Attached files
| file | filename |
|---|---|
| EX-32.1 - EXHIBIT 32.1 - MONROE CAPITAL Corp | tm208259d1_ex32-1.htm |
| EX-31.2 - EXHIBIT 31.2 - MONROE CAPITAL Corp | tm208259d1_ex31-2.htm |
| EX-31.1 - EXHIBIT 31.1 - MONROE CAPITAL Corp | tm208259d1_ex31-1.htm |
| EX-21 - EXHIBIT 21.1 - MONROE CAPITAL Corp | tm208259d1_ex21-1.htm |
| EX-14.1 - EXHIBIT 14.1 - MONROE CAPITAL Corp | tm208259d1_ex14-1.htm |
| EX-4.5 - EXHIBIT 4.5 - MONROE CAPITAL Corp | tm208259d1_ex4-5.htm |
UNITED
STATES
SECURITIES AND EXCHANGE COMMISSION
Washington, D.C. 20549
FORM 10-K
(Mark One)
| x | ANNUAL REPORT PURSUANT TO SECTION 13 OR 15(d) OF THE SECURITIES EXCHANGE ACT OF 1934 |
For the fiscal year ended December 31, 2019
OR
| ¨ | TRANSITION REPORT PURSUANT TO SECTION 13 OR 15(d) OF THE SECURITIES EXCHANGE ACT OF 1934 |
Commission file number: 814-00866
MONROE CAPITAL CORPORATION
(Exact Name of Registrant as Specified in its Charter)
| Maryland | 27-4895840 |
| (State or Other Jurisdiction of Incorporation or Organization) |
(I.R.S. Employer Identification No.) |
| 311 South Wacker Drive, Suite
6400 Chicago, Illinois |
60606 |
| (Address of Principal Executive Office) | (Zip Code) |
(312) 258-8300
(Registrant’s Telephone Number, Including Area Code)
Securities registered pursuant to Section 12(b) of the Act:
| Title of Each Class | Trading Symbol(s) | Name of Each Exchange on Which Registered | ||
| Common Stock, par value $0.001 per share 5.75% Notes due 2023 |
MRCC MRCCL |
The Nasdaq Global Select Market The Nasdaq Global Select Market |
Securities registered pursuant to Section 12(g) of the Act: None
Indicate by check mark if the registrant is a well-known seasoned issuer, as defined in Rule 405 of the Securities Act. Yes ¨ No x
Indicate by check mark if the registrant is not required to file reports pursuant to Section 13 or Section 15(d) of the Act. Yes ¨ No x
Indicate by check mark whether the registrant: (1) has filed all reports required to be filed by Section 13 or 15(d) of the Securities Exchange Act of 1934 during the preceding 12 months (or for such shorter period that the registrant was required to file such reports), and (2) has been subject to such filing requirements for the past 90 days. Yes x No ¨
Indicate by check mark whether the registrant has submitted electronically every Interactive Data File required to be submitted pursuant to Rule 405 of Regulation S-T (§ 232.405 of this chapter) during the preceding 12 months (or for such shorter period that the registrant was required to submit such files). Yes x No ¨
Indicate by check mark whether the registrant is a large accelerated filer, an accelerated filer, a non-accelerated filer, a smaller reporting company, or an emerging growth company. See the definitions of “large accelerated filer,” “accelerated filer,” “smaller reporting company,” and “emerging growth company” in Rule 12b-2 of the Exchange Act.
| Large accelerated filer | ¨ | Accelerated filer | x | |
| Non-accelerated filer | ¨ | Smaller reporting company | ¨ | |
| Emerging growth company | ¨ |
If an emerging growth company, indicate by check mark if the registrant has elected not to use the extended transition period for complying with any new or revised financial accounting standards provided pursuant to Section 13(a) of the Exchange Act. ¨
Indicate by check mark whether the registrant is a shell company (as defined in Rule 12b-2 of the Act). Yes ¨ No x
The aggregate market value of outstanding common stock held by non-affiliates of the registrant was $230.5 million based on the number of shares held by non-affiliates of the registrant as of June 28, 2019, which is the last business day of the registrant’s most recently completed second fiscal quarter.
As of March 2, 2020, the registrant had 20,444,564 shares of common stock, $0.001 par value, outstanding.
Documents Incorporated by Reference
Portions of the registrant’s definitive proxy statement to be filed with the Securities and Exchange Commission pursuant to Regulation 14A relating to the registrant’s 2020 Annual Meeting of Stockholders, to be filed with the Securities and Exchange Commission within 120 days following the end of the Company’s fiscal year, are incorporated by reference in Part III of this Annual Report on Form 10-K as indicated herein.
TABLE OF CONTENTS
CERTAIN DEFINITIONS
Except as otherwise specified in this Annual Report on Form 10-K (“Annual Report”), the terms:
| • | “we,” “us,” “our” and the “Company” refer to Monroe Capital Corporation, a Maryland corporation, and its consolidated subsidiaries; |
| • | MC Advisors refers to Monroe Capital BDC Advisors, LLC, our investment adviser and a Delaware limited liability company; |
| • | MC Management refers to Monroe Capital Management Advisors, LLC, our administrator and a Delaware limited liability company; |
| • | Monroe Capital refers to Monroe Capital LLC, a Delaware limited liability company, and its subsidiaries and affiliates; and | |
| • | SLF refers to MRCC Senior Loan Fund I, LLC, an unconsolidated Delaware limited liability company, in which we co-invest with NLV Financial Corporation (“NLV”) primarily in senior secured loans. |
FORWARD-LOOKING STATEMENTS
This Annual Report contains statements that constitute forward-looking statements which are subject to the safe harbor provisions of the Private Securities Litigation Reform Act of 1995. Statements that are not historical are forward-looking statements within the meaning of Section 27A of the Securities Act of 1933 and Section 21E of the Securities Exchange Act of 1934. Some of the statements in this Annual Report constitute forward-looking statements because they relate to future events or our future performance or future financial condition. These forward-looking statements are not historical facts, but rather are based on current expectations, estimates and projections about our company, our industry, our beliefs and our assumptions. The forward-looking statements contained in this Annual Report involve risks and uncertainties, including statements as to:
| • | our future operating results; |
| • | our business prospects and the prospects of our portfolio companies; |
| • | the dependence of our future success on the general economy and its impact on the industries in which we invest; |
| • | the impact of a protracted decline in the liquidity of credit markets on our business; |
| • | the impact of increased competition; |
| • | the impact of fluctuations in interest rates on our business and our portfolio companies; |
| • | our contractual arrangements and relationships with third parties; |
| • | the valuation of our investments in portfolio companies, particularly those having no liquid trading market; |
| • | actual and potential conflicts of interest with MC Advisors, MC Management and other affiliates of Monroe Capital; |
| • | the ability of our portfolio companies to achieve their objectives; |
| • | the use of borrowed money to finance a portion of our investments; |
| • | the adequacy of our financing sources and working capital; |
| • | the timing of cash flows, if any, from the operations of our portfolio companies; |
| • | the ability of MC Advisors to locate suitable investments for us and to monitor and administer our investments; |
| • | the ability of MC Advisors or its affiliates to attract and retain highly talented professionals; |
| • | our ability to qualify and maintain our qualification as a regulated investment company and as a business development company; and |
| • | the impact of future legislation and regulation on our business and our portfolio companies. |
We use words such as “anticipates,” “believes,” “expects,” “intends,” “seeks,” “plans,” “estimates,” “targets” and similar expressions to identify forward-looking statements. The forward-looking statements contained in this Annual Report involve risks and uncertainties. Our actual results could differ materially from those implied or expressed in the forward-looking statements for any reason, including the factors set forth in “Part I — Item 1A. Risk Factors” in this Annual Report.
Although we believe that the assumptions on which these forward-looking statements are based are reasonable, any of those assumptions could prove to be inaccurate, and as a result, the forward-looking statements based on those assumptions also could be inaccurate. Important assumptions include our ability to originate new loans and investments, certain margins and levels of profitability and the availability of additional capital. In light of these and other uncertainties, the inclusion of a projection or forward-looking statements in this Annual Report should not be regarded as a representation by us that our plans and objectives will be achieved.
We have based the forward-looking statements included in this Annual Report on information available to us on the date of this Annual Report, and we assume no obligation to update any such forward-looking statements. Although we undertake no obligation to revise or update any forward-looking statements in this Annual Report, whether as a result of new information, future events or otherwise, you are advised to consult any additional disclosures that we may make directly to you or through reports that we in the future may file with the Securities and Exchange Commission (the “SEC”), including annual reports on Form 10-K, quarterly reports on Form 10-Q and current reports on Form 8-K.
FORMATION OF OUR COMPANY
We are a Maryland corporation, formed February 9, 2011, for the purpose of purchasing an initial portfolio of loans from two funds managed by Monroe Capital, raising capital in our initial public offering, which was completed in October 2012 (the “Initial Public Offering”), and thereafter operating as an externally managed business development company (“BDC”) under the Investment Company Act of 1940 (the “1940 Act”), as amended. We are a closed-end, non-diversified investment company that has elected to be treated as a BDC under the 1940 Act. In addition, for tax purposes we have elected to be treated as a regulated investment company (“RIC”) under the U.S. Internal Revenue Code of 1986, as amended (the “Code”), commencing with our taxable year ended December 31, 2012.
Prior to the closing of the Initial Public Offering, we purchased our initial portfolio of loans for $67.5 million from two funds managed by Monroe Capital, which was comprised of 16 loans that were either senior secured debt, junior secured debt or unitranche secured debt (a combination of senior secured debt and junior secured debt under the same facility) obligations of companies that we believe provided us with a sound foundation for our business. Our board of directors (the “Board”) determined the purchase price for our initial portfolio based on the aggregate fair value of the assets in the initial portfolio and the disinterested members of our Board approved the transaction as being fair to us.
Public Offerings of Common Stock
The Initial Public Offering consisted of the sale of 5,750,000 shares of our common stock at a price of $15.00 per share, resulting in net proceeds to us, net of underwriting discounts and commissions, of approximately $84.6 million. On July 22, 2013, we completed a public offering of an additional 4,000,000 shares of our common stock at a price of $14.05 per share. On August 20, 2013, we also sold an additional 225,000 shares of our common stock at a price of $14.05 per share pursuant to the underwriters’ partial exercise of the over-allotment option. These issuances during the year ended December 31, 2013 provided us with proceeds, net of offering and underwriting costs, of $56.0 million.
On April 20, 2015, we closed a public offering of 2,450,000 shares of our common stock at a public offering price of $14.85 per share, raising approximately $36.4 million in gross proceeds. On May 18, 2015, we completed the sale of an additional 367,500 shares of our common stock, at a public offering price of $14.85 per share, raising approximately $5.5 million in gross proceeds pursuant to the underwriters’ exercise of the over-allotment option. Aggregate underwriters’ discounts and commissions were $1.7 million and offering costs were $0.3 million, resulting in net proceeds of approximately $39.9 million.
On July 25, 2016, we closed a public offering of 3,100,000 shares of our common stock at a public offering price of $15.50 per share, raising approximately $48.1 million in gross proceeds. On August 3, 2016, we sold an additional 465,000 shares of our common stock, at a public offering price of $15.50 per share, raising approximately $7.2 million in gross proceeds pursuant to the underwriters’ exercise of the over-allotment option. Aggregate underwriters’ discounts and commissions were $2.2 million and offering costs were $0.5 million, resulting in net proceeds of approximately $52.5 million.
On June 9, 2017, we closed a public offering of 3,000,000 shares of our common stock at a public offering price of $15.00 per share, raising approximately $45.0 million in gross proceeds. On June 14, 2017, pursuant to the underwriters’ exercise of the over-allotment option, we sold an additional 450,000 shares of our common stock, at a public offering price of $15.00 per share, raising an additional $6.8 million in gross proceeds for a total of approximately $51.8 million. Aggregate underwriters’ discounts and commissions were $2.1 million and offering costs were $0.1 million, resulting in net proceeds of approximately $49.6 million.
At-the-market Securities Offering Program
On February 6, 2015, we entered into an at-the-market (“ATM”) securities offering program with MLV & Co. LLC (“MLV”) and JMP Securities LLC (“JMP”) (the “Initial ATM Program”) through which we could sell, by means of ATM offerings from time to time, up to $50.0 million of our common stock. During the year ended December 31, 2015, we sold 672,597 shares at an average price of $14.88 per share for gross proceeds of approximately $10.0 million under the Initial ATM Program. Aggregate underwriters’ discounts and commissions were $0.2 million and offering costs were $83 thousand, resulting in net proceeds of approximately $9.8 million.
On July 1, 2016, we amended the Initial ATM Program with MLV and JMP to replace MLV with FBR Capital Markets & Co. (“FBR”), an affiliate of MLV. On May 12, 2017, we entered into new equity distribution agreements with each of FBR and JMP (the “ATM Program”). All other material terms of the Initial ATM Program remain unchanged under the ATM Program. During the year ended December 31, 2017, we sold 173,939 shares at an average price of $15.71 per share for gross proceeds of $2.7 million under the Initial ATM Program and no shares were sold under the ATM Program. Aggregate underwriters’ discounts and commissions were $41 thousand and offering costs were $23 thousand, resulting in net proceeds of approximately $2.7 million. During the year ended December 31, 2018, we sold 182,299 shares at an average price of $13.82 per share for gross proceeds of approximately $2.5 million under the ATM Program. Aggregate underwriters’ discounts and commissions were $38 thousand and offering costs were $79 thousand, resulting in net proceeds of approximately $2.4 million. There were no stock issuances during the year ended December 31, 2019.
Small Business Investment Company Subsidiary
On February 28, 2014, our wholly-owned subsidiary, Monroe Capital Corporation SBIC, LP (“MRCC SBIC”), a Delaware limited partnership, received a license from the Small Business Administration (“SBA”) to operate as a Small Business Investment Company (“SBIC”) under Section 301(c) of the Small Business Investment Act of 1958. MRCC SBIC commenced operations on September 16, 2013. On April 13, 2016, MRCC SBIC was approved by the SBA for an additional $75.0 million in SBA debentures for a total of $115.0 million in available SBA debentures.
| 1 |
OVERVIEW OF OUR BUSINESS
We are a specialty finance company focused on providing financing solutions primarily to lower middle-market companies in the United States and Canada. We provide customized financing solutions focused primarily on senior secured, junior secured and unitranche secured (a combination of senior secured and junior secured debt in the same facility in which we syndicate a “first out” portion of the loan to an investor and retain a “last out” portion of the loan) debt and, to a lesser extent, unsecured subordinated debt and equity, including equity co-investments in preferred and common stock and warrants.
Our investment objective is to maximize the total return to our stockholders in the form of current income and capital appreciation through investment in senior secured, unitranche secured and junior secured debt and, to a lesser extent, unsecured subordinated debt and equity investments. We seek to use our extensive leveraged finance origination infrastructure and broad expertise in sourcing loans to invest in primarily senior secured, unitranche secured and junior secured debt of middle-market companies. We believe that our primary focus on lending to lower middle-market companies offers several advantages as compared to lending to larger companies, including more attractive economics, lower leverage, more comprehensive and restrictive covenants, more expansive events of default, relatively small debt facilities that provide us with enhanced influence over our borrowers, direct access to borrower management and improved information flow.
Since the consummation of the Initial Public Offering, we have grown the fair value of our portfolio of investments to approximately $616.2 million at December 31, 2019. Our portfolio at December 31, 2019 consists of 81 different portfolio companies and holdings include senior secured, junior secured and unitranche secured debt and equity investments. As of December 31, 2019, we have borrowed $180.3 million under our revolving credit facility, we have $109.0 million in aggregate principal amount of senior unsecured notes (“2023 Notes”) outstanding and we have drawn $115.0 million in SBA debentures to finance the purchase of our assets.
Our investments will generally range between $2.0 million and $18.0 million each, although this investment size may vary proportionately with the size of our capital base. As of December 31, 2019, our portfolio included approximately 77.1% senior secured debt, 12.4% unitranche secured debt, 2.2% junior secured debt and 8.3% equity securities. We expect that the companies in which we invest may be leveraged, often as a result of leveraged buy-outs or other recapitalization transactions, and, in certain cases, will not be rated by national ratings agencies. If such companies were rated, we believe that they would typically receive a rating below investment grade (between BB and CCC under the Standard & Poor’s system) from the national rating agencies.
While our primary focus is to maximize current income and capital appreciation through debt investments in thinly traded or private U.S. companies, we may invest a portion of the portfolio in opportunistic investments in order to seek to enhance returns to stockholders. Such investments may include investments in high-yield bonds, distressed debt, private equity or securities of public companies that are not thinly traded and securities of middle-market companies located outside of the United States. We expect that these public companies generally will have debt securities that are non-investment grade.
OUR INVESTMENT ADVISOR
Our investment activities are managed by our investment advisor, MC Advisors. MC Advisors is responsible for sourcing potential investments, conducting research and due diligence on prospective investments and their private equity sponsors, analyzing investment opportunities, structuring our investments and managing our investments and portfolio companies on an ongoing basis. MC Advisors was organized in February 2011 and is a registered investment adviser under the Investment Advisers Act of 1940, as amended (the “Advisers Act”).
Under our Investment Advisory and Management Agreement with MC Advisors, we pay MC Advisors a base management fee and an incentive fee for its services. While not expected to review or approve each investment, our independent directors periodically review MC Advisors’ services and fees as well as its portfolio management decisions and portfolio performance. In connection with these reviews, our independent directors consider whether our fees and expenses (including those related to leverage) remain appropriate.
MC Advisors seeks to capitalize on the significant deal origination, credit underwriting, due diligence, investment structuring, execution, portfolio management and monitoring experience of Monroe Capital’s investment professionals. The senior management team of Monroe Capital, including Theodore L. Koenig and Aaron D. Peck, provides investment services to MC Advisors pursuant to a staffing agreement, or the Staffing Agreement, between MC Management, an affiliate of Monroe Capital, and MC Advisors. Messrs. Koenig and Peck have developed a broad network of contacts within the investment community and average more than 30 years of experience investing in debt and equity securities of lower middle-market companies. In addition, Messrs. Koenig and Peck have extensive experience investing in assets that constitute our primary focus and have expertise in investing throughout all periods of the economic cycle. MC Advisors is an affiliate of Monroe Capital and is supported by experienced investment professionals of Monroe Capital under the terms of the Staffing Agreement. Monroe Capital’s core team of investment professionals has an established track record in sourcing, underwriting, executing and monitoring transactions. From Monroe Capital’s formation in 2004 through December 31, 2019, Monroe Capital’s investment professionals invested in over 1,300 loans and related investments in an aggregate amount of over $17.0 billion.
In addition to their roles with Monroe Capital and MC Advisors, Messrs. Koenig and Peck serve as interested directors. Mr. Koenig has more than 35 years of experience in structuring, negotiating and closing transactions on behalf of asset-backed lenders, commercial finance companies, financial institutions and private equity investors at organizations including Monroe Capital, which Mr. Koenig founded in 2004, and Hilco Capital LP, where he led investments in over 20 companies in the lower middle-market. Mr. Peck has more than 25 years of public company management, leveraged finance and commercial lending experience at organizations including Deerfield Capital Management LLC, Black Diamond Capital Management LLC and Salomon Smith Barney Inc. Messrs. Koenig and Peck are joined on the investment committee of MC Advisors by Michael J. Egan and Jeremy T. VanDerMeid, each of whom is a senior investment professional at Monroe Capital. Mr. Egan has more than 35 years of experience in commercial finance, credit administration and banking at organizations including Hilco Capital, The CIT Group/Business Credit, Inc., The National Community Bank of New Jersey (The Bank of New York) and KeyCorp. Mr. VanDerMeid has more than 20 years of lending and corporate finance experience at organizations including Morgan Stanley Investment Management, Dymas Capital Management Company, LLC and Heller Financial.
| 2 |
ABOUT MONROE CAPITAL
Monroe Capital, a Delaware limited liability company that was founded in 2004, is a leading lender to middle-market companies. As of December 31, 2019, Monroe Capital had approximately $9.2 billion in assets under management. Over its sixteen-year history, Monroe Capital has developed an established lending platform that we believe generates consistent deal flow from a network of proprietary relationships. Monroe Capital’s assets under management are comprised of a diverse portfolio of over 500 current investments that were either originated directly by Monroe Capital or sourced from Monroe Capital’s third-party relationships. From Monroe Capital’s formation in 2004 through December 31, 2019, Monroe Capital’s investment professionals invested in over 1,300 loans and related investments in an aggregate amount of over $17.0 billion. The senior investment team of Monroe Capital averages more than 30 years of experience and has developed a proven investment and portfolio management process that has performed through multiple market cycles. In addition, Monroe Capital’s investment professionals are supported by a robust infrastructure of administrative and back-office personnel focused on compliance, operations, finance, treasury, legal, accounting and reporting, marketing, information technology and office management.
INVESTMENT STRATEGY
Our investment objective is to maximize the total return to our stockholders in the form of current income and capital appreciation primarily through investments in senior, unitranche and junior secured debt and, to a lesser extent, unsecured subordinated debt and equity. We also seek to invest opportunistically in attractively priced, broadly syndicated loans, which should enhance our geographic and industry portfolio diversification and increase our portfolio’s liquidity. We do not target any specific industry, however, as of December 31, 2019, our investments in the Services: Business, High Tech Industries, Banking, Finance, Insurance & Real Estate and Healthcare & Pharmaceuticals industries represented approximately 17.6%, 14.7%, 12.4% and 10.2%, respectively, of the fair value of our portfolio. To achieve our investment objective, we utilize the following investment strategy:
Attractive Current Yield on Investment Portfolio. We believe our sourcing network allows us to enter into transactions with attractive yields and investment structures. Based on current market conditions and our pipeline of new investments, we expect our target directly originated senior and unitranche secured debt will have an average maturity of three to seven years and interest rates of 7% to 13%, and we expect our target directly originated junior secured debt and unsecured subordinated debt will have an average maturity of four to seven years and interest rates of 8% to 15%. In addition, based on current market conditions and our pipeline of new investments, we expect that our target debt investments will typically have a variable coupon (with a LIBOR floor), may include payment-in-kind (“PIK”) interest (interest that is not received in cash, but added to the principal balance of the loan), and that we will typically receive upfront closing fees of 1% to 4%. We may also receive warrants or other forms of upside equity participation. Our transactions are generally secured and supported by a lien on all assets and/or a pledge of company stock in order to provide priority of return and to influence any corporate actions. Although we will target investments with the characteristics described in this paragraph, we cannot provide assurance that our new investments will have these characteristics and we may enter into investments with different characteristics as the market dictates. For a description of the characteristics of our current investment portfolio, see “Management’s Discussion and Analysis of Financial Condition and Results of Operations — Portfolio and Investment Activity.” Until investment opportunities can be found, we may invest our undeployed capital in cash, cash equivalents, U.S. government securities and high-quality debt investments that mature in one year or less from the date of investment. These temporary investments may have lower yields than our other investments and, accordingly, may result in lower distributions, if any, during such period.
Sound Portfolio Construction. We strive to exercise discipline in portfolio creation and management and to implement effective governance throughout our business. Monroe Capital and MC Advisors, which is comprised of substantially the same investment professionals who have operated Monroe Capital, have been, and we believe will continue to be, conservative in the underwriting and structuring of covenant packages in order to enable early intervention in the event of weak financial performance by a portfolio company. We seek to pursue lending opportunities selectively and to maintain a diversified portfolio. We believe that exercising disciplined portfolio management through continued intensive account monitoring and timely and relevant management reporting allows us to mitigate risks in our debt investments. In addition, we have implemented rigorous governance processes through segregation of duties, documented policies and procedures and independent oversight and review of transactions, which we believe helps us to maintain a low level of non-performing loans. We believe that Monroe Capital’s proven process of thorough origination, conservative underwriting, due diligence and structuring, combined with careful account management and diversification, enabled it to protect investor capital, and we believe MC Advisors follows the same philosophy and processes in originating, structuring and managing our portfolio investments.
Predictability of Returns. Beyond conservative structuring and protection of capital, we seek a predictable exit from our investments. We seek to invest in situations where there are a number of potential exit options that can result in full repayment or a modest refinance of our investment. We seek to structure the majority of our transactions as secured loans with a covenant package that provides for full or partial repayment upon the completion of asset sales and restructurings. Because we seek to structure these transactions to provide for contractually determined, periodic payments of principal and interest, we are less likely to depend on merger and acquisition activity or public equity markets to exit our debt investments. As a result, we believe that we can achieve our target returns even in a period when public markets are depressed.
BUSINESS STRATEGY
We believe that we represent an attractive investment opportunity for the following reasons:
Deep, Experienced Management Team. We are managed by MC Advisors, which has access through the Staffing Agreement to Monroe Capital’s experienced team comprised of over 120 professionals, including seven senior partners that average more than 30 years of direct lending experience. We are led by our Chairman and Chief Executive Officer, Theodore L. Koenig, and Aaron D. Peck, our Chief Financial Officer and Chief Investment Officer. This extensive experience includes the management of investments with borrowers of varying credit profiles and transactions completed in all phases of the credit cycle. Monroe Capital’s senior investment professionals provide us with a difficult-to-replicate sourcing network and a broad range of transactional, financial, managerial and investment skills. This expertise and experience is supported by administrative and back office personnel focused on operations, finance, legal and compliance, accounting and reporting, marketing, information technology and office management. From Monroe Capital’s formation in 2004 through December 31, 2019, Monroe Capital’s investment professionals invested in over 1,300 loans and related investments in an aggregate amount of over $17.0 billion.
Differentiated Relationship-Based Sourcing Network. We believe Monroe Capital’s senior investment professionals benefit from extensive relationships with commercial banks, private equity firms, financial intermediaries, management teams and turn-around advisors. We believe that this broad sourcing network differentiates us from our competitors and offers us a diversified origination approach that does not rely on a single channel and offers us consistent deal flow throughout the economic cycle. We also believe that this broad network allows us to originate a substantial number of non-private equity-sponsored investments.
Extensive Institutional Platform for Originating Middle-Market Deal Flow. Monroe Capital’s broad network of relationships and significant origination resources enable us to review numerous lending opportunities, permitting us to exercise a high degree of selectivity in terms of loans to which we ultimately commit. Monroe Capital estimates that it reviewed approximately 2,000 investment opportunities during 2019. Monroe Capital’s over 1,300 previously executed transactions, over 500 of which are with current borrowers, offer us another source of deal flow, as these debt investments reach maturity or seek refinancing. We are also positioned to benefit from Monroe Capital’s established brand name, strong track record in partnering with industry participants and reputation for closing deals on time and as committed. Monroe Capital’s senior investment professionals are complemented by extensive experience in capital markets transactions, risk management and portfolio monitoring.
| 3 |
Disciplined, “Credit-First” Underwriting Process. Monroe Capital has developed a systematic underwriting process that applies a consistent approach to credit review and approval, with a focus on evaluating credit first and then appropriately assessing the risk-reward profile of each loan. MC Advisors’ assessment of credit outweighs pricing and other considerations, as we seek to minimize potential credit losses through effective due diligence, structuring and covenant design. MC Advisors seeks to customize each transaction structure and financial covenant to reflect risks identified through the underwriting and due diligence process. We also seek to actively manage our origination and credit underwriting activities through personal visits and calls on all parties involved with an investment, including the management team, private equity sponsors, if any, or other lenders.
Established Credit Risk Management Framework. We seek to manage our credit risk through a well-defined portfolio strategy and credit policy. In terms of credit monitoring, MC Advisors assigns each loan to a particular portfolio management professional and maintains an internal credit rating analysis for all loans. MC Advisors then employs ongoing review and analysis, together with regular investment committee meetings to review the status of certain complex and challenging loans and a comprehensive quarterly review of all loan transactions. MC Advisors’ investment professionals also have significant turnaround and debt work-out experience, which gives them perspective on the risks and possibilities throughout the entire credit cycle. We believe this careful approach to investment and monitoring enables us to identify problems early and gives us an opportunity to assist borrowers before they face difficult liquidity constraints. By anticipating possible negative contingencies and preparing for them, we believe that we diminish the probability of underperforming assets and loan losses.
INVESTMENTS
Investment Structure
We structure our investments, which typically have maturities of three to seven years, as follows:
Senior Secured Loans. We structure senior secured loans to obtain security interests in the assets of the portfolio company borrowers that serve as collateral in support of the repayment of such loans. This collateral may take the form of first-priority liens on the assets of the portfolio company borrower. Our senior secured loans may provide for moderate loan amortization in the early years of the loan, with the majority of the amortization deferred until loan maturity.
Unitranche Secured Loans. We structure our unitranche loans as senior secured loans. We obtain security interests in the assets of these portfolio companies that serve as collateral in support of the repayment of these loans. This collateral may take the form of first-priority liens on the assets of a portfolio company. Generally, we syndicate a “first out” portion of the loan to an investor and retain a “last out” portion of the loan, in which case the “first out” portion of the loan will generally receive priority with respect to payments of principal, interest and any other amounts due thereunder. Unitranche structures combine characteristics of traditional first lien senior secured as well as second lien and subordinated loans and our unitranche loans will expose us to the risks associated with second lien and subordinated loans and may limit our recourse or ability to recover collateral upon a portfolio company’s bankruptcy. Unitranche loans typically provide for moderate loan amortization in the initial years of the facility, with the majority of the amortization deferred until loan maturity. Unitranche loans generally allow the borrower to make a large lump sum payment of principal at the end of the loan term, and there is a risk of loss if the borrower is unable to pay the lump sum or refinance the amount owed at maturity. In many cases we, together with our affiliates, are the sole or majority lender of our unitranche loans, which can afford us additional influence with a borrower in terms of monitoring and, if necessary, remediation in the event of underperformance.
Junior Secured Loans. We structure junior secured loans to obtain a security interest in the assets of these portfolio companies that serves as collateral in support of the repayment of such loans. This collateral may take the form of second priority liens on the assets of a portfolio company. These loans typically provide for moderate loan amortization in the initial years of the facility, with the majority of the amortization deferred until loan maturity.
Preferred Equity. We generally structure preferred equity investments to combine features of equity and debt. We may obtain a security interest in the assets of these portfolio companies that serves as collateral in support of the repayment of such preferred equity, which takes a priority to common stockholders. Preferred equity interests generally have a stated dividend rate and may not have a fixed maturity date.
Warrants and Equity Co-Investment Securities. In some cases, we may also receive nominally priced warrants or options to buy a minority equity interest in the portfolio company in connection with a loan. As a result, as a portfolio company appreciates in value, we may achieve additional investment return from this equity interest. We may structure such warrants to include provisions protecting our rights as a minority-interest holder, as well as a “put,” or right to sell such securities back to the issuer, upon the occurrence of specified events. In other cases, we may make a minority equity co-investment in the portfolio company in connection with a loan. Additionally, we may receive equity in our distressed portfolio companies in conjunction with amendments or additional debt fundings.
We tailor the terms of each investment to the facts and circumstances of the transaction and the prospective portfolio company, negotiating a structure that protects our rights and manages our risk while creating incentives for the portfolio company to achieve its business plan and improve its operating results. We seek to limit the downside potential of our investments by:
| • | selecting investments that we believe have a very low probability of loss; |
| • | requiring a total return on our investments (including both interest and potential equity appreciation) that we believe will compensate us appropriately for credit risk; and |
| • | negotiating covenants in connection with our investments that afford our portfolio companies as much flexibility in managing their businesses as possible, consistent with the preservation of our capital. Such restrictions may include affirmative and negative covenants, default penalties, lien protection, change of control provisions and board rights, including either observation or rights to a seat on the board of directors under some circumstances. |
We expect to hold most of our investments to maturity or repayment, but we may sell some of our investments earlier if a liquidity event occurs, such as a sale, recapitalization or worsening of the credit quality of the portfolio company.
Senior Loan Fund. We have invested in SLF, which as of December 31, 2019, consisted of loans to different borrowers in industries similar to the companies in our portfolio. SLF invests primarily in senior secured loans of middle market companies. These senior secured loans are generally similar to our senior secured loans, which are secured by a first lien on some or all of the issuer’s assets and include traditional senior debt and any related revolving or similar credit facility. SLF may also invest in more liquid senior secured loans.
| 4 |
Investments
We seek to create a diverse portfolio that includes senior secured, unitranche secured, junior secured loans and warrants and equity co-investment securities by investing approximately $2.0 million to $18.0 million of capital, on average, in the securities of middle-market companies. This investment size may vary proportionately with the size of our capital base. Set forth below is a list of our ten largest portfolio company investments as of December 31, 2019, as well as the top ten industries in which we were invested as of December 31, 2019, in each case excluding SLF, calculated as a percentage of our total investments at fair value as of such date (in thousands):
| Portfolio Company | Fair Value of Investments | Percentage of Total Investments | ||||||
| Rockdale Blackhawk, LLC | $ | 29,538 | 4.8 | % | ||||
| Incipio, LLC | 18,385 | 3.0 | ||||||
| HFZ Capital Group, LLC | 17,995 | 2.9 | ||||||
| American Community Homes, Inc. | 17,616 | 2.9 | ||||||
| MC Sign Lessor Corp. | 17,585 | 2.9 | ||||||
| RPL Bidco Limited | 15,948 | 2.6 | ||||||
| Midwest Composite Technologies, LLC | 15,930 | 2.6 | ||||||
| IT Global Holding, LLC | 14,822 | 2.4 | ||||||
| TRP Construction Group, LLC | 14,457 | 2.3 | ||||||
| Newforma, Inc. | 13,251 | 2.2 | ||||||
| $ | 175,527 | 28.6 | % | |||||
| Industry | Fair Value of Investments | Percentage of Total Investments | ||||||
| Services: Business | $ | 108,704 | 17.6 | % | ||||
| High Tech Industries | 90,385 | 14.7 | ||||||
| Banking, Finance, Insurance & Real Estate | 76,351 | 12.4 | ||||||
| Healthcare & Pharmaceuticals | 62,727 | 10.2 | ||||||
| Construction & Building | 30,887 | 5.0 | ||||||
| Chemicals, Plastics & Rubber | 29,509 | 4.8 | ||||||
| Media: Advertising, Printing & Publishing | 26,333 | 4.3 | ||||||
| Services: Consumer | 22,051 | 3.6 | ||||||
| Consumer Goods: Durable | 21,237 | 3.4 | ||||||
| Consumer Goods: Non-Durable | 20,365 | 3.3 | ||||||
| $ | 488,549 | 79.3 | % | |||||
INVESTMENT PROCESS OVERVIEW
We view our investment process as consisting of the phases described below:
Origination. MC Advisors seeks to develop investment opportunities through extensive relationships with regional banks, private equity firms, financial intermediaries, management teams and other turn-around advisors. Monroe Capital has developed this network since its formation in 2004. MC Advisors manages these leads through personal visits and calls by its senior deal professionals. It is these professionals’ responsibility to identify specific opportunities, refine opportunities through due diligence regarding the underlying facts and circumstances and utilize innovative thinking and flexible terms to solve the financing issues of prospective clients. Monroe Capital’s origination professionals are broadly dispersed throughout North America, with six offices in the United States. Certain of Monroe Capital’s originators are responsible for covering a specified target market based on geography and others focus on specialized industry verticals. We believe Monroe Capital’s origination professionals’ experience is vital to enable us to provide our borrowers with innovative financing solutions. We further believe that their strength and breadth of relationships across a wide range of markets will generate numerous financing opportunities and enable us to be highly selective in our lending activities. In sourcing new transactions, MC Advisors seeks opportunities to work with borrowers domiciled in the United States and Canada and typically focuses on industries in which Monroe Capital has previous lending experience.
Due Diligence. For each of our investments, MC Advisors prepares a comprehensive new business presentation, which summarizes the investment opportunity and its due diligence and risk analysis, all from the perspective of strengths, weaknesses, opportunities and threats presented by the opportunity. This presentation assesses the borrower and its management, including products and services offered, market position, sales and marketing capabilities and distribution channels; key contracts, customers and suppliers, meetings with management and facility tours; background checks on key executives; customer calls; and an evaluation of exit strategies. MC Advisors’ presentation typically evaluates historical financial performance of the borrower and includes projections, including operating trends, an assessment of the quality of financial information, capitalization and liquidity measures and debt service capacity. The financial analysis also includes sensitivity analysis against management projections and an analysis of potential downside scenarios, particularly for cyclical businesses. MC Advisors seeks to also review the dynamics of the borrowers’ industry and assess the maturity, market size, competition, technology and regulatory issues confronted by the industry. Finally, MC Advisors’ new business presentation includes all relevant third-party reports and assessments, including, as applicable, analyses of the quality of earnings of the prospective borrower, a review of the business by industry experts and third-party valuations. MC Advisors also includes in this due diligence, if relevant, field exams, collateral appraisals and environmental reviews, as well as a review of comparable private and public transactions.
| 5 |
Underwriting. MC Advisors uses the systematic, consistent approach to credit evaluation developed in house by Monroe Capital with a particular focus on determining the value of a business in a downside scenario. In this process, the senior investment professionals at MC Advisors bring to bear extensive lending experience with emphasis on lessons learned from the past two credit cycles. We believe that the extensive credit and debt work-out experience of Monroe Capital’s senior management enables us to anticipate problems and minimize risks. Monroe Capital’s underwriting professionals work closely with its origination professionals to identify individual deal strengths, risks and any risk mitigants. MC Advisors preliminarily screens transactions based on cash flow, enterprise value and asset-based characteristics, and each of these measures is developed on a proprietary basis using thorough credit analysis focused on sustainability and predictability of cash flow to support enterprise value, barriers to entry, market position, competition, customer and supplier relationships, management strength, private equity sponsor track record and industry dynamics. For asset-based transactions, MC Advisors seeks to understand current and future collateral value, opening availability and ongoing liquidity. MC Advisors documents this preliminary analysis which is thoroughly reviewed by at least one member of its investment committee prior to proposing a formal term sheet. We believe this early involvement of the investment committee ensures that our resources and those of third parties are deployed appropriately and efficiently during the investment process and lowers execution risk for our clients. With respect to transactions reviewed by MC Advisors, we expect that only approximately 10% of our sourced deals will reach the formal term sheet stage.
Credit Approval/Investment Committee Review. MC Advisors employs a standardized, structured process developed by Monroe Capital when evaluating and underwriting new investments for our portfolio. MC Advisors’ investment committee considers its comprehensive new business presentation to approve or decline each investment. This committee includes Messrs. Koenig, Peck, Egan and VanDerMeid. The committee is committed to providing a prompt turnaround on investment decisions. Each meeting to approve an investment requires a quorum of at least three members of the investment committee, and each investment must receive unanimous approval by such members of the investment committee.
The following chart illustrates the stages of MC Advisors’ evaluation process:
Evaluation Process
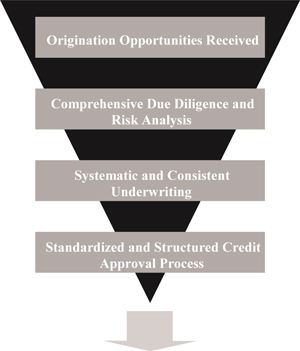
Fund Investments
Execution. We believe Monroe Capital has developed a strong reputation for closing deals as proposed, and we intend to continue this tradition. Through MC Advisors’ consistent approach to credit evaluation and underwriting, we seek to close deals as fast or faster than competitive financing providers while maintaining the discipline with respect to credit, pricing and structure necessary to ensure the ultimate success of the financing.
Monitoring. We benefit from the portfolio management system in place at Monroe Capital. This monitoring includes regular meetings between the responsible analyst and our portfolio company to discuss market activity and current events. MC Advisors’ portfolio management staff closely monitors all credits, with senior portfolio managers covering agented and more complex investments. MC Advisors segregates our capital markets investments by industry. MC Advisors’ monitoring process, developed by Monroe Capital, has daily, weekly, monthly and quarterly components and related reports, each to evaluate performance against historical, budget and underwriting expectations. MC Advisors’ analysts monitor performance using standard industry software tools to provide consistent disclosure of performance. When necessary, MC Advisors updates our internal risk ratings, borrowing base criteria and covenant compliance reports.
As part of the monitoring process, MC Advisors regularly assesses the risk profile of each of our investments and rates each of them based on an internal proprietary system that uses the categories listed below, which we refer to as MC Advisors’ investment performance rating. For any investment rated in grades 3, 4 or 5, MC Advisors, through its internal Portfolio Management Group (“PMG”), will increase its monitoring intensity and prepare regular updates for the investment committee, summarizing current operating results and material impending events and suggesting recommended actions. The PMG is responsible for oversight and management of any investments rated in grades 3, 4 or 5. MC Advisors monitors and, when appropriate, changes the investment ratings assigned to each investment in our portfolio. In connection with our valuation process, MC Advisors reviews these investment ratings on a quarterly basis. The investment performance rating system is described as follows:
| 6 |
| Investment Performance Risk Rating |
Summary Description | |
| Grade 1 | Includes investments exhibiting the least amount of risk in our portfolio. The issuer is performing above expectations or the issuer’s operating trends and risk factors are generally positive. | |
| Grade 2 | Includes investments exhibiting an acceptable level of risk that is similar to the risk at the time of origination. The issuer is generally performing as expected or the risk factors are neutral to positive. | |
| Grade 3 | Includes investments performing below expectations and indicates that the investment’s risk has increased somewhat since origination. The issuer may be out of compliance with debt covenants; however, scheduled loan payments are generally not past due. | |
| Grade 4 | Includes an issuer performing materially below expectations and indicates that the issuer’s risk has increased materially since origination. In addition to the issuer being generally out of compliance with debt covenants, scheduled loan payments may be past due (but generally not more than six months past due). | |
| Grade 5 | Indicates that the issuer is performing substantially below expectations and the investment risk has substantially increased since origination. Most or all of the debt covenants are out of compliance or payments are substantially delinquent. Investments graded 5 are not anticipated to be repaid in full. |
Our investment performance risk ratings do not constitute any rating of investments by a nationally recognized statistical rating organization or reflect or represent any third-party assessment of any of our investments.
In the event of a delinquency or a decision to rate an investment grade 4 or grade 5, the PMG, in consultation with the investment committee, will develop an action plan. Such a plan may require a meeting with the borrower’s management or the lender group to discuss reasons for the default and the steps management is undertaking to address the under-performance, as well as amendments and waivers that may be required. In the event of a dramatic deterioration of a credit, MC Advisors and the PMG will form a team or engage outside advisors to analyze, evaluate and take further steps to preserve our value in the credit. In this regard, we would expect to explore all options, including in a private equity sponsored investment, assuming certain responsibilities for the private equity sponsor or a formal sale of the business with oversight of the sale process by us. The PMG and the investment committee have extensive experience in running debt work-out transactions and bankruptcies.
The following table shows the distribution of our investments on the 1 to 5 investment performance risk rating scale as of December 31, 2019 (in thousands):
| Investment Performance Risk Rating | Investments at Fair Value | Percentage of Total Investments | ||||||
| 1 | $ | — | — | % | ||||
| 2 | 517,597 | 84.0 | ||||||
| 3 | 83,701 | 13.6 | ||||||
| 4 | 13,899 | 2.2 | ||||||
| 5 | 1,034 | 0.2 | ||||||
| Total | $ | 616,231 | 100.0 | % | ||||
The following table shows the distribution of our investments on the 1 to 5 investment performance risk rating scale as of December 31, 2018 (in thousands):
| Investment Performance Risk Rating | Investments at Fair Value | Percentage of Total Investments | ||||||
| 1 | $ | — | — | % | ||||
| 2 | 452,549 | 81.8 | ||||||
| 3 | 57,741 | 10.4 | ||||||
| 4 | 43,331 | 7.8 | ||||||
| 5 | — | — | ||||||
| Total | $ | 553,621 | 100.0 | % | ||||
MANAGEMENT AND OTHER AGREEMENTS
MC Advisors is located at 311 South Wacker Drive, Suite 6400, Chicago, Illinois 60606. MC Advisors is a registered investment adviser under the Advisers Act. Subject to the overall supervision of our Board and in accordance with the 1940 Act, MC Advisors manages our day-to-day operations and provides investment advisory services to us. Under the terms of the Investment Advisory and Management Agreement, MC Advisors:
| • | determines the composition of our portfolio, the nature and timing of the changes to our portfolio and the manner of implementing such changes; |
| • | assists us in determining what securities we purchase, retain or sell; |
| • | identifies, evaluates and negotiates the structure of the investments we make (including performing due diligence on our prospective portfolio companies); and |
| • | executes, closes, services and monitors the investments we make. |
MC Advisors’ services under the Investment Advisory and Management Agreement are not exclusive, and it is free to furnish similar services to other entities so long as its services to us are not impaired.
| 7 |
Management and Incentive Fee
Under the Investment Advisory and Management Agreement with MC Advisors and subject to the overall supervision of our Board, MC Advisors provides investment advisory services to us. For providing these services, MC Advisors receives a fee from us, consisting of two components — a base management fee and an incentive fee.
On November 4, 2019, the Board approved a change to the Investment Advisory Agreement to amend the base management fee structure. Effective July 1, 2019, the base management fee is calculated initially at an annual rate equal to 1.75% of average invested assets (calculated as total assets excluding cash, which includes assets financed using leverage); provided, however, the base management fee is calculated at an annual rate equal to 1.00% of our average invested assets (calculated as total assets excluding cash, which includes assets financed using leverage) that exceeds the product of (i) 200% and (ii) our average net assets. For the avoidance of doubt, the 200% is calculated in accordance with the asset coverage limitation as defined in the 1940 Act to give effect to our exemptive relief with respect to MRCC SBIC’s SBA debentures. This change has the effect of reducing our base management fee rate on assets in excess of regulatory leverage of 1:1 debt to equity to 1.00% per annum. The base management fee is payable quarterly in arrears.
Prior to July 1, 2019, the base management fee was calculated at an annual rate equal to 1.75% of average invested assets (calculated as total assets excluding cash, which included assets financed using leverage) and was payable quarterly in arrears.
The incentive fee consists of two parts. The first part is calculated and payable quarterly in arrears based on our pre-incentive fee net investment income for the preceding quarter subject to a total return requirement. Pre-incentive fee net investment income means interest income, dividend income and any other income (including any other fees such as commitment, origination, structuring, diligence and consulting fees or other fees that we receive from portfolio companies but excluding fees for providing managerial assistance) accrued during the calendar quarter, minus operating expenses for the quarter (including the base management fee, any expenses payable under our administration agreement between us and MC Management (the “Administration Agreement”) and any interest expense and dividends paid on any outstanding preferred stock, but excluding the incentive fee). Pre-incentive fee net investment income includes, in the case of investments with a deferred interest feature such as market discount, debt instruments with PIK interest, preferred stock with PIK dividends and zero-coupon securities, accrued income that we have not yet received in cash. MC Advisors is not under any obligation to reimburse us for any part of the incentive fee it received that was based on accrued interest that we never actually receive.
The foregoing incentive fee is subject to a total return requirement, which provides that no incentive fee in respect of our pre-incentive fee net investment income will be payable except to the extent 20.0% of the cumulative net increase in net assets resulting from operations over the then-current and 11 preceding quarters exceeds the cumulative incentive fees accrued and/or paid for the 11 preceding quarters (the “Incentive Fee Limitation”). Therefore, any ordinary income incentive fee that is payable in a calendar quarter will be limited to the lesser of (i) 20% of the amount by which our pre-incentive fee net investment income for such calendar quarter exceeds the 2% hurdle described below, subject to the “catch-up” provision, and (ii) (x) 20% of the cumulative net increase in net assets resulting from operations for the then current and 11 preceding calendar quarters minus (y) the cumulative incentive fees accrued and/or paid for the 11 preceding calendar quarters. For the foregoing purpose, the “cumulative net increase in net assets resulting from operations” is the amount, if positive, of the sum of our pre-incentive fee net investment income, base management fees, realized gains and losses and unrealized gains and losses for the then-current and 11 preceding calendar quarters.
Pre-incentive fee net investment income does not include any realized capital gains or losses or unrealized capital gains or losses. If any distributions from portfolio companies are characterized as a return of capital, such returns of capital would affect the capital gains incentive fee to the extent a gain or loss is realized. Because of the structure of the incentive fee, it is possible that we may pay an incentive fee in a quarter where we incur a loss. For example, if we receive pre-incentive fee net investment income in excess of the hurdle rate (as defined below) for a quarter, we will pay the applicable incentive fee even if we have incurred a loss in that quarter due to realized and unrealized capital losses.
Pre-incentive fee net investment income, expressed as a rate of return on the value of our net assets (defined as total assets less indebtedness and before taking into account any incentive fees payable during the period) at the end of the immediately preceding calendar quarter, is compared to a fixed “hurdle rate” of 2% per quarter (8% annually). If market interest rates rise, we may be able to invest our funds in debt instruments that provide for a higher return, which would increase our pre-incentive fee net investment income and make it easier for MC Advisors to surpass the fixed hurdle rate and receive an incentive fee based on such net investment income.
We pay MC Advisors an incentive fee with respect to our pre-incentive fee net investment income in each calendar quarter as follows:
| • | no incentive fee in any calendar quarter in which the pre-incentive fee net investment income does not exceed the hurdle rate of 2% (8% annually); |
| • | 100% of our pre-incentive fee net investment income with respect to that portion of such pre-incentive fee net investment income, if any, that exceeds the hurdle rate but is less than 2.5% in any calendar quarter. We refer to this portion of our pre-incentive fee net investment income (which exceeds the hurdle rate but is less than 2.5%) as the “catch-up” provision. The catch-up is meant to provide MC Advisors with 20% of the pre-incentive fee net investment income as if a hurdle rate did not apply if this net investment income exceeds 2.5% in any calendar quarter; and |
| • | 20% of the amount of our pre-incentive fee net investment income, if any, that exceeds 2.5% in any calendar quarter. |
These calculations are adjusted for any share issuances or repurchases during the quarter.
| 8 |
The following is a graphical representation of the calculation of the income-related portion of the incentive fee:
Quarterly Incentive Fee Based on Pre-Incentive Fee Net Investment Income
Pre-incentive fee net investment income (expressed as a percentage of the value of net assets)

Percentage of pre-incentive fee net investment
income allocated to income-related portion
of incentive fee
These calculations will be appropriately prorated for any period of less than three months and adjusted for any share issuances or repurchases during the current quarter.
The second part of the incentive fee is a capital gains incentive fee that is determined and payable in arrears as of the end of each fiscal year (or upon termination of the investment advisory and management agreement, as of the termination date), and equals 20% of our realized capital gains as of the end of the fiscal year. In determining the capital gains incentive fee payable to MC Advisors, we calculate the cumulative aggregate realized capital gains and cumulative aggregate realized capital losses since our inception, and the aggregate unrealized capital depreciation as of the date of the calculation, as applicable, with respect to each of the investments in our portfolio. For this purpose, cumulative aggregate realized capital gains, if any, equals the sum of the differences between the net sales price of each investment, when sold, and the amortized cost of such investment. Cumulative aggregate realized capital losses equals the sum of the amounts by which the net sales price of each investment, when sold, is less than the amortized cost of such investment since our inception. Aggregate unrealized capital depreciation equals the sum of the difference, if negative, between the valuation of each investment as of the applicable calculation date and the amortized cost of such investment. At the end of the applicable year, the amount of capital gains that serves as the basis for our calculation of the capital gains incentive fee equals the cumulative aggregate realized capital gains less cumulative aggregate realized capital losses, less aggregate unrealized capital depreciation, with respect to our portfolio of investments. If this number is positive at the end of such year, then the capital gains incentive fee for such year equals 20% of such amount, less the aggregate amount of any capital gains incentive fees paid in respect of our portfolio in all prior years.
Examples of Quarterly Incentive Fee Calculation
Example 1: Income Related Portion of Incentive Fee before Total Return Requirement Calculation
Alternative 1
Assumptions
Investment income (including interest, dividends,
fees, etc.) = 1.25%
Hurdle rate (1) = 2%
Management fee (2) = 0.4375%
Other expenses (legal, accounting, custodian, transfer agent, etc.) = 0.2%
Pre-incentive fee net investment income
(investment income – (management fee + other expenses)) = 0.6125%
Pre-incentive fee net investment income does not exceed hurdle rate, therefore there is no income-related incentive fee.
Alternative 2
Assumptions
Investment income (including interest, dividends,
fees, etc.) = 3.0%
Hurdle rate (1) = 2%
Management fee (2) = 0.4375%
Other expenses (legal, accounting, custodian, transfer agent, etc.) = 0.2%
Pre-incentive fee net investment income
(investment income – (management fee + other expenses)) = 2.3625%
Incentive fee = 100% × Pre-incentive
fee net investment income (subject to “catch-up”) (3)
= 100%
× (2.3625% – 2%)
= 0.3625%
Pre-incentive fee net investment income exceeds the hurdle rate, but does not fully satisfy the “catch-up” provision, therefore the income-related portion of the incentive fee is 0.3625%.
| 9 |
Alternative 3
Assumptions
Investment income (including interest, dividends,
fees, etc.) = 3.5%
Hurdle rate (1) = 2%
Management fee (2) = 0.4375%
Other expenses (legal, accounting, custodian, transfer agent, etc.) = 0.2%
Pre-incentive fee net investment income
(investment income – (management fee + other expenses)) = 2.8625%
Incentive fee = 100% × Pre-incentive fee net investment income (subject to “catch-up”) (3)
Incentive fee = 100% × “catch-up” + (20% × (Pre-incentive fee net investment income – 2.5%))
“Catch-up” = 2.5% – 2%
=
0.5%
Incentive fee = (100% × 0.5%) + (20% ×
(2.8625% – 2.5%))
=
0.5% + (20% × 0.3625%)
=
0.5% + 0.0725%
=
0.5725%
Pre-incentive fee net investment income exceeds the hurdle rate, and fully satisfies the “catch-up” provision, therefore the income related portion of the incentive fee is 0.5725%.
| (1) | Represents 8.0% annualized hurdle rate. |
| (2) | Represents 1.75% annualized base management fee. |
| (3) | The “catch-up” provision is intended to provide our investment advisor with an incentive fee of 20% on all pre-incentive fee net investment income as if a hurdle rate did not apply when our net investment income exceeds 2.5% in any fiscal quarter. |
Example 2: Income Portion of Incentive Fee with Total Return Requirement Calculation
Assumptions
Hurdle rate (1) = 2%
Management fee (2) = 0.4375%
Other expenses (legal, accounting, transfer agent, etc.) = 0.2%
Cumulative incentive compensation accrued and/or paid
for
preceding 11 calendar quarters = $9 million
Alternative 1
Additional Assumptions
Investment income (including interest, dividends,
fees, etc.) = 3.50%
Pre-incentive fee net investment income
(investment income – (management fee + other expenses)) = 2.8625%
20.0% of cumulative net increase in net assets resulting from operations over
current and preceding 11 calendar quarters = $8 million
Although our pre-incentive fee net investment income exceeds the hurdle rate of 2.0% (as shown in Alternative 3 of Example 1 above), no incentive fee is payable because 20.0% of the cumulative net increase in net assets resulting from operations over the then current and 11 preceding calendar quarters did not exceed the cumulative income and capital gains incentive fees accrued and/or paid for the preceding 11 calendar quarters.
Alternative 2
Additional Assumptions
Investment Income (including interest, dividends,
fees, etc.) = 3.50%
Pre-incentive fee net investment income
(investment income – (management fee + other expenses)) = 2.8625%
20% of cumulative net increase in net assets resulting from operations over
current and preceding 11 calendar quarters = $10 million
Because our pre-incentive fee net investment income exceeds the hurdle rate of 2.0% and because 20.0% of the cumulative net increase in net assets resulting from operations over the then current and 11 preceding calendar quarters exceeds the cumulative income and capital gains incentive fees accrued and/or paid for the preceding 11 calendar quarters, an incentive fee would be payable, as shown in Alternative 3 of Example 1 above.
| (1) | Represents 8.0% annualized hurdle rate. |
| (2) | Represents 1.75% annualized base management fee. |
| 10 |
Example 3: Capital Gains Portion of Incentive Fee (*)
Alternative 1:
Assumptions
Year 1: $20 million investment made in Company A (“Investment A”), and $30 million investment made in Company B (“Investment B”)
Year 2: Investment A sold for $50 million and fair market value (“FMV”) of Investment B determined to be $32 million
Year 3: FMV of Investment B determined to be $25 million
Year 4: Investment B sold for $31 million
The capital gains portion of the incentive fee would be:
Year 1: None
Year 2: Capital gains incentive fee of $6 million — ($30 million realized capital gains on sale of Investment A multiplied by 20%)
Year 3: None — $5 million (20% multiplied by ($30 million cumulative capital gains less $5 million cumulative capital depreciation)) less $6 million (previous capital gains fee paid in Year 2)
Year 4: Capital gains incentive fee of $200,000 — $6.2 million ($31 million cumulative realized capital gains multiplied by 20%) less $6 million (capital gains incentive fee taken in Year 2)
Alternative 2
Assumptions
Year 1: $20 million investment made in Company A (“Investment A”), $30 million investment made in Company B (“Investment B”) and $25 million investment made in Company C (“Investment C”)
Year 2: Investment A sold for $50 million, FMV of Investment B determined to be $25 million and FMV of Investment C determined to be $25 million
Year 3: FMV of Investment B determined to be $27 million and Investment C sold for $30 million
Year 4: FMV of Investment B determined to be $35 million
Year 5: Investment B sold for $20 million
The capital gains incentive fee, if any, would be:
Year 1: None
Year 2: $5 million capital gains incentive fee — 20% multiplied by $25 million ($30 million realized capital gains on Investment A less unrealized capital depreciation on Investment B)
Year 3: $1.4 million capital gains incentive fee (1) — $6.4 million (20% multiplied by $32 million ($35 million cumulative realized capital gains less $3 million unrealized capital depreciation)) less $5 million capital gains incentive fee received in Year 2
Year 4: None
Year 5: None — $5 million (20% multiplied by $25 million (cumulative realized capital gains of $35 million less realized capital losses of $10 million)) less $6.4 million cumulative capital gains incentive fee paid in Year 2 and Year 3 (2)
| * | The hypothetical amounts of returns shown are based on a percentage of our total net assets and assume no leverage. There is no guarantee that positive returns will be realized, and actual returns may vary from those shown in this example. |
| (1) | As illustrated in Year 3 of Alternative 1 above, if we were to be wound up on a date other than our fiscal year end of any year, we may have paid aggregate capital gains incentive fees that are more than the amount of such fees that would be payable if we had been wound up on the fiscal year end of such year. |
| (2) | As noted above, it is possible that the cumulative aggregate capital gains fee received by our investment advisor ($6.4 million) is effectively greater than $5 million (20% of cumulative aggregate realized capital gains less net realized capital losses or net unrealized depreciation ($25 million)). |
Payment of Our Expenses
All investment professionals of MC Advisors and/or its affiliates, when and to the extent engaged in providing investment advisory and management services to us, and the compensation and routine overhead expenses of personnel allocable to these services to us, are provided and paid for by MC Advisors and not by us. We bear all other out-of-pocket costs and expenses of our operations and transactions, including, without limitation:
| • | organization and offering; |
| • | calculating our net asset value (including the cost and expenses of any independent valuation firm); |
| 11 |
| • | fees and expenses incurred by MC Advisors payable to third parties, including agents, consultants or other advisors, in monitoring financial and legal affairs for us and in conducting research and due diligence on prospective investments and equity sponsors, analyzing investment opportunities, structuring our investment and monitoring our investments and portfolio companies on an ongoing basis (although none of MC Advisors’ duties will be subcontracted to sub-advisors); |
| • | interest payable on debt, if any, incurred to finance our investments; | |
| • | offerings of our common stock and other securities; |
| • | investment advisory fees; | |
| • | administration fees and expenses, if any, payable under the Administration Agreement (including payments under the Administration Agreement between us and MC Management based upon our allocable portion of MC Management’s overhead in performing its obligations under the Administration Agreement, including rent and the allocable portion of the cost of our chief financial officer and chief compliance officer, and their respective staffs); |
| • | transfer agent, dividend agent and custodial fees and expenses; |
| • | federal and state registration fees; |
| • | all costs of registration and listing our shares on any securities exchange; |
| • | federal, state and local taxes; |
| • | independent directors’ fees and expenses; |
| • | costs of preparing and filing reports or other documents required by the SEC or other regulators; |
| • | costs of any reports, proxy statements or other notices to stockholders, including printing costs; |
| • | fidelity bond, directors and officers/errors and omissions liability insurance, and any other insurance premiums; |
| • | direct costs and expenses of administration, including printing, mailing, long distance telephone, copying, secretarial and other staff, independent auditors and outside legal costs; |
| • | proxy voting expenses; and |
| • | all other expenses incurred by us or MC Management in connection with administering our business. |
Duration and Termination
Unless terminated earlier as described below, the Investment Advisory and Management Agreement will continue in effect from year to year if approved annually by our Board or by the affirmative vote of the holders of a majority of our outstanding voting securities, and, in either case, if also approved by a majority of our directors who are not “interested persons.” The Investment Advisory and Management Agreement automatically terminates in the event of its assignment, as defined in the 1940 Act, by MC Advisors and may be terminated by either party without penalty upon not less than 60 days’ written notice to the other. The holders of a majority of our outstanding voting securities may also terminate the Investment Advisory and Management Agreement without penalty. See “Risk Factors — Risks Relating to Our Business and Structure — We depend upon MC Advisors’ senior management for our success, and upon its access to the investment professionals of Monroe Capital and its affiliates” and “Risk Factors — Risks Relating to Our Business and Structure — MC Advisors can resign on 60 days’ notice, and we may not be able to find a suitable replacement within that time, resulting in a disruption in our operations that could adversely affect our financial condition, business and results of operations.”
Indemnification
The Investment Advisory and Management Agreement provides that, absent willful misfeasance, bad faith or gross negligence in the performance of its duties or by reason of the reckless disregard of its duties and obligations, MC Advisors and its affiliates’ respective officers, directors, members, managers, stockholders and employees are entitled to indemnification from us from and against any claims or liabilities, including reasonable legal fees and other expenses reasonably incurred, arising out of or in connection with our business and operations or any action taken or omitted on our behalf pursuant to authority granted by the Investment Advisory and Management Agreement, except where attributable to gross negligence, willful misconduct, bad faith or reckless disregard of such person’s duties under the Investment Advisory and Management Agreement.
Administration Agreement
Pursuant to an Administration Agreement, MC Management furnishes us with office facilities and equipment and provides us clerical, bookkeeping and record keeping and other administrative services at such facilities. Under the Administration Agreement, MC Management performs, or oversees the performance of, our required administrative services, which include, among other things, being responsible for the financial records that we are required to maintain and preparing reports to our stockholders and reports filed with the SEC. MC Management also assists us in determining and publishing our net asset value, oversees the preparation and filing of our tax returns, prints and disseminates reports to our stockholders and generally oversees the payment of our expenses and the performance of administrative and professional services rendered to us by others. Under the Administration Agreement, MC Management also provides managerial assistance on our behalf to those portfolio companies that have accepted our offer to provide such assistance.
Payments under the Administration Agreement are equal to an amount based upon our allocable portion (subject to the review and approval of our Board) of MC Management’s overhead in performing its obligations under the Administration Agreement, including rent and our allocable portion of the cost of our officers, including our chief financial officer and chief compliance officer and their respective staffs. Unless terminated earlier as described below, the Administration Agreement will continue in effect from year to year with the approval of our Board. The Administration Agreement may be terminated by either party without penalty upon 60 days’ written notice to the other party.
| 12 |
MC Management may retain third parties to assist in providing administrative services to us. To the extent that MC Management outsources any of its functions, we pay the fees associated with such functions on a direct basis without profit to MC Management. We reimburse MC Management for the allocable portion (subject to the review and approval of our Board) of MC Management’s overhead and other expenses incurred by it in performing its obligations under the Administration Agreement, including rent, the fees and expenses associated with performing compliance functions, and our allocable portion of the cost of our chief financial officer and chief compliance officer and their respective staffs. For the years ended December 31, 2019, 2018 and 2017, we incurred $3.5 million, $3.4 million and $3.4 million in administrative expenses (included within Professional fees, Administrative service fees and General and administrative expenses on the consolidated statements of operations) under the Administration Agreement, respectively, of which $1.3 million, $1.3 million and $1.2 million, respectively, was related to MC Management overhead and salary allocation and paid directly to MC Management.
Indemnification
The Administration Agreement provides that, absent willful misfeasance, bad faith or gross negligence in the performance of its duties or by reason of the reckless disregard of its duties and obligations, MC Management and its affiliates’ respective officers, directors, members, managers, stockholders and employees are entitled to indemnification from us from and against any claims or liabilities, including reasonable legal fees and other expenses reasonably incurred, arising out of or in connection with our business and operations or any action taken or omitted on our behalf pursuant to authority granted by the Administration Agreement, except where attributable to gross negligence, willful misconduct, bad faith or reckless disregard of such person’s duties under the Administration Agreement.
License Agreement
We have entered into a license agreement with Monroe Capital under which Monroe Capital has agreed to grant us a non-exclusive, royalty-free license to use the name “Monroe Capital.” Under this agreement, we have a right to use the “Monroe Capital” name for so long as MC Advisors or one of its affiliates remains our investment advisor. Other than with respect to this limited license, we have no legal right to the “Monroe Capital” name. This license agreement will remain in effect for so long as the Investment Advisory and Management Agreement with MC Advisors is in effect.
Staffing Agreement
We do not have any internal employees. We depend on the diligence, skill and network of business contacts of the senior investment professionals of MC Advisors to achieve our investment objective. MC Advisors is an affiliate of Monroe Capital and depends upon access to the investment professionals and other resources of Monroe Capital and Monroe Capital’s affiliates to fulfill its obligations to us under the Investment Advisory and Management Agreement. MC Advisors also depends upon Monroe Capital to obtain access to deal flow generated by the professionals of Monroe Capital and its affiliates. Under the Staffing Agreement, MC Management provides MC Advisors with the resources necessary to fulfill these obligations. The Staffing Agreement provides that MC Management will make available to MC Advisors experienced investment professionals and access to the senior investment personnel of Monroe Capital for purposes of evaluating, negotiating, structuring, closing and monitoring our investments. The Staffing Agreement also includes a commitment that the members of MC Advisors’ investment committee serve in such capacity. The Staffing Agreement remains in effect until terminated and may be terminated by either party without penalty upon 60 days’ written notice to the other party. Services under the Staffing Agreement are provided to MC Advisors on a direct cost reimbursement basis, and such fees are not our obligation.
Board Approval of the Investment Advisory and Management Agreement and Staffing Agreement
At a meeting of our Board held on August 1, 2019, our Board, including directors who are not “interested persons” as defined in the 1940 Act, voted unanimously to approve and continue the Investment Advisory and Management Agreement for another annual period in accordance with the requirements of the 1940 Act. The approval included consideration and approval of the specific individuals provided through the Staffing Agreement between MC Advisors and MC Management that comprise our investment committee. In reaching a decision to approve and continue the investment advisory agreement and investment committee, the Board reviewed a significant amount of information and considered, among other things:
| • | Nature, Quality and Extent of Services. Our Board reviewed information about the services to be performed and the personnel performing such services under the Investment Advisory Agreement and Staffing Agreement, including the specific approval of the members of the investment committee to be provided pursuant to the Staffing Agreement. Our board of directors considered the nature, extent and quality of the investment selection process employed by MC Advisors and the experience of the members of the investment committee. Our Board concluded that the services to be provided under the Investment Advisory Agreement are consistent with those of comparable BDCs described in the available market data. |
| • | The reasonableness of the fees paid to MC Advisors. Our Board considered comparative data based on publicly available information on other BDCs with respect to services rendered and the advisory fees (including the management fees and incentive fees) of other BDCs as well as our projected operating expenses and expense ratio compared to other BDCs. Our Board also considered the profitability of MC Advisors. Based upon its review, our board of directors concluded that the fees to be paid under the Investment Advisory Agreement are reasonable compared to other BDCs. |
| • | Investment Performance. Our Board reviewed our investment performance as well as comparative data with respect to the investment performance of other externally managed BDCs. Our Board concluded that MC Advisors was delivering results consistent with our investment objective over the most recently completed period. |
| • | Economies of Scale. Our Board addressed the potential for MC Advisors to realize economies of scale in managing our assets, and determined that at this time they did not expect economies of scale to be realized by MC Advisors. |
Based on the information reviewed and the discussions detailed above, our Board, including all of the directors who are not “interested persons” as defined in the 1940 Act, concluded that the investment advisory fee rates and terms are fair and reasonable in relation to the services provided and approved the investment advisory agreement and its continuation as being in the best interests of our stockholders. MC Advisors bears all expenses related to the services and personnel provided pursuant to the Staffing Agreement.
| 13 |
VALUATION PROCESS AND DETERMINATION OF NET ASSET VALUE
The net asset value per share of our outstanding shares of common stock is determined quarterly by dividing the value of total assets minus liabilities by the total number of shares outstanding. We calculate the value of our total assets in accordance with the following procedures.
Investments for which market quotations are readily available and within a recent date are valued at such market quotations. We may also obtain indicative prices with respect to certain of our investments from pricing services or brokers or dealers in order to value such investments. We expect that there will not be a readily available market value within a recent date for many of our investments; those debt and equity securities that are not publicly traded or whose market prices are not readily available are valued at fair value as determined in good faith by our Board using a documented valuation policy and a consistently applied valuation process.
Our Board is ultimately and solely responsible for determining the fair value of the portfolio investments that are not publicly traded, whose market prices are not readily available on a quarterly basis in good faith or any other situation where portfolio investments require a fair value determination.
With respect to investments for which market quotations are not readily available, our Board undertakes a multi-step valuation process each quarter, as described below:
| • | the quarterly valuation process begins with each portfolio company or investment being initially evaluated and rated by the investment professionals of MC Advisors responsible for the credit monitoring of the portfolio investment; |
| • | our Board engages one or more independent valuation firm(s) to conduct independent appraisals of a selection of investments for which market quotations are not readily available. We will consult with independent valuation firm(s) relative to each portfolio company at least once in every calendar year, but the independent appraisals are generally received quarterly; |
| • | to the extent an independent valuation firm is not engaged to conduct an investment appraisal on an investment for which market quotations are not readily available, the investment will be valued by the MC Advisors investment professional responsible for the credit monitoring; |
| • | preliminary valuation conclusions are then documented and discussed with the investment committee; |
| • | the audit committee of our Board reviews the preliminary valuations of MC Advisors and of the independent valuation firm(s) and responds and supplements the valuation recommendations to reflect any comments provided by the audit committee; and |
| • | our Board discusses these valuations and determines the fair value of each investment in the portfolio in good faith, based on the input of MC Advisors, the independent valuation firm(s) and the audit committee. |
The valuation technique utilized in the determination of fair value is affected by a wide variety of factors including the type of investment, whether the investment is new and not yet established in the marketplace, and other characteristics particular to the transaction. The Board generally uses the income approach to determine fair value for loans where market quotations are not readily available, as long as it is appropriate. If there is deterioration in credit quality or a debt investment is in workout status, we may consider other factors in determining the fair value, including the value attributable to the debt investment from the enterprise value of the portfolio company or the proceeds that would be received in a liquidation analysis. This liquidation analysis may also include probability weighting of alternative outcomes. We generally consider our debt to be performing if the borrower is not in default, the borrower is remitting payments in a timely manner, the loan is in covenant compliance or is otherwise not deemed to be impaired. In determining the fair value of the performing debt, we consider fluctuations in current interest rates, the trends in yields of debt instruments with similar credit ratings, financial condition of the borrower, economic conditions and other relevant factors, both qualitative and quantitative. In the event that a debt instrument is not performing, as defined above, we will evaluate the value of the collateral utilizing the same framework described above for a performing loan to determine the value of the debt instrument. See Note 4 to the accompanying consolidated financial statements for additional information on the determination of fair value.
We report our investments at fair value with changes in value reported through our consolidated statements of operations under the caption “unrealized gain (loss).” In determining fair value, we are required to assume that portfolio investments are to be sold in the principal market to market participants, or in the absence of a principal market, the most advantageous market, which may be a hypothetical market. Market participants are defined as buyers and sellers in the principal or most advantageous market that are independent, knowledgeable, and willing and able to transact. The market in which we can exit portfolio investments with the greatest volume and level activity is considered our principal market.
Determination of fair value involves subjective judgments and estimates. Accordingly, the notes to our consolidated financial statements express the uncertainty with respect to the possible effect of such valuations, and any change in such valuations, on our consolidated financial statements.
COMPETITION
We compete with a number of specialty and commercial finance companies to make the types of investments that we make in middle-market companies, including BDCs, traditional commercial banks, private investment funds, regional banking institutions, small business investment companies, investment banks and insurance companies. Additionally, with increased competition for investment opportunities, alternative investment vehicles such as hedge funds may invest in areas they have not traditionally invested in or from which they had withdrawn during the recent economic downturn, including investing in middle-market companies. As a result, competition for investments in lower middle-market companies has intensified, and we expect that trend to continue. Many of our existing and potential competitors are substantially larger and have considerably greater financial, technical and marketing resources than we do. For example, some competitors may have a lower cost of funds and access to funding sources that are not available to us. In addition, some of our competitors may have higher risk tolerances or different risk assessments, which could allow them to consider a wider variety of investments and establish more relationships than us.
We use the expertise of the investment professionals of MC Advisors to assess investment risks and determine appropriate pricing and terms for investments in our loan portfolio. In addition, we expect that the relationships of the senior professionals of MC Advisors will enable us to learn about, and compete effectively for, investment opportunities with attractive middle-market companies, independently or in conjunction with the private equity clients of MC Advisors. For additional information concerning the competitive risks we face, see “Risk Factors — Risks Relating to Our Business and Structure — We operate in a highly competitive market for investment opportunities, which could reduce returns and result in losses.”
| 14 |
INFORMATION TECHNOLOGY
We utilize a number of industry standard practices and software packages to secure, protect, manage and back up all corporate data. We outsource portions of our information technology function to efficiently monitor and maintain our systems. Also, we conduct a daily backup of our systems to ensure the security and stability of the network.
ELECTION TO BE TAXED AS A RIC
As a BDC, we have elected to be treated as a RIC under Subchapter M of the Code. As a RIC, we generally do not have to pay corporate-level U.S. federal income taxes on any ordinary income or capital gains that we timely distribute to our stockholders as dividends. To continue to qualify as a RIC, we must, among other things, meet certain source-of income and asset diversification requirements (as described below). In addition, we must distribute to our stockholders, for each taxable year, at least 90% of our “investment company taxable income,” which is generally our net ordinary income plus the excess of realized net short-term capital gains over realized net long-term capital losses (the “Annual Distribution Requirement”). Generally, we would expect these distributions to be taxable to our stockholders as ordinary income and not to be eligible for the reduced maximum tax rates associated with qualified dividends.
TAXATION AS A RIC
If we continue to:
| • | qualify as a RIC; and |
| • | satisfy the Annual Distribution Requirement; |
then we will not be subject to U.S. federal income tax on the portion of our investment company taxable income and net capital gains, defined as net long-term capital gains in excess of net short-term capital losses we distribute to our stockholders.
We will be subject to U.S. federal income tax at the regular corporate rates on any net income or net capital gain not distributed (or deemed distributed) to our stockholders.
We will be subject to a 4% nondeductible federal excise tax on our undistributed income unless we distribute in a timely manner an amount at least equal to the sum of (a) 98% of our ordinary income for each calendar year, (b) 98.2% of our capital gain net income (both long-term and short-term) for the one-year period ending October 31 in that calendar year and (c) any income realized, but not distributed, in the preceding years (the “Excise Tax Avoidance Requirement”). For this purpose, however, any ordinary income or capital gain net income retained by us that is subject to corporate income tax for the tax year ending in that calendar year will be considered to have been distributed by year end. For the years ended December 31, 2019, 2018 and 2017, we recorded $10 thousand, $11 thousand and $0.1 million on our consolidated statements of operations for U.S. federal excise taxes.
In order to qualify as a RIC for U.S. federal income tax purposes, we must, among other things:
| • | meet the Annual Distribution Requirement; |
| • | qualify to be treated as a BDC under the 1940 Act at all times during each taxable year; |
| • | derive in each taxable year at least 90% of our gross income from dividends, interest, payments with respect to certain securities loans, gains from the sale of stock or other securities, or other income derived with respect to our business of investing in such stock or securities, and net income derived from interests in “qualified publicly traded partnerships” (partnerships that are traded on an established securities market or tradable on a secondary market, other than partnerships that derive 90% of their income from interest, dividends and other permitted RIC income) (the “90% Income Test”); and |
| • | diversify our holdings so that at the end of each quarter of the taxable year: |
| • | at least 50% of the value of our assets consists of cash, cash equivalents, U.S. government securities, securities of other RICs, and other securities if such other securities of any one issuer do not represent more than 5% of the value of our assets or more than 10% of the outstanding voting securities of the issuer (which for these purposes includes the equity securities of a “qualified publicly traded partnership”); and |
| • | no more than 25% of the value of our assets is invested in the securities, other than U.S. government securities or securities of other RICs, of one issuer or of two or more issuers that are controlled, as determined under applicable tax rules, by us and that are engaged in the same or similar or related trades or businesses or in the securities of one or more qualified publicly traded partnerships (the “Diversification Tests”). |
To the extent that we invest in entities treated as partnerships for U.S. federal income tax purposes (other than a “qualified publicly traded partnership”), we generally must include the items of gross income derived by the partnerships for purposes of the 90% Income Test, and the income that is derived from a partnership (other than a “qualified publicly traded partnership”) will be treated as qualifying income for purposes of the 90% Income Test only to the extent that such income is attributable to items of income of the partnership which would be qualifying income if realized by us directly. In addition, we generally must take into account our proportionate share of the assets held by partnerships (other than a “qualified publicly traded partnership”) in which we are a partner for purposes of the Diversification Tests.
In order to prevent our receipt of income that would not satisfy the 90% Income Test, we may establish one or more special purpose corporations to hold assets from which we do not anticipate earning dividend, interest or other qualifying income under the 90% Income Test. Any investments held through a special purpose corporation would generally be subject to federal income taxes and other taxes, and therefore would be expected to achieve a reduced after-tax yield.
| 15 |
We may be required to recognize taxable income in circumstances in which we do not receive a corresponding payment in cash. For example, if we hold debt obligations that are treated under applicable tax rules as having original issue discount (such as debt instruments with PIK interest or, in certain cases, increasing interest rates or issued with warrants), we must include in income each year a portion of the original issue discount that accrues over the life of the obligation, regardless of whether cash representing such income is received by us in the same taxable year. We may also have to include in our income other amounts that we have not yet received in cash, such as deferred loan origination fees that are paid after origination of the loan or are paid in non-cash compensation such as warrants or stock. We anticipate that a portion of our income may constitute original issue discount or other income required to be included in taxable income prior to receipt of cash.
Because any original issue discount or other amounts accrued will be included in our investment company taxable income for the year of the accrual, we may be required to make a distribution to our stockholders in order to satisfy the Annual Distribution Requirement, even though we will not have received the corresponding cash amount. As a result, we may have difficulty meeting the Annual Distribution Requirement. We may have to sell some of our investments at times and/or at prices we do not consider advantageous, raise additional debt or equity capital or forgo new investment opportunities for this purpose. If we are not able to obtain cash from other sources, we may fail to qualify for RIC tax treatment and thus become subject to corporate-level U.S. federal income tax.
Gain or loss realized from warrants acquired by us as well as any loss attributable to the lapse of such warrants generally will be treated as capital gain or loss. Such gain or loss generally will be long-term or short-term, depending on how long we held a particular warrant.
Our investments in non-U.S. securities may be subject to non-U.S. income, withholding and other taxes. In that case, our yield on those securities would be decreased. Stockholders will generally not be entitled to claim a credit or deduction with respect to non-U.S. taxes paid by us.
If we purchase shares in a “passive foreign investment company” (a “PFIC”), we may be subject to U.S. federal income tax on a portion of any “excess distribution” or gain from the disposition of such shares even if such income is distributed as a taxable dividend by us to our stockholders. Additional charges in the nature of interest may be imposed on us in respect of deferred taxes arising from such distributions or gains. If we invest in a PFIC and elect to treat the PFIC as a “qualified electing fund” (a “QEF”), under the Code, in lieu of the foregoing requirements, we will be required to include in income each year a portion of the ordinary earnings and net capital gain of the QEF, even if such income is not distributed to us. Alternatively, we can elect to mark-to-market at the end of each taxable year our shares in a PFIC; in that case, we will recognize as ordinary income any increase in the value of such shares and as ordinary loss any decrease in such value to the extent it does not exceed prior increases included in income. Under either election, we may be required to recognize in a year income in excess of our distributions from PFICs and our proceeds from dispositions of PFIC stock during that year, and such income will be taken into account for purposes of the Annual Distribution Requirement and the 4% federal excise tax.
Under Section 988 of the Code, gain or loss attributable to fluctuations in exchange rates between the time we accrue income, expenses, or other liabilities denominated in a foreign currency and the time we actually collect such income or pay such expenses or liabilities is generally treated as ordinary income or loss. Similarly, gain or loss on foreign currency forward contracts and the disposition of debt denominated in a foreign currency, to the extent attributable to fluctuations in exchange rates between the acquisition and disposition dates, are also treated as ordinary income or loss.
Through our use of leverage, we are subject to certain financial covenants that could limit our ability to make distributions to our stockholders. In addition, under the 1940 Act, we are not permitted to make distributions to our stockholders while our debt obligations and other senior securities are outstanding unless certain “asset coverage” tests are met. If we are unable to make sufficient distributions to satisfy the Annual Distribution Requirement, we may fail to qualify as a RIC.
Although we do not expect to do so, we will be authorized (subject to our financial covenants and 1940 Act asset coverage tests) to borrow funds and to sell assets in order to satisfy the Annual Distribution Requirement and to eliminate or minimize our liability for U.S. federal income tax and the 4% federal excise tax. However, our ability to dispose of assets to make distributions may be limited by (1) the illiquid nature of our portfolio and/or (2) other requirements relating to our status as a RIC, including the Diversification Tests. If we dispose of assets in order to meet the Annual Distribution Requirement or to avoid the 4% federal excise tax, we may make such dispositions at times that, from an investment standpoint, are not advantageous.
If we fail to satisfy the Annual Distribution Requirement or otherwise fail to qualify as a RIC in any taxable year, and certain relief provisions are not available, we will be subject to tax in that year on all of our taxable income, regardless of whether we make any distributions to our stockholders. In that case, all of such income will be subject to corporate-level federal income tax, reducing the amount available to be distributed to our stockholders. See “Failure to Qualify as a RIC” below for more information.
As a RIC, we are not allowed to carry forward or carry back a net operating loss for purposes of computing our investment company taxable income in other taxable years. We generally are permitted to carry forward for an indefinite period any capital losses not used to offset capital gains. However, future transactions that we engage in may cause our ability to use any capital loss carry forwards, and unrealized losses once realized, to be limited under Section 382 of the Code.
| 16 |
Certain of our investment practices may be subject to special and complex U.S. federal income tax provisions that may, among other things: (i) disallow, suspend or otherwise limit the allowance of certain losses or deductions; (ii) convert lower taxed long-term capital gain and qualified dividend income into higher taxed short-term capital gain or ordinary income; (iii) convert an ordinary loss or a deduction into a capital loss (the deductibility of which is more limited); (iv) cause us to recognize income or gain without a corresponding receipt of cash; (v) adversely affect the time as to when a purchase or sale of stock or securities is deemed to occur; (vi) adversely alter the characterization of certain complex financial transactions; and (vii) produce income that will not be qualifying income for purposes of the 90% Income Test. We will monitor our transactions and may make certain tax decisions in order to mitigate the potential adverse effects of these provisions.
As described above, to the extent that we invest in equity securities of entities that are treated as partnerships for U.S. federal income tax purposes, the effect of such investments for purposes of the 90% Income Test and the Diversification Tests will depend on whether or not the partnership is a “qualified publicly traded partnership” (as defined in the Code). If the partnership is a “qualified publicly traded partnership,” the net income derived from such investments will be qualifying income for purposes of the 90% Income Test and will be “securities” for purposes of the Diversification Tests. If the partnership, however, is not treated as a “qualified publicly traded partnership,” then the consequences of an investment in the partnership will depend upon the amount and type of income and assets of the partnership allocable to us. The income derived from such investments may not be qualifying income for purposes of the 90% Income Test and, therefore, could adversely affect our qualification as a RIC. We intend to monitor our investments in equity securities of entities that are treated as partnerships for U.S. federal income tax purposes to prevent our disqualification as a RIC.
FAILURE TO QUALIFY AS A RIC
If we fail the 90% Income Test or the Diversification Tests for any taxable year or quarter of such taxable year, we may nevertheless continue to qualify as a RIC for such year if certain relief provisions of the Code apply (which, among other things may require us to pay certain corporate-level federal taxes or to dispose of certain assets). If we are unable to qualify for treatment as a RIC and are unable to cure the failure, we would be subject to U.S. federal income tax on all of our taxable income at regular corporate rates. We would not be able to deduct distributions to stockholders, nor would they be required to be made. In the event of such a failure to qualify, distributions, including distributions of net long-term capital gain, would generally be taxable to our stockholders as ordinary dividend income to the extent of our current and accumulated earnings and profits. Subject to certain limitations under the Code, our corporate stockholders would be eligible to claim a dividend received deduction with respect to such dividend; our non-corporate stockholders would generally be able to treat such dividends as “qualified dividend income,” which is subject to reduced rates of U.S. federal income tax. Distributions in excess of our current and accumulated earnings and profits would be treated first as a return of capital to the extent of the stockholder’s tax basis, and any remaining distributions would be treated as a capital gain. In order to qualify as a RIC, in addition to the other requirements discussed above, we would be required to distribute all of our previously undistributed earnings and profits attributable to any period prior to us becoming a RIC by the end of the first year that we intend to qualify as a RIC. To the extent that we have any net built-in gains in our assets (i.e., the excess of the aggregate gains, including items of income, over aggregate losses that would have been realized with respect to such assets if we had been liquidated) as of the beginning of the first year that we qualify as a RIC, we would be subject to a corporate-level U.S. federal income tax on such built-in gains if and when recognized over the next ten years (or shorter applicable period). Alternatively, we may choose to recognize such built-in gains immediately prior to our qualification as a RIC.
If we have previously qualified as a RIC, but are subsequently unable to qualify for treatment as a RIC, and certain amelioration provisions are not applicable, we would be subject to tax on all of our taxable income (including our net capital gains) at regular corporate rates. We would not be able to deduct distributions to our stockholders, nor would they be required to be made. Distributions, including distributions of net long-term capital gain, would generally be taxable to our stockholders as ordinary dividend income to the extent of our current and accumulated earnings and profits. Subject to certain limitations under the Code, our corporate stockholders would be eligible to claim a dividend received deduction with respect to such dividend; our non-corporate stockholders would generally be able to treat such dividends as “qualified dividend income,” which is subject to reduced rates of U.S. federal income tax. Distributions in excess of our current and accumulated earnings and profits would be treated first as a return of capital to the extent of the stockholder’s tax basis, and any remaining distributions would be treated as a capital gain. In order to requalify as a RIC, in addition to the other requirements discussed above, we would be required to distribute all of our previously undistributed earnings attributable to the period we failed to qualify as a RIC by the end of the first year that we intend to requalify as a RIC. If we fail to requalify as a RIC for a period greater than two taxable years, we may be subject to regular corporate tax on any net built-in gains with respect to certain of our assets (i.e., the excess of the aggregate gains, including items of income, over aggregate losses that would have been realized with respect to such assets if we had been liquidated) that we elect to recognize on requalification or when recognized over the next five years.
| 17 |
REGULATION
We are a BDC under the 1940 Act and have elected to be treated as a RIC under the Code. The 1940 Act contains prohibitions and restrictions relating to transactions between BDCs and their affiliates (including any investment advisors), principal underwriters and affiliates of those affiliates or underwriters and requires that a majority of the directors of a BDC be persons other than “interested persons,” as that term is defined in the 1940 Act. In addition, the 1940 Act provides that we may not change the nature of our business so as to cease to be, or to withdraw our election as, a BDC unless approved by a majority of our outstanding voting securities.
We may invest up to 100% of our assets in securities acquired directly from issuers in privately negotiated transactions. With respect to such securities, we may, for the purpose of public resale, be deemed an “underwriter” as that term is defined in the Securities Act. Our intention is to not write (sell) or buy put or call options to manage risks associated with the publicly traded securities of our portfolio companies, except that we may enter into hedging transactions to manage the risks associated with interest rate fluctuations. However, we may purchase or otherwise receive warrants to purchase the common stock of our portfolio companies in connection with acquisition financing or other investments. Similarly, in connection with an acquisition, we may acquire rights to require the issuers of acquired securities or their affiliates to repurchase them under certain circumstances. We also do not intend to acquire securities issued by any investment company that exceed the limits imposed by the 1940 Act. Under these limits, we generally cannot acquire more than 3% of the total outstanding voting stock of any registered investment company, invest more than 5% of the value of our total assets in the securities of one investment company or invest, in the aggregate, more than 10% of the value of our total assets in the securities of more than one investment company. With regard to that portion of our portfolio invested in securities issued by investment companies, it should be noted that such investments might subject our stockholders to additional expenses. None of these policies are fundamental and may be changed to the extent permitted by law without stockholder approval.
The SBIC license allows our subsidiary, MRCC SBIC, to obtain leverage by issuing SBA debentures, subject to the issuance of a leverage commitment by the SBA and other customary procedures. SBA debentures are non-recourse, interest only debentures with interest payable semi-annually and have a 10-year maturity. The principal amount of SBA debentures is not required to be paid prior to maturity but may be prepaid at any time without penalty. The interest rate of SBA debentures is fixed on a semi-annual basis (pooling date) at a market-driven spread over U.S. Treasury Notes with 10-year maturities. The SBA, as a creditor, has a superior claim to MRCC SBIC’s assets over our stockholders in the event we liquidate MRCC SBIC or the SBA exercises its remedies under the SBA debentures issued to MRCC SBIC upon an event of default.
SBICs are designed to stimulate the flow of private equity capital to eligible small businesses. Under SBA regulations, SBICs may make loans to eligible small businesses and invest in the equity securities of small businesses. Under present SBA regulations, eligible small businesses include businesses that have a tangible net worth not exceeding $19.5 million and have average after tax net income not exceeding $6.5 million for the two most recent fiscal years. In addition, an SBIC must devote 25% of its investment activity to “smaller” concerns as defined by the SBA. A smaller concern is one that has a tangible net worth not exceeding $6.0 million and has average after tax net income not exceeding $2.0 million for the two most recent fiscal years. SBA regulations also provide alternative size standard criteria to determine eligibility, which depends on the industry in which the business is engaged and are based on such factors as the number of employees and gross sales. According to SBA regulations, SBICs may make long-term loans to small businesses, invest in the equity securities of such businesses and provide them with consulting and advisory services.
SBA regulations currently limit the amount that an individual SBIC may borrow to a maximum of $175.0 million when it has at least $87.5 million in regulatory capital, receives a leverage commitment from the SBA and has been through an audit examination by the SBA subsequent to licensing. The SBA also historically limited a related group of SBICs (commonly referred to as a “family of funds”) to a maximum of $225.0 million in total borrowings. On December 18, 2015, this family of funds limitation was raised to $350.0 million in total borrowings.
On October 2, 2014, we received exemptive relief from the SEC to permit us to exclude the debt of MRCC SBIC guaranteed by the SBA from the asset coverage test under the 1940 Act. The exemptive relief provides us with increased flexibility under the asset coverage test by permitting us to borrow, through MRCC SBIC, more than we would otherwise be able to absent the receipt of this exemptive relief. This provides us with increased investment flexibility but also increases our risks related to leverage. For a discussion of the risks associated with leverage, see “Risk Factors — Risks Relating to Our Business and Structure — Regulations governing our operation as a BDC affect our ability to and the way in which we raise additional capital” and “Risk Factors — Risks Relating to Our Business and Structure — We maintain a revolving credit facility and use other borrowed funds to make investments or fund our business operations, which exposes us to risks typically associated with leverage and increases the risk of investing in us.”
The SBA restricts the ability of SBICs to repurchase their capital stock. SBA regulations also include restrictions on a “change of control” or transfer of an SBIC and require that SBICs invest idle funds in accordance with SBA regulations. In addition, our current and any future SBIC subsidiaries may also be limited in their ability to make distributions to us if they do not have sufficient capital, in accordance with SBA regulations.
MRCC SBIC is subject to regulation and oversight by the SBA, including requirements with respect to maintaining certain minimum financial ratios and other covenants. Receipt of a SBIC license does not assure that MRCC SBIC will receive additional SBA debenture funding, which is dependent upon MRCC SBIC’s continuing to be in compliance with SBA regulations and policies.
| 18 |
QUALIFYING ASSETS
Under the 1940 Act, a BDC may not acquire any asset other than assets of the type listed in Section 55(a) of the 1940 Act, which are referred to as “qualifying assets,” unless, at the time the acquisition is made, qualifying assets represent at least 70% of the company’s total assets. The principal categories of qualifying assets relevant to our business are the following:
| (a) | Securities purchased in transactions not involving any public offering from the issuer of such securities, which issuer (subject to certain limited exceptions) is an eligible portfolio company, or from any person who is, or has been during the preceding 13 months, an affiliated person of an eligible portfolio company, or from any other person, subject to such rules as may be prescribed by the SEC. An eligible portfolio company is defined in the 1940 Act as any issuer that: |
| • | is organized under the laws of, and has its principal place of business in, the United States; |
| • | is not an investment company (other than a small business investment company wholly-owned by the BDC) or a company that would be an investment company but for certain exclusions under the 1940 Act; and |
| • | satisfies either of the following: |
| • | does not have any class of securities listed on a national securities exchange or has any class of securities listed on a national securities exchange subject to a $250 million market capitalization maximum; or |
| • | is controlled by a BDC or a group of companies including a BDC, and such BDC actually exercises a controlling influence over the management or policies of the eligible portfolio company, and, as a result, the BDC has an affiliated person who is a director of the eligible portfolio company. |
| (b) | Securities of any eligible portfolio company which we control. |
| (c) | Securities purchased in a private transaction from a U.S. issuer that is not an investment company or from an affiliated person of the issuer, or in transactions incident to such a private transaction, if the issuer is in bankruptcy and subject to reorganization, or, if the issuer, immediately prior to the purchase of its securities, was unable to meet its obligations as they came due without material assistance other than conventional lending or financing arrangements. |
| (d) | Securities of an eligible portfolio company purchased from any person in a private transaction if there is no ready market for such securities and we already own 60% of the outstanding equity securities of the eligible portfolio company. |
| (e) | Securities received in exchange for or distributed on or with respect to securities described above, or pursuant to the exercise of warrants or rights relating to such securities. |
| (f) | Cash, cash equivalents, U.S. government securities or high-quality debt securities that mature in one year or less from the date of investment. |
The regulations defining qualifying assets may change over time. We may adjust our investment focus as needed to comply with and/or take advantage of any regulatory, legislative, administrative or judicial actions in this area. Investments in the securities of companies domiciled in or with their principal places of business outside of the United States, are not qualifying assets. In accordance with Section 55(a) of the 1940 Act, we cannot invest more than 30% of our assets in non-qualifying assets.
MANAGERIAL ASSISTANCE TO PORTFOLIO COMPANIES
A BDC must have been organized and have its principal place of business in the United States and must be operated for the purpose of making investments in the types of securities described above. However, in order to count portfolio securities as qualifying assets for the purpose of the 70% test, a BDC must either control the issuer of securities or must offer to make available to the issuer of the securities significant managerial assistance. However, when a BDC purchases securities in conjunction with one or more other persons acting together, one of the other persons in the group may make available such managerial assistance. Making available managerial assistance means, among other things, any arrangement whereby the BDC, through its directors, officers, employees or agents offers to provide, and, if accepted, does so provide, significant guidance and counsel concerning the management, operations or business objectives and policies of a portfolio company through monitoring of portfolio company operations, selective participation in board and management meetings, consulting with and advising a portfolio company’s officers or other organizational or financial guidance. MC Advisors or its affiliates provide such managerial assistance on our behalf to portfolio companies that request this assistance.
| 19 |
TEMPORARY INVESTMENTS
Pending investments in other types of qualifying assets, as described above, our investments may consist of cash, cash equivalents, U.S. government securities and high-quality debt investments that mature in one year or less from the date of investment, which we refer to, collectively, as temporary investments, so that 70% of our assets are qualifying assets or temporary investments. We may invest in U.S. Treasury bills or in repurchase agreements, so long as the agreements are fully collateralized by cash or securities issued by the U.S. government or its agencies. A repurchase agreement involves the purchase by an investor, such as us, of a specified security and the simultaneous agreement by the seller to repurchase it at an agreed-upon future date and at a price that is greater than the purchase price by an amount that reflects an agreed-upon interest rate. There is no percentage restriction on the proportion of our assets that may be invested in such repurchase agreements. However, if more than 25% of our total assets constitute repurchase agreements from a single counterparty, we would not meet the Diversification Tests in order to qualify as a RIC for U.S. federal income tax purposes. Accordingly, we do not intend to enter into repurchase agreements with a single counterparty in excess of this limit. MC Advisors monitors the creditworthiness of the counterparties with which we enter into repurchase agreement transactions.
SENIOR SECURITIES
We are generally permitted, under specified conditions, to issue multiple classes of indebtedness and one class of stock senior to our common stock if our asset coverage, as defined in the 1940 Act, is at least equal to 150% immediately after each such issuance. In addition, while any senior securities remain outstanding, we must make provisions to prohibit any distribution to our stockholders or the repurchase of such securities or shares unless we meet the applicable asset coverage ratios at the time of the distribution or repurchase. We may also borrow amounts up to 5% of the value of our total assets for temporary or emergency purposes without regard to asset coverage. We consolidate our financial results with all of our wholly-owned subsidiaries, including MRCC SBIC, for financial reporting purposes and measure our compliance with the leverage test applicable to BDCs under the 1940 Act on a consolidated basis. On October 2, 2014, we received exemptive relief from the SEC to permit us to exclude the debt of our SBIC subsidiaries from our asset coverage test under the 1940 Act. As such, our ratio of total consolidated assets to outstanding indebtedness may be less than 150%. This provides us with increased investment flexibility but also increases our risks related to leverage. For a discussion of the risks associated with leverage, see “Risk Factors — Risks Relating to Our Business and Structure — Regulations governing our operation as a BDC affect our ability to and the way in which we raise additional capital” and “Risk Factors — Risks Relating to Our Business and Structure — We maintain a revolving credit facility and use other borrowed funds to make investments or fund our business operations, which exposes us to risks typically associated with leverage and increases the risk of investing in us.”
CODES OF ETHICS
We and MC Advisors have each adopted a code of ethics pursuant to Rule 17j-1 under the 1940 Act that establishes procedures for personal investments and restricts certain personal securities transactions. Personnel subject to each code may invest in securities for their personal investment accounts, including securities that may be purchased or held by us, so long as such investments are made in accordance with the code’s requirements. You may access our code of ethics on our website at www.monroebdc.com. The date and substance of amendments to the code, if any, are noted on the cover page of the code of ethics. In addition, each code of ethics is attached as an exhibit to our registration statement and is available on the EDGAR Database on the SEC’s website at www.sec.gov. You may also obtain copies of each code of ethics, after paying a duplicating fee, by electronic request at the following e-mail address: publicinfo@sec.gov.
| 20 |
PROXY VOTING POLICIES AND PROCEDURES
We have delegated our proxy voting responsibility to MC Advisors. The proxy voting policies and procedures of MC Advisors are set out below. The guidelines are reviewed periodically by MC Advisors and our directors who are not “interested persons,” and, accordingly, are subject to change. For purposes of these proxy voting policies and procedures described below, “we,” “our” and “us” refer to MC Advisors.
Introduction
As an investment advisor registered under the Advisers Act, we have a fiduciary duty to act solely in the best interests of our clients. As part of this duty, we recognize that we must vote client securities in a timely manner free of conflicts of interest and in the best interests of our clients.
These policies and procedures for voting proxies for our investment advisory clients are intended to comply with Section 206 of, and Rule 206(4)-6 under, the Advisers Act.
Proxy Policies
We vote proxies relating to our portfolio securities in what we perceive to be the best interest of our clients’ stockholders. We review on a case-by-case basis each proposal submitted to a stockholder vote to determine its effect on the portfolio securities held by our clients. In most cases we will vote in favor of proposals that we believe are likely to increase the value of the portfolio securities held by our clients. Although we will generally vote against proposals that may have a negative effect on our clients’ portfolio securities, we may vote for such a proposal if there exist compelling long-term reasons to do so.
Our proxy voting decisions are made by those senior officers who are responsible for monitoring each of our clients’ investments. To ensure that our vote is not the product of a conflict of interest, we require that (a) anyone involved in the decision-making process disclose to our chief compliance officer any potential conflict that he or she is aware of and any contact that he or she has had with any interested party regarding a proxy vote and (b) employees involved in the decision making process or vote administration are prohibited from revealing how we intend to vote on a proposal in order to reduce any attempted influence from interested parties. Where conflicts of interest may be present, we will disclose such conflicts to our client, including those directors who are not interested persons and we may request guidance from such persons on how to vote such proxies for their account.
Proxy Voting Records
You may obtain information about how we voted proxies for Monroe Capital Corporation by making a written request for proxy voting information to: Monroe Capital Corporation, 311 South Wacker Drive, Suite 6400, Chicago, Illinois 60606, Attention: Chief Compliance Officer, or by calling Monroe Capital Corporation at (312) 258-8300. The SEC also maintains a website at www.sec.gov that contains such information.
COMPLIANCE POLICIES AND PROCEDURES
We and MC Advisors have adopted and implemented written policies and procedures reasonably designed to prevent violation of federal securities laws and are required to review these compliance policies and procedures annually for their adequacy and the effectiveness of their implementation. Our chief compliance officer is responsible for administering these policies and procedures.
PRIVACY PRINCIPLES
We are committed to maintaining the privacy of our stockholders and to safeguarding their nonpublic personal information. The following information is provided to help you understand what personal information we collect, how we protect that information and why, in certain cases, we may share information with select other parties.
Generally, we do not receive any nonpublic personal information relating to our stockholders, although certain nonpublic personal information of our stockholders may become available to us. We do not disclose any nonpublic personal information about our stockholders or former stockholders to anyone, except as permitted by law or as is necessary in order to service stockholder accounts (for example, to a transfer agent or third-party administrator).
We restrict access to nonpublic personal information about our stockholders to employees of MC Management and its affiliates with a legitimate business need for the information. We maintain physical, electronic and procedural safeguards designed to protect the nonpublic personal information of our stockholders.
| 21 |
OTHER
We are required to provide and maintain a bond issued by a reputable fidelity insurance company to protect us against larceny and embezzlement. Furthermore, as a BDC, we are prohibited from protecting any director or officer against any liability to Monroe Capital Corporation or our stockholders arising from willful misfeasance, bad faith, gross negligence or reckless disregard of the duties involved in the conduct of such person’s office.
We and MC Advisors are each required to adopt and implement written policies and procedures reasonably designed to prevent violation of relevant federal securities laws, obtain approval of the Board of these policies and procedures, review these policies and procedures annually for their adequacy and the effectiveness of their implementation and designate a chief compliance officer to be responsible for administering the policies and procedures.
We may also be prohibited under the 1940 Act from knowingly participating in certain transactions with our affiliates without the prior approval of our Board who are not interested persons and, in some cases, prior approval by the SEC. The SEC has interpreted the BDC prohibition on transactions with affiliates to prohibit all “joint transactions” between entities that share a common investment advisor. The staff of the SEC has granted no-action relief permitting purchases of a single class of privately placed securities provided that the advisor negotiates no term other than price and certain other conditions are met. As a result, we only expect to co-invest on a concurrent basis with other funds advised by MC Advisors when each of us will own the same securities of the issuer and when no term is negotiated other than price. Any such investment would be made in compliance with existing regulatory guidance, applicable regulations and our allocation procedures. If opportunities arise that would otherwise be appropriate for us and for another fund advised by MC Advisors to invest in different securities of the same issuer, MC Advisors will need to decide which fund will proceed with the investment. Moreover, except in certain circumstances, we are unable to invest in any issuer in which another fund advised by MC Advisors has previously invested.
We co-invest on a concurrent basis with other affiliates of MC Advisors, unless doing so is impermissible with existing regulatory guidance, applicable regulations, the terms of any exemptive relief granted to us and our allocation procedures. On October 15, 2014, we received exemptive relief from the SEC that permits us greater flexibility to negotiate the terms of co-investments if our Board determines that it would be advantageous for us to co-invest with other accounts sponsored or managed by MC Advisors or its affiliates in a manner consistent with our investment objectives, positions, policies, strategies and restrictions as well as regulatory requirements and other pertinent factors. We believe that co-investment by us and accounts sponsored or managed by MC Advisors and its affiliates may afford us additional investment opportunities and the ability to achieve greater diversification.
POLICIES AND PROCEDURES FOR MANAGING CONFLICTS
As of December 31, 2019, affiliates of MC Advisors manage other assets in nine closed-end funds, two small business investment companies and 16 private funds that also have an investment strategy focused primarily on senior, unitranche and junior secured debt and to a lesser extent, unsecured subordinated debt to lower middle-market companies. In addition, MC Advisors manages our wholly-owned SBIC subsidiary, MRCC SBIC, as the manager of MRCC SBIC’s general partner, a private BDC, Monroe Capital Income Plus Corporation, and it may manage other entities in the future with an investment focus similar to ours. To the extent that we compete with entities managed by MC Advisors or any of its affiliates for a particular investment opportunity, MC Advisors will allocate investment opportunities across the entities for which such opportunities are appropriate, consistent with (a) its internal conflict of interest and allocation policies, (b) the requirements of the Advisers Act and (c) certain restrictions under the 1940 Act and rules thereunder regarding co-investments with affiliates. MC Advisors’ allocation policies are intended to ensure that we may generally share equitably with other investment funds or other investment vehicles managed by MC Advisors or its affiliates in investment opportunities, particularly those involving a security with limited supply or involving differing classes of securities of the same issuer which may be suitable for us and such other investment funds or other investment vehicles.
MC Advisors and/or its affiliates may in the future sponsor or manage investment funds, accounts, or other investment vehicles with similar or overlapping investment strategies and have put in place a conflict-resolution policy that addresses the co-investment restrictions set forth under the 1940 Act. MC Advisors will seek to ensure an equitable allocation of investment opportunities when we are able to invest alongside other accounts managed by MC Advisors and its affiliates. We received exemptive relief from the SEC on October 15, 2014 that permits greater flexibility relating to co-investments, subject to certain conditions. When we invest alongside such other accounts as permitted under the 1940 Act, pursuant to SEC staff interpretation, and pursuant to our exemptive relief from the SEC that would permit greater flexibility relating to co-investments, such investments will be made consistent with such relief and MC Advisors’ allocation policy. Under this allocation policy, a fixed percentage of each opportunity, which may vary based on asset class and from time to time, will be offered to us and similar eligible accounts, as periodically determined by MC Advisors and approved by our Board, including a majority of our independent directors. The allocation policy provides that allocations among us and other accounts will generally be made pro rata based on each account’s capital available for investment, as determined, in our case, by our Board, including a majority of our independent directors. It is our policy to base our determinations as to the amount of capital available for investment on such factors as the amount of cash on hand, existing commitments and reserves, if any, the targeted leverage level, the targeted asset mix and diversification requirements and other investment policies and restrictions set by our Board, or imposed by applicable laws, rules, regulations or interpretations. We expect that these determinations will be made similarly for other accounts. In situations where co-investment with other entities sponsored or managed by MC Advisors or its affiliates is not permitted or appropriate, such as when there is an opportunity to invest in different securities of the same issuer, MC Advisors will need to decide whether we or such other entity or entities will proceed with the investment. MC Advisors will make these determinations based on its policies and procedures which will generally require that such opportunities be offered to eligible accounts on a basis that is fair and equitable over time.
| 22 |
AVAILABLE INFORMATION
We intend to make this Annual Report on Form 10-K, as well as our quarterly reports on Form 10-Q, our current reports on Form 8-K and, if applicable, amendments to those reports filed or furnished pursuant to Section 13(a) of the Exchange Act, publicly available free of charge as soon as reasonably practicable following our filing of such reports with the SEC. We maintain a website at www.monroebdc.com and make all of our annual, quarterly and current reports, proxy statements and other publicly filed information available, free of charge, on or through our website. Information contained on our website is not incorporated into this report, and you should not consider information on our website to be part of this report. You may also obtain such information by contacting us in writing at 311 South Wacker Drive, Suite 6400, Chicago, Illinois 60606, Attention: Investor Relations. The SEC maintains a website that contains reports, proxy and information statements and other information we file with the SEC at www.sec.gov.
Investing in our securities involves a number of significant risks. The risks set out below are not the only risks we face. Additional risks and uncertainties not presently known to us or not presently deemed material by us may also impair our operations and performance. If any of the following events occurs, our business, financial condition and results of operations could be materially and adversely affected. In such case, our net asset value and the trading price of our securities could decline, and you may lose all or part of your investment.
Risks Relating to Our Business and Structure
We depend upon MC Advisors’ senior management for our success, and upon its access to the investment professionals of Monroe Capital and its affiliates.
We do not have any internal management capacity or employees. We depend on the investment expertise, skill and network of business contacts of the senior investment professionals of MC Advisors, who evaluate, negotiate, structure, execute, monitor and service our investments in accordance with the terms of the Investment Advisory and Management Agreement. Our success depends to a significant extent on the continued service and coordination of the senior investment professionals of MC Advisors, particularly Messrs. Koenig, Peck, Egan and VanDerMeid, who comprise the MC Advisors investment committee. These individuals may have other demands on their time now and in the future, and we cannot assure you that they will continue to be actively involved in our management. Each of these individuals is an employee of MC Management and is not subject to an employment contract. The departure of any of these individuals or competing demands on their time in the future could have a material adverse effect on our ability to achieve our investment objective.
MC Advisors evaluates, negotiates, structures, closes and monitors our investments in accordance with the terms of the Investment Advisory and Management Agreement. We can offer no assurance, however, that MC Advisors’ senior investment professionals will continue to provide investment advice to us. If these individuals do not maintain their existing relationships with Monroe Capital and its affiliates and do not develop new relationships with other sources of investment opportunities, we may not be able to grow our investment portfolio or achieve our investment objective. In addition, individuals with whom Monroe Capital’s senior investment professionals have relationships are not obligated to provide us with investment opportunities. Therefore, we can offer no assurance that such relationships will generate investment opportunities for us.
MC Advisors, an affiliate of Monroe Capital, provides us with access to Monroe Capital’s investment professionals. MC Advisors also depends upon Monroe Capital to obtain access to deal flow generated by the investment professionals of Monroe Capital and its affiliates. The Staffing Agreement provides that MC Management will make available to MC Advisors experienced investment professionals and access to the senior investment personnel of Monroe Capital for purposes of evaluating, negotiating, structuring, closing and monitoring our investments. We are not a party to this Staffing Agreement and cannot assure you that MC Management will continue to fulfill its obligations under the agreement. Furthermore, the Staffing Agreement may be terminated by either party without penalty upon 60 days’ written notice to the other party. If MC Management fails to perform or terminates the agreement, we cannot assure you that MC Advisors will enforce the Staffing Agreement or that such agreement will not be terminated by either party or that we will continue to have access to the investment professionals of Monroe Capital and its affiliates or their information and deal flow.
The investment committee that oversees our investment activities is provided by MC Advisors under the Investment Advisory and Management Agreement. The loss of any member of MC Advisors’ investment committee or of other Monroe Capital senior investment professionals would limit our ability to achieve our investment objective and operate as we anticipate. This could have a material adverse effect on our financial condition and results of operations.
| 23 |
Our business model depends to a significant extent upon strong referral relationships with financial institutions, sponsors and investment professionals. Any inability of MC Advisors to maintain or develop these relationships, or the failure of these relationships to generate investment opportunities, could adversely affect our business.
We depend upon the senior investment professionals of MC Advisors to maintain their relationships with financial institutions, sponsors and investment professionals, and we rely to a significant extent upon these relationships to provide us with potential investment opportunities. If the senior investment professionals of MC Advisors fail to maintain such relationships, or to develop new relationships with other sources of investment opportunities, we will not be able to grow our investment portfolio. In addition, individuals with whom the senior investment professionals of MC Advisors have relationships are not obligated to provide us with investment opportunities, and, therefore, we can offer no assurance that these relationships will generate investment opportunities for us in the future.
Our financial condition and results of operations depend on our ability to manage our business effectively.
Our ability to achieve our investment objective and grow depends on our ability to manage our business. This depends, in turn, on MC Advisors’ ability to identify, invest in and monitor companies that meet our investment criteria. The achievement of our investment objectives depends upon MC Advisors’ execution of our investment process, its ability to provide competent, attentive and efficient services to us and, to a lesser extent, our access to financing on acceptable terms. MC Advisors has substantial responsibilities under the Investment Advisory and Management Agreement. The senior origination professionals and other personnel of MC Advisors and its affiliates may be called upon to provide managerial assistance to our portfolio companies. These activities may distract them or slow our rate of investment. Any failure to manage our business and our future growth effectively could have a material adverse effect on our business, financial condition, results of operations and prospects. Our results of operations depend on many factors, including the availability of opportunities for investment, readily accessible short and long-term funding alternatives in the financial markets and economic conditions. Furthermore, if we cannot successfully operate our business or implement our investment policies and strategies, it could negatively impact our ability to pay dividends or other distributions and you may lose all or part of your investment.
There may be conflicts related to obligations that MC Advisors’ senior investment professionals and members of its investment committee have to other clients.
The senior investment professionals and members of the investment committee of MC Advisors serve or may serve as officers, directors or principals of entities that operate in the same or a related line of business as we do, or of investment funds, accounts or other investment vehicles sponsored or managed by MC Advisors or its affiliates. In serving in these multiple capacities, they may have obligations to other clients or investors in those entities, the fulfillment of which may not be in our best interests or in the best interest of our stockholders. For example, Messrs. Koenig, Peck, Egan and VanDerMeid have and will continue to have management responsibilities for other investment funds, accounts or other investment vehicles sponsored or managed by affiliates of MC Advisors. In serving in these multiple capacities, they may have obligations to other clients or investors in those entities, the fulfillment of which may not be in the best interests of us or our stockholders. MC Advisors seeks to allocate investment opportunities among eligible accounts in a manner that is fair and equitable over time and consistent with its allocation policy.
MC Advisors manages other assets in a private BDC, and affiliates of MC Advisors manage other assets in nine closed-end funds, two small business investment companies and 16 private funds that also have an investment strategy focused primarily on senior, unitranche and junior secured debt and, to a lesser extent, unsecured subordinated debt to lower middle-market companies. Except for the private BDC, none of these funds are registered with the SEC. In addition, MC Advisors and/or its affiliates may manage other entities in the future with an investment strategy that has the same or similar focus as ours.
Monroe Capital and its affiliates seek to allocate investment opportunities among the participating funds, including us, in proportion to the relative amounts of capital available for new investments, taking into account such factors as Monroe Capital may determine appropriate, including investment objectives, legal or regulatory restrictions, current holdings, availability of capital for investment, immediately available cash, the size of investments generally, risk-return considerations, relative exposure to market trends, maintenance of targeted leverage level, targeted asset mix, target investment return, diversification requirements, strategic objectives, specific liquidity requirements, tax consequences, limitations and restrictions on a fund’s portfolio that are imposed by such fund’s governing board or documents, and other considerations or factors that Monroe Capital deems necessary or appropriate in light of the circumstances at such time (collectively, the “Allocation Criteria”). We expect that Monroe Capital will follow the Allocation Criteria with respect to all of its funds under management, including us.
In situations where co-investment with other entities sponsored or managed by MC Advisors or its affiliates is not permitted or appropriate, such as when there is an opportunity to invest in securities of the same issuer that have different priorities or liens, MC Advisors will need to decide whether we or such other entity or entities will proceed with the investment. MC Advisors will make these determinations based on its policies and procedures which require that such opportunities be offered to eligible accounts on a basis that is fair and equitable over time. However, there can be no assurance that we will be able to participate in all investment opportunities that are suitable to us.
MC Advisors or its investment committee may, from time to time, possess material nonpublic information, limiting our investment discretion.
The managing members and the senior origination professionals of MC Advisors and the senior professionals and members of MC Advisors’ investment committee may serve as directors of, or in a similar capacity with, companies in which we invest, the securities of which are purchased or sold on our behalf. In the event that material nonpublic information is obtained with respect to such companies, or we become subject to trading restrictions under the internal trading policies of those companies or as a result of applicable law or regulations, we could be prohibited for a period of time from purchasing or selling the securities of such companies, and this prohibition may have a material adverse effect on us.
Our management and incentive fee structure may create incentives for MC Advisors that are not fully aligned with the interests of our stockholders.
In the course of our investing activities, we pay management and incentive fees to MC Advisors. Management fees are based on our total assets (which include assets purchased with borrowed amounts but exclude cash and cash equivalents). As a result, investors in our common stock invest on a “gross” basis and receive distributions on a “net” basis after expenses, resulting in a lower rate of return than one might achieve through direct investments. Because these fees are based on our total assets, including assets purchased with borrowed amounts but excluding cash and cash equivalents, MC Advisors benefits when we incur debt or otherwise use leverage. This fee structure may encourage MC Advisors to cause us to borrow money to finance additional investments or to maintain leverage when it would otherwise be appropriate to pay off our indebtedness. Under certain circumstances, the use of borrowed money may increase the likelihood of default, which would disfavor our stockholders. Our Board is charged with protecting our interests by monitoring how MC Advisors addresses these and other conflicts of interest associated with its management services and compensation. While our Board is not expected to review or approve each investment, our independent directors periodically review MC Advisors’ services and fees as well as its portfolio management decisions and portfolio performance. In connection with these reviews, our independent directors consider whether our fees and expenses (including those related to leverage) remain appropriate. As a result of this arrangement, MC Advisors or its affiliates may from time to time have interests that differ from those of our stockholders, giving rise to a conflict.
| 24 |
The part of the incentive fee payable to MC Advisors that relates to our net investment income is computed and paid on income that may include interest income that has been accrued but not yet received in cash. This fee structure may be considered to involve a conflict of interest for MC Advisors to the extent that it may encourage MC Advisors to favor debt financings that provide for deferred interest, rather than current cash payments of interest. MC Advisors may have an incentive to invest in PIK interest securities in circumstances where it would not have done so but for the opportunity to continue to earn the incentive fee even when the issuers of the deferred interest securities would not be able to make actual cash payments to us on such securities. This risk could be increased because MC Advisors is not obligated to reimburse us for any incentive fees received even if we subsequently incur losses or never receive in cash the deferred income that was previously accrued. In addition, the part of the incentive fee payable to MC Advisors that relates to our net investment income generally does not include any realized capital gains or losses or unrealized capital gains or losses. However, part one incentive fees are subject to Incentive Fee Limitation as described in Note 6 to the accompanying consolidated financial statements. Any net investment income incentive fee would not be subject to repayment.
Our incentive fee may induce MC Advisors to make certain investments, including speculative investments.
MC Advisors receives an incentive fee based, in part, upon net capital gains realized on our investments. Unlike that portion of the incentive fee based on income, there is no hurdle rate applicable to the portion of the incentive fee based on net capital gains. As a result, MC Advisors may have a tendency to invest more capital in investments that are likely to result in capital gains as compared to income producing securities. Such a practice could result in our investing in more speculative securities than would otherwise be the case, which could result in higher investment losses, particularly during economic downturns.
The Investment Advisory and Management Agreement with MC Advisors and the Administration Agreement with MC Management were not negotiated on an arm’s length basis and may not be as favorable to us as if they had been negotiated with an unaffiliated third-party.
We negotiated the Investment Advisory and Management Agreement and the Administration Agreement with related parties. Consequently, their terms, including fees payable to MC Advisors, may not be as favorable to us as if they had been negotiated with an unaffiliated third-party. In addition, we may choose not to enforce, or to enforce less vigorously, our rights and remedies under these agreements because of our desire to maintain our ongoing relationship with MC Advisors and MC Management. Any such decision, however, would breach our fiduciary obligations to our stockholders.
Our ability to enter into transactions with our affiliates is restricted, which may limit the scope of investments available to us.
We are prohibited under the 1940 Act from participating in certain transactions with our affiliates without the prior approval of our independent directors and, in some cases, of the SEC. Any person that owns, directly or indirectly, five percent or more of our outstanding voting securities is our affiliate for purposes of the 1940 Act, and we are generally prohibited from buying or selling any security from or to such affiliate, absent the prior approval of our independent directors. The 1940 Act also prohibits certain “joint” transactions with certain of our affiliates, which could include investments in the same portfolio company, without prior approval of our independent directors and, in some cases, of the SEC. We are prohibited from buying or selling any security from or to any person who owns more than 25% of our voting securities or certain of that person’s affiliates, or entering into prohibited joint transactions with such persons, absent the prior approval of the SEC. As a result of these restrictions, we may be prohibited from buying or selling any security (other than any security of which we are the issuer) from or to any portfolio company of a private equity fund managed by MC Advisors or its affiliates without the prior approval of the SEC, which may limit the scope of investment opportunities that would otherwise be available to us.
We may, however, co-invest with MC Advisors and its affiliates’ other clients in certain circumstances where doing so is consistent with applicable law and SEC staff interpretations. For example, we may co-invest with such accounts consistent with guidance promulgated by the SEC staff permitting us and such other accounts to purchase interests in a single class of privately placed securities so long as certain conditions are met, including that MC Advisors, acting on our behalf and on behalf of other clients, negotiates no term other than price. We may also co-invest with MC Advisors’ affiliates’ other clients as otherwise permissible under regulatory guidance, applicable regulations, exemptive relief granted to us by the SEC on October 15, 2014 and MC Advisors’ allocation policy, which the investment committee of MC Advisors maintains in writing. The allocation policy further provides that allocations among us and these other funds are generally made in proportion to the relative amounts of capital available for new investments taking into account the Allocation Criteria. We expect that Monroe Capital will follow the Allocation Criteria with respect to all of its funds under management, including us. However, we can offer no assurance that investment opportunities will be allocated to us fairly or equitably in the short-term or over time.
In situations where co-investment with other entities sponsored or managed by MC Advisors or its affiliates is not permitted or appropriate, such as when there is an opportunity to invest in securities of the same issuer that have different priorities or liens, MC Advisors will need to decide whether we or such other entity or entities will proceed with the investment. MC Advisors will make these determinations based on its policies and procedures which require that such opportunities be offered to eligible accounts on a basis that is fair and equitable over time. Moreover, except in certain circumstances, we are unable to invest in any issuer in which a fund managed by MC Advisors or its affiliates has previously invested. Similar restrictions limit our ability to transact business with our officers or directors or their affiliates.
We may also be prohibited under the 1940 Act from knowingly participating in certain transactions with our affiliates without the prior approval of the majority of the members of our Board who are not interested persons and, in some cases, prior approval by the SEC. The SEC has interpreted the BDC regulations governing transactions with affiliates to prohibit certain “joint transactions” between entities that share a common investment adviser.
We operate in a highly competitive market for investment opportunities, which could reduce returns and result in losses.
We compete with a number of specialty and commercial finance companies to make the types of investments that we make in middle-market companies, including BDCs, traditional commercial banks, private investment funds, regional banking institutions, small business investment companies, investment banks and insurance companies. Additionally, with increased competition for investment opportunities, alternative investment vehicles such as hedge funds may seek to invest in areas they have not traditionally invested in or from which they had withdrawn during the economic downturn, including investing in middle-market companies. As a result, competition for investments in lower middle-market companies has intensified, and we expect that trend to continue. Many of our existing and potential competitors are substantially larger and have considerably greater financial, technical and marketing resources than we do. For example, some competitors may have a lower cost of funds and access to funding sources that are not available to us. In addition, some of our competitors may have higher risk tolerances or different risk assessments, which could allow them to consider a wider variety of investments and establish more relationships than us. These characteristics could allow our competitors to consider a wider variety of investments, establish more relationships and offer better pricing and more flexible structuring than we offer. We may lose investment opportunities if we do not match our competitors’ pricing, terms and structure. If we are forced to match our competitors’ pricing, terms and structure, however, we may not be able to achieve acceptable returns on our investments or may bear substantial risk of capital loss. A significant part of our competitive advantage stems from the fact that the lower middle-market is underserved by traditional commercial and investment banks, and generally has less access to capital. A significant increase in the number and/or the size of our competitors in this target market could force us to accept less attractive investment terms.
| 25 |
Furthermore, many of our competitors are not subject to the regulatory restrictions that the 1940 Act imposes on us as a BDC or the source of income, asset diversification and distribution requirements we must satisfy to maintain our RIC status. The competitive pressures we face may have a material adverse effect on our business, financial condition and results of operations. As a result of this competition, we may not be able to take advantage of attractive investment opportunities from time to time, and we may not be able to identify and make investments that are consistent with our investment objective.
We will be subject to corporate-level U.S. federal income tax if we are unable to qualify or maintain qualification as a RIC under Subchapter M of the Code.
We elected to be treated as a RIC under Subchapter M of the Code commencing with our taxable year ended December 31, 2012, have qualified in each taxable year since, and intend to qualify annually hereafter; however, no assurance can be given that we will be able to qualify for and maintain RIC status. To receive RIC tax treatment under the Code and to be relieved of federal taxes on income and gains distributed to our stockholders, we must meet certain requirements, including source-of-income, asset diversification and distribution requirements. The annual distribution requirement applicable to RICs is satisfied if we distribute at least 90% of our net ordinary income and net short-term capital gains in excess of net long-term capital losses, if any, to our stockholders on an annual basis. In addition, we will be subject to a 4% nondeductible federal excise tax to the extent that we do not satisfy certain additional minimum distribution requirements on a calendar year basis. To the extent we use debt financing, we will be subject to certain asset coverage ratio requirements under the 1940 Act and may be subject to financial covenants under loan and credit agreements, each of which could, under certain circumstances, restrict us from making annual distributions necessary to receive RIC tax treatment. If we are unable to obtain cash from other sources, we may fail to be taxed as a RIC and, thus, may be subject to corporate-level federal income tax on our entire taxable income without regard to any distributions made by us. In order to be taxed as a RIC, we must also meet certain asset diversification requirements at the end of each calendar quarter. Failure to meet these tests may result in our having to dispose of certain investments quickly in order to prevent the loss of RIC status. Because most of our investments are in private or thinly traded public companies, any such dispositions could be made at disadvantageous prices and may result in substantial losses. If we fail to be taxed as a RIC for any reason and become subject to corporate U.S. federal income tax, the resulting corporate U.S. federal taxes could substantially reduce our net assets, the amount of income available for distributions to stockholders and the amount of our distributions and the amount of funds available for new investments. Such a failure would have a material adverse effect on us and our stockholders.
An extended disruption in the capital markets and the credit markets could negatively affect our business.
As a BDC, it will be necessary for us to maintain our ability to raise additional capital for investment purposes. Without sufficient access to the capital markets or credit markets, we may be forced to curtail our business operations or we may not be able to pursue new business opportunities. The capital markets and the credit markets have experienced periods of extreme volatility and disruption and, accordingly, there has been and may in the future be uncertainty in the financial markets in general. Ongoing disruptive conditions in the financial industry and the impact of new legislation in response to those conditions could restrict our business operations and could adversely impact our results of operations and financial condition.
We access the capital markets periodically to issue debt or equity securities or borrow from financial institutions in order to obtain such additional capital. Unfavorable economic conditions could increase our funding costs, limit our access to the capital markets or result in a decision by lenders not to extend credit to us. A reduction in the availability of new capital could limit our ability to pursue new business opportunities and grow our business. In addition, we are required to distribute at least 90% of our net ordinary income and net short-term capital gains in excess of net long-term capital losses, if any, to our stockholders to qualify for the tax benefits available to RICs. As a result, these earnings will not be available to fund new investments. An inability to access the capital markets successfully could limit our ability to grow our business and execute our business strategy fully and could decrease our earnings, if any, which may have an adverse effect on the value of our securities.
We may need to raise additional capital to grow because we must distribute most of our income.
We may need additional capital to fund new investments and grow our portfolio of investments. We intend to access the capital markets periodically to issue debt or equity securities or borrow from financial institutions in order to obtain such additional capital. Unfavorable economic conditions could increase our funding costs, limit our access to the capital markets or result in a decision by lenders not to extend credit to us. A reduction in the availability of new capital could limit our ability to grow. In addition, we are required to distribute each taxable year an amount at least equal to 90% of our net ordinary income and net short-term capital gains in excess of net long-term capital losses, if any, to our stockholders to continue to be taxed as a RIC. As a result, these earnings are not available to fund new investments. An inability to access the capital markets successfully could limit our ability to grow our business and execute our business strategy fully and could decrease our earnings, if any, which may have an adverse effect on the value of our securities.
We may have difficulty paying our required distributions if we recognize income before, or without, receiving cash representing such income.
For U.S. federal income tax purposes, we include in income certain amounts that we have not yet received in cash, such as original issue discount, or through contracted PIK interest, which represents contractual interest added to the loan balance and due at the end of the loan term. Original issue discount, which could be significant relative to our overall investment activities, or increases in loan balances as a result of contracted PIK arrangements, are included in income before we receive the corresponding cash payments. We also may be required to include in income certain other amounts that we will not receive in cash.
That part of the incentive fee payable by us that relates to our net investment income is computed and paid on income that may include interest that has been accrued but not yet received in cash, such as original issue discount and PIK interest. If we pay a net investment income incentive fee on interest that has been accrued, but not yet received in cash, it will increase the basis of our investment in that loan, which will reduce the capital gain incentive fee that we would otherwise pay in the future. Nevertheless, if we pay a net investment income incentive fee on interest that has been accrued but not yet received, and if that portfolio company defaults on such a loan, it is possible that accrued interest previously included in the calculation of the incentive fee will become uncollectible.
| 26 |
Because we may recognize income before or without receiving cash representing such income, we may have difficulty meeting the requirements applicable to RICs. In such a case, we may have to sell some of our investments at times and/or at prices we would not consider advantageous, raise additional debt or equity capital or reduce new investment originations and sourcings to meet these distribution requirements. If we are not able to obtain such cash from other sources, we may fail to qualify for the tax benefits available to RICs and thus be subject to corporate-level U.S. federal income tax.
Legislation enacted in 2018 allows us to incur additional leverage, which could increase the risk of investing in us.
The 1940 Act generally prohibits us from incurring indebtedness unless immediately after such borrowing we have an asset coverage for total borrowings of at least 200% (i.e., the amount of debt may not exceed 50% of the value of our total assets). However, on March 23, 2018, the Small Business Credit Availability Act (the “SBCAA”) was signed into law, which included various changes to regulations under the federal securities laws that impact BDCs. The SBCAA amended the 1940 Act to allow BDCs to decrease their asset coverage requirement from 200% to 150% (i.e. the amount of debt may not exceed 66.7% of the value of our total assets), if certain requirements are met. Under the SBCAA, BDCs are allowed to reduce their asset coverage requirement to 150%, and thereby increase leverage capacity, if stockholders representing at least a majority of the votes cast, when quorum is met, approve a proposal to do so. If a BDC receives stockholder approval, it would be allowed to reduce its asset coverage requirement to 150% on the first day after such approval. Alternatively, the SBCAA allows the majority of a BDCs independent directors to approve the reduction in its asset coverage requirement to 150%, and such approval would become effective after one year. In either case, a BDC would be required to make certain disclosures on its website and in SEC filings regarding, among other things, the receipt of approval to reduce its asset coverage requirement to 150%, its leverage capacity and usage, and risks related to leverage.
On March 27, 2018, our board of directors unanimously approved the application of the modified asset coverage requirements set forth in Section 61(a)(2) of the 1940 Act, as amended by the SBCAA. On March 27, 2018, our board of directors also recommended the submission of a proposal for stockholders to approve the application of the 150% minimum asset coverage requirements at our annual meeting of stockholders held on June 20, 2018. At the annual meeting, our stockholders approved this proposal, and we became subject to the 150% minimum asset coverage ratio, effective June 21, 2018.
Leverage is generally considered a speculative investment technique and may increase the risk of investing in our securities. Leverage magnifies the potential for loss on investments in our indebtedness and on invested equity capital. As we use leverage to partially finance our investments, you will experience increased risks of investing in our securities. If the value of our assets increases, then leveraging would cause the net asset value attributable to our common stock to increase more sharply than it would have had we not leveraged. Conversely, if the value of our assets decreases, leveraging would cause net asset value to decline more sharply than it otherwise would have had we not leveraged our business. Similarly, any increase in our income in excess of interest payable on the borrowed funds would cause our net investment income to increase more than it would without the leverage, while any decrease in our income would cause net investment income to decline more sharply than it would have had we not borrowed. Such a decline could negatively affect our ability to pay distributions, scheduled debt payments or other payments related to our securities. The effects of leverage would cause any decrease in net asset value for any losses to be greater than any increase in net asset value for any corresponding gains. If we incur additional leverage, you will experience increased risks of investing in our common stock.
Regulations governing our operation as a BDC affect our ability to and the way in which we raise additional capital.
We may issue debt securities or preferred stock and/or borrow money from banks or other financial institutions, which we refer to collectively as “senior securities,” up to the maximum amount permitted by the 1940 Act. Under the provisions of the 1940 Act, we are permitted as a BDC to issue senior securities in amounts such that our asset coverage ratio, as defined in the 1940 Act, equals at least 150% (as of June 21, 2018) of total assets less all liabilities and indebtedness not represented by senior securities, immediately after each issuance of senior securities (other than the SBA debentures of an SBIC subsidiary, as permitted by exemptive relief we have been granted by the SEC). If the value of our assets declines, we may be unable to satisfy this test. If that happens, we may be required to sell a portion of our investments and, depending on the nature of our leverage, repay a portion of our indebtedness at a time when such sales may be disadvantageous. This could have a material adverse effect on our operations and we may not be able to make distributions in an amount sufficient to be subject to taxation as a RIC, or at all. In addition, issuance of securities could dilute the percentage ownership of our current stockholders in us.
No person or entity from which we borrow money will have a veto power or a vote in approving or changing any of our fundamental policies. If we issue preferred stock, the preferred stock would rank “senior” to common stock in our capital structure, preferred stockholders would have separate voting rights on certain matters and might have other rights, preferences or privileges more favorable than those of our common stockholders, and the issuance of preferred stock could have the effect of delaying, deferring or preventing a transaction or a change of control that might involve a premium price for holders of our common stock or otherwise be in your best interest. Holders of our common stock will directly or indirectly bear all of the costs associated with offering and servicing any preferred stock that we issue. In addition, any interests of preferred stockholders may not necessarily align with the interests of holders of our common stock and the rights of holders of shares of preferred stock to receive dividends would be senior to those of holders of shares of our common stock.
As a BDC, we generally are not able to issue our common stock at a price below net asset value per share without first obtaining the approval of our stockholders and our independent directors. If we raise additional funds by issuing more common stock or senior securities convertible into, or exchangeable for, our common stock, then percentage ownership of our stockholders at that time would decrease, and you might experience dilution. We have stockholder approval to sell our common stock below net asset value through June 19, 2020. We may seek further stockholder approval to sell shares below net asset value in the future.
In addition, on March 20, 2019, the SEC proposed a series of rule and form amendments pursuant to the SBCAA. However, in the absence of final rules, the revisions required under the SBCAA became self-implementing on March 24, 2019. In the continued absence of transition guidance and through the effectiveness of the final rules, the appropriate mechanisms for implementing offering reform may remain in flux.
We maintain a revolving credit facility and use other borrowed funds to make investments or fund our business operations, which exposes us to risks typically associated with leverage and increases the risk of investing in us.
We maintain a revolving credit facility, have issued debt securities and may borrow money, including through the issuance of additional debt securities or preferred stock, to leverage our capital structure, which is generally considered a speculative investment technique. As a result:
| • | our common stock is exposed to an increased risk of loss because a decrease in the value of our investments would have a greater negative impact on the value of our common stock than if we did not use leverage; |
| • | if we do not appropriately match the assets and liabilities of our business, adverse changes in interest rates could reduce or eliminate the incremental income we make with the proceeds of any leverage; |
| 27 |
| • | our ability to pay distributions on our common stock may be restricted if our asset coverage ratio, as provided in the 1940 Act, is not at least 150% and any amounts used to service indebtedness or preferred stock would not be available for such distributions; |
| • | any credit facility is subject to periodic renewal by its lenders, whose continued participation cannot be guaranteed; |
| • | our revolving credit facility with ING Capital LLC, as agent, is, and any other credit facility we may enter into would be, subject to various financial and operating covenants, including that our portfolio of investments satisfies certain eligibility and concentration limits as well as valuation methodologies; |
| • | such securities would be governed by an indenture or other instrument containing covenants restricting our operating flexibility; |
| • | we bear the cost of issuing and paying interest or distributions on such securities, which costs are entirely borne by our common stockholders; and |
| • | any convertible or exchangeable securities that we issue may have rights, preferences and privileges more favorable than those of our common stock. |
The following table illustrates the effect of leverage on returns from an investment in our common stock assuming various annual returns, net of expenses. The calculations in the table below are hypothetical and actual returns may be higher or lower than those appearing in the table below.
|
Assumed Return on Our Portfolio (Net of Expenses) (1) |
||||||||||||||||||||
| -10% | -5% | 0% | 5% | 10% | ||||||||||||||||
| Corresponding return to common stockholder (2)(3) | -33.29 | % | -20.16 | % | -7.03 | % | 6.11 | % | 19.24 | % | ||||||||||
| (1) | The assumed return on our portfolio is required by regulation of the SEC to assist investors in understanding the effects of leverage and is not a prediction of, and does not represent, our projected or actual performance. |
| (2) | Assumes $655.1 million in total assets, $405.7 million in debt outstanding, of which $289.3 million is senior securities outstanding, $249.4 million in net assets and an average cost of funds of 4.32%, which was the weighted average interest rate of borrowing on our revolving credit facility, SBA debentures and 2023 Notes as of December 31, 2019. The interest rate on our revolving credit facility is a variable rate. Actual interest payments may be different. |
| (3) | In order for us to cover our annual interest payments on indebtedness, we must achieve annual returns on our December 31, 2019 total portfolio assets of at least 2.68%. |
Substantially all of our assets are subject to security interests under our revolving credit facility and if we default on our obligations under such facility, we may suffer adverse consequences, including foreclosure on our assets.
As of December 31, 2019, substantially all of our assets (excluding, among other things, investments held in and by certain of our subsidiaries) were pledged as collateral under our revolving credit facility. If we default on our obligations under this facility, the lenders may have the right to foreclose upon and sell, or otherwise transfer, the collateral subject to their security interests or their superior claim. In such event, we may be forced to sell our investments to raise funds to repay our outstanding borrowings in order to avoid foreclosure and these forced sales may be at times and at prices we would not consider advantageous. Moreover, such deleveraging of our company could significantly impair our ability to effectively operate our business in the manner in which we have historically operated. As a result, we could be forced to curtail or cease new investment activities and lower or eliminate the distributions that we have historically paid to our stockholders.
In addition, if the lenders exercise their right to sell the assets pledged under our revolving credit facility, such sales may be completed at distressed sale prices, thereby diminishing or potentially eliminating the amount of cash available to us after repayment of the amounts outstanding under the credit facilities.
We are subject to risks associated with our revolving credit facility and the terms of our revolving credit facility may contractually limit our ability to incur additional indebtedness.
Our revolving credit facility, as amended, imposes certain conditions that may limit the amount of our distributions to stockholders. Distributions payable in our common stock under our dividend reinvestment plan are not limited by the revolving credit facility. Distributions in cash or property other than our common stock are generally limited to 115% of the amount of distributions required to maintain our ability to be subject to taxation as a RIC. We are required under the revolving credit facility to maintain our ability to be subject to taxation as a RIC.
The revolving credit facility requires us to comply with certain financial and operational covenants, including asset coverage ratios and a minimum net worth. For example, the revolving credit facility requires that we maintain an asset coverage ratio of at least 1.5 to 1 and a senior debt coverage ratio of at least 2 to 1 at all times. We may divert cash to pay the lenders in amounts sufficient to cause these tests to be satisfied. Our compliance with these covenants depends on many factors, some of which, such as market conditions, are beyond our control.
Our ability to sell our investments is also limited under the revolving credit facility. Under the revolving credit facility, the sale of any portfolio investment may not cause our covered debt amount to exceed our borrowing base. As a result, there may be times or circumstances during which we are unable to sell investments, pay distributions or take other actions that might be in our best interests.
Availability of borrowings under the revolving credit facility is linked to the valuation of the collateral pursuant to a borrowing base mechanism. As such, declines in the fair market value of our investments which are collateral to the revolving credit facility may reduce availability under our revolving credit facility.
To the extent we use debt to finance our investments, changes in interest rates will affect our cost of capital and net investment income.
To the extent we borrow money to make investments, our net investment income depends, in part, upon the difference between the rate at which we borrow funds and the rate at which we invest those funds. As a result, we can offer no assurance that a significant change in market interest rates will not have a material adverse effect on our net investment income in the event we use debt to finance our investments. In periods of rising interest rates, our cost of funds would increase, which could reduce our net investment income. We expect that our long-term fixed-rate investments will be financed primarily with issuances of equity and long-term debt securities. We may use interest rate risk management techniques in an effort to limit our exposure to interest rate fluctuations. Such techniques may include various interest rate hedging activities to the extent permitted by the 1940 Act.
| 28 |
You should also be aware that a rise in the general level of interest rates typically leads to higher interest rates applicable to our debt investments. Accordingly, an increase in interest rates may result in an increase of the amount of incentive fees payable to MC Advisors.
The interest rates of our revolving credit facility and loans to our portfolio companies that extend beyond 2021 might be subject to change based on recent regulatory changes.
LIBOR, the London Interbank Offered Rate, is the basic rate of interest used in lending transactions between banks on the London interbank market and is widely used as a reference for setting the interest rate on loans globally. We typically use LIBOR as a reference rate in term loans we extend to portfolio companies such that the interest due to us pursuant to a term loan extended to a portfolio company is calculated using LIBOR. The terms of our debt investments generally include minimum interest rate floors which are calculated based on LIBOR.
As a result of the transition away from the widespread use of LIBOR to alternative rates, interest rates on financial instruments tied to LIBOR rates, as well as the revenue and expenses associated with those financial instruments, may be adversely affected. The U.S. Federal Reserve, in conjunction with the Alternative Reference Rates Committee, a steering committee comprised of large U.S. financial institutions, is considering replacing U.S. dollar LIBOR with a new index calculated by short term repurchase agreements, backed by Treasury securities, called the Secured Overnight Financing Rate (“SOFR”). The first publication of SOFR was released in April 2018. Whether or not SOFR attains market traction as a LIBOR replacement remains a question, and the future of LIBOR at this time is uncertain.
In 2019, the Staff of the SEC’s Division of Corporate Finance, Division of Investment Management, Division of Trading and Markets, and Office of the Chief Accountant has issued statements and guidance surrounding the potentially significant effects on financial markets and market participants when LIBOR is discontinued in 2021 and no longer available as a reference benchmark rate. The Staff has encouraged all market participants to identify contracts that reference LIBOR and begin transitions to alternative rates, and has encouraged audit committees in particular to understand management’s plans to identify and address the risks associated with the elimination of LIBOR, and specifically, the impact on accounting and financial reporting and any related issues associated with financial products and contracts that reference LIBOR.
The elimination of LIBOR or any other changes or reforms to the determination or supervision of LIBOR could have an adverse impact on the market for or value of any LIBOR-linked securities, loans, and other financial obligations or extensions of credit held by or due to us or on our overall financial condition or results of operations. If LIBOR ceases to exist, we may need to renegotiate our revolving credit facility and the credit agreements extending beyond 2021 with our portfolio companies that utilize LIBOR as a factor in determining the interest rate to replace LIBOR with the new standard that is established. In addition, the cessation of LIBOR could:
| · | Adversely impact the pricing, liquidity, value of, return on and trading for a broad array of financial products, including any LIBOR-linked securities and loans that are included in our assets and liabilities; |
| · | Require extensive changes to documentation that governs or references LIBOR or LIBOR-based products, including, for example, pursuant to time-consuming renegotiations of existing documentation to modify the terms of outstanding investment; |
| · | Result in inquiries or other actions from regulators in respect of our preparation and readiness for the replacement of LIBOR with one or more alternative reference rates; |
| · | Result in disputes, litigation or other actions with portfolio companies, or other counterparties, regarding the interpretation and enforceability of provisions in our LIBOR-based investments, such as fallback language or other related provisions, including, in the case of fallbacks to the alternative reference rates, any economic, legal, operational or other impact resulting from the fundamental differences between LIBOR and the various alternative reference rates; |
| · | Require the transition and/or development of appropriate systems and analytics to effectively transition our risk management processes from LIBOR-based products to those based on one or more alternative reference rates, which may prove challenging given the limited history of the proposed alternative reference rates; and |
| · | Cause us to incur additional costs in relation to any of the above factors. |
| 29 |
We are exposed to risks associated with changes in interest rates.
Interest rate fluctuations may have a substantial negative impact on our investments, the value of our common stock and our rate of return on invested capital. A reduction in the interest rates on new investments relative to interest rates on current investments could have an adverse impact on our net investment income while an increase in interest rates could decrease the value of any investments we hold which earn fixed interest rates and increase our interest expense, thereby decreasing our net income. An increase in interest rates available to investors could also make investment in our common stock less attractive unless we are able to increase our dividend rate. In addition, a significant increase in market interest rates could also result in an increase in our non-performing assets and a decrease in the value of our portfolio because our floating-rate loan portfolio companies may be unable to meet higher payment obligations.
MRCC SBIC is subject to SBA regulations.
Under current SBA regulations, a licensed SBIC can invest in entities that have a tangible net worth not exceeding $19.5 million and an average annual net income after U.S. federal income taxes (excluding any carryover losses) not exceeding $6.5 million for the two most recent fiscal years. In addition, a licensed SBIC must invest 25.0% of its capital in those entities that have a tangible net worth not exceeding $6.0 million and an average annual net income after U.S. federal income taxes (excluding any carryover losses) not exceeding $2.0 million for the two most recent fiscal years. The SBA regulations also provide alternative size standard criteria to determine eligibility, which depend on the industry in which the business is engaged and are based on either the number of employees or the gross sales. The SBA regulations permit licensed SBICs to make long term loans to small businesses, invest in the equity securities of such businesses and provide them with consulting and advisory services. The SBA also places certain limitations on the financing terms of investments by SBICs in portfolio companies and prohibits SBICs from providing funds for certain purposes or to businesses in certain prohibited industries. Further, the SBA regulations require that a licensed SBIC be periodically examined and audited by the SBA staff to determine its compliance with the relevant SBA regulations. Compliance with these SBA requirements may cause MRCC SBIC to forego attractive investment opportunities that are not permitted under the SBA regulations, and may cause MRCC SBIC to make investments it otherwise would not make in order to remain in compliance with these regulations.
Failure to comply with the SBA regulations could result in the loss of the SBIC license and the resulting inability to participate in the SBA debenture program. The SBA prohibits, without prior SBA approval, a “change of control” of an SBIC or transfers that would result in any person (or a group of persons acting in concert) owning 10.0% or more of a class of capital stock of a licensed SBIC. Current SBA regulations provide the SBA with certain rights and remedies if an SBIC violates their terms. Remedies for regulatory violations are graduated in severity depending on the seriousness of capital impairment or other regulatory violations. For minor regulatory infractions, the SBA issues a warning. For more serious infractions, the use of SBA debentures may be limited or prohibited, outstanding debentures can be declared to be immediately due and payable, restrictions on distributions and making new investments may be imposed and management fees may be required to be reduced. In severe cases, the SBA may require the removal of a general partner of an SBIC or its officers, directors, managers or partners, or the SBA may obtain appointment of a receiver for the SBIC.
SBA regulations limit the amount that may be borrowed from the SBA by an SBIC.
The SBA regulations currently limit the amount that is available to be borrowed by any SBIC and guaranteed by the SBA to 300.0% of an SBIC’s regulatory capital or $175.0 million (as amended June 21, 2018), whichever is less. For two or more SBICs under common control (commonly referred to as a “family of funds”), the maximum amount of outstanding SBA debentures cannot exceed $350.0 million (prior to December 18, 2015, this limitation was $225.0 million). If MRCC SBIC borrows the maximum amount from the SBA and thereafter requires additional capital, our cost of capital may increase, and there is no assurance that we will be able to obtain additional financing on acceptable terms.
Moreover, there can be no assurance that MRCC SBIC will continue to receive SBA debenture funding. Receipt of SBA debenture funding depends upon an SBIC’s continued compliance with SBA regulations and policies and the availability of funding. The amount of SBA debenture funding available to SBICs depends upon annual Congressional authorizations and in the future may be subject to annual Congressional appropriations. There can be no assurance that there will be sufficient SBA debenture funding available at the times desired by MRCC SBIC.
The debentures issued by the SBA to MRCC SBIC have a maturity of ten years and bear interest semi-annually at fixed rates. MRCC SBIC will need to generate sufficient cash flow to make required debt payments to the SBA. If MRCC SBIC is unable to generate such cash flow, the SBA, as a debt holder, will have a superior claim to our assets over our stockholders in the event MRCC SBIC liquidates or the SBA exercises its remedies under such debentures as the result of a default by MRCC SBIC.
MRCC SBIC, as an SBIC, is limited in its ability to make distributions to us, which could result in us being unable to meet the minimum distribution requirements to maintain our ability to be subject to taxation as a RIC.
In order to maintain our ability to be subject to taxation as a RIC, we are required to distribute to our stockholders on an annual basis 90.0% of our net ordinary income and net short-term capital gains in excess of net long-term capital losses. For this purpose, our taxable income includes the income of MRCC SBIC (and any other entities that are disregarded as separate from us for U.S. federal income tax purposes). MRCC SBIC’s ability to make distributions to us may be limited by the Small Business Investment Act of 1958, as amended, and the regulations promulgated thereunder. As a result, in order to maintain our ability to be subject to taxation as a RIC, we may be required to make distributions attributable to MRCC SBIC’s income without receiving any corresponding cash distributions from it with respect to such income. We can make no assurances that MRCC SBIC will be able to make, or not be limited in making, distributions to us. If we are unable to satisfy the annual distribution requirements, we may fail to maintain our ability to be subject to taxation as a RIC, which would result in the imposition of corporate-level U.S. federal income tax on our entire taxable income without regard to any distributions made by us.
| 30 |
If we do not invest a sufficient portion of our assets in qualifying assets, we could fail to qualify as a BDC, which would have a material adverse effect on our business, financial condition and results of operations.
As a BDC, we may not acquire any assets other than “qualifying assets” unless, at the time of and after giving effect to such acquisition, at least 70% of our total assets are qualifying assets, as defined in section 55(a) of the 1940 Act. See “Business — Qualifying Assets.” We believe that most of the investments that we may acquire in the future will constitute qualifying assets. However, we may be precluded from investing in what we believe are attractive investments if such investments are not qualifying assets for purposes of the 1940 Act. If we do not invest a sufficient portion of our assets in qualifying assets, we could violate the 1940 Act provisions applicable to BDCs. As a result of such violation, specific rules under the 1940 Act could prevent us, for example, from making follow-on investments in existing portfolio companies which could result in the dilution of our position or could require us to dispose of investments at inappropriate times in order to come into compliance with the 1940 Act. If we need to dispose of investments quickly, it could be difficult to dispose of such investments on favorable terms. We may not be able to find a buyer for such investments and, even if we do find a buyer, we may have to sell the investments at a substantial loss. Any such outcomes would have a material adverse effect on our business, financial condition, results of operations, and cash flows.
Many of our portfolio investments are recorded at fair value as determined in good faith by our Board and, as a result, there may be uncertainty as to the value of our portfolio investments.
Under the 1940 Act, we are required to carry our portfolio investments at market value, or if there is no readily available market value, at fair value as determined by our Board. Many of our portfolio investments may take the form of securities that are not publicly traded. The fair value of securities and other investments that are not publicly traded may not be readily determinable, and we value these securities at fair value as determined in good faith by our Board, including to reflect significant events affecting the value of our securities. As part of the valuation process, we may take into account the following types of factors, if relevant, in determining the fair value of our investments:
| • | a comparison of the portfolio company’s securities to publicly traded securities; |
| • | the enterprise value of a portfolio company; |
| • | the nature and realizable value of any collateral; |
| • | the portfolio company’s ability to make payments and its earnings and discounted cash flow; |
| • | the markets in which the portfolio company does business; and |
| • | changes in the interest rate environment and the credit markets generally that may affect the price at which similar investments may be made in the future and other relevant factors. |
We expect that most of our investments (other than cash and cash equivalents) will be classified as Level 3 in the fair value hierarchy and require disclosures about the level of disaggregation along with the inputs and valuation techniques we use to measure fair value. This means that our portfolio valuations are based on unobservable inputs and our own assumptions about how market participants would price the asset or liability in question. Inputs into the determination of fair value of our portfolio investments require significant management judgment or estimation. Even if observable market data is available, such information may be the result of consensus pricing information or broker quotes, which include a disclaimer that the broker would not be held to such a price in an actual transaction. The non-binding nature of consensus pricing and/or quotes accompanied by disclaimers materially reduces the reliability of such information. We employ the services of one or more independent service providers to conduct fair value appraisals of material investments for which market quotations are not readily available. These fair value appraisals for material investments are received at least once every calendar year for each portfolio company investment, but are generally received quarterly. The types of factors that the Board may take into account in determining the fair value of our investments generally include, as appropriate, comparison to publicly traded securities including such factors as yield, maturity and measures of credit quality, the enterprise value of a portfolio company, the nature and realizable value of any collateral, the portfolio company’s ability to make payments and its earnings and discounted cash flow, the markets in which the portfolio company does business and other relevant factors. Because such valuations, and particularly valuations of private securities and private companies, are inherently uncertain, may fluctuate over short periods of time and may be based on estimates, our determinations of fair value may differ materially from the values that would have been used if a ready market for these securities existed. Due to this uncertainty in the value of our portfolio investments, a fair value determination may cause net asset value on a given date to materially understate or overstate the value that we may ultimately realize upon one or more of our investments. As a result, investors purchasing shares of our common stock based on an overstated net asset value would pay a higher price than the value of the investments might warrant. Conversely, investors selling shares during a period in which the net asset value understates the value of investments will receive a lower price for their shares than the value the investment portfolio might warrant.
We adjust quarterly the valuation of our portfolio to reflect the determination of our Board of the fair value of each investment in our portfolio. Any changes in fair value are recorded in our consolidated statements of operations as net change in unrealized gain (loss).
We may experience fluctuations in our quarterly operating results.
We could experience fluctuations in our quarterly operating results due to a number of factors, including our ability or inability to make investments in companies that meet our investment criteria, the interest rate payable to us on the debt securities we acquire, the default rate on such securities, the level of our expenses, including the cost of our indebtedness, variations in and the timing of the recognition of realized and unrealized gains or losses, the degree to which we encounter competition in our markets and general economic conditions. As a result of these factors, results for any period should not be relied upon as being indicative of performance in future periods.
| 31 |
Changes in laws or regulations governing our operations may adversely affect our business or cause us to alter our business strategy.
We and our portfolio companies are subject to regulation at the local, state and federal level. These laws and regulations, as well as their interpretation, may change from time to time, including as the result of interpretive guidance or other directives from the U.S. President and others in the executive branch, and new laws, regulations and interpretations may also come into effect, including those governing the types of investments we or our portfolio companies are permitted to make, any of which could have a material adverse effect on our business. In particular, on July 21, 2010, the Dodd-Frank Wall Street Reform and Consumer Protection Act, or the Dodd-Frank Act, became law. The scope of the Dodd-Frank Act impacts many aspects of the financial services industry, and it requires the development and adoption of many implementing regulations. The effects of Dodd-Frank on the financial services industry will depend, in large part, upon the extent to which regulators exercise the authority granted to them and the approaches taken in implementing regulations. President Trump and certain members of Congress have indicated that they will seek to amend or repeal portions of the Dodd-Frank Act, among other federal laws, which may create regulatory uncertainty in the near term, and in May 2018 the Economic Growth, Regulatory Relief, and Consumer Protection Act was enacted and eased financial regulations and reduced oversight for certain entities. While the impact of the Dodd-Frank Act, and recently-enacted federal tax reform legislation on us and our portfolio companies may not be known for an extended period of time, the Dodd-Frank Act and federal tax reform, including future rules implementing their provisions and the interpretation of those rules, along with other legislative and regulatory proposals directed at the financial services industry or affecting taxation that are proposed or pending in the U.S. Congress, may negatively impact the operations, cash flows or financial condition of us or our portfolio companies, impose additional costs on us or our portfolio companies, intensify the regulatory supervision of us or our portfolio companies or otherwise adversely affect our business or the business of our portfolio companies. In addition, if we do not comply with applicable laws and regulations, we could lose any licenses that we then hold for the conduct of our business and may be subject to civil fines and criminal penalties.
Additionally, changes to the laws and regulations governing our operations, including those associated with RICs, may cause us to alter our investment strategy in order to avail ourselves of new or different opportunities or result in the imposition of corporate-level taxes on us. Such changes could result in material differences to the strategies and plans set forth herein and may shift our investment focus from the areas of expertise of MC Advisors to other types of investments in which MC Advisors may have little or no expertise or experience. Any such changes, if they occur, could have a material adverse effect on our results of operations and the value of your investment.
On May 24, 2018, President Trump signed into law the Economic Growth, Regulatory Relief, and Consumer Protection Act, which increased from $50 billion to $250 billion the asset threshold for designation of “systemically important financial institutions” or “SIFIs” subject to enhanced prudential standards set by the Federal Reserve Board, staggering application of this change based on the size and risk of the covered bank holding company. On May 30, 2018, the Federal Reserve Board voted to consider changes to the Volcker Rule that would loosen compliance requirements for all banks. The effect of this change and any further rules or regulations are and could be complex and far-reaching, and the change and any future laws or regulations or changes thereto could negatively impact our operations, cash flows or financial condition, impose additional costs on us, intensify the regulatory supervision of us or otherwise adversely affect our business, financial condition and results of operations.
Over the last several years, there also has been an increase in regulatory attention to the extension of credit outside of the traditional banking sector, raising the possibility that some portion of the non-bank financial sector will be subject to new regulation. While it cannot be known at this time whether any regulation will be implemented or what form it will take, increased regulation of non-bank credit extension could negatively impact our operations, cash flows or financial condition, impose additional costs on us, intensify the regulatory supervision of us or otherwise adversely affect our business, financial condition and results of operations.
Legislative or other actions relating to taxes could have a negative effect on us.
The rules dealing with U.S. federal income taxation are constantly under review by persons involved in the legislative process and by the Internal Revenue Service (“IRS”) and the U.S. Treasury Department. On December 22, 2017, the U.S. House of Representatives and U.S. Senate enacted the legislation known as the Tax Cuts and Jobs Act (the “2017 Tax Act”). The 2017 Tax Act was signed by the President on December 23, 2017. The 2017 Tax Act makes significant changes to the U.S. income tax rules applicable to both individuals and entities, including corporations. The 2017 Tax Act includes provisions that, among other things, reduce the U.S. corporate tax rate from 35 percent to 21 percent, introduce a capital investment deduction, limit the interest deduction, limit the use of net operating losses to offset future taxable income, repeal the corporate alternative minimum tax and make extensive changes to the U.S. international tax system. The 2017 Tax Act is complex and far-reaching, and we cannot predict the impact its enactment will have on us, our subsidiaries, our portfolio companies and the holders of our securities. While we do not foresee that the 2017 Tax Act or any additional tax legislation will have any impact on our ability to qualify for tax treatment as a RIC, we cannot predict with certainty how any changes in the tax laws, U.S. Treasury regulations, administrative interpretations or court decisions interpreting such legislation might affect us, investors or our portfolio investments.
Uncertainty about presidential administration initiatives could negatively impact our business, financial condition and results of operations.
The current U.S. presidential administration has called for significant changes to U.S. trade, healthcare, immigration, foreign and government regulatory policy. In this regard, there is significant uncertainty with respect to legislation, regulation and government policy at the federal level, as well as the state and local levels. Recent events have created a climate of heightened uncertainty and introduced new and difficult-to-quantify macroeconomic and political risks with potentially far-reaching implications. There has been a corresponding meaningful increase in the uncertainty surrounding interest rates, inflation, foreign exchange rates, treaties, tariffs, trade volumes and fiscal and monetary policy. To the extent the U.S. Congress or the current administration implements changes to U.S. policy, those changes may impact, among other things, the U.S. and global economy, international trade and relations, unemployment, immigration, corporate taxes, healthcare, the U.S. regulatory environment, inflation and other areas. Although we cannot predict the impact, if any, of these changes to our business, they could adversely affect our business, financial condition, operating results and cash flows. Until we know what policy changes are made and how those changes impact our business and the business of our competitors over the long term, we will not know if, overall, we will benefit from them or be negatively affected by them.
Our Board may change our investment objective, operating policies and strategies without prior notice or stockholder approval, the effects of which may be adverse.
Our Board has the authority, except as otherwise prohibited by the 1940 Act, to modify or waive certain of our operating policies and strategies without prior notice and without stockholder approval. However, absent stockholder approval, we may not change the nature of our business so as to cease to be, or withdraw our election as, a BDC. Under Maryland law, we also cannot be dissolved without prior stockholder approval except by judicial action. We cannot predict the effect any changes to our current operating policies and strategies would have on our business, operating results and the price value of our common stock. Nevertheless, any such changes could adversely affect our business and impair our ability to make distributions.
| 32 |
MC Advisors can resign on 60 days’ notice, and we may not be able to find a suitable replacement within that time, resulting in a disruption in our operations that could adversely affect our financial condition, business and results of operations.
MC Advisors has the right to resign under the Investment Advisory and Management Agreement without penalty at any time upon 60 days’ written notice to us, whether we have found a replacement or not. If MC Advisors resigns, we may not be able to find a new investment advisor or hire internal management with similar expertise and ability to provide the same or equivalent services on acceptable terms within 60 days, or at all. If we are unable to do so quickly, our operations are likely to experience a disruption, our financial condition, business and results of operations as well as our ability to pay distributions are likely to be adversely affected and the market price of our securities may decline. In addition, the coordination of our internal management and investment activities is likely to suffer if we are unable to identify and reach an agreement with a single institution or group of executives having the expertise possessed by MC Advisors and its affiliates. Even if we were able to retain comparable management, whether internal or external, the integration of such management and their lack of familiarity with our investment objective may result in additional costs and time delays that may adversely affect our financial condition, business and results of operations.
MC Management can resign on 60 days’ notice from its role as our administrator under the Administration Agreement, and we may not be able to find a suitable replacement within that time, resulting in a disruption in our operations that could adversely affect our financial condition, business and results of operations.
MC Management has the right to resign under the Administration Agreement without penalty upon 60 days’ written notice to us, whether we have found a replacement or not. If MC Management resigns, we may not be able to find a new administrator or hire internal management with similar expertise and ability to provide the same or equivalent services on acceptable terms, or at all. If we are unable to do so quickly, our operations are likely to experience a disruption, our financial condition, business and results of operations as well as our ability to pay distributions are likely to be adversely affected and the market price of our shares may decline. In addition, the coordination of our internal management and administrative activities is likely to suffer if we are unable to identify and reach an agreement with a service provider or individuals with the expertise possessed by MC Management. Even if we were able to retain a comparable service provider or individuals to perform such services, whether internal or external, their integration into our business and lack of familiarity with our investment objective may result in additional costs and time delays that may adversely affect our financial condition, business and results of operations.
Efforts to comply with the Sarbanes-Oxley Act involve significant expenditures, and non-compliance with the Sarbanes-Oxley Act may adversely affect us and the market price of our securities.
As a publicly traded company, we incur legal, accounting and other expenses, including costs associated with the periodic reporting requirements applicable to a company whose securities are registered under the Exchange Act, as well as additional corporate governance requirements, including requirements under the Sarbanes-Oxley Act of 2002, or the Sarbanes-Oxley Act, and other rules implemented by the SEC.
We are subject to the Sarbanes-Oxley Act, and the related rules and regulations promulgated by the SEC. Under current SEC rules, our management is required to report on its internal controls over financial reporting pursuant to Section 404 of the Sarbanes-Oxley Act and rules and regulations of the SEC thereunder. We are required to review on an annual basis our internal controls over financial reporting, and on a quarterly and annual basis to evaluate and disclose changes in our internal controls over financial reporting. As a result, we expect to continue to incur associated expenses, which may negatively impact our financial performance and our ability to make distributions. This process also will result in a diversion of our management’s time and attention. We cannot be certain as to the timing of completion of our evaluation, testing and remediation actions or the impact of the same on our operations and may not be able to ensure that the process is effective or that the internal controls are or will be effective in a timely manner. There can be no assurance that our quarterly reviews and annual audits will not identify additional material weaknesses. In the event that we are unable to maintain or achieve compliance with the Sarbanes-Oxley Act and related rules, our value and results of operations may be adversely affected. As a result, we expect to incur significant associated expenses, which may negatively impact our financial performance and our ability to make distributions.
The failure in cyber security systems, as well as the occurrence of events unanticipated in our disaster recovery systems and management continuity planning, could impair our ability to conduct business effectively.
The occurrence of a disaster such as a cyber-attack, a natural catastrophe, an industrial accident, a terrorist attack or war, events unanticipated in our disaster recovery systems, or a support failure from external providers, could have an adverse effect on our ability to conduct business and on our results of operations and financial condition, particularly if those events affect our computer-based data processing, transmission, storage, and retrieval systems or destroy data. If a significant number of Monroe Capital employees were unavailable in the event of a disaster, our ability to effectively conduct our business could be severely compromised.
| 33 |
We depend heavily upon computer systems to perform necessary business functions. Despite our implementation of a variety of security measures, our computer systems could be subject to cyber-attacks and unauthorized access, such as physical and electronic break-ins or unauthorized tampering. Like other companies, we may experience threats to our data and systems, including malware and computer virus attacks, unauthorized access, system failures and disruptions. If one or more of these events occurs, it could potentially jeopardize the confidential, proprietary and other information processed and stored in, and transmitted through, our computer systems and networks, or otherwise cause interruptions or malfunctions in our operations, which could result in damage to our reputation, financial losses, litigation, increased costs, regulatory penalties and/or customer dissatisfaction or loss.
A disaster or a disruption in the infrastructure that supports our business, including a disruption involving electronic communications or other services used by us or third parties with whom we conduct business, or directly affecting our headquarters, could have a material adverse impact on our ability to continue to operate our business without interruption. Our disaster recovery programs may not be sufficient to mitigate the harm that may result from such a disaster or disruption. In addition, insurance and other safeguards might only partially reimburse us for our losses, if at all.
Third parties with which we do business may also be sources of cybersecurity or other technological risk. We outsource certain functions and these relationships allow for the storage and processing of our information, as well as client, counterparty, employee, and borrower information. While we engage in actions to reduce our exposure resulting from outsourcing, ongoing threats may result in unauthorized access, loss, exposure, destruction, or other cybersecurity incident that affects our data, resulting in increased costs and other consequences as described above.
In addition, cybersecurity has become a top priority for regulators around the world, and some jurisdictions have enacted laws requiring companies to notify individuals of data security breaches involving certain types of personal data. If we fail to comply with the relevant laws and regulations, we could suffer financial losses, a disruption of our businesses, liability to investors, regulatory intervention or reputational damage.
We may incur lender liability as a result of our lending activities.
In recent years, a number of judicial decisions have upheld the right of borrowers and others to sue lending institutions on the basis of various evolving legal theories, collectively termed “lender liability.” Generally, lender liability is founded on the premise that a lender has either violated a duty, whether implied or contractual, of good faith and fair dealing owed to the borrower or has assumed a degree of control over the borrower resulting in the creation of a fiduciary duty owed to the borrower or its other creditors or stockholders. We may be subject to allegations of lender liability, which could be time-consuming and expensive to defend and result in significant liability.
We may incur liability as a result of providing managerial assistance to our portfolio companies.
In the course of providing significant managerial assistance to certain portfolio companies, certain of our management and directors may serve as directors on the boards of such companies. To the extent that litigation arises out of investments in these companies, our management and directors may be named as defendants in such litigation, which could result in an expenditure of our funds, through our indemnification of such officers and directors, and the diversion of management time and resources.
MC Advisors may not be able to achieve the same or similar returns as those achieved by our senior management and investment teams while they were employed at prior positions.
The track record and achievements of the senior investment professionals of Monroe Capital are not necessarily indicative of future results that will be achieved by MC Advisors. As a result, MC Advisors may not be able to achieve the same or similar returns as those achieved by the senior investment professionals of Monroe Capital.
Risks Related to Our Investments
Economic recessions or downturns could impair our portfolio companies and harm our operating results.
Many of our portfolio companies are susceptible to economic slowdowns or recessions and may be unable to repay our loans during these periods. These portfolio companies may face intense competition, including competition from companies with greater financial resources, more extensive research and development, manufacturing, marketing and service capabilities and greater number of qualified and experienced managerial and technical personnel. They may need additional financing that they are unable to secure and that we are unable or unwilling to provide, or they may be subject to adverse developments unrelated to the technologies they acquire.
Therefore, our non-performing assets are likely to increase, and the value of our portfolio is likely to decrease during these periods. Adverse economic conditions may decrease the value of collateral securing some of our loans and the value of our equity investments and could lead to financial losses in our portfolio and a corresponding decrease in revenues, net income and assets.
Unfavorable economic conditions also could increase our funding costs, limit our access to the capital markets or result in a decision by lenders not to extend credit to us. These events could prevent us from increasing our investments and harm our operating results.
A portfolio company’s failure to satisfy financial or operating covenants imposed by us or other lenders could lead to defaults and, potentially, acceleration of its loans and foreclosure on its assets, which could trigger cross-defaults under other agreements and jeopardize our portfolio company’s ability to meet its obligations under the debt securities that we hold. We may incur expenses to the extent necessary to seek recovery upon default or to negotiate new terms with a defaulting portfolio company. It is possible that we could become subject to a lender liability claim, including as a result of actions taken if we or MC Advisors render significant managerial assistance to the borrower. Furthermore, if one of our portfolio companies were to file for bankruptcy protection, even though we may have structured our investment as senior secured debt, depending on the facts and circumstances, including the extent to which we or MC Advisors provided managerial assistance to that portfolio company or otherwise exercise control over it, a bankruptcy court might re-characterize our debt as a form of equity and subordinate all or a portion of our claim to claims of other creditors.
| 34 |
Market conditions have materially and adversely affected debt and equity capital markets in the United States and around the world.
In the past, the global capital markets experienced periods of disruption resulting in increasing spreads between the yields realized on riskier debt securities and those realized on securities perceived as being risk-free and a lack of liquidity in parts of the debt capital markets, significant write-offs in the financial services sector relating to subprime mortgages and the re-pricing of credit risk in the broadly syndicated market. These events, along with the deterioration of the housing market, illiquid market conditions, declining business and consumer confidence and the failure of major financial institutions in the United States, led to a general decline in economic conditions. This economic decline materially and adversely affected the broader financial and credit markets and reduced the availability of debt and equity capital for the market as a whole and to financial firms in particular. If such a period of disruption were to occur in the future, to the extent that we wish to use debt to fund our investments, the debt capital that will be available to us, if at all, may be at a higher cost, and on terms and conditions that may be less favorable, than what we expect, which could negatively affect our financial performance and results. A prolonged period of market illiquidity may cause us to reduce the volume of loans we originate and/or fund below historical levels and adversely affect the value of our portfolio investments, which could have a material and adverse effect on our business, financial condition, and results of operations. The spread between the yields realized on riskier debt securities and those realized on securities perceived as being risk-free has remained narrow on a relative basis recently. If these spreads were to widen or if there were deterioration of market conditions, these events could materially and adversely affect our business.
Our investments in leveraged portfolio companies may be risky, and you could lose all or part of your investment.
Investment in leveraged companies involves a number of significant risks. Leveraged companies, including lower middle-market companies, in which we invest may have limited financial resources and may be unable to meet their obligations under their debt securities that we hold. Such developments may be accompanied by a deterioration in the value of any collateral and a reduction in the likelihood of our realizing any guarantees that we may have obtained in connection with our investment. In addition, our junior secured loans are generally subordinated to senior loans. As such, other creditors may rank senior to us in the event of an insolvency.
Our portfolio companies will likely consist primarily of lower middle-market, privately owned companies, which may present a greater risk of loss than loans to larger companies.
Our portfolio consists, and will most likely continue to consist, primarily of loans to lower middle-market, privately owned companies. Compared to larger, publicly traded firms, these companies generally have more limited access to capital and higher funding costs, may be in a weaker financial position and may need more capital to expand, compete and operate their business. In addition, many of these companies may be unable to obtain financing from public capital markets or from traditional sources, such as commercial banks. Accordingly, loans made to these types of borrowers may entail higher risks than loans made to companies that have larger businesses, greater financial resources or are otherwise able to access traditional credit sources on more attractive terms.
Investing in lower middle-market companies involves a number of significant risks, including that lower middle-market companies:
| • | may have shorter operating histories, narrower product lines and smaller market shares than larger businesses, which tend to render them more vulnerable to competitors’ actions and market conditions, as well as general economic downturns; |
| • | are more likely to depend on the management talents and efforts of a small group of persons; therefore, the death, disability, resignation or termination of one or more of these persons could have a material adverse impact on our portfolio company and, in turn, on us; |
| • | typically have more limited access to the capital markets, which may hinder their ability to refinance borrowings; |
| • | will be unable to refinance or repay at maturity the unamortized loan balance as we structure our loans such that a significant balance remains due at maturity; |
| • | generally have less predictable operating results, may be particularly vulnerable to changes in customer preferences or market conditions, depend on one or a limited number of major customers; |
| • | may from time to time be parties to litigation, may be engaged in rapidly changing businesses with products subject to a substantial risk of obsolescence, and may require substantial additional capital to support their operations, finance expansion or maintain their competitive position; and |
| • | generally have less publicly available information about their businesses, operations and financial condition. If we are unable to uncover all material information about these companies, we may not make a fully informed investment decision, and may lose all or part of our investment. |
| 35 |
Any of these factors or changes thereto could impair a portfolio company’s financial condition, results of operation, cash flow or result in other adverse events, such as bankruptcy, any of which could limit a portfolio company’s ability to make scheduled payments on loans from us. This, in turn, may lead to their inability to make payments on outstanding borrowings, which could result in losses in our loan portfolio and a decrease in our net interest income and book value.
We may be subject to risks associated with our investments in senior loans.
We invest in senior secured loans. Senior secured loans are usually rated below investment grade or may also be unrated. As a result, the risks associated with senior secured loans may be considered by credit rating agencies to be similar to the risks of below investment grade fixed income instruments, although senior secured loans are senior and secured in contrast to other below investment grade fixed income instruments, which are often subordinated or unsecured. Investment in senior secured loans rated below investment grade is considered speculative because of the credit risk of their issuers. Such companies are more likely than investment grade issuers to default on their payments of interest and principal owed to us, and such defaults could have a material adverse effect on our performance. An economic downturn would generally lead to a higher non-payment rate, and a senior secured loan may lose significant market value before a default occurs. Moreover, any specific collateral used to secure a senior secured loan may decline in value or become illiquid, which would adversely affect the senior secured loan’s value.
There may be less readily available and reliable information about most senior secured loans than is the case for many other types of securities, including securities issued in transactions registered under the Securities Act or registered under the Exchange Act. As a result, MC Advisors will rely primarily on its own evaluation of a borrower’s credit quality rather than on any available independent sources. Therefore, we will be particularly dependent on the analytical abilities of MC Advisors.
In general, the secondary trading market for senior secured loans is not well developed. No active trading market may exist for certain senior secured loans, which may make it difficult to value them. Illiquidity and adverse market conditions may mean that we may not be able to sell senior secured loans quickly or at a fair price. To the extent that a secondary market does exist for certain senior secured loans, the market for them may be subject to irregular trading activity, wide bid/ask spreads and extended trade settlement periods.
We may be subject to risks associated with our investments in junior debt securities.
We invest in junior debt securities. Although certain junior debt securities are typically senior to common stock or other equity securities, the equity and debt securities in which we will invest may be subordinated to substantial amounts of senior debt, all or a significant portion of which may be secured. Such subordinated investments may be characterized by greater credit risks than those associated with the senior obligations of the same issuer. These subordinated securities may not be protected by all of the financial covenants, such as limitations upon additional indebtedness, typically protecting such senior debt. Holders of junior debt generally are not entitled to receive full payments in bankruptcy or liquidation until senior creditors are paid in full. Holders of equity are not entitled to payments until all creditors are paid in full. In addition, the remedies available to holders of junior debt are normally limited by restrictions benefiting senior creditors. In the event any portfolio company cannot generate adequate cash flow to meet senior debt service, we may suffer a partial or total loss of capital invested.
We may be subject to risks associated with our investments in unitranche secured loans and securities.
We invest in unitranche secured loans, which are a combination of senior secured and junior secured debt in the same facility in which we syndicate a “first out” portion of the loan to an investor and retain a “last out” portion of the loan. Unitranche secured loans provide all of the debt needed to finance a leveraged buyout or other corporate transaction, both senior and junior, but generally in a first lien position, while the borrower generally pays a blended, uniform interest rate rather than different rates for different tranches. Unitranche secured debt generally requires payments of both principal and interest throughout the life of the loan. Generally, we expect these securities to carry a blended yield that is between senior secured and junior debt interest rates. Unitranche secured loans provide a number of advantages for borrowers, including the following: simplified documentation, greater certainty of execution and reduced decision-making complexity throughout the life of the loan. In some cases, a portion of the total interest may accrue or be paid in kind. Because unitranche secured loans combine characteristics of senior and junior financing, unitranche secured loans have risks similar to the risks associated with senior secured and second lien loans and junior debt in varying degrees according to the combination of loan characteristics of the unitranche secured loan.
Loans may become nonperforming for a variety of reasons.
A nonperforming loan may require substantial debt work-out negotiations or restructuring that may entail a substantial reduction in the interest rate and/or a substantial write-down of the principal of such loan. Because of the unique and customized nature of a loan agreement and the private syndication of a loan, certain loans may not be purchased or sold as easily as publicly traded securities, and, historically, the trading volume in the loan market has been small relative to other markets. Loans may encounter trading delays due to their unique and customized nature, and transfers of interests in loans may require the consent of an agent or borrower.
The lack of liquidity in our investments may adversely affect our business.
All of our assets may be invested in illiquid securities, and a substantial portion of our investments in leveraged companies will be subject to legal and other restrictions on resale or will otherwise be less liquid than more broadly traded public securities. The illiquidity of these investments may make it difficult for us to sell such investments when desired. In addition, if we are required to liquidate all or a portion of our portfolio quickly, we may realize significantly less than the value at which we have previously recorded these investments. As a result, we do not expect to achieve liquidity in our investments in the near-term. However, to maintain the election to be regulated as a BDC and qualify as a RIC, we may have to dispose of investments if we do not satisfy one or more of the applicable criteria under the respective regulatory frameworks. We may also face other restrictions on our ability to liquidate an investment in a portfolio company to the extent that we or MC Advisors have material nonpublic information regarding such portfolio company.
Price declines and illiquidity in the corporate debt markets may adversely affect the fair value of our portfolio investments, reducing our net asset value through increased net unrealized losses.
As a BDC, we are required to carry our investments at market value or, if no market value is ascertainable, at fair value as determined in good faith by our Board. When an external event such as a purchase transaction, public offering or subsequent equity sale occurs, we use the pricing indicated by the external event to corroborate our valuation. We record decreases in the market values or fair values of our investments as unrealized losses. Declines in prices and liquidity in the corporate debt markets may result in significant net unrealized losses on our portfolio. The effect of all of these factors on our portfolio may reduce our net asset value by increasing net unrealized losses on our portfolio. Depending on market conditions, we could incur substantial realized losses and may suffer additional unrealized losses in future periods, which could have a material adverse effect on our business, financial condition and results of operations.
| 36 |
Our portfolio companies may prepay loans, which prepayment may reduce stated yields if capital returned cannot be invested in transactions with equal or greater expected yields.
The loans underlying our portfolio may be callable at any time, and many of them can be repaid with no premium to par. It is generally not clear and highly unpredictable when or if any loan might be called. Whether a loan is called will depend both on the continued positive performance of the portfolio company and the existence of favorable financing market conditions that allow such company the ability to replace existing financing with less expensive capital. As market conditions change frequently, it is unknown when, and if, this may be possible for each portfolio company. Risks associated with owning loans include the fact that prepayments may occur at any time, sometimes without premium or penalty, and that the exercise of prepayment rights during periods of declining spreads could cause us to reinvest prepayment proceeds in lower-yielding instruments. In the case of some of these loans, having the loan called early may reduce our achievable yield if the capital returned cannot be invested in transactions with equal or greater expected yields.
Our portfolio may be exposed in part to one or more specific industries, which may subject us to a risk of significant loss in a particular investment or investments if there is a downturn in that particular industry.
Our portfolio may be exposed in part to one or more specific industries. A downturn in any particular industry in which we are invested could significantly impact the aggregate returns we realize. If an industry in which we have significant investments suffers from adverse business or economic conditions, as these industries have to varying degrees, a material portion of our investment portfolio could be affected adversely, which, in turn, could adversely affect our financial position and results of operations.
As of December 31, 2019, our investments in the Services: Business, High Tech Industries, Banking, Finance, Insurance & Real Estate and Healthcare & Pharmaceuticals industries represented approximately 17.6%, 14.7%, 12.4% and 10.2%, respectively, of the fair value of our portfolio and are subject to certain risks particular to these industries. The laws and rules governing the business of companies in these industries and interpretations of those laws and rules are subject to frequent change and broad latitude is given to the agencies administering those regulations. Existing or future laws and rules could force our portfolio companies operating in these industries to change how they do business, restrict revenue, increase costs, change reserve levels and change business practices. Any of these factors could materially adversely affect the operations of a portfolio company in these industries and, in turn, impair our ability to timely collect principal and interest payments owed to us.
We may be subject to risks associated with our investments in the technology industry.
We may invest portions of our portfolio in the technology industry. There are risks in investing in companies that target technology-related markets, including rapid and sometimes dramatic price erosion of products, the reliance on capital and debt markets to finance large capital outlays, including fabrication facilities, the reliance on partners outside of the United States, particularly in Asia, and inherent cyclicality of the technology market in general. As a result of multiple factors, access to capital may be difficult or impossible for companies in our portfolio that are pursuing these markets. The revenue, income (or losses) and valuations of technology-related companies can and often do fluctuate suddenly and dramatically. In addition, because of rapid technological change, the average selling prices of products and some services provided by technology-related sectors have historically decreased over their productive lives. As a result, the average selling prices of products and services offered by our portfolio companies that operate in technology-related sectors may decrease over time, which could adversely affect their operating results and, correspondingly, the value of any securities that we may hold. This could, in turn, materially adversely affect our business, financial condition and results of operations.
We may be subject to risks associated with our investments in the healthcare industry.
Any of our portfolio companies operating in the healthcare information and services industry are subject to extensive government regulation and certain other risks particular to that industry. As part of our investment strategy, we plan to invest in companies in the healthcare information and services industry. Such portfolio companies provide technology to companies that are subject to extensive regulation, including Medicare and Medicaid payment rules and regulation, the False Claims Act and federal and state laws regarding the collection, use and disclosure of patient health information and the storage handling and administration of pharmaceuticals. If any of our portfolio companies or the companies to which they provide such technology fail to comply with applicable regulations, they could be subject to significant penalties and claims that could materially and adversely affect their operations. Portfolio companies in the healthcare information or services industry are also subject to the risk that changes in applicable regulations will render their technology obsolete or less desirable in the marketplace.
Portfolio companies in the healthcare information and services industry may also have a limited number of suppliers of necessary components or a limited number of manufacturers for their products, and therefore face a risk of disruption to their manufacturing process if they are unable to find alternative suppliers when needed. Any of these factors could materially and adversely affect the operations of a portfolio company in this industry and, in turn, impair our ability to timely collect principal and interest payments owed to us.
We may be subject to risks associated with our investments in the business services industry.
Portfolio companies in the business services sector are subject to many risks, including the negative impact of regulation, changing technology, a competitive marketplace and difficulty in obtaining financing. Portfolio companies in the business services industry must respond quickly to technological changes and understand the impact of these changes on customers’ preferences. Adverse economic, business, or regulatory developments affecting the business services sector could have a negative impact on the value of our investments in portfolio companies operating in this industry, and therefore could negatively impact our business and results of operations.
We may be subject to risks associated with our investments in the insurance industry.
We may invest portions of our portfolio in the insurance industry. The insurance business has historically been a cyclical industry characterized by periods of intense price competition due to excessive underwriting capacity, as well as periods when shortages of capacity permitted an increase in pricing and, thus, more favorable underwriting profits. An increase in premium levels is often offset over time by an increasing supply of insurance capacity in the form of capital provided by new entrants and existing insurers, which may cause prices to decrease. Any of these factors could lead to a significant reduction in premium rates, less favorable policy terms and fewer opportunities for our portfolio companies to underwrite insurance risks. Any of these factors could in turn, materially adversely affect our business, financial condition and results of operations.
| 37 |
We may be subject to risks associated with our investments in the finance industry.
We may invest portions of our portfolio in the finance industry. The regulatory environment in which the finance industry operates could have a material adverse effect on business and operating results for our portfolio companies. Our portfolio companies are subject to a wide variety of laws and regulations in the jurisdictions where they operate, including supervision and licensing by numerous governmental entities. These laws and regulations can create significant constraints on operations and result in significant costs related to compliance. Failure to comply with these laws and regulations could impair the ability of a portfolio company to continue operating and result in substantial civil and criminal penalties, monetary damages, attorneys’ fees and costs, possible revocation of licenses, and damage to reputation, brand and valued customer relationships. Any of these factors could in turn, materially adversely affect our business, financial condition and results of operations.
To the extent original issue discount and payment-in-kind interest constitute a portion of our income, we will be exposed to typical risks associated with such income being required to be included in taxable and accounting income prior to receipt of cash representing such income.
Our investments include original issue discount, or OID, components and may include PIK interest or PIK dividend components. For the year ended December 31, 2019, PIK interest and PIK dividends comprised approximately 8.1% and 0.1% of our investment income, respectively. To the extent original issue discount constitutes a portion of our income, we are exposed to typical risks associated with such income being required to be included in taxable and accounting income prior to receipt of cash, including the following:
| • | We must include in income each year a portion of the OID that accrues over the life of the obligation, regardless of whether cash representing such income is received by us in the same taxable year. Because any OID or other amounts accrued will be included in investment company taxable income for the year of the accrual, we may be required to make a distribution to our stockholders in order to satisfy our annual distribution requirements, even though we will not have received any corresponding cash amount. As a result, we may have to sell some of our investments at times or at prices that would not be advantageous to us, raise additional debt or equity capital or forgo new investment opportunities. |
| • | The higher yield of OID instruments reflect the payment deferral and credit risk associated with these instruments. |
| • | Even if the accounting conditions for income accrual are met, the borrower could still default when our actual collection is supposed to occur at the maturity of the obligation. |
| • | OID instruments may have unreliable valuations because their continuing accruals require continuing judgments about the collectability of the deferred payments and the value of the collateral. |
| • | OID instruments generally represent a significantly higher credit risk than coupon loans. |
| • | OID income received by us may create uncertainty about the source of our cash distributions to stockholders. For accounting purposes, any cash distributions to stockholders representing OID or market discount income are not treated as coming from paid-in capital, even though the cash to pay them comes from the offering proceeds. Thus, although a distribution of OID or market discount interest comes from the cash invested by the stockholders, Section 19(a) of the 1940 Act does not require that stockholders be given notice of this fact by reporting it as a return of capital. |
| • | The deferral of PIK interest has a negative impact on liquidity, as it represents non-cash income that may require distribution of cash dividends to stockholders in order to maintain our RIC status. In addition, the deferral of PIK interest also increases the loan-to-value (“LTV”) ratio at a compounding rate, thus, increasing the risk that we will absorb a loss in the event of foreclosure. |
| • | OID and market discount instruments create the risk of non-refundable incentive fee payments to MC Advisors based on non-cash accruals that we may not ultimately realize. |
We are a non-diversified investment company within the meaning of the 1940 Act, and therefore we are not limited by the 1940 Act with respect to the proportion of our assets that may be invested in securities of a single issuer.
We are classified as a non-diversified investment company within the meaning of the 1940 Act, which means that we are not limited by the 1940 Act with respect to the proportion of our assets that we may invest in securities of a single issuer. Our portfolio is and may in the future be concentrated in a limited number of portfolio companies and industries. Beyond the asset diversification requirements associated with our qualification as a RIC under the Code, we do not have fixed guidelines for diversification. Although we are classified as a non-diversified investment company within the meaning of the 1940 Act, we maintain the flexibility to operate as a diversified investment company and have done so for an extended period of time. To the extent that we operate as a non-diversified investment company in the future, we may be subject to greater risk. To the extent that we assume large positions in the securities of a small number of issuers, our net asset value may fluctuate to a greater extent than that of a diversified investment company as a result of changes in the financial condition or the market’s assessment of the issuer. We may also be more susceptible to any single economic or regulatory occurrence than a diversified investment company. As a result, the aggregate returns we realize may be significantly adversely affected if a small number of investments perform poorly or if we need to write down the value of any one investment. Additionally, while we are not targeting any specific industries, our investments may be concentrated in relatively few industries. As a result, a downturn in any particular industry in which we are invested could also significantly impact the aggregate returns we realize.
We may hold the debt securities of leveraged companies that may, due to the significant volatility of such companies, enter into bankruptcy proceedings.
Leveraged companies may experience bankruptcy or similar financial distress. The bankruptcy process has a number of significant inherent risks. Many events in a bankruptcy proceeding are the product of contested matters and adversary proceedings and are beyond the control of the creditors. A bankruptcy filing by a portfolio company may adversely and permanently affect the portfolio company. If the proceeding is converted to a liquidation, the value of the issuer may not equal the liquidation value that was believed to exist at the time of the investment. The duration of a bankruptcy proceeding is also difficult to predict, and a creditor’s return on investment can be adversely affected by delays until the plan of reorganization or liquidation ultimately becomes effective. The administrative costs in connection with a bankruptcy proceeding are frequently high and would be paid out of the debtor’s estate prior to any return to creditors. Because the standards for classification of claims under bankruptcy law are vague, our influence with respect to the class of securities or other obligations we own may be lost by increases in the number and amount of claims in the same class or by different classification and treatment. In the early stages of the bankruptcy process, it is often difficult to estimate the extent of, or even to identify, any contingent claims that might be made. In addition, certain claims that have priority by law (for example, claims for taxes) may be substantial.
| 38 |
Our failure to make follow-on investments in our portfolio companies could impair the value of our portfolio.
Following an initial investment in a portfolio company, we may make additional investments in that portfolio company as “follow-on” investments, in seeking to:
| • | increase or maintain in whole or in part our position as a creditor or equity ownership percentage in a portfolio company; |
| • | exercise warrants, options or convertible securities that were acquired in the original or subsequent financing; or |
| • | preserve or enhance the value of our investment. |
We have discretion to make follow-on investments, subject to the availability of capital resources and the provisions of the 1940 Act. Failure on our part to make follow-on investments may, in some circumstances, jeopardize the continued viability of a portfolio company and our initial investment, or may result in a missed opportunity for us to increase our participation in a successful operation. Even if we have sufficient capital to make a desired follow-on investment, we may elect not to make a follow-on investment because we may not want to increase our level of risk, because we prefer other opportunities or because we are inhibited by compliance with BDC requirements or the desire to maintain our RIC status. Our ability to make follow-on investments may also be limited by MC Advisors’ allocation policy.
Because we do not hold controlling equity interests in the majority of our portfolio companies, we may not be able to exercise control over our portfolio companies or to prevent decisions by management of our portfolio companies, which could decrease the value of our investments.
Although we may do so in the future, we do not currently hold controlling equity positions in the majority of our portfolio companies. Our debt investments may provide limited control features such as restrictions, for example, on the ability of a portfolio company to assume additional debt, or to use the proceeds of our investment for other than certain specified purposes. “Control” under the 1940 Act is presumed at more than 25% equity ownership, and may also be present at lower ownership levels where we provide managerial assistance. When we do not acquire a controlling equity position in a portfolio company, we may be subject to the risk that a portfolio company may make business decisions with which we disagree, and that the management and/or stockholders of a portfolio company may take risks or otherwise act in ways that are adverse to our interests. Due to the lack of liquidity of the debt and equity investments that we typically hold in our portfolio companies, we may not be able to dispose of our investments in the event we disagree with the actions of a portfolio company and may therefore suffer a decrease in the value of our investments.
Defaults by our portfolio companies will harm our operating results.
A portfolio company’s failure to satisfy financial or operating covenants imposed by us or other lenders could lead to defaults and, potentially, termination of its loans and foreclosure on its assets. This could trigger cross-defaults under other agreements and jeopardize such portfolio company’s ability to meet its obligations under the debt or equity securities that we hold. We may incur expenses to the extent necessary to seek recovery upon default or to negotiate new terms, which may include the waiver of certain financial covenants, with a defaulting portfolio company.
In addition, many of our investments will likely have a principal amount outstanding at maturity, which could result in a substantial loss to us if the borrower is unable to refinance or repay.
Our portfolio companies may incur debt that ranks equally with, or senior to, our investments in such companies.
We generally seek to invest capital in senior, unitranche and junior secured loans and, to a lesser extent, unsecured subordinated debt and equity. The portfolio companies in which we invest usually have, or may be permitted to incur, other debt that ranks equally with, or senior to, the debt securities in which we invest. By their terms, such debt instruments may provide that the holders are entitled to receive payment of interest or principal on or before the dates on which we are entitled to receive payments in respect of the debt securities in which we invest. Also, in the event of insolvency, liquidation, dissolution, reorganization or bankruptcy of a portfolio company, holders of debt instruments ranking senior to our investment in that portfolio company would typically be entitled to receive payment in full before we receive any distribution in respect of our investment. After repaying senior creditors, the portfolio company may not have any remaining assets to use for repaying its obligation to us. In the case of debt ranking equally with debt securities in which we invest, we would have to share any distributions on an equal and ratable basis with other creditors holding such debt in the event of an insolvency, liquidation, dissolution, reorganization or bankruptcy of the relevant portfolio company.
Additionally, certain loans that we make to portfolio companies may be secured on a second-priority basis by the same collateral securing senior secured debt of such companies. The first-priority liens on the collateral will secure the portfolio company’s obligations under any outstanding senior debt and may secure certain other future debt that may be permitted to be incurred by the portfolio company under the agreements governing the loans. The holders of obligations secured by first-priority liens on the collateral will generally control the liquidation of, and be entitled to receive proceeds from, any realization of the collateral to repay their obligations in full before us. In addition, the value of the collateral in the event of liquidation will depend on market and economic conditions, the availability of buyers and other factors. There can be no assurance that the proceeds, if any, from sales of all of the collateral would be sufficient to satisfy the loan obligations secured by the second-priority liens after payment in full of all obligations secured by the first-priority liens on the collateral. If such proceeds were not sufficient to repay amounts outstanding under the loan obligations secured by the second-priority liens, then, to the extent not repaid from the proceeds of the sale of the collateral, we will only have an unsecured claim against the portfolio company’s remaining assets, if any.
The rights we may have with respect to the collateral securing the loans we make to our portfolio companies with senior debt outstanding may also be limited pursuant to the terms of one or more intercreditor agreements that we enter into with the holders of such senior debt, including in unitranche secured transactions. Under a typical intercreditor agreement, at any time that obligations that have the benefit of the first-priority liens are outstanding, any of the following actions that may be taken in respect of the collateral will be at the direction of the holders of the obligations secured by the first-priority liens:
| • | the ability to cause the commencement of enforcement proceedings against the collateral; |
| • | the ability to control the conduct of such proceedings; |
| • | the approval of amendments to collateral documents; |
| • | releases of liens on the collateral; and |
| • | waivers of past defaults under collateral documents. |
| 39 |
We may not have the ability to control or direct such actions, even if our rights are adversely affected. In addition, a bankruptcy court may choose not to enforce an intercreditor agreement or other agreement with creditors.
We may also make unsecured loans to portfolio companies, meaning that such loans will not benefit from any interest in collateral of such companies. Liens on such portfolio companies’ collateral, if any, will secure the portfolio company’s obligations under its outstanding secured debt and may secure certain future debt that is permitted to be incurred by the portfolio company under its secured loan agreements. The holders of obligations secured by such liens will generally control the liquidation of, and be entitled to receive proceeds from, any realization of such collateral to repay their obligations in full before us. In addition, the value of such collateral in the event of liquidation will depend on market and economic conditions, the availability of buyers and other factors. There can be no assurance that the proceeds, if any, from sales of such collateral would be sufficient to satisfy our unsecured loan obligations after payment in full of all secured loan obligations. If such proceeds were not sufficient to repay the outstanding secured loan obligations, then our unsecured claims would rank equally with the unpaid portion of such secured creditors’ claims against the portfolio company’s remaining assets, if any.
We may also make subordinated investments that rank below other obligations of the obligor in right of payment. Subordinated investments are generally more volatile than secured loans and are subject to greater risk of default than senior obligations as a result of adverse changes in the financial condition of the obligor or in general economic conditions. If we make a subordinated investment in a portfolio company, the portfolio company may be highly leveraged, and its relatively high LTV ratio may create increased risks that its operations might not generate sufficient cash flow to service all of its debt obligations.
We may be subject to risks associated with syndicated loans.
From time to time, our investments may consist of syndicated loans. Under the documentation for such loans, a financial institution or other entity typically is designated as the administrative agent and/or collateral agent. This agent is granted a lien on any collateral on behalf of the other lenders and distributes payments on the indebtedness as they are received. The agent is the party responsible for administering and enforcing the loan and generally may take actions only in accordance with the instructions of a majority or two-thirds in commitments and/or principal amount of the associated indebtedness. In most cases, we do not expect to hold a sufficient amount of the indebtedness to be able to compel any actions by the agent. Accordingly, we may be precluded from directing such actions unless we act together with other holders of the indebtedness. If we are unable to direct such actions, we cannot assure you that the actions taken will be in our best interests.
There is a risk that a loan agent may become bankrupt or insolvent. Such an event would delay, and possibly impair, any enforcement actions undertaken by holders of the associated indebtedness, including attempts to realize upon the collateral securing the associated indebtedness and/or direct the agent to take actions against the related obligor or the collateral securing the associated indebtedness and actions to realize on proceeds of payments made by obligors that are in the possession or control of any other financial institution. In addition, we may be unable to remove the agent in circumstances in which removal would be in our best interests. Moreover, agented loans typically allow for the agent to resign with certain advance notice.
The disposition of our investments may result in contingent liabilities.
A significant portion of our investments involves private securities. In connection with the disposition of an investment in private securities, we may be required to make representations about the business and financial affairs of the portfolio company typical of those made in connection with the sale of a business. We may also be required to indemnify the purchasers of such investment to the extent that any such representations turn out to be inaccurate or with respect to potential liabilities. These arrangements may result in contingent liabilities that ultimately result in funding obligations that we must satisfy through our return of distributions previously made to us.
Investments in securities of foreign companies, if any, may involve significant risks in addition to the risks inherent in U.S. investments.
We may make investments in securities of foreign companies. Investing in foreign companies may expose us to additional risks not typically associated with investing in U.S. companies, including changes in exchange control regulations, political and social instability, expropriation and imposition of foreign taxes. In addition, any investments that we make that are denominated in a foreign currency will be subject to the risk that the value of a particular currency will change in relation to one or more other currencies. Factors such as trade balances, the level of short-term interest rates, differences in relative values of similar assets in different currencies, long-term opportunities for investment and capital appreciation and political developments may affect currency values. We may employ hedging techniques to minimize these risks, but we cannot assure you that we will, in fact, hedge currency risk, or, that if we do, such strategies will be effective.
We may be subject to additional risks if we engage in hedging transactions and/or invest in foreign securities.
The 1940 Act generally requires that 70% of our investments be in issuers each of whom, in addition to other requirements, is organized under the laws of, and has its principal place of business in, any state of the United States, the District of Columbia, Puerto Rico, the Virgin Islands or any other possession of the United States. Our investment strategy does not contemplate a significant number of investments in securities of non-U.S. companies. We expect that these investments would focus on the same investments that we make in U.S. middle-market companies and, accordingly, would be complementary to our overall strategy and enhance the diversity of our holdings.
To the extent that these investments are denominated in a foreign currency, we may engage in hedging transactions. Engaging in either hedging transactions or investing in foreign securities would entail additional risks to our stockholders. We may, for example, use instruments such as interest rate swaps, caps, collars and floors, forward contracts or currency options or borrow under a revolving credit facility in foreign currencies to minimize our foreign currency exposure. In each such case, we generally would seek to hedge against fluctuations of the relative values of our portfolio positions from changes in market interest rates or currency exchange rates. Hedging against a decline in the values of our portfolio positions would not eliminate the possibility of fluctuations in the values of such positions or prevent losses if the values of the positions declined. However, such hedging could establish other positions designed to gain from those same developments, thereby offsetting the decline in the value of such portfolio positions. Such hedging transactions could also limit the opportunity for gain if the values of the underlying portfolio positions increased. Moreover, it might not be possible to hedge against an exchange rate or interest rate fluctuation that was so generally anticipated that we would not be able to enter into a hedging transaction at an acceptable price. Our ability to engage in hedging transactions may also be adversely affected by recent rules adopted by the U.S. Commodity Futures Trading Commission.
While we may enter into such transactions to seek to reduce currency exchange rate and interest rate risks, unanticipated changes in currency exchange rates or interest rates could result in poorer overall investment performance than if we had not engaged in any such hedging transactions. In addition, the degree of correlation between price movements of the instruments used in a hedging strategy and price movements in the portfolio positions being hedged could vary. Moreover, for a variety of reasons, we might not seek to establish a perfect correlation between the hedging instruments and the portfolio holdings being hedged. Any such imperfect correlation could prevent us from achieving the intended hedge and expose us to risk of loss. In addition, it might not be possible to hedge fully or perfectly against currency fluctuations affecting the value of securities denominated in non-U.S. currencies because the value of those securities would likely fluctuate as a result of factors not related to currency fluctuations.
| 40 |
We may not realize gains from our equity investments.
We currently hold, and we may in the future make, investments that include warrants or other equity or equity-related securities. In addition, we may from time to time make non-control, equity co-investments in companies in conjunction with private equity sponsors. Our goal is ultimately to realize gains upon our disposition of such equity interests. However, the equity interests we receive may not appreciate in value and, in fact, may decline in value. Accordingly, we may not be able to realize gains from our equity interests, and any gains that we do realize on the disposition of any equity interests may not be sufficient to offset any other losses we experience. We also may be unable to realize any value if a portfolio company does not have a liquidity event, such as a sale of the business, recapitalization or public offering, which would allow us to sell the underlying equity interests. We often seek puts or similar rights to give us the right to sell our equity securities back to the portfolio company issuer. We may be unable to exercise these put rights for the consideration provided in our investment documents if the issuer is in financial distress.
Risks Relating to Our Common Stock
We may not be able to pay distributions, our distributions may not grow over time and/or a portion of our distributions may be a return of capital.
We have paid and intend to continue to pay distributions to our stockholders out of assets legally available for distribution. We cannot assure you that we will achieve investment results that will allow us to sustain a specified level of cash distributions or make periodic increases in cash distributions. Our ability to pay distributions might be adversely affected by, among other things, the impact of one or more of the risk factors described herein. In addition, the inability to satisfy the asset coverage test applicable to us as a BDC could limit our ability to pay distributions. All distributions will be paid at the discretion of our Board and will depend on our earnings, our financial condition, maintenance of our RIC status, compliance with applicable BDC regulations and such other factors as our Board may deem relevant from time to time. We cannot assure you that we will continue to pay distributions to our stockholders.
When we make distributions, we will be required to determine the extent to which such distributions are paid out of current or accumulated earnings and profits. Distributions in excess of current and accumulated earnings and profits will be treated as a non-taxable return of capital to the extent of an investor’s basis in our stock and, assuming that an investor holds our stock as a capital asset, thereafter as a capital gain.
We may choose to pay a portion of our dividends in our own stock, in which case you may be required to pay tax in excess of the cash you receive.
We have adopted a dividend reinvestment plan that provides for reinvestment of our dividends and other distributions on behalf of our stockholders, unless a stockholder elects to receive cash pursuant to such plan. We may distribute taxable dividends that are payable in part in our stock. Taxable stockholders receiving such dividends will be required to include the full amount of the dividend as ordinary income (or as long-term capital gain or qualified dividend income to the extent such distribution is properly reported as such) to the extent of our current and accumulated earnings and profits for federal income tax purposes. The tax rate for ordinary income will vary depending on a stockholder’s particular characteristics. For individuals, the top marginal federal ordinary income tax rate is 37%. To the extent distributions paid by us to non-corporate stockholders (including individuals) are attributable to dividends from U.S. corporations and certain qualified foreign corporations, such distributions generally will be eligible for a maximum qualified dividend federal tax rate of 20%. However, in this regard, it is anticipated that distributions paid by us will generally not be attributable to such dividends and, therefore, generally will not qualify for the preferential federal tax rate. Distributions of our net capital gains (which is generally our realized net long-term capital gains in excess of realized net short-term capital losses) properly reported by us as “capital gain dividends” will be taxable to a U.S. stockholder as long-term capital gains currently at a maximum federal tax rate of 20%.
As a result of receiving dividends in the form of our common stock, a U.S. stockholder may be required to pay tax with respect to such dividends in excess of any cash received. If a U.S. stockholder sells the stock it receives as a dividend in order to pay this tax, the sales proceeds may be less than the amount included in income with respect to the dividend, depending on the market price of our stock at the time of the sale. Furthermore, with respect to non-U.S. stockholders, we may be required to withhold federal tax with respect to such dividends, including in respect of all or a portion of such dividend that is payable in shares of our common stock. In addition, if a significant number of our stockholders determine to sell shares of our stock in order to pay taxes owed on dividends, it may put downward pressure on the trading price of shares of our common stock.
In addition, as discussed above, our loans may contain a PIK interest provision. The PIK interest, computed at the contractual rate specified in each loan agreement, is added to the principal balance of the loan and recorded as interest income. To avoid the imposition of corporate-level tax, we will need to make sufficient distributions, a portion of which may be paid in shares of our common stock, regardless of whether our recognition of income is accompanied by a corresponding receipt of cash.
If we sell common stock at a discount to our net asset value per share, stockholders who do not participate in such sale will experience immediate dilution in an amount that may be material.
The issuance or sale by us of shares of our common stock at a price per share, after offering expenses and commission, that is a discount to net asset value poses a risk of dilution to our stockholders. In particular, stockholders who do not purchase additional shares at or below the discounted price in proportion to their current ownership will experience an immediate decrease in net asset value per share (as well as in the aggregate net asset value of their shares if they do not participate at all). These stockholders will also experience a disproportionately greater decrease in their participation in our earnings and assets and their voting power than the increase we experience in our assets, potential earning power and voting interests from such issuance or sale. In addition, such sales may adversely affect the price at which our common stock trades.
Investing in our common stock may involve an above-average degree of risk.
The investments we make in accordance with our investment objective may result in a higher amount of risk than alternative investment options and a higher risk of volatility or loss of principal. Our investments in portfolio companies may be highly speculative and aggressive and, therefore, an investment in our common stock may not be suitable for someone with lower risk tolerance.
Shares of closed-end investment companies, including BDCs, often trade at a discount to their net asset value.
Shares of closed-end investment companies, including BDCs, may trade at a discount from net asset value. This characteristic of closed-end investment companies and BDCs is separate and distinct from the risk that our net asset value per share may decline. We cannot predict whether our common stock will trade at, above or below net asset value.
| 41 |
Provisions of the Maryland General Corporation Law and our charter and bylaws could deter takeover attempts and have an adverse effect on the price of our common stock.
The Maryland General Corporation Law and our charter and bylaws contain provisions that may discourage, delay or make more difficult a change in control of us or the removal of our directors. We are subject to the Maryland Business Combination Act, subject to any applicable requirements of the 1940 Act. Our Board has adopted a resolution exempting from the Maryland Business Combination Act any business combination between us and any other person, subject to prior approval of such business combination by our Board, including approval by a majority of our independent directors. If the resolution exempting business combinations is repealed or our Board does not approve a business combination, the Maryland Business Combination Act may discourage third parties from trying to acquire control of us and increase the difficulty of consummating such an offer. The SEC staff has taken the position that, under the 1940 Act, an investment company may not avail itself of the Maryland Control Share Acquisition Act. As a result, we will amend our bylaws to be subject to the Maryland Control Share Acquisition Act, only if the Board determines that it would be in our best interests and, after notification, the SEC staff does not object to our determination that our being subject to the Maryland Control Share Acquisition Act does not conflict with the 1940 Act. If such conditions are met, and we amend our bylaws to repeal the exemption from the Maryland Control Share Acquisition Act, the Maryland Control Share Acquisition Act also may make it more difficult for a third party to obtain control of us and increase the difficulty of consummating such a transaction.
We have adopted certain measures that may make it difficult for a third-party to obtain control of us, including provisions of our charter classifying our Board in three staggered terms and authorizing our Board to classify or reclassify shares of our capital stock in one or more classes or series and to cause the issuance of additional shares of our stock. These provisions, as well as other provisions of our charter and bylaws, may delay, defer or prevent a transaction or a change in control that might otherwise be in the best interests of our stockholders.
The market price of our securities may fluctuate significantly.
The market price and liquidity of the market for our securities may be higher or lower than the price you pay and may be significantly affected by numerous factors, some of which are beyond our control and may not be directly related to our operating performance. These factors include:
| • | significant volatility in the market price and trading volume of securities of BDCs or other companies in our sector, which is not necessarily related to the operating performance of these companies; |
| • | changes in regulatory policies or tax guidelines, particularly with respect to RICs or BDCs; |
| • | loss of RIC or BDC status; |
| • | the ability of MRCC SBIC, or any other SBIC subsidiary we may form to obtain and maintain an SBIC license; |
| • | changes or perceived changes in earnings or variations in operating results; |
| • | changes or perceived changes in the value of our portfolio of investments; |
| • | changes in accounting guidelines governing valuation of our investments; |
| • | any shortfall in revenue or net income or any increase in losses from levels expected by investors or securities analysts; |
| • | departure of MC Advisors’ key personnel; |
| • | operating performance of companies comparable to us; |
| • | general economic trends and other external factors; and |
| • | loss of a major funding source. |
Risks Related to the 2023 Notes
The 2023 Notes are unsecured and therefore are effectively subordinated to any secured indebtedness we have incurred or may incur in the future.
The 2023 Notes are not secured by any of our assets or any of the assets of any of our subsidiaries. As a result, the 2023 Notes are effectively subordinated to any secured indebtedness we or our subsidiaries have incurred or that we or our subsidiaries may incur in the future (or any indebtedness that is initially unsecured as to which we subsequently grant a security interest) to the extent of the value of the assets securing such indebtedness. In any liquidation, dissolution, bankruptcy or other similar proceeding, the holders of any of our secured indebtedness or secured indebtedness of our subsidiaries may assert rights against the assets pledged to secure that indebtedness in order to receive full payment of their indebtedness before the assets may be used to pay other creditors, including the holders of the 2023 Notes. As of December 31, 2019, we had $180.3 million in outstanding indebtedness under the revolving credit facility. The indebtedness under the revolving credit facility is effectively senior to the 2023 Notes to the extent of the value of the assets securing such indebtedness.
The 2023 Notes are structurally subordinated to the indebtedness and other liabilities of our subsidiaries.
The 2023 Notes are obligations exclusively of the Company, and not of any of our subsidiaries. None of our subsidiaries is a guarantor of the 2023 Notes, and the 2023 Notes are not required to be guaranteed by any subsidiary we may acquire or create in the future. Any assets of our subsidiaries are not directly available to satisfy the claims of our creditors, including holders of the 2023 Notes. Except to the extent we are a creditor with recognized claims against our subsidiaries, all claims of creditors of our subsidiaries will have priority over our equity interests in such entities (and therefore the claims of our creditors, including holders of the 2023 Notes) with respect to the assets of such entities. Even if we are recognized as a creditor of one or more of these entities, our claims would still be effectively subordinated to any security interests in the assets of any such entity and to any indebtedness or other liabilities of any such entity senior to our claims. Consequently, the 2023 Notes are structurally subordinated to all indebtedness and other liabilities, including trade payables, of any of our existing or future subsidiaries, including MRCC SBIC. As of December 31, 2019, our subsidiaries had total indebtedness outstanding of $115.0 million. In addition, in the future our subsidiaries may incur substantial additional indebtedness, all of which is and would be structurally senior to the 2023 Notes.
| 42 |
The indenture under which the 2023 Notes are issued contains limited protection for holders of the 2023 Notes.
The indenture under which the 2023 Notes are issued offers limited protection to holders of the 2023 Notes. The terms of the indenture and the 2023 Notes do not restrict our or any of our subsidiaries’ ability to engage in, or otherwise be a party to, a variety of corporate transactions, circumstances or events that could have a material adverse impact on your investment in the 2023 Notes. In particular, the terms of the indenture and the 2023 Notes do not place any restrictions on our or our subsidiaries’ ability to:
| • | issue securities or otherwise incur additional indebtedness or other obligations, including (1) any indebtedness or other obligations that would be equal in right of payment to the 2023 Notes, (2) any indebtedness or other obligations that would be secured and therefore rank effectively senior in right of payment to the 2023 Notes to the extent of the values of the assets securing such debt, (3) indebtedness of ours that is guaranteed by one or more of our subsidiaries and which therefore is structurally senior to the 2023 Notes and (4) securities, indebtedness or obligations issued or incurred by our subsidiaries that would be senior to our equity interests in those entities and therefore rank structurally senior to the 2023 Notes with respect to the assets of our subsidiaries, in each case other than an incurrence of indebtedness or other obligation that would cause a violation of Section 18(a)(1)(A) as modified by such provisions of Section 61(a) of the 1940 Act as may be applicable to us from time to time or any successor provisions, whether or not we continue to be subject to such provisions of the 1940 Act, but giving effect, in each case, to any exemptive relief granted to us by the SEC. Currently, these provisions generally prohibit us from making additional borrowings, including through the issuance of additional debt or the sale of additional debt securities, unless our asset coverage, as defined in the 1940 Act, equals at least 150% after such borrowings. See “— Recently-enacted legislation allows us to incur additional leverage, which could increase the risk of investing in us”; |
| • | pay dividends on, or purchase or redeem or make any payments in respect of, capital stock or other securities ranking junior in right of payment to the 2023 Notes, including subordinated indebtedness, in each case other than dividends, purchases, redemptions or payments that would cause our asset coverage (as defined in the 1940 Act, except to the extent modified by this covenant) to fall below the threshold specified in Section 18(a)(1)(B) as modified by such provisions of Section 61(a) of the 1940 Act as may be applicable to us from time to time or any successor provisions, giving effect to (i) any exemptive relief granted to us by the SEC and (ii) no-action relief granted by the SEC to another BDC (or to us if we determine to seek such similar no-action or other relief) permitting the BDC to declare any cash dividend or distribution notwithstanding the prohibition contained in Section 18(a)(1)(B) as modified by such provisions of Section 61(a) of the 1940 Act as may be applicable to us from time to time in order to maintain the BDC’s status as a RIC under Subchapter M of the Code. These provisions generally prohibit us from declaring any cash dividend or distribution upon any class of our capital stock, or purchasing any such capital stock if our asset coverage, as defined in the 1940 Act, is below 150% at the time of the declaration of the dividend or distribution or the purchase and after deducting the amount of such dividend, distribution or purchase. For the purposes of determining “asset coverage” as used above, any and all of our indebtedness, including any outstanding borrowings under the revolving credit facility and any successor or additional credit facility, shall be deemed a senior security of us; |
| • | sell assets (other than certain limited restrictions on our ability to consolidate, merge or sell all or substantially all of our assets); |
| • | enter into transactions with affiliates; |
| • | create liens (including liens on the shares of our subsidiaries) or enter into sale and leaseback transactions; |
| • | make investments; or |
| • | create restrictions on the payment of dividends or other amounts to us from our subsidiaries. |
In addition, the indenture does not require us to offer to purchase the 2023 Notes in connection with a change of control or any other event.
Furthermore, the terms of the indenture and the 2023 Notes do not protect holders of the 2023 Notes in the event that we experience changes (including significant adverse changes) in our financial condition, results of operations or credit ratings, if any, as they do not require that we or our subsidiaries adhere to any financial tests or ratios or specified levels of net worth, revenues, income, cash flow, or liquidity.
Our ability to recapitalize, incur additional debt (including additional debt that matures prior to the maturity of the 2023 Notes), and take a number of other actions that are not limited by the terms of the 2023 Notes may have important consequences for you as a holder of the 2023 Notes, including making it more difficult for us to satisfy our obligations with respect to the 2023 Notes or negatively affecting the trading value of the 2023 Notes.
Other debt we issue or incur in the future could contain more protections for its holders than the indenture and the 2023 Notes, including additional covenants and events of default. The issuance or incurrence of any such debt with incremental protections could affect the market for, trading levels, and prices of the 2023 Notes.
An active trading market for the 2023 Notes may not develop or be sustained, which could limit the market price of the 2023 Notes or the ability to sell them.
Although the 2023 Notes are listed on The Nasdaq Global Select Market under the symbol “MRCCL,” we cannot provide any assurances that an active trading market will develop or be maintained for the 2023 Notes or that the 2023 Notes will be able to be sold. At various times, the 2023 Notes may trade at a discount from their initial offering price depending on prevailing interest rates, the market for similar securities, our credit ratings, if any, general economic conditions, our financial condition, performance and prospects and other factors. Accordingly, we cannot provide any assurance that a liquid trading market will develop for the 2023 Notes, or that the 2023 Notes will be able to be sold at a particular time or at a favorable price. To the extent an active trading market does not develop, the liquidity and trading price for the 2023 Notes may be harmed.
If we default on our obligations to pay our other indebtedness, we may not be able to make payments on the 2023 Notes.
As of December 31, 2019, we had approximately $180.3 million of indebtedness outstanding under the revolving credit facility. Any default under the agreements governing our indebtedness, including a default under the revolving credit facility or other indebtedness to which we may be a party that is not waived by the required lenders, and the remedies sought by lenders or the holders of such indebtedness could make us unable to pay principal, premium, if any, and interest on the 2023 Notes and substantially decrease the market value of the 2023 Notes. If we are unable to generate sufficient cash flow and are otherwise unable to obtain funds necessary to meet required payments of principal, premium, if any, and interest on our indebtedness, or if we otherwise fail to comply with the various covenants, including financial and operating covenants, in the instruments governing our indebtedness (including the revolving credit facility), we could be in default under the terms of the agreements governing such indebtedness, including the 2023 Notes. In the event of such default, the holders of such indebtedness could elect to declare all the funds borrowed thereunder to be due and payable, together with accrued and unpaid interest, the lenders under the revolving credit facility or other debt we may incur in the future could elect to terminate their commitment, cease making further loans and institute foreclosure proceedings against our assets, and we could be forced into bankruptcy or liquidation.
| 43 |
If our operating performance declines and we are not able to generate sufficient cash flow to service our debt obligations, we may in the future need to refinance or restructure our debt, including the 2023 Notes, sell assets, reduce or delay capital investments, seek to raise additional capital or seek to obtain waivers from the lenders under the revolving credit facility or other debt that we may incur in the future to avoid being in default. If we are unable to implement one or more of these alternatives, we may not be able to meet our payment obligations under the 2023 Notes and our other debt. If we breach our covenants under the revolving credit facility or any of our other debt and seek a waiver, we may not be able to obtain a waiver from the required lenders or holders thereof. If this occurs, we would be in default under the revolving credit facility or other debt, the lenders or holders could exercise rights as described above, and we could be forced into bankruptcy or liquidation. If we are unable to repay debt, lenders having secured obligations could proceed against the collateral securing the debt, including the revolving credit facility. Because the revolving credit facility has, and any future credit facilities will likely have, customary cross-default provisions, if we have a default under the terms of the 2023 Notes, the obligations under the revolving credit facility or any future credit facility may be accelerated and we may be unable to repay or finance the amounts due.
We may choose to redeem the 2023 Notes when prevailing interest rates are relatively low.
On or after October 31, 2020, we may choose to redeem the 2023 Notes from time to time, especially if prevailing interest rates are lower than the rate borne by the 2023 Notes. If prevailing rates are lower at the time of redemption, and we redeem the 2023 Notes, you likely would not be able to reinvest the redemption proceeds in a comparable security at an effective interest rate as high as the interest rate on the 2023 Notes being redeemed. Our redemption right also may adversely impact your ability to sell the 2023 Notes as the optional redemption date or period approaches.
A downgrade, suspension or withdrawal of the credit rating assigned by a rating agency to us or our securities, if any, could cause the liquidity or market value of the 2023 Notes to decline significantly.
Our credit ratings are an assessment by rating agencies of our ability to pay our debts when due. Consequently, real or anticipated changes in our credit ratings will generally affect the market value of the 2023 Notes. These credit ratings may not reflect the potential impact of risks relating to the structure or marketing of the 2023 Notes. Credit ratings are not a recommendation to buy, sell or hold any security, and may be revised or withdrawn at any time by the issuing organization in its sole discretion. Neither we nor any underwriter undertakes any obligation to maintain our credit ratings or to advise holders of 2023 Notes of any changes in our credit ratings. There can be no assurance that our credit ratings will remain for any given period of time or that such credit ratings will not be lowered or withdrawn entirely by the rating agency if in their judgment future circumstances relating to the basis of the credit ratings, such as adverse changes in our company, so warrant.
ITEM 1B. UNRESOLVED STAFF COMMENTS
None.
We do not own any real estate or other physical properties materially important to our operation. The principal executive offices of Monroe Capital are located at 311 South Wacker Drive, Suite 6400, Chicago, Illinois 60606. Monroe Capital and its affiliates currently have additional offices, and/or company representatives in New York, New York; Los Angeles, California; San Francisco, California; Atlanta, Georgia; and Boston, Massachusetts. Our administrator furnishes us office space, and we reimburse it for such costs on an allocated basis.
Neither we nor our investment adviser is currently subject to any material legal proceedings.
ITEM 4. MINE SAFETY DISCLOSURES
Not applicable.
| 44 |
ITEM 5. MARKET FOR REGISTRANT’S COMMON EQUITY, RELATED STOCKHOLDER MATTERS AND ISSUER PURCHASES OF EQUITY SECURITIES
COMMON STOCK
Our common stock is traded on The Nasdaq Global Select Market under the ticker symbol “MRCC.” Our common stock has historically traded at prices both above and below our net asset value per share. It is not possible to predict whether our common stock will trade at, above or below net asset value.
HOLDERS
As of March 2, 2020, there were seven holders of record of our common stock. This does not include the number of stockholders that hold shares in “street name” through banks or broker-dealers.
DISTRIBUTIONS
We currently intend to make distributions to our stockholders on a quarterly basis out of assets legally available for distribution. We may also make additional distributions to our stockholders from time to time. Our quarterly and additional distributions, if any, will be determined by our board of directors.
Our revolving credit facility, as amended, imposes certain conditions that may limit the amount of our distributions to stockholders. Distributions payable in our common stock under our dividend reinvestment plan are not limited by the revolving credit facility. Distributions in cash or property other than our common stock are generally limited to 115% of the amount of distributions required to maintain our status as a RIC.
In October 2012, we adopted an “opt out” dividend reinvestment plan for our common stockholders. When we declare a distribution, our stockholders’ cash distributions will be automatically reinvested in additional shares of our common stock unless a stockholder specifically “opts out” of our dividend reinvestment plan. If a stockholder opts out, that stockholder will receive cash distributions.
PERFORMANCE GRAPH
The following graph compares the return on our common stock from December 31, 2014 to December 31, 2019 with that of the Standard & Poor’s 500 Stock Index and the NASDAQ Financial 100 index. The graph assumes that on December 31, 2014, a person invested $100 in each of our common stock, the Standard & Poor’s 500 Stock Index and the NASDAQ Financial 100 index. The graph measures total stockholder return, which takes into account both changes in stock price and dividends. The graph also assumes the reinvestment of all dividends prior to any tax effect. The graph and other information furnished under this Part II Item 5 of this Annual Report on Form 10-K shall not be deemed to be “soliciting material” or to be “filed” with the SEC or subject to Regulation 14A or 14C under, or to the liabilities of Section 18 of, the Exchange Act. The stock price performance included in the below graph is not necessarily indicative of future stock performance.
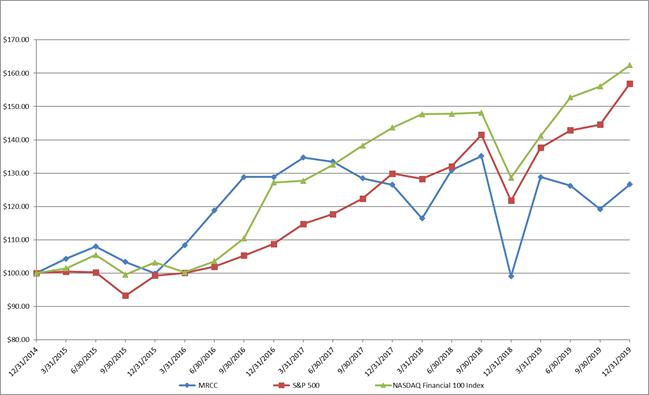
| 45 |
ITEM 6. SELECTED CONSOLIDATED FINANCIAL DATA
The following selected consolidated financial data of the Company are derived from our consolidated financial statements that have been audited by RSM US LLP (“RSM”), our independent registered public accounting firm. This consolidated financial data should be read in conjunction with our consolidated financial statements and related notes thereto included elsewhere in this Annual Report on Form 10-K and with Management’s Discussion and Analysis of Financial Condition and Results of Operations which follows (dollars in thousands, except per share data):
| As of and for the years ended December 31, | ||||||||||||||||||||
| 2019 | 2018 | 2017 | 2016 | 2015 | ||||||||||||||||
| Consolidated statements of operations data: | ||||||||||||||||||||
| Total investment income | $ | 68,193 | $ | 58,384 | $ | 51,107 | $ | 45,018 | $ | 36,898 | ||||||||||
| Base management fees | 10,780 | 8,879 | 7,726 | 6,347 | 5,129 | |||||||||||||||
| Incentive fees, net of incentive fee waiver (1) | 4,429 | 1,751 | 5,378 | 5,504 | 4,685 | |||||||||||||||
| All other expenses | 23,933 | 15,843 | 11,899 | 9,982 | 8,260 | |||||||||||||||
| Net investment income before income taxes | 29,051 | 31,911 | 26,104 | 23,185 | 18,824 | |||||||||||||||
| Income taxes, including excise taxes | 17 | 11 | 100 | 679 | 83 | |||||||||||||||
| Net investment income | 29,034 | 31,900 | 26,004 | 22,506 | 18,741 | |||||||||||||||
| Net realized gain (loss) | (925 | ) | (30,030 | ) | (372 | ) | 587 | 304 | ||||||||||||
| Net change in unrealized gain (loss) | (8,895 | ) | 3,978 | (13,480 | ) | 1,272 | (1,153 | ) | ||||||||||||
| Net increase (decrease) in net assets resulting from operations | $ | 19,214 | $ | 5,848 | $ | 12,152 | $ | 24,365 | $ | 17,892 | ||||||||||
| Per share data (basic and diluted): | ||||||||||||||||||||
| Net asset value | $ | 12.20 | $ | 12.66 | $ | 13.77 | $ | 14.52 | $ | 14.19 | ||||||||||
| Net investment income | 1.42 | 1.57 | 1.40 | 1.55 | 1.60 | |||||||||||||||
| Net realized gain (loss) | (0.05 | ) | (1.48 | ) | (0.03 | ) | 0.04 | 0.03 | ||||||||||||
| Net change in unrealized gain (loss) | (0.43 | ) | 0.20 | (0.72 | ) | 0.09 | (0.10 | ) | ||||||||||||
| Net increase (decrease) in net assets resulting from operations | $ | 0.94 | $ | 0.29 | $ | 0.65 | $ | 1.68 | $ | 1.53 | ||||||||||
| Distributions declared: | ||||||||||||||||||||
| From net investment income | $ | 1.40 | $ | 1.40 | $ | 1.37 | $ | 1.40 | $ | 1.37 | ||||||||||
| From capital gains | — | — | 0.03 | — | 0.03 | |||||||||||||||
| Total distributions declared | $ | 1.40 | $ | 1.40 | $ | 1.40 | $ | 1.40 | $ | 1.40 | ||||||||||
| Consolidated statements of assets and liabilities data at year end: | ||||||||||||||||||||
| Investments, at fair value | $ | 616,231 | $ | 553,621 | $ | 494,138 | $ | 412,920 | $ | 341,091 | ||||||||||
| Cash | 2,234 | 3,744 | 4,332 | 5,958 | 5,278 | |||||||||||||||
| Restricted cash | 27,409 | 13,982 | 2,867 | 2,373 | 8,588 | |||||||||||||||
| Other assets | 9,184 | 8,482 | 6,095 | 3,294 | 2,353 | (2) | ||||||||||||||
| Total assets | 655,058 | 579,829 | 507,432 | 424,545 | 357,310 | (2) | ||||||||||||||
| Total debt, less unamortized deferred financing costs | 396,241 | 313,764 | 221,942 | 177,869 | 162,607 | (2) | ||||||||||||||
| Other liabilities | 9,460 | 7,298 | 6,791 | 5,826 | 10,168 | (2) | ||||||||||||||
| Total liabilities | 405,701 | 321,062 | 228,733 | 183,695 | 172,775 | (2) | ||||||||||||||
| Total net assets | $ | 249,357 | $ | 258,767 | $ | 278,699 | $ | 240,850 | $ | 184,535 | ||||||||||
| Other data: | ||||||||||||||||||||
| Total return based on market value (3) | 27.7 | % | (21.7 | )% | (1.8 | )% | 29.0 | % | (0.2 | )% | ||||||||||
| Total return based on average net asset value (4) | 7.5 | % | 2.2 | % | 4.6 | % | 11.7 | % | 11.0 | % | ||||||||||
| Weighted average annualized effective yield at year end (5) | 8.9 | % | 10.0 | % | 10.0 | % | 9.6 | % | 10.6 | % | ||||||||||
| Number of portfolio company investments at year end | 81 | 74 | 72 | 70 | 55 | |||||||||||||||
| Purchases of investments for the year | $ | 230,605 | $ | 240,420 | $ | 264,393 | $ | 147,780 | $ | 193,631 | ||||||||||
| Principal payments, sales of investments and settlement of forward contracts for the year | $ | 166,092 | $ | 159,161 | $ | 173,446 | $ | 81,446 | $ | 88,379 | ||||||||||
| (1) | During the years ended December 31, 2019, 2018, 2017, 2016 and 2015, MC Advisors waived part one incentive fees (based on net investment income) of $1,182, zero, $308, $273 and zero, respectively. | |
| (2) | In April 2015, the Financial Accounting Standards Board issued Accounting Standards Update (“ASU”) 2015-03, Interest — Imputation of Interest (Subtopic 835-30): Simplifying the Presentation of Debt Issuance Costs (“ASU 2015-03”). ASU 2015-03 requires that debt issuance costs related to a recognized debt liability be presented in the statements of assets and liabilities as a direct deduction from the carrying amount of that debt liability, consistent with debt discounts. We adopted ASU 2015-03 during the year ended December 31, 2016 and the consolidated statements of assets and liabilities for prior years were also revised to reflect this presentation. |
| (3) | Total return based on market value is calculated assuming a purchase of common shares at the market value on the first day and a sale at the market value on the last day of the periods reported. Distributions, if any, are assumed for purposes of this calculation to be reinvested at prices obtained under our dividend reinvestment plan (“DRIP”). Total return based on market value does not reflect brokerage commissions. | |
| (4) | Total return based on average net asset value is calculated by dividing the net increase (decrease) in net assets from operations by the average net asset value. | |
| (5) | The weighted average annualized effective yield on portfolio investments at year end is computed by dividing (a) interest income on debt investments and preferred equity investments (with a stated coupon rate) at the period end effective rate for each investment by (b) the par value of our debt investments (excluding debt investments on non-accrual status acquired for no cost in a restructuring) and the cost basis of our preferred equity investments. We exclude loans acquired for no cost in a restructuring on non-accrual status within this metric as management believes this disclosure provides a better indication of return on invested capital. The weighted average effective yield including debt investments acquired for no cost in a restructuring on non-accrual status was 8.7%, 9.8%, 10.0%, 9.6% and 10.6% as of December 31, 2019, 2018, 2017, 2016 and 2015, respectively. The weighted average annualized effective yield on portfolio investments is a metric on the investment portfolio alone and does not represent a return to stockholders. This metric is not inclusive of our fees and expenses, the impact of leverage on the portfolio or sales load that may be paid by investors. |
| 46 |
ITEM 7. MANAGEMENT’S DISCUSSION AND ANALYSIS OF FINANCIAL CONDITION AND RESULTS OF OPERATIONS
The following discussion should be read in conjunction with our audited consolidated financial statements and related notes and other financial information appearing elsewhere in this Annual Report on Form 10-K. In addition to historical information, the following discussion and other parts of this Annual Report on Form 10-K contain forward-looking information that involves risks and uncertainties.
Please see “Risk Factors” and “Special Note Regarding Forward-Looking Statements” for a discussion of the uncertainties, risks and assumptions associated with these statements.
Overview
Monroe Capital Corporation is an externally managed, closed-end, non-diversified management investment company that has elected to be regulated as a business development company (“BDC”) under the Investment Company Act of 1940, as amended (the “1940 Act”). In addition, for U.S. federal income tax purposes, we have elected to be treated as a regulated investment company (“RIC”) under the subchapter M of the Internal Revenue Code of 1986, as amended (the “Code”). We are a specialty finance company focused on providing financing solutions primarily to lower middle-market companies in the United States and Canada. We provide customized financing solutions focused primarily on senior secured, junior secured and unitranche secured (a combination of senior secured and junior secured debt in the same facility in which we syndicate a “first out” portion of the loan to an investor and retain a “last out” portion of the loan) debt and, to a lesser extent, unsecured subordinated debt and equity, including equity co-investments in preferred and common stock, and warrants.
Our shares are currently listed on the NASDAQ Global Select Market under the symbol “MRCC”.
Our investment objective is to maximize the total return to our stockholders in the form of current income and capital appreciation through investment in senior secured, unitranche secured and junior secured debt and, to a lesser extent, subordinated debt and equity investments. We seek to use our extensive leveraged finance origination infrastructure and broad expertise in sourcing loans to invest in primarily senior secured, unitranche secured and junior secured debt of middle-market companies. Our investments will generally range between $2.0 million and $18.0 million each, although this investment size may vary proportionately with the size of our capital base. As of December 31, 2019, our portfolio included approximately 77.1% senior secured debt, 12.4% unitranche secured debt, 2.2% junior secured debt and 8.3% equity securities, compared to December 31, 2018, when our portfolio included approximately 79.3% senior secured debt, 10.6% unitranche secured debt, 3.8% junior secured debt and 6.3% equity securities. We expect that the companies in which we invest may be leveraged, often as a result of leveraged buy-outs or other recapitalization transactions, and, in certain cases, will not be rated by national ratings agencies. If such companies were rated, we believe that they would typically receive a rating below investment grade (between BB and CCC under the Standard & Poor’s system) from the national rating agencies.
While our primary focus is to maximize current income and capital appreciation through debt investments in thinly traded or private U.S. companies, we may invest a portion of the portfolio in opportunistic investments in order to seek to enhance returns to stockholders. Such investments may include investments in high-yield bonds, distressed debt, private equity or securities of public companies that are not thinly traded and securities of middle-market companies located outside of the United States. We expect that these public companies generally will have debt securities that are non-investment grade.
On February 28, 2014, our wholly-owned subsidiary, Monroe Capital Corporation SBIC, LP (“MRCC SBIC”), a Delaware limited partnership, received a license from the Small Business Administration (“SBA”) to operate as a Small Business Investment Company (“SBIC”) under Section 301(c) of the Small Business Investment Act of 1958. MRCC SBIC commenced operations on September 16, 2013. See “SBA Debentures” below for more information.
On September 12, 2018, we closed a public offering of $69.0 million in aggregate principal amount of senior unsecured notes (“2023 Notes”). On March 20, 2019, we completed a registered direct offering of $40.0 million in additional aggregate principal amount of our 2023 Notes. See “2023 Notes” below for more information.
Investment income
We generate interest income on the debt investments in portfolio company investments that we originate or acquire. Our debt investments, whether in the form of senior secured, unitranche secured or junior secured debt, typically have an initial term of three to seven years and bear interest at a fixed or floating rate. In some instances, we receive payments on our debt investment based on scheduled amortization of the outstanding balances. In addition, we receive repayments of some of our debt investments prior to their scheduled maturity date. In some cases, our investments provide for deferred interest of payment-in-kind (“PIK”) interest. In addition, we may generate revenue in the form of commitment, origination, amendment, structuring or due diligence fees, fees for providing managerial assistance and consulting fees. Loan origination fees, original issue discount and market discount or premium are capitalized, and we accrete or amortize such amounts as interest income. We record prepayment premiums and prepayment gains (losses) on loans as interest income. As the frequency or volume of the repayments which trigger these prepayment premiums and prepayment gains (losses) may fluctuate significantly from period to period, the associated interest income recorded may also fluctuate significantly from period to period. Interest and fee income is recorded on the accrual basis to the extent we expect to collect such amounts. Interest income is accrued based upon the outstanding principal amount and contractual terms of debt and preferred equity investments. Interest is accrued on a daily basis. We record fees on loans based on the determination of whether the fee is considered a yield enhancement or payment for a service. If the fee is considered a yield enhancement associated with a funding of cash on a loan, the fee is generally deferred and recognized into interest income using the effective interest method if captured in the cost basis or using the straight-line method if the loan is unfunded and therefore there is no cost basis. If the fee is not considered a yield enhancement because a service was provided, and the fee is payment for that service, the fee is deemed earned and recognized as fee income in the period the service has been completed.
Dividend income on preferred equity securities is recorded as dividend income on an accrual basis to the extent that such amounts are payable by the portfolio company and are expected to be collected. Dividend income on common equity securities is recorded on the record date for private portfolio companies. Each distribution received from limited liability company (“LLC”) and limited partnership (“LP”) investments is evaluated to determine if the distribution should be recorded as dividend income or a return of capital. Generally, we will not record distributions from equity investments in LLCs and LPs as dividend income unless there are sufficient accumulated tax-basis earnings and profits in the LLC or LP prior to the distribution. Distributions that are classified as a return of capital are recorded as a reduction in the cost basis of the investment. The frequency and volume of the distributions on common equity securities and LLC and LP investments may fluctuate significantly from period to period.
| 47 |
Expenses
Our primary operating expenses include the payment of base management and incentive fees to MC Advisors, under the investment advisory and management agreement (the “Investment Advisory Agreement”), the payment of fees to MC Management for our allocable portion of overhead and other expenses under the administration agreement (the “Administration Agreement”) and other operating costs. See Note 6 to our consolidated financial statements and “Related Party Transactions” below for additional information on our Investment Advisory Agreement and Administration Agreement. Our expenses also include interest expense on our various forms of indebtedness. We bear all other out-of-pocket costs and expenses of our operations and transactions.
Net gain (loss)
We recognize realized gains or losses on investments based on the difference between the net proceeds from the disposition and the cost basis of the investment without regard to unrealized gains or losses previously recognized. We record current period changes in fair value of investments, foreign currency forward contracts, secured borrowings, foreign currency and other transactions within net change in unrealized gain (loss) on the consolidated statements of operations.
Portfolio and Investment Activity
During the year ended December 31, 2019, we invested $98.6 million in 18 new portfolio companies and $132.0 million in 33 existing portfolio companies and had $166.1 million in aggregate amount of sales and principal repayments, resulting in net investments of $64.5 million for the year.
During the year ended December 31, 2018, we invested $112.4 million in 20 new portfolio companies and $128.0 million in 31 existing portfolio companies and had $159.2 million in aggregate amount of sales and principal repayments, resulting in net investments of $81.2 million for the year.
During the year ended December 31, 2017, we invested $200.4 million in 27 new portfolio companies and $64.0 million in 31 existing portfolio companies and had $173.4 million in aggregate amount of sales and principal repayments, resulting in net investments of $91.0 million for the year.
The following table shows portfolio yield by security type:
| December 31, 2019 | December 31, 2018 | |||||||||||||||
| Weighted Average Annualized Contractual Coupon Yield (1) |
Weighted Average Annualized Effective Yield (2) |
Weighted Average Annualized Contractual Coupon Yield (1) |
Weighted Average Annualized Effective Yield (2) |
|||||||||||||
| Senior secured loans | 8.9 | % | 8.9 | % | 10.2 | % | 10.2 | % | ||||||||
| Unitranche secured loans | 9.3 | 9.8 | 10.3 | 10.8 | ||||||||||||
| Junior secured loans | 9.1 | 9.1 | 9.0 | 9.0 | ||||||||||||
| Preferred equity securities | 0.5 | 0.5 | 0.5 | 0.5 | ||||||||||||
| Total | 8.8 | % | 8.9 | % | 10.0 | % | 10.0 | % | ||||||||
| (1) | The weighted average annualized contractual coupon yield at period end is computed by dividing (a) the interest income on debt investments and preferred equity investments (with a stated coupon rate) at the period end contractual coupon rate for each investment by (b) the par value of our debt investments (excluding debt investments acquired for no cost in a restructuring on non-accrual status) and the cost basis of our preferred equity investments. We exclude loans acquired for no cost in a restructuring on non-accrual status within this metric as management believes this disclosure provides a better indication of return on invested capital. This exclusion impacts only the junior secured loans and total disclosed above. The weighted average contractual coupon yield including debt investments acquired for no cost in a restructuring on non-accrual status was 4.8% for junior secured loans and 8.6% in total as of December 31, 2019. The weighted average contractual coupon yield including debt investments acquired for no cost in a restructuring on non-accrual status was 5.6% for junior secured loans and 9.8% in total as of December 31, 2018. | |
| (2) | The weighted average annualized effective yield on portfolio investments at period end is computed by dividing (a) interest income on debt investments and preferred equity investments (with a stated coupon rate) at the period end effective rate for each investment by (b) the par value of our debt investments (excluding debt investments acquired for no cost in a restructuring on non-accrual status) and the cost basis of our preferred equity investments. We exclude loans acquired for no cost in a restructuring on non-accrual status within this metric as management believes this disclosure provides a better indication of return on invested capital. This exclusion impacts only the junior secured loans and total disclosed above. The weighted average effective yield including debt investments acquired for no cost in a restructuring on non-accrual status was 4.8% for junior secured loans and 8.7% in total as of December 31, 2019. The weighted average effective yield including debt investments acquired for no cost in a restructuring on non-accrual status was 5.6% for junior secured loans and 9.8% in total as of December 31, 2018. The weighted average annualized effective yield on portfolio investments is a metric on the investment portfolio alone and does not represent a return to stockholders. This metric is not inclusive of our fees and expenses, the impact of leverage on the portfolio or sales load that may be paid by investors. |
The following table shows the composition of our investment portfolio (in thousands):
| December 31, 2019 | December 31, 2018 | |||||||||||||||
| Fair Value: | ||||||||||||||||
| Senior secured loans | $ | 475,157 | 77.1 | % | $ | 439,068 | 79.3 | % | ||||||||
| Unitranche secured loans | 76,247 | 12.4 | 58,852 | 10.6 | ||||||||||||
| Junior secured loans | 13,676 | 2.2 | 21,154 | 3.8 | ||||||||||||
| LLC equity interest in SLF | 42,412 | 6.9 | 27,634 | 5.0 | ||||||||||||
| Equity securities | 8,739 | 1.4 | 6,913 | 1.3 | ||||||||||||
| Total | $ | 616,231 | 100.0 | % | $ | 553,621 | 100.0 | % | ||||||||
| 48 |
Our portfolio composition remained relatively consistent with December 31, 2018, with the largest shifts in portfolio composition resulting from the funding of senior secured loans and the additional investments made in SLF during the year ended December 31, 2019. The decrease in total contractual and effective yields on the portfolio was primarily attributed to general decreases in LIBOR and moving three additional portfolio companies to non-accrual status.
The following table shows the portfolio composition by industry (in thousands):
| December 31, 2019 | December 31, 2018 | |||||||||||||||
| Fair Value: | ||||||||||||||||
| Automotive | $ | 7,787 | 1.3 | % | $ | 7,878 | 1.4 | % | ||||||||
| Banking, Finance, Insurance & Real Estate | 76,351 | 12.4 | 55,839 | 10.1 | ||||||||||||
| Beverage, Food & Tobacco | 15,634 | 2.5 | 15,544 | 2.8 | ||||||||||||
| Chemicals, Plastics & Rubber | 29,509 | 4.8 | 14,971 | 2.7 | ||||||||||||
| Construction & Building | 30,887 | 5.0 | 29,791 | 5.4 | ||||||||||||
| Consumer Goods: Durable | 21,237 | 3.4 | 25,212 | 4.5 | ||||||||||||
| Consumer Goods: Non-Durable | 20,365 | 3.3 | 19,181 | 3.5 | ||||||||||||
| Containers, Packaging & Glass | 8,377 | 1.4 | 9,694 | 1.8 | ||||||||||||
| Energy: Oil & Gas | 4,306 | 0.7 | 2,516 | 0.4 | ||||||||||||
| Environmental Industries | 12,001 | 1.9 | 12,195 | 2.2 | ||||||||||||
| Healthcare & Pharmaceuticals | 62,727 | 10.2 | 52,769 | 9.5 | ||||||||||||
| High Tech Industries | 90,385 | 14.7 | 77,954 | 14.1 | ||||||||||||
| Hotels, Gaming & Leisure | — | — | 20,264 | 3.7 | ||||||||||||
| Investment Funds & Vehicles | 42,412 | 6.9 | 27,634 | 5.0 | ||||||||||||
| Media: Advertising, Printing & Publishing | 26,333 | 4.3 | 21,908 | 4.0 | ||||||||||||
| Media: Broadcasting & Subscription | 1,491 | 0.2 | 4,483 | 0.8 | ||||||||||||
| Media: Diversified & Production | 10,652 | 1.7 | 5,000 | 0.9 | ||||||||||||
| Retail | 16,998 | 2.8 | 31,866 | 5.8 | ||||||||||||
| Services: Business | 108,704 | 17.6 | 73,336 | 13.2 | ||||||||||||
| Services: Consumer | 22,051 | 3.6 | 17,846 | 3.2 | ||||||||||||
| Wholesale | 8,024 | 1.3 | 27,740 | 5.0 | ||||||||||||
| Total | $ | 616,231 | 100.0 | % | $ | 553,621 | 100.0 | % | ||||||||
Portfolio Asset Quality
MC Advisors’ portfolio management staff closely monitors all credits, with senior portfolio managers covering agented and more complex investments. MC Advisors segregates our capital markets investments by industry. The MC Advisors’ monitoring process and projections developed by Monroe Capital both have daily, weekly, monthly and quarterly components and related reports, each to evaluate performance against historical, budget and underwriting expectations. MC Advisors’ analysts will monitor performance using standard industry software tools to provide consistent disclosure of performance. When necessary, MC Advisors will update our internal risk ratings, borrowing base criteria and covenant compliance reports.
As part of the monitoring process, MC Advisors regularly assesses the risk profile of each of our investments and rates each of them based on an internal proprietary system that uses the categories listed below, which we refer to as MC Advisors’ investment performance rating. For any investment rated in grades 3, 4 or 5, MC Advisors, through its internal Portfolio Management Group (“PMG”), will increase its monitoring intensity and prepare regular updates for the investment committee, summarizing current operating results and material impending events and suggesting recommended actions. The PMG is responsible for oversight and management of any investments rated in grades 3, 4, or 5. MC Advisors monitors and, when appropriate, changes the investment ratings assigned to each investment in our portfolio. In connection with our valuation process, MC Advisors reviews these investment ratings on a quarterly basis. The investment performance rating system is described as follows:
| Investment Performance Risk Rating |
Summary Description | |
| Grade 1 | Includes investments exhibiting the least amount of risk in our portfolio. The issuer is performing above expectations or the issuer’s operating trends and risk factors are generally positive. | |
| Grade 2 | Includes investments exhibiting an acceptable level of risk that is similar to the risk at the time of origination. The issuer is generally performing as expected or the risk factors are neutral to positive. | |
| Grade 3 | Includes investments performing below expectations and indicates that the investment’s risk has increased somewhat since origination. The issuer may be out of compliance with debt covenants; however, scheduled loan payments are generally not past due. | |
| Grade 4 | Includes an issuer performing materially below expectations and indicates that the issuer’s risk has increased materially since origination. In addition to the issuer being generally out of compliance with debt covenants, scheduled loan payments may be past due (but generally not more than six months past due). | |
| Grade 5 | Indicates that the issuer is performing substantially below expectations and the investment risk has substantially increased since origination. Most or all of the debt covenants are out of compliance or payments are substantially delinquent. Investments graded 5 are not anticipated to be repaid in full. |
| 49 |
Our investment performance risk ratings do not constitute any rating of investments by a nationally recognized statistical rating organization or reflect or represent any third-party assessment of any of our investments.
In the event of a delinquency or a decision to rate an investment grade 4 or grade 5, the PMG, in consultation with the investment committee, will develop an action plan. Such a plan may require a meeting with the borrower’s management or the lender group to discuss reasons for the default and the steps management is undertaking to address the under-performance, as well as amendments and waivers that may be required. In the event of a dramatic deterioration of a credit, MC Advisors and the PMG will form a team or engage outside advisors to analyze, evaluate and take further steps to preserve our value in the credit. In this regard, we would expect to explore all options, including in a private equity sponsored investment, assuming certain responsibilities for the private equity sponsor or a formal sale of the business with oversight of the sale process by us. The PMG and the investment committee have extensive experience in running debt work-out transactions and bankruptcies.
The following table shows the distribution of our investments on the 1 to 5 investment performance risk rating scale as of December 31, 2019 (in thousands):
| Investment Performance Risk Rating | Investments at Fair Value |
Percentage of Total Investments |
||||||
| 1 | $ | — | — | % | ||||
| 2 | 517,597 | 84.0 | ||||||
| 3 | 83,701 | 13.6 | ||||||
| 4 | 13,899 | 2.2 | ||||||
| 5 | 1,034 | 0.2 | ||||||
| Total | $ | 616,231 | 100.0 | % | ||||
The following table shows the distribution of our investments on the 1 to 5 investment performance risk rating scale as of December 31, 2018 (in thousands):
| Investment Performance Risk Rating |
Investments at Fair Value |
Percentage of Total Investments |
||||||
| 1 | $ | — | — | % | ||||
| 2 | 452,549 | 81.8 | ||||||
| 3 | 57,741 | 10.4 | ||||||
| 4 | 43,331 | 7.8 | ||||||
| 5 | — | — | ||||||
| Total | $ | 553,621 | 100.0 | % | ||||
As of December 31, 2019, we had six borrowers with loans or preferred equity securities on non-accrual status (Curion Holdings, LLC (“Curion”), Education Corporation of America (“ECA”), Incipio, LLC (“Incipio”) third lien tranches, Luxury Optical Holdings Co., Rockdale Blackhawk, LLC (“Rockdale”) pre-petition debt, and The Worth Collection, Ltd. (“Worth”)), and these investments totaled $34.1 million in fair value, or 5.5% of our total investments at fair value. As of December 31, 2018, we had five borrowers with loans or preferred equity securities on non-accrual status (Curion promissory notes, ECA, Incipio third lien tranches, Millennial Brands, LLC (“Millennial”), and Rockdale pre-petition debt), and these investments totaled $16.8 million in fair value, or 3.0% of our total investments at fair value. The Curion promissory notes and the Incipio third lien tranches were obtained in restructurings during the year ended December 31, 2018 for no cost. Loans or preferred equity securities are placed on non-accrual status when principal, interest or dividend payments become materially past due, or when there is reasonable doubt that principal, interest or dividends will be collected.
Results of Operations
Operating results were as follows (in thousands):
| For the years ended December 31, | ||||||||||||
| 2019 | 2018 | 2017 | ||||||||||
| Total investment income | $ | 68,193 | $ | 58,384 | $ | 51,107 | ||||||
| Total expenses, net of incentive fee waiver | 39,142 | 26,473 | 25,003 | |||||||||
| Net investment income before income taxes | 29,051 | 31,911 | 26,104 | |||||||||
| Income taxes, including excise taxes | 17 | 11 | 100 | |||||||||
| Net investment income | 29,034 | 31,900 | 26,004 | |||||||||
| Net realized gain (loss) on investments | (933 | ) | (30,014 | ) | (439 | ) | ||||||
| Net realized gain (loss) on secured borrowings | — | — | 66 | |||||||||
| Net realized gain (loss) on foreign currency forward contracts | 12 | (3 | ) | — | ||||||||
| Net realized gain (loss) on foreign currency and other transactions | (4 | ) | (13 | ) | 1 | |||||||
| Net realized gain (loss) | (925 | ) | (30,030 | ) | (372 | ) | ||||||
| Net change in unrealized gain (loss) on investments | (8,002 | ) | 2,939 | (13,120 | ) | |||||||
| Net change in unrealized gain (loss) on secured borrowings | — | — | (6 | ) | ||||||||
| Net change in unrealized gain (loss) on foreign currency forward contracts | (75 | ) | 16 | — | ||||||||
| Net change in unrealized gain (loss) on foreign currency and other transactions | (818 | ) | 1,023 | (354 | ) | |||||||
| Net change in unrealized gain (loss) | (8,895 | ) | 3,978 | (13,480 | ) | |||||||
| Net increase (decrease) in net assets resulting from operations | $ | 19,214 | $ | 5,848 | $ | 12,152 | ||||||
| 50 |
Investment Income
The composition of our investment income was as follows (in thousands):
| For the years ended December 31, | ||||||||||||
| 2019 | 2018 | 2017 | ||||||||||
| Interest income | $ | 54,254 | $ | 48,195 | $ | 42,836 | ||||||
| PIK interest income | 5,538 | 2,247 | 1,729 | |||||||||
| Dividend income (1) | 4,110 | 2,567 | 1,002 | |||||||||
| Fee income | 1,926 | 2,024 | 1,890 | |||||||||
| Prepayment gain (loss) | 883 | 1,088 | 1,790 | |||||||||
| Accretion of discounts and amortization of premium | 1,482 | 2,263 | 1,860 | |||||||||
| Total investment income | $ | 68,193 | $ | 58,384 | $ | 51,107 | ||||||
| (1) | During the years ended December 31, 2019, 2018 and 2017, includes PIK dividends of $54, $819 and $241, respectively. |
The increase in investment income of $9.8 million during the year ended December 31, 2019 is primarily the result of an increase in interest income (including PIK interest income) due to an increase in average outstanding loan balances (tempered by a decline in the weighted average portfolio yield) and an increase in dividend income from our investment in SLF, partially offset by a decline in the weighted average portfolio yield and a decrease in accretion of discounts and amortization of premium. The increase in investment income of $7.3 million during the year ended December 31, 2018 is primarily due to an increase in average outstanding loan balances and an increase in dividend income due to our investment in SLF, partially offset by a decrease in prepayment gain (loss).
Operating Expenses
The composition of our operating expenses was as follows (in thousands):
| For the years ended December 31, | ||||||||||||
| 2019 | 2018 | 2017 | ||||||||||
| Interest and other debt financing expenses | $ | 20,268 | $ | 12,270 | $ | 8,312 | ||||||
| Base management fees | 10,780 | 8,879 | 7,726 | |||||||||
| Incentive fees, net of incentive fee waiver (1) | 4,429 | 1,751 | 5,378 | |||||||||
| Professional fees | 1,209 | 1,172 | 1,243 | |||||||||
| Administrative service fees | 1,309 | 1,327 | 1,248 | |||||||||
| General and administrative expenses | 991 | 931 | 948 | |||||||||
| Directors’ fees | 156 | 143 | 148 | |||||||||
| Total expenses, net of incentive fee waiver | $ | 39,142 | $ | 26,473 | $ | 25,003 | ||||||
| (1) | During the years ended December 31, 2019, 2018 and 2017, MC Advisors waived part one incentive fees (based on net investment income) of $1.2 million, zero and $0.3 million, respectively. Incentive fees during the years ended December 31, 2019, 2018 and 2017 were limited by $1.1 million, $4.9 million and $0.4 million due to the Incentive Fee Limitation, respectively. See Note 6 in our attached consolidated financial statements for additional information on the Incentive Fee Limitation. |
The composition of our interest and other debt financing expenses, average outstanding balances and average stated interest rates (i.e. the rate in effect plus spread) were as follows (in thousands):
| For the years ended December 31, | ||||||||||||
| 2019 | 2018 | 2017 | ||||||||||
| Interest expense – revolving credit facility | $ | 8,710 | $ | 5,845 | $ | 4,771 | ||||||
| Interest expense – 2023 Notes | 5,756 | 1,201 | — | |||||||||
| Interest expense – SBA debentures | 3,933 | 3,814 | 2,434 | |||||||||
| Amortization of deferred financing costs | 1,869 | 1,410 | 1,042 | |||||||||
| Interest expense – secured borrowings | — | — | 34 | |||||||||
| Other | — | — | 31 | |||||||||
| Total interest and other debt financing expenses | $ | 20,268 | $ | 12,270 | $ | 8,312 | ||||||
| Average outstanding balance | 397,503 | 243,929 | 179,500 | |||||||||
| Average stated interest rate | 4.5 | % | 4.4 | % | 4.0 | % | ||||||
The increase in expenses of $12.7 million during the year ended December 31, 2019 is primarily due to an increase in interest expense as a result of additional borrowings on our various financing sources (primarily the 2023 Notes and revolving credit facility) to support the larger average portfolio size, an increase in base management fees due to the growth in invested assets, and an increase in incentive fees primarily due to the larger Incentive Fee Limitation during the year ended December 31, 2018. The increase in expenses of $1.4 million during the year ended December 31, 2018 is primarily due to an increase in interest expense as a result of additional borrowings on our various financing sources (including the SBA debentures, 2023 Notes, and revolving credit facility) required to support the growth of the portfolio and an increase in base management fees due to the growth in invested assets. These increases were partially offset by a decrease in incentive fees due to the Incentive Fee Limitation.
Income Taxes, Including Excise Taxes
We have elected to be treated as a RIC under Subchapter M of the Code and operate in a manner so as to qualify for the tax treatment available to RICs. To maintain qualification as a RIC, we must, among other things, meet certain source-of-income and asset diversification requirements and distribute to stockholders, for each taxable year, at least 90% of our “investment company taxable income”, which is generally our net ordinary income plus the excess, if any, of realized net short-term capital gains over realized net long-term capital losses.
| 51 |
Depending on the level of taxable income earned in a tax year, we may choose to carry forward such taxable income in excess of current year dividend distributions from such current year taxable income into the next year and pay a 4% excise tax on such income, as required. To the extent that we determine that our estimated current year annual taxable income may exceed estimated current year dividend distributions, we accrue excise tax, if any, on estimated excess taxable income as such taxable income is earned. For the years ended December 31, 2019, 2018 and 2017, we recorded a net expense on the consolidated statements of operations of $10 thousand, $11 thousand, and $0.1 million, respectively, for U.S. federal excise tax.
Certain of our consolidated subsidiaries are subject to U.S. federal and state corporate-level income taxes. For the years ended December 31, 2019, 2018 and 2017, we recorded a net tax expense on the consolidated statements of operations of $7 thousand, zero and zero, respectively, for these subsidiaries.
Net Realized Gain (Loss)
During the years ended December 31, 2019, 2018 and 2017, we had sales or dispositions of investments of $1.7 million, $14.0 million and $16.9 million, respectively, resulting in ($0.9) million, ($30.0) million and ($0.4) million of net realized gain (loss), respectively. During 2019, we realized our loss on the equity for Millennial and Playtime, LLC, which were previously written down to zero. This was partially offset by $0.2 million of additional cash received from the sale of Fabco Automotive Corporation.
During the years ended December 31, 2019, 2018 and 2017, we had sales of secured borrowings of zero, zero and $1.3 million resulting in zero, zero and $66 thousand of net realized gain (loss), respectively.
We may enter into foreign currency forward contracts to reduce our exposure to foreign currency exchange rate fluctuations. During the years ended December 31, 2019, 2018 and 2017, we had $12 thousand, ($3) thousand and zero of net realized gain (loss) on foreign currency forward contracts, respectively. During the years ended December 31, 2019, 2018 and 2017, we had ($4) thousand, ($13) thousand and $1 thousand of net realized gain (loss) on foreign currency and other transactions, respectively.
Net Change in Unrealized Gain (Loss)
For the years ended December 31, 2019, 2018 and 2017, our investments had ($8.0) million, $2.9 million and ($13.1) million of net change in unrealized gain (loss), respectively. The net change in unrealized gain (loss) includes both unrealized gain on investments in our portfolio with mark-to-market gains during the year and unrealized loss on investments in our portfolio with mark-to-market losses during the year. The net change in unrealized gain (loss) during the year ended December 31, 2019 was primarily attributable to mark-to-market losses on our portfolio, including most significantly unrealized losses on our investment in Worth of ($7.4) million. This was partially offset by mark-to-market gains on our investment in Rockdale of $11.8 million. In January 2020, an arbitrator issued an interim award in favor of the estate of Rockdale in the pending legal proceeding between the estate of Rockdale and a national insurance carrier. The award was issued as “interim” due to the fact that the arbitrator will hear further briefing from both parties as to an allocation of attorneys’ fees, interest and certain other amounts that should be paid to Rockdale in connection with the interim award. As such, the exact computation of the final amount of the award has yet to be determined and is uncertain, but is expected to resolve over the next few quarters. At this time, we believe that our share of the net proceeds from the award will exceed the cost basis of our investment due to our right to receive excess proceeds pursuant to the terms of a sharing agreement between the lenders and the estate; however, due to the aforementioned post-trial arbitration proceedings, it is not certain that will be the case. The lenders to Rockdale, including the Company, will share in the proceeds of this arbitration award with the estate, once it becomes final and is paid. At this time, it is also unclear whether, or to what extent, the national insurance carrier may seek to appeal the adverse ruling against it. We believe that any such appeal is unlikely to be successful based on the appellate standard for arbitration.
For the years ended December 31, 2019, 2018 and 2017, our secured borrowings had zero, zero and ($6) thousand of net change in unrealized gain (loss), respectively. For the years ended December 31, 2019, 2018 and 2017, our foreign currency forward contracts had ($75) thousand, $16 thousand, and zero of net change in unrealized gain (loss), respectively. For the years ended December 31, 2019, 2018 and 2017, our foreign currency borrowings had ($0.8) million, $1.0 million and ($0.4) million of net change in unrealized gain (loss), respectively.
Net Increase (Decrease) in Net Assets Resulting from Operations
For the years ended December 31, 2019, 2018 and 2017, the net increase (decrease) in net assets from operations was $19.2 million, $5.8 million and $12.2 million, respectively. Based on the weighted average shares of common stock outstanding for the years ended December 31, 2019, 2018 and 2017, our per share net increase (decrease) in net assets resulting from operations was $0.94, $0.29 and $0.65, respectively. The $13.4 million increase during the year ended December 31, 2019, is primarily the result of a comparative decrease in net mark-to-market losses on investments in the portfolio, partially offset by a decrease in net investment income. The $6.4 million decrease during the year ended December 31, 2018, is primarily the result of an increase in net losses on investments in the portfolio, partially offset by an increase in net investment income primarily due to portfolio growth and the Incentive Fee Limitation.
Liquidity and Capital Resources
As of December 31, 2019, we had $2.2 million in cash, $27.4 million in cash at MRCC SBIC, $180.3 million of total debt outstanding on our revolving credit facility, $109.0 million in 2023 Notes and $115.0 million in outstanding SBA debentures. We had $74.7 million available for additional borrowings on our revolving credit facility. See “Borrowings” below for additional information.
Cash Flows
For the year ended December 31, 2019, we experienced a net increase (decrease) in cash and restricted cash of $11.9 million. During the same period we used $39.2 million in operating activities, primarily as a result of purchases of portfolio investments, partially offset by sales of and principal repayments on portfolio investments. During the same period, we generated $51.2 million from financing activities, primarily as a result of net proceeds from our 2023 Notes (net of deferred financing cost payments) and net borrowings on our revolving credit facility and 2023 Notes, partially offset by distributions to stockholders.
For the year ended December 31, 2018, we experienced a net increase (decrease) in cash and restricted cash of $10.5 million. During the same period we used $55.1 million in operating activities, primarily as a result of purchases of portfolio investments, partially offset by sales of and principal repayments on portfolio investments. During the same period, we generated $65.7 million from financing activities, primarily as a result of proceeds from our 2023 Notes (net of deferred financing cost payments) and net borrowings on our revolving credit facility, partially offset by distributions to stockholders.
For the year ended December 31, 2017, we experienced a net increase (decrease) in cash and restricted cash of ($1.1) million. During the same period we used $69.6 million in operating activities, primarily as a result of purchases of portfolio investments, partially offset by sales of and principal repayments on portfolio investments. During the same period, we generated $68.4 million from financing activities, primarily as a result of net proceeds from capital raises and SBA debenture borrowings, partially offset by net repayments on our revolving credit facility and distributions to stockholders.
| 52 |
Capital Resources
As a BDC, we distribute substantially all of our net income to our stockholders and have an ongoing need to raise additional capital for investment purposes. We intend to generate additional cash primarily from future offerings of securities, future borrowings and cash flows from operations, including income earned from investments in our portfolio companies. On both a short-term and long-term basis, our primary use of funds will be to invest in portfolio companies and make cash distributions to our stockholders.
As a BDC, we are generally not permitted to issue and sell our common stock at a price below net asset value per share. We may, however, sell our common stock, or warrants, options or rights to acquire our common stock, at a price below the then-current net asset value per share of our common stock if our Board, including independent directors, determines that such sale is in the best interests of us and our stockholders, and if our stockholders have approved such sales. On June 19, 2019, our stockholders voted to allow us to sell or otherwise issue common stock at a price below net asset value per share for a period of one year, subject to certain limitations. As of December 31, 2019 and 2018, we had 20,444,564 and 20,444,564 shares outstanding, respectively.
On June 24, 2015, our stockholders approved a proposal to authorize us to issue warrants, options or rights to subscribe to, convert to, or purchase our common stock in one or more offerings. This is a standing authorization and does not require annual re-approval by our stockholders.
On March 27, 2018, our board approved the application of the modified asset coverage requirements set forth in Section 61(a)(2) of the 1940 Act. On June 20, 2018, our stockholders approved the application of the modified asset coverage requirements. As a result of this approval, we are now permitted to borrow amounts such that our asset coverage ratio, as defined in the 1940 Act, is at least 150% after such borrowing (if certain requirements are met), rather than 200%, as previously required. As of December 31, 2019 and December 31, 2018, our asset coverage ratio based on aggregate borrowings outstanding was 183% and 223%, respectively.
Stock Issuances: On July 1, 2016, we amended the at-the-market (“ATM”) securities offering program we entered into on February 6, 2015 with MLV & Co. LLC (“MLV”) and JMP Securities LLC (“JMP”) (the “Initial ATM Program”), to replace MLV with FBR Capital Markets & Co. (“FBR”), an affiliate of MLV. On May 12, 2017, we entered into new equity distribution agreements with each of FBR and JMP (the “ATM Program”). All other material terms of the Initial ATM Program remain unchanged under the ATM Program. During the year ended December 31, 2016, there were no stock issuances under the Initial ATM Program. During the year ended December 31, 2017, we sold 173,939 shares at an average price of $15.71 per share for gross proceeds of $2.7 million under the Initial ATM Program and no shares were sold under the ATM Program. Aggregate underwriters’ discounts and commissions were $41 thousand and offering costs were $23 thousand, resulting in net proceeds of approximately $2.7 million. During the year ended December 31, 2018, we sold 182,299 shares at an average price of $13.82 per share for gross proceeds of $2.5 million under the ATM Program. Aggregate underwriters’ discounts and commissions were $38 thousand and offering costs were $79 thousand, resulting in net proceeds of approximately $2.4 million. There were no stock issuances during the year ended December 31, 2019.
On June 9, 2017, we closed a public offering of 3,000,000 shares of our common stock at a public offering price of $15.00 per share, raising approximately $45.0 million in gross proceeds. On June 14, 2017, pursuant to the underwriters’ exercise of the over-allotment option, we sold an additional 450,000 shares of our common stock, at a public offering price of $15.00 per share, raising an additional $6.8 million in gross proceeds for a total of $51.8 million. Aggregate underwriters’ discounts and commissions were $2.1 million and offering costs were $0.1 million, resulting in net proceeds of approximately $49.6 million.
Borrowings
Revolving Credit Facility: On March 1, 2019, we amended and restated our revolving credit facility (as amended and restated and further amended on March 20, 2019, the “Amended Credit Agreement”) with ING Capital LLC, as agent. Among other things, the Amended Credit Agreement increased the size of the facility from $200.0 million to $255.0 million (with an accordion feature that permits us, under certain circumstances, to increase the size of the facility up to $400.0 million), extended the period during which we may make draws under the revolving credit facility from expiring on December 14, 2019 to expiring on March 1, 2023, extended the final maturity date from December 14, 2020 to March 1, 2024, lowered the interest rate margins (a) for LIBOR loans (which may be one, three or six month, at the Company’s option), from 2.75% to 2.375% and (b) for alternate base rate loans, from 1.75% to 1.375%, reduced the asset coverage covenant from 2.1 to 1 to 1.5 to 1, replaced the consolidated interest coverage ratio with a minimum senior debt coverage ratio of 2 to 1 (in addition to the asset coverage ratio noted above), and increased the advance rate against certain types of assets in our portfolio. We incurred expenses of $1.8 million in conjunction with the amendment and restatement which have been capitalized within unamortized deferred financing costs and are amortized into interest expense over the estimated average life of the borrowings.
On September 27, 2019, we entered into a second amendment to our revolving credit facility to, among other things, amend the borrowing base to increase the amount of borrowing that can be collateralized by investments structured based on loan-to-value metrics, with corresponding adjustments to the concentration limits. The size, pricing and other significant terms of the revolving credit facility remain unchanged. We incurred expenses of $0.2 million in conjunction with this amendment which have been capitalized within unamortized deferred financing costs and are amortized into interest expense over the estimated average life of the borrowings.
As of December 31, 2019, the maximum amount we are able to borrow was $255.0 million and this maximum can be increased to $400.0 million pursuant to an accordion feature (subject to maintaining 150% asset coverage, as defined by the 1940 Act). The revolving credit facility is secured by a lien on all of our assets, including cash on hand, but excluding the assets of our wholly-owned subsidiary, MRCC SBIC. We may make draws under the revolving credit facility to make or purchase additional investments through March 1, 2023 and for general working capital purposes until March 1, 2024, the maturity date of the revolving credit facility.
Our ability to borrow under the revolving credit facility is subject to availability under the borrowing base, which permits us to borrow up to 72.5% of the fair market value of our portfolio company investments depending on the type of the investment we hold and whether the investment is quoted. Our ability to borrow is also subject to certain concentration limits, and continued compliance with the representations, warranties and covenants given by us under the facility. The revolving credit facility contains certain financial and restrictive covenants, including, but not limited to, our maintenance of: (1) a minimum consolidated total net assets at least equal to $175.0 million plus 65% of the net proceeds to us from sales of our equity securities after March 1, 2019; (2) a ratio of total assets (less total liabilities other than indebtedness) to total indebtedness of not less than 1.5 to 1; and (3) a senior debt coverage ratio of at least 2 to 1. The revolving credit facility also requires us to undertake customary indemnification obligations with respect to ING Capital LLC and other members of the lending group and to reimburse the lenders for expenses associated with entering into the credit facility. The revolving credit facility also has customary provisions regarding events of default, including events of default for nonpayment, change in control transactions at both Monroe Capital Corporation and MC Advisors, failure to comply with financial and negative covenants, and failure to maintain our relationship with MC Advisors. If we incur an event of default under the revolving credit facility and fail to remedy such default under any applicable grace period, if any, then the entire revolving credit facility could become immediately due and payable, which would materially and adversely affect our liquidity, financial condition, results of operations and cash flows.
| 53 |
Our revolving credit facility also imposes certain conditions that may limit the amount of our distributions to stockholders. Distributions payable in our common stock under the DRIP are not limited by the revolving credit facility. Distributions in cash or property other than common stock are generally limited to 115% of the amount of distributions required to maintain our status as a RIC.
As of December 31, 2019, we had U.S. dollar borrowings of $159.0 million and non-U.S. dollar borrowings denominated in Great Britain pounds of £16.1 million ($21.3 million in U.S. dollars) under the revolving credit facility. As of December 31, 2018, we had U.S. dollar borrowings of $117.1 million and non-U.S. dollar borrowings denominated in Great Britain pounds of £14.8 million ($18.9 million in U.S. dollars) under the revolving credit facility. The borrowings denominated in Great Britain pounds may be positively or negatively affected by movements in the rate of exchange between the U.S. dollar and the Great Britain pound. These movements are beyond our control and cannot be predicted. The borrowings denominated in Great Britain pounds are translated into U.S. dollars based on the spot rate at each balance sheet date. The impact resulting from changes in foreign currency borrowings is included in net change in unrealized gain (loss) on foreign currency and other transactions on our consolidated statements of operations and totaled ($0.8) million, $1.0 million and ($0.4) million for the years ended December 31, 2019, 2018 and 2017, respectively.
Borrowings under the revolving credit facility bear interest, at our election, at an annual rate of LIBOR (one-month, three-month or six-month at our discretion based on the term of the borrowing) plus 2.375% or at a daily rate equal to 1.375% per annum plus the greater of the prime interest rate, the federal funds rate plus 0.5% or LIBOR plus 1.0%. In addition to the stated interest rate on borrowings under the revolving credit facility, we are required to pay a fee of 0.5% per annum on any unused portion of the revolving credit facility if the unused portion of the facility is less than 35% of the then available maximum borrowing or a fee of 1.0% per annum on any unused portion of the revolving credit facility if the unused portion of the facility is greater than or equal to 35% of the then available maximum borrowing. As of December 31, 2019 and December 31, 2018, the outstanding borrowings were accruing at a weighted average interest rate of 4.0% and 5.0%, respectively.
2023 Notes: On September 12, 2018, we closed a public offering of 2,760,000 units of senior unsecured notes at a public offering price of $25.00 per unit, resulting in aggregate principal and gross proceeds of $69.0 million. Aggregate underwriter’s discounts and commissions were $2.2 million and deferred financing costs were $0.4 million, resulting in net proceeds of approximately $66.4 million. On March 20, 2019, we closed a registered direct offering of 1,600,000 units of 2023 Notes at an offering price of $24.75 per unit, resulting in additional aggregate principal of $40.0 million and gross proceeds of $39.6 million. Placement agent fees were $0.5 million and deferred financing costs were $0.7 million, resulting in net proceeds of approximately $38.4 million. The 2023 Notes mature on October 31, 2023. Interest on the 2023 Notes is paid quarterly on January 31, April 30, July 31, and October 31, at an annual rate of 5.75%. We may redeem the 2023 Notes in whole or in part at any time or from time to time on or after October 31, 2020. The 2023 Notes are general, unsecured obligations and rank equal in right of payment with all of our existing and future unsecured indebtedness. The 2023 Notes are listed on The Nasdaq Global Select Market under the trading symbol MRCCL.
SBA Debentures: On February 28, 2014, our wholly-owned subsidiary, MRCC SBIC, received a license from the SBA to operate as a SBIC under Section 301(c) of the Small Business Investment Act of 1958, as amended. MRCC SBIC commenced operations on September 16, 2013.
The SBIC license allows MRCC SBIC to obtain leverage by issuing SBA debentures, subject to the issuance of a leverage commitment by the SBA and other customary procedures. SBA debentures are non-recourse, interest only debentures with interest payable semi-annually and have a ten-year maturity. The principal amount of SBA debentures is not required to be paid prior to maturity but may be prepaid at any time without penalty. The interest rate of SBA debentures is fixed on a semi-annual basis (pooling date) at a market-driven spread over U.S. Treasury Notes with 10-year maturities. The SBA, as a creditor, has a superior claim to MRCC SBIC’s assets over our stockholders in the event we liquidate MRCC SBIC, or the SBA exercises its remedies upon an event of default. As of December 31, 2019, MRCC SBIC had $27.4 million in cash and $134.0 million in investments at fair value. As of December 31, 2018, MRCC SBIC had $14.0 million in cash and $161.0 million in investments at fair value.
SBA regulations currently limit the amount that an individual SBIC may borrow to a maximum of $175.0 million when it has at least $87.5 million in regulatory capital, receives a leverage commitment from the SBA and has been through an audit examination by the SBA subsequent to licensing. The SBA also limits a related group of SBICs (commonly referred to as a “family of funds”) to a maximum of $350.0 million in total borrowings.
As of both December 31, 2019 and 2018, MRCC SBIC had $57.6 million in leverageable capital and the following SBA debentures outstanding (in thousands):
| Maturity Date | Interest Rate | Amount | ||||||
| September 2024 | 3.4 | % | $ | 12,920 | ||||
| March 2025 | 3.3 | % | 14,800 | |||||
| March 2025 | 2.9 | % | 7,080 | |||||
| September 2025 | 3.6 | % | 5,200 | |||||
| March 2027 | 3.5 | % | 20,000 | |||||
| September 2027 | 3.2 | % | 32,100 | |||||
| March 2028 | 3.9 | % | 18,520 | |||||
| September 2028 | 4.2 | % | 4,380 | |||||
| Total | $ | 115,000 | ||||||
On October 2, 2014, we were granted exemptive relief from the SEC for permission to exclude the debt of MRCC SBIC guaranteed by the SBA from the asset coverage test under the 1940 Act. The receipt of this exemption for this SBA debt increases flexibility under the asset coverage test.
Secured Borrowings: Certain partial loan sales do not qualify for sale accounting under Accounting Standards Codification (“ASC”) Topic 860 — Transfers and Servicing (“ASC Topic 860”) because these sales do not meet the definition of a “participating interest,” as defined in the guidance, in order for sale treatment to be allowed. Participations or other partial loan sales which do not meet the definition of a participating interest remain as an investment on the accompanying consolidated statements of assets and liabilities and the portion sold is recorded as a secured borrowing in the liabilities section of the consolidated statements of assets and liabilities. For these partial loan sales, the interest earned on the entire loan balance is recorded within “interest income” and the interest earned by the buyer in the partial loan sale is recorded within “interest and other debt financing expenses” on the accompanying consolidated statements of operations. As of December 31, 2019, and 2018, there were no secured borrowings. During the years ended December 31, 2019, 2018 and 2017, repayments on secured borrowings totaled zero, zero and $1.3 million, respectively.
| 54 |
Distributions
Our Board will determine the timing and amount, if any, of our distributions. We intend to pay distributions on a quarterly basis. In order to avoid corporate-level tax on the income we distribute as a RIC, we must distribute to our stockholders at least 90% of our ordinary income and realized net short-term capital gains in excess of realized net long-term capital losses, if any, on an annual basis out of the assets legally available for such distributions. In addition, we also intend to distribute any realized net capital gains (i.e., realized net long-term capital gains in excess of realized net short-term capital losses) at least annually out of the assets legally available for such distributions. Distributions to stockholders for the years ended December 31, 2019, 2018 and 2017 totaled $28.6 million ($1.40 per share), $28.5 million ($1.40 per share) and $27.0 million ($1.40 per share), respectively, none of which represented return of capital. The tax character of such distributions is determined at the end of the fiscal year.
In October 2012, we adopted an “opt out” dividend reinvestment plan (“DRIP”) for our common stockholders. When we declare a distribution, our stockholders’ cash distributions will automatically be reinvested in additional shares of our common stock unless a stockholder specifically “opts out” of our DRIP. If a stockholder opts out, that stockholder will receive cash distributions. Although distributions paid in the form of additional shares of our common stock will generally be subject to U.S. federal, state and local taxes in the same manner as cash distributions, stockholders participating in our DRIP will not receive any corresponding cash distributions with which to pay any such applicable taxes.
MRCC Senior Loan Fund I, LLC
We co-invest with NLV Financial Corporation (“NLV”) in senior secured loans through SLF, an unconsolidated Delaware LLC. SLF is capitalized as underlying investment transactions are completed, taking into account available debt and equity commitments available for funding these investments. All portfolio and investment decisions in respect to SLF must be approved by the SLF investment committee, consisting of one representative of each of us and NLV. SLF may cease making new investments upon notification of either member but operations will continue until all investments have been sold or paid-off in the normal course of business. Investments held by SLF are measured at fair value using the same valuation methodologies as described below. Our investment is illiquid in nature as SLF does not allow for withdrawal from the LLC or the sale of a member’s interest unless approved by the board members of SLF. The full withdrawal of a member would result in an orderly wind-down of SLF.
SLF’s profits and losses are allocated to us and NLV in accordance with the respective ownership interests. As of both December 31, 2019 and 2018, we and NLV each owned 50.0% of the LLC equity interests of SLF. As of both December 31, 2019 and 2018, SLF had $100.0 million in equity commitments from its members (in the aggregate), of which $84.3 million and $54.4 million was funded, respectively.
As of both December 31, 2019 and 2018, we have committed to fund $50.0 million of LLC equity interest subscriptions to SLF. As of December 31, 2019 and 2018, $42.2 million and $27.2 million of our LLC equity interest subscriptions to SLF had been called and contributed, net of return of capital distributions subject to recall, respectively.
For the years ended December 31, 2019 and 2018, we received $4.0 million and $1.7 million of dividend income from our LLC equity interest in SLF, respectively. For the year ended December 31, 2017, we did not receive dividend income from our LLC equity interest in SLF, as we did not make our investment in SLF until November 2017.
SLF has a senior secured revolving credit facility (as amended, the “SLF Credit Facility”) with Capital One, N.A., through its wholly-owned subsidiary MRCC Senior Loan Fund I Financing SPV, LLC (“SLF SPV”), which as of December 31, 2019 allowed SLF SPV to borrow up to $170.0 million at any one time, subject to leverage and borrowing base restrictions. On January 9, 2019, the SLF SPV closed a $20.0 million upsize to the SLF Credit Facility, bringing the maximum amount the SLF SPV is able to borrow up to the now current $170.0 million. Borrowings under the SLF Credit Facility bear interest at an annual rate of LIBOR (three-month) plus 2.25%. The maturity date on the SLF Credit Facility is March 22, 2023.
SLF does not pay any fees to MC Advisors or its affiliates; however, SLF has entered into an administration agreement with Monroe Capital Management Advisors, LLC (“MC Management”), pursuant to which certain loan servicing and administrative functions are delegated to MC Management. SLF may reimburse MC Management for its allocable share of overhead and other expenses incurred by MC Management. For the years ended December 31, 2019, 2018 and 2017, SLF incurred $0.2 million, $72 thousand, and zero of allocable expenses, respectively. There are no agreements or understandings by which we guarantee any SLF obligations.
As of December 31, 2019 and 2018, SLF had total assets at fair value of $245.5 million and $177.1 million, respectively. As of both December 31, 2019 and 2018, SLF had zero portfolio company investments on non-accrual status. The portfolio companies in SLF are in industries and geographies similar to those in which we may invest directly. Additionally, as of December 31, 2019 and 2018, SLF had $4.9 million and $5.5 million, respectively, in outstanding commitments to fund investments under undrawn revolvers and delayed draw commitments.
Below is a summary of SLF’s portfolio, followed by a listing of the individual investments in SLF’s portfolio as of December 31, 2019 and 2018:
| As of | ||||||||
| December 31, 2019 | December 31, 2018 | |||||||
| Senior secured loans (1) | 243,778 | 174,267 | ||||||
| Weighted average current interest rate on senior secured loans (2) | 7.0 | % | 7.6 | % | ||||
| Number of borrowers in SLF | 64 | 50 | ||||||
| Largest portfolio company investment (1) | 6,860 | 6,930 | ||||||
| Total of five largest portfolio company investments (1) | 28,880 | 27,489 | ||||||
| (1) | Represents outstanding principal amount, excluding unfunded commitments. Principal amounts in thousands. |
| (2) | Computed as the (a) annual stated interest rate on accruing senior secured loans divided by (b) total senior secured loans at outstanding principal amount. |
| 55 |
MRCC SENIOR LOAN FUND I, LLC
CONSOLIDATED SCHEDULE OF INVESTMENTS
December 31, 2019
(in thousands)
| Portfolio Company (a) | Spread
Above Index (b) |
Interest Rate (b) |
Maturity | Principal | Fair Value |
|||||||||||
| Non-Controlled/Non-Affiliate Company Investments | ||||||||||||||||
| Senior Secured Loans | ||||||||||||||||
| Aerospace & Defense | ||||||||||||||||
| Bromford Industries Limited (e) | L+5.25% | 7.14 | % | 11/5/2025 | 2,800 | $ | 2,772 | |||||||||
| Bromford Industries Limited (e) | L+5.25% | 7.14 | % | 11/5/2025 | 1,867 | 1,848 | ||||||||||
| IMIA Holdings, Inc. | L+4.50% | 6.44 | % | 10/28/2024 | 4,277 | 4,277 | ||||||||||
| IMIA Holdings, Inc. (Revolver) (c) | L+4.50% | 6.44 | % | 10/28/2024 | 680 | — | ||||||||||
| MAG Aerospace Industries, Inc. | L+4.75% | 6.55 | % | 6/6/2025 | 3,251 | 3,234 | ||||||||||
| Novaria Holdings, LLC | L+4.75% | 6.55 | % | 12/19/2024 | 4,290 | 4,288 | ||||||||||
| Trident Maritime SH, Inc. | L+5.50% | 7.30 | % | 6/4/2024 | 4,435 | 4,404 | ||||||||||
| Trident Maritime SH, Inc. (Revolver) (c) | L+5.50% | 7.30 | % | 6/4/2024 | 340 | — | ||||||||||
| 21,940 | 20,823 | |||||||||||||||
| Automotive | ||||||||||||||||
| Innovative Aftermarkets Systems | L+5.50% | 7.30 | % | 1/25/2021 | 1,893 | 1,891 | ||||||||||
| Wheel Pros, LLC | L+4.75% | 6.55 | % | 4/4/2025 | 4,933 | 4,875 | ||||||||||
| 6,826 | 6,766 | |||||||||||||||
| Banking, Finance, Insurance & Real Estate | ||||||||||||||||
| Avison Young (USA), Inc. (e) | L+5.00% | 6.94 | % | 1/30/2026 | 4,950 | 4,874 | ||||||||||
| Lightbox Intermediate, L.P. | L+5.00% | 6.74 | % | 5/11/2026 | 4,975 | 4,913 | ||||||||||
| Minotaur Acquisition, Inc. | L+5.00% | 6.80 | % | 3/27/2026 | 2,978 | 2,940 | ||||||||||
| Nuvei Technologies Corp. (e) | L+5.00% | 6.80 | % | 9/26/2025 | 4,657 | 4,692 | ||||||||||
| Zenith Merger Sub, Inc. | L+5.25% | 7.19 | % | 12/13/2024 | 4,700 | 4,700 | ||||||||||
| Zenith Merger Sub, Inc. (Delayed Draw) (c) | L+5.25% | 7.19 | % | 12/13/2024 | 265 | 66 | ||||||||||
| 22,525 | 22,185 | |||||||||||||||
| Beverage, Food & Tobacco | ||||||||||||||||
| CBC Restaurant Corp. | L+6.50% | 8.30 | % | 11/10/2022 | 2,537 | 2,502 | ||||||||||
| SW Ingredients Holdings, LLC | L+4.00% | 6.21 | % | 7/3/2025 | 3,694 | 3,688 | ||||||||||
| US Salt, LLC | L+4.75% | 6.55 | % | 1/16/2026 | 2,729 | 2,743 | ||||||||||
| 8,960 | 8,933 | |||||||||||||||
| Capital Equipment | ||||||||||||||||
| Analogic Corporation | L+6.00% | 7.80 | % | 6/24/2024 | 4,874 | 4,854 | ||||||||||
| 4,874 | 4,854 | |||||||||||||||
| Chemicals, Plastics & Rubber | ||||||||||||||||
| Polymer Solutions Group | L+6.75% | 8.45 | % | 6/30/2021 | 1,271 | 1,271 | ||||||||||
| 1,271 | 1,271 | |||||||||||||||
| Construction & Building | ||||||||||||||||
| ISC Purchaser, LLC | L+5.00% | 6.94 | % | 7/11/2025 | 4,988 | 4,988 | ||||||||||
| The Cook & Boardman Group, LLC | L+5.75% | 7.67 | % | 10/20/2025 | 2,970 | 2,866 | ||||||||||
| 7,958 | 7,854 | |||||||||||||||
| Consumer Goods: Durable | ||||||||||||||||
| International Textile Group, Inc. | L+5.00% | 6.69 | % | 5/1/2024 | 1,805 | 1,498 | ||||||||||
| 1,805 | 1,498 | |||||||||||||||
| Consumer Goods: Non-Durable | ||||||||||||||||
| PH Beauty Holdings III, Inc. | L+5.00% | 6.80 | % | 9/26/2025 | 2,468 | 2,356 | ||||||||||
| 2,468 | 2,356 | |||||||||||||||
| Containers, Packaging & Glass | ||||||||||||||||
| Liqui-Box Holdings, Inc. (d) | L+4.50% | 6.30 | % | 6/3/2026 | 4,333 | 4,241 | ||||||||||
| Polychem Acquisition, LLC | L+5.00% | 6.95 | % | 3/17/2025 | 2,978 | 2,978 | ||||||||||
| Port Townsend Holdings Company, Inc. | L+4.75% | 6.55 | % | 4/3/2024 | 4,838 | 4,777 | ||||||||||
| PVHC Holding Corp. | L+4.75% | 6.69 | % | 8/5/2024 | 3,283 | 2,947 | ||||||||||
| PVHC Holding Corp. (Delayed Draw) (c) | L+4.75% | 6.69 | % | 8/5/2024 | 425 | — | ||||||||||
| 15,857 | 14,943 | |||||||||||||||
| Energy: Oil & Gas | ||||||||||||||||
| Drilling Info Holdings, Inc. | L+4.25% | 6.05 | % | 7/30/2025 | 4,609 | 4,586 | ||||||||||
| Offen, Inc. | L+5.00% | 6.94 | % | 6/22/2026 | 2,436 | 2,436 | ||||||||||
| Offen, Inc. (Delayed Draw) (c) | L+5.00% | 6.94 | % | 6/22/2026 | 885 | — | ||||||||||
| 7,930 | 7,022 | |||||||||||||||
| Healthcare & Pharmaceuticals | ||||||||||||||||
| LSCS Holdings, Inc. | L+4.25% | 6.19 | % | 3/17/2025 | 2,322 | 2,299 | ||||||||||
| LSCS Holdings, Inc. | L+4.25% | 6.19 | % | 3/17/2025 | 599 | 593 | ||||||||||
| P&L Developments, LLC | L+7.50% | 9.50 | % | 6/28/2024 | 2,993 | 2,978 | ||||||||||
| Radiology Partners, Inc. | L+4.75% | 6.62 | % | 7/9/2025 | 4,938 | 4,970 | ||||||||||
| Solara Medical Supplies, LLC | L+6.00% | 7.94 | % | 2/27/2024 | 5,515 | 5,515 | ||||||||||
| Solara Medical Supplies, LLC | L+6.00% | 7.94 | % | 2/27/2024 | 1,068 | 1,068 | ||||||||||
| Solara Medical Supplies, LLC (Revolver) (c) | L+6.00% | 7.94 | % | 2/27/2024 | 714 | — | ||||||||||
| 18,149 | 17,423 | |||||||||||||||
| High Tech Industries | ||||||||||||||||
| AQA Acquisition Holding, Inc. | L+4.25% | 6.19 | % | 5/24/2023 | 3,291 | 3,275 | ||||||||||
| Corel, Inc. (e) | L+5.00% | 6.91 | % | 7/2/2026 | 4,000 | 3,875 | ||||||||||
| Gigamon, Inc. | L+4.25% | 6.04 | % | 12/27/2024 | 2,940 | 2,914 | ||||||||||
| LW Buyer, LLC | L+5.00% | 6.80 | % | 12/30/2024 | 4,975 | 4,938 | ||||||||||
| Perforce Software, Inc. | L+4.50% | 6.30 | % | 7/1/2026 | 3,325 | 3,331 | ||||||||||
| TGG TS Acquisition Company | L+6.50% | 8.24 | % | 12/12/2025 | 4,058 | 4,037 | ||||||||||
| 22,589 | 22,370 | |||||||||||||||
| Hotels, Gaming & Leisure | ||||||||||||||||
| Excel Fitness Holdings, Inc. | L+5.25% | 7.05 | % | 10/7/2025 | 4,250 | 4,255 | ||||||||||
| North Haven Spartan US Holdco, LLC | L+5.00% | 6.89 | % | 6/6/2025 | 2,344 | 2,343 | ||||||||||
| Tait, LLC | L+4.50% | 6.61 | % | 3/28/2025 | 4,210 | 4,210 | ||||||||||
| Tait, LLC (Revolver) (c) | L+4.50% | 6.61 | % | 3/28/2025 | 769 | — | ||||||||||
| 11,573 | 10,808 | |||||||||||||||
| Media: Advertising, Printing & Publishing | ||||||||||||||||
| Cadent, LLC | L+5.25% | 7.05 | % | 9/11/2023 | 4,938 | 4,925 | ||||||||||
| Cadent, LLC (Revolver) (c) | L+5.25% | 7.05 | % | 9/11/2023 | 167 | — | ||||||||||
| Digital Room Holdings, Inc. | L+5.00% | 6.80 | % | 5/21/2026 | 4,406 | 4,186 | ||||||||||
| Monotype Imaging Holdings Corp. (d) | L+5.50% | 7.30 | % | 10/9/2026 | 5,000 | 4,825 | ||||||||||
| 14,511 | 13,936 | |||||||||||||||
| Media: Diversified & Production | ||||||||||||||||
| Research Now Group, Inc. and Survey Sampling International, LLC | L+5.50% | 7.41 | % | 12/20/2024 | 6,860 | 6,869 | ||||||||||
| Stats Intermediate Holding, LLC | L+5.25% | 7.30 | % | 7/10/2026 | 5,000 | 4,894 | ||||||||||
| 11,860 | 11,763 | |||||||||||||||
| Services: Business | ||||||||||||||||
| AQ Carver Buyer, Inc. (d) | L+5.00% | 6.80 | % | 9/24/2025 | 5,000 | 4,925 | ||||||||||
| CHA Holdings, Inc. | L+4.50% | 6.44 | % | 4/10/2025 | 2,023 | 2,020 | ||||||||||
| CHA Holdings, Inc. | L+4.50% | 6.44 | % | 4/10/2025 | 426 | 426 | ||||||||||
| Eliassen Group, LLC | L+4.50% | 6.30 | % | 11/5/2024 | 3,032 | 3,022 | ||||||||||
| Engage2Excel, Inc. | L+6.50% | 8.71 | % | 3/7/2023 | 4,298 | 4,181 | ||||||||||
| Engage2Excel, Inc. | L+6.50% | 8.42 | % | 3/7/2023 | 775 | 754 | ||||||||||
| Engage2Excel, Inc. (Delayed Draw) (c) | L+6.50% | 8.42 | % | 3/7/2023 | 500 | — | ||||||||||
| Engage2Excel, Inc. (Revolver) (c) | P+5.50% | 10.25 | % | 3/7/2023 | 545 | 354 | ||||||||||
| GI Revelation Acquisition, LLC | L+5.00% | 6.80 | % | 4/16/2025 | 1,379 | 1,305 | ||||||||||
| Orbit Purchaser, LLC | L+4.50% | 6.45 | % | 10/21/2024 | 2,481 | 2,479 | ||||||||||
| Orbit Purchaser, LLC | L+4.50% | 6.45 | % | 10/21/2024 | 1,916 | 1,914 | ||||||||||
| Orbit Purchaser, LLC | L+4.50% | 6.45 | % | 10/21/2024 | 560 | 560 | ||||||||||
| Output Services Group, Inc. | L+4.50% | 6.30 | % | 3/27/2024 | 4,916 | 4,166 | ||||||||||
| SIRVA Worldwide, Inc. | L+5.50% | 7.30 | % | 8/4/2025 | 1,950 | 1,931 | ||||||||||
| Teneo Holdings, LLC | L+5.25% | 6.99 | % | 7/11/2025 | 4,988 | 4,757 | ||||||||||
| The Kleinfelder Group, Inc. | L+4.75% | 6.37 | % | 11/29/2024 | 2,475 | 2,474 | ||||||||||
| 37,264 | 35,268 | |||||||||||||||
| Services: Consumer | ||||||||||||||||
| Cambium Learning Group, Inc. | L+4.50% | 6.30 | % | 12/18/2025 | 4,950 | 4,801 | ||||||||||
| LegalZoom.com, Inc. | L+4.50% | 6.30 | % | 11/21/2024 | 2,722 | 2,747 | ||||||||||
| 7,672 | 7,548 | |||||||||||||||
| Telecommunications | ||||||||||||||||
| Intermedia Holdings, Inc. | L+6.00% | 7.80 | % | 7/21/2025 | 1,815 | 1,820 | ||||||||||
| Mavenir Systems, Inc. | L+6.00% | 7.91 | % | 5/8/2025 | 3,940 | 3,920 | ||||||||||
| 5,755 | 5,740 | |||||||||||||||
| Transportation: Cargo | ||||||||||||||||
| GlobalTranz Enterprises, LLC | L+5.00% | 6.79 | % | 5/15/2026 | 3,295 | 3,032 | ||||||||||
| 3,295 | 3,032 | |||||||||||||||
| Utilities: Oil & Gas | ||||||||||||||||
| NGS US Finco, LLC | L+4.25% | 6.05 | % | 10/1/2025 | 1,733 | 1,733 | ||||||||||
| 1,733 | 1,733 | |||||||||||||||
| Wholesale | ||||||||||||||||
| BMC Acquisition, Inc. | L+5.25% | 7.17 | % | 12/30/2024 | 4,900 | 4,888 | ||||||||||
| Halo Buyer, Inc. | L+4.50% | 6.30 | % | 6/30/2025 | 4,925 | 4,827 | ||||||||||
| PT Intermediate Holdings III, LLC | L+5.50% | 7.44 | % | 10/15/2025 | 2,000 | 1,995 | ||||||||||
| 11,825 | 11,710 | |||||||||||||||
| TOTAL INVESTMENTS | $ | 239,836 | ||||||||||||||
| (a) | All investments are U.S. companies unless otherwise noted. | ||
| (b) | The majority of investments bear interest at a rate that may be determined by reference to the London Interbank Offered Rate (“LIBOR” or “L”) or Prime (“P”) which reset daily, monthly, quarterly or semiannually. We have provided the spread over LIBOR or Prime and the current contractual rate of interest in effect at December 31, 2019. Certain investments are subject to a LIBOR or Prime interest rate floor. | ||
| (c) | All or a portion of this commitment was unfunded as of December 31, 2019. As such, interest is earned only on the funded portion of this commitment. Principal reflects the commitment outstanding. | ||
| (d) | Investment position or portion thereof unsettled as of December 31, 2019. | ||
| (e) | This is an international company. | ||
| 56 |
CONSOLIDATED SCHEDULE OF INVESTMENTS
December 31, 2018
(in thousands)
| Portfolio Company (a) | Spread
Above Index (b) |
Interest Rate (b) |
Maturity | Principal | Fair Value |
|||||||||||
| Non-Controlled/Non-Affiliate Company Investments | ||||||||||||||||
| Senior Secured Loans | ||||||||||||||||
| Aerospace & Defense | ||||||||||||||||
| IMIA Holdings, Inc. | L+4.50% | 7.30 | % | 10/28/2024 | 4,320 | $ | 4,341 | |||||||||
| IMIA Holdings, Inc. (Revolver) (c) | L+4.50% | 7.30 | % | 10/28/2024 | 680 | — | ||||||||||
| MAG Aerospace Industries, Inc. | L+4.75% | 7.27 | % | 6/6/2025 | 3,284 | 3,267 | ||||||||||
| Novaria Holdings, LLC (d) | L+4.75% | 7.27 | % | 12/19/2024 | 4,333 | 4,290 | ||||||||||
| The KEYW Corporation | L+4.50% | 6.89 | % | 5/8/2024 | 1,488 | 1,473 | ||||||||||
| Trident Maritime SH, Inc. | L+5.50% | 8.30 | % | 6/4/2024 | 4,637 | 4,623 | ||||||||||
| Trident Maritime SH, Inc. (Revolver) (c) | L+5.50% | 8.30 | % | 6/4/2024 | 340 | — | ||||||||||
| 19,082 | 17,994 | |||||||||||||||
| Automotive | ||||||||||||||||
| Wheel Pros, LLC | L+4.75% | 7.27 | % | 4/4/2025 | 3,980 | 3,920 | ||||||||||
| 3,980 | 3,920 | |||||||||||||||
| Banking, Finance, Insurance & Real Estate | ||||||||||||||||
| Kestra Financial, Inc. (d) | L+4.25% | 6.77 | % | 6/24/2022 | 3,564 | 3,537 | ||||||||||
| MTC Intermediate Holdco, Inc. | L+4.50% | 7.02 | % | 1/30/2023 | 4,963 | 4,963 | ||||||||||
| Pivotal Payments, Inc. | P+3.50% | 9.00 | % | 9/26/2025 | 2,902 | 2,873 | ||||||||||
| Pivotal Payments, Inc. (Delayed Draw) (c) | L+4.50% | 6.98 | % | 9/26/2025 | 841 | 518 | ||||||||||
| Zenith Merger Sub, Inc. | L+5.50% | 8.30 | % | 12/13/2023 | 3,713 | 3,701 | ||||||||||
| 15,983 | 15,592 | |||||||||||||||
| Beverage, Food & Tobacco | ||||||||||||||||
| Il Fornaio (America) Corporation | L+6.50% | 9.02 | % | 11/10/2022 | 4,894 | 4,847 | ||||||||||
| SW Ingredients Holdings, LLC | L+4.25% | 7.05 | % | 7/3/2025 | 3,731 | 3,709 | ||||||||||
| US Salt, LLC | L+4.75% | 7.27 | % | 11/30/2023 | 3,474 | 3,474 | ||||||||||
| 12,099 | 12,030 | |||||||||||||||
| Capital Equipment | ||||||||||||||||
| Analogic Corporation | L+6.00% | 8.52 | % | 6/24/2024 | 4,988 | 4,786 | ||||||||||
| 4,988 | 4,786 | |||||||||||||||
| Chemicals, Plastics & Rubber | ||||||||||||||||
| Loparex International B.V. (e) | L+4.25% | 7.05 | % | 4/11/2025 | 498 | 490 | ||||||||||
| Peach State Labs, LLC | L+6.50% | 8.85 | % | 6/30/2021 | 2,850 | 2,825 | ||||||||||
| 3,348 | 3,315 | |||||||||||||||
| Construction & Building | ||||||||||||||||
| Fastener Acquisition, Inc. | L+4.25% | 7.05 | % | 3/28/2025 | 1,323 | 1,256 | ||||||||||
| The Cook & Boardman Group, LLC | L+5.75% | 8.55 | % | 10/20/2025 | 3,000 | 2,978 | ||||||||||
| 4,323 | 4,234 | |||||||||||||||
| Consumer Goods: Durable | ||||||||||||||||
| International Textile Group, Inc. | L+5.00% | 7.35 | % | 5/1/2024 | 1,852 | 1,819 | ||||||||||
| SSH Group Holdings, Inc. | L+4.25% | 6.77 | % | 7/30/2025 | 2,327 | 2,240 | ||||||||||
| 4,179 | 4,059 | |||||||||||||||
| Consumer Goods: Non-Durable | ||||||||||||||||
| PH Beauty Holdings III, Inc. | L+5.00% | 7.52 | % | 9/26/2025 | 1,995 | 1,925 | ||||||||||
| 1,995 | 1,925 | |||||||||||||||
| Containers, Packaging & Glass | ||||||||||||||||
| Port Townsend Holdings Company, Inc. | L+4.75% | 7.27 | % | 4/3/2024 | 4,887 | 4,893 | ||||||||||
| PVHC Holding Corp. | L+4.75% | 7.57 | % | 8/5/2024 | 3,317 | 3,333 | ||||||||||
| PVHC Holding Corp. (Delayed Draw) (c) | L+4.75% | 7.57 | % | 8/5/2024 | 425 | — | ||||||||||
| 8,629 | 8,226 | |||||||||||||||
| Energy: Oil & Gas | ||||||||||||||||
| Drilling Info Holdings, Inc. | L+4.25% | 6.77 | % | 7/30/2025 | 4,307 | 4,296 | ||||||||||
| Drilling Info Holdings, Inc. (Delayed Draw) (c) | L+4.25% | 6.77 | % | 7/30/2025 | 350 | — | ||||||||||
| 4,657 | 4,296 | |||||||||||||||
| Healthcare & Pharmaceuticals | ||||||||||||||||
| LSCS Holdings, Inc. | L+4.25% | 6.77 | % | 3/17/2025 | 2,328 | 2,316 | ||||||||||
| LSCS Holdings, Inc. | L+4.25% | 6.96 | % | 3/17/2025 | 601 | 598 | ||||||||||
| Radiology Partners, Inc. | L+4.25% | 6.87 | % | 7/9/2025 | 4,988 | 4,900 | ||||||||||
| Solara Medical Supplies, LLC | L+6.00% | 8.52 | % | 5/31/2023 | 5,571 | 5,594 | ||||||||||
| Solara Medical Supplies, LLC (Delayed Draw) (c) | L+6.00% | 8.52 | % | 5/31/2023 | 1,071 | — | ||||||||||
| Solara Medical Supplies, LLC (Revolver) (c) | L+6.00% | 8.52 | % | 5/31/2023 | 714 | — | ||||||||||
| 15,273 | 13,408 | |||||||||||||||
| High Tech Industries | ||||||||||||||||
| AQA Acquisition Holding, Inc. | L+4.25% | 7.05 | % | 5/24/2023 | 3,325 | 3,308 | ||||||||||
| Corel, Inc. (d) (e) | L+5.00% | 7.71 | % | 6/4/2024 | 3,786 | 3,749 | ||||||||||
| Gigamon, Inc. | L+4.25% | 7.05 | % | 12/27/2024 | 2,970 | 2,933 | ||||||||||
| TGG TS Acquisition Company (d) | L+6.50% | 9.02 | % | 12/12/2025 | 4,400 | 4,241 | ||||||||||
| 14,481 | 14,231 | |||||||||||||||
| Media: Advertising, Printing & Publishing | ||||||||||||||||
| Cadent, LLC | L+5.25% | 7.71 | % | 9/11/2023 | 4,988 | 4,975 | ||||||||||
| Cadent, LLC (Revolver) (c) | L+5.25% | 7.71 | % | 9/11/2023 | 167 | — | ||||||||||
| 5,155 | 4,975 | |||||||||||||||
| Media: Diversified & Production | ||||||||||||||||
| Research Now Group, Inc. and Survey Sampling International, LLC | L+5.50% | 8.02 | % | 12/20/2024 | 6,930 | 6,817 | ||||||||||
| 6,930 | 6,817 | |||||||||||||||
| Services: Business | ||||||||||||||||
| CHA Holdings, Inc. | L+4.50% | 7.30 | % | 4/10/2025 | 2,043 | 2,041 | ||||||||||
| CHA Holdings, Inc. (Delayed Draw) (c) | L+4.50% | 7.30 | % | 4/10/2025 | 446 | — | ||||||||||
| Eliassen Group, LLC | L+4.50% | 7.02 | % | 11/5/2024 | 2,500 | 2,475 | ||||||||||
| Engage2Excel, Inc. | L+6.50% | 8.93 | % | 3/7/2023 | 4,342 | 4,320 | ||||||||||
| Engage2Excel, Inc. (Revolver) (c) | L+6.50% | 8.95 | % | 3/7/2023 | 545 | 155 | ||||||||||
| GI Revelation Acquisition, LLC | L+5.00% | 7.52 | % | 4/16/2025 | 1,393 | 1,374 | ||||||||||
| North Haven CA Holdings, Inc. | L+4.50% | 7.02 | % | 9/29/2023 | 5,000 | 4,972 | ||||||||||
| Orbit Purchaser, LLC | L+4.50% | 7.17 | % | 10/21/2024 | 1,931 | 1,919 | ||||||||||
| Orbit Purchaser, LLC (Delayed Draw) (c) | L+4.50% | 7.17 | % | 10/21/2024 | 565 | — | ||||||||||
| Output Services Group, Inc. | L+4.25% | 6.77 | % | 3/27/2024 | 4,965 | 4,828 | ||||||||||
| SIRVA Worldwide, Inc. | L+5.50% | 8.02 | % | 8/4/2025 | 2,000 | 1,965 | ||||||||||
| The Kleinfelder Group, Inc. (d) | L+4.75% | 7.27 | % | 11/29/2024 | 2,500 | 2,475 | ||||||||||
| 28,230 | 26,524 | |||||||||||||||
| Services: Consumer | ||||||||||||||||
| Cambium Learning Group, Inc. (d) | L+4.50% | 7.02 | % | 12/18/2025 | 5,000 | 4,769 | ||||||||||
| LegalZoom.com, Inc. | L+4.50% | 7.00 | % | 11/21/2024 | 2,749 | 2,708 | ||||||||||
| WeddingWire, Inc. (d) | L+4.50% | 7.02 | % | 12/19/2025 | 1,167 | 1,149 | ||||||||||
| 8,916 | 8,626 | |||||||||||||||
| Telecommunications | ||||||||||||||||
| Intermedia Holdings, Inc. | L+6.00% | 8.52 | % | 7/21/2025 | 1,833 | 1,831 | ||||||||||
| Mavenir Systems, Inc. | L+6.00% | 8.39 | % | 5/8/2025 | 3,980 | 3,968 | ||||||||||
| 5,813 | 5,799 | |||||||||||||||
| Utilities: Oil & Gas | ||||||||||||||||
| NGS US Finco, LLC | L+4.25% | 6.76 | % | 10/1/2025 | 1,750 | 1,746 | ||||||||||
| 1,750 | 1,746 | |||||||||||||||
| Wholesale | ||||||||||||||||
| BMC Acquisition, Inc. | L+5.25% | 8.13 | % | 12/30/2024 | 4,950 | 4,962 | ||||||||||
| Halo Buyer, Inc. | L+4.50% | 7.02 | % | 6/27/2025 | 3,501 | 3,431 | ||||||||||
| Halo Buyer, Inc. | L+4.50% | 7.02 | % | 6/27/2025 | 1,474 | 1,445 | ||||||||||
| 9,925 | 9,838 | |||||||||||||||
| TOTAL INVESTMENTS | $ | 172,341 | ||||||||||||||
| (a) | All investments are U.S. companies unless otherwise noted. |
| (b) | The majority of investments bear interest at a rate that may be determined by reference to the London Interbank Offered Rate (“LIBOR” or “L”) or Prime (“P”) which reset daily, monthly, quarterly or semiannually. We have provided the spread over LIBOR or Prime and the current contractual rate of interest in effect at December 31, 2018. Certain investments are subject to a LIBOR or Prime interest rate floor. |
| (c) | All or a portion of this commitment was unfunded as of December 31, 2018. As such, interest is earned only on the funded portion of this commitment. Principal reflects the commitment outstanding. |
| (d) | Investment position or portion thereof unsettled as of December 31, 2018. |
| (e) | This is an international company. |
| 57 |
Below is certain summarized financial information for SLF as of December 31, 2019 and 2018 and for the years ended December 31, 2019, 2018 and 2017 (in thousands):
| December 31, 2019 | December 31, 2018 | |||||||
| Assets | ||||||||
| Investments, at fair value | $ | 239,836 | $ | 172,341 | ||||
| Cash | 446 | 448 | ||||||
| Restricted cash | 4,226 | 3,838 | ||||||
| Interest receivable | 920 | 456 | ||||||
| Other assets | 41 | 39 | ||||||
| Total assets | 245,469 | 177,122 | ||||||
| Liabilities | ||||||||
| Revolving credit facility | 147,232 | 101,060 | ||||||
| Less: Unamortized deferred financing costs | (1,407 | ) | (1,625 | ) | ||||
| Total debt, less unamortized deferred financing costs | 145,825 | 99,435 | ||||||
| Payable for open trades | 13,940 | 21,746 | ||||||
| Interest payable | 533 | 457 | ||||||
| Accounts payable and accrued expenses | 346 | 216 | ||||||
| Total liabilities | 160,644 | 121,854 | ||||||
| Members’ capital | 84,825 | 55,268 | ||||||
| Total liabilities and members’ capital | $ | 245,469 | $ | 177,122 | ||||
| For the years ended December 31, | ||||||||||||
| 2019 | 2018 | 2017 (1) | ||||||||||
| Investment income: | ||||||||||||
| Interest income | $ | 16,294 | $ | 7,288 | $ | 39 | ||||||
| Total investment income | 16,294 | 7,288 | 39 | |||||||||
| Expenses: | ||||||||||||
| Interest and other debt financing expenses | 7,056 | 2,849 | — | |||||||||
| Organizational costs | — | 11 | 39 | |||||||||
| Professional fees | 718 | 312 | 45 | |||||||||
| Total expenses | 7,774 | 3,172 | 84 | |||||||||
| Net investment income (loss) | 8,520 | 4,116 | (45 | ) | ||||||||
| Net gain (loss): | ||||||||||||
| Net realized gain (loss) | 7 | 7 | — | |||||||||
| Net change in unrealized gain (loss) | (781 | ) | (85 | ) | 325 | |||||||
| Net gain (loss) | (774 | ) | (78 | ) | 325 | |||||||
| Net increase (decrease) in members’ capital | $ | 7,746 | $ | 4,038 | $ | 280 | ||||||
| (1) | SLF commenced operations on November 14, 2017. |
Related Party Transactions
We have a number of business relationships with affiliated or related parties, including the following:
| • | We have an Investment Advisory Agreement with MC Advisors, an investment advisor registered with the SEC, to manage our day-to-day operating and investing activities. We pay MC Advisors a fee for its services under the Investment Advisory Agreement consisting of two components - a base management fee and an incentive fee. On November 4, 2019, we amended the base management fee under the Investment Advisory Agreement, effective July 1, 2019. See Note 6 to our consolidated financial statements and “Significant Accounting Estimates and Critical Accounting Policies - Capital Gains Incentive Fee” for additional information. |
| • | We have an Administration Agreement with MC Management to provide us with the office facilities and administrative services necessary to conduct our day-to-day operations. See Note 6 to our consolidated financial statements for additional information. |
| • | SLF has an Administration Agreement with MC Management to provide SLF with certain loan servicing and administrative functions. SLF may reimburse MC Management for its allocable share of overhead and other expenses incurred by MC Management. See Note 3 to our consolidated financial statements and “Liquidity and Capital Resources - MRCC Senior Loan Fund I, LLC” for additional information. |
| • | Theodore L. Koenig, our Chief Executive Officer and Chairman of our Board is also a manager of MC Advisors and the President and Chief Executive Officer of MC Management. Aaron D. Peck, our Chief Financial Officer and Chief Investment Officer, serves as a director on our Board and is also a managing director of MC Management. |
| • | We have a license agreement with Monroe Capital LLC, under which Monroe Capital LLC has agreed to grant us a non-exclusive, royalty-free license to use the name “Monroe Capital” for specified purposes in our business. |
In addition, we have adopted a formal code of ethics that governs the conduct of MC Advisors’ officers, directors and employees. Our officers and directors also remain subject to the duties imposed by both the 1940 Act and Maryland General Corporation Law.
| 58 |
Contractual Obligations and Off-Balance Sheet Arrangements
The following table shows our significant contractual payment obligations for repayment as of December 31, 2019 (in thousands):
| Total | Less than 1 year |
1 – 3 years | 3 – 5 years | More than 5 years |
||||||||||||||||
| Revolving credit facility | $ | 180,294 | $ | — | $ | — | $ | 180,294 | $ | — | ||||||||||
| 2023 Notes | 109,000 | — | — | 109,000 | — | |||||||||||||||
| SBA debentures payable | 115,000 | — | — | 12,920 | 102,080 | |||||||||||||||
| Unfunded commitments (1) | 44,208 | 44,208 | — | — | — | |||||||||||||||
| Total contractual obligations | $ | 448,502 | $ | 44,208 | $ | — | $ | 302,214 | $ | 102,080 | ||||||||||
| (1) | Unfunded commitments represent all amounts unfunded, excluding our investments in SLF, as of December 31, 2019. These amounts may or may not be funded to the borrowing party now or in the future. The unfunded commitments relate to loans with various maturity dates, but we are showing this amount in the less than one year category as this entire amount was eligible for funding to the borrowers as of December 31, 2019. |
We may become a party to financial instruments with off-balance sheet risk in the normal course of our business to meet the financial needs of our portfolio companies. These instruments may include commitments to extend credit and involve, to varying degrees, elements of liquidity and credit risk in excess of the amount recognized on the consolidated statements of assets and liabilities. As of December 31, 2019 and 2018, we had outstanding commitments to fund investments under undrawn revolvers, capital expenditure loans, delayed draw commitments and subscription agreements, excluding investments in SLF, totaling $44.2 million and $56.0 million, respectively. As of December 31, 2019 and 2018, we had unfunded commitments to SLF of $7.8 million and $22.8 million, respectively, that may be contributed primarily for the purpose of funding new investments approved by the SLF investment committee. Drawdowns of the commitments to SLF require authorization from one of our representatives on SLF’s board of managers. Additionally, we have entered into certain contracts with other parties that contain a variety of indemnifications. Our maximum exposure under these arrangements is unknown. However, we have not experienced claims or losses pursuant to these contracts and believe the risk of loss related to such indemnifications to be remote.
Off-Balance Sheet Arrangements
We have no off-balance sheet arrangements that have or are reasonably likely to have a current or future effect on our financial condition, changes in financial condition, revenues or expenses, results of operations, liquidity, capital expenditures or capital resources.
Market Trends
We have identified the following trends that may affect our business:
Target Market: We believe that small and middle-market companies in the United States with annual revenues between $10.0 million and $2.5 billion represent a significant growth segment of the U.S. economy and often require substantial capital investments to grow. Middle-market companies have generated a significant number of investment opportunities for investment funds managed or advised by Monroe Capital, and we believe that this market segment will continue to produce significant investment opportunities for us.
Specialized Lending Requirements: We believe that several factors render many U.S. financial institutions ill-suited to lend to U.S. middle-market companies. For example, based on the experience of our management team, lending to U.S. middle-market companies (1) is generally more labor intensive than lending to larger companies due to the smaller size of each investment and the fragmented nature of information for such companies, (2) requires due diligence and underwriting practices consistent with the demands and economic limitations of the middle-market and (3) may also require more extensive ongoing monitoring by the lender.
Demand for Debt Capital: We believe there is a large pool of uninvested private equity capital for middle-market companies. We expect private equity firms will seek to leverage their investments by combining equity capital with senior secured loans and mezzanine debt from other sources, such as us.
Competition from Other Lenders: We believe that many traditional bank lenders, in recent years, de-emphasized their service and product offerings to middle-market businesses in favor of lending to large corporate clients and managing capital market transactions. In addition, many commercial banks face significant balance sheet constraints as they seek to build capital and meet future regulatory capital requirements. These factors may result in opportunities for alternative funding sources to middle-market companies and therefore drive increased new investment opportunities for us. Conversely, there has been a significant amount of capital raised over the past several years dedicated to middle market lending which has increased competitive pressure in the BDC and investment company marketplace for senior and subordinated debt which could result in lower yields and weaker financial covenants for new assets.
Pricing and Deal Structures: We believe that the volatility in global markets over the last several years and current macroeconomic issues including changes in bank regulations for middle-market banks has reduced access to, and availability of, debt capital to middle-market companies, causing a reduction in competition and generally more favorable capital structures and deal terms. Recent capital raises in the BDC and investment company marketplace have created increased competition; however, we believe that current market conditions may continue to create favorable opportunities to invest at attractive risk-adjusted returns.
| 59 |
Recent Developments
On March 3, 2020, the Board declared a quarterly distribution of $0.35 per share payable on March 31, 2020 to holders of record on March 16, 2020.
In January 2020, an arbitrator issued an interim award in favor of the estate of Rockdale in the pending legal proceeding between the estate of Rockdale and a national insurance carrier. The award was issued as “interim” due to the fact that the arbitrator will hear further briefing from both parties as to an allocation of attorneys’ fees, interest and certain other amounts that should be paid to Rockdale in connection with the interim award. As such, the exact computation of the final amount of the award has yet to be determined and is uncertain, but is expected to resolve over the next few quarters. At this time, we believe that our share of the net proceeds from the award will exceed the cost basis of our investment due to our right to receive excess proceeds pursuant to the terms of a sharing agreement between the lenders and the estate; however, due to the aforementioned post-trial arbitration proceedings, it is not certain that will be the case. The lenders to Rockdale, including the Company, will share in the proceeds of this arbitration award with the estate, once it becomes final and is paid. At this time, it is also unclear whether, or to what extent, the national insurance carrier may seek to appeal the adverse ruling against it. We believe that any such appeal is unlikely to be successful based on the appellate standard for arbitration.
Significant Accounting Estimates and Critical Accounting Policies
Revenue Recognition
We record interest and fee income on an accrual basis to the extent that we expect to collect such amounts. For loans and debt securities with contractual PIK interest, we do not accrue PIK interest if the portfolio company valuation indicates that such PIK interest is not collectible. We do not accrue as a receivable interest on loans and debt securities if we have reason to doubt our ability to collect such interest. Loan origination fees, original issue discount and market discount or premium are capitalized, and then we amortize such amounts using the effective interest method as interest income over the life of the investment. Upon the prepayment of a loan or debt security, any unamortized premium or discount or loan origination fees are recorded as interest income. We record prepayment premiums on loans and debt securities as interest income when we receive such amounts. Interest income is accrued based upon the outstanding principal amount and contractual terms of debt and preferred equity investments. Interest is accrued on a daily basis. We record fees on loans based on the determination of whether the fee is considered a yield enhancement or payment for a service. If the fee is considered a yield enhancement associated with a funding of cash on a loan, the fee is generally deferred and recognized into interest income using the effective interest method if captured in the cost basis or using the straight-line method if the loan is unfunded and therefore there is no cost basis. If the fee is not considered a yield enhancement because a service was provided, and the fee is payment for that service, the fee is deemed earned and recognized as fee income in the period the service has been completed.
Dividend income on preferred equity securities is recorded as dividend income on an accrual basis to the extent that such amounts are payable by the portfolio company and are expected to be collected. Dividend income on common equity securities is recorded on the record date for private portfolio companies. Each distribution received from LLC and LP investments is evaluated to determine if the distribution should be recorded as dividend income or a return of capital. Generally, we will not record distributions from equity investments in LLCs and LPs as dividend income unless there are sufficient accumulated tax-basis earnings and profits in the LLC or LP prior to the distribution. Distributions that are classified as a return of capital are recorded as a reduction in the cost basis of the investment.
Valuation of Portfolio Investments
As a BDC, we generally invest in illiquid securities including debt and, to a lesser extent, equity securities of middle-market companies. Under procedures established by our Board, we value investments for which market quotations are readily available and within a recent date at such market quotations. When doing so, we determine whether the quote obtained is sufficient in accordance with generally accepted accounting principles in the United States of America to determine the fair value of the security. Debt and equity securities that are not publicly traded or whose market prices are not readily available or whose market prices are not regularly updated are valued at fair value as determined in good faith by our Board. Such determination of fair values may involve subjective judgments and estimates. Investments purchased within 60 days of maturity are valued at cost plus accreted discount, or minus amortized premium, which approximates fair value.
Our Board is ultimately and solely responsible for determining the fair value of the portfolio investments that are not publicly traded, whose market prices are not readily available on a quarterly basis in good faith or any other situation where portfolio investments require a fair value determination. Because we expect that there will not be a readily available market for many of the investments in our portfolio, we expect to value many of our portfolio investments at fair value as determined in good faith by our Board using a documented valuation policy and a consistently applied valuation process. Due to the inherent uncertainty of determining the fair value of investments that do not have a readily available market value, the fair value of our investments may differ significantly from the values that would have been used had a readily available market value existed for such investments, and the differences could be material.
With respect to investments for which market quotations are not readily available, our Board undertakes a multi-step valuation process each quarter, as described below:
| • | the quarterly valuation process begins with each portfolio company or investment being initially evaluated and rated by the investment professionals responsible for the credit monitoring of the portfolio investment; |
| • | our Board engages one or more independent valuation firm(s) to conduct independent appraisals of a selection of investments for which market quotations are not readily available. We will consult with independent valuation firm(s) relative to each portfolio company at least once in every calendar year, but the independent appraisals are generally received quarterly; |
| • | to the extent an independent valuation firm is not engaged to conduct an investment appraisal on an investment for which market quotations are not readily available, the investment will be valued by the MC Advisors investment professional responsible for the credit monitoring; |
| • | preliminary valuation conclusions are then documented and discussed with the investment committee; |
| • | the audit committee of our Board reviews the preliminary valuations of MC Advisors and of the independent valuation firm(s) and responds and supplements the valuation recommendations to reflect any comments provided by the audit committee; and |
| • | our Board discusses these valuations and determines the fair value of each investment in the portfolio in good faith, based on the input of MC Advisors, the independent valuation firm(s) and the audit committee. |
| 60 |
We generally use the income approach to determine fair value for loans where market quotations are not readily available, as long as it is appropriate. If there is deterioration in credit quality or a debt investment is in workout status, we may consider other factors in determining the fair value, including the value attributable to the debt investment from the enterprise value of the portfolio company or the proceeds that would be received in a liquidation analysis. This liquidation analysis may also include probability weighting of alternative outcomes. We generally consider our debt to be performing loans if the borrower is not in default, the borrower is remitting payments in a timely manner, the loan is in covenant compliance and is otherwise not deemed to be impaired. In determining the fair value of the performing debt, we consider fluctuations in current interest rates, the trends in yields of debt instruments with similar credit ratings, financial condition of the borrower, economic conditions and other relevant factors, both qualitative and quantitative. In the event that a debt instrument is not performing, as defined above, we will evaluate the value of the collateral utilizing the same framework described above for a performing loan to determine the value of the debt instrument.
Under the income approach, discounted cash flow models are utilized to determine the present value of the future cash flow streams of our debt investments, based on future interest and principal payments as set forth in the associated loan agreements. In determining fair value under the income approach, we also consider the following factors: applicable market yields and leverage levels, credit quality, prepayment penalties, the nature and realizable value of any collateral, the portfolio company’s ability to make payments, and changes in the interest rate environment and the credit markets that generally may affect the price at which similar investments may be made.
Under the market approach, the enterprise value methodology is typically utilized to determine the fair value of an investment. There is no one methodology to estimate enterprise value and, in fact, for any one portfolio company, enterprise value is generally best expressed as a range of values, from which we derive a single estimate of enterprise value. In estimating the enterprise value of a portfolio company, we analyze various factors consistent with industry practice, including but not limited to original transaction multiples, the portfolio company’s historical and projected financial results, applicable market trading and transaction comparables, applicable market yields and leverage levels, the nature and realizable value of any collateral, the markets in which the portfolio company does business, and comparisons of financial ratios of peer companies that are public. Typically, the enterprise values of private companies are based on multiples of earnings before interest, income taxes, depreciation and amortization, cash flows, net income, revenues, or in limited cases, book value.
In addition, for certain debt investments, we may base our valuation on indicative bid and ask prices provided by an independent third-party pricing service. Bid prices reflect the highest price that we and others may be willing to pay. Ask prices represent the lowest price that we and others may be willing to accept. We generally use the midpoint of the bid/ask range as our best estimate of fair value of such investment.
Net Realized Gain or Loss and Net Change in Unrealized Gain or Loss
We measure realized gain or loss by the difference between the net proceeds from the sale and the amortized cost basis of the investment, without regard to unrealized gain or loss previously recognized. Net change in unrealized gain or loss reflects the change in portfolio investment values during the reporting period, including any reversal of previously recorded unrealized gain or loss, when gain or loss is realized. Additionally, we do not isolate the portion of the change in fair value resulting from foreign currency exchange rate fluctuations from the changes in fair values of the underlying investment. All fluctuations in fair value are included in net change in unrealized gain (loss) on our consolidated statements of operations. We report changes in the fair value of secured borrowings that are measured at fair value as a component of the net change in unrealized gain (loss) on secured borrowings on the consolidated statements of operations. The impact resulting from changes in foreign exchange rates on the revolving credit facility borrowings is included in net change in unrealized gain (loss) on foreign currency and other transactions.
Capital Gains Incentive Fee
Pursuant to the terms of the Investment Advisory with MC Advisors, the incentive fee on capital gains earned on liquidated investments of our portfolio is determined and payable in arrears as of the end of each calendar year (or upon termination of the Investment Advisory and Administrative Agreement). This fee equals 20% of our incentive fee capital gains (i.e., our realized capital gains on a cumulative basis from inception, calculated as of the end of the applicable period, net of all realized capital losses and unrealized capital depreciation on a cumulative basis), less the aggregate amount of any previously paid capital gains incentive fees. On a quarterly basis, we accrue for the capital gains incentive fee by calculating such fee as if it were due and payable as of the end of such period.
While the Investment Advisory Agreement with MC Advisors neither includes nor contemplates the inclusion of unrealized gains in the calculation of the capital gains incentive fee, pursuant to an interpretation of an American Institute for Certified Public Accountants Technical Practice Aid for investment companies, we include unrealized gains in the calculation of the capital gains incentive fee expense and related accrued capital gains incentive fee. This accrual reflects the incentive fees that would be payable to MC Advisors if our entire portfolio was liquidated at its fair value as of the balance sheet date even though MC Advisors is not entitled to an incentive fee with respect to unrealized gains unless and until such gains are actually realized.
During the year ended December 31, 2019 and 2018, we did not have any further reductions in accrued capital gains incentive fees as they were already at zero, primarily as a result of accumulated realized and unrealized losses on the portfolio. During the year ended December 31, 2017, we had a reduction in accrued capital gains incentive fees of $0.2 million, primarily as a result of net declines in portfolio valuations.
New Accounting Pronouncements
In August 2018, the FASB issued ASU 2018-13, Fair Value Measurement (Topic 820): Disclosure Framework – Changes to the Disclosure Requirements for Fair Value Measurement (“ASU 2018-13”). The primary objective of ASU 2018-13 is to improve the effectiveness of the disclosure requirements for fair value measurements in the notes to the financial statements. ASU 2018-13 is effective for interim and annual reporting periods beginning after December 15, 2019, although early adoption is permitted. We are currently evaluating the impact these changes will have on our consolidated financial statements and disclosures.
In March 2019, the Securities and Exchange Commission (the “SEC”) adopted the final rule under SEC Release No. 33-10618, Fast Act Modernization and Simplification of Regulation S-K, amending certain disclosure requirements. The amendments are intended to simplify certain disclosure requirements and to provide for a consistent set of rules to govern incorporating information by reference and hyperlinking, improve readability and navigability of disclosure documents, and discourage repetition and disclosure of immaterial information. We have adopted the final rule, as applicable, and determined the effect was limited to the modification and removal of certain disclosures.
| 61 |
ITEM 7A. QUANTITATIVE AND QUALITATIVE DISCLOSURES ABOUT MARKET RISK
We are subject to financial market risks, including changes in interest rates. The majority of the loans in our portfolio have floating interest rates, and we expect that our loans in the future may also have floating interest rates. These loans are usually based on a floating LIBOR and typically have interest rate re-set provisions that adjust applicable interest rates under such loans to current market rates on a monthly or quarterly basis. The majority of the loans in our current portfolio have interest rate floors which will effectively convert the loans to fixed rate loans in the event interest rates decrease. In addition, our revolving credit facility has a floating interest rate provision, whereas our SBA debentures and the 2023 Notes have fixed interest rates until maturity. We expect that other credit facilities into which we may enter in the future may have floating interest rate provisions.
The United Kingdom's Financial Conduct Authority, which regulates LIBOR, has announced that it intends to phase out LIBOR by the end of 2021. It is unclear if at that time whether LIBOR will cease to exist or if new methods of calculating LIBOR will be established such that it continues to exist after 2021. At this time, it is not possible to predict the effect of any such changes, any establishment of alternative reference rates or any other reforms to LIBOR that may be enacted. The elimination of LIBOR or any other changes or reforms to the determination or supervision of LIBOR could have an adverse impact on the market for or value of any LIBOR-linked securities, loans, and other financial obligations or extensions of credit held by or due to us or on our overall financial condition or results of operations. In addition, if LIBOR ceases to exist, we may need to renegotiate agreements extending beyond 2021 with our portfolio companies that utilize LIBOR as a factor in determining the interest rate, in order to replace LIBOR with the new standard that is established, which may have an adverse effect on our overall financial condition or results of operations. Following the replacement of LIBOR, some or all of these agreements may bear interest a lower interest rate, which could have an adverse impact on our results of operations. Moreover, if LIBOR ceases to exist, we may need to renegotiate certain terms of our credit facilities. If we are unable to do so, amounts drawn under our credit facilities may bear interest at a higher rate, which would increase the cost of our borrowings and, in turn, affect our results of operations.
Assuming that the consolidated statement of assets and liabilities as of December 31, 2019 were to remain constant and that we took no actions to alter our existing interest rate sensitivity, the following table shows the annualized impact of hypothetical base rate changes in interest rates (in thousands):
| Change in Interest Rates | Increase (decrease) in interest income |
Increase (decrease) in interest expense |
Net increase (decrease) in investment income |
|||||||||
| Down 25 basis points | $ | (1,346 | ) | $ | (451 | ) | $ | (895 | ) | |||
| Up 100 basis points | 5,098 | 1,803 | 3,295 | |||||||||
| Up 200 basis points | 10,591 | 3,606 | 6,985 | |||||||||
| Up 300 basis points | 16,084 | 5,409 | 10,675 | |||||||||
Although we believe that this analysis is indicative of our existing sensitivity to interest rate changes, it does not adjust for changes in the credit market, credit quality, the size and composition of the assets in our portfolio and other business developments, including borrowing under the credit facility or other borrowings that could affect net increase in net assets resulting from operations, or net income. Accordingly, we can offer no assurances that actual results would not differ materially from the analysis above.
We may in the future hedge against interest rate fluctuations by using standard hedging instruments such as futures, options and forward contracts to the extent permitted under the 1940 Act and applicable commodities laws. While hedging activities may insulate us against adverse changes in interest rates, they may also limit our ability to participate in the benefits of lower interest rates with respect to the investments in our portfolio with fixed interest rates or interest rate floors.
We may also have exposure to foreign currencies (currently the Great Britain pound) related to certain investments. Such investments are translated into U.S. dollars based on the spot rate at each balance sheet date, exposing us to movements in the exchange rate. In order to reduce our exposure to fluctuations in exchange rates, we generally borrow in Great Britain pounds under our revolving credit facility to finance such investments. As of December 31, 2019, we have non-U.S. dollar borrowings denominated in Great Britain pounds of £16.1 million ($21.3 million U.S. dollars) outstanding under the revolving credit facility. We may also enter into foreign currency forward contracts to mitigate foreign currency exposure. As of December 31, 2019, we had foreign currency forward contracts in place for £1.3 million associated with future interest payments on certain investments.
| 62 |
ITEM 8. FINANCIAL STATEMENTS AND SUPPLEMENTARY DATA
Our consolidated financial statements are annexed to this Annual Report beginning on page F-1.
ITEM 9. CHANGES IN AND DISAGREEMENTS WITH ACCOUNTANTS ON ACCOUNTING AND FINANCIAL DISCLOSURE
None.
ITEM 9A. CONTROLS AND PROCEDURES
Disclosure Controls and Procedures
In accordance with Rules 13a-15(b) and 15d-15(b) of the Securities Exchange Act of 1934, as amended (the “Exchange Act”), we, under the supervision and with the participation of our Chief Executive Officer and Chief Financial Officer, carried out an evaluation of the effectiveness of our disclosure controls and procedures (as defined in Rule 13a-15(e) and Rule 15d-15(e) of the Exchange Act). Based on that evaluation, our management, including the Chief Executive Officer and Chief Financial Officer, concluded that, at the end of the period covered by our Annual Report on Form 10-K, our disclosure controls and procedures were effective and provided reasonable assurance that information required to be disclosed in our periodic SEC filings is recorded, processed, summarized and reported within the time periods specified in the SEC’s rules and forms, and that such information is accumulated and communicated to our management, including our Chief Executive Officer and Chief Financial Officer, as appropriate, to allow timely decisions regarding required disclosure. Notwithstanding the foregoing, a control system, no matter how well designed and operated, can provide only reasonable, not absolute, assurance that it will detect or uncover failures within the Company to disclose material information otherwise required to be set forth in the Company’s periodic reports.
Management’s Annual Report on Internal Control Over Financial Reporting
Management’s Report on Internal Control and RSM US LLP’s Report of Independent Registered Public Accounting Firm are included in “Item 8. Consolidated Financial Statements and Supplementary Data” of this Annual Report on Form 10-K.
Changes in Internal Control Over Financial Reporting
No change occurred in our internal control over financial reporting (as defined in Rules 13a-15(f) and 15d-15(f) of the Exchange Act) during the quarter ended December 31, 2019 that has materially affected, or is reasonably likely to materially affect, our internal control over financial reporting.
None.
| 63 |
We will file a definitive Proxy Statement for our 2020 Annual Meeting of Stockholders with the Securities and Exchange Commission (the “SEC”), pursuant to Regulation 14A, not later than 120 days after the end of our fiscal year. Accordingly, certain information required by Part III has been omitted under General Instruction G(3) to Form 10-K. Only those sections of our definitive Proxy Statement that specifically address the items set forth herein are incorporated by reference.
ITEM 10. DIRECTORS, EXECUTIVE OFFICERS AND CORPORATE GOVERNANCE
The information required by Item 10 is hereby incorporated by reference from our definitive Proxy Statement relating to our 2020 Annual Meeting of Stockholders, to be filed with the SEC within 120 days following the end of our fiscal year.
ITEM 11. EXECUTIVE COMPENSATION
The information required by Item 11 is hereby incorporated by reference from our definitive Proxy Statement relating to our 2020 Annual Meeting of Stockholders, to be filed with the SEC within 120 days following the end of our fiscal year.
ITEM 12. SECURITY OWNERSHIP OF CERTAIN BENEFICIAL OWNERS AND MANAGEMENT AND RELATED STOCKHOLDER MATTERS
The information required by Item 12 is hereby incorporated by reference from our definitive Proxy Statement relating to our 2020 Annual Meeting of Stockholders, to be filed with the SEC within 120 days following the end of our fiscal year.
ITEM 13. CERTAIN RELATIONSHIPS AND RELATED TRANSACTIONS, AND DIRECTOR INDEPENDENCE
The information required by Item 13 is hereby incorporated by reference from our definitive Proxy Statement relating to our 2020 Annual Meeting of Stockholders, to be filed with the SEC within 120 days following the end of our fiscal year.
ITEM 14. PRINCIPAL ACCOUNTANT FEES AND SERVICES
The information required by Item 14 is hereby incorporated by reference from our definitive Proxy Statement relating to our 2020 Annual Meeting of Stockholders, to be filed with the SEC within 120 days following the end of our fiscal year.
| 64 |
ITEM 15. EXHIBITS AND FINANCIAL STATEMENT SCHEDULES
The following exhibits are included, or incorporated by reference, in this Annual Report on Form 10-K for the year ended December 31, 2019 (and are numbered in accordance with Item 601 of Regulation S-K).
(a)(1) and (2) Consolidated Financial Statements and Schedules
See the Index to Consolidated Financial Statements at page F-1 of this report.
| 65 |
INDEX TO CONSOLIDATED FINANCIAL STATEMENTS
| F-1 |
MANAGEMENT’S REPORT ON INTERNAL CONTROL OVER FINANCIAL REPORTING
The management of Monroe Capital Corporation (“MRCC,” and collectively with its subsidiaries, the “Company,” “we,” “us” and “our”) is responsible for establishing and maintaining adequate internal control over financial reporting. Our internal control system is a process designed to provide reasonable assurance to our management and board of directors regarding the preparation and fair presentation of published financial statements.
Monroe Capital Corporation’s internal control over financial reporting includes policies and procedures that pertain to the maintenance of records that, in reasonable detail, accurately and fairly reflect transactions recorded necessary to permit the preparation of financial statements in accordance with U.S. generally accepted accounting principles. Our policies and procedures also provide reasonable assurance that receipts and expenditures are being made only in accordance with authorizations of management and the directors of Monroe Capital Corporation, and provide reasonable assurance regarding prevention or timely detection of unauthorized acquisition, use or disposition or our assets that could have a material effect on our financial statements.
All internal control systems, no matter how well designed, have inherent limitations. Therefore, even those systems determined to be effective can provide only reasonable assurance with respect to financial statement preparation and presentation. Also, projections of any evaluation of effectiveness as to future periods are subject to the risk that controls may become inadequate because of changes in conditions, or that the degree of compliance with the policies and procedures may deteriorate.
Management assessed the effectiveness of Monroe Capital Corporation’s internal control over financial reporting as of December 31, 2019. In making this assessment, we used the criteria set forth by the Committee of Sponsoring Organizations of the Treadway Commission in Internal Control – Integrated Framework issued in 2013. Based on the assessment, management believes that, as of December 31, 2019, our internal control over financial reporting is effective based on those criteria.
Monroe Capital Corporation’s independent registered public accounting firm that audited the financial statements has issued an audit report on the effectiveness of our internal control over financial reporting as of December 31, 2019. This report appears on F-4.
| F-2 |
REPORT OF INDEPENDENT REGISTERED PUBLIC ACCOUNTING FIRM
To the Stockholders and the Board of Directors of
Monroe Capital Corporation and Subsidiaries
Opinion on the Financial Statements
We have audited the accompanying consolidated statements of assets and liabilities, including the consolidated schedules of investments, of Monroe Capital Corporation and Subsidiaries (the Company) as of December 31, 2019 and 2018, and the related consolidated statements of operations, changes in net assets and cash flows for each of the three years in the period ended December 31, 2019, and the related notes to the consolidated financial statements (collectively, the financial statements). In our opinion, the financial statements present fairly, in all material respects, the financial position of the Company as of December 31, 2019 and 2018, and the results of its operations and its cash flows for each of the three years in the period ended December 31, 2019, in conformity with accounting principles generally accepted in the United States of America.
We have also audited, in accordance with the standards of the Public Company Accounting Oversight Board (United States) (PCAOB), the Company’s internal control over financial reporting as of December 31, 2019, based on criteria established in Internal Control — Integrated Framework issued by the Committee of Sponsoring Organizations of the Treadway Commission in 2013, and our report dated March 3, 2020, expressed an unqualified opinion on the effectiveness of the Company’s internal control over financial reporting.
Basis for Opinion
These financial statements are the responsibility of the Company’s management. Our responsibility is to express an opinion on the Company’s financial statements based on our audits. We are a public accounting firm registered with the PCAOB and are required to be independent with respect to the Company in accordance with U.S. federal securities laws and the applicable rules and regulations of the Securities and Exchange Commission and the PCAOB.
We conducted our audits in accordance with the standards of the PCAOB. Those standards require that we plan and perform the audits to obtain reasonable assurance about whether the financial statements are free of material misstatement, whether due to error or fraud. Our audits included performing procedures to assess the risks of material misstatement of the financial statements, whether due to error or fraud, and performing procedures that respond to those risks. Such procedures included examining, on a test basis, evidence regarding the amounts and disclosures in the financial statements. Our audits also included evaluating the accounting principles used and significant estimates made by management, as well as evaluating the overall presentation of the financial statements. Our procedures included confirmation of investments owned as of December 31, 2019 and 2018, by correspondence with the custodians and issuers of equity securities and other appropriate procedures where replies from issuers of equity securities were not received. We believe that our audits provide a reasonable basis for our opinion.
/s/ RSM US LLP
We have served as the Company's auditor since 2011.
Chicago, Illinois
March 3, 2020
| F-3 |
REPORT OF INDEPENDENT REGISTERED PUBLIC ACCOUNTING FIRM ON INTERNAL CONTROL OVER FINANCIAL REPORTING
To the Stockholders and the Board of Directors of
Monroe Capital Corporation and Subsidiaries
Opinion on the Internal Control Over Financial Reporting
We have audited Monroe Capital Corporation and Subsidiaries’ (the Company) internal control over financial reporting as of December 31, 2019, based on criteria established in Internal Control — Integrated Framework issued by the Committee of Sponsoring Organizations of the Treadway Commission in 2013. In our opinion, the Company maintained, in all material respects, effective internal control over financial reporting as of December 31, 2019, based on criteria established in Internal Control — Integrated Framework issued by the Committee of Sponsoring Organizations of the Treadway Commission in 2013.
We have also audited, in accordance with the standards of the Public Company Accounting Oversight Board (United States) (PCAOB), the consolidated statements of assets and liabilities, including the consolidated schedules of investments, of the Company as of December 31, 2019 and 2018, and the related consolidated statements of operations, changes in net assets and cash flows for each of the three years in the period ended December 31, 2019, and the related notes to the consolidated financial statements of the Company, and our report dated March 3, 2020 expressed an unqualified opinion.
Basis for Opinion
The Company’s management is responsible for maintaining effective internal control over financial reporting and for its assessment of the effectiveness of internal control over financial reporting in the accompanying Management’s Report on Internal Control over Financial Reporting. Our responsibility is to express an opinion on the Company’s internal control over financial reporting based on our audit. We are a public accounting firm registered with the PCAOB and are required to be independent with respect to the Company in accordance with U.S. federal securities laws and the applicable rules and regulations of the Securities and Exchange Commission and the PCAOB.
We conducted our audit in accordance with the standards of the PCAOB. Those standards require that we plan and perform the audit to obtain reasonable assurance about whether effective internal control over financial reporting was maintained in all material respects. Our audit included obtaining an understanding of internal control over financial reporting, assessing the risk that a material weakness exists, and testing and evaluating the design and operating effectiveness of internal control based on the assessed risk. Our audit also included performing such other procedures as we considered necessary in the circumstances. We believe that our audit provides a reasonable basis for our opinion.
Definition and Limitations of Internal Control Over Financial Reporting
A company’s internal control over financial reporting is a process designed to provide reasonable assurance regarding the reliability of financial reporting and the preparation of financial statements for external purposes in accordance with generally accepted accounting principles. A company’s internal control over financial reporting includes those policies and procedures that (1) pertain to the maintenance of records that, in reasonable detail, accurately and fairly reflect the transactions and dispositions of the assets of the company; (2) provide reasonable assurance that transactions are recorded as necessary to permit preparation of financial statements in accordance with generally accepted accounting principles, and that receipts and expenditures of the company are being made only in accordance with authorizations of management and directors of the company; and (3) provide reasonable assurance regarding prevention or timely detection of unauthorized acquisition, use or disposition of the company’s assets that could have a material effect on the financial statements.
Because of its inherent limitations, internal control over financial reporting may not prevent or detect misstatements. Also, projections of any evaluation of effectiveness to future periods are subject to the risk that controls may become inadequate because of changes in conditions, or that the degree of compliance with the policies or procedures may deteriorate.
/s/ RSM US LLP
Chicago, Illinois
March 3, 2020
| F-4 |
CONSOLIDATED STATEMENTS OF ASSETS AND LIABILITIES
(in thousands, except per share data)
| December 31, 2019 | December 31, 2018 | |||||||
| ASSETS | ||||||||
| Investments, at fair value: | ||||||||
| Non-controlled/non-affiliate company investments | $ | 513,959 | $ | 468,720 | ||||
| Non-controlled affiliate company investments | 59,860 | 57,267 | ||||||
| Controlled affiliate company investments | 42,412 | 27,634 | ||||||
| Total investments, at fair value (amortized cost of: $634,736 and $564,124, respectively) | 616,231 | 553,621 | ||||||
| Cash | 2,234 | 3,744 | ||||||
| Restricted cash | 27,409 | 13,982 | ||||||
| Unrealized gain on foreign currency forward contracts | — | 16 | ||||||
| Interest receivable | 8,689 | 7,774 | ||||||
| Other assets | 495 | 692 | ||||||
| Total assets | 655,058 | 579,829 | ||||||
| LIABILITIES | ||||||||
| Debt: | ||||||||
| Revolving credit facility | 180,294 | 136,026 | ||||||
| 2023 Notes | 109,000 | 69,000 | ||||||
| SBA debentures payable | 115,000 | 115,000 | ||||||
| Total debt | 404,294 | 320,026 | ||||||
| Less: Unamortized deferred financing costs | (8,053 | ) | (6,262 | ) | ||||
| Total debt, less unamortized deferred financing costs | 396,241 | 313,764 | ||||||
| Interest payable | 2,763 | 2,550 | ||||||
| Unrealized loss on foreign currency forward contracts | 59 | — | ||||||
| Management fees payable | 2,751 | 2,318 | ||||||
| Incentive fees payable | 1,374 | — | ||||||
| Accounts payable and accrued expenses | 2,513 | 2,430 | ||||||
| Total liabilities | 405,701 | 321,062 | ||||||
| Net assets | $ | 249,357 | $ | 258,767 | ||||
| Commitments and contingencies (See Note 12) | ||||||||
| ANALYSIS OF NET ASSETS | ||||||||
| Common stock, $0.001 par value, 100,000 shares authorized, 20,445 and 20,445 shares issued and outstanding, respectively | $ | 20 | $ | 20 | ||||
| Capital in excess of par value | 288,850 | 288,911 | ||||||
| Accumulated undistributed (overdistributed) earnings | (39,513 | ) | (30,164 | ) | ||||
| Total net assets | $ | 249,357 | $ | 258,767 | ||||
| Net asset value per share | $ | 12.20 | $ | 12.66 | ||||
See Notes to Consolidated Financial Statements.
| F-5 |
CONSOLIDATED STATEMENTS OF OPERATIONS
(in thousands, except per share data)
| Year ended December 31, | ||||||||||||
| 2019 | 2018 | 2017 | ||||||||||
| Investment income: | ||||||||||||
| Non-controlled/non-affiliate company investments: | ||||||||||||
| Interest income | $ | 54,388 | $ | 46,050 | $ | 40,935 | ||||||
| Payment-in-kind interest income | 544 | 501 | 1,120 | |||||||||
| Dividend income | 65 | 842 | 1,002 | |||||||||
| Fee income | 1,926 | 1,941 | 1,890 | |||||||||
| Total investment income from non-controlled/non-affiliate company investments | 56,923 | 49,334 | 44,947 | |||||||||
| Non-controlled affiliate company investments: | ||||||||||||
| Interest income | 2,231 | 5,496 | 4,957 | |||||||||
| Payment-in-kind interest income | 4,994 | 1,746 | 609 | |||||||||
| Fee income | — | 83 | — | |||||||||
| Total investment income from non-controlled affiliate company investments | 7,225 | 7,325 | 5,566 | |||||||||
| Controlled affiliate company investments: | ||||||||||||
| Interest income | — | — | 594 | |||||||||
| Dividend income | 4,045 | 1,725 | — | |||||||||
| Total investment income from controlled affiliate company investments | 4,045 | 1,725 | 594 | |||||||||
| Total investment income | 68,193 | 58,384 | 51,107 | |||||||||
| Operating expenses: | ||||||||||||
| Interest and other debt financing expenses | 20,268 | 12,270 | 8,312 | |||||||||
| Base management fees | 10,780 | 8,879 | 7,726 | |||||||||
| Incentive fees | 5,611 | 1,751 | 5,686 | |||||||||
| Professional fees | 1,209 | 1,172 | 1,243 | |||||||||
| Administrative service fees | 1,309 | 1,327 | 1,248 | |||||||||
| General and administrative expenses | 991 | 931 | 948 | |||||||||
| Directors' fees | 156 | 143 | 148 | |||||||||
| Expenses before incentive fee waiver | 40,324 | 26,473 | 25,311 | |||||||||
| Incentive fee waiver | (1,182 | ) | — | (308 | ) | |||||||
| Total expenses, net of incentive fee waiver | 39,142 | 26,473 | 25,003 | |||||||||
| Net investment income before income taxes | 29,051 | 31,911 | 26,104 | |||||||||
| Income taxes, including excise taxes | 17 | 11 | 100 | |||||||||
| Net investment income | 29,034 | 31,900 | 26,004 | |||||||||
| Net gain (loss): | ||||||||||||
| Net realized gain (loss): | ||||||||||||
| Non-controlled/non-affiliate company investments | 34 | (1,325 | ) | (439 | ) | |||||||
| Non-controlled affiliate company investments | (967 | ) | (28,689 | ) | — | |||||||
| Secured borrowings | — | — | 66 | |||||||||
| Foreign currency forward contracts | 12 | (3 | ) | — | ||||||||
| Foreign currency and other transactions | (4 | ) | (13 | ) | 1 | |||||||
| Net realized gain (loss) | (925 | ) | (30,030 | ) | (372 | ) | ||||||
| Net change in unrealized gain (loss): | ||||||||||||
| Non-controlled/non-affiliate company investments | 859 | (11,375 | ) | 4,764 | ||||||||
| Non-controlled affiliate company investments | (8,689 | ) | 14,020 | (14,635 | ) | |||||||
| Controlled affiliate company investments | (172 | ) | 294 | (3,249 | ) | |||||||
| Secured borrowings | — | — | (6 | ) | ||||||||
| Foreign currency forward contracts | (75 | ) | 16 | — | ||||||||
| Foreign currency and other transactions | (818 | ) | 1,023 | (354 | ) | |||||||
| Net change in unrealized gain (loss) | (8,895 | ) | 3,978 | (13,480 | ) | |||||||
| Net gain (loss) | (9,820 | ) | (26,052 | ) | (13,852 | ) | ||||||
| Net increase (decrease) in net assets resulting from operations | $ | 19,214 | $ | 5,848 | $ | 12,152 | ||||||
| Per common share data: | ||||||||||||
| Net investment income per share - basic and diluted | $ | 1.42 | $ | 1.57 | $ | 1.40 | ||||||
| Net increase (decrease) in net assets resulting from operations per share - basic and diluted | $ | 0.94 | $ | 0.29 | $ | 0.65 | ||||||
| Weighted average common shares outstanding - basic and diluted | 20,445 | 20,337 | 18,625 | |||||||||
See Notes to Consolidated Financial Statements.
| F-6 |
CONSOLIDATED STATEMENTS OF CHANGES IN NET ASSETS
(in thousands)
| Common Stock | Accumulated | |||||||||||||||||||
Number of shares | Par
value | Capital
in excess of par value | undistributed (overdistributed) earnings | Total
net assets | ||||||||||||||||
| Balances at December 31, 2016 | 16,582 | $ | 17 | $ | 233,526 | $ | 7,307 | $ | 240,850 | |||||||||||
| Net investment income | — | — | — | 26,004 | 26,004 | |||||||||||||||
| Net realized gain (loss) | — | — | — | (372 | ) | (372 | ) | |||||||||||||
| Net change in unrealized gain (loss) | — | — | — | (13,480 | ) | (13,480 | ) | |||||||||||||
| Issuance of common stock, net of offering and underwriting costs | 3,624 | 3 | 52,218 | — | 52,221 | |||||||||||||||
| Distributions to stockholders | 34 | — | 525 | (27,049 | ) | (26,524 | ) | |||||||||||||
| Tax reclassification of stockholders' equity in accordance with generally accepted accounting principles | — | — | (128 | ) | 128 | — | ||||||||||||||
| Balances at December 31, 2017 | 20,240 | $ | 20 | $ | 286,141 | $ | (7,462 | ) | $ | 278,699 | ||||||||||
| Net investment income | — | $ | — | $ | — | $ | 31,900 | $ | 31,900 | |||||||||||
| Net realized gain (loss) | — | — | — | (30,030 | ) | (30,030 | ) | |||||||||||||
| Net change in unrealized gain (loss) | — | — | — | 3,978 | 3,978 | |||||||||||||||
| Issuance of common stock, net of offering and underwriting costs | 183 | — | 2,402 | — | 2,402 | |||||||||||||||
| Distributions to stockholders | 22 | — | 301 | (28,483 | ) | (28,182 | ) | |||||||||||||
| Tax reclassification of stockholders’ equity in accordance with generally accepted accounting principles | — | — | 67 | (67 | ) | — | ||||||||||||||
| Balances at December 31, 2018 | 20,445 | $ | 20 | $ | 288,911 | $ | (30,164 | ) | $ | 258,767 | ||||||||||
| Net investment income | — | $ | — | $ | — | $ | 29,034 | $ | 29,034 | |||||||||||
| Net realized gain (loss) | — | — | — | (925 | ) | (925 | ) | |||||||||||||
| Net change in unrealized gain (loss) | — | — | — | (8,895 | ) | (8,895 | ) | |||||||||||||
| Issuance of common stock, net of offering and underwriting costs | — | — | — | — | — | |||||||||||||||
| Distributions to stockholders | — | — | — | (28,624 | ) | (28,624 | ) | |||||||||||||
| Tax reclassification of stockholders’ equity in accordance with generally accepted accounting principles | — | — | (61 | ) | 61 | — | ||||||||||||||
| Balances at December 31, 2019 | 20,445 | $ | 20 | $ | 288,850 | $ | (39,513 | ) | $ | 249,357 | ||||||||||
See Notes to Consolidated Financial Statements.
| F-7 |
CONSOLIDATED STATEMENTS OF CASH FLOWS
(in thousands)
| Year ended December 31, | ||||||||||||
| 2019 | 2018 | 2017 | ||||||||||
| Cash flows from operating activities: | ||||||||||||
| Net increase (decrease) in net assets resulting from operations | $ | 19,214 | $ | 5,848 | $ | 12,152 | ||||||
| Adjustments to reconcile net increase (decrease) in net assets resulting from operations to net cash provided by (used in) operating activities: | ||||||||||||
| Net realized (gain) loss on investments | 933 | 30,014 | 439 | |||||||||
| Net realized (gain) loss on secured borrowings | — | — | (66 | ) | ||||||||
| Net realized (gain) loss on foreign currency forward contracts | (12 | ) | 3 | — | ||||||||
| Net realized (gain) loss on foreign currency and other transactions | 4 | 13 | (1 | ) | ||||||||
| Net change in unrealized (gain) loss on investments | 8,002 | (2,939 | ) | 13,120 | ||||||||
| Net change in unrealized (gain) loss on secured borrowings | — | — | 6 | |||||||||
| Net change in unrealized (gain) loss on foreign currency forward contracts | 75 | (16 | ) | — | ||||||||
| Net change in unrealized (gain) loss on foreign currency and other transactions | 818 | (1,023 | ) | 354 | ||||||||
| Payment-in-kind interest income | (5,538 | ) | (2,247 | ) | (1,729 | ) | ||||||
| Payment-in-kind dividend income | — | (792 | ) | (241 | ) | |||||||
| Net accretion of discounts and amortization of premiums | (1,482 | ) | (2,263 | ) | (1,860 | ) | ||||||
| Purchases of investments | (230,605 | ) | (240,420 | ) | (264,393 | ) | ||||||
| Proceeds from principal payments, sales of investments and settlement of forward contracts | 166,092 | 159,161 | 173,446 | |||||||||
| Amortization of deferred financing costs | 1,869 | 1,410 | 1,042 | |||||||||
| Changes in operating assets and liabilities: | ||||||||||||
| Interest receivable | (915 | ) | (2,439 | ) | (2,692 | ) | ||||||
| Other assets | 197 | 68 | (109 | ) | ||||||||
| Interest payable | 213 | 1,015 | 800 | |||||||||
| Management fees payable | 433 | 254 | 315 | |||||||||
| Incentive fees payable | 1,374 | (1,157 | ) | (65 | ) | |||||||
| Accounts payable and accrued expenses | 83 | 395 | (85 | ) | ||||||||
| Net cash provided by (used in) operating activities | (39,245 | ) | (55,115 | ) | (69,567 | ) | ||||||
| Cash flows from financing activities: | ||||||||||||
| Borrowings on revolving credit facility | 334,997 | 194,307 | 184,538 | |||||||||
| Repayments of revolving credit facility | (291,550 | ) | (174,350 | ) | (196,800 | ) | ||||||
| Proceeds from 2023 Notes | 40,000 | 69,000 | — | |||||||||
| SBA debentures borrowings | — | 5,480 | 58,020 | |||||||||
| Payments of deferred financing costs | (3,660 | ) | (3,002 | ) | (1,766 | ) | ||||||
| Repayments on secured borrowings | — | — | (1,254 | ) | ||||||||
| Proceeds from shares sold, net of offering and underwriting costs | — | 2,402 | 52,221 | |||||||||
| Stockholder distributions paid, net of stock issued under the dividend reinvestment plan of $0, $301 and $525, respectively | (28,624 | ) | (28,182 | ) | (26,524 | ) | ||||||
| Net cash provided by (used in) financing activities | 51,163 | 65,655 | 68,435 | |||||||||
| Net increase (decrease) in Cash and Restricted Cash | 11,918 | 10,540 | (1,132 | ) | ||||||||
| Effect of foreign currency exchange rates | (1 | ) | (13 | ) | — | |||||||
| Cash and Restricted Cash, beginning of year | 17,726 | 7,199 | 8,331 | |||||||||
| Cash and Restricted Cash, end of year | $ | 29,643 | $ | 17,726 | $ | 7,199 | ||||||
| Supplemental disclosure of cash flow information: | ||||||||||||
| Cash interest paid during the year | $ | 18,130 | $ | 9,770 | $ | 6,315 | ||||||
| Cash paid (refund received) for excise taxes during the year | $ | (13 | ) | $ | 91 | $ | 495 | |||||
The following tables provide a reconciliation of cash and restricted cash reported on the Consolidated Statements of Assets and Liabilities that sum to the total of the same such amounts on the Consolidated Statements of Cash Flows:
| December 31, 2019 | December 31, 2018 | December 31, 2017 | ||||||||||
| Cash | $ | 2,234 | $ | 3,744 | $ | 4,332 | ||||||
| Restricted cash | 27,409 | 13,982 | 2,867 | |||||||||
| Total cash and restricted cash shown on the Consolidated Statements of Cash Flows | $ | 29,643 | $ | 17,726 | $ | 7,199 | ||||||
See Notes to Consolidated Financial Statements.
| F-8 |
CONSOLIDATED SCHEDULE OF INVESTMENTS
December 31, 2019
(in thousands, except for shares and units)
| Portfolio Company (a) | Spread
Above Index (b) |
Interest Rate |
Acquisition
Date (c) |
Maturity | Principal | Amortized
Cost |
Fair Value (d) |
%
of Net Assets (e) |
||||||||||||||||||
| Non-Controlled/Non-Affiliate Company Investments | ||||||||||||||||||||||||||
| Senior Secured Loans | ||||||||||||||||||||||||||
| Automotive | ||||||||||||||||||||||||||
| Hastings Manufacturing Company | L+8.25% | 10.05 | % | 4/24/2018 | 4/24/2023 | 2,812 | $ | 2,771 | $ | 2,705 | 1.0 | % | ||||||||||||||
| Magneto & Diesel Acquisition, Inc. | L+5.50% | 7.30 | % | 12/18/2018 | 12/18/2023 | 4,950 | 4,877 | 4,957 | 2.0 | % | ||||||||||||||||
| Magneto & Diesel Acquisition, Inc. (Revolver) (f) | L+5.50% | 7.30 | % | 12/18/2018 | 12/18/2023 | 500 | 125 | 125 | 0.1 | % | ||||||||||||||||
| 8,262 | 7,773 | 7,787 | 3.1 | % | ||||||||||||||||||||||
| Banking, Finance, Insurance & Real Estate | ||||||||||||||||||||||||||
| 777 SPV I LLC (Delayed Draw) (g) (h) | L+8.50% | 10.30 | % | 4/15/2019 | 4/14/2023 | 5,325 | 5,267 | 5,341 | 2.1 | % | ||||||||||||||||
| Echelon Funding I, LLC (h) | L+7.50% | 9.28 | % | 12/31/2019 | 1/11/2021 | 2,205 | 2,172 | 2,204 | 0.9 | % | ||||||||||||||||
| Echelon Funding I, LLC (Delayed Draw) (f) (g) (h) | L+7.50% | 9.19 | % | 2/24/2017 | 1/11/2021 | 14,175 | 10,200 | 10,197 | 4.1 | % | ||||||||||||||||
| HFZ Capital Group, LLC (h) | L+10.00% | 12.10 | % | 10/20/2017 | 11/25/2020 | 18,000 | 17,991 | 17,995 | 7.2 | % | ||||||||||||||||
| HFZ Member RB Portfolio, LLC (h) | L+12.00% | 14.10 | % | 10/30/2018 | 10/29/2021 | 9,780 | 9,765 | 9,765 | 3.9 | % | ||||||||||||||||
| Kudu Investment Holdings, LLC (h) | L+6.25% | 8.18 | % | 12/23/2019 | 12/23/2025 | 5,500 | 5,404 | 5,404 | 2.2 | % | ||||||||||||||||
| Kudu Investment Holdings, LLC (Delayed Draw) (f) (g) (h) | L+6.25% | 8.18 | % | 12/23/2019 | 12/23/2025 | 3,667 | — | — | 0.0 | % | ||||||||||||||||
| Kudu Investment Holdings, LLC (Revolver) (f) (h) | L+6.25% | 8.18 | % | 12/23/2019 | 12/23/2025 | 482 | — | — | 0.0 | % | ||||||||||||||||
| Liftforward SPV II, LLC (g) (h) | L+10.75% | 12.55 | % | 11/10/2016 | 11/10/2020 | 3,240 | 3,235 | 3,240 | 1.3 | % | ||||||||||||||||
| PKS Holdings, LLC (h) | L+14.25% | 15.94 | % | 11/30/2017 | 11/30/2022 | 1,645 | 1,512 | 1,656 | 0.7 | % | ||||||||||||||||
| PKS Holdings, LLC (Revolver) (f) (h) | L+14.25% | 15.94 | % | 11/30/2017 | 11/30/2022 | 80 | — | — | 0.0 | % | ||||||||||||||||
| TCP-NG (U.S.), LLC (h) | L+7.25% | 9.21 | % | 8/23/2019 | 8/22/2024 | 2,925 | 2,880 | 2,919 | 1.2 | % | ||||||||||||||||
| TCP-NG (U.S.), LLC (Revolver) (f) (h) | L+7.25% | 9.21 | % | 8/23/2019 | 8/22/2024 | 180 | — | — | 0.0 | % | ||||||||||||||||
| 67,204 | 58,426 | 58,721 | 23.6 | % | ||||||||||||||||||||||
| Beverage, Food & Tobacco | ||||||||||||||||||||||||||
| California Pizza Kitchen, Inc. | L+6.00% | 7.91 | % | 8/19/2016 | 8/23/2022 | 6,772 | 6,737 | 5,910 | 2.4 | % | ||||||||||||||||
| Toojay's Management LLC | L+5.50% | 7.30 | % | 10/26/2018 | 10/26/2022 | 3,465 | 3,413 | 3,472 | 1.4 | % | ||||||||||||||||
| Toojay's Management LLC | L+5.50% | 7.30 | % | 10/26/2018 | 10/26/2022 | 476 | 476 | 476 | 0.2 | % | ||||||||||||||||
| Toojay's Management LLC (Revolver) (f) | L+5.50% | 7.30 | % | 10/26/2018 | 10/26/2022 | 318 | 239 | 238 | 0.1 | % | ||||||||||||||||
| 11,031 | 10,865 | 10,096 | 4.1 | % | ||||||||||||||||||||||
| Chemicals, Plastics & Rubber | ||||||||||||||||||||||||||
| Midwest Composite Technologies, LLC (i) | L+6.50% | 8.30 | % | 12/2/2019 | 8/31/2023 | 14,962 | 14,667 | 14,980 | 6.0 | % | ||||||||||||||||
| Midwest Composite Technologies, LLC | L+6.50% | 8.30 | % | 8/31/2018 | 8/31/2023 | 889 | 876 | 890 | 0.4 | % | ||||||||||||||||
| Midwest Composite Technologies, LLC (Delayed Draw) (f) (g) | L+6.50% | 8.30 | % | 8/31/2018 | 8/31/2023 | 510 | 60 | 60 | 0.0 | % | ||||||||||||||||
| Midwest Composite Technologies, LLC (Revolver) (f) | L+6.50% | 8.30 | % | 8/31/2018 | 8/31/2023 | 90 | — | — | 0.0 | % | ||||||||||||||||
| Valudor Products, LLC | L+7.50% | 9.30 | % | 6/18/2018 | 6/19/2023 | 1,563 | 1,539 | 1,522 | 0.6 | % | ||||||||||||||||
| Valudor Products, LLC (j) | L+7.50% | 9.30 | % | 6/18/2018 | 6/19/2023 | 211 | 206 | 205 | 0.1 | % | ||||||||||||||||
| Valudor Products, LLC (Revolver) (f) | L+9.50% | 11.30 | % | 6/18/2018 | 6/19/2023 | 818 | 325 | 318 | 0.1 | % | ||||||||||||||||
| 19,043 | 17,673 | 17,975 | 7.2 | % | ||||||||||||||||||||||
| Construction & Building | ||||||||||||||||||||||||||
| Cali Bamboo, LLC | L+7.00% | 8.80 | % | 7/10/2015 | 7/10/2020 | 7,855 | 7,822 | 7,602 | 3.0 | % | ||||||||||||||||
| Cali Bamboo, LLC (Revolver) (f) | L+7.00% | 8.80 | % | 7/10/2015 | 7/10/2020 | 2,165 | 930 | 900 | 0.4 | % | ||||||||||||||||
| Dude Solutions Holdings, Inc. | L+7.00% | 8.80 | % | 6/14/2019 | 6/13/2025 | 10,000 | 9,787 | 9,970 | 4.0 | % | ||||||||||||||||
| Dude Solutions Holdings, Inc. (Revolver) (f) | L+7.00% | 8.80 | % | 6/14/2019 | 6/13/2025 | 1,304 | — | — | 0.0 | % | ||||||||||||||||
| 21,324 | 18,539 | 18,472 | 7.4 | % | ||||||||||||||||||||||
| Consumer Goods: Durable | ||||||||||||||||||||||||||
| Nova Wildcat Amerock, LLC | L+5.75% | 7.55 | % | 10/12/2018 | 10/12/2023 | 9,182 | 9,033 | 9,138 | 3.7 | % | ||||||||||||||||
| Nova Wildcat Amerock, LLC (Revolver) (f) | L+5.75% | 7.55 | % | 10/12/2018 | 10/12/2023 | 931 | — | — | 0.0 | % | ||||||||||||||||
| Parterre Flooring & Surface Systems, LLC (i) | L+9.00% | 10.80 | % | 8/22/2017 | 8/22/2022 | 8,550 | 8,448 | 7,486 | 3.0 | % | ||||||||||||||||
| Parterre Flooring & Surface Systems, LLC (Revolver) | L+9.00% | 10.80 | % | 8/22/2017 | 8/22/2022 | 696 | 696 | 609 | 0.2 | % | ||||||||||||||||
| 19,359 | 18,177 | 17,233 | 6.9 | % | ||||||||||||||||||||||
| Consumer Goods: Non-Durable | ||||||||||||||||||||||||||
| Quirch Foods Holdings, LLC | L+6.00% | 7.79 | % | 2/14/2019 | 12/19/2025 | 1,980 | 1,962 | 1,980 | 0.8 | % | ||||||||||||||||
| 1,980 | 1,962 | 1,980 | 0.8 | % | ||||||||||||||||||||||
| Energy: Oil & Gas | ||||||||||||||||||||||||||
| BJ Services, LLC | L+7.00% | 8.91 | % | 1/28/2019 | 1/3/2023 | 4,331 | 4,296 | 4,306 | 1.7 | % | ||||||||||||||||
| 4,331 | 4,296 | 4,306 | 1.7 | % | ||||||||||||||||||||||
| Environmental Industries | ||||||||||||||||||||||||||
| StormTrap, LLC | L+5.50% | 7.30 | % | 12/10/2018 | 12/8/2023 | 7,920 | 7,804 | 7,609 | 3.0 | % | ||||||||||||||||
| StormTrap, LLC (Revolver) (f) | L+5.50% | 7.30 | % | 12/10/2018 | 12/8/2023 | 432 | — | — | 0.0 | % | ||||||||||||||||
| Synergy Environmental Corporation (i) | L+8.00% | 9.80 | % | 4/29/2016 | 9/30/2021 | 2,893 | 2,869 | 2,884 | 1.2 | % | ||||||||||||||||
| Synergy Environmental Corporation (i) | L+8.00% | 9.80 | % | 4/29/2016 | 9/30/2021 | 484 | 479 | 482 | 0.2 | % | ||||||||||||||||
| Synergy Environmental Corporation | L+8.00% | 9.80 | % | 4/29/2016 | 9/30/2021 | 827 | 827 | 824 | 0.3 | % | ||||||||||||||||
| Synergy Environmental Corporation (Revolver) (f) | L+8.00% | 9.80 | % | 4/29/2016 | 9/30/2021 | 671 | 203 | 202 | 0.1 | % | ||||||||||||||||
| 13,227 | 12,182 | 12,001 | 4.8 | % | ||||||||||||||||||||||
| F-9 |
MONROE CAPITAL CORPORATION
CONSOLIDATED SCHEDULE OF INVESTMENTS – (continued)
December 31, 2019
(in thousands, except for shares and units)
| Portfolio Company (a) | Spread
Above Index (b) |
Interest Rate |
Acquisition
Date (c) |
Maturity | Principal | Amortized
Cost |
Fair Value (d) |
%
of Net Assets (e) |
||||||||||||||||||
| Healthcare & Pharmaceuticals | ||||||||||||||||||||||||||
| American Optics Holdco, Inc. (h) (k) | L+7.00% | 8.80 | % | 9/13/2017 | 9/13/2022 | 4,210 | $ | 4,159 | $ | 4,185 | 1.7 | % | ||||||||||||||
| American Optics Holdco, Inc. (h) (k) | L+7.00% | 8.80 | % | 9/13/2017 | 9/13/2022 | 1,637 | 1,614 | 1,627 | 0.7 | % | ||||||||||||||||
| American Optics Holdco, Inc. (Revolver) (f) (h) (k) | L+7.00% | 8.80 | % | 9/13/2017 | 9/13/2022 | 440 | — | — | 0.0 | % | ||||||||||||||||
| American Optics Holdco, Inc. (Revolver) (f) (h) (k) | L+7.00% | 8.80 | % | 9/13/2017 | 9/13/2022 | 440 | — | — | 0.0 | % | ||||||||||||||||
| Apotheco, LLC | L+5.50% | 7.30 | % | 4/8/2019 | 4/8/2024 | 3,482 | 3,420 | 3,482 | 1.4 | % | ||||||||||||||||
| Apotheco, LLC (Delayed Draw) (f) (g) | L+5.50% | 7.30 | % | 4/8/2019 | 4/8/2024 | 1,647 | — | — | 0.0 | % | ||||||||||||||||
| Apotheco, LLC (Revolver) (f) | L+5.50% | 7.30 | % | 4/8/2019 | 4/8/2024 | 909 | 341 | 341 | 0.1 | % | ||||||||||||||||
| Familia Dental Group Holdings, LLC (i) | L+8.75% | 9.80%
Cash/ 0.75% PIK |
4/8/2016 | 4/8/2021 | 5,019 | 4,993 | 4,726 | 1.9 | % | |||||||||||||||||
| Familia Dental Group Holdings, LLC | L+8.75% | 9.80%
Cash/ 0.75% PIK |
4/8/2016 | 4/8/2021 | 483 | 483 | 455 | 0.2 | % | |||||||||||||||||
| Familia Dental Group Holdings, LLC (Revolver) (f) | L+8.75% | 9.80%
Cash/ 0.75% PIK |
4/8/2016 | 4/8/2021 | 573 | 372 | 351 | 0.1 | % | |||||||||||||||||
| Rockdale Blackhawk, LLC (DIP Facility) | n/a | 15.10 | % | 8/30/2018 | n/a | (l) | 198 | 198 | 198 | 0.1 | % | |||||||||||||||
| Rockdale Blackhawk, LLC (DIP Facility) | n/a | 15.10 | % | 8/6/2018 | n/a | (l) | 8,877 | 8,877 | 10,169 | 4.1 | % | |||||||||||||||
| Rockdale Blackhawk, LLC | L+13.00% | 14.80 | %(m) | 3/31/2015 | 3/31/2020 | 10,923 | 10,465 | 19,171 | 7.7 | % | ||||||||||||||||
| 38,838 | 34,922 | 44,705 | 18.0 | % | ||||||||||||||||||||||
| High Tech Industries | ||||||||||||||||||||||||||
| Host Analytics, Inc. | L+6.00% | 7.69 | % | 12/28/2018 | 12/28/2023 | 9,500 | 9,340 | 9,519 | 3.8 | % | ||||||||||||||||
| Host Analytics, Inc. (Revolver) (f) | L+6.00% | 7.69 | % | 12/28/2018 | 12/28/2023 | 442 | — | — | 0.0 | % | ||||||||||||||||
| Mindbody, Inc. | L+7.00% | 8.79 | % | 2/15/2019 | 2/14/2025 | 6,333 | 6,223 | 6,311 | 2.5 | % | ||||||||||||||||
| Mindbody, Inc. (Revolver) (f) | L+7.00% | 8.79 | % | 2/15/2019 | 2/14/2025 | 667 | — | — | 0.0 | % | ||||||||||||||||
| Newforma, Inc. (i) | L+5.50% | 7.46 | % | 6/30/2017 | 6/30/2022 | 13,251 | 13,139 | 13,251 | 5.3 | % | ||||||||||||||||
| Newforma, Inc. (Revolver) (f) | L+5.50% | 7.46 | % | 6/30/2017 | 6/30/2022 | 1,250 | — | — | 0.0 | % | ||||||||||||||||
| Prototek Sheetmetal Fabrication, LLC | L+7.50% | 9.30 | % | 12/11/2017 | 12/12/2022 | 3,360 | 3,316 | 3,335 | 1.3 | % | ||||||||||||||||
| Prototek Sheetmetal Fabrication, LLC | L+7.50% | 9.30 | % | 6/27/2019 | 12/12/2022 | 1,596 | 1,568 | 1,584 | 0.6 | % | ||||||||||||||||
| Prototek Sheetmetal Fabrication, LLC | L+7.50% | 9.30 | % | 12/11/2017 | 12/12/2022 | 2,295 | 2,295 | 2,277 | 0.9 | % | ||||||||||||||||
| Prototek Sheetmetal Fabrication, LLC (Revolver) (f) | L+7.50% | 9.30 | % | 12/11/2017 | 12/12/2022 | 233 | — | — | 0.0 | % | ||||||||||||||||
| Recorded Future, Inc. | L+6.75% | 8.55 | % | 7/3/2019 | 7/3/2025 | 7,333 | 7,193 | 7,331 | 3.0 | % | ||||||||||||||||
| Recorded Future, Inc. (Delayed Draw) (f) (g) | L+6.75% | 8.55 | % | 7/3/2019 | 7/3/2025 | 587 | — | — | 0.0 | % | ||||||||||||||||
| Recorded Future, Inc. (Revolver) (f) | L+6.75% | 8.55 | % | 7/3/2019 | 7/3/2025 | 880 | — | — | 0.0 | % | ||||||||||||||||
| RPL Bidco Limited (h) (k) (n) | L+7.50% | 8.28 | % | 11/9/2017 | 11/9/2023 | 14,225 | 14,062 | 14,225 | 5.7 | % | ||||||||||||||||
| RPL Bidco Limited (h) (k) (n) | L+7.50% | 8.28 | % | 5/22/2018 | 11/9/2023 | 1,723 | 1,639 | 1,723 | 0.7 | % | ||||||||||||||||
| RPL Bidco Limited (Revolver) (f) (h) (k) (n) | L+7.50% | 8.28 | % | 11/9/2017 | 11/9/2023 | 530 | — | — | 0.0 | % | ||||||||||||||||
| WillowTree, LLC | L+5.50% | 7.30 | % | 10/9/2018 | 10/9/2023 | 7,900 | 7,788 | 7,916 | 3.2 | % | ||||||||||||||||
| WillowTree, LLC (Revolver) (f) | L+5.50% | 7.30 | % | 10/9/2018 | 10/9/2023 | 1,000 | 945 | 945 | 0.4 | % | ||||||||||||||||
| 73,105 | 67,508 | 68,417 | 27.4 | % | ||||||||||||||||||||||
| Media: Advertising, Printing & Publishing | ||||||||||||||||||||||||||
| AdTheorent, Inc. | L+8.50% | 10.19 | % | 12/22/2016 | 12/22/2021 | 3,398 | 3,367 | 3,393 | 1.4 | % | ||||||||||||||||
| Destination Media, Inc. (i) | L+5.50% | 7.30 | % | 4/7/2017 | 4/7/2022 | 4,725 | 4,687 | 4,772 | 1.9 | % | ||||||||||||||||
| Destination Media, Inc. (Revolver) (f) | L+5.50% | 7.30 | % | 4/7/2017 | 4/7/2022 | 542 | — | — | 0.0 | % | ||||||||||||||||
| MC Sign Lessor Corp. | L+7.00% | 8.69 | % | 12/22/2017 | 8/30/2024 | 15,720 | 15,639 | 15,674 | 6.3 | % | ||||||||||||||||
| MC Sign Lessor Corp. (Revolver) (f) | L+7.00% | 8.69 | % | 12/22/2017 | 8/30/2024 | 3,490 | 1,047 | 1,047 | 0.4 | % | ||||||||||||||||
| 27,875 | 24,740 | 24,886 | 10.0 | % | ||||||||||||||||||||||
| Media: Broadcasting & Subscription | ||||||||||||||||||||||||||
| Vice Group Holding, Inc. | L+12.00% | 5.92%
Cash/ 8.00% PIK |
5/2/2019 | 11/2/2022 | 1,250 | 1,240 | 1,251 | 0.5 | % | |||||||||||||||||
| Vice Group Holding, Inc. | L+12.00% | 5.92%
Cash/ 8.00% PIK |
11/4/2019 | 11/2/2022 | 240 | 235 | 240 | 0.1 | % | |||||||||||||||||
| Vice Group Holding, Inc. (Delayed Draw) (f) (g) | L+12.00% | 13.92 | % | 5/2/2019 | 11/2/2022 | 400 | — | — | 0.0 | % | ||||||||||||||||
| Vice Group Holding, Inc. (Delayed Draw) (f) (g) | L+12.00% | 13.92 | % | 5/2/2019 | 11/2/2022 | 160 | — | — | 0.0 | % | ||||||||||||||||
| 2,050 | 1,475 | 1,491 | 0.6 | % | ||||||||||||||||||||||
| Media: Diversified & Production | ||||||||||||||||||||||||||
| Attom Intermediate Holdco, LLC | L+5.75% | 7.55 | % | 1/4/2019 | 1/4/2024 | 1,980 | 1,947 | 1,971 | 0.8 | % | ||||||||||||||||
| Attom Intermediate Holdco, LLC (Revolver) (f) | L+5.75% | 7.55 | % | 1/4/2019 | 1/4/2024 | 320 | — | — | 0.0 | % | ||||||||||||||||
| Crownpeak Technology, Inc. | L+6.25% | 7.94 | % | 2/28/2019 | 2/28/2024 | 4,000 | 3,931 | 4,011 | 1.6 | % | ||||||||||||||||
| Crownpeak Technology, Inc. (Delayed Draw) (f) (g) | L+6.25% | 7.94 | % | 2/28/2019 | 2/28/2024 | 333 | 60 | 60 | 0.0 | % | ||||||||||||||||
| Crownpeak Technology, Inc. (Revolver) (f) | L+6.25% | 7.94 | % | 2/28/2019 | 2/28/2024 | 167 | — | — | 0.0 | % | ||||||||||||||||
| 6,800 | 5,938 | 6,042 | 2.4 | % | ||||||||||||||||||||||
| Retail | ||||||||||||||||||||||||||
| Bluestem Brands, Inc. | L+7.50% | 9.30 | % | 6/26/2015 | 11/6/2020 | 2,275 | 2,270 | 1,707 | 0.7 | % | ||||||||||||||||
| Forman Mills, Inc. (i) | L+9.50% | 9.30%
Cash/ 2.00% PIK |
10/4/2016 | 10/4/2021 | 8,202 | 8,133 | 5,885 | 2.4 | % | |||||||||||||||||
| LuLu's Fashion Lounge, LLC | L+9.00% | 10.80 | % | 8/21/2017 | 8/29/2022 | 4,156 | 4,082 | 4,073 | 1.6 | % | ||||||||||||||||
| The Worth Collection, Ltd. (i) | L+8.50% | 6.05%
Cash/ 4.25% PIK |
(m) | 9/29/2016 | 9/29/2021 | 10,587 | 10,248 | 1,034 | 0.4 | % | ||||||||||||||||
| 25,220 | 24,733 | 12,699 | 5.1 | % | ||||||||||||||||||||||
| F-10 |
MONROE CAPITAL CORPORATION
CONSOLIDATED SCHEDULE OF INVESTMENTS – (continued)
December 31, 2019
(in thousands, except for shares and units)
| Portfolio Company (a) | Spread
Above Index (b) |
Interest Rate |
Acquisition
Date (c) |
Maturity | Principal | Amortized
Cost |
Fair Value (d) |
%
of Net Assets (e) |
||||||||||||||||||
| Services: Business | ||||||||||||||||||||||||||
| APCO Worldwide, Inc. | L+8.00% | 9.80 | % | 6/30/2017 | 6/30/2022 | 4,625 | $ | 4,572 | $ | 4,590 | 1.8 | % | ||||||||||||||
| Arcserve (USA), LLC | L+6.00% | 7.91 | % | 5/1/2019 | 5/1/2024 | 4,755 | 4,668 | 4,785 | 1.9 | % | ||||||||||||||||
| Atlas Sign Industries of FLA, LLC (i) | L+11.50% | 12.30%
Cash/ 1.00% PIK |
5/14/2018 | 5/15/2023 | 3,527 | 3,332 | 3,255 | 1.3 | % | |||||||||||||||||
| Burroughs, Inc. (i) | L+7.50% | 9.19 | % | 12/22/2017 | 12/22/2022 | 5,757 | 5,698 | 5,635 | 2.3 | % | ||||||||||||||||
| Burroughs, Inc. (Revolver) (f) | L+7.50% | 9.19 | % | 12/22/2017 | 12/22/2022 | 1,219 | 1,129 | 1,129 | 0.5 | % | ||||||||||||||||
| Certify, Inc. | L+5.75% | 7.55 | % | 2/28/2019 | 2/28/2024 | 9,000 | 8,882 | 8,938 | 3.6 | % | ||||||||||||||||
| Certify, Inc. (Delayed Draw) (f) (g) | L+5.75% | 7.55 | % | 2/28/2019 | 2/28/2024 | 1,227 | 614 | 609 | 0.2 | % | ||||||||||||||||
| Certify, Inc. (Revolver) (f) | L+5.75% | 7.55 | % | 2/28/2019 | 2/28/2024 | 409 | 61 | 61 | 0.0 | % | ||||||||||||||||
| HaystackID, LLC | L+6.50% | 8.30 | % | 1/14/2019 | 1/12/2024 | 4,950 | 4,867 | 4,965 | 2.0 | % | ||||||||||||||||
| HaystackID, LLC (Revolver) (f) | L+6.50% | 8.30 | % | 1/14/2019 | 1/12/2024 | 403 | 40 | 40 | 0.0 | % | ||||||||||||||||
| HS4 Acquisitionco, Inc. | L+6.75% | 8.71 | % | 7/9/2019 | 7/9/2025 | 10,050 | 9,859 | 10,010 | 4.0 | % | ||||||||||||||||
| HS4 Acquisitionco, Inc. (Revolver) (f) | L+6.75% | 8.54 | % | 7/9/2019 | 7/9/2025 | 817 | 123 | 122 | 0.0 | % | ||||||||||||||||
| IT Global Holding, LLC | L+8.50% | 10.30 | % | 11/15/2018 | 11/10/2023 | 10,237 | 10,066 | 10,160 | 4.1 | % | ||||||||||||||||
| IT Global Holding, LLC | L+8.50% | 10.30 | % | 7/19/2019 | 11/10/2023 | 3,816 | 3,743 | 3,787 | 1.5 | % | ||||||||||||||||
| IT Global Holding, LLC (Revolver) | L+8.50% | 10.30 | % | 11/15/2018 | 11/10/2023 | 875 | 875 | 875 | 0.4 | % | ||||||||||||||||
| Kaseya Traverse, Inc. | L+6.50% | 7.72%
Cash/ 1.00% PIK |
5/3/2019 | 5/2/2025 | 6,026 | 5,913 | 6,011 | 2.5 | % | |||||||||||||||||
| Kaseya Traverse, Inc. (Delayed Draw) (f) (g) | L+6.50% | 7.69%
Cash/ 1.00% PIK |
5/3/2019 | 5/2/2025 | 723 | 94 | 94 | 0.0 | % | |||||||||||||||||
| Kaseya Traverse, Inc. (Revolver) (f) | L+6.50% | 8.30 | % | 5/3/2019 | 5/2/2025 | 506 | 289 | 289 | 0.1 | % | ||||||||||||||||
| Madison Logic, Inc. (i) | L+8.00% | 9.80 | % | 11/30/2016 | 11/30/2021 | 9,621 | 9,531 | 9,621 | 3.9 | % | ||||||||||||||||
| Madison Logic, Inc. (Revolver) (f) | L+8.00% | 9.80 | % | 11/30/2016 | 11/30/2021 | 988 | — | — | 0.0 | % | ||||||||||||||||
| RedZone Robotics, Inc. | L+8.75% | 8.55%
Cash/ 2.00% PIK |
6/1/2018 | 6/5/2023 | 646 | 636 | 596 | 0.2 | % | |||||||||||||||||
| RedZone Robotics, Inc. (Revolver) (f) | L+6.75% | 8.55 | % | 6/1/2018 | 6/5/2023 | 158 | — | — | 0.0 | % | ||||||||||||||||
| Security Services Acquisition Sub Corp. (i) | L+6.00% | 7.74 | % | 2/15/2019 | 2/15/2024 | 3,474 | 3,416 | 3,479 | 1.4 | % | ||||||||||||||||
| Security Services Acquisition Sub Corp. (Delayed Draw) (f) (g) (i) | L+6.00% | 7.74 | % | 2/15/2019 | 2/15/2024 | 2,491 | 1,762 | 1,765 | 0.7 | % | ||||||||||||||||
| Security Services Acquisition Sub Corp. (Delayed Draw) (f) (g) (i) | L+6.00% | 7.74 | % | 2/15/2019 | 2/15/2024 | 2,186 | 1,065 | 1,067 | 0.4 | % | ||||||||||||||||
| Security Services Acquisition Sub Corp. (Revolver) (f) | L+6.00% | 7.74 | % | 2/15/2019 | 2/15/2024 | 1,563 | 104 | 104 | 0.0 | % | ||||||||||||||||
| TRP Construction Group, LLC (i) | L+7.00% | 8.80 | % | 10/5/2017 | 10/5/2022 | 7,863 | 7,767 | 7,815 | 3.1 | % | ||||||||||||||||
| TRP Construction Group, LLC | L+7.00% | 8.80 | % | 9/5/2018 | 10/5/2022 | 6,682 | 6,682 | 6,642 | 2.7 | % | ||||||||||||||||
| TRP Construction Group, LLC (Revolver) (f) | L+7.00% | 8.80 | % | 10/5/2017 | 10/5/2022 | 2,133 | — | — | 0.0 | % | ||||||||||||||||
| VPS Holdings, LLC | L+7.00% | 8.80 | % | 10/5/2018 | 10/4/2024 | 4,537 | 4,459 | 4,448 | 1.8 | % | ||||||||||||||||
| VPS Holdings, LLC | L+7.00% | 8.80 | % | 10/5/2018 | 10/4/2024 | 3,700 | 3,700 | 3,627 | 1.5 | % | ||||||||||||||||
| VPS Holdings, LLC (Revolver) (f) | L+7.00% | 8.80 | % | 10/5/2018 | 10/4/2024 | 1,000 | 100 | 100 | 0.0 | % | ||||||||||||||||
| 115,964 | 104,047 | 104,619 | 41.9 | % | ||||||||||||||||||||||
| Services: Consumer | ||||||||||||||||||||||||||
| Mammoth Holdings, LLC | L+6.00% | 8.10 | % | 10/16/2018 | 10/16/2023 | 1,980 | 1,948 | 1,984 | 0.8 | % | ||||||||||||||||
| Mammoth Holdings, LLC | L+6.00% | 7.79 | % | 10/16/2018 | 10/16/2023 | 4,156 | 4,156 | 4,165 | 1.7 | % | ||||||||||||||||
| Mammoth Holdings, LLC (Revolver) (f) | L+6.00% | 8.10 | % | 10/16/2018 | 10/16/2023 | 500 | — | — | 0.0 | % | ||||||||||||||||
| PeopleConnect Intermediate, LLC | L+6.50% | 8.45 | % | 7/1/2015 | 7/1/2020 | 4,030 | 4,019 | 4,030 | 1.6 | % | ||||||||||||||||
| PeopleConnect Intermediate, LLC | L+12.50% | 14.45 | % | 7/1/2015 | 7/1/2020 | 4,515 | 4,500 | 4,515 | 1.8 | % | ||||||||||||||||
| PeopleConnect Intermediate, LLC (Revolver) (f) | L+9.50% | 11.45 | % | 7/1/2015 | 7/1/2020 | 236 | — | — | 0.0 | % | ||||||||||||||||
| 15,417 | 14,623 | 14,694 | 5.9 | % | ||||||||||||||||||||||
| Wholesale | ||||||||||||||||||||||||||
| Nearly Natural, Inc. (i) | L+7.00% | 8.96 | % | 12/15/2017 | 12/15/2022 | 6,860 | 6,771 | 6,771 | 2.7 | % | ||||||||||||||||
| Nearly Natural, Inc. (Delayed Draw) (f) (g) (i) | L+7.00% | 8.96 | % | 8/28/2019 | 12/15/2022 | 1,924 | 349 | 344 | 0.1 | % | ||||||||||||||||
| Nearly Natural, Inc. (Revolver) (f) | L+7.00% | 8.96 | % | 12/15/2017 | 12/15/2022 | 1,522 | 761 | 761 | 0.3 | % | ||||||||||||||||
| 10,306 | 7,881 | 7,876 | 3.1 | % | ||||||||||||||||||||||
| Total Non-Controlled/Non-Affiliate Senior Secured Loans | 481,336 | 435,760 | 434,000 | 174.0 | % | |||||||||||||||||||||
| F-11 |
MONROE CAPITAL CORPORATION
CONSOLIDATED SCHEDULE OF INVESTMENTS – (continued)
December 31, 2019
(in thousands, except for shares and units)
| Portfolio Company (a) | Spread
Above Index (b) |
Interest Rate |
Acquisition
Date (c) |
Maturity | Principal | Amortized
Cost |
Fair Value (d) |
%
of Net Assets (e) |
||||||||||||||||||
| Unitranche Secured Loans (o) | ||||||||||||||||||||||||||
| Chemicals, Plastics & Rubber | ||||||||||||||||||||||||||
| MFG Chemical, LLC (i) | L+6.00% | 7.80 | % | 6/23/2017 | 6/23/2022 | 10,477 | $ | 10,388 | $ | 10,173 | 4.1 | % | ||||||||||||||
| MFG Chemical, LLC | L+6.00% | 7.80 | % | 3/15/2018 | 6/23/2022 | 1,121 | 1,121 | 1,088 | 0.4 | % | ||||||||||||||||
| 11,598 | 11,509 | 11,261 | 4.5 | % | ||||||||||||||||||||||
| Construction & Building | ||||||||||||||||||||||||||
| Inland Pipe Rehabilitation LLC | L+5.50% | 7.46 | % | 12/27/2018 | 12/26/2024 | 12,375 | 12,156 | 12,415 | 5.0 | % | ||||||||||||||||
| 12,375 | 12,156 | 12,415 | 5.0 | % | ||||||||||||||||||||||
| Consumer Goods: Durable | ||||||||||||||||||||||||||
| RugsUSA, LLC | L+6.50% | 8.45 | % | 5/2/2018 | 4/28/2023 | 4,000 | 3,971 | 4,004 | 1.6 | % | ||||||||||||||||
| 4,000 | 3,971 | 4,004 | 1.6 | % | ||||||||||||||||||||||
| Healthcare & Pharmaceuticals | ||||||||||||||||||||||||||
| Priority Ambulance, LLC (p) | L+6.50% | 8.46 | % | 7/18/2018 | 4/12/2022 | 10,015 | 10,015 | 10,015 | 4.0 | % | ||||||||||||||||
| Priority Ambulance, LLC (q) | L+6.50% | 8.46 | % | 4/12/2017 | 4/12/2022 | 1,253 | 1,234 | 1,256 | 0.5 | % | ||||||||||||||||
| Priority Ambulance, LLC (Delayed Draw) (f) (g) | L+6.50% | 8.46 | % | 12/13/2018 | 4/12/2022 | 2,480 | 689 | 691 | 0.3 | % | ||||||||||||||||
| 13,748 | 11,938 | 11,962 | 4.8 | % | ||||||||||||||||||||||
| High Tech Industries | ||||||||||||||||||||||||||
| Energy Services Group, LLC | L+8.42% | 10.22 | % | 5/4/2017 | 5/4/2022 | 4,170 | 4,139 | 4,154 | 1.6 | % | ||||||||||||||||
| Energy Services Group, LLC (h) (n) | L+8.42% | 9.42 | % | 5/4/2017 | 5/4/2022 | 4,979 | 4,941 | 4,965 | 2.0 | % | ||||||||||||||||
| Energy Services Group, LLC | L+8.42% | 10.22 | % | 5/4/2017 | 5/4/2022 | 1,187 | 1,172 | 1,182 | 0.5 | % | ||||||||||||||||
| Mnine Holdings, Inc. | P+7.75% | 12.50 | % | 11/2/2018 | 11/2/2023 | 7,940 | 7,809 | 7,919 | 3.2 | % | ||||||||||||||||
| 18,276 | 18,061 | 18,220 | 7.3 | % | ||||||||||||||||||||||
| Total Non-Controlled/Non-Affiliate Unitranche Secured Loans | 59,997 | 57,635 | 57,862 | 23.2 | % | |||||||||||||||||||||
| Junior Secured Loans | ||||||||||||||||||||||||||
| Beverage, Food & Tobacco | ||||||||||||||||||||||||||
| CSM Bakery Supplies, LLC | L+7.75% | 9.78 | % | 5/23/2013 | 7/5/2021 | 5,792 | 5,792 | 5,538 | 2.2 | % | ||||||||||||||||
| 5,792 | 5,792 | 5,538 | 2.2 | % | ||||||||||||||||||||||
| High Tech Industries | ||||||||||||||||||||||||||
| Micro Holdings Corp. | L+7.50% | 9.30 | % | 8/16/2017 | 8/18/2025 | 3,000 | 2,974 | 3,009 | 1.2 | % | ||||||||||||||||
| 3,000 | 2,974 | 3,009 | 1.2 | % | ||||||||||||||||||||||
| Media: Diversified & Production | ||||||||||||||||||||||||||
| The Octave Music Group, Inc. | L+8.25% | 9.95 | % | 5/29/2015 | 5/27/2022 | 4,355 | 4,325 | 4,355 | 1.8 | % | ||||||||||||||||
| 4,355 | 4,325 | 4,355 | 1.8 | % | ||||||||||||||||||||||
| Services: Consumer | ||||||||||||||||||||||||||
| Education Corporation of America | L+11.00% | 7.46%
Cash/ 5.50% PIK |
(m) | 9/3/2015 | 3/31/2020 | 833 | 831 | 774 | 0.3 | % | ||||||||||||||||
| 833 | 831 | 774 | 0.3 | % | ||||||||||||||||||||||
| Total Non-Controlled/Non-Affiliate Junior Secured Loans | 13,980 | $ | 13,922 | $ | 13,676 | 5.5 | % | |||||||||||||||||||
| F-12 |
MONROE CAPITAL CORPORATION
CONSOLIDATED SCHEDULE OF INVESTMENTS – (continued)
December 31, 2019
(in thousands, except for shares and units)
| Portfolio Company (a) | Spread
Above Index (b) |
Interest Rate |
Acquisition
Date (c) |
Maturity | Principal | Amortized
Cost |
Fair Value (d) |
%
of Net Assets (e) |
||||||||||||||||||
| Equity Securities (r) (s) | ||||||||||||||||||||||||||
| Banking, Finance, Insurance & Real Estate | ||||||||||||||||||||||||||
| PKS Holdings, LLC (warrant to purchase up to 0.8% of the equity) (h) | — | — | (t) | 11/30/2017 | 11/30/2027 | — | $ | 116 | $ | 14 | 0.0 | % | ||||||||||||||
| 116 | 14 | 0.0 | % | |||||||||||||||||||||||
| Chemicals, Plastics & Rubber | ||||||||||||||||||||||||||
| Valudor Products, LLC (501,014 class A-1 units) | n/a | 10.00% PIK | 6/18/2018 | — | — | 501 | 273 | 0.1 | % | |||||||||||||||||
| 501 | 273 | 0.1 | % | |||||||||||||||||||||||
| High Tech Industries | ||||||||||||||||||||||||||
| Answers Finance, LLC (76,539 shares of common stock) | — | — | (t) | 4/14/2017 | — | — | 2,344 | 52 | 0.0 | % | ||||||||||||||||
| Host Analytics, Inc. (441,860 class A units) | — | — | (t) | 12/28/2018 | — | — | 442 | 603 | 0.3 | % | ||||||||||||||||
| Recorded Future, Inc. (80,080 class A units) (u) | — | — | (t) | 7/3/2019 | — | — | 80 | 84 | 0.0 | % | ||||||||||||||||
| 2,866 | 739 | 0.3 | % | |||||||||||||||||||||||
| Media: Advertising, Printing & Publishing | ||||||||||||||||||||||||||
| AdTheorent, Inc. (128,866 class A voting units) | — | — | (t) | 12/22/2016 | — | — | 129 | 395 | 0.2 | % | ||||||||||||||||
| MC Sign Lessor Corp. (686 shares of common units) | — | — | (t) | 8/30/2019 | — | — | 872 | 864 | 0.3 | % | ||||||||||||||||
| InMobi Pte, Ltd. (warrant to purchase up to 2.8% of the equity) (h) (k) | — | — | (t) | 9/18/2015 | 9/18/2025 | — | — | 188 | 0.1 | % | ||||||||||||||||
| 1,001 | 1,447 | 0.6 | % | |||||||||||||||||||||||
| Media: Diversified & Production | ||||||||||||||||||||||||||
| Attom Intermediate Holdco, LLC (260,000 class A units) | — | — | (t) | 1/4/2019 | — | — | 260 | 255 | 0.1 | % | ||||||||||||||||
| 260 | 255 | 0.1 | % | |||||||||||||||||||||||
| Retail | ||||||||||||||||||||||||||
| The Tie Bar Operating Company, LLC - Class A Preferred Units (1,275 units) | — | — | 6/25/2013 | — | — | 87 | 63 | 0.0 | % | |||||||||||||||||
| The Tie Bar Operating Company, LLC - Class B Preferred Units (1,275 units) | — | — | 6/25/2013 | — | — | — | — | 0.0 | % | |||||||||||||||||
| 87 | 63 | 0.0 | % | |||||||||||||||||||||||
| Services: Business | ||||||||||||||||||||||||||
| APCO Worldwide, Inc. (100 class A voting common stock) | — | — | (t) | 11/1/2017 | — | — | 395 | 281 | 0.1 | % | ||||||||||||||||
| Atlas Sign Industries of FLA, LLC (warrant to purchase up to 0.8% of the equity) | — | — | (t) | 5/14/2018 | 5/14/2026 | — | 125 | 84 | 0.0 | % | ||||||||||||||||
| 520 | 365 | 0.1 | % | |||||||||||||||||||||||
| Services: Consumer | ||||||||||||||||||||||||||
| Education Corporation of America - Series G Preferred Stock (8,333 shares) | n/a | 12.00% PIK | (m) | 9/3/2015 | — | — | 7,492 | 5,117 | 2.1 | % | ||||||||||||||||
| 7,492 | 5,117 | 2.1 | % | |||||||||||||||||||||||
| Wholesale | ||||||||||||||||||||||||||
| Nearly Natural, Inc. (152,174 class A units) | — | — | (t) | 12/15/2017 | — | — | 152 | 148 | 0.1 | % | ||||||||||||||||
| 152 | 148 | 0.1 | % | |||||||||||||||||||||||
| Total Non-Controlled/Non-Affiliate Equity Securities | 12,995 | 8,421 | 3.4 | % | ||||||||||||||||||||||
| Total Non-Controlled/Non-Affiliate Company Investments | $ | 520,312 | $ | 513,959 | 206.1 | % | ||||||||||||||||||||
| Non-Controlled Affiliate Company Investments (v) | ||||||||||||||||||||||||||
| Senior Secured Loans | ||||||||||||||||||||||||||
| Banking, Finance, Insurance & Real Estate | ||||||||||||||||||||||||||
| American Community Homes, Inc. | L+10.00% | 11.80% PIK | 7/22/2014 | 12/31/2020 | 8,830 | $ | 8,821 | $ | 6,764 | 2.7 | % | |||||||||||||||
| American Community Homes, Inc. | L+14.50% | 16.30% PIK | 7/22/2014 | 12/31/2020 | 5,599 | 5,594 | 4,289 | 1.7 | % | |||||||||||||||||
| American Community Homes, Inc. | L+10.00% | 11.80% PIK | 3/17/2016 | 12/31/2020 | 668 | 667 | 512 | 0.2 | % | |||||||||||||||||
| American Community Homes, Inc. | L+10.00% | 11.80% PIK | 5/24/2017 | 12/31/2020 | 535 | 534 | 410 | 0.2 | % | |||||||||||||||||
| American Community Homes, Inc. | L+14.50% | 16.30% PIK | 5/24/2017 | 12/31/2020 | 301 | 300 | 230 | 0.1 | % | |||||||||||||||||
| American Community Homes, Inc. | L+8.00% | 9.80% PIK | 8/10/2018 | 12/31/2020 | 1,922 | 1,922 | 1,472 | 0.6 | % | |||||||||||||||||
| American Community Homes, Inc. | L+8.00% | 9.80% PIK | 3/29/2019 | 12/31/2020 | 3,603 | 3,603 | 2,760 | 1.1 | % | |||||||||||||||||
| American Community Homes, Inc. | L+8.00% | 9.80% PIK | 9/30/2019 | 12/31/2020 | 14 | 14 | 11 | 0.0 | % | |||||||||||||||||
| American Community Homes, Inc. | L+8.00% | 9.80% PIK | 12/30/2019 | 12/31/2020 | 1,186 | 1,186 | 1,168 | 0.5 | % | |||||||||||||||||
| 22,658 | 22,641 | 17,616 | 7.1 | % | ||||||||||||||||||||||
| Containers, Packaging & Glass | ||||||||||||||||||||||||||
| Summit Container Corporation (i) | L+8.00% | 9.80 | % | 12/5/2013 | 1/6/2021 | 3,259 | 3,269 | 2,971 | 1.1 | % | ||||||||||||||||
| Summit Container Corporation (Revolver) (f) (i) | L+8.00% | 9.80 | % | 6/15/2018 | 1/6/2021 | 7,300 | 5,475 | 5,406 | 2.2 | % | ||||||||||||||||
| 10,559 | 8,744 | 8,377 | 3.3 | % | ||||||||||||||||||||||
| Healthcare & Pharmaceuticals | ||||||||||||||||||||||||||
| SHI Holdings, Inc. (i) | L+10.25% | 12.05% PIK | 7/10/2014 | 12/31/2020 | 2,899 | 2,897 | 2,459 | 1.0 | % | |||||||||||||||||
| SHI Holdings, Inc. (Revolver) (f) | L+10.25% | 12.05% PIK | 7/10/2014 | 12/31/2020 | 4,667 | 4,240 | 3,601 | 1.4 | % | |||||||||||||||||
| 7,566 | 7,137 | 6,060 | 2.4 | % | ||||||||||||||||||||||
| Retail | ||||||||||||||||||||||||||
| Luxury Optical Holdings Co. | L+8.00% | 9.80% PIK | (m) | 9/12/2014 | 9/30/2020 | 4,953 | 4,949 | 3,457 | 1.4 | % | ||||||||||||||||
| Luxury Optical Holdings Co. (Delayed Draw) (g) | L+11.50% | 13.30% | (m) | 9/29/2017 | 9/30/2020 | 624 | 624 | 620 | 0.2 | % | ||||||||||||||||
| Luxury Optical Holdings Co. (Revolver) | L+8.00% | 9.80% PIK | (m) | 9/12/2014 | 9/30/2020 | 228 | 228 | 159 | 0.1 | % | ||||||||||||||||
| 5,805 | 5,801 | 4,236 | 1.7 | % | ||||||||||||||||||||||
| Services: Business | ||||||||||||||||||||||||||
| Curion Holdings, LLC (i) | n/a | 14.00% PIK | (m) | 5/2/2017 | 5/2/2022 | 4,226 | 4,189 | 3,279 | 1.3 | % | ||||||||||||||||
| Curion Holdings, LLC (Revolver) (f) | n/a | 14.00% PIK | (m) | 5/2/2017 | 5/2/2022 | 478 | 451 | 441 | 0.2 | % | ||||||||||||||||
| 4,704 | 4,640 | 3,720 | 1.5 | % | ||||||||||||||||||||||
| Services: Consumer | ||||||||||||||||||||||||||
| New England College of Business and Finance, LLC (Revolver) (f) | L+11.00% | 12.69 | % | 6/25/2019 | 6/30/2021 | 1,275 | 1,148 | 1,148 | 0.5 | % | ||||||||||||||||
| 1,275 | 1,148 | 1,148 | 0.5 | % | ||||||||||||||||||||||
| Total Non-Controlled Affiliate Senior Secured Loans | 52,567 | 50,111 | 41,157 | 16.5 | % | |||||||||||||||||||||
| F-13 |
MONROE CAPITAL CORPORATION
CONSOLIDATED SCHEDULE OF INVESTMENTS – (continued)
December 31, 2019
(in thousands, except for shares and units)
| Portfolio Company (a) | Spread
Above Index (b) |
Interest Rate |
Acquisition
Date (c) |
Maturity | Principal | Amortized
Cost |
Fair Value (d) |
%
of Net Assets (e) |
||||||||||||||||||
| Unitranche Secured Loans (o) | ||||||||||||||||||||||||||
| Consumer Goods: Non-Durable | ||||||||||||||||||||||||||
| Incipio, LLC (w) | L+8.72% | 10.41% PIK | (x) | 12/26/2014 | 8/22/2022 | 14,573 | $ | 14,549 | $ | 12,343 | 5.0 | % | ||||||||||||||
| Incipio, LLC (y) | L+8.50% | 10.19% PIK | 3/9/2018 | 8/22/2022 | 3,815 | 3,815 | 3,750 | 1.5 | % | |||||||||||||||||
| Incipio, LLC | L+8.50% | 10.19% PIK | 7/6/2018 | 8/22/2022 | 1,621 | 1,621 | 1,606 | 0.6 | % | |||||||||||||||||
| Incipio, LLC | L+8.50% | 10.19% PIK | 4/17/2019 | 8/22/2022 | 692 | 692 | 686 | 0.3 | % | |||||||||||||||||
| 20,701 | 20,677 | 18,385 | 7.4 | % | ||||||||||||||||||||||
| Total Non-Controlled Affiliate Unitranche Secured Loans | 20,701 | 20,677 | 18,385 | 7.4 | % | |||||||||||||||||||||
| Junior Secured Loans | ||||||||||||||||||||||||||
| Consumer Goods: Non-Durable | ||||||||||||||||||||||||||
| Incipio, LLC (z) | n/a | 10.70% PIK | (m) | 6/18/2018 | 8/22/2022 | 3,766 | — | — | 0.0 | % | ||||||||||||||||
| Incipio, LLC (aa) | n/a | 10.70% PIK | (m) | 6/18/2018 | 8/22/2022 | 7,194 | — | — | 0.0 | % | ||||||||||||||||
| 10,960 | — | — | 0.0 | % | ||||||||||||||||||||||
| Services: Business | ||||||||||||||||||||||||||
| Curion Holdings, LLC (i) | n/a | 15.00% PIK | (m) | 8/17/2018 | 1/2/2023 | 1,720 | 1 | — | 0.0 | % | ||||||||||||||||
| Curion Holdings, LLC (i) | n/a | 15.00% PIK | (m) | 8/17/2018 | 1/2/2023 | 44 | — | — | 0.0 | % | ||||||||||||||||
| 1,764 | 1 | — | 0.0 | % | ||||||||||||||||||||||
| Total Non-Controlled Affiliate Junior Secured Loans | 12,724 | 1 | — | 0.0 | % | |||||||||||||||||||||
| Equity Securities (s) (v) | ||||||||||||||||||||||||||
| Banking, Finance, Insurance & Real Estate | ||||||||||||||||||||||||||
| American Community Homes, Inc. (warrant to purchase up to 22.3% of the equity) | — | — | (t) | 10/9/2014 | 12/18/2024 | — | — | — | 0.0 | % | ||||||||||||||||
| — | — | 0.0 | % | |||||||||||||||||||||||
| Consumer Goods: Non-Durable | ||||||||||||||||||||||||||
| Incipio, LLC (1,774 shares of series C common units) | — | — | (t) | 7/6/2018 | — | — | — | — | 0.0 | % | ||||||||||||||||
| — | — | 0.0 | % | |||||||||||||||||||||||
| Containers, Packaging & Glass | ||||||||||||||||||||||||||
| Summit Container Corporation (warrant to purchase up to 19.5% of the equity) | — | — | (t) | 1/6/2014 | 1/6/2024 | — | — | — | 0.0 | % | ||||||||||||||||
| — | — | 0.0 | % | |||||||||||||||||||||||
| Healthcare & Pharmaceuticals | ||||||||||||||||||||||||||
| SHI Holdings, Inc. (24 shares of common stock) | — | — | (t) | 12/14/2016 | — | — | 27 | — | 0.0 | % | ||||||||||||||||
| 27 | — | 0.0 | % | |||||||||||||||||||||||
| Retail | ||||||||||||||||||||||||||
| Luxury Optical Holdings Co. (86 shares of common stock) | — | — | (t) | 9/29/2017 | — | — | — | — | 0.0 | % | ||||||||||||||||
| — | — | 0.0 | % | |||||||||||||||||||||||
| Services: Business | ||||||||||||||||||||||||||
| Curion Holdings, LLC (58,779 shares of common stock) | — | — | (t) | 8/17/2018 | — | — | — | — | 0.0 | % | ||||||||||||||||
| — | — | 0.0 | % | |||||||||||||||||||||||
| Services: Consumer | ||||||||||||||||||||||||||
| New England College of Business and Finance, LLC (20.8% of units) | — | — | (t) | 6/21/2019 | — | — | 1,458 | 318 | 0.1 | % | ||||||||||||||||
| 1,458 | 318 | 0.1 | % | |||||||||||||||||||||||
| Total Non-Controlled Affiliate Equity Securities | 1,485 | 318 | 0.1 | % | ||||||||||||||||||||||
| Total Non-Controlled Affiliate Company Investments | $ | 72,274 | $ | 59,860 | 24.0 | % | ||||||||||||||||||||
| Controlled Affiliate Company Investments (ab) | ||||||||||||||||||||||||||
| Equity Securities | ||||||||||||||||||||||||||
| Investment Funds & Vehicles | ||||||||||||||||||||||||||
| MRCC Senior Loan Fund I, LLC (50.0% of the equity interests) (h) | — | — | 10/31/2017 | — | — | $ | 42,150 | $ | 42,412 | 17.0 | % | |||||||||||||||
| Total Controlled Affiliate Equity Securities | 42,150 | 42,412 | 17.0 | % | ||||||||||||||||||||||
| Total Controlled Affiliate Company Investments | $ | 42,150 | $ | 42,412 | 17.0 | % | ||||||||||||||||||||
| TOTAL INVESTMENTS | $ | 634,736 | $ | 616,231 | 247.1 | % | ||||||||||||||||||||
Derivative Instruments
Foreign currency forward contracts
| Notional Amount | Notional Amount | Unrealized Gain | ||||||||||||||
| Description | to be Purchased | to be Sold | Counterparty | Settlement Date | (Loss) | |||||||||||
| Foreign currency forward contract | $ | 133 | £ | 104 | Bannockburn Global Forex, LLC | 1/2/2020 | $ | (5 | ) | |||||||
| Foreign currency forward contract | $ | 296 | £ | 231 | Bannockburn Global Forex, LLC | 2/28/2020 | (10 | ) | ||||||||
| Foreign currency forward contract | $ | 35 | £ | 27 | Bannockburn Global Forex, LLC | 3/2/2020 | (1 | ) | ||||||||
| Foreign currency forward contract | $ | 132 | £ | 103 | Bannockburn Global Forex, LLC | 4/1/2020 | (5 | ) | ||||||||
| Foreign currency forward contract | $ | 130 | £ | 102 | Bannockburn Global Forex, LLC | 5/5/2020 | (4 | ) | ||||||||
| Foreign currency forward contract | $ | 295 | £ | 230 | Bannockburn Global Forex, LLC | 5/29/2020 | (10 | ) | ||||||||
| Foreign currency forward contract | $ | 34 | £ | 27 | Bannockburn Global Forex, LLC | 6/1/2020 | (1 | ) | ||||||||
| Foreign currency forward contract | $ | 296 | £ | 230 | Bannockburn Global Forex, LLC | 8/28/2020 | (10 | ) | ||||||||
| Foreign currency forward contract | $ | 35 | £ | 28 | Bannockburn Global Forex, LLC | 9/3/2020 | (2 | ) | ||||||||
| Foreign currency forward contract | $ | 294 | £ | 229 | Bannockburn Global Forex, LLC | 11/30/2020 | (10 | ) | ||||||||
| Foreign currency forward contract | $ | 34 | £ | 26 | Bannockburn Global Forex, LLC | 12/2/2020 | (1 | ) | ||||||||
| $ | (59 | ) | ||||||||||||||
| F-14 |
MONROE CAPITAL CORPORATION
CONSOLIDATED SCHEDULE OF INVESTMENTS – (continued)
December 31, 2019
(in thousands, except for shares and units)
| (a) | All of our investments are issued by eligible portfolio companies, as defined in the Investment Company Act of 1940 (the “1940 Act”), unless otherwise noted. All of our investments are issued by U.S. portfolio companies unless otherwise noted. |
| (b) | The majority of the investments bear interest at a rate that may be determined by reference to the London Interbank Offered Rate (“LIBOR” or “L”) or Prime Rate (“Prime” or “P”) which reset daily, monthly, quarterly, or semiannually. For each such investment, the Company has provided the spread over LIBOR or Prime and the current contractual interest rate in effect at December 31, 2019. Certain investments are subject to a LIBOR or Prime interest rate floor, or rate cap. |
| (c) | Except as otherwise noted, all of the Company’s portfolio company investments, which as of December 31, 2019 represented 247.1% of the Company’s net assets or 94.1% of the Company’s total assets, are subject to legal restrictions on sales. |
| (d) | Because there is no readily available market value for these investments, the fair value of these investments is determined in good faith using significant unobservable inputs by our board of directors as required by the 1940 Act. (See Note 4 in the accompanying notes to the consolidated financial statements.) |
| (e) | Percentages are based on net assets of $249,357 as of December 31, 2019. |
| (f) | All or a portion of this commitment was unfunded at December 31, 2019. As such, interest is earned only on the funded portion of this commitment. |
| (g) | This delayed draw loan requires that certain financial covenants be met by the portfolio company prior to any fundings. |
| (h) | This investment is treated as a non-qualifying investment under Section 55(a) of the 1940 Act. Under the 1940 Act, the Company may not acquire any non-qualifying asset unless, at the time the acquisition is made, qualifying assets represent at least 70% of the Company’s total assets. As of December 31, 2019, non-qualifying assets totaled 19.6% of the Company’s total assets. |
| (i) | All of this loan is held in the Company’s wholly-owned subsidiary, Monroe Capital Corporation SBIC, LP, and is therefore not collateral to the Company’s revolving credit facility. |
| (j) | This investment represents a note convertible to preferred shares of the borrower. |
| (k) | This is an international company. |
| (l) | This is a demand note with no stated maturity. |
| (m) | This position was on non-accrual status as of December 31, 2019, meaning that the Company has ceased accruing interest income on the position. See Note 2 in the accompanying notes to the consolidated financial statements for additional information on the Company’s accounting policies. |
| (n) | This loan is denominated in Great Britain pounds and is translated into U.S. dollars as of the valuation date. |
| (o) | The Company structures its unitranche secured loans as senior secured loans. The Company obtains security interests in the assets of these portfolio companies that serve as collateral in support of the repayment of these loans. This collateral may take the form of first-priority liens on the assets of a portfolio company. Generally, the Company syndicates a “first out” portion of the loan to an investor and retains a “last out” portion of the loan, in which case the “first out” portion of the loan will generally receive priority with respect to payments of principal, interest and any other amounts due thereunder. Unitranche structures combine characteristics of traditional first lien senior secured as well as second lien and subordinated loans and the Company’s unitranche secured loans will expose the Company to the risks associated with second lien and subordinated loans and may limit the Company’s recourse or ability to recover collateral upon a portfolio company’s bankruptcy. Unitranche secured loans typically provide for moderate loan amortization in the initial years of the facility, with the majority of the amortization deferred until loan maturity. Unitranche secured loans generally allow the borrower to make a large lump sum payment of principal at the end of the loan term, and there is a risk of loss if the borrower is unable to pay the lump sum or refinance the amount owed at maturity. In many cases the Company, together with its affiliates, are the sole or majority lender of these unitranche secured loans, which can afford the Company additional influence with a borrower in terms of monitoring and, if necessary, remediation in the event of underperformance. |
| (p) | A portion of this loan (principal of $9,258) is held in the Company’s wholly-owned subsidiary, Monroe Capital Corporation SBIC, LP, and is therefore not collateral to the Company’s revolving credit facility. |
| (q) | A portion of this loan (principal of $525) is held in the Company’s wholly-owned subsidiary, Monroe Capital Corporation SBIC, LP, and is therefore not collateral to the Company’s revolving credit facility. |
| (r) | Represents less than 5% ownership of the portfolio company’s voting securities. |
| (s) | Ownership of certain equity investments may occur through a holding company or partnership. |
| (t) | Represents a non-income producing security. |
| (u) | As of December 31, 2019, the Company was party to a subscription agreement with a commitment to fund an additional equity investment of $16. |
| (v) | As defined in the 1940 Act, the Company is deemed to be an “Affiliated Person” of the portfolio company as it owns 5% or more of the portfolio company’s voting securities. See Note 5 in the accompanying notes to the consolidated financial statements for additional information on transactions in which the issuer was an Affiliated Person (but not a portfolio company that the Company is deemed to control). |
| (w) | A portion of this loan (principal of $5,343) is held in the Company’s wholly-owned subsidiary, Monroe Capital Corporation SBIC, LP, and is therefore not collateral to the Company’s revolving credit facility. |
| (x) | A portion of the PIK interest rate for Incipio Technologies, Inc. is structured as a fee paid upon the termination of the commitment. The fee currently accrues at 0.22% per annum. |
| (y) | A portion of this loan (principal of $48) is held in the Company’s wholly-owned subsidiary, Monroe Capital Corporation SBIC, LP, and is therefore not collateral to the Company’s revolving credit facility. |
| (z) | A portion of this loan (principal of $1,015) is held in the Company’s wholly-owned subsidiary, Monroe Capital Corporation SBIC, LP, and is therefore not collateral to the Company’s revolving credit facility. |
| (aa) | A portion of this loan (principal of $1,938) is held in the Company’s wholly-owned subsidiary, Monroe Capital Corporation SBIC, LP, and is therefore not collateral to the Company’s revolving credit facility. |
| (ab) | As defined in the 1940 Act, the Company is deemed to be both an “Affiliated Person” of and to “Control” this portfolio company as it owns more than 25% of the portfolio company’s voting securities. See Note 5 in the accompanying notes to the consolidated financial statements for additional information on transactions in which the issuer was both an Affiliated Person and a portfolio company that the Company is deemed to Control. |
n/a - not applicable
See Notes to Consolidated Financial Statements.
| F-15 |
MONROE CAPITAL CORPORATION
CONSOLIDATED SCHEDULE OF INVESTMENTS
December 31, 2018
(in thousands, except for shares and units)
| Portfolio Company (a) | Spread
Above Index (b) |
Interest
Rate |
Maturity | Principal | Amortized
Cost |
Fair
Value (c) |
%
of Net Assets (d) |
|||||||||||||||||
| Non-Controlled/Non-Affiliate Company Investments | ||||||||||||||||||||||||
| Senior Secured Loans | ||||||||||||||||||||||||
| Automotive | ||||||||||||||||||||||||
| Hastings Manufacturing Company | L+8.25% | 10.76 | % | 4/24/2023 | 2,944 | $ | 2,891 | $ | 2,883 | 1.1 | % | |||||||||||||
| Hastings Manufacturing Company (Delayed Draw) (e) (f) | L+8.25% | 10.76 | % | 4/24/2023 | 899 | — | — | 0.0 | % | |||||||||||||||
| Magneto & Diesel Acquisition, Inc. | L+5.50% | 8.01 | % | 12/18/2023 | 5,000 | 4,913 | 4,913 | 1.9 | % | |||||||||||||||
| Magneto & Diesel Acquisition, Inc. (Revolver) (e) | L+5.50% | 8.01 | % | 12/18/2023 | 500 | 83 | 82 | 0.0 | % | |||||||||||||||
| 9,343 | 7,887 | 7,878 | 3.0 | % | ||||||||||||||||||||
| Banking, Finance, Insurance & Real Estate | ||||||||||||||||||||||||
| Echelon Funding I, LLC (Delayed Draw) (e) (f) (g) | L+7.50% | 9.85 | % | 2/24/2021 | 15,750 | 15,253 | 15,146 | 5.9 | % | |||||||||||||||
| HFZ Capital Group, LLC (g) | L+10.17% | 12.39%
Cash/ 0.17% PIK |
(h) | 10/21/2019 | 18,000 | 17,819 | 18,009 | 7.0 | % | |||||||||||||||
| HFZ Member RB Portfolio, LLC (Delayed Draw) (e) (f) (g) | L+12.00% | 14.54 | % | 10/29/2021 | 9,000 | 3,708 | 3,706 | 1.4 | % | |||||||||||||||
| Liftforward SPV II, LLC (e) (g) | L+10.75% | 13.27 | % | 11/10/2020 | 10,000 | 4,088 | 4,132 | 1.6 | % | |||||||||||||||
| PKS Holdings, LLC (g) | L+10.00% | 12.35 | % | 11/30/2022 | 1,755 | 1,605 | 1,675 | 0.6 | % | |||||||||||||||
| PKS Holdings, LLC (Revolver) (e) (g) | L+10.00% | 12.35 | % | 11/30/2022 | 80 | — | — | 0.0 | % | |||||||||||||||
| 54,585 | 42,473 | 42,668 | 16.5 | % | ||||||||||||||||||||
| Beverage, Food & Tobacco | ||||||||||||||||||||||||
| California Pizza Kitchen, Inc. | L+6.00% | 8.53 | % | 8/23/2022 | 6,843 | 6,793 | 6,654 | 2.6 | % | |||||||||||||||
| Toojay's Management LLC | L+5.50% | 8.01 | % | 10/26/2022 | 3,500 | 3,433 | 3,497 | 1.4 | % | |||||||||||||||
| Toojay's Management LLC (Delayed Draw) (e) (f) | L+5.50% | 8.01 | % | 10/26/2022 | 477 | — | — | 0.0 | % | |||||||||||||||
| Toojay's Management LLC (Revolver) (e) | L+5.50% | 8.01 | % | 10/26/2022 | 159 | 79 | 79 | 0.0 | % | |||||||||||||||
| 10,979 | 10,305 | 10,230 | 4.0 | % | ||||||||||||||||||||
| Chemicals, Plastics & Rubber | ||||||||||||||||||||||||
| Midwest Composite Technologies, LLC | L+6.75% | 9.26 | % | 8/31/2023 | 898 | 881 | 907 | 0.4 | % | |||||||||||||||
| Midwest Composite Technologies, LLC (Delayed Draw) (e) (f) | L+6.75% | 9.26 | % | 8/31/2023 | 600 | — | — | 0.0 | % | |||||||||||||||
| Midwest Composite Technologies, LLC (Revolver) (e) | L+6.75% | 9.26 | % | 8/31/2023 | 90 | — | — | 0.0 | % | |||||||||||||||
| Valudor Products LLC | L+7.50% | 10.01 | % | 6/19/2023 | 1,604 | 1,575 | 1,600 | 0.6 | % | |||||||||||||||
| Valudor Products LLC (i) | L+7.50% | 10.01 | % | 6/19/2023 | 211 | 205 | 210 | 0.1 | % | |||||||||||||||
| Valudor Products LLC (Revolver) (e) | L+9.50% | 12.01 | % | 6/19/2023 | 818 | 606 | 607 | 0.2 | % | |||||||||||||||
| 4,221 | 3,267 | 3,324 | 1.3 | % | ||||||||||||||||||||
| Construction & Building | ||||||||||||||||||||||||
| Cali Bamboo, LLC | L+6.25% | 8.76 | % | 7/10/2020 | 5,264 | 5,231 | 5,264 | 2.0 | % | |||||||||||||||
| Cali Bamboo, LLC (Revolver) (e) | L+6.25% | 8.76 | % | 7/10/2020 | 2,165 | 1,689 | 1,689 | 0.7 | % | |||||||||||||||
| Construction Supply Acquisition, LLC | L+6.00% | 8.62 | % | 6/30/2023 | 4,791 | 4,767 | 4,779 | 1.8 | % | |||||||||||||||
| Cornerstone Detention Products, Inc. (j) | L+11.83% | 11.01%
Cash/ 3.33% PIK |
(k) | 4/8/2019 | 3,350 | 3,346 | 3,350 | 1.3 | % | |||||||||||||||
| Cornerstone Detention Products, Inc. (Revolver) (e) | L+8.50% | 11.01 | % | 4/8/2019 | 1,000 | 200 | 200 | 0.1 | % | |||||||||||||||
| Inland Pipe Rehabilitation LLC | L+5.50% | 8.29 | % | 12/26/2024 | 12,500 | 12,251 | 12,250 | 4.7 | % | |||||||||||||||
| Inland Pipe Rehabilitation LLC (Revolver) (e) | L+5.50% | 7.87 | % | 12/26/2024 | 4,118 | 2,305 | 2,259 | 0.9 | % | |||||||||||||||
| 33,188 | 29,789 | 29,791 | 11.5 | % | ||||||||||||||||||||
| Consumer Goods: Durable | ||||||||||||||||||||||||
| Nova Wildcat Amerock, LLC | L+5.75% | 8.26 | % | 10/12/2023 | 9,500 | 9,317 | 9,372 | 3.6 | % | |||||||||||||||
| Nova Wildcat Amerock, LLC (Revolver) (e) | L+5.75% | 8.26 | % | 10/12/2023 | 931 | 292 | 288 | 0.1 | % | |||||||||||||||
| Parterre Flooring & Surface Systems, LLC (l) | L+7.25% | 9.76 | % | 8/22/2022 | 11,250 | 11,076 | 10,879 | 4.2 | % | |||||||||||||||
| Parterre Flooring & Surface Systems, LLC (Revolver) (e) | L+7.25% | 9.76 | % | 8/22/2022 | 2,400 | 696 | 671 | 0.3 | % | |||||||||||||||
| 24,081 | 21,381 | 21,210 | 8.2 | % | ||||||||||||||||||||
| Energy: Oil & Gas | ||||||||||||||||||||||||
| Landpoint, LLC | L+12.75% | 13.01%
Cash/ 2.25% PIK |
(m) | 12/20/2019 | 2,256 | 2,253 | 2,244 | 0.9 | % | |||||||||||||||
| Landpoint, LLC (Revolver) (e) | L+10.50% | 13.01 | % | 12/20/2019 | 313 | 274 | 272 | 0.1 | % | |||||||||||||||
| 2,569 | 2,527 | 2,516 | 1.0 | % | ||||||||||||||||||||
| Environmental Industries | ||||||||||||||||||||||||
| StormTrap, LLC | L+5.50% | 8.01 | % | 12/8/2023 | 8,000 | 7,861 | 7,860 | 3.0 | % | |||||||||||||||
| StormTrap, LLC (Revolver) (e) | L+5.50% | 8.01 | % | 12/8/2023 | 432 | — | — | 0.0 | % | |||||||||||||||
| Synergy Environmental Corporation (l) | L+6.50% | 9.01 | % | 4/29/2021 | 2,932 | 2,893 | 2,919 | 1.1 | % | |||||||||||||||
| Synergy Environmental Corporation (l) | L+6.50% | 9.01 | % | 4/29/2021 | 490 | 484 | 488 | 0.2 | % | |||||||||||||||
| Synergy Environmental Corporation (Delayed Draw) (e) (f) | L+6.50% | 9.01 | % | 4/29/2021 | 1,320 | 837 | 834 | 0.3 | % | |||||||||||||||
| Synergy Environmental Corporation (Revolver) (e) | L+6.50% | 9.01 | % | 4/29/2021 | 671 | 94 | 94 | 0.0 | % | |||||||||||||||
| 13,845 | 12,169 | 12,195 | 4.6 | % | ||||||||||||||||||||
| Healthcare & Pharmaceuticals | ||||||||||||||||||||||||
| American Optics Holdco, Inc. (g) (n) | L+8.00% | 10.51 | % | 9/13/2022 | 4,076 | 4,012 | 4,127 | 1.6 | % | |||||||||||||||
| American Optics Holdco, Inc. (g) (n) | L+8.00% | 10.51 | % | 9/13/2022 | 750 | 738 | 759 | 0.3 | % | |||||||||||||||
| American Optics Holdco, Inc. (Revolver) (e) (g) (n) | L+8.00% | 10.51 | % | 9/13/2022 | 440 | 242 | 242 | 0.1 | % | |||||||||||||||
| American Optics Holdco, Inc. (Revolver) (e) (g) (n) | L+8.00% | 10.51 | % | 9/13/2022 | 440 | 165 | 165 | 0.1 | % | |||||||||||||||
| Familia Dental Group Holdings, LLC (l) | L+8.00% | 10.51 | % | 4/8/2021 | 5,053 | 5,011 | 5,083 | 2.0 | % | |||||||||||||||
| Familia Dental Group Holdings, LLC | L+8.00% | 10.51 | % | 4/8/2021 | 486 | 486 | 489 | 0.2 | % | |||||||||||||||
| Familia Dental Group Holdings, LLC (Revolver) (e) | L+8.00% | 10.51 | % | 4/8/2021 | 573 | 229 | 229 | 0.1 | % | |||||||||||||||
| Rockdale Blackhawk, LLC (DIP Facility) | n/a | 15.10 | % | n/a | (o) | 226 | 226 | 226 | 0.1 | % | ||||||||||||||
| Rockdale Blackhawk, LLC (DIP Facility) | n/a | 15.10 | % | n/a | (o) | 8,877 | 8,877 | 8,877 | 3.4 | % | ||||||||||||||
| Rockdale Blackhawk, LLC | L+13.00% | 15.51 | %(p) | 3/31/2020 | 10,923 | 10,465 | 8,667 | 3.3 | % | |||||||||||||||
| 31,844 | 30,451 | 28,864 | 11.2 | % | ||||||||||||||||||||
| F-16 |
MONROE CAPITAL CORPORATION
CONSOLIDATED SCHEDULE OF INVESTMENTS – (continued)
December 31, 2018
(in thousands, except for shares and units)
| Portfolio Company (a) | Spread
Above Index (b) |
Interest
Rate |
Maturity | Principal | Amortized
Cost |
Fair
Value (c) |
%
of Net Assets (d) |
|||||||||||||||||
| High Tech Industries | ||||||||||||||||||||||||
| Corbett Technology Solutions, Inc. (l) | L+7.00% | 9.51 | % | 11/8/2021 | 4,917 | $ | 4,868 | $ | 4,956 | 1.9 | % | |||||||||||||
| Corbett Technology Solutions, Inc. (Revolver) (e) | L+7.00% | 9.51 | % | 11/8/2021 | 867 | — | — | 0.0 | % | |||||||||||||||
| Energy Services Group, LLC | L+8.42% | 10.94 | % | 5/4/2022 | 4,393 | 4,349 | 4,404 | 1.7 | % | |||||||||||||||
| Energy Services Group, LLC (g) (q) | L+8.42% | 9.42 | % | 5/4/2022 | 5,046 | 5,186 | 5,033 | 1.9 | % | |||||||||||||||
| Energy Services Group, LLC | L+8.42% | 10.94 | % | 5/4/2022 | 1,250 | 1,235 | 1,253 | 0.5 | % | |||||||||||||||
| Host Analytics, Inc. | L+6.00% | 8.51 | % | 12/28/2023 | 9,500 | 9,310 | 9,310 | 3.6 | % | |||||||||||||||
| Host Analytics, Inc. (Revolver) (e) | L+6.00% | 8.51 | % | 12/28/2023 | 442 | — | — | 0.0 | % | |||||||||||||||
| Newforma, Inc. (l) | L+5.50% | 8.31 | % | 6/30/2022 | 14,813 | 14,649 | 14,961 | 5.8 | % | |||||||||||||||
| Newforma, Inc. (Revolver) (e) | L+5.50% | 8.31 | % | 6/30/2022 | 1,250 | — | — | 0.0 | % | |||||||||||||||
| Prototek Sheetmetal Fabrication, LLC | L+7.00% | 9.51 | % | 12/12/2022 | 3,465 | 3,408 | 3,451 | 1.3 | % | |||||||||||||||
| Prototek Sheetmetal Fabrication, LLC (Delayed Draw) (e) (f) | L+7.00% | 9.51 | % | 12/12/2022 | 2,329 | 813 | 809 | 0.3 | % | |||||||||||||||
| Prototek Sheetmetal Fabrication, LLC (Revolver) (e) | L+7.00% | 9.51 | % | 12/12/2022 | 233 | — | — | 0.0 | % | |||||||||||||||
| RPL Bidco Limited (g) (n) (q) | L+7.50% | 8.39 | % | 11/9/2023 | 13,774 | 14,122 | 13,912 | 5.4 | % | |||||||||||||||
| RPL Bidco Limited (Delayed Draw) (e) (f) (g) (n) (q) | L+7.50% | 8.39 | % | 11/9/2023 | 2,041 | — | — | 0.0 | % | |||||||||||||||
| RPL Bidco Limited (Revolver) (e) (g) (n) (q) | L+7.50% | 8.39 | % | 11/9/2023 | 510 | — | — | 0.0 | % | |||||||||||||||
| WillowTree, LLC | L+5.50% | 8.01 | % | 10/9/2023 | 7,980 | 7,846 | 7,972 | 3.1 | % | |||||||||||||||
| WillowTree, LLC (Revolver) (e) | L+5.50% | 8.01 | % | 10/9/2023 | 1,000 | 480 | 479 | 0.2 | % | |||||||||||||||
| 73,810 | 66,266 | 66,540 | 25.7 | % | ||||||||||||||||||||
| Hotels, Gaming & Leisure | ||||||||||||||||||||||||
| TRG, LLC | L+12.79% | 9.85% Cash/ 5.29% PIK |
(r) | 3/31/2021 | 17,144 | 17,086 | 18,636 | 7.2 | % | |||||||||||||||
| TRG, LLC (CapEx) | L+9.50% | 9.85% Cash/ 2.00% PIK |
3/31/2021 | 1,367 | 1,363 | 1,486 | 0.6 | % | ||||||||||||||||
| TRG, LLC (Revolver) (e) | L+9.50% | 11.85 | % | 3/31/2021 | 262 | 131 | 142 | 0.1 | % | |||||||||||||||
| 18,773 | 18,580 | 20,264 | 7.9 | % | ||||||||||||||||||||
| Media: Advertising, Printing & Publishing | ||||||||||||||||||||||||
| AdTheorent, Inc. | L+8.50% | 10.85 | % | 12/22/2021 | 4,092 | 4,039 | 4,098 | 1.6 | % | |||||||||||||||
| Destination Media, Inc. (l) | L+6.50% | 9.01 | % | 4/7/2022 | 7,366 | 7,289 | 7,421 | 2.9 | % | |||||||||||||||
| Destination Media, Inc. (Revolver) (e) | L+6.50% | 9.01 | % | 4/7/2022 | 542 | — | — | 0.0 | % | |||||||||||||||
| MC Sign Lessor Corp. | L+7.00% | 9.35 | % | 12/22/2022 | 9,925 | 9,760 | 10,024 | 3.9 | % | |||||||||||||||
| MC Sign Lessor Corp. (Delayed Draw) (e) (f) | L+7.00% | 9.35 | % | 12/22/2022 | 2,083 | — | — | 0.0 | % | |||||||||||||||
| MC Sign Lessor Corp. (Revolver) (e) | L+7.00% | 9.35 | % | 12/22/2022 | 625 | — | — | 0.0 | % | |||||||||||||||
| 24,633 | 21,088 | 21,543 | 8.4 | % | ||||||||||||||||||||
| Retail | ||||||||||||||||||||||||
| Bluestem Brands, Inc. | L+7.50% | 10.03 | % | 11/6/2020 | 2,436 | 2,426 | 1,575 | 0.6 | % | |||||||||||||||
| Forman Mills, Inc. (l) | L+9.50% | 10.01%
Cash/ 2.00% PIK |
10/4/2021 | 8,362 | 8,261 | 8,149 | 3.1 | % | ||||||||||||||||
| LuLu's Fashion Lounge, LLC | L+7.00% | 9.52 | % | 8/29/2022 | 4,531 | 4,426 | 4,606 | 1.8 | % | |||||||||||||||
| The Worth Collection, Ltd. (l) | L+8.50% | 11.01 | % | 9/29/2021 | 10,588 | 10,459 | 8,639 | 3.3 | % | |||||||||||||||
| Yandy Holding, LLC | L+11.00% | 13.51 | % | 9/30/2019 | 3,643 | 3,633 | 3,632 | 1.4 | % | |||||||||||||||
| Yandy Holding, LLC (Revolver) (e) | L+11.00% | 13.51 | % | 9/30/2019 | 907 | — | — | 0.0 | % | |||||||||||||||
| 30,467 | 29,205 | 26,601 | 10.2 | % | ||||||||||||||||||||
| Services: Business | ||||||||||||||||||||||||
| APCO Worldwide, Inc. | L+8.00% | 10.51 | % | 6/30/2022 | 4,875 | 4,802 | 4,790 | 2.0 | % | |||||||||||||||
| Atlas Sign Industries of FLA, LLC (l) | L+10.50% | 13.01 | % | 5/15/2023 | 3,500 | 3,305 | 3,336 | 1.3 | % | |||||||||||||||
| Burroughs, Inc. (l) | L+7.50% | 9.85 | % | 12/22/2022 | 5,888 | 5,814 | 5,767 | 2.2 | % | |||||||||||||||
| Burroughs, Inc. (Revolver) (e) | L+7.50% | 9.85 | % | 12/22/2022 | 1,215 | 975 | 975 | 0.4 | % | |||||||||||||||
| First Call Resolution, LLC (l) | L+7.00% | 9.35 | % | 9/22/2022 | 4,097 | 4,042 | 4,101 | 1.6 | % | |||||||||||||||
| First Call Resolution, LLC | L+7.00% | 9.35 | % | 9/22/2022 | 10,000 | 9,842 | 10,010 | 3.8 | % | |||||||||||||||
| IT Global Holding, LLC | L+7.00% | 9.51 | % | 11/10/2023 | 10,500 | 10,294 | 10,421 | 4.0 | % | |||||||||||||||
| IT Global Holding, LLC (Revolver) (e) | L+7.00% | 9.51 | % | 11/10/2023 | 875 | 263 | 263 | 0.1 | % | |||||||||||||||
| Madison Logic, Inc. (l) | L+8.00% | 10.51 | % | 11/30/2021 | 9,933 | 9,805 | 9,933 | 3.7 | % | |||||||||||||||
| Madison Logic, Inc. (Revolver) (e) | L+8.00% | 10.51 | % | 11/30/2021 | 988 | — | — | 0.0 | % | |||||||||||||||
| RedZone Robotics, Inc. | L+6.75% | 9.26 | % | 6/5/2023 | 946 | 929 | 868 | 0.3 | % | |||||||||||||||
| RedZone Robotics, Inc. (Revolver) (e) | L+6.75% | 9.26 | % | 6/5/2023 | 158 | — | — | 0.0 | % | |||||||||||||||
| TRP Construction Group, LLC (l) | L+6.50% | 9.01 | % | 10/5/2022 | 7,960 | 7,834 | 7,920 | 3.1 | % | |||||||||||||||
| TRP Construction Group, LLC (Delayed Draw) (e) (f) | L+6.50% | 9.01 | % | 10/5/2022 | 7,000 | 5,684 | 5,656 | 2.2 | % | |||||||||||||||
| TRP Construction Group, LLC (Revolver) (e) | L+6.50% | 9.01 | % | 10/5/2022 | 2,133 | — | — | 0.0 | % | |||||||||||||||
| VPS Holdings, LLC | L+7.00% | 9.51 | % | 10/4/2024 | 5,000 | 4,902 | 4,960 | 1.9 | % | |||||||||||||||
| VPS Holdings, LLC (Delayed Draw) (e) (f) | L+7.00% | 9.51 | % | 10/4/2024 | 4,000 | — | — | 0.0 | % | |||||||||||||||
| VPS Holdings, LLC (Revolver) (e) | L+7.00% | 9.51 | % | 10/4/2024 | 1,000 | 100 | 100 | 0.0 | % | |||||||||||||||
| 80,068 | 68,591 | 69,100 | 26.6 | % | ||||||||||||||||||||
| Services: Consumer | ||||||||||||||||||||||||
| Mammoth Holdings, LLC | L+6.00% | 8.44 | % | 10/16/2023 | 2,000 | 1,961 | 1,997 | 0.8 | % | |||||||||||||||
| Mammoth Holdings, LLC (Delayed Draw) (e) (f) | L+6.00% | 8.44 | % | 10/16/2023 | 4,167 | — | — | 0.0 | % | |||||||||||||||
| Mammoth Holdings, LLC (Revolver) (e) | L+6.00% | 8.44 | % | 10/16/2023 | 500 | — | — | 0.0 | % | |||||||||||||||
| PeopleConnect Intermediate, LLC | L+6.50% | 9.30 | % | 7/1/2020 | 4,272 | 4,239 | 4,253 | 1.6 | % | |||||||||||||||
| PeopleConnect Intermediate, LLC | L+12.50% | 15.30 | % | 7/1/2020 | 4,636 | 4,597 | 4,603 | 1.8 | % | |||||||||||||||
| PeopleConnect Intermediate, LLC (Revolver) (e) | L+9.50% | 12.30 | % | 7/1/2020 | 236 | 118 | 118 | 0.0 | % | |||||||||||||||
| 15,811 | 10,915 | 10,971 | 4.2 | % | ||||||||||||||||||||
| F-17 |
MONROE CAPITAL CORPORATION
CONSOLIDATED SCHEDULE OF INVESTMENTS – (continued)
December 31, 2018
(in thousands, except for shares and units)
| Portfolio Company (a) | Spread
Above Index (b) |
Interest
Rate |
Maturity | Principal | Amortized
Cost |
Fair
Value (c) |
%
of Net Assets (d) |
|||||||||||||||||
| Wholesale | ||||||||||||||||||||||||
| Mid-West Wholesale Hardware Co. (l) | L+8.00% | 10.51 | % | 2/9/2022 | 16,402 | $ | 16,173 | $ | 16,312 | 6.3 | % | |||||||||||||
| Mid-West Wholesale Hardware Co. (Revolver) (e) | L+8.00% | 10.51 | % | 2/9/2022 | 4,421 | 3,789 | 3,767 | 1.5 | % | |||||||||||||||
| Nearly Natural, Inc. (l) | L+7.00% | 9.81 | % | 12/15/2022 | 6,930 | 6,816 | 6,906 | 2.7 | % | |||||||||||||||
| Nearly Natural, Inc. (Revolver) (e) | L+7.00% | 9.81 | % | 12/15/2022 | 1,522 | 609 | 609 | 0.2 | % | |||||||||||||||
| 29,275 | 27,387 | 27,594 | 10.7 | % | ||||||||||||||||||||
| Total Non-Controlled/Non-Affiliate Senior Secured Loans | 457,492 | 402,281 | 401,289 | 155.0 | % | |||||||||||||||||||
| Unitranche Secured Loans (s) | ||||||||||||||||||||||||
| Chemicals, Plastics & Rubber | ||||||||||||||||||||||||
| MFG Chemical, LLC (l) | L+6.00% | 8.51 | % | 6/23/2022 | 10,477 | 10,359 | 10,319 | 4.0 | % | |||||||||||||||
| MFG Chemical, LLC | L+6.00% | 8.51 | % | 6/23/2022 | 1,132 | 1,132 | 1,115 | 0.4 | % | |||||||||||||||
| 11,609 | 11,491 | 11,434 | 4.4 | % | ||||||||||||||||||||
| Consumer Goods: Durable | ||||||||||||||||||||||||
| RugsUSA, LLC | L+6.50% | 9.31 | % | 4/28/2023 | 4,000 | 3,964 | 4,002 | 1.5 | % | |||||||||||||||
| 4,000 | 3,964 | 4,002 | 1.5 | % | ||||||||||||||||||||
| Healthcare & Pharmaceuticals | ||||||||||||||||||||||||
| Collaborative Neuroscience Network, LLC | L+11.50% | 14.01 | % | n/a | (o) | 6,120 | 6,096 | 5,894 | 2.3 | % | ||||||||||||||
| Collaborative Neuroscience Network, LLC | n/a | 12.00% Cash/ 3.00% PIK |
n/a | (o) | 304 | 304 | 304 | 0.1 | % | |||||||||||||||
| Collaborative Neuroscience Network, LLC (Revolver) | L+10.00% | 12.51 | % | n/a | (o) | 200 | 193 | 200 | 0.1 | % | ||||||||||||||
| Priority Ambulance, LLC (t) | L+6.50% | 9.31 | % | 4/12/2022 | 10,015 | 10,015 | 9,905 | 3.8 | % | |||||||||||||||
| Priority Ambulance, LLC (u) | L+6.50% | 9.31 | % | 4/12/2022 | 1,253 | 1,226 | 1,240 | 0.5 | % | |||||||||||||||
| Priority Ambulance, LLC (Delayed Draw) (e) (f) | L+6.50% | 9.31 | % | 4/12/2022 | 246 | — | — | 0.0 | % | |||||||||||||||
| Priority Ambulance, LLC (Delayed Draw) (e) (f) | L+6.50% | 9.31 | % | 4/12/2022 | 2,485 | — | — | 0.0 | % | |||||||||||||||
| 20,623 | 17,834 | 17,543 | 6.8 | % | ||||||||||||||||||||
| High Tech Industries | ||||||||||||||||||||||||
| Mnine Holdings, Inc. | L+6.75% | 9.31 | % | 11/2/2023 | 8,000 | 7,843 | 7,952 | 3.1 | % | |||||||||||||||
| 8,000 | 7,843 | 7,952 | 3.1 | % | ||||||||||||||||||||
| Total Non-Controlled/Non-Affiliate Unitranche Secured Loans | 44,232 | 41,132 | 40,931 | 15.8 | % | |||||||||||||||||||
| Junior Secured Loans | ||||||||||||||||||||||||
| Beverage, Food & Tobacco | ||||||||||||||||||||||||
| CSM Bakery Supplies, LLC | L+7.75% | 10.16 | % | 7/5/2021 | 5,792 | 5,792 | 5,314 | 2.1 | % | |||||||||||||||
| 5,792 | 5,792 | 5,314 | 2.1 | % | ||||||||||||||||||||
| High Tech Industries | ||||||||||||||||||||||||
| Micro Holdings Corp. | L+7.50% | 10.00 | % | 8/18/2025 | 3,000 | 2,972 | 2,805 | 1.1 | % | |||||||||||||||
| 3,000 | 2,972 | 2,805 | 1.1 | % | ||||||||||||||||||||
| Media: Broadcasting & Subscription | ||||||||||||||||||||||||
| Mergermarket Bidco Limited | L+7.25% | 9.76 | % | 8/4/2025 | 4,500 | 4,458 | 4,483 | 1.7 | % | |||||||||||||||
| 4,500 | 4,458 | 4,483 | 1.7 | % | ||||||||||||||||||||
| Media: Diversified & Production | ||||||||||||||||||||||||
| The Octave Music Group, Inc. | L+8.25% | 10.63 | % | 5/27/2022 | 5,000 | 4,957 | 5,000 | 1.9 | % | |||||||||||||||
| 5,000 | 4,957 | 5,000 | 1.9 | % | ||||||||||||||||||||
| Services: Consumer | ||||||||||||||||||||||||
| Education Corporation of America | L+11.00% | 8.31%
Cash/ 5.50% PIK |
(p) | 3/31/2020 | 2,292 | 2,288 | 2,292 | 0.9 | % | |||||||||||||||
| 2,292 | 2,288 | 2,292 | 0.9 | % | ||||||||||||||||||||
| Total Non-Controlled/Non-Affiliate Junior Secured Loans | 20,584 | 20,467 | 19,894 | 7.7 | % | |||||||||||||||||||
| Equity Securities (v) (w) | ||||||||||||||||||||||||
| Banking, Finance, Insurance & Real Estate | ||||||||||||||||||||||||
| PKS Holdings, LLC (warrant to purchase up to 0.8% of the equity) (g) | — | — | (x) | 11/30/2027 | — | 116 | 18 | 0.0 | % | |||||||||||||||
| 116 | 18 | 0.0 | % | |||||||||||||||||||||
| Chemicals, Plastics & Rubber | ||||||||||||||||||||||||
| Valudor Products, LLC (501,014 class A-1 units) | n/a | 10.00% PIK | — | — | 501 | 213 | 0.1 | % | ||||||||||||||||
| 501 | 213 | 0.1 | % | |||||||||||||||||||||
| Healthcare & Pharmaceuticals | ||||||||||||||||||||||||
| Collaborative Neuroscience Network, LLC (warrant to purchase up to 1.5% of the equity) | — | — | (x) | 12/27/2022 | — | — | 115 | 0.0 | % | |||||||||||||||
| Collaborative Neuroscience Network, LLC (warrant to purchase up to 2.1% of the equity) | — | — | (x) | 12/31/2027 | — | — | — | 0.0 | % | |||||||||||||||
| — | 115 | 0.0 | % | |||||||||||||||||||||
| High Tech Industries | ||||||||||||||||||||||||
| Answers Finance, LLC (76,539 shares of common stock) | — | — | (x) | — | — | 2,413 | 215 | 0.1 | % | |||||||||||||||
| Host Analytics, Inc. (441,860 class A Units) | — | — | (x) | — | — | 442 | 442 | 0.2 | % | |||||||||||||||
| 2,855 | 657 | 0.3 | % | |||||||||||||||||||||
| Hotels, Gaming & Leisure | ||||||||||||||||||||||||
| Playtime, LLC - Preferred Units (8,665 units) | — | — | (x) | — | — | 200 | — | 0.0 | % | |||||||||||||||
| 200 | — | 0.0 | % | |||||||||||||||||||||
| F-18 |
MONROE CAPITAL CORPORATION
CONSOLIDATED SCHEDULE OF INVESTMENTS – (continued)
December 31, 2018
(in thousands, except for shares and units)
| Portfolio Company (a) | Spread
Above Index (b) |
Interest
Rate |
Maturity | Principal | Amortized
Cost |
Fair
Value (c) |
%
of Net Assets (d) |
|||||||||||||||||
| Media: Advertising, Printing & Publishing | ||||||||||||||||||||||||
| AdTheorent, Inc. (128,866 class A voting units) | — | — | (x) | — | — | $ | 129 | $ | 156 | 0.1 | % | |||||||||||||
| InMobi Pte, Ltd. (warrant to purchase up to 2.8% of the equity) (g) (n) | — | — | (x) | 9/18/2025 | — | — | 209 | 0.1 | % | |||||||||||||||
| 129 | 365 | 0.2 | % | |||||||||||||||||||||
| Retail | ||||||||||||||||||||||||
| The Tie Bar Operating Company, LLC - Class A Preferred Units (1,275 units) | — | — | — | — | 87 | 109 | 0.0 | % | ||||||||||||||||
| The Tie Bar Operating Company, LLC - Class B Preferred Units (1,275 units) | — | — | — | — | — | — | 0.0 | % | ||||||||||||||||
| 87 | 109 | 0.0 | % | |||||||||||||||||||||
| Services: Business | ||||||||||||||||||||||||
| APCO Worldwide, Inc. (100 shares class A voting common stock) | — | — | (x) | — | — | 395 | 317 | 0.1 | % | |||||||||||||||
| Atlas Sign Industries of FLA, LLC (warrants to purchase up to 0.8% of the equity) | — | — | (x) | 5/14/2026 | — | 125 | 83 | 0.0 | % | |||||||||||||||
| 520 | 400 | 0.1 | % | |||||||||||||||||||||
| Services: Consumer | ||||||||||||||||||||||||
| Education Corporation of America - Series G Preferred Stock (8,333 shares) | n/a | 12.00% PIK | (p) | — | — | 7,492 | 4,583 | 1.8 | % | |||||||||||||||
| 7,492 | 4,583 | 1.8 | % | |||||||||||||||||||||
| Wholesale | ||||||||||||||||||||||||
| Nearly Natural, Inc. (152,174 class A units) | — | — | (x) | — | — | 152 | 146 | 0.1 | % | |||||||||||||||
| 152 | 146 | 0.1 | % | |||||||||||||||||||||
| Total Non-Controlled/Non-Affiliate Equity Securities | 12,052 | 6,606 | 2.6 | % | ||||||||||||||||||||
| Total Non-Controlled/Non-Affiliate Company Investments | $ | 475,932 | $ | 468,720 | 181.1 | % | ||||||||||||||||||
| Non-Controlled Affiliate Company Investments (y) | ||||||||||||||||||||||||
| Senior Secured Loans | ||||||||||||||||||||||||
| Banking, Finance, Insurance & Real Estate | ||||||||||||||||||||||||
| American Community Homes, Inc. | L+10.00% | 12.51% PIK | 7/22/2019 | 7,797 | $ | 7,770 | $ | 6,596 | 2.5 | % | ||||||||||||||
| American Community Homes, Inc. | L+14.50% | 17.01% PIK | 7/22/2019 | 4,725 | 4,711 | 3,997 | 1.5 | % | ||||||||||||||||
| American Community Homes, Inc. | L+10.00% | 12.51% PIK | 7/22/2019 | 590 | 587 | 499 | 0.2 | % | ||||||||||||||||
| American Community Homes, Inc. | L+10.00% | 12.51% PIK | 7/22/2019 | 473 | 469 | 400 | 0.2 | % | ||||||||||||||||
| American Community Homes, Inc. | L+14.50% | 17.01% PIK | 7/22/2019 | 254 | 252 | 215 | 0.1 | % | ||||||||||||||||
| American Community Homes, Inc. | L+8.00% | 10.51% PIK | 7/22/2019 | 1,710 | 1,710 | 1,446 | 0.6 | % | ||||||||||||||||
| 15,549 | 15,499 | 13,153 | 5.1 | % | ||||||||||||||||||||
| Containers, Packaging & Glass | ||||||||||||||||||||||||
| Summit Container Corporation (l) | L+8.00% | 10.51 | % | 1/6/2021 | 3,259 | 3,269 | 3,034 | 1.2 | % | |||||||||||||||
| Summit Container Corporation (Revolver) (e) (l) | L+8.00% | 10.51 | % | 1/6/2021 | 8,000 | 6,714 | 6,660 | 2.5 | % | |||||||||||||||
| 11,259 | 9,983 | 9,694 | 3.7 | % | ||||||||||||||||||||
| Healthcare & Pharmaceuticals | ||||||||||||||||||||||||
| SHI Holdings, Inc. (l) | L+10.25% | 12.76 | % | 7/10/2019 | 2,598 | 2,592 | 2,598 | 1.0 | % | |||||||||||||||
| SHI Holdings, Inc. (Revolver) (e) | L+10.25% | 12.76 | % | 7/10/2019 | 4,227 | 3,339 | 3,342 | 1.3 | % | |||||||||||||||
| 6,825 | 5,931 | 5,940 | 2.3 | % | ||||||||||||||||||||
| Retail | ||||||||||||||||||||||||
| Luxury Optical Holdings Co. | L+8.00% | 10.51% PIK | 9/12/2019 | 4,698 | 4,684 | 4,334 | 1.7 | % | ||||||||||||||||
| Luxury Optical Holdings Co. (Delayed Draw) (e) (f) | L+11.50% | 14.01 | % | 9/12/2019 | 1,059 | 624 | 622 | 0.2 | % | |||||||||||||||
| Luxury Optical Holdings Co. (Revolver) | L+8.00% | 10.51% PIK | 9/12/2019 | 217 | 217 | 200 | 0.1 | % | ||||||||||||||||
| 5,974 | 5,525 | 5,156 | 2.0 | % | ||||||||||||||||||||
| Services: Business | ||||||||||||||||||||||||
| Curion Holdings, LLC (l) | n/a | 4.00% Cash/ 10.00% PIK |
5/2/2022 | 3,953 | 3,912 | 3,592 | 1.4 | % | ||||||||||||||||
| Curion Holdings, LLC (Revolver) (e) | n/a | 14.00 | % | 5/2/2022 | 308 | 250 | 244 | 0.1 | % | |||||||||||||||
| 4,261 | 4,162 | 3,836 | 1.5 | % | ||||||||||||||||||||
| Total Non-Controlled Affiliate Senior Secured Loans | 43,868 | 41,100 | 37,779 | 14.6 | % | |||||||||||||||||||
| Unitranche Secured Loans (s) | ||||||||||||||||||||||||
| Consumer Goods: Non-Durable | ||||||||||||||||||||||||
| Incipio, LLC (z) | L+9.06% | 11.01% Cash/ 0.56% PIK |
(aa) | 7/1/2019 | 13,803 | 13,749 | 12,830 | 5.0 | % | |||||||||||||||
| Incipio, LLC (ab) | L+8.50% | 11.01 | % | 7/1/2019 | 3,613 | 3,613 | 3,573 | 1.4 | % | |||||||||||||||
| Incipio, LLC | L+8.50% | 11.01 | % | 7/1/2019 | 1,535 | 1,535 | 1,518 | 0.6 | % | |||||||||||||||
| 18,951 | 18,897 | 17,921 | 7.0 | % | ||||||||||||||||||||
| Total Non-Controlled Affiliate Unitranche Secured Loans | 18,951 | 18,897 | 17,921 | 7.0 | % | |||||||||||||||||||
| Junior Secured Loans | ||||||||||||||||||||||||
| Consumer Goods: Non-Durable | ||||||||||||||||||||||||
| Incipio, LLC (ac) | n/a | 10.70% PIK | (p) | 12/31/2020 | 3,766 | — | 1,260 | 0.4 | % | |||||||||||||||
| Incipio, LLC (ad) | n/a | 10.70% PIK | (p) | 12/31/2020 | 7,194 | — | — | 0.0 | % | |||||||||||||||
| 10,960 | — | 1,260 | 0.4 | % | ||||||||||||||||||||
| Services: Business | ||||||||||||||||||||||||
| Curion Holdings, LLC (l) | n/a | 15.00% PIK | (p) | 1/2/2023 | 1,720 | 1 | — | 0.0 | % | |||||||||||||||
| Curion Holdings, LLC (l) | n/a | 15.00% PIK | (p) | 1/2/2023 | 44 | — | — | 0.0 | % | |||||||||||||||
| 1,764 | 1 | — | 0.0 | % | ||||||||||||||||||||
| Total Non-Controlled Affiliate Junior Secured Loans | 12,724 | 1 | 1,260 | 0.4 | % | |||||||||||||||||||
| F-19 |
MONROE CAPITAL CORPORATION
CONSOLIDATED SCHEDULE OF INVESTMENTS – (continued)
December 31, 2018
(in thousands, except for shares and units)
| Portfolio Company (a) | Spread
Above Index (b) |
Interest
Rate |
Maturity | Principal | Amortized
Cost |
Fair
Value (c) |
%
of Net Assets (d) |
|||||||||||||||||
| Equity Securities (w) (y) | ||||||||||||||||||||||||
| Banking, Finance, Insurance & Real Estate | ||||||||||||||||||||||||
| American Community Homes, Inc. (warrant to purchase up to 22.3% of the equity) | — | — | (x) | 12/18/2024 | — | $ | — | $ | — | 0.0 | % | |||||||||||||
| — | — | 0.0 | % | |||||||||||||||||||||
| Consumer Goods: Non-Durable | ||||||||||||||||||||||||
| Incipio, LLC (1,774 shares of series C common units) | — | — | (x) | — | — | — | — | 0.0 | % | |||||||||||||||
| Millennial Brands LLC (10 preferred units) | — | — | (x) | — | — | 967 | — | 0.0 | % | |||||||||||||||
| Millennial Brands LLC (75,502 common units) | — | — | (x) | — | — | — | — | 0.0 | % | |||||||||||||||
| 967 | — | 0.0 | % | |||||||||||||||||||||
| Containers, Packaging & Glass | ||||||||||||||||||||||||
| Summit Container Corporation (warrant to purchase up to 19.5% of the equity) | — | — | (x) | 1/6/2024 | — | — | — | 0.0 | % | |||||||||||||||
| — | — | 0.0 | % | |||||||||||||||||||||
| Healthcare & Pharmaceuticals | ||||||||||||||||||||||||
| SHI Holdings, Inc. (24 shares of common stock) | — | — | (x) | — | — | 27 | 307 | 0.1 | % | |||||||||||||||
| 27 | 307 | 0.1 | % | |||||||||||||||||||||
| Retail | ||||||||||||||||||||||||
| Luxury Optical Holdings Co. (86 shares of common stock) | — | — | (x) | — | — | — | — | 0.0 | % | |||||||||||||||
| — | — | 0.0 | % | |||||||||||||||||||||
| Services: Business | ||||||||||||||||||||||||
| Curion Holdings, LLC (58,779 shares of common stock) | — | — | (x) | — | — | — | — | 0.0 | % | |||||||||||||||
| — | — | 0.0 | % | |||||||||||||||||||||
| Total Non-Controlled Affiliate Equity Securities | 994 | 307 | 0.1 | % | ||||||||||||||||||||
| Total Non-Controlled Affiliate Company Investments | $ | 60,992 | $ | 57,267 | 22.1 | % | ||||||||||||||||||
| Controlled Affiliate Company Investments (ae) | ||||||||||||||||||||||||
| Equity Securities | ||||||||||||||||||||||||
| Investment Funds & Vehicles | ||||||||||||||||||||||||
| MRCC Senior Loan Fund I, LLC (50.0% of the equity interests) (g) | — | — | — | — | $ | 27,200 | $ | 27,634 | 10.7 | % | ||||||||||||||
| Total Controlled Affiliate Equity Securities | 27,200 | 27,634 | 10.7 | % | ||||||||||||||||||||
| Total Controlled Affiliate Company Investments | $ | 27,200 | $ | 27,634 | 10.7 | % | ||||||||||||||||||
| TOTAL INVESTMENTS | $ | 564,124 | $ | 553,621 | 213.9 | % | ||||||||||||||||||
Derivative Instruments
| Foreign currency forward contracts | ||||||||||||||||
| Notional Amount | Notional Amount | Unrealized Gain | ||||||||||||||
| Description | to be Purchased | to be Sold | Counterparty | Settlement Date | (Loss) | |||||||||||
| Foreign currency forward contract | $ | 137 | £ | 107 | Bannockburn Global Forex, LLC | 1/2/2019 | $ | 1 | ||||||||
| Foreign currency forward contract | $ | 292 | £ | 228 | Bannockburn Global Forex, LLC | 2/28/2019 | 1 | |||||||||
| Foreign currency forward contract | $ | 136 | £ | 106 | Bannockburn Global Forex, LLC | 4/1/2019 | 1 | |||||||||
| Foreign currency forward contract | $ | 293 | £ | 229 | Bannockburn Global Forex, LLC | 5/31/2019 | 1 | |||||||||
| Foreign currency forward contract | $ | 136 | £ | 106 | Bannockburn Global Forex, LLC | 7/1/2019 | 1 | |||||||||
| Foreign currency forward contract | $ | 294 | £ | 230 | Bannockburn Global Forex, LLC | 8/30/2019 | 1 | |||||||||
| Foreign currency forward contract | $ | 134 | £ | 105 | Bannockburn Global Forex, LLC | 10/1/2019 | 1 | |||||||||
| Foreign currency forward contract | $ | 295 | £ | 230 | Bannockburn Global Forex, LLC | 11/29/2019 | 1 | |||||||||
| Foreign currency forward contract | $ | 133 | £ | 104 | Bannockburn Global Forex, LLC | 1/2/2020 | 1 | |||||||||
| Foreign currency forward contract | $ | 296 | £ | 231 | Bannockburn Global Forex, LLC | 2/28/2020 | 1 | |||||||||
| Foreign currency forward contract | $ | 132 | £ | 103 | Bannockburn Global Forex, LLC | 4/1/2020 | 1 | |||||||||
| Foreign currency forward contract | $ | 130 | £ | 102 | Bannockburn Global Forex, LLC | 5/5/2020 | 1 | |||||||||
| Foreign currency forward contract | $ | 296 | £ | 230 | Bannockburn Global Forex, LLC | 5/29/2020 | 1 | |||||||||
| Foreign currency forward contract | $ | 295 | £ | 230 | Bannockburn Global Forex, LLC | 8/28/2020 | 1 | |||||||||
| Foreign currency forward contract | $ | 294 | £ | 229 | Bannockburn Global Forex, LLC | 11/30/2020 | 2 | |||||||||
| $ | 16 | |||||||||||||||
| F-20 |
MONROE CAPITAL CORPORATION
CONSOLIDATED SCHEDULE OF INVESTMENTS – (continued)
December 31, 2018
(in thousands, except for shares and units)
| (a) | All of the Company’s investments are issued by eligible portfolio companies, as defined in the Investment Company Act of 1940 (the “1940 Act”), unless otherwise noted. All of the Company’s investments are issued by U.S. portfolio companies unless otherwise noted. |
| (b) | The majority of the investments bear interest at a rate that may be determined by reference to the London Interbank Offered Rate (“LIBOR” or “L”) or Prime Rate (“Prime” or “P”) which reset daily, monthly, quarterly, or semiannually. For each such investment, the Company has provided the spread over LIBOR or Prime and the current contractual interest rate in effect at December 31, 2018. Certain investments are subject to a LIBOR or Prime interest rate floor, or rate cap. |
| (c) | Because there is no readily available market value for these investments, the fair value of these investments is determined in good faith using significant unobservable inputs by our board of directors as required by the Investment Company Act of 1940. (See Note 4 in the accompanying notes to the consolidated financial statements.) |
| (d) | Percentages are based on net assets of $258,767 as of December 31, 2018. |
| (e) | All or a portion of this commitment was unfunded at December 31, 2018. As such, interest is earned only on the funded portion of this commitment. |
| (f) | This delayed draw loan requires that certain financial covenants be met by the portfolio company prior to any fundings. |
| (g) | This investment is treated as a non-qualifying investment under Section 55(a) of the 1940 Act. Under the 1940 Act, the Company may not acquire any non-qualifying asset unless, at the time the acquisition is made, qualifying assets represent at least 70% of the Company’s total assets. As of December 31, 2018, non-qualifying assets totaled 16.36% of the Company’s total assets. |
| (h) | The PIK portion of the interest rate for HFZ Capital Group, LLC is structured as a fee paid upon the termination of the commitment. The fee currently accrues at 0.17% per annum. |
| (i) | This investment represents a note convertible to preferred shares of the borrower. |
| (j) | A portion of this loan (principal of $2,010) is held in the Company’s wholly-owned subsidiary, Monroe Capital Corporation SBIC, LP, and is therefore not collateral to the Company’s revolving credit facility. |
| (k) | A portion of the PIK interest rate for Cornerstone Detention Products, Inc. is structured as a fee paid upon the termination of the commitment. The fee currently accrues at 2.33% per annum. |
| (l) | All of this loan is held in the Company’s wholly-owned subsidiary, Monroe Capital Corporation SBIC, LP, and is therefore not collateral to the Company’s revolving credit facility. |
| (m) | The PIK portion of the interest rate for Landpoint, LLC is structured as a fee paid upon the termination of the commitment. The fee currently accrues at 2.25% per annum. |
| (n) | This is an international company. |
| (o) | This is a demand note with no stated maturity. |
| (p) | This position was on non-accrual status as of December 31, 2018, meaning that the Company has ceased accruing interest income on the position. See Note 2 in the accompanying notes to the consolidated financial statements for additional information on the Company’s accounting policies. |
| (q) | This loan is denominated in Great Britain pounds and is translated into U.S. dollars as of the valuation date. |
| (r) | A portion of the PIK interest rate for TRG, LLC is structured as a fee paid upon the termination of the commitment. The fee currently accrues at 3.29% per annum. |
| (s) | The Company structures its unitranche secured loans as senior secured loans. The Company obtains security interests in the assets of these portfolio companies that serve as collateral in support of the repayment of these loans. This collateral may take the form of first-priority liens on the assets of a portfolio company. Generally, the Company syndicates a “first out” portion of the loan to an investor and retains a “last out” portion of the loan, in which case the “first out” portion of the loan will generally receive priority with respect to payments of principal, interest and any other amounts due thereunder. Unitranche structures combine characteristics of traditional first lien senior secured as well as second lien and subordinated loans and the Company’s unitranche secured loans will expose the Company to the risks associated with second lien and subordinated loans and may limit the Company’s recourse or ability to recover collateral upon a portfolio company’s bankruptcy. Unitranche secured loans typically provide for moderate loan amortization in the initial years of the facility, with the majority of the amortization deferred until loan maturity. Unitranche secured loans generally allow the borrower to make a large lump sum payment of principal at the end of the loan term, and there is a risk of loss if the borrower is unable to pay the lump sum or refinance the amount owed at maturity. In many cases the Company, together with its affiliates, are the sole or majority lender of these unitranche secured loans, which can afford the Company additional influence with a borrower in terms of monitoring and, if necessary, remediation in the event of underperformance. |
| (t) | A portion of this loan (principal of $9,258) is held in the Company’s wholly-owned subsidiary, Monroe Capital Corporation SBIC, LP, and is therefore not collateral to the Company’s revolving credit facility. |
| (u) | A portion of this loan (principal of $525) is held in the Company’s wholly-owned subsidiary, Monroe Capital Corporation SBIC, LP, and is therefore not collateral to the Company’s revolving credit facility. |
| (v) | Represents less than 5% ownership of the portfolio company’s voting securities. |
| (w) | Ownership of certain equity investments may occur through a holding company or partnership. |
| (x) | Represents a non-income producing security. |
| (y) | As defined in the 1940 Act, the Company is deemed to be an “Affiliated Person” of the portfolio company as it owns 5% or more of the portfolio company’s voting securities. See Note 5 in the accompanying notes to the consolidated financial statements for additional information on transactions in which the issuer was an Affiliated Person (but not a portfolio company that the Company is deemed to control). |
| (z) | A portion of this loan (principal of $5,061) is held in the Company’s wholly-owned subsidiary, Monroe Capital Corporation SBIC, LP, and is therefore not collateral to the Company’s revolving credit facility. |
| (aa) | The PIK portion of the interest rate for Incipio Technologies, Inc. is structured as a fee paid upon the termination of the commitment. The fee currently accrues at 0.56% per annum. |
| (ab) | A portion of this loan (principal of $46) is held in the Company’s wholly-owned subsidiary, Monroe Capital Corporation SBIC, LP, and is therefore not collateral to the Company’s revolving credit facility. |
| (ac) | A portion of this loan (principal of $1,015) is held in the Company’s wholly-owned subsidiary, Monroe Capital Corporation SBIC, LP, and is therefore not collateral to the Company’s revolving credit facility. |
| (ad) | A portion of this loan (principal of $1,938) is held in the Company’s wholly-owned subsidiary, Monroe Capital Corporation SBIC, LP, and is therefore not collateral to the Company’s revolving credit facility. |
| (ae) | As defined in the 1940 Act, the Company is deemed to be both an “Affiliated Person” of and to “Control” this portfolio company as it owns more than 25% of the portfolio company’s voting securities. See Note 5 in the accompanying notes to the consolidated financial statements for additional information on transactions in which the issuer was both an Affiliated Person and a portfolio company that the Company is deemed to Control. |
n/a - not applicable
See Notes to Consolidated Financial Statements.
| F-21 |
NOTES TO CONSOLIDATED FINANCIAL
STATEMENTS
(in thousands, except share and per share data)
Note 1. Organization and Principal Business
Monroe Capital Corporation (together with its subsidiaries, the “Company”) is an externally managed, non-diversified, closed-end management investment company and has elected to be regulated as a business development company (“BDC”) under the Investment Company Act of 1940, as amended (the “1940 Act”). The Company’s investment objective is to maximize the total return to its stockholders in the form of current income and capital appreciation through investment in senior secured, junior secured and unitranche secured (a combination of senior secured and junior secured debt in the same facility in which the Company syndicates a “first out” portion of the loan to an investor and retains a “last out” portion of the loan) debt and, to a lesser extent, unsecured subordinated debt and equity investments. The Company is managed by Monroe Capital BDC Advisors, LLC (“MC Advisors”), a registered investment adviser under the Investment Advisers Act of 1940, as amended. In addition, for U.S. federal income tax purposes, the Company has elected to be treated as a regulated investment company (“RIC”) under Subchapter M of the Internal Revenue Code of 1986, as amended (the “Code”).
On February 28, 2014, the Company’s wholly-owned subsidiary, Monroe Capital Corporation SBIC, LP (“MRCC SBIC”), a Delaware limited partnership, received a license from the Small Business Administration (“SBA”) to operate as a Small Business Investment Company (“SBIC”) under Section 301(c) of the Small Business Investment Act of 1958, as amended. MRCC SBIC commenced operations on September 16, 2013. See Note 7 for additional information.
On September 12, 2018, the Company closed a public offering of $69,000 in aggregate principal amount of senior unsecured notes (“2023 Notes”). On March 20, 2019, the Company completed a registered direct offering of $40,000 in additional aggregate principal amount of the 2023 Notes. See Note 7 for additional information.
Note 2. Summary of Significant Accounting Policies
Basis of Presentation
The accompanying consolidated financial statements of the Company have been prepared in accordance with generally accepted accounting principles in the United States of America (“GAAP”). The accompanying consolidated financial statements of the Company and related financial information have been prepared pursuant to the requirements for reporting on Form 10-K and Articles 6 and 10 of Regulation S-X. The Company has determined it meets the definition of an investment company and follows the accounting and reporting guidance in the Financial Accounting Standards Board (“FASB”) Accounting Standards Codification (“ASC”) Topic 946 - Financial Services - Investment Companies (“ASC Topic 946”). Certain prior period amounts have been reclassified to conform to the current period presentation.
Use of Estimates
The preparation of the consolidated financial statements in conformity with GAAP requires the Company to make estimates and assumptions that affect the reported amounts of assets and liabilities and the disclosure of contingent assets and liabilities as of the date of the consolidated financial statements and the reported amounts of revenue and expenses during the reporting period. Actual results could differ from those estimates.
Consolidation
As permitted under ASC Topic 946, the Company will generally not consolidate its investment in a portfolio company other than an investment company subsidiary or a controlled operating company whose business consists of providing services to the Company. Accordingly, the Company consolidated the results of the Company’s wholly-owned subsidiaries, MRCC SBIC and its wholly-owned general partner MCC SBIC GP, LLC, MRCC Holding Company I, LLC, MRCC Holding Company II, LLC, MRCC Holding Company III, LLC, and MRCC Holding Company IV, LLC, in its consolidated financial statements. All intercompany balances and transactions have been eliminated. The Company does not consolidate its non-controlling interest in MRCC Senior Loan Fund I, LLC (“SLF”). See further description of the Company’s investment in SLF in Note 3.
Fair Value of Financial Instruments
The Company applies fair value to substantially all of its financial instruments in accordance with ASC Topic 820 — Fair Value Measurements and Disclosures (“ASC Topic 820”). ASC Topic 820 defines fair value, establishes a framework used to measure fair value, and requires disclosures for fair value measurements, including the categorization of financial instruments into a three-level hierarchy based on the transparency of valuation inputs. See Note 4 for further discussion regarding the fair value measurements and hierarchy.
ASC Topic 820 requires disclosure of the fair value of financial instruments for which it is practical to estimate such value. The Company believes that the carrying amounts of its other financial instruments such as cash, receivables and payables approximate the fair value of such items due to the short maturity of such instruments.
Revenue Recognition
The Company’s revenue recognition policies are as follows:
Investments and related investment income: Interest and dividend income is recorded on the accrual basis to the extent that the Company expects to collect such amounts. Interest income is accrued based upon the outstanding principal amount and contractual terms of debt and preferred equity investments. Interest is accrued on a daily basis. The Company records fees on loans based on the determination of whether the fee is considered a yield enhancement or payment for a service. If the fee is considered a yield enhancement associated with a funding of cash on a loan, the fee is generally deferred and recognized into interest income using the effective interest method if captured in the cost basis or using the straight-line method if the loan is unfunded and therefore there is no cost basis. If the fee is not considered a yield enhancement because a service was provided, and the fee is payment for that service, the fee is deemed earned and recognized as fee income in the period the service has been completed.
| F-22 |
Dividend income on preferred equity securities is recorded as dividend income on an accrual basis to the extent that such amounts are payable by the portfolio company and are expected to be collected. Dividend income on common equity securities is recorded on the record date for private portfolio companies. Each distribution received from limited liability company (“LLC”) and limited partnership (“LP”) investments is evaluated to determine if the distribution should be recorded as dividend income or a return of capital. Generally, the Company will not record distributions from equity investments in LLCs and LPs as dividend income unless there are sufficient accumulated tax-basis earnings and profits in the LLC or LP prior to the distribution. Distributions that are classified as a return of capital are recorded as a reduction in the cost basis of the investment. For the years ended December 31, 2019, 2018, and 2017, the Company received return of capital distributions from its equity investments and its investment in LLC equity interest in SLF of $69, $11,167 and zero, respectively.
The Company has certain investments in its portfolio that contain a payment-in-kind (“PIK”) provision, which represents contractual interest or dividends that are added to the principal balance and recorded as income. The Company stops accruing PIK interest or PIK dividend when it is determined that PIK interest or PIK dividend is no longer collectible. To maintain RIC tax treatment, and to avoid corporate tax, substantially all of this income must be paid out to stockholders in the form of distributions, even though the Company has not yet collected the cash.
Loan origination fees, original issue discount and market discount or premiums are capitalized, and the Company then amortizes such amounts using the effective interest method as interest income over the life of the investment. Unamortized discounts and loan origination fees totaled $6,279 and $5,172 as of December 31, 2019 and 2018, respectively. Upfront loan origination and closing fees received for the years ended December 31, 2019, 2018 and 2017 totaled $3,250, $3,378 and $4,486 respectively. Upon the prepayment of a loan or debt security, any unamortized premium or discount or loan origination fees are recorded as interest income.
The components of the Company’s investment income were as follows:
| For the years ended December 31, | ||||||||||||
| 2019 | 2018 | 2017 | ||||||||||
| Interest income | $ | 54,254 | $ | 48,195 | $ | 42,836 | ||||||
| PIK interest income | 5,538 | 2,247 | 1,729 | |||||||||
| Dividend income (1) | 4,110 | 2,567 | 1,002 | |||||||||
| Fee income | 1,926 | 2,024 | 1,890 | |||||||||
| Prepayment gain (loss) | 883 | 1,088 | 1,790 | |||||||||
| Accretion of discounts and amortization of premium | 1,482 | 2,263 | 1,860 | |||||||||
| Total investment income | $ | 68,193 | $ | 58,384 | $ | 51,107 | ||||||
| (1) | During the years ended December 31, 2019, 2018 and 2017, includes PIK dividends of $54, $819 and $241, respectively. |
Investment transactions are recorded on a trade-date basis. Realized gains or losses on portfolio investments are calculated based upon the difference between the net proceeds from the disposition and the amortized cost basis of the investment, without regard to unrealized gains or losses previously recognized. Realized gains and losses are recorded within net realized gain (loss) on the consolidated statements of operations. Changes in the fair value of investments from the prior period, as determined by the Company’s board of directors (the “Board”) through the application of the Company’s valuation policy, are included within net change in unrealized gain (loss) on the consolidated statements of operations.
Non-accrual: Loans or preferred equity securities are placed on non-accrual status when principal, interest or dividend payments become materially past due, or when there is reasonable doubt that principal, interest or dividends will be collected. Additionally, any original issue discount and market discount are no longer accreted to interest income as of the date the loan is placed on non-accrual status. Interest payments received on non-accrual loans may be recognized as income or applied to principal depending upon management’s judgment. Non-accrual loans are restored to accrual status when past due principal, interest, or dividends are paid, and, in management’s judgment are likely to remain current. The fair value of the Company’s investments on non-accrual status totaled $34,052 and $16,802 at December 31, 2019 and 2018, respectively.
Partial loan sales: The Company follows the guidance in ASC Topic 860 - Transfers and Servicing (“ASC Topic 860”), when accounting for loan participations and other partial loan sales. Such guidance requires a participation or other partial loan sale to meet the definition of a “participating interest,” as defined in the guidance, in order for sale treatment to be allowed. Participations or other partial loan sales which do not meet the definition of a participating interest remain as an investment on the Company’s consolidated statements of assets and liabilities and the proceeds are recorded as a secured borrowing in the liabilities section of the consolidated statements of assets and liabilities until the definition of a sale is met. For these partial loan sales, the interest earned on the entire loan balance is recorded within “interest income” and the interest earned by the buyer in the partial loan sale is recorded within “interest and other debt financing expenses” on the accompanying consolidated statements of operations. Changes in the fair value of secured borrowings from the prior period, as determined by the Board through the application of the Company’s valuation policy, are included as changes in unrealized gain (loss) on secured borrowings on the consolidated statements of operations. See Note 7 for additional information.
Distributions
Distributions to common stockholders are recorded on the record date. The amount, if any, to be distributed is determined by the Board each quarter and is generally based upon the earnings estimated by management. Net realized capital gains, if any, are generally distributed at least annually.
The determination of the tax attributes for the Company’s distributions is made annually, based upon its taxable income for the full year and distributions paid for the full year. Ordinary dividend distributions from a RIC do not qualify for the preferential tax rate on qualified dividend income from domestic corporations and qualified foreign corporations, except to the extent that the RIC received the income in the form of qualifying dividends from domestic corporations and qualified foreign corporations. The tax attributes for distributions will generally include both ordinary income and capital gains, but may also include qualified dividends or return of capital.
| F-23 |
In October 2012, the Company adopted a dividend reinvestment plan (“DRIP”) that provides for the reinvestment of dividends on behalf of its stockholders, unless a stockholder has elected to receive dividends in cash. When the Company declares a cash dividend, the Company’s stockholders who have not “opted out” of the DRIP at least three days prior to the dividend payment date will have their cash dividend automatically reinvested into additional shares of the Company’s common stock. The Company has the option to satisfy the share requirements of the DRIP through the issuance of new shares of common stock or through open market purchases of common stock by the DRIP plan administrator. Newly issued shares are valued based upon the final closing price of the Company’s common stock on a date determined by the Board. Shares purchased in the open market to satisfy the DRIP requirements will be valued based upon the average price of the applicable shares purchased by the DRIP plan administrator, before any associated brokerage or other costs. See Note 10 for additional information on the Company’s distributions.
Earnings per Share
In accordance with the provisions of ASC Topic 260 — Earnings per Share, basic earnings per share is computed by dividing earnings available to common stockholders by the weighted average number of shares outstanding during the period. The weighted average shares outstanding utilized in the calculation of earnings per share take into account share issues on the issuance date and the Company’s repurchases of its common stock on the repurchase date. See Note 11 for additional information on the Company’s share activity. For the years presented in these consolidated financial statements, there were no potentially dilutive common shares issued.
Segments
In accordance with ASC Topic 280 — Segment Reporting, the Company has determined that it has a single reporting segment and operating unit structure.
Cash
The Company deposits its cash in a financial institution and, at times, such balances may be in excess of the Federal Deposit Insurance Corporation insurance limits.
Restricted Cash
Restricted cash includes amounts held within MRCC SBIC. Cash held within an SBIC is generally restricted to the originations of new loans from the SBIC and the payment of SBA debentures and related interest expense.
Unamortized Deferred Financing Costs
Deferred financing costs represent fees and other direct incremental costs incurred in connection with the Company’s borrowings. As of December 31, 2019 and 2018, the Company had unamortized deferred financing costs of $8,053 and $6,262, respectively, presented as a direct reduction of the carrying amount of debt on the consolidated statements of assets and liabilities. These amounts are amortized and included in interest and other debt financing expenses on the consolidated statements of operations over the estimated average life of the borrowings. Amortization of deferred financing costs for the years ended December 31, 2019, 2018 and 2017 was $1,869, $1,410 and $1,042, respectively.
Offering Costs
Offering costs include, among other things, fees paid in relation to legal, accounting, regulatory and printing work completed in preparation of debt and equity offerings. Offering costs from equity offerings are charged against the proceeds from the offering within the consolidated statements of changes in net assets. Offering costs from debt offerings are reclassified to unamortized deferred financing costs on the consolidated statements of assets and liabilities as noted above. As of December 31, 2019 and 2018, other assets on the consolidated statements of assets and liabilities included $378 and $328, respectively, of deferred offering costs which will be charged against the proceeds from future debt or equity offerings when completed.
Investments Denominated in Foreign Currency
As of both December 31, 2019 and 2018, the Company held investments in two portfolio companies that were denominated in Great Britain pounds.
At each balance sheet date, portfolio company investments denominated in foreign currencies are translated into U.S. dollars using the spot exchange rate on the last business day of the period. Purchases and sales of foreign portfolio company investments, and any income from such investments, are translated into U.S. dollars using the rates of exchange prevailing on the respective dates of such transactions.
Although the fair values of foreign portfolio company investments and the fluctuation in such fair values are translated into U.S. dollars using the applicable foreign exchange rates described above, the Company does not isolate the portion of the change in fair value resulting from foreign currency exchange rates fluctuations from the change in fair value of the underlying investment. All fluctuations in fair value are included in net change in unrealized gain (loss) on the Company’s consolidated statements of operations.
Investments denominated in foreign currencies and foreign currency transactions may involve certain consideration and risks not typically associated with those of domestic origin, including unanticipated movements in the value of the foreign currency relative to the U.S. dollar.
Derivative Instruments
The Company may enter into foreign currency forward contracts to reduce the Company’s exposure to foreign currency exchange rate fluctuations. In a foreign currency forward contract, the Company agrees to receive or deliver a fixed quantity of one currency for another, at a pre-determined price at a future date. Foreign currency forward contracts are marked-to-market based on the difference between the forward rate and the exchange rate at the current period end. Unrealized gain (loss) on foreign currency forward contracts are recorded on the Company’s consolidated statements of assets and liabilities by counterparty on a net basis.
The Company does not utilize hedge accounting and as such values its foreign currency forward contracts at fair value with the change in unrealized gain or loss recorded in net change in unrealized gain (loss) from foreign currency forward contracts and the realized gain or loss recorded in net realized gain (loss) from foreign currency forward contracts on the Company’s consolidated statements of operations.
| F-24 |
Income Taxes
The Company has elected to be treated as a RIC under Subchapter M of the Code and operates in a manner so as to qualify for the tax treatment available to RICs. To maintain qualification as a RIC, the Company must, among other things, meet certain source-of-income and asset diversification requirements and distribute to stockholders, for each taxable year, at least 90% of the Company’s “investment company taxable income,” which is generally the Company’s net ordinary income plus the excess, if any, of realized net short-term capital gains over realized net long-term capital losses. If the Company qualifies as a RIC and satisfies the annual distribution requirement, the Company will not have to pay corporate-level federal income taxes on any income that the Company distributes to its stockholders. The Company intends to make distributions in an amount sufficient to maintain RIC status each year and to avoid any federal income taxes on income. The Company is also subject to nondeductible federal excise taxes if the Company does not distribute at least 98% of net ordinary income, 98.2% of any capital gain net income, if any, and any recognized and undistributed income from prior years for which it paid no federal income taxes. To the extent that the Company determines that its estimated current year annual taxable income may exceed estimated current year dividend distributions, the Company accrues excise tax, calculated as 4% of the estimated excess taxable income, if any, as taxable income is earned. As of December 31, 2019, 2018 and 2017, the Company recorded a net expense on the consolidated statements of operations of $10, $11, and $100, respectively, for U.S. federal excise tax. As of December 31, 2019 and 2018, payables for excise taxes of $23 and zero, respectively, were included in accounts payable and accrued expenses on the consolidated statements of assets and liabilities.
Certain of the Company’s consolidated subsidiaries are subject to U.S. federal and state corporate-level income taxes. For the years ended December 31, 2019, 2018 and 2017, the Company recorded a net tax expense on the consolidated statements of consolidated statements of operations of $7, zero and zero, respectively, for these subsidiaries. As of December 31, 2019 and 2018, payables for corporate-level income taxes of $7 and zero, respectively, were included in accounts payable and accrued expenses on the consolidated statements of assets and liabilities.
The Company accounts for income taxes in conformity with ASC Topic 740 — Income Taxes (“ASC Topic 740”). ASC Topic 740 provides guidelines for how uncertain tax positions should be recognized, measured, presented and disclosed in the consolidated financial statements. ASC Topic 740 requires the evaluation of tax positions taken in the course of preparing the Company’s tax returns to determine whether the tax positions are “more-likely-than-not” to be sustained by the applicable tax authority. Tax benefits of positions not deemed to meet the more-likely-than-not threshold would be recorded as a tax expense in the current year. It is the Company’s policy to recognize accrued interest and penalties related to uncertain tax benefits in income tax expense. There were no material uncertain income tax positions through December 31, 2019. The 2016 through 2019 tax years remain subject to examination by U.S. federal and state tax authorities.
Subsequent Events
The Company has evaluated the need for disclosures and/or adjustments resulting from subsequent events through the date the consolidated financial statements were issued. There have been no subsequent events that occurred during such period that would require disclosure in this Form 10-K or would be required to be recognized in the consolidated financial statements as of and for the year ended December 31, 2019, except as disclosed in Note 14.
Recent Accounting Pronouncements
In August 2018, the FASB issued ASU 2018-13, Fair Value Measurement (Topic 820): Disclosure Framework – Changes to the Disclosure Requirements for Fair Value Measurement (“ASU 2018-13”). The primary objective of ASU 2018-13 is to improve the effectiveness of the disclosure requirements for fair value measurements in the notes to the financial statements. ASU 2018-13 is effective for interim and annual reporting periods beginning after December 15, 2019, although early adoption is permitted. Management is currently evaluating the impact these changes will have on the Company’s consolidated financial statements and disclosures.
In March 2019, the Securities and Exchange Commission (the “SEC”) adopted the final rule under SEC Release No. 33-10618, Fast Act Modernization and Simplification of Regulation S-K, amending certain disclosure requirements. The amendments are intended to simplify certain disclosure requirements and to provide for a consistent set of rules to govern incorporating information by reference and hyperlinking, improve readability and navigability of disclosure documents, and discourage repetition and disclosure of immaterial information. The Company has adopted the final rule, as applicable, and determined the effect was limited to the modification and removal of certain disclosures.
Note 3. Investments
The following tables show the composition of the investment portfolio, at amortized cost and fair value (with corresponding percentage of total portfolio investments):
| December 31, 2019 | December 31, 2018 | |||||||||||||||
| Amortized Cost: | ||||||||||||||||
| Senior secured loans | $ | 485,871 | 76.6 | % | $ | 443,381 | 78.6 | % | ||||||||
| Unitranche secured loans | 78,312 | 12.3 | 60,029 | 10.7 | ||||||||||||
| Junior secured loans | 13,923 | 2.2 | 20,468 | 3.6 | ||||||||||||
| LLC equity interest in SLF | 42,150 | 6.6 | 27,200 | 4.8 | ||||||||||||
| Equity securities | 14,480 | 2.3 | 13,046 | 2.3 | ||||||||||||
| Total | $ | 634,736 | 100.0 | % | $ | 564,124 | 100.0 | % | ||||||||
| December 31, 2019 | December 31, 2018 | |||||||||||||||
| Fair Value: | ||||||||||||||||
| Senior secured loans | $ | 475,157 | 77.1 | % | $ | 439,068 | 79.3 | % | ||||||||
| Unitranche secured loans | 76,247 | 12.4 | 58,852 | 10.6 | ||||||||||||
| Junior secured loans | 13,676 | 2.2 | 21,154 | 3.8 | ||||||||||||
| LLC equity interest in SLF | 42,412 | 6.9 | 27,634 | 5.0 | ||||||||||||
| Equity securities | 8,739 | 1.4 | 6,913 | 1.3 | ||||||||||||
| Total | $ | 616,231 | 100.0 | % | $ | 553,621 | 100.0 | % | ||||||||
| F-25 |
The following tables show the composition of the investment portfolio by geographic region, at amortized cost and fair value (with corresponding percentage of total portfolio investments). The geographic composition is determined by the location of the corporate headquarters of the portfolio company, which may not be indicative of the primary source of the portfolio company’s business:
| December 31, 2019 | December 31, 2018 | |||||||||||||||
| Amortized Cost: | ||||||||||||||||
| International | $ | 21,474 | 3.4 | % | $ | 19,279 | 3.4 | % | ||||||||
| Midwest | 135,258 | 21.3 | 127,364 | 22.6 | ||||||||||||
| Northeast | 160,184 | 25.3 | 129,417 | 22.9 | ||||||||||||
| Southeast | 150,486 | 23.7 | 121,312 | 21.5 | ||||||||||||
| Southwest | 57,971 | 9.1 | 52,272 | 9.3 | ||||||||||||
| West | 109,363 | 17.2 | 114,480 | 20.3 | ||||||||||||
| Total | $ | 634,736 | 100.0 | % | $ | 564,124 | 100.0 | % | ||||||||
| December 31, 2019 | December 31, 2018 | |||||||||||||||
| Fair Value: | ||||||||||||||||
| International | $ | 21,760 | 3.5 | % | $ | 19,205 | 3.5 | % | ||||||||
| Midwest | 127,532 | 20.7 | 124,667 | 22.5 | ||||||||||||
| Northeast | 147,673 | 24.0 | 127,607 | 23.0 | ||||||||||||
| Southeast | 147,634 | 23.9 | 118,161 | 21.3 | ||||||||||||
| Southwest | 68,205 | 11.1 | 50,657 | 9.2 | ||||||||||||
| West | 103,427 | 16.8 | 113,324 | 20.5 | ||||||||||||
| Total | $ | 616,231 | 100.0 | % | $ | 553,621 | 100.0 | % | ||||||||
The following tables show the composition of the investment portfolio by industry, at amortized cost and fair value (with corresponding percentage of total portfolio investments):
| December 31, 2019 | December 31, 2018 | |||||||||||||||
| Amortized Cost: | ||||||||||||||||
| Automotive | $ | 7,773 | 1.2 | % | $ | 7,887 | 1.4 | % | ||||||||
| Banking, Finance, Insurance & Real Estate | 81,183 | 12.8 | 58,088 | 10.3 | ||||||||||||
| Beverage, Food & Tobacco | 16,657 | 2.6 | 16,097 | 2.9 | ||||||||||||
| Chemicals, Plastics & Rubber | 29,683 | 4.7 | 15,259 | 2.7 | ||||||||||||
| Construction & Building | 30,695 | 4.8 | 29,789 | 5.3 | ||||||||||||
| Consumer Goods: Durable | 22,148 | 3.5 | 25,345 | 4.5 | ||||||||||||
| Consumer Goods: Non-Durable | 22,639 | 3.6 | 19,864 | 3.5 | ||||||||||||
| Containers, Packaging & Glass | 8,744 | 1.4 | 9,983 | 1.8 | ||||||||||||
| Energy: Oil & Gas | 4,296 | 0.7 | 2,527 | 0.4 | ||||||||||||
| Environmental Industries | 12,182 | 1.9 | 12,169 | 2.2 | ||||||||||||
| Healthcare & Pharmaceuticals | 54,024 | 8.5 | 54,243 | 9.6 | ||||||||||||
| High Tech Industries | 91,409 | 14.4 | 79,936 | 14.2 | ||||||||||||
| Hotels, Gaming & Leisure | — | — | 18,780 | 3.3 | ||||||||||||
| Investment Funds & Vehicles | 42,150 | 6.6 | 27,200 | 4.8 | ||||||||||||
| Media: Advertising, Printing & Publishing | 25,741 | 4.1 | 21,217 | 3.8 | ||||||||||||
| Media: Broadcasting & Subscription | 1,475 | 0.2 | 4,458 | 0.8 | ||||||||||||
| Media: Diversified & Production | 10,523 | 1.7 | 4,957 | 0.9 | ||||||||||||
| Retail | 30,621 | 4.8 | 34,817 | 6.1 | ||||||||||||
| Services: Business | 109,208 | 17.2 | 73,274 | 13.0 | ||||||||||||
| Services: Consumer | 25,552 | 4.0 | 20,695 | 3.6 | ||||||||||||
| Wholesale | 8,033 | 1.3 | 27,539 | 4.9 | ||||||||||||
| Total | $ | 634,736 | 100.0 | % | $ | 564,124 | 100.0 | % | ||||||||
| F-26 |
| December 31, 2019 | December 31, 2018 | |||||||||||||||
| Fair Value: | ||||||||||||||||
| Automotive | $ | 7,787 | 1.3 | % | $ | 7,878 | 1.4 | % | ||||||||
| Banking, Finance, Insurance & Real Estate | 76,351 | 12.4 | 55,839 | 10.1 | ||||||||||||
| Beverage, Food & Tobacco | 15,634 | 2.5 | 15,544 | 2.8 | ||||||||||||
| Chemicals, Plastics & Rubber | 29,509 | 4.8 | 14,971 | 2.7 | ||||||||||||
| Construction & Building | 30,887 | 5.0 | 29,791 | 5.4 | ||||||||||||
| Consumer Goods: Durable | 21,237 | 3.4 | 25,212 | 4.5 | ||||||||||||
| Consumer Goods: Non-Durable | 20,365 | 3.3 | 19,181 | 3.5 | ||||||||||||
| Containers, Packaging & Glass | 8,377 | 1.4 | 9,694 | 1.8 | ||||||||||||
| Energy: Oil & Gas | 4,306 | 0.7 | 2,516 | 0.4 | ||||||||||||
| Environmental Industries | 12,001 | 1.9 | 12,195 | 2.2 | ||||||||||||
| Healthcare & Pharmaceuticals | 62,727 | 10.2 | 52,769 | 9.5 | ||||||||||||
| High Tech Industries | 90,385 | 14.7 | 77,954 | 14.1 | ||||||||||||
| Hotels, Gaming & Leisure | — | — | 20,264 | 3.7 | ||||||||||||
| Investment Funds & Vehicles | 42,412 | 6.9 | 27,634 | 5.0 | ||||||||||||
| Media: Advertising, Printing & Publishing | 26,333 | 4.3 | 21,908 | 4.0 | ||||||||||||
| Media: Broadcasting & Subscription | 1,491 | 0.2 | 4,483 | 0.8 | ||||||||||||
| Media: Diversified & Production | 10,652 | 1.7 | 5,000 | 0.9 | ||||||||||||
| Retail | 16,998 | 2.8 | 31,866 | 5.8 | ||||||||||||
| Services: Business | 108,704 | 17.6 | 73,336 | 13.2 | ||||||||||||
| Services: Consumer | 22,051 | 3.6 | 17,846 | 3.2 | ||||||||||||
| Wholesale | 8,024 | 1.3 | 27,740 | 5.0 | ||||||||||||
| Total | $ | 616,231 | 100.0 | % | $ | 553,621 | 100.0 | % | ||||||||
MRCC Senior Loan Fund I, LLC
The Company co-invests with NLV Financial Corporation (“NLV”) in senior secured loans through SLF, an unconsolidated Delaware LLC. SLF is capitalized as underlying investment transactions are completed, taking into account available debt and equity commitments available for funding these investments. All portfolio and investment decisions in respect to SLF must be approved by the SLF investment committee, consisting of one representative from the Company and one representative from NLV. SLF may cease making new investments upon notification of either member but operations will continue until all investments have been sold or paid-off in the normal course of business. Investments held by SLF are measured at fair value using the same valuation methodologies as described in Note 4. The Company’s investment is illiquid in nature as SLF does not allow for withdrawal from the LLC or the sale of a member’s interest unless approved by the board members of SLF. The full withdrawal of a member would result in an orderly wind-down of SLF.
SLF’s profits and losses are allocated to the Company and NLV in accordance with their respective ownership interests. As of both December 31, 2019 and 2018, the Company and NLV each owned 50.0% of the LLC equity interests of SLF. As of both December 31, 2019 and 2018, SLF had $100,000 in equity commitments from its members (in the aggregate), of which $84,300 and $54,400 was funded, respectively.
As of both December 31, 2019 and 2018, the Company had committed to fund $50,000 of LLC equity interest subscriptions to SLF. As of December 31, 2019 and 2018, $42,150 and $27,200 of the Company’s LLC equity interest subscriptions to SLF had been called and contributed, net of return of capital distributions subject to recall, respectively.
For the years ended December 31, 2019 and 2018, the Company received $4,045 and $1,725 of dividend income from its LLC equity interest in SLF, respectively. For the year ended December 31, 2017, the Company did not receive dividend income from the SLF LLC equity interests, as the Company did not make its investment in SLF until November 2017.
SLF has a senior secured revolving credit facility (as amended, the “SLF Credit Facility”) with Capital One, N.A., through its wholly-owned subsidiary MRCC Senior Loan Fund I Financing SPV, LLC (“SLF SPV”), which as of December 31, 2019 allowed SLF SPV to borrow up to $170,000 at any one time, subject to leverage and borrowing base restrictions. On January 9, 2019, the SLF SPV closed a $20,000 upsize to the SLF Credit Facility, bringing the maximum amount the SLF SPV is able to borrow up to the now current $170,000. Borrowings under the SLF Credit Facility bear interest at an annual rate of LIBOR (three-month) plus 2.25%. The maturity date on the SLF Credit Facility is March 22, 2023.
SLF does not pay any fees to MC Advisors or its affiliates; however, SLF has entered into an administration agreement with Monroe Capital Management Advisors, LLC (“MC Management”), pursuant to which certain loan servicing and administrative functions are delegated to MC Management. SLF may reimburse MC Management for its allocable share of overhead and other expenses incurred by MC Management. For the years ended December 31, 2019, 2018, and 2017, SLF incurred $201, $72, and zero, of allocable expenses, respectively. There are no agreements or understandings by which the Company guarantees any SLF obligations.
As of December 31, 2019 and 2018, SLF had total assets at fair value of $245,469 and $177,122, respectively. As of both December 31, 2019 and 2018, SLF had zero portfolio company investments on non-accrual status. The portfolio companies in SLF are in industries and geographies similar to those in which the Company may invest directly. Additionally, as of December 31, 2019 and 2018, SLF had $4,861 and $5,466, respectively, in outstanding commitments to fund investments under undrawn revolvers and delayed draw commitments.
| F-27 |
Below is a summary of SLF’s portfolio, followed by a listing of the individual investments in SLF’s portfolio as of December 31, 2019 and 2018:
| As of | ||||||||
| December 31, 2019 | December 31, 2018 | |||||||
| Senior secured loans (1) | 243,778 | 174,267 | ||||||
| Weighted average current interest rate on senior secured loans (2) | 7.0 | % | 7.6 | % | ||||
| Number of borrowers in SLF | 64 | 50 | ||||||
| Largest portfolio company investment (1) | 6,860 | 6,930 | ||||||
| Total of five largest portfolio company investments (1) | 28,880 | 27,489 | ||||||
| (1) | Represents outstanding principal amount, excluding unfunded commitments. |
| (2) | Computed as the (a) annual stated interest rate on accruing senior secured loans divided by (b) total senior secured loans at outstanding principal amount. |
| F-28 |
MRCC SENIOR LOAN FUND I, LLC
CONSOLIDATED SCHEDULE OF INVESTMENTS
December 31, 2019
| Portfolio Company (a) | Spread
Above Index (b) | Interest Rate (b) | Maturity | Principal | Fair Value | |||||||||||||||
| Non-Controlled/Non-Affiliate Company Investments | ||||||||||||||||||||
| Senior Secured Loans | ||||||||||||||||||||
| Aerospace & Defense | ||||||||||||||||||||
| Bromford Industries Limited (e) | L+5.25% | 7.14 | % | 11/5/2025 | 2,800 | $ | 2,772 | |||||||||||||
| Bromford Industries Limited (e) | L+5.25% | 7.14 | % | 11/5/2025 | 1,867 | 1,848 | ||||||||||||||
| IMIA Holdings, Inc. | L+4.50% | 6.44 | % | 10/28/2024 | 4,277 | 4,277 | ||||||||||||||
| IMIA Holdings, Inc. (Revolver) (c) | L+4.50% | 6.44 | % | 10/28/2024 | 680 | — | ||||||||||||||
| MAG Aerospace Industries, Inc. | L+4.75% | 6.55 | % | 6/6/2025 | 3,251 | 3,234 | ||||||||||||||
| Novaria Holdings, LLC | L+4.75% | 6.55 | % | 12/19/2024 | 4,290 | 4,288 | ||||||||||||||
| Trident Maritime SH, Inc. | L+5.50% | 7.30 | % | 6/4/2024 | 4,435 | 4,404 | ||||||||||||||
| Trident Maritime SH, Inc. (Revolver) (c) | L+5.50% | 7.30 | % | 6/4/2024 | 340 | — | ||||||||||||||
| 21,940 | 20,823 | |||||||||||||||||||
| Automotive | ||||||||||||||||||||
| Innovative Aftermarkets Systems | L+5.50% | 7.30 | % | 1/25/2021 | 1,893 | 1,891 | ||||||||||||||
| Wheel Pros, LLC | L+4.75% | 6.55 | % | 4/4/2025 | 4,933 | 4,875 | ||||||||||||||
| 6,826 | 6,766 | |||||||||||||||||||
| Banking, Finance, Insurance & Real Estate | ||||||||||||||||||||
| Avison Young (USA), Inc. (e) | L+5.00% | 6.94 | % | 1/30/2026 | 4,950 | 4,874 | ||||||||||||||
| Lightbox Intermediate, L.P. | L+5.00% | 6.74 | % | 5/11/2026 | 4,975 | 4,913 | ||||||||||||||
| Minotaur Acquisition, Inc. | L+5.00% | 6.80 | % | 3/27/2026 | 2,978 | 2,940 | ||||||||||||||
| Nuvei Technologies Corp. (e) | L+5.00% | 6.80 | % | 9/26/2025 | 4,657 | 4,692 | ||||||||||||||
| Zenith Merger Sub, Inc. | L+5.25% | 7.19 | % | 12/13/2024 | 4,700 | 4,700 | ||||||||||||||
| Zenith Merger Sub, Inc. (Delayed Draw) (c) | L+5.25% | 7.19 | % | 12/13/2024 | 265 | 66 | ||||||||||||||
| 22,525 | 22,185 | |||||||||||||||||||
| Beverage, Food & Tobacco | ||||||||||||||||||||
| CBC Restaurant Corp. | L+6.50% | 8.30 | % | 11/10/2022 | 2,537 | 2,502 | ||||||||||||||
| SW Ingredients Holdings, LLC | L+4.00% | 6.21 | % | 7/3/2025 | 3,694 | 3,688 | ||||||||||||||
| US Salt, LLC | L+4.75% | 6.55 | % | 1/16/2026 | 2,729 | 2,743 | ||||||||||||||
| 8,960 | 8,933 | |||||||||||||||||||
| Capital Equipment | ||||||||||||||||||||
| Analogic Corporation | L+6.00% | 7.80 | % | 6/24/2024 | 4,874 | 4,854 | ||||||||||||||
| 4,874 | 4,854 | |||||||||||||||||||
| Chemicals, Plastics & Rubber | ||||||||||||||||||||
| Polymer Solutions Group | L+6.75% | 8.45 | % | 6/30/2021 | 1,271 | 1,271 | ||||||||||||||
| 1,271 | 1,271 | |||||||||||||||||||
| Construction & Building | ||||||||||||||||||||
| ISC Purchaser, LLC | L+5.00% | 6.94 | % | 7/11/2025 | 4,988 | 4,988 | ||||||||||||||
| The Cook & Boardman Group, LLC | L+5.75% | 7.67 | % | 10/20/2025 | 2,970 | 2,866 | ||||||||||||||
| 7,958 | 7,854 | |||||||||||||||||||
| Consumer Goods: Durable | ||||||||||||||||||||
| International Textile Group, Inc. | L+5.00% | 6.69 | % | 5/1/2024 | 1,805 | 1,498 | ||||||||||||||
| 1,805 | 1,498 | |||||||||||||||||||
| Consumer Goods: Non-Durable | ||||||||||||||||||||
| PH Beauty Holdings III, Inc. | L+5.00% | 6.80 | % | 9/26/2025 | 2,468 | 2,356 | ||||||||||||||
| 2,468 | 2,356 | |||||||||||||||||||
| Containers, Packaging & Glass | ||||||||||||||||||||
| Liqui-Box Holdings, Inc. (d) | L+4.50% | 6.30 | % | 6/3/2026 | 4,333 | 4,241 | ||||||||||||||
| Polychem Acquisition, LLC | L+5.00% | 6.95 | % | 3/17/2025 | 2,978 | 2,978 | ||||||||||||||
| Port Townsend Holdings Company, Inc. | L+4.75% | 6.55 | % | 4/3/2024 | 4,838 | 4,777 | ||||||||||||||
| PVHC Holding Corp. | L+4.75% | 6.69 | % | 8/5/2024 | 3,283 | 2,947 | ||||||||||||||
| PVHC Holding Corp. (Delayed Draw) (c) | L+4.75% | 6.69 | % | 8/5/2024 | 425 | — | ||||||||||||||
| 15,857 | 14,943 | |||||||||||||||||||
| Energy: Oil & Gas | ||||||||||||||||||||
| Drilling Info Holdings, Inc. | L+4.25% | 6.05 | % | 7/30/2025 | 4,609 | 4,586 | ||||||||||||||
| Offen, Inc. | L+5.00% | 6.94 | % | 6/22/2026 | 2,436 | 2,436 | ||||||||||||||
| Offen, Inc. (Delayed Draw) (c) | L+5.00% | 6.94 | % | 6/22/2026 | 885 | — | ||||||||||||||
| 7,930 | 7,022 | |||||||||||||||||||
| Healthcare & Pharmaceuticals | ||||||||||||||||||||
| LSCS Holdings, Inc. | L+4.25% | 6.19 | % | 3/17/2025 | 2,322 | 2,299 | ||||||||||||||
| LSCS Holdings, Inc. | L+4.25% | 6.19 | % | 3/17/2025 | 599 | 593 | ||||||||||||||
| P&L Developments, LLC | L+7.50% | 9.50 | % | 6/28/2024 | 2,993 | 2,978 | ||||||||||||||
| Radiology Partners, Inc. | L+4.75% | 6.62 | % | 7/9/2025 | 4,938 | 4,970 | ||||||||||||||
| Solara Medical Supplies, LLC | L+6.00% | 7.94 | % | 2/27/2024 | 5,515 | 5,515 | ||||||||||||||
| Solara Medical Supplies, LLC | L+6.00% | 7.94 | % | 2/27/2024 | 1,068 | 1,068 | ||||||||||||||
| Solara Medical Supplies, LLC (Revolver) (c) | L+6.00% | 7.94 | % | 2/27/2024 | 714 | — | ||||||||||||||
| 18,149 | 17,423 | |||||||||||||||||||
| High Tech Industries | ||||||||||||||||||||
| AQA Acquisition Holding, Inc. | L+4.25% | 6.19 | % | 5/24/2023 | 3,291 | 3,275 | ||||||||||||||
| Corel, Inc. (e) | L+5.00% | 6.91 | % | 7/2/2026 | 4,000 | 3,875 | ||||||||||||||
| Gigamon, Inc. | L+4.25% | 6.04 | % | 12/27/2024 | 2,940 | 2,914 | ||||||||||||||
| LW Buyer, LLC | L+5.00% | 6.80 | % | 12/30/2024 | 4,975 | 4,938 | ||||||||||||||
| Perforce Software, Inc. | L+4.50% | 6.30 | % | 7/1/2026 | 3,325 | 3,331 | ||||||||||||||
| TGG TS Acquisition Company | L+6.50% | 8.24 | % | 12/12/2025 | 4,058 | 4,037 | ||||||||||||||
| 22,589 | 22,370 | |||||||||||||||||||
| Hotels, Gaming & Leisure | ||||||||||||||||||||
| Excel Fitness Holdings, Inc. | L+5.25% | 7.05 | % | 10/7/2025 | 4,250 | 4,255 | ||||||||||||||
| North Haven Spartan US Holdco, LLC | L+5.00% | 6.89 | % | 6/6/2025 | 2,344 | 2,343 | ||||||||||||||
| Tait, LLC | L+4.50% | 6.61 | % | 3/28/2025 | 4,210 | 4,210 | ||||||||||||||
| Tait, LLC (Revolver) (c) | L+4.50% | 6.61 | % | 3/28/2025 | 769 | — | ||||||||||||||
| 11,573 | 10,808 | |||||||||||||||||||
| Media: Advertising, Printing & Publishing | ||||||||||||||||||||
| Cadent, LLC | L+5.25% | 7.05 | % | 9/11/2023 | 4,938 | 4,925 | ||||||||||||||
| Cadent, LLC (Revolver) (c) | L+5.25% | 7.05 | % | 9/11/2023 | 167 | — | ||||||||||||||
| Digital Room Holdings, Inc. | L+5.00% | 6.80 | % | 5/21/2026 | 4,406 | 4,186 | ||||||||||||||
| Monotype Imaging Holdings Corp. (d) | L+5.50% | 7.30 | % | 10/9/2026 | 5,000 | 4,825 | ||||||||||||||
| 14,511 | 13,936 | |||||||||||||||||||
| Media: Diversified & Production | ||||||||||||||||||||
| Research Now Group, Inc. and Survey Sampling International, LLC | L+5.50% | 7.41 | % | 12/20/2024 | 6,860 | 6,869 | ||||||||||||||
| Stats Intermediate Holding, LLC | L+5.25% | 7.30 | % | 7/10/2026 | 5,000 | 4,894 | ||||||||||||||
| 11,860 | 11,763 | |||||||||||||||||||
| Services: Business | ||||||||||||||||||||
| AQ Carver Buyer, Inc. (d) | L+5.00% | 6.80 | % | 9/24/2025 | 5,000 | 4,925 | ||||||||||||||
| CHA Holdings, Inc. | L+4.50% | 6.44 | % | 4/10/2025 | 2,023 | 2,020 | ||||||||||||||
| CHA Holdings, Inc. | L+4.50% | 6.44 | % | 4/10/2025 | 426 | 426 | ||||||||||||||
| Eliassen Group, LLC | L+4.50% | 6.30 | % | 11/5/2024 | 3,032 | 3,022 | ||||||||||||||
| Engage2Excel, Inc. | L+6.50% | 8.71 | % | 3/7/2023 | 4,298 | 4,181 | ||||||||||||||
| Engage2Excel, Inc. | L+6.50% | 8.42 | % | 3/7/2023 | 775 | 754 | ||||||||||||||
| Engage2Excel, Inc. (Delayed Draw) (c) | L+6.50% | 8.42 | % | 3/7/2023 | 500 | — | ||||||||||||||
| Engage2Excel, Inc. (Revolver) (c) | P+5.50% | 10.25 | % | 3/7/2023 | 545 | 354 | ||||||||||||||
| GI Revelation Acquisition, LLC | L+5.00% | 6.80 | % | 4/16/2025 | 1,379 | 1,305 | ||||||||||||||
| Orbit Purchaser, LLC | L+4.50% | 6.45 | % | 10/21/2024 | 2,481 | 2,479 | ||||||||||||||
| Orbit Purchaser, LLC | L+4.50% | 6.45 | % | 10/21/2024 | 1,916 | 1,914 | ||||||||||||||
| Orbit Purchaser, LLC | L+4.50% | 6.45 | % | 10/21/2024 | 560 | 560 | ||||||||||||||
| Output Services Group, Inc. | L+4.50% | 6.30 | % | 3/27/2024 | 4,916 | 4,166 | ||||||||||||||
| SIRVA Worldwide, Inc. | L+5.50% | 7.30 | % | 8/4/2025 | 1,950 | 1,931 | ||||||||||||||
| Teneo Holdings, LLC | L+5.25% | 6.99 | % | 7/11/2025 | 4,988 | 4,757 | ||||||||||||||
| The Kleinfelder Group, Inc. | L+4.75% | 6.37 | % | 11/29/2024 | 2,475 | 2,474 | ||||||||||||||
| 37,264 | 35,268 | |||||||||||||||||||
| Services: Consumer | ||||||||||||||||||||
| Cambium Learning Group, Inc. | L+4.50% | 6.30 | % | 12/18/2025 | 4,950 | 4,801 | ||||||||||||||
| LegalZoom.com, Inc. | L+4.50% | 6.30 | % | 11/21/2024 | 2,722 | 2,747 | ||||||||||||||
| 7,672 | 7,548 | |||||||||||||||||||
| Telecommunications | ||||||||||||||||||||
| Intermedia Holdings, Inc. | L+6.00% | 7.80 | % | 7/21/2025 | 1,815 | 1,820 | ||||||||||||||
| Mavenir Systems, Inc. | L+6.00% | 7.91 | % | 5/8/2025 | 3,940 | 3,920 | ||||||||||||||
| 5,755 | 5,740 | |||||||||||||||||||
| Transportation: Cargo | ||||||||||||||||||||
| GlobalTranz Enterprises, LLC | L+5.00% | 6.79 | % | 5/15/2026 | 3,295 | 3,032 | ||||||||||||||
| 3,295 | 3,032 | |||||||||||||||||||
| Utilities: Oil & Gas | ||||||||||||||||||||
| NGS US Finco, LLC | L+4.25% | 6.05 | % | 10/1/2025 | 1,733 | 1,733 | ||||||||||||||
| 1,733 | 1,733 | |||||||||||||||||||
| Wholesale | ||||||||||||||||||||
| BMC Acquisition, Inc. | L+5.25% | 7.17 | % | 12/30/2024 | 4,900 | 4,888 | ||||||||||||||
| Halo Buyer, Inc. | L+4.50% | 6.30 | % | 6/30/2025 | 4,925 | 4,827 | ||||||||||||||
| PT Intermediate Holdings III, LLC | L+5.50% | 7.44 | % | 10/15/2025 | 2,000 | 1,995 | ||||||||||||||
| 11,825 | 11,710 | |||||||||||||||||||
| TOTAL INVESTMENTS | $ | 239,836 | ||||||||||||||||||
| (a) | All investments are U.S. companies unless otherwise noted. |
| (b) | The majority of investments bear interest at a rate that may be determined by reference to the London Interbank Offered Rate (“LIBOR” or “L”) or Prime (“P”) which reset daily, monthly, quarterly or semiannually. The Company has provided the spread over LIBOR or Prime and the current contractual rate of interest in effect at December 31, 2019. Certain investments are subject to a LIBOR or Prime interest rate floor. |
| (c) | All or a portion of this commitment was unfunded as of December 31, 2019. As such, interest is earned only on the funded portion of this commitment. Principal reflects the commitment outstanding. |
| (d) | Investment position or portion thereof unsettled as of December 31, 2019. |
| (e) | This is an international company. |
| F-29 |
MRCC SENIOR LOAN FUND I, LLC
CONSOLIDATED SCHEDULE OF INVESTMENTS
December 31, 2018
| Portfolio Company (a) | Spread
Above Index (b) | Interest Rate (b) | Maturity | Principal | Fair Value | |||||||||||||||
| Non-Controlled/Non-Affiliate Company Investments | ||||||||||||||||||||
| Senior Secured Loans | ||||||||||||||||||||
| Aerospace & Defense | ||||||||||||||||||||
| IMIA Holdings, Inc. | L+4.50% | 7.30 | % | 10/28/2024 | 4,320 | $ | 4,341 | |||||||||||||
| IMIA Holdings, Inc. (Revolver) (c) | L+4.50% | 7.30 | % | 10/28/2024 | 680 | — | ||||||||||||||
| MAG Aerospace Industries, Inc. | L+4.75% | 7.27 | % | 6/6/2025 | 3,284 | 3,267 | ||||||||||||||
| Novaria Holdings, LLC (d) | L+4.75% | 7.27 | % | 12/19/2024 | 4,333 | 4,290 | ||||||||||||||
| The KEYW Corporation | L+4.50% | 6.89 | % | 5/8/2024 | 1,488 | 1,473 | ||||||||||||||
| Trident Maritime SH, Inc. | L+5.50% | 8.30 | % | 6/4/2024 | 4,637 | 4,623 | ||||||||||||||
| Trident Maritime SH, Inc. (Revolver) (c) | L+5.50% | 8.30 | % | 6/4/2024 | 340 | — | ||||||||||||||
| 19,082 | 17,994 | |||||||||||||||||||
| Automotive | ||||||||||||||||||||
| Wheel Pros, LLC | L+4.75% | 7.27 | % | 4/4/2025 | 3,980 | 3,920 | ||||||||||||||
| 3,980 | 3,920 | |||||||||||||||||||
| Banking, Finance, Insurance & Real Estate | ||||||||||||||||||||
| Kestra Financial, Inc. (d) | L+4.25% | 6.77 | % | 6/24/2022 | 3,564 | 3,537 | ||||||||||||||
| MTC Intermediate Holdco, Inc. | L+4.50% | 7.02 | % | 1/30/2023 | 4,963 | 4,963 | ||||||||||||||
| Pivotal Payments, Inc. | P+3.50% | 9.00 | % | 9/26/2025 | 2,902 | 2,873 | ||||||||||||||
| Pivotal Payments, Inc. (Delayed Draw) (c) | L+4.50% | 6.98 | % | 9/26/2025 | 841 | 518 | ||||||||||||||
| Zenith Merger Sub, Inc. | L+5.50% | 8.30 | % | 12/13/2023 | 3,713 | 3,701 | ||||||||||||||
| 15,983 | 15,592 | |||||||||||||||||||
| Beverage, Food & Tobacco | ||||||||||||||||||||
| Il Fornaio (America) Corporation | L+6.50% | 9.02 | % | 11/10/2022 | 4,894 | 4,847 | ||||||||||||||
| SW Ingredients Holdings, LLC | L+4.25% | 7.05 | % | 7/3/2025 | 3,731 | 3,709 | ||||||||||||||
| US Salt, LLC | L+4.75% | 7.27 | % | 11/30/2023 | 3,474 | 3,474 | ||||||||||||||
| 12,099 | 12,030 | |||||||||||||||||||
| Capital Equipment | ||||||||||||||||||||
| Analogic Corporation | L+6.00% | 8.52 | % | 6/24/2024 | 4,988 | 4,786 | ||||||||||||||
| 4,988 | 4,786 | |||||||||||||||||||
| Chemicals, Plastics & Rubber | ||||||||||||||||||||
| Loparex International B.V. (e) | L+4.25% | 7.05 | % | 4/11/2025 | 498 | 490 | ||||||||||||||
| Peach State Labs, LLC | L+6.50% | 8.85 | % | 6/30/2021 | 2,850 | 2,825 | ||||||||||||||
| 3,348 | 3,315 | |||||||||||||||||||
| Construction & Building | ||||||||||||||||||||
| Fastener Acquisition, Inc. | L+4.25% | 7.05 | % | 3/28/2025 | 1,323 | 1,256 | ||||||||||||||
| The Cook & Boardman Group, LLC | L+5.75% | 8.55 | % | 10/20/2025 | 3,000 | 2,978 | ||||||||||||||
| 4,323 | 4,234 | |||||||||||||||||||
| Consumer Goods: Durable | ||||||||||||||||||||
| International Textile Group, Inc. | L+5.00% | 7.35 | % | 5/1/2024 | 1,852 | 1,819 | ||||||||||||||
| SSH Group Holdings, Inc. | L+4.25% | 6.77 | % | 7/30/2025 | 2,327 | 2,240 | ||||||||||||||
| 4,179 | 4,059 | |||||||||||||||||||
| Consumer Goods: Non-Durable | ||||||||||||||||||||
| PH Beauty Holdings III, Inc. | L+5.00% | 7.52 | % | 9/26/2025 | 1,995 | 1,925 | ||||||||||||||
| 1,995 | 1,925 | |||||||||||||||||||
| Containers, Packaging & Glass | ||||||||||||||||||||
| Port Townsend Holdings Company, Inc. | L+4.75% | 7.27 | % | 4/3/2024 | 4,887 | 4,893 | ||||||||||||||
| PVHC Holding Corp. | L+4.75% | 7.57 | % | 8/5/2024 | 3,317 | 3,333 | ||||||||||||||
| PVHC Holding Corp. (Delayed Draw) (c) | L+4.75% | 7.57 | % | 8/5/2024 | 425 | — | ||||||||||||||
| 8,629 | 8,226 | |||||||||||||||||||
| Energy: Oil & Gas | ||||||||||||||||||||
| Drilling Info Holdings, Inc. | L+4.25% | 6.77 | % | 7/30/2025 | 4,307 | 4,296 | ||||||||||||||
| Drilling Info Holdings, Inc. (Delayed Draw) (c) | L+4.25% | 6.77 | % | 7/30/2025 | 350 | — | ||||||||||||||
| 4,657 | 4,296 | |||||||||||||||||||
| Healthcare & Pharmaceuticals | ||||||||||||||||||||
| LSCS Holdings, Inc. | L+4.25% | 6.77 | % | 3/17/2025 | 2,328 | 2,316 | ||||||||||||||
| LSCS Holdings, Inc. | L+4.25% | 6.96 | % | 3/17/2025 | 601 | 598 | ||||||||||||||
| Radiology Partners, Inc. | L+4.25% | 6.87 | % | 7/9/2025 | 4,988 | 4,900 | ||||||||||||||
| Solara Medical Supplies, LLC | L+6.00% | 8.52 | % | 5/31/2023 | 5,571 | 5,594 | ||||||||||||||
| Solara Medical Supplies, LLC (Delayed Draw) (c) | L+6.00% | 8.52 | % | 5/31/2023 | 1,071 | — | ||||||||||||||
| Solara Medical Supplies, LLC (Revolver) (c) | L+6.00% | 8.52 | % | 5/31/2023 | 714 | — | ||||||||||||||
| 15,273 | 13,408 | |||||||||||||||||||
| High Tech Industries | ||||||||||||||||||||
| AQA Acquisition Holding, Inc. | L+4.25% | 7.05 | % | 5/24/2023 | 3,325 | 3,308 | ||||||||||||||
| Corel, Inc. (d) (e) | L+5.00% | 7.71 | % | 6/4/2024 | 3,786 | 3,749 | ||||||||||||||
| Gigamon, Inc. | L+4.25% | 7.05 | % | 12/27/2024 | 2,970 | 2,933 | ||||||||||||||
| TGG TS Acquisition Company (d) | L+6.50% | 9.02 | % | 12/12/2025 | 4,400 | 4,241 | ||||||||||||||
| 14,481 | 14,231 | |||||||||||||||||||
| Media: Advertising, Printing & Publishing | ||||||||||||||||||||
| Cadent, LLC | L+5.25% | 7.71 | % | 9/11/2023 | 4,988 | 4,975 | ||||||||||||||
| Cadent, LLC (Revolver) (c) | L+5.25% | 7.71 | % | 9/11/2023 | 167 | — | ||||||||||||||
| 5,155 | 4,975 | |||||||||||||||||||
| Media: Diversified & Production | ||||||||||||||||||||
| Research Now Group, Inc. and Survey Sampling International, LLC | L+5.50% | 8.02 | % | 12/20/2024 | 6,930 | 6,817 | ||||||||||||||
| 6,930 | 6,817 | |||||||||||||||||||
| Services: Business | ||||||||||||||||||||
| CHA Holdings, Inc. | L+4.50% | 7.30 | % | 4/10/2025 | 2,043 | 2,041 | ||||||||||||||
| CHA Holdings, Inc. (Delayed Draw) (c) | L+4.50% | 7.30 | % | 4/10/2025 | 446 | — | ||||||||||||||
| Eliassen Group, LLC | L+4.50% | 7.02 | % | 11/5/2024 | 2,500 | 2,475 | ||||||||||||||
| Engage2Excel, Inc. | L+6.50% | 8.93 | % | 3/7/2023 | 4,342 | 4,320 | ||||||||||||||
| Engage2Excel, Inc. (Revolver) (c) | L+6.50% | 8.95 | % | 3/7/2023 | 545 | 155 | ||||||||||||||
| GI Revelation Acquisition, LLC | L+5.00% | 7.52 | % | 4/16/2025 | 1,393 | 1,374 | ||||||||||||||
| North Haven CA Holdings, Inc. | L+4.50% | 7.02 | % | 9/29/2023 | 5,000 | 4,972 | ||||||||||||||
| Orbit Purchaser, LLC | L+4.50% | 7.17 | % | 10/21/2024 | 1,931 | 1,919 | ||||||||||||||
| Orbit Purchaser, LLC (Delayed Draw) (c) | L+4.50% | 7.17 | % | 10/21/2024 | 565 | — | ||||||||||||||
| Output Services Group, Inc. | L+4.25% | 6.77 | % | 3/27/2024 | 4,965 | 4,828 | ||||||||||||||
| SIRVA Worldwide, Inc. | L+5.50% | 8.02 | % | 8/4/2025 | 2,000 | 1,965 | ||||||||||||||
| The Kleinfelder Group, Inc. (d) | L+4.75% | 7.27 | % | 11/29/2024 | 2,500 | 2,475 | ||||||||||||||
| 28,230 | 26,524 | |||||||||||||||||||
| Services: Consumer | ||||||||||||||||||||
| Cambium Learning Group, Inc. (d) | L+4.50% | 7.02 | % | 12/18/2025 | 5,000 | 4,769 | ||||||||||||||
| LegalZoom.com, Inc. | L+4.50% | 7.00 | % | 11/21/2024 | 2,749 | 2,708 | ||||||||||||||
| WeddingWire, Inc. (d) | L+4.50% | 7.02 | % | 12/19/2025 | 1,167 | 1,149 | ||||||||||||||
| 8,916 | 8,626 | |||||||||||||||||||
| Telecommunications | ||||||||||||||||||||
| Intermedia Holdings, Inc. | L+6.00% | 8.52 | % | 7/21/2025 | 1,833 | 1,831 | ||||||||||||||
| Mavenir Systems, Inc. | L+6.00% | 8.39 | % | 5/8/2025 | 3,980 | 3,968 | ||||||||||||||
| 5,813 | 5,799 | |||||||||||||||||||
| Utilities: Oil & Gas | ||||||||||||||||||||
| NGS US Finco, LLC | L+4.25% | 6.76 | % | 10/1/2025 | 1,750 | 1,746 | ||||||||||||||
| 1,750 | 1,746 | |||||||||||||||||||
| Wholesale | ||||||||||||||||||||
| BMC Acquisition, Inc. | L+5.25% | 8.13 | % | 12/30/2024 | 4,950 | 4,962 | ||||||||||||||
| Halo Buyer, Inc. | L+4.50% | 7.02 | % | 6/27/2025 | 3,501 | 3,431 | ||||||||||||||
| Halo Buyer, Inc. | L+4.50% | 7.02 | % | 6/27/2025 | 1,474 | 1,445 | ||||||||||||||
| 9,925 | 9,838 | |||||||||||||||||||
| TOTAL INVESTMENTS | $ | 172,341 | ||||||||||||||||||
| (a) | All investments are U.S. companies unless otherwise noted. |
| (b) | The majority of investments bear interest at a rate that may be determined by reference to the London Interbank Offered Rate (“LIBOR” or “L”) or Prime Rate (“Prime” or “P”) which reset daily, monthly, quarterly or semiannually. The Company has provided the spread over LIBOR or Prime and the current contractual rate of interest in effect at December 31, 2018. Certain investments are subject to a LIBOR or Prime interest rate floor. |
| (c) | All or a portion of this commitment was unfunded as of December 31, 2018. As such, interest is earned only on the funded portion of this commitment. Principal reflects the commitment outstanding. |
| (d) | Investment position or portion thereof unsettled as of December 31, 2018. |
| (e) | This is an international company. |
| F-30 |
Below is certain summarized financial information for SLF as of December 31, 2019 and 2018 and for the years ended December 31, 2019, 2018 and 2017:
| December 31, 2019 | December 31, 2018 | |||||||
| Assets | ||||||||
| Investments, at fair value | $ | 239,836 | $ | 172,341 | ||||
| Cash | 446 | 448 | ||||||
| Restricted cash | 4,226 | 3,838 | ||||||
| Interest receivable | 920 | 456 | ||||||
| Other assets | 41 | 39 | ||||||
| Total assets | 245,469 | 177,122 | ||||||
| Liabilities | ||||||||
| Revolving credit facility | 147,232 | 101,060 | ||||||
| Less: Unamortized deferred financing costs | (1,407 | ) | (1,625 | ) | ||||
| Total debt, less unamortized deferred financing costs | 145,825 | 99,435 | ||||||
| Payable for open trades | 13,940 | 21,746 | ||||||
| Interest payable | 533 | 457 | ||||||
| Accounts payable and accrued expenses | 346 | 216 | ||||||
| Total liabilities | 160,644 | 121,854 | ||||||
| Members’ capital | 84,825 | 55,268 | ||||||
| Total liabilities and members’ capital | $ | 245,469 | $ | 177,122 | ||||
| For the years ended December 31, | ||||||||||||
| 2019 | 2018 | 2017 (1) | ||||||||||
| Investment income: | ||||||||||||
| Interest income | $ | 16,294 | $ | 7,288 | $ | 39 | ||||||
| Total investment income | 16,294 | 7,288 | 39 | |||||||||
| Expenses: | ||||||||||||
| Interest and other debt financing expenses | 7,056 | 2,849 | — | |||||||||
| Organizational costs | — | 11 | 39 | |||||||||
| Professional fees | 718 | 312 | 45 | |||||||||
| Total expenses | 7,774 | 3,172 | 84 | |||||||||
| Net investment income (loss) | 8,520 | 4,116 | (45 | ) | ||||||||
| Net gain (loss): | ||||||||||||
| Net realized gain (loss) | 7 | 7 | — | |||||||||
| Net change in unrealized gain (loss) | (781 | ) | (85 | ) | 325 | |||||||
| Net gain (loss) | (774 | ) | (78 | ) | 325 | |||||||
| Net increase (decrease) in members’ capital | $ | 7,746 | $ | 4,038 | $ | 280 | ||||||
| (1) | SLF commenced operations on November 14, 2017. |
Note 4. Fair Value Measurements
Investments
The Company values all investments in accordance with ASC Topic 820. ASC Topic 820 requires enhanced disclosures about assets and liabilities that are measured and reported at fair value. As defined in ASC Topic 820, fair value is the price that would be received to sell an asset or paid to transfer a liability in an orderly transaction between market participants at the measurement date. Where available, fair value is based on observable market prices or parameters, or derived from such prices or parameters. Where observable prices or inputs are not available, valuation models are applied. These valuation models involve some level of management estimation and judgment, the degree of which is dependent on the price transparency for the assets or liabilities or market and the assets’ or liabilities’ complexity.
ASC Topic 820 establishes a hierarchal disclosure framework which prioritizes and ranks the level of market price observability of inputs used in measuring investments at fair value. Market price observability is affected by a number of factors, including the type of investment and the characteristics specific to the investment. Investments with readily available active quoted prices or for which fair value can be measured from actively quoted prices generally will have a higher degree of market price observability and a lesser degree of judgment used in measuring fair value.
| F-31 |
Based on the observability of the inputs used in the valuation techniques, the Company is required to provide disclosures on fair value measurements according to the fair value hierarchy. The fair value hierarchy ranks the observability of the inputs used to determine fair values. Investments carried at fair value are classified and disclosed in one of the following three categories:
| • | Level 1 — Valuations based on unadjusted quoted prices in active markets for identical assets or liabilities at the measurement date. | |
| • | Level 2 — Valuations based on inputs other than quoted prices in active markets, including quoted prices for similar assets or liabilities, which are either directly or indirectly observable. | |
| • | Level 3 — Valuations based on inputs that are unobservable and significant to the overall fair value measurement. This includes situations where there is little, if any, market activity for the assets or liabilities. The inputs into the determination of fair value are based upon the best information available and may require significant management judgment or estimation. |
In certain cases, the inputs used to measure fair value may fall into different levels of the fair value hierarchy. In such cases, an asset’s or liability’s categorization within the fair value hierarchy is based on the lowest level of input that is significant to the fair value measurement. The Company’s assessment of the significance of a particular input to the fair value measurement in its entirety requires judgment, and considers factors specific to the asset or liability. All investments, with the exception of investments measured at fair value using net asset value (“NAV”), as of December 31, 2019 and 2018 were categorized as Level 3 investments.
With respect to investments for which market quotations are not readily available, the Company’s Board undertakes a multi-step valuation process each quarter, as described below:
| • | the quarterly valuation process begins with each portfolio company or investment being initially evaluated and rated by the investment professionals of MC Advisors responsible for the credit monitoring of the portfolio investment; | |
| • | the Board engages one or more independent valuation firm(s) to conduct independent appraisals of a selection of investments for which market quotations are not readily available. The Company will consult with independent valuation firm(s) relative to each portfolio company at least once in every calendar year, but the independent appraisals are generally received quarterly; | |
| • | to the extent an independent valuation firm is not engaged to conduct an investment appraisal on an investment for which market quotations are not readily available, the investment will be valued by the MC Advisors investment professional responsible for the credit monitoring; | |
| • | preliminary valuation conclusions are then documented and discussed with the investment committee of the Company; | |
| • | the audit committee of the Board reviews the preliminary valuations of MC Advisors and of the independent valuation firm(s) and responds and supplements the valuation recommendations to reflect any comments provided by the audit committee; and | |
| • | the Board discusses these valuations and determines the fair value of each investment in the portfolio in good faith, based on the input of MC Advisors, the independent valuation firm(s) and the audit committee. |
The accompanying consolidated schedules of investments held by the Company consist primarily of private debt instruments (“Level 3 debt”). The Company generally uses the income approach to determine fair value for Level 3 debt where market quotations are not readily available, as long as it is appropriate. If there is deterioration in credit quality or a debt investment is in workout status, the Company may consider other factors in determining the fair value, including the value attributable to the debt investment from the enterprise value of the portfolio company or the proceeds that would be received in a liquidation analysis. This liquidation analysis may include probability weighting of alternative outcomes. The Company generally considers its Level 3 debt to be performing loans if the borrower is not in default, the borrower is remitting payments in a timely manner; the loan is in covenant compliance or is otherwise not deemed to be impaired. In determining the fair value of the performing Level 3 debt, the Company considers fluctuations in current interest rates, the trends in yields of debt instruments with similar credit ratings, financial condition of the borrower, economic conditions and other relevant factors, both qualitative and quantitative. In the event that a Level 3 debt instrument is not performing, as defined above, the Company will evaluate the value of the collateral utilizing the same framework described above for a performing loan to determine the value of the Level 3 debt instrument.
Under the income approach, discounted cash flow models are utilized to determine the present value of the future cash flow streams of its debt investments, based on future interest and principal payments as set forth in the associated loan agreements. In determining fair value under the income approach, the Company also considers the following factors: applicable market yields and leverage levels, credit quality, prepayment penalties, the nature and realizable value of any collateral, the portfolio company’s ability to make payments, and changes in the interest rate environment and the credit markets that generally may affect the price at which similar investments may be made.
Under the market approach, enterprise value methodology is typically utilized to determine the fair value of an investment. There is no one methodology to estimate enterprise value and, in fact, for any one portfolio company, enterprise value is generally best expressed as a range of values, from which the Company derives a single estimate of enterprise value. In estimating the enterprise value of a portfolio company, the Company analyzes various factors consistent with industry practice, including but not limited to original transaction multiples, the portfolio company’s historical and projected financial results, applicable market trading and transaction comparables, applicable market yields and leverage levels, the nature and realizable value of any collateral, the markets in which the portfolio company does business, and comparisons of financial ratios of peer companies that are public. Typically, the enterprise values of private companies are based on multiples of earnings before interest, income taxes, depreciation and amortization (“EBITDA”), cash flows, net income, revenues, or in limited cases, book value.
In addition, for certain debt investments, the Company may base its valuation on indicative bid and ask prices provided by an independent third-party pricing service. Bid prices reflect the highest price that the Company and others may be willing to pay. Ask prices represent the lowest price that the Company and others may be willing to accept. The Company generally uses the midpoint of the bid/ask range as its best estimate of fair value of such investment.
| F-32 |
Secured Borrowings
The Company has elected the fair value option under ASC Topic 825 — Financial Instruments relating to accounting for debt obligations at their fair value for its secured borrowings which arose due to partial loan sales which did not meet the criteria for sale treatment under ASC Topic 860. The Company reports changes in the fair value of its secured borrowings within net change in unrealized gain (loss) on secured borrowings on the consolidated statements of operations. The net gain or loss reflects the difference between the fair value and the principal amount due on maturity.
Due to the absence of a liquid trading market for these secured borrowings, they are valued by calculating the net present value of the future expected cash flow streams using an appropriate risk-adjusted discount rate model. The discount rate considers projected performance of the related loan investment, applicable market yields and leverage levels, credit quality, prepayment penalties and comparable company analysis. The Company consults with an independent valuation firm relative to the fair value of its secured borrowings at least once in every calendar year.
Foreign Currency Forward Contracts
The valuation for the Company’s foreign currency forward contracts is based on the difference between the exchange rate associated with the forward contract and the exchange rate at the current period end. Foreign currency forward contracts are categorized as Level 2 in the fair value hierarchy.
Fair Value Disclosures
The following table presents fair value measurements of investments and foreign currency forward contracts, by major class, as of December 31, 2019, according to the fair value hierarchy:
| Fair Value Measurements | ||||||||||||||||
| Level 1 | Level 2 | Level 3 | Total | |||||||||||||
| Investments: | ||||||||||||||||
| Senior secured loans | $ | — | $ | — | $ | 475,157 | $ | 475,157 | ||||||||
| Unitranche secured loans | — | — | 76,247 | 76,247 | ||||||||||||
| Junior secured loans | — | — | 13,676 | 13,676 | ||||||||||||
| Equity securities | — | — | 8,739 | 8,739 | ||||||||||||
| Investments measured at NAV (1) (2) | — | — | — | 42,412 | ||||||||||||
| Total investments | $ | — | $ | — | $ | 573,819 | $ | 616,231 | ||||||||
| Foreign currency forward contracts asset (liability) | $ | — | $ | (59 | ) | $ | — | $ | (59 | ) | ||||||
| (1) | Certain investments that are measured at fair value using the NAV have not been categorized in the fair value hierarchy. The fair value amounts presented in this table are intended to permit reconciliation of the fair value hierarchy to the amounts presented on the consolidated statements of assets and liabilities. |
| (2) | Represents the Company’s investment in LLC equity interests in SLF. The fair value of this investment has been determined using the NAV of the Company’s ownership interest in members’ capital. |
The following table presents fair value measurements of investments and foreign currency forward contracts, by major class, as of December 31, 2018, according to the fair value hierarchy:
| Fair Value Measurements | ||||||||||||||||
| Level 1 | Level 2 | Level 3 | Total | |||||||||||||
| Investments: | ||||||||||||||||
| Senior secured loans | $ | — | $ | — | $ | 439,068 | $ | 439,068 | ||||||||
| Unitranche secured loans | — | — | 58,852 | 58,852 | ||||||||||||
| Junior secured loans | — | — | 21,154 | 21,154 | ||||||||||||
| Equity securities | — | — | 6,913 | 6,913 | ||||||||||||
| Investments measured at NAV (1) (2) | — | — | — | 27,634 | ||||||||||||
| Total investments | $ | — | $ | — | $ | 525,987 | $ | 553,621 | ||||||||
| Foreign currency forward contracts asset (liability) | $ | — | $ | 16 | $ | — | $ | 16 | ||||||||
| (1) | Certain investments that are measured at fair value using the NAV have not been categorized in the fair value hierarchy. The fair value amounts presented in this table are intended to permit reconciliation of the fair value hierarchy to the amounts presented on the consolidated statements of assets and liabilities. |
| (2) | Represents the Company’s investment in LLC equity interests in SLF. The fair value of this investment has been determined using the NAV of the Company’s ownership interest in members’ capital. |
| F-33 |
Senior secured, unitranche secured and junior secured loans are collateralized by tangible and intangible assets of the borrowers. These investments include loans to entities that have some level of challenge in obtaining financing from other, more conventional institutions, such as a bank. Interest rates on these loans are either fixed or floating, and are based on current market conditions and credit ratings of the borrower. Excluding loans on non-accrual, the contractual interest rates on the loans ranged between 7.30% to 16.30% at December 31, 2019 and 7.87% to 17.01% at December 31, 2018. The maturity dates on the loans outstanding at December 31, 2019 range between March 2020 and December 2025.
The following tables provide a reconciliation of the beginning and ending balances for investments at fair value that use Level 3 inputs for the years ended December 31, 2019 and 2018:
| Investments | ||||||||||||||||||||
| Senior secured loans | Unitranche secured loans | Junior secured loans | Equity securities | Total investments | ||||||||||||||||
| Balance as of December 31, 2018 | $ | 439,068 | $ | 58,852 | $ | 21,154 | $ | 6,913 | $ | 525,987 | ||||||||||
| Net realized gain (loss) on investments | 46 | 188 | — | (1,167 | ) | (933 | ) | |||||||||||||
| Net change in unrealized gain (loss) on investments | (6,272 | ) | (1,015 | ) | (934 | ) | 391 | (7,830 | ) | |||||||||||
| Purchases of investments and other adjustments to cost (1) | 218,836 | 2,613 | 13 | 1,213 | 222,675 | |||||||||||||||
| Proceeds from principal payments and sales of investments (2) | (153,399 | ) | (7,513 | ) | (5,099 | ) | (69 | ) | (166,080 | ) | ||||||||||
| Reclassifications (3) | (23,122 | ) | 23,122 | (1,458 | ) | 1,458 | — | |||||||||||||
| Balance as December 31, 2019 | $ | 475,157 | $ | 76,247 | $ | 13,676 | $ | 8,739 | $ | 573,819 | ||||||||||
| Investments | ||||||||||||||||||||
| Senior secured loans | Unitranche secured loans | Junior secured loans | Equity securities | Total investments | ||||||||||||||||
| Balance as of December 31, 2017 | $ | 387,874 | $ | 40,295 | $ | 38,549 | $ | 17,780 | $ | 484,498 | ||||||||||
| Net realized gain (loss) on investments | (23,720 | ) | — | (2,011 | ) | (4,283 | ) | (30,014 | ) | |||||||||||
| Net change in unrealized gain (loss) on investments | 7,583 | (811 | ) | 2,586 | (6,713 | ) | 2,645 | |||||||||||||
| Purchases of investments and other adjustments to cost (1) | 191,397 | 23,438 | 1,827 | 1,860 | 218,522 | |||||||||||||||
| Proceeds from principal payments and sales of investments (2) | (124,066 | ) | (4,070 | ) | (19,797 | ) | (1,731 | ) | (149,664 | ) | ||||||||||
| Reclassifications (3) | — | — | — | — | — | |||||||||||||||
| Balance as December 31, 2018 | $ | 439,068 | $ | 58,852 | $ | 21,154 | $ | 6,913 | $ | 525,987 | ||||||||||
| (1) | Includes purchases of new investments, effects of refinancing and restructurings, premium and discount accretion and amortization and PIK interest. |
| (2) | Represents net proceeds from investments sold and principal paydowns received. |
| (3) | Represents the non-cash reclassification of investment type due to the restructuring of the investments in portfolio companies. |
The total net change in unrealized gain (loss) included on the consolidated statements of operations for the year ended December 31, 2019, attributable to Level 3 investments still held at December 31, 2019 was ($6,977). The total net change in unrealized gain (loss) included on the consolidated statements of operations within net change in unrealized gain (loss) on investments for the year ended December 31, 2018, attributable to Level 3 investments still held at December 31, 2018 was ($11,397). Reclassifications impacting Level 3 of the fair value hierarchy are reported as transfers in or out of Level 3 as of the beginning of the period which the reclassifications occur. There were no transfers among Levels 1, 2 and 3 during the years ended December 31, 2019 and 2018.
Significant Unobservable Inputs
ASC Topic 820 requires disclosure of quantitative information about the significant unobservable inputs used in the valuation of assets and liabilities classified as Level 3 within the fair value hierarchy. Disclosure of this information is not required in circumstances where a valuation (unadjusted) is obtained from a third-party pricing service and the information regarding the unobservable inputs is not reasonably available to the Company and as such, the disclosures provided below exclude those investments valued in that manner. The tables below are not intended to be all-inclusive, but rather to provide information on significant unobservable inputs and valuation techniques used by the Company.
| F-34 |
The valuation techniques and significant unobservable inputs used in recurring Level 3 fair value measurements of assets and liabilities as of December 31, 2019 were as follows:
| Weighted | Range | |||||||||||||||||||
| Fair Value | Valuation Technique | Unobservable Input |
Average Mean |
Minimum | Maximum | |||||||||||||||
| Assets: | ||||||||||||||||||||
Senior secured loans |
$ | 287,776 | Discounted cash flow | EBITDA multiples | 7.0 | x | 4.0 | x | 14.0 | x | ||||||||||
| Market yields | 10.0 | % | 6.5 | % | 17.5 | % | ||||||||||||||
| Senior secured loans | 94,468 | Discounted cash flow | Revenue multiples | 5.7 | x | 0.7 | x | 11.8 | x | |||||||||||
| Market yields | 8.2 | % | 6.5 | % | 15.8 | % | ||||||||||||||
| Senior secured loans | 31,720 | Liquidation | Probability weighting of alternative outcomes | 147.4 | % | 9.8 | % | 175.5 | % | |||||||||||
| Senior secured loans | 17,616 | Enterprise value | Tangible book value multiples | 1.6 | x | 1.6 | x | 1.6 | x | |||||||||||
| Senior secured loans | 20,742 | Enterprise value | EBITDA multiples | 6.6 | x | 4.8 | x | 8.5 | x | |||||||||||
| Senior secured loans | 9,164 | Enterprise value | Revenue multiples | 0.4 | x | 0.2 | x | 0.7 | x | |||||||||||
| Unitranche secured loans | 49,943 | Discounted cash flow | EBITDA multiples | 8.6 | x | 7.8 | x | 10.5 | x | |||||||||||
| Market yields | 9.0 | % | 7.4 | % | 10.8 | % | ||||||||||||||
| Unitranche secured loans | 13,961 | Discounted cash flow | Revenue multiples | 2.3 | x | 0.6 | x | 3.6 | x | |||||||||||
| Market yields | 10.9 | % | 10.7 | % | 11.5 | % | ||||||||||||||
| Unitranche secured loans | 12,343 | Enterprise value | Revenue multiples | 0.6 | x | 0.6 | x | 0.6 | x | |||||||||||
| Junior secured loans | 774 | Liquidation | Probability weighting of alternative outcomes | 52.4 | % | 52.4 | % | 52.4 | % | |||||||||||
| Equity securities | 5,435 | Liquidation | Probability weighting of alternative outcomes | 52.7 | % | 21.8 | % | 54.6 | % | |||||||||||
| Equity securities | 2,375 | Enterprise value | EBITDA multiples | 6.7 | x | 4.0 | x | 10.5 | x | |||||||||||
| Equity securities | 877 | Enterprise value | Revenue multiples | 4.4 | x | 1.5 | x | 11.8 | x | |||||||||||
| Total Level 3 Assets | $ | 547,194 | (1) | |||||||||||||||||
| (1) | Excludes loans of $26,625 at fair value where valuation (unadjusted) is obtained from a third-party pricing service for which such disclosure is not required. |
The valuation techniques and significant unobservable inputs used in recurring Level 3 fair value measurements of assets and liabilities as of December 31, 2018 were as follows:
| Weighted | Range | |||||||||||||||||||
| Fair Value | Valuation Technique | Unobservable Input |
Average Mean |
Minimum | Maximum | |||||||||||||||
| Assets: | ||||||||||||||||||||
| Senior secured loans | $ | 337,840 | Discounted cash flow | EBITDA multiples | 6.8 | x | 3.8 | x | 13.0 | x | ||||||||||
| Market yields | 11.1 | % | 7.4 | % | 19.0 | % | ||||||||||||||
| Senior secured loans | 38,183 | Discounted cash flow | Revenue multiples | 3.5 | x | 3.1 | x | 4.5 | x | |||||||||||
| Market yields | 8.1 | % | 7.7 | % | 8.5 | % | ||||||||||||||
| Senior secured loans | 17,770 | Liquidation | Probability weighting of alternative outcomes | 90.0 | % | 79.4 | % | 100.0 | % | |||||||||||
| Senior secured loans | 13,153 | Enterprise value | Tangible book value multiples | 1.5 | x | 1.5 | x | 1.5 | x | |||||||||||
| Senior secured loans | 10,474 | Enterprise value | EBITDA multiples | 7.5 | x | 6.5 | x | 8.3 | x | |||||||||||
| Senior secured loans | 8,639 | Enterprise value | Revenue multiples | 0.4 | x | 0.4 | x | 0.4 | x | |||||||||||
| Unitranche secured loans | 37,766 | Discounted cash flow | EBITDA multiples | 7.3 | x | 4.5 | x | 8.5 | X | |||||||||||
| Market yields | 12.6 | % | 10.0 | % | 20.2 | % | ||||||||||||||
| Unitranche secured loans | 13,134 | Enterprise value | EBITDA multiples | 4.6 | x | 4.5 | x | 8.5 | x | |||||||||||
| Unitranche secured loans | 7,952 | Enterprise value | Revenue multiples | 4.5 | x | 4.5 | x | 4.5 | x | |||||||||||
| Junior secured loans | 2,292 | Liquidation | Probability weighting of alternative outcomes | 78.5 | % | 78.5 | % | 78.5 | % | |||||||||||
| Junior secured loans | 1,260 | Enterprise value | EBITDA multiples | 4.5 | x | 4.5 | x | 4.5 | x | |||||||||||
| Equity securities | 4,583 | Liquidation | Probability weighting of alternative outcomes | 59.0 | % | 59.0 | % | 59.0 | % | |||||||||||
| Equity securities | 1,465 | Enterprise value | EBITDA multiples | 7.2 | x | 4.5 | x | 10.5 | x | |||||||||||
| Equity securities | 650 | Enterprise value | Revenue multiples | 3.7 | x | 2.0 | x | 4.5 | x | |||||||||||
| Total Level 3 Assets | $ | 495,161 | (1) | |||||||||||||||||
| (1) | Excludes loans of $30,826 at fair value where valuation (unadjusted) is obtained from a third-party pricing service for which such disclosure is not required. |
The significant unobservable inputs used in the income approach of fair value measurement of the Company’s investments is the discount rate used to discount the estimated future cash flows expected to be received from the underlying investment, which include both future principal and interest payments. Increases (decreases) in the discount rate would result in a decrease (increase) in the fair value estimate of the investment. Included in the consideration and selection of discount rates are the following factors: risk of default, rating of the investment and comparable investments, and call provisions.
| F-35 |
The significant unobservable inputs used in the market approach of fair value measurement of the Company’s investments are the market multiples of EBITDA or revenue of the comparable guideline public companies. The Company selects a population of public companies for each investment with similar operations and attributes of the portfolio company. Using these guideline public companies’ data, a range of multiples of enterprise value to EBITDA or revenue is calculated. The Company selects percentages from the range of multiples for purposes of determining the portfolio company’s estimated enterprise value based on said multiple and generally the latest twelve months EBITDA or revenue of the portfolio company (or other meaningful measure). Increases (decreases) in the multiple will result in an increase (decrease) in enterprise value, resulting in an increase (decrease) in the fair value estimate of the investment.
Other Financial Assets and Liabilities
ASC Topic 820 requires disclosure of the fair value of financial instruments for which it is practical to estimate such value. The Company believes that the carrying amounts of its other financial instruments such as cash, receivables and payables approximate the fair value of such items due to the short maturity of such instruments. Fair value of the Company’s revolving credit facility is estimated by discounting remaining payments using applicable market rates or market quotes for similar instruments at the measurement date, if applicable. As of both December 31, 2019 and 2018, the Company believes that the carrying value of its revolving credit facility approximates fair value. As of December 31, 2019, the 2023 Notes were trading on The Nasdaq Global Select Market for $25.70 per unit at par value. The par value at underwriting for the 2023 Notes was $25.00 per unit. Based on this Level 1 input, the fair value of the $109,000 in principal outstanding 2023 Notes was $112,052. As of December 31, 2018, the 2023 Notes were trading on The Nasdaq Global Select Market for $23.50 per unit at par value. Based on this Level 1 input, the fair value of the $69,000 in principal outstanding 2023 Notes was $64,860. SBA debentures are carried at cost and with their longer maturity dates, fair value is estimated by discounting remaining payments using current market rates for similar instruments and considering such factors as the legal maturity date and the ability of market participants to prepay the debentures. As of both December 31, 2019 and 2018, the Company believes that the carrying value of the SBA debentures approximates fair value.
Note 5. Transactions with Affiliated Companies
An affiliated company is a company in which the Company has an ownership interest of 5% or more of its voting securities. A controlled affiliate company is a company in which the Company has an ownership interest of more than 25% of its voting securities. Please see the Company’s consolidated schedule of investments for the type of investment, principal amount, interest rate including the spread, and the maturity date. Transactions related to the Company’s investments with affiliates for the years ended December 31, 2019 and 2018 were as follows:
| F-36 |
| Portfolio Company | Fair value at December 31, 2018 |
Transfers in (out) |
Purchases (cost) |
Sales and paydowns (cost) |
PIK interest (cost) |
Discount accretion |
Net realized |
Net unrealized |
Fair value at 2019 |
|||||||||||||||||||||||||||
| Non-controlled affiliate company investments: | ||||||||||||||||||||||||||||||||||||
| American Community Homes, Inc. | $ | 6,596 | $ | — | $ | — | $ | — | $ | 1,033 | $ | 18 | $ | — | $ | (883 | ) | $ | 6,764 | |||||||||||||||||
| American Community Homes, Inc. | 3,997 | — | — | — | 874 | 9 | — | (591 | ) | 4,289 | ||||||||||||||||||||||||||
| American Community Homes, Inc. | 499 | — | — | — | 78 | 2 | — | (67 | ) | 512 | ||||||||||||||||||||||||||
| American Community Homes, Inc. | 400 | — | — | — | 63 | 2 | — | (55 | ) | 410 | ||||||||||||||||||||||||||
| American Community Homes, Inc. | 215 | — | — | — | 47 | 1 | — | (33 | ) | 230 | ||||||||||||||||||||||||||
| American Community Homes, Inc. | 1,446 | — | — | — | 212 | — | — | (186 | ) | 1,472 | ||||||||||||||||||||||||||
| American Community Homes, Inc. | — | — | 3,333 | — | 270 | — | — | (843 | ) | 2,760 | ||||||||||||||||||||||||||
| American Community Homes, Inc. | — | — | 1,111 | (1,111 | ) | 14 | — | — | (3 | ) | 11 | |||||||||||||||||||||||||
| American Community Homes, Inc. | — | — | 1,186 | — | — | — | — | (18 | ) | 1,168 | ||||||||||||||||||||||||||
| American Community Homes, Inc. (warrant to purchase up to 22.3% of the equity) | — | — | — | — | — | — | — | — | — | |||||||||||||||||||||||||||
| 13,153 | — | 5,630 | (1,111 | ) | 2,591 | 32 | — | (2,679 | ) | 17,616 | ||||||||||||||||||||||||||
| Curion Holdings, LLC | 3,592 | — | — | — | 273 | 4 | — | (590 | ) | 3,279 | ||||||||||||||||||||||||||
| Curion Holdings, LLC (Revolver) | 244 | — | 184 | — | 17 | — | — | (4 | ) | 441 | ||||||||||||||||||||||||||
| Curion Holdings, LLC (Junior secured loan) | — | — | — | — | — | — | — | — | — | |||||||||||||||||||||||||||
| Curion Holdings, LLC (Junior secured loan) | — | — | — | — | — | — | — | — | — | |||||||||||||||||||||||||||
| Curion Holdings, LLC (58,779 shares of common stock) | — | — | — | — | — | — | — | — | — | |||||||||||||||||||||||||||
| 3,836 | — | 184 | — | 290 | 4 | — | (594 | ) | 3,720 | |||||||||||||||||||||||||||
| Incipio, LLC | 12,830 | — | — | — | 770 | 30 | — | (1,287 | ) | 12,343 | ||||||||||||||||||||||||||
| Incipio, LLC | 3,573 | — | — | — | 202 | — | — | (25 | ) | 3,750 | ||||||||||||||||||||||||||
| Incipio, LLC | 1,518 | — | — | — | 86 | — | — | 2 | 1,606 | |||||||||||||||||||||||||||
| Incipio, LLC | — | — | 656 | — | 36 | — | — | (6 | ) | 686 | ||||||||||||||||||||||||||
| Incipio, LLC (Junior secured loan) | 1,260 | — | — | — | — | — | — | (1,260 | ) | — | ||||||||||||||||||||||||||
| Incipio, LLC (Junior secured loan) | — | — | — | — | — | — | — | — | — | |||||||||||||||||||||||||||
| Incipio, LLC (1,774 shares of Series C common units) | — | — | — | — | — | — | — | — | — | |||||||||||||||||||||||||||
| 19,181 | — | 656 | — | 1,094 | 30 | — | (2,576 | ) | 18,385 | |||||||||||||||||||||||||||
| Luxury Optical Holdings Co. | 4,334 | — | — | — | 255 | 10 | — | (1,142 | ) | 3,457 | ||||||||||||||||||||||||||
| Luxury Optical Holdings Co. (Delayed Draw) | 622 | — | — | — | — | — | — | (2 | ) | 620 | ||||||||||||||||||||||||||
| Luxury Optical Holdings Co. (Revolver) | 200 | — | — | — | 11 | — | — | (52 | ) | 159 | ||||||||||||||||||||||||||
| Luxury Optical Holdings Co. (86 shares of common stock) | — | — | — | — | — | — | — | — | — | |||||||||||||||||||||||||||
| 5,156 | — | — | — | 266 | 10 | — | (1,196 | ) | 4,236 | |||||||||||||||||||||||||||
| Millennial Brands LLC (10 preferred units) | — | — | — | — | — | — | (967 | ) | 967 | — | ||||||||||||||||||||||||||
| Millennial Brands LLC (75,502 common units) | — | — | — | — | — | — | — | — | — | |||||||||||||||||||||||||||
| — | — | — | — | — | — | (967 | ) | 967 | — | |||||||||||||||||||||||||||
| New England College of Business and Finance, LLC (Revolver) (1) | — | — | 1,148 | — | — | — | — | — | 1,148 | |||||||||||||||||||||||||||
| New England College of Business and Finance, LLC (20.8% of units) (1) | — | 1,458 | — | — | — | — | — | (1,140 | ) | 318 | ||||||||||||||||||||||||||
| — | 1,458 | 1,148 | — | — | — | — | (1,140 | ) | 1,466 | |||||||||||||||||||||||||||
| SHI Holdings, Inc. | 2,598 | — | — | (14 | ) | 315 | 4 | — | (444 | ) | 2,459 | |||||||||||||||||||||||||
| SHI Holdings, Inc. (Revolver) | 3,342 | — | 464 | — | 438 | (1 | ) | — | (642 | ) | 3,601 | |||||||||||||||||||||||||
| SHI Holdings, Inc. (24 shares of common stock) | 307 | — | — | — | — | — | — | (307 | ) | — | ||||||||||||||||||||||||||
| 6,247 | — | 464 | (14 | ) | 753 | 3 | — | (1,393 | ) | 6,060 | ||||||||||||||||||||||||||
| Summit Container Corporation | 3,034 | — | — | — | — | — | — | (63 | ) | 2,971 | ||||||||||||||||||||||||||
| Summit Container Corporation (Revolver) | 6,660 | — | 32,602 | (33,841 | ) | — | — | — | (15 | ) | 5,406 | |||||||||||||||||||||||||
| Summit Container Corporation (warrant to purchase up to 19.5% of the equity) | — | — | — | — | — | — | — | — | — | |||||||||||||||||||||||||||
| 9,694 | — | 32,602 | (33,841 | ) | — | — | — | (78 | ) | 8,377 | ||||||||||||||||||||||||||
| Total non-controlled affiliate company investments | $ | 57,267 | $ | 1,458 | $ | 40,684 | $ | (34,966 | ) | $ | 4,994 | $ | 79 | $ | (967 | ) | $ | (8,689 | ) | $ | 59,860 | |||||||||||||||
| Controlled affiliate company investments: | ||||||||||||||||||||||||||||||||||||
| MRCC Senior Loan Fund I, LLC | $ | 27,634 | $ | — | $ | 14,950 | $ | — | $ | — | $ | — | $ | — | $ | (172 | ) | $ | 42,412 | |||||||||||||||||
| 27,634 | — | 14,950 | — | — | — | — | (172 | ) | 42,412 | |||||||||||||||||||||||||||
| Total controlled affiliate company investments | $ | 27,634 | $ | — | $ | 14,950 | $ | — | $ | — | $ | — | $ | — | $ | (172 | ) | $ | 42,412 | |||||||||||||||||
| F-37 |
| Portfolio Company | Fair value at December 31, 2017 |
Transfers in (out) |
Purchases (cost) |
Sales and paydowns (cost) |
PIK interest (cost) |
Discount accretion |
Net realized |
Net unrealized |
Fair value at 2018 |
|||||||||||||||||||||||||||
| Non-controlled affiliate company investments: | ||||||||||||||||||||||||||||||||||||
| American Community Homes, Inc. (2) | $ | 7,441 | $ | — | $ | — | $ | (331 | ) | $ | 463 | $ | 46 | $ | — | $ | (1,023 | ) | $ | 6,596 | ||||||||||||||||
| American Community Homes, Inc. (2) | 4,329 | — | — | (165 | ) | 478 | 22 | — | (667 | ) | 3,997 | |||||||||||||||||||||||||
| American Community Homes, Inc. (2) | 542 | — | — | — | 48 | 3 | — | (94 | ) | 499 | ||||||||||||||||||||||||||
| American Community Homes, Inc. (2) | 431 | — | — | — | 28 | 6 | — | (65 | ) | 400 | ||||||||||||||||||||||||||
| American Community Homes, Inc. (2) | 224 | — | — | — | 25 | 4 | — | (38 | ) | 215 | ||||||||||||||||||||||||||
| American Community Homes, Inc. (Delayed Draw) (2) | — | — | — | — | — | — | — | — | — | |||||||||||||||||||||||||||
| American Community Homes, Inc. (Delayed Draw) (2) | — | — | — | — | — | — | — | — | — | |||||||||||||||||||||||||||
| American Community Homes, Inc. (2) | — | — | 1,667 | — | 43 | — | — | (264 | ) | 1,446 | ||||||||||||||||||||||||||
| American Community Homes, Inc. (warrant to purchase up to 22.3% of the equity) (2) | 353 | — | — | — | — | — | — | (353 | ) | — | ||||||||||||||||||||||||||
| 13,320 | — | 1,667 | (496 | ) | 1,085 | 81 | — | (2,504 | ) | 13,153 | ||||||||||||||||||||||||||
| Curion Holdings, LLC (3) | — | 3,775 | — | (25 | ) | 143 | 5 | — | (306 | ) | 3,592 | |||||||||||||||||||||||||
| Curion Holdings, LLC (Revolver) (3) | — | 76 | 173 | — | — | — | — | (5 | ) | 244 | ||||||||||||||||||||||||||
| Curion Holdings, LLC (3) | — | — | 1 | — | — | — | — | (1 | ) | — | ||||||||||||||||||||||||||
| Curion Holdings, LLC (3) | — | — | — | — | — | — | — | — | — | |||||||||||||||||||||||||||
| Curion Holdings, LLC (58,779 shares of common stock) (3) | — | — | — | — | — | — | — | — | — | |||||||||||||||||||||||||||
| — | 3,851 | 174 | (25 | ) | 143 | 5 | — | (312 | ) | 3,836 | ||||||||||||||||||||||||||
| Incipio, LLC (4) | — | 13,307 | — | — | — | 58 | — | (535 | ) | 12,830 | ||||||||||||||||||||||||||
| Incipio, LLC (4) | — | 3,613 | — | — | — | — | — | (40 | ) | 3,573 | ||||||||||||||||||||||||||
| Incipio, LLC (4) | — | — | 1,535 | — | — | — | — | (17 | ) | 1,518 | ||||||||||||||||||||||||||
| Incipio, LLC (4) | — | 1,143 | — | — | — | — | — | 117 | 1,260 | |||||||||||||||||||||||||||
| Incipio, LLC (4) | — | — | — | — | — | — | — | — | — | |||||||||||||||||||||||||||
| Incipio, LLC (1,774 shares of Series C common stock) (4) | — | — | — | — | — | — | — | — | — | |||||||||||||||||||||||||||
| — | 18,063 | 1,535 | — | — | 58 | — | (475 | ) | 19,181 | |||||||||||||||||||||||||||
| Luxury Optical Holdings Co. | 3,697 | — | — | — | 448 | 18 | — | 171 | 4,334 | |||||||||||||||||||||||||||
| Luxury Optical Holdings Co. (Delayed Draw) | 741 | — | — | (118 | ) | — | — | — | (1 | ) | 622 | |||||||||||||||||||||||||
| Luxury Optical Holdings Co. (Revolver) | 170 | — | — | — | 21 | — | — | 9 | 200 | |||||||||||||||||||||||||||
| Luxury Optical Holdings Co. (86 shares of common stock) | — | — | — | — | — | — | — | — | — | |||||||||||||||||||||||||||
| 4,608 | — | — | (118 | ) | 469 | 18 | — | 179 | 5,156 | |||||||||||||||||||||||||||
| Millennial Brands LLC | — | — | — | — | — | — | (1,157 | ) | 1,157 | — | ||||||||||||||||||||||||||
| Millennial Brands LLC | — | — | — | — | — | — | (416 | ) | 416 | — | ||||||||||||||||||||||||||
| Millennial Brands LLC | — | — | — | — | — | — | (235 | ) | 235 | — | ||||||||||||||||||||||||||
| Millennial Brands LLC | 550 | — | — | (167 | ) | — | — | (367 | ) | (16 | ) | — | ||||||||||||||||||||||||
| Millennial Brands LLC | — | — | — | — | — | — | (2,011 | ) | 2,011 | — | ||||||||||||||||||||||||||
| Millennial Brands LLC (10 preferred units) | — | — | — | — | — | — | — | — | — | |||||||||||||||||||||||||||
| Millennial Brands LLC (75,502 common units) | — | — | — | — | — | — | — | — | — | |||||||||||||||||||||||||||
| 550 | — | — | (167 | ) | — | — | (4,186 | ) | 3,803 | — | ||||||||||||||||||||||||||
| Rockdale Blackhawk, LLC (5) | 10,594 | (12,753 | ) | — | — | — | 110 | — | 2,049 | — | ||||||||||||||||||||||||||
| Rockdale Blackhawk, LLC (Capex) (5) | 533 | (641 | ) | — | — | — | — | — | 108 | — | ||||||||||||||||||||||||||
| Rockdale Blackhawk, LLC (Revolver) (5) | 1,797 | (2,159 | ) | — | — | — | — | — | 362 | — | ||||||||||||||||||||||||||
| Rockdale Blackhawk, LLC (Revolver) (5) | 3,145 | (3,778 | ) | — | — | — | — | — | 633 | — | ||||||||||||||||||||||||||
| Rockdale Blackhawk, LLC (Revolver) (5) | — | (2,672 | ) | 2,288 | — | — | — | — | 384 | — | ||||||||||||||||||||||||||
| Rockdale Blackhawk, LLC – LLC Units (5) | 5,673 | — | — | — | — | — | — | (5,673 | ) | — | ||||||||||||||||||||||||||
| 21,742 | (22,003 | ) | 2,288 | — | — | 110 | — | (2,137 | ) | — | ||||||||||||||||||||||||||
| SHI Holdings, Inc. | 2,625 | — | — | (27 | ) | — | 11 | — | (11 | ) | 2,598 | |||||||||||||||||||||||||
| SHI Holdings, Inc. (Revolver) | 2,226 | — | 1,117 | — | — | 6 | — | (7 | ) | 3,342 | ||||||||||||||||||||||||||
| SHI Holdings, Inc. (24 shares of common stock) | 786 | — | — | — | — | — | — | (479 | ) | 307 | ||||||||||||||||||||||||||
| 5,637 | — | 1,117 | (27 | ) | — | 17 | — | (497 | ) | 6,247 | ||||||||||||||||||||||||||
| Summit Container Corporation | 3,421 | — | — | (367 | ) | 34 | 26 | — | (80 | ) | 3,034 | |||||||||||||||||||||||||
| Summit Container Corporation | 1,507 | — | — | (1,523 | ) | 15 | — | — | 1 | — | ||||||||||||||||||||||||||
| Summit Container Corporation (Revolver) | — | — | 25,614 | (18,900 | ) | — | — | — | (54 | ) | 6,660 | |||||||||||||||||||||||||
| Summit Container Corporation (warrant to purchase up to 19.5% of the equity) | — | — | — | — | — | — | — | — | — | |||||||||||||||||||||||||||
| 4,928 | — | 25,614 | (20,790 | ) | 49 | 26 | — | (133 | ) | 9,694 | ||||||||||||||||||||||||||
| TPP Operating, Inc. (6) | — | — | — | — | — | — | (9,330 | ) | 9,330 | — | ||||||||||||||||||||||||||
| TPP Operating, Inc. (6) | 3,373 | 724 | 63 | (42 | ) | — | — | (7,629 | ) | 3,511 | — | |||||||||||||||||||||||||
| TPP Operating, Inc. (6) | 4,593 | (724 | ) | 467 | (47 | ) | — | — | (4,289 | ) | — | — | ||||||||||||||||||||||||
| TPP Operating, Inc. (24 shares of common stock) (6) | — | — | — | — | — | — | (1,953 | ) | 1,953 | — | ||||||||||||||||||||||||||
| TPP Operating, Inc. (16 shares of common stock) (6) | — | — | — | — | — | — | (1,302 | ) | 1,302 | — | ||||||||||||||||||||||||||
| 7,966 | — | 530 | (89 | ) | — | — | (24,503 | ) | 16,096 | — | ||||||||||||||||||||||||||
| Total non-controlled affiliate company investments | $ | 58,751 | $ | (89 | ) | $ | 32,925 | $ | (21,712 | ) | $ | 1,746 | $ | 315 | $ | (28,689 | ) | $ | 14,020 | $ | 57,267 | |||||||||||||||
| Controlled affiliate company investments: | ||||||||||||||||||||||||||||||||||||
| MRCC Senior Loan Fund I, LLC | $ | 9,640 | $ | — | $ | 27,200 | $ | (9,500 | ) | $ | — | $ | — | $ | — | $ | 294 | $ | 27,634 | |||||||||||||||||
| 9,640 | — | 27,200 | (9,500 | ) | — | — | — | 294 | 27,634 | |||||||||||||||||||||||||||
| Total controlled affiliate company investments | $ | 9,640 | $ | — | $ | 27,200 | $ | (9,500 | ) | $ | — | $ | — | $ | — | $ | 294 | $ | 27,634 | |||||||||||||||||
| (1) | During the three months ended June 30, 2019, the Company participated in a credit bid to acquire the assets of New England College of Business (“NECB”), which was a subsidiary of Education Corporation of America (“ECA”). As a result, the Company obtained a 20.8% equity stake in NECB in exchange for a $1,458 reduction of secured loan position in ECA. The Company also provided a follow-on revolver commitment to NECB. |
| (2) | The Company provided a follow-on investment to American Community Homes, Inc. (“ACH”) during the twelve months ended December 31, 2018. In conjunction with the follow-on investment, the Company also received an additional warrant for 13.3% of the equity in ACH, increasing total equity ownership to 22.3%. |
| (3) | The Company provided a follow-on investment to Curion Holdings, LLC (“Curion”) as a part of a restructuring during the twelve months ended December 31, 2018. As part of the restructuring, the Company also received 12.1% of the equity of Curion. For the purpose of this schedule, transfers in represents the fair value at June 30, 2018. |
| (4) | The Company provided a follow-on investment to Incipio, LLC (“Incipio”) as a part of a restructuring during the twelve months ended December 31, 2018. As a part of the restructuring, the Company also received 17.7% of the equity of Incipio. For the purpose of this schedule, transfers in represents the fair value at June 30, 2018. |
| (5) | On July 24, 2018, Rockdale Blackhawk, LLC (“Rockdale”) filed for bankruptcy as part of a restructuring process. During the twelve months ended December 31, 2018, the Company funded additional investments under the debtor-in-possession (“DIP”) financing facility established in conjunction with the bankruptcy and received repayments on a portion of its pre-petition debt. On July 20, 2018, the Company put back its 22.7% equity investment in Rockdale, resulting in a realized loss of $1,093, and therefore it is no longer an affiliated investment. The Company placed its investment in the pre-petition debt of Rockdale on non-accrual status in conjunction with the bankruptcy filing. For the purpose of this schedule, transfers out represents the fair value at June 30, 2018. |
| (6) | In December 2017, the Company transferred 16.0% of the equity interest in TPP Operating, Inc. (“TPP”) shares to a wholly-owned entity, MCC Holdco Equity Manager I, LLC (“MCC Holdco”), which has an independent manager who has full control over the operations of MCC Holdco, including the right to vote the shares of TPP Holdco LLC, the holding company which owns the Company’s equity interest in TPP. As a result, the Company then only controlled 24.0% of the voting interests in TPP, which was no longer considered a controlled affiliate company investment. For the purpose of this schedule, transfers into the non-controlled affiliate company lines represent the fair value at September 30, 2017. During the twelve months ended December 31, 2018, TPP ceased operations and the Company, along with the other owners, appointed an assignee and pursuant to Delaware state law completed a General Assignment for the Benefit of Creditors to the assignee. The purpose of the assignment was to wind down the TPP business and distribute the assets to its creditors. The assignee has informed the Company that it will have de minimis assets, if any, to distribute to its creditors. As a result, the Company has realized a loss on TPP of $24,503 during the year ended December 31, 2018. |
| F-38 |
| For the years ended December 31, | ||||||||||||||||||||||||
| 2019 | 2018 | |||||||||||||||||||||||
| Portfolio Company | Interest income |
Dividend income |
Fee income |
Interest income |
Dividend income |
Fee income |
||||||||||||||||||
| Non-controlled affiliate company investments: | ||||||||||||||||||||||||
| American Community Homes, Inc. | $ | 1,044 | $ | — | $ | — | $ | 1,061 | $ | — | $ | — | ||||||||||||
| American Community Homes, Inc. | 880 | — | — | 822 | — | — | ||||||||||||||||||
| American Community Homes, Inc. | 80 | — | — | 91 | — | — | ||||||||||||||||||
| American Community Homes, Inc. | 64 | — | — | 66 | — | — | ||||||||||||||||||
| American Community Homes, Inc. | 48 | — | — | 46 | — | — | ||||||||||||||||||
| American Community Homes, Inc. | 190 | — | — | — | — | — | ||||||||||||||||||
| American Community Homes, Inc. | 284 | — | — | — | — | — | ||||||||||||||||||
| American Community Homes, Inc. | 14 | — | — | 67 | — | — | ||||||||||||||||||
| American Community Homes, Inc. | 1 | — | — | — | — | — | ||||||||||||||||||
| American Community Homes, Inc. (Warrant) | — | — | — | — | — | — | ||||||||||||||||||
| 2,605 | — | — | 2,153 | — | — | |||||||||||||||||||
| Curion Holdings, LLC | 286 | — | — | 257 | — | — | ||||||||||||||||||
| Curion Holdings, LLC (Revolver) | 20 | — | — | 11 | — | — | ||||||||||||||||||
| Curion Holdings, LLC (Junior secured loan) | — | — | — | — | — | — | ||||||||||||||||||
| Curion Holdings, LLC (Junior secured loan) | — | — | — | — | — | — | ||||||||||||||||||
| Curion Holdings, LLC (Common units) | — | — | — | — | — | — | ||||||||||||||||||
| 306 | — | — | 268 | — | — | |||||||||||||||||||
| Incipio, LLC | 1,554 | — | — | 912 | — | — | ||||||||||||||||||
| Incipio, LLC | 400 | — | — | 242 | — | — | ||||||||||||||||||
| Incipio, LLC | 170 | — | — | 67 | — | — | ||||||||||||||||||
| Incipio, LLC | 51 | — | — | — | — | — | ||||||||||||||||||
| Incipio, LLC (Junior secured loan) | — | — | — | — | — | — | ||||||||||||||||||
| Incipio, LLC (Junior secured loan) | — | — | — | — | — | — | ||||||||||||||||||
| Incipio, LLC (Common units) | — | — | — | — | — | — | ||||||||||||||||||
| 2,175 | — | — | 1,221 | — | — | |||||||||||||||||||
| Luxury Optical Holdings Co. | 259 | — | — | 469 | — | — | ||||||||||||||||||
| Luxury Optical Holdings Co. (Delayed Draw) | 86 | — | — | 88 | — | — | ||||||||||||||||||
| Luxury Optical Holdings Co. (Revolver) | 12 | — | — | 21 | — | — | ||||||||||||||||||
| Luxury Optical Holdings Co. (Common stock) | — | — | — | — | — | — | ||||||||||||||||||
| 357 | — | — | 578 | — | — | |||||||||||||||||||
| Millennial Brands LLC (Preferred units) | — | — | — | — | — | — | ||||||||||||||||||
| Millennial Brands LLC (Common units) | — | — | — | — | — | — | ||||||||||||||||||
| — | — | — | — | — | — | |||||||||||||||||||
| New England College of Business and Finance, LLC (Revolver) | 47 | — | — | n/a | n/a | n/a | ||||||||||||||||||
| New England College of Business and Finance, LLC (LLC units) | — | — | — | n/a | n/a | n/a | ||||||||||||||||||
| 47 | — | — | n/a | n/a | n/a | |||||||||||||||||||
| Rockdale Blackhawk, LLC | n/a | n/a | n/a | 920 | — | — | ||||||||||||||||||
| Rockdale Blackhawk, LLC (Capex) | n/a | n/a | n/a | 41 | — | — | ||||||||||||||||||
| Rockdale Blackhawk, LLC (Revolver) | n/a | n/a | n/a | 137 | — | — | ||||||||||||||||||
| Rockdale Blackhawk, LLC (Revolver) | n/a | n/a | n/a | 240 | — | — | ||||||||||||||||||
| Rockdale Blackhawk, LLC (Revolver) | n/a | n/a | n/a | 104 | — | — | ||||||||||||||||||
| Rockdale Blackhawk, LLC (LLC interest) | n/a | n/a | n/a | — | — | — | ||||||||||||||||||
| n/a | n/a | n/a | 1,442 | — | — | |||||||||||||||||||
| SHI Holdings, Inc. | 347 | — | — | 336 | — | — | ||||||||||||||||||
| SHI Holdings, Inc. (Revolver) | 480 | — | — | 352 | — | — | ||||||||||||||||||
| SHI Holdings, Inc. (Common stock) | — | — | — | — | — | — | ||||||||||||||||||
| 827 | — | — | 688 | — | — | |||||||||||||||||||
| Summit Container Corporation | 339 | — | — | 492 | — | 83 | ||||||||||||||||||
| Summit Container Corporation | — | — | — | 108 | — | — | ||||||||||||||||||
| Summit Container Corporation (Revolver) | 569 | — | — | 292 | — | — | ||||||||||||||||||
| Summit Container Corporation (Warrant) | — | — | — | — | — | — | ||||||||||||||||||
| 908 | — | — | 892 | — | 83 | |||||||||||||||||||
| TPP Operating, Inc. | n/a | n/a | n/a | — | — | — | ||||||||||||||||||
| TPP Operating, Inc. | n/a | n/a | n/a | — | — | — | ||||||||||||||||||
| TPP Operating, Inc. | n/a | n/a | n/a | — | — | — | ||||||||||||||||||
| TPP Operating, Inc. (Common stock) | n/a | n/a | n/a | — | — | — | ||||||||||||||||||
| TPP Operating, Inc. (Common stock) | n/a | n/a | n/a | — | — | — | ||||||||||||||||||
| n/a | n/a | n/a | — | — | — | |||||||||||||||||||
| Total non-controlled affiliate company investments | $ | 7,225 | $ | — | $ | — | $ | 7,242 | $ | — | $ | 83 | ||||||||||||
| Controlled affiliate company investments: | ||||||||||||||||||||||||
| MRCC Senior Loan Fund I, LLC | $ | — | $ | 4,045 | $ | — | $ | — | $ | 1,725 | $ | — | ||||||||||||
| — | 4,045 | — | — | 1,725 | — | |||||||||||||||||||
| Total controlled affiliate company investments | $ | — | $ | 4,045 | $ | — | $ | — | $ | 1,725 | $ | — | ||||||||||||
Note 6. Transactions with Related Parties
The Company has entered into an investment advisory agreement with MC Advisors, (the “Investment Advisory Agreement”), under which MC Advisors, subject to the overall supervision of the Board, provides investment advisory services to the Company. The Company pays MC Advisors a fee for its services under the Investment Advisory Agreement consisting of two components - a base management fee and an incentive fee.
On November 4, 2019, the Board approved a change to the Investment Advisory Agreement to amend the base management fee structure. Effective July 1, 2019, the base management fee is calculated initially at an annual rate equal to 1.75% of average invested assets (calculated as total assets excluding cash, which includes assets financed using leverage); provided, however, the base management fee is calculated at an annual rate equal to 1.00% of the Company’s average invested assets (calculated as total assets excluding cash, which includes assets financed using leverage) that exceeds the product of (i) 200% and (ii) the Company’s average net assets. For the avoidance of doubt, the 200% is calculated in accordance with the asset coverage limitation as defined in the 1940 Act to give effect to the Company’s exemptive relief with respect to MRCC SBIC’s SBA debentures. This change has the effect of reducing the Company’s base management fee rate on assets in excess of regulatory leverage of 1:1 debt to equity to 1.00% per annum. The base management fee is payable quarterly in arrears.
Prior to July 1, 2019, the base management fee was calculated at an annual rate equal to 1.75% of average invested assets (calculated as total assets excluding cash, which included assets financed using leverage) and was payable quarterly in arrears.
Base management fees for the years ended December 31, 2019, 2018, and 2017 were $10,780, $8,879 and $7,726 respectively.
| F-39 |
The incentive fee consists of two parts. The first part is calculated and payable quarterly in arrears and equals 20% of “pre-incentive fee net investment income” for the immediately preceding quarter, subject to a 2% (8% annualized) preferred return, or “hurdle,” and a “catch up” feature. The foregoing incentive fee is subject to a total return requirement, which provides that no incentive fee in respect of pre-incentive fee net investment income will be payable except to the extent that 20% of the cumulative net increase in net assets resulting from operations over the then current and 11 preceding calendar quarters exceeds the cumulative incentive fees accrued and/or paid for the 11 preceding calendar quarters (the “Incentive Fee Limitation”). Therefore, any ordinary income incentive fee that is payable in a calendar quarter will be limited to the lesser of (1) 20% of the amount by which pre-incentive fee net investment income for such calendar quarter exceeds the 2% hurdle, subject to the “catch-up” provision, and (2) (x) 20% of the cumulative net increase in net assets resulting from operations for the then current and 11 preceding calendar quarters minus (y) the cumulative incentive fees accrued and/or paid for the 11 preceding calendar quarters. For the foregoing purpose, the “cumulative net increase in net assets resulting from operations” is the sum of pre-incentive fee net investment income, realized gains and losses and unrealized gains and losses for the then current and 11 preceding calendar quarters. The second part of the incentive fee is determined and payable in arrears as of the end of each fiscal year in an amount equal to 20% of realized capital gains, if any, on a cumulative basis from inception through the end of the year, computed net of all realized capital losses on a cumulative basis and unrealized depreciation, less the aggregate amount of any previously paid capital gain incentive fees.
The composition of the Company’s incentive fees was as follows:
| For the years ended December 31, | ||||||||||||
| 2019 | 2018 | 2017 | ||||||||||
| Part one incentive fees (1) | $ | 6,692 | $ | 6,730 | $ | 6,276 | ||||||
| Part two incentive fees (2) | — | — | (175 | ) | ||||||||
| Incentive Fee Limitation | (1,081 | ) | (4,979 | ) | (415 | ) | ||||||
| Incentive fees, excluding the impact of the incentive fee waiver | 5,611 | 1,751 | 5,686 | |||||||||
| Incentive fee waiver (3) | (1,182 | ) | — | (308 | ) | |||||||
| Total incentive fees, net of incentive fee waiver | $ | 4,429 | $ | 1,751 | $ | 5,378 | ||||||
| (1) | Based on net investment income. |
| (2) | Based upon net realized and unrealized gains and losses, or capital gains. The Company accrues, but does not pay, a capital gains incentive fee in connection with any unrealized capital appreciation, as appropriate. If, on a cumulative basis, the sum of net realized gain (loss) plus net unrealized gain (loss) decreases during a period, the Company will reverse any excess capital gains incentive fee previously accrued such that the amount of capital gains incentive fee accrued is no more than 20% of the sum of net realized gain (loss) plus net unrealized gain (loss). |
| (3) | Represents part one incentive fees waived by MC Advisors. |
The Company has entered into an administration agreement with MC Management (the “Administration Agreement”), under which the Company reimburses MC Management, subject to the review and approval of the Board, for its allocable portion of overhead and other expenses, including the costs of furnishing the Company with office facilities and equipment and providing clerical, bookkeeping, record-keeping and other administrative services at such facilities, and the Company’s allocable portion of the cost of the chief financial officer and chief compliance officer and their respective staffs. To the extent that MC Management outsources any of its functions, the Company will pay the fees associated with such functions on a direct basis, without incremental profit to MC Management. For the years ended December 31, 2019, 2018 and 2017, the Company incurred $3,509, $3,430 and $3,439, respectively, in administrative expenses (included within Professional fees, Administrative service fees and General and administrative expenses on the consolidated statements of operations) under the Administration Agreement, of which $1,309, $1,327 and $1,248, respectively, was related to MC Management overhead and salary allocation and paid directly to MC Management. As of December 31, 2019 and 2018, $322 and $342, respectively, of expenses were due to MC Management under this agreement and are included in accounts payable and accrued expenses on the consolidated statements of assets and liabilities.
The Company has entered into a license agreement with Monroe Capital LLC under which Monroe Capital LLC has agreed to grant the Company a non-exclusive, royalty-free license to use the name “Monroe Capital” for specified purposes in its business. Under this agreement, the Company has the right to use the “Monroe Capital” name at no cost, subject to certain conditions, for so long as MC Advisors or one of its affiliates remains its investment adviser. Other than with respect to this limited license, the Company has no legal right to the “Monroe Capital” name or logo.
Note 7. Borrowings
On June 20, 2018, the Company’s stockholders approved the application of the modified asset coverage requirements set forth in Section 61(a)(2) of the 1940 Act to the Company. As a result of this approval, the Company is now permitted to borrow amounts such that its asset coverage ratio, as defined in the 1940 Act, is at least 150% after such borrowing (if certain requirements are met), rather than 200%, as previously required. As of December 31, 2019 and 2018, the Company’s asset coverage ratio based on aggregate borrowings outstanding was 183% and 223%, respectively.
Revolving Credit Facility: On March 1, 2019, the Company amended and restated its revolving credit facility (as amended and restated and further amended on March 20, 2019, the “Amended Credit Agreement”) with ING Capital LLC, as agent. Among other things, the Amended Credit Agreement increased the size of the facility from $200,000 to $255,000 (with an accordion feature that permits the Company, under certain circumstances, to increase the size of the facility up to $400,000), extended the period during which the Company may make draws under the revolving credit facility from expiring on December 14, 2019 to expiring on March 1, 2023, extended the final maturity date from December 14, 2020 to March 1, 2024, lowered the interest rate margins (a) for LIBOR loans (which may be one, three or six month, at the Company’s option), from 2.75% to 2.375% and (b) for alternate base rate loans, from 1.75% to 1.375%, reduced the asset coverage covenant from 2.1 to 1 to 1.5 to 1, replaced the consolidated interest coverage ratio with a minimum senior debt coverage ratio of 2 to 1 (in addition to the asset coverage ratio noted above), and increased the advance rate against certain types of assets in the Company’s portfolio. The Company incurred expenses of $1,820 in conjunction with the amendment and restatement which have been capitalized within unamortized deferred financing costs and are amortized into interest expense over the estimated average life of the borrowings.
| F-40 |
On September 27, 2019, the Company entered into a second amendment to its revolving credit facility to, among other things, amend the borrowing base to increase the amount of borrowing that can be collateralized by investments structured based on loan-to-value metrics, with corresponding adjustments to the concentration limits. The size, pricing and other significant terms of the revolving credit facility remain unchanged. The Company incurred expenses of $191 in conjunction with this amendment which have been capitalized within unamortized deferred financing costs and are amortized into interest expense over the estimated average life of the borrowings.
As of December 31, 2019, the maximum amount the Company was able to borrow was $255,000 and this maximum can be increased to $400,000 pursuant to an accordion feature (subject to maintaining 150% asset coverage, as defined by the 1940 Act). The revolving credit facility is secured by a lien on all of the Company’s assets, including cash on hand, but excluding the assets of the Company’s wholly-owned subsidiary, MRCC SBIC. The Company may make draws under the revolving credit facility to make or purchase additional investments through March 1, 2023 and for general working capital purposes until March 1, 2024, the maturity date of the revolving credit facility.
The Company’s ability to borrow under the revolving credit facility is subject to availability under the borrowing base, which permits the Company to borrow up to 72.5% of the fair market value of its portfolio company investments depending on the type of the investment the Company holds and whether the investment is quoted. The Company’s ability to borrow is also subject to certain concentration limits, and continued compliance with the representations, warranties and covenants given by the Company under the facility. The revolving credit facility contains certain financial and restrictive covenants, including, but not limited to, the Company’s maintenance of: (1) a minimum consolidated total net assets at least equal to $175,000 plus 65% of the net proceeds to the Company from sales of its equity securities after March 1, 2019; (2) a ratio of total assets (less total liabilities other than indebtedness) to total indebtedness of not less than 1.5 to 1; and (3) a senior debt coverage ratio of at least 2 to 1. The revolving credit facility also requires the Company to undertake customary indemnification obligations with respect to ING Capital LLC and other members of the lending group and to reimburse the lenders for expenses associated with entering into the credit facility. The revolving credit facility also has customary provisions regarding events of default, including events of default for nonpayment, change in control transactions at both Monroe Capital Corporation and MC Advisors, failure to comply with financial and negative covenants, and failure to maintain the Company’s relationship with MC Advisors. If the Company incurs an event of default under the revolving credit facility and fails to remedy such default under any applicable grace period, if any, then the entire revolving credit facility could become immediately due and payable, which would materially and adversely affect the Company’s liquidity, financial condition, results of operations and cash flows.
The Company’s revolving credit facility also imposes certain conditions that may limit the amount of the Company’s distributions to stockholders. Distributions payable in the Company’s common stock under the DRIP are not limited by the revolving credit facility. Distributions in cash or property other than common stock are generally limited to 115% of the amount of distributions required to maintain the Company’s status as a RIC.
As of December 31, 2019, the Company had U.S. dollar borrowings of $158,950 and non-U.S. dollar borrowings denominated in Great Britain pounds of £16,100 ($21,344 in U.S. dollars) under the revolving credit facility. As of December 31, 2018, the Company had U.S. dollar borrowings of $117,150 and non-U.S. dollar borrowings denominated in Great Britain pounds of £14,800 ($18,876 in U.S. dollars) under the revolving credit facility. The borrowings denominated in Great Britain pounds may be positively or negatively affected by movements in the rate of exchange between the U.S. dollar and the Great Britain pound. These movements are beyond the control of the Company and cannot be predicted. The borrowings denominated in Great Britain pounds are translated into U.S. dollars based on the spot rate at each balance sheet date. The impact resulting from changes in foreign currency borrowings is included in net change in unrealized gain (loss) on foreign currency and other transactions on the Company’s consolidated statements of operations and totaled ($821), $1,023 and ($354) for the years ended December 31, 2019, 2018 and 2017, respectively.
Borrowings under the revolving credit facility bear interest, at the Company’s election, at an annual rate of LIBOR (one-month, three-month or six-month at the Company’s discretion based on the term of the borrowing) plus 2.375% or at a daily rate equal to 1.375% per annum plus the greater of the prime interest rate, the federal funds rate plus 0.5% or LIBOR plus 1.0%. In addition to the stated interest rate on borrowings under the revolving credit facility, the Company is required to pay a fee of 0.5% per annum on any unused portion of the revolving credit facility if the unused portion of the facility is less than 35% of the then available maximum borrowing or a fee of 1.0% per annum on any unused portion of the revolving credit facility if the unused portion of the facility is greater than or equal to 35% of the then available maximum borrowing. As of December 31, 2019 and December 31, 2018, the outstanding borrowings were accruing at a weighted average interest rate of 4.0% and 5.0%, respectively.
2023 Notes: On September 12, 2018, the Company closed a public offering of 2,760,000 units of senior unsecured notes at a public offering price of $25.00 per unit, resulting in aggregate principal and gross proceeds of $69,000. Aggregate underwriters’ discounts and commissions were $2,156 and deferred financing costs were $450, resulting in net proceeds of approximately $66,394. On March 20, 2019, the Company closed a registered direct offering of 1,600,000 units of 2023 Notes at an offering price of $24.75 per unit, resulting in additional aggregate principal of $40,000 and gross proceeds of $39,600. Placement agent fees were $530 and deferred financing costs were $718, resulting in net proceeds of approximately $38,352. The 2023 Notes mature on October 31, 2023. Interest on the 2023 Notes is paid quarterly on January 31, April 30, July 31, and October 31, at an annual rate of 5.75%. The Company may redeem the 2023 Notes in whole or in part at any time or from time to time on or after October 31, 2020. The 2023 Notes are general, unsecured obligations and rank equal in right of payment with all of the Company’s existing and future unsecured indebtedness. The 2023 Notes are listed on The Nasdaq Global Select Market under the trading symbol MRCCL.
SBA Debentures: On February 28, 2014, the Company’s wholly-owned subsidiary, MRCC SBIC received a license from the SBA to operate as a SBIC under Section 301(c) of the Small Business Investment Act of 1958, as amended. MRCC SBIC commenced operations on September 16, 2013.
The SBIC license allows MRCC SBIC to obtain leverage by issuing SBA debentures, subject to the issuance of a leverage commitment by the SBA and other customary procedures. SBA debentures are non-recourse, interest only debentures with interest payable semi-annually and have a 10-year maturity. The principal amount of SBA debentures is not required to be paid prior to maturity but may be prepaid at any time without penalty. The interest rate of SBA debentures is fixed on a semi-annual basis (pooling date) at a market-driven spread over U.S. Treasury Notes with 10-year maturities. The SBA, as a creditor, has a superior claim to MRCC SBIC’s assets over the Company’s stockholders in the event the Company liquidates MRCC SBIC, or the SBA exercises its remedies upon an event of default. As of December 31, 2019, MRCC SBIC had $27,409 in cash and $133,982 in investments at fair value. As of December 31, 2018, MRCC SBIC had $13,982 in cash and $161,014 in investments at fair value.
| F-41 |
SBA regulations currently limit the amount that an individual SBIC may borrow to a maximum of $175,000 when it has at least $87,500 in regulatory capital, receives a leverage commitment from the SBA and has been through an audit examination by the SBA subsequent to licensing. The SBA also limits a related group of SBICs (commonly referred to as a “family of funds”) to a maximum of $350,000 in total borrowings.
As of both December 31, 2019 and December 31, 2018, MRCC SBIC had $57,624 in leverageable capital and the following SBA debentures outstanding:
| Maturity Date | Interest Rate | Amount | ||||||
| September 2024 | 3.4 | % | $ | 12,920 | ||||
| March 2025 | 3.3 | % | 14,800 | |||||
| March 2025 | 2.9 | % | 7,080 | |||||
| September 2025 | 3.6 | % | 5,200 | |||||
| March 2027 | 3.5 | % | 20,000 | |||||
| September 2027 | 3.2 | % | 32,100 | |||||
| March 2028 | 3.9 | % | 18,520 | |||||
| September 2028 | 4.2 | % | 4,380 | |||||
| Total | $ | 115,000 | ||||||
On October 2, 2014, the Company was granted exemptive relief from the SEC for permission to exclude the debt of MRCC SBIC guaranteed by the SBA from the asset coverage test under the 1940 Act. The receipt of this exemption for this SBA debt increases flexibility under the asset coverage test.
Secured Borrowings: Certain partial loan sales do not qualify for sale accounting under ASC Topic 860 because these sales do not meet the definition of a “participating interest,” as defined in the guidance, in order for sale treatment to be allowed. Participations or other partial loan sales which do not meet the definition of a participating interest remain as an investment on the accompanying consolidated statements of assets and liabilities and the portion sold is recorded as a secured borrowing in the liabilities section of the consolidated statements of assets and liabilities. For these partial loan sales, the interest earned on the entire loan balance is recorded within “interest income” and the interest earned by the buyer in the partial loan sale is recorded within “interest and other debt financing expenses” on the accompanying consolidated statements of operations. As of December 31, 2019 and 2018, there were no secured borrowings. During the years ended December 31, 2019, 2018 and 2017, repayments on secured borrowings totaled zero, zero and $1,254, respectively.
Components of interest expense: The components of the Company’s interest expense and other debt financing expenses, average outstanding balances and average stated interest rates (i.e. the rate in effect plus spread) were as follows:
| For the years ended December 31, | ||||||||||||
| 2019 | 2018 | 2017 | ||||||||||
| Interest expense – revolving credit facility | $ | 8,710 | $ | 5,845 | $ | 4,771 | ||||||
| Interest expense – 2023 Notes | 5,756 | 1,201 | — | |||||||||
| Interest expense – SBA debentures | 3,933 | 3,814 | 2,434 | |||||||||
| Amortization of deferred financing costs | 1,869 | 1,410 | 1,042 | |||||||||
| Interest expense – secured borrowings | — | — | 34 | |||||||||
| Other | — | — | 31 | |||||||||
| Total interest and other debt financing expenses | $ | 20,268 | $ | 12,270 | $ | 8,312 | ||||||
| Average outstanding balance | 397,503 | 243,929 | 179,500 | |||||||||
| Average stated interest rate | 4.5 | % | 4.4 | % | 4.0 | % | ||||||
Note 8. Derivative Instruments
The Company enters into foreign currency forward contracts from time to time to help mitigate the impact that an adverse change in foreign exchange rates would have on future interest cash flows from the Company’s investments denominated in foreign currencies. As of December 31, 2019 and 2018, the counterparty to these foreign currency forward contracts was Bannockburn Global Forex, LLC. Net unrealized gain or loss on foreign currency forward contracts are included in net change in unrealized gain (loss) from foreign currency forward contracts and net realized gain or loss on forward currency forward contracts are included in net realized gain (loss) from foreign currency forward contracts on the accompanying consolidated statements of operations.
| F-42 |
Certain information related to the Company’s foreign currency forward contracts is presented below as of December 31, 2019 and December 31, 2018.
| As of December 31, 2019 | |||||||||||||||||
Notional Amount
to be |
Settlement Date |
Gross Unrealized |
Gross Amount of Unrealized Loss |
Balance Sheet location of Net Amounts | |||||||||||||
| Foreign currency forward contract | £ | 104 | 1/2/2020 | $ | — | $ | (5 | ) | Unrealized loss on foreign currency forward contracts | ||||||||
| Foreign currency forward contract | £ | 231 | 2/28/2020 | — | (10 | ) | Unrealized loss on foreign currency forward contracts | ||||||||||
| Foreign currency forward contract | £ | 27 | 3/2/2020 | — | (1 | ) | Unrealized loss on foreign currency forward contracts | ||||||||||
| Foreign currency forward contract | £ | 103 | 4/1/2020 | — | (5 | ) | Unrealized loss on foreign currency forward contracts | ||||||||||
| Foreign currency forward contract | £ | 102 | 5/5/2020 | — | (4 | ) | Unrealized loss on foreign currency forward contracts | ||||||||||
| Foreign currency forward contract | £ | 230 | 5/29/2020 | — | (10 | ) | Unrealized loss on foreign currency forward contracts | ||||||||||
| Foreign currency forward contract | £ | 27 | 6/1/2020 | — | (1 | ) | Unrealized loss on foreign currency forward contracts | ||||||||||
| Foreign currency forward contract | £ | 230 | 8/28/2020 | — | (10 | ) | Unrealized loss on foreign currency forward contracts | ||||||||||
| Foreign currency forward contract | £ | 28 | 9/3/2020 | — | (2 | ) | Unrealized loss on foreign currency forward contracts | ||||||||||
| Foreign currency forward contract | £ | 229 | 11/30/2020 | — | (10 | ) | Unrealized loss on foreign currency forward contracts | ||||||||||
| Foreign currency forward contract | £ | 26 | 12/2/2020 | — | (1 | ) | Unrealized loss on foreign currency forward contracts | ||||||||||
| Total | £ | 1,337 | $ | — | $ | (59 | ) | ||||||||||
| As of December 31, 2018 | |||||||||||||||||
Notional Amount
to be |
Settlement Date |
Gross Unrealized |
Gross Amount of Unrealized Loss |
Balance Sheet location of Net Amounts | |||||||||||||
| Foreign currency forward contract | £ | 107 | 1/2/2019 | $ | 1 | $ | — | Unrealized gain on foreign currency forward contracts | |||||||||
| Foreign currency forward contract | £ | 228 | 2/28/2019 | 1 | — | Unrealized gain on foreign currency forward contracts | |||||||||||
| Foreign currency forward contract | £ | 106 | 4/1/2019 | 1 | — | Unrealized gain on foreign currency forward contracts | |||||||||||
| Foreign currency forward contract | £ | 229 | 5/31/2019 | 1 | — | Unrealized gain on foreign currency forward contracts | |||||||||||
| Foreign currency forward contract | £ | 106 | 7/1/2019 | 1 | — | Unrealized gain on foreign currency forward contracts | |||||||||||
| Foreign currency forward contract | £ | 230 | 8/30/2019 | 1 | — | Unrealized gain on foreign currency forward contracts | |||||||||||
| Foreign currency forward contract | £ | 105 | 10/1/2019 | 1 | — | Unrealized gain on foreign currency forward contracts | |||||||||||
| Foreign currency forward contract | £ | 230 | 11/29/2019 | 1 | — | Unrealized gain on foreign currency forward contracts | |||||||||||
| Foreign currency forward contract | £ | 104 | 1/2/2020 | 1 | — | Unrealized gain on foreign currency forward contracts | |||||||||||
| Foreign currency forward contract | £ | 231 | 2/28/2020 | 1 | — | Unrealized gain on foreign currency forward contracts | |||||||||||
| Foreign currency forward contract | £ | 103 | 4/1/2020 | 1 | — | Unrealized gain on foreign currency forward contracts | |||||||||||
| Foreign currency forward contract | £ | 102 | 5/5/2020 | 1 | — | Unrealized gain on foreign currency forward contracts | |||||||||||
| Foreign currency forward contract | £ | 230 | 5/29/2020 | 1 | — | Unrealized gain on foreign currency forward contracts | |||||||||||
| Foreign currency forward contract | £ | 230 | 8/28/2020 | 1 | — | Unrealized gain on foreign currency forward contracts | |||||||||||
| Foreign currency forward contract | £ | 229 | 11/30/2020 | 2 | — | Unrealized gain on foreign currency forward contracts | |||||||||||
| Total | £ | 2,570 | $ | 16 | $ | — | |||||||||||
For the years ended December 31, 2019, 2018 and 2017, the Company recognized net change in unrealized gain (loss) on foreign currency forward contracts of ($75), $16 and zero, respectively. For the years ended December 31, 2019, 2018 and 2017, the Company recognized net realized gain (loss) on foreign currency forward contracts of $12, ($3) and zero, respectively.
Note 9. Income Taxes
The Company has elected to be treated as a RIC under Subchapter M of the Code. As a RIC, the Company is not taxed on any investment company taxable income or capital gains which it distributes to stockholders. The Company intends to distribute all of its investment company taxable income and capital gains annually. Accordingly, no provision for federal income tax has been made in the consolidated financial statements.
Dividends from net investment income and distributions from net realized capital gains are determined in accordance with U.S. federal tax regulations, which may differ from amounts in accordance with U.S. GAAP and those differences could be material. These book-to-tax differences are either temporary or permanent in nature. Reclassifications due to permanent book-to-tax differences have no impact on net assets.
The following permanent differences were reclassified for tax purposes:
| For the years ended December 31, | ||||||||||||
| 2019 | 2018 | 2017 | ||||||||||
| Increase (decrease) in capital in excess of par value | $ | (61 | ) | $ | 67 | $ | (128 | ) | ||||
| Increase (decrease) in accumulated undistributed (overdistributed) earnings | 61 | (67 | ) | 128 | ||||||||
| F-43 |
Taxable income generally differs from net increase (decrease) in net assets resulting from operations for financial reporting purposes due to temporary and permanent differences in the recognition of income and expenses and generally excludes unrealized gain (loss) on investments as investment gains and losses are not included in taxable income until they are realized.
Capital losses in excess of capital gains earned in a tax year may generally be carried forward and used to offset capital gains, subject to certain limitations. Under the Regulated Investment Company Modernization Act of 2010, capital losses incurred after September 30, 2011 are not subject to expiration and retain their character as either short-term or long-term capital losses. As of December 31, 2019 and 2018, the Company had short-term capital loss carryforwards of $1,164 and $1,211, respectively. As of December 31, 2019 and 2018, the Company had long-term capital loss carryforwards of $21,184 and $21,547, respectively.
The following table reconciles net increase in net assets resulting from operations to taxable income:
| For the years ended December 31, | ||||||||||||
| 2019 | 2018 | 2017 | ||||||||||
| Net increase in net assets resulting from operations | $ | 19,214 | $ | 5,848 | $ | 12,152 | ||||||
| Net change in unrealized (gain) loss | 8,895 | (3,978 | ) | 13,480 | ||||||||
| Other realized gain (loss) for tax but not book | 108 | 8,853 | — | |||||||||
| Other income (loss) for tax but not book | (46 | ) | (3,394 | ) | (6,485 | ) | ||||||
| Other deductions for book in excess of deductions for tax | — | — | (175 | ) | ||||||||
| Expenses not currently deductible | 10 | 11 | 100 | |||||||||
| Net capital loss carryforward | 815 | 21,161 | 372 | |||||||||
| Total taxable income | $ | 28,996 | $ | 28,501 | $ | 19,444 | ||||||
For income tax purposes, distributions paid to stockholders are reported as ordinary income, return of capital, long term capital gains or a combination thereof. The following table provides the tax character of distributions paid:
| For the years ended December 31, | ||||||||||||
| 2019 | 2018 | 2017 | ||||||||||
| Ordinary income | $ | 28,624 | $ | 28,483 | $ | 26,458 | ||||||
| Long-term capital gains | — | — | 591 | |||||||||
| Total | $ | 28,624 | $ | 28,483 | $ | 27,049 | ||||||
Certain of the Company’s consolidated subsidiaries are subject to U.S. federal and state income taxes. For the years ended December 31, 2019, 2018 and 2017, the Company recorded a net tax expense of approximately $7, zero and zero, respectively, for these subsidiaries.
As of December 31, 2019, the estimated cost basis of investment for U.S. federal income tax purposes was $634,704, resulting in estimated net unrealized loss of $18,473, comprised of estimated gross unrealized gains and losses of $14,770 and $33,243, respectively. As of December 31, 2018, the estimated cost basis of investment for U.S. federal income tax purposes was $564,055, resulting in estimated net unrealized loss of $10,434, comprised of estimated gross unrealized gains and losses of $7,255 and $17,689, respectively.
Note 10. Distributions
The Company’s distributions are recorded on the record date. The following table summarizes dividends declared during the years ended December 31, 2019, 2018 and 2017:
| Date Declared | Record Date | Payment Date | Amount Per Share |
Cash Distribution |
DRIP Shares Issued |
DRIP Shares Value |
DRIP Shares Repurchased in the Open Market |
Cost
of DRIP Shares Repurchased |
||||||||||||||||||||
| Year ended December 31, 2019: | ||||||||||||||||||||||||||||
| March 5, 2019 | March 15, 2019 | March 29, 2019 | $ | 0.35 | $ | 7,156 | — | $ | — | 27,498 | $ | 342 | ||||||||||||||||
| May 31, 2019 | June 14, 2019 | June 28, 2019 | 0.35 | 7,156 | — | — | 30,802 | 363 | ||||||||||||||||||||
| September 3, 2019 | September 16, 2019 | September 30, 2019 | 0.35 | 7,156 | — | — | 33,674 | 355 | ||||||||||||||||||||
| December 2, 2019 | December 16, 2019 | December 31, 2019 | 0.35 | 7,156 | — | — | 31,662 | 349 | ||||||||||||||||||||
| Total distributions declared | $ | 1.40 | $ | 28,624 | — | $ | — | 123,636 | $ | 1,409 | ||||||||||||||||||
| Year ended December 31, 2018: | ||||||||||||||||||||||||||||
| March 1, 2018 | March 16, 2018 | March 30, 2018 | $ | 0.35 | $ | 7,084 | — | $ | — | 23,908 | $ | 301 | ||||||||||||||||
| June 1, 2018 | June 15, 2018 | June 29, 2018 | 0.35 | 6,786 | 22,308 | 301 | — | — | ||||||||||||||||||||
| August 31, 2018 | September 14, 2018 | September 28, 2018 | 0.35 | 7,156 | — | — | 24,946 | 338 | ||||||||||||||||||||
| November 30, 2018 | December 14, 2018 | December 28, 2018 | 0.35 | 7,156 | — | — | 35,006 | 337 | ||||||||||||||||||||
| Total distributions declared | $ | 1.40 | $ | 28,182 | 22,308 | $ | 301 | 83,860 | $ | 976 | ||||||||||||||||||
| Year ended December 31, 2017: | ||||||||||||||||||||||||||||
| March 7, 2017 | March 17, 2017 | March 31, 2017 | $ | 0.35 | $ | 5,549 | 16,217 | $ | 254 | — | $ | — | ||||||||||||||||
| May 31, 2017 | June 15, 2017 | June 30, 2017 | 0.35 | 6,807 | 17,932 | 271 | — | — | ||||||||||||||||||||
| August 31, 2017 | September 15, 2017 | September 29, 2017 | 0.35 | 7,084 | — | — | 6,508 | 93 | ||||||||||||||||||||
| December 1, 2017 | December 15, 2017 | December 29, 2017 | 0.35 | 7,084 | — | — | 20,832 | 294 | ||||||||||||||||||||
| Total distributions declared | $ | 1.40 | $ | 26,524 | 34,149 | $ | 525 | 27,340 | $ | 387 | ||||||||||||||||||
None of the distributions declared during the years ended December 31, 2019, 2018, and 2017 represented a return of capital for tax purposes.
| F-44 |
Note 11. Stock Issuances and Repurchases
Stock Issuances: On July 1, 2016, the Company amended the at-the-market (“ATM”) securities offering program the Company entered into on February 6, 2015, with MLV & Co. LLC (“MLV”) and JMP Securities LLC (“JMP”) (the “Initial ATM Program”), to replace MLV with FBR Capital Markets & Co. (“FBR”), an affiliate of MLV. On May 12, 2017, the Company entered into new equity distribution agreements with each of FBR and JMP (the “ATM Program”). All other material terms of the Initial ATM Program remain unchanged under the ATM Program. During the year ended December 31, 2017, the Company sold 173,939 shares at an average price of $15.71 per share for gross proceeds of $2,732 under the Initial ATM Program and no shares were sold under the ATM Program. Aggregate underwriters’ discounts and commissions were $41 and offering costs were $23, resulting in net proceeds of approximately $2,668. During the year ended December 31, 2018, the Company sold 182,299 shares at an average price of $13.82 per share for gross proceeds of $2,519 under the ATM Program. Aggregate underwriter’s discounts and commissions were $38 and offering costs were $79, resulting in net proceeds of approximately $2,402. There were no stock issuances during the year ended December 31, 2019.
On June 9, 2017, the Company closed a public offering of 3,000,000 shares of common stock at a public offering price of $15.00 per share, raising approximately $45,000 in gross proceeds. On June 14, 2017, pursuant to the underwriters’ exercise of the over-allotment option, the Company sold an additional 450,000 shares of its common stock, at a public offering price of $15.00 per share, raising an additional $6,750 in gross proceeds for a total of $51,750. Aggregate underwriters’ discounts and commissions were $2,070 and offering costs were $127, resulting in net proceeds of approximately $49,553.
Note 12. Commitments and Contingencies
Commitments: As of December 31, 2019 and 2018, the Company had $44,208 and $56,041, respectively, in outstanding commitments to fund investments under undrawn revolvers, capital expenditure loans, delayed draw commitments and subscription agreements (excluding SLF). As described in Note 3, the Company had unfunded commitments of $7,850 and $22,800, respectively, to SLF as of December 31, 2019 and 2018, that may be contributed primarily for the purpose of funding new investments approved by the SLF investment committee. Drawdowns of the commitments to SLF require authorization from one of the Company’s representatives on SLF’s board of managers. Management believes the Company’s available cash balances and/or ability to draw on the revolving credit facility provide sufficient funds to cover its unfunded commitments as of December 31, 2019.
Indemnifications: In the normal course of business, the Company enters into contracts and agreements that contain a variety of representations and warranties that provide general indemnifications. The Company’s maximum exposure under these agreements is unknown, as these involve future claims that may be made against the Company but that have not occurred. The Company expects the risk of any future obligations under these indemnifications to be remote.
Concentration of credit and counterparty risk: Credit risk arises primarily from the potential inability of counterparties to perform in accordance with the terms of the contract. In the event that the counterparties do not fulfill their obligations, the Company may be exposed to risk. The risk of default depends on the creditworthiness of the counterparties or issuers of the instruments. It is the Company’s policy to review, as necessary, the credit standing of each counterparty.
Market risk: The Company’s investments and borrowings are subject to market risk. Market risk is the potential for changes in the value due to market changes. Market risk is directly impacted by the volatility and liquidity in the markets in which the investments and borrowings are traded.
Legal proceedings: In the normal course of business, the Company may be subject to legal and regulatory proceedings that are generally incidental to its ongoing operations. While there can be no assurance of the ultimate disposition of any such proceedings, the Company is not currently aware of any such proceedings or disposition that would have a material adverse effect on the Company’s consolidated financial statements.
Note 13. Financial Highlights
The financial highlights for the Company are as follows:
| For the years ended December 31, | ||||||||||||||||||||
| 2019 | 2018 | 2017 | 2016 | 2015 | ||||||||||||||||
| Per share data: | ||||||||||||||||||||
| Net asset value at beginning of year | $ | 12.66 | $ | 13.77 | $ | 14.52 | $ | 14.19 | $ | 14.05 | ||||||||||
| Net investment income (1) | 1.42 | 1.57 | 1.40 | 1.55 | 1.60 | |||||||||||||||
| Net gain (loss) (1) | (0.48 | ) | (1.28 | ) | (0.75 | ) | 0.13 | (0.07 | ) | |||||||||||
| Net increase in net assets from operations (1) | 0.94 | 0.29 | 0.65 | 1.68 | 1.53 | |||||||||||||||
| Stockholder distributions – income | (1.40 | ) | (1.40 | ) | (1.37 | ) | (1.40 | ) | (1.37 | ) | ||||||||||
| Stockholder distributions – capital gains | — | — | (0.03 | ) | — | (0.03 | ) | |||||||||||||
| Effect of share issuance above (below) NAV (2) | — | — | — | 0.05 | — | |||||||||||||||
| Other (2) | — | — | — | — | 0.01 | |||||||||||||||
| Net asset value at end of year | $ | 12.20 | $ | 12.66 | $ | 13.77 | $ | 14.52 | $ | 14.19 | ||||||||||
| Net assets at end of year | $ | 249,357 | $ | 258,767 | $ | 278,699 | $ | 240,850 | $ | 184,535 | ||||||||||
| Shares outstanding at end of year | 20,444,564 | 20,444,564 | 20,239,957 | 16,581,869 | 13,008,007 | |||||||||||||||
| Per share market value at end of year | $ | 10.86 | $ | 9.60 | $ | 13.75 | $ | 15.38 | $ | 13.09 | ||||||||||
| Total return based on market value (3) | 27.68 | % | (21.74 | )% | (1.82 | )% | 28.95 | % | (0.21 | )% | ||||||||||
| Total return based on average net asset value (4) | 7.53 | % | 2.17 | % | 4.58 | % | 11.70 | % | 11.04 | % | ||||||||||
| Ratio/Supplemental data: | ||||||||||||||||||||
| Ratio of net investment income to average net assets (5) | 11.38 | % | 11.85 | % | 9.80 | % | 10.81 | % | 11.56 | % | ||||||||||
| Ratio of total expenses, net of incentive fee waiver, to average net assets (5) | 15.35 | % | 9.84 | % | 9.46 | % | 10.81 | % | 11.20 | % | ||||||||||
| Portfolio turnover | 27.18 | % | 31.53 | % | 39.39 | % | 22.41 | % | 30.70 | % | ||||||||||
| F-45 |
| (1) | Calculated using the weighted average shares outstanding during the years presented. |
| (2) | Includes the effect of share issuances above (below) net asset value and the impact of different share amounts used in calculating per share data as a result of calculating certain per share data based on weighted average shares outstanding during the year and certain per share data based on shares outstanding as of a period end or transaction date. |
| (3) | Total return based on market value is calculated assuming a purchase of common shares at the market value on the first day and a sale at the market value on the last day of the periods reported. Distributions, if any, are assumed for purposes of this calculation to be reinvested at prices obtained under the Company’s DRIP. Total return based on market value does not reflect brokerage commissions. |
| (4) | Total return based on average net asset value is calculated by dividing the net increase in net assets from operations by the average net asset value. |
| (5) | The following is a schedule of supplemental ratios for the years presented. |
| 2019 | 2018 | 2017 | 2016 | 2015 | ||||||||||||||||
| Ratio of interest and other debt financing expenses to average net assets | 7.95 | % | 4.56 | % | 3.13 | % | 3.26 | % | 3.33 | % | ||||||||||
| Ratio of total expenses (without incentive fees) to average net assets | 13.61 | % | 9.19 | % | 7.43 | % | 8.17 | % | 8.31 | % | ||||||||||
| Ratio of incentive fees, net of incentive fee waiver, to average net assets (6) | 1.74 | % | 0.65 | % | 2.03 | % | 2.64 | % | 2.89 | % | ||||||||||
| (6) | The ratio of waived incentive fees to average net assets was 0.46%, zero, 0.12%, 0.13% and zero for the years ended December 31, 2019, 2018, 2017, 2016 and 2015, respectively. |
Note 14. Subsequent Events
The Company has evaluated subsequent events through March 3, 2020, the date on which the consolidated financial statements were issued.
On March 3, 2020, the Board declared a quarterly distribution of $0.35 per share payable on March 31, 2020 to holders of record on March 16, 2020.
In January 2020, an arbitrator issued an interim award in favor of the estate of Rockdale in the pending legal proceeding between the estate of Rockdale and a national insurance carrier. The award was issued as “interim” due to the fact that the arbitrator will hear further briefing from both parties as to an allocation of attorneys’ fees, interest and certain other amounts that should be paid to Rockdale in connection with the interim award. As such, the exact computation of the final amount of the award has yet to be determined and is uncertain, but is expected to resolve over the next few quarters. At this time, management believes that the Company’s share of the net proceeds from the award will exceed the cost basis of the Company’s investment due to the Company’s right to receive excess proceeds pursuant to the terms of a sharing agreement between the lenders and the estate; however, due to the aforementioned post-trial arbitration proceedings, it is not certain that will be the case. The lenders to Rockdale, including the Company, will share in the proceeds of this arbitration award with the estate, once it becomes final and is paid. At this time, it is also unclear whether, or to what extent, the national insurance carrier may seek to appeal the adverse ruling against it. Management believes that any such appeal is unlikely to be successful based on the appellate standard for arbitration.
Note 15. Selected Quarterly Financial Data (unaudited)
| For the quarter ended | ||||||||||||||||
| December 31, 2019 | September 30, 2019 | June 30, 2019 | March 31, 2019 | |||||||||||||
| Total investment income | $ | 17,985 | $ | 17,330 | $ | 16,719 | $ | 16,159 | ||||||||
| Net investment income | $ | 7,649 | $ | 7,238 | $ | 7,073 | $ | 7,074 | ||||||||
| Net gain (loss) | $ | (3,521 | ) | $ | (3,585 | ) | $ | (3,081 | ) | $ | 367 | |||||
| Net increase (decrease) in net assets resulting from operations | $ | 4,128 | $ | 3,653 | $ | 3,992 | $ | 7,441 | ||||||||
| Net investment income per share – basic and diluted | $ | 0.37 | $ | 0.35 | $ | 0.35 | $ | 0.35 | ||||||||
| Net increase (decrease) in net assets resulting from operations per share – basic and diluted | $ | 0.21 | $ | 0.17 | $ | 0.20 | $ | 0.36 | ||||||||
| Net asset value per share at period end | $ | 12.20 | $ | 12.34 | $ | 12.52 | $ | 12.67 | ||||||||
| For the quarter ended | ||||||||||||||||
| December 31, 2018 | September 30, 2018 | June 30, 2018 | March 31, 2018 | |||||||||||||
| Total investment income | $ | 14,835 | $ | 13,779 | $ | 14,820 | $ | 14,950 | ||||||||
| Net investment income | $ | 7,803 | $ | 7,726 | $ | 7,906 | $ | 8,465 | ||||||||
| Net gain (loss) | $ | (6,632 | ) | $ | (8,719 | ) | $ | (3,626 | ) | $ | (7,075 | ) | ||||
| Net increase (decrease) in net assets resulting from operations | $ | 1,171 | $ | (993 | ) | $ | 4,280 | $ | 1,390 | |||||||
| Net investment income per share – basic and diluted | $ | 0.38 | $ | 0.38 | $ | 0.39 | $ | 0.42 | ||||||||
| Net increase (decrease) in net assets resulting from operations per share – basic and diluted | $ | 0.06 | $ | (0.05 | ) | $ | 0.21 | $ | 0.07 | |||||||
| Net asset value per share at period end | $ | 12.66 | $ | 12.95 | $ | 13.35 | $ | 13.49 | ||||||||
| For the quarter ended | ||||||||||||||||
| December 31, 2017 | September 30, 2017 | June 30, 2017 | March 31, 2017 | |||||||||||||
| Total investment income | $ | 13,364 | $ | 13,469 | $ | 12,268 | $ | 12,006 | ||||||||
| Net investment income | $ | 6,995 | $ | 6,887 | $ | 6,088 | $ | 6,034 | ||||||||
| Net gain (loss) | $ | (4,754 | ) | $ | (569 | ) | $ | (5,064 | ) | $ | (3,465 | ) | ||||
| Net increase (decrease) in net assets resulting from operations | $ | 2,241 | $ | 6,318 | $ | 1,024 | $ | 2,569 | ||||||||
| Net investment income per share – basic and diluted | $ | 0.35 | $ | 0.34 | $ | 0.35 | $ | 0.36 | ||||||||
| Net increase (decrease) in net assets resulting from operations per share – basic and diluted | $ | 0.11 | $ | 0.31 | $ | 0.06 | $ | 0.15 | ||||||||
| Net asset value per share at period end | $ | 13.77 | $ | 14.01 | $ | 14.05 | $ | 14.34 | ||||||||
| F-46 |
(a)(3) Exhibits
None.
| 66 |
Pursuant to the requirements of Section 13 or 15(d) of the Securities Exchange Act of 1934, the registrant has duly caused this Annual Report on Form 10-K to be signed on its behalf by the undersigned, thereunto duly authorized.
Date: March 3, 2020
Monroe Capital Corporation (Registrant)
| By | /s/ Theodore L. Koenig | |
| Theodore L. Koenig | ||
| Chairman, Chief Executive Officer and Director | ||
| (Principal Executive Officer) |
| By | /s/ Aaron D. Peck | |
| Aaron D. Peck | ||
| Chief Financial Officer, Chief Investment Officer and Director | ||
| (Principal Financial and Accounting Officer) |
Pursuant to the requirements of the Securities Exchange Act of 1934, this report has been signed below by the following persons on behalf of the registrant and in the capacities and on the dates indicated.
| Signature | Title | Date | ||
| /s/ Theodore L. Koenig | Chairman, Chief Executive Officer and Director | March 3, 2020 | ||
| Theodore L. Koenig | (Principal Executive Officer) | |||
| /s/ Aaron D. Peck | Chief Financial Officer, Chief Investment Officer and Director | March 3, 2020 | ||
| Aaron D. Peck | (Principal Financial and Accounting Officer) | |||
| /s/ Thomas J. Allison | Director | March 3, 2020 | ||
| Thomas J. Allison | ||||
| /s/ Jeffrey A. Golman | Director | March 3, 2020 | ||
| Jeffrey A. Golman | ||||
| /s/ Jorde M. Nathan | Director | March 3, 2020 | ||
| Jorde M. Nathan | ||||
| /s/ Robert S. Rubin | Director | March 3, 2020 | ||
| Robert S. Rubin | ||||
| /s/ Jeffrey D. Steele | Director | March 3, 2020 | ||
| Jeffrey D. Steele |
| 67 |