Attached files
| file | filename |
|---|---|
| EX-32.2 - EXHIBIT 32.2 - COVETRUS, INC. | cvet_20191231xex322.htm |
| EX-32.1 - EXHIBIT 32.1 - COVETRUS, INC. | cvet_20191231xex321.htm |
| EX-31.2 - EXHIBIT 31.2 - COVETRUS, INC. | cvet_20191231xex312.htm |
| EX-31.1 - EXHIBIT 31.1 - COVETRUS, INC. | cvet_20191231xex311.htm |
| EX-23.2 - EXHIBIT 23.1 - COVETRUS, INC. | cvet_20191231xex231.htm |
| EX-21.1 - EXHIBIT 21.1 - COVETRUS, INC. | cvet_20191231xex211.htm |
| EX-10.31 - EXHIBIT 10.31 - COVETRUS, INC. | cvet_20191231xex1031.htm |
| EX-4.2 - EXHIBIT 4.2 - COVETRUS, INC. | cvet_20191231xex42.htm |
UNITED STATES
SECURITIES AND EXCHANGE COMMISSION
Washington, D.C. 20549
___________________________
FORM 10-K
___________________________
x | ANNUAL REPORT PURSUANT TO SECTION 13 OR 15(d) OF THE SECURITIES EXCHANGE ACT OF 1934 |
For the fiscal year ended December 31, 2019
OR
☐ | TRANSITION REPORT PURSUANT TO SECTION 13 OR 15(d) OF THE SECURITIES EXCHANGE ACT OF 1934 |
For the transition period from to
Commission file number 001-38794
_________________________
COVETRUS, INC.
(Exact name of registrant as specified in its charter)
___________________________
Delaware | 83-1448706 | |
(State or other jurisdiction of incorporation or organization) | (I.R.S. Employer Identification No.) | |
7 Custom House Street, Portland, Maine | 04101 | |
(Address of principal executive offices) | (Zip Code) | |
(888) 280-2221
(Registrant’s telephone number, including area code)
N/A
(Former name, former address and former fiscal year, if changed since last report)
___________________________
Securities registered pursuant to Section 12(b) of the Act:
Title of Each Class | Ticker Symbol | Name of Exchange on Which Registered | ||
Common Stock, par value $0.01 per share | CVET | Nasdaq Global Select Market | ||
Securities registered pursuant to Section 12(g) of the Act: None
——————————————————————————————
Indicate by check mark if the registrant is a well-known seasoned issuer, as defined in Rule 405 of the Securities Act. Yes o No x |
Indicate by check mark if the registrant is not required to file reports pursuant to Section 13 or Section 15(d) of the Act. Yes o No x |
Indicate by check mark whether the registrant (1) has filed all reports required to be filed by Section 13 or 15 (d) of the Securities Exchange Act of 1934 during the preceding 12 months (or for such shorter period that the registrant was required to file such reports), and (2) has been subject to such filing requirements for the past 90 days. Yes x No o |
Indicate by check mark whether the registrant has submitted electronically every Interactive Data File required to be submitted pursuant to Rule 405 of Regulation S-T (§ 232.405 of this chapter) during the preceding 12 months (or for such shorter period that the registrant was required to submit such files). Yes x No o |
Indicate by check mark whether the registrant is a large accelerated filer, an accelerated filer, a non-accelerated filer, a smaller reporting company, or an emerging growth company. See the definitions of “large accelerated filer,” “accelerated filer,” “smaller reporting company,” and “emerging growth company” in Rule 12b-2 of the Exchange Act. |
Large accelerated filer | o | Accelerated filer | o | |
Non-accelerated filer | x | Smaller reporting company | o | |
Emerging growth company | o | |||
If an emerging growth company, indicate by check mark if the registrant has elected not to use the extended transition period for complying with any new or revised financial accounting standards provided pursuant to Section 13(a) of the Exchange Act. o |
Indicate by check mark whether the registrant is a shell company (as defined in Rule 12b-2 of the Exchange Act). Yes o No x |
The aggregate market value of the voting common stock held by non-affiliates of the registrant, computed by reference to the closing price as of the last business day of the registrant's most recently completed second fiscal quarter, June 28, 2019, was approximately $2.4 billion. |
The registrant had 111,708,121 shares of common stock outstanding as of February 28, 2020.
DOCUMENTS INCORPORATED BY REFERENCE
Portions of the Proxy Statement of Registrant for use in connection with the 2020 Annual Meeting of Shareholders (our “2020 Proxy Statement”), are incorporated by reference into Part III of this report.
COVETRUS, INC.
ANNUAL REPORT ON FORM 10-K
FOR THE YEAR ENDED DECEMBER 31, 2019
TABLE OF CONTENTS
Page No. | |||
2
Explanatory Note
As previously disclosed, effective February 7, 2019, Direct Vet Marketing, Inc. (d/b/a Vets First Choice) (“Vets First Choice”) became a wholly-owned subsidiary of Covetrus, Inc. (f/k/a HS Spinco, Inc.) (“Covetrus” or the “Company”), a company formed by Henry Schein, Inc. (“Henry Schein” or “Former Parent”) in connection with the spin-off of the animal-health business of Henry Schein (the “Animal Health Business”) and combination with Vets First Choice (collectively, the “Transactions”). Covetrus common stock began regular-way trading under the symbol “CVET” on the Nasdaq Global Select Market on February 8, 2019.
Except as otherwise specifically noted, the combined financial statements and other financial information for the fiscal years ended December 29, 2018 and December 30, 2017 relate to the Animal Health Business, as these periods predate the February 7, 2019 effective date of the acquisition of Vets First Choice. This Annual Report on Form 10-K (“Form 10-K” or “Report”) does not include the historical financial results of Vets First Choice for the fiscal years ended December 29, 2018 and December 30, 2017 and does not include any pro forma financial statements of Covetrus.
Beginning with the Quarterly Report on Form 10-Q for the quarter ended March 31, 2019, Covetrus began reporting on a consolidated basis, representing the combined operations of the Animal Health Business and Vets First Choice and their respective subsidiaries. Because the Animal Health Business is deemed the acquirer in this combination for accounting purposes under U.S. Generally Accepted Accounting Principles (“GAAP”), the Animal Health Business is considered Covetrus’ predecessor, and the historical combined financial statements of the Animal Health Business prior to February 7, 2019 have been reflected in Covetrus’ quarterly reports and this Form 10-K for the year ended December 31, 2019 as Covetrus’ historical financial statements.
The terms “Covetrus,” “Company,” “we,” “our,” “us,” or “ourselves” included in this Report mean Covetrus, Inc. and its consolidated subsidiaries, collectively.
Rounding adjustments applied to individual numbers and percentages shown in this Report may result in these figures differing immaterially from their absolute values, and tables may not foot or cross foot.
Forward-looking Statements
Certain matters discussed in this Report, including the information presented in Part II, Item 7, Management’s Discussion and Analysis of Financial Condition and Results of Operations, contain statements, estimates, and projections that are “forward-looking statements” as defined under U.S. federal securities laws. These forward-looking statements, which include statements regarding our business strategy, our expenses and sufficiency of cash, seasonality, our ability to exit transition services agreements with our Former Parent, deployment of our platform outside the United States, and the timing and impact of business transactions, involve substantial risks and uncertainties and include, without limitation, statements regarding our industry, business strategy, plans, goals, and our expectations concerning our market position, accounting pronouncements, litigation, seasonality of our business, leases, expenses, interest expense and debt, and sufficiency of cash. When used in this Report, the words “anticipate,” “assume,” “believe,” “budget,” “continue,” “could,” “estimate,” “expect,” “intend,” “may,” “plan,” “potential,” “predict,” “project,” “should,” “will,” “future,” and the negative of these or similar terms and phrases are intended to identify forward-looking statements. Except as required by law, we do not intend to update or revise any forward-looking statements, whether as a result of new information, future events, or otherwise.
These forward-looking statements reflect our current expectations regarding future events, results, or outcomes. Although we believe the expectations reflected in our forward-looking statements are reasonable, we can give no assurance that these expectations will prove to have been correct. These expectations may or may not be realized. Some of these expectations may be based upon assumptions, data, or judgments that prove to be incorrect. Actual events, results, and outcomes may differ materially from our expectations due to a variety of known and unknown risks, uncertainties, and other factors. Important factors that could cause actual results to differ materially from those indicated by such forward-looking statements include, but are not limited to, those described in this Form 10-K in Part I, Item 1A, Risk Factors.
We operate in a very competitive and rapidly changing market. New risks emerge from time to time, and it is not possible for our management to predict all risks, nor can we assess the impact of all factors on our business or the extent to which any factor, or combination of factors, may cause actual results to differ materially from those contained in any forward-looking statements we may make.
3
PART I
Item 1. | Business |
Overview
We are a global animal-health technology and services company dedicated to supporting the companion, equine, and large-animal veterinary markets. Our mission is to provide the best products, services, and technology to veterinarians and animal-health practitioners (“Customers”) across the globe, so they can deliver exceptional care to their patients (“Animal Owners”) when and where it is needed. In February 2019, we combined the complementary capabilities of the Animal Health Business and Vets First Choice, bringing together leading practice management software and supply chain and distribution businesses with a technology-enabled prescription management platform and related pharmacy services. We believe our approach to the market will support the delivery of improved veterinary care and the health of their practices while driving increased demand for our products and services.
History and Corporate Information
We were incorporated in Delaware in April 2018 as a wholly-owned subsidiary of our Former Parent under the name HS Spinco, Inc., and subsequently changed our name to Covetrus, Inc. Prior to the spin-off, affiliates of Covetrus purchased from certain minority holders their ownership interests in the applicable operating companies of the Animal Health Business. On February 7, 2019, Henry Schein completed the spin-off of its Animal Health Business and transferred the applicable assets, liabilities, and ownership interests to us (the “Separation”) and distributed all the shares of our common stock that were then owned by Henry Schein to its stockholders of record as of January 17, 2019 (the “Distribution”). Also, on February 7, 2019 and prior to the Distribution, we sold $361 million in shares to accredited institutional investors (the “Share Sale”). The proceeds from the Share Sale were paid to us and distributed to our Former Parent. Concurrent with the Distribution, we paid a cash dividend of $1.2 billion from loan proceeds from our newly established credit facility (see Note 8 - Debt). We then acquired Vets First Choice in an all-stock transaction (the “Acquisition”) and the following day, our shares began trading on the Nasdaq Global Select Market under the symbol CVET.
In January 2020, we entered into (i) a definitive agreement to sell our scil animal-care business (“scil”) to Heska Corporation, and (ii) an agreement to combine our subsidiary operating in Spain and Portugal with Distrivet S.A. Both transactions are expected to close during the second quarter ended June 30, 2020, subject to customary closing conditions. See Note 3 - Held for Sale and Note 19 - Subsequent Events.
Global Operations
In connection with the Separation, Distribution, and Acquisition, we made significant changes to our organizational management and reporting structure. As a result, we revised our reportable segments from (i) supply chain and (ii) technology and value-added services to (i) North America, (ii) Europe, and (iii) APAC & Emerging Markets. While the historical business was focused on driving growth through specific product and service offerings to our Customers, the Separation, Distribution, and Acquisition allowed for the integration of the different products and service offerings, along with prescription management, data analytics, and insights through veterinary practice management software, into one multi-channel veterinary platform. We will focus on delivering this platform of products and services to our Customers on a geographical basis. We provided recast historical segment information reflecting these changes in the Form 8-K dated May 7, 2019. See Note 18 - Segment Data.
The table below shows the percentage of net sales by segment for the last three years:
Percent of Net Sales by Segment (a) | 2019 | 2018 | 2017 | |||||
North America | 53.1 | % | 51.3 | % | 52.4 | % | ||
Europe | 38.0 | 38.7 | 38.4 | |||||
APAC & Emerging Markets | 9.3 | 10.2 | 9.7 | |||||
Eliminations | (0.3 | ) | (0.3 | ) | (0.5 | ) | ||
Total | 100.0 | % | 100.0 | % | 100.0 | % | ||
(a) See Note 4 - Revenue from Contracts with Customers for our disaggregated revenue | ||||||||
4
Our Products and Services
Below is a graphic representing our major product categories currently available to the market and certain of our products and services:
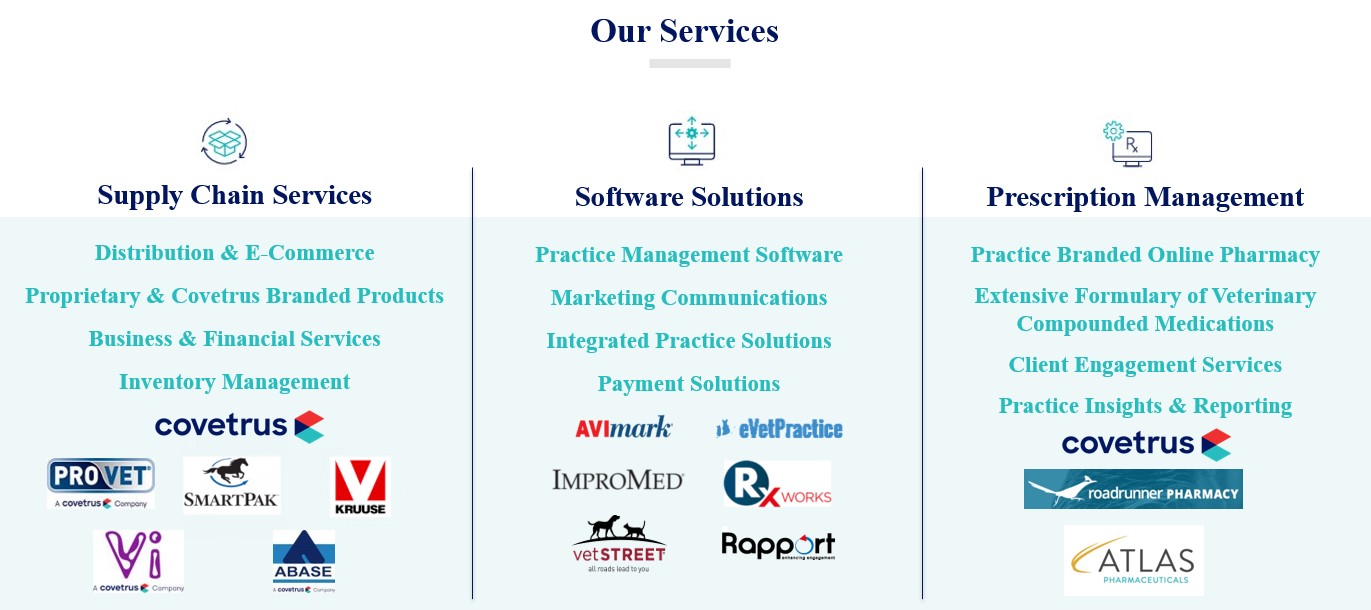
Supply Chain Services
We offer a comprehensive portfolio of products and services and value-added solutions for enhancing practice revenue, operating efficient practices, and delivering high-quality care. By combining our extensive infrastructure and logistical expertise with robust software and ordering tools, a broad product offering at competitive prices, a suite of add-on business and financial services, and a strong commitment to customer service, we strive to be an indispensable and trusted partner for our Customers’ evolving needs.
Software Solutions
We offer technology solutions and services, including practice management software, data-driven applications, client communications tools, and related services, which are designed to increase staff efficiency and improve business health, allowing the veterinarian more time to provide patient care. We develop, provide, and support veterinary practices with a wide range of veterinary software systems. We also offer solutions that integrate with our software platforms, including client communication services, reminders, data backup services, hardware sales and support, and credit card processing. These integrated veterinary marketing services leverage practice-level data and consumer insights to deliver highly personal, relevant, and timely communications, strengthening the veterinary-client patient relationship and improving Animal Owners loyalty. Our payment solutions also help veterinarians save time and money with credit card processing services, which we build into our veterinary software systems to streamline workflow.
Prescription Management
Our technology-enabled prescription management platform empowers veterinarians with insights and pharmacy services that are designed to increase engagement and veterinary practice health. Our prescription management platform, which integrates into veterinary practice management software and workflow, leverages insight and analytics, client engagement and outreach communications, and integrated veterinary pharmacy services and is designed to improve medical compliance. We work directly with veterinary practices to provide client and practice-level insights and identify gaps in medical care. By doing so, we seek to enable our veterinarian Customers to manage the lifecycle of a prescription to create new revenue opportunities, adapt to changing animal-owner purchasing behaviors, and strengthen their client relationships through convenience of our e-commerce, auto-ship services, and access to accredited veterinary pharmacies with more than 20,000 products for standard prescriptions, preventatives, diets, and custom-compounded medications. These products and services ultimately allow our Customers to improve the quality of animal care that is provided.
5
Our Customers
Our customer base is comprised principally of animal-health and veterinary practices and clinics in the companion-animal and equine markets in North America, Europe, and APAC & Emerging Markets:
• | Supply chain Customers in North America, Europe, and APAC & Emerging Markets, |
• | Software solutions Customers in the U.S., the United Kingdom, Australia, New Zealand, and certain other countries, and |
• | Prescription management and pharmacy services Customers in the U.S. |
These veterinary practices consist of both small, privately-owned businesses and an increasing number of corporate-owned practices. We also serve animal-health providers and producers in the large-animal market, primarily outside of North America.
Sales and Marketing
Our supply chain sales and marketing efforts are designed to establish and solidify Customer relationships through personal visits by field sales representatives and contact from our inside sales team. Our prescription management and software businesses also have a direct sales force, which we augment through our channel partners and other marketing initiatives. We have also developed sales and marketing capabilities aimed at expanding our relationships with strategic accounts and pharmaceutical manufacturers.
Our combined sales and marketing teams include approximately 1,200 employees worldwide who generate new sales through direct and frequent communication with Customers and when requested, Animal Owners, facilitate order processing, stay abreast of market developments, and educate practice personnel regarding the hundreds of new products, services, and technologies introduced each year.
Sales and Marketing Employees by Segment | Number | % | ||
North America | 625 | 52.1 | % | |
Europe | 500 | 41.7 | % | |
APAC & Emerging Markets | 75 | 6.2 | % | |
Total | 1,200 | 100.0 | % | |
Our Strategy
As a recently formed and publicly-listed company, we have prioritized what we believe are the necessary building blocks to our independent operations and future success: (i) establishing reliable worldwide Customer support alongside a continuing and planned elimination of our reliance on our Transition Service Agreements (“TSAs”) with our Former Parent, (ii) increasing coordination across our business units and technology capabilities as we phase-in our global integration efforts, and (iii) strengthening our capabilities so that we will be able to penetrate our Customer base across our various markets to tap into growth opportunities. We made notable progress in 2019 in addressing these building blocks:
• | We made progress establishing a corporate infrastructure, including the people and the technology, necessary to support finance, human resources, information technology, and legal capabilities, among other functions, across Covetrus, including exiting 18 TSAs in 2019. |
• | We made significant investments in our portfolio of software solutions and technology-enabled prescription management platform that improved customer service and workflow and delivered deeper integration and coordination between our prescription management and software solutions businesses. We started the process of combining our prescription management and software services teams as one phase of our integration efforts. |
• | We had early success in cross-selling and penetrating our existing Supply Chain Services Customer base with our Prescription Management platform, delivering an increased number of enrollments on this platform, and increasing growth in our specialty pharmacy and compounded medications businesses. |
• | We manufacture products and develop solutions for certain of our European businesses, our proprietary products and services offerings, as well as engage third parties to manufacture products on our behalf that we sell with Covetrus branding. We experienced further adoption of these proprietary and Covetrus-branded products and solutions inside our existing customer base as our integration efforts continued. |
6
As we continue to expand on our 2019 accomplishments, our priorities entering 2020 continue to be centered on further strengthening our team and culture, and pursuing the specific strategies that will help us better achieve our mission as an organization, which is to provide the best products, services, and technologies to animal-health practitioners across the globe, so they can deliver exceptional care to their patients when and where it is needed. Our strategic goals are customer-centric and are designed to help animal-health practitioners (primarily veterinarians) deliver improved outcomes for their practices and their clients. We expect to meet our goals by (i) focusing and streamlining our businesses, (ii) synchronizing our global capabilities, and (iii) accelerating our growth while expanding our products and services offerings.
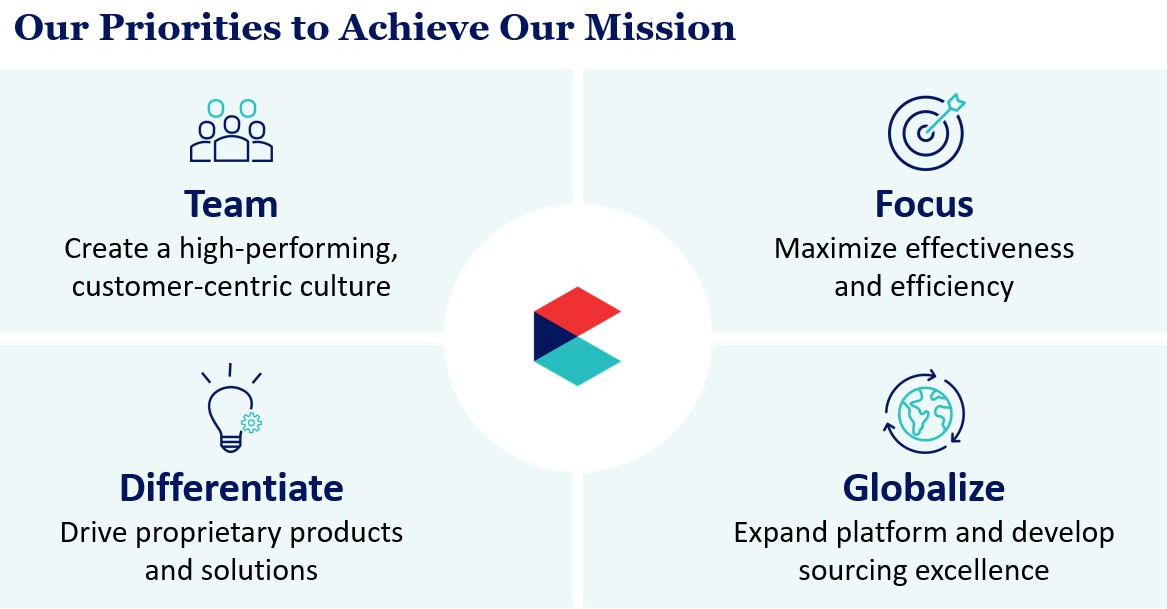
Team
We must remain an attractive employer to capitalize on the relationships, relationship building potential, and wealth of knowledge that our employees possess and ensure these employee attributes can be translated into value creation. We strive to create a high-performing, Customer-centric culture that is operating as one team that embraces our values. We seek to leverage a passion for caring for animals that strives for continuous improvement, education, and advancement with competitive wages and benefits for our staff.
Focus
We will continue to streamline and focus our business by maximizing effectiveness and efficiency to deliver more consistent and profitable performance. We may also look to divest non-core assets, such as the scil animal care transaction announced in January 2020, and we plan to better manage our infrastructure spending, and complete our separation efforts from Henry Schein as we exit all TSAs by the end of 2020.
• | For our supply chain business, we are targeting reduced costs to serve our Customers and making investments in global sourcing to lay the foundation for potential margin enhancement. We also expect to drive additional growth in our proprietary and Covetrus-branded offerings that can drive greater value to our Customers and improve margins. |
• | For our software business, we are building our product roadmap and making targeted investments in our capabilities to potentially improve functionality and workflow for our Customers. We will also continue to invest in customer support as we continuously look to provide higher service levels to our Customers. |
• | For our prescription management business, we are leveraging the infrastructure investments we have made over the past two years to scale our business profitability. We plan to prioritize technology investments and drive tighter coordination with our software businesses while expecting to deliver efficiencies and improved product capabilities. |
7
Differentiate
We are investing in our differentiated and higher margin proprietary products and solutions in 2020. We are focused on delivering better experiences and outcomes, which includes relentlessly seeking to advance our Customer successes, leveraging the power of our market insights, and investing in technology advancements and enterprise solutions. We are also leveraging technology across all facets of our business to deliver even greater value back to our Customers and manufacturer partners. Additional investment in support programs and product capabilities should also put us in a stronger position to differentiate our services and drive deeper engagement with our large Customer base. Utilizing our channel access to provide specialty pharmacy and compounded medications to a broader Customer base is also a priority for us. Finally, we will look to bring new products and solutions to market as we strive to be an indispensable and trusted partner for all our Customers’ evolving needs.
Globalize
In 2020, we will seek to more rapidly identify and better understand the needs of our global Customers and manufacturer partners to align our collection of capabilities together into a more integrated value proposition. This foundational focus should enable us to deliver on the global and cross-border opportunities we see moving forward more effectively. This will include building out the initial technology infrastructure necessary to deploy our prescription management platform outside the U.S. and bring some of our higher-margin proprietary products and solutions into new geographies. We expect to broaden our enterprise solutions to meet the needs of corporate groups that continue to acquire practices across geographies. Finally, we expect to capitalize on our global reach to deliver on the sourcing opportunity we see available to us.
Our Competition
The market for providing products, services, and technology to the global animal-health industry is highly competitive and fragmented. Competitive factors include price, product offerings, value-added services, service and delivery levels, credit terms, and customer support. Substantially all of the products we sell are available to Customers from a number of distributors, manufacturers and suppliers and, increasingly, some are being sold directly to Animal Owners and, as a result, significant price reductions by our competitors or changes in how products are ultimately procured by Animal Owners could result in competitive harm.
Our principal competitors include:
• | Animal Health Divisions of Traditional Distribution Companies: the MWI Animal Health division of AmerisourceBergen Corporation and the Patterson Veterinary division of Patterson Companies, Inc., |
• | Animal Health-focused Companies: national, regional, and local full-service distributors, online commerce such as Amazon.com, Inc. and zooplus AG, retail and online pharmacy providers such as Chewy, Inc., PetMed Express, Inc., and Strategic Pharmaceutical Solutions, Inc. (d/b/a Vetsource), as well as manufacturers of animal-health products that sell directly to veterinary practices and retailers, thereby eliminating or reducing the role of distribution, and |
• | Practice Management Service Providers: IDEXX Laboratories, Inc. and several regional and local veterinary software vendors, including those offering cloud-based solutions. |
Additionally, the growth in online and brick-and-mortar retailers offering certain animal-health products and services directly to Animal Owners continues to impact our Customers and, in turn, our business given our strategic alignment with the veterinary community. Our operating results may be materially adversely affected should this trend continue.
Our Competitive Strengths
We believe we are well-situated within the markets in which we compete. We expect that our comprehensive and integrated multi-channel capabilities that are focused on empowering care givers, providing expertise, and delivering global scale will allow us to maintain and strengthen existing Customer relationships, win new business, and unlock new demand and access additional revenue opportunities while addressing the evolving needs of our Customers, Animal Owners, and our manufacturing partners.
8
Seasonality
Our quarterly sales and operating results have varied from period-to-period in the past and will likely continue to do so in the future. In the companion animal market, sales of parasite protection products have historically tended to be stronger during the spring and summer months, primarily due to an increase in vector-borne diseases during that time, which correlates with our second and third quarters given that most of our business is in the northern hemisphere. Buying patterns can also be affected by manufacturers’ and distributors’ marketing programs or price increase announcements, which can cause veterinarians to purchase animal-health products earlier than when those products are needed. This kind of early purchasing may reduce our sales in the quarters these purchases would have otherwise been made. The sales of animal products can also vary due to changes in the price of commodities used in manufacturing the products and weather patterns, which may also affect period-over-period financial results. We expect our historical seasonality trends to continue in the foreseeable future.
Working Capital
Our principal capital requirements include the funding of working capital needs, debt service, strategic investments, build out of our infrastructure, and maintenance capital expenditures. We require substantial working capital, which is susceptible to fluctuations in the level of accounts receivables and inventory purchase patterns, and seasonal demands throughout the year. We extend credit to many of our customers globally in the ordinary course of business, which increases accounts receivable balances within our business segments and is dependent, to an extent, on seasonal demand. Our sales terms vary from due immediately for credit card payments to significantly longer periods generally offered to larger customers. Inventory purchase activity and stock levels are also dependent on sales activity and seasonal demand, however, on occasion we consider special inventory buy-in opportunities to achieve better purchase terms and earn larger rebates.
Intellectual Property
We own multiple trademarks, service marks and trade names that are important to our business. We believe that our trademarks are well recognized in the animal-health industry and by veterinarians and, therefore, are valuable assets.
Employees and Executive Officers
We have a knowledgeable team of over 5,500 employees worldwide (2,600 in the U.S.), including 5,100 full-time employees as of December 31, 2019. We view our employees as a critical factor to our success in strengthening our market position, innovating and driving the global adoption of our proprietary brands and solutions. We have identified our team as one of our four priorities in executing our strategy, see Our Strategy above. We believe we maintain positive relations with our employees. In certain countries, we are bound by union agreements negotiated by the employer's association with the respective union representatives. We are also party to shop agreements on workplace-related issues, negotiated with works councils at individual facilities that relate to those facilities.
9
Our executive officers, as of March 3, 2020 are as follows:
Name | Age | Position | Qualifying Experience | |||
Benjamin Wolin | 44 | President and Chief Executive Officer since March 2020; Acting President and Chief Executive Officer since October 2019; Director since February 2019 | Former Chief Executive Officer and Co-founder of Everyday Health, Inc. | |||
Erin Powers Brennan | 49 | Senior Vice President, General Counsel and Secretary | General Counsel of Vets First Choice; Partner at Morgan, Lewis & Bockius LLP. | |||
Michael Ellis | 61 | Executive Vice President, President of Europe and North America | Chief Financial Officer, General Manager, Vice President, & President of Europe at Henry Schein Animal Health. | |||
Dustin K. Finer | 50 | Chief People Officer since September 2019; Chief Administrative Officer since November 2019 | Chief Administrative & Internal Operations Officer at TiVo/Rovi; Chief of Operations at MySpace. | |||
Stuart B. Gleichenhaus | 62 | Interim Chief Financial Officer since December 2019 | Senior Managing Director at FTI Consulting, Inc.; Co-leader of the Merger Integration & Carve-outs Practice & a Leader of the Office of the CFO Solutions Practice; Interim Chief Financial Officer at ANGUS Chemicals, AgroFresh, ATW, and Carestream Dental. | |||
David Hinton | 59 | Executive Vice President, President of APAC & Emerging Markets | Vice President & Managing Director of Australia and New Zealand at Henry Schein; Vice President & Managing Director of U.K., Ireland, and France at Henry Schein Animal Health. | |||
Timothy Ludlow | 54 | Senior Vice President and Chief Transformation Officer | Chief Financial Officer, Chief Integration Officer & Transformation Officer at Vets First Choice; Chief Financial Officer at Pine State Trading Company; Senior Vice President & Treasurer at C&S Wholesale Grocers. | |||
Laura J. Phillips | 50 | Vice President, Global Controller and Chief Accounting Officer since April 2019 | Director of Finance Compliance at Google; Vice President, Corporate Controller of Brown-Forman Corporation; Assistant Corporate Controller of General Motors; Deputy Chief Auditor for the Public Company Accounting Oversight Board. | |||
Anthony Providenti | 52 | Senior Vice President, Corporate Development | Vice President of Corporate Business Development at Henry Schein; Vice President of Strategy & Development at Henry Schein Animal Health. | |||
Georgina Wraight | 45 | Executive Vice President, President of Global Technology Solutions | President & Chief Operating Officer at Vets First Choice; Chief Operating Officer The Rockport Group; Chief Operating Office, Chief Financial Officer Highline Group; and other financial Positions at Ernst & Young, Walt Disney, and the BBC . | |||
Laws and Regulations
Our prescription management and pharmacy services business, which is currently conducted only in the U.S., is affected by federal and state laws and regulations governing, among other things, the purchase, distribution, management, compounding, dispensing, marketing, and labeling of prescription and non-prescription drugs and related services. In addition, we are subject to U.S. Food and Drug Administration (“FDA”), U.S. Drug Enforcement Administration (“DEA”), and comparable state regulations affecting the pharmacy and pharmaceutical industries, including state pharmacy licensure, registration or permit standards, state and federal controlled substance laws, and statutes and regulations related to FDA approval of the sale and marketing of new pharmaceuticals and medical devices. State pharmacy laws require pharmacies to be licensed or otherwise authorized to dispense prescription medications.
Our pharmacies are in Arizona, Maine, Nebraska, and Texas and dispense in all states. Non-resident pharmacies are licensed similar to resident pharmacies. As such, each prescription for a medication that is fulfilled by one of our pharmacies is generally
10
covered by the laws of the state where the pet owner is located. The laws and regulations relating to the sale and delivery of prescription medications vary from state to state, but generally require that prescription medications be dispensed with the authorization from a prescribing veterinarian. We are authorized to dispense prescription medications in all 50 states and the District of Columbia.
The sale of animal-health products is also governed by the laws and regulations specific to each country in which we sell our products.
United States
The regulatory body that is responsible for the regulation of animal-health pharmaceuticals in the U.S. is the Center for Veterinary Medicine (“CVM”) housed within the FDA. Generally, all animal-health pharmaceuticals are subject to pre-market review and must be shown to be safe, effective, and produced by a consistent method of manufacture as defined under the Federal Food, Drug and Cosmetic Act. If the drug is for food-producing animals, potential consequences for humans are also considered. The FDA’s basis for approving a drug application is documented in a Freedom of Information Summary. Post-approval monitoring of products is required, with reports being provided to the CVM’s Surveillance and Compliance group. Reports of product quality defects, adverse events or unexpected results are produced in accordance with the law. Animal supplements generally are not required to obtain premarket approval from the CVM, although they may be treated as a food. Any substance that is added to, or is expected to become a component of, animal food must be used in accordance with a food additive regulation, unless it is generally recognized as safe, under the conditions of its intended use. Alternatively, the FDA may consider animal supplements to be drugs. The FDA has agreed to exercise enforcement discretion for such supplements if each such supplement meets certain conditions.
The regulatory body in the U.S. for veterinary biologics, such as vaccines, is the U.S. Department of Agriculture (“USDA”). The USDA’s Center for Veterinary Biologics is responsible for the regulation of animal-health vaccines, including immunotherapeutics. Marketing of imported veterinary biological products in the U.S. requires a U.S. Veterinary Biological Product Permit. Veterinary biologics are subject to pre-market review and must be shown to be pure, safe, potent, and efficacious, as defined under the Virus Serum Toxin Act. Post-licensing monitoring of products is required. Reports of product quality defects, adverse events, or unexpected results are produced in accordance with USDA requirements.
The main regulatory body in the U.S. for veterinary pesticides is the Environmental Protection Agency (“EPA”). The EPA’s Office of Pesticide Programs is responsible for the regulation of pesticide products applied to animals. Animal-health pesticides are subject to pre-market review and must not cause “unreasonable adverse effects to man or the environment” as stated in the Federal Insecticide, Fungicide, and Rodenticide Act. Within the U.S., pesticide products that are approved by the EPA must also be approved by individual state pesticide authorities before distribution in that state. Post-approval monitoring of products is required, with reports provided to the EPA and some state regulatory agencies.
Under the Controlled Substances Act, distributors of controlled substances are required to obtain and renew annually registrations for their facilities from the DEA. Distributors are also subject to other statutory and regulatory requirements relating to the storage, sale, marketing, handling, and distribution of such drugs, in accordance with the Controlled Substances Act and its implementing regulations, and these requirements have been subject to heightened enforcement activity in recent times. Distributors are subject to inspection by the DEA.
Advertising and promotion of animal-health products that are not subject to approval by the CVM may be challenged by the Federal Trade Commission (“FTC”), as well as by state attorneys general and by consumers under state consumer protection laws. The FTC regulates advertising pursuant to its authority to prevent “unfair or deceptive acts or practices in or affecting commerce” under the Federal Trade Commission Act. The FTC will find an advertisement to be deceptive if it contains a representation or omission of fact that is likely to mislead consumers acting reasonably under the circumstances, and the representation or omission is material and if the advertiser does not possess and rely upon a reasonable basis, such as competent and reliable evidence, substantiating the claim. The FTC may attack unfair or deceptive advertising practices through either an administrative adjudication or judicial enforcement action, including preliminary or permanent injunction. The FTC may also seek consumer redress from the advertiser in instances of dishonest or fraudulent conduct.
States may require registration of animal drug distributors and wholesalers. Additional requirements may apply when the product is also a controlled substance. States work closely with the Association of American Feed Control Officials (“AAFCO”) in their regulation of animal food. The AAFCO’s annual Official Publication, contains model animal and pet food labeling regulations that states may adopt. The publication is treated deferentially by the federal and state government agencies that regulate animal
11
food. Many states require registration or licensing of animal food distributors. States may also review and approve animal food labels prior to sale of the product in their state.
European Union
Veterinary medicines (which includes both prescription and over-the-counter products) must obtain a marketing authorization (“MA”) before they can be imported, marketed, and sold in any European Union (“EU”) member state. In broad terms, there are four different routes for obtaining MAs (i) a centralized EU-wide authorization procedure, (ii) national authorization procedures for each member state, (iii) a mutual recognition procedure involving at least two member states, and (iv) the decentralized procedure.
The centralized authorization route is used to obtain MAs for marketing and sale of veterinary medicines throughout all the EU member states as well as those countries in the European Free Trade Area (the “EFTA”). The European Medicines Agency (the “EMA”) located in London is responsible for assessing applications made under the centralized route. The agency is responsible for the scientific evaluation of medicines developed by pharmaceutical companies for use in the EU. The agency has a specialized veterinary review section distinct from the human medical review section. The Committee for Veterinary Medicinal Products is responsible for scientific review of the submissions for pharmaceuticals and vaccines. The EMA makes the final decision on the approval of products. Once granted by the European Commission (the “EC”) a centralized marketing authorization is valid in all EU member states and EFTA states. A series of Regulations, Directives, Guidelines, and EU Pharmacopeia Monographs provide the requirements for approval in the European Union. In general, these requirements are like those in the U.S., requiring demonstrated evidence of purity, safety, efficacy, and consistency of manufacturing processes. The EMA works closely with the competent authorities of each member state in the regulation of veterinary medicines, including with respect to pharmacovigilance and testing for residues of veterinary medicines or illegal substances in animals and animal products.
Veterinary medicines can also be authorized on a national level through application to the relevant member state’s competent authority. If a product already has been authorized in at least one EU member state, then the mutual recognition procedure can be used to gain approval in other member states. Finally, the decentralized procedure may be used if the product is not authorized in any member state and the applicant would like authorization in several or all member states. This may occur where the centralized procedure is not mandatory, the product is not eligible for the centralized procedure or where the applicant does not wish to use the centralized procedure.
The EC must authorize animal feed additives. The European Food Safety Authority (the “EFSA”) assesses applications on behalf of the EC. The EFSA will analyze a sample of the feed additive and provide an opinion within six months of receiving the application. The EC will decide whether to grant or deny an authorization of the additive based upon this opinion. When authorized, all companies can (subject to any relevant third-party intellectual property rights) usually benefit from the authorization.
An EU regulation on animal medicines, which became effective in November 2018, relates to the advertising of veterinary products, in addition to various regulation that applies in individual EU member states. Health claims on animal pet food must not be misleading and claims that a food fulfills a nutritional need must be in line with the list of permitted claims that is published in an EU directive.
United Kingdom
The Veterinary Medicines Directorate (the “VMD”) is the United Kingdom’s competent national authority responsible for overseeing the regulation of veterinary medicines in the United Kingdom (“U.K.”). U.K. national applications follow an approach like centralized EU applications. The VMD is also responsible for post-market surveillance and adverse event reporting.
Australia
The Australian Pesticides and Veterinary Medicines Authority (the “APVMA”) is an Australian government statutory authority established to centralize the registration of all agricultural and veterinary products in the Australian marketplace. Previously each state and territory government had its own system of registration. The primary legislation governing the APVMA’s activities is the Agricultural and Veterinary Chemicals Code, or the AgVet Code. The AgVet Code is in turn given force of law pursuant to the Agricultural and Veterinary Chemicals Code Act 1994 (Cth).
The APVMA assesses applications from companies and individuals seeking registration so they can import, promote, and supply their products to the marketplace, and under the AgVet Code the APVMA must be satisfied that any active constituents or
12
chemical products will not have a harmful effect on human health, the environment, occupational health and safety or trade, and that the product is effective for its intended use. Applications undergo rigorous assessment using the expertise of the APVMA’s scientific staff and drawing on the technical knowledge of other relevant scientific organizations, commonwealth government departments, and state agriculture departments. Labeling standards apply and pre-approval is required by the APVMA for veterinary chemical products. In addition, all advertising and promotion of products is subject to the Australian Consumer Law, which, like the U.S. and European Union, emphasizes accuracy and transparency in advertising and prohibits any misleading or deceptive conduct.
If the product works as intended and the scientific data confirms that when used as directed on the product label it will have no harmful or unintended effects on people, animals, the environment, or international trade, the APVMA will register the product. As well as registering new agricultural and veterinary products, the APVMA reviews older products that have been on the market for a substantial period to ensure they are still effective and safe to use. The APVMA also reviews registered products when concerns are raised about their safety and effectiveness. The review of a product may result in confirmation of its registration or continuing registration with some changes to the way the product can be used. In some cases, the review may result in the registration of a product being cancelled and the product taken off the market. The APVMA has the power to order compulsory product recalls and enforcement powers to ensure compliance with the requirements of the AgVet Code.
New Zealand
All veterinary medicines, agricultural chemicals and vertebrate toxic agents imported into New Zealand must be authorized under the Agricultural Compounds and Veterinary Medicines (the “ACVM”) Act and regulations. The New Zealand Ministry for Primary Industries maintains an ACVM Register of products that have been assessed to the ACVM Act registration information requirements and considered appropriate for registration. Conditions may be applied to such registration. The New Zealand Environmental Protection Authority (the “NZ EPA”) regulates the supply and use of hazardous substances. The NZ EPA operates various hazardous substances databases which can be searched to determine what controls have been placed on particular substances. Veterinary medicines that are hazardous substances require approval under the Hazardous Substances and New Organisms Act before they can be imported or manufactured in New Zealand. Animal nutritional and animal care products are covered by a group standard approval.
Rest of world
Country-specific laws have provisions that include requirements for licensing, regulatory approvals, certain labeling, safety, efficacy, and manufacturers’ quality control procedures (to assure the consistency of the products), as well as company records and reports. Many other countries’ regulatory agencies will generally refer to the FDA, the USDA, European Union, and other international animal-health entities, including the World Organization for Animal Health and the Codex Alimentarius Commission, in establishing standards and regulations for veterinary pharmaceuticals and vaccines.
Where You Can Find Important Information
Our principal executive offices are located at 7 Custom House Street, Portland, ME 04101, and our telephone number is (888) 280-2221. Our website is www.covetrus.com. We may disclose important information through one or more of the following channels: SEC filings, public conference calls and webcasts, press releases, and the social media channels identified on the Newsroom page of our website https://covetrus.com/news-room/.
13
Item 1A. | Risk Factors |
The following discussion describes the most significant risks and uncertainties that could adversely affect our business. If any of the events described below actually occur, our business, financial condition, results of operations and cash flows could be materially and adversely affected, and the trading price of our common stock could decline. Our business could also be affected by additional factors that are not presently known to us or that we currently consider not material. The reader should not consider this list to be a complete statement of all risks and uncertainties.
Risks Relating to Our Business
We may not successfully implement our business strategies.
We are pursuing, and will continue to pursue, strategic initiatives that management considers critical to our long-term success, including: leveraging the scale, reach and infrastructure of our supply chain network to accelerate the adoption of our Prescription Management platform; increasing sales to our Customers; driving category growth; developing advanced insight and analytics and software; and enhancing Customer and Animal Owners relationships. There are significant risks involved with the execution of these initiatives, including significant business, economic and competitive uncertainties, many of which are outside of our control. Accordingly, we cannot predict whether we will succeed in implementing these strategic initiatives. It could take several years to realize the anticipated benefits from these initiatives, if any benefits are achieved at all. Additionally, our business strategy may change from time to time, which could delay our ability to implement initiatives that we believe are important to our business.
Since Customers may be hesitant to migrate or integrate their critical business systems and procedures to those provided by us, the market and the sales cycle for our technology and services may develop more slowly than we expect.
Our success depends, in part, on the willingness of Customers to adopt new technology and services. Many veterinary practices have invested substantial effort and financial resources into the information systems and procedures that support their businesses and may be reluctant or unwilling to migrate or integrate these systems with online or cloud-based, on-demand services. Other factors that may affect market acceptance of our services include:
• | the security capabilities, reliability, and availability of on-demand services, |
• | concerns with entrusting a third party to maintain and manage data, especially confidential or sensitive data, |
• | our ability to minimize the time and resources required to implement our services, |
• | our ability to maintain high levels of Customer satisfaction, |
• | our ability to implement upgrades and other changes to our software without disrupting services we provide, |
• | the level of customization or configuration we offer, |
• | the ability to provide rapid response time during periods of intense activity on Customer websites, and |
• | the price, performance and availability of competing products and services. |
The market for these services may develop more slowly than we expect, which would have a material adverse effect on our business, financial condition, results of operations and cash flows.
The animal-health market is highly competitive, and we may not be able to compete effectively.
The animal-health market is highly competitive and rapidly changing, and we expect competition to intensify in the future. Our competitors include the animal-health businesses of large pharmaceutical or distribution companies, specialty animal-health businesses, animal-health focused businesses, practice management service providers, and Internet-based businesses, such as Chewy, Inc. and PetMed Express, Inc., also known as 1-800-PetMeds, and may, in the future, include new market entrants. Some of our competitors have access to greater financial, marketing, technical, and other resources than us that could allow them to compete more effectively.
If any of our competitors are more successful with respect to any key competitive factor such as technological advances or newer low-cost business models with the ability to operate at higher gross margins, our sales and profitability could be adversely affected. Additional competitive pressure could arise from, among other things, limited demand growth or a significant number of additional competitive products or services being introduced into a particular market, price reductions by competitors, or the ability of competitors to capitalize on their economies of scale.
14
Changes in manufacturer sales channels for companion animal products could negatively impact our market share, margins, and distribution of our products.
In most markets, companion animal owners typically purchase their animal-health products directly from veterinarians. Companion animal owners increasingly have the option to purchase animal-health products from sources other than veterinarians, such as online retailers, “big-box” retail stores or other over-the-counter distribution channels. This trend has been demonstrated, for example, by the significant shift away from the veterinarian distribution channel in the sale of flea and tick products in recent years. Companion animal owners also could decrease their reliance on, and visits to, veterinarians as they rely more on online animal-health information and retailers that now offer basic veterinary services. Because we market our companion animal prescription products through the veterinarian channel, both in-office and through our online platform, any decrease in reliance on and visits to veterinarians by companion animal owners could reduce our market share for such products and have a material adverse effect on our business. In addition, companion animal owners may substitute human health products for animal-health products if human health products are deemed to be lower-cost alternatives.
Because substantially all the products that we distribute and sell are not manufactured by us, we are dependent on third parties for the manufacture and supply of substantially all our products.
We obtain substantially all our products from third parties. Generally, we do not have long-term contracts with our suppliers committing them to supply products to us. Therefore, suppliers may not provide the products we need in the quantities we request or at all. Additionally, certain key suppliers, in the aggregate, supply a significant portion of the products we sell. In addition, we currently purchase many products and materials from single sources. Some of the products that we purchase from these sources are proprietary and, therefore, cannot be readily or easily replaced by alternative sources. These products include branded and patented products from major pharmaceutical manufacturers, including Boehringer Ingelheim International GmbH, Elanco Animal Health Incorporated, Merck & Co., Inc., Vedco, Inc., and Zoetis, Inc., among others. These five suppliers accounted for approximately 50% of our purchases for the year ended December 31, 2019. If we are unable to obtain adequate quantities of products in the future from single-source suppliers, we may be unable to supply the market, which could have a material adverse effect on our results of operations.
Additionally, because we generally do not control the actual production of the products we sell, we may be subject to delays caused by interruption in production based on conditions outside of our control, including interruption due to physical loss of the manufacturers' or their suppliers facilities and the manufacturers’ failure to comply with applicable government requirements. The failure of manufacturers of products regulated by the FDA, the DEA, or other governmental agencies to meet these requirements could result in product recall, cessation of sales or other market disruptions. If any of our third-party suppliers were to become unable or unwilling to continue to provide the products in our required volumes, we would need to identify and obtain acceptable replacement sources on a timely basis. There is no guarantee that we would be able to obtain such alternative sources of supply on a timely basis, if at all. An extended interruption in the supply of our products, especially any high-sales volume product, could have a material adverse effect on our business, financial condition, results of operations and cash flows.
Our substantial indebtedness could adversely affect our financial condition and impair our ability to operate our business. We may incur substantial additional indebtedness, which could further exacerbate the risks to our financial condition.
On February 7, 2019, we entered into a $1.5 billion syndicated credit agreement with a group of lenders for a five-year term (the “Credit Facilities”). The Credit Facilities include a $1.2 billion term loan facility, (the “Term Loan Facility”), which was fully funded and primarily used to pay a dividend to Henry Schein, and a $300 million revolving line of credit for working capital and general corporate purposes (the “Revolving Credit Facility”). As of December 31, 2019, there was $1.2 billion outstanding under the Term Loan Facility and there were no borrowings from the Revolving Credit Facility, although we do utilize the Revolving Credit Facility from time to time.
We may incur significant additional indebtedness in the future, including secured indebtedness. Although the agreements governing our Credit Facilities contain restrictions on the incurrence of additional indebtedness, these restrictions are subject to a number of qualifications and exceptions, and the additional indebtedness incurred in compliance with these restrictions could be substantial.
Our current level of indebtedness, and any additional indebtedness, could have a material adverse effect on our business, financial condition, results of operations and cash flows, including the following:
• | limiting our ability to obtain additional debt or equity financing for working capital, capital expenditures, debt service requirements, acquisitions and general corporate or other purposes, |
15
• | requiring that a substantial portion of our cash flows from operations be dedicated to payments on our indebtedness instead of other purposes, including working capital, capital expenditures and future business opportunities, |
• | making it more difficult for us to make payments on our indebtedness or satisfy other obligations, |
• | limiting our ability to make the expenditures necessary to transform our business, |
• | limiting our ability to adjust to changing market conditions and placing us at a competitive disadvantage compared to our competitors that have less debt, and |
• | increasing our vulnerability to a downturn in general economic conditions or in our business and making us unable to carry out capital spending that is important to our growth. |
The agreements governing our Credit Facilities contain restrictive covenants, which restrict our operational flexibility.
The agreements governing our Credit Facilities contain restrictions and limitations on our ability to engage in activities that may be in our long-term best interests, including financial and other restrictive covenants that will limit our ability to:
• | incur additional indebtedness, |
• | make dividends and other restricted payments, |
• | incur additional liens, |
• | consolidate, merge, sell, or otherwise dispose of all or substantially all assets, |
• | make investments, |
• | transfer or sell assets, |
• | enter into restrictive agreements, |
• | change the nature of the business, and |
• | enter certain transactions with affiliates. |
The agreements governing our Credit Facilities also contain other restrictions customary for facilities of this nature.
Our ability to borrow additional amounts under these agreements will depend on satisfaction of these covenants, as well as financial covenants (i) consolidated net total leverage ratio and (ii) consolidated net interest coverage ratio. Events beyond our control could affect our ability to meet these covenants. Our failure to comply with obligations under these agreements may result in an event of default under those agreements. A default, if not cured or waived, may permit acceleration of our indebtedness. If our indebtedness is accelerated, we cannot be certain that we will have sufficient funds available to pay the accelerated indebtedness or that we will have the ability to refinance the accelerated indebtedness on terms favorable to us or at all. This could have a material adverse effect on our business, financial condition, results of operations and cash flows and could cause us to become bankrupt or insolvent.
We will require a significant amount of cash to service our indebtedness. Our ability to generate cash depends on many factors, some beyond our control.
Our ability to make payments on and to refinance our indebtedness, and to fund capital expenditures, will depend on our ability to generate cash. This, to a certain extent, is subject to economic, financial, competitive, legislative, regulatory, and other factors that are beyond our control. We have substantial indebtedness, and may incur additional indebtedness, which could lead to increased interest expense and could increase the amount of cash flows required to fund interest expense associated with our indebtedness. In addition, certain obligations under the Credit Facilities bear interest at variable interest rates. As of December 31, 2019, we maintained interest rate swap contracts with notional amounts aggregating $500 million, which are intended to fix the future interest payments associated with our $1.2 billion variable-rate Term Loan Facility. These swap agreements expire July 31, 2021. Despite these derivative contracts, interest rate increases still could result in larger debt service requirements. Such an increase in our debt service obligations would adversely affect our cash flows. In addition, we may not be able to take advantage of interest rate decreases where we have fixed rates utilizing swap agreements. We cannot guarantee that our business will generate sufficient cash flows from operations or that future borrowings will be available to us under our Credit Facilities or any subsequent credit agreement, or that we can obtain alternative financing proceeds in an amount sufficient to enable us to pay our indebtedness or to fund our other liquidity needs. We may need to refinance all or a portion of our indebtedness at or before maturity. We cannot assure you that we will be able to refinance any of our indebtedness on commercially reasonable terms or at all.
The debt service obligations under our Credit Facilities could also reduce funds available for working capital, capital expenditures and other general corporate purposes and may create competitive disadvantages relative to other companies with lower debt levels.
16
We may require financing to fund our ongoing operations and capital expenditures, the availability of which is highly uncertain.
The capital and credit markets can experience volatility and disruption. Such markets can exert extreme downward pressure on stock prices and upward pressure on the cost of new debt capital and can severely restrict credit availability for most issuers. Our business will require expenditures to develop enhancements to our platforms, expand capacity, and add new businesses complementary to our product lines. In the future we may engage in transactions that depend on our ability to obtain financing. We may also seek financing to fund our ongoing operations.
Depending on conditions in the financial markets and/or our financial performance, we may not be able to raise additional capital on favorable terms, or at all. If we are unable to pursue our current and future spending programs, we may be forced to cancel or scale back those programs. Failure to successfully pursue our capital expenditure and other spending plans could negatively affect our ability to compete effectively and have a material negative effect on our business and results of operations.
Many of our Customers and Animal Owners are price sensitive, and if the prices for our products and services are unacceptable to them, it could have a material adverse effect on our business, financial condition, results of operations and cash flows.
Many of our Customers and Animal Owners are price sensitive. As the market for our services matures, or as new competitors introduce new products or services that compete with us, we may be unable to retain our existing Customers or attract new customers based on the same price pricing model as previously used. As a result, it is possible that competitive dynamics in our market may require us to change our pricing model or reduce our prices, which could have a material adverse effect on our business, financial condition, results of operations and cash flows.
We may lose Customers and have difficulty attracting new customers if we have defects, disruptions, or poor service in our technology product offerings.
Because we deliver online and cloud-based applications as a service, errors or defects in the software applications underlying the service, or a failure of our hosting infrastructure, may render the service unavailable to Customers. Since our Customers will use our platform to manage critical aspects of their businesses, any errors, defects, disruptions in service or other performance problems with the platform, whether in connection with the day-to-day operation of the platform, upgrades or otherwise, could damage the Customers’ businesses. If we experience any errors, defects, disruptions in service or other performance problems with our online and cloud-based services, Customers could delay or withhold payment or stop doing business with us, and our business, results of operations and reputation could be harmed.
Consolidation of our customers and distributors could negatively affect the pricing of our products.
Veterinarians are our primary customers. In recent years, there has been a trend towards the concentration of veterinarians in large clinics and hospitals. In addition, our distributors have seen consolidation in their industries. Furthermore, we have seen the expansion of corporate customers, including larger cross-border ones, and an increase in the consolidation of buying groups (cooperatives of veterinary practices that leverage volume to pursue discounts from manufacturers). The pace of consolidation and structure of markets varies greatly across geographies. If these trends towards consolidation continue, these customers and distributors could attempt to improve their profitability by leveraging their buying power to obtain favorable pricing. The resulting decrease in our prices could have a material adverse effect on our operating results and financial condition.
If our information systems (or third-party systems we rely on) are interrupted, damaged by unforeseen events, are subject to cyberattacks or fail for any extended period of time or unauthorized access is obtained to a Customer’s or their Client’s data, we may incur significant liabilities, our service may be perceived as not being secure, Customers may curtail or stop using our products or services and our results of operations could be materially adversely affected.
The services we offer involve the maintenance of our Customers’ and Animal Owners sensitive information. In addition, we rely on information systems (“IS”) in our business to obtain, rapidly process, analyze, manage, and store data to, among other things:
• | maintain and manage systems to facilitate the purchase and distribution of thousands of inventory items from numerous distribution centers, |
• | receive, process and ship orders on a timely basis, |
• | manage the accurate billing and collections for thousands of Customers, and |
• | process payments to suppliers. |
17
Information security risks have generally increased in recent years, and a third-party action, employee error, malfeasance or other event that bypasses our IS security systems causing an IS security breach may lead to a material disruption of our IS business systems and/or the loss of business, customer or client information resulting in a material adverse effect on our business. Because techniques used to obtain unauthorized access to, or to sabotage, IS security systems change frequently and generally are not recognized until launched against a target, we may be unable to anticipate these techniques or to implement adequate preventive measures.
In addition, we develop products and provide services to our Customers that are technology-based, and a cyberattack that bypasses the IS security systems of our products or services causing a security breach and/or perceived security vulnerabilities in our products or services could also cause significant reputational harm, and actual or perceived vulnerabilities may lead to claims against us by our Customers, their clients and/or governmental agencies. Perceived or actual security vulnerabilities in our products or services, or the perceived or actual failure by us or our Customers who use our products to comply with applicable legal requirements, may not only cause us significant reputational harm, but may also lead to claims against us by our Customers, their clients and/or governmental agencies and involve fines and penalties, costs for remediation, and substantial defense and settlement expenses.
Additionally, changes in the legislative or regulatory action related to cybersecurity may increase our costs to develop or implement new technology-based products and services. In addition, changes in the regulatory environment could increase our compliance related costs.
Risks associated with these and other actual or perceived IS security breaches may include, among other things:
• | the theft, destruction, loss, misappropriation or release of confidential data or intellectual property, |
• | operational or business delays resulting from the disruption of information systems and subsequent clean-up and mitigation activities, |
• | the need to continually evolve procedures and safeguards to meet new IS challenges, and enhancing protections, and conducting investigations and remediation, may impose additional costs on us, |
• | claims, fines and penalties, and costs for remediation, or substantial defense and settlement expenses, and |
• | negative publicity resulting in reputation or brand damage with our Customers or Animal Owners, suppliers or industry peers or the loss of sales or Customers. |
We store, process and use information collected from or about our Customers and Animal Owners that subjects us to legislative and regulatory burdens and may expose us to liability and/or potential objections from such Customers and Animal Owners, and our actual or perceived failure to adequately protect or appropriately use data could harm our brand, our reputation in the marketplace and our business.
Because we collect, store, process and use data, some of which contain personal information, we are subject to complex and evolving laws and regulations relating to privacy, data protection and other matters related to personal information. Failure to abide by these laws, regulations and standards could expose us to breach of contract claims, investigations, substantial fines, penalties and other liabilities and expenses, costs for remediation and harm to our reputation. Our Customers and Animal Owners may also object to or opt out of the collection and use of their data, which may harm our business.
Certain states in which we operate, including California, and countries outside of the United States have adopted or may in the future adopt new regulations governing handling, storage, use and protection of personal information. The California Consumer Privacy Act (“CCPA”) is a state statute intended to enhance privacy rights and consumer protection for residents of California, U.S. Both in the United States and abroad, these laws and regulations continue to evolve and remain subject to significant change. In addition, the application and interpretation of these laws and regulations are often uncertain. If we fail to comply with such laws and regulations, we could be required to make significant changes to our products or services, or incur substantial fines, penalties, or other liabilities. For example, if legislation or regulations are adopted, interpreted or implemented in a manner that is inconsistent with our current business practices and that require changes to these practices, the design of our products and services or privacy practices, it could have a material adverse effect on our business, financial condition, results of operations and cash flows. The costs of compliance with, and the other burdens imposed by, new or existing laws or regulatory actions may prevent us from selling our products or services, or increase the costs of doing so, and may affect our ability to invest in or develop products or services. In addition, a determination by a court or government agency that any of our practices do not meet these standards could result in liability or negative publicity and could have a material adverse effect on our business, financial condition, results of operations and cash flows.
18
In addition, the European Parliament and the Council of the European Union have adopted the EU General Data Protection Regulation (“GDPR”) effective from May 25, 2018, which increases privacy rights for individuals in Europe, extends the scope or responsibilities for data controllers and data processors and imposes increased requirements and potential penalties on companies offering goods or services to individuals who are located in Europe, or Data Subjects, or monitoring the behavior of such individuals (including by companies based outside of Europe). Noncompliance can result in penalties of up to the greater of EUR 20 million, or 4% of total company revenues. Individual member states may impose additional requirements and penalties as they relate to certain things such as employee personal data. Among other things, the GDPR requires, with respect to personal data concerning Data Subjects, company accountability, consents from Data Subjects or other acceptable legal basis needed to process the personal data, prompt breach notifications within 72 hours, fairness and transparency in how the personal data is stored, used or otherwise processed, and data integrity and security, and provides rights to Data Subjects relating to modification, erasure and transporting of the personal data. Our efforts to implement programs and controls that comply with the GDPR are likely to impose additional costs on us, and we cannot predict whether the interpretations of the requirements, or changes in our products or services in response to new requirements or interpretations of the requirements, will be accepted as compliant by applicable regulatory authorities.
Successful claims for misappropriation or release of confidential or personal data brought against us or fines or other penalties assessed or any claim that results in significant adverse publicity against us could have a material adverse effect on our business and reputation.
We may launch branding or rebranding initiatives that may involve substantial costs and may not be favorably received by Customers.
We now operate under the name “Covetrus, Inc.” In connection with this name change, we have incurred substantial costs, and may in the future incur substantial additional costs, in rebranding our products and services, and we may not be able to achieve or maintain brand name recognition or status under the new brand that is comparable to the recognition and status previously enjoyed by the Animal Health Business and Vets First Choice separately. The failure of any such rebranding initiative could adversely affect our ability to attract and retain customers, which could cause us not to realize some or all the benefits contemplated by us to result from our acquisition of Vets First Choice in an all-stock transaction ("Merger").
Many of our Customers are small and medium-sized businesses, which can be challenging to cost-effectively reach, acquire, and retain.
We market and sell many of our services to veterinary practices and clinics, which are typically small or medium-sized business (“SMBs”). To grow our business, we must develop new customers, sell additional services to existing Customers, and encourage existing Customers to remain on our platform. However, selling to and retaining SMBs can be more difficult than selling to and retaining large enterprises because SMB customers:
• | are more price sensitive, |
• | are more difficult to reach with broad marketing campaigns, and |
• | often require higher sales, marketing and support expenditures by vendors that sell to them per revenue dollar generated for those vendors. |
If we are unable to cost-effectively market and sell our services to our target customers, our ability to grow our business will be harmed.
Our business is subject to risk based on global economic conditions.
Macroeconomic, business, and financial disruptions could have a material adverse effect on our business, financial condition, results of operations and cash flows. Certain of our Customers, Animal Owners and our suppliers could be affected directly by an economic downturn and could face credit issues or cash flow problems that could give rise to payment delays, increased credit risk, bankruptcies and other financial hardships that could decrease the demand for our products or hinder our ability to collect amounts due from Customers. If one or more of our large Customers discontinue their relationship with us because of economic conditions or otherwise, our operating results and financial condition may be materially adversely affected. Furthermore, our exposure to credit and collectability risk is higher in certain international markets and our ability to mitigate such risks may be limited. While we have procedures to monitor and limit exposure to credit and collectability risk, there can be no assurances such procedures will effectively limit such risk and avoid losses. In addition, since Animal Owners typically utilize discretionary income to purchase services or products for their pets, economic concerns may cause some Animal Owners to forgo or defer visits to veterinary practices or could reduce their willingness to treat pet health conditions or even to continue to own a pet.
19
A significant portion of our operations is conducted in foreign jurisdictions and is subject to the economic, political, legal, regulatory, and business environments of the countries in which we do business. Risks associated with such international operations could negatively affect our business, financial condition, results of operations and cash flows.
We have significant operations outside of the United States. We expect that we will continue to expand our international operations in the future. International operations inherently subject us to several risks and uncertainties, including:
• | compliance with governmental controls, trade restrictions, restrictions on direct investments, quotas, embargoes, import and export restrictions, tariffs, duties, and regulatory and licensing requirements by domestic or foreign entities, including restrictions administered by the Office of Foreign Assets Control of the U.S. Department of the Treasury, the U.K. Office of Financial Sanctions Implementation, United Nations Security Council, and Australia's Department of Foreign Affairs and Trade, |
• | difficulties in building, staffing, and managing foreign operations (including a geographically dispersed workforce) and maintaining compliance with foreign labor laws, |
• | burdens to comply with, and different levels of protection offered by, multiple and potentially conflicting foreign laws and regulations, including those relating to environmental, health and safety requirements and intellectual property, |
• | changes in laws, regulations, government controls or enforcement practices with respect to our business and the businesses of our Customers, |
• | political and social instability, including crime, civil disturbance, terrorist activities, armed conflicts, outbreak of disease, and natural and other disasters, |
• | ongoing instability or changes in a country’s or region’s regulatory, economic, or political conditions, including as a result of the United Kingdom’s leaving the European Union, or Brexit, and any other similar referenda or actions by other European Union member countries, |
• | local business and cultural factors that differ from our normal standards and practices, including business practices prohibited by the U.S. Foreign Corrupt Practices Act, U.K. Bribery Act, and other anti-corruption laws and regulations, |
• | longer payment cycles and increased exposure to counterparty risk, |
• | disruptions in transportation of our products or our supply chain, and |
• | the differing product and service needs of foreign Customers. |
The multinational nature of our business subjects us to potential risks that various taxing authorities may challenge the pricing of our cross-border arrangements and subject us to additional tax, adversely impacting our effective tax rate and our tax liability. In addition, international transactions may involve increased financial and legal risks due to differing legal systems and customs. Compliance with these requirements may prohibit the import or export of certain products and technologies or may require us to obtain a license before importing or exporting certain products or technology. A failure to comply with any of these laws, regulations or requirements could result in civil or criminal legal proceedings, monetary or non-monetary penalties, or both, disruptions to our business, limitations on our ability to import and export products and services, and damage to our reputation. While the impact of these factors is difficult to predict, any of them could have a material adverse effect on our business, financial condition, results of operations and cash flows. Changes in any of these laws, regulations or requirements, or the political environment in a particular country, may affect our ability to engage in business transactions in certain markets, including investment, procurement, and repatriation of earnings.
Brexit may have a negative effect on our business.
The uncertainty regarding new or modified arrangements between the United Kingdom and other countries following Brexit may have a material adverse effect on the movement of products between the United Kingdom and members of the European Union and the United States, including the interruption of or delays in imports into the United Kingdom of products originating within the European Union and exports from the United Kingdom of products originating there. Such a situation could have an adverse effect on our business.
Our business is exposed to domestic and foreign currency fluctuations that could have a material adverse effect on our business, financial condition, results of operations and cash flows.
Approximately 47% of our net sales for our business in fiscal 2019 was to Customers outside the United States. Changes in non-U.S. currencies relative to the U.S. dollar impact our sales, profits, assets, and liabilities. In addition, the weakening or strengthening of the U.S. dollar may result in significant favorable or unfavorable translation effects when the operating results of our non-U.S. business activity are translated into U.S. dollars and could cause our results of operations to differ from our expectations and the expectations of our investors. For our international sales denominated in U.S. dollars, an increase in the
20
value of the U.S. dollar relative to foreign currencies could make our products and services less competitive in international markets. Alternately, a weakening of the currencies in which sales are generated relative to the currencies in which costs are denominated would decrease operating profits and cash flow. Changes in currency exchange rates may also affect the relative prices at which we purchase materials and services in foreign markets. In addition, the impact of currency devaluations in countries experiencing high inflation rates or significant currency exchange fluctuations could negatively impact our operating results. While we may use financial instruments to mitigate the impact of fluctuations in currency exchange rates on our cash flows, unhedged exposures would continue to be subject to currency fluctuations.
The future growth of our business depends in significant part on increasing our international sales. Our recent and continuing international expansion efforts subject us to additional risks.
Net sales outside of the U.S. represented approximately 48% of our total Net sales in 2017, 49% in 2018, and 47% in 2019. Our international expansion efforts may be slow or unsuccessful to the extent we experience difficulties in recruiting, training, managing and retaining qualified personnel with international experience, language skills and cultural competencies in the geographic markets we target, which could negatively impact our bookings and operating results. Conducting and expanding international operations subjects us to risks we generally do not face in the U.S., including:
• | management, communication, and integration problems resulting from language barriers, cultural differences and geographic dispersion of our customers and personnel, |
• | language translation of, and associated Customer Care support for, our products, |
• | compliance with foreign laws, including laws regarding online disclaimers, advertising, liability of online service providers for activities of customers especially with respect to hosted content, and more stringent laws in foreign jurisdictions relating to consumer privacy and protection of data collected from individuals and other third parties, |
• | accreditation and other regulatory requirements to do business and to provide domain name registration, web-hosting and other products in foreign jurisdictions, |
• | greater difficulty in enforcing contracts, including our universal terms of service and other agreements, |
• | increased expenses incurred in establishing and maintaining office space and equipment for our international operations, |
• | greater costs and expenses associated with international marketing and operations, |
• | greater risk of unexpected changes in regulatory practices, tariffs, trade disputes and tax laws and treaties, |
• | different or lesser degrees of protection for our or our customers' intellectual property and free speech rights in certain markets, |
• | increased exposure to foreign currency risks, |
• | increased risk of a failure of employees to comply with both U.S. and foreign laws, including export and antitrust regulations, anti-bribery regulations and any trade regulations ensuring fair trade practices, |
• | heightened risk of unfair or corrupt business practices in certain geographies, and |
• | the potential for political, social, or economic unrest, terrorism, hostilities or war, and multiple and possibly overlapping tax regimes. |
The Coronavirus could materially adversely affect our results
The Novel Coronavirus Disease 2019 (COVID-19) (“Coronavirus”) is impacting worldwide economic activity, and activity in China in particular. Estimates for Chinese gross domestic product and economic growth have been reduced as a result of the Coronavirus. In addition, with the spread of the Coronavirus to other countries, it is unclear how economic activity might be impacted on a worldwide basis. We also might be unable to obtain products from our suppliers due to the competing demand for such products created by the virus, and by the potential constraints on the movement of goods. The impact of the virus on Chinese and other economic activity, and its effect on the global supply chain are uncertain at this time and could have a material adverse effect on our results.
Our business is subject to substantial regulation.
Our pharmacy and supply chain businesses are impacted by federal and state laws and regulations governing, among other things: the purchase, distribution, management, compounding, dispensing, marketing and labeling of prescription drugs and related services; DEA and/or state regulation affecting the sale and distribution of controlled substances; and statutes and regulations related to the sale and marketing of animal drugs, pet food, insecticides and devices. Our failure to comply with any of these laws and regulations could severely limit or curtail our pharmacy and supply chain operations, which would materially harm our business and prospects. Further, our business could be affected by changes in these or any newly enacted laws and regulations, as well as federal and state agency interpretations of such statutes and regulations. Such statutory or regulatory changes could
21
require that we make changes to our business model and operations and/or could require that we incur significantly increased costs to comply with such regulations.
The status of compounded animal drugs is uncertain. The FDA issued proposed guidance titled Guidance for Industry #256: Compounding Animal Drugs from Bulk Drug Substances (“GFI #256”) on November 18, 2019. The comment period for this proposed guidance will end on June 21, 2020. If adopted, GFI #256 would strictly limit the circumstances under which the FDA would permit compounding of veterinary drug products. It is uncertain whether GFI #256 will be adopted in the form proposed, or at all. The proposed guidance is similar to guidance proposed by the FDA in 2015 and ultimately withdrawn in November 2017. These and other restrictions that may be imposed on the activities of compounding pharmacies may limit the available market for compounded formulations from bulk substances for animal use, as compared to the market available for the FDA-approved animal drugs.
The marketing and sale of compounded formulations is subject to and must comply with state statutes and regulations governing compounding pharmacies. These statutes and regulations include, among other things, restrictions on compounding in advance of receiving an animal-specific prescription, restrictions on compounding drugs that are essentially copies of FDA-approved drugs, restrictions on compounding drug products for office use, and restrictions on wholesaling. These and other restrictions on the activities of compounding pharmacies may significantly limit the market available for compounded formulations, as compared to the market available for FDA-approved drugs.
Legislation may be proposed in the United States or other jurisdictions in the future that could impact the distribution channels for our companion animal products. For example, such legislation may require veterinarians to provide Animal Owners with written prescriptions and disclosure that the Animal Owner may fill prescriptions through a third party, which may further reduce the number of Animal Owners who purchase their animal-health products directly from veterinarians. Such requirements may lead to increased use of generic alternatives to our products or the increased substitution of our products with other animal-health products or human health products if such other products are deemed to be lower-cost alternatives. Any of these events could have a material adverse effect on our business, financial condition, results of operations and cash flows.
The sale and distribution of our products is also regulated in most or all jurisdictions outside the United States where our business operates. Local regulations on sale and distribution may be tightened, for example regarding labeling, quality, or transportation, which may increase our costs of doing business. In the European Union, a revision of the current legislation on veterinary medicinal products is under way, establishing a new EU regulation on veterinary medicinal products will become effective January 28, 2022 throughout the European Union and will limit the use of antibiotics, tighten importation rules, and impose stricter pharmacovigilance standards. This regulation must still be implemented at the member state level and as such, additional requirements may be adopted by individual member states which would have the effect of increasing the compliance requirements for our business in the European Union with resulting costs.
If a compounded drug formulation provided through our compounding pharmacy services leads to injury or death or results in a product recall, we may be exposed to liabilities or reputational harm.
The success of our compounding pharmacy services is dependent on perceptions of us and the safety and quality of our products and services. We could be adversely affected if we or any other compounding pharmacies or our formulations and technologies are subject to negative publicity. We could also be adversely affected if any of our formulations or technologies, any similar products sold by other companies, or any products sold by other veterinary compounding pharmacies prove to be, or are asserted to be, harmful. For instance, to the extent any of the components of approved drugs or other ingredients used to produce our compounded formulations have quality or other problems that adversely affect the finished compounded preparations, our business could be adversely affected. Also, because of our dependence on veterinarian and client perceptions, any adverse publicity associated with illness or other adverse effects resulting from the use or misuse of our products, any similar products sold by other companies or any products sold by veterinary compounding pharmacies could have a material adverse effect on our business, financial condition, results of operations and cash flows.
Assertions by a third party that we are infringing its intellectual property, whether successful or not, could subject us to costly and time-consuming litigation or expensive licenses.
The software and technology industries are characterized by the existence of many patents, copyrights, trademarks, and trade secrets and by frequent litigation based on allegations of infringement or other violations of intellectual property rights. The preparation or sale of our products may infringe on the patent rights of others. As we face increasing competition, the possibility of intellectual property rights claims against us may grow. Our technology may not be able to withstand any third-party claims or rights against their use. Additionally, although we have licensed from other party's proprietary technology covered by patents, it
22
cannot be certain that any such patents will not be challenged, invalidated, or circumvented. These types of claims could harm our relationships with our Customers, may deter future Customers from using our services or could expose us to litigation for such claims.
Any intellectual property rights claim against us, with or without merit, could be time-consuming, expensive to litigate or settle and could divert management attention and financial resources. An adverse determination also could prevent us from offering our services to Customers and may require the procurement or development of substitute services that do not infringe. As a result of intellectual property rights claims against us, we may have to pay damages or stop using technology or formulation found to be in violation of a third party’s rights. We may have to seek a license for the intellectual property, which may not be available on reasonable terms, if at all, and may significantly increase our operating expenses or may require us to restrict our business activities in one or more respects. As a result, we may also be required to develop alternative non-infringing technology, which could require significant effort and expense.
In addition, we use open source software in our platform and will use open source software in the future. From time to time, we may face claims from companies that incorporate open source software into their products, claiming ownership of, or demanding release of, the source code, the open source software, or derivative works that were developed using such software, or otherwise seeking to enforce the terms of the applicable open source license. These claims could also result in litigation, require us to purchase a costly license or require us to devote additional product, technology, and development resources to change our platform or services, any of which would have a material adverse effect on our business, financial condition, results of operations and cash flows.
Turnover of key personnel, including executive officers, could disrupt our operations and our inability to attract and retain qualified personnel could harm our business.
Our success depends on the efforts of our executive officers and certain key personnel. Any unplanned turnover or our failure to develop an adequate succession plan for one or more of our executive officers or other key positions could deplete our institutional knowledge base and erode our competitive advantage. The loss or limited availability of the services of one or more of our executive officers or other key personnel, or our inability to recruit and retain qualified executive officers or other key personnel in the future, could, at least temporarily, have a material adverse effect on our business, financial condition, results of operations and cash flows. Our future success also depends on our ability to attract, retain, and motivate talented technical, managerial, sales, marketing, and service and support personnel. Competition for sales, marketing, and technology development personnel is particularly intense in the software and technology industries. As a result, we may be unable to successfully attract or retain qualified personnel, which could have a material adverse effect on our business, financial condition, results of operations and cash flows.
In September 2019, David Shaw resigned as Chairman of our Board of Directors and Benjamin Wolin was appointed as Chairman of our Board of Directors; in October 2019, Benjamin Shaw resigned as our Chief Executive Officer and President, Mr. Wolin resigned as Chairman of our Board of Directors and was appointed Acting Chief Executive Officer and President, and Philip Laskawy was appointed Chairman of our Board of Directors; in December 2019, Christine Komola resigned as our Chief Financial Officer and Stuart Gleichenhaus was appointed as our Interim Chief Financial Officer; and on March 3, 2020, Mr. Wolin was appointed as our Chief Executive Officer and President. We may face risks related to these and other transitions in our leadership team.
Tax legislation could materially adversely affect our financial results.
We are subject to the tax laws and regulations of the United States federal, state, and local governments, as well as foreign jurisdictions. From time to time, various legislative initiatives may be proposed that could materially adversely affect our tax positions. There can be no assurance that our effective tax rate will not be materially adversely affected by legislation resulting from these initiatives.
On December 22, 2017, the U.S. Tax Cuts and Jobs Act of 2017 was enacted in the United States, which among other things, reduced the corporate tax rate from a top marginal rate of 35% to a flat rate of 21% and limited the ability to deduct net interest expense to 30% of adjusted earnings, in addition to making other significant changes to corporate and international tax provisions. Notwithstanding the reduction in the corporate income tax rate, the overall impact of the new federal tax law is uncertain and our business and financial condition could be materially adversely affected. In addition, it is uncertain how various states will respond to the newly enacted federal tax law.
23
Risks Relating to the Transactions
We may not realize the anticipated revenue growth opportunities and operational synergies from the Transactions.
The benefits that we expect to achieve because of the Transactions will depend, in part, on our ability to realize anticipated revenue growth opportunities and operational synergies. Our success in realizing these revenue growth opportunities and operational synergies, and the timing of their realization, depends on the successful integration of the Animal Health Business and the business of Vets First Choice. Even if we can integrate the businesses successfully, this integration may not result in the realization of the revenue growth and operational synergies that we currently expect within the anticipated time frame or at all. For example, we may not be able to accelerate the adoption of the Vets First Choice platform by the Animal Health Business’ customers. Moreover, we may incur substantial expenses in connection with the integration of the two businesses. Such expenses are difficult to estimate accurately and may exceed current estimates. Accordingly, the benefits from the Transactions may be offset by costs or delays incurred in integrating the businesses.
The on-going integration of the Animal Health Business and Vets First Choice presents significant challenges that may lead to unforeseen business interruptions or substantial costs.
There is a significant degree of difficulty and management distraction inherent in the process of integrating the Animal Health Business and the Vets First Choice business. These difficulties include, among others:
• | the challenge of integrating the businesses while carrying on the ongoing operations of each business, |
• | the challenge of integrating the cultures of each business, |
• | the challenge of integrating the information technology systems of each business, and |
• | the potential difficulty in attracting and retaining key employees and sales personnel of each business. |
The process of integrating operations could cause an interruption of, or loss of momentum in, the activities of one or more of the businesses and may require us to incur substantial costs. Members of our senior management may be required to devote considerable time and attention to this integration process, which will decrease the time and attention they will have to manage our operations, service existing Customers, attract new Customers and develop new products, services or strategies. If senior management is not able to effectively manage the integration process, or if any significant business activities are interrupted because of the integration process, our business could suffer. We cannot guarantee that we will successfully or cost-effectively integrate the Animal Health Business and Vets First Choice businesses. Failure to do so could have a material adverse effect on our business, financial condition, results of operations and cash flows.
We expect that we will incur significant costs associated with the Transactions that could affect our period-to-period operating results.
We anticipate that we will incur significant one-time non-recurring costs over the next several years as a result of the Transactions. We may not be able to quantify the exact amount of these costs or the period in which they will be incurred. Some of the factors affecting the costs associated with the Transactions include the resources required in integrating the Animal Health Business and the Vets First Choice businesses and the length of time during which transition services are provided to us by Henry Schein. The amount and timing of these charges, including those related to information technology infrastructure and systems integration and planning, could adversely affect our period-to-period operating results, which could result in a reduction in the market price of shares of our common stock. Moreover, delays in completing the integration may reduce the growth opportunities and operational synergies and other benefits expected from the Transactions and such reduction may be material.
We may be unable to access equivalent benefits and services that historically have been provided by Henry Schein to the Animal Health Business.
The Animal Health Business previously received benefits and services from Henry Schein and benefitted from Henry Schein’s financial strength and extensive business relationships. We no longer benefit from Henry Schein’s resources, other than pursuant to the Transition Services Agreement, dated as of February 7, 2019, by and between Henry Schein and Covetrus, or the Transition Services Agreement, while that agreement is in effect. While Henry Schein will provide certain services to us for a specified period of time under the Transition Services Agreement, those services are transitional in nature and it cannot be assured that we will be able to adequately replace all of the resources provided by Henry Schein to the Animal Health Business or replace them at the same cost. If we are not able to replace the resources provided by Henry Schein, are unable to replace them at the same cost or are delayed in replacing the resources historically provided by Henry Schein, there could be a material adverse effect on our business, financial condition, results of operations and cash flows.
24
We may be affected by significant restrictions imposed on us to avoid significant tax-related liabilities and related indemnification obligations.
The Tax Matters Agreement, dated as of January 7, 2019, by and among Henry Schein, Covetrus, Vets First Choice and the Vets First Choice Stockholders’ Representative (as it may be amended and/or restated from time to time), (the “Tax Matters Agreement”), generally prohibits us from taking certain actions that could cause the Distribution and the Merger to fail to qualify as tax-free transactions. For a two-year period following the date of the Distribution, we may not (among other limitations):
• | cease, or permit certain of our wholly-owned subsidiaries to cease, the active conduct of a business that was conducted immediately prior to the Distribution or from holding certain assets held at the time of the Distribution, |
• | dissolve, liquidate, take any action that is a liquidation for federal income tax purposes, merge or consolidate with any other person, or permit certain of our wholly-owned subsidiaries to do any of the foregoing, |
• | approve or allow an extraordinary contribution to us by our stockholders in exchange for stock, redeem or otherwise repurchase (directly or indirectly) any of our stock, or amend our certificate of incorporation or other organizational documents, or take any other action, if such amendment or other action would affect the relative voting rights of our capital stock or would be inconsistent with the representations and statements made by us and Henry Schein in connection with the Opinion of Cleary Gottlieb Steen & Hamilton LLP, to the effect that the contribution of the Animal Health Business, the Distribution and certain related transactions will qualify as tax free to Henry Schein and Henry Schein stockholders for U.S. federal income tax purposes (the “Spin-off Tax Opinion”), or |
• | enter into any transaction or series of transactions as a result of which one or more persons would acquire (directly or indirectly) an amount of stock of Covetrus (taking into account the stock of Covetrus acquired pursuant to the Merger and Share Sale (as defined below)) that would reasonably be expected to cause the failure of the tax-free status of the Distribution, the Merger and certain related transactions. |
In addition, we may not amend our certificate of incorporation or take any other action that would render ineffective the application of the Ownership Limitation (as defined below), and in certain circumstances this restriction may prevent us from taking certain actions even following the second anniversary of the Distribution. The Tax Matters Agreement also imposes additional obligations and restrictions on us related to the Ownership Limitation, including a requirement that we diligently enforce the provisions of the Ownership Limitation against any purported transfers in violation of its terms, and we may have an obligation to indemnify Henry Schein if we breach or otherwise fail to comply with these restrictions. Due to these and other restrictions and indemnification obligations under the Tax Matters Agreement, we may be limited in our ability to pursue strategic transactions, equity or convertible debt financings or other transactions that may otherwise be in our best interests. Also, our potential indemnity obligations to Henry Schein might discourage, delay, or prevent a change of control during this two-year period that our stockholders may consider favorable.
If the Distribution does not qualify as a tax-free spin-off under Section 355 of the Internal Revenue Code, including as a result of subsequent acquisitions of our stock, then we may have certain indemnification obligations which could have a material adverse effect on our business.
The Transactions were conditioned on Henry Schein’s and our receipt of the Spin-off Tax Opinion. The parties did not obtain a private letter ruling from the Internal Revenue Service (“IRS”) with respect to the Transactions, and instead intend to rely solely on the Spin-off Tax Opinion for comfort that the spin-off and certain related transactions qualify for tax-free treatment for U.S. federal income tax purposes under the U.S. Internal Revenue Code of 1986, as amended (the “Code”). The Spin-off Tax Opinion is based on, among other things, certain representations, and assumptions as to factual matters, as well as certain undertakings, made by us. The failure of any factual representation or assumption to be true, correct, and complete in all material respects, or any undertakings to be fully complied with, could affect the validity of the Spin-off Tax Opinion. An opinion of counsel represents counsel’s best legal judgment, is not binding on the IRS or the courts, and the IRS or the courts may not agree with the conclusions set forth in the Spin-off Tax Opinion. In addition, the Spin-off Tax Opinion was based on current law, and cannot be relied on if current law changes with retroactive effect.
If the Transactions do not qualify for their intended tax-free treatment, including as a result of our failure to comply with the restrictions in the Tax Matters Agreement or subsequent acquisitions of our stock, we may have an obligation under the Tax Matters Agreement to indemnify Henry Schein for the resulting tax liability (which may be significant). In the event we are required to indemnify Henry Schein for taxes incurred in connection with the Transactions, the indemnification obligation could have a material adverse effect on our business, financial condition, results of operations and cash flows.
25
Our amended and restated certificate of incorporation includes a share ownership limitation that, for a two-year period following the Distribution, may prevent certain transfers of our shares.
In order to minimize the likelihood that an acquisition of our capital stock by one or more persons (or coordinating groups of persons) after the Distribution could be part of a plan or series of related transactions that includes the Distribution, our amended and restated certificate of incorporation generally prohibits, for the two-year period following the Distribution, direct or indirect beneficial ownership (taking into account applicable ownership provisions of the Code) and any agreement, understanding, or substantial negotiations to acquire beneficial ownership, by any person or persons of more than 9.8% of our outstanding common stock (or any other class or series of outstanding stock) or, in the case of certain grandfathered holders of more than the requisite percentage of such stock held by such investor, or collectively, the Ownership Limitation. Any attempted transfer of our stock which, if effective, would result in a violation of the relevant Ownership Limitation will be null and void ab initio, and will cause the shares in excess of such Ownership Limitation (rounded up to the nearest whole share) to be automatically transferred to a trust for the exclusive benefit of one or more charitable beneficiaries, and the proposed transferee would not acquire any rights in the shares. A transfer for this purpose will include not only direct transfers, but also other direct and indirect changes in beneficial ownership. The trustee of the trust will receive all distributions on, and will exercise all voting rights in respect of, the shares in trust for the exclusive benefit of the charitable beneficiary. In addition, the trustee would be empowered to sell the shares in trust to a qualified person selected by the trustee, under procedures set out in our amended and restated certificate of incorporation, with all of the net profit being received by the trustee for the exclusive benefit of the charitable beneficiary. In the event that the shares-in-trust shall have been sold by the purported transferee in an open market transaction, such sale would be deemed to have been made on behalf of the trustee and all of the net profit, if any, from such sale shall be paid by the purported transferee to the trustee for the exclusive benefit of the charitable beneficiary. The purported transferee of the shares in trust would have no right to share in any profit that may be realized in respect of such shares.
Our Board has the power to waive the relevant Ownership Limitation for specific transfers after following procedures set out in our amended and restated certificate of incorporation. However, other than in respect of certain transfers that meet certain requirements described in our amended and restated certificate of incorporation, our Board is not obligated to grant a waiver. In addition, our ability to modify the relevant restrictions set forth in our amended and restated certificate of incorporation is limited by the Tax Matters Agreement.
The Ownership Limitation is intended to help preserve the tax-free treatment of the Distribution under Section 355 of the Code, but it is possible the restriction could depress the price of shares of our common stock, and, in certain circumstances while the Ownership Limitation is in effect, could inhibit proxy contests to change our Board or delay, defer or prevent a transaction or a change in control of us that might involve a premium price for holders of our common stock or that might otherwise be in the best interest of our stockholders.
Due to the Merger, our ability to use net operating losses to offset future taxable income may be restricted and these net operating losses could expire or otherwise be unavailable.
Due to the Merger, our ability to use net operating losses to offset future taxable income will be further restricted and these net operating losses (“NOLs”) could expire or otherwise be unavailable. In general, under Section 382 of the Code and corresponding provisions of state law, a corporation that undergoes an “ownership change” is subject to limitations on its ability to utilize its pre-change NOLs to offset future taxable income. For these purposes, an ownership change generally occurs where the aggregate stock ownership of one or more stockholders or groups of stockholders who owns at least 5% of a corporation’s stock increases its ownership by more than 50 percentage points over its lowest ownership percentage within a specified testing period. Prior to the Merger, some of Vets First Choice’s existing NOLs were subject to limitations. Following the Merger, Vets First Choice’s existing NOLs may be subject to further limitations and we may not be able to fully use these NOLs to offset future taxable income. In addition, if we undergo any subsequent ownership change, our ability to utilize NOLs could be further limited. There is also a risk that, due to regulatory changes or for other unforeseen reasons, existing NOLs could expire or otherwise be unavailable to offset future income tax liabilities.
Additionally, the Tax Act (as defined below) resulted in a reduction in the economic benefit of the NOLs and other deferred tax assets available to us. Under the Tax Act, U.S. federal NOLs generated after December 31, 2017 will not be subject to expiration.
26
Risks Relating to Our Common Stock
The market price of our common stock is likely to be highly volatile and subject to wide fluctuations, and you may be unable to resell your shares at or above the price at which you acquired them, or at all.
Prior to the Distribution date, there was no public market for our common stock. A limited market, commonly known as a “when-issued” trading market, for our common stock developed on February 4, 2019 and “regular-way” trading of our common stock (Nasdaq: CVET) began on February 8, 2019. The market price of our common stock is likely to be highly volatile and could be subject to wide fluctuations in response to many factors that are beyond our control, including, but not limited to:
• | quarterly variations in our revenues and operating expenses, |
• | developments in the financial markets and worldwide or regional economies, |
• | announcements of innovations or new products or services by us or our competitors, |
• | announcements by the government relating to regulations that govern our industry, |
• | significant sales of our common stock or other securities in the open market, |
• | variations in interest rates, |
• | changes in the market valuations of other comparable companies, and |
• | changes in accounting principles. |
If securities or industry analysts publish unfavorable research about us or cease to provide coverage of us, our stock price and trading volume could decline.
The trading market for our common stock will depend in part on the research reports that securities or industry analysts publish about us and our business. If one or more of the securities and industry analysts who cover our stock downgrades the stock or publishes unfavorable research about us, the stock price would likely decline. If one or more of these analysts ceases coverage of us or fails to publish reports on us regularly, demand for our stock could decrease, which could cause the stock price or trading volume to decline.
Fluctuations in our quarterly or annual operating results may cause our stock price to decline.
Our quarterly and annual operating results may fluctuate significantly in the future, due to a number of factors, including: seasonality of certain product lines; changes in foreign currency exchange rates; changes in our accounting estimates; timing of operating expenditures; and timing of regulatory approvals and licenses, which could adversely impact the value of our common stock. Furthermore, our results may fluctuate due to a variety of other factors, many of which are outside of our control and may be difficult to predict.
The cumulative effects of these factors could result in large fluctuations and unpredictability in our quarterly and annual operating results. As a result, comparing our operating results on a period-to-period basis may not be meaningful. Investors should not rely on past results as an indication of our future performance. This variability and unpredictability could also result in our failure to meet the expectations of industry or financial analysts or investors for any period. If our revenue or operating results fall below the expectations of analysts or investors or below any forecasts we may provide to the market, or if any forecasts we provide to the market are below the expectations of analysts or investors, the price of our common stock could decline substantially. Such a stock price decline could occur even when we have met any previously publicly stated revenue and/or earnings guidance we may provide.
Our business could be materially adversely affected by a negative outcome in significant litigation or other legal proceedings.
We are currently involved in a shareholder securities litigation, and may be subject to future litigation matters, claims, and demands. These matters may divert financial and management resources that would otherwise be used to benefit our operations. No assurances can be given that the results of these matters will be favorable to us. An adverse resolution or outcome of any of these lawsuits, claims, demands or investigations could have a negative impact on our results of operations, financial condition, and liquidity.
27
Failure to establish and maintain effective internal controls could have a material adverse effect on our ability to report our financial condition, results of operations, or cash flows accurately and on a timely basis and could harm our reputation.
As a publicly traded company, we are subject to the Securities Exchange Act of 1934 (the “Exchange Act”) and the Sarbanes-Oxley Act of 2002 (“Sarbanes-Oxley Act”). The Sarbanes-Oxley Act requires that we maintain effective disclosure controls and procedures and internal control over financial reporting.
To comply with these requirements, we have and will need to continue to upgrade and implement additional internal controls, reporting systems, information technology systems and procedures, and hire additional accounting, legal, compliance, and finance staff. A material weakness is a deficiency or combination of deficiencies in internal control over financial reporting that results in a more than reasonable possibility that a material misstatement of annual or interim financial statements will not be prevented or detected on a timely basis.
During the quarter ended September 30, 2019, management identified a material weakness in our internal control related to ineffective information technology general controls (ITGC’s) in the areas of logical security and change management in certain of our business units within North America, APAC, and Europe. As a result of this material weakness, management concluded that our internal controls over financial reporting were not effective as of September 30, 2019 and through December 31, 2019.
During the quarter ended December 31, 2019, management identified a material weakness in our internal controls over financial reporting relating to our accounting for income taxes. Management's assessment identified control deficiencies associated with the transition to establishing expanded in-house tax capabilities and utilizing new tax consultants. As a result of these issues, our controls to review and analyze the Company's income tax provision and deferred income tax balances did not operate effectively. That led management to conclude that the control deficiencies that existed at December 31, 2019 represented a material weakness in internal controls.
We are implementing remedial measures to address the material weaknesses prior to the end of fiscal 2020, however we cannot assure that our efforts will be successful or on this timeline, or that we have identified all material weaknesses. Our remedial measures may result in additional technology and other expenses. Any failure to implement these remedial measures and to achieve and maintain effective internal controls and disclosure controls and procedures could have a material adverse effect on the market for our common stock.
For a discussion of our internal controls over financial reporting and a description of the identified material weakness, see Part II, Item 9A Controls and Procedures of this Report.
Sales of our common stock may negatively affect its market price.
It is likely that some stockholders have sold or may sell our common stock received in the Transactions for various reasons such as if our business profile or market capitalization as a combined company does not fit their investment objectives. The sales of significant amounts of our common stock or the perception in the market that this will occur may result in a decrease in the market price of our common stock. Certain former stockholders of Vets First Choice holding approximately 17.3% of our common stock were subject to a six-month lock-up period following February 7, 2019, or the Closing Date, with respect to the shares of our common stock they received in the Merger pursuant to a voting and support agreement. These shares were not restricted securities within the meaning of Rule 144 under the Securities Act after the expiration of the lock-up period and, unless held by our affiliates, may subsequently be sold into the public market without restriction. If some or all these shares are sold, or if it is perceived that they will be sold, in the public market, the price of our common stock could decline substantially.
We do not intend to pay dividends on our common stock and, consequently, your ability to achieve a return on your investment will depend on appreciation in the price of our common stock.
We do not intend to declare and pay dividends on our common stock for the foreseeable future. We currently intend to invest our future earnings, if any, to fund our growth, to develop our business, for working capital needs and for general corporate purposes. Therefore, you are not likely to receive any dividends on your common stock for the foreseeable future and the success of an investment in shares of our common stock will depend on any future appreciation in their value. There is no guarantee that shares of our common stock will appreciate or even maintain the value of shares received in connection with the Transactions. In addition, Delaware law or the agreements governing our indebtedness may impose requirements that may restrict our ability to pay dividends to holders of our common stock.
28
Under our amended and restated certificate of incorporation, our non-employee directors generally have no obligation to offer us corporate opportunities.
Our amended and restated certificate of incorporation addresses potential conflicts of interest with respect to corporate opportunities and transactions that are presented to, or which otherwise come into the possession of, any of our directors who is not also one of our employees or an employee of any of our subsidiaries. Under our amended and restated certificate of incorporation, we renounce any interest or expectancy in such corporate opportunities unless they were presented to a non-employee director expressly and solely in such person’s capacity as one of our directors.
Anti-takeover provisions in our amended and restated certificate of incorporation and amended and restated by-laws could discourage, delay, or prevent a change of control and may affect the trading price of our common stock.
Our amended and restated certificate of incorporation and amended and restated by-laws include a number of provisions that may discourage, delay, or prevent a change in our management or control over us that stockholders may consider favorable. For example, the amended and restated certificate of incorporation and amended and restated by-laws, collectively:
• | authorize the issuance of “blank check” preferred stock that could be issued by our Board without approval of stockholders, |
• | for the first three years following the Merger until the 2022 annual meeting of stockholders, divide our Board into three classes, serving staggered terms of one, two and three years, respectively, |
• | limit the ability of stockholders to remove directors by requiring the affirmative vote of holders of at least two-thirds of the outstanding shares of our capital stock then entitled to vote for removal and, until the 2022 annual meeting of stockholders, permitting directors to be removed only with cause, |
• | provide that vacancies on our Board may be filled only by a majority vote of directors then in office, |
• | prohibit stockholders from calling special meetings of stockholders, |
• | prohibit stockholder action by written consent, |
• | establish advance notice requirements for stockholder nominations of candidates for election as directors before an annual or special meeting of our stockholders or to bring other business before an annual meeting of our stockholders, |
• | subject us to Section 203 of the DGCL, which will prohibit us from engaging in business combinations with certain “interested stockholders” for three years following the date such stockholder became interested unless certain criteria are met, and |
• | require the approval of holders of at least two-thirds of the outstanding shares of our capital stock then entitled to vote to amend the amended and restated certificate of incorporation and the amended and restated by-laws. |
These provisions may prevent our stockholders from receiving the benefit from any premium to the market price of the common stock offered by a bidder in a takeover context. Even in the absence of a takeover attempt, the existence of these provisions may adversely affect the prevailing market price of the common stock if the provisions are viewed as discouraging takeover attempts in the future. The amended and restated by-laws also make it difficult for stockholders to replace or remove management by giving our Board the sole ability to elect and remove officers. These provisions may facilitate management entrenchment that may delay, deter, render more difficult or prevent a change in our control, which may not be in the best interests of the stockholders.
Our amended and restated certificate of incorporation designates the Court of Chancery of the State of Delaware, or if the Court of Chancery does not have jurisdiction, the federal district court for the District of Delaware or other state courts of the State of Delaware (each such court, as applicable, the “Selected Forum”), as the exclusive forum for certain litigation that may be initiated by our stockholders, which could limit our stockholders’ ability to obtain a favorable judicial forum for disputes with us.
Our amended and restated certificate of incorporation provides that the Selected Forum will be the sole and exclusive forum for (i) any derivative action or proceeding brought on our behalf, (ii) any action asserting a claim of breach of a fiduciary duty owed to us or our stockholders by any of our current or former directors, officers, employees or stockholders, (iii) any action asserting a claim against us arising under the DGCL, our amended and restated certificate of incorporation or our amended and restated by-laws or as to which the DGCL confers jurisdiction on a Selected Forum, (iv) any action asserting a claim against us that is governed by the internal affairs doctrine, (v) any action to interpret, apply, enforce or determine the validity of our amended and restated certificate of incorporation or our amended and restated by-laws, or (vi) any other action asserting an “internal corporate claim” under Section 115 of the DGCL. If a stockholder files any of the preceding actions in a court other than a court located within the State of Delaware (a “Foreign Action”), such stockholder shall be deemed to have consented to (x) the personal jurisdiction of the Selected Forum in connection with any action brought in such court to enforce the choice of forum provision and (y) having service of process made on such stockholder in any such enforcement action by service on the stockholder’s counsel (as such stockholder’s agent) in the foreign action. By becoming a holder of our common stock, a person will be deemed to have notice of and have consented to the provisions of our amended and restated certificate of incorporation related to choice of
29
forum. The choice of forum provision in our amended and restated certificate of incorporation may limit our stockholders’ ability to obtain a favorable judicial forum for disputes with us.
Item 1B. | Unresolved Staff Comments |
None
Item 2. | Properties |
Our corporate headquarters consists of three facilities located in Portland, Maine. The first facility encompasses approximately 25,000 square feet of leased office space, which expires in July 2026. The second facility encompasses approximately 10,000 square feet of leased office space, which expires in December 2020. The third facility encompasses approximately 10,000 square feet of leased office space, which expires in April 2022. We also utilize approximately 50 distribution centers and approximately 75 offices throughout the world.
In August 2018, we signed two new leases for additional office and laboratory space in Portland, Maine. The first is for approximately 117,000 square feet of office space and the second is for approximately 46,000 square feet of laboratory space and will house certain compounding pharmacy operations. The lease terms will commence at the earlier of (i) when we begin our operations in these facilities, or (ii) the date the landlord obtains a permanent certificate of occupancy. The initial lease terms are for 20 years and include four optional five-year extensions.
In June 2018, we signed a lease for office space and pharmacy operations in Phoenix, Arizona which commenced in November 2019 with an initial lease term of 13 years. The facility is approximately 100,000 square feet; however, we have determined that it is not suitable for its intended purpose, and are actively pursuing sub-lease opportunities.
In July 2019, we signed a lease for alternate space in Phoenix, Arizona. The facility includes approximately 100,000 square feet of office space and will house certain compounding pharmacy operations. The lease term commenced in January 2020 and the initial lease term is 14 years.
We believe that our existing facilities are adequate for our near-term needs, but we may need additional space as we grow and expand our operations. We believe that suitable additional or alternative office space would be available as required in the future on commercially reasonable terms.
See Note 6 - Leases under Item 8, Financial Statements and Supplementary Data.
We believe that our properties are in good condition, are well maintained, and are suitable and adequate to carry on our business, apart from the space noted above. We have additional operating capacity at certain distribution center facilities.
Item 3. | Legal Proceedings |
Refer to Note 11 - Commitments and Contingencies included in Part II, Item 8, Financial Statements and Supplementary Data in this Report for information on legal proceedings.
Item 4. | Mine Safety Disclosures |
Not applicable
30
PART II
Item 5. | Market for Registrant’s Common Equity, Related Stockholder Matters, and Issuer Purchases of Equity Securities |
Our common stock has been listed on the Nasdaq Global Select Market under the symbol “CVET” since February 8, 2019. Prior to that date, there was no public trading market for our common stock. A “when-issued” trading market for our common stock existed between February 4, 2019 and February 7, 2019 under the symbol “CVETV”.
Holders of Common Stock
As of February 28, 2020, there were 429 holders of record of our common stock. This number does not reflect beneficial owners whose shares are held in street name.
Securities Authorized for Issuance Under Equity Compensation Plans
Information regarding our equity compensation plans and the securities authorized for issuance thereunder is set forth herein under Part III, Item 12 below.
Dividend Policy
We have never declared or paid any cash dividends on our common stock or any other securities. We anticipate that we will retain all available funds and any future earnings, if any, for use in the operation of our business and do not anticipate paying cash dividends in the foreseeable future. In addition, our debt instruments materially restrict our ability to pay dividends on our common stock. Payment of future cash dividends, if any, will be at the discretion of the board of directors after taking into account various factors, including our financial condition, operating results, current and anticipated cash needs, the requirements of current or then-existing debt instruments and other factors the board of directors deems relevant.
Stock Performance Graph
The graph below compares the cumulative total shareholder return of our common stock for the last four quarters with the Nasdaq Global Market Composite Index and the S&P 600 Health Care Index. The information presented assumes an initial investment of $100 on February 7, 2019, the effective date of the registration of our common stock, and that all dividends were reinvested. The graph shows the value that each of these investments would have had at the end of each quarter.
31
Four-Quarter Cumulative Total Shareholder Return(a)
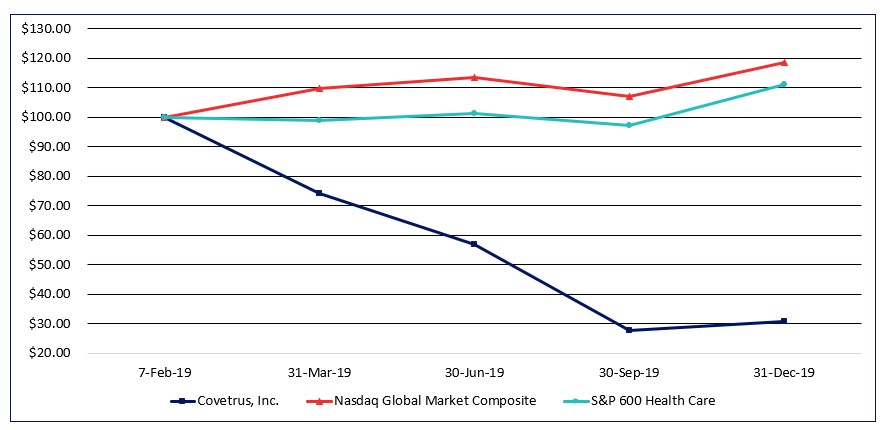
February 7, 2019 | March 31, 2019 | June 30, 2019 | September 30, 2019 | December 31, 2019 | ||||||||||||||||
Covetrus, Inc. | $ | 100.00 | $ | 73.98 | $ | 56.82 | $ | 27.62 | $ | 30.66 | ||||||||||
Nasdaq Global Market Composite | $ | 100.00 | $ | 109.58 | $ | 113.62 | $ | 107.04 | $ | 118.65 | ||||||||||
S&P 600 Health Care | $ | 100.00 | $ | 98.98 | $ | 101.12 | $ | 97.32 | $ | 110.99 | ||||||||||
(a) $100 invested on February 7, 2019 in stock or index, including reinvestment of dividends, as of December 31, 2019 | ||||||||||||||||||||
Recent Sales of Unregistered Securities
Not applicable
Issuer Purchases of Equity Securities
Not applicable
32
Item 6. | Selected Financial Data |
You should read the following consolidated and combined financial data in conjunction with Item 7, Management’s Discussion and Analysis of Financial Condition and Results of Operations and Item 8, Financial Statements and Supplementary Data. The results shown below are not necessarily indicative of the results to be expected for any future periods.
Fiscal Years Ended | |||||||||||||||||||
(In millions, except per share data) | December 31, 2019 (a) | December 29, 2018 | December 31, 2017 | December 26, 2016 | December 26, 2015 | ||||||||||||||
Statement of Operations Data: | |||||||||||||||||||
Net sales | $ | 3,976 | $ | 3,778 | $ | 3,580 | $ | 3,353 | $ | 2,978 | |||||||||
Gross profit | 749 | 684 | 652 | 620 | 530 | ||||||||||||||
Selling, general and administrative | 808 | 547 | 517 | 496 | 426 | ||||||||||||||
Goodwill impairment (b) | 938 | — | — | — | — | ||||||||||||||
Operating (loss) income | (997 | ) | 137 | 135 | 124 | 104 | |||||||||||||
Other income (expense), net | (32 | ) | 6 | 4 | 3 | 4 | |||||||||||||
(Loss) income before taxes and equity in earnings of affiliates | (1,029 | ) | 143 | 139 | 127 | 108 | |||||||||||||
Income tax benefit (expense) (c) | 7 | (37 | ) | (48 | ) | (28 | ) | (24 | ) | ||||||||||
Equity in earnings of affiliates | — | 1 | 1 | 1 | 1 | ||||||||||||||
Net (loss) income | (1,022 | ) | 107 | 92 | 100 | 85 | |||||||||||||
Net loss (income) attributable to redeemable non-controlling interests | 3 | (6 | ) | (28 | ) | (30 | ) | (25 | ) | ||||||||||
Net (loss) income attributable to Covetrus | $ | (1,019 | ) | $ | 101 | $ | 64 | $ | 70 | $ | 60 | ||||||||
(Loss) earnings per share attributable to Covetrus: | |||||||||||||||||||
Basic (d) | $ | (9.50 | ) | $ | 1.41 | $ | 0.90 | $ | 0.98 | $ | 0.84 | ||||||||
Diluted (d) | $ | (9.50 | ) | $ | 1.40 | $ | 0.89 | $ | 0.98 | $ | 0.84 | ||||||||
Balance Sheet Data: | |||||||||||||||||||
Total assets | $ | 3,361 | $ | 2,233 | $ | 2,217 | $ | 1,991 | $ | 1,862 | |||||||||
Long-term debt and other borrowings, net (e) | 1,125 | 24 | 24 | 26 | 24 | ||||||||||||||
Redeemable non-controlling interests (f) | 10 | 92 | 367 | 322 | 276 | ||||||||||||||
Total shareholders' equity | 1,256 | 1,494 | 1,257 | 1,120 | 1,057 | ||||||||||||||
(a) Includes the Acquisition on February 7, 2019
(b) See Note 7 - Goodwill and Other Intangible Assets, Net
(c) See Note 14 - Income Taxes
(d) | On February 7, 2019, Henry Schein, Inc. distributed approximately 71 million shares of Covetrus common stock to its shareholders. The computation of basic earnings per common share (“EPS”) for all periods disclosed was calculated using the shares distributed by Henry Schein on February 7, 2019 totaling 71 million. The weighted-average number of shares outstanding for diluted EPS for periods prior to the Distribution included 0.5 million of diluted common share equivalents for restricted stock and restricted stock units as these share-based awards were previously issued by Henry Schein and outstanding at the time of Distribution and were replaced with Covetrus awards following the Distribution |
(e) See Note 8 - Debt
(f) | See Note 12 - Redeemable Non-controlling Interests |
33
Item 7. | Management’s Discussion and Analysis of Financial Condition and Results of Operations |
Our financial information is summarized in this Management's Discussion and Analysis of Financial Condition and Results of Operations (“MD&A”) and is intended to help the reader better understand Covetrus, our operations, financial results, and current business environment. This MD&A should be read in conjunction with our consolidated and combined financial statements and accompanying notes in Item 8. Financial Statements and Supplementary Data of this Report.
Overview
See Item 1. Business for a detailed discussion of our corporate mission and strategy that should be read in conjunction with our discussion and analysis of financial condition and results of operations.
Segments
We are organized based upon geographic region and focus on delivering our platform of products and services to our customers on a geographical basis. Effective during the first quarter of 2019, in connection with the Distribution and the Acquisition, we revised our reportable segments to (i) North America, (ii) Europe, and (iii) APAC & Emerging Markets. For additional information on the changes in reportable segments, see Note 18 - Segment Data. The periods presented in this Form 10-K are reported on a comparable basis.
Key Factors and Trends Affecting our Results
Goodwill Impairment
Goodwill is not amortized but is subject to impairment analysis at least once annually. We performed an interim impairment test in August 2019, due to certain triggering events, and determined that it was impaired. Impairment analysis requires a comparison of the fair value to the carrying value of the reporting units. We regard our reporting units to be the same as our revised reportable segments, (i) North America, (ii) Europe, and (iii) APAC & Emerging Markets, and our Goodwill was reallocated to our new reporting segments in the first quarter of 2019. Based on our analysis, a goodwill impairment charge of $938 million was included within the consolidated statement of operations for the year ended December 31, 2019. There is no remaining net goodwill for our Europe and APAC & Emerging Markets reporting units. See Note 7 - Goodwill and Other Intangible Assets, Net.
Our annual impairment test is performed at the beginning of the fourth quarter, and for the year ended December 31, 2019, we utilized the qualitative approach that allows the assessment of qualitative factors to determine whether it is more likely than not that the fair value of a reporting unit is less than its carrying value. Based on the results of our annual impairment review during the fourth quarter of 2019, we concluded there was no additional goodwill impairment. However, the potential for impairment exists in the future should actual results deteriorate versus our current expectations. To the extent that future impairment charges occur, it could have a material impact on our financial results. At December 31, 2019, the carrying value of our goodwill was $1.2 billion.
For the years ended December 29, 2018 and December 30, 2017, we tested goodwill for impairment using a quantitative analysis, and no goodwill impairment was recorded. See Critical Accounting Policies and Estimates below.
Covetrus is an Independent, Publicly Traded Company Following the Distribution and the Acquisition of Vets First Choice
Since the Distribution, we have been responsible for the costs associated with being an independent, publicly traded company, including costs related to corporate governance, investor and public relations, and public reporting. In our first year of combined operations, we incurred substantial costs to phase-in the ongoing integration of our businesses globally as well as take steps toward identifying our target processes and structure for operations. We expect that our selling, general and administrative expenses will likely increase through 2020, which includes building out our infrastructure, expanding our global sales and marketing efforts, and increasing our pharmaceutical operations capacity.
Terms with Key Suppliers
Each year, suppliers in the veterinary channel engage in negotiations with us regarding pricing terms, including performance rebates and other growth incentives. Our Supply Chain Services is dependent upon third-party suppliers and the results of these negotiations can have a material impact on the financial performance of our business on an annual basis. Five suppliers accounted for approximately 50% of our purchases for the year ended December 31, 2019. Globally, we are subject to a concentration of risk
34
with these suppliers as the loss of one of our five major manufacturing relationships could have a material impact on our financial performance.
Core to Agency Revenue
In certain of our customer relationships, largely attributable to our North American Supply Chain Services, the adoption of ASC 606 and the terms of selected supplier contracts resulted in us recognizing agency revenue on a net basis. See Note 1 - Business Overview and Significant Accounting Policies as well as Note 4 - Revenue from Contracts with Customers.
Veterinary Visits and Animal Owner Willingness to Spend
The health of the business of in-office veterinary care is a critical determinant in our financial performance, both with respect to the number of visits by Animal Owners as well as their desire and ability to spend on preventative and therapeutic treatments and procedures. Because we market companion-animal prescription products through the veterinarian channel, both in-office and through our online platform, any decrease in reliance on and visits to veterinarians by companion-animal owners could reduce our market share for such products and have a material adverse effect on our business, financial condition, results of operations, and cash flows.
Definition of Non-GAAP Adjusted Earnings Before Interest, Taxes, Depreciation and Amortization (“Adjusted EBITDA”)
Adjusted EBITDA is among the primary metrics by which management evaluates the performance of the business. See Note 18 - Segment Data. We use Adjusted EBITDA to (i) aid management and investors with year-over-year comparability, (ii) determine management performance under our compensation plans, (iii) plan and forecast, (iv) communicate our financial performance to our board of directors, shareholders, and investment analysts, and (v) understand our operating performance without regard to items we do not consider a component of our core ongoing operating performance. Adjusted EBITDA has certain limitations in that it does not consider the impact of certain expenses to our consolidated and combined statements of operations. Adjusted EBITDA excludes share-based compensation, transaction costs, formation of Covetrus expenses, separation programs and executive severance, carve-out operating expenses, IT infrastructure, goodwill impairment charges, and other (income) expense items, net. We do not allocate expenses managed at the corporate level, such as corporate wages and related benefits, corporate occupancy costs, professional services utilized at the corporate level, and non-recurring expenses to our operating segments. Other companies may not define or calculate Adjusted EBITDA in the same way. We provide Adjusted EBITDA by segment as a supplemental measure to GAAP. See below for our Adjusted EBITDA explanations on a segment basis as well as on a consolidated, non-GAAP basis. Non-GAAP Adjusted EBITDA on a total segment basis is reconciled in Note 18 - Segment Data, as required by ASC 280.
Results of Operations
Years Ended | |||||||||||
(In millions) | December 31, 2019 | December 29, 2018 | December 30, 2017 | ||||||||
Net sales | $ | 3,976 | $ | 3,778 | $ | 3,580 | |||||
Cost of sales | 3,227 | 3,094 | 2,928 | ||||||||
Gross profit | 749 | 684 | 652 | ||||||||
Gross margin % | 18.8 | % | 18.1 | % | 18.2 | % | |||||
Operating expenses: | |||||||||||
Selling, general and administrative | 808 | 547 | 517 | ||||||||
Goodwill impairment (Note 7) | 938 | — | — | ||||||||
Operating (loss) income | $ | (997 | ) | $ | 137 | $ | 135 | ||||
Net (loss) income | $ | (1,022 | ) | $ | 107 | $ | 92 | ||||
Net (loss) income attributable to Covetrus | $ | (1,019 | ) | $ | 101 | $ | 64 | ||||
Our year ended December 31, 2019 results were largely driven by the acquisition of Vets First Choice (see Note 2 - Business Acquisitions), organic growth in Europe and APAC & Emerging Markets, foreign currency headwinds due to the strengthening U.S. dollar, increased Selling, general and administrative expenses to drive our transformation as a wholly independent, newly formed, public company, as well as the effect of our goodwill impairment charge.
35
Year Ended December 31, 2019 Compared to Year Ended December 29, 2018
Net Sales
(In millions) | Year Ended December 31, 2019 | % of Total | Year Ended December 29, 2018 | % of Total | $ Change | % Change | ||||||||||||||
North America | $ | 2,111 | 53.1 | % | $ | 1,939 | 51.3 | % | $ | 172 | 8.9 | % | ||||||||
Europe | 1,509 | 38.0 | 1,463 | 38.7 | 46 | 3.1 | ||||||||||||||
APAC & Emerging Markets | 368 | 9.3 | 387 | 10.2 | (19 | ) | (4.9 | ) | ||||||||||||
Eliminations | (12 | ) | (0.3 | ) | (11 | ) | (0.3 | ) | (1 | ) | 9.1 | |||||||||
Total net sales | $ | 3,976 | 100.0 | % | $ | 3,778 | 100.0 | % | $ | 198 | 5.2 | % | ||||||||
Net sales for the year ended December 31, 2019 increased compared to the year ended December 29, 2018 due to the contribution of $313 million in net sales from acquisitions (primarily Vets First Choice), partially offset by $104 million in unfavorable foreign exchange, and the effect of certain distribution products moving from core to agency basis in North America. The drivers by segment are detailed below:
• | North America increased due to the contribution of $246 million in net sales from the acquisition of Vets First Choice from February 8, 2019 forward (see Note 2 - Business Acquisitions), partially offset by the loss of a large customer, and the negative effect of certain distribution products moving from core to agency basis which amounted to $51 million. |
• | Europe increased primarily due to the contribution of $67 million in net sales from acquisitions in France and Romania and organic growth in most of our markets in the region, largely offset by unfavorable foreign exchange of $79 million driven primarily by the U.S. dollar further strengthening against the British pound and Euro. |
• | APAC & Emerging Markets decreased primarily due to unfavorable foreign exchange of $26 million driven largely by the U.S. dollar further strengthening against the Australian dollar and the negative effect to sales from the loss of a local manufacturer relationship, partially offset by organic growth. |
Gross Profit and Gross Margin
(In millions) | Year Ended December 31, 2019 | Gross Margin % | Year Ended December 29, 2018 | Gross Margin % | $ Change | Gross Profit % Change | |||||||||||||||
North America | $ | 452 | 21.4 | % | $ | 389 | 20.1 | % | $ | 63 | 16.2 | % | |||||||||
Europe | 227 | 15.0 | 223 | 15.2 | 4 | 1.8 | |||||||||||||||
APAC & Emerging Markets | 70 | 19.0 | 72 | 18.6 | (2 | ) | (2.8 | ) | |||||||||||||
Total gross profit | $ | 749 | 18.8 | % | $ | 684 | 18.1 | % | $ | 65 | 9.5 | % | |||||||||
During the year ended December 31, 2019, gross profit increased compared to the year ended December 29, 2018 largely driven by an $83 million contribution from acquisitions (primarily Vets First Choice) and the successful execution of our strategy to grow our higher-margin proprietary brands and solutions, which were partially offset by margin pressure from industry consolidation in certain of our markets and unfavorable foreign exchange of $17 million. The drivers by segment are detailed below:
• | North America increased due to the contribution of $74 million from the acquisition of Vets First Choice, partially offset by a modest decline in our supply chain business. |
• | Europe increased primarily due to the contribution of $9 million from acquisitions in France and Romania, organic growth, and sales development in our higher-margin proprietary brands, largely offset by unfavorable foreign exchange of $12 million. |
• | APAC & Emerging Markets decreased due to unfavorable foreign exchange of $5 million and the negative effect from the loss of a local manufacturer relationship, partially offset by organic growth. |
36
Selling, General and Administrative (“SG&A”)
(In millions) | Year Ended December 31, 2019 | % of Respective Net Sales | Year Ended December 29, 2018 | % of Respective Net Sales | $ Change | % Change | |||||||||||||||
North America | $ | 467 | 22.1 | % | $ | 275 | 14.2 | % | $ | 192 | 69.8 | % | |||||||||
Europe | 186 | 12.3 | 175 | 12.0 | 11 | 6.3 | |||||||||||||||
APAC & Emerging Markets | 58 | 15.8 | 58 | 15.0 | — | — | |||||||||||||||
Corporate | 97 | — | 39 | — | 58 | 148.7 | |||||||||||||||
Total SG&A | $ | 808 | 20.3 | % | $ | 547 | 14.5 | % | $ | 261 | 47.7 | % | |||||||||
SG&A expenses for the year ended December 31, 2019 increased compared to the year ended December 29, 2018, primarily due to the contribution of $169 million in SG&A from acquisitions (primarily Vets First Choice), $38 million due to an increase in share-based compensation expense, $34 million in expense related to the formation of Covetrus, and $11 million related to separation programs and executive severance, partially offset by $14 million favorable foreign exchange. The drivers by segment and at Corporate are detailed below:
• | North America increased primarily due to Vets First Choice expenses of $160 million (including $77 million of intangibles amortization expense) and $29 million due to an increase in share-based compensation expense. |
• | Europe increased primarily due to the impact from acquisitions of $9 million in France and Romania, as well as $5 million related to separation programs and executive severance, $2 million related to the formation of Covetrus, partially offset by favorable foreign exchange. |
• | Corporate increased primarily due to $31 million in expenses related to the formation of Covetrus, $6 million due to an increase in share-based compensation expense, $4 million related to separation programs and executive severance, and increased costs related to various corporate functions as we establish ourselves as an independent, globally present company. We expect that Selling, general and administrative will likely increase through 2020 as we continue our transformation. |
During the year ended December 29, 2018, SG&A included expense allocations for (i) certain corporate functions historically provided by Henry Schein, including accounting, legal, information services, planning, compliance, investor relations, administration and communication, and similar costs, (ii) employee benefits and incentives, and (iii) share-based compensation. The allocations may not reflect the actual expenses that the Animal Health Business would have incurred as a standalone company for this period. During the year ended December 29, 2018, we were allocated $55 million of general corporate expenses which were included within Selling, general and administrative.
Goodwill Impairment
As further described in Note 7 - Goodwill and Other Intangible Assets, Net, we recorded a non-tax-deductible goodwill impairment charge totaling $938 million included within the consolidated statement of operations for the year ended December 31, 2019. There were no goodwill impairment charges during 2018.
Other (Expense) Income, Net
(In millions) | Year Ended December 31, 2019 | Year Ended December 29, 2018 | $ Change | % Change | |||||||||||
Interest income | $ | 7 | $ | 6 | $ | 1 | 16.7 | % | |||||||
Interest expense | (56 | ) | (3 | ) | (53 | ) | 1,766.7 | ||||||||
Other, net | 17 | 3 | 14 | 466.7 | |||||||||||
Other (expense) income, net | $ | (32 | ) | $ | 6 | $ | (38 | ) | (633.3 | )% | |||||
Other (expense) income, net for the year ended December 31, 2019 decreased compared to the year ended December 29, 2018 primarily due to an increase in interest expense associated with our debt, partially offset by a non-cash gains recorded in connection with our acquisitions in Europe recorded in Other, net.
37
Income Taxes
For the year ended December 31, 2019, our effective tax rate was 0.7% compared to 25.9% for the prior year period. The decrease in the effective tax rate is primarily related to the goodwill impairment recorded in 2019.
On December 22, 2017, the U.S. government passed the U.S. Tax Cuts and Jobs Act of 2017 (the “Tax Act”). The Tax Act included provisions for tax on global intangible low-taxed income (“GILTI”).
The valuation allowance was $49 million as of December 31, 2019 and $1 million as of December 29, 2018. In assessing the realizability of deferred tax assets, management considers whether it is more likely than not that some or all the deferred tax assets will be realized. The ultimate realization of deferred taxes assets is dependent upon generation of future taxable income during the period in which those temporary differences become deductible. Management considers the scheduled reversal of deferred tax liabilities, projected future taxable income, and taxable income in carryback years and tax-planning strategies when making this assessment. The change in valuation allowance for the year ended December 31, 2019 was $48 million and was attributable primarily to uncertainty regarding the realization of future tax benefits from certain U.S. deferred tax assets. See Note 14 - Income Taxes.
We elected to recognize the tax on GILTI as a period expense in the period the tax is incurred and estimated the impact of each provision of the Tax Act on the effective tax and recorded tax expense for the GILTI provision of $10 million and an interest limitation of $7 million for the year ended December 31, 2019. We recorded a tax expense for the GILTI provision of $2 million for the year ended December 29, 2018. We have concluded that the base erosion and anti-abuse tax (“BEAT”) and foreign derived intangible income (“FDII”) provisions of the Tax Act will not apply or will not have a material impact on our consolidated and combined financial statements, therefore, we have not recorded an estimate in the effective tax rate for the years ended December 31, 2019 and December 29, 2018.
For the year ended December 29, 2018, we recorded a net $4 million additional expense for the one-time transition tax. The change was a result of additional analysis, changes in interpretation and assumptions, as well as additional regulatory guidance that was issued. As of December 29, 2018, we completed our analysis of the impact of the Tax Act and the amounts are now considered final. The effective tax rate in 2018 was primarily impacted by an increase in the estimate of transition tax associated with the Tax Act, the impact of GILTI, and state and foreign income taxes, partially offset by non-controlling interests in our partnership investments and the impact of windfall tax benefits from share-based payments.
Due to the one-time transition tax and the imposition of the GILTI provisions, all previously unremitted earnings will no longer be subject to U.S. federal income tax, however, there could be U.S. state and/or foreign withholding taxes upon distribution of such unremitted earnings. Determination of the amount of unrecognized deferred tax liability with respect to such earnings is not practicable.
Adjusted EBITDA
(In millions) | Year Ended December 31, 2019 | % of Respective Net Sales | Year Ended December 29, 2018 | % of Respective Net Sales | $ Change | % Change | ||||||||||||||
North America | $ | 154 | 7.3 | % | $ | 157 | 8.1 | % | $ | (3 | ) | (1.9 | )% | |||||||
Europe | 68 | 4.5 | 75 | 5.1 | (7 | ) | (9.3 | ) | ||||||||||||
APAC & Emerging Markets | 19 | 5.2 | 20 | 5.2 | (1 | ) | (5.0 | ) | ||||||||||||
Corporate | (39 | ) | NA | (32 | ) | NA | (7 | ) | NA | |||||||||||
Total adjusted EBITDA | $ | 202 | 5.1 | % | $ | 220 | 5.8 | % | $ | (18 | ) | (8.2 | )% | |||||||
Total non-GAAP Adjusted EBITDA decreased year over year as a result of a decline in our supply chain profitability, increasing costs incurred as we transform into a wholly independent public company, and unfavorable foreign exchange as the U.S. dollar strengthens against certain local currencies.
Adjusted EBITDA is our primary segment operating metric. We do not allocate expenses managed at the corporate level to our segments. See Note 18 - Segment Data for additional information on corporate allocations and for a reconciliation of total adjusted EBITDA to net income (loss) in accordance with ASC 280. The changes by segment and at Corporate are detailed below:
• | North America decreased primarily due to a decline in our supply chain business, which more than offset an increase from the contribution of the Vets First Choice acquisition and growth in our software services business. |
38
• | Europe decreased primarily due to the unfavorable impact of foreign exchange of $4 million and increased SG&A expenses, which more than offset the positive impact from organic growth and the contribution from acquisitions. |
• | APAC & Emerging Markets was relatively comparable to the prior year as the unfavorable effect from foreign exchange and the loss of a local manufacturer relationship offset the positive impact from organic growth. |
• | Corporate contributed to a reduction in Adjusted EBITDA due to incremental costs associated with various corporate functions. |
Year Ended December 29, 2018 Compared to Year Ended December 30, 2017
The fiscal year ended December 29, 2018 consisted of 52 weeks as compared to the fiscal year ended December 30, 2017 which consisted of 53 weeks.
Net Sales
(In millions) | Year Ended December 29, 2018 | % of Total | Year Ended December 30, 2017 | % of Total | $ Change | % Change | ||||||||||||||
North America | $ | 1,939 | 51.3 | % | $ | 1,876 | 52.4 | % | $ | 63 | 3.4 | % | ||||||||
Europe | 1,463 | 38.7 | 1,373 | 38.4 | 90 | 6.6 | ||||||||||||||
APAC & Emerging Markets | 387 | 10.2 | 349 | 9.7 | 38 | 10.9 | ||||||||||||||
Eliminations | (11 | ) | (0.3 | ) | (18 | ) | (0.5 | ) | 7 | (38.9 | ) | |||||||||
Total net sales | $ | 3,778 | 100.0 | % | $ | 3,580 | 100.0 | % | $ | 198 | 5.5 | % | ||||||||
Net sales for the year ended December 29, 2018 increased compared to the year ended December 30, 2017 due to the contribution of $90 million in net sales from acquisitions, $63 million increase in organic growth, and $45 million in favorable foreign exchange. The drivers by segment are detailed below:
• | North America increased due to the contribution of $51 million in net sales from acquisitions as well as organic growth of $12 million which was negatively affected by year-over-year changes to certain distribution products moving from core to agency basis in 2018. |
• | Europe increased primarily due to favorable foreign exchange of $61 million driven largely by the Euro and British pound strengthening against the U.S. dollar, $24 million in organic growth, and $5 million from acquisitions. |
• | APAC & Emerging Markets increased primarily due to the contribution of $34 million in net sales from acquisitions as well as organic growth of $20 million, partially offset by $16 million related to unfavorable foreign exchange. |
Gross Profit and Gross Margin
(In millions) | Year Ended December 29, 2018 | Gross Margin % | Year Ended December 30, 2017 | Gross Margin % | $ Change | Gross Profit % Change | |||||||||||||||
North America | $ | 389 | 20.1 | % | $ | 383 | 20.4 | % | $ | 6 | 1.6 | % | |||||||||
Europe | 223 | 15.2 | 205 | 14.9 | 18 | 8.8 | |||||||||||||||
APAC & Emerging Markets | 72 | 18.6 | 64 | 18.3 | 8 | 12.5 | |||||||||||||||
Total gross profit | $ | 684 | 18.1 | % | $ | 652 | 18.2 | % | $ | 32 | 4.9 | % | |||||||||
The increase in gross profit for the year ended December 29, 2018 compared to the year ended December 30, 2017 was largely driven by the contribution of $19 million in gross profit from acquisitions, $7 million in organic growth, and $6 million due to favorable foreign exchange. The drivers by segment are detailed below:
• | North America increased due to the contribution of $10 million in gross profit from acquisitions which was offset by lower gross profit margins. |
• | Europe increased primarily due to $10 million from favorable foreign exchange, organic growth, and higher margin rates. |
39
• | APAC & Emerging Markets increased primarily due to the contribution of $8 million from acquisitions, organic growth, and higher margin rates, offset by $4 million due to unfavorable foreign exchange. |
Selling, General and Administrative
(In millions) | Year Ended December 29, 2018 | % of Respective Net Sales | Year Ended December 30, 2017 | % of Respective Net Sales | $ Change | % Change | |||||||||||||||
North America | $ | 275 | 14.2 | % | $ | 262 | 14.0 | % | $ | 13 | 5.0 | % | |||||||||
Europe | 175 | 12.0 | 162 | 11.8 | 13 | 8.0 | |||||||||||||||
APAC & Emerging Markets | 58 | 15.0 | 51 | 14.6 | 7 | 13.7 | |||||||||||||||
Corporate | 39 | — | 42 | — | (3 | ) | (7.1 | ) | |||||||||||||
Total SG&A | $ | 547 | 14.5 | % | $ | 517 | 14.4 | % | $ | 30 | 5.8 | % | |||||||||
SG&A expenses increased for the year ended December 29, 2018 compared to the year ended December 30, 2017 due to additional expenses of $18 million from acquisitions and $5 million of unfavorable foreign exchange. The drivers by segment are detailed below:
• | North America increased primarily due to $10 million in additional costs from acquired companies. |
• | Europe increased primarily due to $8 million unfavorable foreign exchange. |
• | APAC & Emerging Markets increased primarily due to additional expenses of $7 million from acquisitions, partially offset by favorable foreign exchange. |
As previously indicated, SG&A expenses include expense allocations from Henry Schein and the allocations may not reflect the actual expenses that Covetrus would have incurred as a standalone company for the periods presented. General corporate expenses allocated to us was $55 million in 2018 and $59 million in 2017 which were included within Selling, general and administrative.
Other Income, Net
Year Ended December 29, 2018 | Year Ended December 30, 2017 | $ Change | % Change | |||||||||||
(In millions) | ||||||||||||||
Interest income | $ | 6 | $ | 5 | $ | 1 | 20.0 | % | ||||||
Interest expense | (3 | ) | (2 | ) | (1 | ) | 50.0 | |||||||
Other, net | 3 | 1 | 2 | 200.0 | ||||||||||
Other income, net | $ | 6 | $ | 4 | $ | 2 | 50.0 | % | ||||||
Other income, net increased in 2018 primarily due to investment proceeds, the impact of foreign currency exchange rates, and losses from property and equipment disposals that occurred in 2017.
Income Taxes
For the year ended December 29, 2018, our effective tax rate was 25.9% compared to 34.6% for the prior year period. In 2018, the effective tax rate was primarily impacted by an increase in the estimate of transition tax associated with the Tax Act, the impact of GILTI, and state and foreign income taxes, partially offset by non-controlling interests in our partnership investments and the impact of windfall tax benefits from share-based payments. In 2017, the effective tax rate was primarily impacted by the Tax Act and the adoption of Accounting Standards Update Compensation - Stock Compensation (Topic 718) (“ASU 2016-09”).
In the fourth quarter of 2017, we recorded provisional amounts related to the Tax Act for any items that could be reasonably estimated at the time. This included the one-time transition tax that we estimated to be $13 million and a net deferred tax expense of $7 million attributable to the revaluation of deferred tax assets and liabilities due to the lower-enacted federal income tax rate of 21%. In the aggregate, for the quarter ended December 30, 2017, these Tax Act modifications resulted in a one-time tax expense of $20 million. Absent the effects of the transition tax, the revaluation of deferred tax assets and liabilities and the adoption of ASU 2016-09. Our effective tax rate for the year ended December 30, 2017 would have been 22.8% as compared to
40
our actual effective tax rate of 34.6%. In 2017, the effective tax rate was primarily impacted by the Tax Act and the adoption of ASU 2016-09.
Adjusted EBITDA
(In millions) | Year Ended December 29, 2018 | % of Respective Net Sales | Year Ended December 30, 2017 | % of Respective Net Sales | $ Change | % Change | ||||||||||||||
North America | $ | 157 | 8.1 | % | $ | 136 | 7.2 | % | $ | 21 | 15.4 | % | ||||||||
Europe | 75 | 5.1 | 62 | 4.5 | 13 | 21.0 | ||||||||||||||
APAC & Emerging Markets | 20 | 5.2 | 16 | 4.6 | 4 | 25.0 | ||||||||||||||
Corporate | (32 | ) | NA | (37 | ) | NA | 5 | NA | ||||||||||||
Total adjusted EBITDA | $ | 220 | 5.8 | % | $ | 177 | 4.9 | % | $ | 43 | 24.3 | % | ||||||||
Total non-GAAP Adjusted EBITDA increased year over year largely due to the purchase of minority interest within our supply chain business to successfully implement the spin-off. The changes by segment and at Corporate are detailed below:
• | North America increased primarily due to incremental Adjusted EBITDA attributable to Covetrus due to the purchase of minority interests within the supply chain business. |
• | Europe increased primarily due to $10 million growth in our supply chain business and the favorable impact of foreign exchange. |
• | APAC & Emerging Markets increased primarily due to the contribution of $3 million from acquisitions as well as $2 million from growth in our supply chain business and software services, partially offset by unfavorable foreign exchange. |
• | Corporate contributed to a $5 million increase in adjusted EBITDA due to a reduction in various Corporate expenses. |
Liquidity and Capital Resources
Overview
On February 7, 2019, we entered into a $1.5 billion syndicated credit agreement with a group of lenders for a five-year term (the “Credit Facilities”). The Credit Facilities include a $1.2 billion term loan facility (the “Term Loan Facility”) which was fully funded and primarily used to pay a dividend to Henry Schein and a $300 million revolving line of credit for working capital and general corporate purposes (the “Revolving Credit Facility”). There were no borrowings from the Revolving Credit Facility as of December 31, 2019. See Note 8 - Debt for more information on our Credit Facilities.
Our primary sources of liquidity are cash and cash equivalents, cash flows from the operations of our business, available borrowing capacity under the Revolving Credit Facility, and cash proceeds received from divestitures. Longer term, if we desire to access alternative sources of funding through the capital and credit markets, challenging global economic conditions could adversely impact our ability to do so. Our principal uses of cash include working capital-related items, capital expenditures, debt service, and strategic investments.
Working capital requirements, which can be substantial and susceptible to fluctuations during the year due to seasonal demands, generally result from sales growth, inventory purchase patterns driven by sales activity and buy-in opportunities, our desired level of inventory, and payment terms for receivables and payables. In addition, we expect that our selling, general and administrative expenses will likely increase through 2020 as we continue to transform our business.
41
We expect to incur additional disbursements in connection with the following activities:
• | Expansion of global sales and marketing efforts, |
• | Increase of our pharmaceutical operations capacity, |
• | International development, |
• | Equity investments and business acquisitions that we may fund from time to time, |
• | Term Loan Facility amortization payments that begin in 2020, |
• | Capital investment in current and future facilities, and |
• | Pursuit and maintenance of appropriate regulatory clearances, approvals for existing products, and any new products that may be developed. |
Similarly, we anticipate that we will continue to incur significant interest expense related to debt service on the Term Loan Facility.
Selected Measures of Liquidity and Capital Resources
(In millions) | December 31, 2019 | December 29, 2018 | December 30, 2017 | ||||||||
Cash and cash equivalents | $ | 130 | $ | 23 | $ | 16 | |||||
Working capital | $ | 511 | $ | 514 | $ | 565 | |||||
We regularly monitor and assess our ability to meet funding requirements. We expect to meet our foreseeable liquidity needs over the next 12 months using our unrestricted cash and cash equivalents of $130 million, cash flow from operations, access to borrowing capacity available under our Revolving Credit Facility, and net cash proceeds to be received from divestitures of non-core business operations.
Cash Flows
The following table summarizes our cash flows from operating, investing, and financing activities:
Years Ended | |||||||||||
(In millions) | December 31, 2019 | December 29, 2018 | December 30, 2017 | ||||||||
Net cash provided by operating activities | $ | 103 | $ | 158 | $ | 108 | |||||
Net cash used for investing activities | $ | (65 | ) | $ | (29 | ) | $ | (129 | ) | ||
Net cash provided by (used for) financing activities | $ | 66 | $ | (120 | ) | $ | 16 | ||||
Cash inflows and outflows from changes in operating activities
We have generated significant cash flows from operations in each of the last three years. The decrease in 2019 from 2018 is primarily due to the additional expenses related to the formation of Covetrus and lower operating earnings.
The increase in net cash provided by operating activities in 2018 over 2017 was driven primarily by growth in the results of operations due to an increase in organic growth, acquisitions, and the development of our working capital.
Cash inflows and outflows from changes in investing activities
The increase in net cash used for investing activities in 2019 was primarily due to a $17 million increase in capital spending for property and equipment and an $18 million increase for business acquisitions.
The decrease in net cash used for investing activities in 2018 over 2017 was driven primarily due to fewer acquisitions occurring in the year ended December 29, 2018.
Cash inflows and outflows from changes in financing activities
Net cash provided by financing activities increased in 2019 from 2018 primarily from debt issuance proceeds of $1.2 billion, net of $24 million debt issuance costs, and a $308 million decrease in acquisitions of non-controlling interest, partially offset by $1.2 billion paid as a dividend to Henry Schein, a reduction in Net former parent investment of $109 million that included the $361
42
million Share Sale and subsequent distribution of proceeds to Henry Schein, and an increase of $41 million in debt repayments primarily related to the Animal Health Business debt.
Net cash used for financing activities in 2018, compared to net cash provided by financing activities in 2017, was driven primarily by the purchase of additional equity interest of Butler Animal Health Holding Company, LLC in the year ended December 29, 2018. In connection with the Separation, Henry Schein purchased additional equity interests in certain consolidated subsidiaries of the Animal Health Business.
Long-term Obligations
We have long-term obligations related to borrowing arrangements and leases that we enter into in the normal course of business (see below and Notes 6 - Leases, 8 - Debt and 11 - Commitments and Contingencies). The following table summarizes our long-term obligations related to fixed and variable rate long-term debt, operating and capital lease obligations, as well as purchase obligations as of December 31, 2019:
Payments Due by Period | |||||||||||||||||||
(In millions) | 2020 | 2021-2022 | 2023-2024 | After 2024 | Total | ||||||||||||||
Long-term debt | $ | 61 | $ | 120 | $ | 1,025 | $ | — | $ | 1,206 | |||||||||
Interest on long-term debt | 45 | 82 | 41 | — | 168 | ||||||||||||||
Operating leases (a) | 24 | 42 | 31 | 132 | 229 | ||||||||||||||
Finance leases, including interest | 1 | — | — | — | 1 | ||||||||||||||
Purchase obligations (b) | 22 | 16 | 14 | 6 | 58 | ||||||||||||||
Total | $ | 153 | $ | 260 | $ | 1,111 | $ | 138 | $ | 1,662 | |||||||||
(a) Includes interest and amounts related to leases executed and expected to commence in future years | |||||||||||||||||||
(b) Purchase obligations include agreements to purchase goods or services that we are committed to: (i) fixed or minimum quantities to be purchased, or (ii) the amount of the termination fee during the requisite notice period. Certain of our contracts contain a variable component aligned with future performance goals which cannot be reasonably estimated at this time | |||||||||||||||||||
Long-term Debt and other borrowings, net
(In millions) | December 31, 2019 | December 29, 2018 | |||||
Term loan payable in quarterly installments of $15 million beginning March 31, 2020 at an interest rate of approximately 4% at December 31, 2019 (Note 8) | $ | 1,200 | $ | — | |||
Various collateralized and uncollateralized loans payable in varying installments through 2023 at an interest rate of 4% at December 31, 2019 and ranging from 2.61% to 5.01% at December 29, 2018 | 6 | 24 | |||||
Finance lease obligations (Note 6) | 1 | 1 | |||||
Total | 1,207 | 25 | |||||
Less current maturities | (62 | ) | (1 | ) | |||
Total long-term debt and other borrowings | 1,145 | 24 | |||||
Less unamortized debt discount | (20 | ) | — | ||||
Total long-term debt and other borrowings, net | $ | 1,125 | $ | 24 | |||
Unrecognized Tax Benefits
We cannot reasonably estimate the timing of future cash flows related to the unrecognized tax benefits, including accrued interest and penalties, of $6 million as of December 31, 2019. See Note 14 - Income Taxes.
Off-balance Sheet Arrangements
As of December 31, 2019, we had $19 million outstanding in standby letters of credit that primarily guarantee our performance under a business acquisition transaction, which expire in April 2020, as well as support our obligations related to our insurance programs (see Note 8 - Debt), and $3 million in surety bonds outstanding in support of various U.S. state registrations for pharmaceutical operations and distributions.
43
Critical Accounting Policies and Estimates
Preparing financial statements in accordance with GAAP involves us making estimates and assumptions that affect reported amounts of assets and liabilities, net sales and expenses, and related disclosures in the accompanying notes at the date of our financial statements. We base our estimates on historical experience, industry and market trends, and on various other assumptions that we believe to be reasonable under the circumstances. However, by their nature, estimates are subject to various assumptions and uncertainties, and changes in circumstances could cause actual results to differ from these estimates, sometimes materially.
We believe that our policies and estimates that require our most significant judgments are considered our critical accounting policies and are discussed below. In addition, refer to Note 1 - Business Overview and Significant Accounting Policies for further details.
Business Acquisitions, Acquired Goodwill, and Intangible Assets
The net assets of businesses acquired are recorded at their fair value and the accounting is based on critical estimates, judgments and assumptions derived from analysis of market conditions, discount rate, discounted cash flows, customer retention rates, and estimated useful lives. We generally allocate purchase price to identifiable intangible assets, accounts receivable, inventory, property and equipment, deferred taxes, and other current and long-term assets and liabilities. Any excess of acquisition consideration over the fair value of identifiable net assets acquired is recorded as goodwill.
In August 2019, as described in Note 7 - Goodwill and Other Intangible Assets, Net, we tested our goodwill for impairment due to certain triggering events. Fair values were estimated using both the income approach, discounting projected future cash flows based on budget projections and growth rates that consider estimated inflation rates, and the market approach, applying a multiple of earnings based on comparable publicly traded companies. The calculation of the impairment charge includes fact-based determinations as well as estimates. Key estimates include weighted-average cost of capital, future levels of gross and operating profits, and projected capital expenditures. The rates used to discount projected future cash flows under the income approach reflect a weighted-average cost of capital in the range of 9.0% to 9.5%, depending on the reporting unit, which considered capital structure and risk premiums, including those reflected in our current market capitalization. We corroborated the reasonableness of the estimated reporting unit fair values by reconciling to our enterprise value and market capitalization.
Based on our analysis, we determined that the carrying value of our reporting units exceeded their fair values. We recorded a non-tax-deductible goodwill impairment charge totaling $938 million in a separate line item, Goodwill impairment, included within the consolidated statement of operations for the year ended December 31, 2019. See Note 7 - Goodwill and Other Intangible Assets, Net for changes in goodwill by reporting unit.
We consider our North America reporting unit's goodwill to be at risk and changes in our forecast of future operating or financial results, cash flows, share price, market capitalization, or discount rate used when conducting future goodwill impairment tests could affect the estimated fair values of this reporting unit and may result in a goodwill impairment charge in the future. For example, we estimate that a 25-basis point increase in the discount rate would result in an additional goodwill impairment charge of approximately $70 million.
Intangible assets other than goodwill, are evaluated for impairment whenever events or changes in circumstances indicate that the carrying amount of the assets may not be recoverable through the estimated undiscounted future cash flows to be derived from such assets.
Definite-lived intangible assets primarily consist of non-compete agreements, trademarks, trade names, customer lists, customer relationships, and intellectual property, and impairment losses are only recorded if the asset’s carrying amount is not recoverable through our undiscounted, probability-weighted future cash flows. We measure the impairment loss based on the difference between the carrying amount and the estimated fair value. When an impairment exists, the related assets are written down to fair value. Other than the goodwill impairment noted above, we did not record any intangible asset impairments during the years ended December 31, 2019, December 29, 2018, and December 30, 2017.
44
Loss Contingencies
We are subject to various claims, including claims with customers and vendors, pending and potential legal actions for damages, investigations relating to governmental laws and regulations, and other matters arising out of the normal course of our business.
Certain of these matters include speculative claims for substantial or indeterminate amounts of damages. We record a liability when we believe that it is probable that a loss has been incurred and the amount can be reasonably estimated. If we determine that a loss is reasonably possible and the loss or range of loss can be estimated, we disclose the possible loss in the notes to our financial statements.
We regularly evaluate developments in our legal matters that could affect whether the amount of the liability can be reasonably estimated and therefore accrued. We adjust our accruals and make changes to our disclosures as appropriate.
Significant judgment is required to determine both probability and the estimated amounts of loss contingencies. Such claims, suits, and proceedings are inherently unpredictable and subject to significant uncertainties, some of which are beyond our control. If any of these estimates and assumptions change, it could have a material impact on our results of operations, financial position, and cash flows.
Income Taxes
We are subject to income taxes in the U.S. and 25 foreign jurisdictions. Significant judgment is required in determining income tax expense, deferred tax assets and liabilities and uncertain tax positions. The underlying assumptions are also highly susceptible to change from period to period.
We accrue for the estimated additional tax and interest that may result from tax authorities disputing uncertain tax positions. We believe we have made adequate provisions for income taxes for all years that are subject to audit based upon the latest information available. We operate within multiple taxing jurisdictions and are subject to tax audits in these jurisdictions. These audits can involve complex issues and may require an extended period of time to resolve. We recognize tax benefits from uncertain tax positions only if we believe that it is more likely than not that the tax position will be sustained on examination by the taxing authorities based on the technical merits of the position. Although we believe that we have adequately reserved for our uncertain tax positions, we can provide no assurance that the final tax outcome of these matters will not be materially different. We adjust these reserves when facts and circumstances change, such as the closing of a tax audit or the refinement of an estimate. To the extent that the final tax outcome of these matters is different than the amounts recorded, such differences may affect the provision for income taxes in the period in which such determination is made and could have an impact on our results of operations.
On a quarterly basis, we assess our current and projected earnings by jurisdiction to determine whether or not our earnings during the periods when the temporary differences become deductible will be sufficient to realize the related future tax benefits. Should we determine that we would not be able to realize all or part of our net deferred tax asset in a particular jurisdiction in the future, a valuation allowance to the deferred tax asset would be charged to income in the period such determination was made. This valuation allowance is maintained for deferred tax assets that we estimate are more likely than not to be unrealizable based on available evidence at the time the estimate is made. The determination of whether a valuation allowance for deferred tax assets is appropriate is subject to considerable judgment and requires an evaluation of all positive and negative evidence, including our historical financial results, the source and consistency of those results, whether they should be adjusted for certain one-time or nonrecurring items, whether losses cumulatively exceed income over a reasonable period of time, the availability of tax planning strategies, availability of carryback and carryforward periods, and other factors, including our expectations of future taxable income. Adjustments to income tax expense to the extent we establish a valuation allowance or adjust this allowance in a period could have a material impact on our financial condition and results of operations. See Note 14 - Income Taxes.
Accounting Standards Update
For information on updated accounting standards that we have recently adopted or will adopt in future periods, see Note 1 - Business Overview and Significant Accounting Policies included under Item 8, Financial Statements and Supplementary Data.
45
Item 7A. | Quantitative and Qualitative Disclosures About Market Risk |
We have exposure to market risks related to changes in foreign currency exchange rates and interest rates as follows:
Foreign Currency Risk
The value of certain foreign currencies as compared to the U.S. dollar and the value of certain of our underlying functional currencies, including our foreign subsidiaries, may affect our financial results. Fluctuations in exchange rates, for which we currently conduct our operations in multiple currencies, may positively or negatively affect revenues, gross margins, and operating expenses, all of which are presented in U.S. dollars. We attempt to offset foreign currency assets and liabilities where and when possible, but have not, as of December 31, 2019, entered into hedging arrangements. In the future, we may evaluate and decide, to the extent reasonable and practical, to enter into foreign currency forward exchange contracts with financial institutions. If we were to enter into such hedging transactions, the market risk resulting from foreign currency fluctuations is unlikely to be entirely eliminated. We do not plan to enter into derivative financial instruments for trading or speculative purposes.
We have exposure to Brexit as approximately 13% of our annual revenue and 4% of our annual net income is generated by our operations located within the UK, which adds incremental GBP/USD foreign exchange risk to our operating results. The primary Brexit risk we face is supply chain-related, specifically for our replenishment of certain inventory stock sourced from UK vendors who may manufacture such goods in their subsidiaries outside the UK and thus need to import those goods into the UK. As a result of uncertainty created by Brexit, we have increased, and may continue to increase, our inventory of such vendor-imported goods by an additional 10% - 20% to satisfy potential customer demand, which will expose us to incremental foreign exchange risk.
As of December 31, 2019, a hypothetical 5% increase in foreign exchange rates where we conduct our business vis-à-vis the U.S. dollar would have resulted in an improvement of $8 million in annualized operating income.
Conversely, a hypothetical 5% decrease in foreign exchange rates would have resulted in a decrease of $9 million in annualized operating income.
Interest Rate Risk
At December 31, 2019, we had variable-rate borrowings outstanding of $1.2 billion under the Credit Facility. Increases in the underlying interest rate elections we make will negatively affect interest expense, while decreases to the underlying interest rates will have a positive influence on our interest expense. We regularly review the projected borrowings under the Credit Facility and the current interest rate environment.
In July and August 2019, we executed interest rate swap contracts with notional amounts aggregating $500 million that are designated as cash flow hedges. See Note 9 - Derivatives and Financial Instruments. Our earnings are affected by changes in interest rates, however, due to our interest rate swap contracts, the effects are mitigated to an extent.
If market interest rates increase 1% over the next 12 months, our net interest expense, after considering the effects of our interest rate swap contracts, would increase by $7 million.
Conversely, if market interest rates decrease 1% over the next 12 months, our net interest expense, after considering the effects of our interest rate swap contracts, would decrease by $7 million.
The market risk resulting from interest rate fluctuations will not be entirely eliminated through our interest rate swap contracts.
Short-term Investments
We limit our credit risk with respect to our cash equivalents and short-term investments by monitoring the credit worthiness of the counterparties to such financial instruments. As a risk management policy, we limit credit exposure by diversifying such investments among investment grade counterparties.
46
Item 8. | Financial Statements and Supplementary Data |
INDEX TO CONSOLIDATED AND COMBINED FINANCIAL STATEMENTS
Page | |
47
Report of Independent Registered Public Accounting Firm
Board of Directors and Shareholders
Covetrus, Inc.
Portland, ME
Opinion on the Consolidated and Combined Financial Statements
We have audited the accompanying consolidated and combined balance sheets of Covetrus, Inc. (the “Company”) as of December 31, 2019 and December 29, 2018, the related consolidated and combined statements of operations, comprehensive income (loss), shareholders’ equity, and cash flows for each of the three years in the period ended December 31, 2019, and the related notes (collectively referred to as the “consolidated and combined financial statements”). In our opinion, the consolidated and combined financial statements present fairly, in all material respects, the financial position of the Company at December 31, 2019 and December 29, 2018, and the results of its operations and its cash flows for each of the three years in the period ended December 31, 2019, in conformity with accounting principles generally accepted in the United States of America.
Basis for Opinion
These consolidated and combined financial statements are the responsibility of the Company’s management. Our responsibility is to express an opinion on the Company’s consolidated and combined financial statements based on our audits. We are a public accounting firm registered with the Public Company Accounting Oversight Board (United States) (“PCAOB”) and are required to be independent with respect to the Company in accordance with the U.S. federal securities laws and the applicable rules and regulations of the Securities and Exchange Commission and the PCAOB.
We conducted our audits in accordance with the standards of the PCAOB. Those standards require that we plan and perform the audit to obtain reasonable assurance about whether the consolidated and combined financial statements are free of material misstatement, whether due to error or fraud. The Company is not required to have, nor were we engaged to perform, an audit of its internal control over financial reporting. As part of our audits we are required to obtain an understanding of internal control over financial reporting but not for the purpose of expressing an opinion on the effectiveness of the Company’s internal control over financial reporting. Accordingly, we express no such opinion.
Our audits included performing procedures to assess the risks of material misstatement of the consolidated and combined financial statements, whether due to error or fraud, and performing procedures that respond to those risks. Such procedures included examining, on a test basis, evidence regarding the amounts and disclosures in the consolidated and combined financial statements. Our audits also included evaluating the accounting principles used and significant estimates made by management, as well as evaluating the overall presentation of the consolidated and combined financial statements. We believe that our audits provide a reasonable basis for our opinion.
Change in Accounting Principle
As discussed in Note 1 to the consolidated financial statements, effective January 1, 2019, the Company adopted Accounting Standards Codification Topic 842, Leases (Topic 842).
Emphasis of Matter
As described in Note 1, the financial statements of the Animal Health Business are not those of a standalone entity. The combined financial statements of the Animal Health Business as of December 29, 2018 and for the two years in the period ended December 29, 2018 reflect the assets, liabilities, revenues, and expenses directly attributable to the Animal Health Business, as well as allocations deemed reasonable by management, to present the financial position, results of operations, changes in equity, and cash flows of the Animal Health Business on a standalone basis and do not necessarily reflect the financial position, results of operations, changes in equity, and cash flows of the Animal Health Business in the future or what they would have been had the Animal Health Business been a separate, standalone entity during the periods presented.
/s/ BDO USA, LLP
We have served as the Company’s auditor since 2018.
Boston, MA
March 3, 2020
48
COVETRUS, INC.
CONSOLIDATED AND COMBINED BALANCE SHEETS
(In millions, except share amounts)
December 31, 2019 | December 29, 2018 | ||||||
ASSETS | |||||||
Current assets: | |||||||
Cash and cash equivalents | $ | 130 | $ | 23 | |||
Accounts receivable, net of allowance of $8 and $7 (Note 4) | 426 | 431 | |||||
Inventories, net | 636 | 564 | |||||
Other receivables | 67 | 49 | |||||
Prepaid expenses and other | 30 | 19 | |||||
Assets held for sale (Note 3) | 51 | — | |||||
Total current assets | 1,340 | 1,086 | |||||
Non-current assets: | |||||||
Property and equipment, net (Note 5) | 93 | 69 | |||||
Operating lease right-of-use assets, net (Note 6) | 84 | — | |||||
Goodwill (Note 7) | 1,154 | 750 | |||||
Other intangibles, net (Note 7) | 643 | 208 | |||||
Investments and other | 47 | 120 | |||||
Total assets | $ | 3,361 | $ | 2,233 | |||
LIABILITIES, REDEEMABLE NON-CONTROLLING INTERESTS, AND SHAREHOLDERS' EQUITY | |||||||
Current liabilities: | |||||||
Accounts payable | $ | 520 | $ | 440 | |||
Current maturities of long-term debt and other borrowings (Note 8) | 62 | 1 | |||||
Accrued payroll and related liabilities | 44 | 37 | |||||
Accrued taxes | 18 | 17 | |||||
Other current liabilities | 164 | 77 | |||||
Liabilities held for sale (Note 3) | 21 | — | |||||
Total current liabilities | 829 | 572 | |||||
Non-current liabilities: | |||||||
Long-term debt and other borrowings, net (Note 8) | 1,125 | 24 | |||||
Deferred income taxes | 47 | 16 | |||||
Other liabilities | 94 | 35 | |||||
Total liabilities | 2,095 | 647 | |||||
Commitments and contingencies (Note 11) | |||||||
Redeemable non-controlling interests (Note 12) | 10 | 92 | |||||
Shareholders' equity: | |||||||
Common stock, $0.01 par value per share, 675,000,000 shares authorized as of December 31, 2019; 111,620,507 shares issued and outstanding as of December 31, 2019 | 1 | — | |||||
Net former parent investment | — | 1,576 | |||||
Accumulated other comprehensive loss (Note 13) | (86 | ) | (82 | ) | |||
Additional paid-in capital | 2,381 | — | |||||
Accumulated deficit | (1,040 | ) | — | ||||
Total shareholders’ equity | 1,256 | 1,494 | |||||
Total liabilities, redeemable non-controlling interests, and shareholders’ equity | $ | 3,361 | $ | 2,233 | |||
See notes to consolidated and combined financial statements.
49
COVETRUS, INC.
CONSOLIDATED AND COMBINED STATEMENTS OF OPERATIONS
(In millions, except per share amounts)
Years Ended | |||||||||||
December 31, 2019 | December 29, 2018 | December 30, 2017 | |||||||||
Net sales (Note 4) | $ | 3,976 | $ | 3,778 | $ | 3,580 | |||||
Cost of sales | 3,227 | 3,094 | 2,928 | ||||||||
Gross profit | 749 | 684 | 652 | ||||||||
Operating expenses: | |||||||||||
Selling, general and administrative | 808 | 547 | 517 | ||||||||
Goodwill impairment (Note 7) | 938 | — | — | ||||||||
Operating (loss) income | (997 | ) | 137 | 135 | |||||||
Other income (expense): | |||||||||||
Interest income | 7 | 6 | 5 | ||||||||
Interest expense | (56 | ) | (3 | ) | (2 | ) | |||||
Other, net | 17 | 3 | 1 | ||||||||
(Loss) income before taxes and equity in earnings of affiliates | (1,029 | ) | 143 | 139 | |||||||
Income tax benefit (expense) (Note 14) | 7 | (37 | ) | (48 | ) | ||||||
Equity in earnings of affiliates | — | 1 | 1 | ||||||||
Net (loss) income | (1,022 | ) | 107 | 92 | |||||||
Less: net loss (income) attributable to redeemable non-controlling interests | 3 | (6 | ) | (28 | ) | ||||||
Net (loss) income attributable to Covetrus | $ | (1,019 | ) | $ | 101 | $ | 64 | ||||
(Loss) earnings per share attributable to Covetrus: (Note 15) | |||||||||||
Basic | $ | (9.50 | ) | $ | 1.41 | $ | 0.90 | ||||
Diluted | $ | (9.50 | ) | $ | 1.40 | $ | 0.89 | ||||
Weighted-average common shares outstanding: | |||||||||||
Basic | 107 | 71 | 71 | ||||||||
Diluted | 107 | 72 | 72 | ||||||||
See notes to consolidated and combined financial statements.
50
COVETRUS, INC.
CONSOLIDATED AND COMBINED STATEMENTS OF COMPREHENSIVE INCOME (LOSS)
(In millions)
Years Ended | |||||||||||
December 31, 2019 | December 29, 2018 | December 30, 2017 | |||||||||
Net (loss) income | $ | (1,022 | ) | $ | 107 | $ | 92 | ||||
Other comprehensive (loss) income, net of tax: | |||||||||||
Foreign currency translation (loss) gain | (3 | ) | (43 | ) | 62 | ||||||
Unrealized (loss) gain from foreign currency hedging activities | — | (1 | ) | 1 | |||||||
Unrealized loss on derivative instruments | (1 | ) | — | — | |||||||
Pension adjustment gain | — | 2 | — | ||||||||
Total other comprehensive (loss) income | (4 | ) | (42 | ) | 63 | ||||||
Comprehensive (loss) income | (1,026 | ) | 65 | 155 | |||||||
Comprehensive loss (income) attributable to redeemable non-controlling interests: | |||||||||||
Net loss (income) | 3 | (6 | ) | (28 | ) | ||||||
Foreign currency translation (gain) loss | (1 | ) | 2 | (3 | ) | ||||||
Less: comprehensive loss (income) attributable to redeemable non-controlling interests | 2 | (4 | ) | (31 | ) | ||||||
Comprehensive (loss) income attributable to Covetrus | $ | (1,024 | ) | $ | 61 | $ | 124 | ||||
See notes to consolidated and combined financial statements.
51
COVETRUS, INC.
CONSOLIDATED AND COMBINED STATEMENTS OF SHAREHOLDERS' EQUITY
(In millions, except share amounts)
Common Stock | Additional Paid-in Capital | Accumulated Deficit | Accumulated Other Comprehensive Loss | Net Former Parent Investment | Total Shareholders' Equity | ||||||||||||||||||||||
Shares | Amount | ||||||||||||||||||||||||||
December 31, 2016 | — | $ | — | $ | — | $ | — | $ | (102 | ) | $ | 1,222 | $ | 1,120 | |||||||||||||
Net income attributable to Covetrus | — | — | — | — | — | 64 | 64 | ||||||||||||||||||||
Other comprehensive income | — | — | — | — | 60 | — | 60 | ||||||||||||||||||||
Net increase in former parent investment | — | — | — | — | — | 13 | 13 | ||||||||||||||||||||
December 30, 2017 | — | — | — | — | (42 | ) | 1,299 | 1,257 | |||||||||||||||||||
Net income attributable to Covetrus | — | — | — | — | — | 101 | 101 | ||||||||||||||||||||
Cumulative impact of adopting ASC 606 | — | — | — | — | — | 2 | 2 | ||||||||||||||||||||
Net increase in former parent investment | — | — | — | — | — | 174 | 174 | ||||||||||||||||||||
Other comprehensive loss | — | — | — | — | (40 | ) | — | (40 | ) | ||||||||||||||||||
December 29, 2018 | — | — | — | — | (82 | ) | 1,576 | 1,494 | |||||||||||||||||||
Net (loss) income attributable to Covetrus (a) | — | — | — | (1,040 | ) | — | 21 | (1,019 | ) | ||||||||||||||||||
Dividend to former parent | — | — | (21 | ) | — | — | (1,153 | ) | (1,174 | ) | |||||||||||||||||
Issuance of shares at Separation (including Share Sale investors) | 71,693,426 | 1 | 608 | — | — | (609 | ) | — | |||||||||||||||||||
Issuance of shares in connection with the Acquisition (b) | 39,742,089 | — | 1,772 | — | — | — | 1,772 | ||||||||||||||||||||
Shares canceled (b) | (700,400 | ) | — | (30 | ) | — | — | — | (30 | ) | |||||||||||||||||
Net increase in former parent investment | — | — | — | — | — | 172 | 172 | ||||||||||||||||||||
Issuance of shares in connection with share-based compensation plans | 885,392 | — | 5 | — | — | — | 5 | ||||||||||||||||||||
Share-based compensation | — | — | 46 | — | — | — | 46 | ||||||||||||||||||||
Deferred tax impact of acquisition of non-controlling interest | — | — | — | — | — | (7 | ) | (7 | ) | ||||||||||||||||||
Other | — | — | 1 | — | — | — | 1 | ||||||||||||||||||||
Other comprehensive loss | — | — | — | — | (4 | ) | — | (4 | ) | ||||||||||||||||||
December 31, 2019 | 111,620,507 | $ | 1 | $ | 2,381 | $ | (1,040 | ) | $ | (86 | ) | $ | — | $ | 1,256 | ||||||||||||
(a) Net income earned from January 1, 2019 through February 7, 2019 is attributed to the former parent as it was the sole shareholder prior to February 7, 2019 | |||||||||||||||||||||||||||
(b) See Note 2 - Business Acquisitions | |||||||||||||||||||||||||||
See notes to consolidated and combined financial statements.
52
COVETRUS, INC.
CONSOLIDATED AND COMBINED STATEMENTS OF CASH FLOWS
(In millions)
Years Ended | |||||||||||
December 31, 2019 | December 29, 2018 | December 30, 2017 | |||||||||
Cash flows from operating activities: | |||||||||||
Net (loss) income | $ | (1,022 | ) | $ | 107 | $ | 92 | ||||
Adjustments to reconcile net (loss) income to net cash provided by operating activities: | |||||||||||
Depreciation and amortization | 155 | 64 | 59 | ||||||||
Amortization of right-of-use assets | 21 | — | — | ||||||||
Goodwill impairment | 938 | — | — | ||||||||
Share-based compensation expense | 46 | 7 | 7 | ||||||||
(Benefit) provision for deferred income taxes | (25 | ) | (5 | ) | 6 | ||||||
Equity in earnings of affiliates | — | (1 | ) | (1 | ) | ||||||
Amortization of debt issuance costs | 5 | — | — | ||||||||
Other | (10 | ) | — | — | |||||||
Changes in operating assets and liabilities, net of acquisitions: | |||||||||||
Accounts receivable, net | 13 | (13 | ) | (33 | ) | ||||||
Inventories, net | (58 | ) | (42 | ) | (23 | ) | |||||
Other assets and liabilities | (53 | ) | (34 | ) | (5 | ) | |||||
Accounts payable and accrued expenses | 93 | 75 | 6 | ||||||||
Net cash provided by operating activities | 103 | 158 | 108 | ||||||||
Cash flows from investing activities: | |||||||||||
Purchases of property and equipment | (39 | ) | (22 | ) | (21 | ) | |||||
Payments related to equity investments and business acquisitions, net of cash acquired | (26 | ) | (8 | ) | (109 | ) | |||||
Proceeds from sale of property and equipment | — | 1 | 1 | ||||||||
Net cash used for investing activities | (65 | ) | (29 | ) | (129 | ) | |||||
Cash flows from financing activities: | |||||||||||
Proceeds from the issuance of debt | 1,220 | — | — | ||||||||
Principal payments of debt | (43 | ) | (2 | ) | — | ||||||
Debt issuance costs | (24 | ) | — | — | |||||||
Dividend paid to former parent | (1,174 | ) | — | — | |||||||
Issuance of common shares in connection with share-based compensation plans | 5 | — | — | ||||||||
Net transfers from former parent | 165 | 274 | 62 | ||||||||
Distributions to non-controlling shareholders | — | (10 | ) | (20 | ) | ||||||
Acquisition payment | (9 | ) | — | — | |||||||
Acquisitions of non-controlling interests in subsidiaries | (74 | ) | (382 | ) | (26 | ) | |||||
Net cash provided by (used for) financing activities | 66 | (120 | ) | 16 | |||||||
Effect of exchange rate changes on cash and cash equivalents | 3 | (2 | ) | 2 | |||||||
Net change in cash and cash equivalents | 107 | 7 | (3 | ) | |||||||
Cash and cash equivalents, beginning of period | 23 | 16 | 19 | ||||||||
Cash and cash equivalents, end of period | $ | 130 | $ | 23 | $ | 16 | |||||
Supplemental cash flow disclosures: | |||||||||||
Interest | $ | 47 | $ | — | $ | — | |||||
Income taxes | $ | 18 | $ | 12 | $ | 8 | |||||
See notes to consolidated and combined financial statements.
53
COVETRUS, INC.
NOTES TO CONSOLIDATED AND COMBINED FINANCIAL STATEMENTS
(In millions, except per share amounts)
1. Business Overview and Significant Accounting Policies
Business
Covetrus is a global animal-health technology and services company dedicated to supporting the companion, equine, and large-animal veterinary markets.
On February 7, 2019, Henry Schein completed the spin-off of its Animal Health Business and transferred the applicable assets, liabilities, and ownership interests to us (the “Separation”) and distributed all the shares of our common stock that were then owned by Henry Schein to its stockholders of record as of January 17, 2019 (the “Distribution”). Also, on February 7, 2019 and prior to the Distribution, we sold $361 million in shares to accredited institutional investors (the “Share Sale”). The proceeds from the Share Sale were paid to us and distributed to Henry Schein. Concurrent with the Distribution, we paid a cash dividend of $1.2 billion from loan proceeds from our newly established credit facility (see Note 8 - Debt). We then acquired Vets First Choice in an all-stock transaction (the “Acquisition”).
Immediately following the Share Sale, Distribution, and Acquisition, on a fully diluted basis, (i) approximately 63% of our outstanding common stock was owned by (a) shareholders of Henry Schein and the Share Sale investors, and (b) specific employees of the Animal Health Business who held certain equity awards, and (ii) approximately 37% was owned by (a) shareholders of Vets First Choice, and (b) certain employees of Vets First Choice who held certain equity awards. On February 8, 2019, our common stock began regular-way trading under the symbol “CVET” on the Nasdaq Global Select Market.
Basis of Presentation and Principles of Consolidation
We prepared the accompanying consolidated and combined financial statements in accordance with GAAP.
Except as otherwise specifically noted, the combined financial statements and other financial information for the fiscal years ended December 29, 2018 and December 30, 2017 relate to the Animal Health Business, as these periods predate the February 7, 2019 effective date of the Acquisition. This Form 10-K does not include the historical financial results of Vets First Choice for the fiscal years ended December 29, 2018 and December 30, 2017 and does not include any pro forma financial statements of Covetrus.
Beginning with the Quarterly Report on Form 10-Q for the quarter ended March 31, 2019, Covetrus began reporting on a consolidated basis, representing the combined operations of the Animal Health Business and Vets First Choice and their respective subsidiaries. The Animal Health Business is deemed the acquirer in this combination for accounting purposes under GAAP, therefore, the Animal Health Business is considered Covetrus’ predecessor and the historical combined financial statements of the Animal Health Business prior to February 7, 2019 are reflected in Covetrus’ quarterly and annual reports as Covetrus’ historical financial statements.
The accompanying consolidated and combined financial statements include the operations of the Company as well as those of our wholly-owned and majority-owned subsidiaries from their respective dates of inception or acquisition. All significant intercompany transactions and balances are eliminated in consolidation. All intracompany transactions have been eliminated and all intercompany transactions between the Animal Health Business and Henry Schein have been eliminated in these combined financial statements as such transactions were deemed to not have occurred between us and Henry Schein. Investments in unconsolidated affiliates, which are 20% to 50% owned, or investments of less than 20% in which we could influence the operating or financial decisions, are accounted for under the equity method.
The combined financial statements include expense allocations for (i) certain corporate functions historically provided by Henry Schein, including accounting, legal, information services, planning, compliance, investor relations, administration and communication, and similar costs, (ii) employee benefits and incentives, and (iii) share-based compensation. These expenses have been allocated to the Animal Health Business based on direct usage when identifiable, with the remainder allocated on a pro rata basis of net sales, headcount, or other measures of the Animal Health Business and Henry Schein. The Animal Health Business believes the bases on which the expenses have been allocated are a reasonable reflection of the utilization of services provided to, or the benefit received by, the Animal Health Business during the periods presented. The allocations may not, however, reflect the actual expenses that the Animal Health Business would have incurred as a stand-alone company for the periods presented. Actual costs that may have been incurred if the Animal Health Business had been a stand-alone company would depend on a number of
54
COVETRUS, INC.
NOTES TO CONSOLIDATED AND COMBINED FINANCIAL STATEMENTS (Continued)
(In millions, except per share amounts)
factors, including the chosen organizational structure, what functions were outsourced or performed by employees, and strategic decisions made in areas such as information technology and infrastructure. Following the Separation, these functions have been performed using our own resources or third-party service providers. Some of these functions may continue to be provided by Henry Schein under transition services agreements through February 2021.
Certain prior period amounts were reclassified to conform to the current presentation.
During the fourth quarter ended December 31, 2019, we recorded a revision to our deferred tax adjustment due to our reassessment of our judgment in the third quarter ended September 30, 2019 on the realizability of deferred tax assets. In the aggregate, the revisions to our tax valuation allowance, including a revision for a deferred tax calculation error that pre-dates the Separation, Distribution and Acquisition, were $53 million. We have concluded that this adjustment was not material to any previously issued financial statements or to our full fiscal year 2019 results. See Note 14 - Income Taxes.
Use of Estimates
Preparing financial statements in conformity with GAAP requires us to make estimates and assumptions that affect the amounts reported and disclosed in the financial statements and accompanying notes. Changes in circumstances could cause actual results to differ materially from these estimates. The most significant estimates include our evaluation of goodwill impairment, intangible assets acquired, fair value of our derivatives, share-based compensation, self-insurance reserves, and supplier rebates.
Fiscal Year
During fiscal years 2017 and 2018, we operated on a 52-53-week basis ending on the last Saturday of December. For fiscal year 2019, we adopted a last day of the calendar year accounting and operating cycle. We made this change on a prospective basis and did not adjust operating results for periods prior to 2019 as the result was not material.
Revenue Recognition
We recognize revenue when a customer obtains control of promised goods or services in an amount that reflects the consideration that we expect to receive for those goods or services. To recognize revenue, we do the following:
• | Identify the contract(s) with a customer, |
• | Identify the performance obligations in the contract, |
• | Determine the transaction price, |
• | Allocate the transaction price to the performance obligations in the contract, and |
• | Recognize revenue when, or as, the entity satisfies a performance obligation. |
Our revenue is generated from the following major product categories:
• | Supply Chain Services - primarily includes the sale of animal-health consumable products, including our own proprietary and Covetrus branded products, small equipment, laboratory products, large equipment, equipment repair services, branded and generic pharmaceuticals, vaccines, surgical products, diagnostic tests, infection-control products, and vitamins and supplements to wholesale and retail customers. Our value-added practice solutions include financial services, equipment repair, inventory management, e-commerce, as well as continuing education services for practitioners. |
• | Software Solutions - includes practice management software systems for veterinary practitioners and animal-health clinics, client communication services, reminders, data backup services, and hardware sales and support. |
• | Prescription Management - includes the distribution of finished goods pharmacy products, specialty pharmaceutical compounding, e-commerce, shipping, manufacturer incentives, service fees, and data integration and support services. |
We estimate the transaction price at contract inception, including any variable consideration, and update the estimate each reporting period for any changes in circumstances. Variable consideration, including provisions for discounts, rebates to customers, customer returns, and other contra revenue adjustments is included in the transaction price at contract inception by estimating the most likely amount based upon historical data and estimates and are provided for in the period in which the related sales are recognized.
55
COVETRUS, INC.
NOTES TO CONSOLIDATED AND COMBINED FINANCIAL STATEMENTS (Continued)
(In millions, except per share amounts)
Many of our contracts with customers require us to take possession of the inventory, provide the goods or services, and establish the price for the goods or services. Revenue and cost of sales from this type of contract are recognized on a gross basis. From time to time, certain contracts require us to arrange for the procurement of goods or services on behalf of our customer, but we do not purchase or take title of the product from the supplier before they are transferred to our customer. In this type of contract, we are acting as an agent and revenue is recognized on a net basis (revenue less cost of sales is included in Net sales) (“Net Agency Revenue”), as the supplier is the primary obligor, bears the inventory and credit risk, establishes the price, picks, packs, and ships the product, determines the product specifications, and the amount is fixed. Payment terms differ by customer and jurisdiction, but generally range from 30 to 60 days.
Supply Chain Services
Revenue derived from the sale of consumable products is recognized at a point in time when control transfers to the customer. Such sales typically entail high-volume, low-dollar orders shipped using third-party common carriers. We believe that the shipment date is the most appropriate point in time indicating control has transferred to the customer because we have no post-shipment obligations, and this is when legal title and risks and rewards of ownership transfer to the customer and we have an enforceable right to payment.
Revenue derived from the sale of equipment is recognized when control transfers to the customer. This generally occurs when the equipment is delivered. Such sales typically entail scheduled deliveries of large equipment primarily by equipment service technicians. Some equipment sales require minimal installation which is typically completed at the time of delivery. Our products generally carry standard warranty terms provided by the manufacturer, however, in instances where we provide warranty labor services, the warranty costs are accrued in the period the related revenue is recognized.
Software Solutions
Revenue derived from the sale of software products is recognized when products are shipped to customers or made available electronically. Such software is generally installed by customers and does not require extensive training due to the nature of its design. Revenue derived from post-contract customer support for software, including annual support, is generally recognized over the life of the support period while revenue from training services is recognized over the period the services are provided.
Prescription Management
Revenue under this category is primarily generated from two sources: (i) prescription management and pharmacy services (including the distribution of finished goods products, specialty pharmaceutical compounding, shipping, manufacturer incentives, and service fees), which is recognized when control transfers to the customer, typically upon shipment or delivery, and (ii) data integration and support services (including software as a service, initial setup to connect customers to hosted software applications, data conversions, custom software developments, upgrades and enhancements, training, software configuration, and technical support), which is recognized over the period the services are provided.
Other Revenue
Revenue derived from other sources, including freight charges and equipment repairs, is recognized when the related product revenue is recognized or when the services are provided. We applied the practical expedient to treat shipping and handling activities performed after the customer obtains control as fulfillment activities, rather than a separate performance obligation in the contract.
Certain of our revenue is derived from bundled arrangements that include multiple distinct performance obligations that are accounted for separately. When we sell software products together with related services (e.g., training and technical support), we allocate revenue to software using the residual method, utilizing an estimate of our standalone selling price to estimate the fair value of the undelivered elements. There have not been any cases where revenue is deferred due to a lack of a standalone selling price. Bundled arrangements that include elements that are not considered software consist primarily of equipment and the related installation service. We allocate revenue for such arrangements based on the relative selling prices of the goods or services. If an observable selling price is not available because we do not sell the goods or services separately, we use one of the following techniques to estimate the standalone selling price: (i) adjusted market approach, (ii) cost-plus approach, or (iii) the residual method. There is no specific hierarchy for the use of these methods, but the relative selling price reflects our best estimate of what
56
COVETRUS, INC.
NOTES TO CONSOLIDATED AND COMBINED FINANCIAL STATEMENTS (Continued)
(In millions, except per share amounts)
the selling prices of each deliverable would be if it were sold regularly on a standalone basis, taking into consideration the cost structure of the business, technical skill required, customer location, and other market conditions.
Sales, value-add, and other taxes we collect concurrently with revenue-producing activities are excluded from revenue, but rather are recorded as liabilities and included in Accrued taxes. See Note 4 - Revenue from Contracts with Customers and Note 18 - Segment Data for additional disclosures.
Contract Balances
Contract balances represent amounts presented in the consolidated and combined balance sheets when we have either transferred goods or services to the customer or the customer has paid consideration to us under the contract. These contract balances include accounts receivable, contract assets, and contract liabilities.
Accounts Receivable
The carrying amount of accounts receivable is reduced by an allowance that reflects our best estimate of the amounts that will not be collected. In addition to reviewing delinquent accounts receivable, we consider many factors in estimating our allowance for doubtful accounts including historical data, experience, customer types, creditworthiness, and economic trends. From time to time, we adjust our assumptions for anticipated changes in any of these or other factors expected to affect collectability. Accounts receivable are written-off when it is probable that all contractual payments due will not be collected.
Contract Assets
Contract assets include amounts related to any conditional right to consideration for work completed as of the reporting date and generally represent amounts owed to us by customers, but not yet billed. Contract assets are transferred to Accounts receivable when the right becomes unconditional. Current contract assets are included in Prepaid expenses and other and non-current contract assets are included in Investments and other within the consolidated and combined balance sheets. The contract assets primarily relate to the bundled arrangements for the sale of equipment and consumables and sales of term software licenses.
Contract Liabilities
Contract liabilities are comprised of advance payments and deferred revenue amounts. Contract liabilities are transferred to revenue once the performance obligation has been satisfied. Current contract liabilities are included in Other current liabilities and non-current contract liabilities are included in Other liabilities within the consolidated and combined balance sheets. The contract liabilities primarily relate to advance payments from customers and upfront payments for service arrangements provided over time.
Sales Returns
Sales returns are recognized as a reduction of revenue by the amount of expected returns and are recorded as a refund liability within Other current liabilities. We estimate the amount of revenue expected to be reversed to calculate the sales return liability based on historical data for specific products, adjusted as necessary for new products. The allowance for returns is presented gross as a refund liability, and we record an inventory asset (and a corresponding adjustment to Cost of sales) for any goods or services that we expect to be returned.
Prior to the Adoption of Topic 606
Results for reporting periods beginning after December 30, 2017 are presented under “Revenue from Contracts with Customers (Topic 606)”, while prior period amounts continue to be reported under “Revenue Recognition (Topic 605)”, the accounting standard in effect for those periods.
Cash and Cash Equivalents
We maintain cash depository accounts with banks throughout the world and invest in high quality, short-term, liquid instruments. Such investments are made only in instruments issued by high-quality institutions. These investments mature within three months, and we have not incurred any related losses for the years ended December 31, 2019, December 29, 2018, and December 30, 2017.
57
COVETRUS, INC.
NOTES TO CONSOLIDATED AND COMBINED FINANCIAL STATEMENTS (Continued)
(In millions, except per share amounts)
Inventories
Inventories consist primarily of finished goods and are valued at the lower of cost or net realizable value. When inventory is adjusted to net realizable value, the corresponding adjustment is included in Cost of sales. Cost is determined by the first-in, first-out method for merchandise or actual cost for large equipment and high-tech equipment. In accordance with our policy for inventory valuation, we consider many factors, including the condition and salability of the inventory, historical sales, forecasted sales, and market and economic trends. From time to time, we adjust our assumptions for anticipated changes in any of these or other factors expected to affect the value of inventory. In addition, we record a liability for unconditional purchase commitments with contract suppliers for quantities greater than future demand forecasts consistent with excess and obsolete inventory valuations. As of December 31, 2019 and December 29, 2018, we did not record any liability related to excess unconditional purchase commitments.
Assets and Liabilities Held for Sale
Assets and liabilities are considered held for sale when certain criteria are met, including when management has committed to a plan to sell the asset, the asset is available for sale in its immediate condition, and the sale is probable within one year of the reporting date. Assets and liabilities held for sale are reported at the lower of cost or fair value less costs to sell. See Note 3 - Held for Sale.
Shipping and Handling Costs
Freight and other direct shipping costs are included in Cost of sales. Direct handling costs, which represent primarily direct compensation costs of employees who pick, pack, and otherwise prepare, if necessary, merchandise for shipment to customers, are reflected in Selling, general and administrative.
Advertising
Advertising costs are charged to operations when incurred as part of Selling, general and administrative. We receive reimbursements from certain vendors for advertising costs. Reimbursements for advertising costs are reported on a net basis within Selling, general and administrative. When reimbursements received are more than the cost of advertising, the net amount is reported within Cost of sales. Advertising expense was $17 million in 2019, $16 million in 2018, and $15 million in 2017. Additionally, advertising and promotional costs incurred in connection with direct marketing, including product catalogs and printed materials, are deferred and amortized on a straight-line basis over the period that is benefited, typically one year. Deferred direct marketing expenses included in Prepaid expenses and other were not material in 2019 and 2018.
Supplier Rebates
We receive quarterly and annual performance rebates from suppliers based upon attainment of certain sales and/or purchase goals. Supplier rebates are included as a reduction of Cost of sales and are recognized over the period they are earned. The factors considered in estimating supplier rebate accruals include forecasted inventory purchases and sales in conjunction with supplier rebate contract terms, which generally provide for increasing rebates based on either increased purchase or sales volume.
Property and Equipment
Property and equipment are stated at cost, net of accumulated depreciation and amortization. Depreciation is computed primarily under the straight-line method. Amortization of leasehold improvements is computed using the straight-line method over the lesser of the useful life of the assets or the lease term. See Note 5 - Property and Equipment, Net.
Capitalized software costs consist of costs to purchase and develop software. Costs incurred during the application development stage for software bought and further customized by outside suppliers for use, software developed by a supplier for proprietary use, and costs incurred for our own personnel who are directly associated with software development are capitalized.
58
COVETRUS, INC.
NOTES TO CONSOLIDATED AND COMBINED FINANCIAL STATEMENTS (Continued)
(In millions, except per share amounts)
Income Taxes
We account for income taxes under an asset and liability approach that requires the recognition of deferred income tax assets and liabilities for the expected future tax consequences of events that have been recognized in the financial statements or tax returns. In estimating future tax consequences, we generally consider all expected future events other than enactments of changes in tax laws or rates. The effect on deferred income tax assets and liabilities of a change in tax rates is recognized as income or expense in the period of the enactment date. See Note 14 - Income Taxes.
Our tax provision for fiscal years 2018 and 2017 were prepared utilizing the separate return methodology as if we had not been included in a consolidated or group income tax return with Henry Schein. Current income tax liabilities are presented based on current amounts owed for the current tax year for entities that file separate returns. Current taxes payable for entities that joined in a consolidated or group filing with Henry Schein were settled in Net former parent investment consistent with other intercompany obligations.
Share-based Compensation
Share-based compensation represents the cost related to share-based awards granted to employees and non-employee directors. We determine the fair value of share-based payment awards using the Black-Scholes model which is affected by the stock price and several assumptions, including expected volatility, expected life, risk-free interest rate, and expected dividends. We recognize share-based compensation expense, net of estimated expected forfeitures, on a straight-line basis over the requisite service period of the award, which is included in Selling, general and administrative in our consolidated and combined statements of operations.
Foreign Currency Translation and Transactions
The financial position and results of operations of our foreign subsidiaries are determined using local currency as the functional currency. Assets and liabilities of these subsidiaries are translated at the exchange rate in effect at each year-end. Statement of operations accounts are translated at the average rate of exchange prevailing during the year. Translation adjustments arising from the use of differing exchange rates from period-to-period are included in Accumulated other comprehensive loss in equity. Gains and losses resulting from foreign currency transactions are included in earnings.
Derivatives and Financial Instruments
Our global business exposes us to risks related to changes in foreign currency exchange rates and interest rates. Our financial risk management program is designed to manage the exposure arising from cash flow variability and uses derivative financial instruments to minimize this risk. We do not enter into derivative financial instruments for trading or speculative purposes.
For agreements not designated as hedges, changes in the value of the derivative, along with the transaction gain or loss on the hedged item, are recorded in earnings. For cash flow hedges, the effective portion of the changes in the fair value of the derivative, along with any gain or loss on the hedged item, are recorded as a component of accumulated other comprehensive income and subsequently reclassified into earnings in the period(s) during which the hedged transaction affects earnings.
We classified the cash flows related to hedging activities in the same category on the consolidated and combined statements of cash flows as the cash flows related to the hedged item. See Note 9 - Derivatives and Financial Instruments.
Business Acquisitions
The net assets of businesses acquired are recorded at their fair value at the acquisition date and the consolidated and combined financial statements include their results of operations from that date. Any excess of acquisition consideration over the fair value of identifiable net assets acquired is recorded as goodwill. The major classes of assets and liabilities that we generally allocate purchase price to, excluding goodwill, include identifiable intangible assets (e.g., trademarks and trade names, customer relationships and lists, and non-compete agreements), accounts receivable, inventory, property and equipment, deferred taxes, and other current and long-term assets and liabilities. The estimated fair value of identifiable intangible assets is based on critical estimates, judgments, and assumptions derived from analysis of market conditions, discount rate, discounted cash flows, customer retention rates, and estimated useful lives. See Note 2 - Business Acquisitions.
59
COVETRUS, INC.
NOTES TO CONSOLIDATED AND COMBINED FINANCIAL STATEMENTS (Continued)
(In millions, except per share amounts)
Goodwill
As noted in Business Acquisitions above, our Goodwill is derived when we acquire another company. Goodwill is not amortized, but the potential impairment of goodwill is assessed at least annually (at the beginning of the fourth quarter) and on an interim basis whenever events or changes in circumstances indicate that the carrying value may not be recoverable. Impairment analysis for goodwill requires a comparison of the fair value to the carrying value of a reporting unit.
Some important factors that could trigger an interim impairment review include:
• | Significant underperformance relative to expected historical or projected future operating results, |
• | Significant changes in the manner of the use of acquired assets or our overall business strategy (e.g., decision to divest a business), |
• | Sustained decline in our share price and a resulting decrease in our market capitalization, or |
• | Significant negative industry or economic trends. |
See Note 7 - Goodwill and Other Intangible Assets, Net and Note 10 - Fair Value for information about our interim impairment test performed in August 2019 and our annual impairment test results.
Long-lived Assets
Long-lived assets, other than goodwill, are evaluated for impairment whenever events or changes in circumstances indicate that the carrying amount of the assets may not be recoverable through the estimated undiscounted future cash flows derived from such assets.
Definite-lived intangible assets consist primarily of non-compete agreements, trademarks, patents, customer relationships, and product development. For long-lived assets used in operations, impairment losses are only recorded if the asset’s carrying amount is not recoverable through its undiscounted, probability-weighted future cash flows. We measure the impairment loss based on the difference between the carrying amount and the estimated fair value. When impairment exists, the related assets are written down to fair value. See Note 7 - Goodwill and Other Intangible Assets, Net.
Cost of Sales
The primary components of Cost of sales include the cost of the product (net of purchase discounts, supplier chargebacks, and rebates) and inbound and outbound freight charges. Our distribution network costs, such as purchasing, receiving, inspections, warehousing, internal inventory transfers, and other related costs are included in Selling, general and administrative along with other operating costs. Total distribution network costs were $18 million in 2019, $18 million in 2018, and $16 million in 2017.
Cost of sales also includes costs directly related to the design and production of software, distribution of licenses, hardware and costs related to services provided, and amortization of the capitalized costs for internally generated software for resale.
Comprehensive Income
Comprehensive income (loss) includes certain gains and losses that, under GAAP, are excluded from net income as such amounts are recorded directly as an adjustment to equity. Comprehensive income (loss) is primarily comprised of net income, foreign currency translation gain (loss), unrealized gain (loss) from hedging activities, and pension adjustment gain (loss).
Accounting Pronouncements Adopted
As of January 1, 2019, we adopted the following ASUs:
• | ASU 2016-02, “Leases (Topic 842),” introduces the balance sheet recognition of lease assets and lease liabilities by lessees for those leases classified as operating leases under previous guidance. We adopted the new lease standard using the transition option issued under the amendments in ASU 2018-11, “Leases (Topic 842): Targeted Improvements,” which allowed us to continue to apply the legacy guidance in Accounting Standards Codification (“ASC”) 840, “Leases,” in the comparative periods presented in the year of adoption. We elected the package of practical expedients permitted under the transition guidance within the new standard, which among other things, allowed us to carry forward the |
60
COVETRUS, INC.
NOTES TO CONSOLIDATED AND COMBINED FINANCIAL STATEMENTS (Continued)
(In millions, except per share amounts)
historical lease classification. We have lease agreements with both lease and non-lease components, which are generally accounted for together as a single lease component. We made an accounting policy election to keep leases with an initial term of 12 months or less off the balance sheet. We recognize those lease payments in the consolidated statement of operations on a straight-line basis over the lease term. The impact of the adoption was an increase to our operating lease assets and liabilities on January 1, 2019 of $65 million. The initial recognition of the right-of-use asset and lease liability represented a non-cash activity. See Note 6 - Leases.
• | ASU 2017-04, “Intangibles-Goodwill and Other (Topic 350): Simplifying the Test for Goodwill Impairment,” eliminates step two from the quantitative goodwill impairment test. Under this guidance, annual or interim goodwill impairment testing is performed by comparing the fair value of the reporting units to the carrying value of those units. If the carrying value exceeds the fair value, an impairment charge is recognized, not to exceed the amount of goodwill allocated to each reporting unit. |
• | ASU 2018-02, “Treatment of Stranded Tax Effects in Accumulated Other Comprehensive Income Resulting from the Tax Cuts and Jobs Act of 2017,” allows the reclassification of the income tax effects resulting from the Tax Cuts and Jobs Act of 2017 ("Tax Act") from accumulated comprehensive income to retained earnings. The adoption did not have a material impact on our consolidated financial statements and related disclosures. |
• | ASU 2018-07, “Compensation—Stock Compensation (Topic 718): Improvements to Nonemployee Share-Based Payment Accounting,” expands the scope of Topic 718 to include share-based payment transactions for acquiring goods and services from nonemployees. ASU 2018-07 simplifies the accounting for share-based payments to nonemployees by aligning it with the accounting for share-based payments to employees. ASU 2019-08 amended 2018-07 to require that an entity measure and classify share-based payment awards granted to a customer by applying the guidance in Topic 718. The adoption did not have a material impact on our consolidated financial statements and related disclosures. |
• | ASU 2017-12, “Derivatives and Hedging (Topic 815): Targeted Improvements to Accounting for Hedging Activities,” which simplifies the requirements for hedge accounting, more closely aligns hedge accounting with risk management activities and increases transparency of the scope and results of hedging activities. This ASU amends the presentation and disclosure requirements and provides options for new hedging strategies and methods of assessing hedge effectiveness in certain circumstances. ASU 2017-12 is required to be implemented for fiscal years beginning after December 15, 2018. The adoption did not have a material impact on the consolidated financial statements and related disclosures. |
As of July 1, 2019, we early adopted the following ASUs:
• | ASU No. 2018-15, “Intangibles—Goodwill and Other—Internal-Use Software (Subtopic 350-40): Customer’s Accounting for Implementation Costs Incurred in a Cloud Computing Arrangement That Is a Service Contract,” aligns the requirements for capitalizing implementation costs incurred in a hosting arrangement that is a service contract with the requirements for capitalizing implementation costs incurred to develop or obtain internal-use software (and hosting arrangements that include an internal use software license). We adopted prospectively and the adoption did not have a material impact on our consolidated financial statements and related disclosures. |
• | ASU No. 2018-13, “Fair Value Measurement (Topic 820): Disclosure Framework—Changes to the Disclosure Requirements for Fair Value Measurement,” removed, modified, and added disclosure requirements for fair value assets and liabilities. The adoption did not have a material impact on our consolidated financial statements and related disclosures. |
Accounting pronouncement to be adopted:
• | ASU 2016-13, “Financial Instruments—Credit Losses (Topic 326): Measurement of Credit Losses on Financial Instruments,” requires the measurement and recognition of expected credit losses for financial assets held at amortized cost. This ASU is effective for interim and annual reporting periods beginning after December 15, 2019. This ASU is required to be adopted using the modified retrospective basis, with a cumulative-effect adjustment to Retained earnings (Accumulated deficit) as of the beginning of the first reporting period in which the guidance of this ASU is effective. We do not expect that this ASU will have a material impact on the results of our consolidated financial statements. |
61
COVETRUS, INC.
NOTES TO CONSOLIDATED AND COMBINED FINANCIAL STATEMENTS (Continued)
(In millions, except per share amounts)
• | ASU 2019-12, “Income Taxes (Topic 740): Simplifying the Accounting for Income Taxes,” removes specific technical exceptions to general principles found in Topic 740, items that often produce information investors have a hard time understanding and simplifies the accounting for income taxes. The standard is effective for fiscal years, and interim periods within those fiscal years, beginning after December 15, 2020, with early adoption permitted. We are evaluating the anticipated impact of this standard on our financial statements as well as timing of adoption. |
2. Business Acquisitions
Vets First Choice
On February 7, 2019, we acquired Vets First Choice. See Note 1 - Business Overview and Significant Accounting Policies. During the third quarter ended September 30, 2019, we recorded a measurement period adjustment, which was made to reflect the facts and circumstances in existence as of the acquisition date. This adjustment reflects a reduction to the purchase price of $30 million, offset by a corresponding decrease to goodwill. This measurement period adjustment related to the cancellation of 700,400 Covetrus shares issued to Vets First Choice shareholders that were held in escrow. During the fourth quarter ended December 31, 2019, we recorded a final measurement period adjustment of $4 million which increased the deferred tax liability with a corresponding decrease to goodwill. The estimated consideration and fair value in the tables below have been updated to reflect this measurement period adjustment.
The acquisition date fair value of the consideration transferred consisted of the following:
Estimated Consideration | ||||
Total Covetrus shares issued to Vets First Choice shareholders | 39,041,689 | |||
Per share price (in actuals) (a) | $ | 43.05 | ||
Total fair value of shares issued to Vets First Choice shareholders | $ | 1,681 | ||
Fair value of Vets First Choice replacement stock option awards attributable to pre-acquisition service | 62 | |||
Vets First Choice debt repaid at close | 24 | |||
Vets First Choice expenses paid at close | 18 | |||
Less: Vets First Choice cash used to fund transaction | (9 | ) | ||
Total consideration | $ | 1,776 | ||
(a) Closing price on February 7, 2019, Covetrus shares trading on a when-issued basis (Nasdaq: CVETV) | ||||
The purchase price was allocated to the underlying assets acquired and liabilities assumed based upon their estimated fair values at the date of acquisition. The following table summarizes the allocation of the purchase price to the assets acquired and liabilities assumed:
Estimated Fair Value | ||||
Fair value of net assets acquired | $ | 14 | ||
Goodwill | 1,324 | |||
Intangible assets | 545 | |||
Deferred tax liabilities | (107 | ) | ||
Total acquisition cost | $ | 1,776 | ||
We determined the estimated fair value of the identifiable intangible assets after review and consideration of relevant information including discounted cash flow analysis, market data, and management’s estimates. We engaged an independent valuation firm to assist in determining the fair value of the acquired intangible assets. The value attributed to the other identifiable intangible assets included $20 million in trademarks and trade names, $50 million in product formulas, $125 million in customer relationships, and $350 million in developed technologies. These intangible assets are being amortized over a weighted-average period of seven years.
62
COVETRUS, INC.
NOTES TO CONSOLIDATED AND COMBINED FINANCIAL STATEMENTS (Continued)
(In millions, except per share amounts)
The goodwill from this transaction arose because of our expected ability to leverage existing and new marketing opportunities across a larger revenue base. The goodwill from this transaction is not deductible for tax purposes.
The results of operations of Vets First Choice are included in our consolidated results of operations since February 7, 2019, during which period Vets First Choice contributed revenue of $246 million and net loss of $525 million.
The following unaudited pro forma financial information presents the results of operations for the years ended December 31, 2019 and December 29, 2018 as if the Acquisition had occurred as of December 31, 2017. The unaudited pro forma results reflect certain adjustments for items that are not expected to have a continuing impact, such as adjustments for transaction costs incurred, management fees, and purchase accounting.
The information presented below has been prepared for comparative purposes only and does not purport to be indicative of either future results of operations or the results of operations that would have occurred had the Acquisition been consummated on December 31, 2017:
Years Ended | ||||||||
December 31, 2019 | December 29, 2018 | |||||||
Net sales | $ | 4,000 | $ | 3,981 | ||||
Goodwill impairment | $ | 938 | $ | — | ||||
Net loss | $ | (1,032 | ) | $ | (63 | ) | ||
Net loss attributable to Covetrus | $ | (1,029 | ) | $ | (63 | ) | ||
Other
We completed certain other acquisitions during the year ended December 31, 2019 which were not material to our consolidated financial statements individually or in the aggregate.
3. Held for Sale
In 2019, in accordance with our strategy to streamline our organizational focus, we engaged a third party to facilitate the marketing and eventual sale of our scil animal-care business. In January 2020, we entered into a definitive agreement to sell scil to Heska Corporation for a purchase price of $125 million in cash, subject to customary closing adjustments. Gains are not recognized until the date of sale, which is expected to close during the second quarter ended June 30, 2020, subject to customary closing conditions. scil is primarily included within our Europe segment.
scil's major classes of assets and liabilities were as follows:
December 31, 2019 | ||||
Current assets | $ | 24 | ||
Property and equipment, net | 15 | |||
Goodwill | 2 | |||
Other intangibles, net | 4 | |||
Investments and other | 3 | |||
Assets held for sale | $ | 48 | ||
Current liabilities | $ | 18 | ||
Other non-current liabilities | 3 | |||
Liabilities held for sale | $ | 21 | ||
We also have a building for sale in our APAC & Emerging Markets segment which is leased to a long-term tenant. As of December 31, 2019, the building was included in Assets held for sale at $3 million, net, along with scil's assets held for sale.
63
COVETRUS, INC.
NOTES TO CONSOLIDATED AND COMBINED FINANCIAL STATEMENTS (Continued)
(In millions, except per share amounts)
4. Revenue from Contracts with Customers
Disaggregation of Revenue
The table below presents our revenue disaggregated by major product category and reportable segment for the year ended December 31, 2019:
Supply Chain Services | Software Solutions | Prescription Management | Eliminations | Total | |||||||||||||||
North America | $ | 1,816 | $ | 82 | $ | 246 | $ | (33 | ) | $ | 2,111 | ||||||||
Europe | 1,513 | 10 | — | (14 | ) | 1,509 | |||||||||||||
APAC & Emerging Markets | 361 | 7 | — | — | 368 | ||||||||||||||
Eliminations | (12 | ) | — | — | — | (12 | ) | ||||||||||||
Total net sales | $ | 3,678 | $ | 99 | $ | 246 | $ | (47 | ) | $ | 3,976 | ||||||||
The table below presents our revenue disaggregated by major product category and reportable segment for the year ended December 29, 2018:
Supply Chain Services | Software Solutions | Prescription Management | Eliminations | Total | |||||||||||||||
North America | $ | 1,858 | $ | 83 | $ | — | $ | (2 | ) | $ | 1,939 | ||||||||
Europe | 1,462 | 11 | — | (10 | ) | 1,463 | |||||||||||||
APAC & Emerging Markets | 380 | 7 | — | — | 387 | ||||||||||||||
Eliminations | (11 | ) | — | — | — | (11 | ) | ||||||||||||
Total net sales | $ | 3,689 | $ | 101 | $ | — | $ | (12 | ) | $ | 3,778 | ||||||||
The table below presents our revenue recognized under ASC 605 disaggregated by major product category and reportable segment for the year ended December 30, 2017:
Supply Chain Services | Software Solutions | Prescription Management | Eliminations | Total | |||||||||||||||
North America | $ | 1,795 | $ | 83 | $ | — | $ | (2 | ) | $ | 1,876 | ||||||||
Europe | 1,359 | 11 | — | 3 | 1,373 | ||||||||||||||
APAC & Emerging Markets | 342 | 7 | — | — | 349 | ||||||||||||||
Eliminations | (18 | ) | — | — | — | (18 | ) | ||||||||||||
Total net sales | $ | 3,478 | $ | 101 | $ | — | $ | 1 | $ | 3,580 | |||||||||
The following table presents our revenue and gross billings associated with our Net Agency Revenue:
Years Ended | |||||||||||
December 31, 2019 | December 29, 2018 | December 30, 2017 | |||||||||
Net Agency Revenue | $ | 18 | $ | 26 | $ | 16 | |||||
Gross billings from Net Agency Revenue | $ | 447 | $ | 454 | $ | 402 | |||||
64
COVETRUS, INC.
NOTES TO CONSOLIDATED AND COMBINED FINANCIAL STATEMENTS (Continued)
(In millions, except per share amounts)
Contract Balances
The following table presents information about our receivables, contract assets, and contract liabilities from contracts with customers:
Balance Sheet Location | December 31, 2019 | December 29, 2018 | |||||||
Accounts receivable: | |||||||||
Accounts receivable, net | $ | 426 | $ | 431 | |||||
Contract liabilities: | |||||||||
Deferred revenue, current | Other current liabilities | $ | 37 | $ | 18 | ||||
For the year ended December 31, 2019, deferred revenue recognized from performance obligations completed this period approximates the balance outstanding as of December 29, 2018. The increase in Deferred revenue for the year ended December 31, 2019 compared to the prior year was primarily attributable to increased customer orders in the U.K. due to uncertainty created by Brexit.
Performance Obligations
Estimated future revenues expected to be generated from long-term contracts with unsatisfied performance obligations as of December 31, 2019, was not material.
5. Property and Equipment, Net
Property and equipment, net consisted of the following as of:
Estimated Useful Life | December 31, 2019 | December 29, 2018 | |||||||
Land | N/A | $ | 1 | $ | 2 | ||||
Buildings and permanent improvements | 10-40 years | 9 | 17 | ||||||
Leasehold improvements | 1-20 years | 23 | 12 | ||||||
Machinery and warehouse equipment | 3-10 years | 44 | 43 | ||||||
Furniture, fixtures, and other | 2-10 years | 36 | 32 | ||||||
Computer equipment and software | 2-10 years | 64 | 36 | ||||||
Total property and equipment, gross | 177 | 142 | |||||||
Less: accumulated depreciation and amortization | (84 | ) | (73 | ) | |||||
Total property and equipment, net | $ | 93 | $ | 69 | |||||
The following table sets forth our depreciation and amortization expense for the years ended:
Location | December 31, 2019 | December 29, 2018 | December 30, 2017 | |||||||||
Cost of sales | $ | 3 | $ | 2 | $ | 2 | ||||||
Selling, general and administrative | 25 | 13 | 11 | |||||||||
Total depreciation and amortization expense | $ | 28 | $ | 15 | $ | 13 | ||||||
6. Leases
We evaluate whether an arrangement is or contains a lease at contract inception. For all our leases, we determine the classification as either operating or financing. We have office space, warehouse facilities, vehicles, and equipment under non-cancelable operating leases with third parties. The leases have remaining lease terms of one to 20 years. Leases with an initial term of 12 months or less are not recognized on the balance sheet. We recognize lease expense for these leases on a straight-line basis over the lease term. For purposes of calculating operating lease liabilities, lease terms may be deemed to include options to extend or terminate the lease when it is reasonably certain that we will exercise that option.
65
COVETRUS, INC.
NOTES TO CONSOLIDATED AND COMBINED FINANCIAL STATEMENTS (Continued)
(In millions, except per share amounts)
Operating lease right-of-use assets and liabilities are recognized at commencement date based on the present value of lease payments over the lease term. As most of our leases do not provide an implicit rate, we use the incremental borrowing rate based on the information available at commencement date in determining the present value of future lease payments. We use the implicit rate when readily determinable.
Rent expense charged to operations under operating leases during the year ended December 31, 2019 was $25 million. Common Area Maintenance and taxes for the year ended December 31, 2019 was $2 million. Short-term lease expense and variable rent expense during the year ended December 31, 2019 was not material. Rent expense, under ASC 840, was $20 million for the year ended December 29, 2018 and $17 million for the year ended December 30, 2017.
The following table presents the lease balances within the consolidated balance sheet and other supplemental information related to our leases as of December 31, 2019:
Operating Leases: | ||||
Operating lease right-of-use assets, net | $ | 84 | ||
Accrued expenses, other | $ | 19 | ||
Other liabilities | 67 | |||
Total operating lease liabilities | $ | 86 | ||
Finance Leases: | ||||
Property and equipment, net | $ | 2 | ||
Current maturities of long-term debt and other borrowings | $ | 1 | ||
Long-term debt and other borrowings, net | — | |||
Total finance lease liabilities | $ | 1 | ||
Weighted-average remaining lease term: | ||||
Operating leases | 6.8 years | |||
Finance leases | 2.4 years | |||
Weighted-average discount rate: | ||||
Operating leases | 3.5 | % | ||
Finance leases | 8.1 | % | ||
Supplemental cash flow information related to leases for the year ended was as follows:
December 31, 2019 | ||||
Cash paid for amounts included in the measurement of operating lease liabilities | $ | 25 | ||
Right-of-use assets obtained in exchange for new operating lease liabilities | $ | 104 | ||
Right-of-use assets obtained in exchange for new finance lease liabilities | $ | 1 | ||
66
COVETRUS, INC.
NOTES TO CONSOLIDATED AND COMBINED FINANCIAL STATEMENTS (Continued)
(In millions, except per share amounts)
The following table presents the maturity of our lease liabilities as of December 31, 2019:
Operating Leases | Finance Leases | ||||||
2020 | $ | 22 | $ | 1 | |||
2021 | 18 | — | |||||
2022 | 13 | — | |||||
2023 | 9 | — | |||||
2024 | 8 | — | |||||
Thereafter | 28 | — | |||||
Total minimum lease payments | 98 | 1 | |||||
Less: amount representing interest | (12 | ) | — | ||||
Present value of net minimum lease payments | 86 | 1 | |||||
Less: current portion of lease obligations | (19 | ) | (1 | ) | |||
Long-term lease obligations | $ | 67 | $ | — | |||
As of December 31, 2019, we had additional operating leases that have not yet commenced which included the following:
Description | Commencing | Lease Term | Total Future Lease Payments | |||||
Compounding pharmacy and offices | January 2020 | 14 years | $ | 25 | ||||
Compounding pharmacy | November 2020 | 20 years | 28 | |||||
New corporate headquarters | October 2021 | 20 years | 78 | |||||
Total | $ | 131 | ||||||
7. Goodwill and Other Intangible Assets, Net
Goodwill
During the first quarter of 2019, in connection with the Separation, Distribution, and Acquisition, we made changes to our organizational and reporting structure. With these changes, we revised our reportable segments and goodwill was reallocated to the new reporting segments. See Note 18 - Segment Data.
In August 2019, we released our results for the three and six months ended June 30, 2019 which failed to meet expectations and included a downward revision to our previously provided full-year guidance for the year ended December 31, 2019. We experienced a sustained decline in our share price and a resulting decrease in our market capitalization. These events triggered an interim impairment review as of August 31, 2019. We tested for goodwill impairment by quantitatively comparing the fair values of our reporting units to their carrying amounts. See Note 10 - Fair Value for further information.
Based on our analysis, we determined that the carrying value of our reporting units exceeded their fair values, and we recorded a non-tax-deductible goodwill impairment charge totaling $938 million for the year ended December 31, 2019. Our annual impairment review was performed during the fourth quarter of 2019 using a qualitative approach, and we determined that there was no additional goodwill impairment as of December 31, 2019.
67
COVETRUS, INC.
NOTES TO CONSOLIDATED AND COMBINED FINANCIAL STATEMENTS (Continued)
(In millions, except per share amounts)
The changes in the Goodwill balances by segment for the years ended December 31, 2019 and December 29, 2018 were as follows:
North America | Europe | APAC & Emerging Markets | Total | ||||||||||||
Balance at December 31, 2017 (a) | $ | 528 | $ | 182 | $ | 50 | $ | 760 | |||||||
Foreign currency translation | (1 | ) | (11 | ) | (1 | ) | (13 | ) | |||||||
Goodwill additions | 2 | 1 | — | 3 | |||||||||||
Balance at December 29, 2018 (a) | 529 | 172 | 49 | 750 | |||||||||||
Foreign currency translation | — | (8 | ) | (1 | ) | (9 | ) | ||||||||
Goodwill additions (b) | 1,280 | 57 | 16 | 1,353 | |||||||||||
Goodwill impairment | (653 | ) | (221 | ) | (64 | ) | (938 | ) | |||||||
Divestitures and related adjustments (c) | (2 | ) | — | — | (2 | ) | |||||||||
Balance at December 31, 2019 | $ | 1,154 | $ | — | $ | — | $ | 1,154 | |||||||
(a) Recast to conform to 2019 presentation | |||||||||||||||
(b) Includes goodwill adjustments of $34 million related to Vets First Choice; see Note 2 - Business Acquisitions | |||||||||||||||
(c) Attributable to scil; see Note 3 - Held for Sale | |||||||||||||||
North America | Europe | APAC & Emerging Markets | Total | ||||||||||||
Accumulated impairment at December 29, 2018 | $ | — | $ | — | $ | — | $ | — | |||||||
Accumulated impairment at December 31, 2019 | $ | (653 | ) | $ | (221 | ) | $ | (64 | ) | $ | (938 | ) | |||
Other Intangible Assets, Net
We periodically review our long-lived assets for indications of impairment to determine if the carrying value is recoverable and exceeds fair value. The carrying amount of long-lived assets is not recoverable if it exceeds the sum of undiscounted cash flows expected as a result from use and eventual disposition of the asset.
Because an interim goodwill assessment was completed, we also performed an interim assessment of long-lived assets as of August 31, 2019. The results of our analysis indicated that the long-lived assets were recoverable as of the assessment date and did not require further impairment review.
Definite-lived intangible assets consisted of the following as of:
December 31, 2019 | ||||||||||||
Cost | Accumulated Amortization | Net | ||||||||||
Customer relationships | $ | 503 | $ | (234 | ) | $ | 269 | |||||
Trademarks | 60 | (28 | ) | 32 | ||||||||
Patents | 30 | (24 | ) | 6 | ||||||||
Product development | 406 | (71 | ) | 335 | ||||||||
Non-compete agreements | 2 | (1 | ) | 1 | ||||||||
Total | $ | 1,001 | $ | (358 | ) | $ | 643 | |||||
68
COVETRUS, INC.
NOTES TO CONSOLIDATED AND COMBINED FINANCIAL STATEMENTS (Continued)
(In millions, except per share amounts)
December 29, 2018 | ||||||||||||
Cost | Accumulated Amortization | Net | ||||||||||
Customer relationships | $ | 368 | $ | (193 | ) | $ | 175 | |||||
Trademarks | 41 | (23 | ) | 18 | ||||||||
Patents | 30 | (20 | ) | 10 | ||||||||
Product development | 6 | (3 | ) | 3 | ||||||||
Non-compete agreements | 4 | (2 | ) | 2 | ||||||||
Total | $ | 449 | $ | (241 | ) | $ | 208 | |||||
Other intangible assets were established through business acquisitions. We amortize intangible assets on a straight-line basis over their estimated useful lives. Non-compete agreements represent amounts paid primarily to key employees and prior owners of acquired businesses, as well as certain salespersons, in exchange for placing restrictions on their ability to pose a competitive risk to us. Such amounts are amortized on a straight-line basis over the respective non-compete period which generally commences upon termination of employment or separation from Covetrus.
The table below sets forth amortization of intangible assets for the years ended:
Location | December 31, 2019 | December 29, 2018 | December 30, 2017 | |||||||||
Cost of sales | $ | 4 | $ | — | $ | — | ||||||
Selling, general and administrative | 123 | 49 | 46 | |||||||||
Total amortization | $ | 127 | $ | 49 | $ | 46 | ||||||
The estimated future amortization of intangible assets is as follows:
2020 | $ | 134 | |
2021 | 130 | ||
2022 | 126 | ||
2023 | 112 | ||
2024 | 59 | ||
Thereafter | 82 | ||
Total | $ | 643 | |
8. Debt
On February 7, 2019, we entered into a $1.5 billion syndicated credit agreement with a five-year term (the “Credit Facility”) primarily to pay a dividend to Henry Schein, as well as provide funding for working capital and general corporate purposes. The Credit Facility is comprised of the following:
Total Amount | Amount Available as of | ||||||
December 31, 2019 | |||||||
Term loan | $ | 1,200 | $ | — | |||
Revolving line of credit (a) | 300 | 281 | |||||
Total Credit Facility (b) | $ | 1,500 | $ | 281 | |||
(a) Letters of credit reduce our borrowing capacity under the revolving line of credit. At December 31, 2019, we had $19 million for letters of credit outstanding against the total $35 million sub-limit available. | |||||||
(b) We paid $24 million of debt issuance costs related to the Credit Facilities which we deferred and amortize on an effective yield basis to interest expense. The unamortized portion at December 31, 2019 was $20 million. | |||||||
In February 2020, the Credit Facility was amended, and the revised terms are reflected below.
69
COVETRUS, INC.
NOTES TO CONSOLIDATED AND COMBINED FINANCIAL STATEMENTS (Continued)
(In millions, except per share amounts)
The term loan and revolving line of credit bear interest on a floating rate basis at our option and incur fees as follows:
• | LIBOR (ranging from one month to 12 months) subject to a floor of 0.00% |
◦ | plus, an applicable margin ranging from 1.25% to 2.50% annually based on our leverage ratio at the end of the prior quarter. |
• | Alternative base rate subject to a floor of 1.00% |
◦ | plus, an applicable margin ranging from 0.25% to 1.50% annually based on our leverage ratio at the end of the prior quarter. |
• | Unused capacity under the revolving line of credit loan incurs a fee ranging from 0.175% to 0.400% per annum based on our leverage ratio at the end of the prior quarter. |
• | Additionally, customary letter of credit fees, as well as fronting fees, are incurred for letters of credit outstanding. |
The applicable margins on LIBOR and alternative base rate borrowings fluctuated over the course of 2019. As of December 31, 2019, the applicable margins on LIBOR and alternative base rate borrowings were 2.25% and 1.25%, respectively, for both the term loan and revolving line of credit. The commitment fee for the revolving line of credit as of December 31, 2019 was 0.35%.
Starting March 31, 2020, the term loan amortizes in quarterly installments equal to 5.00% per annum of the initial borrowed amount and requires full payment at maturity of all remaining amounts owed. No amortizing payments are required for the revolving line of credit, however all amounts owed are due at maturity. We have the option to prepay both the term loan and revolving line of credit without penalty, subject to certain conditions. If the aggregate balance of loans outstanding exceeds the lender's commitments made to the revolving line of credit at any time, then the amount of such excess is required to be prepaid. Mandatory prepayments of the term loan are required in an amount equal to the net cash proceeds of, subject to specific conditions, (i) certain assets sales, (ii) certain debt offerings, and (iii) certain insurance recovery and condemnation events. We plan to use a portion of the expected net cash proceeds from the sale of our scil animal-care business in an amount up to $60 million to prepay the 2020 quarterly term loan amortization payments.
Additionally, the Credit Facility limits or restricts our ability, subject to certain exceptions, to:
• | incur additional indebtedness, |
• | make dividends and other restricted payments, |
• | incur additional liens, |
• | consolidate, merge, sell, or otherwise dispose of all or substantially all assets, |
• | make investments, |
• | transfer or sell assets, |
• | enter into restrictive agreements, |
• | change the nature of the business, and |
• | enter certain transactions with affiliates. |
Starting April 1, 2019, we were required to maintain a leverage ratio of less than 5.50:1.00. The leverage ratio covenant decreases annually, starting with a reduction to 5.00:1.00 in 2021 and decreasing down to 3.75:1.00 in 2022. We must also maintain a net interest coverage ratio of no less than 3.00:1.00 at the end of each quarter. We were in compliance with all financial covenants as of and for the year ended December 31, 2019.
We continuously monitor our compliance with the terms and conditions of our Credit Facility and take such actions as are necessary to attain and ensure compliance.
The Credit Facility is guaranteed by Covetrus, the subsidiary borrower, and its subsidiary guarantors. We have pledged substantially all tangible and intangible assets, as well as our ownership interests in certain subsidiary companies, in support of the Credit Facility.
Long-term debt as of December 29, 2018 consisted primarily of a $23 million term loan. Prior to the separation and distribution date of February 7, 2019, the Animal Health Business’ long-term debt of $23 million was repaid by the Former Parent.
70
COVETRUS, INC.
NOTES TO CONSOLIDATED AND COMBINED FINANCIAL STATEMENTS (Continued)
(In millions, except per share amounts)
The following table presents the maturities of our Long-term debt and other borrowings as of December 31, 2019:
Credit Facility | Other Debt | Total Repayments | ||||||||||
2020 | $ | 60 | $ | 2 | $ | 62 | ||||||
2021 | 60 | — | 60 | |||||||||
2022 | 60 | — | 60 | |||||||||
2023 | 60 | 5 | 65 | |||||||||
2024 | 960 | — | 960 | |||||||||
Total debt maturities | 1,200 | 7 | 1,207 | |||||||||
Less: current maturities | (60 | ) | (2 | ) | (62 | ) | ||||||
Less: unamortized debt issuance costs | (20 | ) | — | (20 | ) | |||||||
Long-term maturities | $ | 1,120 | $ | 5 | $ | 1,125 | ||||||
9. Derivatives and Financial Instruments
We are exposed to the impact of changes in interest rates in the normal course of business. Our financial risk management program is designed to manage the exposure arising from this cash flow risk and uses derivative financial instruments to minimize this risk. We do not enter into derivative financial instruments for trading or speculative purposes.
In July and August 2019, we executed interest rate swap contracts with notional amounts aggregating $500 million that are designated as cash flow hedges to manage interest rate risk on our floating rate debt. These interest rate swap contracts adjust the amount of our total debt that is subject to variable interest rates by effectively fixing the borrowing rates on a portion of our floating rate debt discussed in Note 8 - Debt.
Our interest rate swap agreements exchange payment streams based on the notional principal amount. These agreements fix our future interest rates ranging from 1.63% to 1.70% plus the applicable margin as provided in our debt agreement on an amount of our debt principal equal to the then-outstanding swap notional amount. The base notional amount matures two years from inception on July 31, 2021. On the interest rate swap inception dates, we designated the swaps as a hedge of the variability in cash flows we pay on our variable rate borrowings.
Our derivative instruments at December 29, 2018 primarily included foreign currency forward agreements related to certain intercompany loans and certain forecasted inventory purchase commitments with foreign suppliers. The derivative instruments were allocated to us based on a specific identification basis. Foreign currency forward agreements related to forecasted inventory purchase commitments were designated as cash flow hedges. Foreign currency forward agreements related to foreign currency balance sheet exposure provide economic hedges but were not designated as hedges for accounting purposes. The hedging activities in 2018 did not have a material impact on the combined financial statements. Accordingly, additional disclosures related to derivatives and hedging activities have been omitted.
The following table discloses the fair value and balance sheet location of our derivative instruments:
Liability Derivatives | ||||||||||
Cash Flow Hedging Instruments: | Balance Sheet Location | December 31, 2019 | December 29, 2018 | |||||||
Interest rate swap contracts | Other liabilities | $ | 1 | $ | — | |||||
At inception of the hedging contract, we used statistical regression to assess the effectiveness of the interest rate hedges. The hedging contracts were deemed highly effective and are expected to be highly effective throughout the hedge period. Therefore, we perform a qualitative assessment of the hedge effectiveness at each subsequent quarterly reporting date. As of December 31, 2019, derivative gains and losses were initially reported as a component of Other comprehensive (loss) income and subsequently recorded in the consolidated statement of operations when the hedged transaction was recognized in earnings.
71
COVETRUS, INC.
NOTES TO CONSOLIDATED AND COMBINED FINANCIAL STATEMENTS (Continued)
(In millions, except per share amounts)
The effect of cash flow hedges on Other comprehensive (loss) income was as follows:
Cash Flow Hedging Instruments: | Location | Year Ended December 31, 2019 | ||||
Amounts recognized in Other comprehensive (loss) income | Accumulated other comprehensive loss | $ | (1 | ) | ||
Amounts reclassified out of Accumulated other comprehensive (loss) income into earnings | Interest expense | $ | 1 | |||
The net amount of deferred gains on cash flow hedges that are expected to be reclassified from Accumulated other comprehensive income (loss) into Interest expense within the next 12 months is not material.
10. Fair Value
GAAP defines fair value as the price that would be received from the sale of an asset or paid to transfer a liability in an orderly transaction between market participants at the measurement date. GAAP establishes a fair value hierarchy that distinguishes between (i) market participant assumptions developed based on market data obtained from independent sources (observable inputs), and (ii) an entity’s own assumptions about market participant assumptions developed based on the best information available in the circumstances (unobservable inputs).
We have certain financial assets and liabilities that are measured at fair value on a recurring basis, certain nonfinancial assets and liabilities that may be measured at fair value on a non-recurring basis, and certain financial assets and liabilities that
are not measured at fair value in our consolidated and combined balance sheets, but the fair value is disclosed. The fair value disclosures of these assets and liabilities are based on a three-level hierarchy, which is defined as follows:
• | Level 1 - Unadjusted quoted prices in active markets for identical assets or liabilities |
• | Level 2 - Unadjusted quoted prices in active markets for similar assets or liabilities, or unadjusted quoted prices for identical or similar assets or liabilities in markets that are not active, or inputs other than quoted prices that are observable for the asset or liability |
• | Level 3 - Unobservable inputs for the asset or liability |
There were no changes in valuation approaches or techniques during the year ended December 31, 2019.
Assets and Liabilities that are Measured at Fair Value on a Recurring Basis
Derivative contracts
Our derivatives at December 31, 2019 consisted of five interest rate swap contracts which are over-the-counter and not traded through an exchange.
The following table presents our financial instruments measured at fair value on a recurring basis and indicates the level within the fair value hierarchy:
Level | December 31, 2019 | December 29, 2018 | ||||||||
Liabilities: | ||||||||||
Interest rate swap contracts | 2 | $ | 1 | $ | — | |||||
Foreign currency forward contracts | 2 | — | NM | |||||||
Total liabilities | $ | 1 | $ NM | |||||||
NM - Not material
See Note 9 - Derivatives and Financial Instruments for additional information.
72
COVETRUS, INC.
NOTES TO CONSOLIDATED AND COMBINED FINANCIAL STATEMENTS (Continued)
(In millions, except per share amounts)
Assets and Liabilities that are Measured at Fair Value on a Nonrecurring Basis
Assets that are measured at fair value on a nonrecurring basis primarily relate to Property and equipment, net, Operating lease right-of-use assets, net, Goodwill, and Other intangible assets, net. We do not periodically adjust carrying value to fair value for these assets; rather, the carrying value of the asset is reduced to its fair value when we determine that impairment has occurred. At August 31, 2019, assets measured at fair value on a nonrecurring basis consisted of Goodwill. The fair value measurement of goodwill was measured using both the market approach and income approach, which includes discounted expected cash flows. As the discounted cash flows include unobservable inputs that were significant to the fair value measurement, the fair value was classified as a Level 3 measurement within the fair value hierarchy. See Note 7 - Goodwill and Other Intangible Assets, Net.
Assets and Liabilities that are not Measured at Fair Value
Financial assets and liabilities
The carrying amounts reported on the consolidated and combined balance sheets for Cash and cash equivalents, Accounts receivable, net, Other receivables, Accounts payable, and accrued expenses approximate their fair value due to the short maturity of those instruments.
Investments in affiliates
There are no quoted market prices available for investments in affiliates, however, we believe the carrying amounts are a reasonable estimate of fair value.
Long-term debt
Our Long-term debt is classified as a Level 2 instrument. The carrying amount of the term loan approximates fair value given the underlying interest rate applied to such amounts outstanding is currently reset to the prevailing monthly market rate. See Note 8 - Debt.
11. Commitments and Contingencies
We are involved in various legal proceedings that arise in the ordinary course of business. Substantial judgment is required in predicting the outcome of these legal proceedings, many of which take years to adjudicate. We accrue estimated costs for a contingency when we believe that a loss is probable and can be reasonably estimated. No material accrued loss contingencies were recorded as of December 31, 2019.
Securities Litigation Matter
On September 30, 2019, the City of Hollywood (Florida) Police Officers' Retirement System filed a putative securities class action lawsuit in the United States District Court for the Eastern District of New York, purportedly on behalf of purchasers of Covetrus common stock from February 8, 2019 through August 12, 2019, against the Company, Henry Schein, Inc., our former Chief Executive Officer and President, and our former Chief Financial Officer (“Defendants”). The complaint alleges that Defendants violated Sections 10(b) and 20(a) of the Exchange Act by making allegedly false and misleading statements and omissions, primarily regarding the Company’s financial prospects and the integration costs relating to the business combination involving the Animal Health Business and Vets First Choice. The suit seeks unspecified damages, fees, interest, and costs. We intend to defend the matter vigorously. Given the uncertainty of litigation, the preliminary stage of the case, and the legal standards that must be met for, among other things, class certification and success on the merits, we cannot estimate the reasonably possible loss or range of loss that may result from this action.
Purchase Obligations
We are party to an exclusive supply arrangement for certain products within the U.S. market. We amended this arrangement in February 2020 to extend the purchase obligations until 2025.
73
COVETRUS, INC.
NOTES TO CONSOLIDATED AND COMBINED FINANCIAL STATEMENTS (Continued)
(In millions, except per share amounts)
This multi-year exclusive arrangement includes unconditional purchase obligations as reflected in the table below:
Year | Amount | |||
2020 | $ | 8 | ||
2021 | 8 | |||
2022 | 8 | |||
2023 | 7 | |||
2024 | 7 | |||
2025 | 6 | |||
Total | $ | 44 | ||
We paid $9 million in 2019, $9 million in 2018, and $2 million in 2017 for products purchased under this exclusive arrangement.
In 2019, we engaged a third-party for a three-year period ending December 31, 2022. We paid them $2 million in 2019. The fixed portion of the contract is capped at $14 million while the variable portion of the contract is capped at $39 million over the term of the engagement. We consider the contract to be of a “take-or-pay” nature due to the termination fees embedded in the contract: fixed termination fees of $10 million until mid-May 2020, $12 million until mid-November 2020, and $14 million thereafter, plus any variable performance fees through termination. Currently, these variable performance fees cannot be estimated as they are calculated based on future performance achievement.
12. Redeemable Non-controlling Interests
Some minority equity owners in certain of our subsidiaries have the right, at certain times, to require us to acquire their ownership interest in those entities. We initially record our Redeemable non-controlling interests at fair value on the date of acquisition and subsequently adjust to redemption value. The following table presents the components of change and balances of Redeemable non-controlling interests within the consolidated and combined balance sheets as of:
December 31, 2019 | December 29, 2018 | December 30, 2017 | |||||||||
Balance at beginning of period | $ | 92 | $ | 368 | $ | 322 | |||||
Decrease due to redemptions | (74 | ) | (383 | ) | (26 | ) | |||||
Increase due to business acquisitions | — | 6 | 7 | ||||||||
Net (loss) income attributable to redeemable non-controlling interests | (3 | ) | 6 | 28 | |||||||
Dividends paid | — | (10 | ) | (20 | ) | ||||||
Effect of foreign currency translation (loss) gain attributable to redeemable non-controlling interests | 1 | (2 | ) | 3 | |||||||
Change to redemption value | (6 | ) | 107 | 54 | |||||||
Balance at end of period | $ | 10 | $ | 92 | $ | 368 | |||||
13. Accumulated Other Comprehensive Income (Loss)
Comprehensive income (loss) includes certain gains and losses that are excluded from net income (loss) under GAAP as these amounts are recorded directly as an adjustment to total equity.
74
COVETRUS, INC.
NOTES TO CONSOLIDATED AND COMBINED FINANCIAL STATEMENTS (Continued)
(In millions, except per share amounts)
The following table presents the changes in Accumulated other comprehensive loss, net of applicable taxes, by component:
Derivative (Loss) Gain | (Loss) Gain on Pension Adjustment | Foreign Currency Translation (Loss) Gain | Unrealized Gain (Loss) from Foreign Currency Hedging | Total | |||||||||||||||
Balance as of December 31, 2016 | $ | — | $ | (2 | ) | $ | (100 | ) | $ | — | $ | (102 | ) | ||||||
Other comprehensive income attributable to Covetrus before reclassifications | — | — | 59 | 1 | 60 | ||||||||||||||
Balance as of December 30, 2017 | — | (2 | ) | (41 | ) | 1 | (42 | ) | |||||||||||
Other comprehensive income (loss) attributable to Covetrus before reclassifications | — | 2 | (41 | ) | (1 | ) | (40 | ) | |||||||||||
Balance as of December 29, 2018 | — | — | (82 | ) | — | (82 | ) | ||||||||||||
Other comprehensive loss attributable to Covetrus before reclassifications | (1 | ) | — | (4 | ) | — | (5 | ) | |||||||||||
Gain reclassified from Accumulated other comprehensive loss to earnings | 1 | — | — | — | 1 | ||||||||||||||
Balance as of December 31, 2019 | $ | — | $ | — | $ | (86 | ) | $ | — | $ | (86 | ) | |||||||
We recognized foreign currency translation gains (losses) as a component of comprehensive income due to changes in foreign exchange rates from the beginning of the period to the end of the period. The consolidated and combined financial statements are denominated in the U.S. dollar currency. Fluctuations in the value of foreign currencies as compared to the U.S. dollar may have a significant impact on our comprehensive income (loss).
The tax effect on accumulated unrealized losses on derivative instruments, unrealized pension adjustment gains, and gains recognized on derivative instruments was immaterial for all years presented.
14. Income Taxes
(Loss) income before taxes and equity in earnings of affiliates were as follows:
Years Ended | |||||||||||
December 31, 2019 | December 29, 2018 | December 30, 2017 | |||||||||
Domestic | $ | (809 | ) | $ | 59 | $ | 69 | ||||
Foreign | (220 | ) | 84 | 70 | |||||||
Total (loss) income before taxes and equity in earnings of affiliates | $ | (1,029 | ) | $ | 143 | $ | 139 | ||||
The provisions for income taxes were as follows:
Years Ended | |||||||||||
December 31, 2019 | December 29, 2018 | December 30, 2017 | |||||||||
Current income tax (benefit) expense: | |||||||||||
U.S. federal | $ | — | $ | 13 | $ | 22 | |||||
State and local | 2 | 4 | 4 | ||||||||
Foreign | 16 | 25 | 16 | ||||||||
Total current | 18 | 42 | 42 | ||||||||
Deferred income tax (benefit) expense: | |||||||||||
U.S. federal | (10 | ) | — | 7 | |||||||
State and local | (7 | ) | — | — | |||||||
Foreign | (8 | ) | (5 | ) | (1 | ) | |||||
Total deferred | (25 | ) | (5 | ) | 6 | ||||||
Total income tax (benefit) expense | $ | (7 | ) | $ | 37 | $ | 48 | ||||
75
COVETRUS, INC.
NOTES TO CONSOLIDATED AND COMBINED FINANCIAL STATEMENTS (Continued)
(In millions, except per share amounts)
Significant components of our deferred tax assets and liabilities were as follows:
Years Ended | |||||||
December 31, 2019 | December 29, 2018 | ||||||
Deferred income tax assets: | |||||||
Investment in partnerships | $ | 96 | $ | 72 | |||
Net operating losses and other carryforwards | 38 | 3 | |||||
Inventory, premium coupon redemptions, and accounts receivable valuation allowances | — | 1 | |||||
Share-based compensation | 7 | — | |||||
Other assets | 12 | 1 | |||||
Total deferred income tax assets | 153 | 77 | |||||
Valuation allowance for deferred tax assets | (49 | ) | (1 | ) | |||
Net deferred income tax assets | 104 | 76 | |||||
Deferred income tax liabilities: | |||||||
Intangibles amortization | (125 | ) | (20 | ) | |||
Other liabilities | (6 | ) | — | ||||
Total deferred income tax liabilities | (131 | ) | (20 | ) | |||
Net deferred income tax (liabilities) assets | $ | (27 | ) | $ | 56 | ||
The deferred income tax assets (liabilities) are classified in the consolidated and combined balance sheets as follows:
December 31, 2019 | December 29, 2018 | ||||||
Non-current deferred income tax assets, net (a) | $ | 20 | $ | 72 | |||
Non-current deferred income tax liabilities, net | (47 | ) | (16 | ) | |||
Non-current deferred income tax (liabilities) assets | $ | (27 | ) | $ | 56 | ||
(a) Included in Investments and other | |||||||
Deferred income taxes reflect the net tax effect of temporary differences between the carrying amounts of assets and liabilities for financial reporting purposes and the amounts used for income tax purposes. The assessment of the amount of value assigned to the deferred tax assets under the applicable accounting rules is judgmental.
The valuation allowance was $49 million as of December 31, 2019 and $1 million as of December 29, 2018. In assessing the realizability of deferred tax assets, management considers whether it is more likely than not that some or all the deferred tax assets will be realized. The ultimate realization of deferred taxes assets is dependent upon generation of future taxable income during the period in which those temporary differences become deductible. Management considers the scheduled reversal of deferred tax liabilities, projected future taxable income, and taxable income in carryback years and tax-planning strategies when making this assessment. In evaluating whether it is more likely than not that our deferred tax assets would be recovered, we considered various potential sources of positive and negative evidence including historical cumulative income or loss, projections of future taxable income, available tax planning strategies which are prudent and feasible to implement, and future reversals of existing taxable temporary differences.
In the fourth quarter of 2019, we incurred additional losses which, for the first time, created a three-year cumulative loss in the U.S. We determined that the cumulative loss represented a significant piece of negative evidence which is difficult to overcome in determining whether a valuation allowance was required. The cumulative loss caused us to reassess the weight of other available evidence at September 30, 2019. That reassessment resulted in our conclusion that negative evidence at September 30, 2019 outweighed the positive which resulted in the need for a revision.
76
COVETRUS, INC.
NOTES TO CONSOLIDATED AND COMBINED FINANCIAL STATEMENTS (Continued)
(In millions, except per share amounts)
We revised our consolidated financial statements for our quarter ended September 30, 2019, see Note 1 - Business Overview and Significant Accounting Policies. We determined that these amounts are not material to our previously issued quarterly financial statements. The impact to our previously issued consolidated financial statements was as follows:
As of September 30, 2019 | ||||||||||||
Consolidated Balance Sheet: | Previously Reported | Revision | As Revised | |||||||||
Non-current deferred income tax assets, net (a) | $ | 38 | $ | (19 | ) | $ | 19 | |||||
Total assets | 3,328 | (19 | ) | 3,309 | ||||||||
Deferred income taxes | 11 | 34 | 45 | |||||||||
Total liabilities | 1,989 | 34 | 2,023 | |||||||||
Accumulated deficit | (939 | ) | (53 | ) | (992 | ) | ||||||
Total shareholders’ equity | 1,329 | (53 | ) | 1,276 | ||||||||
Total liabilities, redeemable non-controlling interests, and shareholders’ equity | $ | 3,328 | $ | (19 | ) | $ | 3,309 | |||||
(a) Included in Investments and other | ||||||||||||
Quarter Ended September 30, 2019 | ||||||||||||
Consolidated Statement of Operations: | Previously Reported | Revision | As Revised | |||||||||
Income tax benefit (expense) | $ | 60 | $ | (53 | ) | $ | 7 | |||||
Net (loss) income | $ | (909 | ) | $ | (53 | ) | $ | (962 | ) | |||
Net (loss) income attributable to Covetrus | $ | (906 | ) | $ | (53 | ) | $ | (959 | ) | |||
(Loss) earnings per share attributable to Covetrus: | ||||||||||||
Basic | $ | (8.09 | ) | $ | (0.47 | ) | $ | (8.56 | ) | |||
Diluted | $ | (8.09 | ) | $ | (0.47 | ) | $ | (8.56 | ) | |||
The balance sheet contains assets and liabilities held for sale. The amounts of deferred tax assets and liabilities held for sale at December 31, 2019 were not material.
At December 31, 2019, we had the following tax loss and tax credit carryforwards available to offset taxable income in prior and future years:
Amount | Expiration Period | ||||
U.S. federal tax loss carryforwards | $ | 21 | 2023 - unlimited | ||
U.S. federal and state interest carryforwards | $ | 8 | unlimited | ||
U.S. state tax loss carryforwards | $ | 5 | 2020 - 2039 | ||
Non-U.S. tax loss carryforwards | $ | 4 | 2020 - unlimited | ||
Total tax loss and tax credit carryforwards | $ | 38 | |||
The U.S. state tax loss carryforwards were incurred in various jurisdictions. The non-U.S. tax loss carryforwards were incurred in various jurisdictions, predominantly France, Germany, Poland, Sweden, and the U.K.
77
COVETRUS, INC.
NOTES TO CONSOLIDATED AND COMBINED FINANCIAL STATEMENTS (Continued)
(In millions, except per share amounts)
The tax provision (benefit) differs from the amount computed by applying the federal statutory income tax rate due to the following:
Years Ended | ||||||||
December 31, 2019 | December 29, 2018 | December 30, 2017 | ||||||
Income tax provision at federal statutory rate | 21.0 | % | 21.0 | % | 35.0 | % | ||
Transition tax on deemed repatriation of foreign earnings | — | 2.8 | 9.4 | |||||
Pass through non-controlling interest | — | (2.1 | ) | (7.9 | ) | |||
State income tax provision, net of federal income tax effect | 0.5 | 1.4 | 2.0 | |||||
Foreign income tax provision (benefit) | 0.3 | 1.4 | (6.2 | ) | ||||
Tax on GILTI | (0.9 | ) | 1.4 | — | ||||
Excess tax benefits related to share-based compensation | — | (0.7 | ) | (2.9 | ) | |||
Revaluation of deferred tax assets and liabilities | (0.9 | ) | — | 5.3 | ||||
Valuation allowance impacts | (3.9 | ) | — | — | ||||
Goodwill impairment | (14.4 | ) | — | — | ||||
Other | (1.0 | ) | 0.7 | (0.1 | ) | |||
Total income tax provision | 0.7 | % | 25.9 | % | 34.6 | % | ||
We file U.S. federal and various state and local income tax returns as well as income tax returns in 25 foreign jurisdictions. Tax returns are generally subject to examination for a period of three to five years after the filing of the respective return. The tax years subject to examination by major tax jurisdictions include the years 2016 and forward by the U.S. Internal Revenue Service, the years 2015 and forward for certain state and local jurisdictions, and the years 2011 and forward for certain foreign jurisdictions.
The Tax Act is comprehensive tax legislation that implemented complex changes to the U.S. tax code and also moved from a global tax regime to a modified territorial regime, which required U.S. companies to pay a mandatory one-time transition tax on historical offshore earnings that have not been repatriated to the U.S., provisions for GILTI, a beneficial tax rate on FDII, BEAT that imposes tax on certain foreign related-party payments, and interest limitation. We became subject to the GILTI, FDII, BEAT and interest limitation provisions effective January 1, 2018.
We elected to recognize the tax on GILTI as a period expense in the period the tax is incurred and estimated the impact of each provision of the Tax Act on the effective tax and recorded tax expense for the GILTI provision of $10 million and an interest limitation of $7 million for the year ended December 31, 2019. We recorded a tax expense for the GILTI provision of $2 million for the year ended December 29, 2018. We have concluded that the BEAT and FDII provisions of the Tax Act will not apply to or will not have a material impact on our consolidated and combined financial statements, therefore, we have not recorded an estimate for these items in the effective tax rate for the years ended December 29, 2018 and December 31, 2019.
Due to the complexities of the Tax Act, the SEC staff issued Staff Accounting Bulletin No. 118 (“SAB 118”) that allowed us to record a provisional amount for any income tax effects of the Tax Act in accordance with ASC 740, to the extent that a reasonable estimate could be made, in our 2017 combined financial statements. SAB 118 allowed for a measurement period of up to one year after the enactment date of the Tax Act to finalize the recording of the related tax impacts.
In the fourth quarter of 2017, we recorded provisional amounts related to the Tax Act for any items that could be reasonably estimated at the time. This included the one-time transition tax that we estimated to be $13 million and a net deferred tax expense of $7 million attributable to the revaluation of deferred tax assets and liabilities due to the lower-enacted federal income tax rate of 21%. In the aggregate, for the quarter ended December 30, 2017, these Tax Act modifications resulted in a one-time tax expense of $20 million. Absent the effects of the transition, the revaluation of deferred tax assets and liabilities, and the adoption of ASU 2016-09, “Accounting for Stock Compensation,” our effective tax rate for the year ended December 30, 2017, would have been 22.8% as compared to our actual effective tax rate of 34.6%.
For the year ended December 29, 2018, we recorded $4 million additional expense for the one-time transition tax. The change was a result of additional analysis, changes in interpretation and assumptions, as well as additional regulatory guidance that was issued. As of December 29, 2018, we completed our analysis of the impact of the Tax Act in accordance with SAB 118 and the amounts are final.
78
COVETRUS, INC.
NOTES TO CONSOLIDATED AND COMBINED FINANCIAL STATEMENTS (Continued)
(In millions, except per share amounts)
Due to the one-time transition tax and the imposition of the GILTI provisions, all previously unremitted earnings will no longer be subject to U.S. federal income tax, however, there could be U.S. state and/or foreign withholding taxes upon distribution of such unremitted earnings. Determination of the amount of unrecognized deferred tax liability with respect to such earnings is not practicable.
ASC Topic 740 prescribes the accounting for uncertainty in income taxes recognized in the financial statements in accordance with other provisions contained within the guidance. This topic prescribes a recognition threshold and a measurement attribute for the financial statement recognition and measurement of tax positions taken or expected to be taken in a tax return. For those benefits to be recognized, a tax position must be more likely than not to be sustained upon examination by the taxing authorities. The amount recognized is measured as the largest amount of benefit that is greater than 50% likely of being realized upon ultimate audit settlement. In the normal course of business, our tax returns are subject to examination by various taxing authorities. Such examinations may result in future tax and interest assessments by these taxing authorities for uncertain tax positions taken in respect to certain tax matters.
The following table provides a reconciliation of unrecognized tax benefits which are included in Other liabilities within the balance sheets:
Years Ended | |||||||||||
December 31, 2019 | December 29, 2018 | December 30, 2017 | |||||||||
Balance at beginning of period | $ | 6 | $ | 8 | $ | 8 | |||||
Additions based on prior year tax positions | — | 2 | 1 | ||||||||
Reductions from lapse in statutes of limitations | (2 | ) | (4 | ) | (1 | ) | |||||
Balance at end of period | $ | 4 | $ | 6 | $ | 8 | |||||
The amount of unrecognized tax benefits that would affect the effective tax rate if recognized during the year ended December 31, 2019 would be $4 million. We believe that it is reasonably possible that a decrease of up to $1 million in unrecognized tax benefits related to foreign tax exposures may be necessary in the coming year due to lapses of statute of limitations.
The balance sheet at December 31, 2019 contains unrecognized tax benefits of $1 million related to assets held for sale.
We recognize interest and penalties related to unrecognized tax benefits as components of Income tax (benefit) expense in the statements of operations and accrued $2 million in 2019 and $1 million in 2018.
15. Earnings Per Share
On February 7, 2019, Henry Schein distributed approximately 71 million shares of Covetrus common stock to its shareholders. The computation of basic earnings per common share (“EPS”) for periods prior to the Separation was performed using the shares distributed by Henry Schein on February 7, 2019. The weighted-average number of shares outstanding for diluted EPS for the periods prior to the Separation also includes approximately 1 million of diluted common share equivalents for restricted stock and restricted stock units as these share-based awards were previously issued by Henry Schein, outstanding at the time of the Separation, and were assumed by Covetrus following the Separation.
Basic EPS is computed by dividing net income (loss) available to common shareholders by the weighted-average number of shares of common stock outstanding during the period. In addition, the shares of common stock issuable pursuant to restricted stock awards, restricted stock units, and stock options outstanding under our 2019 Omnibus Incentive Compensation Plan are included in the diluted EPS calculation to the extent they are dilutive.
79
COVETRUS, INC.
NOTES TO CONSOLIDATED AND COMBINED FINANCIAL STATEMENTS (Continued)
(In millions, except per share amounts)
The following is a reconciliation of the numerator and denominator of the basic and diluted EPS computation for net (loss) earnings per share:
December 31, 2019 | December 29, 2018 | December 30, 2017 | ||||||||||
Numerator: | ||||||||||||
Net (loss) income attributable to Covetrus | $ | (1,019 | ) | $ | 101 | $ | 64 | |||||
Denominator: | ||||||||||||
Basic | ||||||||||||
Weighted-average common shares outstanding | 107 | 71 | 71 | |||||||||
Diluted | ||||||||||||
Effect of dilutive shares (a) | — | 1 | 1 | |||||||||
Diluted shares | 107 | 72 | 72 | |||||||||
Basic (loss) earnings per share | $ | (9.50 | ) | $ | 1.41 | $ | 0.90 | |||||
Diluted (loss) earnings per share | $ | (9.50 | ) | $ | 1.40 | $ | 0.89 | |||||
(a) Shares from share-based awards are not included for periods with a net loss because they would be anti-dilutive. See Note 16 - Share-based Compensation and Other Employee Benefits | ||||||||||||
16. Share-based Compensation and Other Employee Benefits
Share-based Compensation Plan
In connection with the Separation, Distribution, and Acquisition, all outstanding restricted stock awards (“RSAs”), restricted stock units (“RSUs”), and stock options of Henry Schein and Vets First Choice were exchanged for economically equivalent awards of Covetrus. RSAs and RSUs totaling 327,447 and stock options of 3,914,694 were issued in connection with the exchange.
On February 7, 2019, we adopted the 2019 Omnibus Incentive Compensation Plan (the “Plan”) which authorizes Covetrus' Compensation Committee of the Board of Directors to grant stock options, stock awards, stock units, stock appreciation rights, other share-based awards, and cash awards. Awards may be granted to employees, consultants, advisors, and non-employee Directors of Covetrus and our subsidiaries. Awards issued under the Plan may not have a term greater than 10 years from the date of grant, generally vest ratably over a three-year period, and must be issued at a price of not less than 100% of the fair market value at the date of grant.
We reserved 11,527,675 shares of our common stock for issuance under the Plan. In addition, to the extent that awards outstanding under the Plan are cancelled, forfeited, or otherwise terminated without being exercised, the number of shares underlying such awards will be available for future grant under the Plan.
We recognized pre-tax share-based compensation expense of $46 million ($40 million after-tax) in 2019, $7 million ($6 million after-tax) in 2018, and $7 million ($4 million after-tax) in 2017. No share-based compensation cost was capitalized as part of an asset.
Stock Options
We grant stock options at an exercise price equal to the closing market price of our stock on the grant date. We use the Black-Scholes pricing model to determine the fair value of options granted and have elected the accrual method for recognizing compensation costs. The fair value of share-based payment awards calculated using the Black-Scholes model varies based on share price, award exercise price, stock volatility, expected term, risk free interest rate, expected dividends, and the assumptions used in determining these variables. No stock options were granted during 2017 and 2018.
80
COVETRUS, INC.
NOTES TO CONSOLIDATED AND COMBINED FINANCIAL STATEMENTS (Continued)
(In millions, except per share amounts)
The following table summarizes our stock option activity under the Plan for the year ended December 31, 2019:
Stock Options | |||||||||||||
Number of Shares | Weighted- average Exercise Price Per Share | Weighted- average Remaining Contractual Term | Aggregate Intrinsic Value | ||||||||||
Outstanding at beginning of year | — | $ | — | ||||||||||
Granted | 5 | 14.03 | |||||||||||
Exercised | (1 | ) | 5.14 | ||||||||||
Forfeited | — | 18.66 | |||||||||||
Outstanding at end of year | 4 | $ | 15.29 | 6.9 years | $ | 16 | |||||||
Exercisable at end of year | 2 | $ | 9.25 | 5.2 years | $ | 12 | |||||||
The following table provides the weighted-average grant-date fair value and related valuation assumptions for these awards granted during the year ended December 31, 2019:
Weighted-average grant-date fair value | $ | 14.03 | |
Valuation assumptions: | |||
Expected term | 6.0 years | ||
Risk-free interest rate | 1.8 | % | |
Expected volatility | 29.9 | % | |
Expected dividend rate | — | % | |
We received cash from option exercises of $4 million during 2019.
RSAs/RSUs
We grant RSAs and RSUs at an exercise price equal to the closing market price of our stock on the grant date.
The following table summarizes our RSA/RSU activity under the Plan for the year ended December 31, 2019:
Restricted Stock Awards/Restricted Stock Units | |||||||||||||
Number of Shares | Weighted- average Grant Date Fair Value Per Share | Weighted- average Remaining Contractual Term | Aggregate Intrinsic Value | ||||||||||
Nonvested at beginning of year | — | $ | 76.86 | ||||||||||
Granted | 2 | 27.83 | |||||||||||
Vested | — | 66.84 | |||||||||||
Forfeited | — | 36.11 | |||||||||||
Nonvested at end of year | 2 | $ | 25.69 | 1.6 years | $ | 22 | |||||||
The weighted-average grant-date fair values for these awards granted during each of the last three years were as follows:
December 31, 2019 | December 29, 2018 | December 30, 2017 | |||||||||
Weighted-average grant-date fair value | $ | 27.83 | $ | 65.26 | $ | 85.90 | |||||
81
COVETRUS, INC.
NOTES TO CONSOLIDATED AND COMBINED FINANCIAL STATEMENTS (Continued)
(In millions, except per share amounts)
Additional Information
As of December 31, 2019, there was $75 million in unrecognized compensation expense related to nonvested share-based awards that is expected to be recognized over a weighted-average period of 2.4 years.
The following table provides further information related to our share-based awards for the last three years:
December 31, 2019 | December 29, 2018 | December 30, 2017 | |||||||||
Intrinsic value of stock options exercised | $ | 15 | $ | — | $ | — | |||||
Fair value of RSA/RSU shares vested | $ | 3 | $ | 2 | $ | — | |||||
Employee Stock Purchase Plan
On February 7, 2019, we adopted the Employee Stock Purchase Plan (the “ESPP”) and approved 2,223,864 shares for issuance under this plan. The share reserve will increase automatically on the first trading day of January of each calendar year beginning January 1, 2020. The ESPP is administered by the Compensation Committee.
The ESPP provides for the issuance of shares of our common stock to participating employees. At the end of each designated offering period, which occurs every six months on May 31 and November 30, employees can elect to purchase shares of our common stock with contributions of up to 15% of their base pay, accumulated via payroll deductions, at an amount equal to 85% of the lower of our stock price on (i) the first day of the offering period, or (ii) the last day of the offering period. For the year ended December 31, 2019, activity under the ESPP was not material.
Annual Incentive Plan
Our Compensation Committee adopted the Annual Incentive Plan (the “AIP”) on February 7, 2019. The AIP provides pay for performance incentive compensation to our employees, including our named executive officers, rewarding them for their contributions to us with incentive compensation based on attainment of predetermined corporate performance goals, as applicable.
Our Compensation Committee designates participants in the AIP for each performance period and may establish corporate performance goals and individual performance goals for our named executive officers under the AIP. The Compensation Committee may subsequently adjust the performance goals to consider such unanticipated circumstances or significant events as our Compensation Committee determines.
Our Compensation Committee is responsible for administering the AIP and has full discretionary authority under the AIP and the authority to take any actions it deems necessary or advisable in carrying out its duties thereunder, including delegating their authority under the AIP.
For the year ended December 31, 2019, we recorded compensation expense of $7 million associated with the AIP.
401(k) Plan
Covetrus maintains a qualified 401(k) plan covering eligible employees of certain of the U.S. entities as well as certain other defined contribution plans. Matching contributions and administrative expenses related to these plans were $9 million in 2019, $6 million in 2018, and $6 million in 2017.
17. Related-party Transactions
Long-term Debt
As of December 29, 2018, the combined financial statements included long-term debt with Darby Group Companies, Inc. and M&S Investment Holding I LLC, each a related party of the Former Parent and the Animal Health Business. Prior to the Separation and Distribution date of February 7, 2019, the Former Parent repaid the Animal Health Business’ long-term debt.
82
COVETRUS, INC.
NOTES TO CONSOLIDATED AND COMBINED FINANCIAL STATEMENTS (Continued)
(In millions, except per share amounts)
Allocation of General Corporate Expenses
As discussed in Note 1 - Business Overview and Significant Accounting Policies, we were allocated general corporate expenses of $5 million in 2019, $55 million in 2018, and $59 million in 2017 which are included within Selling, general and administrative in the consolidated and combined statements of operations.
Net Former Parent Investment
The net transfers from the Former Parent are reflected in equity on the consolidated and combined balance sheets and statements of shareholders' equity.
A reconciliation of Net Former Parent investment in the consolidated and combined statements of equity to the corresponding amount presented on the consolidated and combined statements of cash flows for all periods presented were as follows:
December 31, 2019 | December 29, 2018 | December 30, 2017 | |||||||||
Net transfers from Former Parent from statements of shareholders' equity | $ | 172 | $ | 174 | $ | 13 | |||||
Share-based compensation expense | — | (7 | ) | (7 | ) | ||||||
Changes to redemption value of redeemable non-controlling interests | (6 | ) | 107 | 54 | |||||||
Other | (1 | ) | — | 2 | |||||||
Total net transfers from Former Parent from statements of cash flows | $ | 165 | $ | 274 | $ | 62 | |||||
18. Segment Data
In connection with the Separation, Distribution, and Acquisition, we revised our reportable segments to reflect how the chief operating decision maker (the chief executive officer) (the “CODM”) reviews financial information and makes operating decisions. This resulted in a change in the operating segments from (i) supply chain and (ii) technology and value-added services to (i) North America, (ii) Europe, and (iii) APAC & Emerging Markets. While the historical business was focused on driving growth through specific product and service offerings to its customers, the Separation, Distribution, and Acquisition allowed for the integration of the different products and service offerings, along with prescription management, data analytics, and insights through veterinary practice management software into one multi-channel veterinary platform. We will focus on delivering the integrated platform of products and services to our customers on a geographical basis.
During the second quarter of 2019, our CODM began evaluating segment profit (loss) solely based on Adjusted EBITDA. In the prior period, our CODM was using both operating income and Adjusted EBITDA for measurement purposes, thus operating income was presented as it most closely reflected the measurement principle applied to our consolidated and combined financial statements. We do not allocate expenses managed at the corporate level to our segments, such as corporate wages and related benefits, corporate occupancy costs, professional services utilized at the corporate level, and non-recurring expenses. All intersegment balances and transactions have been eliminated in consolidation.
83
COVETRUS, INC.
NOTES TO CONSOLIDATED AND COMBINED FINANCIAL STATEMENTS (Continued)
(In millions, except per share amounts)
The following tables reflect our segment information and Corporate, the segment recast for the prior years, and reconciles Adjusted EBITDA for reportable segments to consolidated net (loss) income attributable to Covetrus:
At and For the Year Ended December 31, 2019 | |||||||||||||||||||||||
North America | Europe | APAC & Emerging Markets | Corporate | Eliminations | Total | ||||||||||||||||||
Net sales | $ | 2,111 | $ | 1,509 | $ | 368 | $ | — | $ | (12 | ) | $ | 3,976 | ||||||||||
Adjusted EBITDA | $ | 154 | $ | 68 | $ | 19 | $ | (39 | ) | $ | — | $ | 202 | ||||||||||
Depreciation and amortization | $ | 131 | $ | 18 | $ | 6 | $ | — | $ | — | $ | 155 | |||||||||||
Income tax benefit (expense) | $ | 8 | $ | (3 | ) | $ | (4 | ) | $ | 6 | $ | — | $ | 7 | |||||||||
Total assets | $ | 2,941 | $ | 726 | $ | 137 | $ | 783 | $ | (1,226 | ) | $ | 3,361 | ||||||||||
Expenditures for long-lived assets | $ | 23 | $ | 10 | $ | 1 | $ | 5 | $ | — | $ | 39 | |||||||||||
Reconciliation of Net Loss Attributable to Covetrus to Adjusted EBITDA: | |||||||||||||||||||||||
Net loss attributable to Covetrus | $ | (1,019 | ) | ||||||||||||||||||||
Plus: Depreciation and amortization | 155 | ||||||||||||||||||||||
Plus: Interest expense, net | 53 | ||||||||||||||||||||||
Less: Income tax benefit | (7 | ) | |||||||||||||||||||||
Earnings before interest, taxes, depreciation, and amortization | (818 | ) | |||||||||||||||||||||
Plus: Share-based compensation | 46 | ||||||||||||||||||||||
Plus: Transaction costs | 2 | ||||||||||||||||||||||
Plus: Formation of Covetrus | 34 | ||||||||||||||||||||||
Plus: Separation programs and executive severance | 11 | ||||||||||||||||||||||
Plus: Carve-out operating expenses | 5 | ||||||||||||||||||||||
Plus: IT infrastructure | 6 | ||||||||||||||||||||||
Plus: Goodwill impairment | 938 | ||||||||||||||||||||||
Less: Minority interest in goodwill impairment | (3 | ) | |||||||||||||||||||||
Less: Other (income) expense items, net | (19 | ) | |||||||||||||||||||||
Adjusted EBITDA | $ | 202 | |||||||||||||||||||||
84
COVETRUS, INC.
NOTES TO CONSOLIDATED AND COMBINED FINANCIAL STATEMENTS (Continued)
(In millions, except per share amounts)
At and For the Year Ended December 29, 2018 | |||||||||||||||||||||||
North America | Europe | APAC & Emerging Markets | Corporate | Eliminations | Total | ||||||||||||||||||
Net sales | $ | 1,939 | $ | 1,463 | $ | 387 | $ | — | $ | (11 | ) | $ | 3,778 | ||||||||||
Adjusted EBITDA | $ | 157 | $ | 75 | $ | 20 | $ | (32 | ) | $ | — | $ | 220 | ||||||||||
Depreciation and amortization | $ | 41 | $ | 17 | $ | 6 | $ | — | $ | — | $ | 64 | |||||||||||
Income tax expense | $ | (18 | ) | $ | (15 | ) | $ | (3 | ) | $ | (1 | ) | $ | — | $ | (37 | ) | ||||||
Total assets | $ | 1,343 | $ | 702 | $ | 182 | $ | 10 | $ | (4 | ) | $ | 2,233 | ||||||||||
Expenditures for long-lived assets | $ | 14 | $ | 7 | $ | 1 | $ | — | $ | — | $ | 22 | |||||||||||
Reconciliation of Net Income Attributable to Covetrus to Adjusted EBITDA: | |||||||||||||||||||||||
Net income attributable to Covetrus | $ | 101 | |||||||||||||||||||||
Plus: Depreciation and amortization | 64 | ||||||||||||||||||||||
Plus: Interest expense, net | 2 | ||||||||||||||||||||||
Plus: Income tax expense | 37 | ||||||||||||||||||||||
Earnings before interest, taxes, depreciation, and amortization | 204 | ||||||||||||||||||||||
Plus: Share-based compensation | 7 | ||||||||||||||||||||||
Plus: Separation programs and executive severance | 9 | ||||||||||||||||||||||
Adjusted EBITDA | $ | 220 | |||||||||||||||||||||
At and For the Year Ended December 30, 2017 | |||||||||||||||||||||||
North America | Europe | APAC & Emerging Markets | Corporate | Eliminations | Total | ||||||||||||||||||
Net sales | $ | 1,876 | $ | 1,373 | $ | 349 | $ | — | $ | (18 | ) | $ | 3,580 | ||||||||||
Adjusted EBITDA | $ | 136 | $ | 62 | $ | 16 | $ | (37 | ) | $ | — | $ | 177 | ||||||||||
Depreciation and amortization | $ | 38 | $ | 16 | $ | 5 | $ | — | $ | — | $ | 59 | |||||||||||
Income tax expense | $ | (34 | ) | $ | (11 | ) | $ | (2 | ) | $ | (1 | ) | $ | — | $ | (48 | ) | ||||||
Total assets | $ | 1,301 | $ | 735 | $ | 174 | $ | 11 | $ | (4 | ) | $ | 2,217 | ||||||||||
Expenditures for long-lived assets | $ | 13 | $ | 7 | $ | 1 | $ | — | $ | — | $ | 21 | |||||||||||
Reconciliation of Net Income Attributable to Covetrus to Adjusted EBITDA: | |||||||||||||||||||||||
Net income attributable to Covetrus | $ | 64 | |||||||||||||||||||||
Plus: Depreciation and amortization | 59 | ||||||||||||||||||||||
Plus: Interest expense, net | 2 | ||||||||||||||||||||||
Plus: Income tax expense | 48 | ||||||||||||||||||||||
Earnings before interest, taxes, depreciation, and amortization | 173 | ||||||||||||||||||||||
Plus: Share-based compensation | 4 | ||||||||||||||||||||||
Adjusted EBITDA | $ | 177 | |||||||||||||||||||||
See Note 4 - Revenue from Contracts with Customers for our revenue disaggregated by major product category and reportable segment.
19. Subsequent Events
In January 2020, we entered into an agreement to combine our business operating in Spain and Portugal with Distrivet, a leading provider of veterinary products and services in Spain. We will own 50.01% of the new company, to be called Distrivet, a Covetrus
85
COVETRUS, INC.
NOTES TO CONSOLIDATED AND COMBINED FINANCIAL STATEMENTS (Continued)
(In millions, except per share amounts)
company. The transaction is expected to close during the second quarter ended June 30, 2020, subject to satisfaction of customary closing conditions, including regulatory clearance.
20. Summary of Quarterly Data (Unaudited)
A summary of quarterly data follows:
For the Three Months Ended | ||||||||||||||||
March 31, 2019 | June 30, 2019 | September 30, 2019 | December 31, 2019 | |||||||||||||
Net sales | $ | 941 | $ | 1,009 | $ | 1,018 | $ | 1,008 | ||||||||
Gross profit (a) | $ | 177 | $ | 193 | $ | 191 | $ | 188 | ||||||||
Goodwill impairment | $ | — | $ | — | $ | 939 | $ | (1 | ) | |||||||
Operating loss | $ | (9 | ) | $ | (5 | ) | $ | (958 | ) | $ | (25 | ) | ||||
Net loss attributable to Covetrus (b) | $ | (13 | ) | $ | (10 | ) | $ | (959 | ) | $ | (37 | ) | ||||
Loss per share: (b) | ||||||||||||||||
Basic | $ | (0.14 | ) | $ | (0.09 | ) | $ | (8.56 | ) | $ | (0.33 | ) | ||||
Diluted | $ | (0.14 | ) | $ | (0.09 | ) | $ | (8.56 | ) | $ | (0.33 | ) | ||||
(a) 2019 quarterly data reflects a reclassification of Vets First Choice shipping expenses that were previously included in Selling, general and administrative into Cost of sales to classify these Vets First Choice shipping expenses consistently with the rest of our business. | ||||||||||||||||
(b) The third quarter ended September 30, 2019 includes a revision (see Note 14 - Income Taxes). | ||||||||||||||||
For the Three Months Ended | ||||||||||||||||
March 31, 2018 | June 30, 2018 | September 30, 2018 | December 29, 2018 | |||||||||||||
Net sales | $ | 947 | $ | 1,005 | $ | 923 | $ | 903 | ||||||||
Gross profit | $ | 176 | $ | 183 | $ | 166 | $ | 159 | ||||||||
Operating income | $ | 32 | $ | 38 | $ | 34 | $ | 33 | ||||||||
Net income attributable to Covetrus | $ | 23 | $ | 29 | $ | 16 | $ | 33 | ||||||||
Earnings per share: | ||||||||||||||||
Basic | $ | 0.32 | $ | 0.40 | $ | 0.22 | $ | 0.47 | ||||||||
Diluted | $ | 0.31 | $ | 0.40 | $ | 0.22 | $ | 0.46 | ||||||||
86
Item 9. | Changes in and Disagreements with Accountants on Accounting and Financial Disclosures |
None
Item 9A. | Controls and Procedures |
Disclosure Controls and Procedures
Our management is responsible for establishing and maintaining adequate internal control over financial reporting as defined in Rule 13a-15(f) or 15d-15(f) of the Exchange Act. Internal control over financial reporting is a process designed to provide reasonable assurance regarding the reliability of financial reporting and the preparation of financial statements for external purposes in accordance with generally accepted accounting principles, and includes those policies and procedures that:
(i) | pertain to the maintenance of records that, in reasonable detail, accurately and fairly reflect the transactions and dispositions of our assets, |
(ii) | provide reasonable assurance that transactions are recorded as necessary to permit preparation of financial statements in accordance with generally accepted accounting principles, and that our receipts and expenditures are being made only in accordance with authorizations of our management and directors, and |
(iii) | provide reasonable assurance regarding prevention or timely detection of unauthorized acquisition, use or disposition of our assets that could have a material effect on our financial statements. |
Because of its inherent limitations, internal control over financial reporting may not prevent or detect misstatements. Also, projections of any evaluation of effectiveness to future periods are subject to the risk that controls may become inadequate because of changes in conditions, or that the degree of compliance with the policies or procedures may deteriorate.
Our management, with the participation of our Chief Executive Officer (“CEO”) and our Chief Financial Officer (“CFO”), evaluated the effectiveness of our disclosure controls and procedures (as defined in Rules 13a-15(e) or 15d-15(e) promulgated under the Exchange Act) at December 31, 2019. Based on this evaluation, the CEO and CFO concluded that as of that date, our disclosure controls and procedures required by paragraph (b) of Rules 13a-15 or 15d-15 were not effective, at a reasonable assurance level, because of material weaknesses in our internal control over financial reporting, which we view as an integral part of our disclosure controls and procedures.
As previously disclosed in our Form 10-Q for the quarter ended September 30, 2019, Management identified deficiencies in our internal control over financial reporting which are related to the operation of information technology general controls (“ITGCs”) in the areas of logical security and change management in certain financially relevant systems. A material weakness is a deficiency, or combination of deficiencies, in internal control over financial reporting, such that there is a reasonable possibility that a material misstatement of the Company's annual or interim financial statements will not be prevented or detected on a timely basis. Management has determined that the aggregate impact of these deficiencies resulted in the following material weakness:
• | ITGCs: deficiencies in certain financially relevant systems used by us resulted in the risk of failure of other automated controls and other controls that rely on data from these applications, primarily in change management and logical security functions. |
The material weakness did not result in any identified misstatements in the current period consolidated financial statements, nor in any restatements of combined financial statements previously reported by us, and there were no changes in previously released financial results. We developed remediation plans for this material weakness as follows:
• | Improving the operation and monitoring of control activities and procedures associated with logical security including user and administrator access to the affected IT systems, including both preventive and detective control activities, |
• | Improving the operation of program change management control activities to track authorizations to changes and emergency change management procedures across the affected IT systems, including both preventive and detective controls activities, and |
• | Implementing additional training for resources in the functional areas that support and monitor our IT systems and information generated therefrom. |
During the fourth quarter ended December 31, 2019, Management identified deficiencies in our internal control over financial reporting which relate to the accounting for income taxes and determined the impact of these deficiencies resulted in a material weakness. This material weakness stemmed from issues associated with the transition to establish expanded in-house tax capabilities
87
and utilization of new tax consultants. As a result of these issues, our controls to review and analyze the Company's income tax provision and deferred income tax balances did not operate effectively.
The material weakness described above resulted in certain material and immaterial misstatements in the preliminary financial statement accounts that were adjusted prior to the issuance of the annual consolidated financial statements. We developed remediation plans for this material weakness as follows:
• | Increasing oversight by our management in the calculation and reporting of certain tax balances of our global operations, |
• | Enhancing policies, procedures, and controls relating to significant judgments impacting our income tax accounts, |
• | Augmenting our tax accounting resources, |
• | Increasing communication to information providers for tax jurisdiction specific information, and |
• | Strengthening communication and information flows between the tax department and the finance group. |
Management believes that these efforts will effectively remediate the material weaknesses. However, the material weaknesses in our internal control over financial reporting will not be considered remediated until (i) the controls are fully implemented and existing controls are reinforced, (ii) the controls are in operation for a sufficient period of time, and (iii) the controls are tested and concluded by management to be designed and operating effectively. We cannot provide any assurance that these remediation efforts will be successful or that our internal control over financial reporting will be effective as a result of these efforts. In addition, as we continue to evaluate and work to improve our internal control over financial reporting, management may determine to take additional measures to address control deficiencies or determine to modify the remediation plans described above. Management will test and evaluate the implementation of these revised processes and internal controls to ascertain whether they are designed and operating effectively to provide reasonable assurance that they will prevent or detect a material error in our financial statements.
Changes in Internal Control over Financial Reporting
Other than as described above, there have been no other changes in our internal control over financial reporting during the most recent quarter that has materially affected, or is reasonably likely to materially affect, our internal control over financial reporting.
Limitations of the Effectiveness of Internal Control
A control system, no matter how well conceived and operated, can provide only reasonable, not absolute, assurance that the objectives of the internal control system are met. Because of the inherent limitations of any internal control system, no evaluation of controls can provide absolute assurance that all control issues, if any, within a company have been detected.
Item 9B. | Other Information |
We executed an Amendment, dated as of February 27, 2020, to the Credit Agreement dated as of February 7, 2019, by and among Vet Intermediate Holdco II, LLC, JP Morgan Chase Bank, N.A., and the several banks and other financial institutions from time to time. See Part IV, Item 15, Exhibits and Financial Statement Schedules, Exhibit 10.31.
On March 3, 2020, our Board of Directors appointed Benjamin Wolin as our President and Chief Executive Officer. Mr. Wolin had been serving as our acting President and Chief Executive Officer since October 2019. Mr. Wolin’s biographical information can be found in Item 1, Business under the caption Employees and Executive Officers. We anticipate that we will enter into a mutually acceptable employment agreement with Mr. Wolin, which will be disclosed on a Form 8-K filing.
88
PART III
Item 10. Directors, Executive Officers, and Corporate Governance
The information required by this item of Form 10-K is incorporated by reference to our definitive proxy statement (which will be filed with the SEC pursuant to Regulation 14A under the Exchange Act) relating to our 2020 Annual Meeting of Shareholders (our “2020 Proxy Statement”).
Item 11. Executive Compensation
The information required by this item is incorporated by reference to our 2020 Proxy Statement.
Item 12. Security Ownership of Certain Beneficial Owners and Management and Related Stockholder Matters
The following table summarizes information as of December 31, 2019, about our equity compensation plans under which we have made grants of restricted stock, restricted stock units, and options.
Plan Category | Number of Securities to be Issued Upon Exercise of Outstanding Rights and Options (a) | Weighted-average Price of Options (b) | Number of Securities Remaining Available for Future Issuance Under Equity Compensation Plans (c) | |||||||
Equity compensation plans approved by common shareholders | 5,573,706 | $ | 15.29 | 16,531,361 | ||||||
Equity compensation plans not approved by common shareholders | — | $ | — | — | ||||||
(a) Includes 1,633,499 restricted stock units (RSUs) and 77,648 restricted stock awards (RSAs), and 3,862,559 stock options issued under our 2019 Omnibus Incentive Compensation Plan. | ||||||||||
(b) RSUs have no exercise price. Their value depends on continued employment or service over time and are settled for shares of common stock. Accordingly, these have been disregarded for purposes of computing the weighted-average exercise price. | ||||||||||
(c) 2,101,144 shares are available for purchase under our employee stock purchase plan as of December 31, 2019 and 127,748 shares are subject to purchase during the offering period December 1, 2019 to May 31, 2020. | ||||||||||
Other information required by this item is incorporated by reference to our 2020 Proxy Statement.
Item 13. | Certain Relationships and Related Transactions, and Director Independence |
The information required by this item is incorporated by reference to our 2020 Proxy Statement.
Item 14. | Principal Accountant Fees and Services |
The information required by this item is incorporated by reference to our 2020 Proxy Statement.
89
PART IV
Item 15. | Exhibits and Financial Statement Schedules |
Page | ||
(a) (1) | Financial Statements: See “Index to Consolidated and Combined Financial Statements” | |
(a) (2) | Financial Statement Schedules: None We have omitted schedules for which provision is made in the applicable accounting regulations of the SEC because they are not required under the related instructions, or they do not apply. | |
(a) (3) | Exhibits: | |
Exhibit Number | Exhibit Description | Form | Date | No. | ||||
2.1 | S-4 | 12/26/2018 | 2.1 | |||||
2.2 | S-4 | 12/26/2018 | 2.2 | |||||
2.3 | S-4 | 12/26/2018 | 2.3 | |||||
2.4 | S-4 | 12/26/2018 | 2.4 | |||||
2.5 | S-4 | 12/26/2018 | 2.5 | |||||
2.6 | S-4/A | 1/15/2019 | 2.6 | |||||
3.1 | S-4/A | 1/15/2019 | 3.4 | |||||
3.2 | S-4/A | 1/8/2019 | 3.5 | |||||
4.1 | S-4/A | 1/8/2019 | 4.1 | |||||
4.2* | ||||||||
10.1 | 8-K | 2/7/2019 | 10.1 | |||||
10.2 | 8-K | 2/7/2019 | 10.2 | |||||
10.3 | S-4 | 12/26/2018 | 10.1 | |||||
10.4 | 8-K | 2/7/2019 | 10.4 | |||||
10.5 | 8-K | 2/7/2019 | 10.5 | |||||
90
Exhibit Number | Exhibit Description | Form | Date | No. | ||||
10.6 | S-4/A | 1/8/2019 | 10.3 | |||||
10.7 | 8-K | 2/7/2019 | 10.3 | |||||
10.8† | S-4 | 12/26/2018 | 10.5 | |||||
10.9† | S-4 | 12/26/2018 | 10.6 | |||||
10.10† | S-4 | 12/26/2018 | 10.7 | |||||
10.11† | S-4 | 12/26/2018 | 10.8 | |||||
10.12† | S-4 | 12/26/2018 | 10.9 | |||||
10.13† | S-4 | 12/26/2018 | 10.10 | |||||
10.14† | S-4/A | 1/8/2019 | 10.11 | |||||
10.15† | 8-K | 2/7/2019 | 10.8 | |||||
10.16† | 8-K | 2/7/2019 | 10.9 | |||||
10.17† | 8-K | 2/7/2019 | 10.10 | |||||
10.18† | 8-K | 2/7/2019 | 10.11 | |||||
10.19† | 8-K | 2/7/2019 | 10.12 | |||||
10.20 | S-4 | 12/26/2018 | 10.16 | |||||
10.21 | S-4 | 12/26/2018 | 10.17 | |||||
10.22 | S-4 | 12/26/2018 | 10.18 | |||||
10.23 | S-4 | 12/26/2018 | 10.19 | |||||
10.24 | S-4 | 12/26/2018 | 10.20 | |||||
10.25† | 8-K | 3/5/2019 | 10.7 | |||||
10.26† | 8-K | 10/22/2019 | 10.1 | |||||
10.27† | 8-K | 11/4/2019 | 10.1 | |||||
10.28† | 8-K | 1/21/2020 | 10.1 | |||||
10.29† | 8-K | 1/21/2020 | 10.1 | |||||
10.30† | 8-K | 1/21/2020 | 10.2 | |||||
91
Exhibit Number | Exhibit Description | Form | Date | No. | ||||
10.31* | ||||||||
21.1* | ||||||||
23.1* | ||||||||
31.1* | ||||||||
31.2* | ||||||||
32.1** | ||||||||
32.2** | ||||||||
101.INS* | XBRL Instance Document | |||||||
101.SCH* | XBRL Taxonomy Extension Schema Document | |||||||
101.CAL* | XBRL Taxonomy Extension Calculation Linkbase Document | |||||||
101.DEF* | XBRL Taxonomy Extension Definition Linkbase Document | |||||||
101.LAB* | XBRL Taxonomy Extension Label Linkbase Document | |||||||
101.PRE* | XBRL Taxonomy Extension Presentation Linkbase Document | |||||||
* Filed herewith
** Furnished and not filed herewith
† Indicates management contract or compensatory plan
Item 16. 10-K Summary
None
92
SIGNATURES
Pursuant to the requirements of Section 13 or 15(d) of the Securities Act of 1934, the Registrant has duly caused this report to be signed on its behalf by the undersigned, thereunto duly authorized.
COVETRUS, INC. | ||||
Date: March 3, 2020 | By: | /s/ Benjamin Wolin | ||
Benjamin Wolin President and Chief Executive Officer | ||||
Pursuant to the requirements of the Securities Act of 1934, this report has been signed by the following persons on behalf of the registrant and in the capacities and on the dates indicated.
Name | Title | Date | ||
/s/ Benjamin Wolin | President, Chief Executive Officer and Director (Principal Executive Officer) | March 3, 2020 | ||
Benjamin Wolin | ||||
/s/ Stuart B. Gleichenhaus | Interim Chief Financial Officer (Principal Financial Officer) | March 3, 2020 | ||
Stuart B. Gleichenhaus | ||||
/s/ Laura J. Phillips | Vice President, Global Controller and Chief Accounting Officer (Principal Accounting Officer) | March 3, 2020 | ||
Laura J. Phillips | ||||
/s/ Philip A. Laskawy | Chairman of the Board and Director | March 3, 2020 | ||
Philip A. Laskawy | ||||
/s/ Deborah G. Ellinger | Director | March 3, 2020 | ||
Deborah G. Ellinger | ||||
/s/ Sandra L. Helton | Director | March 3, 2020 | ||
Sandra L. Helton | ||||
/s/ Mark J. Manoff | Director | March 3, 2020 | ||
Mark J. Manoff | ||||
/s/ Edward M. McNamara | Director | March 3, 2020 | ||
Edward M. McNamara | ||||
/s/ Steven Paladino | Director | March 3, 2020 | ||
Steven Paladino | ||||
/s/ Ravi Sachdev | Director | March 3, 2020 | ||
Ravi Sachdev | ||||
/s/ David E. Shaw | Director | March 3, 2020 | ||
David E. Shaw | ||||
93