Attached files
| file | filename |
|---|---|
| EX-31.1 - EX-31.1 - Mayville Engineering Company, Inc. | mec-ex311_9.htm |
| EX-21 - EX-21 - Mayville Engineering Company, Inc. | mec-ex21_129.htm |
| EX-32 - EX-32 - Mayville Engineering Company, Inc. | mec-ex32_6.htm |
| EX-31.2 - EX-31.2 - Mayville Engineering Company, Inc. | mec-ex312_8.htm |
| EX-23 - EX-23 - Mayville Engineering Company, Inc. | mec-ex23_167.htm |
| EX-4 - EX-4 - Mayville Engineering Company, Inc. | mec-ex4_131.htm |
UNITED STATES
SECURITIES AND EXCHANGE COMMISSION
Washington, D.C. 20549
FORM 10-K
(Mark One)
|
☒ |
ANNUAL REPORT PURSUANT TO SECTION 13 OR 15(d) OF THE SECURITIES EXCHANGE ACT OF 1934 |
For the fiscal year ended December 31, 2019
OR
|
☐ |
TRANSITION REPORT PURSUANT TO SECTION 13 OR 15(d) OF THE SECURITIES EXCHANGE ACT OF 1934 FOR THE TRANSITION PERIOD FROM TO |
Commission File Number 001-38894
Mayville Engineering Company, Inc.
(Exact name of Registrant as specified in its Charter)
|
Wisconsin |
39-0944729 |
|
(State or other jurisdiction of incorporation or organization) |
(I.R.S. Employer Identification No.) |
|
|
|
|
715 South Street Mayville, Wisconsin |
53050 |
|
(Address of principal executive offices) |
(Zip Code) |
Registrant’s telephone number, including area code: (920) 387-4500
Securities registered pursuant to Section 12(b) of the Act:
|
Title of each class |
|
Trading Symbol(s) |
|
Name of each exchange on which registered |
|
Common Stock, no par value |
|
MEC |
|
New York Stock Exchange |
Securities registered pursuant to Section 12(g) of the Act: None
Indicate by check mark if the Registrant is a well-known seasoned issuer, as defined in Rule 405 of the Securities Act. YES ☐ NO ☒
Indicate by check mark if the Registrant is not required to file reports pursuant to Section 13 or 15(d) of the Act. YES ☐ NO ☒
Indicate by check mark whether the Registrant: (1) has filed all reports required to be filed by Section 13 or 15(d) of the Securities Exchange Act of 1934 during the preceding 12 months (or for such shorter period that the Registrant was required to file such reports), and (2) has been subject to such filing requirements for the past 90 days. YES ☒ NO ☐
Indicate by check mark whether the Registrant has submitted electronically every Interactive Data File required to be submitted pursuant to Rule 405 of Regulation S-T (§232.405 of this chapter) during the preceding 12 months (or for such shorter period that the Registrant was required to submit such files). YES ☒ NO ☐
Indicate by check mark whether the Registrant is a large accelerated filer, an accelerated filer, a non-accelerated filer, smaller reporting company, or an emerging growth company. See the definitions of “large accelerated filer,” “accelerated filer,” “smaller reporting company,” and “emerging growth company” in Rule 12b-2 of the Exchange Act.
|
Large accelerated filer |
|
☐ |
|
Accelerated filer |
|
☐ |
|
Non-accelerated filer |
|
☒ |
|
Smaller reporting company |
|
☐ |
|
Emerging growth company |
|
☒ |
|
|
|
|
If an emerging growth company, indicate by check mark if the Registrant has elected not to use the extended transition period for complying with any new or revised financial accounting standards provided pursuant to Section 13(a) of the Exchange Act. ☐
Indicate by check mark whether the Registrant is a shell company (as defined in Rule 12b-2 of the Exchange Act). YES ☐ NO ☒
The aggregate market value of the Common Stock held by non-affiliates of the Registrant, based on the closing price of the shares of common stock on the New York Stock Exchange on June 28, 2019, was $272,416,084.
The number of shares of the Registrant’s Common Stock outstanding as of February 15, 2020 was 19,545,689.
DOCUMENTS INCORPORATED BY REFERENCE
Part III of this report incorporates information by reference to the Registrant’s proxy statement for its 2020 annual meeting of shareholders, which proxy statement will be filed with the Securities and Exchange Commission no later than 120 days after the close of the year ended December 31, 2019.
|
|
|
Page |
|
PART I |
|
|
|
Item 1. |
1 |
|
|
Item 1A. |
12 |
|
|
Item 1B. |
25 |
|
|
Item 2. |
25 |
|
|
Item 3. |
26 |
|
|
Item 4. |
26 |
|
|
|
|
|
|
PART II |
|
|
|
Item 5. |
27 |
|
|
Item 6. |
28 |
|
|
Item 7. |
Management’s Discussion and Analysis of Financial Condition and Results of Operations |
29 |
|
Item 7A. |
40 |
|
|
Item 8. |
41 |
|
|
Item 9. |
Changes in and Disagreements With Accountants on Accounting and Financial Disclosure |
65 |
|
Item 9A. |
65 |
|
|
Item 9B. |
66 |
|
|
|
|
|
|
PART III |
|
|
|
Item 10. |
67 |
|
|
Item 11. |
67 |
|
|
Item 12. |
Security Ownership of Certain Beneficial Owners and Management and Related Stockholder Matters |
67 |
|
Item 13. |
Certain Relationships and Related Transactions, and Director Independence |
67 |
|
Item 14. |
67 |
|
|
|
|
|
|
PART IV |
|
|
|
Item 15. |
68 |
|
|
Item 16. |
70 |
i
Cautionary Statement Regarding Forward-Looking Statements
Certain matters discussed in this Annual Report on Form 10-K contain forward-looking statements that involve risks and uncertainties, such as statements related to future events, business strategy, future performance, future operations, financial position, estimated revenues and losses, projected costs, prospects, plans and objectives of management. All statements other than statements of historical fact may be forward-looking statements. Forward-looking statements are often, but not always, identified by the use of words such as “seek,” “anticipate,” “plan,” “continue,” “estimate,” “expect,” “may,” “will,” “project,” “predict,” “potential,” “targeting,” “intend,” “could,” “might,” “should,” “believe” and similar expressions or their negative. Forward-looking statements should not be read as a guarantee of future performance or results, and will not necessarily be accurate indications of the times at, or by, which such performance or results will be achieved. Forward-looking statements are based on management’s belief, based on currently available information, as to the outcome and timing of future events. These statements involve estimates, assumptions, known and unknown risks, uncertainties and other factors that may cause actual results or events to differ materially from those expressed in such forward-looking statements. Mayville Engineering Company, Inc. (MEC, the Company, we, our, us or similar terms) believes the expectations reflected in the forward-looking statements contained in this Annual Report on Form 10-K are reasonable, but no assurance can be given that these expectations will prove to be correct. Forward-looking statements should not be unduly relied upon.
Important factors that could cause actual results or events to differ materially from those expressed in forward-looking statements include, but are not limited to, those described in “Risk Factors” in Part I, Item 1A of this Annual Report on Form 10-K, as such may be amended or supplemented in Part II, Item 1A of our subsequently filed Quarterly Reports on Form 10-Q, and the following:
|
|
• |
failure to compete successfully in our markets; |
|
|
• |
risks relating to developments in the industries in which our customers operate; |
|
|
• |
our ability to maintain our manufacturing, engineering and technological expertise; |
|
|
• |
the loss of any of our large customers or the loss of their respective market shares; |
|
|
• |
risks related to scheduling production accurately and maximizing efficiency; |
|
|
• |
our ability to realize net sales represented by our awarded business; |
|
|
• |
our ability to successfully identify or integrate acquisitions; |
|
|
• |
risks related to entering new markets; |
|
|
• |
our ability to develop new and innovative processes and gain customer acceptance of such processes; |
|
|
• |
our ability to recruit and retain our key executive officers, managers and trade-skilled personnel; |
|
|
• |
risks related to our information technology systems and infrastructure; |
|
|
• |
manufacturing risks, including delays and technical problems, issues with third-party suppliers, environmental risks and applicable statutory and regulatory requirements; |
|
|
• |
political and economic developments, including foreign trade relations and associated tariffs; |
|
|
• |
volatility in the prices or availability of raw materials critical to our business; |
|
|
• |
results of legal disputes, including product liability, intellectual property infringement and other claims; |
|
|
• |
risks associated with our capital-intensive industry; |
|
|
• |
risks related to our treatment as an S Corporation prior to the consummation of our initial public offering of common stock (IPO); |
|
|
• |
risks related to our employee stock ownership plan’s treatment as a tax-qualified retirement plan; and |
|
|
• |
our ability to remediate the material weaknesses in internal control over financial reporting identified in preparing our financial statements included in this Annual Report on Form 10-K, and to subsequently maintain effective internal control over financial reporting. |
These factors are not necessarily all of the important factors that could cause actual results or events to differ materially from those expressed in forward-looking statements. Other unknown or unpredictable factors could also cause actual results or events to differ materially from those expressed in the forward-looking statements. All forward-looking statements attributable to us are qualified in their entirety by this cautionary statement. Forward-looking statements speak only as of the date hereof. We undertake no
1
obligation to update or revise any forward-looking statements after the date on which any such statement is made, whether as a result of new information, future events or otherwise, except as required by federal securities laws.
General
MEC is a leading U.S.-based value-added manufacturing partner that provides a broad range of prototyping and tooling, production fabrication, coating, assembly and aftermarket components. Our customers operate in diverse end markets, including heavy- and medium-duty commercial vehicles, construction, powersports, agriculture, military and other end markets. We have developed long-standing relationships with our blue-chip customers based upon a high level of experience, trust and confidence. “We Make Things Simple” by providing a diverse set of process offerings and a “one stop shop” for end-to-end solutions with benefits throughout the entire product lifecycle, including front-end collaboration in design and prototyping, product manufacturing, aftermarket components and ancillary supply chain benefits. Founded as a corporation in 1945 and headquartered in Mayville, Wisconsin, we are a leading Tier I U.S. supplier of highly engineered components to original equipment manufacturer (OEM) customers with leading position in their respective markets. We are focused on producing the highest quality components using complex processes at the lowest cost by working with customers throughout the product design and development process to establish optimal solutions. Our engineering expertise and technical know-how allow us to add value through every product redevelopment cycle (generally every three to five years for our customers). According to The Fabricator, we have been ranked as the largest fabricator in the United States for the past nine years in a row (2011 – 2019). We are more than two times the size of our next largest competitor, based on The Fabricator’s projections for revenue for metal fabricating companies.
Our customers’ complex products require a unique combination of our capabilities that allow us to achieve a customized offering to satisfy our customers’ desired outcomes. Our capabilities, which include, but are not limited to: metal fabrication, metal stamping, tube bending and forming, robotic part forming, robotic welding, resistance welding, five-axis tube and fiber laser cutting and custom coatings, including high heat and chemical agent resistant coating (CARC) painting, are used in a variety of applications and represent the building blocks of what we produce.
Our key customers have globally recognized brands and demand the highest product quality and expertise. Over our nearly 75-year history, we have developed capabilities and provide solutions that result in customer loyalty and long-standing relationships, which we call “Experience You Can Trust”. We have a diverse and market-leading customer base that serves broad end markets representing favorable near- and long-term growth prospects for us. We have a track record of growth and are well-positioned to increase our market share and benefit from growth in customer demand as well as consolidate demand across the end markets that we serve. To help pursue our strategic mission, we have approximately 2,600 employees who are tactically aligned around our core values and will continue to participate in our employee ownership culture. We are led by an experienced management team that has contributed to our growth by establishing deep and long-standing relationships with key customers, and has worked to expand the customer base both organically and through strategic acquisitions.
We maintain an established base of long-standing customers comprised of leading, blue-chip OEM manufactures across the United States. Our broad capabilities offering and track record of producing the highest quality solutions have allowed us to establish, and subsequently deepen, relationships with additional products and platforms over time. For example, our more than 40 year relationship with Deere & Company (John Deere) began with a small order of simple stamped parts for a farm tractor in its agricultural segment that expanded over time and represented 2019 sales in excess of $78.0 million across five market segments, representing over 60 model platforms. We have also been successful in winning customers and rapidly expanding relationships with high-growth customers by utilizing our diversified “one-stop” offering. For instance, our relationship with Volvo Truck began with fuel tanks and has expanded over the last seven years to include exhaust tubing, new sleeper cab and chassis fabrications and other fabrications. Through the expansion of multiple fabricated components from multiple facilities, we have been able to deepen our relationship with this customer and solidify our position as an important strategic sourcing partner.
We serve customers through 20 strategically located U.S. facilities across eight states, with almost three million square feet of manufacturing capacity. Our expansive footprint enables us to service and maintain strong relationships with existing key customers across the United States with a “local” presence, as well as target new customer opportunities. We have a proven track record of improving financial results by thoroughly understanding our capabilities and the markets we serve, and aligning our people and resources to optimize results. Coupled with our focus on market alignment and execution, we constantly strive to improve and refine capabilities, capacities and reduce our carbon footprint. In addition, the ongoing investment in flexible, re-deployable automation allows us to expand output while reducing cost and improving quality, productivity and consistency for margin enhancement and market leading competitiveness.
2
Our leading market position, embedded customer relationships with leading OEMs, unique value proposition and proven acquisition strategy has allowed us to achieve attractive financial performance and has positioned us for further growth. Our historical financial success is a function of our engineering expertise, extensive manufacturing capabilities, limited commodity exposure, investment in automation and embedded relationships with the contractual ability to pass input costs through prices. We believe we are poised to grow though economic cycles due to our:
|
|
• |
market positioning and reputation; |
|
|
• |
product breadth; |
|
|
• |
flexible and re-deployable capital investment in automation and process capabilities; and |
|
|
• |
our geographic, end market and product diversification. |
Our diversified profile today best positions us for stability and leading market performance through all phases of an economic cycle.
Acquisition
On December 14, 2018, we acquired Defiance Metal Products Co., Inc. (DMP), a full-service metal fabricator and contract manufacturer with two facilities in Defiance, OH, one in Heber Springs, AR, and one in Bedford, PA. We acquired DMP for $117.1 million, net of cash received. The DMP acquisition provided us with enhanced product, customer and geographic diversification with minimal customer overlap (i.e. less than $15.0 million).
Our Industry
We compete in the highly fragmented market of contract manufacturers, the majority of which are small local players that are limited in scale, capabilities and technology. Many of these local manufacturers have single or limited production capabilities and provide niche components in specific geographic markets. Accordingly, there are a limited number of competitors in the contract manufacturing market in which we operate with the capacity and expertise to deliver the full range of solutions we offer. For example, our diverse manufacturing capabilities across product lines have contributed to us being the recipient of The Fabricator’s “FAB 40” #1 Largest Fabricator in the attractive U.S. markets for the past nine years in a row (2011 – 2019). While we compete with certain manufacturers across selected product lines, we believe that no single manufacturer directly competes with us across our full offering and end market applications.
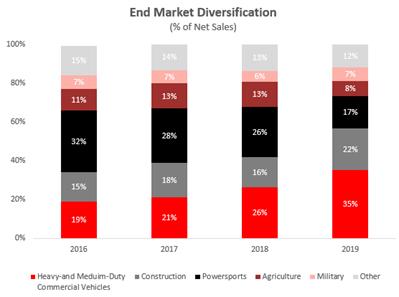
Our end market diversification coupled with our extensive product breadth allows us to maintain financial stability as individual end markets fluctuate. The primary end markets we serve include heavy- and medium-duty commercial vehicles, construction, powersports, agriculture and military, among other machinery markets. As markets strengthen or weaken, our output is redirected and realigned to support ongoing change. Further, as these fluctuations affect the market, we are favorably positioned to benefit from the broader trend of our OEM customers to consolidate to fewer and more sophisticated suppliers in order to improve quality and delivery while lowering the total cost of doing business. This consolidation trend will allow us to grow and protects our cash flow as markets change and shift.
3
We have also experienced, and benefitted from, an OEM trend of seeking to improve their strategy execution and simplify their business through outsourcing. Based on our history, OEMs pursue a strategy that focuses on core component market differentiation, such as structural frames and complete powertrain assemblies, and prefer to outsource the remaining product components to third parties rather than manufacturing them in-house. This is done in order to maintain their strategic focus, drive cost savings and reduce their own investment in manufacturing, thereby allowing them to focus on the most important aspects of their value creation process, namely product design and development, final product assembly and testing, branding, sales, marketing and distribution. While each specific OEM differs in its strategy, we see this trend continuing as customers deal with workforce constraints and look for optimum return on investments and improving cash flow. Moreover, our OEM customers focus on the production of the core components of their products, which leads them to rely on outsourced providers like us for the remaining components of their finished product needs. We believe we will benefit from this continued shift in our customers’ focus and ongoing desire for OEMs to improve efficiencies, reduce costs and simplify supply chains. Our established and embedded relationships, breadth of capabilities and scalability will allow us to simplify the supply chain process for our customers by acting as a single point of contact in the supply chain. In addition, we believe OEMs are increasingly favoring platforms supported by larger, more sophisticated and financially stable suppliers with the ability to serve large national and international operations all while maintaining a local touch. Our extensive manufacturing footprint, competitive cost structure and integrated design, engineering, production planning and quality program management capabilities positions us favorably to take advantage of these opportunities and trends.
Our Competitive Strengths
We believe that customers turn to us for their manufacturing needs because we are the ultimate “ReSource”. ReSource is a dual-purpose acronym we use to describe the breadth of our capabilities and our goal to be the one-stop solution allowing customers to re-source all of their fabrication needs through us. We collaborate with our customers to generate a strategic alignment and position ourselves as an essential part of our customers’ product development and manufacturing process by drawing on our deep product and engineering knowledge to deliver best-in-class solutions. We offer a broad portfolio of end-to-end solutions comprised of advanced and innovative processes and capabilities that enhance quality and simplify supply chains. We are focused on producing the highest quality components using complex processes at the lowest cost by working with customers throughout the product design and development process to establish optimal solutions. Our engineering expertise and technical know-how allows us to add value through every product redevelopment cycle (generally every three to five years for our customers).
Value-Added Supply Chain Partner with Embedded Relationships. Our embedded relationships with our large and diverse customer base are driven by the P.R.I.D.E. (“Personal Responsibility In Daily Excellence”) approach our employees take in their work, which emphasizes the highest quality and performance in all facets of our business, including our ability to partner with our customers and deliver to them complex solutions across a wide range of products. Our unique, end-to-end offering provides solutions throughout the life cycle of a product, including upfront product manufacturability advice and prototyping, production volumes and aftermarket components. We strive to maintain operation alignment (and continuous re-alignment) with our customers’ strategy and production activities as they evolve, allowing us to remain agile in response to market changes, while enabling our customers to be successful, and to remain adaptable to changes in customer needs to retain flexibility to adjust appropriately. Together, these items comprise “The MEC Mission.” Our focus on collaboration with our customers and our breadth of capabilities also generates strategic alignment with our customers, resulting in sticky relationships, driving vendor reduction and providing other ancillary benefits such as optimization of working capital investments. Our track record of engineering expertise has resulted in our consistent inclusion in customer design and prototyping activities, enabling customers to view us as an invaluable extension of their own teams. In turn, this collaboration allows our customers to focus on the development of their core technologies and products. Our position as a deeply embedded supply chain partner of scale allows us to provide a multitude of solutions, driving strong customer relationships with high switching costs.
Leading and Defendable Market Position in Attractive North American Market. According to the Fabricator, we have been ranked as the largest fabricator in the United States for the past nine years in a row (2011 – 2019). The market is highly fragmented and characterized by high barriers to entry given the complex nature of the work, established relationships, and high customer switching costs. While there are numerous competitors in the markets in which we operate, few maintain the product breadth, manufacturing capabilities, scale or engineering expertise that we do. Our depth of capabilities allows us to offer our customers:
|
|
• |
low volume production capability; |
|
|
• |
customized and sophisticated solutions; |
|
|
• |
unique engineering and manufacturing capabilities throughout the product lifecycle; |
|
|
• |
critical scale to service large national and regional customers as well as local customers; and |
|
|
• |
the ability to act as a single point of contact and offer seamless customer service. |
Our position in the market, along with our acquisition experience and reputation as the go-to consolidator, will result in continued organic and acquisitive growth in the future.
4
End Market and Customer Diversification. Our value-added manufacturing focus enables us to remain diversified across a variety of customer end markets, including heavy- and medium-duty commercial vehicles, construction, powersports, agriculture and military, among others. These end markets are representative of our globally recognized customers, which are comprised of large OEM manufacturers. In 2019, our top customer and top ten customers accounted for 15% and 81% of net sales respectively, which collectively represents hundreds of platforms that we serve across a variety of end markets and customer operating segments. Our access to a multitude of end markets allows us to strategically shift focus to sell into current opportunities as end market demand evolves. In addition to customer and end market diversification, our customers themselves are also diversified across multiple end markets. For example, John Deere is one of our leading customers with 2019 net sales accounting for 15% of our total net sales, to whom we provide over 5,000 SKUs across over 60 individual John Deere platforms including the agriculture, forestry, turf care, power systems and construction markets. Our increasingly stable performance is a direct result of our intentional business design of agility and adaptability to realign manufacturing capacities to serve diversified and ever-changing end markets.
Breadth of Capabilities Appealing to a Variety of Applications. We have many manufacturing capabilities that together represent the building blocks for the complex solutions we provide to our customers. We maintain a full spectrum of capabilities across our 20 production facilities to address a wide set of customer needs, including upfront product development advice and prototyping, unique manufacturing processes and capabilities across a variety of products and back-end finishing, assembly and aftermarket components representing a unique end-to-end offering. Our range of capabilities combined with our breadth of components, including fabrications, tubes, tanks, and performance structures, expands the applicable uses and end markets in which we may offer our components. Throughout our history, our capabilities have allowed us to generate growth by expanding into new verticals and by further penetrating existing verticals through cross-selling to increase wallet share, a strategy that has driven sticky relationships with our customers. Further, our unique combination of manufacturing processes allows us to opportunistically target sophisticated, higher margin business. The diversity of our offering has provided our Company with financial stability through various end market and economic cycles.
Technology-Enabled Infrastructure. We continue to invest in a technology-enabled asset base that provides significant flexible and re-deployable capacity to support our planned growth, increases profitability and efficiency, reduces spend on energy and drives a long-term cost advantage over our competitors. We have leveraged our purchasing power to make significant investments in operational infrastructure throughout our history, in items such as flexible and re-deployable automation and capacity improvements to improve throughput, quality and consistency. For example, we were one of the first in our industry to adopt fiber lasers and have continued to invest in this capability. We have implemented 10,000-watt fiber lasers with an automation tower, which are on average three times faster, provide a cleaner, more precise cut and use one-third of the power compared to traditional CO2 lasers, with a payback period of less than two years. Additionally, the implementation of robotic brakes has improved quality through a continued shift towards precision automation. By reducing setup procedures, manual employee lifting requirements and downtime while offering additional capacity, the implementation of robotic brakes has resulted in a payback period of approximately two years. These two examples of investments in technology-enabled infrastructure allow us to reallocate our workforce, as employees can be retrained and redeployed into more technically skilled positions. In today’s ever-changing labor market, the ability to redeploy labor to increase flexibility and capacity for our customers is of utmost importance and interest as part of our strategy. Our investments in continuous improvement and automation have driven operational efficiencies and improved metric tracking allowing our management team to more effectively run the business and improve the value we provide to our customers. We have, from time-to-time, made strategic,
5
customer-driven investments that directly support new product and market expansion which result in further competitive advantages and higher switching costs for our customers.
Cost Structure and Operational Excellence. We have reduced our exposure to commodity price risk by structuring our customer contracts to pass through changes in commodity prices. As such, we have been able to effectively limit any potential impact from recent tariffs and commodity price volatility to our margins. Our scale and profitability have also allowed us the flexibility to implement continuous improvement initiatives in driving efficiencies, such as automation and additional capacity, which will result in long-term efficiency and margin improvements, and expanded capabilities.
Our Strategy
Achieve Sales Growth Through Organic Expansion. We believe there is ample opportunity to achieve deeper penetration of existing customers and to win new customers with our strong one-stop offerings. By leveraging our core product capabilities to expand into new markets, and establishing new offerings in attractive, adjacent or complementary platforms through new product introductions, there is significant opportunity to execute on our organic growth initiatives. Expanding our wallet share with our customers by capturing a wider variety of products and more platforms both solidifies our relationship with customers (because it increases customer switching costs) and attracts potential new customers that seek to simplify supply chains, while also defending our market position from our competitors. These opportunities are enhanced through cross selling between the acquired DMP capabilities and customer base and MEC’s legacy capabilities and customer base. Our expertise allows us to produce higher quality components at cost-effective rates while our volume, equipment and know-how establish competitive advantages. Further, an expanded offering increases our strategic alignment with customers and supports our “We Make Things Simple” value proposition by presenting customers with further vendor consolidation opportunities.
Pursue Opportunistic Acquisitions. Our management team maintains a proven track record of successfully executing and integrating strategic acquisitions. We have completed two significant acquisitions since 2012 (Center Mfg. Co. in 2012 and DMP in December 2018) and four other complementary acquisitions since 2004, which have contributed new capabilities, end markets and technologies to our legacy business, along with significant synergy opportunities that have enhanced our financial position. Our strategy is to continue to identify, and opportunistically execute on, accretive acquisitions that will allow our Company to achieve further growth. We believe that our reputation, scale and track record of performance makes us a “consolidator of choice” among industry participants, which has led to a growing pipeline of actionable acquisition opportunities. Our investment criteria for acquisitions are U.S.-based companies with long-standing customer bases comprised of leading OEMs, and specialized manufacturing capabilities that allows us to enhance our existing expertise or expand into new types of capabilities, among other criteria. It is our view that continued execution of our acquisition strategy provides significant opportunity to generate shareholder value through further consolidation of our fragmented industry. The market environment, comprised mainly of small local and regional players, provides ample add-on acquisition opportunities to bolster our one-stop shop approach to broadly serving our customers. Beyond our existing served markets, we see potential acquisition opportunities within the rail, aerospace, heavy fabrication and food end markets, among others.
Continue Process-Driven Improvement Initiatives. Our process-driven improvement initiatives have resulted in significant savings throughout our history, leading to improved financial results and positive customer outcomes. Our strategy will continue to include a keen focus on continuous improvements in order to maintain a differentiated and defendable market-leading position, as well as ongoing costs and operating improvements. Improvement initiatives in 2019 were focused on strategic investments in automation technology and capacity, which are expected to drive immediate productivity and margin improvements as the integration efforts are completed. For example, we currently have process driven improvement plans that relate to:
|
|
• |
successful integration of new 10,000 watt fiber lasers and automated material handling equipment in Mayville, Wisconsin and Defiance, Ohio; |
|
|
• |
consolidation of shifts through better utilization of automation on paint lines, new laser technology, automated machining centers and optimization of companywide assets; and |
|
|
• |
acquisition synergies between DMP and legacy MEC through centers of competencies driving best practices throughout the organization. |
6
Maintain Alignment with Employee Base and Employee-Driven Results. Our rich history of employee ownership and personal responsibility in daily excellence has cultivated a strategic management-employee alignment and results-driven organization with each employee contributing to a common goal. Our employees maintained a significant ownership stake following our IPO, which we believe benefits the entire organization as our strategic alignment remains in place and continues to generate employee-driven results. As we continue to invest in our business and increasingly implement a more technology-enabled infrastructure, we will strive to redeploy our employees in other, higher-skilled areas of our business and invest in training where needed. Our employees are the foundation of our company; with experience across a diverse range of markets and capabilities, they drive innovation, believe in our process and the outcomes of their work and our success. We and our employees are also highly involved in, and actively support, the communities in which our facilities are located; our 2,600 employees take P.R.I.D.E. in creating value and support for both our customers and communities every day.
We offer a broad portfolio of end-to-end processes and solutions comprised of advanced and innovative capabilities that enhance quality and simplify supply chains for our customers. Through our collaborative approach, we maintain a complete, and growing, set of sophisticated manufacturing capabilities to meet the diverse needs of our customers, including:
|
|
• |
Program Management — We offer our customers a complete solution from concept to launch following the APQP (Advanced Product Quality Planning) process (planning, design for manufacturability and development, process design and improvement, product and process validation and continuous improvement). |
|
|
• |
Engineering — We collaborate with our customers and provide design for manufacturing, off-line programming (lasers, brake press, machining, robot welding, coordinate measuring machines), value engineering and CI (continuous improvement). |
|
|
• |
Tool Design and Build — Our in-house tool design and tool room capability ensures quality from start to finish. We build and service all categories of tooling, including large progressive dies. |
|
|
• |
Laser Cutting — Our programmable fiber and CO2 laser cutting capabilities eliminate expensive hard tooling. Our equipment can cut metal up to 1 inch thick while maintaining tolerances to .002 inches at speeds up to 3,300 per minute. Our tube lasers are state of the art cutting machines that offer exceptional tolerances and through-put. |
|
|
• |
Brake Press — We combine our operator’s expertise with the proper equipment required to offer top versatility to our clients for bending, forming, coining and air bending. Our facilities house the latest press brake press machinery including robotic part manipulation and stacking. |
|
|
• |
Stamping — We provide custom metal stamping capabilities for short, medium or long production runs. For longer runs, our production of sheet metal stamping uses 50 to 1,200-ton manual or automatic feed presses with state-of-the-art feed lines for precision metal stamping. Our small, high-speed presses are ideal for producing intricate high-volume stampings. |
|
|
• |
Machining — We provide a variety of machining capabilities to meet our customer needs by providing in-house machining assistance for parts that are part of larger fabrications and assemblies. |
|
|
• |
Tube Bending — We maintain vast tube bending capabilities, including (i) manufacturing of oval, round and square tubes from .25 inch up through six inch and (ii) leveraging our extensive inventory of equipment including the latest CNC (computer numerical control) benders; and state-of-the-art technologies such as CNC electro-servo-driven bending with multi-task heads. |
|
|
• |
Welding — We have earned our reputation as one of the premier manufacturers of weldments. Our welding departments offer manual and robotic wire welding, including GMAW (Gas Metal Arc Welding and also known as MIG, or Metal Inert Gas), GTAW (Gas Tungsten Arc Welding and also known as TIG (Tungsten Inert Gas), Heliarc), Fluxcore, Metalcore, Aluminum, Plasma Weld, Brazing and Pulse Heliarc. |
|
|
• |
Coatings, Assembly and Logistics — We provide premier full-service coating, assembly and logistics solutions for blue chip OEMs. Our coating capabilities offer a full-range of high technology industrial coating capabilities, including: E-Coat, military certified CARC, commercial and industrial powder and liquid coatings. Our coating systems utilize pre-treatment including acid pickle, zinc phosphate and in-line Alodine for the conversion of aluminum. |
7
We collaborate with our customers to generate a strategic alignment and position ourselves as an essential part of our customers’ product development and manufacturing process by drawing on our deep product and engineering knowledge to deliver best-in-class solutions. Our approach is simple: we view quality as a significant business strategy with a strong return on investment. Our philosophy on quality is based on Continuous Improvement with an IATF (international automotive task force) and ISO (international organization for standardization) foundation. Our skilled and experienced staff is highly trained in areas of quality planning, metrology, geometric dimensioning and tolerancing (ASME Y14.5M 1994), ISO, QS9000, statistical techniques (SPC) and ISO 14001 certifications. Our Quality Management System is comprised of the following:
|
|
• |
IATF 16949:2016 certification (one of the automotive industry’s most widely used international standards for quality management); |
|
|
• |
ISO 9001:2015 registration (international standard for quality management systems); |
|
|
• |
process and assembly line audits with focus on process control; |
|
|
• |
process capability that is proven at validation and monitored during production; and |
|
|
• |
specialized validations for paint and weld operations. |
We periodically enter into joint process improvement efforts with key customers. Such exercises have historically resulted in reduced manufacturing critical path time, cost reductions and quality improvements through effective batch sizes and more repeatable processes. Our continuous improvement initiatives have resulted in the acquisition and application of state-of-the-art technologies and plant improvements that support lean, quick response manufacturing flexibility that put us at the forefront of our market. Moreover, the agility that our quick response manufacturing methodology provides us keeps our purchasing, manufacturing, engineering and quality teams on the cutting edge of flexible manufacturing. This adaptable approach also decreases manufacturing costs, allows for faster order turnaround times, and elimination of excess waste.
We maintain an advanced machinery portfolio in our facilities that allow us to leverage our employee workforce with state-of-the-art capabilities and functionality. We strive to maintain our assets or upgrade capabilities where deterioration has driven obsolescence or better technology is available, reducing our carbon footprint. Most recently, we have invested in two fiber laser systems with automation aimed at reducing labor content and optimizing floor space which allows us to generate more revenue with the same workforce and footprint. We have also recently invested in a machining center with palletizers, robotic brake presses, robotic weld cells and a direct-to-metal paint line.
Our primary end markets include (but are not limited to) the heavy- and medium-duty commercial vehicles, construction, powersports, agriculture and military markets. While our individual end markets may be exposed to cyclical variations, the diversified nature of our end markets affords us the ability to shift production with demand as certain end markets trend lower and others trend higher. In our experience, our diversification has muted the impact of downturns on our business that we have faced in the past. For example, we experienced net sales growth during the 2008 and 2009 recessions due to strong orders, particularly from our customers focused on the military end market. Moreover, as our heavy- and medium-duty commercial vehicles, construction, powersports, and agriculture customers’ revenues fluctuated from 2013 to 2017, with median peak-to-trough sales decline of 23%, our peak-to-trough sales declines were less than that of those respective markets at only 10%. We were able to accomplish this by reallocating our resources to serve our heavy- and medium-duty commercial vehicles and powersports customers, leading to strong double-digit growth in those end markets.
|
|
• |
Heavy- and Medium-Duty Commercial Vehicles: Heavy-duty commercial vehicles include class 8 heavy trucks such as standard semi-trucks. Medium-duty commercial vehicles include classes 3-7 trucks such as box trucks; |
|
|
• |
Construction: Primary applications include wheel loaders, crawlers, skid steer loaders, excavators, motor graders, access equipment and other construction equipment; |
|
|
• |
Powersports: Encompasses our all-terrain (ATV) and multi-utility (MUV) vehicles, as well as marine and motorcycle markets; |
|
|
• |
Agriculture: Primary applications include tractors, combines, sprayers, turf care, implements and other agriculture-related equipment; |
|
|
• |
Military: We provide a variety of components for military vehicle platforms; and |
|
|
• |
Other: We provide components and assemblies to a variety of other industrial and automotive end markets, such as power generation, mining and medical cabinetry. |
8
We are a critical and deeply embedded supply partner with strong strategic alignment and relationships with our customers. We have developed long-standing business relationships with our OEM customers, many of which span decades. Further, we are diversified by customers and end markets with net sales attributed to our top 20 customers accounting for $471 million of 2019 net sales, and no single end market accounting for more than 38% of net sales. For the year ended December 31, 2019, John Deere, AB Volvo and PACCAR Inc. accounted for 15%, 14% and 13% of net sales, respectively. We have not historically experienced customer attrition given high customer switching costs resulting from our embedded relationships driven by our broad capabilities and scale.
Raw Materials and Manufactured Components
Our purchases primarily include steel and aluminum. We maintain a broad and diverse base of over 1,000 suppliers. Our established relationships provide efficient and flexible access to resources and redundancy to ensure support of our customers. We have no history of material supply issues or outages. In 2019, no single supplier represented more than 19% of our total purchases and 98% of the raw materials we purchased were sourced from domestic suppliers. Our suppliers are strategically located in order to maximize efficiencies and minimize shipping costs, although switching costs are minimal and we maintain a multitude of alternative suppliers that we could transfer orders to, if needed. We have structured our customer contracts to pass through commodity price changes, which has allowed us to remain mostly unaffected by the recent raw material price volatility and tariffs. As we continue to grow, we intend to leverage our size and scale to further reduce material costs.
Sales and Marketing
We have a strong sales team comprised of over 50 experienced professionals responsible for managing and expanding client relationships, and proactively pursuing new opportunities. Sales personnel are aligned by market segment and customer, including heavy- and medium-duty commercial vehicles, construction, powersports, agriculture, military and other end markets, and employ a highly technical and collaborative sales process with deep knowledge of our customers and capabilities. Sales personnel have assigned support teams comprised of inside sales, marketing, and sales administration personnel. We are consistently involved in request for proposal processes, where our sales teams with deep process expertise collaborate with customers on optimal designs for manufacturability and manufacturing efficiency. The upfront collaboration drives formalization of product specifications, program lifecycle planning, cost estimates and risk mitigation. The sales process typically takes 3 – 18 months and ultimately ends in the implementation of product lifecycle timelines and purchase orders under long-term customer arrangements. The sales team utilizes systems infrastructure that effectively track and manage backlogs, quotes and bookings information, strategic projects and call reports, all of which are reviewed at weekly sales team meetings.
Information Systems
We utilize standardized information technology systems across all areas of quoting and estimating, enterprise resource planning, materials resource planning, capacity planning and accounting for enhanced procurement of work, project execution and financial controls. We provide information technology oversight and support from our corporate headquarters in Mayville, Wisconsin. The operational information systems we employ throughout our company are industry specific applications that in some cases have been internally or vendor modified and improved to fit our operations. Our enterprise resource planning software is integrated with our operational information systems wherever possible to deliver relevant, real-time operational data to designated personnel. Accounting and operations personnel of acquired companies are trained not only by our information technology support staff, but by long- tenured employees in our organization with extensive experience using our systems. We believe our information systems provide our people with the tools to execute their individual job function and achieve our strategic initiatives.
Our Competition
We participate in a highly fragmented market with competitors in each of the end markets we serve ranging in size from small companies focused on a single capability or end market, to large multi-disciplinary companies. While there can be instances of intense competition from specific end markets, we believe that we have been able to effectively compete, and maintain competitive advantages on the basis of our:
|
|
• |
scale and product offering with the ability to cross-sell and provide our customers with a one-stop solution; |
|
|
• |
broad manufacturing capability and flexibility to fulfill requests that require complex solutions; |
|
|
• |
customer service with our highly skilled and knowledgeable workforce able to provide consultative advice; and |
|
|
• |
regionalized geographic focus provides a defensible position from both foreign and domestic competitors as our customers continue to take a regionalized approach to production, which provides a shorter supply chain with greater flexibility. |
9
We maintain an experienced and skilled workforce. We have been highly focused on attracting and retaining high quality personnel as they represent a critical factor in our continued success. As of December 31, 2019, we had approximately 2,600 full-time employees, none of which are unionized. Despite the recent market challenges in the hiring of trade-skilled employees, our continued investment in newer technologies and capabilities has allowed us to opportunistically re-train and redeploy certain roles that were previously human capital-intensive, and re-train and repurpose employees into other areas of the company. On average, our employees have approximately seven years of service with us. We believe we maintain strong relations with our employees and believe they are aligned with our employee-owned mindset.
Environmental Matters
We are subject to numerous federal, state and local laws and regulations relating to manufacturing, handling and disposal of materials into the environment. We believe that our environmental control procedures are adequate.
Information About Our Executive Officers
The following table sets forth certain information as of February 1, 2020, regarding our executive officers:
|
Name |
|
Age |
|
|
Position |
|
|
Robert D. Kamphuis |
|
|
61 |
|
|
Chairman, President and Chief Executive Officer |
|
Todd M. Butz |
|
|
48 |
|
|
Chief Financial Officer |
|
Ryan F. Raber |
|
|
37 |
|
|
Executive Vice President―Strategy, Sales & Marketing |
|
Steve P. Mance |
|
|
60 |
|
|
Chief Operating Officer |
|
Clifford O. Sanderson |
|
|
62 |
|
|
Vice President―Human Resources |
|
Eric J. Welak |
|
|
44 |
|
|
Executive Vice President―Fabrication |
Robert D. Kamphuis joined our company as President and Chief Executive Officer in 2005 and has served as the Chairman, President and Chief Executive Officer since January 2007. Mr. Kamphuis also serves as a board member and past Chairman of Wisconsin Manufacturers & Commerce, a board member of Brakebush Brothers, Inc. and The Nordic Group of Companies, Ltd., and Subzero Group Inc., and a member of the UW System Business Council, the John Deere Direct Material Supplier Council, the Harley Davidson Supplier Advisory Council and the Mebane Manor Executive Corporate Club. Prior to joining our company, Mr. Kamphuis held various roles with Giddings & Lewis, Inc. including as President and Chief Executive Officer of Gilman Engineering and Manufacturing Co., LLC, a designer and manufacturer of automated assembly systems, and began his career with Ernst & Young. Mr. Kamphuis is a graduate of the Executive International Leadership Program at Stanford University and earned a Bachelor of Business Administration & Accounting from the University of Wisconsin-Whitewater. He is also a licensed certified public accountant.
Todd M. Butz joined our company in 2008 and has served as our Chief Financial Officer since January 2014. Mr. Butz also serves on the Board of Trustees for Marian University. Prior to joining our company, Mr. Butz spent time as the Finance Manager at Mercury Marine, a subsidiary of the Brunswick Corporation, and Audit Supervisor at Schenck Business Solutions. Mr. Butz earned a Bachelor of Science in Accounting and Business Management from Marian University and is a licensed certified public accountant.
Ryan F. Raber joined our company in 2009 and has served as our Executive Vice President – Strategy, Sales & Marketing since June 2019. Prior to serving in his current position, Mr. Raber served as our Executive Vice President – Sales & Marketing beginning in November 2018 and as our Vice President of Sales & Marketing beginning in August 2013. Mr. Raber earned a Masters of Business Administration from the University of Wisconsin-Madison and a Bachelor of Science in Mechanical Engineering from Purdue University.
Steve P. Mance joined our company on December 14, 2018 as part of the DMP acquisition where he served as President for the prior eight years. Mr. Mance became our Chief Operating Officer in June 2019. Prior to joining DMP, Mr. Mance served as Vice President and General Manager of the Charging business at Bendix for eight years, President of the Components Division at Hendrickson International, Vice President of Operations and Six Sigma at AlliedSignal and various engineering and management positions at IBM. Mr. Mance earned a Bachelor of Science in Chemical Engineering from the University of Buffalo.
Clifford O. Sanderson joined our company in October 2013 and has served as our Vice President – Human Resources since that time. Prior to joining our company, Mr. Sanderson served as the Director of Human Resources at Coleman Cable, Inc. from June 1998 to October 2013, the Human Resources Manager at Nypro and the Divisional Director of Human Resources at Wheeling Pittsburgh Steel Corporation. Mr. Sanderson has over 30 years of human resources management experience. Mr. Sanderson earned a Masters in Human Resources and a Masters of Business Administration, Operations and Finance, from the Keller Graduate School of Management at DeVry University and a Bachelor of Science in Business from the University of Illinois Chicago.
10
Eric J. Welak joined our company in 1996 and has served as our Executive Vice President – Fabrication since January 2017. Prior to serving in his current position, Mr. Welak served as our Operations Manager, Plant Manager, Director of Operations and Vice President of Operations. Mr. Welak earned an Associate of Industrial Engineering from Moraine Park Technical College and a Bachelor of Science in Business Administration, Management and Operations from Marian University.
Available Information
Our website address is www.mecinc.com. We are not including the information provided on our website as a part of, or incorporating it by reference into, this Annual Report on Form 10-K. We make available free of charge (other than an investor’s own internet access charges) through our website our annual reports on Form 10-K, quarterly reports on Form 10-Q, current reports on Form 8-K, amendments to these reports and our proxy statements, as soon as reasonably practicable after we electronically file such material with, or furnish such material to, the United States Securities and Exchange Commission (the SEC).
11
Investing in our common stock involves a high degree of risk. You should carefully consider the risks and uncertainties described below, together with all of the other information in this Annual Report on Form 10-K, including “Management’s Discussion and Analysis of Financial Condition and Results of Operations” and our consolidated financial statements and related notes, before making a decision to invest in our common stock. The risks and uncertainties described below may not be the only ones we face. If any of the risks actually occur, our business, financial condition, operating results and prospects could be materially and adversely affected. In that event, the market price of our common stock could decline, and you could lose part or all of your investment.
Risks Related to Our Business
Failure to compete successfully in our markets could materially adversely affect our business, financial condition, results of operations or prospects.
We offer our processes and solutions in highly competitive markets. The competitors in these markets may, among other things:
|
|
• |
respond more quickly to new or emerging technologies; |
|
|
• |
have greater name recognition, critical mass or geographic market presence; |
|
|
• |
be better positioned to take advantage of acquisition opportunities; |
|
|
• |
adapt more quickly to changes in customer requirements; |
|
|
• |
devote greater resources to the development, promotion and sale of their processes and solutions; |
|
|
• |
be better positioned to compete on price due to any combination of low-cost labor, raw materials, components, facilities or other operating items, or willingness to make sales at lower margins than us; |
|
|
• |
consolidate with other competitors in the industry with may create increased pricing and competitive pressures on our business; and |
|
|
• |
be better able to utilize excess capacity which may reduce the cost of their processes and solutions. |
Competitors with lower cost structures may have a competitive advantage over us. We also expect our competitors to continue to improve the performance of their current processes and solutions, to reduce the prices of their existing processes and solutions and to introduce new processes or solutions that may offer greater performance and improved pricing. Additionally, we may face competition from new entrants to the industry in which we operate. Any of these developments could cause a decline in sales and average selling prices, loss of market share or profit margin compression. Maintaining and improving our competitive position will require successful management of these factors, including continued investment by us in research and development, engineering, marketing and customer service and support. Our future growth rate depends upon our agility to compete successfully, which is impacted by a number of factors, including, but not limited to, our ability to (i) identify emerging technological trends in our target end markets, (ii) develop and maintain a wide range of competitive and appropriately priced processes and solutions and defend our market share against an ever-expanding number of competitors including many new and non-traditional competitors, (iii) ensure that our processes and solutions remain cost-competitive and (iv) attract, develop and retain individuals with the requisite technical expertise and understand of customers’ needs to develop and sell new technologies and processes.
We are affected by developments in the industries in which our customers operate.
We derive a large amount of our net sales from customers in the following industry sectors: heavy- and medium-duty commercial vehicles, construction, powersports, agriculture and military. Factors affecting any of these industries in general, or any of our customers in particular, could adversely affect us because our net sales growth largely depends on the continued growth of our customers’ businesses in their respective industries. These factors include:
|
|
• |
seasonality of demand for our customers’ products which may cause our manufacturing capacity to be underutilized for periods of time; |
|
|
• |
our customers’ failure to successfully market their products, to gain or retain widespread commercial acceptance of their products or to compete effectively in their industries; |
|
|
• |
loss of market share for our customers’ products, which may lead our customers to reduce or discontinue purchasing our processes and solutions and to reduce prices, thereby exerting pricing pressure on us; |
|
|
• |
economic conditions in the markets in which our customers operate, in particular, the United States, including recessionary periods such as a global economic downturn; |
12
|
|
• |
our customers’ decision to insource the production of components that has traditionally been outsourced to us; and |
|
|
• |
product design changes or manufacturing process changes that may reduce or eliminate demand for the components we supply. |
We expect that future sales will continue to depend on the success of our customers. If economic conditions and demand for our customers’ products deteriorate, we may experience a material adverse effect on our business, operating results and financial condition.
We may not be able to maintain our manufacturing, engineering and technological expertise.
The markets for our processes and solutions are characterized by changing technology and evolving process development. The continued success of our business will depend upon our ability to:
|
|
• |
hire, retain and expand our pool of qualified engineering and trade-skilled personnel; |
|
|
• |
maintain technological leadership in our industry; |
|
|
• |
implement new and expand upon current robotics, automation and tooling technologies; and |
|
|
• |
anticipate or respond to changes in manufacturing processes in a cost-effective and timely manner. |
We cannot be certain that we will develop the capabilities required by our customers in the future. The emergence of new technologies, industry standards or customer requirements may render our equipment, inventory or processes obsolete or uncompetitive. We may have to acquire new technologies and equipment to remain competitive. The acquisition and implementation of new technologies and equipment may require us to incur significant expense and capital investment, which could reduce our margins and affect our operating results. When we establish or acquire new facilities, we may not be able to maintain or develop our manufacturing, engineering and technological expertise due to a lack of trained personnel, effective training of new staff or technical difficulties with machinery. Failure to anticipate and adapt to customers’ changing technological needs and requirements or to hire and retain a sufficient number of engineers and maintain manufacturing, engineering and technological expertise may have a material adverse effect on our business, operating results and financial condition.
We are dependent on a limited number of large customers for current and future net sales. The loss of any of these customers or the loss of market share by these customers could materially adversely affect our business, financial condition, results of operations and cash flows.
We depend on a limited number of major manufacturers for a majority of our net sales. For example, our largest customers in 2019, including John Deere, AB Volvo and PACCAR Inc. accounted for 15%, 14% and 13% of our net sales, respectively. Our financial performance depends in large part on our ability to continue to arrange for the purchase of our processes and solutions with these customers, and we expect these customers to continue to make up a large portion of our net sales in the foreseeable future. The loss of all or a substantial portion of our sales to any of our large-volume customers could have a material adverse effect on our business, financial condition, results of operations and cash flows by reducing cash flows and by limiting our ability to spread our fixed costs over a larger net sales base. We may make fewer sales to these customers for a variety of reasons, including, but not limited to:
|
|
• |
loss of business relationship; |
|
|
• |
reduced or delayed customer requirements; |
|
|
• |
the insourcing of business that has been traditionally outsourced to us; |
|
|
• |
strikes or other work stoppages affecting production by our customers; or |
|
|
• |
reduced demand for our customers’ products. |
13
Most of our customers do not commit to long-term production schedules, which makes it difficult for us to schedule production accurately and achieve maximum efficiency of our manufacturing capacity.
Most of our customers do not commit to long-term contracts or firm production schedules, and we continue to experience reduced lead-times in customer orders. Additionally, customers may change production quantities or delay production with little lead-time or advance notice. Therefore, we rely on and plan our production and inventory levels based on our customers’ advance orders, commitments and/or forecasts as well as our internal assessments and forecasts of customer demand. The volume and timing of sales to our customers may vary due to, among others:
|
|
• |
variation in demand for or discontinuation of our customers’ products; |
|
|
• |
our customers’ attempts to manage their inventory; |
|
|
• |
design changes; |
|
|
• |
changes in our customers’ manufacturing strategies; |
|
|
• |
disruptive events in the markets in which our customers operate, including natural disasters and epidemics like the coronavirus; and |
|
|
• |
acquisitions of or consolidation among customers. |
The variations in volume and timing of sales make it difficult to schedule production and optimize utilization of manufacturing capacity. This uncertainty may require us to increase staffing and incur other expenses in order to meet an unexpected increase in customer demand, potentially placing a significant burden on our resources. Additionally, an inability to respond to such increases in a timely manner may cause customer dissatisfaction, which may negatively affect our customer relationships.
Further, in order to secure sufficient production scale, we may make capital investments in advance of anticipated customer demand. Such investments may lead to low utilization levels if customer demand forecasts change and we are unable to utilize the additional capacity. Because fixed costs make up a large proportion of our total production costs, a reduction in customer demand can have a significant adverse impact on our gross profits and operating results. Additionally, we order materials and components based on customer forecasts and orders and suppliers may require us to purchase materials and components in minimum quantities that exceed customer requirements, which may have an adverse impact on our gross profits and operating results. In the past, anticipated orders from some of our customers have failed to materialize and delivery schedules have been deferred as a result of changes in our customers’ business needs.
We may be unable to realize net sales represented by our awarded business, which could materially and adversely impact our business, financial condition, results of operations and cash flows.
The realization of future net sales from awarded business is inherently subject to a number of important risks and uncertainties, including a lack of long-term commitments and production schedules with customers. Accordingly, we cannot assure you that we will realize any or all of the future net sales represented by our awarded business. Any failure to realize these net sales could have a material adverse effect on our business, financial condition, results of operations and cash flows.
In addition to not having a commitment from our customers regarding the minimum number of components they must purchase from us if we obtain awarded business, typically the terms and conditions of the agreements with our customers provide that they have the contractual right to unilaterally terminate our contracts with them with no notice or limited notice. In many cases, we must commit substantial resources in preparation for production under awarded customer business well in advance of the customer’s production start date. If such contracts are terminated by our customers, our ability to obtain compensation from our customers for such termination is generally limited to the direct out-of-pocket costs that we incurred for raw materials and work-in-progress. Although we have been successful in recovering these costs under appropriate circumstances in the past, we cannot assure you that our results of operations will not be materially adversely impacted in the future if we are unable to recover these types of pre-production costs related to our customers’ cancellation of awarded business.
Our growth strategy includes acquisitions, and we may not be able to identify attractive acquisition targets or successfully integrate acquired targets without impacting our business.
Acquisitions have played a key role in our growth strategy, and we expect to continue to grow through acquisitions in the future. We expect to continue evaluating potential strategic acquisitions of businesses, assets and product lines. We may not be able to identify suitable candidates, negotiate appropriate or favorable acquisition terms, obtain financing that may be needed to consummate such transactions or complete proposed acquisitions. There is significant competition for acquisition and expansion opportunities in our businesses, which may increase the cost of any acquisition or result in the loss of attractive acquisition targets.
14
In addition, acquisitions involve numerous risks, including (i) incurring the time and expense associated with identifying and evaluating potential acquisitions and negotiating potential transactions, resulting in management’s attention being diverted from the operation of our existing business; (ii) using estimates and judgments to evaluate credit, operations, funding, liquidity, business, management and market risks with respect to the target entity or assets; (iii) litigation relating to an acquisition, particularly in the context of a publicly held acquisition target, could require us to incur significant expenses or result in the delaying or enjoining of the transaction; (iv) failing to properly identify an acquisition candidate’s liabilities, potential liabilities or risks; and (v) not receiving required regulatory approvals or such approvals being delayed or restrictively conditional. In addition, any acquisitions could involve the incurrence of substantial additional indebtedness or dilution to our shareholders. We cannot assure you that we will be able to successfully integrate any acquisitions that we undertake or that such acquisitions will perform as planned or prove to be beneficial to our operations and cash flow. Any such failure could seriously harm our financial condition, results of operations and cash flows.
We routinely evaluate potential acquisition candidates and engage in discussions and negotiations regarding potential acquisitions; however, even if we execute a definitive agreement for an acquisition, there can be no assurance that we will consummate the transaction within the anticipated closing timeframe, or at all. Further, acquisitions typically involve the payment of a premium over book- and market-value for the target business or asset and, therefore, some dilution of our tangible book value and/or earnings per common share may occur in connection with any future transaction.
Entering new markets, either organically or via acquisition, poses new competitive threats and commercial risks.
As we expand into new markets, either organically or via acquisition, we expect to diversify our net sales by leveraging our development, engineering and manufacturing capabilities in order to source necessary parts and components for other industries. Such diversification requires investments and resources that may not be available as needed. Furthermore, even if we sign contracts in new markets, we cannot guarantee that we will be successful in leveraging our capabilities into these new markets and thus in meeting the needs of these customers and competing favorably in these new markets. If these customers experience reduced demand for their products or financial difficulties, our future prospects will be negatively affected as well.
If we fail to develop new and innovative processes or if customers in our market do not accept them, our results would be negatively affected.
Our processes must be kept current to meet our customers’ needs. To remain competitive, we therefore must develop new and innovative processes on an ongoing basis. If we fail to make innovations or the market does not accept our new processes, our sales and results would suffer. We invest significantly in the research and development of new processes; however, these expenditures do not always result in processes that will be accepted by the market. To the extent they do not, whether as a function of the process or the business cycle, we will have increased expenses without significant sales to offset such costs. Failure to develop successful new processes may also cause potential customers to purchase from competitors.
We depend on our key executive officers, managers, and trade-skilled personnel and may have difficulty retaining and recruiting qualified employees. Moreover, we operate in competitive labor markets, which may also impact our ability to hire and retain employees at our facilities.
Our success depends to a large extent upon the continued services of our executive officers, senior management, managers and trade-skilled personnel and our ability to recruit and retain skilled personnel to maintain and expand our operations. We could be affected by the loss of any of our executive officers who are responsible for formulating and implementing our business plan and strategy, and who have been instrumental in our growth and development. In addition, in order to manage our growth, we will need to recruit and retain additional management personnel and other skilled employees at our facilities. However, competition for our trade-skilled labor is high, particularly in some of the geographic locations where our facilities are located. Although we intend to continue to devote significant resources to recruit, train and retain qualified employees, we may not be able to attract, effectively train and retain these employees. Any failure to do so could impair our ability to conduct design, engineering and manufacturing activities, efficiently perform our contractual obligations, develop marketable components, timely meet our customers’ needs and ultimately win new business, all of which could adversely affect our business, financial condition and results of operations. If we are not able to do so, our business and our ability to continue to grow could be negatively affected. In addition, salaries and related costs are a significant portion of the cost of providing our solutions and, accordingly, our ability to efficiently utilize our workforce impacts our profitability. If our employees are under-utilized, our profitability could suffer.
15
We are dependent on information technology and our systems and infrastructure face certain risks, including cyber security risks and data leakage risks.
We are dependent on information technology systems and infrastructure that could be damaged or interrupted by a variety of factors. Any significant breach, breakdown, destruction or interruption of these systems by employees, others with authorized access to our systems or unauthorized persons has the potential to negatively affect our operations. There is also a risk that we could experience a business interruption, theft of information or reputational damage as a result of a cyberattack, such as the infiltration of a data center, or data leakage of confidential information either internally or at our third-party providers. Although we have invested in the protection of our data and information technology to reduce these risks and periodically test the security of our information systems network, there can be no assurance that our efforts will prevent breakdowns or breaches in our systems that could have a material adverse effect on our financial condition, results of operations and liquidity.
We may incur additional expenses and delays due to technical problems or other interruptions at our manufacturing facilities.
Disruptions in operations due to technical problems or power interruptions as well as other interruptions such as floods, fire or other natural disasters could adversely affect the manufacturing capacity of our facilities. Such interruptions could cause delays in production and cause us to incur additional expenses such as charges for expedited deliveries for components that are delayed. In addition, our customers have the ability to cancel purchase orders in the event of any delays in production and may decrease future orders if delays are persistent. Additionally, to the extent that such disruptions do not result from damage to our physical property, these may not be covered by our business interruption insurance. Any such disruptions may adversely affect our operations and financial results.
Political and economic developments could adversely affect our business.
Increased political instability and social unrest, evidenced by the threat or occurrence of terrorist attacks, enhanced national security measures and the related decline in consumer confidence may hinder our ability to do business. Any escalation in these events or similar future events may disrupt our operations or those of our customers and suppliers and could affect the availability of raw materials and components we need in our manufacturing operations or the means to transport those materials or components to our manufacturing facilities and finished parts to our customers. These events have had and may continue to have an adverse effect, generally, on the economy and consumer confidence and spending, which could adversely affect our net sales and operating results. The effect of these events on the volatility of the financial markets could in the future lead to volatility of the market price of our securities and may limit the capital resources available to us, our customers and our suppliers.
Volatility in the prices of raw materials and energy prices and our ability to pass along increased costs to our customers could adversely affect our results of operations.
The prices and availability of raw materials critical to our business and performance are based on global supply and demand conditions. Certain raw materials used by us are only available from a limited number of suppliers, and it may be difficult to find alternative suppliers at the same or similar costs. While we strive to pass through the price of raw materials to our customers, we may not be able to do so in the future, and volatility in the prices of raw materials may affect customer demand for certain components. In addition, we, along with our suppliers and customers, rely on various energy sources for a number of activities connected with our business, such as the transportation of raw materials and finished parts. The availability and pricing of these resources are subject to market forces that are beyond our control. Furthermore, we are vulnerable to any reliability issues experienced by our suppliers, which also are beyond our control. Our suppliers contract separately for the purchase of such resources, and our sources of supply could be interrupted should our suppliers not be able to obtain these materials due to higher demand or other factors that interrupt their availability. Energy and utility prices, including electricity and water prices, and in particular prices for petroleum-based energy sources, are volatile. Increased supplier and customer operating costs arising from volatility in the prices of energy sources, such as increased energy and utility costs and transportation costs, could be passed through to us and we may not be able to increase our product prices sufficiently or at all to offset such increased costs. The impact of any volatility in the prices of energy or the raw materials on which we rely, including the reduction in demand for certain components caused by such price volatility, could result in a loss of net sales and profitability and adversely affect our results of operations.
Our manufacturing operations are dependent upon third-party suppliers, making us vulnerable to supply shortages.
We obtain raw materials, parts and certain components from third-party suppliers. Any delay in receiving supplies could impair our ability to timely deliver components to our customers and, accordingly, could have an adverse effect on our business, financial condition, results of operations and cash flows. The volatility in the financial markets and uncertainty in the sectors our suppliers service could result in exposure related to the financial viability of certain of our suppliers. Suppliers may also exit certain business lines, causing us to find other suppliers for materials or components and potentially delaying our ability to deliver components to customers, or our suppliers may change the terms on which they are willing to provide parts or materials to us, any of which could adversely affect our financial condition and results of operations. In addition, many of our suppliers have unionized workforces that
16
could be subject to work stoppages as a result of labor relations issues. Some of our suppliers supply components and materials that cannot be quickly or inexpensively re-sourced to another supplier due to long lead times and contractual commitments that might be required by another supplier in order to provide the components or materials.
The impact of foreign trade relations and associated tariffs could adversely impact our business.
We currently source certain raw materials from international suppliers. Import tariffs, taxes, customs duties and/or other trade regulations imposed by the U.S. government on foreign countries, or by foreign countries on the United States, could significantly increase the prices we pay for certain raw materials, such as steel, aluminum and purchased components, that are critical to our ability to manufacture components for our customers. In addition, we may be unable to find a domestic supplier to provide the necessary raw materials on an economical basis in the amounts we require. If the cost of our raw materials increases, or if we are unable to procure the necessary raw materials required to manufacture our components, then we could experience a negative impact on our operating results, profitability, customer relationships and future cash flows.
Additionally, our customers’ businesses may be negatively impacted by import tariffs, taxes, customs duties and/or other trade regulations imposed by the U.S. government on foreign countries or by foreign countries on the United States, which could, in turn, reduce our customers’ demand for the components that we manufacture for them. Any reduction in customer demand for our components as a result of such tariffs, taxes, customs duties and/or other trade regulations could have a material adverse impact on our financial position, results of operations, cash flows and liquidity.
Because our industry is capital intensive and we have significant fixed and semi-fixed costs, our profitability is sensitive to changes in volume.
The property, plants and equipment needed to produce components for our customers and provide our processes and solutions can be very expensive. We must spend a substantial amount of capital to purchase and maintain such property, plants and equipment. Although we believe our current cash balance, along with our projected internal cash flows and available financing sources, will provide sufficient cash to support our currently anticipated operating and capital needs, if we are unable to generate sufficient cash to purchase and maintain the property, plants and equipment necessary to operate our business, we may be required to reduce or delay planned capital expenditures or to incur additional indebtedness.
We may need to raise additional capital in the future for working capital, capital expenditures and/or acquisitions, and we may not be able to do so on favorable terms, or at all, which would impair our ability to operate our business or achieve our growth objectives.
Our ongoing ability to generate cash is important for the funding of our continuing operations, making acquisitions and servicing our indebtedness. To the extent that existing cash balances and cash flow from operations, together with borrowing capacity under our existing credit facilities, are insufficient to make investments or acquisitions or provide needed working capital, we may require additional financing from other sources. Our ability to obtain such additional financing in the future will depend in part upon prevailing capital market conditions, as well as conditions in our business and our operating results, and those factors may affect our efforts to arrange additional financing on terms that are acceptable to us. Furthermore, if economic, political or other market conditions adversely affect the financial institutions that provide credit to us, it is possible that our ability to draw upon our existing credit facilities may be impacted. If adequate funds are not available, or are not available on acceptable terms, we may not be able to make future investments, take advantage of acquisitions or other opportunities, or respond to competitive challenges, resulting in loss of market share, any of which could have a material adverse impact on our financial position, results of operations, cash flows and liquidity.
The risks associated with climate change, as well as climate change legislation and regulations, could adversely affect our operations and financial condition.
The physical risks of climate change, such as more frequent or more extreme weather events, changes in temperature and precipitation patterns, changes to ground and surface water availability and other related phenomena, could affect some, or all, of our operations. Severe weather or other natural disasters could be destructive, which could result in increased costs, including supply chain costs.
17
In addition, a number of government bodies have finalized, proposed or are contemplating legislative and regulatory changes in response to growing concerns about climate change. In recent years, federal, state and local governments have taken steps to reduce emissions of greenhouse gases (GHGs). The Environmental Protection Agency has finalized a series of GHG monitoring, reporting and emissions control rules for certain large sources of GHGs, and the U.S. Congress has, from time to time, considered adopting legislation to reduce GHG emissions. Numerous states have already taken measures to reduce GHG emissions, primarily through the development of GHG emission inventories and/or regional GHG cap-and-trade programs. While the current administration has announced that the United States will withdraw from international commitments to reduce GHG emissions, many state and local officials have announced their decisions to uphold such commitments.
Although it is not possible at this time to predict how future legislation or regulations to address GHG emissions would impact our business, any such laws and regulations imposing reporting obligations on, or limiting emissions of GHGs from, our equipment and operations, could require us to incur costs to reduce GHG emissions associated with our operations. We cannot assure you that our costs, liabilities and obligations relating to environmental matters will not have a material adverse effect on our business, financial condition, results of operations and cash flows.
Our manufacturing, painting and coating operations are subject to environmental, health and safety laws and regulations that could result in liabilities to us.
Our manufacturing, painting and coating operations are subject to environmental, health and safety laws and regulations, including those governing discharges to air and water, the management and disposal of hazardous substances, the cleanup of contaminated sites and health and safety matters. We could incur material costs, including cleanup costs, civil and criminal fines, penalties and third-party claims for cost recovery, property damage or personal injury as a result of violations of or liabilities under such laws and regulations. The ultimate cost of remediating contaminated sites, if any, is difficult to accurately predict and could exceed estimates. In addition, as environmental, health and safety laws and regulations have tended to become stricter, we could incur additional costs complying with requirements that are promulgated in the future.
If our manufacturing processes do not comply with applicable statutory and regulatory requirements, or if we manufacture components containing manufacturing defects, demand for our capabilities may decline and we may be subject to liability claims.
Our manufacturing processes and facilities need to comply with applicable statutory and regulatory requirements. We may also have the responsibility to ensure that the processes we use satisfy safety and regulatory standards, including those applicable to our customers and to obtain any necessary certifications. In addition, our customers’ products, as well as the manufacturing processes and components that we use to produce such products, are often highly complex. As a result, components that we manufacture may at times contain manufacturing defects, and our manufacturing processes may be subject to errors or not be in compliance with applicable statutory and regulatory requirements or demands of our customers. Defects in the components we manufacture, whether caused by a manufacturing or component failure or error, or deficiencies in our manufacturing processes, may result in delayed shipments to customers, replacement costs or reduced or cancelled customer orders. If these defects or deficiencies are significant, our business reputation may also be damaged. The failure of the components that we manufacture for our customers to comply with applicable statutory and regulatory requirements may subject us to legal fines or penalties and, in some cases, require us to shut down or incur considerable expense to correct a manufacturing process or facility. In addition, these defects may expose us to liability to pay for the recall of a customer’s product or to indemnify our customers for the costs of any such claims or recalls which they face as a result of using items manufactured by us in their products.
Adverse judgments or settlements in legal disputes, including product liability, intellectual property infringement and other claims, could result in materially adverse monetary damages or injunctive relief and damage our business and/or our reputation.
We are subject to, and may become a party to, a variety of litigation or other claims and suits that arise from time to time in the ordinary course of our business. The results of litigation and other legal proceedings are inherently uncertain and adverse judgments or settlements in some or all of these legal disputes may result in materially adverse monetary damages or injunctive relief against us. Additionally, our insurance policies may not protect us against potential liability due to various exclusions in the policies and self-insured retention amounts. Partially or completely uninsured claims, if successful and of significant magnitude, could have a material adverse effect on our business, financial condition and results of operations. Furthermore, any claims or litigation, even if fully indemnified or insured, could damage our reputation and make it more difficult to compete effectively or obtain adequate insurance in the future.
18
The components we manufacture can expose us to potential liabilities. For instance, our manufacturing operations expose us to potential product liability claims resulting from injuries caused by defects in components we design or manufacture, as well as potential claims that components we design infringe on third-party intellectual property rights. Such claims could subject us to significant liability for damages, subject the infringing portion of our business to injunction and, regardless of their merits, could be time-consuming and expensive to resolve. We may also have greater potential exposure from warranty claims and recalls due to problems caused by component or product design. Although we have product liability insurance coverage, it may not be sufficient to cover the full extent of our product liability, it at all. A successful product liability claim in excess or outside of our insurance coverage or any material claim for which insurance coverage was denied or limited and for which indemnification was not available could have a material adverse effect on our business, results of operations and/or financial condition.
We may experience work-related accidents that may expose us to liability claims.
Due to the nature of our operations, we are subject to the risks of our employees being exposed to industrial-related accidents at our premises. If such accidents occur in the future, we may be required to pay compensation and may also suffer reputational harm. Under such circumstances, our business and financial performance could be adversely affected.
Increases in the cost of employee benefits could impact our financial results and cash flows.
Our expenses relating to employee health benefits are significant. Unfavorable changes in the cost of and the unpredictability of claims under such benefits could impact our financial results and cash flows. Healthcare costs have risen significantly in recent years, and recent legislative and private sector initiatives regarding healthcare reform could result in significant changes to the U.S. healthcare system. Pursuant to the Affordable Care Act, employees may be ineligible for certain healthcare subsidies if such employee is eligible and offered qualifying and affordable healthcare coverage under an employer’s plan. Due to the breadth and complexity of the healthcare reform legislation, the lack of implementing regulations and interpretive guidance and the uncertainty surrounding further reform proposals, we are not able to fully determine the impact that healthcare reform will have in the future on company sponsored medical plans.
Compliance or the failure to comply with regulations and governmental policies could cause us to incur significant expense.
We are subject to a variety of local and foreign laws and regulations including those relating to labor and health and safety concerns. Such laws may require us to pay mandated compensation and penalties. Additionally, we may need to obtain and maintain licenses and permits to conduct business in various jurisdictions. If we or the businesses or companies we acquire have failed or fail in the future to comply with such laws and regulations, then we could incur liabilities and fines and our operations could be suspended. Such laws and regulations could also restrict our ability to modify or expand our facilities, could require us to acquire costly equipment, or could impose other significant expenditures.
Prior to our initial public offering, we were treated as an S Corporation, and claims of taxing authorities related to our prior status as an S Corporation could have an adverse effect on our business, financial condition and results of operations.
Upon the consummation of our initial public offering, our status as an S Corporation was terminated and we have since been treated as a “C Corporation” for U.S. federal income tax purposes and thus are now subject to U.S. federal income tax. If the unaudited, open tax years in which we were an S Corporation are audited by the Internal Revenue Service (IRS), and we determined not to have qualified for, or to have violated any requirement for maintaining our S Corporation status, we will be obligated to pay back taxes, interest and possibly penalties. The amounts that we would be obligated to pay could include taxes on all our taxable income attributable to such open tax years. Any such claims could result in additional costs to us and could have a material adverse effect on our business, financial condition and results of operations.
Prior to the completion of our initial public offering we were 100% owned by the ESOP, which is a retirement plan intended to be tax-qualified. If the ESOP fails to meet the requirements of a tax-qualified retirement plan, we could be subject to substantial penalties.
The Mayville Engineering Company, Inc. Employee Stock Ownership Plan (the ESOP), is a defined contribution retirement plan subject to the requirements of the Internal Revenue Code of 1986, as amended (the Code), and the Employee Retirement Income Security Act of 1974, as amended (ERISA). The ESOP has received a determination letter from the IRS that it meets the requirements of a tax-qualified retirement plan in form and we endeavor to maintain and administer the ESOP in compliance with all requirements of the Code and ERISA. However, the rules regarding tax-qualified plans, and especially ESOPs, are complex and change frequently. Accordingly, it is possible that the ESOP may not have been an may not in the future be administered in full compliance with all applicable rules under the Code or ERISA.
19
If the IRS were to determine that the ESOP was not in material compliance with the Code or ERISA, then the ESOP could lose its tax-qualified status and we could be subject to substantial penalties under the Code and/or ERISA, which could have a material adverse effect on our business, financial condition or results of operations. Additionally, any retroactive loss of the ESOP’s tax-qualified status would adversely impact our prior treatment as an S Corporation. See “—Prior to our initial public offering, we were treated as an S Corporation, and claims of taxing authorities related to our prior status as an S Corporation could have an adverse effect on our business, financial condition and results of operations.”
Any failure to protect our customers’ intellectual property that we use in the products we manufacture for them could harm our customer relationships and subject us to liability.
The products we manufacture for our customers often contain our customers’ intellectual property, including copyrights, patents, trade secrets and know-how. Our success depends, in part, on our ability to protect our customers’ intellectual property. The steps we take to protect our customers’ intellectual property may not adequately prevent its disclosure or misappropriation. If we fail to protect our customers’ intellectual property, our customer relationships could be harmed, and we may experience difficulty in establishing new customer relationships. In addition, our customers might pursue legal claims against us for any failure to protect their intellectual property, possibly resulting in harm to our reputation and our business, financial condition and operating results.
Risks Related to Our Indebtedness
Our Amended and Restated Credit Agreement restricts our ability and the ability of our subsidiaries to engage in some business and financial transactions.
On September 26, 2019, as last amended as of December 31, 2019, we entered into an amended and restated credit agreement (the A&R Credit Agreement) with certain lenders and Wells Fargo Bank, National Association, as administrative agent. The A&R Credit Agreement provides for (i) a $200.0 million revolving credit facility (the Revolving Loan), with a letter of credit sub-facility in an aggregate amount not to exceed $5.0 million, and a swingline facility in an aggregate amount of $20.0 million. The A&R Credit Agreement also provides for an additional $100.0 million of capacity through an accordion feature.
Our A&R Credit Agreement contains a number of covenants that limit our ability and the ability of our subsidiaries to:
|
|
• |
create, incur or assume indebtedness (other than certain permitted indebtedness); |
|
|
• |
create or incur liens (other than certain permitted liens); |
|
|
• |
make investments (other than certain permitted investments); |
|
|
• |
merge or consolidate with another entity; |
|
|
• |
make asset dispositions (other than certain permitted dispositions); |
|
|
• |
declare or pay any dividend or any other distribution to shareholders; |
|
|
• |
enter into transactions with affiliates; |
|
|
• |
make certain organizational changes, including changing our fiscal year end or amending our organizational documents; |
|
|
• |
enter into any agreement further restricting our ability to create or assume any lien; |
|
|
• |
sell notes receivable or accounts receivable except under certain circumstances; |
|
|
• |
enter into sale leaseback transactions; |
|
|
• |
incur capital expenditures in excess of $35,000,000 in any fiscal year; |
|
|
• |
permit any person or group other than the ESOP or other employee benefit plan of ours (like our 401(k) plan) to own or control more than 35% of our equity interests; or |
|
|
• |
permit our board of directors to not be composed of a majority of our continuing directors (i.e., our directors as of September 26, 2019 and any additional or replacement directors that have been approved by at least 51% of the directors then in office). |
Our A&R Credit Agreement also requires us to maintain a minimum interest coverage ratio and a consolidated total leverage ratio, and contains certain customary representations and warranties, affirmative covenants and events of default (including, among others, payment default, covenant default, breach of representation or warranty, bankruptcy, cross-default, material ERISA events, certain changes of control, material money judgements and failure to maintain subsidiary guarantees). If an event of default occurs under the A&R Credit Agreement, the lenders under the A&R Credit Agreement will be entitled to take various actions, including the acceleration of amounts due thereunder, the termination of such credit facility and all actions permitted to be taken by a secured
20
creditor. Our failure to comply with our obligations under the A&R Credit Agreement may result in an event of default under the A&R Credit Agreement. A default, if not cured or waived, may permit acceleration of our indebtedness. If our indebtedness is accelerated, we cannot be certain that we will have sufficient funds available to pay the accelerated indebtedness or that we will have the ability to refinance the accelerated indebtedness on terms favorable to us or at all.
We are able to incur additional debt, which could reduce our ability to satisfy our current obligations under our existing indebtedness.
At December 31, 2019, we had $72.6 million outstanding under the Revolving Loan. In addition, we may be able to incur significant additional indebtedness in the future, and we may do so, among other reasons, to fund acquisitions as part of our growth strategy. Although the A&R Credit Agreement contains restrictions on the incurrence of additional indebtedness, these restrictions are subject to a number of qualifications and exceptions, and we could incur substantial additional indebtedness in compliance with these restrictions.
Risks Related to Ownership of Our Common Stock
Your ability to influence corporate matters may be limited because the ESOP and our 401(k) plan own a substantial amount of our stock and continue to have significant influence over us, which may limit your ability to influence the outcome of important transactions, including a change in control.
As of February 1, 2020, our employees and certain former employees, through their interests in the ESOP and the Mayville Engineering Company, Inc. 401(k) Plan (the 401(k) Plan), beneficially owned approximately 59.6% of the outstanding shares of our common stock. Each participant in the ESOP and the 401(k) Plan is entitled to direct the vote of the shares allocated to his or her accounts, in his or her sole discretion. As a result, our employees and former employees, if acting together, will be able to influence or control matters requiring approval by our shareholders, including the election of directors, influence over our management and policies and the approval of mergers, acquisitions or other extraordinary transactions. As employees and former employees, the ESOP and 401(k) Plan participants’ interests may be contrary to other investors. This concentration of ownership may have the effect of delaying, preventing or deterring a change in control of our company, could deprive our non-ESOP and non-401(k) Plan shareholders of an opportunity to receive a premium for their common stock as part of a sale of our company and might ultimately affect the market price of our common stock.
The Trustees of the ESOP and the 401(k) Plan may have the power to vote a large block of shares on matters presented to shareholders for approval.
ESOP and 401(k) Plan participants have the right to direct the vote of the shares allocated to his or her ESOP and 401(k) Plan accounts. However, if a participant does not timely direct the voting of his or her shares, then (1) GreatBanc Trust Company (the ESOP Trustee) will vote such shares in its independent fiduciary discretion and (2) Wells Fargo, N.A. (the 401(k) Plan Trustee) will vote such shares as directed by the 401(k) Plan sponsor, which is the Company. Additionally, the ESOP Trustee and the 401(k) Plan Trustee have fiduciary duties under ERISA which may cause the ESOP Trustee or the 401(k) Plan Trustee to override participants’ voting discretions. Consequently, there may be circumstances in which the ESOP Trustee and the 401(k) Plan Trustee have the ability to vote a significant block of shares on matters presented to shareholders for approval. The ESOP and the 401(k) Plan, which as retirement plans have the purpose of providing retirement benefits to current and former employees of the Company and their beneficiaries, may have interests that are different from other investors and may vote in a way with which other shareholders disagree and which may be adverse to other shareholders interests.
The market price of our common stock may be volatile, and you could lose all or part of your investment.
Since our initial public offering in May 2019, the market price of our common stock has been volatile and has been and could continue to be subject to wide fluctuations in response to various factors, some of which are beyond our control. These fluctuations could cause investors to lose all or part of their investment in our common stock. Factors that could cause fluctuations in the market price of our common stock include the following:
|
|
• |
sales of substantial amounts of our securities by our directors, executive officers or significant shareholders (including our current and former employees via the ESOP and the 401(k) Plan) or the perception that such sales could occur; |
|
|
• |
price and volume fluctuations in the overall stock market from time to time; |
|
|
• |
relatively small percentage of our common stock available publicly; |
|
|
• |
actual or anticipated fluctuations in our quarterly financial results or the quarterly financial results of companies perceived to be similar to us; |
|
|
• |
changes in the market’s expectations about our operating results; |
21
|
|
• |
success of competitors; |
|
|
• |
our operating results failing to meet the expectation of securities analysts or investors in a particular period; |
|
|
• |
changes in financial estimates and recommendations by securities analysts concerning us or the markets in general; |
|
|
• |
operating and stock price performance of other companies that investors deem comparable to us; |
|
|
• |
our ability to manufacture new and enhanced components for the products of our customers on a timely basis; |
|
|
• |
changes in laws and regulations affecting our business; |
|
|
• |
commencement of, or involvement in, litigation involving us; |
|
|
• |
changes in our capital structure, such as future issuances of securities or the incurrence of additional debt; |
|
|
• |
the volume of securities available for public sale; |
|
|
• |
any major change in our board of directors or management; |
|
|
• |
general economic and political conditions such as recessions, interest rates, tariffs, fuel prices, international currency fluctuations and acts of war or terrorism; and |
|
|
• |
changes in our investor base. |
In the past, following periods of volatility in the overall market and the market price of a particular company’s securities, securities class action litigation has often been instituted against these companies. This litigation, if instituted against us, could result in substantial costs and a diversion of our management’s attention and resources.
Additionally, if our common stock becomes delisted from the New York Stock Exchange (the NYSE) for any reason, and is quoted on the OTC Bulletin Board, an inter-dealer automated quotation system for equity securities that is not a national securities exchange, the liquidity and price of our securities may be more limited than if we were quoted or listed on the NYSE or another national securities exchange. You may be unable to sell your securities unless a market can be established or sustained.
If securities or industry analysts do not publish or cease publishing research or reports about us, our business, or our market, or if they change their recommendations regarding our securities adversely, the price and trading volume of our securities could decline.
The trading market for our securities is influenced by the research and reports that industry or securities analysts publish about us, our business, our market or our competitors. If any of the analysts who cover us change their recommendation regarding our securities adversely, or provide more favorable relative recommendations about our competitors, the price of our securities would likely decline. If any analyst who covers us were to cease coverage of us or fail to regularly publish reports on us, we could lose visibility in the financial markets, which could cause our stock price or trading volume to decline.
We do not expect to declare any dividends in the foreseeable future.
The continued operation and growth of our business, including acquisitions and capital expenditures, will require substantial cash. Accordingly, we do not anticipate declaring any cash dividends to holders of our common stock in the foreseeable future. Any determination to pay dividends in the future will be at the discretion of our board of directors and will depend upon results of operations, financial condition, any contractual restrictions, our indebtedness, restrictions imposed by applicable law and other factors our board of directors deem relevant. Consequently, investors may need to sell all or part of their holdings of our common stock after price appreciation, which may never occur, as the only way to realize any future gains on their investment.
22
Some provisions of Wisconsin law and our articles of incorporation and bylaws could make a merger, tender offer or proxy contest difficult, thereby depressing the trading price of our common stock.
Our status as a Wisconsin corporation and the anti-takeover provisions of the Wisconsin Business Corporation Law (the WBCL) may discourage, delay or prevent a change in control even if a change in control would be beneficial to our shareholders by prohibiting us from engaging in a business combination with an interested shareholder for a period of three years after the person becomes an interested shareholder. We may engage in a business combination with an interested shareholder after the expiration of the three-year period with respect to that shareholder only if one or more of the following conditions is satisfied: (i) our board of directors approved the acquisition of the stock before the date on which the shareholder acquired the shares, (ii) the business combination is approved by a majority of our outstanding voting stock not beneficially owned by the interested shareholder or (iii) the consideration to be received by shareholders meets certain fair prices requirements of the WBCL with respect to form and amount.
In addition, our articles of incorporation and bylaws contain provisions that may make the acquisition of the company more difficult, including the following:
|
|
• |
establishing a classified board of directors so that not all members of our board of directors are elected at one time, which could delay the ability of shareholders to change the membership of a majority of our board of directors; |
|
|
• |
authorizing undesignated preferred stock, the terms of which may be established and shares of which may be issued by our board of directors without shareholder approval; |
|
|
• |
requiring certain procedures to be satisfied in order for a shareholder to call a special meeting of shareholders, including requiring that we receive written demands for a special meeting from holders of 10% or more of all the votes entitled to be cast on any issue proposed to be considered; |
|
|
• |
requiring that a director may be removed from office only for “cause” and with the affirmative vote of shareholders holding at least 66 2/3% of the then outstanding shares of stock entitled to vote in the election of directors; |
|
|
• |
not providing for cumulative voting in the election of directors, which would otherwise allow holders of less than a majority of stock to elect some directors; and |
|
|
• |
establishing advance notice procedures for shareholder proposals or the nomination of candidates for election as directors. |
These provisions could have the effect of discouraging, delaying or preventing a transaction involving a change in control of the Company. These provisions could also have the effect of discouraging proxy contests and make it more difficult for shareholders to elect directors of their choosing or prevent us from taking other corporate actions that shareholders may desire.
Risks Related to Being a New Public Company
The requirements of being a public company may strain our resources and distract our management, which could make it difficult to manage our business.
As a public company, we are required to comply with various regulatory and reporting requirements, including those required by the SEC. Complying with these reporting and other regulatory requirements are time-consuming and result in increased costs to us and could have a negative effect on our business, financial condition and operating results.
As a public company, we are subject to the reporting requirements of the Securities Exchange Act of 1934, as amended (the Exchange Act), and the requirements of the Sarbanes-Oxley Act of 2002. These requirements may place a strain on our systems and resources. The Exchange Act requires that we file annual, quarterly and current reports with respect to our business and financial condition. The Sarbanes-Oxley Act requires that we maintain effective disclosure controls and procedures and internal controls over financial reporting. To maintain and improve the effectiveness of our disclosure controls and procedures, we may need to commit significant resources, hire additional staff and provide additional management oversight. We are implementing additional procedures and processes for the purpose of addressing the standards and requirements applicable to public companies. Sustaining our growth also requires us to commit additional management, operational and financial resources to identify new professionals to join the company and to maintain appropriate operational and financial systems to adequately support expansion. These activities may divert management’s attention from other business concerns, which could have a material adverse effect on our business, financial condition and operating results.
23
We have a material weakness in our internal control over financial reporting. If our remediation of this material weakness is not effective, or if we experience additional material weaknesses in the future or otherwise fail to maintain an effective system of internal controls in the future, we may not be able to accurately or timely report our financial condition or results of operations, which may adversely affect investor confidence in us and, as a result, the value of our common stock.
As a public company, we will be required in future years to document and assess the effectiveness of our system of internal controls over financial reporting to satisfy the requirements of the Sarbanes-Oxley Act.
During the course of the quarterly and year-end close processes in 2019, we identified a material weakness in the design and operation of our internal control over financial reporting. A material weakness is a deficiency, or a combination of deficiencies, in internal control over financial reporting, such that there is a reasonable possibility that a material misstatement of a company’s annual or interim financial statements will not be prevented or detected on a timely basis. The material weakness relates to a lack of consistently documented accounting policies and procedures and a lack of formalized controls over the accounting and recording of complex and significant unusual transactions which, in the aggregate, constitute a material weakness.
We have taken numerous steps to enhance our internal control environment during 2019. While preparing for our initial public offering, as of December 31, 2018, we had identified two material weaknesses in the design and operation of our internal control over financial reporting. As of December 31, 2019, we have concluded that one of the previously identified material weaknesses has been remediated and the other has been partially remediated. The previously identified deficiencies, that represented the two material weaknesses, included the preparation and review of journal entries, a limited number of personnel with a level of GAAP accounting knowledge commensurate with our financial reporting requirements and certain information technology general controls specific to segregation of duties, systems access and change management processes. However, deficiencies in our control environment, specifically deficiencies related to a lack of consistently documented accounting policies and procedures and a lack of formalized controls over the accounting and recording of complex and significant unusual transactions, which we have collectively determined aggregate to a material weakness, remained as of December 31, 2019. We are currently evaluating a number of steps to enhance our control over financial reporting and address this material weakness, including: enhancing our internal review procedures during the financial statement close process, and designing and implementing consistent policies throughout the Company; however, our current efforts to design and implement effective controls may not be sufficient to remediate the material weakness described above or prevent future material weaknesses or other deficiencies from occurring. Despite these actions, we may identify additional material weaknesses in our internal control over financial reporting in the future.
If we fail to effectively remediate this material weakness in our internal control over financial reporting, if we identify future material weaknesses in our internal control over financial reporting or if we are unable to comply with the demands that will be placed upon us as a public company, including the requirements of Section 404 of the Sarbanes-Oxley Act, in a timely manner, we may be unable to accurately report our financial results, or report them within the timeframes required by the SEC. In addition, if we are unable to assert that our internal control over financial reporting is effective, or if our independent registered public accounting firm is unable to express an opinion as to the effectiveness of our internal control over financial reporting, when required, investors may lose confidence in the accuracy and completeness of our financial reports, we may face restricted access to the capital markets and our stock price may be adversely affected.
Commencing with our Annual Report on Form 10-K for the year ending December 31, 2020, we must perform system and process evaluation and testing of our internal control over financial reporting to allow management to report on the effectiveness of our internal control over financial reporting in our Form 10-K filing for that year, as required by Section 404 of the Sarbanes Oxley Act. We expect to expend significant resources in developing the necessary documentation and testing procedures required by Section 404. If we fail to implement the requirements of Section 404 in a timely manner, regulatory authorities such as the SEC or the Public Company Accounting Oversight Board, might subject us to sanctions or investigation. We cannot be certain that the actions we will be taking to improve our internal controls over financial reporting will be sufficient, or that we will be able to implement our planned processes and procedures in a timely manner.
We are an emerging growth company, and any decision on our part to comply only with certain reduced reporting and disclosure requirements applicable to emerging growth companies could make our common stock less attractive to investors.
We are an “emerging growth company” as defined by the Jumpstart Our Business Startups Act of 2012 (the JOBS Act). Under the JOBS Act, emerging growth companies can delay adopting new or revised accounting standards until such time as those standards apply to private companies. We have elected to use this exemption from new or revised accounting standards and, therefore, we will not be subject to the same new or revised accounting standards as other public companies that have not made this election.
For as long as we continue to be an emerging growth company, we also intend to take advantage of certain other exemptions from various reporting requirements that are applicable to other public companies including, but not limited to, reduced disclosure obligations regarding executive compensation in our periodic reports and proxy statements, and exemptions from the requirements of holding a nonbinding advisory vote on executive compensation and shareholder approval of any golden parachute payments not
24
previously approved. We cannot predict if investors will find our common stock less attractive because we will rely on these exemptions. If some investors find our common stock less attractive as a result, there may be a less active trading market for our common stock and our stock price may be more volatile.
We will remain an emerging growth company until the earliest of (i) the last day of the year which we have total annual gross revenue of $1.07 billion or more; (ii) the last day of the year following the fifth anniversary of the date of the closing of our initial public offering; (iii) the date on which we have issued more than $1.0 billion in nonconvertible debt during the previous three years; or (iv) the date on which we are deemed to be a large accelerated filer under the rules of the SEC.
Our business and stock price may suffer as a result of our lack of public company operating experience.
The obligations of being a public company, including substantial public reporting, auditing and investor relations obligations, require significant additional expenditures, place additional demands on our management and require the hiring of additional personnel. These obligations increase our operating expenses and could divert our management’s attention from our operations. The Sarbanes-Oxley Act and the SEC rules and regulations implementing such Act, as well as various NYSE rules, required us to implement additional corporate governance practices and may require further changes. These rules and regulations increase our legal and financial compliance costs, and make some activities more difficult, time-consuming and/or costly. These rules and regulations could also make it more difficult for us to attract and retain qualified independent members of our board of directors and qualified members of our management team.
Item 1B. Unresolved Staff Comments.
None.
We maintain 20 strategically located U.S. facilities comprising approximately three million square feet of manufacturing space. We are headquartered in Mayville, Wisconsin. We believe that our facilities are sufficient to meet our current and near-term manufacturing needs.
|
Facility |
|
Description of Use |
|
Approximate Square Feet |
|
|
Ownership |
|
|
1. Mayville, WI |
|
Manufacturing / Corporate Headquarters |
|
|
340,000 |
|
|
Owned |
|
2. Mayville, WI |
|
Manufacturing |
|
|
167,000 |
|
|
Owned |
|
3. Defiance, OH |
|
Manufacturing |
|
|
250,000 |
|
|
Owned |
|
4. Defiance, OH |
|
Manufacturing |
|
|
192,000 |
|
|
Owned |
|
5. Defiance, OH |
|
Warehouse |
|
|
90,000 |
|
|
Leased |
|
6. Beaver Dam, WI |
|
Manufacturing |
|
|
303,000 |
|
|
Owned |
|
7. Beaver Dam, WI |
|
Manufacturing |
|
|
163,000 |
|
|
Owned |
|
8. Greenwood, SC |
|
Manufacturing |
|
|
234,000 |
|
|
Owned |
|
9. Heber Springs, AR |
|
Manufacturing |
|
|
190,000 |
|
|
Owned |
|
10. Bedford, PA |
|
Manufacturing |
|
|
181,000 |
|
|
Leased |
|
11. Wautoma, WI |
|
Manufacturing |
|
|
157,000 |
|
|
Owned |
|
12. Atkins, VA |
|
Manufacturing |
|
|
150,000 |
|
|
Owned |
|
13. Byron Center, MI |
|
Manufacturing |
|
|
138,000 |
|
|
Leased |
|
14. Neillsville, WI |
|
Manufacturing |
|
|
58,000 |
|
|
Owned |
|
15. Neillsville, WI |
|
Manufacturing |
|
|
42,000 |
|
|
Owned |
|
16. Vanderbilt, MI |
|
Manufacturing |
|
|
50,000 |
|
|
Owned |
|
17. Vanderbilt, MI |
|
Manufacturing |
|
|
40,000 |
|
|
Owned |
|
18. Greenville, MS |
|
Manufacturing |
|
|
76,000 |
|
|
Leased |
|
19. Wayland, MI |
|
Manufacturing |
|
|
75,000 |
|
|
Leased |
|
20. Piedmont, MI |
|
Manufacturing |
|
|
34,000 |
|
|
Leased |
|
TOTAL |
|
|
|
|
2,930,000 |
|
|
|
25
We are not currently a party to any material litigation proceedings. From time to time, however we may be a party to litigation and subject to claims incident to the ordinary course of business. Regardless of the outcome, litigation can have an adverse impact on us because of defense and settlement costs, diversion of management resources and other factors.
Item 4. Mine Safety Disclosures.
Not applicable.
26
Item 5. Market for Registrant’s Common Equity, Related Stockholder Matters and Issuer Purchases of Equity Securities.
Market Price Information
Our common stock is traded on the NYSE under the symbol MEC. As of February 1, 2020, there were two registered shareholders of record of our common stock and thousands of beneficial holders of our common stock, including all the participants in our ESOP and many participants in our 401(k) Plan.
We have never declared or paid any cash dividends on our common stock. We intend to retain all available funds and any future earnings for use in the operation and expansion of our business and do not anticipate declaring or paying any cash dividends in the foreseeable future. Any future determination as to the declaration and payment of dividends will be at the discretion of our board of directors and will depend on then-existing conditions, including our financial condition, results of operations, contractual restrictions, capital requirements, business prospects and other factors that our board of directors considers relevant. In addition, the terms of the Credit Agreement restrict our ability to pay cash dividends to the holders of our common stock.
Issuer Purchases of Equity Securities
The table below sets forth information with respect to purchases we made of shares of our common stock during the twelve months ended December 31, 2019:
|
Period |
|
Total Number of Shares Purchased |
|
|
Average Price Paid per Share |
|
|
Total Number of Shares Purchased as Part of Publicly Announced Plans or Programs (1) |
|
|
Dollar Value of Shares that May Yet Be Purchased Under the Plans or Programs (1) |
|
||||
|
June 1-30, 2019 |
|
|
105,397 |
|
|
$ |
15.10 |
|
|
|
105,397 |
|
|
$ |
2,408,338 |
|
|
November 1-30, 2019 |
|
|
24,015 |
|
|
$ |
9.52 |
|
|
|
24,015 |
|
|
$ |
23,179,725 |
|
|
December 1-31, 2019 |
|
|
84,070 |
|
|
$ |
9.20 |
|
|
|
84,070 |
|
|
$ |
22,406,533 |
|
|
Total |
|
|
108,085 |
|
|
|
|
|
|
|
108,085 |
|
|
|
|
|
|
(1) |
On June 12, 2019, our board of directors authorized the purchase of up to $4.0 million of shares of our common stock to be used to meet our required 2019 safe harbor funding obligation under the ESOP. On October 28, 2019, our board of directors approved an increase of our share repurchase program from $4 million to $25 million through 2021. |
Stock Performance Graph
27
Securities Authorized For Issuance Under Equity Compensation Plans
See Part III, Item 12, of this Annual Report on Form 10-K for certain information regarding our equity compensation plans.
Item 6. Selected Financial Data.
The selected financial data as of December 31, 2019 and 2018, and for the years ended December 31, 2019, 2018, and 2017 have been derived from Mayville Engineering’s’ audited consolidated financial statements, including the notes thereto, appearing elsewhere on Form 10-K.
The historical results presented below are not necessarily indicative of the results to be expected for any future period. This information should be read in conjunction with “Risk Factors,” “Management’s Discussion and Analysis of Financial Condition and Results of Operations,” and the Company’s consolidated financial statements and the related notes included elsewhere in this Annual Report on Form 10-K.
|
(in thousands) |
|
|
|
|
|
|
|
|
|
|
|
|
|
Operating Results |
|
2019 |
|
|
2018 |
|
|
2017 |
|
|||
|
Net sales |
|
$ |
519,704 |
|
|
$ |
354,526 |
|
|
$ |
313,331 |
|
|
Cost of sales |
|
|
460,986 |
|
|
|
303,948 |
|
|
|
278,594 |
|
|
Amortization of intangibles |
|
|
10,706 |
|
|
|
4,096 |
|
|
|
3,756 |
|
|
Profit sharing, bonuses, and deferred compensation |
|
|
25,105 |
|
|
|
8,058 |
|
|
|
5,397 |
|
|
Employee Stock Ownership Plan expense |
|
|
5,453 |
|
|
|
4,000 |
|
|
|
4,000 |
|
|
Other selling, general and administrative expenses |
|
|
25,466 |
|
|
|
12,276 |
|
|
|
12,158 |
|
|
Contingent consideration revaluation |
|
|
(6,054 |
) |
|
|
(21 |
) |
|
|
— |
|
|
Income (loss) from operations |
|
|
(1,958 |
) |
|
|
22,169 |
|
|
|
9,426 |
|
|
Interest expense |
|
|
(6,728 |
) |
|
|
(3,879 |
) |
|
|
(4,180 |
) |
|
Loss on extinguishment of debt |
|
|
(154 |
) |
|
|
(814 |
) |
|
|
— |
|
|
Income (loss) before taxes |
|
|
(8,840 |
) |
|
|
17,476 |
|
|
|
5,246 |
|
|
Income tax benefit |
|
|
(4,088 |
) |
|
|
(459 |
) |
|
|
— |
|
|
Net income (loss) and comprehensive income (loss) |
|
$ |
(4,753 |
) |
|
$ |
17,935 |
|
|
$ |
5,246 |
|
|
|
|
|
|
|
|
|
|
|
|
|
|
|
|
EBITDA (1) |
|
$ |
30,890 |
|
|
$ |
41,823 |
|
|
$ |
30,190 |
|
|
Adjusted EBITDA (1) |
|
$ |
53,080 |
|
|
$ |
43,694 |
|
|
$ |
30,190 |
|
|
|
|
|
|
|
|
|
|
|
|
|
|
|
|
Cash Flows |
|
|
|
|
|
|
|
|
|
|
|
|
|
Net cash provided by operating activities |
|
$ |
33,402 |
|
|
$ |
36,715 |
|
|
$ |
30,801 |
|
|
Net cash used in investing activities |
|
$ |
(28,090 |
) |
|
$ |
(132,569 |
) |
|
$ |
(11,235 |
) |
|
Net cash provided by (used in) financing activities |
|
$ |
(8,400 |
) |
|
$ |
98,867 |
|
|
$ |
(19,633 |
) |
|
|
|
|
|
|
|
|
|
|
|
|
|
|
|
Balance Sheet |
|
|
|
|
|
|
|
|
|
|
|
|
|
Total assets |
|
$ |
363,582 |
|
|
$ |
391,725 |
|
|
N/A |
|
|
|
Total liabilities |
|
$ |
162,687 |
|
|
$ |
288,736 |
|
|
N/A |
|
|
|
Total temporary equity |
|
|
— |
|
|
$ |
102,989 |
|
|
N/A |
|
|
|
Total shareholders’ equity |
|
$ |
200,895 |
|
|
|
— |
|
|
N/A |
|
|
|
(1) |
For our definitions of EBITDA and Adjusted EBITDA, as well as a reconciliation of net income (loss), the most directly comparable measure calculated in accordance with GAAP, to EBITDA and Adjusted EBITDA, please see “Other Key Performance Indicators—EBITDA, EBITDA Margin, Adjusted EBITDA and Adjusted EBITDA Margin” in Part II, Item 7 of this Annual Report on Form 10-K, below. |
28
Item 7. Management’s Discussion and Analysis of Financial Condition and Results of Operations.
Management’s Discussion and Analysis of Financial Condition and Results of Operations is intended to assist in the understanding and assessing the trends and significant changes in our results of operations and financial condition. Historical results may not be indicative of future performance. This discussion includes forward-looking statements that reflect our plans, estimates and beliefs. Such statements involve risks and uncertainties. Our actual results may differ materially from those contemplated by these forward-looking statements as a result of various factors, including those set forth in “Risk Factors” in Part I, Item 1A and “Cautionary Statement Regarding Forward-Looking Statements” of this Annual Report on Form 10-K. This discussion should be read in conjunction with our audited consolidated financial statements and the notes thereto included in Part II, Item 8 of this Annual Report on Form 10-K. In this discussion, we use certain non-GAAP financial measures. Explanation of these non-GAAP financial measures and reconciliation to the most directly comparable GAAP financial measures are included in this Management’s Discussion and Analysis of Financial Condition and Results of Operations. Investors should not consider non-GAAP financial measures in isolation or as substitutes for financial information presented in compliance with GAAP.
Critical Accounting Policies and Estimates
Critical accounting policies are those policies that, in management’s view, are most important in the portrayal of our financial condition and results of operations. The notes to the consolidated financial statements include full disclosure of significant accounting policies. The methods, estimates and judgments that we use in applying our accounting policies have a significant impact on the results that we report in our financial statements. These critical accounting policies require us to make difficult and subjective judgments, often as a result of the need to make estimates regarding matters that are inherently uncertain. Those critical accounting policies and estimates that require the most significant judgment are discussed further below. See Note 1 – Nature of business and summary of significant accounting policies, in the Notes to the Consolidated Financial Statements in Part II, Item 8 of this Annual Report on Form 10-K for more specifics.
Goodwill, Other Intangibles and Other Long-Lived Assets
Our long-lived assets consist primarily of property, equipment, purchased intangible assets and goodwill. The valuation and the impairment testing of these long-lived assets involve significant judgments and assumptions, particularly as they relate to the identification of reporting units, asset groups and the determination of fair market value.
We test our tangible and intangible long-lived assets subject to amortization for impairment whenever facts and circumstances indicate that the carrying amount of an asset may not be recoverable. We test goodwill and indefinite lived intangible assets for impairment annually, or more frequently if triggering events occur indicating that there may be impairment.
We have recorded goodwill and perform testing for potential goodwill impairment at a reporting unit level. A reporting unit is an operating segment, or a business unit one level below an operating segment for which discrete financial information is available, and for which management regularly reviews the operating results. Additionally, components within an operating segment can be aggregated as a single reporting unit if they have similar economic characteristics. We have performed testing on each of our reporting units which contain goodwill.
We determine the fair value of our reporting units using multiple valuation methodologies, relying largely on an income approach but also incorporating value indicators from a market approach. Under the income approach, we calculate the fair value of a reporting unit based on the present value of estimated future cash flows. The income approach is dependent on several key management assumptions, including estimates of future sales, gross margins, operating costs, interest expense, income tax rates, capital expenditures, changes in working capital requirements and the weighted average cost of capital or the discount rate. Discount rate assumptions include an assessment of the risk inherent in the future cash flows of the reporting unit. Expected cash flows used under the income approach are developed in conjunction with our budgeting and forecasting process. Under the market approach, we estimate fair value of the reporting units using EBITDA multiples. The multiples are derived from comparable publicly traded companies with similar operating and investment characteristics as the respective reporting units.
During the fourth fiscal quarters of 2019 and 2018, we performed our annual impairment assessments of goodwill, which did not indicate an impairment existed.
For the twelve months ended December 31, 2018 we had two reporting units, DMP and MEC. The DMP reporting unit was acquired on December 14, 2018 and had preliminarily estimated goodwill of $29.2 million as of December 31, 2018. For the 18-day period from December 14 through December 31, 2018, DMP’s actual results of operations were above estimates utilized to determine the preliminary purchase price allocation. As a result, the fair value of the DMP reporting unit at December 31, 2018 is nominally above its carrying value. At December 31, 2018, the MEC reporting unit had goodwill with a carrying amount of approximately $40.2 million. The fair value of the MEC reporting unit substantially exceeded carrying value for 2018.
For the twelve months ended December 31, 2019, we concluded that the DMP and MEC reporting units were integrated into one reporting unit. At December 31, 2019, the reporting unit had goodwill with a carrying amount of approximately $71.5 million. The fair value of this reporting unit substantially exceeded the carrying value for 2019.
29
Changes to management assumptions and estimates utilized in the income and market approaches could negatively impact the fair value conclusions for our reporting units resulting in goodwill impairment. All key assumptions and valuations are determined by and are the responsibility of management. The factors used in the impairment analysis are inherently subject to uncertainty. We believe that the estimates and assumptions are reasonable to determine the fair value of our reporting units, however, if actual results are not consistent with these estimates and assumptions, goodwill and other intangible assets may be overstated which could trigger an impairment charge.
For impairment testing of long-lived assets, we identify asset groups at the lowest level for which identifiable cash flows are largely independent of the cash flows of other groups of assets and liabilities. Recoverability of assets to be held and used is measured by a comparison of the carrying amount of an asset to estimated undiscounted future cash flow expected to be generated by the assets. If the carrying amount of an asset exceeds its estimated future cash flows, an impairment charge is recognized by the amount by which the carrying amount of the asset exceeds the estimated fair value of the asset. For the years ended December 31, 2019 and 2018, there were no events or changes in circumstances that would indicate a material impairment of our long-lived assets.
Determining the useful life of an intangible asset also requires judgment. Certain intangible assets are expected to have indefinite lives based on their history and our plans to continue to support and build the acquired brands. Other acquired intangible assets such as customer relationships, trade names, and non-compete agreements are expected to have determinable useful lives. The costs of determinable-lived intangibles are amortized to expense over their estimated lives.
Income Taxes
The provision for, or benefit from, income taxes includes deferred taxes resulting from temporary differences in income for financial and tax purposes using the liability method. Such temporary differences result primarily from differences in the carrying value of assets and liabilities. Future realization of deferred income tax assets requires sufficient taxable income within the carryback and/or carryforward period available under tax law.
The Company evaluates on a quarterly basis whether, based on all available evidence, it is probable that the deferred income tax assets are realizable. Valuation allowances are established when it is estimated that it is more likely than not that the tax benefit of the deferred tax asset will not be realized. The evaluation includes the consideration of all available evidence, both positive and negative, regarding the estimated future reversals of existing taxable temporary differences, estimated future taxable income exclusive of reversing temporary differences and carryforwards, historical taxable income in prior carryback periods if carryback is permitted, and potential tax planning strategies which may be employed to prevent an operating loss or tax credit carryforward from expiring unused. The verifiable evidence such as future reversals of existing temporary differences and the ability to carryback are considered before the subjective sources such as estimate future taxable income exclusive of temporary differences and tax planning strategies. Additionally, we record uncertain tax positions at their net recognizable amount, based on the amount that management deems is more likely than not to be sustained upon ultimate settlement with the tax authorities in jurisdictions in which we operate.
Revenue recognition
The Company adopted ASC 606 January 1, 2019, where the Company recognizes revenue for the transfer of goods or services to a customer in an amount that reflects the consideration it expects to receive in exchange for those goods or services. When goods are shipped, the customer takes ownership at shipment, and this is when control transfers. Sales are supported by documentation such as supply agreements and purchase order, which specify certain terms and conditions including product specifications, quantities, fixed prices, delivery dates and payments terms. Revenue related to services is recognized in the period services are performed, thus the Company recognizes revenue at a point in time.
There are many customers where the Company designs, engineers and builds production tooling, which is purchased by the customer. Revenue is recognized when the tooling is completed, the customer signs off the product through the Product Part Approval Process (PPAP) and the tool is placed into service. Revenue related to production tooling is recognized as a point in time when it meets the PPAP criteria.
The Company offers certain customers discounts for early payments. These discounts are recorded against net sales in the consolidated statement of comprehensive income and accounts receivable in the consolidated balance sheet. The Company does not offer any other customer incentives, rebates or allowances.
ESOP
Prior to completion of this offering, shares of our common stock held by the ESOP are presented as temporary equity as they include a cash redemption feature that is not solely within our control. Throughout the year, as employee services are rendered, we record compensation expense based on a percentage of salaries or wages for eligible employees. The stock in the ESOP is held in trust for the sole benefit of the participants. Shares allocated to a participant’s account are fully vested.
Upon retirement, death, termination of employment or exercise of diversification rights, the eligible portion of a participant’s ESOP account is redeemable annually at the current price per share of the stock. Such per share price is established annually by an
30
independent valuation firm as of the end of the plan year preceding the redemption. Under the current terms of the ESOP, we are obligated to redeem eligible participant account balances for cash (in accordance with the redemption schedule and subject to the limitations set forth in the ESOP). Prior to this offering, we present all shares held by the ESOP as temporary equity on the consolidated balance sheet at their maximum redemption value. Following this offering, (i) we no longer redeem participants’ ESOP interests, as distributions from the ESOP made to a participant following retirement, death or termination of employment, or the exercise of diversification rights under the Traditional ESOP, will be made in our common stock, and upon receiving a distribution of our common stock from the ESOP a participant will be able to sell such shares of common stock in the market, subject to any requirements of federal securities law; and (ii) with respect to any participant who exercises statutory diversification rights under the 401(k) ESOP, the ESOP Trustee will sell, on behalf of the participant, the shares that the participant has elected to diversify and reinvest the sale proceeds in an alternate investment option as directed by the participant.
Emerging Growth Company
The JOBS Act permits an “emerging growth company” like us to take advantage of an extended transition period to comply with new or revised accounting standards applicable to public companies. We are choosing to use this provision and, as a result, we will comply with new or revised accounting standards as required for private companies.
Internal Controls and Procedures
Our management is responsible for establishing and maintaining adequate internal control over financial reporting for our company. Internal control over financial reporting is a process to provide reasonable assurance regarding the reliability of our financial reporting and the preparation of financial statements for external purposes in accordance with GAAP. Internal control over financial reporting includes maintaining records that in reasonable detail accurately and fairly reflect our transactions; providing reasonable assurance that transactions are recorded as necessary for preparation of our financial statements; providing reasonable assurance that receipts and expenditures of our assets are made in accordance with management’s authorization; and providing reasonable assurance that unauthorized acquisition, use or disposition of our assets that could have a material effect on the financial statements would be prevented or detected on a timely basis. Because of its inherent limitations, internal control over financial reporting is not intended to provide absolute assurance that a misstatement of our financial statements would be prevented or detected. Furthermore, our controls and procedures can be circumvented by the individual acts of some persons, by collusion of two or more people or by management override of the control, and misstatements due to error or fraud may occur and not be detected on a timely basis.
During the course of the quarterly and year-end close processes in 2019, we identified a material weakness in the design and operation of our internal control over financial reporting. The material weakness relates to a lack of consistently documented accounting policies and procedures and a lack of formalized controls over the accounting and recording of complex and significant unusual transactions which, in the aggregate, constitute a material weakness.
We have taken numerous steps to enhance our internal control environment during 2019. While preparing for our initial public offering, as of December 31, 2018, we had identified two material weaknesses in the design and operation of our internal control over financial reporting. As of December 31, 2019, we have concluded that one of the previously identified material weaknesses has been remediated and the other has been partially remediated. The previously identified deficiencies, that represented the two material weaknesses, included the preparation and review of journal entries, a limited number of personnel with a level of GAAP accounting knowledge commensurate with our financial reporting requirements and certain information technology general controls specific to segregation of duties, systems access and change management processes. However, deficiencies in our control environment, specifically deficiencies related to a lack of consistently documented accounting policies and procedures and a lack of formalized controls over the accounting and recording of complex and significant unusual transactions, which we have collectively determined aggregate to a material weakness, remained as of December 31, 2019. We are currently evaluating a number of steps to enhance our control over financial reporting and address this material weakness, including: enhancing our internal review procedures during the financial statement close process, and designing and implementing consistent policies throughout the Company; however, our current efforts to design and implement effective controls may not be sufficient to remediate the material weakness described above or prevent future material weaknesses or other deficiencies from occurring. Despite these actions, we may identify additional material weaknesses in our internal control over financial reporting in the future.
If we fail to effectively remediate this material weakness in our internal control over financial reporting, if we identify future material weaknesses in our internal control over financial reporting or if we are unable to comply with the demands that will be placed upon us as a public company, including the requirements of Section 404 of the Sarbanes-Oxley Act, in a timely manner, we may be unable to accurately report our financial results, or report them within the timeframes required by the SEC. In addition, if we are unable to assert that our internal control over financial reporting is effective, or if our independent registered public accounting firm is unable to express an opinion as to the effectiveness of our internal control over financial reporting, when required, investors may lose
31
confidence in the accuracy and completeness of our financial reports, we may face restricted access to the capital markets and our stock price may be adversely affected.
Overview
MEC is a leading U.S.-based value-added manufacturing partner that provides a broad range of prototyping and tooling, production fabrication, coating, assembly and aftermarket components. Our customers operate in diverse end markets, including heavy- and medium-duty commercial vehicles, construction, powersports, agriculture, military and other end markets. We have developed long-standing relationships with our blue-chip customers based upon a high level of experience, trust and confidence.
Our one operating segment focuses on producing metal components that are used in a broad range of heavy- and medium-duty commercial vehicles, construction, powersports, agricultural, military and other products.
On December 14, 2018 we acquired DMP, a leading U.S. based manufacturer of component parts for the heavy- and medium-duty commercial vehicles, construction, agriculture and military markets. See Note 3 – Acquisition, in the Notes to the Consolidated Financial Statements for more specifics.
In May 2019, we completed our IPO. In conjunction with the IPO, the Company’s legacy business converted from an S Corporation to a C Corporation. As a result, the consolidated business is subject to paying federal and state corporate income taxes on its taxable income from May 9, 2019 forward.
How We Assess Performance
Net Sales. Net sales reflect sales of our components and products net of allowances for returns and discounts. Several factors affect our net sales in any given period, including general economic conditions, weather, timing of acquisitions and the production schedules of our customers. Net sales are recognized at the time of shipment to the customer.
Manufacturing Margins. Manufacturing margins represents net sales less cost of sales. Cost of sales consists of all direct and indirect costs used in the manufacturing process, including raw materials, labor, equipment costs, depreciation, lease expenses, subcontract costs and other directly related overhead costs. Our cost of sales is directly affected by the fluctuations in commodity prices, primarily sheet steel and aluminum, but these changes are largely mitigated by contractual agreements with our customers that allow us to pass through these price changes based upon certain market indexes.
Depreciation and Amortization. We carry property, plant and equipment on our balance sheet at cost, net of accumulated depreciation and amortization. Depreciation on property, plant and equipment is computed on a straight-line basis over the estimated useful life of the asset. Amortization expense is the periodic expense related to leasehold improvements and intangible assets. Leasehold improvements are amortized over the lesser of the life of the underlying asset or the remaining lease term. Our intangible assets were recognized as a result of certain acquisitions and are generally amortized on a straight-line basis over the estimated useful lives of the assets.
Other Selling, General, and Administrative Expenses. Other selling, general and administrative expenses consist primarily of salaries and personnel costs for our sales and marketing, finance, human resources, information systems, administration and certain other managerial employees and certain corporate level administrative expenses such as incentive compensation, audit, accounting, legal and other consulting and professional services, travel, and insurance.
Other Key Performance Indicators
EBITDA, EBITDA Margin, Adjusted EBITDA and Adjusted EBITDA Margin
EBITDA represents net income before interest expense, provision (benefit) for income taxes, depreciation and amortization. EBITDA Margin represents EBITDA as a percentage of net sales for each period.
Adjusted EBITDA represents EBITDA before transaction fees incurred in connection with the DMP acquisition and the IPO, the loss on debt extinguishment relating to our December 2018 credit agreement, non-cash purchase accounting charges including costs recognized on the step-up of acquired inventory and contingent consideration fair value adjustments, and one-time increases in deferred compensation and long term incentive plan expenses related to the IPO. Adjusted EBITDA Margin represents Adjusted EBITDA as a percentage of net sales for each period. These metrics are supplemental measures of our operating performance that are neither required by, nor presented in accordance with, GAAP. These measures should not be considered as an alternative to net income or any other performance measure derived in accordance with GAAP as an indicator of our operating performance. We present Adjusted EBITDA and Adjusted EBITDA Margin as management uses these measures as key performance indicators, and we believe they are measures frequently used by securities analysts, investors and other parties to evaluate companies in our industry.
32
These measures have limitations as analytical tools and should not be considered in isolation or as substitutes for analysis of our results as reported under GAAP.
Our calculation of EBITDA, EBITDA Margin, Adjusted EBITDA and Adjusted EBITDA Margin may not be comparable to the similarly named measures reported by other companies. Potential differences between our measures of EBITDA and Adjusted EBITDA compared to other similar companies’ measures of EBITDA and Adjusted EBITDA may include differences in capital structure and tax positions.
The following table presents a reconciliation of net income, the most directly comparable measure calculated in accordance with GAAP, to EBITDA and Adjusted EBITDA, and the calculation of EBITDA Margin and Adjusted EBITDA Margin for each of the periods presented.
|
|
|
Twelve Months Ended December 31, |
|
|||||||||
|
(in thousands) |
|
2019 |
|
|
2018 |
|
|
2017 |
|
|||
|
Net income (loss) |
|
$ |
(4,753 |
) |
|
$ |
17,935 |
|
|
$ |
5,246 |
|
|
Interest expense |
|
|
6,728 |
|
|
|
3,879 |
|
|
|
4,180 |
|
|
Benefit for income taxes |
|
|
(4,088 |
) |
|
|
(459 |
) |
|
|
— |
|
|
Other |
|
|
— |
|
|
|
— |
|
|
|
33 |
|
|
Depreciation and amortization |
|
|
33,002 |
|
|
|
20,468 |
|
|
|
20,731 |
|
|
EBITDA |
|
|
30,890 |
|
|
|
41,823 |
|
|
|
30,190 |
|
|
Loss on the extinguishment of debt |
|
|
154 |
|
|
|
814 |
|
|
|
— |
|
|
Costs recognized on step-up of acquired inventory |
|
|
395 |
|
|
|
583 |
|
|
|
— |
|
|
Contingent consideration revaluation |
|
|
(6,054 |
) |
|
|
(21 |
) |
|
|
— |
|
|
Deferred compensation expense specific to IPO |
|
|
10,159 |
|
|
|
— |
|
|
|
— |
|
|
Long term incentive plan expense specific to IPO |
|
|
9,921 |
|
|
|
— |
|
|
|
— |
|
|
Other IPO and DMP acquisition related expenses |
|
|
7,615 |
|
|
|
495 |
|
|
|
— |
|
|
Adjusted EBITDA |
|
$ |
53,080 |
|
|
$ |
43,694 |
|
|
$ |
30,190 |
|
|
Net sales |
|
$ |
519,704 |
|
|
$ |
354,526 |
|
|
$ |
313,331 |
|
|
EBITDA Margin |
|
|
5.9 |
% |
|
|
11.8 |
% |
|
|
9.6 |
% |
|
Adjusted EBITDA Margin |
|
|
10.2 |
% |
|
|
12.3 |
% |
|
|
9.6 |
% |
Consolidated Results of Operations
Twelve Months Ended December 31, 2019 Compared to Twelve Months Ended December 31, 2018
|
|
|
Twelve Months Ended December 31, |
|
|
|
|
|
|
|
|
|
|||||||||||||
|
|
|
2019 |
|
|
2018 |
|
|
Increase (Decrease) |
|
|||||||||||||||
|
(in thousands) |
|
Amount |
|
|
% of Net Sales |
|
|
Amount |
|
|
% of Net Sales |
|
|
Amount Change |
|
|
% Change |
|
||||||
|
Net sales |
|
$ |
519,704 |
|
|
|
100.0 |
% |
|
$ |
354,526 |
|
|
|
100.0 |
% |
|
$ |
165,178 |
|
|
|
46.6 |
% |
|
Cost of sales |
|
|
460,986 |
|
|
|
88.7 |
% |
|
|
303,948 |
|
|
|
85.7 |
% |
|
|
157,038 |
|
|
|
51.7 |
% |
|
Manufacturing margins |
|
|
58,718 |
|
|
|
11.3 |
% |
|
|
50,578 |
|
|
|
14.3 |
% |
|
|
8,141 |
|
|
|
16.1 |
% |
|
Amortization of intangibles |
|
|
10,706 |
|
|
|
2.1 |
% |
|
|
4,096 |
|
|
|
1.2 |
% |
|
|
6,610 |
|
|
|
161.4 |
% |
|
Profit sharing, bonuses and deferred compensation |
|
|
25,105 |
|
|
|
4.8 |
% |
|
|
8,058 |
|
|
|
2.3 |
% |
|
|
17,047 |
|
|
|
211.6 |
% |
|
Employee stock ownership plan expense |
|
|
5,453 |
|
|
|
1.0 |
% |
|
|
4,000 |
|
|
|
1.1 |
% |
|
|
1,453 |
|
|
|
36.3 |
% |
|
Other selling, general and administrative expenses |
|
|
25,466 |
|
|
|
4.9 |
% |
|
|
12,276 |
|
|
|
3.5 |
% |
|
|
13,190 |
|
|
|
107.5 |
% |
|
Contingent consideration revaluation |
|
|
(6,054 |
) |
|
|
-1.2 |
% |
|
|
(21 |
) |
|
|
0.0 |
% |
|
|
(6,033 |
) |
|
|
-28728.6 |
% |
|
Income (loss) from operations |
|
|
(1,958 |
) |
|
|
-0.4 |
% |
|
|
22,169 |
|
|
|
6.3 |
% |
|
|
(24,127 |
) |
|
|
-108.8 |
% |
|
Interest expense |
|
|
(6,728 |
) |
|
|
1.3 |
% |
|
|
(3,879 |
) |
|
|
1.1 |
% |
|
|
2,849 |
|
|
|
73.5 |
% |
|
Loss on extinguishment of debt |
|
|
(154 |
) |
|
|
0.0 |
% |
|
|
(814 |
) |
|
|
0.2 |
% |
|
|
(660 |
) |
|
|
-81.1 |
% |
|
Benefit for income taxes |
|
|
(4,088 |
) |
|
|
-0.8 |
% |
|
|
(459 |
) |
|
|
-0.1 |
% |
|
|
(3,628 |
) |
|
|
-790.0 |
% |
|
Net income (loss) and comprehensive income (loss) |
|
$ |
(4,753 |
) |
|
|
-0.9 |
% |
|
$ |
17,935 |
|
|
|
5.1 |
% |
|
$ |
(22,688 |
) |
|
|
-126.5 |
% |
|
EBITDA |
|
$ |
30,890 |
|
|
|
5.9 |
% |
|
$ |
41,823 |
|
|
|
11.8 |
% |
|
$ |
(10,933 |
) |
|
|
-26.1 |
% |
|
Adjusted EBITDA |
|
$ |
53,080 |
|
|
|
10.2 |
% |
|
$ |
43,694 |
|
|
|
12.3 |
% |
|
$ |
9,386 |
|
|
|
21.5 |
% |
Net Sales. Net sales were $519,704 for the twelve months ended December 31, 2019 as compared to $354,526 for the twelve months ended December 31, 2018 for an increase of $165,178, or 46.6%, which was driven by approximately $189,000 of net
33
contributions from the former DMP locations slightly offset by modest declines within our legacy business. Both the legacy MEC and former DMP businesses were adversely impacted by sudden declines in market demand that began late in the third quarter and continued through the fourth quarter, particularly in the Commercial Vehicle (CV), Agricultural and Construction end markets served. These market demand changes drove destocking activities which had a more pronounced impact on the legacy MEC business, especially in the fourth quarter. Destocking stems from lower retail sales resulting in customer decisions to reduce dealer inventory levels by reducing and curtailing near-term production schedules. In addition, several key customers in the CV market experienced labor union issues in the third and fourth quarters of 2019, which negatively impacted production schedules for both the legacy MEC and former DMP businesses.
Manufacturing Margins. Manufacturing margins were $58,718 for the twelve months ended December 31, 2019 as compared to $50,578 for the twelve months ended December 31, 2018, an increase of $8,141, or 16.1%. The increase was driven by approximately $21,000 of contributions from the former DMP locations slightly offset by modest declines at the legacy MEC locations. The declines in market demand, destocking, and impact of customer labor issues adversely impacted volumes and the labor absorption associated with it. These circumstances, along with the costs associated with working through the consolidation of the Company’s Virginia facilities, shift consolidations across multiple facilities and increased healthcare costs, coupled with fewer working days in the fourth quarter, negatively impacted our costs. These conditions collectively produced an unusual amount of under-absorbed manufacturing expenses and lower manufacturing margins in the third quarter and especially in the fourth quarter of 2019.
Amortization of Intangibles Expense. Amortization of intangibles expense was $10,706 for the twelve months ended December 31, 2019 as compared to $4,096 for the twelve months ended December 31, 2018. The increase of $6,610, or 161.4%, was solely due to the amortization expense associated with the identifiable intangible assets from the DMP acquisition. Please see Note 3 – Acquisition of the Consolidated Financial Statements for more information related to these identifiable intangible assets.
Profit Sharing, Bonuses and Deferred Compensation Expenses. Profit sharing, bonuses, and deferred compensation expenses were $25,105 for the twelve months ended December 31, 2019 as compared to $8,058 for the twelve months ended December 31, 2018. The increase of $17,047 was primarily driven by a one-time increase of approximately $10,200 in deferred compensation plan expense and a one-time increase of approximately $9,900 in long term incentive plan (“LTIP”) expense, both related to the IPO, offset by approximately a $2,600 reduction in annual incentive-based bonus expense.
Employee Stock Ownership Plan Expense. Employee stock ownership plan expense was $5,453 for the twelve months ended December 31, 2019 as compared to $4,000 for the twelve months ended December 31, 2018. The increase of $1,453, or 36.3%, was primarily due to the addition of plan participants as a result of the DMP acquisition.
Other Selling, General and Administrative Expenses. Other selling, general and administrative expenses were $25,466 for the twelve months ended December 31, 2019 as compared to $12,276 for the twelve months ended December 31, 2018. The increase of $13,190, or 107.5%, was driven by approximately $5,700 of one-time IPO and DMP acquisition expenses, approximately $5,300 from the former DMP acquired entities, and additional costs associated with being a publicly traded company.
34
Contingent Consideration Revaluation. The DMP purchase agreement provided for a payout to the previous shareholders of DMP of $7,500, but not more than $10,000 if a certain level of EBITDA was generated during the twelve-month period ended September 30, 2019. We estimated the fair value of the contingent consideration payable balance of $6,076 as of the acquisition date. We then remeasured the fair value each quarter with the change recorded as income or expense. Based on our calculations in accordance with the purchase agreement, and as agreed to by DMP’s former shareholders, DMP’s EBITDA fell short of the payout threshold and as a result, the contingent consideration payable balance was adjusted to zero in the third quarter of 2019, resulting in a revaluation gain of $6,054 for the twelve months ended December 31, 2019.
Interest Expense. Interest expense was $6,728 for the twelve months ended December 31, 2019 as compared to $3,879 for the twelve months ended December 31, 2018. The increase of $2,849, or 73.5%, was due to additional debt used to fund the DMP acquisition, slightly offset by the partial paydown of our debt with the IPO proceeds in May and net positive cash flows generated by the business.
Benefit for Income Taxes. Income tax benefits were $4,088 for the twelve months ended December 31, 2019 as compared to $459 for the twelve months ended December 31, 2018. The current period benefit is the result of the Company’s legacy business converting to a C Corporation in May 2019 and the one-time IPO expenses incurred which are deductible, causing the benefit. Prior to the IPO, the Company’s legacy business was a S Corporation, where substantially all taxes were passed to the shareholders and the Company did not pay federal or state corporate income taxes on its taxable income. The DMP entities have been taxable under the provisions of the Internal Revenue Code and certain state statutes since being acquired. The consolidated business has been subject to paying federal and state corporate income taxes on its taxable income since May 9, 2019.
Net Income (Loss) and Comprehensive Income (Loss). Net loss and comprehensive loss was $4,753 for the twelve months ended December 31, 2019 as compared to net income and comprehensive income of $17,935 for the twelve months ended December 31, 2018. The decrease of $22,688 was due to the previously discussed expense increases, most notably the one-time LTIP and deferred compensation plan expenses related to the IPO, and other one-time IPO and DMP acquisition related expenses, slightly offset by the contingent consideration fair value revaluation adjustment and net income generated by DMP.
EBITDA and EBITDA Margin. EBITDA and EBITDA Margin percent were $30,890 and 5.9%, respectively, for the twelve months ended December 31, 2019, as compared to $41,823 and 11.8%, respectively, for the twelve months ended December 31, 2018. The $10,933 decline in EBITDA was due to the previously mentioned increase in LTIP and deferred compensation plan expenses related to the IPO, and other one-time IPO and DMP acquisition related expenses. These one-time expenses and charges were slightly offset by the gain recorded for the DMP contingent consideration fair value revaluation adjustment and the addition of DMP.
Adjusted EBITDA and Adjusted EBITDA Margin. Adjusted EBITDA and Adjusted EBITDA Margin percent were $53,080 and 10.2%, respectively, for the twelve months ended December 31, 2019, as compared to $43,694 and 12.3%, respectively, for the twelve months ended December 31, 2018. The increase in Adjusted EBITDA of $9,386 was primarily driven by our recent acquisition of DMP.
Twelve Months Ended December 31, 2018 Compared to Twelve Months Ended December 31, 2017
|
|
|
Twelve Months Ended December 31, |
|
|
|
|
|
|
|
|
|
|||||||||||||
|
|
|
2018 |
|
|
2017 |
|
|
Increase (Decrease) |
|
|||||||||||||||
|
(in thousands) |
|
Amount |
|
|
% of Net Sales |
|
|
Amount |
|
|
% of Net Sales |
|
|
Amount Change |
|
|
% Change |
|
||||||
|
Net sales |
|
$ |
354,526 |
|
|
|
100.0 |
% |
|
$ |
313,331 |
|
|
|
100.0 |
% |
|
$ |
41,195 |
|
|
|
13.1 |
% |
|
Cost of sales |
|
|
303,948 |
|
|
|
85.7 |
% |
|
|
278,594 |
|
|
|
88.9 |
% |
|
|
25,354 |
|
|
|
9.1 |
% |
|
Manufacturing margins |
|
|
50,578 |
|
|
|
14.3 |
% |
|
|
34,737 |
|
|
|
11.1 |
% |
|
|
15,841 |
|
|
|
45.6 |
% |
|
Amortization of intangibles |
|
|
4,096 |
|
|
|
1.2 |
% |
|
|
3,756 |
|
|
|
1.2 |
% |
|
|
340 |
|
|
|
9.1 |
% |
|
Profit sharing, bonuses and deferred compensation |
|
|
8,058 |
|
|
|
2.3 |
% |
|
|
5,397 |
|
|
|
1.7 |
% |
|
|
2,661 |
|
|
|
49.3 |
% |
|
Employee stock ownership plan expense |
|
|
4,000 |
|
|
|
1.1 |
% |
|
|
4,000 |
|
|
|
1.3 |
% |
|
|
— |
|
|
|
— |
|
|
Other selling, general and administrative expenses |
|
|
12,276 |
|
|
|
3.5 |
% |
|
|
12,158 |
|
|
|
3.9 |
% |
|
|
118 |
|
|
|
1.0 |
% |
|
Contingent consideration revaluation |
|
|
(21 |
) |
|
|
0.0 |
% |
|
|
— |
|
|
N/A |
|
|
|
(21 |
) |
|
N/A |
|
||
|
Income (loss) from operations |
|
|
22,169 |
|
|
|
6.3 |
% |
|
|
9,426 |
|
|
|
3.0 |
% |
|
|
12,743 |
|
|
|
135.2 |
% |
|
Interest expense |
|
|
(3,879 |
) |
|
|
1.1 |
% |
|
|
(4,180 |
) |
|
|
1.3 |
% |
|
|
(301 |
) |
|
|
-7.2 |
% |
|
Loss on extinguishment of debt |
|
|
(814 |
) |
|
|
0.2 |
% |
|
|
— |
|
|
N/A |
|
|
|
814 |
|
|
N/A |
|
||
|
Benefit for income taxes |
|
|
(459 |
) |
|
|
-0.1 |
% |
|
|
— |
|
|
N/A |
|
|
|
(459 |
) |
|
N/A |
|
||
|
Net income (loss) and comprehensive income (loss) |
|
$ |
17,935 |
|
|
|
5.1 |
% |
|
$ |
5,246 |
|
|
|
1.7 |
% |
|
$ |
12,689 |
|
|
|
241.9 |
% |
|
EBITDA |
|
$ |
41,823 |
|
|
|
11.8 |
% |
|
$ |
30,190 |
|
|
|
9.6 |
% |
|
$ |
11,633 |
|
|
|
38.5 |
% |
|
Adjusted EBITDA |
|
$ |
43,694 |
|
|
|
12.3 |
% |
|
$ |
30,190 |
|
|
|
9.6 |
% |
|
$ |
13,504 |
|
|
|
44.7 |
% |
35
Net Sales. Net sales were $354,526 for the twelve months ended December 31, 2018 compared to $313,331 for the twelve months ended December 31, 2017. The increase of $41,195, or 13.1%, was due in part to our acquisition of DMP, which accounted for $4,841, or 1.5%, of the increase, general market demand increases, which accounted for approximately $27,500 of the increase, and sales price increases passed along to our customers for increased material cost and other labor related inflationary reasons, which accounted for approximately $8,900 of the increase.
Manufacturing Margins. Manufacturing margins were $50,578 for the twelve months ended December 31, 2018 compared to $34,737 for the twelve months ended December 31, 2017. Of the increase of $15,841, or 45.6%, approximately $7,500 was related to the increased market demand noted above, approximately $6,000 was related to sales price realization, and approximately $2,400 was related to realized operational efficiencies and cost improvements.
Amortization of Intangibles. Amortization of intangibles were $4,096 for the twelve months ended December 31, 2018 compared to $3,756 for the twelve months ended December 31, 2017. The increase of $340, or 9.1%, related to the amortization expense associated with the identifiable intangible assets from the DMP acquisition.
Profit Sharing, Bonuses and Deferred Compensation. Profit sharing, bonuses and deferred compensation expense was $8,058 for the twelve months ended December 31, 2018 compared to $5,397 for the twelve months ended December 31, 2017. The increase of $2,661, or 49.3%, related to the financial performance and increased valuation of the Company.
Employee Stock Ownership Plan Expense. Employee stock ownership plan expense was $4,000 for both the twelve months ended December 31, 2018 and the twelve months ended December 31, 2017. This expense relates to stock that was repurchased during the year from our employees.
Other Selling, General and Administrative Expenses. Other selling, general and administrative expenses were $12,276 for the twelve months ended December 31, 2018 compared to $12,158 for the twelve months ended December 31, 2017. The increase of $118, or 1.0%, related to salary increases.
Interest Expense. Interest expense was $3,879 for the twelve months ended December 31, 2018 compared to $4,180 for the twelve months ended December 31, 2017. The decrease of $301, or 7.2%, related to debt reduction that occurred prior to the acquisition of DMP.
Net Income and Comprehensive Income. Net income and comprehensive income was $17,935 for the twelve months ended December 31, 2018 compared to $5,246 for the twelve months ended December 31, 2017. The increase of $12,689, or 241.9%, was due to the factors described above.
EBITDA and EBITDA Margin. EBITDA and EBITDA Margin were $41,823 and 11.8%, respectively, for the twelve months ended December 31, 2018, as compared to $30,190 and 9.6%, respectively, for the twelve months ended December 31, 2017. The increase in EBITDA and EBITDA Margin was primarily due to the factors described above.
Liquidity and Capital Resources
Cash Flows Analysis Twelve Months Ended December 31, 2019 Compared to Twelve Months Ended December 31, 2018
|
|
|
Twelve Months Ended December 31, |
|
|
Increase (Decrease) |
|
||||||||||
|
(in thousands) |
|
2019 |
|
|
2018 |
|
|
$Change |
|
|
% Change |
|
||||
|
Net cash provided by operating activities |
|
$ |
33,402 |
|
|
$ |
36,715 |
|
|
|
(3,313 |
) |
|
|
-9.0 |
% |
|
Net cash used in investing activities |
|
|
(28,090 |
) |
|
|
(132,569 |
) |
|
|
104,479 |
|
|
|
-78.8 |
% |
|
Net cash provided by (used in) financing activities |
|
|
(8,400 |
) |
|
|
98,867 |
|
|
|
(107,267 |
) |
|
|
-108.5 |
% |
|
Net change in cash |
|
$ |
(3,088 |
) |
|
$ |
3,013 |
|
|
$ |
(6,101 |
) |
|
|
-202.5 |
% |
Operating Activities. Cash provided by operating activities was $33,402 for the twelve months ended December 31, 2019 as compared to $36,715 for the twelve months ended December 31, 2018. The $3,313, or 9.0% decline in operating cash flows was primarily driven by the LTIP payout of approximately $10,600 in the second quarter of 2019 and approximately $5,000 of payments made in 2019 specific to the IPO, offset by additional cash flow generated by the consolidated business during 2019. Changes to pricing, payment terms and credit terms did not have a significant impact on changes to working capital items, or any other element of the operating cash flow activities, for the periods presented.
36
Investing Activities. Cash used in investing activities was $28,090 for the twelve months ended December 31, 2019, as compared to $132,569 for the twelve months ended December 31, 2018. The $104,479, or 78.8%, decrease in cash used in investing activities was predominantly driven by cash utilized to acquire DMP in 2018, slightly offset by greater capital expenditures in 2019.
Financing Activities. Cash used by financing activities was $8,400 for the twelve months ended December 31, 2019, as compared to cash provided in financing activities of $98,867 for the twelve months ended December 31, 2018. The $107,267 change was primarily due to $101,763 of net IPO proceeds received in May 2019, net of debt repayments.
Cash Flows Analysis Twelve Months Ended December 31, 2018 Compared to Twelve Months Ended December 31, 2017
|
|
|
Twelve Months Ended December 31, |
|
|
Increase (Decrease) |
|
||||||||||
|
(in thousands) |
|
2018 |
|
|
2017 |
|
|
$Change |
|
|
% Change |
|
||||
|
Net cash provided by operating activities |
|
$ |
36,715 |
|
|
$ |
30,801 |
|
|
|
5,914 |
|
|
|
19.2 |
% |
|
Net cash used in investing activities |
|
|
(132,569 |
) |
|
|
(11,235 |
) |
|
|
(121,334 |
) |
|
|
1080.0 |
% |
|
Net cash provided by (used in) financing activities |
|
|
98,867 |
|
|
|
(19,633 |
) |
|
|
118,500 |
|
|
|
-603.6 |
% |
|
Net change in cash |
|
$ |
3,013 |
|
|
$ |
(67 |
) |
|
$ |
3,080 |
|
|
|
-4597.6 |
% |
Operating Activities. Cash provided by operating activities was $36,715 for the twelve months ended December 31, 2018, as compared to $30,801 for the twelve months ended December 31, 2017. The $5,914, or 19.2%, increase in cash provided by operating activities was primarily due to the increase in net income of $12,689, partially offset by changes in working capital items including $4,393 of additional inventory primarily driven by higher forecasted volumes year over year and increases in prepaid and other assets primarily due to the timing of payments. Changes to pricing, payment terms and credit terms did not have a significant impact to working capital items, or any other element of operating cash flow activities, for the periods presented.
Investing Activities. Cash used in investing activities was $132,569 for the twelve months ended December 31, 2018, as compared to $11,235 for the twelve months ended December 31, 2017. The $121,334 increase in cash used in investing activities was primarily due to the $114,700 net payment to acquire DMP in addition to a $6,620 increase in capital expenditures.
Financing Activities. Cash provided by financing activities was $98,867 for the twelve months ended December 31, 2018, as compared to $19,633 used in the twelve months ended December 31, 2017. The increase of $118,500 in cash provided by financing activities was primarily due to the DMP acquisition facilitated by the restructuring of our debt facilities.
Amended and Restated Credit Agreement
On September 26, 2019, and as last amended as of December 31, 2019, we entered into the A&R Credit Agreement with certain lenders and Wells Fargo Bank, National Association, as administrative agent (the Agent). The A&R Credit Agreement provides for a $200.0 million Revolving Loan, with a letter of credit sub-facility in an aggregate amount not to exceed $5.0 million, and a swingline facility in an aggregate amount of $20.0 million. The A&R Credit Agreement also provides for an additional $100.0 million of capacity through an accordion feature. All amounts borrowed under the A&R Credit Agreement mature on September 26, 2024.
Our obligations under the A&R Credit Agreement are secured by first priority security interests in substantially all of our personal property and guaranteed by, and secured by first priority security interests in, substantially all of the personal property of, our direct and indirect subsidiaries: Center Manufacturing, Inc., Center Manufacturing Holdings, Inc., Center—Moeller Products LLC, Defiance Metal Products Co., Defiance Metal Products of Arkansas, Inc., Defiance Metal Products of PA., Inc. and Defiance Metal Products of WI, Inc.
Borrowings under the A&R Credit Agreement bear interest at a fluctuating London Interbank Offered Rate (LIBOR) (which may be adjusted for certain reserve requirements), plus 1.00-2.00% depending on the current Consolidated Total Leverage Ratio (as defined in the A&R Credit Agreement). Under certain circumstances, we may not be able to pay interest based on LIBOR. If that happens, we will be required to pay interest at the Base Rate, which is the sum of (a) the higher of (i) the Prime Rate (as publicly announced by the Agent from time to time) and (ii) the Federal Funds Rate plus 0.50%, plus (b) 0.00% to 1.00%, depending on the current Total Consolidated Leverage Ratio. The A&R Credit Agreement also includes provisions for determining a replacement rate when LIBOR is no longer available.
At December 31, 2019, the interest rate on outstanding borrowings under the Revolving Loan was 3.25%. At December 31, 2019, we had availability of $127.4 million under the Revolving Loan.
37
We must pay a commitment fee at a rate of 0.20% per annum on the average daily unused portion of the aggregate unused revolving commitments under the A&R Credit Agreement. We must also pay fees as specified in the Fee Letter (as defined in the A&R Credit Agreement) and with respect to any letters of credit issued under the A&R Credit Agreement.
The A&R Credit Agreement contains usual and customary negative covenants for agreements of this type, including, but not limited to, restrictions on our ability to, subject to certain exceptions, create, incur or assume indebtedness, create or incur liens, make certain investments, merge or consolidate with another entity, make certain asset dispositions, pay dividends or other distributions to shareholders, enter into transactions with affiliates, enter into sale leaseback transactions or make capital expenditures. The A&R Credit Agreement also requires us to satisfy certain financial covenants, including a minimum interest coverage ratio of 3.00 to 1.00. At December 31, 2019, our interest coverage ratio was 7.42 to 1.00. The A&R Credit Agreement also requires us to maintain a consolidated total leverage ratio not to exceed 3.25 to 1.00, although such leverage ratio can be increased in connection with certain acquisitions. At December 31, 2019, our consolidated total leverage ratio was 1.39 to 1.00.
The A&R Credit Agreement includes customary events of default, including, among other things, payment default, covenant default, breach of representation or warranty, bankruptcy, cross-default, material ERISA events, material money judgments, failure to maintain subsidiary guarantees and a change in control, which will be deemed to occur if any person or group other than the ESOP or the 401(k) Plan owns or controls more than 35% of our equity interests, or our board of directors is not composed of a majority of our continuing directors (i.e., our directors as of September 26, 2019, and any additional or replacement directors that have been approved by at least 51% of the directors then in office). If an event of default occurs, the Agent will be entitled to take various actions, including the acceleration of amounts due under the A&R Credit Agreement, termination of the credit facility, and all other actions permitted to be taken by a secured creditor.
At December 31, 2019, we were in compliance with all covenants under the A&R Credit Agreement.
Capital Requirements and Sources of Liquidity
During the twelve months ended December 31, 2019 and 2018, our capital expenditures were approximately $25.8 million and $17.9 million, respectively. The increase of $7.9 million was primarily driven by our continued investment in automation and new technology, the addition of DMP, and the timing of purchases in 2019 as compared to the prior year.
Historically, we have had significant cash requirements in order to organically expand our business to meet the market related needs of our customers, continue our investment in new technologies and automation, as well as fund new projects. Additionally, prior to the IPO, we were required to use cash to repurchase shares of our common stock from the ESOP in connection with legally required diversification and other distributions to eligible ESOP participants. Following the consummation of the IPO, this requirement terminated, which allows us to direct this previously allocated cash to operating- and growth-related purposes. Our cash requirements include costs related to capital expenditures, purchase of materials and production of materials and cash to fund these needs. Our working capital needs are driven by the growth of our business, with our cash requirements greater in periods of growth. Additional cash requirements resulting from our growth include the costs of additional personnel, production and distribution facilities, enhancing our information systems and, our integration of DMP and any future acquisitions and, our compliance with laws and rules applicable to being a public company. Following the completion of the IPO, our primary uses of cash are investing in flexible, re-deployable automation used to provide our components and products and funding organic and acquisitive growth initiatives.
We have historically relied upon cash available through credit facilities, in addition to cash from operations, to finance our working capital requirements and to support our growth. At December 31, 2019, we had availability of $127.4 million under our A&R Credit Agreement. We regularly monitor potential capital sources, including equity and debt financings, in an effort to meet our planned capital expenditures and liquidity requirements. Our future success will be highly dependent on our ability to access outside sources of capital.
We believe that our operating cash flow and available borrowings under the A&R Credit Agreement are sufficient to fund our operations for 2020. However, future cash flows are subject to a number of variables, and additional capital expenditures will be required to conduct our operations. There can be no assurance that operations and other capital resources will provide cash in sufficient amounts to maintain planned or future levels of capital expenditures. In the event we make one or more acquisitions and the amount of capital required is greater than the amount we have available for acquisitions at that time, we could be required to reduce the expected level of capital expenditures and/or seek additional capital. If we seek additional capital, we may do so through borrowings under the A&R Credit Agreement, joint ventures, asset sales, offerings of debt or equity securities or other means. We cannot guarantee that this additional capital will be available on acceptable terms or at all. If we are unable to obtain the funds we need, we may not be able to complete acquisitions that may be favorable to us or finance the capital expenditures necessary to conduct our operations.
38
The following table presents our obligations and commitments to make future payments under contracts and contingent commitments at December 31, 2019:
|
|
|
|
|
|
|
Payments Due by Period |
|
|||||||||||||
|
(in thousands) |
|
Total |
|
|
2020 |
|
|
2021 – 2022 |
|
|
2023 – 2024 |
|
|
Thereafter |
|
|||||
|
Long-term debt principal payment obligations (1) |
|
$ |
72,572 |
|
|
$ |
— |
|
|
$ |
— |
|
|
$ |
72,572 |
|
|
|
— |
|
|
Forecasted interest on debt payment obligations (2) |
|
|
11,400 |
|
|
|
2,359 |
|
|
|
4,717 |
|
|
|
4,324 |
|
|
|
— |
|
|
Capital lease obligations |
|
|
3,676 |
|
|
|
734 |
|
|
|
1,468 |
|
|
|
1,248 |
|
|
|
226 |
|
|
Operating lease obligations |
|
|
12,766 |
|
|
|
3,402 |
|
|
|
4,648 |
|
|
|
2,622 |
|
|
|
2,094 |
|
|
Total |
|
$ |
100,414 |
|
|
$ |
6,495 |
|
|
$ |
10,833 |
|
|
$ |
80,766 |
|
|
$ |
2,320 |
|
|
(1) |
The long-term amounts in the table include principal payments under the Company’s A&R Credit Agreement, which expires in 2024. |
|
(2) |
Forecasted interest on debt payment obligations based on interest rates as of December 31, 2019 |
Item 7A. Quantitative and Qualitative Disclosures About Market Risk.
We are exposed to market risk from changes in customer forecasts, interest rates, inflation, and, to a lesser extent, commodities. To reduce such risks, we selectively use financial instruments and other proactive management techniques.
Customer Forecasts
The use and consumption of our components, products and services fluctuates depending on order forecasts we receive from our customers. These order forecasts can change dramatically from quarter to quarter dependent upon the respective markets that our customers provide products.
Interest Rate Risk
We are exposed to interest rate risk on certain of our short- and long-term debt obligations used to finance our operations and acquisitions. We have LIBOR-based floating rate borrowings under the A&R Credit Agreement, which exposes us to variability in interest payments due to changes in the reference interest rates.
The amount borrowed under the Revolver Loan under the A&R Credit Agreement was $72.6 million as of December 31, 2019. The interest rate was 3.25% as of December 31, 2019. Please see “Amended and Restated Credit Agreement” in Part II, Item 7 of this Annual Report on Form 10-K and Note 5 in the Notes to the Consolidated Financial Statements for more specifics.
A hypothetical 100-basis-point increase in our borrowing rates would result in a $0.3 million change in our annual interest expense based on our variable rate debt at December 31, 2019. We do not use derivative financial instruments to manage interest risk or to speculate on future changes in interest rates. A rise in interest rates could negatively affect our cash flow.
Commodity Risk
We source a wide variety of materials and components from a network of suppliers. While such materials are generally available from numerous suppliers, commodity raw materials, such as steel, aluminum, copper, paint and paint chemicals, and other production costs are subject to price fluctuations, which could have a negative impact on our results. We strive to pass along such commodity price increases to customers to avoid profit margin erosion and in many cases utilize contracts with those customers to mitigate the impact of commodity raw material price fluctuations. As of December 31, 2019, we did not have any commodity hedging instruments in place.
39
Item 8. Financial Statements and Supplementary Data.
Report of Independent Registered Public Accounting Firm
To the shareholders and the Board of Directors of Mayville Engineering Company, Inc.
Opinion on the Financial Statements
We have audited the accompanying consolidated balance sheets of Mayville Engineering Company, Inc. and subsidiaries (the "Company") as of December 31, 2019 and 2018, the related consolidated statements of comprehensive income (loss), shareholders’ equity, and cash flows, for each of the three years in the period ended December 31, 2019, and the related notes (collectively referred to as the "financial statements"). In our opinion, the financial statements present fairly, in all material respects, the financial position of the Company as of December 31, 2019 and 2018, and the results of its operations and its cash flows for each of the three years in the period ended December 31, 2019, in conformity with accounting principles generally accepted in the United States of America.
Basis for Opinion
These financial statements are the responsibility of the Company's management. Our responsibility is to express an opinion on the Company's financial statements based on our audits. We are a public accounting firm registered with the Public Company Accounting Oversight Board (United States) (PCAOB) and are required to be independent with respect to the Company in accordance with the U.S. federal securities laws and the applicable rules and regulations of the Securities and Exchange Commission and the PCAOB.
We conducted our audits in accordance with the standards of the PCAOB. Those standards require that we plan and perform the audit to obtain reasonable assurance about whether the financial statements are free of material misstatement, whether due to error or fraud. The Company is not required to have, nor were we engaged to perform, an audit of its internal control over financial reporting. As part of our audits, we are required to obtain an understanding of internal control over financial reporting but not for the purpose of expressing an opinion on the effectiveness of the Company’s internal control over financial reporting. Accordingly, we express no such opinion.
Our audits included performing procedures to assess the risks of material misstatement of the financial statements, whether due to error or fraud, and performing procedures that respond to those risks. Such procedures included examining, on a test basis, evidence regarding the amounts and disclosures in the financial statements. Our audits also included evaluating the accounting principles used and significant estimates made by management, as well as evaluating the overall presentation of the financial statements. We believe that our audits provide a reasonable basis for our opinion.
/s/ DELOITTE & TOUCHE LLP
Milwaukee, WI
March 2, 2020
We have served as the Company's auditor since 2018.
40
Mayville Engineering Company, Inc. and Subsidiaries
(in thousands, except share amounts)
|
|
|
December 31, 2019 |
|
|
December 31, 2018 |
|
||
|
ASSETS |
|
|
|
|
|
|
|
|
|
Cash and cash equivalents |
|
$ |
1 |
|
|
$ |
3,089 |
|
|
Receivables, net of allowances for doubtful accounts of $526 as of December 31, 2019 and $801 as of December 31, 2018 |
|
|
40,188 |
|
|
|
52,298 |
|
|
Inventories, net |
|
|
45,692 |
|
|
|
53,405 |
|
|
Tooling in progress |
|
|
1,589 |
|
|
|
2,318 |
|
|
Prepaid expenses and other current assets |
|
|
3,007 |
|
|
|
1,649 |
|
|
Total current assets |
|
|
90,477 |
|
|
|
112,759 |
|
|
Property, plant and equipment, net |
|
|
125,063 |
|
|
|
123,883 |
|
|
Goodwill |
|
|
71,535 |
|
|
|
69,437 |
|
|
Intangible assets-net |
|
|
72,173 |
|
|
|
82,879 |
|
|
Capital lease, net |
|
|
3,227 |
|
|
|
1,953 |
|
|
Other long-term assets |
|
|
1,107 |
|
|
|
814 |
|
|
Total |
|
|
363,582 |
|
|
|
391,725 |
|
|
LIABILITIES, TEMPORARY EQUITY, AND SHAREHOLDERS’ EQUITY |
|
|
|
|
|
|
|
|
|
Accounts payable |
|
|
32,173 |
|
|
|
45,992 |
|
|
Current portion of capital lease obligation |
|
|
598 |
|
|
|
281 |
|
|
Current portion of long-term debt |
|
|
— |
|
|
|
8,606 |
|
|
Accrued liabilities: |
|
|
|
|
|
|
|
|
|
Salaries, wages, and payroll taxes |
|
|
5,752 |
|
|
|
7,548 |
|
|
Profit sharing and bonus |
|
|
6,229 |
|
|
|
6,124 |
|
|
Other current liabilities |
|
|
3,439 |
|
|
|
14,610 |
|
|
Total current liabilities |
|
|
48,191 |
|
|
|
83,161 |
|
|
Bank revolving credit notes |
|
|
72,572 |
|
|
|
59,629 |
|
|
Capital lease obligation, less current maturities |
|
|
2,687 |
|
|
|
1,697 |
|
|
Other long-term debt, less current maturities |
|
|
— |
|
|
|
111,675 |
|
|
Deferred compensation and long-term incentive, less current portion |
|
|
24,949 |
|
|
|
13,351 |
|
|
Deferred income tax liability |
|
|
14,188 |
|
|
|
19,123 |
|
|
Other long-term liabilities |
|
|
100 |
|
|
|
100 |
|
|
Total liabilities |
|
|
162,687 |
|
|
|
288,736 |
|
|
Commitments and contingencies (see Note 12) |
|
|
|
|
|
|
|
|
|
Redeemable common shares, no par value, stated at redemption value of outstanding shares, 60,045,454 shares authorized, 38,623,806 shares issued at December 31, 2018 |
|
|
— |
|
|
|
133,806 |
|
|
Retained earnings |
|
|
— |
|
|
|
26,842 |
|
|
Treasury shares at cost, 25,180,330 shares at December 31, 2018 |
|
|
— |
|
|
|
(57,659 |
) |
|
Total temporary equity |
|
|
— |
|
|
|
102,989 |
|
|
Common shares, no par value, 75,000,000 authorized, 20,845,693 shares issued at December 31, 2019 |
|
|
— |
|
|
|
— |
|
|
Additional paid-in-capital |
|
|
183,687 |
|
|
|
— |
|
|
Retained earnings |
|
|
22,090 |
|
|
|
— |
|
|
Treasury shares at cost, 1,213,482 shares at December 31, 2019 |
|
|
(4,882 |
) |
|
|
— |
|
|
Total shareholders’ equity |
|
|
200,895 |
|
|
|
— |
|
|
Total |
|
$ |
363,582 |
|
|
$ |
391,725 |
|
|
|
|
|
|
|
|
|
|
|
Share counts as of December 31, 2018 give effect to the issuance of a stock dividend of approximately 1,334.34-for-1 related to the Company’s May 2019 IPO. There were 45,000 shares authorized, 28,946 shares issued and 18,871 treasury shares at December 31, 2018.
The accompanying notes are an integral part of these Consolidated Financial Statements.
41
Mayville Engineering Company, Inc. and Subsidiaries
Consolidated Statements of Comprehensive Income (Loss)
(in thousands, except share amounts and per share data)
|
|
|
Twelve Months Ended December 31, |
|
|||||||||
|
|
|
2019 |
|
|
2018 |
|
|
2017 |
|
|||
|
Net sales |
|
$ |
519,704 |
|
|
$ |
354,526 |
|
|
$ |
313,331 |
|
|
Cost of sales |
|
|
460,986 |
|
|
|
303,948 |
|
|
|
278,594 |
|
|
Amortization of intangibles |
|
|
10,706 |
|
|
|
4,096 |
|
|
|
3,756 |
|
|
Profit sharing, bonuses, and deferred compensation |
|
|
25,105 |
|
|
|
8,058 |
|
|
|
5,397 |
|
|
Employee Stock Ownership Plan expense |
|
|
5,453 |
|
|
|
4,000 |
|
|
|
4,000 |
|
|
Other selling, general and administrative expenses |
|
|
25,466 |
|
|
|
12,276 |
|
|
|
12,158 |
|
|
Contingent consideration revaluation |
|
|
(6,054 |
) |
|
|
(21 |
) |
|
|
— |
|
|
Income (loss) from operations |
|
|
(1,958 |
) |
|
|
22,169 |
|
|
|
9,426 |
|
|
Interest expense |
|
|
(6,728 |
) |
|
|
(3,879 |
) |
|
|
(4,180 |
) |
|
Loss on extinguishment of debt |
|
|
(154 |
) |
|
|
(814 |
) |
|
|
— |
|
|
Income (loss) before taxes |
|
|
(8,840 |
) |
|
|
17,476 |
|
|
|
5,246 |
|
|
Income tax benefit |
|
|
(4,088 |
) |
|
|
(459 |
) |
|
|
— |
|
|
Net income (loss) and comprehensive income (loss) |
|
$ |
(4,753 |
) |
|
$ |
17,935 |
|
|
$ |
5,246 |
|
|
Earnings (loss) per share |
|
|
|
|
|
|
|
|
|
|
|
|
|
Net income (loss) available to shareholders |
|
$ |
(4,753 |
) |
|
$ |
17,935 |
|
|
$ |
5,246 |
|
|
Basic and diluted earnings (loss) per share |
|
$ |
(0.27 |
) |
|
$ |
1.29 |
|
|
$ |
0.37 |
|
|
Basic and diluted weighted average shares outstanding |
|
|
17,447,464 |
|
|
|
13,891,301 |
|
|
|
14,341,538 |
|
|
Tax-adjusted pro forma information |
|
|
|
|
|
|
|
|
|
|
|
|
|
Net income (loss) available to shareholders |
|
$ |
(4,753 |
) |
|
$ |
17,935 |
|
|
$ |
5,246 |
|
|
Pro forma provision for income taxes |
|
|
173 |
|
|
|
4,663 |
|
|
|
— |
|
|
Pro forma net income (loss) |
|
$ |
(4,926 |
) |
|
$ |
13,272 |
|
|
$ |
5,246 |
|
|
Pro forma basic and diluted earnings (loss) per share |
|
$ |
(0.28 |
) |
|
$ |
0.96 |
|
|
$ |
0.37 |
|
|
Basic and diluted weighted average shares outstanding |
|
|
17,447,464 |
|
|
|
13,891,301 |
|
|
|
14,341,538 |
|
Weighted average shares give effect to the issuance of a stock dividend of approximately 1,334.34-for-1 related to the IPO, as if the IPO occurred at the beginning of 2018.
Tax adjusted pro forma amounts reflect income tax adjustments as if the Company was a taxable entity as of the beginning of 2018 using a 26% effective tax rate.
The accompanying notes are an integral part of these Consolidated Financial Statements.
42
Mayville Engineering Company, Inc. and Subsidiaries
Consolidated Statements of Cash Flows
(in thousands)
|
|
|
Twelve Months Ended December 31, |
|
|||||||||
|
|
|
2019 |
|
|
2018 |
|
|
2017 |
|
|||
|
CASH FLOWS FROM OPERATING ACTIVITIES |
|
|
|
|
|
|
|
|
|
|
|
|
|
Net income (loss) |
|
$ |
(4,753 |
) |
|
$ |
17,935 |
|
|
$ |
5,246 |
|
|
Adjustments to reconcile net income to net cash used in operating activities: |
|
|
|
|
|
|
|
|
|
|
|
|
|
Depreciation |
|
|
22,296 |
|
|
|
16,372 |
|
|
|
16,975 |
|
|
Amortization |
|
|
10,706 |
|
|
|
4,096 |
|
|
|
3,756 |
|
|
Stock-based compensation expense |
|
|
3,486 |
|
|
|
— |
|
|
|
— |
|
|
Costs recognized on step-up of acquired inventory |
|
|
395 |
|
|
|
583 |
|
|
|
— |
|
|
Contingent consideration revaluation |
|
|
(6,054 |
) |
|
|
(21 |
) |
|
|
— |
|
|
Gain on disposal of property, plant and equipment |
|
|
(62 |
) |
|
|
(177 |
) |
|
|
(23 |
) |
|
Deferred compensation and long-term incentive |
|
|
11,598 |
|
|
|
4,466 |
|
|
|
1,000 |
|
|
Loss (gain) on extinguishment or forgiveness of debt |
|
|
(367 |
) |
|
|
814 |
|
|
|
— |
|
|
Provision for doubtful accounts |
|
|
— |
|
|
|
(48 |
) |
|
|
— |
|
|
Non-cash adjustments |
|
|
(13 |
) |
|
|
218 |
|
|
|
— |
|
|
Changes in operating assets and liabilities – net of effects of acquisition: |
|
|
|
|
|
|
|
|
|
|
|
|
|
Accounts receivable |
|
|
11,853 |
|
|
|
1,042 |
|
|
|
2,570 |
|
|
Inventories |
|
|
8,886 |
|
|
|
(6,873 |
) |
|
|
(2,480 |
) |
|
Tooling in progress |
|
|
729 |
|
|
|
489 |
|
|
|
(481 |
) |
|
Prepaids and other current assets |
|
|
(1,358 |
) |
|
|
(4,425 |
) |
|
|
(106 |
) |
|
Accounts payable |
|
|
(11,010 |
) |
|
|
834 |
|
|
|
2,083 |
|
|
Deferred income taxes |
|
|
(5,992 |
) |
|
|
— |
|
|
|
— |
|
|
Accrued liabilities, excluding long-term incentive |
|
|
(6,938 |
) |
|
|
1,410 |
|
|
|
2,261 |
|
|
Net cash provided by operating activities |
|
|
33,402 |
|
|
|
36,715 |
|
|
|
30,801 |
|
|
CASH FLOWS FROM INVESTING ACTIVITIES |
|
|
|
|
|
|
|
|
|
|
|
|
|
Purchase of property, plant and equipment |
|
|
(25,797 |
) |
|
|
(17,879 |
) |
|
|
(11,259 |
) |
|
Proceeds from sale of property, plant and equipment |
|
|
76 |
|
|
|
10 |
|
|
|
24 |
|
|
Acquisitions, net of cash acquired |
|
|
(2,369 |
) |
|
|
(114,700 |
) |
|
|
— |
|
|
Net cash used in investing activities |
|
|
(28,090 |
) |
|
|
(132,569 |
) |
|
|
(11,235 |
) |
|
CASH FLOWS FROM FINANCING ACTIVITIES |
|
|
|
|
|
|
|
|
|
|
|
|
|
Proceeds from bank revolving credit notes |
|
|
442,154 |
|
|
|
257,428 |
|
|
|
132,473 |
|
|
Payments on bank revolving credit notes |
|
|
(429,211 |
) |
|
|
(228,137 |
) |
|
|
(133,882 |
) |
|
Proceeds from issuance of other long-term debt |
|
|
— |
|
|
|
167,094 |
|
|
|
— |
|
|
Repayments of other long-term debt |
|
|
(120,046 |
) |
|
|
(87,389 |
) |
|
|
(9,099 |
) |
|
Deferred financing costs |
|
|
— |
|
|
|
(2,173 |
) |
|
|
(412 |
) |
|
Proceeds from IPO, net |
|
|
101,763 |
|
|
|
— |
|
|
|
— |
|
|
Purchase of treasury stock |
|
|
(2,591 |
) |
|
|
(7,833 |
) |
|
|
(8,713 |
) |
|
Payments on capital leases |
|
|
(469 |
) |
|
|
(123 |
) |
|
|
— |
|
|
Net cash provided by (used in) financing activities |
|
|
(8,400 |
) |
|
|
98,867 |
|
|
|
(19,633 |
) |
|
Net increase (decrease) in cash and cash equivalents |
|
|
(3,088 |
) |
|
|
3,013 |
|
|
|
(67 |
) |
|
Cash and cash equivalents, beginning of year |
|
|
3,089 |
|
|
|
76 |
|
|
|
143 |
|
|
Cash and cash equivalents, end of year |
|
$ |
1 |
|
|
$ |
3,089 |
|
|
$ |
76 |
|
|
Supplemental disclosure of cash flow information: |
|
|
|
|
|
|
|
|
|
|
|
|
|
Cash paid for interest |
|
$ |
6,629 |
|
|
$ |
4,117 |
|
|
$ |
4,305 |
|
|
In conjunction with the DMP acquisition, fair value of assets acquired and liabilities assumed were as followed: (1) |
|
|
|
|
|
|
|
|
|
|
|
|
|
Fair value of assets acquired, net of cash acquired |
|
$ |
— |
|
|
$ |
167,781 |
|
|
$ |
— |
|
|
Liabilities assumed |
|
|
— |
|
|
|
(53,081 |
) |
|
|
— |
|
|
Cash paid for acquisition, net of cash acquired |
|
$ |
— |
|
|
$ |
114,700 |
|
|
$ |
— |
|
|
Non-cash construction in progress in accounts payable |
|
$ |
2,809 |
|
|
$ |
1,240 |
|
|
$ |
186 |
|
|
(1) |
2019 relate to net working capital true-ups. |
The accompanying notes are an integral part of these Consolidated Financial Statements.
43
Mayville Engineering Company, Inc. and Subsidiaries
Consolidated Statement of Shareholders’ Equity
(in thousands)
|
|
|
Shareholder’s Equity |
|
|||||||||||||
|
|
|
Additional Paid-in-Capital |
|
|
Treasury Shares |
|
|
Retained Earnings |
|
|
Total |
|
||||
|
Balance as of December 31, 2017 |
|
$ |
— |
|
|
$ |
— |
|
|
$ |
— |
|
|
$ |
— |
|
|
Balance as of December 31, 2018 |
|
$ |
— |
|
|
$ |
— |
|
|
$ |
— |
|
|
$ |
— |
|
|
Transfer from Temporary Equity (see Note 19) |
|
|
133,806 |
|
|
|
(57,659 |
) |
|
|
29,698 |
|
|
|
105,845 |
|
|
Share issuance – IPO |
|
|
101,763 |
|
|
|
|
|
|
|
|
|
|
|
101,763 |
|
|
Cancellation of Treasury Stock |
|
|
(55,369 |
) |
|
|
55,369 |
|
|
|
|
|
|
|
— |
|
|
Share repurchases |
|
|
|
|
|
|
(2,592 |
) |
|
|
|
|
|
|
(2,592 |
) |
|
Stock-based compensation |
|
|
3,486 |
|
|
|
|
|
|
|
|
|
|
|
3,486 |
|
|
Net loss post IPO |
|
|
|
|
|
|
|
|
|
|
(7,609 |
) |
|
|
(7,609 |
) |
|
Balance as of December 31, 2019 |
|
$ |
183,687 |
|
|
$ |
(4,882 |
) |
|
$ |
22,089 |
|
|
$ |
200,895 |
|
The accompanying notes are an integral part of these Consolidated Financial Statements.
44
Mayville Engineering Company, Inc. and Subsidiaries
Notes to Consolidated Financial Statements
(in thousands, except share amounts and per share data)
Note 1. Nature of business and summary of significant accounting policies
Mayville Engineering Company, Inc. and subsidiaries (MEC, the Company, we, our, us or similar terms) is a leading U.S.-based value-added manufacturing partner that provides a broad range of prototyping and tooling, production fabrication, coating, assembly and aftermarket components. Our customers operate in diverse end markets, including heavy- and medium-duty commercial vehicle, construction, powersports, agriculture, military and other end markets. Founded in 1945 and headquartered in Mayville, Wisconsin, we are a leading Tier I U.S. supplier of highly engineered components to original equipment manufacturers (OEM) customers with leading positions in their respective markets. The Company operates 20 facilities located in Arkansas, Michigan, Mississippi, Ohio, Pennsylvania, South Carolina, Virginia, and Wisconsin. Our engineering expertise and technical know-how allow us to add value through every product redevelopment cycle (generally every three to five years for our customers).
In December 1985, the Company formed the Mayville Engineering Company, Inc. Employee Stock Ownership Plan (ESOP). The ESOP is a tax qualified retirement plan and is designed to invest primarily in the Company’s common stock which is held in a Trust. From January 2003 until the Company’s initial public offering of its common stock (IPO) in May 2019, the ESOP owned 100% of the Company’s outstanding shares of common stock which have been fully allocated to active or retired eligible employees.
Basis of presentation and consolidation
The accompanying consolidated financial statements have been prepared in accordance with accounting principles generally accepted in the United States of America (GAAP). They include the accounts of the Company and its wholly-owned subsidiaries. All intercompany balances and transactions have been eliminated in consolidation.
Use of estimates
The preparation of consolidated financial statements in conformity with accounting principles generally accepted in the United States of America requires management to make certain estimates and assumptions that affect the reported amounts and disclosures. Accordingly, actual results could differ from those estimates.
Cash and cash equivalents
The Company considers all highly-liquid investments purchased with original maturities of 90 days or less to be cash and cash equivalents.
Concentration of credit risk
Financial instruments that potentially subject the Company to credit risk consist principally of bank balances above the Federal Deposit Insurance Corporation (FDIC) insurability limits of $250 per official custodian. The Company has not experienced any losses on these accounts and management believes the Company is not exposed to any significant credit risk on cash.
Accounts receivable
Accounts receivable are generally uncollateralized customer obligations due under normal trade terms requiring payment within 30 to 60 days from the invoice date. Management periodically reviews past due balances and established an allowance for doubtful accounts of approximately $526 and $801 as of December 31, 2019 and 2018, respectively, for probable uncollectible amounts based on its assessment of the current status of individual accounts. The estimated valuation allowance results in a charge to earnings and the accounts are written-off through a charge to the valuation allowance and a credit to accounts receivable after the Company has used all reasonable collection efforts.
Inventories
Inventories are stated at the lower of cost, determined on the first-in, first-out method (FIFO), and net realizable value. Net realizable value is the estimated selling price in the ordinary course of business, less reasonably predictable costs of completion, disposal and transportation. Work-in-process and finished goods are valued at production cost consisting of material, labor and overhead. The Company maintains a reserve for obsolete and slow-moving inventory which is based upon the aging of current inventory as well as assumptions on future demand and market conditions.
Tooling in progress
The Company has agreements with its customers to provide production tooling which will be used to produce specific parts for its customers. The costs to design, engineer, and manufacture the tooling are charged to tooling in progress as incurred and upon completion are sold to customers. The Company may also provide production tooling that is not sold to customers but is capitalized in property, plant and equipment. To the extent that estimated costs exceed expected reimbursement from the customer, the Company recognizes a loss. Tooling in progress was $1,589 and $2,318 as of December 31, 2019 and 2018, respectively.
45
Property, plant and equipment are stated at cost. Expenditures for additions and improvements are capitalized while replacements, maintenance and repairs which do not improve or extend the lives of the respective assets are expensed as incurred. Properties sold, or otherwise disposed of, are removed from the property accounts, with gains or losses on disposal credited or charged to the results of operations. Depreciation is provided over the estimated useful lives of the respective assets, using the straight-line depreciation method for financial reporting purposes and begins when the asset is placed into service. Depreciation expense for the twelve months ended December 31, 2019, 2018 and 2017 was $22,296, $16,372 and $16,975, respectively, and is included in cost of sales on the consolidated statements of comprehensive income.
Business combinations
The Company accounts for all business combinations in accordance with Financial Accounting Standards Board (FASB) Accounting Standards Codification (ASC) Topic 805, Business Combinations. In connection with a business combination, the acquiring company must allocate the cost of the acquisition to assets acquired and liabilities assumed based on fair values as of the acquisition date. Any excess or shortage of amounts assigned to assets and liabilities over or under the purchase price is recorded as a gain on bargain purchase or goodwill. Transaction costs associated with acquisitions are expensed as incurred within selling, general and administrative expenses.
Goodwill
We test goodwill for impairment annually, or more frequently if triggering events occur indicating that there may be an impairment. We have recorded goodwill and perform testing for potential goodwill impairment at a reporting unit level. A reporting unit is an operating segment, or a business unit one level below an operating segment for which discrete financial information is available, and for which management regularly reviews the operating results. Additionally, components within an operating segment can be aggregated as a single reporting unit if they have similar economic characteristics. We have performed testing on each of our reporting units which contain goodwill.
We determine the fair value of our reporting units using multiple valuation methodologies, relying largely on an income approach but also incorporating value indicators from a market approach. Under the income approach, we calculate the fair value of a reporting unit based on the present value of estimated future cash flows. The income approach is dependent on several key management assumptions, including estimates of future sales, gross margins, operating costs, interest expense, income tax rates, capital expenditures, changes in working capital requirements and the weighted average cost of capital or the discount rate. Discount rate assumptions include an assessment of the risk inherent in the future cash flows of the reporting unit. Expected cash flows used under the income approach are developed in conjunction with our budgeting and forecasting process. Under the market approach, we estimate fair value of the reporting units using EBITDA multiples. The multiples are derived from comparable publicly traded companies with similar operating and investment characteristics as the respective reporting units.
During the fourth fiscal quarters of 2019 and 2018, we performed our annual impairment assessments of goodwill, which did not indicate an impairment existed.
For the twelve months ended December 31, 2018 we had two reporting units, DMP and MEC. The DMP reporting unit was acquired on December 14, 2018 and had preliminarily estimated goodwill of $29.2 million as of December 31, 2018. For the 18-day period from December 14 through December 31, 2018, DMP’s actual results of operations were above estimates utilized to determine the preliminary purchase price allocation. As a result, the fair value of the DMP reporting unit at December 31, 2018 is nominally above its carrying value. At December 31, 2018, the MEC reporting unit had goodwill with a carrying amount of approximately $40.2 million. The fair value of the MEC reporting unit substantially exceeded carrying value for 2018.
For the twelve months ended December 31, 2019, we concluded that the DMP and MEC reporting units were integrated into one reporting unit. At December 31, 2019, the reporting unit had goodwill with a carrying amount of approximately $71.5 million. The fair value of this reporting unit substantially exceeded the carrying value for 2019.
Changes to management assumptions and estimates utilized in the income and market approaches could negatively impact the fair value conclusions for our reporting units resulting in goodwill impairment. All key assumptions and valuations are determined by and are the responsibility of management. The factors used in the impairment analysis are inherently subject to uncertainty. We believe that the estimates and assumptions are reasonable to determine the fair value of our reporting units, however, if actual results are not consistent with these estimates and assumptions, goodwill and other intangible assets may be overstated which could trigger an impairment charge.
Fair Value of Financial Instruments
Financial instruments consist of cash and cash equivalents, accounts receivable, accounts payable and long-term debt. The carrying amount of all significant financial instruments approximates fair value due to either the short maturity or the existence of variable interest rates that approximate prevailing market rates. Cash and cash equivalents, accounts receivable and accounts payable are classified as Level 1 fair value inputs as further described in Note 17. Long-term debt is classified as a Level 1 and Level 2 fair value input.
46
Impairment of long-lived assets
When events or conditions warrant, the Company evaluates the recoverability of long-lived assets and considers whether these assets are impaired. The Company assesses the recoverability of these assets based on several factors, including management’s intention with respect to these assets and their projected undiscounted cash flows. If projected undiscounted cash flows are less than the carrying amount of the respective assets, the Company adjusts the carrying amounts of such assets to their estimated fair value. To the extent that the carrying value of the net assets of a reportable unit is greater than the estimated fair value, the Company may be required to record impairment charges.
Deferred financing costs
Loan issuance costs and discounts are capitalized upon the issuance of long-term debt and amortized over the life of the related debt and are presented as a reduction of the associated long-term debt on the consolidated balance sheets. Loan issuance costs associated with revolving debt arrangements are presented as a component of other assets. Loan issuance costs incurred in connection with revolving debt arrangements are amortized using the straight-line method over the life of the credit agreement. Loan issuance costs and discounts incurred in connection with term debt are amortized using the effective interest method. Amortization of deferred loan issuance costs and discounts are included in interest expense. During 2019, 2018 and 2017 the Company recorded $142, $2,173 and $412, respectively of deferred financing costs associated with its long-term debt and line of credit arrangements. Amortization expense associated with the deferred debt issuance costs and discounts in 2019, 2018 and 2017 was approximately $381, $198 and $249. Accumulated amortization was approximately $474, $114 and $619 as of December 31, 2019, 2018 and 2017, respectively. Amendments made to existing debt in 2019, 2018 and 2017 resulted in the write-offs of $154, $814 and zero, respectively of unamortized costs associated with the debt that was replaced.
Revenue recognition
The Company adopted ASC 606 January 1, 2019, where the Company recognizes revenue for the transfer of goods or services to a customer in an amount that reflects the consideration it expects to receive in exchange for those goods or services. When goods are shipped, the customer takes ownership at shipment, and this is when control transfers. Sales are supported by documentation such as supply agreements and purchase order, which specify certain terms and conditions including product specifications, quantities, fixed prices, delivery dates and payments terms. Revenue related to services is recognized in the period services are performed, thus the Company recognizes revenue at a point in time.
There are many customers where the Company designs, engineers and builds production tooling, which is purchased by the customer. Revenue is recognized when the tooling is completed, the customer signs off the product through the Product Part Approval Process (PPAP) and the tool is placed into service. Revenue related to production tooling is recognized as a point in time when it meets the PPAP criteria.
The Company offers certain customers discounts for early payments. These discounts are recorded against net sales in the consolidated statement of comprehensive income and accounts receivable in the consolidated balance sheet. The Company does not offer any other customer incentives, rebates or allowances.
Shipping and handling
The Company expenses shipping and handling costs as incurred. These costs are generally comprised of salaries and wages, shipping supplies and warehouse costs. These costs are included in cost of sales on the consolidated statements of comprehensive income. The Company does not charge customers nor recognize revenue for shipping and handling. The Company’s OEM customers arrange and pay the freight for delivery.
Advertising
The Company expenses the costs of advertising when incurred. Advertising expense was approximately $110, $116 and $157 for the twelve months ended December 31, 2019, 2018 and 2017, respectively. Advertising costs are charged to selling, general and administrative expenses.
Income Taxes
Income taxes and uncertain tax positions are accounted for in accordance with ASC 740, “Accounting for Income Taxes”. Deferred income taxes are provided for the differences between the bases of assets and liabilities for financial reporting and income tax purposes. The Company measures deferred tax assets and liabilities using enacted tax rates in effect for the years in which the differences are expected to reverse and recognizes the effect of a change in enacted rates in the period of enactment. Tax positions meeting the more-likely-than-not recognition threshold are measured pursuant to the guidance set forth in ASC 740. A valuation allowance is established when necessary to reduce deferred tax assets to the amount expected to be realized. See Note 11 “Income Taxes” of these Notes to Consolidated Financial Statements for further discussion.
Earnings per share
47
The Company computes basic earnings (loss) per share by dividing net income (loss) available to shareholders by the actual weighted average number of common shares outstanding for the reporting period. The Company does not have any potentially dilutive convertible securities. As a result, basic and diluted earnings per share for the Company are the same.
Treasury Stock
Treasury stock purchases are accounted for under the cost method whereby the entire cost of the acquired stock is recorded as treasury stock. Subsequent reissuance of shares to the ESOP are recorded as a reduction to treasury stock and as ESOP expense in the consolidated statement of comprehensive income.
Recent Accounting Pronouncements
In May 2014, FASB issued Accounting Standard Update (ASU) 2014-09, Revenue from Contracts with Customers (ASU 2014-09), and issued subsequent amendments to the initial guidance within ASU 2016-08, Revenue from Contracts with Customers, Principal versus Agent Considerations (ASU 2016-08) issued in March 2016, ASU 2016-10, Revenue from Contracts with Customers, Identifying Performance Obligations and Licensing (ASU 2016-10) issued in April 2016, ASU 2016-12, Revenue from Contracts with Customers, Narrow-Scope Improvements and Practical Expedients (ASU 2016-12) issued in May 2016 and ASU 2016-20, Technical Corrections and Improvements to Topic 606, Revenue from Contracts with Customers (ASU 2016-20) issued in December 2016 (ASU 2014-09, ASU 2016-08, ASU 2016-10, ASU 2016-12 and ASU 2016-20 collectively “Topic 606”). Topic 606 provides a comprehensive revenue recognition model requiring companies to recognize revenue for the transfer of goods or services to a customer in an amount that reflects the consideration it expects to receive in exchange for those goods or services. The guidance also requires additional disclosure about the nature, amount, timing and uncertainty of revenue and cash flows arising from customer contracts. In July 2015, the FASB voted to defer the effective date of ASU 2014-09 by one year, and therefore the standard is effective for the Company's annual and interim periods beginning after December 15, 2019. Effective January 1, 2019, the Company implemented the new standard using a five-step model specified in the guidance using the modified retrospective method. The implementation did not have a material impact on the consolidated financial statements and there was no adjustment to retained earnings from implementation.
In February 2016, the FASB issued ASU 2016-02, Leases, creating Topic 842, which requires lessees to record the assets and liabilities arising from all leases in the statement of financial position. Under ASU 2016-02, lessees will recognize a liability for lease payments and a right-of-use asset. When measuring assets and liabilities, a lessee should include amounts related to option terms, such as the option of extending or terminating the lease or purchasing the underlying asset, that are reasonably certain to be exercised. For leases with a term of 12 months or less, lessees are permitted to make an accounting policy election to not recognize lease assets and liabilities. This guidance retains the distinction between finance leases and operating leases and the classification criteria remains similar to existing guidance. For financing leases, a lessee will recognize the interest on a lease liability separate from amortization of the right-of-use asset. In addition, repayments of principal will be presented within financing activities, and interest payments will be presented within operating activities in the statement of cash flows. For operating leases, a lessee will recognize a single lease cost on a straight-line basis and classify all cash payments within operating activities in the statement of cash flows. For public companies, this guidance will be effective for fiscal years beginning after December 15, 2018, including interim periods within those fiscal years. For as long as the Company remains an EGC, the new guidance is effective for annual reporting periods beginning after December 15, 2020, and interim periods within fiscal years beginning after December 15, 2021. Early adoption is permitted. The Company is evaluating the potential impact of this guidance on the consolidated financial statements.
In June 2016, the FASB issued ASU No. 2016-13, Measurement of Credit Losses on Financial Instruments, which establishes ASC 326, Financial Instruments – Credit Losses. The ASU revises the measurement of credit losses for financial assets measured at amortized cost from an incurred loss methodology to an expected loss methodology. The ASU affects trade receivables, debt securities, net investment in leases, and most other financial assets that represent a right to receive cash. Additional disclosures about significant estimates and credit quality are also required. In November 2018, the FASB issued ASU No. 2018-19, Codification Improvements to Topic 326, Financial Instruments – Credit Losses. This ASU clarifies that receivables from operating leases are accounted for using the lease guidance and not as financial instruments. In May 2019, the FASB issued ASU No. 2019-05, Targeted Transition Relief, which amends ASC 326. This ASU provides an option to irrevocably elect to measure certain individual financial assets at fair value instead of amortized cost. In November 2019, the FASB issued ASU No. 2019-11, Codification Improvements to Topic 326, Financial Instruments – Credit Losses. The ASU clarifies the treatment of expected recoveries for amounts previously written off on purchased receivables, provides transition relief for troubled debt restructuring, and allows for certain disclosure simplifications of accrued interest. For as long as the Company remains and EGC, the new guidance is effective for annual reporting periods beginning after December 15, 2022. The Company is evaluating the potential effects on the consolidated financial statements.
In January 2017, the FASB issued ASU 2017-01, Clarifying the Definition of a Business, which narrows the application of when an integrated set of assets and activities is considered a business and provides a framework to assist entities in evaluating whether both an input and a substantive process are present to be considered a business. It is expected that the new guidance will reduce the number of transactions that would need to be further evaluated and accounted for as a business. For public companies, this guidance is effective for annual reporting periods beginning after December 15, 2017, including interim periods within those fiscal years. For as long as the Company remains an EGC, the new guidance is effective for annual reporting periods beginning after December 15, 2018 and interim periods within annual periods beginning after December 15, 2019. Early adoption is permitted. The Company is evaluating the potential impact of adopting this guidance on the consolidated financial statements.
48
In January 2017, the FASB issued ASU, 2017-04, Simplifying the Test for Goodwill Impairment, which simplifies the subsequent measurement of goodwill by removing the requirement to perform a hypothetical purchase price allocation to compute the implied fair value of goodwill to measure impairment. Instead, any goodwill impairment will equal the amount by which a reporting unit’s carrying value exceeds its fair value, not to exceed the carrying amount of goodwill. Further, the guidance eliminates the requirements for any reporting unit with a zero or negative carrying amount to perform a qualitative assessment and, if it fails that qualitative test, to perform Step 2 of the goodwill impairment test. For public companies, this guidance is effective for annual or any interim goodwill impairment test in annual reporting periods beginning after December 15, 2020. For as long as the Company remains an EGC, the new guidance is effective for any annual or interim goodwill impairment test in annual reporting periods beginning after December 15, 2021. The adoption of this guidance is not expected to have a material impact on the consolidated financial statements.
In August 2018, the FASB issued ASU 2018-13, Fair Value Measurement (Topic 820): Disclosure Framework—Changes to the Disclosure Requirements for Fair Value Measurement (ASU 2018-13) to improve the effectiveness of fair value measurement disclosures. The amendments in this Update modify the disclosure requirements on fair value measurements in Topic 820, Fair Value Measurement based on the concepts in FASB Concept Statement, including the consideration of costs and benefits. The amendments in this Update are effective for fiscal years and interim periods within those fiscal years, beginning after December 15, 2019. Early adoption of this guidance is permitted for removed or modified disclosures upon issuance of this Update while a delayed adoption of the additional disclosures is allowed until the effective date. The Company is evaluating the impact of this standard on its financial statements.
Note 2. IPO
The IPO of shares of the Company’s common stock was completed in May 2019. In connection with the offering, the Company initially sold 6,250,000 shares of common stock at $17 per share generating proceeds of $99,344, net of underwriting discounts and commissions. Additional shares were also sold under an option granted to the underwriters that same month, resulting in a sale of an additional 152,209 shares of common stock at $17 per share, generating additional proceeds of $2,419, net of underwriting discounts and commissions. In conjunction with the IPO, the Company issued a stock dividend specific to pre-IPO shares, of approximately 1,334.34-for-1, resulting in the conversion of 10,075 shares in our Employee Stock Ownership Plan to 13,443,484 shares.
IPO proceeds were used to pay down certain indebtedness.
Note 3. Acquisition
On December 14, 2018, the Company acquired Defiance Metal Products Co. (DMP), a full-service metal fabricator and contract manufacturer with two facilities in Defiance, OH, one in Heber Springs, AR, and one in Bedford, PA.
The Company acquired DMP for $117,068, net of cash received, plus potential contingent consideration of up to $10,000. The Company would have paid DMP’s previous shareholders $7,500 if DMP generated $19,748 of EBITDA, as defined by the stock purchase agreement, over the twelve-month period ended September 30, 2019. In addition, the Company would have paid one dollar for each additional dollar of EBITDA in excess of $19,748 generated over this period; however, in no event would the total have payment exceeded $10,000.
49
The estimated fair values of assets acquired, and liabilities assumed are as follows:
|
|
|
Opening Balance Sheet Allocation |
|
|
|
Cash consideration at acquisition date, net of cash received |
|
$ |
114,700 |
|
|
Cash consideration for net working capital adjustment |
|
|
2,368 |
|
|
Contingent consideration fair value as of acquisition date |
|
|
6,076 |
|
|
Total purchase price |
|
$ |
123,144 |
|
|
Accounts receivable, net |
|
$ |
26,927 |
|
|
Tooling in progress |
|
|
1,318 |
|
|
Inventory, net |
|
|
13,237 |
|
|
Property, plant and equipment, net |
|
|
30,017 |
|
|
Other assets, net of cash |
|
|
416 |
|
|
Intangible assets |
|
|
|
|
|
Trade name |
|
|
14,780 |
|
|
Customer relationships |
|
|
44,550 |
|
|
Non-compete |
|
|
8,800 |
|
|
Goodwill |
|
|
31,333 |
|
|
Total assets acquired |
|
|
171,378 |
|
|
Deferred income taxes |
|
|
20,221 |
|
|
Other liabilities |
|
|
28,014 |
|
|
Net assets acquired |
|
$ |
123,144 |
|
The aggregate purchase price has been allocated to the assets acquired and liabilities assumed based on their fair values as of the acquisition date. The excess purchase price over the estimated fair value of net tangible assets acquired was allocated to identifiable intangible assets and goodwill. The Company engaged a reputable independent third party to assist with the identification and valuation of the intangible assets. Management made significant estimates and assumptions when determining the fair value of assets acquired and liabilities assumed. These estimates include, but are not limited to, discount rates, projected future net sales, projected future expected cash flows, useful lives, attrition rates, royalty rates, and growth rates. These measures are based on significant Level 3 inputs (see Note 17) not observable in the market.
In connection with the DMP acquisition, inventory was valued at its estimated fair value which is defined as expected sales price less costs to sell. The valuation resulted in an inventory fair value step-up of $978. This amount was amortized based on inventory turns, with the amortization resulting in a reduction of inventory and an expense reflected in cost of sales on the Consolidated Statement of Comprehensive Income (Loss). The Company amortized $395 and $583 of the inventory fair value step-up during the twelve months ended and December 31, 2019 and 2018 respectively.
The Company recorded $14,780 of trade name intangible assets with an estimated useful life of 10 years, $44,550 of customer relationship intangible assets with an estimated useful life of 12 years, and $8,800 of non-compete agreements with an estimated useful life of 5 years. These intangibles are amortized on a straight-line basis. The Company believes that the estimated useful lives and the straight-line amortization methodology most appropriately reflect when and how the Company expects to benefit from the identifiable intangible assets. Amortization expense related to these intangible assets is reflected in amortization of intangible expenses on the Consolidated Statement of Comprehensive Income (Loss).
The Company also estimated and recorded the fair value of the contingent consideration payable to be $6,076 as of the acquisition date. The Company remeasured this liability utilizing a Monte Carlo valuation model through the conclusion of the earnout period, September 30, 2019, with the change in value resulting in income or expense and reflected in the Contingent Consideration Revaluation line item on the Consolidated Statement of Comprehensive Income (Loss). The primary inputs utilized in the Monte Carlo valuation model include actual and projected EBITDA along with a discount rate. Contingent consideration payable was revalued to $0, $9,598, $6,924, and $6,054 as of September 30, 2019, June 30, 2019, March 31, 2019 and December 31, 2018, respectively. The change between these balances resulted in (income)/expense of ($9,598), $2,674, $869, and ($21) for the three months ended September 30, 2019, June 30, 2019, March 31, 2019, and the twelve months ended December 31, 2018, respectively.
Based on our calculations as of September 30, 2019, and as agreed to by DMP’s former shareholders, DMP’s EBITDA fell short of the $19,748 contingent consideration threshold. As a result, and in accordance with GAAP, the contingent consideration balance of $9,598 was reduced to zero resulting in an adjustment of $6,054 reflected in the Contingent Consideration Revaluation line item on the Consolidated Statements of Comprehensive Income (Loss) for the twelve months ended December 31, 2019.
50
The purchase price of DMP exceeded the preliminary estimated fair value of identifiable net assets and accordingly, the difference was allocated to goodwill, which is not tax deductible.
The Company believes that the information gathered to date provides a reasonable basis for estimating the fair values of assets acquired and liabilities assumed.
As of December 31, 2019, the Company has finalized the estimates of assets and acquired liabilities assumed. Since its preliminary estimates, the Company adjusted the fair value on the opening balance sheet by increasing/(decreasing) accounts receivable by $27, inventory by $1,508, property plant and equipment by ($36), deferred income taxes by $1,097 and other liabilities by $31. In addition, the Company finalized the net working capital adjustment during the three month period ended June 30, 2019 resulting in an additional payout of $2,368 by the Company to the seller, bringing the Company’s acquisition of DMP to $117,068 in total cash paid, net of cash acquired. The offsetting entries of these adjustments was to goodwill.
The DMP acquired entities accounted for $193,420 of net sales and $10,903 of net income for the twelve months ended December 31, 2019. Net income includes the contingent consideration fair value adjustments previously discussed.
Pro Forma Financial Information (Unaudited): In accordance with ASC 805, the following unaudited pro forma combined results of operations have been prepared and presented to give effect to the DMP acquisition as if it had occurred on January 1, 2018, the beginning of the comparable period, applying certain assumptions and proforma adjustments. These proforma adjustments primarily relate to the depreciation expense on stepped-up fixed assets, amortization of identifiable intangible assets, costs of goods sold expense on the sale of stepped inventory, interest expense related to additional debt needed to fund the acquisition, and the tax impact of these adjustments. The unaudited pro forma consolidated results are provided for illustrative purposes only and are not indicative of the Company’s actual consolidated results of operations or consolidated financial position.
The unaudited pro forma results of operations do not reflect any operating efficiencies or potential cost savings which may result from the acquisition.
The unaudited pro forma net income of $17,151 is $914 lower than the amount previously reported for the same pro forma period. The previously disclosed pro forma schedules were prepared in accordance with ASC 805 as if the DMP acquisition had occurred on January 1, 2017, the beginning of the first comparable period included in that filing. The difference in these assumed acquisition dates resulted in $914 of net expense being recorded in the proforma financials that were reflected in the previously disclosed 2017 proforma financials. The $914 is comprised of $978 of inventory fair value step-up amortization and $257 of loss on debt extinguishment offset by $260 of tax benefit of these items based on an assumed tax rate of 26%.
|
|
|
Twelve Months Ended December 31, 2018 |
|
|
|
Net sales |
|
$ |
523,721 |
|
|
Net income |
|
|
17,151 |
|
Note 4. Select balance sheet data
Inventory
Inventories as of December 31, 2019 and December 31, 2018 consist of:
|
|
|
December 31, 2019 |
|
|
December 31, 2018 |
|
||
|
Finished goods and purchased parts |
|
$ |
28,664 |
|
|
$ |
32,589 |
|
|
Raw materials |
|
|
10,834 |
|
|
|
12,329 |
|
|
Work-in-process |
|
|
6,194 |
|
|
|
8,487 |
|
|
Total |
|
$ |
45,692 |
|
|
$ |
53,405 |
|
The change in inventory from $53,405 as of December 31, 2018 to $45,692 as of December 31, 2019 includes a $395 reduction related to the amortization of the DMP inventory fair value step-up.
51
Property, plant and equipment as of December 31, 2019 and December 31, 2018 consist of:
|
|
|
Useful Lives Years* |
|
December 31, 2019 |
|
|
December 31, 2018 |
|
||
|
Land |
|
Indefinite |
|
$ |
1,264 |
|
|
$ |
1,264 |
|
|
Land improvements |
|
15-39 |
|
|
3,169 |
|
|
|
3,169 |
|
|
Building and building improvements |
|
15-39 |
|
|
58,021 |
|
|
|
55,269 |
|
|
Machinery, equipment and tooling |
|
3-10 |
|
|
204,248 |
|
|
|
182,045 |
|
|
Vehicles |
|
5 |
|
|
3,738 |
|
|
|
3,613 |
|
|
Office furniture and fixtures |
|
3-7 |
|
|
15,469 |
|
|
|
14,253 |
|
|
Construction in progress |
|
N/A |
|
|
3,154 |
|
|
|
6,786 |
|
|
Total property, plant and equipment, gross |
|
|
|
|
289,063 |
|
|
|
266,399 |
|
|
Less accumulated depreciation |
|
|
|
|
164,000 |
|
|
|
142,516 |
|
|
Total property, plant and equipment, net |
|
|
|
$ |
125,063 |
|
|
$ |
123,883 |
|
Goodwill
Changes in goodwill between December 31, 2018 and December 31, 2019 consist of:
|
Balance as of December 31, 2018 |
|
$ |
69,437 |
|
|
DMP purchase accounting adjustments, net |
|
|
(270 |
) |
|
DMP net working capital true-up |
|
|
2,368 |
|
|
Balance as of December 31, 2019 |
|
$ |
71,535 |
|
Intangible Assets
The following is a listing of intangible assets, the useful lives in years (amortization period) and accumulated amortization as of December 31, 2019 and December 31, 2018:
|
|
|
Useful Lives Years |
|
December 31, 2019 |
|
|
December 31, 2018 |
|
||
|
Amortizable intangible assets: |
|
|
|
|
|
|
|
|
|
|
|
Customer relationships and contracts |
|
9-12 |
|
$ |
78,340 |
|
|
$ |
78,340 |
|
|
Trade name |
|
10 |
|
|
14,780 |
|
|
|
14,780 |
|
|
Non-compete agreements |
|
5 |
|
|
8,800 |
|
|
|
8,800 |
|
|
Patents |
|
19 |
|
|
24 |
|
|
|
24 |
|
|
Accumulated amortization |
|
|
|
|
(33,582 |
) |
|
|
(22,876 |
) |
|
Total amortizable intangible assets, net |
|
|
|
|
68,362 |
|
|
|
79,068 |
|
|
Non-amortizable brand name |
|
|
|
|
3,811 |
|
|
|
3,811 |
|
|
Total intangible assets, net |
|
|
|
$ |
72,173 |
|
|
$ |
82,879 |
|
Non-amortizable brand name is tested annually for impairment.
Changes in intangible assets between December 31, 2018 and December 31, 2019 consist of:
|
Balance as of December 31, 2018 |
|
$ |
82,879 |
|
|
Amortization expense |
|
|
(10,706 |
) |
|
Balance as of December 31, 2019 |
|
$ |
72,173 |
|
52
Amortization expense was $10,706, $4,096 and $3,756 for the twelve months ended December 31, 2019, 2018 and 2017 respectively.
Future amortization expense is expected to be $10,706, $10,706, $6,952, $6,865 and $5,192 for the twelve months ended December 31, 2020, 2021, 2022, 2023 and 2024, respectively.
Note 5. Bank revolving credit notes
On September 26, 2019, and as last amended as of December 31, 2019, we entered into an amended and restated credit agreement (A&R Credit Agreement) with certain lenders and Wells Fargo Bank, National Association, as administrative agent (the Agent). The A&R Credit Agreement provides for $200,000 revolving credit facility (the Revolving Loan), with a letter of credit sub-facility in an aggregate amount not to exceed $5,000, and a swingline facility in an aggregate amount of $20,000. The A&R Credit Agreement also provides for an additional $100,000 of capacity through an accordion feature. All amounts borrowed under the A&R Credit Agreement mature on September 26, 2024.
The A&R Credit Agreement contains usual and customary negative covenants for agreements of this type, including, but not limited to, restrictions on our ability to, subject to certain exceptions, create, incur or assume indebtedness, create or incur liens, make certain investments, merge or consolidate with another entity, make certain asset dispositions, pay dividends or other distributions to shareholders, enter into transactions with affiliates, enter into sale leaseback transactions or make capital expenditures. The A&R Credit Agreement also requires us to satisfy certain financial covenants, including a minimum interest coverage ratio of 3.00 to 1.00. At December 31, 2019, our interest coverage ratio was 7.42 to 1.00. The A&R Credit Agreement also requires us to maintain a consolidated total leverage ratio not to exceed 3.25 to 1.00, although such leverage ratio can be increased in connection with certain acquisitions. At December 31, 2019, our consolidated total leverage ratio was 1.39 to 1.00.
Prior to September 26, 2019, the Company maintained a credit agreement providing for $90,000 borrowing capacity through a revolving credit note.
Under both agreements, interest is payable monthly at the adjusted London Interbank Offered Rate plus an applicable margin based on the current funded indebtedness to adjusted EBITDA ratio. The interest rate was 3.25% and 4.69% as of December 31, 2019 and December 31, 2018, respectively. Additionally, both agreements have a fee on the average daily unused portion of the aggregate unused revolving commitments. This fee was 0.20% as of December 31, 2019 and December 31, 2018.
The Company was in compliance with all financial covenants of its credit agreements as of December 31, 2019 and December 31, 2018. The amount borrowed on the revolving credit notes was $72,572 and $59,629 as of December 31, 2019 and December 31, 2018, respectively.
Note 6. Other long-term debt
Prior to September 26, 2019, the Company maintained a facility financing package with borrowings of $95,000 and a maturity date of December 14, 2023 and a strategic capital loan with borrowings of $25,000 and a maturity date of June 14, 2024. As of September 26, 2019, all long-term debt was paid off in connection with entering into the A&R Credit Agreement.
Government loan balances include forgiveness clauses based upon capital spending and headcount increases at the noted manufacturing locations.
As previously disclosed, the Company completed its IPO in May 2019. Proceeds from the IPO were used to pay down debt including $43,000 pay down of the prior Term A loan and $25,000 pay-off of the prior strategic capital loan.
In June 2019, the Company received written notification that the $521 balance remaining of the Smyth County, Virginia loan was forgiven. Due to the nature of the requirements to obtain forgiveness, the gain associated with the forgiveness is reflected in cost of sales on the Consolidated Statement of Comprehensive Income (Loss).
On September 26, 2019, the Company entered into the A&R Credit Agreement resulting in the payoff of the real estate term loan and the Term A loan through the A&R Credit Agreement.
In December 2019, the Company paid off the Wisconsin Economic Development Corporate loan.
53
Other long-term debt as of December 31, 2019 and December 31, 2018 consisted of the following:
|
|
|
December 31, 2019 |
|
|
December 31, 2018 |
|
||||||||
|
|
|
Interest Rate |
|
Balance |
|
|
Interest Rate |
|
|
Balance |
|
|||
|
Term A loans – 2018 financing package |
|
N/A |
|
$ |
— |
|
|
|
4.69 |
% |
|
$ |
69,000 |
|
|
Real estate term loan – 2018 financing package |
|
N/A |
|
|
— |
|
|
|
4.69 |
% |
|
|
26,000 |
|
|
Strategic capital loan |
|
N/A |
|
|
— |
|
|
|
11.78 |
% |
|
|
25,000 |
|
|
Wisconsin Economic Development Corporate (Neillsville) |
|
N/A |
|
|
— |
|
|
|
2.00 |
% |
|
|
406 |
|
|
Smyth County, Virginia |
|
N/A |
|
|
— |
|
|
|
0.00 |
% |
|
|
700 |
|
|
Total principal outstanding |
|
|
|
|
— |
|
|
|
|
|
|
|
121,106 |
|
|
Less: Unamortized debt issuance costs |
|
|
|
|
— |
|
|
|
|
|
|
|
(825 |
) |
|
Less: Current maturities |
|
|
|
|
— |
|
|
|
|
|
|
|
(8,606 |
) |
|
Long-term debt, less current maturities, net |
|
|
|
$ |
— |
|
|
|
|
|
|
$ |
111,675 |
|
The Company was in compliance with all financial covenants of its long-term debt agreements as of December 31, 2019.
Note 7. Capital lease obligation
Capital leases consist of equipment with a capitalized cost of $3,825 and accumulated depreciation of $598 at December 31, 2019. Depreciation of $503 was recognized on the capital lease assets during the twelve months ended December 31, 2019. Non-cash capital lease transactions amounted to $1,776, $2,051 and zero, for the twelve months ended December 31, 2019, 2018 and 2017, respectively. Future minimum lease payments required under the lease are as follows:
|
Year ending December 31, |
|
|
|
|
|
2020 |
|
$ |
734 |
|
|
2021 |
|
|
734 |
|
|
2022 |
|
|
734 |
|
|
2023 |
|
|
734 |
|
|
2024 |
|
|
514 |
|
|
Thereafter |
|
|
226 |
|
|
Total |
|
|
3,676 |
|
|
Less payment amount allocated to interest |
|
|
392 |
|
|
Present value of capital lease obligation |
|
$ |
3,285 |
|
|
Current portion of capital lease obligation |
|
|
598 |
|
|
Long-term portion of capital lease obligation |
|
|
2,687 |
|
|
Total capital lease obligation |
|
$ |
3,285 |
|
Note 8. Operating lease obligation
Operating leases relate to property, plant and equipment. Future minimum lease payments required under the lease are as follows:
|
Year ending December 31, |
|
|
|
|
|
2020 |
|
$ |
3,402 |
|
|
2021 |
|
|
2,725 |
|
|
2022 |
|
|
1,923 |
|
|
2023 |
|
|
1,792 |
|
|
2024 |
|
|
830 |
|
|
Thereafter |
|
|
2,094 |
|
|
Total |
|
$ |
12,766 |
|
54
The Company leases certain office space, warehousing facilities, equipment and vehicles under operating lease arrangements with third-party lessors. These lease arrangements expire at various times through December 2028. Total rent expense under the arrangements was approximately $4,801, $2,052 and $1,856 for the twelve months ended December 31, 2019, 2018, and 2017, respectively.
Note 9. Employee stock ownership plan
Under the ESOP, the Company makes annual contributions to the trust for the benefit of eligible employees in the form of cash or shares of the Company. The annual contribution is discretionary except that it must be at least 3% of the compensation for all safe harbor participants for the plan year. For the twelve months ended December 31, 2019, 2018 and 2017, the Company’s ESOP expense amounted to $5,453, $4,000 and $4,000, respectively.
At various times following death, disability, retirement or termination of employment, an ESOP participant is entitled to receive their ESOP account balance in accordance with various distribution methods as permitted under the policies adopted by the ESOP. Prior to the IPO, all distributions were paid to participants in cash.
During the twelve months ended December 31, 2019 the ESOP did not acquire any shares from withdrawing participants.
As of December 31, 2019, and December 31, 2018, the ESOP shares consisted of 11,790,113 and 13,443,484 in allocated shares, respectively after giving effect to the issuance of a stock dividend of approximately 1,334.34-for-1 related to the Company’s May 2019 IPO. Prior to its IPO, the Company was obligated to repurchase shares in the trust that were not distributed to ESOP participants as determined by the ESOP trustees, and thus the shares were mandatorily redeemable. Based on the mandatory redemption of these shares, they represented temporary equity on the consolidated balance sheets for periods prior to the IPO. The total estimated fair value of all allocated shares subject to this repurchase obligation approximated $133,806 as of December 31, 2018. The estimated fair value as of December 31, 2018 was based on the most recent available appraisals of the common stock which was approximately $9.95 per share after giving effect to the issuance of a stock dividend of approximately 1,334.34-for-1 related to the Company’s May 2019 IPO. Subsequent to the IPO, ESOP shares are sold in the public market.
Note 10. Retirement plans
The Company established the Mayville Engineering Company, Inc. 401(k) Plan (the 401(k) Plan) covering substantially all employees meeting certain eligibility requirements. The 401(k) Plan is a defined contribution plan and is intended for eligible employees to defer tax-free contributions to save for retirement. Employees may contribute up to 50% of their eligible compensation plan to the 401(k) Plan, subject to the limits of Section 401(k) of the Internal Revenue Code.
The 401(k) Plan also provides for employer discretionary profit sharing contributions and the Board of Directors authorized discretionary profit sharing contributions of zero, $696 and $671 for the twelve months ended December 31, 2019, 2018 and 2017, respectively, that are funded in the subsequent years.
Note 11. Income taxes
Income taxes are included in the consolidated statements of income at December 31, 2019 and 2018 as below:
|
(in thousands) |
|
December 31, 2019 |
|
|
December 31, 2018 |
|
||
|
Current income tax expense (benefit) |
|
|
|
|
|
|
|
|
|
U.S Federal |
|
$ |
401 |
|
|
$ |
(126 |
) |
|
State |
|
|
1,544 |
|
|
|
614 |
|
|
Total |
|
|
1,945 |
|
|
|
488 |
|
|
Deferred income tax benefit |
|
|
|
|
|
|
|
|
|
U.S Federal |
|
|
(4,197 |
) |
|
|
(793 |
) |
|
State |
|
|
(1,836 |
) |
|
|
(154 |
) |
|
Total |
|
|
(6,033 |
) |
|
|
(947 |
) |
|
Total income tax benefit |
|
$ |
(4,088 |
) |
|
$ |
(459 |
) |
A reconciliation of the statutory federal income tax expense to the income tax expense from continuing operations provided at December 31, 2019 and 2018, is as follows:
55
|
|
December 31, 2019 |
|
|
December 31, 2018 |
|
|||
|
Income tax expense at the federal statutory rate - 21% |
|
$ |
(1,854 |
) |
|
$ |
(388 |
) |
|
State and local income taxes - net of federal income tax benefits |
|
|
(58 |
) |
|
|
(61 |
) |
|
Compensation deduction limitation - section 162(m) adjustment |
|
|
357 |
|
|
|
— |
|
|
Income taxed by shareholder before IPO |
|
|
(867 |
) |
|
|
— |
|
|
Other - perms |
|
|
77 |
|
|
|
171 |
|
|
Transaction Costs |
|
|
607 |
|
|
|
— |
|
|
Change in tax status |
|
|
(2,355 |
) |
|
|
— |
|
|
Tax credits generated |
|
|
(254 |
) |
|
|
— |
|
|
Other misc. tax |
|
|
259 |
|
|
|
(181 |
) |
|
Total income tax benefit |
|
$ |
(4,088 |
) |
|
$ |
(459 |
) |
|
Effective tax rate |
|
|
47.5 |
% |
|
|
-2.5 |
% |
The Company’s legacy business converted to a C Corporation on May 9, 2019. Previous to this date, the legacy business was an S Corporation where the tax burden was born by the shareholders, therefore income tax expense for December 31, 2017 was zero.
The tax effects of temporary differences that give rise to significant portions of the deferred income tax assets and liabilities are presented below:
|
(in thousands) |
|
December 31, 2019 |
|
|
December 31, 2018 |
|
||
|
Deferred tax assets: |
|
|
|
|
|
|
|
|
|
Deferred compensation |
|
$ |
8,645 |
|
|
$ |
226 |
|
|
Inventory adjustments |
|
|
1,837 |
|
|
|
— |
|
|
Accrued expenses |
|
|
211 |
|
|
|
— |
|
|
Credits |
|
|
279 |
|
|
|
— |
|
|
Net operating loss |
|
|
3,120 |
|
|
|
949 |
|
|
Other |
|
|
— |
|
|
|
288 |
|
|
Total deferred tax assets |
|
|
14,092 |
|
|
|
1,464 |
|
|
Deferred tax liabilities: |
|
|
|
|
|
|
|
|
|
Property, plant and equipment |
|
|
8,354 |
|
|
|
4,379 |
|
|
Intangibles |
|
|
19,305 |
|
|
|
16,034 |
|
|
Inventory adjustment |
|
|
— |
|
|
|
175 |
|
|
Other |
|
|
622 |
|
|
|
— |
|
|
Total deferred tax liabilities |
|
|
28,281 |
|
|
|
20,587 |
|
|
Valuation allowance |
|
|
— |
|
|
|
— |
|
|
Net deferred tax liability |
|
$ |
(14,188 |
) |
|
$ |
(19,123 |
) |
Consolidated federal NOL’s are $13,827 and do not expire. In addition, consolidated state NOL’s commence expire as follows:
|
(in thousands) |
|
Amount |
|
|
Expire Commencing |
|
||
|
Illinois |
|
$ |
2,141 |
|
|
|
2039 |
|
Uncertain Tax Positions
Based on the Company’s evaluation, it has been concluded that there are no significant uncertain tax positions requiring recognition in the Company’s financial statements as of December 31, 2019. The Company does not anticipate that there will be a material change in the balance of the unrecognized tax benefits in the next twelve months. Any interest and penalties related to uncertain tax positions are recorded in income tax expense. There were no amounts recorded as tax expense for interest and penalties for the year ended December 31, 2019.
The Company files income tax returns in the United States federal jurisdiction and in various state and local jurisdictions. Federal tax returns for tax years beginning January 1, 2016, and state tax returns beginning January 1, 2015, are open for examination.
Note 12. Contingencies
From time to time, the Company may be involved in various claims and lawsuits, both for and against the Company, arising in the normal course of business. Although the results of litigation and claims cannot be predicted with certainty, in management’s
56
opinion, either the likelihood of loss is remote, or any reasonably possible loss associated with the resolution of such proceedings is not expected to have a material adverse impact on the consolidated financial statements.
Note 13. Deferred compensation
The Mayville Engineering Deferred Compensation Plan is available for certain employees designated to be eligible to participate by the Company and approved by the Board of Directors. Eligible employees may elect to defer a portion of his or her compensation for any plan year and the deferral cannot exceed 50% of the participant’s base salary and may include the participant’s annual short-term cash incentive up to 100%. The participant’s election must be made prior to the first day of the plan year.
An employer contribution will be made for each participant to reflect the amount of any reduced allocations to the ESOP and/or 401(k) employer contributions due solely to the participant’s deferral amounts, as applicable. In addition, a discretionary amount may be awarded to a participant by the Company.
Prior to the IPO, all deferrals were deemed to have been invested in the Company stock at a price equal to the share value on the date of deferral and the value of the account increased or decreased with the change in the value of the stock. Individual accounts are maintained for each participant. Each participant’s account is credited with the participant’s deferred compensation, the Company’s contributions, and investment income or loss, reduced for charges, if any.
For the period subsequent to the IPO, deferrals are invested in an investment vehicle based on the options made available to the participant (which does not include Company stock).
The deferred compensation plan provides benefits payable upon separation of service or death. Payments are to be made 30 days after date of separation from service, either in a lump-sum payment or up to five annual installments as elected by the participant when the participant first elects to defer compensation.
The deferred compensation plan is non-funded, and all future contributions are unsecured in that the employees have the status of a general unsecured creditor of the Company and the agreements constitute a promise by the Company to make benefit payments in the future. During the twelve months ended December 31, 2019, 2018 and 2017, eligible employees elected to defer compensation of $1,269, $856 and $292, respectively. As of December 31, 2019, and December 31, 2018, the total amount accrued for all benefit years under this plan was $24,949 and $13,351, respectively, which is included within the deferred compensation and long-term incentive on the Consolidated Balance Sheets. These amounts include the initial deferral of compensation as adjusted for (a) subsequent changes in the share value of the Company stock pursuant to the IPO or (b) following the IPO in the investment options chosen by the participants. Total expense for the deferred compensation plan for the twelve months ended December 31, 2019, 2018 and 2017 amounted to $10,476, $1,647 and $1,133, respectively. These expenses are included in profit sharing, bonuses and deferred compensation on the Consolidated Statements of Comprehensive Income (Loss).
Note 14. Long-Term incentive plan
Prior to the IPO, the Company’s long-term incentive plan (LTIP) was available for any employee who had been designated to be eligible to participate by the Compensation Committee of the Board of Directors. Annually, the LTIP provided for long-term cash incentive awards to eligible participants based on the Company’s performance over a three-year performance period.
The LTIP was non-funded and each participant in the plan was considered a general unsecured creditor of the Company and each agreement constituted a promise by the Company to make benefit payments if the future conditions were met, or if discretion is exercised in favor of a benefit payment.
The qualifying conditions for each award granted under the plan included a minimum increase in the aggregate fair value of the Company of 12% during the three-year performance period and the eligible participants must have been employed by the Company on the date of the cash payment or have retired after attaining age 65, died or become disabled during the period from the beginning of the performance period to the date of payment. If the qualifying conditions were not attained, discretionary payments were made, up to a maximum amount specified in each award agreement. Discretionary payments were determined by the Compensation Committee of the Board of Directors (for payment to the Chief Executive Officer of the Company) and by the Chief Executive Officer (for payments to other participants in the plan).
If a participant was not employed throughout the performance period due to retirement, death or disability, their maximum benefit was prorated based on the number of days employed by the Company during the performance periods.
The total amount accrued for all grant years under this plan was $1,846 at December 31, 2018. This amount is included within profit sharing and bonus on the Consolidated Balance Sheets. Total expense for the long-term incentive plan for the twelve months ended December 31, 2019, 2018 and 2017 amounted to $10,000, $1,712 and $134, respectively. These expenses are included in profit sharing, bonuses and deferred compensation on the Consolidated Statements of Comprehensive Income (Loss). The LTIP was
57
terminated May 2019 in conjunction with the IPO, resulting in a payout approximating the accrued balance at December 31, 2018, and the expense incurred during 2019.
Note 15. Self-Funded insurance
The Company is self-funded for the medical benefits provided to its employees and their dependents. Healthcare costs are expensed as incurred and are based upon actual claims paid, reinsurance premiums, administration fees, and estimated unpaid claims. The Company purchases reinsurance to limit the annual risk associated with their multiple medical plans. Under one plan, the Company purchases reinsurance to limit the annual risk per participant to $225 with no aggregate stop loss. Under another plan, the Company purchases reinsurance to limit the annual risk per participant to $200 and to limit the annual aggregate risk related to this contract which was approximately $19,208, $17,726 and $16,176 for the twelve months ended December 31, 2019, 2018 and 2017, respectively. An estimated accrued liability of approximately $1,316 and $1,730 was recorded as of December 31, 2019 and December 31, 2018, respectively, for estimated unpaid claims and is included within other current liabilities on the Consolidated Balance Sheets.
Note 16. Segments
The Company applies the provisions of ASC Topic 280, Segment Reporting. An operating segment is defined as a component that engages in business activities whose operating results are reviewed by the chief operating decision maker (CODM) and for which discrete financial information is available. Based on the provisions of ASC 280, the Company has determined it has one operating segment.
The Company does not earn revenues or have long-lived asset located in foreign countries. In accordance with the enterprise-wide disclosure requirements of ASC 280, the Company’s net sales from external customers by main product lines are as follows:
|
|
|
Twelve Months Ended December 31, |
|
|||||||||
|
|
|
2019 |
|
|
2018 |
|
|
2017 |
|
|||
|
Outdoor sports |
|
$ |
7,181 |
|
|
$ |
6,862 |
|
|
$ |
7,896 |
|
|
Fabrication |
|
|
334,340 |
|
|
|
147,099 |
|
|
|
129,387 |
|
|
Performance structures |
|
|
71,881 |
|
|
|
84,231 |
|
|
|
87,742 |
|
|
Tube |
|
|
71,108 |
|
|
|
80,715 |
|
|
|
65,440 |
|
|
Tank |
|
|
40,033 |
|
|
|
39,641 |
|
|
|
27,359 |
|
|
Total |
|
|
524,544 |
|
|
|
358,550 |
|
|
|
317,824 |
|
|
Intercompany sales elimination |
|
|
(4,839 |
) |
|
|
(4,024 |
) |
|
|
(4,493 |
) |
|
Total, net sales |
|
$ |
519,704 |
|
|
$ |
354,526 |
|
|
$ |
313,331 |
|
|
|
|
|
|
|
|
|
|
|
|
|
|
|
Note 17. Fair value of financial instruments
Fair value provides information on what the Company may realize if certain assets were sold or might pay to transfer certain liabilities based upon an exit price. Financial assets and liabilities that are measured and reported at fair value are classified into a three-level hierarchy that prioritizes the inputs used in the valuation process. A financial instrument’s categorization within the valuation hierarchy is based on the lowest level of any input that is significant to the fair value measurement. The hierarchy is based on the observability and objectivity of the pricing inputs, as follows:
|
|
• |
Level 1 – Quoted prices in active markets for identical assets or liabilities. |
|
|
• |
Level 2 – Significant directly observable data (other than Level 1 quoted prices) or significant indirectly observable data through corroboration with observable market data. Inputs would normally be (i) quoted prices in active markets for similar assets or liabilities, (ii) quoted prices in inactive markets for identical or similar assets or liabilities or (iii) information derived from or corroborated by observable market data. Long term debt is classified as a Level 2 fair value input. |
|
|
• |
Level 3 – Prices or valuation techniques that require significant unobservable data inputs. These inputs would normally be the Company’s own data and judgements about assumptions that market participants would use in pricing the asset or liability. |
58
The following table lists the Company’s financial assets and liabilities accounted for at fair value by the fair value hierarchy:
|
|
|
|
|
|
|
Fair Value Measurements at Report Date Using |
|
|||||||||
|
|
|
Balance at December 31, 2019 |
|
|
(Level 1) |
|
|
(Level 2) |
|
|
(Level 3) |
|
||||
|
Deferred compensation |
|
$ |
24,949 |
|
|
$ |
2,470 |
|
|
$ |
22,479 |
|
|
$ |
— |
|
|
Total |
|
$ |
24,949 |
|
|
$ |
2,470 |
|
|
$ |
22,479 |
|
|
$ |
— |
|
|
|
|
|
|
|
|
Fair Value Measurements at Report Date Using |
|
|||||||||
|
|
|
Balance at December 31, 2018 |
|
|
(Level 1) |
|
|
(Level 2) |
|
|
(Level 3) |
|
||||
|
Deferred compensation |
|
$ |
13,351 |
|
|
$ |
— |
|
|
$ |
— |
|
|
$ |
13,351 |
|
|
Contingent consideration payable |
|
|
6,054 |
|
|
|
— |
|
|
|
— |
|
|
|
6,054 |
|
|
Total |
|
$ |
19,405 |
|
|
$ |
— |
|
|
$ |
— |
|
|
$ |
19,405 |
|
Changes in liabilities measured at fair value on a recurring basis using significant unobservable inputs (Level 3) between December 31, 2018 and December 31, 2019 consist of:
|
Balance as of December 31, 2018 |
|
$ |
19,405 |
|
|
Contingent consideration revaluation |
|
|
(6,054 |
) |
|
Deferred compensation adjustments |
|
|
11,673 |
|
|
Payments |
|
|
(75 |
) |
|
Transfer to level 1 and level 2 investments |
|
|
(24,949 |
) |
|
Balance as of December 31, 2019 |
|
$ |
— |
|
Fair value measurements for the Company’s cash and cash equivalents are classified based upon Level 1 measurements because such measurements are based upon quoted market prices in active markets for identical assets.
Accounts receivable, accounts payable, long-term debt and accrued liabilities are recorded in the financial statements at cost and approximate fair value.
Deferred compensation liabilities are recorded at amounts due to participants at the time of deferral. Prior to the IPO, deferrals were deemed to have been invested in the Company stock at a price equal to the share value on the deferral date. Considered Level 3 on the fair value hierarchy, the Company computed the fair value of its stock through the utilization of an independent third-party valuation specialist. For the period subsequent to the IPO, deferrals are invested in an investment vehicle based on the options made available to the participant, considered to be Level 1 and Level 2 on the fair value hierarchy, with the majority of the balance as Level 2. In conjunction with the IPO, investment vehicle options were changed to Level 1 and Level 2 within the fair value hierarchy. The change in fair value is recorded in deferred compensation and long-term incentive liabilities on the Consolidated Balance Sheets and deferred compensation expense on the Consolidated Statements of Comprehensive Income (Loss).
On December 14, 2018, the Company acquired DMP for $117,068, net of cash received plus potential contingent consideration of up to $10,000. The Company would have paid DMP’s previous shareholders an additional $7,500 if DMP generated $19,748 of EBITDA over the twelve-month period ended September 30, 2019. In addition, the Company would have paid one dollar for each additional dollar of EBITDA in excess of $19,748 generated over this period; however, in no event would have the total payment exceeded $10,000. The Company estimated and recorded the fair value of the contingent consideration payable of $6,076 as of the acquisition date. The Company remeasured this liability through the conclusion of the earnout period, September 30, 2019, with the change in value resulting in income or expense reflected in the Contingent Consideration Revaluation line item on the Consolidated Statement of Comprehensive Income (Loss). Contingent consideration payable was revalued to $0 as of December 31, 2019.
Based on our calculations as of September 30, 2019, and as agreed to by DMP’s former shareholders, DMP’s EBITDA fell short of the $19,748 contingent consideration threshold. As a result, and in accordance with GAAP, the contingent consideration balance of $9,598 was reduced to zero resulting in a net gain of $6,054 in the Contingent Consideration line item on the Consolidated Statements of Comprehensive Income (Loss) for the twelve months ended December 31, 2019.
The Company’s non-financial assets such as intangible assets and property, plant, and equipment are re-measured at fair value when there is an indication of impairment and adjusted only when an impairment charge is recognized.
59
Contract Assets and Contract Liabilities
The Company has contract assets and contract liabilities, which are included in other current assets and other current liabilities on the consolidated balance sheet, respectively. Contract assets include products where the Company has satisfied its performance obligation, but receipt of payment is contingent upon delivery. Contract liabilities include deferred tooling revenue, where the performance obligation was not met. The performance obligation is satisfied when the tooling is completed and the customer signs off through the Product Part Approval Process (PPAP). At this time, the tool is placed into service and the cost to build the tooling is released from the balance sheet and included in cost of goods sold.
The Company’s contracts with customers are short-term in nature; therefore, revenue is typically recognized, billed and collected within a 12 month period. The following table reflects the changes in our contract assets and liabilities during the twelve months ended December 31, 2019.
|
(in thousands) |
|
Contract Assets |
|
|
Contract Liabilities |
|
||
|
As of January 1, 2019 |
|
$ |
2,318 |
|
|
$ |
977 |
|
|
Net Activity |
|
|
(729 |
) |
|
|
(63 |
) |
|
As of December 31, 2019 |
|
$ |
1,589 |
|
|
$ |
914 |
|
Disaggregated Revenue
The following table represents a disaggregation of revenue by product category:
|
|
|
Twelve Months Ended December 31, |
|
|||||||||
|
|
|
2019 |
|
|
2018 |
|
|
2017 |
|
|||
|
Outdoor sports |
|
$ |
7,181 |
|
|
$ |
6,862 |
|
|
$ |
7,896 |
|
|
Fabrication |
|
|
334,340 |
|
|
|
147,099 |
|
|
|
129,387 |
|
|
Performance structures |
|
|
71,881 |
|
|
|
84,231 |
|
|
|
87,742 |
|
|
Tube |
|
|
71,108 |
|
|
|
80,715 |
|
|
|
65,440 |
|
|
Tank |
|
|
40,033 |
|
|
|
39,641 |
|
|
|
27,359 |
|
|
Total |
|
|
524,544 |
|
|
|
358,550 |
|
|
|
317,824 |
|
|
Intercompany sales elimination |
|
|
(4,839 |
) |
|
|
(4,024 |
) |
|
|
(4,493 |
) |
|
Total, net sales |
|
$ |
519,704 |
|
|
$ |
354,526 |
|
|
$ |
313,331 |
|
|
|
|
|
|
|
|
|
|
|
|
|
|
|
Note 19. Temporary Equity
Prior to the IPO in May 2019, the Company’s common stock was considered redeemable under GAAP because of certain repurchase obligations related to the ESOP. As a result, all common shares were recorded as temporary equity (redeemable common shares) on the consolidated balance sheets at their redemption value as of the respective balance sheet dates. Retained earnings on the consolidated balance sheet was adjusted for the changes during the period in the current redemption value of redeemable common shares.
All contractual redemption features were removed at the time of the IPO. As a consequence, all outstanding shares of common stock ceased to be considered temporary equity and were reclassified to Shareholders’ Equity, including the associated balances of retained earnings. As the common shares have no par value, the amounts recorded in temporary equity for the share redemption value were recorded to additional paid-in capital within Shareholders’ Equity upon the transfer.
60
The following table shows all changes to temporary equity during the twelve months ended December 31, 2019, excluding net income for the period of April 1, 2019 through the date of the IPO.
|
|
|
Temporary Equity |
|
|||||||||
|
|
|
Redeemable Common Shares |
|
|
Treasury Shares |
|
|
Retained Earnings |
|
|||
|
Balance as of January 1, 2018 |
|
$ |
125,042 |
|
|
$ |
(49,826 |
) |
|
$ |
17,671 |
|
|
Net Income |
|
|
|
|
|
|
|
|
|
|
17,936 |
|
|
Purchase of treasury shares |
|
|
|
|
|
|
(11,833 |
) |
|
|
|
|
|
Redistribution of Stockholders Share |
|
|
|
|
|
|
4,000 |
|
|
|
|
|
|
Change in redemption value of outstanding redeemable common shares, net |
|
|
8,764 |
|
|
|
|
|
|
|
(8,764 |
) |
|
Balance as of December 31, 2018 |
|
$ |
133,806 |
|
|
$ |
(57,659 |
) |
|
$ |
26,842 |
|
|
|
|
Temporary Equity |
|
|||||||||
|
|
|
Redeemable Common Shares |
|
|
Treasury Shares |
|
|
Retained Earnings |
|
|||
|
Balance as of January 1, 2019 |
|
$ |
133,806 |
|
|
$ |
(57,659 |
) |
|
$ |
26,842 |
|
|
Net income pre IPO |
|
|
— |
|
|
|
— |
|
|
|
2,856 |
|
|
Transfer from temporary equity to common equity |
|
|
(133,806 |
) |
|
|
57,659 |
|
|
|
(29,698 |
) |
|
Balance as of December 31, 2019 |
|
$ |
— |
|
|
$ |
— |
|
|
$ |
— |
|
Note 20. Common Equity
On May 13, 2019, the Company issued a stock dividend specific to pre-IPO shares, of approximately 1,334.34-for-1. The share dividend was accounted for as a 1,334.34-for-1 stock split and is retroactively reflected in these consolidated financial statements. All share redemption provisions mentioned in Note 19, Temporary Equity, were removed effective with the IPO. Therefore, common shares were reclassified from temporary equity to permanent equity as of May 2019.
As disclosed in Note 2, IPO, the Company’s IPO of common stock was effective in May 2019. In connection with the offering, the Company sold a total of 6,402,209 shares of additional shares of common stock.
On June 28, 2019, the Company cancelled 24,180,421 shares of common stock held in the Company’s treasury and returned those shares to the status of authorized but unissued shares of common stock.
Note 21. Concentration of major customers
The following customers accounted for 10% or greater of the Company’s recorded net sales and net trade receivables:
|
|
|
Net Sales |
|
|
Accounts Receivable |
|
|||||||||
|
|
|
Twelve Months Ended December 31, |
|
|
As of |
|
|
As of |
|
||||||
|
|
|
2019 |
|
|
2018 |
|
|
2017 |
|
|
December 31, 2019 |
|
|
December 31, 2018 |
|
|
Customer |
|
|
|
|
|
|
|
|
|
|
|
|
|
|
|
|
A |
|
15.1 |
% |
|
22.6 |
% |
|
20.2 |
% |
|
<10 |
% |
|
<10 |
% |
|
B |
|
13.5 |
% |
|
19.3 |
% |
|
19.8 |
% |
|
<10 |
% |
|
<10 |
% |
|
C |
|
<10 |
% |
|
17.4 |
% |
|
14.7 |
% |
|
<10 |
% |
|
<10 |
% |
|
D |
|
13.1 |
% |
|
<10 |
% |
|
<10 |
% |
|
<10 |
% |
|
12.6 |
% |
|
E |
|
<10 |
% |
|
<10 |
% |
|
<10 |
% |
|
13.5 |
% |
|
10.2 |
% |
|
F |
|
<10 |
% |
|
<10 |
% |
|
<10 |
% |
|
10.4 |
% |
|
<10 |
% |
61
Note 22. Stock based compensation
The Company recognizes stock-based compensation using the fair value provisions prescribed by ASC Topic 718, Compensation – Stock Compensation. Accordingly, compensation costs for awards of stock-based compensation settled in shares are determined based on the fair value of the share-based instrument at the time of grant and are recognized as expense over the vesting period of the share-based instrument. Cancellations and forfeitures are accounted for as incurred.
The Mayville Engineering Company, Inc. 2019 Omnibus Incentive Plan provides the Company the ability to provide monetary payments based on the value of its common stock, up to two million shares.
In May 2019, we granted stock awards, including stock options and restricted stock units, to key employees and outside directors. These awards vest on the annual anniversary dates based on the passage of time. The related compensation expense for each award is recognized on a straight-line basis over the requisite service period. The fair value of each stock-based compensation award is established on the date of grant. There were no stock awards granted previous to those granted in May 2019.
For grants of restricted stock units, the fair value is established based on the market price on the date of the grant. There were 331,436 restricted stock units granted in May 2019 at a fair value of $17/unit. The total fair value of these award grants was $3,600 and $2,034, with requisite service periods of 1- and 2-year periods, respectively.
For grants of options, we use the Black-Scholes option pricing model to estimate the fair value of share-based payment awards. The determination of the fair value of share-based awards is affected by stock price and a number of assumptions. Our assumptions included expected volatility of 21.3%, expected risk free rate of 2.42%, exercise price of $17 per share, and a ten year period to exercise. Expected volatility was estimated with the use of peer public company data. There were 287,895 options granted in May 2019 at a fair value of $6.07/option. The total fair value of these award grants was $1,748. These options have a requisite service period of 2 years.
The Company recognized $3,486 of stock-based compensation expense for the twelve months ended December 31, 2019.
Forfeitures during the year included 14,416 of options and 5,148 of restricted stock units. There were no option exercises or expirations during the twelve months ended December 31, 2019.
There was $3,720 of unrecognized stock-based compensation expense as of December 31, 2019.
Note 23. Valuation and qualifying accounts
|
Description |
|
Balance at beginning of period |
|
|
Additions |
|
|
Deductions |
|
|
Balance at end of period |
|
||||
|
Year ended December 31, 2019 |
|
|
|
|
|
|
|
|
|
|
|
|
|
|
|
|
|
Allowance for doubtful accounts |
|
$ |
801 |
|
|
$ |
308 |
|
|
$ |
583 |
|
|
$ |
526 |
|
|
Year ended December 31, 2018 |
|
|
|
|
|
|
|
|
|
|
|
|
|
|
|
|
|
Allowance for doubtful accounts |
|
$ |
308 |
|
|
$ |
541 |
|
|
$ |
48 |
|
|
$ |
801 |
|
Note 24. Subsequent events
The Company evaluated events and transactions for potential recognition or disclosure in the consolidated financial statements through March 2, 2020, the date on which the consolidated financial statements were available to be issued.
62
Note 25. Quarterly results of operations (unaudited)
The following tables present our unaudited quarterly results of operations for the eight quarters in 2019 and 2018. This unaudited information has been prepared on the same basis as our audited consolidated financial statements and includes all adjustments, consisting only of normal recurring adjustments, that we consider necessary for fair statement of our consolidated financial position and operating results for the quarters presented. This unaudited information should be read in conjunction with the consolidated financial statements and related notes included in Part II, Item 8 of this Annual Report on Form 10-K. Our operating results for any quarter are not necessarily indicative of results for any future quarters or for a full year.
|
|
|
Q1 |
|
|
Q2 |
|
|
Q3 |
|
|
Q4 |
|
|
Full Year |
|
|||||
|
(in thousands, except share amounts and per share data) |
|
2019 |
|
|
2019 |
|
|
2019 |
|
|
2019 |
|
|
2019 |
|
|||||
|
Net sales |
|
$ |
143,732 |
|
|
$ |
145,130 |
|
|
$ |
128,511 |
|
|
$ |
102,331 |
|
|
$ |
519,704 |
|
|
Cost of sales |
|
|
124,153 |
|
|
|
124,595 |
|
|
|
113,941 |
|
|
|
98,297 |
|
|
|
460,986 |
|
|
Amortization of intangibles |
|
|
2,677 |
|
|
|
2,677 |
|
|
|
2,677 |
|
|
|
2,677 |
|
|
|
10,706 |
|
|
Profit sharing, bonuses, and deferred compensation |
|
|
1,750 |
|
|
|
22,830 |
|
|
|
678 |
|
|
|
(153 |
) |
|
|
25,105 |
|
|
Employee Stock Ownership Plan expense |
|
|
1,500 |
|
|
|
1,500 |
|
|
|
1,500 |
|
|
|
953 |
|
|
|
5,453 |
|
|
Other selling, general and administrative expenses |
|
|
6,723 |
|
|
|
7,506 |
|
|
|
6,068 |
|
|
|
5,170 |
|
|
|
25,466 |
|
|
Contingent consideration revaluation |
|
|
869 |
|
|
|
2,674 |
|
|
|
(9,598 |
) |
|
|
— |
|
|
|
(6,054 |
) |
|
Income (loss) from operations |
|
|
6,060 |
|
|
|
(16,652 |
) |
|
|
13,245 |
|
|
|
(4,612 |
) |
|
|
(1,958 |
) |
|
Interest expense |
|
|
(2,832 |
) |
|
|
(1,991 |
) |
|
|
(987 |
) |
|
|
(918 |
) |
|
|
(6,728 |
) |
|
Loss on extinguishment of debt |
|
|
— |
|
|
|
(154 |
) |
|
|
— |
|
|
|
— |
|
|
|
(154 |
) |
|
Income (loss) before taxes |
|
|
3,228 |
|
|
|
(18,797 |
) |
|
|
12,258 |
|
|
|
(5,530 |
) |
|
|
(8,840 |
) |
|
Income tax benefit |
|
|
769 |
|
|
|
(3,513 |
) |
|
|
2,512 |
|
|
|
(3,857 |
) |
|
|
(4,088 |
) |
|
Net income (loss) and comprehensive income (loss) |
|
$ |
2,459 |
|
|
$ |
(15,284 |
) |
|
$ |
9,746 |
|
|
$ |
(1,673 |
) |
|
$ |
(4,753 |
) |
|
Earnings (loss) per share |
|
|
|
|
|
|
|
|
|
|
|
|
|
|
|
|
|
|
|
|
|
Net income (loss) available to shareholders |
|
$ |
2,459 |
|
|
$ |
(15,284 |
) |
|
$ |
9,746 |
|
|
$ |
(1,673 |
) |
|
$ |
(4,753 |
) |
|
Basic and diluted earnings (loss) per share |
|
$ |
0.18 |
|
|
$ |
(0.91 |
) |
|
$ |
0.49 |
|
|
$ |
(0.08 |
) |
|
$ |
(0.27 |
) |
|
Basic and diluted weighted average shares outstanding |
|
|
13,443,484 |
|
|
|
16,799,915 |
|
|
|
19,740,296 |
|
|
|
19,711,921 |
|
|
|
17,447,464 |
|
|
Tax-adjusted pro forma information |
|
|
|
|
|
|
|
|
|
|
|
|
|
|
|
|
|
|
|
|
|
Net income (loss) available to shareholders |
|
$ |
2,459 |
|
|
$ |
(15,284 |
) |
|
$ |
9,746 |
|
|
$ |
(1,673 |
) |
|
$ |
(4,753 |
) |
|
Pro forma provision for income taxes |
|
|
70 |
|
|
|
103 |
|
|
|
— |
|
|
|
— |
|
|
|
173 |
|
|
Pro forma net income (loss) |
|
$ |
2,389 |
|
|
$ |
(15,387 |
) |
|
$ |
9,746 |
|
|
$ |
(1,673 |
) |
|
$ |
(4,926 |
) |
|
Pro forma basic and diluted earnings (loss) per share |
|
$ |
0.18 |
|
|
$ |
(0.92 |
) |
|
$ |
0.49 |
|
|
$ |
(0.08 |
) |
|
$ |
(0.28 |
) |
|
Basic and diluted weighted average shares outstanding |
|
|
13,443,484 |
|
|
|
16,799,915 |
|
|
|
19,740,296 |
|
|
|
19,711,921 |
|
|
|
17,447,464 |
|
|
|
|
|
|
|
|
|
|
|
|
|
|
|
|
|
|
|
|
|
|
|
|
IPO occurred in Q2 of 2019. |
|
|
|
|
|
|
|
|
|
|
|
|
|
|
|
|
|
|
|
|
63
|
|
|
Q1 |
|
|
Q2 |
|
|
Q3 |
|
|
Q4 |
|
|
Full Year |
|
|||||
|
(in thousands, except share amounts and per share data) |
|
2018 |
|
|
2018 |
|
|
2018 |
|
|
2018 |
|
|
2018 |
|
|||||
|
Net sales |
|
$ |
87,221 |
|
|
$ |
91,535 |
|
|
$ |
84,338 |
|
|
$ |
91,431 |
|
|
$ |
354,526 |
|
|
Cost of sales |
|
|
75,411 |
|
|
|
75,986 |
|
|
|
71,517 |
|
|
|
81,035 |
|
|
|
303,948 |
|
|
Amortization of intangibles |
|
|
939 |
|
|
|
939 |
|
|
|
939 |
|
|
|
1,279 |
|
|
|
4,096 |
|
|
Profit sharing, bonuses, and deferred compensation |
|
|
1,640 |
|
|
|
1,365 |
|
|
|
2,340 |
|
|
|
2,713 |
|
|
|
8,058 |
|
|
Employee Stock Ownership Plan expense |
|
|
1,000 |
|
|
|
1,000 |
|
|
|
1,000 |
|
|
|
1,000 |
|
|
|
4,000 |
|
|
Other selling, general and administrative expenses |
|
|
2,867 |
|
|
|
2,713 |
|
|
|
2,855 |
|
|
|
3,841 |
|
|
|
12,276 |
|
|
Contingent consideration revaluation |
|
|
— |
|
|
|
— |
|
|
|
— |
|
|
|
(21 |
) |
|
|
(21 |
) |
|
Income (loss) from operations |
|
|
5,364 |
|
|
|
9,532 |
|
|
|
5,687 |
|
|
|
1,585 |
|
|
|
22,169 |
|
|
Interest expense |
|
|
(906 |
) |
|
|
(853 |
) |
|
|
(846 |
) |
|
|
(1,274 |
) |
|
|
(3,879 |
) |
|
Loss on extinguishment of debt |
|
|
— |
|
|
|
(588 |
) |
|
|
— |
|
|
|
(226 |
) |
|
|
(814 |
) |
|
Income (loss) before taxes |
|
|
4,458 |
|
|
|
8,091 |
|
|
|
4,841 |
|
|
|
85 |
|
|
|
17,476 |
|
|
Income tax benefit |
|
|
29 |
|
|
|
— |
|
|
|
17 |
|
|
|
(505 |
) |
|
|
(459 |
) |
|
Net income (loss) and comprehensive income (loss) |
|
$ |
4,430 |
|
|
$ |
8,091 |
|
|
$ |
4,824 |
|
|
$ |
590 |
|
|
$ |
17,935 |
|
|
Earnings (loss) per share |
|
|
|
|
|
|
|
|
|
|
|
|
|
|
|
|
|
|
|
|
|
Net income (loss) available to shareholders |
|
$ |
4,430 |
|
|
$ |
8,091 |
|
|
$ |
4,824 |
|
|
$ |
590 |
|
|
$ |
17,935 |
|
|
Basic and diluted earnings (loss) per share |
|
$ |
0.31 |
|
|
$ |
0.56 |
|
|
$ |
0.36 |
|
|
$ |
0.04 |
|
|
$ |
1.29 |
|
|
Basic and diluted weighted average shares outstanding |
|
|
14,177,317 |
|
|
|
14,341,538 |
|
|
|
13,453,285 |
|
|
|
13,443,524 |
|
|
|
13,891,301 |
|
|
Tax-adjusted pro forma information |
|
|
|
|
|
|
|
|
|
|
|
|
|
|
|
|
|
|
|
|
|
Net income (loss) available to shareholders |
|
$ |
4,430 |
|
|
$ |
8,091 |
|
|
$ |
4,824 |
|
|
$ |
590 |
|
|
$ |
17,935 |
|
|
Pro forma provision for income taxes |
|
|
1,130 |
|
|
|
2,104 |
|
|
|
1,254 |
|
|
|
175 |
|
|
|
4,663 |
|
|
Pro forma net income (loss) |
|
$ |
3,300 |
|
|
$ |
5,987 |
|
|
$ |
3,570 |
|
|
$ |
415 |
|
|
$ |
13,272 |
|
|
Pro forma basic and diluted earnings (loss) per share |
|
$ |
0.23 |
|
|
$ |
0.42 |
|
|
$ |
0.27 |
|
|
$ |
0.03 |
|
|
$ |
0.96 |
|
|
Basic and diluted weighted average shares outstanding |
|
|
14,177,317 |
|
|
|
14,341,538 |
|
|
|
13,453,285 |
|
|
|
13,443,524 |
|
|
|
13,891,301 |
|
|
|
|
|
|
|
|
|
|
|
|
|
|
|
|
|
|
|
|
|
|
|
|
DMP acquisition occurred in Q4 of 2018. |
|
|
|
|
|
|
|
|
|
|
|
|
|
|
|
|
|
|
|
|
Item 9. Changes in and Disagreements with Accountants on Accounting and Financial Disclosure.
Not applicable.
Item 9A. Controls and Procedures.
Evaluation of Disclosure Controls and Procedures
We maintain disclosure controls and procedures that are designed to provide reasonable assurance that information required to be disclosed in the reports we file or submit under the Securities Exchange Act of 1934, as amended (the Exchange Act), is recorded, processed, summarized and reported within the time periods specified in the rules and forms of the SEC, and that such information is accumulated and communicated to our management, including our Chief Executive Officer and Chief Financial Officer, to allow timely decisions regarding required disclosure. In designing disclosure controls and procedures, our management necessarily was required to apply its judgment in evaluating the cost-benefit relationship of possible disclosure controls and procedures. The design of any disclosure controls and procedures also is based in part upon certain assumptions about the likelihood of future events, and there can be no assurance that any design will succeed in achieving its stated goals under all potential future conditions. Any controls and procedures, no matter how well designed and operated, can provide only reasonable assurance of achieving the desired objectives.
Our management, under the supervision of our Chief Executive Officer and Chief Financial Officer, evaluated the effectiveness of our disclosure controls and procedures (as defined in Rules 13a-15(e) and 15d-15(e) under the Exchange Act) as of the end of the period covered by this Annual Report on Form 10K. As a result of the material weakness described below, our Chief Executive Officer and Chief Financial Officer have concluded that, as of the end of the period covered by this Annual Report on Form 10K, our disclosure controls and procedures were not effective at the reasonable assurance level.
Changes in Internal Control Over Financial Reporting
As a public company, we will be required in future years to document and assess the effectiveness of our system of internal controls over financial reporting to satisfy the requirements of the Sarbanes-Oxley Act.
64
During the course of the quarterly and year-end close processes in 2019, we identified a material weakness in the design and operation of our internal control over financial reporting. A material weakness is a deficiency, or a combination of deficiencies, in internal control over financial reporting, such that there is a reasonable possibility that a material misstatement of a company’s annual or interim financial statements will not be prevented or detected on a timely basis. The material weakness relates to a lack of consistently documented accounting policies and procedures and a lack of formalized controls over the accounting and recording of complex and significant unusual transactions which, in the aggregate, constitute a material weakness.
We have taken numerous steps to enhance our internal control environment during 2019. While preparing for our initial public offering, as of December 31, 2018, we had identified two material weaknesses in the design and operation of our internal control over financial reporting. As of December 31, 2019, we have concluded that one of the previously identified material weaknesses has been remediated and the other has been partially remediated. The previously identified deficiencies, that represented the two material weaknesses, included the preparation and review of journal entries, a limited number of personnel with a level of GAAP accounting knowledge commensurate with our financial reporting requirements and certain information technology general controls specific to segregation of duties, systems access and change management processes. However, deficiencies in our control environment, specifically deficiencies related to a lack of consistently documented accounting policies and procedures and a lack of formalized controls over the accounting and recording of complex and significant unusual transactions, which we have collectively determined aggregate to a material weakness, remained as of December 31, 2019. We are currently evaluating a number of steps to enhance our control over financial reporting and address this material weakness, including: enhancing our internal review procedures during the financial statement close process, and designing and implementing consistent policies throughout the Company; however, our current efforts to design and implement effective controls may not be sufficient to remediate the material weakness described above or prevent future material weaknesses or other deficiencies from occurring. Despite these actions, we may identify additional material weaknesses in our internal control over financial reporting in the future.
If we fail to effectively remediate this material weakness in our internal control over financial reporting, if we identify future material weaknesses in our internal control over financial reporting or if we are unable to comply with the demands that will be placed upon us as a public company, including the requirements of Section 404 of the Sarbanes-Oxley Act, in a timely manner, we may be unable to accurately report our financial results, or report them within the timeframes required by the SEC. In addition, if we are unable to assert that our internal control over financial reporting is effective, or if our independent registered public accounting firm is unable to express an opinion as to the effectiveness of our internal control over financial reporting, when required, investors may lose confidence in the accuracy and completeness of our financial reports, we may face restricted access to the capital markets and our stock price may be adversely affected.
Commencing with our Annual Report on Form 10-K for the year ending December 31, 2020, we must perform system and process evaluation and testing of our internal control over financial reporting to allow management to report on the effectiveness of our internal control over financial reporting in our Form 10-K filing for that year, as required by Section 404 of the Sarbanes Oxley Act. We expect to expend significant resources in developing the necessary documentation and testing procedures required by Section 404. If we fail to implement the requirements of Section 404 in a timely manner, regulatory authorities such as the SEC or the Public Company Accounting Oversight Board, might subject us to sanctions or investigation. We cannot be certain that the actions we will be taking to improve our internal controls over financial reporting will be sufficient, or that we will be able to implement our planned processes and procedures in a timely manner.
On February 26, 2020, the Compensation Committee of the Company’s Board of Directors approved an amendment to outstanding stock options under the Company’s 2019 Omnibus Incentive Plan. The affected options include all options held by the Company’s named executive officers. The amendment will permit vested options to be exercised following the option holder’s approved retirement until the end of the full 10-year term of the option unless, following retirement, the option holder breaches a noncompetition agreement or other agreement with the Company.
65
Item 10. Directors, Executive Officers and Corporate Governance.
The information required by this Item with respect to directors and Section 16 compliance is included under the captions “Election of Directors,” “Corporate Governance – Committees” and “Delinquent Section 16(a) Reports,” respectively, in the Company’s definitive proxy statement for its 2020 annual meeting of shareholders (Proxy Statement) and is hereby incorporated herein by reference. Information with respect to the executive officers of the Company appears in Item 1 of this Annual Report on Form 10-K. The information required by this Item with respect to audit committees and audit committee financial experts is included under the caption “Corporate Governance” in the Proxy Statement and is incorporated herein by reference.
The Company has adopted a Code of Conduct and Ethics that applies to all of the Company’s directors, officers and employees, including the Company’s Chief Executive Officer and Chief Financial Officer and other persons performing similar functions. The Company has posted a copy of the Code of Conduct and Ethics on its website at www.mecinc.com. The Company intends to satisfy the disclosure requirements under Item 5.05 of Form 8-K regarding amendments to, or waivers from, the Code of Conduct and Ethics by posting such information on its website at www.mecinc.com. We are not including the information contained on its website as part of, or incorporating it by reference into, this report.
Item 11. Executive Compensation.
The information required by this Item is included under the captions “2019 Summary Compensation Table”, “Outstanding Equity Awards at December 31, 2019,” “2019 Director Compensation” and “Corporate Governance-Transactions with Related Persons” in the Proxy Statement and is hereby incorporated herein by reference.
Item 12. Security Ownership of Certain Beneficial Owners and Management and Related Stockholder Matters.
The information required by this Item with respect to security ownership of certain beneficial owners and management is included under the caption “Principal Shareholders” in the Proxy Statement and is hereby incorporated by reference.
The following table sets forth information with respect to compensation plans under which equity securities of the Company are authorized for issuance as of December 31, 2019:
|
Plan Category |
|
Number of securities to be issued upon exercise of outstanding options, warrants, and rights |
|
|
Weighted average exercise price of outstanding options, warrants and rights (1) |
|
|
Number of securities remaining available for future issuance under equity compensation plans (excluding securities reflected in column (a)) |
|
|||
|
Equity compensation plans approved by security holders |
|
|
599,767 |
|
|
$ |
17.00 |
|
|
|
1,400,233 |
|
|
Equity compensation plans not approved by security holders |
|
|
— |
|
|
|
— |
|
|
|
— |
|
|
Total |
|
|
599,767 |
|
|
$ |
17.00 |
|
|
|
1,400,233 |
|
|
(1) |
Represents weighted average exercise price of outstanding options and does not take into account restricted stock units. |
Item 13. Certain Relationships and Related Transactions, and Director Independence.
The information required by this Item is included under the caption “Corporate Governance” in the Proxy Statement and is hereby incorporated by reference.
Item 14. Principal Accounting Fees and Services.
The information required by this Item is included under the caption “Miscellaneous – Independent Registered Public Accounting Firm” in the Proxy Statement and is hereby incorporated by reference.
66
Item 15. Exhibits, Financial Statement Schedules.
Consolidated Financial Statements
The consolidated financial statements listed in the accompanying index to the consolidated financial statements are filed as part of this Annual Report on Form 10-K.
Financial Statement Schedules
All financial statement schedules have been omitted because they are not applicable or the required information is included in the consolidated financial statements and the related notes thereto.
Exhibits
The exhibits listed in the exhibit index below are filed as part of this Annual Report on Form 10-K.
67
|
Exhibit Number |
|
Description |
|
|
|
|
|
2+ |
|
|
|
3.1 |
|
|
|
3.2 |
|
|
|
4* |
|
Description of Mayville Engineering Company, Inc.’s Securities. |
|
10.1† |
|
|
|
10.2† |
|
|
|
10.3† |
|
|
|
10.4† |
|
|
|
10.5† |
|
|
|
10.6† |
|
|
|
10.7† |
|
|
|
10.8† |
|
|
|
10.9† |
|
|
|
10.10† |
|
|
|
10.11† |
|
|
|
10.12 |
|
68
|
|
||
|
23* |
|
|
|
31.1* |
|
|
|
31.2* |
|
|
|
32* |
|
|
|
99 |
|
Proxy Statement for the 2020 Annual Meeting of Shareholders. [To be filed with the Securities and Exchange Commission under Regulation 14A within 120 days after December 31, 2019; except to the extent specifically incorporated by reference, the Proxy Statement for the 2020 Annual Meeting of Shareholders shall not be deemed to be filed with the Securities and Exchange Commission as part of this Annual Report on Form 10-K].
|
|
101.INS |
|
XBRL Instance Document |
|
101.SCH |
|
XBRL Taxonomy Extension Schema Document |
|
101.CAL |
|
XBRL Taxonomy Extension Calculation Linkbase Document |
|
101.DEF |
|
XBRL Taxonomy Extension Definition Linkbase Document |
|
101.LAB |
|
XBRL Taxonomy Extension Label Linkbase Document |
|
101.PRE |
|
XBRL Taxonomy Extension Presentation Linkbase Document |
|
|
|
|
|
* |
Filed herewith. |
|
+ |
The disclosure schedules and similar attachments to this agreement are not being filed herewith. We agree to furnish supplementally a copy of any such schedules or attachments to the Securities and Exchange Commission upon request. |
|
† |
Management contract, compensatory plan or arrangement |
INDEX TO CONSOLIDATED FINANCIAL STATEMENTS
|
41 |
|
|
|
|
|
Consolidated Balance Sheets as of December 31, 2019 and 2018 |
42 |
|
|
|
|
43 |
|
|
|
|
|
Consolidated Statements of Cash Flows for the Years ended December 31, 2019 and 2018, and 2017 |
44 |
|
|
|
|
45 |
|
|
|
|
|
46 |
None.
69
Pursuant to the requirements of Section 13 or 15(d) of the Securities Exchange Act of 1934, as amended, the Registrant has duly caused this Report to be signed on its behalf by the undersigned, thereunto duly authorized.
|
MAYVILLE ENGINEERING COMPANY, INC. |
|||
|
|
|
|
|
|
Date: March 2, 2020 |
|
By: |
/s/ Robert D. Kamphuis |
|
|
|
|
Robert D. Kamphuis |
|
|
|
|
Chairman, President and Chief Executive Officer |
Pursuant to the requirements of the Securities Exchange Act of 1934, as amended, this Report has been signed below by the following persons on behalf of the Registrant in the capacities and on the dates indicated.
|
Name |
|
Title |
|
Date |
|
|
|
|
|
|
|
/s/ Robert D. Kamphuis |
|
Chairman, President, Chief Executive Officer (Principal Executive Officer) and Director |
|
March 2, 2020 |
|
Robert D. Kamphuis |
|
|
|
|
|
|
|
|
|
|
|
/s/ Todd M. Butz |
|
Chief Financial Officer (Principal Financial and Accounting Officer) |
|
March 2, 2020 |
|
Todd M. Butz |
|
|
|
|
|
|
|
|
|
|
|
/s/ Allen J. Carlson |
|
Director |
|
March 2, 2020 |
|
Allen J. Carlson |
|
|
|
|
|
|
|
|
|
|
|
/s/ Timothy L. Christen |
|
Director |
|
March 2, 2020 |
|
Timothy L. Christen |
|
|
|
|
|
|
|
|
|
|
|
/s/ Steven L. Fisher |
|
Director |
|
March 2, 2020 |
|
Steven L. Fisher |
|
|
|
|
|
|
|
|
|
|
|
/s/ Craig E. Johnson |
|
Director |
|
March 2, 2020 |
|
Craig E. Johnson |
|
|
|
|
|
|
|
|
|
|
|
/s/ Patrick D. Michels |
|
Director |
|
March 2, 2020 |
|
Patrick D. Michels |
|
|
|
|
|
|
|
|
|
|
|
/s/ Jay O. Rothman |
|
Director |
|
March 2, 2020 |
|
Jay O. Rothman |
|
|
|
|
|
|
|
|
|
|
|
/s/ John A. St. Peter |
|
Director |
|
March 2, 2020 |
|
John A. St. Peter |
|
|
|
|
70