Attached files
| file | filename |
|---|---|
| EX-99.2 - FOURTH QUARTER 2019 INVESTOR REVIEW PRESENTATION - CIRCOR INTERNATIONAL INC | cirq412312019ex992.htm |
| 8-K - 8-K - CIRCOR INTERNATIONAL INC | q41231198k.htm |
EXHIBIT 99.1

CIRCOR Reports Preliminary Fourth-Quarter and Year- End 2019 Financial Results
Burlington, MA - March 2, 2020
CIRCOR International, Inc. (NYSE: CIR), a leading provider of severe service flow control solutions and other highly engineered products for the Industrial and Aerospace & Defense markets, today announced preliminary financial results for the fourth quarter and full year ended December 31, 2019.
As disclosed in a Form 12b-25 that the Company filed with the SEC today, CIRCOR requires additional time to file its Form 10-K for the year ended December 31, 2019.
Highlights
• | Strong fourth quarter 2019 results from continuing operations |
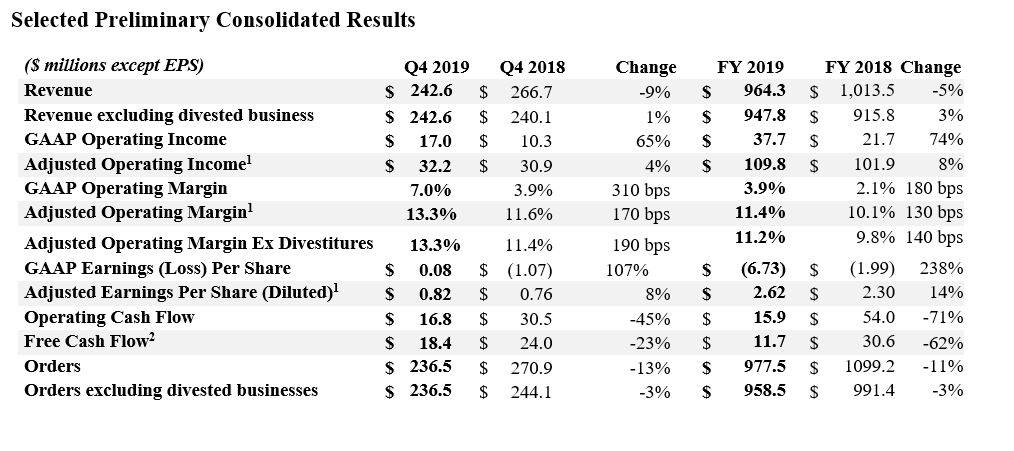
◦ | Revenue of $243 million, down 9% reported, up 2% organically |
◦ | Preliminary GAAP earnings per share from continuing operations of $0.16 |
◦ | Adjusted earnings per share of $0.82 |
◦ | Preliminary GAAP operating margin of 7.0% |
◦ | Adjusted operating margin of 13.3% |
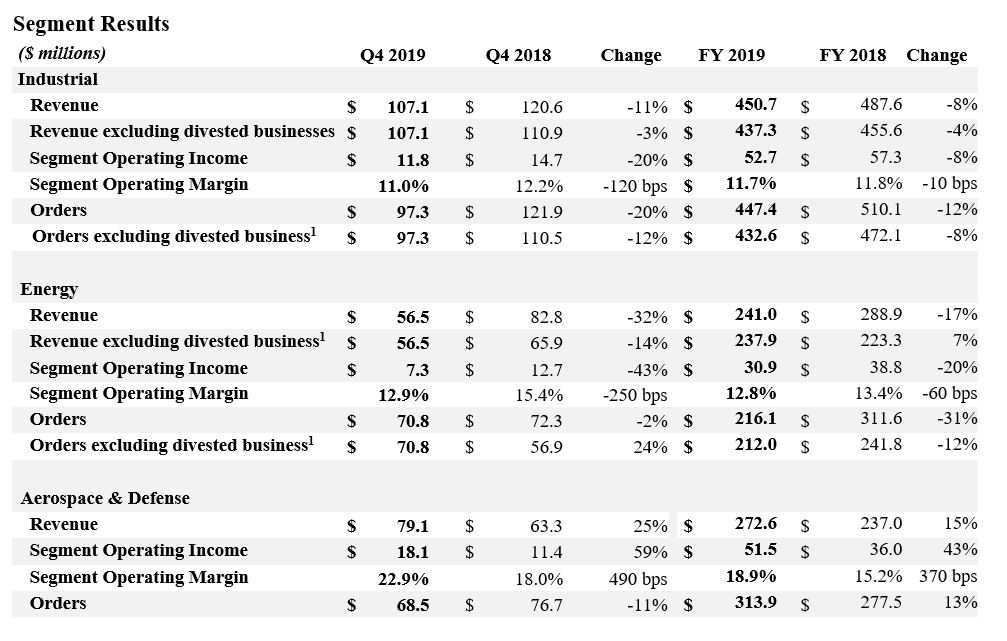
◦ | A&D Segment operating margin of 22.9%, up 490 bps year-over-year |
• | Delivered 2019 Adjusted EBITDA target and on track for 2020 targets communicated in 18-month plan |
• | Completed the sale of non-core Instrumentation & Sampling in January 2020 for $172 million |
• | Achieved pro-forma net leverage ratio of 3.6 times |
• | Repriced debt in February 2020, reducing interest expense by 25 bps |
“We ended the year with another solid quarter, delivering a record 13.3% adjusted operating margin from continuing operations, up 190 basis points from a year ago,” said Scott Buckhout, President and Chief Executive Officer. “In January we sold our Instrumentation and Sampling business for $172 million with net proceeds going to further reduce debt.”
“We delivered on our 2019 goal to achieve substantial earnings growth while deleveraging the Company,” Mr. Buckhout continued. “Since January 2019, we have generated over $340 million in proceeds from non-core asset sales, enabling CIRCOR to accelerate the reduction of debt.”
“Looking ahead, we are on track to deliver our 2020 commitments. We continue to focus on driving long-term growth, expanding margins, generating strong free cash flow, and deleveraging as we drive value for our shareholders,” concluded Mr. Buckhout.
First-Quarter 2020 Guidance
For the first quarter of 2020, CIRCOR expects revenue in the range of $190 million to $205 million, and GAAP loss per share in the range of $(0.25) to $(0.05), which reflects acquisition-related amortization expense of $(0.48) and other special and restructuring (charges) gains of $(0.27) to $(0.17). Excluding the impact of amortization, special and restructuring (charges) gains, adjusted EPS is expected to be in the
1
range of $0.50 to $0.60 per share. This guidance excludes revenue and earnings from the Instrumentation & Sampling business which was sold on January 31, 2020. Presentation slides that provide supporting information to this guidance and fourth-quarter and year-end results are posted on the “Investors” section of the Company’s website, http://investors.circor.com, and will be discussed during the conference call at 9:00 a.m. ET today, March 2, 2020.
2
1. | Adjusted Consolidated and Segment results for Q4 2019 exclude non-cash acquisition-related intangible amortization, special and restructuring charges totaling $15.2 million ($13.4 million, net of tax). These charges include: (i) $12.2 million for non-cash acquisition-related intangible amortization expense and amortization of the step-up in fixed asset values; (ii) $2.3 million related to restructuring and cost saving initiatives; (iii) $1.3 million of professional fees associated with an unsolicited tender offer to acquire all outstanding shares of the Company’s common stock; (iv) $1.2 million related to divestitures, partially offset by (v) a $1.8 million gain on the sale of a building. Adjusted Consolidated and Segment Results for Q4 2018 exclude non-cash acquisition-related intangible amortization, special and restructuring charges totaling $20.6 million ($31.6 million, net of tax). These charges include: (i) $13.6 million for non-cash acquisition-related intangible amortization expense and amortization of the step-up in fixed asset values; (ii) $4.4 million related to the sale of businesses; (iii) $2.6 million related to other special and restructuring activities and (iv) $10.9 million related to the write-off of a deferred tax asset due to changes in US tax law. |
2. | Free Cash Flow is a non-GAAP financial measure and is calculated by subtracting GAAP capital expenditures, net of proceeds from asset sales, from GAAP Operating Cash Flow. |
Conference Call Information
CIRCOR International will hold a conference call to review its financial results at 9:00 a.m. ET today, March 2, 2020. To listen to the live conference call and view the accompanying presentation slides, please visit “Webcasts & Presentations” in the “Investors” portion of CIRCOR’s website. The live call also can be accessed by dialing (877) 407-5790 or (201) 689-8328. The webcast will be archived on the Company’s website for one year.
Use of Non-GAAP Financial Measures
Adjusted operating income, Adjusted operating margin, Adjusted net income, Adjusted earnings per share (diluted), EBITDA, Adjusted EBITDA, net debt, free cash flow and organic growth, (and such measures and revenue further excluding divested businesses) are non-GAAP financial measures. These non-GAAP financial measures are used by management in our financial and operating decision making because we believe they reflect our ongoing business and facilitate period-to-period comparisons. We believe these non-GAAP financial measures provide useful information to investors and others in understanding and evaluating the Company’s current operating performance and future prospects in the same manner as management does, if they so choose. These non-GAAP financial measures also allow investors and others to compare the Company’s current financial results with the Company’s past financial results in a consistent manner.
For example:
• | We exclude costs and tax effects associated with restructuring activities, such as reducing overhead and consolidating facilities. We believe that the costs related to these restructuring activities are not indicative of our normal operating costs. |
• | We exclude certain acquisition-related costs, including significant transaction costs and amortization of inventory and fixed-asset step-ups and the related tax effects. We exclude these costs because we do not believe they are indicative of our normal operating costs. |
• | We exclude the expense and tax effects associated with the non-cash amortization of acquisition-related intangible assets because a significant portion of the purchase price for acquisitions may be allocated to intangible assets that have lives up to 25 years. Exclusion of the non-cash amortization expense allows comparisons of operating results that are consistent over time for both our newly acquired and long-held businesses and with both acquisitive and non-acquisitive peer companies. |
• | We also exclude certain gains/losses and related tax effects, which are either isolated or cannot be expected to occur again with any predictability, and that we believe are not indicative of our normal operating gains and losses. For example, we exclude gains/losses from items such as the sale of a business, significant litigation-related matters and lump-sum pension plan settlements. |
3
• | We exclude the results of discontinued operations. |
• | Due to the significance of recently sold businesses and to provide a comparison of changes in our orders and revenue, we also discuss these changes on an “organic” basis. Organic is calculated assuming the divestitures completed prior to September 29, 2019 were completed on January 1, 2018 and excluding the impact of changes in foreign currency exchange rates. |
CIRCOR’s management uses these non-GAAP measures, in addition to GAAP financial measures, as the basis for measuring the Company’s operating performance and comparing such performance to that of prior periods and to the performance of our competitors. We use such measures when publicly providing our business outlook, assessing future earnings potential, evaluating potential acquisitions and dispositions and in our financial and operating decision-making process, including for compensation purposes.
Investors should recognize that these non-GAAP measures might not be comparable to similarly titled measures of other companies. These measures should be considered in addition and not as a substitute for or superior to, any measure of performance, cash flow or liquidity prepared in accordance with accounting principles generally accepted in the United States. A reconciliation of the non-GAAP financial measures to the most directly comparable GAAP measures is included in this news release.
Safe Harbor Statement
This press release contains forward-looking statements within the meaning of Section 27 A of the Securities Act of 1933, as amended, and Section 21 E of the Securities Exchange Act of 1934, as amended. Reliance should not be placed on forward-looking statements because they involve unknown risks, uncertainties and other factors, which are, in some cases, beyond the control of CIRCOR. Any statements in this press release that are not statements of historical fact are forward-looking statements, including, but not limited to, those relating to CIRCOR's first-quarter 2020 guidance, our future performance, including future growth and profitability, increase in shareholder value, realization of cost reductions from restructuring activities and expected synergies, plans to reduce our outstanding debt and our corporate priorities. Actual events, performance or results could differ materially from the anticipated events, performance or results expressed or implied by such forward-looking statements. Important factors that could cause actual results to vary from expectations include, but are not limited to: adjustments identified by the Company or its auditors in the course of completing the year-end audit, our ability to successfully integrate acquired businesses, as contemplated, our ability to successfully implement our divestiture, restructuring or simplification strategies, the possibility that expected benefits related to the Fluid Handling acquisition may not materialize as expected, any adverse changes in governmental policies, variability of raw material and component pricing, changes in our suppliers’ performance, fluctuations in foreign currency exchange rates, changes in tariffs or other taxes related to doing business internationally, our ability to hire and retain key personnel, our ability to operate our manufacturing facilities at efficient levels including our ability to prevent cost overruns and reduce costs, our ability to generate increased cash by reducing our working capital, our prevention of the accumulation of excess inventory, our ability to successfully implement our restructuring or simplification strategies, fluctuations in interest rates, our ability to successfully defend product liability actions, any actions of stockholders or others in response to the expiration of the recent unsolicited tender offer and the cost and disruption of responding to those actions, as well as the uncertainty associated with the current worldwide economic conditions and the continuing impact on economic and financial conditions in the United States and around the world, including as a result of health pandemics, natural disasters, terrorist attacks, current Middle Eastern conflicts and related matters. BEFORE MAKING ANY INVESTMENT DECISIONS REGARDING OUR COMPANY, WE STRONGLY ADVISE YOU TO READ THE SECTION ENTITLED "RISK FACTORS" IN OUR MOST RECENT ANNUAL REPORT ON FORM 10-K AND
4
SUBSEQUENT REPORTS ON FORMS 10-Q, WHICH CAN BE ACCESSED UNDER THE "INVESTORS" LINK OF OUR WEBSITE AT WWW.CIRCOR.COM. We undertake no obligation to publicly update or revise any forward-looking statement, whether as a result of new information, future events or otherwise.
About CIRCOR International, Inc.
CIRCOR International, Inc. designs, manufactures and markets differentiated technology products and sub-systems for markets including oil & gas, industrial, aerospace & defense and commercial marine. CIRCOR has a diversified flow and motion control product portfolio with recognized, market-leading brands that fulfill its customers’ mission critical needs. For more information, visit the Company’s investor relations website at http://investors.circor.com.
Contact:
David F. Mullen
Senior Vice President Finance
CIRCOR International
(781) 270-1200
5
CIRCOR INTERNATIONAL, INC.
Preliminary Condensed Consolidated Statement of Operations
(in millions, except per share data)
(UNAUDITED)
Three Months Ended | Twelve Months Ended | ||||||||||||||
December 31, 2019 | December 31, 2018 | December 31, 2019 | December 31, 2018 | ||||||||||||
Net revenues | $ | 242,638 | $ | 266,716 | $ | 964,313 | $ | 1,013,470 | |||||||
Cost of revenues | 164,634 | 176,704 | 655,504 | 688,267 | |||||||||||
Gross Profit | 78,004 | 90,012 | 308,809 | 325,203 | |||||||||||
Selling, general and administrative expenses | 58,029 | 72,732 | 248,256 | 284,641 | |||||||||||
Special and restructuring charges, net | 2,979 | 6,985 | 22,872 | 18,909 | |||||||||||
Operating income | 16,996 | 10,295 | 37,681 | 21,653 | |||||||||||
Other expense (income): | |||||||||||||||
Interest expense, net | 10,763 | 13,264 | 48,609 | 52,975 | |||||||||||
Other (income) expense, net | 1,919 | (347 | ) | (836 | ) | (7,426 | ) | ||||||||
Total other expense, net | 12,682 | 12,917 | 47,773 | 45,549 | |||||||||||
Income (loss) from continuing operations before income taxes | 4,314 | (2,622 | ) | (10,092 | ) | (23,896 | ) | ||||||||
Provision for income taxes | 1,163 | 13,885 | 14,676 | 9,451 | |||||||||||
Income (loss) from continuing operations, net of tax | 3,151 | (16,507 | ) | (24,768 | ) | (33,347 | ) | ||||||||
Loss from discontinued operations, net of tax | (1,595 | ) | (4,497 | ) | (109,167 | ) | (6,037 | ) | |||||||
Net income (loss) | $ | 1,556 | $ | (21,004 | ) | $ | (133,935 | ) | $ | (39,384 | ) | ||||
Basic income (loss) per common share: | |||||||||||||||
Basic income (loss) from continuing operations | $ | 0.16 | $ | (0.84 | ) | $ | (1.24 | ) | $ | (1.68 | ) | ||||
Basic (loss) from discontinued operations | $ | (0.08 | ) | $ | (0.23 | ) | $ | (5.48 | ) | $ | (0.30 | ) | |||
Net income (loss) | $ | 0.08 | $ | (1.07 | ) | $ | (6.73 | ) | $ | (1.99 | ) | ||||
Diluted (loss) income per common share: | |||||||||||||||
Diluted income (loss) from continuing operations | $ | 0.16 | $ | (0.84 | ) | $ | (1.24 | ) | $ | (1.68 | ) | ||||
Diluted (loss) from discontinued operations | $ | (0.08 | ) | $ | (0.23 | ) | $ | (5.48 | ) | $ | (0.30 | ) | |||
Net income (loss) | $ | 0.08 | $ | (1.07 | ) | $ | (6.73 | ) | $ | (1.99 | ) | ||||
Weighted average common shares outstanding: | |||||||||||||||
Basic | 19,920 | 19,722 | 19,903 | 19,834 | |||||||||||
Diluted | 20,148 | 19,972 | 19,903 | 19,834 | |||||||||||
6
CIRCOR INTERNATIONAL, INC.
Preliminary Condensed Consolidated Statement of Cash Flows
(in thousands)
(UNAUDITED)
Twelve Months Ended | |||||||
OPERATING ACTIVITIES | December 31, 2019 | December 31, 2018 | |||||
Net loss | $ | (133,935 | ) | $ | (39,384 | ) | |
Loss from discontinued operations | (109,167 | ) | (6,037 | ) | |||
Loss from continuing operations | (24,768 | ) | (33,347 | ) | |||
Adjustments to reconcile net loss to net cash provided by operating activities: | |||||||
Depreciation | 22,045 | 26,183 | |||||
Amortization | 47,591 | 49,129 | |||||
Provision for bad debt expense | 616 | (261 | ) | ||||
Loss on write down of inventory and amortization of fair value step-up | 366 | 7,675 | |||||
Compensation expense of share-based plans | 5,418 | 4,965 | |||||
Amortization of debt issuance costs | 4,622 | 3,937 | |||||
Deferred income tax benefit | (3,440 | ) | (2,367 | ) | |||
(Gain) loss on disposal of property, plant and equipment | (1,793 | ) | 1,380 | ||||
Loss on sale of businesses | 3,615 | 1,882 | |||||
Changes in operating assets and liabilities, net of effects of acquisitions and divestitures: | |||||||
Trade accounts receivable | 25,822 | (12,229 | ) | ||||
Inventories | (9,557 | ) | 6,620 | ||||
Prepaid expenses and other assets | (9,827 | ) | (26,770 | ) | |||
Accounts payable, accrued expenses and other liabilities | (28,780 | ) | 30,458 | ||||
Net cash provided by continuing operations | 31,931 | 57,255 | |||||
Net cash used in discontinued operations | (16,018 | ) | (3,261 | ) | |||
Net cash provided by operating activities | 15,913 | 53,994 | |||||
INVESTING ACTIVITIES | |||||||
Purchases of property, plant and equipment | (13,855 | ) | (20,114 | ) | |||
Proceeds from the sale of property, plant and equipment | 5,735 | 156 | |||||
Proceeds from divestitures | 861 | — | |||||
Proceeds from the sale of business, net | 162,591 | 2,753 | |||||
Business acquisitions, net of cash acquired | — | 3,727 | |||||
Net cash provided by (used in) continuing investing activities | 155,332 | (13,478 | ) | ||||
Net cash used in discontinued investing activities | (2,296 | ) | (3,399 | ) | |||
Net cash provided by (used in) investing activities | 153,036 | (16,877 | ) | ||||
FINANCING ACTIVITIES | |||||||
Proceeds from long-term debt | 281,600 | 248,300 | |||||
Payments of short-term and long-term debt | (434,797 | ) | (260,146 | ) | |||
Debt issuance costs | — | — | |||||
Dividends paid | — | — | |||||
Proceeds from the exercise of stock options | 253 | 690 | |||||
Return of cash to seller | — | (62,917 | ) | ||||
Net cash used in continuing financing activities | (152,944 | ) | (74,073 | ) | |||
Net cash used in financing activities | (152,944 | ) | (74,073 | ) | |||
Effect of exchange rate changes on cash and cash equivalents | 197 | (5,812 | ) | ||||
INCREASE (DECREASE) IN CASH AND CASH EQUIVALENTS | 16,202 | (42,768 | ) | ||||
Cash and cash equivalents at beginning of year | 69,525 | 112,293 | |||||
CASH AND CASH EQUIVALENTS AT END OF YEAR | $ | 85,727 | $ | 69,525 | |||
7
CIRCOR INTERNATIONAL, INC.
Preliminary Condensed Consolidated Balance Sheets
(in thousands, except per share data)
(UNAUDITED)
December 31, 2019 | December 31, 2018 | ||||||
ASSETS | |||||||
CURRENT ASSETS: | |||||||
Cash and cash equivalents | $ | 84,531 | $ | 68,517 | |||
Short-term investments | — | — | |||||
Trade accounts receivable, less allowance for doubtful accounts | 125,422 | 167,181 | |||||
Inventories | 137,309 | 143,682 | |||||
Income taxes refundable | — | — | |||||
Prepaid expenses and other current assets | 72,164 | 71,428 | |||||
Assets held for sale | 161,193 | 197,238 | |||||
Total Current Assets | 580,619 | 648,046 | |||||
PROPERTY, PLANT AND EQUIPMENT, NET | 172,179 | 189,672 | |||||
OTHER ASSETS: | |||||||
Goodwill | 271,893 | 450,605 | |||||
Intangibles, net | 385,542 | 440,281 | |||||
Deferred income taxes | 30,852 | 19,906 | |||||
Assets held for sale | — | 30,374 | |||||
Other assets | 35,360 | 12,728 | |||||
TOTAL ASSETS | $ | 1,476,445 | $ | 1,791,612 | |||
LIABILITIES AND SHAREHOLDERS’ EQUITY | |||||||
CURRENT LIABILITIES: | |||||||
Accounts payable | $ | 79,399 | $ | 94,715 | |||
Accrued expenses and other current liabilities | 99,669 | 92,496 | |||||
Accrued compensation and benefits | 19,518 | 30,703 | |||||
Liabilities held for sale | 43,289 | 58,298 | |||||
Notes payable and current portion of long-term debt | — | 7,850 | |||||
Total Current Liabilities | 241,875 | 284,062 | |||||
LONG-TERM DEBT | 636,297 | 778,187 | |||||
DEFERRED INCOME TAXES | 21,425 | 33,607 | |||||
PENSION LIABILITY, NET | 146,801 | 150,623 | |||||
LIABILITIES HELD FOR SALE | — | 861 | |||||
OTHER NON-CURRENT LIABILITIES | 38,636 | 15,279 | |||||
SHAREHOLDERS’ EQUITY: | |||||||
Preferred stock, $0.01 par value; 1,000,000 shares authorized; no shares issued and outstanding | — | — | |||||
Common stock, $0.01 par value; 29,000,000 shares authorized; 19,912,362 and 19,845,205 shares issued at December 31, 2019 and 2018, respectively | 213 | 212 | |||||
Additional paid-in capital | 446,657 | 440,890 | |||||
Retained earnings | 99,280 | 232,102 | |||||
Common treasury stock, at cost (1,372,488 shares at December 31, 2019 and 2018) | (74,472 | ) | (74,472 | ) | |||
Accumulated other comprehensive loss, net of tax | (80,267 | ) | (69,739 | ) | |||
Total Shareholders’ Equity | 391,411 | 528,993 | |||||
TOTAL LIABILITIES AND SHAREHOLDERS’ EQUITY | $ | 1,476,445 | $ | 1,791,612 | |||
8
CIRCOR INTERNATIONAL, INC. Segment Information (in millions) UNAUDITED | |||||||||||||||
Three Months Ended | Twelve Months Ended | ||||||||||||||
December 31, 2019 | December 31, 2018 | December 31, 2019 | December 31, 2018 | ||||||||||||
ORDERS (1) (3) | |||||||||||||||
Energy | $ | 70.8 | $ | 72.3 | $ | 216.1 | $ | 311.6 | |||||||
Aerospace & Defense | 68.5 | 76.7 | 313.9 | 277.5 | |||||||||||
Industrial | 97.3 | 121.9 | 447.4 | 510.1 | |||||||||||
Total orders | $ | 236.5 | $ | 270.9 | $ | 977.5 | $ | 1,099.2 | |||||||
BACKLOG (2) (3) | December 31, 2019 | December 31, 2018 | |||||||||||||
Energy | $ | 74.1 | $ | 110.5 | |||||||||||
Aerospace & Defense | 194.5 | 156.3 | |||||||||||||
Industrial | 152.1 | 163.8 | |||||||||||||
Total Backlog | $ | 420.7 | $ | 430.6 | |||||||||||
Numbers may not add due to rounding. | |||||||||||||||
(1) Orders do not include the foreign exchange impact due to the re-measurement of customer backlog amounts denominated in foreign currencies. Orders for the three months and year ended December 31, 2019 include orders from businesses divested prior to December 31, 2019 of $0.0 million and $19.0 million, respectively. Orders for the three months and year ended December 31, 2018 include orders from businesses divested of $26.8 million and $107.8 million, respectively. Divested businesses are Reliability Services (Energy), Spence / Nicholson (Industrial) and Delden (Industrial). | |||||||||||||||
Note 2: Backlog include unshipped customer orders for which revenue has not been recognized. Backlog at Q4 2018 includes $20.3 million and $1.7 million for Energy and Industrial related to divested businesses. | |||||||||||||||
9
CIRCOR INTERNATIONAL, INC. Segment Information (in thousands, except percentages) UNAUDITED | ||||||||||||||||||||||||||||||
2018 | 2019 | |||||||||||||||||||||||||||||
As Reported | 1ST QTR | 2ND QTR | 3RD QTR | 4TH QTR | TOTAL | 1ST QTR | 2ND QTR | 3RD QTR | 4TH QTR | TOTAL | ||||||||||||||||||||
ORDERS | ||||||||||||||||||||||||||||||
Energy | $ | 85,335 | $ | 66,825 | $ | 87,146 | $ | 72,319 | $ | 311,626 | $ | 48,088 | $ | 43,982 | $ | 53,276 | $ | 70,768 | $ | 216,114 | ||||||||||
Aerospace & Defense | 59,793 | 59,441 | 81,533 | 76,702 | 277,469 | 88,107 | 93,405 | 63,968 | 68.459 | 313,939 | ||||||||||||||||||||
Industrial | 136,607 | 136,746 | 114,876 | 121,886 | 510,115 | 123,746 | 120,660 | 105,710 | 97,323 | 447,438 | ||||||||||||||||||||
Total | $ | 281,735 | $ | 263,012 | $ | 283,555 | $ | 270,907 | $ | 1,099,210 | $ | 259,941 | $ | 258,047 | $ | 222,954 | $ | 236,550 | $ | 977,491 | ||||||||||
NET REVENUES | ||||||||||||||||||||||||||||||
Energy | $ | 64,279 | $ | 71,094 | $ | 70,718 | $ | 82,786 | $ | 288,877 | $ | 66,876 | $ | 61,752 | $ | 55,835 | $ | 56,519 | $ | 240,982 | ||||||||||
Aerospace & Defense | 58,477 | 57,500 | 57,757 | 63,283 | 237,017 | 61,240 | 64,694 | 67,621 | 79,070 | 272,625 | ||||||||||||||||||||
Industrial | 117,131 | 131,064 | 118,734 | 120,647 | 487,576 | 110,738 | 119,322 | 113,596 | 107,050 | 450,706 | ||||||||||||||||||||
Total | $ | 239,888 | $ | 259,658 | $ | 247,209 | $ | 266,716 | $ | 1,013,470 | $ | 238,854 | $ | 245,768 | $ | 237,052 | $ | 242,639 | $ | 964,313 | ||||||||||
SEGMENT OPERATING INCOME | ||||||||||||||||||||||||||||||
Energy | $5,627 | $ | 10,691 | $ | 9,726 | $ | 12,735 | $ | 38,779 | $ | 9,978 | $ | 8,343 | $ | 5,286 | $7,287 | $ | 30,894 | ||||||||||||
Aerospace & Defense | 8,931 | 6,992 | 8,709 | 11,415 | 36,047 | 9,374 | 10,443 | 13,564 | 18,099 | 51,480 | ||||||||||||||||||||
Industrial | 12,946 | 15,037 | 14,609 | 14,748 | 57,340 | 10,787 | 16,138 | 13,953 | 11,810 | 52,688 | ||||||||||||||||||||
Corporate Expenses | (7,800 | ) | (6,451 | ) | (8,034 | ) | (8,004 | ) | (30,289 | ) | (6,705 | ) | (6,335 | ) | (7,209 | ) | (5,013 | ) | (25,262 | ) | ||||||||||
Total | $ | 19,704 | $ | 26,269 | $ | 25,010 | $ | 30,894 | $ | 101,877 | $ | 23,434 | $ | 28,589 | $ | 25,594 | $ | 32,183 | $ | 109,800 | ||||||||||
SEGMENT OPERATING MARGIN % | ||||||||||||||||||||||||||||||
Energy | 8.8 | % | 15.0 | % | 13.8 | % | 15.4 | % | 13.4 | % | 14.9 | % | 13.5 | % | 9.5 | % | 12.9 | % | 12.8 | % | ||||||||||
Aerospace & Defense | 15.3 | % | 12.2 | % | 15.1 | % | 18.0 | % | 15.2 | % | 15.3 | % | 16.1 | % | 20.1 | % | 22.9 | % | 18.9 | % | ||||||||||
Industrial | 11.1 | % | 11.5 | % | 12.3 | % | 12.2 | % | 11.8 | % | 9.7 | % | 13.5 | % | 12.3 | % | 11.0 | % | 11.7 | % | ||||||||||
Total | 8.2 | % | 10.1 | % | 10.1 | % | 11.6 | % | 10.1 | % | 9.8 | % | 11.6 | % | 10.8 | % | 13.3 | % | 11.4 | % | ||||||||||
SEGMENT OPERATING MARGIN % Excluding Divestitures (1) | ||||||||||||||||||||||||||||||
Energy | 11.3% | 16.0% | 12.6% | 16.9% | 14.4% | 15.6% | 13.5% | 9.5% | 12.9% | 13.0% | ||||||||||||||||||||
Aerospace & Defense | 15.3% | 12.2% | 15.1% | 18.0% | 15.2% | 15.3% | 16.1% | 20.1% | 22.9% | 18.9% | ||||||||||||||||||||
Industrial | 10.5% | 11.3% | 12.0% | 11.5% | 11.4% | 8.7% | 12.7% | 12.6% | 11.0% | 11.3% | ||||||||||||||||||||
Total | 8.4% | 9.9% | 9.4% | 11.4% | 9.8% | 9.5% | 11.2% | 10.9% | 13.3% | 11.2% | ||||||||||||||||||||
Numbers may not add due to rounding. | ||||||||||||||||||||||||||||||
(1) Divested businesses include Reliability Services (Energy), Spence / Nicholson (Industrial) and Delden (Industrial) which were sold before September 29, 2019. Engineered Valves and Distributed Valves are discontinued operations and not reflected in the As Reported figures in accordance with US GAAP. | ||||||||||||||||||||||||||||||
10
CIRCOR INTERNATIONAL, INC. Supplemental Information Regarding Divested Businesses (in thousands) UNAUDITED | ||||||||||
2018 | 2019 | |||||||||
Divested Businesses (1) | 1ST QTR | 2ND QTR | 3RD QTR | 4TH QTR | TOTAL | 1ST QTR | 2ND QTR | 3RD QTR | 4TH QTR | TOTAL |
ORDERS | ||||||||||
Energy | $16,891 | $18,389 | $19,145 | $15,451 | $69,875 | $4,104 | $— | $— | $— | $4,104 |
Industrial | 9,708 | 9,836 | 7,078 | 11,351 | 37,973 | 4,778 | 5,275 | 4,798 | — | 14,851 |
Total | $26,599 | $28,225 | $26,223 | $26,802 | $107,849 | $8,882 | $5,275 | $4,798 | $— | $18,955 |
NET REVENUES | ||||||||||
Energy | $14,731 | $17,419 | $16,579 | $16,885 | $65,613 | $3,106 | $— | $— | $— | $3,106 |
Industrial | 8,816 | 6,317 | 7,123 | 9,762 | 32,017 | 5,366 | 5,198 | 2,891 | — | 13,456 |
Total | $23,547 | $23,735 | $23,702 | $26,647 | $97,630 | $8,473 | $5,198 | $2,891 | $— | $16,562 |
SEGMENT OPERATING INCOME | ||||||||||
Energy | $8 | $2,085 | $2,905 | $1,597 | $6,596 | $— | $— | $— | $— | $— |
Industrial | 1,573 | 897 | 1,174 | 1,983 | 5,627 | 1,630 | 1,642 | — | — | 3,272 |
Total | $1,582 | $2,982 | $4,079 | $3,580 | $12,223 | $1,630 | $1,642 | $— | $— | $3,272 |
Numbers may not add due to rounding. | ||||||||||
(1) Divested businesses include Reliability Services (Energy), Spence/Nicholson (Industrial) and Delden (Industrial) which were sold before September 29, 2019. Engineered Valves and Distributed Valves are discontinued operations and not reflected in the As Reported figures in accordance with US GAAP. | ||||||||||
11
CIRCOR INTERNATIONAL, INC. RECONCILIATION OF KEY PERFORMANCE MEASURES TO COMMONLY USED GENERALLY ACCEPTED ACCOUNTING PRINCIPLE TERMS (in thousands, except per share data) UNAUDITED | ||||||||||||
2018 | 2019 | |||||||||||
1ST QTR | 2ND QTR | 3RD QTR | 4TH QTR | TOTAL | 1ST QTR | 2ND QTR | 3RD QTR | 4TH QTR | TOTAL | |||
Net Cash (Used In) Provided by Operating Activities | $(145) | $(465) | $24,073 | $30,531 | $53,994 | $(22,378) | $12,339 | $9,128 | $16,822 | $ | 15,913 | |
LESS: | ||||||||||||
Capital expenditures, net of sale proceeds (a) | 8,141 | 3,563 | 5,119 | 6,534 | 23,357 | 3,689 | 2,995 | (963) | (1,535) | 4,186 | ||
FREE CASH FLOW | $(8,286) | $(4,028) | $18,954 | $23,997 | $30,637 | $(26,067) | $9,344 | $10,091 | $18,357 | $11,727 | ||
Gross Debt | $823,665 | $827,629 | $831,613 | $807,050 | $807,050 | $753,950 | $748,250 | $659,100 | $653,850 | $653,850 | ||
Less: Cash & Cash Equivalents | 123,305 | 69,030 | 71,334 | 68,517 | 68,517 | 73,619 | 76,082 | 69,225 | 84,531 | 84,531 | ||
GROSS DEBT, NET OF CASH | $700,360 | $758,599 | $760,279 | $738,533 | $738,533 | $680,331 | $672,168 | $589,875 | $569,319 | $569,319 | ||
TOTAL SHAREHOLDERS' EQUITY | $592,096 | $573,992 | $574,171 | $528,993 | $528,993 | $516,177 | $494,899 | $375,388 | $391,411 | $391,411 | ||
GROSS DEBT AS % OF EQUITY | 139% | 144% | 145% | 153% | 153% | 146% | 151% | 176% | 167% | 167% | ||
GROSS DEBT, NET OF CASH AS % OF EQUITY | 118% | 132% | 132% | 140% | 140% | 132% | 136% | 157% | 145% | 145% | ||
Numbers may not add due to rounding. | ||||||||||||
(a) Includes capital expenditures, net of sales proceeds of discontinued operations. | ||||||||||||
12
CIRCOR INTERNATIONAL, INC. RECONCILIATION OF KEY PERFORMANCE MEASURES TO COMMONLY USED GENERALLY ACCEPTED ACCOUNTING PRINCIPLE TERMS (in thousands, except per share data) UNAUDITED | ||||||||||
2018 | 2019 | |||||||||
1ST QTR | 2ND QTR | 3RD QTR | 4TH QTR | TOTAL | 1ST QTR | 2ND QTR | 3RD QTR | 4TH QTR | TOTAL | |
NET (LOSS) INCOME | $(17,441) | $5,902 | $(6,841) | $(21,005) | $(39,384) | $(4,634) | $(18,520) | $(112,337) | $1,556 | $(133,935) |
LESS: | ||||||||||
Restructuring related inventory charges | 473 | 16 | — | (137) | 352 | 325 | — | (1,145) | — | (820) |
Amortization of inventory step-up | 6,600 | — | — | — | 6,600 | — | — | — | — | — |
Restructuring charges, net | 3,424 | 524 | 1,075 | 825 | 5,848 | 358 | 299 | 5,038 | (509) | 5,186 |
Acquisition amortization | 11,797 | 11,767 | 11,735 | 12,012 | 47,311 | 12,078 | 11,247 | 11,202 | 11,188 | 45,715 |
Acquisition depreciation | 1,837 | 1,735 | 1,742 | 1,735 | 7,049 | 1,124 | 1,106 | 1,101 | 1,021 | 4,352 |
Special charges (recoveries), net | 3,360 | 1,629 | 1,913 | 6,160 | 13,061 | (8,200) | 3,916 | 18,481 | 3,489 | 17,686 |
Income tax impact | (5,798) | (4,213) | (1,857) | 10,998 | (870) | 3,625 | (2,266) | 5,533 | (1,752) | 5,140 |
Net income (loss) from discontinued operations | 3,468 | (4,802) | 2,874 | 4,498 | 6,038 | 5,728 | 17,156 | 84,688 | 1,595 | 109,167 |
ADJUSTED NET INCOME | $7,719 | $12,556 | $10,642 | $15,086 | $46,004 | $10,404 | $12,938 | $12,592 | $16,588 | $52,492 |
(LOSS) EARNINGS PER COMMON SHARE (Diluted) | $(0.88) | $0.30 | $(0.34) | $(1.06) | $(1.99) | $(0.23) | $(0.93) | $(5.64) | $0.08 | $(6.73) |
LESS: | ||||||||||
Restructuring related inventory charges | 0.02 | — | — | (0.01) | 0.02 | 0.02 | — | (0.06) | — | (0.04) |
Amortization of inventory step-up | 0.33 | — | — | — | 0.33 | — | — | — | — | — |
Restructuring charges, net | 0.17 | 0.03 | 0.05 | 0.04 | 0.29 | 0.02 | 0.02 | 0.25 | (0.03) | 0.26 |
Acquisition amortization | 0.60 | 0.59 | 0.59 | 0.61 | 2.39 | 0.61 | 0.57 | 0.56 | 0.56 | 2.30 |
Acquisition depreciation | 0.09 | 0.09 | 0.09 | 0.09 | 0.36 | 0.06 | 0.06 | 0.06 | 0.05 | 0.22 |
Special charges (recoveries), net | 0.17 | 0.08 | 0.10 | 0.31 | 0.66 | (0.41) | 0.20 | 0.93 | 0.18 | 0.89 |
Income tax impact | (0.29) | (0.21) | (0.10) | 0.55 | (0.06) | 0.18 | (0.12) | 0.28 | (0.10) | 0.24 |
Earnings (Loss) Per Share from discontinued operations | 0.18 | (0.24) | 0.14 | 0.23 | 0.30 | 0.29 | 0.86 | 4.25 | 0.08 | 5.48 |
ADJUSTED EARNINGS PER SHARE (Diluted) | $0.39 | $0.63 | $0.53 | $0.76 | $2.30 | $0.52 | $0.64 | $0.63 | $0.82 | $2.62 |
Numbers may not add due to rounding. | ||||||||||
13
CIRCOR INTERNATIONAL, INC. RECONCILIATION OF KEY PERFORMANCE MEASURES TO COMMONLY USED GENERALLY ACCEPTED ACCOUNTING PRINCIPLE TERMS (in thousands) UNAUDITED | ||||||||||||||
2018 | 2019 | |||||||||||||
1ST QTR | 2ND QTR | 3RD QTR | 4TH QTR | TOTAL | 1ST QTR | 2ND QTR | 3RD QTR | 4TH QTR | TOTAL | |||||
NET (LOSS) INCOME | $(17,441) | $5,902 | $(6,841) | $(21,005) | $(39,384) | $(4,633) | $(18,520) | $(112,338) | $1,556 | $(133,935) | ||||
LESS: | ||||||||||||||
Interest expense, net | 11,810 | 13,764 | 14,137 | 13,264 | 52,975 | 13,094 | 12,947 | 11,804 | 10,764 | 48,609 | ||||
Depreciation | 4,834 | 4,791 | 9,983 | 6,576 | 26,183 | 5,499 | 5,568 | 5,551 | 5,427 | 22,045 | ||||
Amortization | 14,134 | 13,985 | 8,632 | 12,477 | 49,228 | 12,536 | 11,685 | 11,629 | 11,741 | 47,591 | ||||
Benefit from (provision for) income taxes | (3,782) | (608) | (45) | 13,885 | 9,451 | 5,709 | 284 | 7,490 | 1,193 | 14,676 | ||||
Loss from discontinued operations | 3,468 | (4,802) | 2,874 | 4,498 | 6,038 | 5,728 | 17,156 | 84,688 | 1,595 | 109,167 | ||||
EBITDA | $13,023 | $33,032 | $28,740 | $29,695 | $104,490 | $37,933 | $29,120 | $8,857 | $32,276 | $108,153 | ||||
LESS: | ||||||||||||||
Restructuring related inventory charges | 473 | 16 | — | (137) | 352 | 325 | — | (1,145) | — | (820) | ||||
Amortization of inventory step-up | 6,600 | — | — | — | 6,600 | — | — | — | — | — | ||||
Restructuring charges, net | 3,424 | 524 | 1,075 | 825 | 5,848 | 358 | 299 | 5,038 | (509) | 5,186 | ||||
Special recoveries (charges), net | 3,360 | 1,629 | 1,913 | 6,160 | 13,061 | (8,200) | 3,916 | 18,481 | 3,489 | 17,686 | ||||
ADJUSTED EBITDA | $26,880 | $35,200 | $31,728 | $36,544 | $130,351 | $30,416 | $33,335 | $31,230 | $35,256 | $130,203 | ||||
Numbers may not add due to rounding. | ||||||||||||||
Leverage Calculations: | ||||||||||||||
Full Year 2019, as reported | Full Year 2019, Pro Forma for I&S Divestiture (b) | |||||||||||||
GROSS DEBT, NET OF CASH (Net Debt) | $ | 569,319 | Net Debt | $ | 569,319 | |||||||||
Net Debt / 2019 Adjusted EBITDA | 4.4 x | Net proceeds from I&S sale | (160,000 | ) | ||||||||||
Pro Forma Net Debt | $ | 409,319 | ||||||||||||
2019 Investor Plan Comparison | ||||||||||||||
2019 Adjusted EBITDA - Reported | $ | 130,203 | 2019 EBITDA as reported | $ | 130,203 | |||||||||
Engineered Valves & Distributed Valves First Half (a) | (6,619 | ) | 2019 I&S EBITDA | (16,811 | ) | |||||||||
2019 Adjusted EBITDA - Investor Plan | $ | 123,584 | Pro Forma Adjusted EBITDA | $ | 113,392 | |||||||||
Net Debt / Adjusted EBITDA - Investor Plan | 4.6 x | Pro Forma Net Debt / Pro Forma Adjusted EBITDA | 3.6 x | |||||||||||
(a) The Company's June 2019 investor plan included the results of Engineered Valves and Distributed Valves for the first half of 2019. In Q3 2019, both businesses were reclassified to discontinued operations. | ||||||||||||||
(b) The Company sold its Instrumentation & Sampling business in January 2020 for $172 million. These pro forma calculations reduce net debt by the expected net proceeds of $160 million and remove 2019 EBITDA from the reported EBITDA. | ||||||||||||||
14
CIRCOR INTERNATIONAL, INC. RECONCILIATION OF KEY PERFORMANCE MEASURES TO COMMONLY USED GENERALLY ACCEPTED ACCOUNTING PRINCIPLE TERMS (in thousands, except per share data) UNAUDITED | ||||||||||||||||||||||||||||||
2018 | 2019 | |||||||||||||||||||||||||||||
1ST QTR | 2ND QTR | 3RD QTR | 4TH QTR | TOTAL | 1ST QTR | 2ND QTR | 3RD QTR | 4TH QTR | TOTAL | |||||||||||||||||||||
GAAP OPERATING (LOSS) INCOME | $ | (7,787 | ) | $ | 10,599 | $ | 8,545 | $ | 10,295 | $ | 21,653 | $ | 17,749 | $ | 12,020 | $ | (9,084 | ) | $ | 16,996 | $ | 37,681 | ||||||||
LESS: | ||||||||||||||||||||||||||||||
Restructuring related inventory charges | 473 | 16 | — | (137 | ) | 352 | 325 | — | (1,145 | ) | — | (820 | ) | |||||||||||||||||
Amortization of inventory step-up | 6,600 | — | — | — | 6,600 | — | — | — | — | — | ||||||||||||||||||||
Restructuring charges, net | 3,424 | 524 | 1,075 | 825 | 5,848 | 358 | 299 | 5,038 | (509 | ) | 5,186 | |||||||||||||||||||
Acquisition amortization | 11,797 | 11,767 | 11,735 | 12,012 | 47,311 | 12,078 | 11,247 | 11,202 | 11,188 | 45,715 | ||||||||||||||||||||
Acquisition depreciation | 1,837 | 1,735 | 1,742 | 1,735 | 7,049 | 1,123 | 1,106 | 1,101 | 1,021 | 4,351 | ||||||||||||||||||||
Special charges (recoveries), net | 3,360 | 1,629 | 1,913 | 6,160 | 13,061 | (8,200 | ) | 3,916 | 18,481 | 3,489 | 17,686 | |||||||||||||||||||
ADJUSTED OPERATING INCOME | $19,704 | $26,269 | $25,010 | $30,890 | $101,873 | $23,433 | $28,589 | $25,594 | $32,185 | $109,799 | ||||||||||||||||||||
GAAP OPERATING MARGIN | (3.2 | )% | 4.1 | % | 3.5 | % | 3.9 | % | 2.1 | % | 7.4 | % | 4.9 | % | (3.8 | )% | 7.0 | % | 3.9 | % | ||||||||||
LESS: | — | % | — | % | — | % | — | % | — | % | — | % | — | % | — | % | — | % | — | % | ||||||||||
Restructuring related inventory charges | 0.2 | % | — | % | — | % | (0.1 | )% | — | % | 0.1 | % | — | % | (0.5 | )% | — | % | (0.1 | )% | ||||||||||
Amortization of inventory step-up | 2.8 | % | — | % | — | % | — | % | 0.7 | % | — | % | — | % | — | % | — | % | — | % | ||||||||||
Restructuring charges, net | 1.4 | % | 0.2 | % | 0.4 | % | 0.3 | % | 0.6 | % | 0.2 | % | 0.1 | % | 2.1 | % | (0.2 | )% | 0.5 | % | ||||||||||
Acquisition amortization | 4.9 | % | 4.5 | % | 4.7 | % | 4.5 | % | 4.7 | % | 5.1 | % | 4.6 | % | 4.7 | % | 4.6 | % | 4.7 | % | ||||||||||
Acquisition depreciation | 0.8 | % | 0.7 | % | 0.7 | % | 0.7 | % | 0.7 | % | 0.5 | % | 0.5 | % | 0.5 | % | 0.4 | % | 0.5 | % | ||||||||||
Special charges (recoveries), net | 1.4 | % | 0.6 | % | 0.8 | % | 2.3 | % | 1.3 | % | (3.4 | )% | 1.6 | % | 7.8 | % | 1.4 | % | 1.8 | % | ||||||||||
Income tax impact | — | % | — | % | — | % | — | % | — | % | — | % | — | % | — | % | — | % | — | % | ||||||||||
Net income loss from discontinued operations | — | % | — | % | — | % | — | % | — | % | — | % | — | % | — | % | — | % | — | % | ||||||||||
ADJUSTED OPERATING MARGIN | 8.2 | % | 10.1 | % | 10.1 | % | 11.6 | % | 10.1 | % | 9.8 | % | 11.6 | % | 10.8 | % | 13.3 | % | 11.4 | % | ||||||||||
Impact of Divestitures (1) | 0.2 | % | (0.2 | )% | (0.7 | )% | (0.2 | )% | (0.3 | )% | (0.3 | )% | (0.4 | )% | 0.1 | % | — | % | (0.1 | )% | ||||||||||
ADJUSTED OPERATING MARGIN EXCLUDING DIVESTITURES (1) | 8.4 | % | 9.9 | % | 9.4 | % | 11.4 | % | 9.8 | % | 9.5 | % | 11.2 | % | 10.9 | % | 13.3 | % | 11.2 | % | ||||||||||
Numbers may not add due to rounding. | ||||||||||||||||||||||||||||||
15