Attached files
| file | filename |
|---|---|
| EX-99.1 - PRESS RELEASE - TPI COMPOSITES, INC | exh_991.htm |
| 8-K - FORM 8-K - TPI COMPOSITES, INC | f8k_022720.htm |
EXHIBIT 99.2

Q4 2019 Earnings Call February 27, 2020
Q4 2019 Earnings Call Legal Disclaimer This presentation contains forward - looking statements within the meaning of the federal securities law. All statements other tha n statements of historical facts contained in this presentation, including statements regarding our future results of operations and financial position, business strategy and p lan s and objectives of management for future operations, are forward - looking statements. In many cases, you can identify forward - looking statements by terms such as “may,” “should,” “ex pects,” “plans,” “anticipates,” “could,” “intends,” “target,” “projects,” “contemplates,” “believes,” “estimates,” “predicts,” “potential” or “continue” or the negative of these te rms or other similar words. Forward - looking statements contained in this presentation include, but are not limited to, statements about: ( i ) growth of the wind energy market and our addressable market; (ii) the potential impact of the increasing prevalence of auction - based tenders in the wind energy market and increased competition from solar energy on our gros s margins and overall financial performance; (iii) our future financial performance, including our net sales, cost of goods sold, gross profit or gross margin, operating expens es, ability to generate positive cash flow, and ability to achieve or maintain profitability; (iv) changes in domestic or international government or regulatory policy, including witho ut limitation, changes in trade policy; (v) the sufficiency of our cash and cash equivalents to meet our liquidity needs; (vi) our ability to attract and retain customers for our products, and to optimize product pricing; (vii) our ability to effectively manage our growth strategy and future expenses, including our startup and transition costs; (viii) competition from other win d b lade and wind blade turbine manufacturers; (ix) the discovery of defects in our products; (x) our ability to successfully expand in our existing wind energy markets and into new in ternational wind energy markets, including our ability to expand our field service inspection and repair services in wind energy markets; (xi) our ability to successfully open new man ufa cturing facilities and expand existing facilities on time and on budget; (xii) the impact of the accelerated pace of new product and wind blade model introductions on our business and ou r results of operations; (xiii) our ability to successfully expand our transportation business and execute upon our strategy of entering new markets outside of wind energy; (x iv) the potential impact of the Coronavirus on our business and results of operations; (xv) worldwide economic conditions and their impact on customer demand; (xvi) our ability to maintain, protect and enhance our intellectual property; (xvii) our ability to comply with existing, modified or new laws and regulations applying to our business, includin g t he imposition of new taxes, duties or similar assessments on our products; (xviii) the attraction and retention of qualified employees and key personnel; (xix) our ability to maintai n g ood working relationships with our employees, and avoid labor disruptions, strikes and other disputes with labor unions that represent certain of our employees; (xx) our ability to pro cure adequate supplies of raw materials and components to fulfill our wind blade volume commitments to our customers and (xxi) the potential impact of one or more of our customers bec oming bankrupt or insolvent, or experiencing other financial problems. These forward - looking statements are only predictions. These statements relate to future events or our future financial performa nce and involve known and unknown risks, uncertainties and other important factors that may cause our actual results, levels of activity, performance or achievements to materially differ from any future results, levels of activity, performance or achievements expressed or implied by these forward - looking statements. Because forward - looking statements are inh erently subject to risks and uncertainties, some of which cannot be predicted or quantified, you should not rely on these forward - looking statements as guarantees of future even ts. Further information on the factors, risks and uncertainties that could affect our financial results and the forward - looking statements in this presentation are included in ou r filings with the Securities and Exchange Commission and will be included in subsequent periodic and current reports we make with the Securities and Exchange Commission from time to time, including in our Annual Report on Form 10 - K for the year ended December 31, 2019. The forward - looking statements in this presentation represent our views as of the date of this presentation. We anticipate that subsequent events and developments will cause our views to change. However, while we may elect to update these forward - looking statements at some point in the future, we undertak e no obligation to update any forward - looking statement to reflect events or developments after the date on which the statement is made or to reflect the occurrence of una nti cipated events except to the extent required by applicable law. You should, therefore, not rely on these forward - looking statements as representing our views as of any date aft er the date of this presentation. Our forward - looking statements do not reflect the potential impact of any future acquisitions, mergers, dispositions, joint ventures, or investme nts we may make. This presentation includes unaudited non - GAAP financial measures including total billings, EBITDA, adjusted EBITDA, net cash (de bt) and free cash flow. We define total billings as the total amounts we have invoiced our customers for products and services for which we are entitled to payment under the ter ms of our long - term supply agreements or other contractual agreements. We define EBITDA as net income (loss) plus interest expense (including losses on the extinguishment o f d ebt and net of interest income), income taxes and depreciation and amortization. We define Adjusted EBITDA as EBITDA plus any share - based compensation expense, plus or minus any realized gains or losses from foreign currency remeasurement and any realized gains or losses on the sale of assets and asset impairments. We define net cash (debt ) a s total unrestricted cash and cash equivalents less the total principal amount of debt outstanding. We define free cash flow as net cash flow from operating activities less capital expenditures. We present non - GAAP measures when we believe that the additional information is useful and meaningful to investors. Non - GAAP financial measures do not have a ny standardized meaning and are therefore unlikely to be comparable to similar measures presented by other companies. The presentation of non - GAAP financial measures is n ot intended to be a substitute for, and should not be considered in isolation from, the financial measures reported in accordance with GAAP. See the Appendix for the reconcilia tio ns of certain non - GAAP financial measures to the comparable GAAP measures. This presentation also contains estimates and other information concerning our industry that are based on industry publicatio ns, surveys and forecasts. This information involves a number of assumptions and limitations, and we have not independently verified the accuracy or completeness of the information . February 27, 2020 2
Q4 2018 Earnings Call Agenda • Q4 and Full Year 2019 Highlights • Q4 and Full Year 2019 Financial Highlights • Guidance for 2020 • Q&A • Appendix – Non - GAAP Information 3 February 27, 2020
February 27, 2020 Q4 and Full Year 2019 Highlights
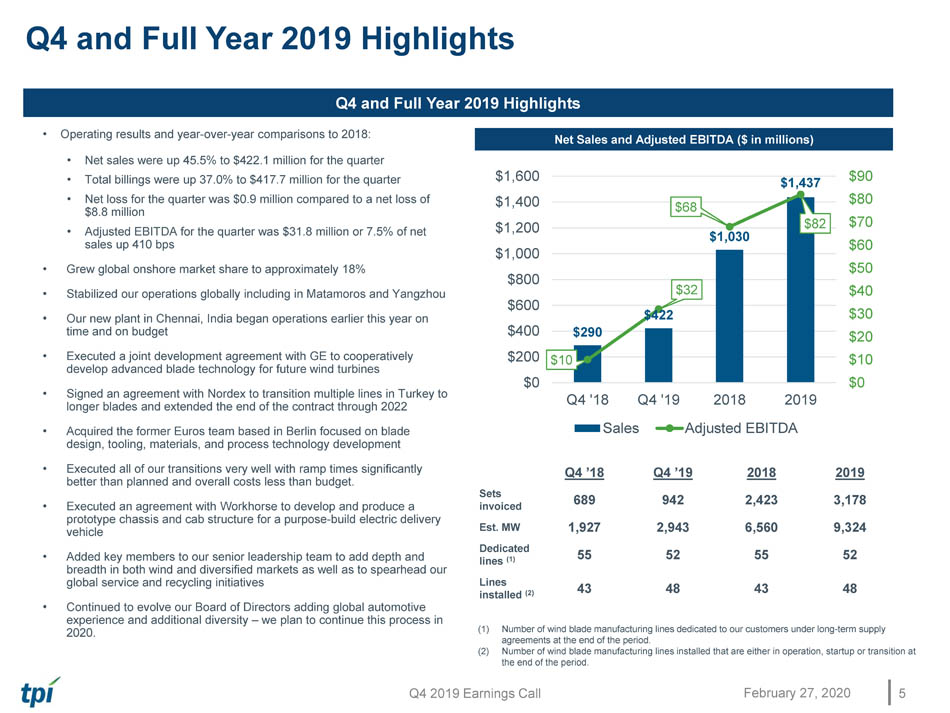
Q4 2019 Earnings Call $290 $422 $1,030 $1,437 $10 $32 $68 $82 $0 $10 $20 $30 $40 $50 $60 $70 $80 $90 $0 $200 $400 $600 $800 $1,000 $1,200 $1,400 $1,600 Q4 '18 Q4 '19 2018 2019 Sales Adjusted EBITDA Q4 and Full Year 2019 Highlights Q4 and Full Year 2019 Highlights • Operating results and year - over - year comparisons to 201 8: • Net sales were up 45.5% to $422.1 million for the quarter • Total billings were up 37.0% to $417.7 million for the quarter • N et loss for the quarter was $ 0.9 million compared to a net loss of $8.8 million • Adjusted EBITDA for the quarter was $31.8 million or 7.5% of net sales up 410 bps • Grew global onshore market share to approximately 18% • Stabilized our operations globally including in Matamoros and Yangzhou • Our new plant in Chennai, India began operations earlier this year on time and on budget • Executed a joint development agreement with GE to cooperatively develop advanced blade technology for future wind turbines • Signed an agreement with Nordex to transition multiple lines in Turkey to longer blades and extended the end of the contract through 2022 • Acquired the former Euros team based in Berlin focused on blade design, tooling, materials, and process technology development • Executed all of our transitions very well with ramp times significantly better than planned and overall costs less than budget. • Executed an agreement with Workhorse to develop and produce a prototype chassis and cab structure for a purpose - build electric delivery vehicle • Added key members to our senior leadership team to add depth and breadth in both wind and diversified markets as well as to spearhead our global service and recycling initiatives • Continued to evolve our Board of Directors adding global automotive experience and additional diversity – we plan to continue this process in 2020. Net Sales and Adjusted EBITDA ($ in millions) (1) Number of wind blade manufacturing lines dedicated to our customers under long - term supply agreement s at the end of the period. (2) Number of wind blade manufacturing lines installed that are either in operation, startup or transition at the end of the period. February 27, 2020 5 Q4 ’18 Q4 ’19 2018 2019 Sets invoiced 689 942 2,423 3,178 Est. MW 1,927 2,943 6,560 9,324 Dedicated lines (1) 55 52 55 52 Lines installed (2) 43 48 43 48
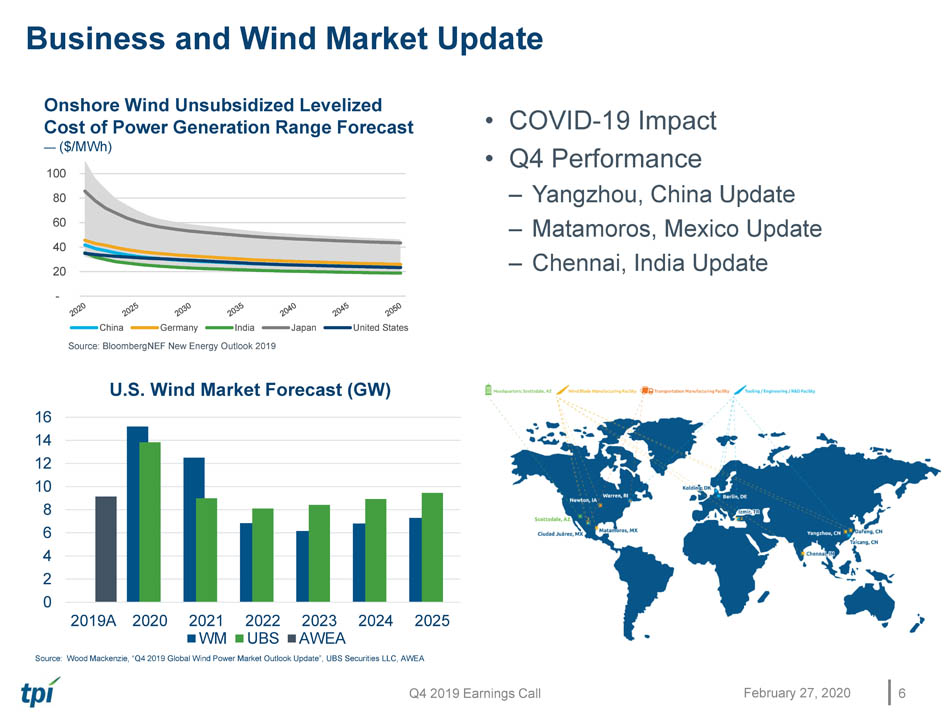
Q4 2019 Earnings Call Business and Wind Market Update 0 2 4 6 8 10 12 14 16 2019A 2020 2021 2022 2023 2024 2025 U.S. Wind Market Forecast (GW) WM UBS AWEA Source: Wood Mackenzie, “Q4 2019 Global Wind Power Market Outlook Update”, UBS Securities LLC, AWEA 6 February 27, 2020 - 20 40 60 80 100 China Germany India Japan United States Source: BloombergNEF New Energy Outlook 2019 Onshore Wind Unsubsidized Levelized Cost of Power Generation Range Forecast — ($/MWh) • COVID - 19 Impact • Q4 Performance – Yangzhou, China Update – Matamoros, Mexico Update – Chennai, India Update
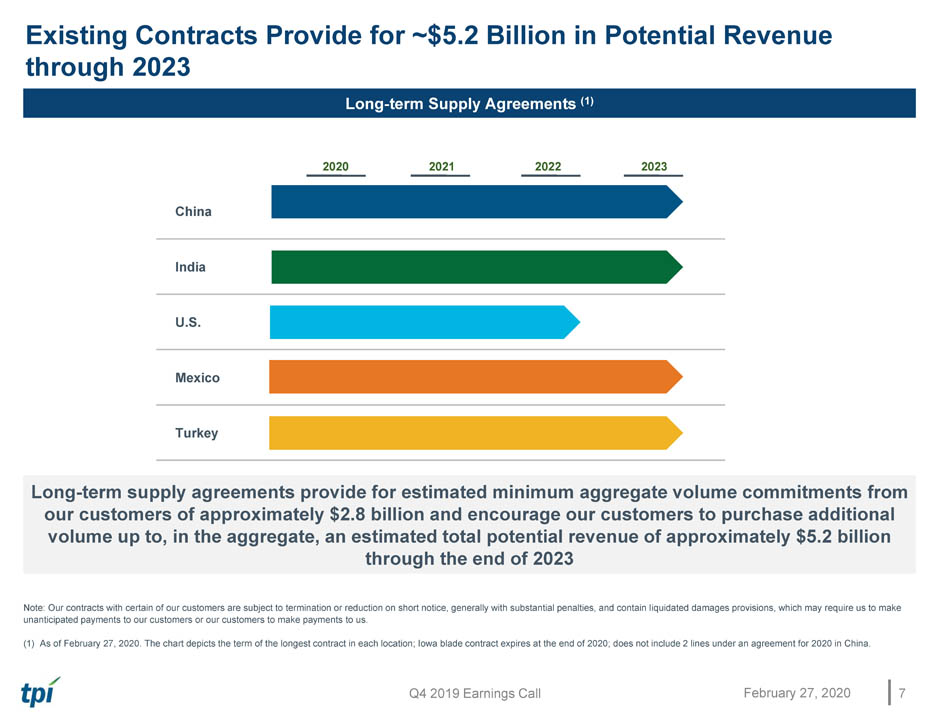
Q4 2019 Earnings Call Existing Contracts Provide for ~$5.2 Billion in Potential Revenue through 2023 Long - term Supply Agreements (1) Long - term supply agreements provide for estimated minimum aggregate volume commitments from our customers of approximately $ 2.8 billion and encourage our customers to purchase additional volume up to, in the aggregate, an estimated total potential revenue of approximately $5.2 billion through the end of 2023 Note: Our contracts with certain of our customers are subject to termination or reduction on short notice, generally with substantial penalties, and contain l iqu idated damages provisions, which may require us to make unanticipated payments to our customers or our customers to make payments to us. (1) As of February 27, 2020. The chart depicts the term of the longest contract in each location ; Iowa blade contract expires at the end of 2020 ; does not include 2 lines under an agreement for 2020 in China. 2020 2021 2022 2023 China India U.S. Mexico Turkey February 27, 2020 7
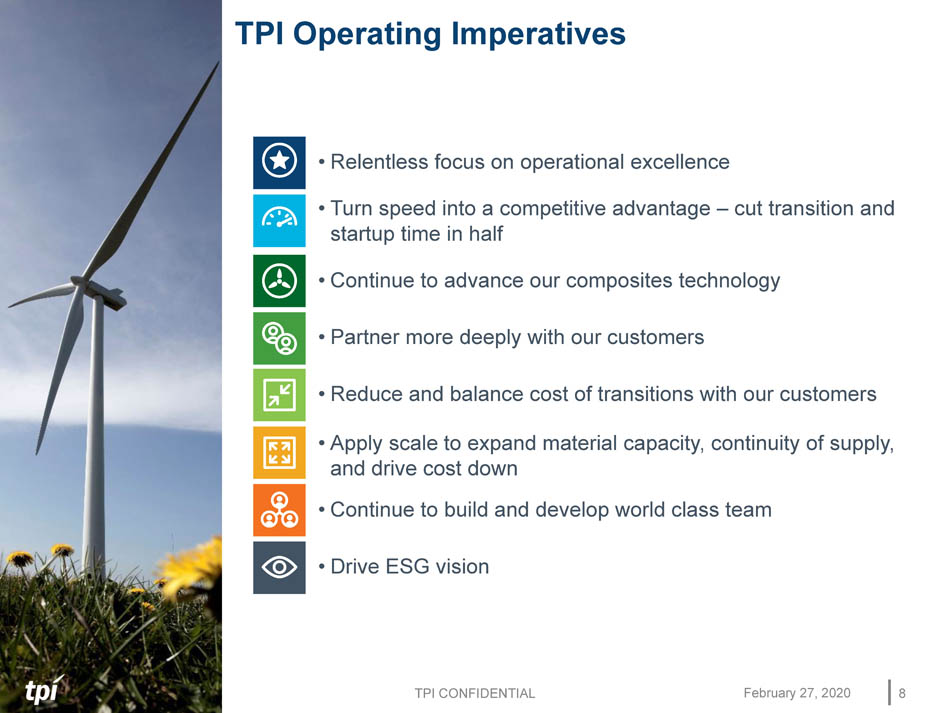
TPI CONFIDENTIAL TPI Operating Imperatives 8 February 27, 2020 • Relentless focus on operational excellence • Turn speed into a competitive advantage – cut transition and startup time in half • Continue to advance our composites technology • Partner more deeply with our customers • Reduce and balance cost of transitions with our customers • Apply scale to expand material capacity, continuity of supply, and drive cost down • Continue to build and develop world class team • Drive ESG vision
February 27, 2020 Q4 and Full Year 2019 Financial Highlights 9
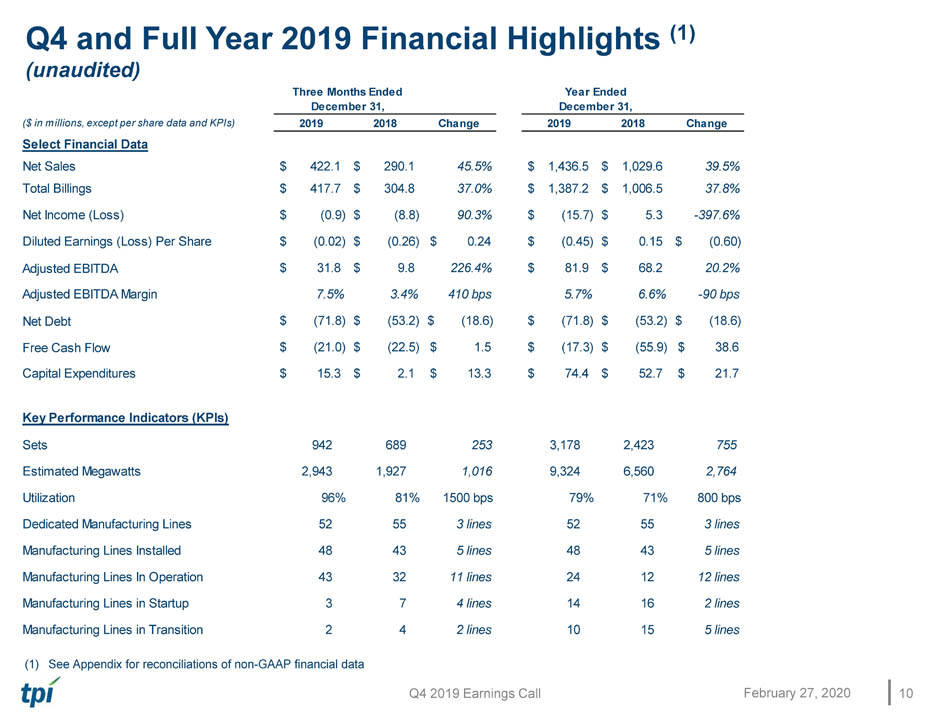
Q4 2019 Earnings Call Q4 and Full Year 2019 Financial Highlights (1) (unaudited) ($ in millions, except per share data and KPIs) 2019 2018 Change 2019 2018 Change Select Financial Data Net Sales $ 422.1 $ 290.1 45.5% $ 1,436.5 $ 1,029.6 39.5% Total Billings $ 417.7 $ 304.8 37.0% $ 1,387.2 $ 1,006.5 37.8% Net Income (Loss) $ (0.9) $ (8.8) 90.3% $ (15.7) $ 5.3 -397.6% Diluted Earnings (Loss) Per Share $ (0.02) $ (0.26) $ 0.24 $ (0.45) $ 0.15 $ (0.60) Adjusted EBITDA (1) $ 31.8 $ 9.8 226.4% $ 81.9 $ 68.2 20.2% Adjusted EBITDA Margin 7.5% 3.4% 410 bps 5.7% 6.6% -90 bps Net Debt (1) $ (71.8) $ (53.2) $ (18.6) $ (71.8) $ (53.2) $ (18.6) Free Cash Flow (1) $ (21.0) $ (22.5) $ 1.5 $ (17.3) $ (55.9) $ 38.6 Capital Expenditures $ 15.3 $ 2.1 $ 13.3 $ 74.4 $ 52.7 $ 21.7 Key Performance Indicators (KPIs) Sets 942 689 253 3,178 2,423 755 Estimated Megawatts 2,943 1,927 1,016 9,324 6,560 2,764 Utilization 96% 81% 1500 bps 79% 71% 800 bps Dedicated Manufacturing Lines 52 55 3 lines 52 55 3 lines Manufacturing Lines Installed 48 43 5 lines 48 43 5 lines Manufacturing Lines In Operation 43 32 11 lines 24 12 12 lines Manufacturing Lines in Startup 3 7 4 lines 14 16 2 lines Manufacturing Lines in Transition 2 4 2 lines 10 15 5 lines Three Months Ended December 31, Year Ended December 31, 10 February 27, 2020 (1) See Appendix for reconciliations of non - GAAP financial data
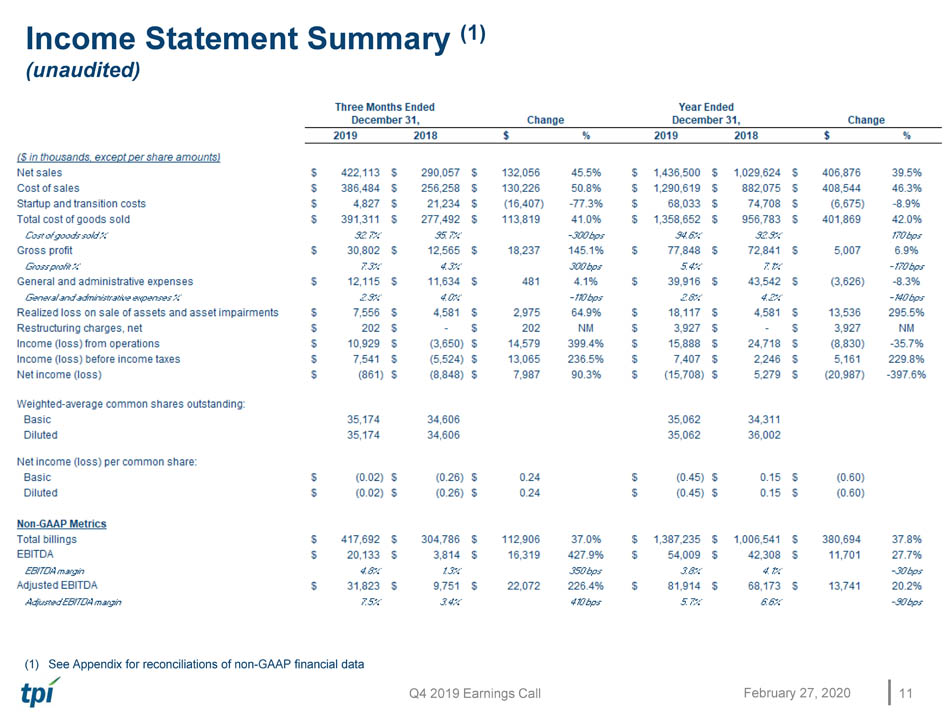
Q4 2019 Earnings Call Income Statement Summary (1) (unaudited) 11 February 27, 2020 (1) See Appendix for reconciliations of non - GAAP financial data
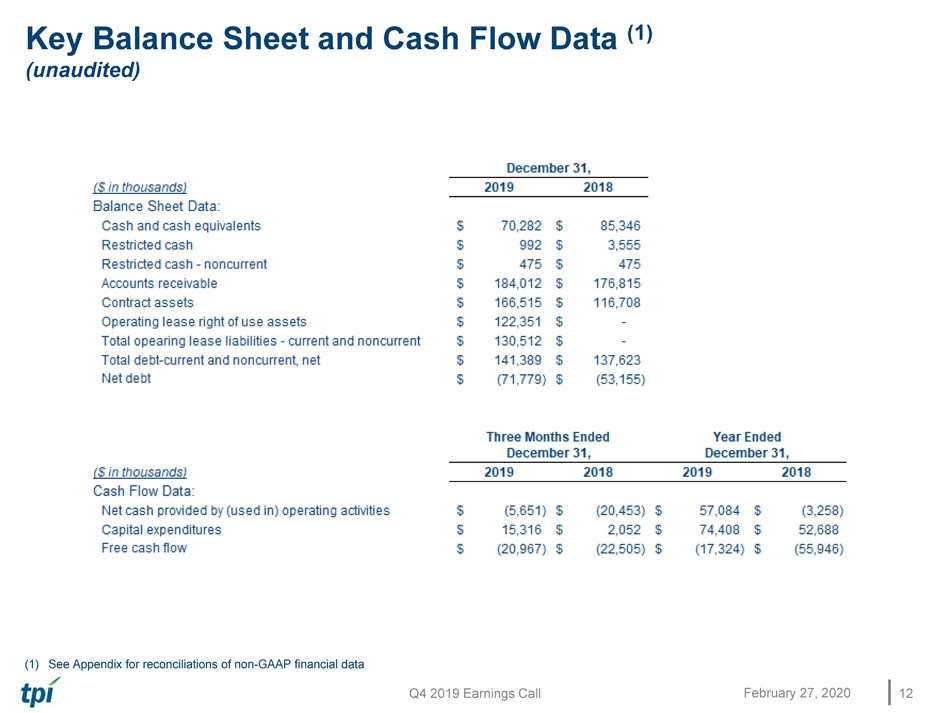
Q4 2019 Earnings Call Key Balance Sheet and Cash Flow Data (1) (unaudited) February 27, 2020 12 (1) See Appendix for reconciliations of non - GAAP financial data
February 27, 2020 Guidance for 2020
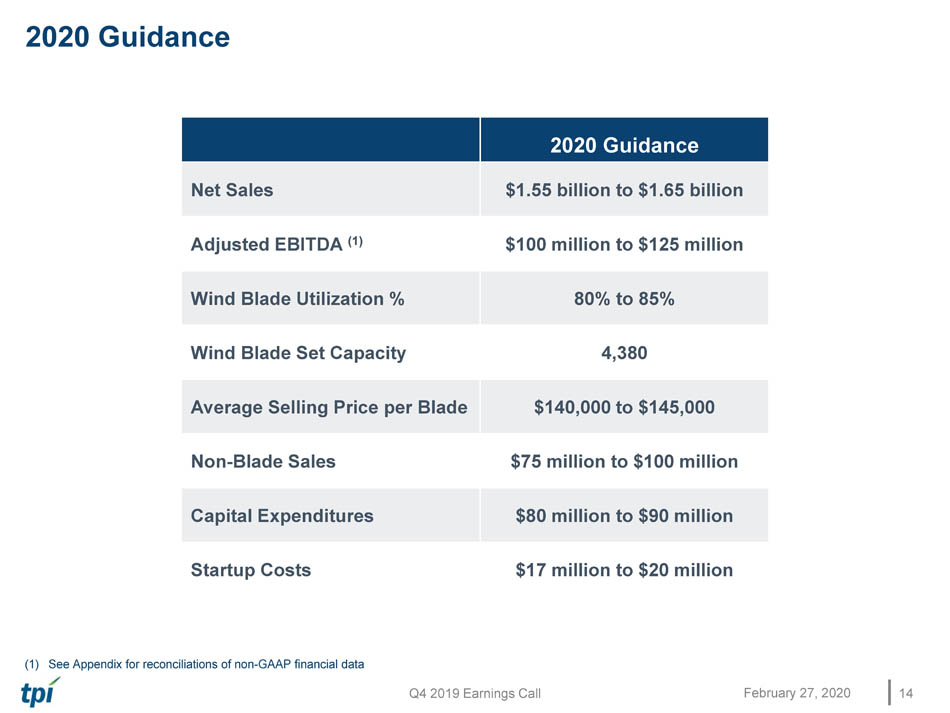
Q4 2019 Earnings Call 2020 Guidance February 27, 2020 14 2020 Guidance Net Sales $1.55 billion to $1.65 billion Adjusted EBITDA (1) $100 million to $125 million Wind Blade Utilization % 80% to 85% Wind Blade Set Capacity 4,380 Average Selling Price per Blade $140,000 to $145,000 Non - Blade Sales $75 million to $100 million Capital Expenditures $80 million to $90 million Startup Costs $17 million to $20 million (1) See Appendix for reconciliations of non - GAAP financial data

February 27, 2020 Q&A
February 27, 2020 Appendix – Non - GAAP Information 16 This presentation includes unaudited non - GAAP financial measures including total billings, EBITDA, adjusted EBITDA, net cash (debt) and free cash flow. We define total billings as the total amounts we have invoiced our customers for products and services for which we are entitled to payment under the terms of our long - term supply agreements or other contractual agreements. We define EBITDA as net income (loss) plus interest expense (including losses on the extinguishment of debt and net of interest income), income taxes and depreciation and amortization. We define Adjusted EBITDA as EBITDA plus any share - based compensation expense, plus or minus any realized gains or losses from foreign currency remeasurement and any realized gains or losses on the sale of assets and asset impairments. We define net cash (debt) as total unrestricted cash and cash equivalents less the total principal amount of debt outstanding. We define free cash flow as net cash flow from operating activities less capital expenditures. We present non - GAAP measures when we believe that the additional information is useful and meaningful to investors. Non - GAAP financial measures do not have any standardized meaning and are therefore unlikely to be comparable to similar measures presented by other companies. The presentation of non - GAAP financial measures is not intended to be a substitute for, and should not be considered in isolation from, the financial measures reported in accordance with GAAP. See below for a reconciliation of certain non - GAAP financial measures to the comparable GAAP measures.
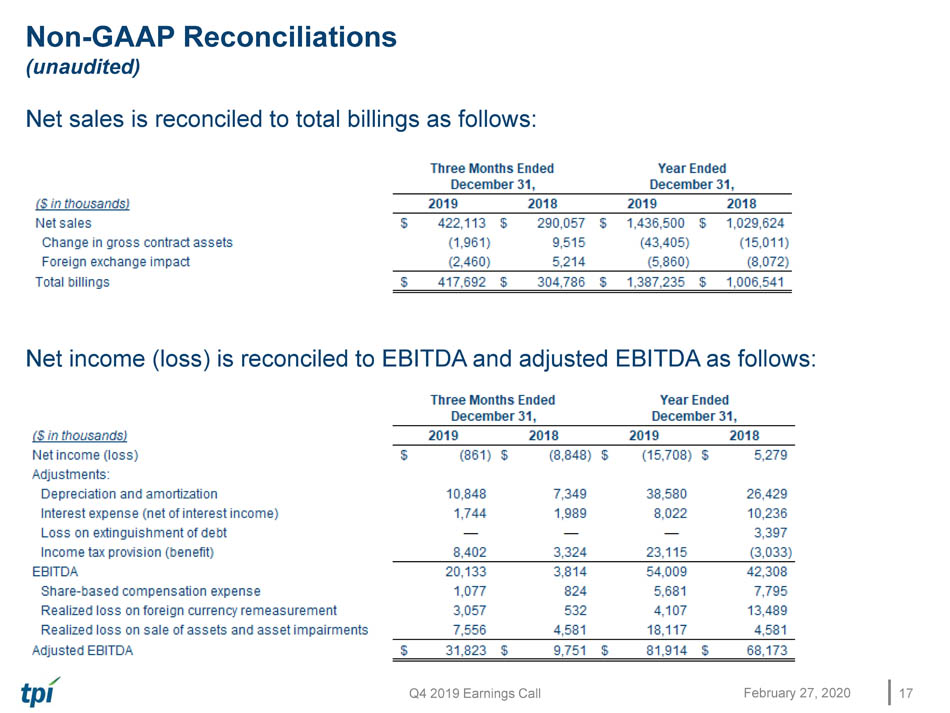
Q4 2019 Earnings Call Non - GAAP Reconciliations (unaudited) Net sales is reconciled to total billings as follows: Net income (loss) is reconciled to EBITDA and adjusted EBITDA as follows: February 27, 2020 17
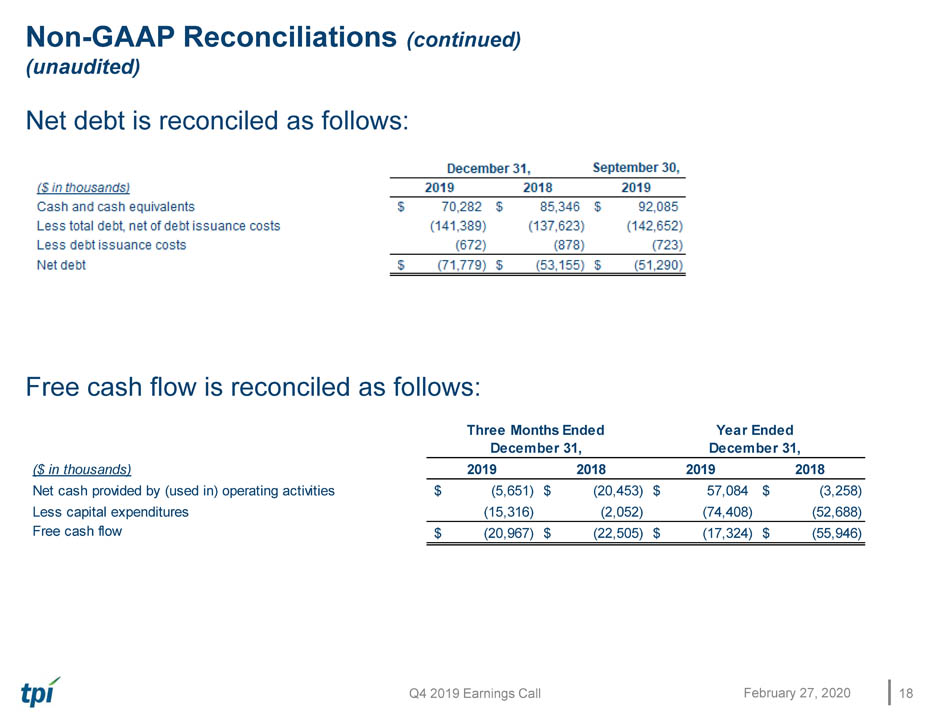
Q4 2019 Earnings Call Non - GAAP Reconciliations (continued) (unaudited) Net debt is reconciled as follows: Free cash flow is reconciled as follows: February 27, 2020 18 ($ in thousands) 2019 2018 2019 2018 Net cash provided by (used in) operating activities (5,651)$ (20,453)$ 57,084$ (3,258)$ Less capital expenditures (15,316) (2,052) (74,408) (52,688) Free cash flow (1) (20,967)$ (22,505)$ (17,324)$ (55,946)$ Three Months Ended December 31, Year Ended December 31,
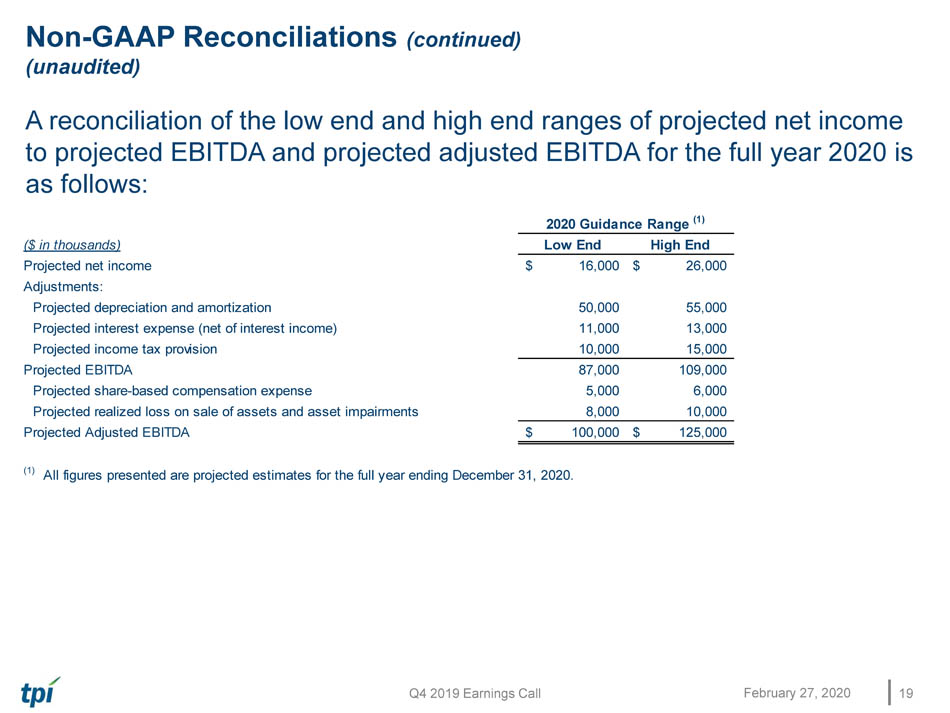
Q4 2019 Earnings Call Non - GAAP Reconciliations (continued) (unaudited) A reconciliation of the low end and high end ranges of projected net income to projected EBITDA and projected adjusted EBITDA for the full year 2020 is as follows: February 27, 2020 19 ($ in thousands) Low End High End Projected net income 16,000$ 26,000$ Adjustments: Projected depreciation and amortization 50,000 55,000 Projected interest expense (net of interest income) 11,000 13,000 Projected income tax provision 10,000 15,000 Projected EBITDA 87,000 109,000 Projected share-based compensation expense 5,000 6,000 Projected realized loss on sale of assets and asset impairments 8,000 10,000 Projected Adjusted EBITDA 100,000$ 125,000$ (1) All figures presented are projected estimates for the full year ending December 31, 2020. 2020 Guidance Range (1)