Attached files
| file | filename |
|---|---|
| EX-32.2 - EX-32.2 - TPI COMPOSITES, INC | tpic-ex322_539.htm |
| EX-32.1 - EX-32.1 - TPI COMPOSITES, INC | tpic-ex321_535.htm |
| EX-31.2 - EX-31.2 - TPI COMPOSITES, INC | tpic-ex312_536.htm |
| EX-31.1 - EX-31.1 - TPI COMPOSITES, INC | tpic-ex311_537.htm |
| EX-23.1 - EX-23.1 - TPI COMPOSITES, INC | tpic-ex231_538.htm |
UNITED STATES
SECURITIES AND EXCHANGE COMMISSION
Washington, D.C. 20549
FORM 10-K
(Mark One)
|
☒ |
ANNUAL REPORT PURSUANT TO SECTION 13 OR 15(d) OF THE SECURITIES EXCHANGE ACT OF 1934 |
For the fiscal year ended December 31, 2016
OR
|
☐ |
TRANSITION REPORT PURSUANT TO SECTION 13 OR 15(d) OF THE SECURITIES EXCHANGE ACT OF 1934 |
For the transition period from to
Commission File Number 001-37839

TPI Composites, Inc.
(Exact name of Registrant as specified in its Charter)
|
Delaware |
|
20-1590775 |
|
(State or other jurisdiction of incorporation or organization) |
|
(I.R.S. Employer Identification Number) |
8501 N. Scottsdale Rd.
Gainey Center II, Suite 100
Scottsdale, AZ 85253
(480) 305-8910
(Address, including zip code, and telephone number,
including area code, of registrant’s principal executive offices)
Securities registered pursuant to Section 12(b) of the Act:
|
Title of each class |
|
Name of each exchange on which registered |
|
Common Stock, par value $0.01 |
|
NASDAQ Global Market |
Securities registered pursuant to Section 12(g) of the Act: None
Indicate by check mark if the Registrant is a well-known seasoned issuer, as defined in Rule 405 of the Securities Act. YES ☐ NO ☒
Indicate by check mark if the Registrant is not required to file reports pursuant to Section 13 or 15(d) of the Act. YES ☐ NO ☒
Indicate by check mark whether the Registrant: (1) has filed all reports required to be filed by Section 13 or 15(d) of the Securities Exchange Act of 1934 during the preceding 12 months (or for such shorter period that the Registrant was required to file such reports), and (2) has been subject to such filing requirements for the past 90 days. YES ☒ NO ☐
Indicate by check mark whether the Registrant has submitted electronically and posted on its corporate Web site, if any, every Interactive Data File required to be submitted and posted pursuant to Rule 405 of Regulation S-T (§232.405 of this chapter) during the preceding 12 months (or for such shorter period that the Registrant was required to submit and post such files). YES ☒ NO ☐
Indicate by check mark if disclosure of delinquent filers pursuant to Item 405 of Regulation S-K (§229.405) is not contained herein, and will not be contained, to the best of Registrant’s knowledge, in definitive proxy or information statements incorporated by reference in Part III of this Form 10-K or any amendment to this Form 10-K. ☐
Indicate by check mark whether the Registrant is a large accelerated filer, an accelerated filer, a non-accelerated filer, or a smaller reporting company. See the definition of “large accelerated filer”, “accelerated filer”, and “smaller reporting company” in Rule 12b-2 of the Exchange Act. (Check one):
|
Large accelerated filer |
|
☐ |
|
Accelerated filer |
|
☐ |
|
|
|
|
|
|
|
|
|
Non-accelerated filer |
|
☒ (Do not check if a small reporting company) |
|
Small reporting company |
|
☐ |
Indicate by check mark whether the Registrant is a shell company (as defined in Rule 12b-2 of the Exchange Act). YES ☐ NO ☒
The aggregate market value of the common stock held by non-affiliates of the Registrant, based on the closing price of the shares of common stock on July 22, 2016 as reported by the NASDAQ Global Market on such date was approximately $81 million. The Registrant has elected to use July 22, 2016, which was the initial trading date on the NASDAQ Global Market, as the calculation date because on June 30, 2016 (the last business day of the Registrant’s most recently completed second fiscal quarter), the Registrant was a privately held company. Shares of the Registrant’s common stock held by each executive officer, director and holder of 5% or more of the outstanding common stock have been excluded in that such persons may be deemed to be affiliates. This calculation does not reflect a determination that certain persons are affiliates of the Registrant for any other purpose.
As of February 28, 2017, Registrant had 33,736,863 shares of common stock outstanding.
Documents Incorporated by Reference
Portions of the Registrant’s Definitive Proxy Statement relating to the Annual Meeting of Stockholders, scheduled to be held on May 16, 2017, are incorporated by reference into Part III of this Report.
|
|
|
|
|
Page |
|
PART I |
|
|
|
|
|
Item 1. |
|
|
2 |
|
|
Item 1A. |
|
|
13 |
|
|
Item 1B. |
|
|
39 |
|
|
Item 2. |
|
|
40 |
|
|
Item 3. |
|
|
40 |
|
|
Item 4. |
|
|
41 |
|
|
|
|
|
|
|
|
PART II |
|
|
|
|
|
Item 5. |
|
|
42 |
|
|
Item 6. |
|
|
44 |
|
|
Item 7. |
|
Management’s Discussion and Analysis of Financial Condition and Results of Operations |
|
47 |
|
Item 7A. |
|
|
73 |
|
|
Item 8. |
|
|
74 |
|
|
Item 9. |
|
Changes in and Disagreements With Accountants on Accounting and Financial Disclosure |
|
74 |
|
Item 9A. |
|
|
74 |
|
|
Item 9B. |
|
|
75 |
|
|
|
|
|
|
|
|
PART III |
|
|
|
|
|
Item 10. |
|
|
76 |
|
|
Item 11. |
|
|
76 |
|
|
Item 12. |
|
Security Ownership of Certain Beneficial Owners and Management and Related Stockholder Matters |
|
76 |
|
Item 13. |
|
Certain Relationships and Related Transactions, and Director Independence |
|
76 |
|
Item 14. |
|
|
76 |
|
|
|
|
|
|
|
|
PART IV |
|
|
|
|
|
Item 15. |
|
|
76 |
|
|
Item 16. |
|
|
76 |
i
SPECIAL NOTE REGARDING FORWARD-LOOKING STATEMENTS
This Annual Report on Form 10-K contains forward-looking statements. All statements other than statements of historical facts contained in this Annual Report on Form 10-K, including statements regarding our future results of operations and financial position, business strategy and plans and objectives of management for future operations, are forward-looking statements. In many cases, you can identify forward-looking statements by terms such as “may,” “should,” “expects,” “plans,” “anticipates,” “could,” “intends,” “target,” “projects,” “contemplates,” “believes,” “estimates,” “predicts,” “potential” or “continue” or the negative of these terms or other similar words. Forward-looking statements contained in this Annual Report on Form 10-K include, but are not limited to, statements about:
|
|
• |
growth of the wind energy market and our addressable market; |
|
|
• |
the potential impact of General Electric’s pending acquisition of LM Wind Power upon our business; |
|
|
• |
our future financial performance, including our net sales, cost of goods sold, gross profit or gross margin, operating expenses, ability to generate positive cash flow, and ability to achieve or maintain profitability; |
|
|
• |
the sufficiency of our cash and cash equivalents to meet our liquidity needs; |
|
|
• |
our ability to attract and retain customers for our products, and to optimize product pricing; |
|
|
• |
competition from other wind blade manufacturers and wind blade turbine manufacturers; |
|
|
• |
the discovery of defects in our products; |
|
|
• |
our ability to successfully expand in our existing markets and into new international markets; |
|
|
• |
worldwide economic conditions and their impact on customer demand; |
|
|
• |
our ability to effectively manage our growth strategy and future expenses; |
|
|
• |
our ability to maintain, protect and enhance our intellectual property; |
|
|
• |
our ability to comply with existing, modified or new laws and regulations applying to our business, including the imposition of new taxes, duties or similar assessments on our products; and |
|
|
• |
the attraction and retention of qualified employees and key personnel. |
These forward-looking statements are only predictions. These statements relate to future events or our future financial performance and involve known and unknown risks, uncertainties and other important factors that may cause our actual results, levels of activity, performance or achievements to materially differ from any future results, levels of activity, performance or achievements expressed or implied by these forward-looking statements. We have described under the heading “Risk Factors” included in Part 1, Item 1A of this Annual Report on Form 10-K the principal risks and uncertainties that we believe could cause actual results to differ from these forward-looking statements. Because forward-looking statements are inherently subject to risks and uncertainties, some of which cannot be predicted or quantified, you should not rely on these forward-looking statements as guarantees of future events.
The forward-looking statements in this Annual Report on Form 10-K represent our views as of the date of this Annual Report on Form 10-K. We anticipate that subsequent events and developments will cause our views to change. However, while we may elect to update these forward-looking statements at some point in the future, we undertake no obligation to update any forward-looking statement to reflect events or developments after the date on which the statement is made or to reflect the occurrence of unanticipated events except to the extent required by applicable law. You should, therefore, not rely on these forward-looking statements as representing our views as of any date after the date of this Annual Report on Form 10-K. Our forward-looking statements do not reflect the potential impact of any future acquisitions, mergers, dispositions, joint ventures, or investments we may make.
1
Description of Business
TPI Composites, Inc. is the holding company that conducts substantially all of its business operations through its direct and indirect subsidiaries (collectively, the Company or we). The Company was founded in 1968 and has been producing composite wind blades since 2001. The Company’s knowledge and experience of composite materials and manufacturing originates with its predecessor company, Tillotson Pearson Inc., a leading manufacturer of high-performance sail and powerboats along with a wide range of composite structures used in other industrial applications. Following the separation from the boat building business in 2004, the Company reorganized in Delaware as LCSI Holding, Inc. and then changed its corporate name to TPI Composites, Inc. in 2008.
Overview
We are the largest U.S.-based independent manufacturer of composite wind blades. We enable many of the industry’s leading wind turbine original equipment manufacturers (OEMs), who have historically relied on in-house production, to outsource the manufacturing of some of their wind blades through our global footprint of advanced manufacturing facilities strategically located to serve large and growing wind markets in a cost-effective manner. Given the importance of wind energy capture, turbine reliability and cost to power producers, the size, quality and performance of wind blades have become highly strategic to our OEM customers. As a result, we have become a key supplier to our OEM customers in the manufacture of wind blades and related precision molding and assembly systems. We have entered into long-term supply agreements pursuant to which we dedicate capacity at our facilities to our customers in exchange for their commitment to purchase minimum annual volumes of wind blade sets, which consist of three wind blades. As of February 28, 2017, our long-term supply agreements provide for estimated minimum aggregate volume commitments from our customers of $2.6 billion and encourage our customers to purchase additional volume up to, in the aggregate, an estimated total contract value of up to $3.9 billion through the end of 2023. This collaborative dedicated supplier model provides us with contracted volumes that generate significant revenue visibility, drive capital efficiency and allow us to produce wind blades at a lower total delivered cost, while ensuring critical dedicated capacity for our customers.
Our wind blade and precision molding and assembly systems manufacturing businesses accounted for over 99% of our total net sales for each of the years ended December 31, 2016, 2015 and 2014. We also leverage our advanced composite technology and history of innovation to supply high strength, lightweight and durable composite products to the transportation market. For a further discussion regarding our wind blade and precision molding and assembly system businesses, refer to the discussion in “Management’s Discussion and Analysis of Financial Condition and Results of Operations—Results of Operations” included in Part II, Item 7 of this Annual Report on Form 10-K.
Initial Public Offering and Stock Split
In July 2016, we completed an initial public offering (IPO) of 7,187,500 shares of our common stock at a price of $11.00 per share, which included 937,500 shares issued pursuant to the underwriters’ over-allotment option. Certain of our existing shareholders, a non-employee director and executive officers purchased an aggregate of 1,250,000 shares of common stock in the IPO included in the total issuance above. The net proceeds from the IPO were $67.2 million after deducting underwriting discounts and offering expenses. Immediately prior to the closing of the IPO, all shares of the then-outstanding redeemable preferred shares converted into an aggregate of 21,110,204 shares of common stock and the redeemable preferred share warrants converted on a net issuance basis into 120,923 shares of common stock. In addition, concurrent with the closing of the IPO, certain subordinated convertible promissory notes in the aggregate principal and interest amount of $11.9 million were converted into 1,079,749 shares of common stock at the public offering price of $11.00 per share.
Prior to the IPO, in July 2016 we amended our amended and restated certificate of incorporation to effect a 360-for-1 forward stock split of our common stock. As a result of the stock split, we have adjusted the share amounts authorized and issuable under our share-based compensation plans. All share and per share common stock information (including those related to our share-based compensation plans) referenced throughout the consolidated
2
financial statements and notes thereto have been retroactively adjusted to reflect this stock split. The stock split did not cause an adjustment to the par value of the authorized shares of common stock.
Financial Information about Segments and Geographic Areas
We divide our business operations into four geographic operating segments—the United States, Asia, Mexico and Europe, the Middle East and Africa (EMEA) as follows:
|
|
• |
Our U.S. segment includes (1) the manufacturing of wind blades at our Newton, Iowa plant, (2) the manufacturing of precision molding and assembly systems used for the manufacture of wind blades at our Warren, Rhode Island facility, (3) the manufacturing of composite solutions for the transportation industry, which we also conduct at our Rhode Island and Massachusetts facilities and (4) our corporate headquarters, the costs of which are included in general and administrative expenses. |
|
|
• |
Our Asia segment includes (1) the manufacturing of wind blades at our facility in Taicang Port, China and at our two facilities in Dafeng, China, (2) the manufacturing of precision molding and assembly systems at our Taicang City, China facility, (3) the manufacture of components at our second Taicang Port, China facility and (4) wind blade inspection and repair services. |
|
|
• |
Our Mexico segment manufactures wind blades from our three facilities in Juárez, Mexico, one of which commenced operations in 2014, the second during the third quarter of 2016 and the third in January 2017. |
|
|
• |
Our EMEA segment manufactures wind blades from our two facilities in Izmir, Turkey. We entered into a joint venture in 2012 to produce wind blades at our first Turkey plant and in 2013 became the sole owner of the Turkey operation with the acquisition of the remaining 25% interest. Our EMEA segment commenced operations at our second facility during the third quarter of 2016. |
For additional information regarding our operating segments and geographic areas, see Note 19 – Segment Reporting of the Notes to Consolidated Financial Statements included in Part II, Item 8 of this Annual Report on Form 10-K.
Business Strategy
Our long-term success will be driven by our business strategy. The key elements of our strategy are as follows:
|
|
• |
Grow our existing relationships and develop new relationships with leading industry OEMs. We plan to continue growing and expanding our relationships with existing customers who, according to data from MAKE Consulting (MAKE), represented approximately 32% of the global onshore wind energy market, approximately 56% of that market excluding China, and over 82% of the U.S. onshore wind turbine market over the three years ended December 31, 2015, based on megawatts (MWs) of energy capacity installed, as well as developing new relationships with other leading industry OEMs. We are presented with opportunities to expand our existing relationships and develop new relationships with industry OEMs as they seek to capitalize on the benefits of outsourced wind blade manufacturing while maintaining high quality customization and dedicated capacity. In 2016, we extended the term of our existing Iowa and Mexico supply agreements with General Electric International, Inc. and its affiliates (GE Wind), and entered into a new supply agreement with GE Wind to supply them with wind blades from our third manufacturing facility in Mexico, which became operational in January 2017. We also entered into a new supply agreement with Gamesa Wind US LLC (Gamesa) whereby we will continue to supply wind blades to them from our existing manufacturing facility in Mexico as well as from our second Mexico manufacturing facility. We also extended the term of our existing Turkey supply agreement with Nordex SE (Nordex) and entered into a new supply agreement with Nordex to supply them with wind blades from our second manufacturing facility in Turkey. In January 2017, we extended the term of our existing China supply agreement with Vestas Wind Systems A/S (Vestas) and also amended our existing Turkey supply agreement with Vestas. |
3
|
|
• |
Focus on continuing innovation. We have a history of innovation in advanced composite technologies and production techniques and use several proprietary technologies related to wind blade manufacturing. With this culture of innovation and a collaborative “design for manufacturability” approach, we continue to address increasing physical dimensions, demanding technical specifications and strict quality control requirements for our customers’ most advanced wind blades. We also invest in ongoing simplification and selective automation of production processes for increased efficiency and precision. In addition, we plan to leverage our history of composite industry-first innovations to grow our business in the transportation market, in which we believe there is a demand for high precision, structural composites manufacturing. |
|
|
• |
Continue to drive down costs of wind energy. We continue to work with our customers on larger size wind blade models that maximize the capture of wind energy and drive down the levelized cost of energy (LCOE). We also continue to utilize our advanced technology, regional manufacturing facilities strategically located to cost effectively serve large and growing wind markets and ability to source materials globally at competitive costs to deliver high-performing, composite wind blades at a lower total delivered cost. Our collaborative engineering approach and our advanced precision molding and assembly systems allow us to integrate our customer’s design requirements with cost-efficient, replicable and scalable manufacturing processes. We also continue to collaborate with our customers to drive down the cost of materials and production, the benefit of which we typically share with our customers contractually in a manner that reduces LCOE for customers, further strengthens our customer relationships and improves our margins. |
Wind Blade Manufacturing Operations and Process
We have developed significant expertise in advanced composite technology and use high performance composite materials, precision molding and assembly systems including modular tooling, and advanced process technology, as well as sophisticated measurement, inspection, testing and quality assurance tools, allowing us to produce over 30,000 wind blades since 2001 with an excellent field performance record in a market where reliability is critical to our customers’ success. We manufacture or have manufactured wind blades ranging from 30 meters to over 60 meters across our global facilities, and have the capability to manufacture wind blades of greater lengths at all of our advanced manufacturing facilities as required by existing or new customers. In combination with our advanced technologies, we seek to create manufacturing processes that are replicable and scalable in our manufacturing facilities located worldwide, regardless of cultural or language barriers. Our integrated manufacturing process allows us to customize each manufacturing step, from raw materials to finished products. It also allows us to systematically design for the entire manufacturing process so that we can achieve better quality control and increase production efficiencies. We believe that our focus on simplifying and, where feasible, automating production processes is critical to manufacturing high-precision, lightweight and durable products at a reasonable cost to our customers. We produce high unit volumes of near-aerospace grade products at industrial costs.
Raw Materials
The key raw materials for our wind blades include highly advanced fiberglass fabrics, select carbon reinforcements, foam, balsa wood, resin, adhesives for assembly of molded components, gel coat or paint for preparation of cosmetic surfaces and attachment hardware including steel components. Most of these materials are available in multiple geographic regions and in reasonably close proximity to our manufacturing facilities. Our
4
agreements for the supply of raw materials are designed to guarantee volumes that we believe will be required to fulfill our customers’ wind blade commitments. A portion of our raw materials are subject to price volatility, such as the resins used in our manufacturing processes. Although the majority of materials incorporated into our products are available from a number of sources, certain materials are available only from a relatively limited number of suppliers. We seek multiple suppliers for our raw materials and continually evaluate potential new supplier relationships.
Precision Molding and Assembly Systems
Over the last decade, we have produced hundreds of precision molding and assembly systems, ranging from 30 meters to over 60 meters in length, to support our global operations. We began these operations in our tooling technology center in Warren, Rhode Island. In 2013, we expanded our precision molding and assembly system production capabilities to a facility in Taicang City, China, which serves customers around the globe. While capable of cost-effectively delivering precision molding and assembly systems across all of our facilities, our Rhode Island tooling technology center primarily serves the North American market. Our precision molding and assembly systems have been used to build tens of thousands of wind blades worldwide.
Our tooling solutions include precision wind blade patterns, precision molding and assembly systems, including modular tooling techniques. We believe that our technological and production expertise are key factors in our continued competitiveness, as we address continually increasing physical dimensions, demanding technical specifications, and strict quality control requirements for wind blades.
Wind Blade Production Process
Production of our wind blades requires adherence to the unique specifications of our customers, who design their wind turbines and wind blades to optimize performance, reliability and total delivered cost. With our culture of innovation and a collaborative “design for manufacturability” approach, we have the capability and expertise to manufacture wind blades of different designs, utilizing fiberglass, carbon or other advanced composite materials to meet unique customer specifications. We also have the flexibility to quickly transition our manufacturing capabilities to produce different wind blade models and sizes using our precision molding and assembly systems, including modular tooling techniques.
We have developed a highly dependable method for making high-quality wind blades. We design our proprietary manufacturing processes to be replicable, scalable and transferable to each of our advanced manufacturing facilities worldwide. As a result, we can repeatedly move a product from its design phase to volume production while maintaining quality, even in developing regions of the world. Similarly, we have developed the manual portions of our manufacturing processes based on proven technologies and production methods that can be learned and implemented rapidly by line personnel. We focus on consistency and quality control across our facilities, using hands-on training methods and employing repeatable manufacturing processes.
We use an advanced form of vacuum-assisted resin transfer tooling process to pull liquid resin into a dry lay-up, resulting in light, strong, and reliable composite structures. In our manufacturing process, fiber reinforcements and core materials are laid up in a tool while dry, followed by a vacuum bag that is placed over the layup and sealed to the mold. The wind blade component is then placed under vacuum. The resin is introduced into the wind blade component via resin inlet ports and then distributed through the reinforcement and core materials via a flow medium and a series of channels, saturating the wind blade component. The vacuum removes air and gases during processing, thereby eliminating voids. Pressure differentials drive resin uniformly throughout the wind blade component, providing a consistent laminate. By using a variety of reinforcement and core materials, the structural characteristics of the wind blade can be highly engineered to suit the custom specifications of our customers. Although only occasionally required by our customers, we are also capable of employing additional composite fabrication processes, such as pre-impregnated laminates, in addition to our vacuum infusion process.
5
Wind Blade Long-Term Supply Agreements
Our current wind blade customers, which include GE Wind, Vestas, Gamesa and Nordex (which acquired Acciona Windpower, S.A. (Acciona) in April 2016), are some of the world’s largest wind turbine manufacturers. According to data from MAKE, our customers represented approximately 32% of the global onshore wind energy market, approximately 56% of that market excluding China, and over 82% of the U.S. onshore wind turbine market over the three years ended December 31, 2015, based on MWs of energy capacity installed. In our collaborative dedicated supplier model, our customers are incentivized to maximize the volume of wind blades purchased through lower pricing at higher purchase volumes. As of February 28, 2017, our existing wind blade supply agreements provide for estimated minimum aggregate volume commitments of $2.6 billion and encourages customers to, in the aggregate, purchase additional volume up to an estimated total contract value of up to $3.9 billion through the end of 2023, which we believe provides us with significant future revenue visibility and helps to insulate us from potential short-term fluctuations or legislative changes in any one market. Although in some instances our supply agreements contain liquidated damages provisions in the event of late delivery, we generally do not bear the responsibility for transportation and delivery costs in connection with the delivery of our wind blades.
GE Wind
In 2007, we entered into a supply agreement to build a facility and manufacture wind blades for GE Wind in Taicang Port, China. Later in 2007, we entered into a similar agreement to build a facility and manufacture wind blades for GE Wind in Newton, Iowa. Based on the success of these manufacturing arrangements, we were able to expand our customer relationship with GE Wind through additional supply agreements for our manufacturing facility in Turkey and two of our manufacturing facilities in Mexico in 2011, 2013 and 2016, respectively. Subject to certain exceptions on a plant-by-plant basis, each of our supply agreements with GE Wind provide for a minimum number of wind blade sets to be purchased by GE Wind each year during the term, the schedule for which is established at the outset of the agreement. In return, we commit to dedicate a specific number of manufacturing lines to GE Wind for each of the years 2017 through 2020. Additionally, we create model-specific tooling for GE Wind. For the years ended December 31, 2016, 2015 and 2014, we recorded related-party sales under these supply agreements with GE Wind of $379.9 million, $312.5 million and $234.8 million, respectively. In March 2017, the Company and GE Wind announced that the parties do not intend to renew the Turkey supply agreement, which expires on December 31, 2017. Unless otherwise terminated or renewed, our supply agreements with GE Wind are in effect until the end of 2017 for our China facility and the end of 2020 for our Iowa and two Mexico facilities. In some cases, GE Wind may terminate its supply agreements early upon providing us with 123 to 360 days’ advance written notice and in one instance, no advance notice, and paying us termination fees as set forth in the applicable agreement. In addition, either party may terminate these supply agreements upon a material breach by the other party which goes uncured for 30 days after written notice has been provided.
In October 2016, General Electric Company (GE) announced its planned acquisition of LM Wind Power (LM), our largest competitor, and GE anticipates closing this acquisition in the first half of 2017. Although we recently extended and expanded certain of our supply agreements with GE Wind, GE Wind could elect to utilize LM for more of its wind blade production, reduce the volumes of wind blades it purchases from us or terminate any of our supply agreements, which may materially harm our relationship, business, financial condition and results of operations. In March 2017, the Company and GE Wind announced that the parties do not intend to renew the Turkey supply agreement. See “Risk Factors—Risks Related to Our Wind Blade Business—GE’s planned acquisition of LM Wind Power, our largest competitor, may materially harm our business, financial condition and results of operations and may cause the price of our common stock to decline” included in Part I, Item 1A of this Annual Report on Form 10-K for further discuss on the GE’s planned acquisition and its potential effects on us.
See Note 3 – Related Party Transactions of the Notes to Consolidated Financial Statements included in Part II, Item 8 of this Annual Report on Form 10-K for additional information regarding our related party transactions with GE Wind.
Other Long-Term Supply Agreements
We have entered into other long-term supply agreements in China, Mexico and Turkey. Under all but one of these agreements, we agree to dedicate capacity for a set number of wind blades for each calendar year during the
6
term of the agreement in exchange for commitments to purchase minimum annual volumes of wind blade sets. Unless otherwise terminated, these supply agreements generally remain in effect for a period of five years and either party may terminate their respective supply agreements upon a material breach by the other party which goes uncured. Some of these supply agreements contain provisions that allow for termination by the customer upon notice for reasons such as our failure to deliver the contracted wind blade volumes or our failure to meet certain mutually agreed upon cost reduction targets. See “Risk Factors—Risks Related to Our Wind Blade Business—Our long-term supply agreements with our customers are subject to termination on short notice and our failure to perform our obligations under such agreements, and termination of a significant number of these agreements would materially harm our business” included in Part I, Item 1A of this Annual Report on Form 10-K.
Research and Development
We have a long history of developing composite products as well as the development of new and advanced materials, tooling, manufacturing processes and inspection methods. Our knowledge and experience of composite materials and manufacturing originates with our predecessor company, Tillotson Pearson Inc., a leading manufacturer of high-performance recreational sail and powerboats along with a wide range of composite structures used in other industrial applications. Leveraging our knowledge and experience, we realized the opportunity to specialize in other industrial end-markets where there was a demand for high precision composite manufacturing capabilities.
We conduct extensive research and development in close collaboration with our customers on the design, development and deployment of innovative manufacturing processes, including automation, advanced materials and sophisticated product quality inspection tools. We partnered with the U.S. Department of Energy, government laboratories, universities and our customers to innovate through cost sharing Advanced Manufacturing Innovation Initiative programs. In 2015, we received an award of $3.0 million from the U.S. Department of Energy’s Office of Energy Efficiency & Renewable Energy to lead a team of industry and academic participants to design, develop and demonstrate an ultra-light composite vehicle door for high volume manufacturing production in conjunction with other industry and university participants. We employ a highly experienced workforce of engineers in various facets of our business, from discrete research and development projects, to the ongoing, real-time development and implementation of incremental manufacturing and material improvements. Our research and development effort places a priority on improving quality through process and procedure improvement, in addition to reducing cost through specification changes and sourcing of more cost-effective suppliers. Other areas of emphasis include composite design, in-house fabrication of precision molding and assembly systems, prototyping, testing, optimization and volume production capabilities. We also encourage our employees to invent and develop new technologies to maintain our competitiveness in the marketplace. In addition to our internal research and development activities, from time to time, we also conduct research and development activities pursuant to funded development arrangements with our customers and other third parties, and intend to continue to seek opportunities for product development programs that could create recurring revenue and increase our overall profitability over the long term.
For financial statement purposes, research and development is reflected in general and administrative expenses. For the years ended December 31, 2016, 2015 and 2014, our research and development expenses were $1.5 million, $0.9 million and $0.8 million, respectively.
Competition
The wind blade market is highly concentrated, competitive and subject to evolving customer needs and expectations. In October 2016, GE, our largest customer, announced its planned acquisition of LM, our largest competitor, and GE anticipates closing this acquisition in the first half of 2017. We also compete primarily with other independent wind blade manufacturers, such as Tecsis GmbH, Sinoma Science & Technology Co. Ltd. and ZhongFu Lianzhong Composites Group Co., Ltd., as well as regional wind blade suppliers in geographic areas where our current or prospective manufacturing facilities are located.
We also compete with, and in a number of cases supplement, vertically integrated wind turbine OEMs that manufacture their wind blades. We believe that a number of other established companies are manufacturing wind blades that will compete directly with our offerings, and some of our competitors, including LM, Tecsis GmbH,
7
Sinoma Science & Technology Co. Ltd. and ZhongFu Lianzhong Composites Group Co., Ltd. may have significant financial and institutional resources.
The principal competitive factors in the wind blade market include reliability, total delivered cost, manufacturing capability, product quality, engineering capability and timely completion of wind blades. We believe we compete favorably with our competitors on the basis of the foregoing factors. Our ability to remain competitive will depend to a great extent upon our ongoing performance in the areas of manufacturing capability, timely completion and product quality.
Transportation Products
We seek to create additional recurring revenue opportunities through the supply of other composite structures outside the wind energy market. We believe larger scale and higher volume transportation products, including buses, trucks, electric vehicles and high performance automotive products, are ideally suited for our advanced composite technology because of the benefits derived from weight reduction, corrosion resistance, strength and durability. These benefits should allow us to develop structural composite solutions to assist our customers in developing buses with clean propulsion systems or in meeting new and developing fuel economy standards including the 2025 U.S. Government Corporate Average Fuel Economy standards that are pushing automakers to develop lighter, more fuel efficient vehicles with lower emissions. In 2015, we received a $3.0 million award from the U.S. Department of Energy’s Office of Energy Efficiency & Renewable Energy to design, develop and demonstrate an ultra-light composite vehicle door for high volume manufacturing production in conjunction with various other industry and university participants.
In addition, by producing a range of composite structures, we are able to leverage the materials and manufacturing process technology and expertise developed through one project to maximize production quality, improve performance and minimize costs across our other manufacturing efforts, including our wind blade business. Our projects for customers in the transportation market have historically generated project-related revenues for a specific duration. We intend to seek collaborations with additional customers in these markets that will provide recurring project revenue and business opportunities for us, in addition to the opportunities provided by our existing customers and relationships, and increase our overall profitability over the long term. In 2017, we entered into a supply agreement with Proterra Inc. to supply bus bodies from our New England manufacturing facilities.
Our facility in Warren, Rhode Island manufactures products for customers in the transportation market using the same proprietary and replicable manufacturing processes that we use to produce our wind blades. Our projects for customers in the transportation market include or have included the supply of all-composite bodies for electric buses and automated people mover systems for airports.
Our current principal competitors in the transportation market include suppliers of conventional steel and aluminum products and non-structural automotive fiberglass and other advanced composites-based manufacturers for transportation applications.
Intellectual Property
We have a variety of intellectual property rights, including patents (filed and applied-for in a number of jurisdictions, including the United States, the European Union and China), trademarks and copyrights, but we believe that our continued success and competitive position depend, in large part, on our proprietary materials, tooling, process and inspection technologies and our ability to innovate. Accordingly, we take measures to protect the confidentiality and control the disclosure of our proprietary technology. We rely primarily on a combination of know-how and trade secrets to establish and protect our proprietary rights and preserve our competitive position. We also seek to protect our proprietary technology, in part, by confidentiality agreements with our customers, employees, consultants and other contractors. Trade secrets, however, are difficult to protect. These agreements may be breached, and we may not have adequate remedies for any breach. In addition, our trade secrets may otherwise become known or be independently discovered by competitors. To the extent that our customers, employees, consultants or contractors use intellectual property owned by others in their work for us, disputes may arise as to the rights in related or resulting know-how and inventions.
8
As of December 31, 2016 and 2015, the backlog for our wind blades and related products totaled $567.3 million and $519.0 million, respectively. Our backlog includes purchase orders signed in connection with our long-term supply agreements. We generally record a purchase order into backlog when the following requirements have been met: a signed long-term supply agreement has been executed with our customer, a purchase order has been made by our customer and we expect to ship wind blades to such customer in satisfaction of any purchase order within 12 months. Backlog as of any particular date should not be relied upon as indicative of our revenue for any future period. Although in certain circumstances projects may be delayed, in these circumstances the long-term supply agreement generally rolls forward and the revenue remains on the backlog until the project commences.
Regulation
Our operations are subject to various foreign, federal, state and local regulations related to environmental protection, health and safety, labor relationships, general business practices and other matters. These regulations are administered by various foreign, federal, state and local environmental agencies and authorities, including the U.S. Environmental Protection Agency (EPA), the Occupational Safety and Health Administration of the U.S. Department of Labor and comparable agencies in China, Mexico and Turkey. In addition, our manufacturing operations in China, Mexico and Turkey are subject to those countries’ wage and price controls, currency exchange control regulations, investment and tax laws, laws restricting our ability to repatriate profits, trade restrictions and laws that may restrict foreign investment in certain industries. Some of these laws have only been recently adopted or are subject to further rulemaking or interpretation, and their impact on our operations, including the cost of complying with these laws, is uncertain. We maintain a policy of adhering to the laws of the United States or the country in which our manufacturing facility is located, whichever is stricter, and believe that our operations currently comply, in all material respects, with applicable laws and regulations. Further, as a U.S. corporation, we and our subsidiaries are subject to The Foreign Corrupt Practices Act of 1977 (FCPA), which generally prohibits U.S. companies and their intermediaries from making improper payments to foreign officials for the purpose of obtaining or keeping business.
In addition, our business has been and will continue to be affected by subsidization of the wind turbine industry with its influence declining over time as wind energy reaches grid parity with traditional sources of energy. In the United States, the federal government has encouraged capital investment in renewable energy primarily through tax incentives. Production tax credits for new renewable energy projects were first established in 1992. The Production Tax Credit for Renewable Energy (PTC) provided the owner of a wind turbine placed in operation before January 1, 2015 with a 10-year credit against its U.S. federal income tax obligations based on the amount of electricity generated by the wind turbine.
The PTC was extended in December 2015 for wind power projects through December 31, 2019, and is currently contemplated to be phased down over the term of the PTC extension. Specifically, the PTC will be kept at the same rate in effect at the end of 2014 for wind power projects that either commenced construction or met certain safe harbor requirements by the end of 2016, and thereafter will be reduced by 20% per year in 2017, 2018 and 2019, respectively.
In August 2015, the EPA announced a final rule adopted pursuant to the Clean Air Act, known as the Clean Power Plan, which establishes national standards for states to reduce carbon emissions from power plants. Specifically, the Clean Power Plan requires states to reduce carbon emissions from power plants 32% below 2005 levels by 2030. The Clean Power Plan also provides for interim state-level compliance reduction targets beginning in 2022 through 2030 based on individualized targets for each of the states utilizing 2012 historical carbon emissions data and three building blocks for emissions reduction including: increasing generation from new zero-emitting renewable energy sources such as wind. In February 2016, the United States Supreme Court issued a stay of the EPA’s implementation of the Clean Power Plan until the D.C. Circuit of the United States Court of Appeals decides upon the merits of multiple lawsuits challenging the legality of the Clean Power Plan. In addition, President Trump has made comments during his presidency and the presidential campaign suggesting that he is not supportive of various clean energy programs and initiatives designed to curtail global warming and may attempt to eliminate, modify or further reduce the scope of the Clean Power Plan.
9
At the state level, as of December 31, 2016, 29 states and the District of Columbia have implemented renewable portfolio standard (RPS) programs that generally require that, by a specified date, a certain percentage of a utility’s electricity supplied to consumers within such state is to be from renewable sources (generally between 15% and 50% by 2020 or 2030).
In addition, there are also increasing regulatory efforts to promote renewable power. China is currently implementing its 13th 5-Year Plan with a goal of 15% total primary energy from non-fossil fuel sources and targeting 210 gigawatts (GWs) of grid-connected wind capacity by 2020 according to its National Development and Reform Commission, and employs preferential feed-in tariff schemes, in addition to local tax-based incentives. Mexico has established strict targets, aiming for 35% renewable energy by 2024 and 50% by 2050, according to MAKE, which it is facilitating through tax incentives. Large European Union members have renewable energy targets for 2020 of between 13% and 49% of all energy use derived from renewable energy sources, according to MAKE. Additionally, Turkey enacted Law No. 5346 in 2005 to promote renewable-based electricity generation within their domestic electricity market by introducing tariffs and purchase obligations for distribution companies requiring purchases from certified renewable energy producers. The World Bank also provided Turkey with an aggregate of $600 million of loan proceeds to encourage investors to construct generation plants with renewable energy resources.
Employees
As of December 31, 2016, we employed over 6,700 full-time employees, approximately 1,260 of whom were located in the United States, 1,940 in China, 2,000 in Mexico and 1,570 in Turkey. Certain of our employees in Turkey are represented by a labor union. We believe that our relations with our employees are good.
Available Information
Our website address is www.tpicomposites.com. All of our filings with the Securities and Exchange Commission (SEC), including this Annual Report on Form 10-K, quarterly reports on Form 10-Q, current reports on Form 8-K, statements of changes in beneficial ownership and amendments to those reports, are available free of charge on our website as soon as reasonably practicable after they are electronically filed with, or furnished to, the SEC. The information contained on our website is neither a part of, nor incorporated by reference into, this Annual Report on Form 10-K. You may read and copy any materials we file with the SEC at the SEC’s Public Reference Room at 100 F Street, N.E., Washington, D.C. 20549. You may obtain information on the operation of the Public Reference Room by calling the SEC at 1-800-SEC-0330. The SEC also maintains an Internet website that contains reports, proxy and information statements, and other information regarding issuers, like us, that file electronically with the SEC. The address of that website is www.sec.gov.
Our investor relations website address is www.tpicomposites.com/investors and includes key information about our corporate governance initiatives, including our Nominating and Corporate Governance Committee charter, charters of the Audit and Compensation committees and our Code of Business Conduct and Ethics.
10
The following table sets forth certain information regarding our Executive Officers as of February 28, 2017:
|
Name |
Age |
|
Position |
|
Steven C. Lockard |
55 |
|
President, Chief Executive Officer and Director |
|
Mark R. McFeely |
44 |
|
Chief Operating Officer |
|
Wayne G. Monie |
68 |
|
Chief Manufacturing Technology Officer |
|
William E. Siwek |
54 |
|
Chief Financial Officer |
|
Lars Moller |
49 |
|
Executive Vice President—Business Development and Strategy |
|
Thomas J. Castle |
45 |
|
Senior Vice President—North American Wind Operations and Global Operational Excellence |
|
Steven G. Fishbach |
47 |
|
General Counsel and Secretary |
Steven C. Lockard. Mr. Lockard became our President and Chief Executive Officer in 2004 and has served as a member of our board of directors since 2004. Prior to joining us in 1999, Mr. Lockard was Vice President of Satloc, Inc., a supplier of precision GPS equipment, from 1997 to 1999. Prior to that, Mr. Lockard was Vice President of marketing and business development and a founding officer of ADFlex Solutions, Inc., a NASDAQ-listed international manufacturer of interconnect products for the electronics industry, from 1993 to 1997. Prior to that, Mr. Lockard held several marketing and management positions including Business Unit Manager, Corporate Market Development Manager and Marketing/Applications Engineer at Rogers Corporation from 1982 to 1993. Mr. Lockard serves on the board of and is co-chair of the policy committee for the American Wind Energy Association and also serves on the board of Fluidic Energy, a privately-held company. Mr. Lockard holds a B.S. degree in Electrical Engineering from Arizona State University.
Mark R. McFeely. Mr. McFeely joined us in November 2015 as our Chief Operating Officer. Prior to joining us, Mr. McFeely served as Senior Vice President and Chief Operations Officer of Remy International, Inc., an OEM and aftermarket supplier of heavy duty and light duty automotive components, from 2012 to 2015. Prior to that, Mr. McFeely was Vice President, Operations of Meggitt Safety Systems Inc. from 2011 to 2012. From 2005 to 2011, Mr. McFeely held several operations and leadership positions within divisions of Danaher Corporation, including General Manager/Plant Manager of Pacific Scientific, General Manager and Vice President, Global Operations of Kollmorgen Vehicle Systems, and General Manager/Director Operations of Jacobs Vehicle System Asia. Prior to 2005, Mr. McFeely held several operations and business development leadership positions at Honeywell International Inc. and the Federal Emergency Management Agency. He received a bachelor’s degree from Colorado State University and an M.B.A. from Pennsylvania State University.
Wayne G. Monie. Mr. Monie has served as our Chief Manufacturing Technology Officer since December 2015 and our Asia CEO from August 2015 through March 31, 2016. Mr. Monie previously served as our Chief Operating Officer from 2004 to 2015 and as our Vice President—Operations from 2002 to 2004. From 2004 to July 2016, Mr. Monie served as a member of our board of directors. Prior to joining us, Mr. Monie was Vice President, Manufacturing for First Solar, Inc., a solar company, from 2001 to 2002. Prior to that, Mr. Monie was Vice President and General Manager of Satloc, Inc., a supplier of precision GPS equipment, from 1998 to 2001. Mr. Monie holds a B.S. degree in Industrial Engineering from Virginia Polytechnic Institute and State University and an M.S. degree in Engineering Management from the University of Dayton.
William E. Siwek. Mr. Siwek joined us as our Chief Financial Officer in 2013. Prior to joining us, Mr. Siwek previously served as the Chief Financial Officer for T.W. Lewis Company, an Arizona-based real estate investment company, from September 2012 to September 2013. From May 2010 until September 2012, he was an independent consultant assisting companies in the real estate, construction, insurance and renewable energy industries. Prior to that, Mr. Siwek was Executive Vice President and Chief Financial Officer of Talisker Mountain, Inc., from January 2009 to April 2010. Prior to that, he was President and Chief Financial Officer of the Lyle Anderson Company from December 2002 to December 2008. Prior to that, Mr. Siwek spent 18 years, from September 1984 to May 2002, with Arthur Andersen where he became a Partner in both Audit and Business Consulting Divisions. Mr. Siwek holds B.S. degrees in Accounting and Economics from University of Redlands and is a Certified Public Accountant.
11
Lars Moller. Mr. Moller has served as our Executive Vice President—Business Development and Strategy since April 2016. Prior to that he served as our Senior Vice President—EMEA and Global Supply Chain since September 2015 and prior to that he was our Senior Vice President—EMEA since July 2014. Before joining us, Mr. Moller served as CEO of North American Operations for Global Energy Services, from 2013 to 2014. From 2010 to 2012, Mr. Moller served as Group Senior Vice President for Vestas Wind Systems. From 2007 to 2010, Mr. Moller served as Executive Vice President and COO for Broadwind Energy and from 2003 to 2007, Mr. Moller served as President of DMI Industries.
Thomas J. Castle. Mr. Castle joined us in November 2015 as our Senior Vice President—North American Wind Operations and Global Operational Excellence. Prior to joining us, Mr. Castle was with Honeywell Aerospace from 2007 to 2015. Mr. Castle served as the Vice President of Integrated Supply Chain, Americas Electronics Operations Center from 2014 to 2015. From 2012 to 2014, he was the Global Vice President of the Honeywell Operating System for Aerospace. Prior to that, Mr. Castle held various positions at the Americas Services Organization from 2007 to 2012. From 1996 to 2007, Mr. Castle was with GE Aviation in roles of increasing responsibility, most recently as the Managing Director of a manufacturing facility in Thailand from 2005 to 2007. Mr. Castle holds a B.S. degree in Aeronautics from St. Louis University.
Steven G. Fishbach. Mr. Fishbach has served as our General Counsel since January 2015. Prior to joining us, Mr. Fishbach served as Deputy General Counsel of Global Cash Access Holdings, Inc. from 2011 to 2015 and Associate General Counsel from 2009 to 2011. Prior to that, Mr. Fishbach served in various senior roles in the legal department of Fidelity National Information Services, Inc./eFunds Corporation from 2005 to 2008. Mr. Fishbach also practiced corporate and securities law at Squire Sanders (now Squire Patton Boggs) from 2000 to 2005. Mr. Fishbach holds a B.A. degree in American Studies from Georgetown University and a juris doctor degree from William & Mary Law School.
12
You should carefully consider the following risk factors. If any of the events contemplated by the following discussion of risks should occur, our business, results of operations, financial condition, growth prospects and cash flows could suffer significantly. Additional risks that we currently do not know about or that we currently believe to be immaterial may also impair our business.
Risks Related to Our Wind Blade Business
GE’s planned acquisition of LM Wind Power, our largest competitor, may materially harm our business, financial condition and results of operations and may cause the price of our common stock to decline.
In October 2016, GE announced its planned acquisition of LM Wind Power, our largest competitor, and anticipates closing this acquisition in the first half of 2017. We currently have entered into five supply agreements with GE Wind providing for the supply of wind blades from our Iowa facility; two Juárez, Mexico facilities; our original Turkey facility; and our Taicang Port, China facility. In October 2016, we entered into (i) an amended and restated supply agreement for the continued supply of wind blades from our Iowa facility through December 31, 2020, (ii) an amendment to our existing supply agreement for the continued supply of wind blades from our original Juárez, Mexico facility through December 31, 2020 and (iii) a new supply agreement with GE Wind for the supply of incremental wind blades from our second manufacturing facility in Juárez, Mexico through December 31, 2020.
Although we recently extended and expanded certain of our supply agreements, GE Wind may decide to utilize LM for more of its wind blade production as a result of the pending LM acquisition. As such, GE Wind may not continue to purchase wind blades from us at similar volumes or on as favorable terms in the future. In addition, our current supply agreements with GE Wind for the supply of wind blades from our Turkey and Taicang, China facilities expire on December 31, 2017. In March 2017, the Company and GE Wind announced that the parties do not intend to renew the Turkey supply agreement and GE Wind may elect not to renew the China supply agreement. GE Wind also may elect to terminate our Iowa supply agreement at the end of 2018 or 2019 by providing us with 12 months’ advance notice and paying us a specified termination fee. GE Wind may also elect to terminate our two Mexico supply agreements with 15 days’ notice and pay us a termination fee. If GE Wind elects to utilize LM for more of its wind blade production, reduce the volumes of wind blades it purchases from us or terminates any of our supply agreements, it may materially harm our business, financial condition and results of operations.
In addition, GE Ventures Limited (GE Ventures), a GE affiliated company, owns 8.4% of our outstanding common stock as of December 31, 2016. GE Ventures’ lock-up agreement with our IPO underwriters expired on January 17, 2017 and as a result of GE’s pending acquisition of LM, GE Ventures may be more inclined to sell all or a portion of its shares of our common stock pursuant to the requirements of Rule 144 of the Securities Act of 1933, as amended. If GE Ventures sells all or a portion of its holdings of our common stock pursuant to Rule 144 or otherwise, it may cause the price of our common stock to decline.
The results of the 2016 United States presidential and congressional elections has created regulatory uncertainty for our business and the wind energy sector and may materially harm our business, financial condition and results of operations.
U.S. President Trump, certain members of the U.S. House of Representatives, and key U.S. administrative officials and policy makers have suggested renegotiation of The North American Free Trade Agreement and the implementation of tariffs, duties, border taxes or other similar assessments that could impact the level of trade between the U.S. and Mexico. President Trump also has publicly stated that he may seek to impose tariffs, duties, border taxes or other similar assessments on products imported from China. A substantial amount of the wind blades that we manufacture in our Mexico and China facilities are imported into the United States. If any such tariffs, duties, border taxes or other assessments are imposed on our wind blades that are imported into the United States, it would increase the total cost of our wind blades and may decrease demand for our wind blades. In addition, we may not be able to fully pass on the added cost of such tariffs, taxes, duties or assessments to our customers and may materially harm our business, financial condition and results of operations.
President Trump also has made comments during his presidency and the presidential campaign suggesting that he is not supportive of various clean energy programs and initiatives designed to curtail global warming. It remains unclear what specifically President Trump would or would not do with respect to these programs and
13
initiatives, and what support he would have for any potential changes to such legislative programs and initiatives in the Unites States Congress, even though both the House of Representatives and Senate are controlled by the Republican Party. If President Trump and/or the United States Congress take action or publicly speak out about the need to eliminate, modify or further reduce the PTC, the Clean Power Plan or other legislation, regulations and incentives supporting wind energy, such actions may result in a decrease in demand for wind energy in the United States and other geographical markets and may materially harm our business, financial condition and results of operations.
A significant portion of our business is derived from a small number of customers, and one wind blade customer in particular, therefore any loss of or reduction in purchase orders, failure of these customers to fulfill their obligations or our failure to secure long-term supply agreement renewals from these customers would materially harm our business.
Substantially all of our revenues are derived from four wind blade customers. One customer, GE Wind, accounted for 50.3%, 53.3% and 73.2% of our total net sales for the years ended December 31, 2016, 2015 and 2014, respectively. In addition, three customers, Vestas, Nordex (which acquired Acciona in April 2016) and Gamesa accounted for 20.1%, 17.5% and 10.8% of our net sales for the year ended December 31, 2016, respectively, and two customers, Nordex and Gamesa accounted for 26.5% and 10.3% of our net sales for the year ended December 31, 2015, respectively. Accordingly, we are substantially dependent on continued business from our current wind blade customers, and GE Wind in particular. GE Wind and other customers may not continue to purchase wind blades from us at similar volumes or on as favorable terms in the future. For example, GE Wind has in the past informed us of their intention to terminate a supply agreement. However, in that case, the agreement was not terminated but was instead renegotiated. If GE Wind or one or more of our other wind blade customers were to reduce or delay wind blade orders, fail to pay amounts due or satisfactorily perform their respective contractual obligations with us or otherwise terminate or fail to renew their long-term supply agreements with us, our business, financial condition and results of operations could be materially harmed.
Defects in materials and workmanship or wind blade failures could harm our reputation, expose us to product warranty or other liability claims, decrease demand for our wind blades, or materially harm existing or prospective customer relationships.
Defects in our wind blades, whether caused by a design, engineering, materials, manufacturing or component failure or deficiencies in our manufacturing processes, are unpredictable and an inherent risk in manufacturing technically advanced products. We have, in the past, experienced wind blade testing failures and defects at some of our facilities during the startup manufacturing phase of new products, and we may experience failures or defects in the future. We have also experienced wind blade failures in the field. Any such customer qualification and wind blade testing failures or other product defects in the future could materially harm our existing and prospective customer relationships. Specifically, negative publicity about the quality of our wind blades or defects in the wind blades supplied to our customers could result in a reduction in wind blade orders, increased warranty claims, product liability claims and other damages or termination of our long-term supply agreements or business relationships with current or new customers.
We may determine that resolving potential warranty claims through a negotiated settlement may be in the best interest of the business and long-term customer relationships. For example, in June 2016, we entered into a settlement agreement and release with Nordex relating to the April 2015 wind blade failure. See “Management’s Discussion and Analysis of Financial Condition and Results of Operations—Other Contingencies” included in Part II, Item 7 of this Annual Report on Form 10-K for more information. Wind blades may also fail due to lightning strikes or other extreme weather, which could also result in negative publicity regarding our wind blades and wind energy in general. In addition, product defects may require costly repairs or replacement components, a change in our manufacturing processes or recall of previously manufactured wind blades, which could result in significant expense and materially harm our existing or prospective customer relationships. Further, defects or product liability claims, with or without merit, may result in negative publicity that could harm our future sales and our reputation in the industry. Any of the foregoing could materially harm our business, operating results and financial condition.
14
We have experienced, and could in the future experience, quality or operational issues in connection with plant construction or expansion, wind blade model transitions and wind blade manufacturing, which could result in losses and cause delays in our ability to complete our projects and may therefore materially harm our business, financial condition and results of operations.
We dedicate most of the capacity of our current wind blade manufacturing facilities to existing customers and, as a result, we may need to build additional manufacturing capacity or facilities to serve the needs of new customers or expanded needs of existing customers. We recently entered into lease agreements with third parties to lease new manufacturing facilities in Mexico and Turkey, and commenced operations at these new facilities in the third quarter of 2016. We have also entered into a new lease with a third party for a third manufacturing facility in Juárez, Mexico, and we commenced operations at this facility in January 2017. The construction of new plants and the expansion of existing plants involves significant time, cost and other risks. We expect our plants to generate losses in their first 12 to 24 months of operations related to production startup costs. Additionally, numerous factors can contribute, and have in the past contributed, to delays or difficulties in the startup of, or the adoption of our manufacturing lines to produce larger wind blade models, which we refer to as model transitions, in our manufacturing facilities, including permitting, construction or renovation delays, the engineering and fabrication of specialized equipment, the modification of our general production know-how and customer-specific manufacturing processes to address the specific wind blades to be tested and built, changing and evolving customer specifications and expectations and the hiring and training of plant personnel. If our production or the delivery by any third-party suppliers of any custom equipment is delayed, the construction or renovation of the facility, or the addition of the production line would be delayed. Any delays or difficulties in plant startup or expansion may result in cost overruns, production delays, contractual penalties, loss of revenues and impairment of customer relationships, which could materially harm our business, financial condition and results of operations.
Our long-term supply agreements with our customers are subject to termination on short notice and our failure to perform our obligations under these agreements or the termination of agreements would materially harm our business.
Our current long-term supply agreements expire between the end of 2017 and the end of 2023. Some of our long-term supply agreements contain provisions that allow for the termination of those agreements upon the customer providing us with 92 to 365 days’ advance written notice or, in one instance, upon no advance notice, or upon a material breach that goes uncured for up to 15 to 30 days. Additionally, our long-term supply agreements contain provisions allowing our customers to terminate these agreements upon our failure to deliver the contracted wind blade volumes or our failure to meet certain mutually agreed upon cost reductions. Our customers may not continue to maintain long-term supply agreements with us in the future. If one or more of our customers terminate or fail to renew their long-term supply agreements with us, it would materially harm our business, financial condition and results of operations.
We operate in an industry characterized by changing customer demands and associated transition costs, which could materially harm our business.
The wind energy industry is competitive and is characterized by evolving customer demands. As a result, we must adapt quickly to customer requests for changes to wind blade specifications, which increases our costs and can provide periods of reduced revenue and margins. For instance, in 2015 in order to satisfy GE Wind’s need for bigger wind turbines with larger wind blades, at GE Wind’s request, we implemented model transitions at our U.S., China, Mexico and Turkey facilities, resulting in unplanned delays in wind blade production and associated transition costs at each of these facilities. We are generally able to share transition costs with the customer in connection with these changing customer demands, but any sharing is the subject of negotiation and the amount is not always contractually defined. If we do not receive transition payments from our customers sufficient to cover our transition costs or lost margins, our business, financial condition and results of operations could be materially harmed.
The concentration of customers in our wind business could enable one or more of our customers to attempt to substantially influence our policies, business and affairs going forward.
Our dependence on four wind blade customers, and GE Wind in particular, for substantially all of our revenues could encourage GE Wind or these customers to attempt to impose new or additional requirements on us
15
that reduce the profitability of our long-term supply agreements with them or otherwise influence our policies, choice of and arrangements with raw material suppliers and other aspects of our business. Our customers could also attempt to influence the outcome of a corporate transaction if the transaction benefits a customer’s competitor or is otherwise perceived as not advantageous to a customer, which could have the effect of delaying, deterring, or preventing a transaction that could benefit us. In addition, consolidation of some of our customers may result in increased customer concentration and the potential loss of customers. For example, GE Wind acquired Alstom S.A.’s power business in 2015, Nordex completed its acquisition of Acciona in April 2016 and in June 2016 Siemens A.G. (Siemens) and Gamesa announced a planned merger of Siemens’ wind business with Gamesa. Although we are not constrained by any exclusivity agreements with any of our existing wind blade customers, they may resist our development of new customer relationships, which could affect our relationships with them or our ability to secure new customers.
Demand for our wind blades may fluctuate for a variety of reasons, including the growth of the wind industry, and decreases in demand could materially harm our business and may not be sufficient to support our growth strategy.
Our revenues, business prospects and growth strategy heavily depend on the continued growth of the wind industry and our customers’ continuing demand for our wind blades. Customer demand could decrease from anticipated levels due to numerous factors outside of our control that may affect the development of the wind energy market generally, portions of the market or individual wind project developments, including:
|
|
• |
general economic conditions; |
|
|
• |
the general availability and demand for electricity; |
|
|
• |
wind energy market volatility; |
|
|
• |
cost-effectiveness, availability and reliability of alternative sources of energy and competing methods of producing electricity, including non-renewable sources such as natural gas; |
|
|
• |
foreign, federal and state governmental subsidies and tax or regulatory policies; |
|
|
• |
the availability of financing for wind development projects; |
|
|
• |
the development of electrical transmission infrastructure and the ability to implement a proper grid connection for wind development projects; |
|
|
• |
foreign, federal and state laws and regulations regarding avian protection plans, noise or turbine setback requirements and other environmental laws and regulations; |
|
|
• |
administrative and legal challenges to proposed wind development projects; and |
|
|
• |
public perception and localized community responses to wind energy projects. |
In addition to factors affecting the wind energy market generally, our customers’ demand may also fluctuate based on other factors beyond our control. Any decline in customer demand below anticipated levels could materially harm our revenues and operating results and could delay or impede our growth strategy.
Changes in customers’ business focus and strategy could materially harm our business and results of operations.
Changes in our customers’ business focus could significantly reduce their demand for wind blades. For instance, GE, the parent corporation of GE Wind, is a highly diversified company that operates in a number of different industries and could decide to devote more resources to operations outside of wind energy or cease selling wind turbines altogether. In addition, GE Wind will begin to insource some of its wind blade production if its pending acquisition of LM is consummated. If any of our customers change their business focus, including a strategic shift to insource some of its wind blade production requirements, it could materially harm our business and results of operations.
16
We have experienced in the past, and our future wind blade production could be affected by, operating problems at our facilities, which may materially harm our operating results and financial condition.
Our wind blade manufacturing processes and production capacity have in the past been, and could in the future be, disrupted by a variety of issues, including:
|
|
• |
production outages to conduct maintenance activities that cannot be performed safely during operations; |
|
|
• |
prolonged power failures or reductions; |
|
|
• |
breakdowns, failures or substandard performance of machinery and equipment; |
|
|
• |
our inability to comply with material environmental requirements or permits; |
|
|
• |
inadequate transportation infrastructure, including problems with railroad tracks, bridges, tunnels or roads; |
|
|
• |
damage or production delays caused by earthquakes, fires, floods, tornadoes, hurricanes, extreme weather conditions such as windstorms, hailstorms, drought, temperature extremes, typhoons or other natural disasters or terrorism; and |
|
|
• |
labor unrest. |
The cost of repeated or prolonged interruptions, reductions in production capacity, or the repair or replacement of complex and sophisticated tooling and equipment may be considerable and could result in damages under or the termination of our long-term supply agreements or penalties for regulatory non-compliance, any of which could materially harm our business, operating results and financial condition.
We operate a substantial portion of our business in international markets and we may be unable to effectively manage a variety of currency, legal, regulatory, economic, social and political risks associated with our global operations and those in developing markets.
We currently operate manufacturing facilities in the United States, China, Mexico and Turkey, and we intend to further expand our operations worldwide to meet customer demand. We recently entered into lease agreements with third parties to lease new manufacturing facilities in Mexico and Turkey, and commenced operations at these new facilities in the third quarter of 2016. We have also entered into a new lease with a third party for a third manufacturing facility in Juárez, Mexico, and we commenced operations at this facility in January 2017. For the years ended December 31, 2016, 2015 and 2014, 75%, 74% and 55%, respectively, of our net sales were derived from our international operations and we expect that a substantial portion of our projected revenue growth will be derived from those operations. Our overall success depends, in part, upon our ability to succeed in differing legal, regulatory, economic, social and political conditions. The global nature of our operations is subject to a variety of risks, including:
|
|
• |
difficulties in staffing and managing multiple international locations; |
|
|
• |
increased exposure to foreign currency exchange rate risk or currency exchange controls imposed by foreign countries; |
|
|
• |
the risk of import, export and transportation regulations and tariffs on foreign trade and investment, including boycotts and embargoes; |
|
|
• |
taxation and revenue policies or other restrictions, including royalty and tax increases, retroactive tax claims and the imposition of unexpected taxes, including border adjustable taxes; |
|
|
• |
the imposition of, or rapid or unexpected adverse changes in, foreign laws, regulatory requirements or trade policies; |
|
|
• |
restrictions on repatriation of earnings or capital or transfers of funds into or out of foreign countries; |
|
|
• |
limited protection for intellectual property rights in some jurisdictions; |
|
|
• |
inability to obtain adequate insurance; |
17
|
|
• |
difficulty administering internal controls and legal and compliance practices in countries with different cultural norms and business practices; |
|
|
• |
the possibility of being subjected to the jurisdiction of foreign courts in connection with legal disputes and the possible inability to subject foreign persons to the jurisdiction of courts in the United States; |
|
|
• |
the misinterpretation of local contractual terms, renegotiation or modification of existing long-term supply agreements and enforcement of contractual terms in disputes before local courts; |
|
|
• |
the inability to maintain or enforce legal rights and remedies at a reasonable cost or at all; and |
|
|
• |
the potential for political unrest, expropriation, nationalization, revolution, war or acts of terrorism in countries in which we operate. |
In particular, our operations in China are subject to a variety of specific risks, which may adversely affect our business, including:
|
|
• |
the promotion by the Chinese government of indigenous businesses, through the implementation of favorable tax, lending, purchasing and other programs and through local content requirements (which require that wind turbine equipment purchased for wind farm projects in China contain at least a majority of locally-made components) and the uncertainty and inconsistency in the promotion of foreign investment and enterprise in China; |
|
|
• |
the deterioration of the diplomatic and political relationships between the United States and China resulting from such factors as the opposition of the United States to censorship and other policies of the Chinese government, China’s growing trade surpluses with the United States and the potential introduction by the United States of trade restrictions that would impact Chinese imports and any retaliatory measures that could ensue; |
|
|
• |
the uncertainty of the Chinese legal regime generally, and in particular in protecting intellectual property and contractual rights, in securing future land use rights, and the recent adoption of new labor, environmental and tax laws, the impacts of which are not yet fully understood; and |
|
|
• |
various restrictions on our ability to repatriate profits from China to other jurisdictions. See “Risk Factors—Risks Related to our Business as a Whole—We may have difficulty making distributions and repatriating earnings from our Chinese manufacturing operations, which may also occur in some of our other locations.” |
We also operate in developing markets, which have, in the past, experienced, and may in the future experience, social and political unrest. For example, Turkey has experienced problems with domestic terrorist and ethnic separatist groups and attempted military coups. The issue of civil rights for Kurdish citizens remains a potential source of political instability, which may be exacerbated by continuing instability in the Middle East.
In addition, Juárez, Mexico, the location of our three Mexico manufacturing facilities, has in the past been subject to violence related to drug trafficking, including kidnappings and killings. This could negatively impact our ability to hire and retain personnel, especially senior U.S. managers, to continue to work at these facilities, or disrupt our operation in other ways, which could materially harm our business.
As we continue to operate our business globally, our success will depend, in part, on our ability to anticipate and effectively manage these and other related risks. We may be unsuccessful in developing and implementing policies and strategies that will be effective in managing these risks in each country where we do business or conduct operations. Our failure to manage these risks successfully could materially harm our business, operating results and financial condition.
18
Although a majority of our manufacturing facilities are located outside the United States, our business is still heavily dependent upon the demand for wind energy in the United States and any downturn in demand for wind energy in the United States could materially harm our business.
We have developed a global footprint to serve the growing wind energy market worldwide and have wind blade manufacturing facilities in the United States, China, Mexico and Turkey. Although a majority of our manufacturing facilities are located outside of the United States, historically more than half of the wind blades that we produced were deployed in wind farms located within the United States. Our Iowa and Mexico manufacturing facilities manufacture wind blades that are generally deployed within the United States. In addition, we export wind blades from our China manufacturing facility to the United States. Demand for wind energy and our wind blades in the United States could be adversely affected by a variety of reasons and factors, and any downturn in demand for wind energy and our wind blades in the United States could materially harm our business.
Our focus on wind energy markets in a limited number of geographic areas could result in a material harm to our business, financial condition and results of operations.
The wind energy industry continues to be dependent on developments within a relatively small number of markets and we have developed our global manufacturing footprint and long-term growth strategy to serve these markets. We cannot assure you that these wind energy markets will continue to demand increasing amounts of wind energy going forward. For example, the connection or access of wind turbines to a power grid is very important when locating wind turbines. In each of these markets, there are various laws, rules or regulations that govern the connection or access of wind turbines to the power grid. If the customers of our customers fail to obtain a connection or access to power grids on a timely basis and on economically reasonable terms and enter agreements to sell the electrical energy generated or the number of MW hours that any of these markets consumes declines, our business, financial condition and results of operations could be materially harmed. In addition, if one of those markets does not develop in line with our expectations, our business, financial condition and results of operations could be materially harmed.
We may not achieve the long-term growth we anticipate if wind turbine OEMs do not continue to shift from in-house production of wind blades to outsourced wind blade suppliers and if we do not expand our customer relationships and add new customers.
Many wind turbine OEMs rely on in-house production of wind blades for some or all of their wind turbines. Our growth strategy depends in large part on the continued expansion of our relationships with our current wind blade customers, and the addition of new key customers. The majority of our customers possess the financial, engineering and technical capabilities to produce their own wind blades and many source wind blades from multiple suppliers. Our existing customers may not expand their wind energy operations or, if they do, they may not choose us to supply them with new or additional quantities of wind blades. Our collaborative dedicated supplier model for the manufacture of wind blades is a significant departure from traditional vertically integrated methods. As is typical for rapidly evolving industries, customer demand for new business models is highly uncertain. For instance, although we have entered into long-term supply agreements with three customers, Vestas, Gamesa (which in June 2016 announced a planned merger with Siemens’ wind business) and Nordex (which acquired Acciona in April 2016), that also produce wind blades for their wind turbines in-house, we may not be able to maintain these customer relationships or enter into similar arrangements with new customers that produce wind blades in-house in the future. In addition, although GE Wind has historically outsourced all of their wind blade production, GE Wind will insource some of their wind blade production if their pending acquisition of LM is consummated. Our business and growth strategies depend in large part on the continuation of a current trend toward outsourcing manufacturing. If that trend does not continue or we are unsuccessful in persuading wind turbine OEMs to shift from in-house production to the outsourcing of their wind blade manufacturing, we may not achieve the long-term growth we anticipate and our market share could be limited.
19
A drop in the price of energy sources other than wind energy, or our inability to deliver wind blades that compete with the price of other energy sources, may materially harm our business, financial condition and results of operations.
We believe that a customer’s decision to purchase wind blades is to a significant degree driven by the relative cost of electricity generated by wind turbines compared to the applicable price of electricity from the utility grid and the cost of traditional and other renewable energy sources. Decreases in the prices of electricity from the relevant utility grid or from renewable energy sources other than wind energy would harm the market for wind blades. In particular, a drop in natural gas prices could lessen the appeal of wind-generated electricity. Technological advancements or the construction of a significant number of power generation plants, including nuclear, coal, natural gas or power plants utilizing other renewable energy technologies, government support for other forms of renewable energy or construction of additional electric transmission and distribution lines could reduce the price of electricity produced by competing methods, thereby making the purchase of wind blades less attractive to customers economically. The ability of energy conservation technologies, public initiatives and government incentives to reduce electricity consumption or support other forms of renewable energy could also lead to a reduction in the price of electricity, which would undermine the attractiveness of wind turbines, and, in turn, our wind blades. If prices for electricity generated by wind turbines are not competitive, our business, financial condition and results of operations may be materially harmed.
If any precision molding and assembly systems needed for our manufacturing process contains a defect or is not fabricated and delivered in a timely manner, our ongoing manufacturing operations, business, financial condition and results of operation may be materially harmed.
We custom fabricate many of the precision molding and assembly systems used in our facilities. Our customers also have the option of using third-party manufacturers to produce their custom tooling. If any piece of equipment fails, is determined to produce nonconforming or defective products or is not fabricated and delivered in a timely manner, whether produced by us or a third party, our wind blade production could be interrupted and we could be subject to contractual penalties, warranty claims, loss of revenues and damage to our customer relationships, among other consequences.
Our long-term supply agreements and our backlog are subject to reduction within contractual parameters and we may not realize all of the expected revenue.
Our current long-term wind blade supply agreements generally establish annual purchase requirements on which we rely for our future production and financial forecasts. However, the timing and volume of purchases, within certain parameters, may be subject to change by our customers. In some instances, our customers have the contractual right to require us to reduce the number of manufacturing lines committed to them and correspondingly reduce their minimum annual purchase requirements. Additionally, our minimum annual purchase commitments could potentially understate the actual net sales that we are likely to generate in a given period or periods if all of our long-term supply agreements remain in place and pricing remains materially unchanged. Such minimum annual purchase requirements could also potentially overstate the actual net sales that we are likely to generate in a given period or periods if one or more of our long-term supply agreements were to be terminated by our customers for any reason. As a result, we may not realize the revenue we expect under our long-term supply agreements or pursuant to our backlog, which we define as the value of purchase orders received less the revenue recognized to date on those purchase orders. In addition, fulfillment of our backlog may not result in profits.
The long sales cycle involved in attracting new customers may make the timing of our revenue difficult to predict and may cause our operating results to fluctuate.
The complexity, expense and long-term nature of our supply agreements generally require a lengthy customer education, evaluation and approval process. It can take us from several months to years to identify and attract new customers, if we are successful at all. This long sales cycle for attracting and retaining new customers subjects us to a number of significant risks that may materially harm our business, results of operation and financial condition over which we have limited control, including fluctuations in our quarterly operating results. In addition, we may incur substantial expenses and devote significant management effort to develop potential relationships that do not result in agreements or revenue and may prevent us from pursuing other opportunities.
20
We encounter intense competition for limited customers from other wind blade manufacturers, as well as in-house production by wind turbine OEMs, which may make it difficult to enter into long-term supply agreements, keep existing customers and potentially get new customers.
We face significant competition from other wind blade manufacturers, and this competition may intensify in the future. The wind turbine market is characterized by a relatively small number of large OEMs. In addition, a significant percentage of wind turbine OEMs, including most of our current customers, produce some of their own wind blades in-house. As a result, we compete for business from a limited number of customers that outsource the production of wind blades. We also compete with a number of wind blade manufacturers in China, who are growing in terms of their technical capability and aspire to expand outside of China. Many of our competitors have more experience in the wind energy industry, as well as greater financial, technical or human resources than we do, which may limit our ability to compete effectively with them and maintain or improve our market share. Additionally, our long-term supply agreements dedicate capacity at our facilities to our customers, which may also limit our ability to compete if our facilities cannot accommodate additional capacity. If we are unable to compete effectively for the limited number of customers that outsource production of wind blades, our ability to enter into long-term supply agreements with potential new and existing customers may be materially harmed.
We could be affected by increasing competition from new and existing industry participants and industry consolidation.
The markets in which we operate are increasingly competitive and any failure on our part to compete effectively on an ongoing basis could materially harm our business, results of operations or financial condition. The key factors affecting competition in the wind energy industry are the capacity and quality of products, technology, price, the ability to fulfill local market requirements and the scope, cost and quality of maintenance services, training and support.
Competition in the wind energy industry has intensified in recent years as a result of a number of factors, including international expansion by existing industry participants exploiting new markets, particularly as political will around the issues of global warming and the environment become more prominent to the political agenda in those new markets. There has also been increasing pressure from Asian manufacturers rapidly improving the quality and reliability of their technologies, and considering moving out of their local markets and into international cross border transactions. Market entry by certain large industrial groups, including those previously unconnected to the wind energy market, through acquisitions and license agreements and numerous greenfield establishments in certain markets, also poses a competition risk.
The competitive environment in the wind energy industry may become more challenging in the years ahead, particularly in the event of greater consolidation in the industry, leading to greater market power and “economies of scale” by such market players which translate into being able to offer greater “cost of energy” savings to wind power plant customers. For example, GE announced its planned acquisition of LM in October 2016 and also acquired Alstom S.A.’s power business in 2015; Nordex completed its acquisition of Acciona in June 2016 and also in June 2016 Gamesa announced a planned merger with Siemens’ wind business. These transactions or further consolidation in the wind energy industry may have an adverse impact on our business in the future, including, without limitation, reduced demand for our products and services, product innovation, changes in pricing and similar factors, including any competitor’s attempt to duplicate our collaborative dedicated supplier model. Such events could materially harm our business, results of operations, financial condition or prospects.
Significant increases in the prices of raw materials or components that cannot be reflected in the price of our products could negatively affect our operating margins.
The prices of our raw materials and components are subject to price fluctuations resulting from volatility of supply and demand in world markets. Under our long-term supply agreements, our customers generally commit to purchase minimum annual volumes and prices for wind blades are generally set as of the date of our supply agreements and adjusted annually, or in some cases more frequently, for the cost of raw material and our operating expenses in certain cases. As a result, the competitive nature of the wind blade market and our long-term supply agreements with our customers may delay or prevent us from passing cost increases in raw materials and components on to our customers. Significant increases in the price of raw materials or components used in our
21
manufactured wind blades that cannot be reflected in the price of our products, could negatively affect our operating margins and materially harm our business, operating results or financial condition.
We could experience shortages of raw materials or components critical to our manufacturing needs, which may hinder our ability to perform under our supply agreements.
We rely upon third parties for raw materials, such as fiberglass, carbon, resins, foam core and balsa wood, and various components for the manufacture of our wind blades. Some of these raw materials and components may only be purchased from a limited number of suppliers. For example, balsa wood is only grown and produced in a limited number of geographies and is only available from a limited number of suppliers. Additionally, our ability to purchase the appropriate quantities of raw materials is constrained by our customers’ transitioning wind blade designs and specifications. As a result, we maintain relatively low inventory and acquire raw materials and components as needed. Due to significant international demand for these raw materials from many industries, we may be unable to acquire sufficient quantities or secure a stable supply for our manufacturing needs. If shortages or delays occur, we may be unable to provide our products to our customers on time, or at all. In addition, a disruption in any aspect of our global supply chain caused by transportation delays, customs delays, cost issues or other factors could result in a shortage of raw materials or components critical to our manufacturing needs. Any supply shortages, delays in the shipment of materials or components from third party suppliers, or changes in the terms on which they are available could disrupt or materially harm our business, operating results and financial condition.
Certain of our long-term supply agreements are highly dependent upon a limited number of suppliers of raw materials.
Our ability to perform under certain of our long-term supply agreements is currently, and may continue to be in the future, highly dependent on a limited number of suppliers of raw materials. For instance, our agreements with certain customers require us or our customers to purchase raw materials from a single supplier unless additional suppliers are evaluated and found to satisfy the requirements set out in those agreements. In 2015, for example, our ability to supply wind blades to one of our customers was constrained because our customer, who under our agreement was required to procure a sufficient supply of a specific type of material, was unable to procure the material from a single source supplier. Should any of these suppliers of raw materials experience production delays or shortages, have their operations interrupted or otherwise cease or curtail their operations, this may disrupt or materially harm our business, operating results and financial condition.
Significant increases in the cost of transporting our wind blades could negatively affect the demand for our products.
A significant portion of our customers’ costs are transportation costs related to the transport of our manufactured wind blades to their customers’ wind farms. Demand for our products could be negatively affected if the costs our customers bear to transport our wind blades increase.
The nature of our manufacturing processes and unanticipated changes to those processes could significantly reduce our manufacturing yields and product reliability, which could materially harm our business, operating results and financial condition.
The manufacture of our wind blades involves highly complex and precise processes which may be dictated by our customers’ requests requiring production in highly controlled environments. Changes in our manufacturing processes or that are required by our customers could affect product reliability. Furthermore, many of our processes are manual to facilitate production flexibility and compliance with customer requirements. A manually dependent manufacturing process can limit capacity and increase production costs. In some cases, existing manufacturing techniques may be insufficient to achieve the volume or cost targets of our customers. For example, our manufacturing processes may at times require a quantity of raw materials greater than the quantity for which we have contracted, making it difficult for us to achieve the targeted cost levels negotiated with our customers. In order to achieve targeted volume and cost levels, we may need to increase the quantity of raw materials for which we contract or develop new manufacturing processes and techniques. While we continue to devote substantial efforts to the improvement of our manufacturing techniques and processes, we may not achieve
22
manufacturing volumes and cost levels in our manufacturing activities that will fully satisfy customer demands, which could materially harm our business, operating results and financial condition.
Our reserves for warranty expenses might not be sufficient to cover all future costs.
We provide warranties for all of our products, including parts and labor, for periods that typically range from two to five years depending on the product sold. If a wind blade is found to be defective during the warranty period as a result of a defect in workmanship or materials, or if we are required to cover remediation expenses or other potential remedies, in addition to our regular warranty coverage we may need to repair or replace the wind blade (which could include significant transportation, installation and erection costs) at our sole expense. Our estimate of warranty expense requires us to make assumptions about matters that are highly uncertain, including future rates of product failure, repair costs, shipping and handling and de-installation and re-installation costs at customers’ sites. Our assumptions could be materially different from the actual performance of our products and these remediation expenses in the future. The expenses associated with wind blade repair and remediation activities can be substantial and may include changes to our manufacturing processes. If our estimates prove materially incorrect, we could incur warranty expenses that exceed our reserves and be required to make material unplanned cash expenditures, which could materially harm our business, operating results and financial condition.
We may not be able to meet our customers’ future wind blade supply demands, which may hinder our customer relationships and reputation.
Historically, our existing customers’ demand and MW capacity goals have mirrored the anticipated growth of the wind energy industry. Given the importance of wind energy capture, turbine reliability and cost to power producers, the size, quality and performance of wind blades have become highly strategic to our OEM customers. If we are unable to maintain future manufacturing capacity at levels that meet our customers’ increasing demands, including with respect to volume, technical specifications, or commercial terms, our existing customers may seek relationships with, or give priority to, other wind blade manufacturers or may use or develop their own internal manufacturing capabilities to meet their increased demand, which could materially harm our business, operating results and financial condition. In addition, our reputation could be materially harmed if we are unable to satisfy the requirements of our customers.
We rely on our research and development efforts to remain competitive, and we may fail to develop on a timely basis new wind blade manufacturing technologies that are commercially attractive or permit us to keep up with customer demands.
The market for wind blades is subject to evolving customer needs and expectations. Our research and development is invested in developing faster and more efficient manufacturing processes in order to build the new wind blades designed by our customers that more effectively capture wind energy and are adaptable to new growth segments of the wind energy market. Research and development activities are inherently uncertain and the results of our in-house research and development may not be successful. In addition, our competition may adopt more advanced technologies or develop wind blades that are more effective or commercially attractive. We believe that our future success will depend in large part upon our ability to be at the forefront of technological innovation in the wind energy industry and to rapidly and cost-effectively adapt our wind blade manufacturing processes to keep pace with changing technologies, new wind blade design and changing customer needs. If we are unable to do so, our business, operating results, financial condition and reputation could be materially harmed.
Many of our long-term supply agreements contain liquidated damages provisions, which may require us to make unanticipated payments to our customers.
Many of our long-term supply agreements contain liquidated damages provisions in the event that we fail to perform our obligations thereunder in a timely manner or in accordance with the agreed terms, conditions and standards. Our liquidated damages provisions generally require us to make a payment to the customer if we fail to deliver a product or service on time. We generally try to limit our exposure under any individual long-term supply agreement to a maximum penalty. Nevertheless, if we incur liquidated damages, they may materially harm our business, operating results and financial condition.
23
We depend on third parties for certain construction, maintenance, engineering, transportation, warehousing and logistics services, and failures of those third parties to perform their obligations may in turn impede our ability to perform our obligations.
We contract with third parties for certain services relating to the design, construction and maintenance of various components of our production facilities and other systems. If these third parties fail to comply with their obligations:
|
|
• |
we may experience delays in the completion of new facilities or expansion of existing facilities; |
|
|
• |
the facilities may not operate as intended; |
|
|
• |
we may be required to recognize impairment charges; or |
|
|
• |
we could experience production delays, which could cause us to miss our production capacity targets and breach our long-term supply agreements, which could damage our relationships with our customers and subject us to contractual penalties and contract termination. |
Any of these events could have a material adverse effect on our business, operating results or financial condition. Our customers also contract with third parties for the transportation of the products we manufacture. In particular, a significant portion of the goods we manufacture are transported to different countries, which requires sophisticated warehousing, logistics and other resources. If our customers fail to contract with third parties for certain construction, maintenance, engineering, transportation, warehousing and logistics services, or there are any disruptions, delays or failures in these services, this could have a material adverse effect on our business, operating results or financial condition.
Various legislation, regulations and incentives that are expected to support the growth of wind energy in the United States and around the world may not be extended or may be discontinued, phased out or changed, or may not be successfully implemented, which could materially harm wind energy programs and materially decrease demand for our wind blades.
The U.S. wind energy industry is dependent in part upon governmental support through certain incentives including federal tax incentives and RPS programs and may not be economically viable absent such incentives. Government-sponsored tax incentive programs including the PTC, and to a lesser extent, the Investment Tax Credit, are expected to support the U.S. growth of wind energy. The PTC provided the owner of a wind turbine placed in operation before January 1, 2015 with a ten year credit against its U.S. federal income tax obligations based on the amount of electricity generated by the wind turbine.
Although the PTC was extended in December 2015 for wind power projects through December 31, 2019, as currently contemplated, the PTC rate is being phased out over the term of the PTC extension. Specifically, as currently contemplated, the PTC will remain at the same rate in effect at the end of 2014 for wind power projects that commence construction by the end of 2016, and thereafter will be reduced by 20% per year in 2017, 2018 and 2019, respectively.
In 2015, the EPA enacted the Clean Power Plan, which is also intended to promote the growth of renewable energy. However, in February 2016, the United States Supreme Court issued a stay of the EPA’s implementation of the Clean Power Plan until the D.C. Circuit of the United States Court of Appeals reviews the merits of multiple lawsuits challenging the legality of the Clean Power Plan. If the Clean Power Plan is not successfully implemented, demand for our wind blades may be materially decreased.
In addition, many state governments have adopted measures designed to promote wind energy. For example, according to the American Wind Energy Association (AWEA), at the state level, as of December 31, 2016, 29 states, as well as the District of Columbia, have implemented RPS programs that mandate that a specific percentage of electricity sales in a state come from renewable energy within a specified period. However, RPS programs have been challenged lately and they may not continue going forward. These programs have spurred significant growth in the wind energy industry in the United States and a corresponding increase in the demand for our manufactured wind blades. However, although the U.S. government and several state governments have adopted these various programs that are expected to drive the growth of wind energy, they may approve new or additional programs that
24
might hinder the wind energy industry and therefore negatively impact our business, operating results or financial condition. See “Risk Factors—Risks Related to Our Wind Blade Business—The results of the 2016 United States presidential and congressional elections has created regulatory uncertainty for our business and the wind energy sector and may materially harm our business, financial condition and results of operations” included in Part I, Item 1A of this Annual Report on Form 10-K
China is currently implementing its 13th 5-Year Plan with a goal of 15% energy from non-fossil fuel sources and targeting 210 GWs of grid-connected wind capacity by 2020, according to its National Development and Reform Commission, and employs preferential feed-in tariff schemes, in addition to local tax-based incentives. Mexico has established strict targets, aiming for 35% renewable energy by 2024 and 50% by 2050, according to MAKE, which it is facilitating through tax incentives. Large European Union members have renewable energy targets for 2020 of between 13% and 49% of all energy use derived from renewable energy sources, according to MAKE. Turkey enacted Law No. 5346 in 2005 to promote renewable-based electricity generation within its domestic electricity market by introducing tariffs and purchase obligations for distribution companies requiring purchases from certified renewable energy producers. The World Bank also provided to Turkey an aggregate of $600 million of loan proceeds to encourage investors to construct generation plants with renewable energy resources. These programs have spurred significant growth in the wind energy industry internationally and a corresponding increase in the demand for our manufactured wind blades. However, although foreign governments have adopted various programs that are expected to drive the growth of wind energy, they may approve new or additional programs going forward that might hinder the wind energy industry and therefore negatively impact our business as a result. For example, foreign governments may decide to reduce or eliminate these economic incentives for political, financial or other reasons. They may also favor other forms of energy, including current and new sources of energy such as solar, nuclear and hydropower.
Because of the long lead times necessary to develop wind energy projects, any uncertainty or delay in adopting, extending or renewing these incentives beyond their current or future expiration dates could negatively impact potential wind energy installations and result in industry volatility. There can be no assurance that the PTC, the Clean Power Plan or other governmental programs or subsidies for renewable energy will remain in effect in their present form or at all, and the elimination, reduction, or modification of these programs or subsidies could materially harm wind energy programs in the United States and international markets and materially decrease demand for our wind blades and, in turn, materially harm our business, operating results and financial condition.
We may not be able to obtain, or agree on acceptable terms and conditions for, government tax credits, grants, loans and other incentives for which we have in the past applied or may in the future apply, which may materially harm our business, operating results and financial condition.
We have in the past and may in the future rely, in part, on tax credits, grants, loans and other incentives under U.S. and foreign governmental programs to support the construction of new plants and expansion of existing manufacturing facilities. We may not be successful in obtaining these tax credits, grants, loans and other incentives, and the tax and other incentives that have already been approved may not be continued in the future. Our ability to obtain funds or incentives from government sources is subject to the availability of funds under applicable governmental programs and approval of our applications to participate in these programs. The application process for these funds and other incentives is and will be highly competitive. We may not be able to satisfy the requirements and milestones imposed by the granting authority as conditions to receipt of the funds or other incentives, the timing of the receipt of the funds may not meet our needs, and, even if obtained, we may be unable to successfully execute on our business plan. Moreover, not all of the terms and conditions associated with these incentive funds have been disclosed to us, and once disclosed, there may be terms and conditions with which we are unable to comply or that are commercially unacceptable to us. Further, participation in certain programs may require us to notify the federal government of certain intellectual property we develop and comply with applicable regulations in order to protect our interests in that intellectual property. In addition, these federal governmental programs may require us to spend a portion of our own funds for every incentive dollar we receive or are permitted to borrow from the government and may impose time limits during which we must use the funds awarded to us that we may be unable to achieve. If we are unable to obtain or comply with the terms of these tax credits, grants, loans or other incentives, our business, operating results and financial condition may be harmed.
25
Adverse weather conditions could impact the wind energy industry in some regions and could materially harm our business, operating results and financial condition.
Our business may be subject to fluctuations in sales volumes due to adverse weather conditions that could delay the erection of wind turbines, the installation of wind blades and the ability of wind turbines to generate electricity efficiently. Moreover, any remediation efforts we could be required to undertake pursuant to wind blade warranties could be delayed or otherwise adversely impacted by poor weather. Although our customer base and geographical footprint is geographically diversified, enduring weather patterns or seasonal variations may impact the expansion of the wind energy industry in certain regions. A resulting reduction or delay in demand for the wind blades we manufacture for our customers could materially harm our business, operating results and financial condition.
In mid-2015, our Audit Committee conducted an internal investigation into allegations of improper business dealings in China. While the investigation did not substantiate the allegations, we ultimately terminated our former Senior Vice President—Asia, then serving as a consultant to the Company, in January 2016 for material violations of his agreements with us and of Company policies, which came to light subsequent to the completion of the internal investigation. Any misconduct that the initial investigation or our subsequent review of the activities of our former Senior Vice President—Asia failed to uncover could have a material adverse effect on our operations generally.
In June 2015, our Audit Committee was notified of allegations that, among other things, our former Senior Vice President—Asia requested personal compensation from suppliers in return for doing business with the Company in China and made excessive payments for capital expenditures. The Audit Committee directed a U.S.-based law firm, assisted by a forensic accounting firm and a law firm with local resources in China, to initiate an investigation into the conduct of the former Senior Vice President—Asia. Although the investigation did not uncover any illegal conduct, the investigation did not disprove the allegations. We subsequently accelerated the implementation of enhanced operational procedures, processes and controls relating to our China operations pursuant to recommendations arising out of the internal investigation and our review of our China operations. This process is currently ongoing.
Although the results of the internal investigation were inconclusive regarding the allegations relating to our former Senior Vice President—Asia, in early August 2015, we entered into a transition agreement with our former Senior Vice President—Asia pursuant to which he transitioned out of his role as Senior Vice President—Asia at the end of 2015. Pursuant to the transition agreement, he was to serve in a consulting capacity to facilitate an orderly transition of operations in China through 2016 and 2017. In January 2016, we subsequently determined that our former Senior Vice President—Asia, then serving as a consultant to the Company, had materially violated the terms of the transition agreement, including the non-compete provisions, and had materially violated Company policies. Following our discovery of these violations, we terminated his consultancy for cause in January 2016 pursuant to the terms of the transition agreement and he is no longer associated with the Company. Subsequent to his termination, we found further evidence that our former Senior Vice President—Asia and three of his subordinates in China, who we also terminated in January 2016, likely engaged in improper conduct involving the misuse of funds in violation of Company policies.
Additional facts or allegations may exist that the internal investigation or our subsequent review did not uncover. The persons that our investigative teams interviewed may have omitted facts or may have been untruthful, and the investigative teams may not have had access to all relevant documents or persons relating to the subject of the investigation. If new evidence concerning the allegations is found in the future, or if new allegations are made or other similar issues arise or are uncovered, our Chinese operations could be materially disrupted, our suppliers and customers may cease to do business with us, our reputation in the marketplace may be materially harmed, we may be required to terminate additional key employees, and we may need to incur substantial legal and accounting costs in investigating and resolving these matters. If any of these risks materialize, we could be subject to fines, penalties, prosecution or other impacts, which could result in a decline in our stock price or materially and adversely affect our business, operating results, liquidity and financial condition.
26
Our long-term growth and success is dependent upon retaining our senior management and attracting and retaining qualified personnel.
Our growth and success depends to a significant extent on our ability to attract and retain highly qualified research and development, management, manufacturing, marketing and other key personnel including engineers in our various locations. In addition, we rely heavily on our management team, including Steven C. Lockard, our Chief Executive Officer; Mark R. McFeely, our Chief Operating Officer; William E. Siwek, our Chief Financial Officer; and other senior management. The inability to recruit and retain key personnel or the unexpected loss of key personnel may materially harm our business, operating results and financial condition. Hiring those persons may be especially difficult because of the specialized nature of our business and our international operations. If we cannot attract and retain qualified personnel, or if we lose the services of Messrs. Lockard, McFeely or Siwek, other key members of senior management or other key personnel, our ability to successfully execute our business plan, market and develop our products and serve our customers could be materially and adversely affected. In addition, because of our reliance on our management team, our future success depends, in part, on its ability to identify and develop talent to succeed its senior management. The retention of key personnel and appropriate senior management succession planning will continue to be critical to the successful implementation of our future strategies.
Risks Related to Our Business as a Whole
We may not be able to manage our future growth effectively, which may materially harm our business, operating results and financial condition.
We expect to continue to expand our business significantly to meet our current and expected future contractual obligations and to satisfy anticipated increased demand for our products. To manage our anticipated expansion, we believe we must scale our internal infrastructure, including establishing additional facilities, improve our operational systems and procedures and manufacturing capabilities, continue to enhance our compliance and quality assurance systems, train and manage our growing employee base, and retain and add to our current executives and management personnel. Rapid expansion of our operations could place a significant strain on our senior management team, support teams, manufacturing lines, information technology platforms and other resources. Difficulties in effectively managing the budgeting, forecasting and other process control issues presented by any rapid expansion could materially harm our business, prospects, results of operations or financial condition. Our inability to implement operational improvements, generate and sustain increased revenue and manage and control our cost of goods sold and operating expenses could impede our future growth and materially harm our business, operating results and financial condition.
We have a history of net losses and may not achieve or maintain profitability in the future.
We have a history of significant net losses, including a net loss of $6.6 million for the year ended December 31, 2014. For the years ended December 31, 2016 and 2015, we had net income of $13.8 million and $7.7 million, respectively. As a result of past operating losses, the effect of redeemable preferred share cumulative dividends earned and the accretion to redemption amounts, we had an accumulated deficit of $182.8 million as of December 31, 2016. Although we were profitable for the year ended December 31, 2016, we may not be able to achieve profitability for the current or any future fiscal year. In addition, we expect our operating expenses to increase as we continue to seek new customer relationships and expand our operations. Our ability to achieve and maintain profitability depends on a number of factors, including the growth rate of the wind energy industry, the competitiveness of our wind blades and our ability to successfully build new and expand existing manufacturing facilities and increase production capacity at existing plants. We may incur significant losses in the future for a number of reasons, including due to the other risks described in this Annual Report on Form 10-K, and we may encounter unforeseen expenses, difficulties, complications and delays and other unknown events. In addition, as a public company, we incur significant legal, accounting and other expenses that we did not incur as a private company. As a result, our operations may not achieve profitability in the future and, even if we do achieve profitability, we may not be able to maintain or increase it.
27
Our financial position, revenue, operating results and profitability are difficult to predict and may vary from quarter to quarter, which could cause our share price to decline significantly.
Our quarterly revenue, operating results and profitability have varied in the past and are likely to vary significantly from quarter to quarter in the future. For example, our quarterly results have ranged from an operating profit of $16.6 million for the three months ended December 31, 2015 to an operating loss of $2.7 million for the three months ended March 31, 2015. The factors that are likely to cause these variations include:
|
|
• |
operating and startup costs of new manufacturing facilities; |
|
|
• |
wind blade model transitions; |
|
|
• |
differing quantities of wind blade production, including the amount subject to storage arrangements; |
|
|
• |
unanticipated contract or project delays or terminations; |
|
|
• |
changes in the costs of raw materials or disruptions in raw material supply; |
|
|
• |
scrap of defective products; |
|
|
• |
warranty expense; |
|
|
• |
availability of qualified personnel; |
|
|
• |
employee wage levels; |
|
|
• |
costs incurred in the expansion of our existing manufacturing capacity; |
|
|
• |
volume reduction requests from our customers pursuant to our customer agreements; and |
|
|
• |
general economic conditions. |
As a result, our revenue, operating results and profitability for a particular period are difficult to predict and may decline in comparison to corresponding prior periods regardless of the strength of our business. It is also possible that in some future periods our revenue, operating results and profitability may not meet the expectations of securities analysts or investors. If this occurs, the trading price of our common stock could fall substantially, either suddenly or over time, and our business, operating results and financial condition would be materially harmed.
The fluctuation of foreign currency exchange rates could materially harm our financial results.
Since we conduct a significant portion of our operations internationally, our business is subject to foreign currency risks, including currency exchange rate fluctuations. The exchange rates are affected by, among other things, changes in political and economic conditions. For example, an increase in our Turkey sales and operations will result in a larger portion of our net sales and expenditures being denominated in the Euro and Turkish Lira. Significant fluctuations in the exchange rate between the Turkish Lira and the U.S. dollar, the Turkish Lira and the Euro or the Euro and the U.S. dollar may adversely affect our revenue, expenses, as well as the value of our assets and liabilities. Similarly, an increase in our China sales and operations will result in a larger portion of our net sales and expenditures being denominated in Chinese Renminbi. The Chinese government controls the procedures by which the Chinese Renminbi is converted into other currencies, and conversion of the Chinese Renminbi generally requires government consent. As a result, the Chinese Renminbi may not be freely convertible into other currencies at all times. If the Chinese government institutes changes in currency conversion procedures, or imposes restrictions on currency conversion, those actions may materially harm our business, liquidity, financial condition and operating results. In addition, significant fluctuations in the exchange rate between the Chinese Renminbi and U.S. dollars may adversely affect our expenses as well as the value of our assets and liabilities. To the extent our future revenues are generated outside of the United States in currencies other than the U.S. dollar, including the Euro, the Turkish Lira, the Chinese Renminbi or Mexican Peso, among others, we will be subject to increased risks relating to foreign currency exchange rate fluctuations which could materially harm our business, financial condition and operating results.
28
Our manufacturing operations and future growth are dependent upon the availability of capital, which may be insufficient to support our capital expenditures.
Our current wind blade manufacturing activities and future growth will require substantial capital investment. For the years ended December 31, 2016 and 2015, our capital expenditures were $40.5 million and $31.4 million, respectively, including assets acquired under capital lease in 2016 and 2015 of $10.0 million and $5.0 million, respectively. We have recently entered into lease agreements with third parties to lease new manufacturing facilities in China, Mexico and Turkey. Major projects expected to be undertaken include purchasing equipment for and the expansion of our Dafeng, China and Taicang China facilities and new facilities in Mexico and Turkey. Our ability to grow our business is predicated upon us making significant additional capital investments to expand our existing manufacturing facilities and build and operate new manufacturing facilities in existing and new markets. We generally estimate that the startup of a new six line manufacturing facility requires cash for net operating expenses and working capital of between $15 million to $25 million and additional capital expenditures for machinery and equipment of between $15 million to $25 million. In addition, we estimate our annual maintenance capital expenditures to be between $1.0 million to $1.5 million per facility. We may not have the capital to undertake these capital investments. In addition, our capital expenditures may be significantly higher if our estimates of future capital investments are incorrect and may increase substantially if we are required to undertake actions to comply with new regulatory requirements or compete with new technologies. The cost of some projects may also be affected by foreign exchange rates if any raw materials or other goods must be paid for in foreign currency. We cannot assure you that we will be able to raise funds on favorable terms, if at all, or that future financings would not be dilutive to holders of our capital stock. We also cannot assure you that completed capital expenditures will yield the anticipated results. If we raise additional funds by obtaining loans from third parties, the terms of those financing arrangements may include negative covenants, or other restrictions on our business that could impair our operational flexibility, and would require us to fund additional interest expense. If we are unable to obtain sufficient capital at a reasonable cost or at all, we may not be able to expand production sufficiently to take advantage of changes in the marketplace or may be required to delay, reduce or eliminate some or all of our current operations, which could materially harm our business, operating results and financial condition.
As a U.S. corporation with international operations, we are subject to the U.S. Foreign Corrupt Practices Act of 1977, which could impact our ability to compete in certain jurisdictions.
As a U.S. corporation, we are subject to the FCPA, which generally prohibits U.S. companies and their intermediaries from making improper payments to foreign officials for the purpose of obtaining or keeping business. We have manufacturing facilities in China, Mexico and Turkey, countries with a fairly high risk of corruption. Those facilities are subject to routine government oversight. In addition, a small number of our raw materials and components suppliers are state-owned in China. Moreover, due to our need to import raw materials across international borders, we also routinely have interactions, directly or indirectly, with customs officials. In many foreign countries, under local custom, businesses engage in practices that may be prohibited by the FCPA or other similar laws and regulations. Additionally, we continue to hire employees around the world as we continue to expand. Although we have recently implemented certain procedures designed to ensure compliance with the FCPA and similar laws, there can be no guarantee that all of our employees and agents, as well as those companies to which we outsource certain of our business operations, have not taken and will not take actions that violate our policies and the FCPA, which could subject us to fines, penalties, disgorgement, and loss of business, harm our reputation and impact our ability to compete in certain jurisdictions. In addition, these laws are complex and far-reaching in nature, and, as a result, we may be required in the future to alter one or more of our practices to be in compliance with these laws or any changes in these laws or the interpretation thereof. Moreover, our competitors may not be subject to the FCPA or comparable legislation, which could provide them with a competitive advantage in some jurisdictions.
We may have difficulty making distributions and repatriating earnings from our Chinese manufacturing operations, which may also occur in some of our other locations.
A material portion of our business is conducted in China. As of December 31, 2016, our China operations had unrestricted cash of $12.3 million, most of which will be used to fund our future operations in China. Our ability to repatriate funds from China to the United States is subject to a number of restrictions imposed by the Chinese government. We repatriate funds through several technology license and corporate/administrative service
29
agreements. We are compensated quarterly based on agreed upon royalty rates for such intellectual property licenses and quarterly fees for those services. Certain of our subsidiaries are limited in their ability to declare dividends without first meeting statutory restrictions of the People’s Republic of China, including retained earnings as determined under Chinese-statutory accounting requirements. Until 50% ($5.2 million) of registered capital is contributed to a surplus reserve, our Chinese operations can only pay dividends equal to 90% of after-tax profits (10% must be contributed to the surplus reserve). Once the surplus reserve fund requirement is met, we can pay dividends equal to 100% of after-tax profit assuming other conditions are met. At December 31, 2016, the amount of the surplus reserve fund was $4.4 million. Any inability to make distributions, repatriate earnings or otherwise access funds from our manufacturing operations in China, if and when needed for use outside of China, could materially harm our liquidity and our business.
Effective internal controls are necessary for us to provide reliable financial reports and effectively address fraud risks.
We maintain a system of internal controls to provide reasonable assurance regarding the reliability of financial reporting and the preparation of financial statements for external purposes in accordance with U.S. generally accepted accounting principles (GAAP). The process of designing and implementing effective internal controls is a continuous effort that requires us to anticipate and react to changes in our business and the economic and regulatory environments and to expend significant resources to establish and maintain a system of internal controls that will be adequate to satisfy the reporting obligations of a public company. The effectiveness of our internal controls depends in part on the cooperation of senior managers worldwide. See “Risk Factors—Risks Related to Our Wind Blade Business—In mid-2015, our Audit Committee conducted an internal investigation into allegations of improper business dealings in China. While the investigation did not substantiate the allegations, we ultimately terminated our former Senior Vice President—Asia, then serving as a consultant to the Company, in January 2016 for material violations of his agreements with us and with Company policies that came to light subsequent to the completion of the internal investigation. Any misconduct that the investigation or our subsequent review of the activities of our former Senior Vice President—Asia failed to uncover could have a material adverse effect on our operations generally.”
Any system of controls, however well designed and operated, can provide only reasonable, and not absolute, assurance that the objectives of the system are met. Any failure to maintain that system, or consequent inability to produce accurate financial statements on a timely basis, could increase our operating costs and harm our business, and lead to our becoming subject to litigation, sanctions or investigations by The NASDAQ Global Market (NASDAQ), the SEC or other regulatory governmental agencies and bodies. Furthermore, investors’ perceptions that our internal controls are inadequate or that we are unable to produce accurate financial statements on a timely basis may harm our stock price.
We have in the past experienced material weaknesses. While we have successfully remediated those material weaknesses, we could experience control deficiencies in the future or identify areas requiring improvement in our internal control over financial reporting.
The state of financial markets and the economy may materially harm our sources of liquidity and capital.
There has been significant recent turmoil and volatility in worldwide financial markets. These conditions have resulted in a disruption in the liquidity of financial markets, and could directly impact us to the extent we need to access capital markets to raise funds to support our business and overall liquidity position. This situation could affect the cost of such funds or our ability to raise such funds. If we were unable to access any of these funding sources when needed, it could materially harm our business, operating results and financial condition.
Our ability to use our net operating loss carry forwards may be subject to limitation and may result in increased future tax liability.
Sections 382 and 383 of the Internal Revenue Code of 1986, as amended (the Code), contain rules that limit the ability of a company that undergoes an “ownership change” to utilize its net operating loss and tax credit carry forwards and certain built-in losses recognized in years after the ownership change. An “ownership change” is generally defined as any change in ownership of more than 50% of a corporation’s stock over a rolling three-year
30
period by stockholders that own (directly or indirectly) 5% or more of the stock of a corporation, or arising from a new issuance of stock by a corporation. If an ownership change occurs, Section 382 generally imposes an annual limitation on the use of pre-ownership change net operating losses (NOLs), credits and certain other tax attributes to offset taxable income earned after the ownership change. The annual limitation is equal to the product of the applicable long-term tax exempt rate and the value of the company’s stock immediately before the ownership change. This annual limitation may be adjusted to reflect any unused annual limitation for prior years and certain recognized built-in gains and losses for the year. In addition, Section 383 generally limits the amount of tax liability in any post-ownership change year that can be reduced by pre-ownership change tax credit carryforwards. This could result in increased U.S. federal income tax liability for us if we generate taxable income in a future period. Limitations on the use of NOLs and other tax attributes could also increase our state tax liability. The use of our tax attributes will also be limited to the extent that we do not generate positive taxable income in future tax periods. As a result of these limitations, we may be unable to offset future taxable income (if any) with losses, or our tax liability with credits, before such losses and credits expire. Accordingly, these limitations may increase our federal income tax liability.
Although we have not experienced an ownership change since 2008, it is possible that future transactions may cause us to undergo one or more ownership changes. As of December 31, 2016, we have U.S. federal NOLs of approximately $57.5 million, state NOLs of approximately $77.2 million, foreign tax credits of approximately $2.6 million and Turkey investment tax credits of approximately $0.3 million available to offset future taxable income. In 2008, we had an “ownership change” and the pre-ownership change NOLs existing at the date of change of $25.6 million were subject to an annual limitation of $4.3 million. As of December 31, 2016, the pre-ownership change NOLs are no longer limited. Certain of these NOLs may be at risk of limitation in the event of a future ownership change.
We have U.S. federal and state NOLs. In general, NOLs in one country cannot be used to offset income in any other country and NOLs in one state cannot be used to offset income in any other state. Accordingly, we may be subject to tax in certain jurisdictions even if we have unused NOLs in other jurisdictions. Also, each jurisdiction in which we operate may have its own limitations on our ability to utilize NOLs or tax credit carryovers generated in that jurisdiction. These limitations may increase our federal, state, and/or foreign income tax liability.
Our current credit facility with HPS Investment Partners, LLC and Capital One, N.A. contains, and any future loan agreements we may enter into may contain, operating and financial covenants that may restrict our business and financing activities.
We have a $100.0 million amended and restated credit facility (the Amended Credit Facility) with HPS Investment Partners, LLC and Capital One, N.A., consisting of a $75.0 million term loan and a $25.0 million revolving credit facility, which includes a $15.0 million letter of credit sub-facility. As of December 31, 2016, the aggregate outstanding balance under the Amended Credit Facility was $77.8 million. The Amended Credit Facility is secured by substantially all of our assets. In addition, from time to time, we enter into various loan, working capital and accounts receivable financing facilities to finance the construction and ongoing operations of our advanced manufacturing facilities and other capital expenditures. The Amended Credit Facility contains various financial covenants and restrictions on our and our operating subsidiaries’ excess cash flows and ability to make capital expenditures, incur additional indebtedness and pay dividends or make distributions on, or repurchase, our stock. The operating and financial restrictions and covenants of the Amended Credit Facility, as well as our other existing and any future financing agreements that we may enter into, may restrict our ability to finance our operations, engage in business activities or expand or fully pursue our business strategies. Our ability to comply with these covenants may be affected by events beyond our control, and we may not be able to maintain appropriate minimum leverage ratio and fixed charge coverage ratio requirements in the future. A breach of any of these covenants could result in a default under the applicable loan facility, which could cause all of the outstanding indebtedness under such facility to become immediately due and payable by us and/or enable the lender to terminate all commitments to extend further credit. In addition, if we were unable to repay the outstanding indebtedness upon a default, our lenders could proceed against the assets pledged as collateral to secure that indebtedness.
31
Our indebtedness may adversely affect our business, results of operations and financial condition.
Our indebtedness could adversely affect our business, results of operations and financial condition by, among other things:
|
|
• |
requiring us to dedicate a substantial portion of our cash flow from operations to pay principal and interest on our debt, which would reduce the availability of our cash flow to fund working capital, capital expenditures, acquisitions, execution of our growth strategy and other general corporate purposes; |
|
|
• |
limiting our ability to borrow additional amounts to fund debt service requirements, working capital, capital expenditures, acquisitions, execution of our growth strategy and other general corporate purposes; |
|
|
• |
making us more vulnerable to adverse changes in general economic, industry and regulatory conditions and in our business by limiting our flexibility in planning for, and making it more difficult to react quickly to, changing conditions; |
|
|
• |
placing us at a competitive disadvantage compared with those of our competitors that have less debt and lower debt service requirements; |
|
|
• |
making us more vulnerable to increases in interest rates since some of our indebtedness is subject to variable rates of interest; and |
|
|
• |
making it more difficult for us to satisfy our financial obligations. |
In addition, we may not be able to generate sufficient cash flow from our operations to repay our outstanding indebtedness when it becomes due and to meet our other cash needs or to comply with the financial covenants set forth therein. If we are not able to pay our debts as they become due, we could be in default of the Amended Credit Facility or other indebtedness. We might also be required to pursue one or more alternative strategies to repay indebtedness, such as selling assets, refinancing or restructuring our indebtedness or selling additional debt or equity securities. We may not be able to refinance our debt or sell additional debt or equity securities or our assets on favorable terms, if at all, and if we must sell assets, it may negatively affect our ability to generate revenues.
Much of our intellectual property consists of trade secrets and know-how that is very difficult to protect. If we experience loss of protection for our trade secrets or know-how, our business would be substantially harmed.
We have a variety of intellectual property rights, including patents, trademarks and copyrights, but much of our most important intellectual property rights consists of trade secrets and know-how and effective intellectual property protection may be unavailable, limited or outside the scope of the intellectual property rights we pursue in the United States and in foreign countries such as China where we operate. Although we strive to protect our intellectual property rights, there is always a risk that our trade secrets or know-how will be compromised or that a competitor could lawfully reverse-engineer our technology or independently develop similar or more efficient technology. We have confidentiality agreements with each of our customers, suppliers, key employees and independent contractors in place to protect our intellectual property rights, but it is possible that a customer, supplier, employee or contractor might breach the agreement, intentionally or unintentionally. For example, we believe a key former employee may have shared some of our intellectual property with a competitor in China and this former employee or the competitor may use this intellectual property to compete with us in the future. It is also possible that our confidentiality agreements with customers, suppliers, employees and contractors will not be effective in preserving the confidential nature of our intellectual property rights. The patents we own could be challenged, invalidated, narrowed or circumvented by others and may not be of sufficient scope or strength to provide us with any meaningful protection or commercial advantage. Once our patents expire, or if they are invalidated, narrowed or circumvented, our competitors may be able to utilize the inventions protected by our patents. Additionally, the existence of our intellectual property rights does not guarantee that we will be successful in any attempt to enforce these rights against third parties in the event of infringement, misappropriation or other misuse, which may materially and adversely affect our business. Because our ability to effectively compete in our industry depends upon our ability to protect our proprietary technology, we might lose business to competitors and our business, revenue, operating results and prospects could be materially harmed if we suffer loss of trade secret and know-how protection or breach of our confidentiality agreements.
32
If the transfer pricing arrangements we have among our subsidiaries are determined to be inappropriate in one or more jurisdictions, our tax liability may increase.
In many countries, including the United States, we are subject to transfer pricing and other tax regulations designed to ensure that appropriate levels of income are reported as earned in each jurisdiction in which we operate. These regulations require that any international transaction involving associated enterprises be on substantially the same basis as a transaction between unrelated companies dealing at arms’ length and that contemporaneous documentation be maintained to support the transfer prices. We have transfer pricing arrangements among our subsidiaries in relation to various aspects of our business. We consider the transactions among our subsidiaries to be substantially on arm’s-length terms. If, however, a tax authority in any jurisdiction reviews any of our tax returns and determines that the transfer prices and terms we have applied are not appropriate, or that other income of our affiliates should be taxed in that jurisdiction, we may incur increased tax liability, including accrued interest and penalties, which would cause our tax provision to increase, possibly materially. In addition, if the jurisdiction from which the income is reallocated does not agree with the reallocation, both jurisdictions could tax the same income, resulting in double taxation. If tax authorities were to allocate income to a higher tax jurisdiction, subject our income to double taxation, or assess interest and penalties, it would increase our consolidated tax liability, which could materially harm our business, operating results and financial condition.
Our insurance coverage may not cover all risks we face and insurance premiums may increase, which may hinder our ability to maintain sufficient coverage to cover losses we may incur.
We are exposed to risks inherent in the manufacturing of wind blades and other composite structures as well as the construction of our facilities, such as natural disasters, breakdowns and manufacturing defects that could harm persons and damage property. We maintain insurance coverage with licensed insurance carriers that limits our aggregate exposure to certain types of catastrophic losses. In addition, we self-insure for a portion of our claims exposure resulting from workers’ compensation and certain events of general liability. We accrue currently for estimated incurred losses and expenses, and periodically evaluate and adjust our claims accrued liability amount to reflect our experience. However, our insurance coverage may not be sufficient to cover the full amount of potential losses. In addition, there are some types of losses such as from warranty, hurricanes, terrorism, wars, or earthquakes where insurance is limited and/or not economically justifiable. If we were to sustain a serious uninsured loss or a loss exceeding the limits of our insurance policies, the resulting costs could have a material adverse effect on our business prospects, results of operations and financial condition. Further, our insurance policies provide for our premiums to be adjusted annually. If the premiums we pay for our policies increase significantly, we may be unable to maintain the same level of coverage we currently carry, or we will incur significantly greater costs to maintain the same level of coverage, including through higher deductibles.
We may be subject to significant liabilities and costs relating to environmental and health and safety requirements.
We are subject to various environmental, health and safety laws, regulations and permit requirements in the jurisdictions in which we operate governing, among other things, health, safety, pollution and protection of the environment and natural resources, the handling and use of hazardous substances, the generation, storage, treatment and disposal of wastes, and the cleanup of any contaminated sites. We have incurred, and expect to continue to incur, capital and operating expenditures to comply with such laws, regulations and permit requirements. While we believe that we currently are in material compliance with all such laws, regulations and permit requirements, any noncompliance may subject us to a range of enforcement measures, including the imposition of monetary fines and penalties, other civil or criminal sanctions, remedial obligations, and the issuance of compliance requirements restricting our operations. In addition, the future adoption of more stringent laws, regulations and permit requirements may require us to make additional capital and operating expenditures. Under certain environmental laws and regulations, liabilities also can be imposed for cleanup of currently and formerly owned, leased or operated properties, or properties to which we sent hazardous substances or wastes, regardless of whether we directly caused the contamination or violated any law. For example, we could have future liability relating to any contamination that remains from historic industrial operations by others at our properties. Additionally, some of our facilities have a long history of industrial operations and, in the past, contaminants have been detected and remediated at our Turkey facility.
33
There can be no assurance that we will not in the future become subject to compliance requirements, obligations to undertake cleanup or related activities, or claims or proceedings relating to environmental, health or safety matters, hazardous substances or wastes, contaminated sites, or other environmental or natural resource damages, that could impose significant liabilities and costs on us and materially harm our business, operating results or financial condition.
Claims that we infringe, misappropriate or otherwise misuse the intellectual property rights of others could subject us to significant liability and disrupt our business.
Our competitors and third party suppliers of components and raw materials used in our products protect their intellectual property rights by means such as trade secrets and patents. In the future we may be sued for violations of other parties’ intellectual property rights, and the risk of this type of lawsuit will likely increase as our size, geographic presence and market share expand and as the number of competitors in our market increases. Any such claims or litigation, whether meritorious or not, could:
|
|
• |
be time-consuming and expensive to defend; |
|
|
• |
divert the attention of our technical and managerial resources; |
|
|
• |
adversely affect our relationships with current or future customers; |
|
|
• |
require us to enter into royalty or licensing agreements with third parties, which may not be available on terms that we deem acceptable; |
|
|
• |
prevent us from operating all or a portion of our business or force us to redesign our manufacturing processes or products, which could be difficult, time-consuming and expensive; |
|
|
• |
limit the supply or increase the cost of key raw materials and components used in our products; |
|
|
• |
subject us to significant liability for damages or result in significant settlement payments; and |
|
|
• |
require us to indemnify our customers or suppliers. |
Any of the foregoing could disrupt our business and materially harm our operating results and financial condition. In addition, intellectual property disputes have in the past arisen between our customers which negatively affected such customers’ demand for wind blades manufactured by us. If such intellectual property disputes involving, or between, one or more of our customers should arise in the future, our business could be materially harmed.
We may form joint ventures, or acquire businesses or assets, in the future, and we may not realize the benefits of those transactions.
We have, in the past, entered into joint ventures with third parties for the manufacture of wind blades. For example, we entered into joint ventures with third parties in both our Mexico and Turkey locations. We may create new or additional joint ventures with third parties, or acquire businesses or assets, in the future that we believe will complement or augment our existing business. We cannot assure you that, following any such joint venture or acquisition, we will achieve the expected synergies to justify the transaction. We may encounter numerous difficulties in manufacturing any new products resulting from a joint venture or acquisition that delay or prevent us from realizing their expected benefits or enhancing our business. If we enter into joint ventures or acquire businesses or assets with respect to promising markets, we may not be able to realize the benefit of those joint ventures or acquired businesses assets if we are unable to successfully integrate them with our existing operations and company culture.
Work disruptions resulting from our collective bargaining agreements could result in increased operating costs and materially harm our business, operating results and financial condition.
Certain of our employees in Turkey, which represented approximately 17% of our workforce as of December 31, 2016, are covered by collective bargaining arrangements, which we entered into in May 2016 and has a three-year term. We expect that this agreement will result in an average increase in pay of approximately 20% for
34
employees covered by the agreement. Additionally, our other employees working at other manufacturing facilities may vote to be represented by a labor union in the future. For example, our employees in Iowa attempted unsuccessfully to unionize in 2013. There can be no assurance that we will not experience labor disruptions such as work stoppages or other slowdowns by workers at any of our facilities. Should significant industrial action, threats of strikes or related disturbances occur, we could experience a disruption of operations and increased labor costs in Turkey or other locations, which could materially harm our business, operating results or financial condition. Any such work stoppage or slow-down at any of our facilities could also result in additional expenses and possible loss of revenue for us.
Our information technology infrastructure could experience serious failures or disruptions, the failure of which could materially harm our business, operating results and financial condition.
Information technology is part of our business strategy and operations. It enables us to streamline operation processes, facilitating the collection and reporting of business data, in addition to internal and external communications. There are risks that information technology system failures, network disruptions and breaches of data security could disrupt our operations. Any significant disruption or breach may materially harm our business, operating results or financial condition.
We will incur significant increased costs as a result of operating as a public company, and our management will be required to devote substantial time to compliance initiatives.
As a public company, we incur significant legal, accounting and other expenses that we did not incur as a private company. In addition, the Sarbanes-Oxley Act, as well as rules subsequently implemented by the SEC and NASDAQ, impose various requirements on public companies, including requiring establishment and maintenance of effective disclosure controls and internal control over financial reporting and changes in corporate governance practices. Our management and other personnel will need to devote a substantial amount of time to these compliance initiatives. Moreover, these rules and regulations will increase our legal and financial compliance costs and will make some activities more time-consuming and costly. For example, we expect these rules and regulations to make it more difficult and more expensive for us to obtain director and officer liability insurance. We estimate that we will incur approximately $2.5 million to $3.0 million in expenses annually in response to these requirements.
Section 404(a) of the Sarbanes-Oxley Act requires annual management assessments of the effectiveness of our internal control over financial reporting, starting with the second annual report that we file with the SEC. However, as long as we remain an “emerging growth company,” as defined in the Jumpstart Our Business Startups Act of 2012 (the JOBS Act), we intend to take advantage of certain exemptions from various reporting requirements that are applicable to other public companies that are not emerging growth companies including, but not limited to, not being required to comply with the auditor attestation requirements of Section 404(b) of the Sarbanes-Oxley Act. We will take advantage of these reporting exemptions until we are no longer an emerging growth company and will incur additional expense and time related to these efforts at that time. We will remain an emerging growth company until the earliest of (i) the last day of the fiscal year in which we have total annual gross revenues of $1.0 billion or more; (ii) the last day of our fiscal year following the fifth anniversary of the date of the completion of our IPO; (iii) the date on which we have issued more than $1.0 billion in nonconvertible debt during the previous three years; or (iv) the date on which we are deemed to be a “large accelerated filer” under SEC rules.
Our testing, or the subsequent testing by our independent registered public accounting firm, may reveal deficiencies in our internal control over financial reporting that are deemed to be material weaknesses. Our management and other personnel will need to devote a substantial amount of time to these compliance initiatives, diverting their attention away from the day-to-day management of our business, and we may not successfully or efficiently manage our transition into a public company. We will also need to upgrade our systems, implement additional financial and management controls, reporting systems and procedures, hire an internal audit group and additional accounting, auditing and financial staff with appropriate public company experience and technical accounting knowledge. We have significant operations in China, Mexico and Turkey and may have difficulty hiring and retaining employees in these countries who have the experience necessary to implement the kind of management and financial controls that are expected of a U.S. public company. In this regard, for example, China has only recently begun to adopt management and financial reporting concepts and practices like those in the United
35
States. If we are not able to comply with these requirements in a timely manner or if we or our independent registered public accounting firm identify deficiencies in our internal control over financial reporting that are deemed to be material weaknesses, the market price of our stock could decline, and we could be subject to sanctions or investigations by NASDAQ, the SEC or other regulatory authorities, which would require additional financial and management resources.
We are faced with increasingly complex tax issues in many jurisdictions, and we could be obligated to pay additional taxes in various jurisdictions.
We may be subject to taxation in many jurisdictions in the United States and around the world with increasingly complex tax laws, the application of which can be uncertain. The amount of taxes we pay in these jurisdictions could increase substantially as a result of changes in the applicable tax laws, including increased tax rates or revised interpretations of existing tax laws and precedents, which could harm our liquidity and operating results. In addition, the taxing authorities in these jurisdictions could review our tax returns, or authorities in jurisdictions in which we do not file tax returns could assert that we are subject to tax in those jurisdictions, and in either case could impose additional tax, interest and penalties. Further, the authorities could claim that various withholding requirements apply to us or our subsidiaries or assert that benefits of tax treaties are not available to us or our subsidiaries, any of which could have a material adverse impact on us and the results of our operations.
The current U.S. presidential administration has made public statements indicating that it has made tax reform a priority, and key members of the U.S. Congress have conducted hearings and proposed a wide variety of potential changes. Certain changes to U.S. tax laws, including border adjustable tax provisions as well as limitations on the ability to defer U.S. taxation on earnings outside of the United States until those earnings are repatriated to the United States, could affect the tax treatment of our foreign earnings, as well as cash and cash equivalent balances we currently maintain outside of the United States.
Risks Related to Ownership of Our Common Stock
An active, liquid trading market may not develop.
Before the IPO, there was no public market for shares of our common stock. An active and liquid trading market may not develop following our IPO, if developed, may not be sustained. The lack of an active and liquid market may impair your ability to sell your shares of common stock at the time you wish to sell them or at a price that you consider reasonable. The lack of an active and liquid market may also reduce the market value and increase the volatility of your shares of common stock. In addition, an inactive and illiquid market may impair our ability to raise capital by selling shares of common stock and may impair our ability to acquire other business or assets by using shares of our common stock as consideration.
The price of our common stock may fluctuate substantially and your investment may decline in value.
The market price of our common stock is likely to be highly volatile and may fluctuate substantially due to many factors, including:
|
|
• |
actual or anticipated fluctuations in our results of operations; |
|
|
• |
our ability to provide products due to shipments subject to delayed delivery and deferred revenue arrangements; |
|
|
• |
loss of or changes in our relationship with one or more of our customers; |
|
|
• |
failure to meet our earnings estimates; |
|
|
• |
conditions and trends in the energy and manufacturing markets in which we operate and changes in estimates of the size and growth rate of these markets; |
|
|
• |
announcements by us or our competitors of significant contracts, developments, acquisitions, strategic partnerships or divestitures; |
|
|
• |
availability of equipment, labor and other items required for the manufacture of wind blades; |
36
|
|
• |
additions or departures of members of our senior management or other key personnel; |
|
|
• |
changes in market valuation or earnings of our competitors; |
|
|
• |
sales of our common stock, including sales of our common stock by our directors and officers or by our other principal stockholders; |
|
|
• |
the trading volume of our common stock; and |
|
|
• |
general market and economic conditions. |
In addition, the stock market in general, including NASDAQ, as well as the market for broader energy and renewable energy companies in particular, have experienced extreme price and volume fluctuations that have often been unrelated or disproportionate to the operating performance of particular companies affected. These broad market and industry factors may materially harm the market price of our common stock, regardless of our operating performance. In the past, securities class-action litigation has often been instituted against a company following periods of volatility in the market price of that company’s securities. Securities class-action litigation, if instituted against us, could result in substantial costs or damages and a diversion of management’s attention and resources, which could materially harm our business and operating results.
A significant portion of our total outstanding shares may be sold into the public market in future sales, which could cause the market price of our common stock to drop significantly, even if our business is doing well.
Sales of a substantial number of shares of our common stock in the public market could occur at any time after the expiration of the lock-up agreements which expired on January 17, 2017. These sales, or the market perception that the holders of a large number of shares intend to sell shares, could reduce the market price of our common stock. As of December 31, 2016, we had 33,736,863 shares of common stock outstanding, inclusive of the underwriters’ exercise of their option to purchase additional shares. All shares can now be sold, subject to any applicable volume limitations under federal securities laws.
In addition, as of December 31, 2016, there were: (i) 160,424 shares subject to outstanding common stock warrants, or approximately 0.5% of our outstanding shares; (ii) 3,331,418 shares subject to outstanding options, or approximately 9.9% of our outstanding shares; (iii) 636,120 restricted stock units, or approximately 1.9% of our outstanding shares; and (iv) 3,587,692 shares reserved for future issuance, or approximately 10.6% of our outstanding shares under the Amended and Restated 2015 Stock Option and Incentive Plan (the 2015 Plan) that will become eligible for sale in the public market to the extent permitted by any applicable vesting requirements and Rules 144 and 701 under the Securities Act. Moreover, holders of an aggregate of 27,247,725 shares of our common stock, have rights, subject to some conditions, to require us to file registration statements covering their shares or to include their shares in registration statements that we may file for ourselves or other stockholders. We also intend to register all shares of common stock that we may issue under our employee equity incentive plans. Once we register these shares, they can be freely sold in the public market upon issuance and subject to the restrictions imposed on our affiliates under Rule 144.
In the future, we may also issue our securities in connection with investments or acquisitions. The amount of shares of our common stock issued in connection with an investment or acquisition could constitute a material portion of our then-outstanding shares of our common stock. Any issuance of additional securities in connection with investments or acquisitions may result in additional dilution to you and may cause the market price of our common stock to drop significantly.
The exercise of options and warrants and other issuances of shares of common stock or securities convertible into common stock under our equity compensation plans will dilute your interest.
Under our existing equity compensation plans, as of December 31, 2016, we had outstanding options to purchase 3,331,418 shares of our common stock and 636,120 restricted stock units to our employees and non-employee directors. From time to time, we expect to grant additional options and other stock awards in accordance with the 2015 Plan. The exercise of options and warrants at prices below the market price of our common stock
37
could adversely affect the price of shares of our common stock. Additionally, any issuance of our common stock that is not made solely to then-existing stockholders proportionate to their interests, such as in the case of a stock dividend or stock split, will result in dilution to each stockholder by reducing their percentage ownership of the total outstanding shares. If we issue options or warrants to purchase our common stock in the future and those options or warrants are exercised or we issue stock, stockholders may experience further dilution.
Our executive officers, directors and their affiliated entities will continue to have substantial control over us and could limit the ability of other stockholders to influence the outcome of key transactions, including changes of control.
Our executive officers, directors and their affiliated entities, in the aggregate, beneficially own approximately 82% of the outstanding common stock, based on 33,736,863 shares of common stock outstanding as of February 28, 2017. Our executive officers, directors and their affiliated entities, if acting together, will be able to control or significantly influence all matters requiring approval by our stockholders, including the election of directors and the approval of mergers or other significant corporate transactions. In addition, certain of our stockholders are affiliated with certain of our customers. These stockholders might have interests that differ from yours, and they might vote in a way with which you disagree and that could be adverse to your interests. The concentration of common stock ownership could have the effect of delaying, preventing, or deterring a change of control of our company, could deprive our stockholders of an opportunity to receive a premium for their common stock as part of a sale of our company, and could negatively affect the market price of the common stock.
If equity research analysts issue unfavorable commentary or downgrade our common stock, the price of our common stock could decline.
The trading market for our common stock relies in part on the research and reports that equity research analysts publish about us and our business. We do not control the work performed by these analysts. The demand for our common stock could decline if one or more equity analysts downgrade our stock or if those analysts issue unfavorable or inaccurate commentary. If such analysts cease publishing reports about us or our business, we could lose visibility in the market, which in turn could cause our share price and trading volume to decline.
We do not currently intend to pay dividends on the common stock, which may hinder your ability to achieve a return on your investment.
We have never declared or paid any cash dividends on our common stock. The continued operation and expansion of our business will require substantial funding and thus we currently intend to retain any future earnings and do not expect to pay any dividends in the foreseeable future. Accordingly, you are not likely to receive any dividends on common stock in the foreseeable future, and your ability to achieve a return on your investment will therefore depend on appreciation in the price of the common stock.
Provisions of Delaware law or our charter documents could delay or prevent an acquisition of our company, even if the acquisition would be beneficial to our stockholders, and could make it more difficult for you to change management.
Provisions of Delaware law and our amended and restated certificate of incorporation and amended and restated by-laws may discourage, delay or prevent a merger, acquisition or other change in control that stockholders may consider favorable, including transactions in which stockholders might otherwise receive a premium for their shares. These provisions may also prevent or delay attempts by stockholders to replace or remove our current management or members of our board of directors. These provisions include:
|
|
• |
a classified board of directors; |
|
|
• |
limitations on the removal of directors; |
|
|
• |
advance notice requirements for stockholder proposals and nominations; |
|
|
• |
the inability of stockholders to act by written consent or to call special meetings; |
38
|
|
• |
the ability of our board of directors to make, alter or repeal our amended and restated by-laws; and |
|
|
• |
the authority of our board of directors to issue preferred stock with such terms as our board of directors may determine. |
The affirmative vote of the holders of at least 75% of our shares of capital stock entitled to vote, and not less than 75% of the outstanding shares of each class entitled to vote thereon as a class, is necessary to amend or repeal the above provisions that are contained in our amended and restated certificate of incorporation. In addition, absent approval of our board of directors, our amended and restated by-laws may only be amended or repealed by the affirmative vote of the holders of at least 75% of our shares of capital stock entitled to vote.
In addition, we are subject to the provisions of Section 203 of the Delaware General Corporation Law, which limits business combination transactions with stockholders of 15% or more of our outstanding voting stock that our board of directors has not approved. These provisions and other similar provisions make it more difficult for stockholders or potential acquirers to acquire us without negotiation. These provisions may apply even if some stockholders may consider the transaction beneficial to them.
As a result, these provisions could limit the price that investors are willing to pay in the future for shares of our common stock. These provisions might also discourage a potential acquisition proposal or tender offer, even if the acquisition proposal or tender offer is at a premium over the then current market price for our common stock.
We are an “emerging growth company” and will be able to avail ourselves of reduced disclosure requirements applicable to emerging growth companies, which could make our common stock less attractive to investors.
We are an “emerging growth company,” as defined in the JOBS Act, and we intend to take advantage of certain exemptions from various reporting requirements that are applicable to other public companies that are not emerging growth companies including not being required to comply with the auditor attestation requirements of Section 404(b) of the Sarbanes-Oxley Act, reduced disclosure obligations regarding executive compensation in our periodic reports and proxy statements, and exemptions from the requirements of holding a nonbinding advisory vote on executive compensation and shareholder approval of any golden parachute payments not previously approved. We cannot predict whether investors will find our common stock less attractive because we may rely on these exemptions. If they do, there may be a less active trading market for our common stock and our stock price may be more volatile. We may take advantage of these reporting exemptions until we are no longer an emerging growth company. We will remain an emerging growth company until the earliest of (i) the last day of the fiscal year in which we have total annual gross revenues of $1.0 billion or more; (ii) the last day of our fiscal year following the fifth anniversary of the date of the completion of our IPO; (iii) the date on which we have issued more than $1.0 billion in nonconvertible debt during the previous three years; or (iv) the date on which we are deemed to be a “large accelerated filer” under the rules of the SEC.
Under the JOBS Act, emerging growth companies can also delay adopting new or revised accounting standards until such time as those standards apply to private companies. We have irrevocably elected not to avail ourselves of this exemption from new or revised accounting standards and, therefore, we are subject to the same new or revised accounting standards as other public companies that are not emerging growth companies.
Item 1B. Unresolved Staff Comments.
None.
39
Our headquarters is located in Scottsdale, Arizona, and we own or lease various other facilities in the United States, China, Mexico and Turkey. We believe that our properties are generally in good condition, are well maintained and are generally suitable and adequate to carry out our business at expected capacity for the foreseeable future. The table below lists the locations and square footage for our facilities as of February 28, 2017:
|
|
|
Year |
|
Leased or |
|
Approximate |
|
|
|
|
|
Location |
|
Commenced |
|
Owned |
|
Square Footage |
|
|
Description of Use |
|
|
Newton, IA, United States |
|
2008 |
|
Leased |
|
|
337,922 |
|
|
Wind Blade Manufacturing Facility |
|
Dafeng, China |
|
2013 |
|
Leased |
|
|
392,000 |
|
|
Wind Blade Manufacturing Facility |
|
Dafeng, China |
|
2015 |
|
Leased |
|
|
446,034 |
|
|
Wind Blade Manufacturing Facility |
|
Taicang Port, China |
|
2007 |
|
Owned |
|
|
226,542 |
|
|
Wind Blade Manufacturing Facility |
|
Juárez, Mexico |
|
2013 |
|
Leased |
|
|
345,984 |
|
|
Wind Blade Manufacturing Facility |
|
Juárez, Mexico |
|
2016 |
|
Leased |
|
|
358,796 |
|
|
Wind Blade Manufacturing Facility |
|
Juárez, Mexico |
|
2017 |
|
Leased |
|
|
339,386 |
|
|
Wind Blade Manufacturing Facility |
|
Izmir, Turkey |
|
2012 |
|
Leased |
|
|
343,000 |
|
|
Wind Blade Manufacturing Facility |
|
Izmir, Turkey |
|
2015 |
|
Leased |
|
|
397,931 |
|
|
Wind Blade Manufacturing Facility |
|
Fall River, MA, United States |
|
2008 |
|
Leased |
|
|
70,000 |
|
|
Composite Solution Manufacturing and Research and Development Facility |
|
Warren, RI, United States |
|
2004 |
|
Leased |
|
|
91,387 |
|
|
Precision Molding Development and Manufacturing and Research and Development Facility |
|
Santa Teresa, NM, United States |
|
2014 |
|
Leased |
|
|
503,710 |
|
|
Wind Blade Storage Facility |
|
Scottsdale, AZ, United States |
|
2015 |
|
Leased |
|
|
20,964 |
|
|
Corporate Headquarters |
|
Taicang Port, China |
|
2014 |
|
Leased |
|
|
80,730 |
|
|
Component Manufacturing Facility |
|
Taicang City, China |
|
2013 |
|
Leased |
|
|
69,750 |
|
|
Precision Molding Manufacturing Facility |
From time to time, we may be involved in disputes or litigation relating to claims arising out of our operations.
In March 2015, a complaint was filed against the Company in the Superior Court of the State of Arizona (Maricopa County) by a former employee of the Company, alleging that the Company had agreed to make certain cash payments to such employee upon any future sale of the Company. We filed a motion to dismiss the complaint in April 2015, which was denied. We subsequently filed an answer to the complaint in July 2015 denying the substantive allegations of the complaint. The parties completed court-ordered mediation in December 2015 but were not able to reach a settlement. We filed a motion for summary judgment to dismiss the complaint in April 2016 and the court denied our motion in August 2016. The court set a trial date for September 2017. We continue to deny the substantive allegations of the complaint and we intend to vigorously defend this lawsuit; however, we are currently unable to determine the ultimate outcome of this case.
In August 2015, we entered into a transition agreement with our former Senior Vice President – Asia, pursuant to which he transitioned out of this role at the end of 2015 and was to serve in a consulting capacity in 2016 and 2017. In January 2016, following our discovery that he had materially violated the terms of his transition agreement, we terminated his consultancy for cause. In April 2016, he filed an arbitration claim in China with the Taicang Labor and Personnel Dispute Arbitration Committee alleging that we improperly terminated his transition agreement. He is demanding that we continue to honor the terms of the transition agreement and pay him compensation and fees owed to him under the transition agreement, which in the aggregate total approximately $2.6 million. In addition, he is also challenging the validity of our termination of his option to purchase 164,880 shares of our common stock and 77,760 restricted stock units under the 2015 Plan, which were canceled in January 2016 when we terminated his consultancy. We believe that our termination of his transition agreement was valid and we intend to vigorously defend this matter.
40
Item 4. Mine Safety Disclosures
Not applicable.
41
Item 5. Market for Registrant’s Common Equity, Related Stockholder Matters and Issuer Purchases of Equity Securities
Market Information
On July 22, 2016, our common stock began trading on the NASDAQ Global Market under the symbol “TPIC.” Prior to that time, there was no public market for our stock. The following table sets forth the high and low intra-day per share sale prices for our common stock for the periods indicated, as reported by NASDAQ.
|
|
|
2016 |
|
|||||
|
|
|
High |
|
|
Low |
|
||
|
Third Quarter (July 22, 2016 - September 30, 2016) |
|
$ |
22.72 |
|
|
$ |
11.31 |
|
|
Fourth Quarter |
|
$ |
23.30 |
|
|
$ |
13.27 |
|
Stock Performance Graph
The following graph and table illustrate the total shareholder return from July 22, 2016 through December 30, 2016, on our common stock, the Russell 2000 Index, the S&P Small Cap 600 Energy (Sector) Index and the NASDAQ Clean Edge Green Energy Index, assuming an investment of $100.00 on July 22, 2016 including the reinvestment of dividends
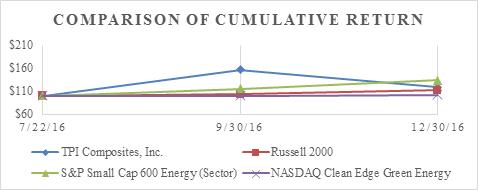
|
|
|
Base Period |
|
|
|
|
|
|
|
|
|
|
|
|
|
7/22/16 |
|
|
9/30/16 |
|
|
12/30/16 |
|
|||
|
TPI Composites, Inc. |
|
$ |
100.00 |
|
|
$ |
156.78 |
|
|
$ |
118.29 |
|
|
Russell 2000 |
|
$ |
100.00 |
|
|
$ |
103.20 |
|
|
$ |
111.89 |
|
|
S&P Small Cap 600 Energy (Sector) |
|
$ |
100.00 |
|
|
$ |
115.32 |
|
|
$ |
133.11 |
|
|
NASDAQ Clean Edge Green Energy |
|
$ |
100.00 |
|
|
$ |
100.33 |
|
|
$ |
102.59 |
|
Holders
As of February 28, 2017, there were 13 shareholders of record of our common stock, although there is a much larger number of beneficial owners.
Dividends
We have never declared or paid any cash dividends on shares of our capital stock. We currently intend to retain earnings, if any, to finance the development and growth of our business and do not anticipate paying cash dividends on the common stock in the future. Any payment of any future dividends will be at the discretion of the board of directors, subject to compliance with certain covenants in our loan agreements, after taking into account various factors, including our financial condition, operating results, capital requirements, restrictions contained in any future financing instruments, growth plans and other factors the board deems relevant. See “Management’s
42
Discussion and Analysis of Financial Condition and Results of Operations – Liquidity and Capital Resources” included in Part II, Item 7.
Certain subsidiaries of the Company are limited in their ability to declare dividends without first meeting statutory restrictions of the People’s Republic of China, including retained earnings as determined under Chinese-statutory accounting requirements. Until 50% ($5.2 million) of registered capital is contributed to a surplus reserve, our Chinese operations can only pay dividends equal to 90% of after-tax profits (10% must be contributed to the surplus reserve). Once the surplus reserve fund requirement is met, we can pay dividends equal to 100% of after-tax profit assuming other conditions are met. At December 31, 2016, the amount of the surplus reserve fund was $4.4 million. See “Management’s Discussion and Analysis of Financial Condition and Results of Operations— Liquidity and Capital Resources” included in Part II, Item 7.
Securities Authorized for Issuance under Equity Compensation Plans
The information required in response to Item 201(d) of Regulation S-K is set forth in Part III, Item 12 of this Annual Report on Form 10-K which is incorporated herein by reference.
Recent Sales of Unregistered Securities
None
Use of Proceeds from Registered Securities
On July 21, 2016, our Registration Statement on Form S-1 (File No. 333-212093) was declared effective by the SEC for our IPO whereby we registered an aggregate of 7,187,500 shares of our common stock, including 937,500 shares of our common stock registered for sale by us upon the full exercise of the underwriters’ option to purchase additional shares. On July 27, 2016, we completed our IPO and sold 7,187,500 shares of our common stock at a price to the public of $11.00 per share. J.P. Morgan Securities LLC and Morgan Stanley & Co. LLC acted as the managing underwriters. The total gross proceeds from the offering to us were $79.1 million. After deducting underwriting discounts and commissions of $4.6 million and offering expenses of $7.3 million, we received $67.2 million in net proceeds. There has been no material change in the planned use of proceeds from our IPO as described in our final prospectus filed with the SEC on July 22, 2016 pursuant to Rule 424(b) of the Securities Act. We invested the remaining funds received in registered money market funds.
Issuer Purchases of Equity Securities
None
43
Item 6. Selected Financial Data
The following selected consolidated statements of operations data for the years ended December 31, 2016, 2015, 2014 and 2013 and the consolidated balance sheet data as of December 31, 2016, 2015 and 2014 have been derived from our audited consolidated financial statements included in Part II, Item 8 of this Annual Report on Form 10-K. Our historical results are not necessarily indicative of the results that may be expected in the future. The selected consolidated financial and other data in this section are not intended to replace the consolidated financial statements and are qualified in their entirety by the consolidated financial statements and related notes to consolidated financial Statements included in Part II, Item 8 of this Annual Report on Form 10-K and should be read in conjunction with “Management’s Discussion and Analysis of Financial Condition and Results of Operations” included in Part II, Item 7 and the consolidated financial statements and related notes included in Part II, Item 8 of this Annual Report on Form 10-K and other financial information included elsewhere in this Annual Report on Form 10-K.
|
|
|
Year Ended December 31, |
|
|||||||||||||
|
|
|
2016 |
|
|
2015 |
|
|
2014 |
|
|
2013 |
|
||||
|
|
|
(in thousands, except per share data) |
|
|||||||||||||
|
Consolidated Statements of Operations Data: |
|
|
|
|
|
|
|
|
|
|
|
|
|
|
|
|
|
Net sales |
|
$ |
754,877 |
|
|
$ |
585,852 |
|
|
$ |
320,747 |
|
|
$ |
215,054 |
|
|
Cost of sales |
|
|
659,745 |
|
|
|
528,247 |
|
|
|
289,528 |
|
|
|
200,182 |
|
|
Startup and transition costs |
|
|
18,127 |
|
|
|
15,860 |
|
|
|
16,567 |
|
|
|
6,607 |
|
|
Total cost of goods sold |
|
|
677,872 |
|
|
|
544,107 |
|
|
|
306,095 |
|
|
|
206,789 |
|
|
Gross profit |
|
|
77,005 |
|
|
|
41,745 |
|
|
|
14,652 |
|
|
|
8,265 |
|
|
General and administrative expenses |
|
|
33,892 |
|
|
|
14,126 |
|
|
|
9,175 |
|
|
|
7,566 |
|
|
Income from operations |
|
|
43,113 |
|
|
|
27,619 |
|
|
|
5,477 |
|
|
|
699 |
|
|
Other income (expense): |
|
|
|
|
|
|
|
|
|
|
|
|
|
|
|
|
|
Interest income |
|
|
344 |
|
|
|
161 |
|
|
|
186 |
|
|
|
155 |
|
|
Interest expense |
|
|
(17,614 |
) |
|
|
(14,565 |
) |
|
|
(7,236 |
) |
|
|
(3,474 |
) |
|
Loss on extinguishment of debt |
|
|
(4,487 |
) |
|
|
— |
|
|
|
(2,946 |
) |
|
|
— |
|
|
Realized loss on foreign currency remeasurement |
|
|
(757 |
) |
|
|
(1,802 |
) |
|
|
(1,743 |
) |
|
|
(1,892 |
) |
|
Miscellaneous income |
|
|
238 |
|
|
|
246 |
|
|
|
539 |
|
|
|
140 |
|
|
Total other expense |
|
|
(22,276 |
) |
|
|
(15,960 |
) |
|
|
(11,200 |
) |
|
|
(5,071 |
) |
|
Income (loss) before income taxes |
|
|
20,837 |
|
|
|
11,659 |
|
|
|
(5,723 |
) |
|
|
(4,372 |
) |
|
Income tax benefit (provision) |
|
|
(6,995 |
) |
|
|
(3,977 |
) |
|
|
(925 |
) |
|
|
3,346 |
|
|
Net income (loss) before noncontrolling interest |
|
|
13,842 |
|
|
|
7,682 |
|
|
|
(6,648 |
) |
|
|
(1,026 |
) |
|
Net loss attributable to noncontrolling interest(1) |
|
|
— |
|
|
|
— |
|
|
|
— |
|
|
|
2,305 |
|
|
Net income (loss) |
|
|
13,842 |
|
|
|
7,682 |
|
|
|
(6,648 |
) |
|
|
1,279 |
|
|
Net income attributable to preferred shareholders(2) |
|
|
5,471 |
|
|
|
9,423 |
|
|
|
13,930 |
|
|
|
14,149 |
|
|
Net income (loss) attributable to common shareholders |
|
$ |
8,371 |
|
|
$ |
(1,741 |
) |
|
$ |
(20,578 |
) |
|
$ |
(12,870 |
) |
|
Weighted-average common shares outstanding: |
|
|
|
|
|
|
|
|
|
|
|
|
|
|
|
|
|
Basic(3) |
|
|
17,530 |
|
|
|
4,238 |
|
|
|
4,238 |
|
|
|
4,238 |
|
|
Diluted(3) |
|
|
17,616 |
|
|
|
4,238 |
|
|
|
4,238 |
|
|
|
4,238 |
|
|
Net income (loss) per common share: |
|
|
|
|
|
|
|
|
|
|
|
|
|
|
|
|
|
Basic |
|
$ |
0.48 |
|
|
$ |
(0.41 |
) |
|
$ |
(4.86 |
) |
|
$ |
(3.04 |
) |
|
Diluted |
|
$ |
0.48 |
|
|
$ |
(0.41 |
) |
|
$ |
(4.86 |
) |
|
$ |
(3.04 |
) |
44
|
|
|
Year Ended December 31, |
|
|||||||||||||
|
|
|
2016 |
|
|
2015 |
|
|
2014 |
|
|
2013 |
|
||||
|
|
|
(in thousands, except other operating information) |
|
|||||||||||||
|
Other Financial Information: |
|
|
|
|
|
|
|
|
|
|
|
|
|
|
|
|
|
Total billings(4) |
|
$ |
764,424 |
|
|
$ |
600,107 |
|
|
$ |
362,749 |
|
|
$ |
221,057 |
|
|
EBITDA(4) |
|
$ |
55,491 |
|
|
$ |
37,479 |
|
|
$ |
8,768 |
|
|
$ |
6,502 |
|
|
Adjusted EBITDA(4) |
|
$ |
66,150 |
|
|
$ |
39,281 |
|
|
$ |
13,457 |
|
|
$ |
8,430 |
|
|
Capital expenditures |
|
$ |
30,507 |
|
|
$ |
26,361 |
|
|
$ |
18,924 |
|
|
$ |
7,065 |
|
|
Total debt, net of debt issuance costs and discount |
|
$ |
123,155 |
|
|
$ |
129,346 |
|
|
$ |
120,849 |
|
|
$ |
36,562 |
|
|
Net debt(4) |
|
$ |
6,379 |
|
|
$ |
90,667 |
|
|
$ |
87,547 |
|
|
$ |
26,590 |
|
|
Other Operating Information: |
|
|
|
|
|
|
|
|
|
|
|
|
|
|
|
|
|
Sets(5) |
|
|
2,154 |
|
|
|
1,609 |
|
|
|
966 |
|
|
|
648 |
|
|
Estimated megawatts(6) |
|
|
4,920 |
|
|
|
3,595 |
|
|
|
2,029 |
|
|
|
1,173 |
|
|
Dedicated manufacturing lines(7) |
|
|
43 |
|
|
|
34 |
|
|
|
29 |
|
|
|
16 |
|
|
Total manufacturing lines installed(8) |
|
|
33 |
|
|
|
30 |
|
|
|
22 |
|
|
|
14 |
|
|
Manufacturing lines in startup(9) |
|
|
3 |
|
|
|
10 |
|
|
|
9 |
|
|
|
2 |
|
|
Manufacturing lines in transition(10) |
|
|
— |
|
|
|
11 |
|
|
|
8 |
|
|
|
2 |
|
|
(1) |
In 2012, we commenced operations in Turkey as a 75% owner of those operations and in 2013, we became the sole owner with the acquisition of the remaining 25% interest. |
|
(2) |
Represents the accrual of dividends on our convertible and senior redeemable preferred shares, the accretion to redemption amounts on our convertible preferred shares and warrant fair value adjustments. Immediately prior to the closing of the IPO, all preferred shares were converted into shares of our common stock and as a result, the accrual of dividends ceased. |
|
(3) |
For the year ended December 31, 2016, the weighted-average diluted shares outstanding include the conversion on a net issuance basis of our common warrants and the stock options issued under the 2008 Stock Option and Grant Plan. For the years ended December 31, 2015 and 2014, the weighted-average common shares outstanding are the same under the basic and diluted per share calculations since we had a net loss in each period presented. |
|
(4) |
See “Management’s Discussion and Analysis of Financial Condition and Results of Operations—Key Metrics Used By Management to Measure Performance” included in Part II, Item 7 of this Annual Report on Form 10-K for more information and the reconciliations of total billings, EBITDA, adjusted EBITDA and net debt to net sales, net income (loss), net income (loss) and total debt, net of debt issuance costs and discount, respectively, the most directly comparable financial measures calculated and presented in accordance with GAAP. |
|
(5) |
Number of wind blade sets (which consist of three wind blades) invoiced worldwide in the period. See “Management’s Discussion and Analysis of Financial Condition and Results of Operations—Key Metrics Used By Management to Measure Performance” included in Part II, Item 7 of this Annual Report on Form 10-K for more information. |
|
(6) |
Estimated megawatts of energy capacity to be generated by wind blade sets invoiced in the period. See “Management’s Discussion and Analysis of Financial Condition and Results of Operations—Key Metrics Used By Management to Measure Performance” included in Part II, Item 7 of this Annual Report on Form 10-K for more information. |
|
(7) |
Number of manufacturing lines that are dedicated to our customers under long-term supply agreements. See “Management’s Discussion and Analysis of Financial Condition and Results of Operations—Key Metrics Used By Management to Measure Performance” included in Part II, Item 7 of this Annual Report on Form 10-K for more information. Dedicated manufacturing lines may be greater than total manufacturing line capacity in instances where we have signed new supply agreements for manufacturing facilities that are under construction or have not yet been built. |
45
|
(9) |
Number of manufacturing lines in a startup phase during the pre-production and production ramp-up periods. See “Management’s Discussion and Analysis of Financial Condition and Results of Operations—Key Metrics Used By Management to Measure Performance” included in Part II, Item 7 of this Annual Report on Form 10-K for more information. |
|
(10) |
Number of manufacturing lines that were being transitioned to a new wind blade model during the period. See “Management’s Discussion and Analysis of Financial Condition and Results of Operations—Key Metrics Used By Management to Measure Performance” included in Part II, Item 7 of this Annual Report on Form 10-K for more information. |
|
|
|
December 31, |
|
|||||||||
|
|
|
2016 |
|
|
2015 |
|
|
2014 |
|
|||
|
|
|
(in thousands) |
|
|||||||||
|
Consolidated Balance Sheet Data: |
|
|
|
|
|
|
|
|
|
|
|
|
|
Cash and cash equivalents |
|
$ |
119,066 |
|
|
$ |
45,917 |
|
|
$ |
43,592 |
|
|
Total assets |
|
|
437,206 |
|
|
|
329,920 |
|
|
|
273,704 |
|
|
Total debt |
|
|
123,155 |
|
|
|
129,346 |
|
|
|
120,849 |
|
|
Total liabilities |
|
|
330,699 |
|
|
|
322,287 |
|
|
|
271,448 |
|
|
Total convertible and senior redeemable preferred shares and warrants |
|
|
— |
|
|
|
198,830 |
|
|
|
189,349 |
|
|
Total shareholders’ equity (deficit) |
|
|
106,507 |
|
|
|
(191,197 |
) |
|
|
(187,093 |
) |
46
Item 7. Management’s Discussion and Analysis of Financial Condition and Results of Operations
You should read the following discussion and analysis of our financial condition and results of operations together with our consolidated financial statements and the related notes included in Part II, Item 8 of this Annual Report on Form 10-K and other financial information appearing elsewhere in this Annual Report on Form 10-K. Some of the information contained in this discussion and analysis or set forth elsewhere in this Annual Report on Form 10-K, including information with respect to plans and strategy for our business and related financing, includes forward-looking statements that involve risks and uncertainties. Our actual results could differ materially from those described in or implied by these forward-looking statements as a result of various factors, including those discussed below and elsewhere in this Annual Report on Form 10-K, particularly those under “Risk Factors” included in Part I, Item 1A of this Annual Report on Form 10-K. Dollars in tabular format are presented in thousands, except as otherwise indicated.
OVERVIEW
Our Company
We are the largest U.S.-based independent manufacturer of composite wind blades. We enable many of the industry’s leading wind turbine OEMs, who have historically relied on in-house production, to outsource the manufacturing of some of their wind blades through our global footprint of advanced manufacturing facilities strategically located to serve large and growing wind markets in a cost-effective manner. Given the importance of wind energy capture, turbine reliability and cost to power producers, the size, quality and performance of wind blades have become highly strategic to our OEM customers. As a result, we have become a key supplier to our OEM customers in the manufacture of wind blades and related precision molding and assembly systems. We have entered into long-term supply agreements pursuant to which we dedicate capacity at our facilities to our customers in exchange for their commitment to purchase minimum annual volumes of wind blade sets, which consist of three wind blades. As of February 28, 2017, our long-term supply agreements provide for minimum aggregate volume commitments from our customers of $2.6 billion and encourage our customers to purchase additional volume up to, in the aggregate, a total contract value of up to $3.9 billion through the end of 2023. This collaborative dedicated supplier model provides us with contracted volumes that generate significant revenue visibility, drive capital efficiency and allow us to produce wind blades at a lower total delivered cost, while ensuring critical dedicated capacity for our customers. Our wind blade and precision molding and assembly systems manufacturing businesses accounted for over 99% of our total net sales for each of the years ended December 31, 2016, 2015 and 2014. In recent years, we have experienced significant growth in our OEM customer base, as according to data from MAKE, our OEM customers collectively accounted for approximately 32% of the global onshore wind energy market and approximately 56% of that market excluding China over the three years ended December 31, 2015, based on MWs of energy capacity installed. Additionally, our customers represented 82% of the U.S. onshore wind turbine market over the three years ended December 31, 2015, based on MWs of energy capacity installed. We believe this figure demonstrates the leading position of our existing OEM customers, as well as our opportunity to develop relationships with new OEM customers as additional OEMs seek to capitalize on the benefits of outsourced wind blade manufacturing while maintaining high quality customization and dedicated capacity. We believe that these trends will help us to strengthen our current customer base, grow our business worldwide, increase our revenue and improve our business prospects.
We divide our business operations into four geographic operating segments—the United States, Asia, Mexico and EMEA, as follows:
|
|
• |
Our U.S. segment includes (1) the manufacturing of wind blades at our Newton, Iowa plant, (2) the manufacturing of precision molding and assembly systems used for the manufacture of wind blades at our Warren, Rhode Island facility, (3) the manufacturing of composite solutions for the transportation industry, which we also conduct at our Rhode Island and Massachusetts facilities and (4) our corporate headquarters, the costs of which are included in general and administrative expenses. |
|
|
• |
Our Asia segment includes (1) the manufacturing of wind blades at our facility in Taicang Port, China and at our two facilities in Dafeng, China, (2) the manufacturing of precision molding and assembly systems at our Taicang City, China facility, (3) the manufacture of components at our second Taicang Port, China facility and (4) wind blade inspection and repair services. |
47
|
|
• |
Our EMEA segment manufactures wind blades from our two facilities in Izmir, Turkey. We entered into a joint venture in 2012 to produce wind blades at our first Turkey plant and in 2013 became the sole owner of the Turkey operation with the acquisition of the remaining 25% interest. Our EMEA segment commenced operations at our second facility during the third quarter of 2016. |
Key Trends Affecting our Business
We have identified the following material trends affecting our business:
|
|
• |
The wind power generation industry has grown rapidly and expanded worldwide over the last five years to meet high global demand for electricity and the expanded use of renewable energy. Our sales of wind blades to our wind turbine customers have grown rapidly over the last several years in response to these trends. In that time, we have entered into long-term supply agreements with customers in the United States, China, Mexico and Turkey with terms extending to 2020, 2019, 2020 and 2023, respectively. |
|
|
• |
During the last several years, wind turbine OEMs have increasingly outsourced the production of wind blades and other key components to specialized manufacturers to meet this increasing global demand for wind energy in a cost-effective manner in new and growing markets. That shift, together with the overall expansion of the wind power generation industry, has increased our addressable market. As a result, we have hired more than 4,500 additional new employees since the beginning of 2014 and have expanded our customer base from one OEM customer to four OEM customers over the last two years in response to the growth and expansion of the wind energy generation industry generally as well as the specific trend of wind turbine OEMs increasing the outsourcing of the manufacturing of wind blades. |
|
|
• |
We expect that a substantial portion of our future revenue growth will be derived from our international operations. We have expanded our manufacturing facilities internationally over the last several years, including opening facilities in China, Mexico and Turkey, to meet the needs of our customers. We recently entered into lease agreements with third parties to lease new manufacturing facilities in Mexico and Turkey, and commenced operations at these new facilities in the third quarter of 2016. We have also entered into a new lease with a third party for a third manufacturing facility in Juárez, Mexico, and we commenced operations at this facility in January 2017. The portion of our net sales that were derived from our international operations increased to 75% for the year ended December 31, 2016 from 74% for the year ended December 31, 2015, 55% for the year ended December 31, 2014 and 25% for the year ended December 31, 2013. We believe we will continue to derive a substantial portion of our future net sales growth from our international operations. |
|
|
• |
Our long-term supply agreements with our customers generally encourage our customers to maximize the volume of wind blades they purchase from us, since purchasing less than a specified amount triggers higher pricing, as well as provide downside protection for us through minimum annual volume commitments. Some of our long-term supply agreements also provide for annual sales price reductions reflecting assumptions regarding increases in our manufacturing productivity. We work to continue to drive down the cost of materials and production through innovation and global sourcing, a portion of the benefit of which we share with our customers contractually, further strengthening our deep customer relationships. Wind blade pricing is based on annual commitments of volume as established in the customer’s contract, with orders less than committed volume resulting in additional costs per wind blade to customers. Orders in excess of annual commitments may but generally do not result in discounts to customers from the contracted price for the committed volume. Customers may utilize early payment discounts, which are reported as a reduction of revenue at the time the discount is taken. |
48
|
|
• |
We expect our new manufacturing facilities to generate operating losses in their first 12 to 24 months of operations due to startup costs and expenses as they initially operate far below capacity during the pre-production and production ramp up periods. As a result, this generally has a negative impact on our results of operations during these ramp-up periods. These losses include initial operating losses and pre-production expenses such as the selection of the plant site, infrastructure investment, build-out cost, customer qualification and associated legal, regulatory and personnel costs. In addition, construction of new facilities and expansion of existing facilities, including the fabrication of precision molding and assembly systems to outfit those facilities, is complex and involves inherent risks. For planning purposes, we generally estimate that the startup of a new six-line manufacturing facility requires cash for net operating expenses and working capital of between $15 million to $25 million. We also estimate that additional capital expenditures primarily related to machinery and equipment for new facilities or facility expansions of between $15 million and $25 million will be required. |
|
|
• |
We recently commenced operations at new manufacturing facilities in Turkey and Mexico and for the reasons described in the preceding bullet, we believe that over the first 12 to 24 months of operations these facilities are likely to generate operating losses during pre-production and production ramp-up periods, which are likely to have a negative overall effect on our consolidated net income (loss) and adjusted EBITDA. However, over the longer term, and once these new manufacturing facilities and new manufacturing lines are operating at capacity, we expect this expansion in lines, facilities and purchase commitments to have a positive overall effect on our consolidated net income (loss) and adjusted EBITDA in future periods. |
|
|
• |
Changing customer demands, including shifts to bigger wind turbines with larger wind blades, have driven some of our customers to require us to transition to new wind blade models one or two times during the term of a long-term supply agreement. Although we do receive transition payments to compensate us for the costs of the impact of reduced volumes during these transitions, these payments may not always fully cover the transition costs and lost margin. As a result, these transitions have and may continue to have a short-term, negative impact on our consolidated operating results and cash flows. However, our precision molding and assembly manufacturing business increases as we transition to larger wind blade models and larger wind blades generally have a higher average selling price, so that the transition to larger wind blades may increase our net sales over time. As we transition to new wind blade models, we also often extend our existing supply agreements. |
49
COMPONENTS OF RESULTS OF OPERATIONS
Net Sales
Net sales reflect sales of our products, including wind blades, precision molding and assembly systems and transportation products, as well as transition revenue received. Several factors affect net sales in any period, including customer demand, wind blade model transitions, general economic conditions and weather conditions. We currently derive an immaterial amount of net sales from our transportation business. Under GAAP, we do not recognize revenue on our wind blade sales until the wind blades have been delivered to our customers. Under our long-term supply agreements with our customers, we invoice our customers for wind blades once the blades pass certain acceptance procedures and title passes to our customers. Our customers generally pay us for the wind blades between 15 to 65 days after receipt of the invoice based on negotiated payment terms. However, in many cases, our customers request that we store their wind blades until they are ready to assemble wind turbines at a particular wind farm project. We have no control over when our customers decide to ship wind blades from our storage sites, and in some cases, our customers have stored large numbers of their wind blades at our sites for six months or more. Even if the customer has paid us for the wind blades and title has passed to the customer, we do not recognize revenue for these wind blades until the wind blades are delivered. Instead, these transactions are recorded as deferred revenue in our consolidated financial statements.
Cost of Goods Sold
Cost of goods sold includes the costs associated with products invoiced during the period as well as unallocated manufacturing overhead costs associated with startup and transition costs. Cost of sales includes all costs incurred at our production facilities to make products saleable, such as raw materials, direct labor and indirect labor and facilities costs, including purchasing and receiving costs, plant management, inspection costs, product engineering and internal transfer costs. In addition, all depreciation associated with assets used to produce composite products and make them saleable is included in cost of sales. Direct labor costs consist of salaries, benefits, share-based compensation and other personnel related costs for employees engaged in the manufacture of our products.
Startup costs represent the unallocated overhead related to both new manufacturing facilities as well as new lines in existing manufacturing facilities. Transition costs represent the unallocated overhead related to the transition of wind blade models at the request of our customers. The startup and transition costs are primarily fixed overhead costs incurred during the period production facilities are under-utilized while transitioning wind blade models and ramping up manufacturing, which are not allocated to products and are expensed as incurred. The cost of sales for the initial wind blades from a new model manufacturing line is generally higher than when the line is operating at optimal production volume levels due to inefficiencies during ramp-up related to labor hours per blade, cycle times per blade and raw material usage. Additionally, manufacturing overhead as a percentage of net sales is generally higher during the period in which a facility is ramping up to full production capacity due to underutilization of the facility. Manufacturing overhead at each of our facilities includes virtually all indirect costs (including share-based compensation costs) incurred at the plants, including engineering, finance, information technology, human resources and plant management.
General and Administrative Expenses
General and administrative expenses are primarily incurred at our corporate headquarters and our research facilities and include salaries, benefits and other personnel related costs for employees engaged in research and development, engineering, finance, information technology, human resources, business development, global operational excellence, global supply chain, in-house legal and executive management. Other costs include outside
50
legal and accounting fees, risk management (insurance), share-based compensation and certain other administrative and global resources costs.
For the years ended December 31, 2016, 2015 and 2014, our research and development expenses (included in general and administrative expenses) totaled $1.5 million, $0.9 million and $0.8 million, respectively.
Other Income (Expense)
Other income (expense) consists primarily of interest expense on our credit facilities and the amortization of deferred financing costs and beneficial conversion features related to debt borrowings. Other income (expense) also includes realized gains and losses on foreign currency remeasurement, interest income and miscellaneous income and expense. During the year ended December 31, 2016, we expensed $2.4 million of deferred financing costs and $2.1 million of prepayment penalties related to the refinancing of our previous credit facility. During the year ended December 31, 2014, we incurred a $2.9 million loss on the extinguishment of our senior term loan. This loss included prepayment penalties, an end of term fee and the write off of the remaining debt issuance costs under our previous senior term loan.
Income Tax Benefit (Provision)
Income tax benefit (provision) consists of federal, state, provincial, local and foreign taxes based on income in jurisdictions in which we operate, including in the United States, China, Mexico and Turkey. The composite income tax rate, tax provisions, deferred tax assets and liabilities vary according to the jurisdiction in which the income (loss) arises. Tax laws are complex and subject to different interpretations by management and the respective governmental taxing authorities and require us to exercise judgment in determining our income tax provision, our deferred tax assets and liabilities and the valuation allowance recorded against our net deferred tax assets.
Net Income Attributable to Preferred Shareholders
Net income attributable to preferred shareholders relates to the accrual of dividends on our convertible and senior redeemable preferred shares, the accretion to redemption amounts on our convertible preferred shares and warrant fair value adjustment. Immediately prior to the closing of our IPO, all preferred shares were converted into shares of our common stock and as a result, the accrual of dividends ceased.
KEY METRICS USED BY MANAGEMENT TO MEASURE PERFORMANCE
In addition to measures of financial performance presented in our consolidated financial statements in accordance with GAAP, we use certain other financial measures and operating metrics to analyze the performance of our company. These “non-GAAP” financial measures consist of total billings, EBITDA, adjusted EBITDA and net debt, which help us evaluate growth trends, establish budgets, assess operational efficiencies, oversee our overall liquidity, and evaluate our overall financial performance. The key operating metrics consist of wind blade sets invoiced, estimated MWs of energy capacity for wind blades invoiced, manufacturing lines dedicated to customers under long-term supply agreements, total manufacturing lines installed, manufacturing lines in startup and manufacturing lines in transition, which help us evaluate our operational performance. We believe that these measures are useful to investors in evaluating our performance.
51
|
|
|
Year Ended December 31, |
|
|||||||||
|
(in thousands) |
|
2016 |
|
|
2015 |
|
|
2014 |
|
|||
|
Net sales |
|
$ |
754,877 |
|
|
$ |
585,852 |
|
|
$ |
320,747 |
|
|
Total billings(1) |
|
$ |
764,424 |
|
|
$ |
600,107 |
|
|
$ |
362,749 |
|
|
Net income (loss) |
|
$ |
13,842 |
|
|
$ |
7,682 |
|
|
$ |
(6,648 |
) |
|
EBITDA(1) |
|
$ |
55,491 |
|
|
$ |
37,479 |
|
|
$ |
8,768 |
|
|
Adjusted EBITDA(1) |
|
$ |
66,150 |
|
|
$ |
39,281 |
|
|
$ |
13,457 |
|
|
Capital expenditures |
|
$ |
30,507 |
|
|
$ |
26,361 |
|
|
$ |
18,924 |
|
|
Total debt, net of debt issuance costs and discount |
|
$ |
123,155 |
|
|
$ |
129,346 |
|
|
$ |
120,849 |
|
|
Net debt(1) |
|
$ |
6,379 |
|
|
$ |
90,667 |
|
|
$ |
87,547 |
|
Key Operating Metrics
|
|
|
Year Ended December 31, |
|
|||||||||
|
|
|
2016 |
|
|
2015 |
|
|
2014 |
|
|||
|
Sets(2) |
|
|
2,154 |
|
|
|
1,609 |
|
|
|
966 |
|
|
Estimated megawatts(3) |
|
|
4,920 |
|
|
|
3,595 |
|
|
|
2,029 |
|
|
Dedicated manufacturing lines(4) |
|
|
44 |
|
|
|
34 |
|
|
|
29 |
|
|
Total manufacturing lines installed(5) |
|
|
33 |
|
|
|
30 |
|
|
|
22 |
|
|
Manufacturing lines in startup(6) |
|
|
3 |
|
|
|
10 |
|
|
|
9 |
|
|
Manufacturing lines in transition(7) |
|
|
- |
|
|
|
11 |
|
|
|
8 |
|
|
(1) |
See below for more information and a reconciliation of total billings, EBITDA, adjusted EBITDA and net debt to net sales, net income (loss), net income (loss) and total debt, net of debt issuance costs and discount, respectively, the most directly comparable financial measures calculated and presented in accordance with GAAP. |
|
(2) |
Number of wind blade sets (which consist of three wind blades) invoiced worldwide in the period. |
|
(3) |
Estimated megawatts of energy capacity to be generated by wind blade sets invoiced in the period. |
|
(4) |
Number of manufacturing lines that are dedicated to our customers under long-term supply agreements. Dedicated manufacturing lines may be greater than total manufacturing line capacity in instances where we have signed new supply agreements for manufacturing facilities that are under construction or have not yet been built. |
|
(5) |
Number of manufacturing lines installed and either in operation, startup or transition. |
|
(6) |
Number of manufacturing lines in a startup phase during the pre-production and production ramp-up periods. |
|
(7) |
Number of manufacturing lines that were being transitioned to a new wind blade model during the period. |
Net sales and total billings
We define total billings, a non-GAAP financial measure, as the total amounts we have invoiced our customers for products and services for which we are entitled to payment under the terms of our long-term supply agreements or other contractual agreements. We monitor total billings, and believe it is useful to present to investors as a supplement to our GAAP measures, because we believe it more directly correlates to sales activity and operations based on the timing of actual transactions with our customers, which facilitates comparison of our performance between periods and provides a more timely indication of trends in sales. Under GAAP, we do not recognize revenue on our wind blade sales until they have been delivered to our customers. Under our long-term supply agreements with our customers, we invoice our customers for wind blades once they pass certain acceptance procedures and title passes to our customers. Our customers generally pay us for the wind blades between 15 to 65 days after receipt of the invoice based on negotiated payment terms. However, in many cases, our customers request that we store their wind blades until they are ready to assemble wind turbines at a particular wind farm project. We have no control over when our customers will ship wind blades from our storage sites, and in some cases, our
52
customers have stored large numbers of their wind blades at our sites for six months or more. Even if the customer has paid us for the wind blades and title has passed to the customer, we do not recognize revenue for these wind blades until the wind blades are delivered. Instead, these transactions are recorded as deferred revenue in our consolidated financial statements. However, we are contractually entitled to payment for those wind blades and, accordingly, invoice them when the blades are placed in storage.
Our use of total billings has limitations as an analytical tool, and you should not consider it in isolation or as a substitute for analysis of our results as reported under GAAP. Some of these limitations are:
|
|
• |
Total billings includes wind blades that have not been delivered and for which we are responsible if damage occurs to them while we hold them; and |
|
|
• |
Other companies, including companies in our industry, may define total billings differently, which reduces its usefulness as a comparative measure. |
EBITDA and adjusted EBITDA
We define EBITDA, a non-GAAP financial measure, as net income or loss plus interest expense (including losses on the extinguishment of debt and net of interest income), income taxes and depreciation and amortization. We define adjusted EBITDA as EBITDA plus share-based compensation expense, plus or minus any realized gains or losses from foreign currency remeasurement. Adjusted EBITDA is the primary metric used by our management and our board of directors to establish budgets and operational goals for managing our business and evaluating our performance. In addition, our previous credit facility contained minimum EBITDA (as defined in the previous credit facility) covenants with which we were required to comply. We monitor adjusted EBITDA as a supplement to our GAAP measures and believe it is useful to present to investors because we believe that it facilitates evaluation of our period-to-period operating performance by eliminating items that are not operational in nature, allowing comparison of our recurring core business operating results over multiple periods unaffected by differences in capital structure, capital investment cycles and fixed asset base. In addition, we believe adjusted EBITDA and similar measures are widely used by investors, securities analysts, ratings agencies, and other parties in evaluating companies in our industry as a measure of financial performance and debt-service capabilities.
Our use of adjusted EBITDA has limitations as an analytical tool and you should not consider it in isolation or as a substitute for analysis of our results as reported under GAAP. Some of these limitations are:
|
|
• |
adjusted EBITDA does not reflect changes in, or cash requirements for, our working capital needs; |
|
|
• |
adjusted EBITDA does not reflect our cash expenditures for capital equipment or other contractual commitments; |
|
|
• |
adjusted EBITDA does not reflect the interest expense or the cash requirements necessary to service interest or principal payments on our indebtedness; |
|
|
• |
adjusted EBITDA does not reflect tax payments that may represent a reduction in cash available to us; |
|
|
• |
although depreciation and amortization are non-cash charges, the assets being depreciated and amortized may have to be replaced in the future, and adjusted EBITDA does not reflect capital expenditure requirements relating to the future need to augment or replace those assets; |
|
|
• |
adjusted EBITDA does not reflect the realized gains or losses from foreign currency remeasurement in our international operations; |
|
|
• |
adjusted EBITDA does not reflect share-based compensation expense on equity-based incentive awards to our officers, employees, directors and consultants; |
|
|
• |
adjusted EBITDA does not reflect losses on extinguishment of debt relating to prepayment penalties, termination fees and the write off of any remaining debt discount and debt issuance costs upon the repayment or refinancing of our debt; and |
|
|
• |
other companies, including companies in our industry, may calculate EBITDA and adjusted EBITDA differently, which reduces their usefulness as comparative measures. |
53
In evaluating EBITDA and adjusted EBITDA, you should be aware that in the future, we will incur expenses similar to the adjustments in this presentation. Our presentations of EBITDA and adjusted EBITDA should not be construed as suggesting that our future results will be unaffected by these expenses or any unusual or non-recurring items. When evaluating our performance, you should consider EBITDA and adjusted EBITDA alongside other financial performance measures, including our net income (loss) and other GAAP measures.
Net debt
We define net debt as the total principal amount of debt outstanding less unrestricted cash and cash equivalents. The total principal amount of debt outstanding is comprised of the long-term debt and current maturities of long-term debt as presented in our consolidated balance sheets adjusting for any debt issuance costs and discount. We believe that the presentation of net debt provides useful information to investors because our management reviews net debt as part of our oversight of overall liquidity, financial flexibility and leverage. Net debt is important when we consider opening new plants and expanding existing plants, as well as for capital expenditure requirements.
The following table reconciles our non-GAAP key financial measures to the most directly comparable GAAP measures:
|
|
|
Year Ended December 31, |
|
|||||||||
|
|
|
2016 |
|
|
2015 |
|
|
2014 |
|
|||
|
|
|
(in thousands) |
|
|||||||||
|
Net sales |
|
$ |
754,877 |
|
|
$ |
585,852 |
|
|
$ |
320,747 |
|
|
Change in deferred revenue: |
|
|
|
|
|
|
|
|
|
|
|
|
|
Blade-related deferred revenue at beginning of period(1) |
|
|
(65,520 |
) |
|
|
(59,476 |
) |
|
|
(20,646 |
) |
|
Blade-related deferred revenue at end of period(1) |
|
|
69,568 |
|
|
|
65,520 |
|
|
|
59,476 |
|
|
Foreign exchange impact(2) |
|
|
5,499 |
|
|
|
8,211 |
|
|
|
3,172 |
|
|
Change in deferred revenue |
|
|
9,547 |
|
|
|
14,255 |
|
|
|
42,002 |
|
|
Total billings |
|
$ |
764,424 |
|
|
$ |
600,107 |
|
|
$ |
362,749 |
|
|
Net income (loss) |
|
$ |
13,842 |
|
|
$ |
7,682 |
|
|
$ |
(6,648 |
) |
|
Adjustments: |
|
|
|
|
|
|
|
|
|
|
|
|
|
Depreciation and amortization |
|
|
12,897 |
|
|
|
11,416 |
|
|
|
7,441 |
|
|
Interest expense (net of interest income) |
|
|
17,270 |
|
|
|
14,404 |
|
|
|
7,050 |
|
|
Loss on extinguishment of debt |
|
|
4,487 |
|
|
|
— |
|
|
|
2,946 |
|
|
Income tax provision |
|
|
6,995 |
|
|
|
3,977 |
|
|
|
925 |
|
|
EBITDA |
|
|
55,491 |
|
|
|
37,479 |
|
|
|
11,714 |
|
|
Realized loss on foreign currency remeasurement |
|
|
757 |
|
|
|
1,802 |
|
|
|
1,743 |
|
|
Share-based compensation expense |
|
|
9,902 |
|
|
|
— |
|
|
|
— |
|
|
Adjusted EBITDA |
|
$ |
66,150 |
|
|
$ |
39,281 |
|
|
$ |
13,457 |
|
54
|
(1) |
Total billings is reconciled using the blade-related deferred revenue amounts at the beginning and the end of the period as follows: |
|
|
|
Year Ended December 31, |
|
|||||||||
|
|
|
2016 |
|
|
2015 |
|
|
2014 |
|
|||
|
|
|
(in thousands) |
|
|||||||||
|
Blade-related deferred revenue at beginning of period |
|
$ |
65,520 |
|
|
$ |
59,476 |
|
|
$ |
20,646 |
|
|
Non-blade related deferred revenue at beginning of period |
|
|
— |
|
|
|
— |
|
|
|
757 |
|
|
Total current and noncurrent deferred revenue at beginning of period |
|
$ |
65,520 |
|
|
$ |
59,476 |
|
|
$ |
21,403 |
|
|
Blade-related deferred revenue at end of period |
|
$ |
69,568 |
|
|
$ |
65,520 |
|
|
$ |
59,476 |
|
|
Non-blade related deferred revenue at end of period |
|
|
— |
|
|
|
— |
|
|
|
— |
|
|
Total current and noncurrent deferred revenue at end of period |
|
$ |
69,568 |
|
|
$ |
65,520 |
|
|
$ |
59,476 |
|
|
(2) |
Represents the effect of the difference the exchange rate used by our various foreign subsidiaries on the invoice date versus the exchange rate used at the period-end balance sheet date. |
Net debt is reconciled as follows:
|
|
|
December 31, |
|
|||||||||
|
|
|
2016 |
|
|
2015 |
|
|
2014 |
|
|||
|
|
|
(in thousands) |
|
|||||||||
|
Total debt, net of debt issuance costs and discount |
|
$ |
123,155 |
|
|
$ |
129,346 |
|
|
$ |
120,849 |
|
|
Add debt issuance costs |
|
|
2,290 |
|
|
|
4,220 |
|
|
|
4,256 |
|
|
Add discount on debt |
|
|
— |
|
|
|
3,018 |
|
|
|
6,034 |
|
|
Less cash and cash equivalents |
|
|
(119,066 |
) |
|
|
(45,917 |
) |
|
|
(43,592 |
) |
|
Net debt |
|
$ |
6,379 |
|
|
$ |
90,667 |
|
|
$ |
87,547 |
|
Key Operating Metrics
Key operating metrics consist of sets invoiced, estimated megawatts of energy capacity for wind blade sets invoiced, dedicated manufacturing lines, total manufacturing lines installed, manufacturing lines in startup and manufacturing lines in transition. Sets represents the number of wind blade sets, consisting of three wind blades each, that we invoiced worldwide during the period. We monitor sets and believe that presenting sets to investors is helpful because we believe that it is the most direct measurement of our manufacturing output during the period. Sets primarily impact net sales and total billings. Estimated megawatts are the energy capacity to be generated by wind blade sets sold in the period. Our estimate is based solely on name-plate capacity of the wind turbine on which our wind blades are expected to be installed. We monitor estimated megawatts and believe that presenting estimated megawatts to investors is helpful because we believe that it is a commonly followed measurement of energy capacity across our industry and provides an indication of our share of the overall wind blade market. Dedicated manufacturing lines are the number of manufacturing lines that we have dedicated to our customers pursuant to our long-term supply agreements. Total manufacturing lines installed represents the number of manufacturing lines installed and either in operation, startup or transition. We monitor dedicated manufacturing lines and total manufacturing lines installed and believe that presenting both of these metrics to investors is helpful because we believe that the number of dedicated manufacturing lines is the best indicator of demand for our wind blades from customers under our long-term supply agreements in any given period. Dedicated manufacturing lines primarily impacts our net sales and total billings. We believe that dedicated manufacturing lines provide an understanding of additional capacity within an existing facility and that total manufacturing lines installed provides an understanding of the number of manufacturing lines installed and either in operation, startup or transition. Manufacturing lines in startup is the number of dedicated manufacturing lines that were in a startup phase during the pre-production and production ramp up period, pursuant to the opening of a new manufacturing facility, the expansion of an existing
55
manufacturing facility or the addition of new manufacturing lines in an existing manufacturing facility. We monitor and present this metric because we believe it helps investors to better understand the impact of the startup phase of our new manufacturing facilities on our gross profit (loss) and net income (loss). Manufacturing lines in transition is the number of dedicated manufacturing lines that were being transitioned to a new wind blade model during the period. We monitor and present this metric because we believe it helps investors to better understand the impact of these transitions on our gross profit (loss) and net income (loss).
RESULTS OF OPERATIONS
Year Ended December 31, 2016 Compared to Year Ended December 31, 2015
The following table summarizes certain information relating to our operating results and related percentage of net sales for the years ended December 31, 2016 and 2015 that has been derived from our consolidated financial statements.
|
|
|
Year Ended December 31, |
|
|||||||||||||
|
(in thousands) |
|
2016 |
|
|
2015 |
|
||||||||||
|
Net sales |
|
$ |
754,877 |
|
|
|
100.0 |
% |
|
$ |
585,852 |
|
|
|
100.0 |
% |
|
Cost of sales |
|
|
659,745 |
|
|
|
87.4 |
% |
|
|
528,247 |
|
|
|
90.2 |
% |
|
Startup and transition costs |
|
|
18,127 |
|
|
|
2.4 |
% |
|
|
15,860 |
|
|
|
2.7 |
% |
|
Total cost of goods sold |
|
|
677,872 |
|
|
|
89.8 |
% |
|
|
544,107 |
|
|
|
92.9 |
% |
|
Gross profit |
|
|
77,005 |
|
|
|
10.2 |
% |
|
|
41,745 |
|
|
|
7.1 |
% |
|
General and administrative expenses |
|
|
33,892 |
|
|
|
4.5 |
% |
|
|
14,126 |
|
|
|
2.4 |
% |
|
Income from operations |
|
|
43,113 |
|
|
|
5.7 |
% |
|
|
27,619 |
|
|
|
4.7 |
% |
|
Other expense |
|
|
(22,276 |
) |
|
|
(3.0 |
)% |
|
|
(15,960 |
) |
|
|
(2.7 |
)% |
|
Income before income taxes |
|
|
20,837 |
|
|
|
2.7 |
% |
|
|
11,659 |
|
|
|
2.0 |
% |
|
Income tax provision |
|
|
(6,995 |
) |
|
|
(0.9 |
)% |
|
|
(3,977 |
) |
|
|
(0.7 |
)% |
|
Net income |
|
|
13,842 |
|
|
|
1.8 |
% |
|
|
7,682 |
|
|
|
1.3 |
% |
|
Net income attributable to preferred shareholders |
|
|
5,471 |
|
|
|
0.7 |
% |
|
|
9,423 |
|
|
|
1.6 |
% |
|
Net income (loss) attributable to common shareholders |
|
$ |
8,371 |
|
|
|
1.1 |
% |
|
$ |
(1,741 |
) |
|
|
(0.3 |
)% |
Net sales for the year ended December 31, 2016 increased by $169.0 million or 28.9% to $754.9 million compared to $585.9 million in the same period in 2015. The increase was primarily driven by a 38% increase in the number of wind blades delivered during 2016 as compared to 2015, partially offset by a reduction in net sales from the manufacturing of prevision molding and assembly systems. Net sales of wind blades were $706.8 million for the year ended December 31, 2016 as compared to $535.2 million in the same period in 2015. These increases were primarily the result of additional wind blade volume at each of our plants impacted by lower average sales price due to geographic mix, blade mix and the result of savings in raw material costs, a portion of which we share with our customers, partially offset by foreign currency fluctuations in Turkey and China. Net sales from the manufacturing of precision molding and assembly systems during the year ended December 31, 2016 decreased to $39.1 million from $47.3 million in the same period in 2015. This decrease was primarily the result of reduced demand from our customers for precision molding and assembly systems from our China facility. Total billings for the year ended December 31, 2016 increased by $164.3 million or 27.4% to $764.4 million compared to $600.1 million in the same period in 2015. The impact of the strengthening of the U.S. dollar against the Euro at our Turkey operations and the Chinese Renminbi at our China operations on consolidated net sales and total billings were reductions of 1.1% and 1.0%, respectively, for the year ended December 31, 2016, with reductions of 4.8% and 4.1%, respectively, in the same period in 2015. Similar to the impact to net sales above, the impact of the strengthening of the U.S. dollar against the Euro, Turkish Lira, Mexican Peso and Chinese Renminbi reduced consolidated cost of goods sold by 3.5% for year ended December 31, 2016, compared to 4.7% in the same period in 2015.
Total cost of goods sold for the year ended December 31, 2016 was $677.9 million and included aggregate costs of $18.1 million related to startup costs in our new plants in Mexico and Turkey. This compares to total cost of goods sold for the year ended December 31, 2015 of $544.1 million which included aggregate costs of $15.9 million related to startup costs in our Mexico and Dafeng, China plants as well as the transition of wind blade models across
56
all of our plants. Cost of goods sold as a percentage of net sales of wind blades decreased by 4.3% in the year ended December 31, 2016 as compared to the same period in 2015 driven by improved operating efficiency in China and the U.S., which was partially offset by higher operating costs in our Turkey and Mexico plants due to the startup costs incurred with the opening of new plants in both those segments. Cost of goods sold as a percentage of net sales from the manufacturing of precision molding and assembly systems increased slightly during the year ended December 31, 2016 as compared to the same period in 2015.
General and administrative expenses for the year ended December 31, 2016 totaled $33.9 million as compared to $14.1 million for the same period in 2015. As a percentage of net sales, general and administrative expenses were 4.5% for the year ended December 31, 2016, up from 2.4% in the same period in 2015. The increased expenditures for general and administrative expenses were driven primarily by share-based compensation costs of $8.4 million recorded in 2016 as well as the costs of enhancing our corporate support functions during this period of growth.
Other expense increased to $22.3 million for the year ended December 31, 2016 from $16.0 million for the same period in 2015. The increase was primarily due to the expensing of $4.5 million of deferred financing costs and prepayment penalties related to the refinancing of our previous credit facility in 2016.
Income tax provision increased to $7.0 million for the year ended December 31, 2016 from $4.0 million for the same period in 2015. The increase was primarily due to the improved operating results in China and Mexico and an increase in China’s statutory rate.
Net income for the year ended December 31, 2016 was $13.8 million, as compared to $7.7 million in the same period in 2015. The increase was primarily due to the reasons set forth above.
Net income attributable to preferred shareholders decreased to $5.5 million during the year ended December 31, 2016 from $9.4 million during the same period in 2015. This decrease was primarily due to the fact that immediately prior to the closing of the IPO in July 2016, all shares of the then-outstanding redeemable preferred shares converted into an aggregate of 21,110,204 shares of common stock.
Net income attributable to common shareholders increased to $8.4 million during the year ended December 31, 2016 from a loss of $1.7 million in the same period in 2015. This increase was primarily due to the improved operating results discussed above as well as the decrease in the net income attributable to preferred shareholders. Diluted earnings per share for the year ended December 31, 2016 was $0.48 compared to a loss of $0.41 for the year ended December 31, 2015.
Segment Discussion
The following table summarizes our net sales and income (loss) from operations by our four geographic operating segments:
|
Net Sales |
|
Year Ended December 31, |
|
|||||
|
(in thousands) |
|
2016 |
|
|
2015 |
|
||
|
U.S. |
|
$ |
190,092 |
|
|
$ |
149,614 |
|
|
Asia |
|
|
301,893 |
|
|
|
206,779 |
|
|
Mexico |
|
|
129,756 |
|
|
|
97,912 |
|
|
EMEA |
|
|
133,136 |
|
|
|
131,547 |
|
|
Total net sales |
|
$ |
754,877 |
|
|
$ |
585,852 |
|
|
Income (Loss) from Operations |
|
Year Ended December 31, |
|
|||||
|
(in thousands) |
|
2016 |
|
|
2015 |
|
||
|
U.S. |
|
$ |
(25,099 |
) |
|
$ |
(13,405 |
) |
|
Asia |
|
|
64,393 |
|
|
|
34,998 |
|
|
Mexico |
|
|
9,546 |
|
|
|
7,531 |
|
|
EMEA |
|
|
(5,727 |
) |
|
|
(1,505 |
) |
|
Income from operations |
|
$ |
43,113 |
|
|
$ |
27,619 |
|
57
U.S. Segment
Net sales in the year ended December 31, 2016 increased by $40.5 million or 27.1% to $190.1 million compared to $149.6 million in the same period in 2015. Net sales of wind blades were $160.0 million during the year ended December 31, 2016 as compared to $122.4 million in the same period of 2015. The increase was driven by an increase in the number of wind blades delivered in the year ended December 31, 2016 compared to the same period in 2015 due to the transition in 2015 to the production of larger wind blade models at our customer’s request, partially offset by lower pricing due to savings in raw material costs, a portion of which we share with our customers. Net sales from the manufacturing of precision molding and assembly systems during the year ended December 31, 2016 were $21.1 million compared to $23.9 million during the same period in 2015.
The loss from operations for the year ended December 31, 2016 was $25.1 million as compared to $13.4 million in the same period in 2015. These amounts include corporate general and administrative costs of $33.9 million and $14.2 million for the years ended December 31, 2016 and 2015, respectively, with 2016 including $8.4 million of share-based compensation costs as described above. Notwithstanding these costs, the operating results were driven by increased wind blade volume, the impact of savings in raw material costs and improved operating efficiency.
Asia Segment
Net sales in the year ended December 31, 2016 increased by $95.1 million or 46.0% to $301.9 million compared to $206.8 million in the same period in 2015. Net sales of wind blades were $283.9 million in the year ended December 31, 2016 as compared to $183.4 million in the same period in 2015. The increase was the result of a 68% increase in the number of wind blades delivered during the year ended December 31, 2016 compared to the same period in 2015, which was primarily the result of the start of production for a new customer in our Dafeng facility during the latter half of 2015 as well as the addition of one manufacturing line for an existing customer, along with a change in the mix of wind blade models sold. These increases were partially offset by lower pricing due to savings in raw material costs, a portion of which we share with our customers and the unfavorable impact of the fluctuation of the U.S. dollar relative to the Chinese Renminbi of 2.7%. Net sales from the manufacturing of precision molding and assembly systems during the year ended December 31, 2016 were $18.0 million compared to $23.4 million during the same period in 2015. The decrease in sales was driven by the abnormally high demand from our customers for precision molding in the United States, China and Turkey in 2015 due to the transition to the production of large wind blade models at our customer’s request.
Income from operations in the Asia segment for the year ended December 31, 2016 was $64.4 million as compared to $35.0 million in the same period in 2015. In addition to the factors noted above, this increase reflects the impact of savings in raw material costs, continued increasing operational efficiencies and other improvements in our Taicang Port and Dafeng wind blade facilities relative to the same period in 2015 and the favorable impact of the fluctuation of the U.S. dollar relative to the Chinese Renminbi of 6.7%.
Mexico Segment
Net sales in the year ended December 31, 2016 increased by $31.8 million or 32.5% to $129.8 million compared to $97.9 million in the same period in 2015, reflecting a 23% increase in wind blade volume, notwithstanding the transition to the production of a larger wind blade model at our customer’s request during the period, the mix of blades and lower average sales prices on certain blades related to savings in raw material costs, a portion of which we share with our customers. Net sales of wind blades represents the entirety of net sales in the Mexico segment in the 2016 and 2015 periods.
Income from operations in the Mexico segment for the year ended December 31, 2016 was $9.5 million as compared to $7.5 million in the same period in 2015. The improvement in income from operations was due to the increase in wind blade volume in 2016 compared to the same period in 2015 and the savings in raw material costs and the favorable impact of the fluctuation of the U.S. dollar relative to the Mexican Peso of 2.3%, partially offset by costs to transition to a larger wind blade model as described above.
58
Net sales during the year ended December 31, 2016 increased $1.6 million or 1.2% to $133.1 million compared to $131.5 million in the same period in 2015. The increase in net sales was driven by a 3% increase in wind blade volume and changes in our wind blade mix, partially offset by lower sales prices related to savings in raw material costs, a portion of which we share with our customers. Net sales of wind blades represents the entirety of net sales in the EMEA segment in 2016 and 2015.
The loss from operations in the EMEA segment for the year ended December 31, 2016 was $5.7 million as compared to a loss of $1.5 million in the same period in 2015. The increase in the loss from operations was driven by an increase in the warranty reserve in 2016 which was partially offset by the higher wind blade volume noted above, improved operating performance and the savings in raw material costs and the net favorable impact of the fluctuation of the U.S. dollar relative to the Turkish Lira and Euro of 4.8%.
Year Ended December 31, 2015 Compared to Year Ended December 31, 2014
The following table summarizes certain information relating to our operating results and related percentage of net sales for the years ended December 31, 2015 and 2014 that has been derived from our consolidated financial statements.
|
|
|
Year Ended December 31, |
|
|||||||||||||
|
(in thousands) |
|
2015 |
|
|
2014 |
|
||||||||||
|
Net sales |
|
$ |
585,852 |
|
|
|
100.0 |
% |
|
$ |
320,747 |
|
|
|
100.0 |
% |
|
Cost of sales |
|
|
528,247 |
|
|
|
90.2 |
|
|
|
289,528 |
|
|
|
90.2 |
|
|
Startup and transition costs |
|
|
15,860 |
|
|
|
2.7 |
|
|
|
16,567 |
|
|
|
5.2 |
|
|
Total cost of goods sold |
|
|
544,107 |
|
|
|
92.9 |
|
|
|
306,095 |
|
|
|
95.4 |
|
|
Gross profit |
|
|
41,745 |
|
|
|
7.1 |
|
|
|
14,652 |
|
|
|
4.6 |
|
|
General and administrative expenses |
|
|
14,126 |
|
|
|
2.4 |
|
|
|
9,175 |
|
|
|
2.9 |
|
|
Income from operations |
|
|
27,619 |
|
|
|
4.7 |
|
|
|
5,477 |
|
|
|
1.7 |
|
|
Other expense |
|
|
(15,960 |
) |
|
|
(2.7 |
) |
|
|
(11,200 |
) |
|
|
(3.5 |
) |
|
Income (loss) before income taxes |
|
|
11,659 |
|
|
|
2.0 |
|
|
|
(5,723 |
) |
|
|
(1.8 |
) |
|
Income tax provision |
|
|
(3,977 |
) |
|
|
(0.7 |
) |
|
|
(925 |
) |
|
|
(0.3 |
) |
|
Net income (loss) |
|
|
7,682 |
|
|
|
1.3 |
|
|
|
(6,648 |
) |
|
|
(2.1 |
) |
|
Net income attributable to preferred shareholders |
|
|
9,423 |
|
|
|
1.6 |
|
|
|
13,930 |
|
|
|
4.3 |
|
|
Net loss attributable to common shareholders |
|
$ |
(1,741 |
) |
|
|
(0.3 |
)% |
|
$ |
(20,578 |
) |
|
|
(6.4 |
)% |
Net sales for the year ended December 31, 2015 increased by $265.2 million or 83% to $585.9 million compared to $320.7 million in the same period in 2014. This was primarily driven by a 91% increase in the number of wind blades delivered in the year ended December 31, 2015 compared to the same period in 2014. Net sales of wind blades were $535.2 million for the year ended December 31, 2015 as compared to $293.0 million in the same period in 2014. These increases were primarily the result of additional wind blade volume in our plants in Mexico, China and Turkey, partially offset by lower volume in the U.S. Net sales from the manufacturing of precision molding and assembly systems during the year ended December 31, 2015 increased to $47.3 million from $25.8 million in the same period in 2014. This increase was a result of precision molding and assembly systems manufactured in the United States and Asia for use in our U.S., China and Mexico facilities. Total billings for the year ended December 31, 2015 increased by $237.3 million or 65% to $600.1 million compared to total billings of $362.8 million in the same period in 2014. The impact of the strengthening of the U.S. dollar against the Euro at our Turkey operation on consolidated net sales and total billings were reductions of 4.8% and 4.1%, respectively, for the year ended December 31, 2015, with no material impact in the same period in 2014.
Total cost of goods sold for the year ended December 31, 2015 was $544.1 million and included aggregate costs of $15.9 million related to startup costs in our Mexico and Dafeng, China plants as well as the transition of wind blade models across all of our plants. This compares to total cost of goods sold for the year ended December 31, 2014 of $306.1 million, including aggregate costs of $16.6 million related to the transition of wind blades in our U.S. plant and startup costs in Mexico, Turkey and Dafeng, China. Cost of goods sold as a percentage
59
of net sales of wind blades decreased by 3% in the year ended December 31, 2015 as compared to the same period in 2014 driven by improved operating efficiency in Mexico and Turkey, which was partially offset by higher operating costs in our U.S. and China plants due to the transition to the production of larger wind blade models at our customer’s request. Cost of goods sold as a percentage of net sales from the manufacturing of precision molding and assembly systems decreased by 1% during the year ended December 31, 2015 as compared to the same period in 2014. Similar to the impact to net sales above, the impact of the strengthening of the U.S. dollar against the Euro reduced consolidated cost of goods sold at our Turkey operation by 4.7% for year ended December 31, 2015, compared to 1.8% in the same period in 2014.
General and administrative expenses for the year ended December 31, 2015 totaled $14.1 million as compared to $9.2 million for the same period in 2014. As a percentage of net sales, general and administrative expenses were 2.4% for the year ended December 31, 2015, down from 2.9% in the same period in 2014. The increased expenditures for general and administrative expenses were driven by the costs of enhancing our corporate support functions during this period of growth.
Other expense increased to $16.0 million for the year ended December 31, 2015 from $11.2 million for the same period in 2014. This was driven by higher interest expense from additional borrowings under our credit facilities to fund our growth initiatives, most notably our expansions and ramp-ups in Dafeng, China and Turkey. The increase also related to the amortization of the beneficial conversion feature on our subordinated convertible promissory notes during 2015.
Income tax provision increased to $4.0 million for the year ended December 31, 2015 from $0.9 million for the same period in 2014. The increase was primarily due to the operating results in China and Mexico.
Net income for the year ended December 31, 2015 was $7.7 million, as compared to a net loss of $6.6 million in the same period in 2014. The increase was primarily due to the reasons set forth above.
Net income attributable to preferred shareholders decreased to $9.4 million during the year ended December 31, 2015 from $13.9 million during the same period in 2014. This decrease was primarily due to the convertible preferred shares being fully accreted to their respective redemption amounts in 2014, partially offset by the normal period-over-period increase in the ongoing accrual of dividends.
Net loss attributable to common shareholders decreased to $1.7 million during the year ended December 31, 2015 from a loss of $20.6 million in the same period in 2014. This decrease was primarily due to the decrease in the net income attributable to preferred shareholders and net income (loss) discussed above.
Segment Discussion
The following table summarizes our net sales and income (loss) from operations by our four geographic operating segments:
|
Net Sales |
|
Year Ended December 31, |
|
|||||
|
(in thousands) |
|
2015 |
|
|
2014 |
|
||
|
U.S. |
|
$ |
149,614 |
|
|
$ |
145,691 |
|
|
Asia |
|
|
206,779 |
|
|
|
79,325 |
|
|
Mexico |
|
|
97,912 |
|
|
|
28,725 |
|
|
EMEA |
|
|
131,547 |
|
|
|
67,006 |
|
|
Total net sales |
|
$ |
585,852 |
|
|
$ |
320,747 |
|
60
|
Income (Loss) from Operations |
|
Year Ended December 31, |
|
|||||
|
(in thousands) |
|
2015 |
|
|
2014 |
|
||
|
U.S. |
|
$ |
(13,405 |
) |
|
$ |
(1,199 |
) |
|
Asia |
|
|
34,998 |
|
|
|
14,771 |
|
|
Mexico |
|
|
7,531 |
|
|
|
(6,567 |
) |
|
EMEA |
|
|
(1,505 |
) |
|
|
(1,528 |
) |
|
Income from operations |
|
$ |
27,619 |
|
|
$ |
5,477 |
|
U.S. Segment
Net sales in the year ended December 31, 2015 were $149.6 million, up from $145.7 million in the same period in 2014. Net sales of wind blades were $122.4 million during the year ended December 31, 2015 as compared to $128.5 million in the same period of 2014. The decrease was driven by a reduction in the number of wind blades delivered in the year ended December 31, 2015 compared to the same period in 2014 due to the transition to the production of larger wind blade models at our customer’s request. Net sales from the manufacturing of precision molding and assembly systems during the year ended December 31, 2015 were $23.9 million compared to $15.3 million during the same period in 2014. This increase was primarily the result of model-specific tooling equipment manufactured in our Rhode Island facility as required by our customers due to the transition to larger wind blade models for use in the U.S. and Mexico facilities.
The loss from operations for the year ended December 31, 2015 was $13.4 million as compared to the loss from operations of $1.2 million in the same period in 2014, primarily driven by reduced wind blade volume discussed above as well as higher general and administrative expenses in the U.S., including at our headquarters, required to facilitate our growth worldwide.
Asia Segment
Net sales in the year ended December 31, 2015 were $206.8 million, up from $79.3 million in the same period in 2014. Net sales of wind blades were $183.4 million in the year ended December 31, 2015 as compared to $68.8 million in the same period in 2014. The increase was the result of a 160% increase in the number of wind blades delivered during the year ended December 31, 2015 compared to the same period in 2014, along with a change in the mix of wind blade models sold. This was primarily the result of the start of production for a new customer in our Dafeng facility during 2015 as well as the addition of one manufacturing line for an existing customer for a portion of the year. Net sales from the manufacturing of precision molding and assembly systems were $23.4 million during the year ended December 31, 2015 compared to $10.5 million in the same period in 2014. These sales were driven by demand from our customers for precision molding and assembly systems in the United States, China and Turkey that we manufactured in our Taicang City facility.
Income from operations in the Asia segment for the year ended December 31, 2015 was $35.0 million as compared to $14.8 million in the same period in 2014. In addition to the factors noted above, this increase reflected continued increasing operational efficiencies and other improvements in our Taicang Port and Dafeng facilities relative to the prior period and the start of production for a new customer in our Dafeng facility.
Mexico Segment
The Mexico segment had net sales of $97.9 million in the year ended December 31, 2015 as compared to $28.7 million in the same period in 2014. This increase reflects the ramp-up of production in Mexico. Net sales of wind blades represents the entirety of net sales in the Mexico segment in 2015 and 2014.
Income from operations in the Mexico segment for the year ended December 31, 2015 was $7.5 million as compared to a loss of $6.6 million in the same period in 2014. The improvement was due to the increased production levels during the year ended December 31, 2015 approaching a normalized capacity, compared to the ramp up of production in the same period in 2014.
61
Net sales during the year ended December 31, 2015 were $131.5 million, up from $67.0 million in the same period in 2014. The increase was driven by a 105% increase in wind blade volume and changes in our wind blade mix, which resulted in a higher average sale price. Net sales of wind blades represents the entirety of net sales in the EMEA segment in 2015 and 2014.
The loss from operations in the EMEA segment for the years ended December 31, 2015 and 2014 were each $1.5 million. The higher wind blade volume and improved operating performance was more than offset by the impact of the strengthening of the U.S. dollar against the Euro and Turkish Lira in 2015. The impact of the strengthening U.S. dollar reduced net sales by 21.4% and cost of goods sold by 19.7%. The impact of the U.S. dollar against the Euro and Turkish Lira reduced net sales and cost of goods sold by 2.2% and 8.2%, respectively, in the comparable year ended December 31, 2014.
LIQUIDITY AND CAPITAL RESOURCES
Our primary needs for liquidity have been, and in the future will continue to be, capital expenditures, new facility startup costs, working capital and debt service costs. Our capital expenditures have been primarily related to machinery and equipment for new facilities or facility expansions. Historically, we have funded our working capital needs through cash flows from operations, the proceeds received from our credit facilities and from proceeds received from the issuance of stock. As discussed below, during 2016 we completed an initial public offering of common stock for which we received net proceeds of $67.2 million and in 2014 we received $6.8 million of net proceeds from preferred stock offerings (no common or preferred shares were offered during 2015). We received net proceeds from financing arrangements and customer advances of $1.6 million and $81.7 million during the years ended December 31, 2015 and 2014, respectively. During the year ended December 31, 2016, we had net repayments of financing arrangements and customer advances of $15.4 million. As of December 31, 2016 and 2015, we had $125.4 million and $136.6 million in outstanding indebtedness, excluding debt issuance costs and discounts, respectively. As of December 31, 2016, we had an aggregate of $64.3 million of remaining capacity and $14.0 million of availability under our various credit facilities. Working capital requirements have increased as a result of our overall growth and the need to fund higher accounts receivable and inventory levels as our business volumes have increased. Based upon current and anticipated levels of operations, we believe that cash on hand, available credit facilities and cash flow from operations will be adequate to fund our working capital and capital expenditure requirements and to make required payments of principal and interest on our indebtedness over the next twelve months.
In July 2016, we completed an IPO of 7,187,500 shares of our common stock at a public offering price of $11.00 per share, which included 937,500 shares issued pursuant to the underwriters’ over-allotment option. We received $67.2 million in proceeds, net of underwriting discounts and offering expenses and intend to use the net proceeds from the public offering for our working capital and other general corporate purposes, including financing existing manufacturing operations, expansion in existing and new geographies and repayment of a customer advance. Immediately prior to the closing of the IPO, all shares of the then-outstanding redeemable preferred shares converted into an aggregate of 21,110,204 shares of common stock and the redeemable preferred share warrants were converted on a net issuance basis into 120,923 shares of common stock. In addition, concurrent with the closing of the IPO, certain subordinated convertible promissory notes in the aggregate principal and interest amount of $11.9 million were converted into an aggregate of 1,079,749 shares of common stock at the public offering price of $11.00 per share. Prior to the IPO, in July 2016 we also consummated a 360-for-1 forward stock split of our common stock.
We anticipate that any new facilities and future facility expansions will be funded through cash flows from operations, the proceeds of our IPO, the incurrence of other indebtedness and other potential sources of liquidity.
At December 31, 2016 and 2015, we had unrestricted cash, cash equivalents and short-term investments totaling $119.1 million and $45.9 million, respectively. The December 31, 2016 balance includes $15.7 million of cash located outside of the United States, including $12.3 million in China, $2.5 million in Turkey and $0.9 million in Mexico. The December 31, 2015 balance includes $12.7 million of cash located outside of the United States, including $5.3 million in China, $7.2 million in Turkey and $0.2 million in Mexico. Our ability to repatriate funds
62
from China to the United States is subject to a number of restrictions imposed by the Chinese government. We repatriate funds through several technology license and corporate/administrative service agreements and dividends. We are compensated quarterly based on agreed upon royalty rates for such intellectual property licenses and quarterly fees for those services. Certain of our subsidiaries are limited in their ability to declare dividends without first meeting statutory restrictions of the People’s Republic of China, including retained earnings as determined under Chinese-statutory accounting requirements. Until 50% ($5.2 million) of registered capital is contributed to a surplus reserve, our Chinese operations can only pay dividends equal to 90% of after-tax profits (10% must be contributed to the surplus reserve). Once the surplus reserve fund requirement is met, our Chinese operations can pay dividends equal to 100% of after-tax profit assuming other conditions are met. At December 31, 2016, the amount of the surplus reserve fund was $4.4 million.
Operating Cash Flows
|
|
|
Year Ended December 31, |
|
|||||||||
|
(in thousands) |
|
2016 |
|
|
2015 |
|
|
2014 |
|
|||
|
Net income (loss) |
|
$ |
13,842 |
|
|
$ |
7,682 |
|
|
$ |
(6,648 |
) |
|
Depreciation and amortization |
|
|
12,897 |
|
|
|
11,416 |
|
|
|
7,441 |
|
|
Other non-cash items |
|
|
16,290 |
|
|
|
3,741 |
|
|
|
2,995 |
|
|
Changes in assets and liabilities |
|
|
10,812 |
|
|
|
8,454 |
|
|
|
(37,005 |
) |
|
Net cash provided by (used in) operating activities |
|
$ |
53,841 |
|
|
$ |
31,293 |
|
|
$ |
(33,217 |
) |
Net cash provided by operating activities totaled $53.8 million for the year ended December 31, 2016 and was primarily the result of net income of $13.8 million, non-cash depreciation and amortization charges totaling $12.9 million and other non-cash items of $16.3 million, as well as net changes in working capital. The key components of the $10.8 million increase in working capital includes a $15.0 million increase in accounts payable and accrued expenses, a $6.3 million increase in accrued warranty, a $5.1 million decrease in accounts receivable and a $4.0 million increase in deferred revenue. This was partially offset by an $8.3 million increase in other noncurrent assets, a $7.5 million increase in customer deposits and a $5.0 million increase in inventory. The working capital changes in accounts receivable, inventory, accounts payable and accrued expenses, accrued warranty and deferred revenue are primarily the result of the material increase in and the timing of sales in the year ended December 31, 2016.
Net cash provided by operating activities totaled $31.3 million for the year ended December 31, 2015 and was primarily the result of non-cash depreciation and amortization charges totaling $11.4 million and other non-cash items of $3.7 million, as well as net income of $7.7 million and net changes in working capital. The key components of the $8.5 million increase in working capital includes a $34.4 million increase in accounts payable and accrued expenses, a $7.7 million increase in accrued warranty, a $6.0 million increase in deferred revenue and a $4.2 million decrease in other noncurrent assets. This was partially offset by a $29.7 million increase in accounts receivable, an $11.0 million increase in prepaid expenses and other current assets and a $3.2 million decrease in customer deposits. The working capital changes in accounts receivable, inventory, accounts payable, accrued warranty and accrued expenses and deferred revenue are primarily the result of the material increase in and the timing of sales in the year ended December 31, 2015.
Net cash used in operating activities totaled $33.2 million for the year ended December 31, 2014. This cash usage was primarily the result of net changes in working capital and the net loss for the year ended December 31, 2014 of $6.6 million, partly offset by non-cash depreciation and amortization of $7.4 million. The key components of the working capital changes include a $60.3 million increase in inventory, a $31.7 million increase in accounts receivable and a $9.2 million increase in prepaid expenses and other current assets, partially reduced by $38.3 million increase in deferred revenue and a $26.1 million increase in accounts payable and accrued expenses. The working capital changes in accounts receivable, inventory, accounts payable and accrued expenses and deferred revenue are primarily the result of the material increase in and the timing of sales in the year ended December 31, 2014.
63
|
|
|
Year Ended December 31, |
|
|||||||||
|
(in thousands) |
|
2016 |
|
|
2015 |
|
|
2014 |
|
|||
|
Purchase of property and equipment |
|
$ |
(30,507 |
) |
|
$ |
(26,361 |
) |
|
$ |
(18,924 |
) |
|
Proceeds from sale of assets |
|
|
— |
|
|
|
146 |
|
|
|
— |
|
|
Net cash used in investing activities |
|
$ |
(30,507 |
) |
|
$ |
(26,215 |
) |
|
$ |
(18,924 |
) |
Net cash flows used in investing activities totaled $30.5 million, $26.2 million and $18.9 million in the years ended December 31, 2016, 2015 and 2014, respectively, driven primarily by capital expenditures for new facilities and expansion or improvements at existing facilities. The capital expenditures for the year ended December 31, 2016 primarily related to the plant build outs of three new wind blade facilities, two in Mexico and one in Turkey. The capital expenditures for the year ended December 31, 2015 primarily related to the expansion of our China and Iowa wind blade facilities. For the year ended December 31, 2014, the capital expenditures were primarily for the Turkey, Mexico and China plant build outs.
We anticipate fiscal year 2017 capital expenditures of between $75 million to $80 million. We estimate that the cost after December 31, 2016 that we will incur to complete our current projects in process is approximately $5 million. We have used and will continue to use cash flows from operations, the proceeds received from our credit facilities and the proceeds received from the issuance of stock for major projects currently being undertaken, which include new manufacturing facilities in Mexico and Turkey, as well as continued investment in our existing China and Turkey wind blade facilities.
Financing Cash Flows
|
|
|
Year Ended December 31, |
|
|||||||||
|
(in thousands) |
|
2016 |
|
|
2015 |
|
|
2014 |
|
|||
|
Proceeds from issuance of common stock sold in initial public offering, net of underwriting discount and offering costs |
|
$ |
67,199 |
|
|
$ |
— |
|
|
$ |
— |
|
|
Net proceeds from (repayment of) term loans |
|
|
(930 |
) |
|
|
19,375 |
|
|
|
23,901 |
|
|
Net proceeds from (repayments of) accounts receivable financing |
|
|
(5,385 |
) |
|
|
(2,472 |
) |
|
|
34,450 |
|
|
Net proceeds from (repayments of) working capital loans |
|
|
(4,290 |
) |
|
|
(12,572 |
) |
|
|
5,999 |
|
|
Proceeds from subordinated debt arrangements |
|
|
— |
|
|
|
— |
|
|
|
15,000 |
|
|
Net repayments of other debt |
|
|
(4,765 |
) |
|
|
(2,777 |
) |
|
|
(2,130 |
) |
|
Net proceeds from customer advances |
|
|
— |
|
|
|
— |
|
|
|
4,500 |
|
|
Proceeds from issuance of preferred stock |
|
|
— |
|
|
|
— |
|
|
|
6,846 |
|
|
Debt issuance costs |
|
|
— |
|
|
|
(1,113 |
) |
|
|
(4,818 |
) |
|
Restricted cash and other |
|
|
(499 |
) |
|
|
(2,864 |
) |
|
|
273 |
|
|
Net cash provided by (used in) financing activities |
|
$ |
51,330 |
|
|
$ |
(2,423 |
) |
|
$ |
84,021 |
|
The net cash flows provided by financing activities totaled $51.3 million and $84.0 million for the years ended December 31, 2016 and 2014, respectively. Net cash flows used in financing activities for the year ended December 31, 2015 totaled $2.4 million. Net cash flows provided by financing activities for the year ended December 31, 2016 primarily reflects the net proceeds received from our initial public offering, partially offset by repayments of working capital loans and accounts receivable loans. Net cash flows used in financing activities for the year ended December 31, 2015 primarily reflects the net repayments of working capital loans and accounts receivable loans as well as payments related to the acquisition of noncontrolling interest of our Turkey operation in 2013 and additions to restricted cash. This was partially offset by additional net proceeds from term loans. The net cash flows from financing activities for the year ended December 31, 2014 was primarily comprised of additional indebtedness provided by our senior lenders, accounts receivable financings, working capital loans and subordinated debt as well as from proceeds of preferred stock offerings.
64
Description of Our Indebtedness
Senior Financing Agreements (U.S.):
In August 2014, we entered into an agreement to borrow up to $75.0 million through a credit facility (the Credit Facility) in order to refinance existing indebtedness as well as to fund current operations and future growth opportunities. The initial amount drawn on the closing date was $50.0 million and an additional $5.0 million was drawn in December 2014. In December 2014, in connection with the additional $5.0 million draw, the Credit Facility was amended. In December 2015, the Credit Facility was further amended to increase the total available principal amount from $75.0 million to $100.0 million. The Credit Facility had an initial term of four years and was to mature in 2018, provided for various financial covenants and bore interest at the London Interbank Offered Rate (LIBOR) with a 1.0% floor, plus 8.0%. The Credit Facility contained various affirmative and negative covenants, including EBITDA (as defined in the Credit Facility) minimum covenants, a leverage ratio and a fixed-charge coverage ratio. The Credit Facility limited annual capital expenditures based on budgets submitted to and agreed to with the lender and there was also an annual excess cash flow sweep requirement. In connection with the December 2015 amendment, all financial covenants were revised and the measurement period changed from monthly to quarterly. Concurrent with the December 2015 amendment, we borrowed an additional $20.0 million under the Credit Facility to fund future growth and expansion. In addition, there were debt issuance costs of $4.7 million which were being amortized to interest expense over a period of 48 months using the effective interest method. As of December 31, 2015, the outstanding balances under the Credit Facility was $74.4 million.
In connection with the initial draw on the Credit Facility in August 2014, we repaid our previously outstanding senior term loan of $20.0 million plus accrued interest, a prepayment penalty and a termination fee. The prepayment penalty and termination fee amounted to $1.6 million and are included within the caption Loss on extinguishment of debt in the accompanying consolidated statements of operations. In addition, we also expensed the remaining $1.3 million of debt discount and deferred financing costs associated with the senior term loan within the caption Loss on extinguishment of debt in the accompanying consolidated statements of operations. We also repaid $5.0 million of previously outstanding subordinated convertible promissory notes plus accrued interest as well as $5.7 million of customer advances outstanding at the time of the refinancing.
In December 2016, we amended and restated the Credit Facility (the Amended Credit Facility). The previous $100.0 million of available principal was replaced with a $75.0 million term loan and a $25.0 million revolving credit facility, which includes a $15.0 million letter of credit sub-facility. The borrowings under the Amended Credit Facility bear interest at a variable rate through maturity at LIBOR, with a 1.0% floor, plus 5.75%. The Amended Credit Facility requires us to make quarterly principal payments in the amount of $0.9 million of the outstanding principal loan balance commencing in March 2017, with the remaining outstanding balance to be repaid on or before December 30, 2020. The Amended Credit Facility contains customary affirmative covenants, negative covenants and events of default, including covenants and restrictions that, among other things, require us and our subsidiaries to satisfy certain capital expenditure and other financial covenants, and restricts the ability of us and our subsidiaries to incur liens, incur additional indebtedness, enter into joint ventures or partnerships, engage in mergers and acquisitions, engage in asset sales and declare dividends on its capital stock without the prior written consent of the Lenders. The obligations under the Amended Credit Facility are secured by a lien on substantially all tangible and intangible property of us and our domestic subsidiaries and by a pledge by us and our domestic subsidiaries of 65% of the equity of their direct foreign subsidiaries, subject to customary exceptions and exclusions from collateral.
If we prepay any of the outstanding principal loan balance prior to December 30, 2017, we are required to pay the lenders a premium in an amount equal to the amount of interest that otherwise would have been payable from the date of prepayment until December 30, 2017 plus 3.0% of the amount of the principal loan balance that was prepaid. If we prepay any of the outstanding principal loan balance after December 30, 2017 through December 30, 2018, we are required to pay the lenders 2.0% of the principal loan balance that was prepaid, and if we prepay any of the outstanding loan balance after December 30, 2018 through December 30, 2019, we are required to pay a premium of 1.5% of the amount of the principal loan balance that was prepaid.
In connection with the Amended Credit Facility, we repaid the outstanding Credit Facility balance of $74.4 million, plus accrued interest, closing fees, a prepayment penalty and the reimbursement of certain lenders expenses incurred. The deferred financing fees totaled $2.2 million and are being amortized to interest expense over a period of 48 months using the effective interest method. In addition, we also expensed $2.4 million of the remaining
65
deferred financing costs associated with the Credit Facility and $2.1 million of the prepayment penalty within the caption Loss on extinguishment of debt in the accompanying consolidated statements of operations. As of December 31, 2016, the aggregate outstanding balance under the Amended Credit Facility was $77.8 million. We cannot assure you that we will be able to maintain appropriate minimum leverage or fixed-charge coverage ratio requirements in the future.
Subordinated Convertible Promissory Notes Agreement (U.S.):
In conjunction with the additional funding under the Credit Facility in December 2014, we entered into a note purchase agreement with five of our current investors for the purchase of $10.0 million of subordinated convertible promissory notes. The notes bore interest at a rate of 12.0% per annum and would automatically mature and be due and payable on the earlier of the completion of any change of control or qualified initial public offering, or at the election of the holders of the notes at any time after the occurrence of an event of default. We had the right to prepayment without the consent of the note holders and the note holders held conversion rights upon future financing into new equity financing or convertible note financing. This note purchase agreement contained a beneficial conversion feature which was valued at $5.2 million based on the difference between the fair value of our stock as of the commitment date as compared to the most favorable conversion rate that would have been available to the investor during the term of the loan. This amount was accounted for as a debt discount and an increase in shareholders’ equity. The debt discount was being accreted to interest expense ratably over the expected term of the notes. In addition, there were debt issuance costs of $0.2 million which were being amortized to interest expense over the estimated term of the loan using the effective interest method. As of December 31, 2015, the outstanding balance under the note purchase agreement was $10.0 million.
Concurrent with the closing of our IPO, the principal and accrued interest on the outstanding subordinated convertible promissory notes were converted into an aggregate of 1,079,749 shares of common stock at the public offering price of $11.00 per share. In connection with this conversion, the remaining beneficial conversion feature, debt discount and debt issuance costs totaling $1.3 million were fully expensed as interest expense in the accompanying consolidated statements of operations.
Accounts Receivable, Secured and Unsecured Financing:
EMEA: During 2014, we renewed a general credit agreement with a financial institution in Turkey to provide up to $20.0 million (later updated to 20.0 million Euro, or approximately $21.1 million as of December 31, 2016) of short-term collateralized financing on invoiced accounts receivable of one of Turkey’s customers. Interest accrues annually at the Euro Interbank Offered Rate (EURIBOR) plus 0.2% (currently 5.75%) and is paid monthly. In December 2014, Turkey obtained an additional $7.0 million of unsecured financing under the credit agreement, increasing the total facility. All credit agreement terms remained the same. The credit agreement does not have a maturity date, however the limits are reviewed in September of each year. Amounts outstanding under this agreement as of December 31, 2016 and 2015 include $15.1 million and $18.7 million of accounts receivable financing and $4.6 million and $4.1 million of unsecured financing, respectively.
In December 2014, we entered into a credit agreement with a Turkish financial institution to provide up to $16.0 million short-term financing of which $10.0 million is collateralized financing on invoiced accounts receivable of one of Turkey’s customers and the remaining $6.0 million is unsecured. Interest accrues at an average rate of 6.25%. The credit agreement does not have a maturity date, however the limits are reviewed in September of each year. No amounts were outstanding under this agreement as of December 31, 2016. Amounts outstanding under this agreement as of December 31, 2015 include $1.8 million of accounts receivable financing and $4.5 million of unsecured financing.
In March 2016, we entered into a general credit agreement with a Turkish financial institution to provide up to 33.5 million Euro (later increased to 36.0 million Euro, or approximately $37.9 million as of December 31, 2016) of short-term financing of which 20.0 million Euro (approximately $21.1 million as of December 31, 2016) is collateralized financing based on invoiced accounts receivable of one of the EMEA segment’s customers, 12.5 million Euro (later increased to 15.0 million Euro, or approximately $15.8 million as of December 31, 2016) for the collateralized financing of capital expenditures and 1.0 million Euro (approximately $1.0 million as of
66
December 31, 2016) related to letters of guarantee. Interest on the collateralized financing based on invoiced accounts receivable accrues at the three month EURIBOR plus 5.75% and is paid quarterly with a maturity date equal to four months from the applicable invoice date. Interest on the collateralized capital expenditures financing accrues at the one month EURIBOR, plus 6.75% (currently 6.75%) with monthly principal repayments beginning in October 2017 with a final maturity date of December 2021. Interest on the letters of guarantee accrues at 2.00% annually with a final maturity date of March 2017. As of December 31, 2016, there was $15.8 million outstanding under the collateralized financing of capital expenditures line.
Asia: During 2014, we entered into accounts receivable financing loans with a financial institution. Amounts outstanding as of December 31, 2015 were $6.6 million and interest accrued at 6.6% annually. All interest was payable quarterly. The principal on these loans was scheduled to be paid from between 12 to 36 months from each loan origination date but had been, and were anticipated to continue to be, renewed at their maturities. As of December 31, 2016, all amounts outstanding under these accounts receivable financing loans were fully repaid.
In January 2016, we entered into a credit agreement with a Chinese financial institution to provide up to 95.0 million Renminbi (approximately $13.6 million as of December 31, 2016) of short-term financing of which 85.0 million Renminbi (approximately $12.2 million as of December 31, 2016) is collateralized financing based on invoiced accounts receivables of one of our Asia segment’s customers and 10.0 million Renminbi (approximately $1.4 million as of December 31, 2016) of working capital loans collateralized by one of our Asia segment location’s machinery and equipment. Interest on the collateralized financing and the collateralized working capital loan accrues at a specified LIBOR rate plus an applicable margin and can be paid monthly, quarterly or at the time of the debt’s final maturity (January 12, 2017). As of December 31, 2016, there were no amounts outstanding under these accounts receivable financing and working capital loans.
Working Capital Agreements (Asia):
During 2014, we entered into several working capital loans with various financial institutions. Amounts outstanding as of December 31, 2015 were $9.5 million and interest accrued at between 5.6% and 6.9% annually. All interest was payable quarterly. The principal on these loans was scheduled to be paid from between 3 to 12 months from each loan origination date. As collateral for the above working capital loans, the financial institution received a security interest in China’s buildings and land use rights. In connection with the December 2015 amendment to the Credit Facility noted above, we repaid the outstanding indebtedness incurred in connection with our working capital loans with our lenders in China in 2016.
Equipment Lease and Other Arrangements: We have entered into certain capital lease and construction loan arrangements in the United States, Mexico and EMEA for equipment used in our operations as well as for office use. These leases bear interest at rates ranging from 4.0% to 9.0% annually, and principal and interest are payable monthly. As of December 31, 2016 and 2015, there was $12.1 million and $7.0 million outstanding under these arrangements, respectively.
Customer Advances: As of December 31, 2014, we had an outstanding non-interest bearing customer advance totaling $1.2 million, which was discounted using an imputed interest rate of 7.0%, which approximated the rate that we would have received on this financing in the open market. These customer advances were paid back in full during the year ended December 31, 2015. In January 2016, we entered into an agreement with GE Wind and received an advance of $2.0 million. These funds were used to expand the existing Mexico manufacturing facility to accommodate larger wind blade models. We were obligated to repay the advance, without interest, by providing future credits against a specified number of wind blade sets sold to GE Wind. If the Mexico operation failed to supply those wind blade sets by December 31, 2016, the then outstanding balance of the advance would have been immediately due and payable. The advance would have also been immediately due in full upon a change of control of the Company or within 30 days after the effective date of an initial public offering of our common stock. In August 2016, the customer advance was repaid in full.
Operating Leases: We lease various facilities and equipment under non-cancelable operating lease agreements. As of December 31, 2016, we leased a total of approximately 3.8 million square feet in Dafeng, China; Izmir, Turkey; Newton, Iowa; Juárez, Mexico; Santa Teresa, New Mexico; Taicang City, China; Taicang Port, China; Warren, Rhode Island; and Fall River, Massachusetts, as well as our corporate office in Scottsdale, Arizona.
67
The terms of these leases range from 12 months to 120 months with annual payments approximating $16 million for the full year 2017.
Other Contingencies
Other than as noted in “Legal Proceedings” included in Part I, Item 3 of this Annual Report on Form 10-K as of December 31, 2016 and 2015, we were not involved in any material litigation. In the future, however, we may become involved in various claims and legal actions arising in the ordinary course of business which may have a material adverse effect on our consolidated financial position, results of operations or liquidity.
Our wind blades and other composite structures are subject to warranties against defects in workmanship and materials, generally for a period of two to five years. We are not responsible for the fitness for use of the wind blade or the overall wind turbine system. If a wind blade is found to be defective during the warranty period as a result of a defect in workmanship or materials, among other potential remedies, we may need to repair or replace the wind blade (which could include significant transportation and installation costs) at our sole expense.
In June 2016, we entered into a settlement agreement and release with Nordex providing for the full and final settlement of any potential claims arising from a wind blade failure that occurred in April 2015 and certain alleged defects with respect to that blade and certain other wind blades that were primarily manufactured in 2014 according to Nordex’s specifications. We expressly stated in the settlement agreement and release that we deny any and all liability related to such potential claims and Nordex acknowledged our denial of liability in the settlement agreement and release. Notwithstanding our denial of liability, we concluded that reaching an agreement with Nordex to resolve the matter was in our best interest. The settlement agreement and release provided that Nordex would release us from any and all possible claims arising out of or relating to the identified issues with the wind blades in question and any and all liabilities associated therewith. Nordex had also agreed to indemnify us against any third party claims relating to the identified issues with the wind blades in question, including without limitation, from Nordex’s customers or insurance carriers. In consideration for these releases and indemnification, we agreed and made a one-time cash payment to Nordex equal to 8.0 million Euro in November 2016. Pursuant to the settlement agreement and release, we replaced four sets of wind blades, and are in the process of making certain field repairs to 42 wind blades and retrofitting an additional 70 wind blades at our Turkey facility. The most probable aggregate cost to us of fulfilling our obligations under the settlement agreement and release was determined to be approximately $15.0 million, all of which was accrued by us as of March 31, 2016 and a substantial portion of which was paid prior to December 31, 2016. After the settlement agreement was executed with Nordex, we subsequently extended the term of our existing supply agreement with Nordex from 2018 to 2020 and entered into a new long-term supply agreement with Nordex for the supply of wind turbines from two manufacturing lines at our second manufacturing facility in Turkey. We have yet to sign an additional supply agreement with Nordex for the remaining two additional manufacturing lines contemplated by the Nordex settlement agreement. There can be no assurance that we will be able to enter into a new supply agreement or new supply agreements with Nordex for the remaining two lines, or if we do, that the final definitive agreements will contain terms as described above.
At December 31, 2016 and 2015, we had accrued warranty reserves totaling $19.9 million and $13.6 million, respectively.
We had no material operating expenditures for environmental matters, including government imposed remedial or corrective actions, during the years ended December 31, 2016, 2015 and 2014.
Off-Balance Sheet Transactions
We are not presently involved in any off-balance sheet arrangements, including transactions with unconsolidated special-purpose or other entities that would materially affect our financial position, results of operations, liquidity or capital resources, other than operating lease arrangements and the accounts receivable assignment agreement described below. Furthermore, we do not have any relationships with special-purpose or other entities that provide off-balance sheet financing; liquidity, market risk or credit risk support; or engage in leasing or other services that may expose us to liability or risks of loss that are not reflected in consolidated financial statements and related notes.
68
In 2014, our Mexico segment entered into an accounts receivable assignment agreement with a financial institution. Under this agreement, the financial institution buys, on a non-recourse basis, the accounts receivable amounts related to one of our Mexico segment’s customers at a discount calculated based on an effective annual rate of LIBOR plus 2.75%. As these receivables are purchased by the financial institution, they are removed from the Mexico segment’s balance sheet. During the year ended December 31, 2016, $74.4 million of receivables were sold to the financial institution.
Contractual Obligations
The following table summarizes certain of our contractual obligations as of December 31, 2016:
|
|
|
Payments Due by Period |
|
|||||||||||||||||
|
(in thousands) |
|
Less than 1 year |
|
|
1-3 years |
|
|
3-5 years |
|
|
More than 5 years |
|
|
Total |
|
|||||
|
Long-term debt obligations(1) |
|
$ |
33,403 |
|
|
$ |
20,850 |
|
|
$ |
71,192 |
|
|
$ |
— |
|
|
$ |
125,445 |
|
|
Operating lease obligations(2) |
|
|
16,434 |
|
|
|
27,665 |
|
|
|
21,980 |
|
|
|
41,271 |
|
|
|
107,350 |
|
|
Purchase obligations |
|
|
1,157 |
|
|
|
953 |
|
|
|
733 |
|
|
|
— |
|
|
|
2,843 |
|
|
Estimated interest payments(3) |
|
|
7,998 |
|
|
|
10,884 |
|
|
|
4,776 |
|
|
|
— |
|
|
|
23,658 |
|
|
Total contractual obligations |
|
$ |
58,992 |
|
|
$ |
60,352 |
|
|
$ |
98,681 |
|
|
$ |
41,271 |
|
|
$ |
259,296 |
|
|
(1) |
See “—Description of Our Indebtedness” above. |
|
(2) |
Our operating lease obligations represent the contractual payments due for the lease of our corporate office in Scottsdale, Arizona in addition to facilities in Iowa, Massachusetts, Rhode Island, New Mexico, China, Mexico and Turkey. |
|
(3) |
Includes interest on variable rate debt based on interest rates as of December 31, 2016. |
CRITICAL ACCOUNTING POLICIES AND ESTIMATES
Our discussion and analysis of our financial condition and results of operations are based upon our consolidated financial statements, which have been prepared in accordance with GAAP. The preparation of these consolidated financial statements requires us to make estimates and judgments that affect the reported amount of our assets, liabilities, revenue and expenses and related disclosure of contingent assets and liabilities. We evaluate our estimates on an ongoing basis, including those related to revenue recognition, income taxes, share-based compensation, warranty expense and goodwill and intangibles. We base our estimates on our historical experience and on various other assumptions that we believe to be reasonable under the circumstances, the results of which form the basis for making the judgments we make about the carrying values of our assets and liabilities that are not readily apparent from other sources. Because these estimates can vary depending on the situation, actual results may differ from the estimates.
We believe the following critical accounting policies affect our more significant judgments used in the preparation of our consolidated financial statements.
Revenue Recognition. We record all sales of goods when a firm sales agreement is in place, when delivery has occurred (as defined by the sales contract), and collectability of the fixed or determinable sales price is reasonably assured. The basic criteria necessary for revenue recognition are: (1) evidence that a sales arrangement exists, (2) title and risk of loss have passed to the customer, (3) delivery of goods has occurred, (4) the seller’s price to the buyer is fixed or determinable and (5) collectability is reasonably assured. We recognize revenue at the time of delivery to customers.
For multiple deliverable revenue arrangements, we allocate revenue to each element based on a selling price hierarchy. The selling price for a deliverable is based on its vendor specific objective evidence (VSOE) if available, third party evidence (TPE) if VSOE is not available, or best estimated selling price (BESP) if neither VSOE nor TPE is available. We generally allocate revenue for each of the deliverables within multiple element arrangements through BESP using cost plus margin estimates prepared during contract negotiations, agreed upon sales price or VSOE for sales of similar items outside of multiple element arrangements. The precision molding and assembly
69
systems provided for in each customer’s contract are based upon the specific engineering requirements and design of the customer relative to the wind blade design and function desired. From the customer’s engineering specifications, a job cost estimate is developed along with a production plan, and margin is applied based on the customer and complexity of the work to be performed. Precision molding and assembly systems are built to produce wind blades which are manufactured in production runs specified in the customer contract. To determine the appropriate accounting for recognition of revenue, we consider whether the deliverables specified in the multiple element arrangement should be treated as separate units of accounting, and, if so, how the price should be allocated among the elements, when to recognize revenue for each element, and the period over which revenue should be recognized. We also evaluate whether a delivered item has value on a stand-alone basis prior to delivery of the remaining items by determining whether we have made separate sales of such items or whether the undelivered items are essential to the functionality of the delivered items. Further, we assess whether we know the fair value of the undelivered items, determined by reference to stand-alone sales of such items, if available, or BESP. As each of these items has stand-alone value to the customer, revenue from sales of wind blades and precision molding and assembly systems used in the production of composite products are recognized when those specific items are accepted by the customer as meeting the contractual technical specifications and delivered to the customer. Delivery of wind blades and precision molding and assembly systems generally takes place as defined in the contract at the facility where the precision molding and assembly systems are produced at which point the precision molding and assembly systems become exclusive property of the customer. The customer is generally then responsible for transportation to their own or our wind blade production sites where the precision molding and assembly systems are placed into service. Revenue related to engineering and freight services provided under customer contracts is recognized upon completion of the services being provided. Customers usually pay directly to the carrier the cost of shipping associated with items produced, but if paid by us, that cost is included in cost of goods sold and amounts invoiced for shipping and handling are included in revenue.
Our customers may request, in situations where they do not have space available to receive products or do not want to immediately take possession of products for other reasons, that their finished composite products be stored by us in one of our facilities. We will bill for the components as allowed by the contract; however, revenue is deferred for financial reporting purposes until we deliver the finished composite product and all of the other requirements for revenue recognition have been met. Composite products that have been billed by us and continue to be stored by us at one of our facilities are included at net realizable value in inventory held for customer orders included on the consolidated balance sheets. Inventory held for customer orders is physically segregated from finished goods and is accounted for separately within our accounting records.
Wind blade pricing is based on annual commitments of volume as established in the customer’s contract with orders less than committed volume resulting in additional costs per wind blade to customers; however, orders in excess of annual commitments do not result in discounts to customers from the contracted price for the committed volume. Customers may utilize early payment discounts which are reported as a reduction of revenue at the time the discount is taken.
Income Taxes. In connection with preparing our consolidated financial statements, we are required to estimate our income taxes in each of the jurisdictions in which we operate. This process involves our assessment of any net operating loss carryforwards, as well as estimating our actual current tax liability together with assessing temporary differences resulting from differing treatment of items, such as reserves and accrued liabilities, for tax and accounting purposes. We also have to assess whether any portion of our earnings generated in one taxing jurisdiction might be claimed as earned by income tax authorities in a differing tax jurisdiction. Significant judgment is required in determining our annual tax rate, the allocation of earnings to various jurisdictions and in the evaluation of our tax positions.
Additionally, we record the estimated future tax effects of temporary differences between the tax basis of assets and liabilities and amounts reported in the accompanying consolidated balance sheets, as well as operating loss and tax credit carryforwards. We then assess the likelihood that our deferred income tax assets will be realized by evaluating all available positive and negative evidence in order to determine if it is more-likely-than-not that the deferred tax assets will be realized. To the extent we believe that the realization of our deferred tax assets is not more-likely-than-not, we are required to establish a valuation allowance. In doing so we considered our recent operating history, taxpaying history and future reversals of deferred tax liabilities based upon future operating projections. As a result of cumulative losses in the United States, we have determined that a valuation allowance for
70
all of our U.S. deferred tax assets was appropriate. We periodically evaluate all available positive and negative evidence regarding the future recoverability of our deferred tax assets and, when we determine that the recoverability of deferred tax assets meets the criteria of more-likely-than-not, we reduce the valuation allowance against our deferred tax assets. The effect of a change in judgment concerning the realizability of deferred tax assets would be included in provision for income taxes. As of December 31, 2016, we have U.S. federal NOLs of approximately $57.5 million, state NOLs of approximately $77.2 million and foreign tax credits of approximately $2.6 million available to offset future taxable income.
Federal U.S. income taxes have not been provided on $42.0 million of undistributed earnings at December 31, 2016 of foreign subsidiaries over which we have sufficient influence to control the distribution of such earnings, and we have determined that such earnings have been reinvested indefinitely. Should we elect in the future to repatriate a portion of the foreign earnings so invested, we could incur income tax expense on such repatriation, net of any available deductions and foreign tax credits. This would result in additional income tax expense beyond the computed expected provision in such periods. The amount of unrecognized deferred tax liability for temporary differences related to investments in foreign subsidiaries and foreign corporate joint ventures that are essentially permanent in duration is not easily determinable.
Sections 382 and 383 of the Code, contain rules that limit the ability of a company that undergoes an “ownership change” to utilize its net operating loss and tax credit carry forwards and certain built-in losses recognized in years after the ownership change. An ownership change is generally defined as any change in ownership of more than 50% of a corporation’s stock over a rolling three-year period by stockholders that own (directly or indirectly) 5% or more of the stock of a corporation, or arising from a new issuance of stock by a corporation. If an ownership change occurs, Section 382 generally imposes an annual limitation on the use of pre-ownership change NOLs, credits and certain other tax attributes to offset taxable income earned after the ownership change. The annual limitation is equal to the product of the applicable long-term tax exempt rate and the value of the company’s stock immediately before the ownership change. This annual limitation may be adjusted to reflect any unused annual limitation for prior years and certain recognized built-in gains and losses for the year. In addition, Section 383 generally limits the amount of tax liability in any post-ownership change year that can be reduced by pre-ownership change tax credit carryforwards. In 2008, we had an ownership change and the pre-ownership change NOLs existing at the date of change of $25.6 million were subject to an annual limitation of $4.3 million. As of December 31, 2016, the pre-ownership change NOLs are no longer limited. Certain of these NOLs may be at risk of limitation in the event of a future ownership change.
Share-Based Compensation. We have granted to our directors and senior management a combination of stock options, restricted stock units (RSUs), stock appreciation rights (SARs) and unit appreciation rights. We intend to continue to make share-based compensation awards from time to time to our directors and senior management. Historically, our equity awards, as well as any equity awards we may make in the future, will carry a compensation charge. We measure the fair value of stock options and SARs at grant date using the Black-Scholes valuation model. Share-based compensation expense is recognized over the related service period of the options or SARs. The Black-Scholes model requires the input of subjective assumptions including the expected volatility based on comparable companies, the period of time the stock option is expected to remain outstanding and the fair value of the underlying common stock on the date of grant, the expected dividend yield (if any) and the risk-free interest rate. The use of different assumptions in the Black-Scholes pricing model would result in different amounts of share-based compensation expense. Furthermore, if different assumptions are used in future periods, share-based compensation expense could be materially impacted in the future.
We measure and recognize compensation expense for share-based payment awards made to employees, consultants and directors based the fair value of share-based awards on the date of grant for employees and directors and the fair value of share-based awards to consultants on the date of vesting. We use the Black-Scholes option pricing model to estimate the fair value of our options as of the grant date using the following assumptions:
Expected Volatility. As our common stock had not been publicly traded prior to July 2016, the expected volatility assumption reflects an average of volatilities of publicly traded peer group companies with a period equal to the expected life of the options.
71
Expected Life (years). We use the simplified method to estimate the expected term of stock options. The simplified method for estimating expected term is to use the mid-point between the vesting term and the contractual term of the option. We elected to use the simplified method because we did not have historical exercise data to estimate the expected term due to the limited time period our common stock had been publicly traded.
Risk-Free Interest Rate. The risk-free interest rate assumption is based upon the U.S. constant maturity treasury rates as the risk-free rate interpolated between the years commensurate with the expected life of the options.
Dividend Yield. The dividend yield assumption is zero since we do not expect to declare or pay dividends in the foreseeable future.
Forfeitures. Forfeitures are estimated at the time of grant and revised in subsequent periods if actual forfeitures differ from those estimates.
Expected Vesting Period. We amortize the share-based compensation expense over the requisite service period.
We granted awards of stock options and RSUs during 2016 and 2015 to certain employees and non-employee directors. These awards include a performance condition requiring the completion of our IPO and have a required vesting period of one to four years commencing upon achievement of the performance condition. As the IPO was consummated in July 2016, we began recording compensation expense in July 2016 for the requisite service period from the grant date through the IPO date with the balance of the share-based compensation to be expensed over the remaining vesting period. Total share-based compensation expense recognized during the year ended December 31, 2016 was $9.9 million, of which $1.5 million is included in cost of goods sold and the remaining $8.4 million is included in general and administrative expenses. The amount recorded related to restricted stock units was $3.5 million while $6.4 million related to stock options. Approximately $3.6 million of the total share-based compensation expense recorded during the year ended December 31, 2016 related to the service period from the grant date through December 31, 2015. No share-based compensation costs were capitalized during the year ended December 31, 2016.
There were no share-based compensation equity awards granted during the year ended December 31, 2014 and we did not recognize any share-based compensation expense during the years ended December 31, 2015 and 2014.
Warranty Expense. As discussed above, our wind blades are subject to warranties against defects in workmanship and materials, generally for a period of two to five years. We are not responsible for the fitness for use of the wind blade in the overall wind turbine system. If a wind blade is found to be defective during the warranty period as a result of a defect in workmanship or materials, among other potential remedies, we may need to repair or replace the wind blade at our sole expense. We provide warranties for all of our products with terms and conditions that vary depending on the product sold. We record warranty expense based upon our estimate of future repairs using a probability-based methodology.
Our estimate of warranty expense requires us to make assumptions about matters that are highly uncertain, including future rates of product failure, repair costs, including availability of materials, shipping and handling, and de-installation and re-installation costs at customers’ sites, among others. When a potential or actual warranty claim arises, we will accrue additional warranty reserves for the estimated cost of remediation or proposed settlement. From 2010 through 2012, our U.S. wind blade plant incurred cumulative warranty costs of $3.5 million to inspect and when required, correct wind blades that may not have met the customer’s specifications. We accrued $15.0 million during 2016 to cover the aggregate costs associated with the agreement that we entered into with Nordex to settle potential claims relating to a wind blade failure that occurred in April 2015 and certain alleged defects with respect to that wind blade and certain other wind blades that were primarily manufactured in 2014. See “Management’s Discussion and Analysis of Financial Condition and Results of Operations—Other Contingencies” included in Part II, Item 7 of this Annual Report on Form 10-K for more information. Except for these costs, we have not experienced other material warranty expenses beyond the provision described above in the years ended December 31, 2016, 2015 and 2014. However, changes in warranty reserves could have a material effect on our consolidated financial statements.
72
Inventory. Inventories are stated at the lower of cost or net realizable value. Net realizable value is estimated sales price less estimated completion and transportation costs, if applicable and is compared to the carrying cost of the inventory to determine if a write-down is necessary. Cost is determined using the first-in, first-out method for raw materials and specific identification for work in process and finished goods inventories. Actual cost includes the cost of materials, direct labor, and applied manufacturing overhead. Write-downs to reduce the carrying cost of obsolete, slow-moving, and unusable inventory to market value are recognized in cost of goods sold. The effect of these write-downs is to establish a new cost basis in the related inventory, which is not subsequently written up. Inventory designated for customer orders under storage arrangements is physically segregated from finished goods and is accounted for separately.
Recent Accounting Pronouncements
For a discussion of recent accounting pronouncements, see Note 1 – Summary of Significant Accounting Policies of the Notes to Consolidated Financial Statements in Part II, Item 8 of this Annual Report on Form 10-K.
Jumpstart Our Business Startups Act of 2012
On April 5, 2012, the JOBS Act was enacted. Section 107 of the JOBS Act provides that an “emerging growth company” can take advantage of the extended transition period provided in Section 7(a)(2)(B) of the Securities Act for complying with new or revised accounting standards. We intend to take advantage of certain exemptions from various reporting requirements that are applicable to other public companies that are not emerging growth companies including not being required to comply with the auditor attestation requirements of Section 404(b) of the Sarbanes-Oxley Act, reduced disclosure obligations regarding executive compensation in our periodic reports and proxy statements, and exemptions from the requirements of holding a nonbinding advisory vote on executive compensation and shareholder approval of any golden parachute payments not previously approved. We may take advantage of these reporting exemptions until we are no longer an emerging growth company. We will remain an emerging growth company until the earliest of (i) the last day of the fiscal year in which we have total annual gross revenues of $1.0 billion or more; (ii) the last day of our fiscal year following the fifth anniversary of the date of the completion of our IPO; (iii) the date on which we have issued more than $1.0 billion in nonconvertible debt during the previous three years or (iv) the date on which we are deemed to be a “large accelerated filer” under the rules of the SEC.
Under the JOBS Act, emerging growth companies can also delay adopting new or revised accounting standards until such time as those standards apply to private companies. We have irrevocably elected not to avail ourselves of this exemption from new or revised accounting standards and, therefore, will be subject to the same new or revised accounting standards as other public companies that are not emerging growth companies.
Item 7A. Quantitative and Qualitative Disclosures About Market Risk
We are exposed to market risk in the ordinary course of our business. These market risks are principally limited to changes in foreign currency exchange rates and commodity prices. We currently do not hedge our exposure to these risks.
Foreign Currency Risk. We conduct international operations in China, Mexico and Turkey. Our results of operations are subject to both currency transaction risk and currency translation risk. We incur currency transaction risk whenever we enter into either a purchase or sale transaction using a currency other than the local currency of the transacting entity. With respect to currency translation risk, our financial condition and results of operations are measured and recorded in the relevant domestic currency and then translated into U.S. dollars for inclusion in our consolidated financial statements. In recent years, exchange rates between these foreign currencies and the U.S. dollar have fluctuated significantly and may do so in the future. A hypothetical change of 10% in the exchange rates for the countries above would have resulted in a change to income from operations of approximately $12.5 million and $6.2 million for the years ended December 31, 2016 and 2015, respectively.
Commodity Price Risk. We are subject to commodity price risk under agreements for the supply of our raw materials. We have not hedged, nor do we intend to hedge, our commodity price exposure. We generally lock in
73
pricing for our key raw materials for 12 months which protects us from price increases within that period. Additionally, the arrangements we have with our customers limit the impact of any price or cost increases. Finally, since many of our raw material supply agreements have meet or release clauses, if raw materials prices go down, we can also benefit from the reductions in price. We believe that this adequately protects us from increases in raw material prices but also enables us to take full advantage of decreases. We believe that a 10% change in the price of resin and resin systems, the commodities for which we do not have fixed pricing, would have had an impact to income from operations of approximately $9.8 million and $10.0 million for the years ended December 31, 2016 and 2015, respectively.
Interest Rate Risk. We have an aggregate of $77.8 million outstanding under the Amended Credit Facility that is tied to LIBOR which is used to refinance existing indebtedness, fund future growth opportunities and current operations. During 2014, our Turkey operation entered into a general credit agreement with a Turkish financial institution to provide up to $12.0 million, which was increased to $20.0 million, of short-term collateralized financing on invoiced accounts receivable of one of its customers and unsecured financing that is tied to EURIBOR. The Amended Credit Facility and the Turkey short-term collateralized financing on invoiced accounts receivable and unsecured financings are the only variable rate debt that we held as of December 31, 2016 and 2015 as all remaining working capital loans, accounts receivable financing and capital lease obligations are fixed rate instruments and are not subject to fluctuations in interest rates. Due to the relatively low LIBOR and EURIBOR rates in effect as of December 31, 2016, a 10% change in the LIBOR or EURIBOR rate would not have a material impact on our future earnings, fair values or cash flows.
Item 8. Financial Statements and Supplementary Data
The financial statements required to be filed pursuant to this Item 8 are appended to this Report. An index of those financial statements is found in Item 15.
Item 9. Changes in and Disagreements With Accountants on Accounting and Financial Disclosure
None
Item 9A. Controls and Procedures
Evaluation of Disclosure Controls and Procedures
We maintain disclosure controls and procedures that are designed to provide reasonable assurance that information required to be disclosed in our reports under the Exchange Act is recorded, processed, summarized, and reported within the time period specified in the SEC’s rules and forms and that such information is accumulated and communicated to our management, including our Chief Executive Officer and Chief Financial Officer, as appropriate, to allow timely decisions regarding required disclosure.
As required by Rule 13a-15(b) promulgated under the Exchange Act, our management, with the participation of our Chief Executive Officer and Chief Financial Officer, evaluated the design and operating effectiveness as of December 31, 2016 of our disclosure controls and procedures, as defined in Rule 13a-15(e) promulgated under the Exchange Act. Based on this evaluation, our Chief Executive Officer and Chief Financial Officer concluded that our disclosure controls and procedures were effective as of December 31, 2016.
Management’s Report on Internal Control Over Financial Reporting and Attestation Report of the Registered Public Accounting Firm
This Annual Report on Form 10-K does not include a report of management's assessment regarding internal control over financial reporting due to a transition period established by rules of the SEC for newly public companies.
In addition, because we are an “emerging growth company” under the JOBS Act, our independent registered public accounting firm will not be required to attest to the effectiveness of our internal control over financial reporting for so long as we are an emerging growth company.
74
Changes in Internal Control Over Financial Reporting
There have not been any changes in our internal control over financial reporting during the three months ended December 31, 2016, that have materially affected, or are reasonably likely to materially affect, our internal control over financial reporting.
Not applicable.
75
Item 10. Directors, Executive Officers and Corporate Governance
The information required by this Item is incorporated by reference to the information that will be contained in our proxy statement related to the 2017 Annual Meeting of Stockholders, which we intend to file with the SEC within 120 days of the fiscal year ended December 31, 2016.
Item 11. Executive Compensation
The information required by this Item is incorporated by reference to the information that will be contained in our proxy statement related to the 2017 Annual Meeting of Stockholders, which we intend to file with the SEC within 120 days of the fiscal year ended December 31, 2016.
Item 12. Security Ownership of Certain Beneficial Owners and Management and Related Stockholder Matters
The information required by this Item is incorporated by reference to the information that will be contained in our proxy statement related to the 2017 Annual Meeting of Stockholders, which we intend to file with the SEC within 120 days of the fiscal year ended December 31, 2016.
Item 13. Certain Relationships and Related Transactions, and Director Independence
The information required by this Item is incorporated by reference to the information that will be contained in our proxy statement related to the 2017 Annual Meeting of Stockholders, which we intend to file with the SEC within 120 days of the fiscal year ended December 31, 2016.
Item 14. Principal Accounting Fees and Services
The information required by this Item is incorporated by reference to the information that will be contained in our proxy statement related to the 2017 Annual Meeting of Stockholders, which we intend to file with the SEC within 120 days of the fiscal year ended December 31, 2016.
PART IV
Item 15. Exhibits, Financial Statement Schedules
|
(a) |
Financial Statements and Schedules |
The financial statements listed in the accompanying Index to Consolidated Financial Statements are filed as part of this Annual Report on Form 10-K.
|
(b) |
Exhibits |
See Exhibit Index.
Not applicable.
76
Pursuant to the requirements of Section 13 or 15(d) of the Securities Exchange Act of 1934, the Registrant has duly caused this Report to be signed on its behalf by the undersigned, thereunto duly authorized.
|
|
|
TPI COMPOSITES, INC. |
||
|
|
|
|
|
|
|
Date: March 17, 2017 |
|
By: |
|
/s/ William E. Siwek |
|
|
|
|
|
William E. Siwek |
|
|
|
|
|
Chief Financial Officer (Principal Financial and Accounting Officer) |
We, the undersigned officers and directors of TPI Composites, Inc., hereby severally constitute and appoint Steven C. Lockard and William E. Siwek, and each of them singly (with full power to each of them to act alone), our true and lawful attorneys-in-fact and agents, with full power of substitution and resubstitution in each of them for him or her and, place and stead, and in any and all capacities, to sign conformed for us and in our names in the capacities indicated below any and all signatures and amendments to this report, and to file the same, with all exhibits thereto, filing date and other documents in connection therewith, with the Securities and Exchange Commission, granting unto said attorneys-in-fact and agents, and each of them, full power and authority to do and perform each and every act and thing requisite or necessary to be done in and about the premises, as full to all intents and purposes as he or she might or could do in person, hereby ratifying and confirming all that said attorneys-infact and agents or any of them, or their or his substitute or substitutes, may lawfully do or cause to be done by virtue hereof.
77
Pursuant to the requirements of the Securities Exchange Act of 1934, as amended, this Report has been signed below by the following persons on behalf of the Registrant in the capacities and on the dates indicated.
|
Name |
|
Title |
|
Date |
|
|
|
|
|
|
|
/s/ Steven C. Lockard |
|
President, Chief Executive Officer and Director |
|
March 17, 2017 |
|
Steven C. Lockard |
|
(Principal Executive Officer) |
|
|
|
|
|
|
|
|
|
/s/ William E. Siwek |
|
Chief Financial Officer |
|
March 17, 2017 |
|
William E. Siwek |
|
(Principal Financial and Accounting Officer) |
|
|
|
|
|
|
|
|
|
/s/ Stephen B. Bransfield |
|
Director |
|
March 17, 2017 |
|
Stephen B. Bransfield |
|
|
|
|
|
|
|
|
|
|
|
/s/ Michael L. DeRosa |
|
Director |
|
March 17, 2017 |
|
Michael L. DeRosa |
|
|
|
|
|
|
|
|
|
|
|
/s/ Philip J. Deutch |
|
Director |
|
March 17, 2017 |
|
Philip J. Deutch |
|
|
|
|
|
|
|
|
|
|
|
/s/ Paul G. Giovacchini |
|
Director and Chairman of the Board |
|
March 17, 2017 |
|
Paul G. Giovacchini |
|
|
|
|
|
|
|
|
|
|
|
/s/ Jack A. Henry |
|
Director |
|
March 17, 2017 |
|
Jack A. Henry |
|
|
|
|
|
|
|
|
|
|
|
/s/ James A. Hughes |
|
Director |
|
March 17, 2017 |
|
James A. Hughes |
|
|
|
|
|
|
|
|
|
|
|
/s/ Daniel G. Weiss |
|
Director |
|
March 17, 2017 |
|
Daniel G. Weiss |
|
|
|
|
78
INDEX TO CONSOLIDATED FINANCIAL STATEMENTS
F-1
Report of Independent Registered Public Accounting Firm
The Board of Directors and Stockholders
TPI Composites, Inc.:
We have audited the accompanying consolidated balance sheets of TPI Composites, Inc. and subsidiaries (“Company”) as of December 31, 2016 and 2015, and the related consolidated statements of operations, comprehensive income (loss), shareholders’ equity (deficit), and cash flows for each of the years in the three-year period ended December 31, 2016. These consolidated financial statements are the responsibility of the Company’s management. Our responsibility is to express an opinion on these consolidated financial statements based on our audits.
We conducted our audits in accordance with the standards of the Public Company Accounting Oversight Board (United States). Those standards require that we plan and perform the audit to obtain reasonable assurance about whether the consolidated financial statements are free of material misstatement. An audit includes examining, on a test basis, evidence supporting the amounts and disclosures in the consolidated financial statements. An audit also includes assessing the accounting principles used and significant estimates made by management, as well as evaluating the overall financial statement presentation. We believe that our audits provide a reasonable basis for our opinion.
In our opinion, the consolidated financial statements referred to above present fairly, in all material respects, the financial position of TPI Composites, Inc. and subsidiaries as of December 31, 2016 and 2015, and the results of their operations and their cash flows for each of the years in the three-year period ended December 31, 2016, in conformity with U.S. generally accepted accounting principles.
/s/ KPMG LLP
Phoenix, Arizona
March 17, 2017
F-2
TPI COMPOSITES, INC. AND SUBSIDIARIES
(In thousands, except par value data)
|
|
|
December 31, |
|
|||||
|
|
|
2016 |
|
|
2015 |
|
||
|
Assets |
|
|
|
|
|
|
|
|
|
Current assets: |
|
|
|
|
|
|
|
|
|
Cash and cash equivalents |
|
$ |
119,066 |
|
|
$ |
45,917 |
|
|
Restricted cash |
|
|
2,259 |
|
|
|
1,760 |
|
|
Accounts receivable (Note 3) |
|
|
67,842 |
|
|
|
72,913 |
|
|
Inventories |
|
|
53,095 |
|
|
|
50,841 |
|
|
Inventories held for customer orders |
|
|
52,308 |
|
|
|
49,594 |
|
|
Prepaid expenses and other current assets |
|
|
30,657 |
|
|
|
31,337 |
|
|
Total current assets |
|
|
325,227 |
|
|
|
252,362 |
|
|
Property, plant, and equipment, net |
|
|
91,166 |
|
|
|
67,732 |
|
|
Goodwill |
|
|
2,807 |
|
|
|
2,807 |
|
|
Intangible assets, net |
|
|
265 |
|
|
|
419 |
|
|
Other noncurrent assets |
|
|
17,741 |
|
|
|
6,600 |
|
|
Total assets |
|
$ |
437,206 |
|
|
$ |
329,920 |
|
|
Liabilities and Shareholders’ Equity (Deficit) |
|
|
|
|
|
|
|
|
|
Current liabilities: |
|
|
|
|
|
|
|
|
|
Accounts payable and accrued expenses |
|
$ |
112,281 |
|
|
$ |
101,108 |
|
|
Accrued warranty |
|
|
19,912 |
|
|
|
13,596 |
|
|
Deferred revenue |
|
|
69,568 |
|
|
|
65,520 |
|
|
Customer deposits and customer advances |
|
|
1,390 |
|
|
|
8,905 |
|
|
Current maturities of long-term debt |
|
|
33,403 |
|
|
|
52,065 |
|
|
Total current liabilities |
|
|
236,554 |
|
|
|
241,194 |
|
|
Long-term debt, net of debt issuance costs, discount and current maturities |
|
|
89,752 |
|
|
|
77,281 |
|
|
Other noncurrent liabilities |
|
|
4,393 |
|
|
|
3,812 |
|
|
Total liabilities |
|
|
330,699 |
|
|
|
322,287 |
|
|
Commitments and contingencies (Note 15) |
|
|
|
|
|
|
|
|
|
Convertible and senior redeemable preferred shares and warrants (Note 3) |
|
|
— |
|
|
|
198,830 |
|
|
Shareholders’ equity (deficit): (Note 3) |
|
|
|
|
|
|
|
|
|
Preferred shares, $0.01 par value, 5,500 shares authorized, no shares issued or outstanding at December 31, 2016; no shares authorized, issued or outstanding at December 31, 2015 |
|
|
— |
|
|
|
— |
|
|
Common shares, $0.01 par value, 100,000 shares authorized and 33,737 shares issued and outstanding at December 31, 2016; 31,104 shares authorized and 4,238 shares issued and outstanding at December 31, 2015 |
|
|
337 |
|
|
|
— |
|
|
Paid-in capital |
|
|
292,833 |
|
|
|
— |
|
|
Accumulated other comprehensive loss |
|
|
(3,862 |
) |
|
|
(25 |
) |
|
Accumulated deficit |
|
|
(182,801 |
) |
|
|
(191,172 |
) |
|
Total shareholders’ equity (deficit) |
|
|
106,507 |
|
|
|
(191,197 |
) |
|
Total liabilities and shareholders’ equity (deficit) |
|
$ |
437,206 |
|
|
$ |
329,920 |
|
See accompanying notes to consolidated financial statements.
F-3
TPI COMPOSITES, INC. AND SUBSIDIARIES
Consolidated Statements of Operations
(In thousands, except per share data)
|
|
|
Year Ended December 31, |
|
|||||||||
|
|
|
2016 |
|
|
2015 |
|
|
2014 |
|
|||
|
Net sales (Note 3) |
|
$ |
754,877 |
|
|
$ |
585,852 |
|
|
$ |
320,747 |
|
|
Cost of sales |
|
|
659,745 |
|
|
|
528,247 |
|
|
|
289,528 |
|
|
Startup and transition costs |
|
|
18,127 |
|
|
|
15,860 |
|
|
|
16,567 |
|
|
Total cost of goods sold |
|
|
677,872 |
|
|
|
544,107 |
|
|
|
306,095 |
|
|
Gross profit |
|
|
77,005 |
|
|
|
41,745 |
|
|
|
14,652 |
|
|
General and administrative expenses |
|
|
33,892 |
|
|
|
14,126 |
|
|
|
9,175 |
|
|
Income from operations |
|
|
43,113 |
|
|
|
27,619 |
|
|
|
5,477 |
|
|
Other income (expense): |
|
|
|
|
|
|
|
|
|
|
|
|
|
Interest income |
|
|
344 |
|
|
|
161 |
|
|
|
186 |
|
|
Interest expense |
|
|
(17,614 |
) |
|
|
(14,565 |
) |
|
|
(7,236 |
) |
|
Loss on extinguishment of debt |
|
|
(4,487 |
) |
|
|
— |
|
|
|
(2,946 |
) |
|
Realized loss on foreign currency remeasurement |
|
|
(757 |
) |
|
|
(1,802 |
) |
|
|
(1,743 |
) |
|
Miscellaneous income |
|
|
238 |
|
|
|
246 |
|
|
|
539 |
|
|
Total other expense |
|
|
(22,276 |
) |
|
|
(15,960 |
) |
|
|
(11,200 |
) |
|
Income (loss) before income taxes |
|
|
20,837 |
|
|
|
11,659 |
|
|
|
(5,723 |
) |
|
Income tax provision |
|
|
(6,995 |
) |
|
|
(3,977 |
) |
|
|
(925 |
) |
|
Net income (loss) |
|
|
13,842 |
|
|
|
7,682 |
|
|
|
(6,648 |
) |
|
Net income attributable to preferred shareholders |
|
|
5,471 |
|
|
|
9,423 |
|
|
|
13,930 |
|
|
Net income (loss) attributable to common shareholders |
|
$ |
8,371 |
|
|
$ |
(1,741 |
) |
|
$ |
(20,578 |
) |
|
Weighted-average common shares outstanding: |
|
|
|
|
|
|
|
|
|
|
|
|
|
Basic |
|
|
17,530 |
|
|
|
4,238 |
|
|
|
4,238 |
|
|
Diluted |
|
|
17,616 |
|
|
|
4,238 |
|
|
|
4,238 |
|
|
Net income (loss) per common share: |
|
|
|
|
|
|
|
|
|
|
|
|
|
Basic |
|
$ |
0.48 |
|
|
$ |
(0.41 |
) |
|
$ |
(4.86 |
) |
|
Diluted |
|
$ |
0.48 |
|
|
$ |
(0.41 |
) |
|
$ |
(4.86 |
) |
See accompanying notes to consolidated financial statements.
F-4
TPI COMPOSITES, INC. AND SUBSIDIARIES
Consolidated Statements of Comprehensive Income (Loss)
(In thousands)
|
|
|
Year Ended December 31, |
|
|||||||||
|
|
|
2016 |
|
|
2015 |
|
|
2014 |
|
|||
|
Net income (loss) |
|
$ |
13,842 |
|
|
$ |
7,682 |
|
|
$ |
(6,648 |
) |
|
Other comprehensive loss: |
|
|
|
|
|
|
|
|
|
|
|
|
|
Foreign currency translation adjustments |
|
|
(3,837 |
) |
|
|
(2,363 |
) |
|
|
(124 |
) |
|
Comprehensive income (loss) |
|
$ |
10,005 |
|
|
$ |
5,319 |
|
|
$ |
(6,772 |
) |
See accompanying notes to consolidated financial statements.
F-5
TPI COMPOSITES, INC. AND SUBSIDIARIES
Consolidated Statements of Changes in Shareholders’ Equity (Deficit)
(In thousands)
|
|
|
Common |
|
|
Paid-in |
|
|
Accumulated other comprehensive |
|
|
Accumulated |
|
|
Total shareholders' equity |
|
|||||||||
|
|
|
Shares |
|
|
Amount |
|
|
capital |
|
|
income (loss) |
|
|
deficit |
|
|
(deficit) |
|
||||||
|
Balance at January 1, 2014 |
|
|
4,238 |
|
|
$ |
— |
|
|
$ |
— |
|
|
$ |
2,462 |
|
|
$ |
(175,647 |
) |
|
$ |
(173,185 |
) |
|
Net loss |
|
|
— |
|
|
|
— |
|
|
|
— |
|
|
|
— |
|
|
|
(6,648 |
) |
|
|
(6,648 |
) |
|
Other comprehensive loss |
|
|
— |
|
|
|
— |
|
|
|
— |
|
|
|
(124 |
) |
|
|
— |
|
|
|
(124 |
) |
|
Common stock warrants |
|
|
— |
|
|
|
— |
|
|
|
— |
|
|
|
— |
|
|
|
845 |
|
|
|
845 |
|
|
Acquisition and tax impact of noncontrolling interest |
|
|
— |
|
|
|
— |
|
|
|
— |
|
|
|
— |
|
|
|
760 |
|
|
|
760 |
|
|
Beneficial conversion feature in subordinated debt agreement |
|
|
— |
|
|
|
— |
|
|
|
— |
|
|
|
— |
|
|
|
5,189 |
|
|
|
5,189 |
|
|
Redeemable preferred shares fair value adjustment |
|
|
— |
|
|
|
— |
|
|
|
— |
|
|
|
— |
|
|
|
(13,930 |
) |
|
|
(13,930 |
) |
|
Balance at December 31, 2014 |
|
|
4,238 |
|
|
|
— |
|
|
|
— |
|
|
|
2,338 |
|
|
|
(189,431 |
) |
|
|
(187,093 |
) |
|
Net income |
|
|
— |
|
|
|
— |
|
|
|
— |
|
|
|
— |
|
|
|
7,682 |
|
|
|
7,682 |
|
|
Other comprehensive loss |
|
|
— |
|
|
|
— |
|
|
|
— |
|
|
|
(2,363 |
) |
|
|
— |
|
|
|
(2,363 |
) |
|
Redeemable preferred shares fair value adjustment |
|
|
— |
|
|
|
— |
|
|
|
— |
|
|
|
— |
|
|
|
(9,423 |
) |
|
|
(9,423 |
) |
|
Balance at December 31, 2015 |
|
|
4,238 |
|
|
|
— |
|
|
|
— |
|
|
|
(25 |
) |
|
|
(191,172 |
) |
|
|
(191,197 |
) |
|
Net income |
|
|
— |
|
|
|
— |
|
|
|
— |
|
|
|
— |
|
|
|
13,842 |
|
|
|
13,842 |
|
|
Other comprehensive loss |
|
|
— |
|
|
|
— |
|
|
|
— |
|
|
|
(3,837 |
) |
|
|
— |
|
|
|
(3,837 |
) |
|
Redeemable preferred shares fair value adjustment |
|
|
— |
|
|
|
— |
|
|
|
— |
|
|
|
— |
|
|
|
(5,471 |
) |
|
|
(5,471 |
) |
|
Issuance of common stock sold in initial public offering (IPO), net of under- writers discount and offering costs |
|
|
7,188 |
|
|
|
72 |
|
|
|
67,127 |
|
|
|
— |
|
|
|
— |
|
|
|
67,199 |
|
|
Conversion of convertible preferred shares into common stock upon consummation of IPO |
|
|
21,110 |
|
|
|
253 |
|
|
|
202,993 |
|
|
|
— |
|
|
|
— |
|
|
|
203,246 |
|
|
Conversion of subordinated convertible promissory notes into common stock upon consummation of IPO |
|
|
1,080 |
|
|
|
11 |
|
|
|
11,866 |
|
|
|
— |
|
|
|
— |
|
|
|
11,877 |
|
|
Conversion of redeemable preferred share warrants into common stock upon consummation of IPO |
|
|
121 |
|
|
|
1 |
|
|
|
1,083 |
|
|
|
— |
|
|
|
— |
|
|
|
1,084 |
|
|
Share-based compensation expense |
|
|
— |
|
|
|
— |
|
|
|
9,764 |
|
|
|
— |
|
|
|
— |
|
|
|
9,764 |
|
|
Balance at December 31, 2016 |
|
|
33,737 |
|
|
$ |
337 |
|
|
$ |
292,833 |
|
|
$ |
(3,862 |
) |
|
$ |
(182,801 |
) |
|
$ |
106,507 |
|
See accompanying notes to consolidated financial statements.
F-6
TPI COMPOSITES, INC. AND SUBSIDIARIES
Consolidated Statements of Cash Flows
(In thousands)
|
|
|
Year Ended December 31, |
|
|||||||||
|
|
|
2016 |
|
|
2015 |
|
|
2014 |
|
|||
|
Cash flows from operating activities: |
|
|
|
|
|
|
|
|
|
|
|
|
|
Net income (loss) |
|
$ |
13,842 |
|
|
$ |
7,682 |
|
|
$ |
(6,648 |
) |
|
Adjustments to reconcile net income (loss) to net cash provided by (used in) operating activities: |
|
|
|
|
|
|
|
|
|
|
|
|
|
Loss on disposal of property and equipment |
|
|
— |
|
|
|
185 |
|
|
|
128 |
|
|
Depreciation and amortization |
|
|
12,897 |
|
|
|
11,416 |
|
|
|
7,441 |
|
|
Amortization of debt discount |
|
|
3,018 |
|
|
|
3,016 |
|
|
|
— |
|
|
Amortization of debt issuance costs |
|
|
1,663 |
|
|
|
1,303 |
|
|
|
715 |
|
|
Loss on extinguishment of debt |
|
|
4,487 |
|
|
|
— |
|
|
|
2,946 |
|
|
Share-based compensation expense |
|
|
9,902 |
|
|
|
— |
|
|
|
— |
|
|
Loss on investment in joint venture |
|
|
2 |
|
|
|
2 |
|
|
|
6 |
|
|
Amortization of discount on customer advances |
|
|
— |
|
|
|
— |
|
|
|
218 |
|
|
Deferred income taxes |
|
|
(2,782 |
) |
|
|
(765 |
) |
|
|
(1,018 |
) |
|
Changes in assets and liabilities: |
|
|
|
|
|
|
|
|
|
|
|
|
|
Accounts receivable |
|
|
5,071 |
|
|
|
(29,652 |
) |
|
|
(31,677 |
) |
|
Inventories |
|
|
(4,967 |
) |
|
|
(626 |
) |
|
|
(60,320 |
) |
|
Prepaid expenses and other current assets |
|
|
681 |
|
|
|
(10,978 |
) |
|
|
(9,225 |
) |
|
Other noncurrent assets |
|
|
(8,291 |
) |
|
|
4,204 |
|
|
|
2,021 |
|
|
Accounts payable and accrued expenses |
|
|
14,959 |
|
|
|
34,423 |
|
|
|
26,050 |
|
|
Accrued warranty |
|
|
6,316 |
|
|
|
7,680 |
|
|
|
2,180 |
|
|
Customer deposits |
|
|
(7,515 |
) |
|
|
(3,193 |
) |
|
|
1,047 |
|
|
Deferred revenue |
|
|
4,048 |
|
|
|
6,044 |
|
|
|
38,322 |
|
|
Other noncurrent liabilities |
|
|
510 |
|
|
|
552 |
|
|
|
(5,403 |
) |
|
Net cash provided by (used in) operating activities |
|
|
53,841 |
|
|
|
31,293 |
|
|
|
(33,217 |
) |
|
Cash flows from investing activities: |
|
|
|
|
|
|
|
|
|
|
|
|
|
Purchases of property and equipment |
|
|
(30,507 |
) |
|
|
(26,361 |
) |
|
|
(18,924 |
) |
|
Proceeds from sale of assets |
|
|
— |
|
|
|
146 |
|
|
|
— |
|
|
Net cash used in investing activities |
|
|
(30,507 |
) |
|
|
(26,215 |
) |
|
|
(18,924 |
) |
|
Cash flows from financing activities: |
|
|
|
|
|
|
|
|
|
|
|
|
|
Proceeds from issuance of common stock sold in initial public offering, net of underwriters discount and offering costs |
|
|
67,199 |
|
|
|
— |
|
|
|
— |
|
|
Proceeds from issuance of preferred stock |
|
|
— |
|
|
|
— |
|
|
|
6,846 |
|
|
Proceeds from term loans |
|
|
— |
|
|
|
20,000 |
|
|
|
23,901 |
|
|
Repayments of term loans |
|
|
(930 |
) |
|
|
(625 |
) |
|
|
— |
|
|
Net proceeds from (repayments of) accounts receivable financing |
|
|
(5,385 |
) |
|
|
(2,472 |
) |
|
|
34,450 |
|
|
Proceeds from working capital loans |
|
|
15,813 |
|
|
|
11,690 |
|
|
|
19,120 |
|
|
Repayments of working capital loans |
|
|
(20,103 |
) |
|
|
(24,262 |
) |
|
|
(13,121 |
) |
|
Proceeds from subordinated debt arrangements |
|
|
— |
|
|
|
— |
|
|
|
15,000 |
|
|
Proceeds from (repayments of) other financing arrangements |
|
|
(4,765 |
) |
|
|
(2,777 |
) |
|
|
(2,130 |
) |
|
Proceeds from customer advances |
|
|
2,000 |
|
|
|
— |
|
|
|
4,500 |
|
|
Repayments of customer advances |
|
|
(2,000 |
) |
|
|
— |
|
|
|
— |
|
|
Debt issuance costs |
|
|
— |
|
|
|
(1,113 |
) |
|
|
(4,818 |
) |
|
Payment on acquisition of noncontrolling interest |
|
|
— |
|
|
|
(1,875 |
) |
|
|
(1,625 |
) |
|
Restricted cash |
|
|
(499 |
) |
|
|
(989 |
) |
|
|
1,898 |
|
|
Net cash provided by (used in) financing activities |
|
|
51,330 |
|
|
|
(2,423 |
) |
|
|
84,021 |
|
|
Impact of foreign exchange rates on cash and cash equivalents |
|
|
(1,515 |
) |
|
|
(330 |
) |
|
|
(43 |
) |
|
Net change in cash and cash equivalents |
|
|
73,149 |
|
|
|
2,325 |
|
|
|
31,837 |
|
|
Cash and cash equivalents, beginning of year |
|
|
45,917 |
|
|
|
43,592 |
|
|
|
11,755 |
|
|
Cash and cash equivalents, end of year |
|
$ |
119,066 |
|
|
$ |
45,917 |
|
|
$ |
43,592 |
|
|
Supplemental disclosures of cash flow information: |
|
|
|
|
|
|
|
|
|
|
|
|
|
Cash paid for interest |
|
$ |
11,126 |
|
|
$ |
9,439 |
|
|
$ |
6,343 |
|
|
Cash paid for income taxes, net |
|
|
8,506 |
|
|
|
3,087 |
|
|
|
547 |
|
|
Supplemental disclosures of noncash investing and financing activities: |
|
|
|
|
|
|
|
|
|
|
|
|
|
Conversion of subordinated convertible promissory notes into common stock |
|
|
11,877 |
|
|
|
— |
|
|
|
— |
|
|
Accrued capital expenditures in accounts payable |
|
|
2,664 |
|
|
|
1,860 |
|
|
|
1,980 |
|
|
Equipment acquired through capital lease and financing obligations |
|
|
10,011 |
|
|
|
5,004 |
|
|
|
7,381 |
|
|
Customer advances applied to accounts receivable |
|
|
— |
|
|
|
1,171 |
|
|
|
2,753 |
|
|
Debt refinance and related fees |
|
|
2,163 |
|
|
|
— |
|
|
|
36,099 |
|
See accompanying notes to consolidated financial statements.
F-7
TPI COMPOSITES, INC. AND SUBSIDIARIES
Notes to Consolidated Financial Statements
Note 1. Summary of Operations and Significant Accounting Policies
(a) Description of Business and Basis of Presentation
TPI Composites, Inc. is the holding company that conducts substantially all of its business operations through its direct and indirect subsidiaries (collectively, the Company). The Company was founded in 1968 and has been providing composite wind blades since 2001. The Company’s knowledge and experience of composite materials and manufacturing originates with its predecessor company, Tillotson Pearson Inc., a leading manufacturer of high-performance sail and powerboats along with a wide range of composite structures used in other industrial applications. Following the separation from the boat building business in 2004, the Company reorganized in Delaware as LCSI Holding, Inc. The Company changed its corporate name to TPI Composites, Inc. in 2008. Today, the Company is headquartered in Scottsdale, Arizona and has expanded its global footprint to include domestic facilities in Newton, Iowa; Fall River, Massachusetts; Warren, Rhode Island and Santa Teresa, New Mexico and international facilities in Dafeng, China; Taicang Port, China; Taicang City, China; Juárez, Mexico and Izmir, Turkey.
The Company divides its business operations into four geographic operating segments—the United States, Asia, Mexico and Europe, the Middle East and Africa (EMEA), as follows:
|
|
• |
The U.S. segment includes (1) the manufacturing of wind blades at the Newton, Iowa plant, (2) the manufacturing of precision molding and assembly systems used for the manufacture of wind blades at the Warren, Rhode Island facility, (3) the manufacturing of composite solutions for the transportation industry, which the Company also conducts at its Rhode Island and Massachusetts facilities and (4) its corporate headquarters, the costs of which are included in general and administrative expenses. |
|
|
• |
The Asia segment includes (1) the manufacturing of wind blades at the facility in Taicang Port, China and at its two facilities in Dafeng, China, (2) the manufacturing of precision molding and assembly systems at the Taicang City, China facility, (3) the manufacture of components at the second Taicang Port, China facility and (4) wind blade inspection and repair services. |
|
|
• |
The Mexico segment manufactures wind blades from its three facilities in Juárez, Mexico, one of which commenced operations in 2014, the second during the third quarter of 2016 and the third in January 2017. |
|
|
• |
The EMEA segment manufactures wind blades from its two facilities in Izmir, Turkey. The Company entered into a joint venture in 2012 to produce wind blades at the first Turkey plant and in 2013 became the sole owner of the Turkey operation with the acquisition of the remaining 25% interest. The EMEA segment commenced operations at its second facility during the third quarter of 2016. |
The accompanying consolidated financial statements include the accounts of TPI Composites, Inc. and all majority owned subsidiaries. All significant intercompany transactions and balances have been eliminated.
(b) Initial Public Offering and Stock Split
In July 2016, the Company completed an initial public offering (IPO) of 7,187,500 shares of its common stock at a price of $11.00 per share, which included 937,500 shares issued pursuant to the underwriters’ over-allotment option. Certain of the Company’s existing shareholders, a director and executive officers purchased an aggregate of 1,250,000 shares of common stock in the IPO included in the total issuance above. The net proceeds from the IPO were $67.2 million after deducting underwriting discounts and offering expenses. Immediately prior to the closing of the IPO, all shares of the then-outstanding redeemable preferred shares converted into an aggregate of 21,110,204 shares of common stock and the redeemable preferred share warrants converted on a net issuance basis into 120,923 shares of common stock. In addition, concurrent with the closing of the IPO, certain subordinated convertible promissory notes in the aggregate principal and interest amount of $11.9 million were converted into 1,079,749 shares of common stock at the public offering price of $11.00 per share.
Prior to the IPO, in July 2016 the Company amended its amended and restated certificate of incorporation to effect a 360-for-1 forward stock split of its common stock. As a result of the stock split, the Company has adjusted the share amounts authorized and issuable under the share-based compensation plans. All share and per share
F-8
TPI COMPOSITES, INC. AND SUBSIDIARIES
Notes to Consolidated Financial Statements
common stock information (including the share-based compensation plans) referenced throughout the consolidated financial statements and notes thereto have been retroactively adjusted to reflect this stock split. The stock split did not cause an adjustment to the par value of the authorized shares of common stock.
(c) Revenue Recognition
The Company records all sales of goods when a firm sales agreement is in place, delivery has occurred as defined by the sales contract, and collectability of the fixed or determinable sales price is reasonably assured. The basic criteria necessary for revenue recognition are: (1) evidence that a sales arrangement exists, (2) title and risk of loss have passed to the customer, (3) delivery of goods has occurred, (4) the seller’s price to the buyer is fixed or determinable and (5) collectability is reasonably assured. The Company recognizes revenue at the time of delivery to customers as all criteria necessary for revenue recognition have occurred at this point.
For multiple deliverable revenue arrangements, the Company allocates revenue to each element based on a selling price hierarchy. The selling price for a deliverable is based on its vendor specific objective evidence (VSOE) if available, third-party evidence (TPE) if VSOE is not available, or best estimated selling price (BESP) if neither VSOE nor TPE is available. The Company generally allocates revenue for each of the deliverables within multiple element arrangements through BESP using cost plus margin estimates prepared during contract negotiations and agreed upon sales price. The precision molding and assembly systems provided for in each customer’s contract are based upon the specific engineering requirements and design of the customer relative to the wind blade design and function desired. From the customer’s engineering specifications, a job cost estimate is developed along with a production plan, and margin is applied based on the location the work is to be performed, customer and complexity of the customer’s design. Precision molding and assembly systems are built to produce wind blades which are manufactured in production runs specified in the customer contract. To determine the appropriate accounting for recognition of revenue, the Company considers whether the deliverables specified in the multiple element arrangement should be treated as separate units of accounting, and, if so, how the price should be allocated among the elements, when to recognize revenue for each element, and the period over which revenue should be recognized. The Company also evaluates whether a delivered item has value on a stand-alone basis prior to delivery of the remaining items by determining whether the Company has made separate sales of such items or whether the undelivered items are essential to the functionality of the delivered items. Further, the Company assesses whether the fair value of the undelivered items is known, determined by reference to stand-alone sales of such items, if available, or BESP. As each of these items has stand-alone value to the customer, revenue from sales of wind blades and precision molding and assembly systems used in the production of composite products are recognized when those specific items are accepted by the customer as meeting the contractual technical specifications and delivered to the customer. Delivery of wind blades and precision molding and assembly systems generally takes place as defined in the contract at the facility where the precision molding and assembly systems are produced at which point the precision molding and assembly systems become exclusive property of the customer. The customer is generally then responsible for transportation and may transport the composite mold to its own or the Company’s wind blade production facility. Revenue related to engineering and freight services provided under customer contracts is recognized upon completion of the services being provided. Customers usually pay the cost of shipping associated with items produced directly to the carrier, but if paid by the Company, that cost is included in cost of goods sold and amounts invoiced for shipping and handling are included in revenue.
The Company’s customers may request, in situations where they do not have space available to receive products or do not want to take possession of products immediately for other reasons, that their finished composite products be stored by the Company in one of its facilities. The Company will bill for the components as allowed by the contract; however, revenue is deferred for financial reporting purposes until the Company delivers the finished composite product and all of the other requirements for revenue recognition have been met. Composite products that have been billed by the Company and continue to be stored by the Company at one of its facilities are included at net realizable value in inventory held for customer orders included on the consolidated balance sheets. Inventory held for customer orders is physically segregated from finished goods and is accounted for separately within the Company’s accounting records.
Wind blade pricing is based on annual commitments of volume as established in the customer’s contract with orders less than committed volume resulting in additional costs per wind blade to customers; however, orders in
F-9
TPI COMPOSITES, INC. AND SUBSIDIARIES
Notes to Consolidated Financial Statements
excess of annual commitments may, but generally do not, result in discounts to customers from the contracted price for the committed volume. Customers may utilize early payment discounts which are reported as a reduction of revenue at the time the discount is taken.
(d) Cost of Goods Sold
Cost of goods sold includes the costs associated with products invoiced during the period as well as unallocated manufacturing overhead costs associated with startup and transition costs. Cost of sales includes all costs incurred at the Company’s production facilities to make products saleable, such as raw materials, direct labor and indirect labor and facilities costs including purchasing and receiving costs, plant management, inspection costs, product engineering and internal transfer costs. In addition, all depreciation associated with assets used to produce composite products and make them saleable is included in cost of sales. Direct labor costs consist of salaries, benefits and other personnel related costs for employees engaged in the manufacture of the Company’s products.
Startup and transition costs represent the unallocated factory overhead relating to the transition of wind blade models at the request of the Company’s customers and startup costs related to new manufacturing facilities. The startup and transition costs are primarily fixed overhead costs, incurred during the period production facilities are under-utilized while transitioning wind blade models and ramping up manufacturing, that are not allocated to products and are expensed as incurred. The cost of sales for the initial wind blades from a new model manufacturing line is generally higher than when the line is operating at optimal production volume levels due to inefficiencies during ramp-up related to labor hours per blade, cycle times per blade and raw material usage. Additionally, manufacturing overhead as a percentage of net sales is generally higher during the period in which a facility is ramping up to full production capacity due to underutilization of the facility. Manufacturing overhead at each of the Company’s facilities includes virtually all indirect costs incurred at the plants, including engineering, finance, information technology, human resources and plant management.
(e) General and Administrative Expense
General and administrative expenses are primarily incurred at the Company’s corporate headquarters and research facilities and include salaries, benefits and other personnel related costs for employees engaged in research and development, engineering, finance, information technology, human resources, business development, global operational excellence, global supply chain, in-house legal and executive management. Other costs include outside legal and accounting fees, risk management (insurance), share-based compensation and certain other administrative and global resources costs. For the years ended December 31, 2016, 2015 and 2014, total research and development expenses (included in general and administrative expenses) totaled $1.5 million, $0.9 million and $0.8 million, respectively.
(f) Cash and Cash Equivalents and Restricted Cash
Cash and cash equivalents include highly liquid investments that are readily convertible to known amounts of cash with original maturities of three months or less. The carrying value of cash and cash equivalents approximates fair value.
As of December 31, 2016 and 2015, the Taicang plants had unrestricted cash of $8.3 million and $5.1 million, respectively, in bank accounts in China. As of December 31, 2016 and 2015, the Dafeng plant had unrestricted cash of $4.0 million and $0.2 million, respectively, in bank accounts in China. The Chinese government imposes certain restrictions on transferring cash out of China. The local governments in Turkey and Mexico impose no such restrictions on transferring cash out of the respective country. The Company has provided fully cash-collateralized letters of credit in connection with certain facility leases and with one of the Company’s workers’ compensation providers totaling $2.3 million and $1.8 million, respectively. These amounts are reported as restricted cash in the Company’s consolidated balance sheets. Also, as of December 31, 2016 and 2015, the Company maintained long-term deposits in interest bearing accounts, related to fully cash-collateralized letters of credit in connection with the facility leases at our Mexico locations and an equipment lessor in Iowa, totaling $8.5 million and $2.5 million, respectively. See Note 9, Other Noncurrent Assets.
F-10
TPI COMPOSITES, INC. AND SUBSIDIARIES
Notes to Consolidated Financial Statements
(g) Accounts Receivable
Trade accounts receivable are recorded at the invoiced amount and generally do not bear interest. The Company follows the allowance method of recognizing uncollectible accounts receivable, which recognizes bad debt expense based on a review of the individual accounts outstanding and prior history of uncollectible accounts receivable. Credit is extended based on evaluation of each customer’s financial condition and is generally unsecured. Accounts receivable are generally due within 30 days and are stated net of an allowance for doubtful accounts in the consolidated balance sheets. Accounts are considered past due if outstanding longer than contractual payment terms. The Company records an allowance based on consideration of a number of factors, including the length of time trade accounts are past due, previous loss history, the credit-worthiness of individual customers, economic conditions affecting specific customer industries, and economic conditions in general. The Company charges-off accounts receivable after all reasonable collection efforts have been exhausted. The Company credits payments subsequently received on such receivables to bad debt expense in the period payment is received. The Company records delinquent finance charges on outstanding accounts receivables only if they are collected. The Company wrote off $0.5 million during 2016 and did not write off any material amounts due during 2015 or 2014, and does not have any off-balance-sheet credit exposure related to its customers. See Note 4, Accounts Receivable.
(h) Inventories
Inventory is measured at the lower of cost or net realizable value. Net realizable value is defined as the estimated selling prices in the ordinary course of business, less reasonably predictable costs of completion, disposal, and transportation. Cost is determined using the first-in, first-out method for raw materials and specific identification for work in process and finished goods inventories. Actual cost includes the cost of materials, direct labor, and applied manufacturing overhead. Write-downs to reduce the carrying cost of obsolete, slow-moving, and unusable inventory to net realizable value are recognized in cost of goods sold. The effect of these write-downs establishes a new cost basis in the related inventory, which is not subsequently written up. See Note 5, Inventories.
(i) Property, Plant, and Equipment
Property, plant, and equipment are stated at cost. Depreciation and amortization of property, plant, and equipment is calculated on the straight-line method over the estimated useful lives of the assets. See Note 7, Property, Plant and Equipment, Net.
|
|
|
Estimated useful lives |
|
Machinery and equipment |
|
7–10 years |
|
Buildings |
|
20 years |
|
Leasehold improvements |
|
5 to 10 years, or the term of the lease, if shorter |
|
Office equipment and software |
|
3 to 5 years |
|
Furniture |
|
5 years |
|
Vehicles |
|
5 years |
(j) Recoverability of Long-Lived Assets
The Company reviews property, plant and equipment and other long-lived assets in order to assess recoverability based on expected future undiscounted cash flows whenever events or circumstances indicate that the carrying value may not be recoverable. If the sum of the expected future net cash flows is less than the carrying value, an impairment loss is recognized. The impairment loss is measured as the amount by which the carrying value exceeds the fair value of the asset.
F-11
TPI COMPOSITES, INC. AND SUBSIDIARIES
Notes to Consolidated Financial Statements
(k) Goodwill and Intangible Assets
Goodwill represents the excess of the acquisition cost of Composite Solutions, Inc. from True North Partners, LLC in 2004 over the fair value of identifiable assets acquired and liabilities assumed. Goodwill, which is entirely in the U.S. segment, is evaluated for impairment annually on October 31 and whenever events or circumstances make it likely that impairment may have occurred. In determining whether impairment has occurred, the Company uses a two-step approach. Step one compares the fair value of the related reporting unit (calculated using the discounted cash flow method) to its carrying value. If the carrying value exceeds the fair value, there is a potential impairment and step two must be performed. Step two compares the carrying value of the reporting unit’s goodwill to its implied fair value (i.e., fair value of reporting unit less the fair value of the unit’s assets and liabilities, including identifiable intangible assets). If the implied fair value of goodwill is less than the carrying amount of goodwill, impairment is recognized for that difference. The Company may first assess qualitative factors to determine whether it is necessary to perform the two-step quantitative goodwill impairment test. The Company performed its annual goodwill impairment test during 2016 and determined that it is more-likely-than-not that its fair value exceeds its carrying amount.
Intangible assets were acquired in a business acquisition and provide contractual or legal rights, or other future benefits that could be separately identified. The Company’s valuation of identified intangible assets was based upon discounted cash flow estimates that require significant management judgment with respect to revenue and expense growth rates, changes in working capital, and the selection and use of the appropriate discount rate. The intangible assets are amortized over their estimated useful life. Intangible assets with indefinite lives are evaluated at least annually for impairment or whenever events or circumstances make it likely that impairment may have occurred. See Note 8, Intangible Assets, Net.
(l) Warranty Expense
The Company provides a limited warranty for its mold and wind blade products, including parts and labor, with terms and conditions that vary depending on the product sold, for periods that range from two to five years. Warranty expense is recorded based upon estimates of future repairs using a probability-based methodology. Once the warranty period has expired, any remaining unused warranty accrual for the specific products is reversed against the current year warranty expense amount. See Note 10, Accrued Warranty.
(m) Foreign Currency Translation Adjustments
The reporting currency of the Company is the U.S. dollar. However, the Company has non-U.S. operating segments in Mexico, Turkey and China.
|
|
• |
The U.S. parent companies of the three Mexico operations, each of which are wholly-owned subsidiaries of TPI Composites, Inc., maintain their books and records in U.S. dollars. |
|
|
• |
The Mexico operations maintain their books and records through multiple legal entities that are denominated in the local Mexican currency, the Peso. |
|
|
• |
The Turkey operations maintain their books and records in the local Turkish currency, the Lira. |
|
|
• |
TPI China, LLC, the U.S. parent company of the China operations and a wholly-owned subsidiary of TPI Composites, Inc., maintains its books and records in U.S. dollars. |
|
|
• |
The Taicang Port, Dafeng and Taicang City operations maintain their books and records in the local Chinese currency, the Renminbi. |
Foreign currency-denominated assets and liabilities are translated into U.S. dollars at exchange rates existing at the respective balance sheet dates. Results of operations of foreign subsidiaries are translated at the average exchange rates during the respective periods. Foreign currency transaction gains and losses are reported in realized gain (loss) on foreign currency remeasurement in the Company’s consolidated statements of operations. Translation adjustments are reported in accumulated other comprehensive income (loss) in the Company’s consolidated balance sheets. Currency translation adjustments for the years ended December 31, 2016, 2015 and 2014 amounted to losses of $3.8 million, $2.4 million and $0.1 million, respectively.
F-12
TPI COMPOSITES, INC. AND SUBSIDIARIES
Notes to Consolidated Financial Statements
The Company maintains two active incentive compensation plans: the 2008 Stock Option and Grant Plan and the Amended and Restated 2015 Stock Option and Incentive Plan (the 2015 Plan). In May 2015, the Company’s board of directors and shareholders adopted and approved the 2015 Plan, which provides for the issuance of incentive stock options, non-qualified stock options, stock appreciation rights, restricted stock units, restricted stock awards, unrestricted stock awards, cash-based awards, performance share awards and dividend equivalent rights to certain employees, non-employee directors and consultants. The term of stock options issued under the 2015 Plan may not exceed ten years from the date of grant. Under the 2015 Plan, incentive stock options and non-qualified stock options are granted at an exercise price that is not to be less than 100% of the fair market value of the common stock of the Company on the date of grant, as determined by the Compensation Committee of the board of directors. Stock options become vested and exercisable at such times and under such conditions as determined by the Compensation Committee on the date of grant. Upon approval of the 2015 Plan, no future grants will be made from the 2008 Stock Option and Grant Plan.
The Company measures share-based compensation expense for stock options using the estimated fair value of the related award on the date of grant using the Black-Scholes valuation model as of the grant date using the following assumptions:
Expected Volatility. As the Company’s common stock had not been publicly traded prior to July 2016, the expected volatility assumption reflects an average of volatilities of publicly traded peer group companies with a period equal to the expected life of the options.
Expected Life (years). The Company uses the simplified method to estimate the expected term of stock options. The simplified method for estimating expected term is to use the mid-point between the vesting term and the contractual term of the option. The Company elected to use the simplified method because it did not have historical exercise data to estimate the expected term due to the limited time period its common stock had been publicly traded.
Risk-Free Interest Rate. The risk-free interest rate assumption is based upon the U.S. constant maturity treasury rates as the risk-free rate interpolated between the years commensurate with the expected life of the options.
Dividend Yield. The dividend yield assumption is zero since the Company does not expect to declare or pay dividends in the foreseeable future.
Expected Vesting Period. The Company amortizes the share-based compensation expense over the requisite service period.
Share-based compensation expense related to restricted stock units is expensed over the vesting period using the straight-line method for Company employees and the Company’s board of directors. The restricted stock units do not have voting rights. The Company calculates the fair value of share-based awards on the date of grant for employees and directors. The Company calculates the fair value of share-based awards to consultants on the date of vesting. Forfeitures are estimated at the time of grant and revised in subsequent periods if actual forfeitures differ from those estimates.
(o) Leases
Leases are classified as either operating leases or capital leases. Assets acquired under capital leases are amortized on the same basis as similar property, plant and equipment. Rental payments, including rent holidays, leasehold incentives, and scheduled rent increases are expensed on a straight-line basis. Leasehold improvements are amortized over the shorter of the depreciable lives of the corresponding fixed assets or the lease term including any applicable renewals.
F-13
TPI COMPOSITES, INC. AND SUBSIDIARIES
Notes to Consolidated Financial Statements
(p) Debt Issuance Costs and Discount
Costs associated with the issuance of debt and debt issuance discounts are presented net of the related debt and are amortized over the term of the debt using the effective interest rate method. See Note 1, Summary of Operations and Significant Accounting Policies – (u) Recently Issued Accounting Pronouncements for more details.
(q) Income Taxes
Income taxes are accounted for under the asset and liability method in accordance with Financial Accounting Standards Board (FASB) Accounting Standard Codification (ASC) Topic 740, Income Taxes. Deferred tax assets and liabilities are measured using enacted tax rates expected to apply to taxable income in the years in which those differences are projected to be recovered or settled. Realization of deferred tax assets is dependent on the Company’s ability to generate sufficient taxable income of an appropriate character in future periods. A valuation allowance is established if it is determined to be more-likely-than-not that a deferred tax asset will not be realized. Interest and penalties related to unrecognized tax benefits are reported in income tax expense, See Note 17, Income Taxes.
(r) Net Income Per Share Calculation
The basic net income per common share is computed by dividing the net income by the weighted-average number of common shares outstanding during a period. Diluted net income per common share is computed by dividing the net income, adjusted on an as-if-converted basis, by the weighted-average number of common shares outstanding plus potentially dilutive securities. The table below reflects the calculation of the weighted-average number of common shares outstanding, on an as if converted basis, used in computing basic and diluted earnings per common share for the years ended December 31 (in thousands):
|
|
|
2016 |
|
|
2015 |
|
|
2014 |
|
|||
|
Basic weighted-average shares outstanding |
|
|
17,530 |
|
|
|
4,238 |
|
|
|
4,238 |
|
|
Effect of dilutive stock options and warrants |
|
|
86 |
|
|
|
— |
|
|
|
— |
|
|
Diluted weighted-average shares outstanding |
|
|
17,616 |
|
|
|
4,238 |
|
|
|
4,238 |
|
The Company did not have potential dilutive securities that are not shown in the diluted net income per share calculation for the year ended December 31, 2016. The Company had potentially dilutive securities of 4,571,007 outstanding for each of the years ended December 31, 2015 and 2014 that are not shown in the diluted net loss per share calculation because their effect would be anti-dilutive. The potentially dilutive securities excluded from the calculation include common shares issued upon conversion or exercise of options and warrants.
Assuming that the IPO had occurred on January 1, 2014, diluted earnings per share would have been $0.41, $0.23 and a loss of $0.20 for the years ended December 31, 2016, 2015 and 2014, respectively.
(s) Use of Estimates
The preparation of consolidated financial statements in conformity with U.S. generally accepted accounting principles (GAAP) requires management to make estimates and assumptions that affect the reported amounts of assets and liabilities and disclosure of contingent assets and liabilities at the date of the consolidated financial statements and the reported amounts of revenues and expenses during the reporting period. Actual results could differ from those estimates. Significant items subject to such estimates and assumptions include the useful lives of property, plant, and equipment, realizability of intangible assets and deferred tax assets, inventory valuation, relative selling prices for revenue recognition, fair value of stock options and warrants, warranty reserves and other contingencies.
(t) Fair Value of Financial Instruments
FASB ASC Topic 820, Fair Value Measurements, defines fair value as the price that would be received to sell an asset or paid to transfer a liability in an orderly transaction between market participants at the measurement date.
F-14
TPI COMPOSITES, INC. AND SUBSIDIARIES
Notes to Consolidated Financial Statements
Topic 820 also specifies a fair value hierarchy that requires an entity to maximize the use of observable inputs and minimize the use of unobservable inputs when measuring fair value. The standard describes three levels of inputs that may be used to measure fair value is follows:
Level 1: Quoted prices in active markets for identical assets or liabilities;
Level 2: Observable inputs other than Level 1 prices, such as quoted prices for similar assets or liabilities; quoted prices in markets that are not active; or other inputs that are observable or can be corroborated by observable market data for substantially the full term of the assets or liabilities; and
Level 3: Valuation is generated from model-based techniques that use significant assumptions not observable in the market. These unobservable assumptions reflect the Company’s own estimate of assumptions that market participants would use in pricing the asset or liability.
The carrying amounts of cash and cash equivalents, trade accounts receivable, income taxes receivable, accounts payable and accrued expenses and income taxes payable approximate fair value because of the short-term nature of these financial instruments. The carrying amount of working capital loans approximates fair value due to their short term nature and the loans carry a current market rate of interest, a level 2 input. The carrying value of long-term debt approximates fair value based on its variable rate index or based upon market interest rates available to the Company for debt of similar risk and maturities, both of which are level 2 inputs.
(u) Recently Issued Accounting Pronouncements
Simplifying the Presentation of Debt Issuance Costs
In April 2015, the FASB issued Accounting Standards Update (ASU) 2015-03, Simplifying the Presentation of Debt Issuance Costs. ASU 2015-03 required that debt issuance costs related to a recognized debt liability be presented in the balance sheet as a direct deduction from the carrying amount of that debt liability, consistent with debt discounts. ASU 2015-03 was effective for the first interim period for fiscal years beginning after December 15, 2015. Consequently, during the three months ended March 31, 2016, the Company adopted ASU 2015-03 on a retrospective basis, which resulted in the reclassification of the noncurrent debt issuance cost asset on the December 31, 2015 consolidated balance sheet, which decreased total assets by $4.2 million and decreased total liabilities from $326.5 million to $322.3 million, to conform to the current presentation. The adoption of this guidance did not have a material impact on the financial condition, results of operations or disclosures of the Company. See Note 13, Long Term Debt, Net of Debt Issuance Costs and Discount.
Revenue from Contracts with Customers
In May 2014, the FASB issued Accounting Standards Update (ASU) 2014-09, Revenue from Contracts with Customers, (Topic 606), which provides new recognition and disclosure requirements for revenue from contracts with customers that supersedes the existing revenue recognition guidance. The new recognition requirements focus on when the customer obtains control of the goods or services, rather than the current risks and rewards model of recognition. The core principle of the new standard is that an entity will recognize revenue when it transfers goods or services to its customers in an amount that reflects the consideration an entity expects to be entitled to for those goods or services. The new disclosure requirements will include information intended to communicate the nature, amount, timing and any uncertainty of revenue and cash flows from the applicable contracts, including any significant judgments and changes in judgments and assets recognized from the costs to obtain or fulfill a contract. Entities will generally be required to make more estimates and use more judgment under the new standard.
The new requirements are effective for the Company beginning January 1, 2018, and may be implemented either retrospectively for all periods presented, or as a cumulative-effect adjustment as of the date of adoption.
The Company expects to adopt Topic 606 as of January 1, 2018 with retrospective application to January 1, 2016 through December 31, 2017. Based on the Company’s preliminary evaluation of the new standard, revenue recognition in accordance with Topic 606 differs from the current guidance provided by GAAP as outlined in the
F-15
TPI COMPOSITES, INC. AND SUBSIDIARIES
Notes to Consolidated Financial Statements
SEC’s Staff Accounting Bulletin 104, which requires the Company to defer recognition of revenue until the risk of loss has passed to the customer and delivery has been made or a fixed delivery schedule has been provided by the customer. Since the Company’s products have no alternative use to the Company due to contractual restrictions placed by each customer on the technical specifications and design of the products, the Company’s preliminary assessment is that revenue upon adoption of Topic 606 will likely be recognized over time during the course of the production process and before the product is delivered to the customer.
The Company expects that the adoption of Topic 606 will have a material impact on the amount of net sales, cost of goods sold and income from operations reported in the Consolidated Statements of Operations in future periods. In accordance with Topic 606, revenues will be recognized over the time period of the production process, whereas currently it is recognized upon delivery to the client. Further, since revenue will be recognized over time for manufacturing contracts, future net sales will include amounts related to products that are in production as of the period end. Finally, the gross margin realized in the period may be impacted by the changes related to the timing and amount of revenue recognized for products in the production process.
The changes noted above involving the timing of revenue recognition will materially impact the amount of reported assets and liabilities associated with our manufacturing contracts. Upon adoption of Topic 606, the Company will include amounts recognized in revenue for products in production in contract assets, which differs from the current practice of including the balances in inventory and will include an amount for the margin recognized to date. The Company believes that it will no longer report inventory held for customer orders since revenue will be recognized over time during the course of the production process and before the product is delivered to the customer. Contract liabilities will be reported for amounts collected from customers in advance of the production of products. The amount of deferred revenue will be substantially reduced as revenue for products will be recognized over time.
The Company does not anticipate a change in the timing of cash receipts and payments from customers as customers will continue to be invoiced as products are completed; however, the impact to the amounts reported in the statements of cash flows operating activities upon application of Topic 606 is expected to be material.
The Company has a project plan in place for the transition to revenue recognition in accordance with Topic 606 including necessary changes to accounting processes and procedures, the chart of accounts, the system of internal control and retrospective application of the standard to periods beginning January 1, 2016 through December 31, 2017. The Company expects to complete the plan in time to report in accordance with Topic 606 for the first quarterly filing on Form 10-Q for the period ended March 31, 2018.
Share-Based Compensation
In March 2016, the FASB issued ASU 2016-09, Compensation - Stock Compensation (Topic 718) - Improvements to Employee Share-Based Payment Accounting. ASU 2016-09 is intended to simplify several areas of accounting for share-based compensation arrangements, including the income tax impact, classification on the statement of cash flows and forfeitures. This standard is effective for annual and interim periods beginning after December 15, 2016. Early adoption is permitted. The adoption of ASU 2016-09 on January 1, 2017 will not have a material effect on the Company’s financial positions or results of operations.
Leases
In February 2016, the FASB issued ASU 2016-02, Leases, (Topic 842). ASU 2016-02 is a comprehensive new recognition model for leases requiring a lessee to recognize the asset and liability that arise from leases. For public companies, the amendment is effective for financial statements issued for annual periods beginning after December 16, 2018. Entities may elect to early adopt the lease standard in 2016. In adopting ASU 2016-02, entities are required to recognize and measure leases at the beginning of the earliest period presented using a modified retrospective approach. The modified retrospective approach includes a number of optional practical expedients that entities may elect to apply. Management is evaluating the provisions of ASU 2016-02 and has not yet selected a transition method nor determined what impact the adoption of ASU 2016-02 will have on the Company’s financial position or results of operations.
F-16
TPI COMPOSITES, INC. AND SUBSIDIARIES
Notes to Consolidated Financial Statements
In June 2016, the FASB issued ASU 2016-13, Financial Instruments – Credit Losses: Measurement of Credit Losses on Financial Instruments. ASU 2016-13 revises the accounting requirements related to the measurement of credit losses on financial instruments and the timing of when such losses are recorded. ASU 2016-13 is effective for fiscal years, and interim periods within those years, beginning after December 15, 2019. Early adoption is permitted for fiscal years and interim periods within those years, beginning after December 15, 2018. Accordingly, ASU 2016-13 is effective for the Company on January 1, 2020 using a modified retrospective approach, and the Company is currently evaluating the impact that the standard will have on the Company’s financial positions and results of operations.
There have been no other recent accounting pronouncements or changes in accounting pronouncements during the current year that are of significance, or potential significance, to the Company.
Note 2. Significant Risks and Uncertainties
The Company’s revenues and receivables are from a small number of customers. As such, the Company’s production levels are dependent on these customers’ orders. See Note 18, Concentration of Customers.
The Company maintains its U.S. cash in bank deposit accounts that, at times, exceed U.S. federally insured limits. U.S. bank accounts are guaranteed by the Federal Deposit Insurance Corporation (FDIC) in an amount up to $250,000 during 2016 and 2015. At December 31, 2016 and 2015, the Company had $103.4 million and $33.2 million, respectively, of cash in deposit accounts in high quality U.S. banks, which was in excess of FDIC limits. The Company has not experienced losses in any such accounts.
The Company also maintains cash in bank deposit accounts outside the U.S. with no insurance. At December 31, 2016, this includes $2.5 million in Turkey, $12.3 million in China and $0.9 million in Mexico. The Company has not experienced losses in these accounts. The Company also has long-term deposits in interest bearing accounts of $8.1 million in Mexico. See Note 9, Other Noncurrent Assets.
Note 3. Related-Party Transactions
Related party transactions include transactions between the Company and certain of its affiliates. The following transactions were in the normal course of operations and were measured at the exchange amount, which is the amount of consideration established and agreed to by the parties.
The Company has historically entered into several agreements with subsidiaries of General Electric Company and its consolidated affiliates (GE) relating to the operation of its business. As a result of these agreements, GE has been a debtor, creditor, holder of preferred shares and now a holder of common shares.
The Company has entered into five separate supply agreements with GE to manufacture wind blades in Newton, Iowa; Taicang Port, China; Juárez, Mexico (2) and Izmir, Turkey. As a result of the supply agreements, GE is the Company’s largest customer. As disclosed at note 18, Concentration of Customers, for the years ended December 31, 2016, 2015 and 2014, the Company recorded related-party sales with GE of $379.9 million, $312.5 million and $234.8 million, respectively. As of December 31, 2016 and 2015, the Company had accounts receivables related to sales to GE of approximately $16.6 million and $19.0 million, respectively.
Since 2007, the Company had issued multiple series of preferred shares, including several preferred share issuances to GE. Immediately prior to the closing of the IPO, all shares of the then-outstanding preferred shares were converted into shares of common stock. As a result of these transactions, GE owns 8.4% of the Company’s outstanding common stock as of December 31, 2016. See Note 14, Convertible and Senior Redeemable Preferred Shares and Warrants.
In January 2016, the Company entered into an agreement with GE and received an advance of $2.0 million, which the Company repaid in full in August 2016. See Note 11, Customer Deposits and Customer Advances.
F-17
TPI COMPOSITES, INC. AND SUBSIDIARIES
Notes to Consolidated Financial Statements
Certain of the Company’s existing stockholders, consisting of entities associated with Element Partners, Angeleno Group and Landmark Partners, each of which is an affiliate of a member of the board of directors, as well as certain executive officers and a director, purchased an aggregate of 1,250,000 shares of common stock in the IPO. In addition, all outstanding obligations under the Company’s subordinated convertible promissory notes, including accrued interest, held by certain existing stockholders, including Element Partners, Angeleno Group and Landmark Partners, were converted into an aggregate of 1,079,749 shares of common stock concurrent with the closing of the IPO at the public offering price of $11.00 per share.
Note 4. Accounts Receivable
Accounts receivable at December 31 consisted of the following (in thousands):
|
|
|
2016 |
|
|
2015 |
|
||
|
Trade accounts receivable |
|
$ |
66,612 |
|
|
$ |
71,588 |
|
|
Other accounts receivable |
|
|
1,230 |
|
|
|
1,325 |
|
|
Total accounts receivable |
|
$ |
67,842 |
|
|
$ |
72,913 |
|
Note 5. Inventories
Inventories at December 31 consisted of the following (in thousands):
|
|
|
2016 |
|
|
2015 |
|
||
|
Raw materials |
|
$ |
29,278 |
|
|
$ |
29,022 |
|
|
Work in process |
|
|
21,169 |
|
|
|
16,630 |
|
|
Finished goods |
|
|
2,648 |
|
|
|
5,189 |
|
|
Total Inventories |
|
$ |
53,095 |
|
|
$ |
50,841 |
|
Note 6. Prepaid Expenses and Other Current Assets
Prepaid expenses and other current assets at December 31 consisted of the following (in thousands):
|
|
|
2016 |
|
|
2015 |
|
||
|
Refundable value-added tax |
|
$ |
5,229 |
|
|
$ |
12,052 |
|
|
Prepaid customs and duty charges |
|
|
8,289 |
|
|
|
5,891 |
|
|
Deposits |
|
|
8,135 |
|
|
|
3,140 |
|
|
Deferred expenses |
|
|
— |
|
|
|
2,807 |
|
|
Prepaid rebates |
|
|
519 |
|
|
|
523 |
|
|
Other prepaid expenses |
|
|
8,130 |
|
|
|
5,531 |
|
|
Other current assets |
|
|
355 |
|
|
|
1,393 |
|
|
Total prepaid expenses and other current assets |
|
$ |
30,657 |
|
|
$ |
31,337 |
|
F-18
TPI COMPOSITES, INC. AND SUBSIDIARIES
Notes to Consolidated Financial Statements
Note 7. Property, Plant, and Equipment, Net
Property, plant, and equipment, net at December 31 consisted of the following (in thousands):
|
|
|
2016 |
|
|
2015 |
|
||
|
Machinery and equipment |
|
$ |
70,481 |
|
|
$ |
49,078 |
|
|
Buildings |
|
|
13,449 |
|
|
|
14,047 |
|
|
Leasehold improvements |
|
|
16,818 |
|
|
|
14,259 |
|
|
Office equipment and software |
|
|
6,403 |
|
|
|
3,691 |
|
|
Furniture |
|
|
15,883 |
|
|
|
15,140 |
|
|
Vehicles |
|
|
342 |
|
|
|
279 |
|
|
Construction in progress |
|
|
11,592 |
|
|
|
4,660 |
|
|
Total |
|
|
134,968 |
|
|
|
101,154 |
|
|
Accumulated depreciation |
|
|
(43,802 |
) |
|
|
(33,422 |
) |
|
Property, plant and equipment, net |
|
$ |
91,166 |
|
|
$ |
67,732 |
|
As of December 31, 2016, the Company had undertaken projects including the construction and outfitting of its second and third wind blade production facilities in Juárez, Mexico, facility improvements to certain of our wind blade production facilities, as well as the purchase of equipment and machinery across all facilities and the Corporate office.
Total depreciation for the years ended December 31, 2016, 2015 and 2014 was $12.7 million, $10.6 million and $6.7 million, respectively.
As of December 31, 2016, the cost and accumulated depreciation of property, plant and equipment that the Company is leasing under capital lease arrangements is $23.4 million and $4.4 million, respectively. As of December 31, 2015, the cost and accumulated depreciation of property, plant and equipment that the Company is leasing under capital lease arrangements is $13.8 million and $2.4 million, respectively.
Note 8. Intangible Assets, Net
Carrying values and estimated useful lives of intangible assets as of December 31, 2016, consisted of the following (in thousands):
|
|
|
Estimated Useful Life |
|
Cost |
|
|
Accumulated Amortization |
|
|
Net |
|
|||
|
Patents |
|
13 years |
|
$ |
2,000 |
|
|
$ |
(1,885 |
) |
|
$ |
115 |
|
|
Trademarks |
|
Indefinite |
|
|
150 |
|
|
|
— |
|
|
|
150 |
|
|
|
|
|
|
$ |
2,150 |
|
|
$ |
(1,885 |
) |
|
$ |
265 |
|
Carrying values and estimated useful lives of intangible assets as of December 31, 2015, consisted of the following (in thousands):
|
|
|
Estimated Useful Life |
|
Cost |
|
|
Accumulated Amortization |
|
|
Net |
|
|||
|
Patents |
|
13 years |
|
$ |
2,000 |
|
|
$ |
(1,731 |
) |
|
$ |
269 |
|
|
Customer agreements |
|
3 years 9 months |
|
|
2,328 |
|
|
|
(2,328 |
) |
|
|
— |
|
|
Trademarks |
|
Indefinite |
|
|
150 |
|
|
|
— |
|
|
|
150 |
|
|
|
|
|
|
$ |
4,478 |
|
|
$ |
(4,059 |
) |
|
$ |
419 |
|
The weighted-average remaining amortization period for the Company’s amortizable intangible assets is approximately 0.7 years and thus the amortizable intangible assets will be fully-amortized by December 31, 2017. During the years ended December 31, 2016, 2015 and 2014, the Company recorded amortization expense of $0.2 million, $0.8 million and $0.8 million, respectively.
F-19
TPI COMPOSITES, INC. AND SUBSIDIARIES
Notes to Consolidated Financial Statements
Note 9. Other Noncurrent Assets
Other noncurrent assets at December 31 consisted of the following (in thousands):
|
|
|
2016 |
|
|
2015 |
|
||
|
Restricted cash |
|
$ |
8,538 |
|
|
$ |
2,537 |
|
|
Deferred tax assets |
|
|
5,131 |
|
|
|
1,661 |
|
|
Land use right |
|
|
1,648 |
|
|
|
1,796 |
|
|
Deposits |
|
|
2,422 |
|
|
|
486 |
|
|
Other |
|
|
2 |
|
|
|
120 |
|
|
Total other noncurrent assets |
|
$ |
17,741 |
|
|
$ |
6,600 |
|
As of December 31, 2016 and 2015, the Company maintained long-term deposits in interest bearing accounts, related to fully cash-collateralized letters of credit in connection with the facility leases at its Mexico locations, totaling $8.1 million and $2.1 million, respectively. The Company has also provided a fully cash-collateralized letter of credit in connection with an equipment lessor in Iowa totaling $0.4 million as of December 31, 2016 and 2015.
As a result of the refinancing of our previous credit facility, in the first quarter of 2017 $8.1 million of long-term deposits in interest bearing accounts, related to fully cash-collateralized letters of credit, were returned to the Company and applied against its letter of credit sub-facility under the Amended Credit Facility.
The land use right was purchased during 2007 and permits the Company to use the land where the Taicang Port, China facility, owned by the Company, is situated. The Company is amortizing the land use right on a straight-line basis over its 50 year life. Amortization of the land use right began upon the opening of the plant in 2008.
Note 10. Accrued Warranty
Warranty accrual at December 31 consisted of the following (in thousands):
|
|
|
2016 |
|
|
2015 |
|
|
2014 |
|
|||
|
Warranty accrual at beginning of year |
|
$ |
13,596 |
|
|
$ |
5,916 |
|
|
$ |
3,748 |
|
|
Accrual during the year |
|
|
18,886 |
|
|
|
10,653 |
|
|
|
3,211 |
|
|
Cost of warranty services provided during the year (1) |
|
|
(10,808 |
) |
|
|
(1,349 |
) |
|
|
(548 |
) |
|
Reduction of reserves |
|
|
(1,762 |
) |
|
|
(1,624 |
) |
|
|
(495 |
) |
|
Warranty accrual at end of year |
|
$ |
19,912 |
|
|
$ |
13,596 |
|
|
$ |
5,916 |
|
|
(1) |
The 2016 amount includes an 8.0 million Euro ($8.5 million) payment related to the Nordex settlement agreement. |
Note 11. Customer Deposits and Customer Advances
The Company regularly enters into contracts for the production of composite structures that require the purchase of raw materials specific to the customers’ orders. As such, the Company may require that customers pay a deposit prior to the beginning of production. The customer deposits are recorded as current liabilities in the consolidated balance sheets and are reduced as the Company invoices its customers for work performed or the products are delivered. As of December 31, 2016 and 2015, the Company had customer deposits of $1.4 million and $8.9 million, respectively.
The Company may receive customers advances used to assist with the cash required for the transition and startup of operations at facilities. Interest on these advances is imputed and a discount is recorded on the customer advances. The rate used approximates that which the Company estimates it could have received if financed from
F-20
TPI COMPOSITES, INC. AND SUBSIDIARIES
Notes to Consolidated Financial Statements
third parties. The discount is recorded as deferred revenue and recognized as net sales on a straight-line basis over the term of the supply agreements with the customer.
In 2014, the Company’s Mexico segment received aggregate advance payments of $2.0 million as well as manufacturing equipment valued at $0.8 million from one of its customers to help fund the startup of the plant in Mexico. The agreement, as amended later in 2014, required the Company to repay the advance payments and equipment cost without interest, through future credits against a specified number of products sold to the customer during 2014 and 2015. For the year ended December 31, 2015, the remaining balance of $1.2 million was repaid through credits.
In January 2016, the Company entered into an agreement with GE and received an advance of $2.0 million, which the Company repaid in full in August 2016. See Note 3, Related-Party Transactions.
Note 12. Share-Based Compensation
The Company has granted awards of stock options and restricted stock units (RSUs) in 2016 and 2015 to certain employees and non-employee directors under the Amended and Restated 2015 Stock Option and Incentive Plan. Each award granted prior to the consummation of the Company’s IPO included a performance condition that required the completion of an initial public offering by the Company and a required vesting period of one to four years commencing upon achievement of the performance condition. As the IPO was consummated in July 2016, the Company began recording compensation expense in July 2016 for the requisite service period from the grant date through the IPO date with the balance of the share-based compensation to be expensed over the remaining vesting period. No share-based compensation awards were granted in 2014.
Total share-based compensation expense recognized during the year ended December 31, 2016 was $9.9 million. Upon completion of the IPO and the achievement of the performance condition, the Company was required to record share-based compensation expense for the requisite service period from the grant date which included approximately $3.6 million related to the portion of the service period from the grant date through December 31, 2015. Of the $9.9 million expense, $1.5 million is included in cost of goods sold and the remaining $8.4 million included in general and administrative expenses. The amount recorded related to RSUs was $3.5 million while $6.4 million related to stock options. No share-based compensation expense was recorded during the years ended December 31, 2015 or 2014 and no share-based compensation costs were capitalized during 2016, 2015 or 2014.
F-21
TPI COMPOSITES, INC. AND SUBSIDIARIES
Notes to Consolidated Financial Statements
The summary of activity for the Company’s incentive plans is as follows:
|
|
|
|
|
|
|
Stock Options |
|
|
RSUs |
|
||||||||||||||
|
|
|
Shares Available for Grant |
|
|
Shares |
|
|
Weighted- Average Exercise Price |
|
|
Options Exercisable |
|
|
Shares |
|
|
Weighted- Average Grant Date Fair Value |
|
||||||
|
Balance as of December 31, 2013 |
|
|
1,550,990 |
|
|
|
35,703 |
|
|
$ |
8.49 |
|
|
|
34,560 |
|
|
|
— |
|
|
$ |
— |
|
|
Granted |
|
|
— |
|
|
|
— |
|
|
|
— |
|
|
|
|
|
|
|
— |
|
|
|
— |
|
|
Exercised |
|
|
— |
|
|
|
— |
|
|
|
— |
|
|
|
|
|
|
|
— |
|
|
|
— |
|
|
Forfeited/cancelled (1) |
|
|
(518,040 |
) |
|
|
— |
|
|
|
— |
|
|
|
|
|
|
|
— |
|
|
|
— |
|
|
Balance as of December 31, 2014 |
|
|
1,032,950 |
|
|
|
35,703 |
|
|
|
8.49 |
|
|
|
35,703 |
|
|
|
— |
|
|
|
— |
|
|
Increase in shares authorized |
|
|
6,317,031 |
|
|
|
— |
|
|
|
— |
|
|
|
|
|
|
|
— |
|
|
|
— |
|
|
Granted |
|
|
(4,001,040 |
) |
|
|
3,269,160 |
|
|
|
11.92 |
|
|
|
|
|
|
|
731,880 |
|
|
|
10.89 |
|
|
Exercised/vested |
|
|
— |
|
|
|
— |
|
|
|
— |
|
|
|
|
|
|
|
— |
|
|
|
— |
|
|
Forfeited/cancelled |
|
|
43,200 |
|
|
|
(43,200 |
) |
|
|
10.87 |
|
|
|
|
|
|
|
— |
|
|
|
— |
|
|
Balance as of December 31, 2015 |
|
|
3,392,141 |
|
|
|
3,261,663 |
|
|
|
11.90 |
|
|
|
35,703 |
|
|
|
731,880 |
|
|
|
10.89 |
|
|
Increase in shares authorized |
|
|
169,546 |
|
|
|
— |
|
|
|
— |
|
|
|
|
|
|
|
— |
|
|
|
— |
|
|
Granted |
|
|
(493,990 |
) |
|
|
493,990 |
|
|
|
17.37 |
|
|
|
|
|
|
|
— |
|
|
|
— |
|
|
Exercised/vested |
|
|
— |
|
|
|
— |
|
|
|
— |
|
|
|
|
|
|
|
— |
|
|
|
— |
|
|
Forfeited/cancelled |
|
|
519,995 |
|
|
|
(424,235 |
) |
|
|
11.78 |
|
|
|
|
|
|
|
(95,760 |
) |
|
|
10.87 |
|
|
Balance as of December 31, 2016 |
|
|
3,587,692 |
|
|
|
3,331,418 |
|
|
|
12.72 |
|
|
|
25,828 |
|
|
|
636,120 |
|
|
|
10.90 |
|
|
(1) |
Relates to shares previously available under the 2004 Long-Term Incentive Plan, which expired in September 2014. |
The following table summarizes the outstanding and exercisable stock option awards as of December 31, 2016:
|
|
|
Options Outstanding |
|
|
Options Exercisable |
|
||||||||||||||
|
Range of Exercise Prices: |
|
Shares |
|
|
Weighted- Average Remaining Contractual Life (in years) |
|
|
Weighted- Average Exercise Price |
|
|
Shares |
|
|
Weighted- Average Exercise Price |
|
|||||
|
$8.49 |
|
|
25,828 |
|
|
|
3.0 |
|
|
$ |
8.49 |
|
|
|
25,828 |
|
|
$ |
8.49 |
|
|
$10.87 |
|
|
2,278,800 |
|
|
|
8.4 |
|
|
|
10.87 |
|
|
|
— |
|
|
|
— |
|
|
$11.00 to $14.31 |
|
|
79,200 |
|
|
|
9.6 |
|
|
|
12.50 |
|
|
|
— |
|
|
|
— |
|
|
$16.53 |
|
|
604,800 |
|
|
|
9.0 |
|
|
|
16.53 |
|
|
|
— |
|
|
|
— |
|
|
$17.68 to $18.70 |
|
|
342,790 |
|
|
|
9.4 |
|
|
|
18.68 |
|
|
|
— |
|
|
|
— |
|
|
$8.49 to $18.70 |
|
|
3,331,418 |
|
|
|
8.6 |
|
|
|
12.72 |
|
|
|
25,828 |
|
|
|
8.49 |
|
The following table contains additional information pertaining to stock options for the years ended December 31 (in thousands);
|
|
|
2016 |
|
|
2015 |
|
|
2014 |
|
|||
|
Total intrinsic value of stock options outstanding |
|
$ |
12,251 |
|
|
$ |
34,388 |
|
|
$ |
330 |
|
|
Total intrinsic value of stock options exercisable |
|
|
195 |
|
|
|
498 |
|
|
|
330 |
|
|
Fair value of stock options vested |
|
|
— |
|
|
|
— |
|
|
|
10 |
|
As of December 31, 2016, the unamortized cost of the outstanding RSUs was $2.8 million, which the Company expects to recognize in the consolidated financial statements over a weighted-average period of approximately 1.8 years. The total unrecognized cost related to non-vested stock option awards was $7.3 million as of December 31, 2016. The Company expects to recognize such costs in the consolidated financial statements over a
F-22
TPI COMPOSITES, INC. AND SUBSIDIARIES
Notes to Consolidated Financial Statements
weighted-average period of approximately 2.1 years. As of December 31, 2015, there were no unrecognized costs related to unvested stock options granted prior to 2015.
The fair value of the stock options granted during the years ended December 31 were calculated using the Black-Scholes option pricing model with the following assumptions:
|
|
|
2016 |
|
|
2015 |
|
||
|
Weighted-average fair value |
|
$ |
5.14 |
|
|
$ |
5.02 |
|
|
Expected volatility |
|
|
45.2 |
% |
|
|
42.7 |
% |
|
Expected life |
|
6.3 years |
|
|
6.3 years |
|
||
|
Risk-free interest rate |
|
|
0.9 |
% |
|
|
0.7 |
% |
|
Dividend yield |
|
|
0.0 |
% |
|
|
0.0 |
% |
Note 13. Long-Term Debt, Net of Debt Issuance Costs and Discount
Long-term debt, net of debt issuance costs and discount, as of December 31 consisted of the following (in thousands):
|
|
|
2016 |
|
|
2015 |
|
||
|
Senior term loan—U.S. |
|
$ |
75,000 |
|
|
$ |
74,375 |
|
|
Senior revolving loan—US |
|
|
2,820 |
|
|
|
— |
|
|
Subordinated convertible promissory notes—U.S. |
|
|
— |
|
|
|
10,000 |
|
|
Accounts receivable financing—EMEA |
|
|
15,120 |
|
|
|
20,505 |
|
|
Unsecured financing—EMEA |
|
|
4,638 |
|
|
|
8,572 |
|
|
Equipment financing—EMEA |
|
|
15,813 |
|
|
|
— |
|
|
Accounts receivable financing—Asia |
|
|
— |
|
|
|
6,622 |
|
|
Working capital loans—Asia |
|
|
— |
|
|
|
9,548 |
|
|
Equipment capital lease—U.S. |
|
|
2,016 |
|
|
|
2,678 |
|
|
Equipment capital lease—EMEA |
|
|
1,898 |
|
|
|
2,879 |
|
|
Construction financing—Mexico |
|
|
— |
|
|
|
1,204 |
|
|
Equipment capital lease—Mexico |
|
|
8,037 |
|
|
|
37 |
|
|
Equipment loan—Mexico |
|
|
103 |
|
|
|
164 |
|
|
Total long-term debt |
|
|
125,445 |
|
|
|
136,584 |
|
|
Less: Debt issuance costs |
|
|
(2,290 |
) |
|
|
(4,220 |
) |
|
Less: Discount on debt |
|
|
— |
|
|
|
(3,018 |
) |
|
Total long-term debt, net of debt issuance costs and discount |
|
|
123,155 |
|
|
|
129,346 |
|
|
Less: Current maturities of long-term debt |
|
|
(33,403 |
) |
|
|
(52,065 |
) |
|
Long-term debt, net of debt issuance costs, discount and current maturities |
|
$ |
89,752 |
|
|
$ |
77,281 |
|
Senior Financing Agreements (U.S.):
In August 2014, the Company entered into an agreement to borrow up to $75.0 million through a credit facility (the Credit Facility) in order to refinance existing indebtedness as well as to fund current operations and future growth opportunities. The initial amount drawn on the closing date was $50.0 million and an additional $5.0 million was drawn in December 2014. In December 2014, in connection with the additional $5.0 million draw, the Credit Facility was amended. In December 2015, the Credit Facility was further amended to increase the total available principal amount from $75.0 million to $100.0 million. The Credit Facility had an initial term of four years and was to mature in 2018, provided for various financial covenants and bore interest at the London Interbank Offered Rate (LIBOR) with a 1.0% floor, plus 8.0%. The Credit Facility contained various affirmative and negative covenants, limited annual capital expenditures based on budgets submitted to and agreed to with the lender and an annual excess cash flow sweep requirement. In connection with the December 2015 amendment, all financial
F-23
TPI COMPOSITES, INC. AND SUBSIDIARIES
Notes to Consolidated Financial Statements
covenants were revised and the measurement period changed from monthly to quarterly. Concurrent with the December 2015 amendment, the Company borrowed an additional $20.0 million under the Credit Facility to fund future growth and expansion. In addition, there were debt issuance costs of $4.7 million which were being amortized to interest expense over a period of 48 months using the effective interest method. As of December 31, 2015, the outstanding balances under the Credit Facility was $74.4 million.
In connection with the initial draw on the Credit Facility in August 2014, the Company repaid its previously outstanding senior term loan of $20.0 million plus accrued interest, a prepayment penalty and a termination fee. The prepayment penalty and termination fee amounted to $1.6 million and are included within the caption “Loss on extinguishment of debt” in the accompanying consolidated statements of operations. In addition, the Company also expensed the remaining $1.3 million of debt discounts and deferred financing costs associated with the senior term loan within the caption “Loss on extinguishment of debt” in the accompanying consolidated statements of operations. The Company also repaid $5.0 million of previously outstanding subordinated convertible promissory notes plus accrued interest as well as $5.7 million of customer advances outstanding at the time of the refinancing.
In December 2016, the Company amended and restated the Credit Facility (the Amended Credit Facility). The previous $100.0 million of available principal was replaced with a $75.0 million term loan and a $25.0 million revolving credit facility, which includes a $15.0 million letter of credit sub-facility. The borrowings under the Amended Credit Facility bear interest at a variable rate through maturity at LIBOR, with a 1.0% floor, plus 5.75%. The Amended Credit Facility requires us to make quarterly principal payments in the amount of $0.9 million of the outstanding principal loan balance commencing in March 2017, with the remaining outstanding balance to be repaid on or before December 30, 2020. The Amended Credit Facility contains customary affirmative covenants, negative covenants and events of default, including covenants and restrictions that, among other things, require the Company and its subsidiaries to satisfy certain capital expenditure and other financial covenants, and restricts the ability of the Company and its subsidiaries to incur liens, incur additional indebtedness, enter into joint ventures or partnerships, engage in mergers and acquisitions, engage in asset sales and declare dividends on its capital stock without the prior written consent of the Lenders. The obligations under the Amended Credit Facility are secured by a lien on substantially all tangible and intangible property of the Company and its domestic subsidiaries and by a pledge by the Company and its domestic subsidiaries of 65% of the equity of their direct foreign subsidiaries, subject to customary exceptions and exclusions from collateral.
If the Company prepays any of the outstanding principal loan balance prior to December 30, 2017, the Company is required to pay the lenders a premium in an amount equal to the amount of interest that otherwise would have been payable from the date of prepayment until December 30, 2017 plus 3.0% of the amount of the principal loan balance that was prepaid. If the Company prepays any of the outstanding principal loan balance after December 30, 2017 through December 30, 2018, the Company is required to pay the lenders 2.0% of the principal loan balance that was prepaid, and if the Company prepays any of the outstanding loan balance after December 30, 2018 through December 30, 2019, the Company is required to pay a premium of 1.5% of the amount of the principal loan balance that was prepaid.
In connection with the Amended Credit Facility, the Company repaid the outstanding Credit Facility balance of $74.4 million, plus accrued interest, closing fees, a prepayment penalty and the reimbursement of certain lenders expenses incurred. The deferred financing fees totaled $2.2 million and are being amortized to interest expense over a period of 48 months using the effective interest method. In addition, the Company also expensed $2.4 million of the remaining deferred financing costs associated with the Credit Facility and $2.1 million of the prepayment penalty within the caption “Loss on extinguishment of debt” in the accompanying consolidated statements of operations. As of December 31, 2016, the aggregate outstanding balance under the Amended Credit Facility was $77.8 million. The Company cannot assure you that they will be able to maintain appropriate minimum leverage or fixed-charge coverage ratio requirements in the future.
Subordinated Convertible Promissory Notes Agreement (U.S.):
In conjunction with the additional funding under the Credit Facility in December 2014, the Company entered into a note purchase agreement with five of the Company’s current investors for the purchase of $10.0 million of subordinated convertible promissory notes. The notes bore interest at a rate of 12.0% per annum and would
F-24
TPI COMPOSITES, INC. AND SUBSIDIARIES
Notes to Consolidated Financial Statements
automatically mature and be due and payable on the earlier of the completion of any change of control or qualified initial public offering, or at the election of the holders of the notes at any time after the occurrence of an event of default. The Company had the right to prepayment without the consent of the note holders and the note holders held conversion rights upon future financing into new equity financing or convertible note financing. This note purchase agreement contained a beneficial conversion feature which was valued at $5.2 million based on the difference between the fair value of the Company’s stock as of the commitment date as compared to the most favorable conversion rate that would have been available to the investor during the term of the loan. This amount was accounted for as a debt discount and an increase in shareholders’ equity. The debt discount was being accreted to interest expense ratably over the expected term of the notes. In addition, there were debt issuance costs of $0.2 million which were being amortized to interest expense over the estimated term of the loan using the effective interest method. As of December 31, 2015, the outstanding balance under the note purchase agreement was $10.0 million.
As discussed in Note 1, concurrent with the closing of the Company’s IPO, the principal and accrued interest on the outstanding subordinated convertible promissory notes were converted into an aggregate of 1,079,749 shares of common stock at the public offering price of $11.00 per share. In connection with this conversion, the remaining beneficial conversion feature, debt discount and debt issuance costs totaling $1.3 million were fully expensed as interest expense in the accompanying consolidated statements of operations.
Accounts Receivable, Secured and Unsecured Financing:
EMEA: During 2014, the Company renewed a general credit agreement with a financial institution in Turkey to provide up to $20.0 million (later changed to 20.0 million Euro, or approximately $21.1 million as of December 31, 2016) of short-term collateralized financing on invoiced accounts receivable of one of Turkey’s customers. Interest accrues annually at the Euro Interbank Offered Rate (EURIBOR) plus 0.2% (currently 5.75%) and is paid monthly. In December 2014, Turkey obtained an additional $7.0 million of unsecured financing under the credit agreement, increasing the total facility. All credit agreement terms remained the same. The credit agreement does not have a maturity date, however the limits are reviewed in September of each year. Amounts outstanding under this agreement as of December 31, 2016 and 2015 include $15.1 million and $18.7 million of accounts receivable financing and $4.6 million and $4.1 million of unsecured financing, respectively.
In December 2014, the Company entered into a credit agreement with a Turkish financial institution to provide up to $16.0 million short-term financing of which $10.0 million is collateralized financing on invoiced accounts receivable of one of Turkey’s customers and the remaining $6.0 million is unsecured. Interest accrues at an average rate of 6.25%. The credit agreement does not have a maturity date, however the limits are reviewed in September of each year. No amounts were outstanding under this agreement as of December 31, 2016. Amounts outstanding under this agreement as of December 31, 2015 include $1.8 million of accounts receivable financing and $4.5 million of unsecured financing.
In March 2016, the Company entered into a general credit agreement with a Turkish financial institution to provide up to 33.5 million Euro (later increased to 36.0 million Euro, or approximately $37.9 million as of December 31, 2016) of short-term financing of which 20.0 million Euro (approximately $21.1 million as of December 31, 2016) is collateralized financing based on invoiced accounts receivable of one of the EMEA segment’s customers, 12.5 million Euro (later increased to 15.0 million Euro, or approximately $15.8 million as of December 31, 2016) for the collateralized financing of capital expenditures and 1.0 million Euro (approximately $1.0 million as of December 31, 2016) related to letters of guarantee. Interest on the collateralized financing based on invoiced accounts receivable accrues at the three month EURIBOR plus 5.75% and is paid quarterly with a maturity date equal to four months from the applicable invoice date. Interest on the collateralized capital expenditures financing accrues at the one month EURIBOR, plus 6.75% (currently 6.75%) with monthly principal repayments beginning in October 2017 with a final maturity date of December 2021. Interest on the letters of guarantee accrues at 2.00% annually with a final maturity date of March 2017. As of December 31, 2016, there was $15.8 million outstanding under the collateralized financing of capital expenditures line.
Asia: During 2014, the Company also entered into accounts receivable financing loans with a financial institution. Amounts outstanding as of December 31, 2015 were $6.6 million and interest accrued at 6.6% annually.
F-25
TPI COMPOSITES, INC. AND SUBSIDIARIES
Notes to Consolidated Financial Statements
All interest was payable quarterly. The principal on these loans was scheduled to be paid from between 12 to 36 months from each loan origination date but had been, and were anticipated to continue to be, renewed at their maturities. As of December 31, 2016, all amounts outstanding under these accounts receivable financing loans were fully repaid.
In January 2016, the Company entered into a credit agreement with a Chinese financial institution to provide up to 95.0 million Renminbi (approximately $13.6 million as of December 31, 2016) of short-term financing of which 85.0 million Renminbi (approximately $12.2 million as of December 31, 2016) is collateralized financing based on invoiced accounts receivables of one of its Asia segment’s customers and 10.0 million Renminbi (approximately $1.4 million as of December 31, 2016) of working capital loans collateralized by one of its Asia segment location’s machinery and equipment. Interest on the collateralized financing based on invoiced accounts receivable and the collateralized working capital loan accrues at a specified LIBOR rate plus an applicable margin and can be paid monthly, quarterly or at the time of the debt’s final maturity (January 12, 2017). As of December 31, 2016, there were no amounts outstanding under these accounts receivable financing and working capital loans.
Working Capital Agreements (Asia):
During 2014, the Company entered into several working capital loans with various financial institutions. Amounts outstanding as of December 31, 2015 were $9.5 million and interest accrued at between 5.6% and 6.9% annually. All interest was payable quarterly. The principal on these loans was scheduled to be paid from between 3 to 12 months from each loan origination date. As collateral for the above working capital loans, the financial institution received a security interest in China’s buildings and land use rights (Note 9).
In connection with the December 2015 amendment to the Credit Facility noted above, the Company repaid the outstanding indebtedness incurred in connection with its working capital loans with its lenders in China in 2016.
Equipment Lease and Other Arrangements:
U.S.: In March 2014, the Company entered into a lease agreement with a leasing company for the initial lease of up to $2.2 million of machinery and equipment at its Iowa facility. The lease agreement was subsequently amended and the amount of machinery and equipment available for lease was increased to $5.4 million. The lease includes an implied effective interest rate of 4.3% annually and requires monthly payments during each 24 month term. As of December 31, 2016 and 2015, there was $2.0 million and $2.7 million outstanding under this agreement.
EMEA: In 2013, the Company entered into a finance lease agreement with a financial institution in Turkey for $4.9 million of machinery, equipment and building improvements at its Turkey facility. The term of the lease was for four years at an effective interest rate of 6.0%. The loan is to be repaid in monthly installments through 2017. The balance outstanding as of December 31, 2016 and 2015 was $1.9 million and $2.9 million, respectively.
Mexico: In October 2015, the Company entered into a construction financing agreement related to the expansion of a building with a total value of $1.8 million. Interest accrued at 7.0% annually and was paid monthly. The agreement required monthly payments between October 2015 and October 2016. No amounts were outstanding under this agreement as of December 31, 2016. The amount outstanding under this agreement as of December 31, 2015 was $1.2 million.
In January 2016, the Company entered into a lease agreement with a leasing company for the initial lease of up to $9.5 million (subsequently amended to $10.0 million) of machinery and equipment at its second Mexico facility. The lease includes an implied effective interest rate of 4.3% annually and requires monthly payments during each 24 month term. The amount outstanding under this agreement as of December 31, 2016 was $8.0 million.
Due to the short-term nature of the unsecured financing in Turkey, the Company estimates that fair-value approximates the face value of the notes.
For the years ended December 31, 2016, 2015 and 2014, $1.7 million, $1.3 million and $0.7 million of debt issuance costs were amortized to interest expense in the Company’s consolidated statements of operations.
F-26
TPI COMPOSITES, INC. AND SUBSIDIARIES
Notes to Consolidated Financial Statements
The average interest rate on the Company’s short-term borrowings as of December 31, 2016 and 2015 was approximately 5.8% and 6.1%, respectively.
The aggregate annual maturities of debt at December 31, 2016, are as follows (in thousands):
|
2017 |
|
$ |
33,403 |
|
|
2018 |
|
|
13,379 |
|
|
2019 |
|
|
7,471 |
|
|
2020 |
|
|
67,471 |
|
|
2021 |
|
|
3,721 |
|
|
Total |
|
$ |
125,445 |
|
Note 14. Convertible and Senior Redeemable Preferred Shares and Warrants
The convertible and senior redeemable preferred shares and warrants outstanding as of December 31, 2015 automatically converted to common shares immediately prior to the closing of the IPO, consisted of the following (in thousands, except share and par value data):
|
Series A convertible preferred shares (convertible at 1 share to 3.4974 shares of common stock), $0.01 par value; liquidation preference equal to $50,901; 3,551 shares authorized; 3,551 shares issued and outstanding at December 31, 2015 |
|
$ |
50,901 |
|
|
Series B convertible preferred shares (convertible at 1 share to 3.5636 shares of common stock), $0.01 par value; liquidation preference equal to $41,200; 2,813 shares authorized; 2,287 shares issued and outstanding at December 31, 2015 |
|
|
41,200 |
|
|
Series B-1 convertible preferred shares (convertible at 1 share to 5.0243 shares of common stock), $0.01 par value; liquidation preference equal to $52,510; 2,972 shares authorized; 2,972 shares issued and outstanding at December 31, 2015 |
|
|
52,510 |
|
|
Series C convertible preferred shares (convertible at 1 share to 3.2817 shares of common stock), $0.01 par value; liquidation preference equal to $17,490; 2,944 shares authorized; 2,944 shares issued and outstanding at December 31, 2015 |
|
|
17,490 |
|
|
Senior redeemable preferred shares (convertible at 1 share to 13.2211 shares of common stock), $0.01 par value; liquidation preference equal to $64,722; 740 shares authorized; 740 shares issued and outstanding December 31, 2015 |
|
|
27,585 |
|
|
Super senior redeemable preferred shares (convertible at 1 share to 13.2211 shares of common stock), $0.01 par value; liquidation preference equal to $22,141; 1,024 shares authorized; 280 shares issued and outstanding at December 31, 2015 |
|
|
8,060 |
|
|
Redeemable preferred share warrants; 248 warrants issued and outstanding at December 31, 2015 |
|
|
1,084 |
|
|
Convertible and senior redeemable preferred shares and warrants |
|
$ |
198,830 |
|
As discussed in Note 1, immediately prior to the closing of the IPO, all of the outstanding redeemable preferred shares were converted into an aggregate of 21,110,204 shares of common stock. Prior to conversion, the Company had recorded dividends totaling $5.5 million for the period January 1, 2016 through July 22, 2016 (the date of the Company’s IPO) which are included in the net income attributable to preferred shareholders in the accompanying consolidated statements of operations.
Redeemable Preferred Share Warrants
As discussed in Note 1, immediately prior to the closing of the IPO, the 248 outstanding redeemable Series B preferred share warrants were converted on a net issuance basis into an aggregate of 120,923 shares of common stock.
F-27
TPI COMPOSITES, INC. AND SUBSIDIARIES
Notes to Consolidated Financial Statements
In connection with the note purchase agreement dated December 29, 2014, for the purchase of $10.0 million of subordinated convertible promissory notes, a minimum of 160,424 warrants were issued to purchase common stock with an exercise price equal to the lesser of $24.30 or 85% of the IPO price of $11.00 per share, accordingly, after the IPO, the exercise price is $9.35. The warrants are immediately exercisable and expire no later than eight years from the date of issuance. The unamortized fair value of the warrants was expensed upon conversion of the convertible promissory notes concurrent with the IPO. These warrants all remain outstanding as of December 31, 2016.
Note 15. Commitments and Contingencies
(a) Operating Leases
The Company leases various facilities and equipment under noncancelable operating leases with terms ranging from 12 months to 120 months. Scheduled rent increases are recorded on a straight-line basis over the entire term of the lease.
Rental expense charged under all operating leases (including leases with terms of less than one year) was $11.5 million, $8.4 million and $7.1 million for the years ended December 31, 2016, 2015 and 2014, respectively. Future minimum lease payments under noncancelable operating leases with terms of one year or more as of December 31, 2016 are as follows (in thousands):
|
2017 |
|
$ |
16,434 |
|
|
2018 |
|
|
14,726 |
|
|
2019 |
|
|
12,939 |
|
|
2020 |
|
|
12,560 |
|
|
2021 |
|
|
9,420 |
|
|
Thereafter |
|
|
41,271 |
|
|
Total |
|
$ |
107,350 |
|
(b) Legal Proceedings
From time to time, the Company is party to various lawsuits, claims, and other legal proceedings that arise in the ordinary course of business, some of which are covered by insurance. When the Company is aware of a claim or potential claim, it assesses the likelihood of any loss or exposure. If it is probable that a loss will result and the amount of the loss can be reasonably estimated, the Company records a liability for the loss. If the loss is not probable or the amount of the loss cannot be reasonably estimated, the Company discloses the nature of the specific claim if the likelihood of a potential loss is reasonably possible and the amount involved is material. With respect to the majority of pending litigation matters, the Company’s ultimate legal and financial responsibility, if any, cannot be estimated with certainty and, in most cases, any potential losses related to those matters are not considered probable.
Upon resolution of any pending legal matters, the Company may incur charges in excess of presently established reserves. Management does not believe that any such charges would, individually or in the aggregate, have a material adverse effect on the Company’s financial condition, results of operations or cash flows.
(c) Insurance/Self-Insurance
The Company uses a combination of insurance and self-insurance for a number of risks, including claims related to employee health care, workers’ compensation and general liability. Liabilities associated with these risks are estimated based on, among other things, historical claims experience, severity factors, and other actuarial assumptions. The Company’s loss exposure related to self-insurance is limited by stop loss coverage on a per occurrence and aggregate basis. The Company regularly analyzes its reserves for incurred but not reported claims, and for reported but not paid claims related to self-funded insurance programs. While the Company believes
F-28
TPI COMPOSITES, INC. AND SUBSIDIARIES
Notes to Consolidated Financial Statements
reserves are adequate, significant judgment is involved in assessing these reserves such as assessing historical paid claims, average lags between the claims’ incurred date, reported dates and paid dates, and the frequency and severity of claims. There may be differences between actual settlement amounts and recorded reserves and any resulting adjustments are included in expense once a probable amount is known.
(d) Dividend Restrictions
Certain subsidiaries of the Company are limited in their ability to declare dividends without first meeting statutory restrictions of the People’s Republic of China, including retained earnings as determined under Chinese-statutory accounting requirements. Until 50% ($5.2 million) of registered capital is contributed to a surplus reserve, the Company’s Chinese operations can only pay dividends equal to 90% of after-tax profits (10% must be contributed to the surplus reserve). Once the surplus reserve fund requirement is met, the Company can pay dividends equal to 100% of after-tax profit assuming other conditions are met. At December 31, 2016, the amount of the surplus reserve fund was $4.4 million.
(e) Collective Bargaining Agreement
In May 2016, the Company entered into a new three-year collective bargaining agreement with certain of its Turkish employees. The new agreement will result in an average increase in pay of approximately 20% for employees covered by the agreement. Currently, there are no other employees covered by collective bargaining agreements. The Company believes that its relations with employees are good, and there have been no major work stoppages in recent years.
Note 16. Defined Contribution Plan
The Company maintains a 401(k) plan for all of its U.S. employees. Under the 401(k) plan, eligible employees may contribute, subject to statutory limitations, a percentage of their salaries. The Company currently matches 25 percent of the participants’ contributions up to 8 percent of eligible compensation.
Participant vesting occurs in the Company matching contributions according to the schedule below:
|
Years of service |
|
Vesting Percentage |
|
|
|
Less than 2 years |
|
|
0 |
% |
|
2-year anniversary |
|
|
20 |
% |
|
3-year anniversary |
|
|
40 |
% |
|
4-year anniversary |
|
|
60 |
% |
|
5-year anniversary |
|
|
80 |
% |
|
6-year anniversary |
|
|
100 |
% |
The Company’s matching contributions to the 401(k) plan were $0.3 million, $0.2 million and $0.2 million for the years ended December 31, 2016, 2015 and 2014, respectively. The Company’s matching contributions are accrued and recorded as expense during each payroll period. Effective January 1, 2017, the Company changed the 401(k) plan to include an auto enrollment feature, increased the Company match from 25% of the first 8% to 50% of the first 8% and reduced the vesting period from six years to three years.
In Mexico, the Company maintains an annual savings fund, which matches the employee contribution each week, based on the Mexican statutory maximum of 13% of actual minimum salary rates. The savings fund period runs from November to October each year, and is distributed to employees in full, during the first week of November each year. For the years ended December 31, 2016 and 2015, the Company incurred matched savings expense of $0.6 million and $0.5 million, respectively.
In Turkey, the Company maintains a retirement fund that is based on a formula of annual salary multiplied by the number of years of service for the Company. The Company accrues a retirement fund liability for this each
F-29
TPI COMPOSITES, INC. AND SUBSIDIARIES
Notes to Consolidated Financial Statements
month. As of December 31, 2016 and 2015, the Company accrued $1.0 million and $0.6 million, respectively, based on the service periods of eligible employees greater than one year.
Note 17. Income Taxes
Geographic sources of net income (loss) before income taxes are as follows for the years ended December 31 (in thousands):
|
|
|
2016 |
|
|
2015 |
|
|
2014 |
|
|||
|
United States |
|
$ |
5,406 |
|
|
$ |
(3,165 |
) |
|
$ |
(7,733 |
) |
|
China |
|
|
22,826 |
|
|
|
18,420 |
|
|
|
5,832 |
|
|
Turkey |
|
|
(8,564 |
) |
|
|
(4,552 |
) |
|
|
(3,962 |
) |
|
Mexico |
|
|
1,169 |
|
|
|
956 |
|
|
|
140 |
|
|
Total |
|
$ |
20,837 |
|
|
$ |
11,659 |
|
|
$ |
(5,723 |
) |
The income tax provision includes U.S. federal, state, and local taxes, Turkey, China and Mexico taxes currently payable and those deferred because of temporary differences between the financial statement and the tax bases of assets and liabilities. The components of the provision for income taxes for the years ended December 31 are as follows (in thousands):
|
|
|
2016 |
|
|
2015 |
|
|
2014 |
|
|||
|
Current: |
|
|
|
|
|
|
|
|
|
|
|
|
|
U.S. federal |
|
$ |
— |
|
|
$ |
(51 |
) |
|
$ |
80 |
|
|
U.S. state and local taxes |
|
|
(196 |
) |
|
|
55 |
|
|
|
282 |
|
|
Foreign |
|
|
9,973 |
|
|
|
4,738 |
|
|
|
1,581 |
|
|
Total current |
|
|
9,777 |
|
|
|
4,742 |
|
|
|
1,943 |
|
|
Deferred: |
|
|
|
|
|
|
|
|
|
|
|
|
|
U.S. federal |
|
|
51 |
|
|
|
— |
|
|
|
— |
|
|
U.S. state and local taxes |
|
|
— |
|
|
|
— |
|
|
|
— |
|
|
Foreign |
|
|
(2,833 |
) |
|
|
(765 |
) |
|
|
(1,018 |
) |
|
Total deferred |
|
|
(2,782 |
) |
|
|
(765 |
) |
|
|
(1,018 |
) |
|
Total provision |
|
$ |
6,995 |
|
|
$ |
3,977 |
|
|
$ |
925 |
|
F-30
TPI COMPOSITES, INC. AND SUBSIDIARIES
Notes to Consolidated Financial Statements
The following is a reconciliation between the U.S. statutory income tax rate and the Company’s income tax provision for the years ended December 31:
|
|
|
2016 |
|
|
2015 |
|
|
2014 |
|
|||
|
United States statutory income tax rate (benefit) |
|
|
34.0 |
% |
|
|
34.0 |
% |
|
|
(34.0 |
)% |
|
Foreign rate differential |
|
|
5.3 |
|
|
|
(23.9 |
) |
|
|
(8.8 |
) |
|
Foreign permanent differences |
|
|
2.4 |
|
|
|
4.1 |
|
|
|
0.0 |
|
|
China rate change |
|
|
(4.8 |
) |
|
|
0.0 |
|
|
|
0.0 |
|
|
Withholding taxes |
|
|
6.8 |
|
|
|
3.4 |
|
|
|
6.8 |
|
|
Foreign tax credits |
|
|
(7.9 |
) |
|
|
0.0 |
|
|
|
0.0 |
|
|
Valuation allowance |
|
|
(14.3 |
) |
|
|
17.3 |
|
|
|
64.8 |
|
|
State taxes |
|
|
(0.6 |
) |
|
|
0.5 |
|
|
|
3.6 |
|
|
Deferred tax adjustments |
|
|
(0.1 |
) |
|
|
2.3 |
|
|
|
(13.3 |
) |
|
Research and development |
|
|
(3.0 |
) |
|
|
(3.0 |
) |
|
|
(2.2 |
) |
|
U.S. foreign income inclusions |
|
|
2.0 |
|
|
|
|
|
|
|
|
|
|
Nondeductible interest expense |
|
|
11.5 |
|
|
|
|
|
|
|
|
|
|
Other |
|
|
2.3 |
|
|
|
(0.6 |
) |
|
|
(0.7 |
) |
|
Total expense |
|
|
33.6 |
% |
|
|
34.1 |
% |
|
|
16.2 |
% |
U.S. income taxes have not been provided on $42.0 million of undistributed earnings as of December 31, 2016 of foreign subsidiaries over which the Company has sufficient influence to control the distribution of such earnings, and has determined that such earnings have been reinvested indefinitely. Should the Company elect in the future to repatriate a portion of the foreign earnings so invested, the Company could incur income tax expense on such repatriation, net of any available deductions and foreign tax credits. This would result in additional income tax expense beyond the computed expected provision in such periods. In addition, the Company’s ability to repatriate funds from China to the United States is subject to a number of restrictions imposed by the Chinese government. The amount of unrecognized deferred tax liability for temporary differences related to investments in foreign subsidiaries and foreign corporate joint ventures that are essentially permanent in duration is not easily determinable.
The following is a summary of the components of deferred tax assets and liabilities at December 31 (in thousands):
|
|
|
2016 |
|
|
2015 |
|
|
2014 |
|
|||
|
Deferred tax assets: |
|
|
|
|
|
|
|
|
|
|
|
|
|
Net operating loss and credit carry forwards |
|
$ |
25,354 |
|
|
$ |
32,294 |
|
|
$ |
34,961 |
|
|
Deferred revenue |
|
|
5,373 |
|
|
|
6,563 |
|
|
|
5,084 |
|
|
Non-deductible accruals |
|
|
8,316 |
|
|
|
4,825 |
|
|
|
3,028 |
|
|
Equity compensation |
|
|
3,503 |
|
|
|
— |
|
|
|
— |
|
|
Equity investment |
|
|
633 |
|
|
|
653 |
|
|
|
692 |
|
|
Amortization of intangible assets |
|
|
472 |
|
|
|
720 |
|
|
|
656 |
|
|
Tax credits |
|
|
2,914 |
|
|
|
384 |
|
|
|
120 |
|
|
Other |
|
|
1,248 |
|
|
|
1,671 |
|
|
|
657 |
|
|
Total deferred tax assets |
|
|
47,813 |
|
|
|
47,110 |
|
|
|
45,198 |
|
|
Valuation allowance |
|
|
(40,596 |
) |
|
|
(41,216 |
) |
|
|
(39,347 |
) |
|
Net deferred tax assets |
|
|
7,217 |
|
|
|
5,894 |
|
|
|
5,851 |
|
|
Deferred tax liabilities: |
|
|
|
|
|
|
|
|
|
|
|
|
|
Deferred revenue |
|
|
— |
|
|
|
(615 |
) |
|
|
(3,497 |
) |
|
Depreciation |
|
|
(1,714 |
) |
|
|
(1,831 |
) |
|
|
(1,368 |
) |
|
Other |
|
|
(423 |
) |
|
|
(1,787 |
) |
|
|
(41 |
) |
|
Total deferred tax liabilities |
|
|
(2,137 |
) |
|
|
(4,233 |
) |
|
|
(4,906 |
) |
|
Net deferred tax assets |
|
$ |
5,080 |
|
|
$ |
1,661 |
|
|
$ |
945 |
|
F-31
TPI COMPOSITES, INC. AND SUBSIDIARIES
Notes to Consolidated Financial Statements
The deferred tax valuation allowance at December 31 consisted of the following (in thousands):
|
|
|
2016 |
|
|
2015 |
|
|
2014 |
|
|||
|
Allowance at beginning of year |
|
$ |
(41,216 |
) |
|
$ |
(39,347 |
) |
|
$ |
(35,208 |
) |
|
Benefits obtained (expenses incurred) |
|
|
620 |
|
|
|
(1,869 |
) |
|
|
(4,139 |
) |
|
Adjustment |
|
|
— |
|
|
|
— |
|
|
|
— |
|
|
Allowance at end of year |
|
$ |
(40,596 |
) |
|
$ |
(41,216 |
) |
|
$ |
(39,347 |
) |
The valuation allowance relates to deferred taxes that the Company believes do not meet the more-likely-than-not criteria for recording the related benefits.
The Company has U.S. federal net operating losses (NOLs) of approximately $57.5 million, state NOLs of approximately $77.2 million and foreign tax credits of approximately $2.6 million available to offset future U.S. taxable income. The federal and state net operating loss carryforwards expire in varying amounts through 2036 and the foreign tax credits expire between 2024 and 2026. The Company also has Turkey investment tax credits of approximately $0.3 million that do not expire.
Sections 382 and 383 of the Internal Revenue Code of 1986, contain rules that limit the ability of a company that undergoes an “ownership change” to utilize its net operating loss and tax credit carry forwards and certain built-in losses recognized in years after the ownership change. An “ownership change” is generally defined as any change in ownership of more than 50% of a corporation’s stock over a rolling three-year period by stockholders that own (directly or indirectly) 5% or more of the stock of a corporation, or arising from a new issuance of stock by a corporation. If an ownership change occurs, Section 382 generally imposes an annual limitation on the use of pre-ownership change NOLs to offset taxable income earned after the ownership change. The annual limitation is equal to the product of the applicable long-term tax exempt rate and the value of the company’s stock immediately before the ownership change. This annual limitation may be adjusted to reflect any unused annual limitation for prior years and certain recognized built-in gains and losses for the year. In addition, Section 383 generally limits the amount of tax liability in any post-ownership change year that can be reduced by pre-ownership change tax credit carryforwards. In 2008, the Company had an “ownership change” and the pre-ownership change NOLs existing at the date of change of $25.6 million were subject to an annual limitation of $4.3 million. As of December 31, 2016, the pre-ownership change NOLs are no longer limited. Certain of these NOLs may be at risk of limitation in the event of a future ownership change.
The Company recognizes the impact of a tax position in its financial statements if that position is more-likely-than-not to be sustained on audit, based on the technical merits of the position. The Company discloses all unrecognized tax benefits, which includes the reserves recorded for uncertain tax positions on filed tax returns and the unrecognized portion of affirmative claims. The Company’s policy regarding uncertain tax positions is to recognize potential accrued interest and penalties related to unrecognized tax benefits as a component of income tax expense. As of December 31, 2016, the Company has not identified any unrecognized tax benefits.
The Company operates in and files income tax returns in various jurisdictions in China, Mexico, Turkey and the U.S., which are subject to examination by tax authorities. With few exceptions, the Company is no longer subject to income tax examinations for years before 2010.
F-32
TPI COMPOSITES, INC. AND SUBSIDIARIES
Notes to Consolidated Financial Statements
Note 18. Concentration of Customers
Revenues from certain customers in excess of 10 percent of total consolidated Company revenues for the years ended December 31 are as follows (in thousands):
|
|
|
2016 |
|
|
2015 |
|
|
2014 |
|
|||||||||||||||
|
Customer |
|
Revenues |
|
|
% of Total |
|
|
Revenues |
|
|
% of Total |
|
|
Revenues |
|
|
% of Total |
|
||||||
|
Customer 1 - GE |
|
$ |
379,941 |
|
|
|
50.3 |
% |
|
$ |
312,495 |
|
|
|
53.3 |
% |
|
$ |
234,795 |
|
|
|
73.2 |
% |
|
Customer 2 - Vestas |
|
|
152,106 |
|
|
|
20.1 |
% |
|
|
50,031 |
|
|
|
8.5 |
% |
|
|
— |
|
|
|
— |
|
|
Customer 3 - Nordex/Acciona |
|
|
131,775 |
|
|
|
17.5 |
% |
|
|
154,927 |
|
|
|
26.5 |
% |
|
|
69,383 |
|
|
|
21.6 |
% |
|
Customer 4 - Gamesa |
|
|
81,463 |
|
|
|
10.8 |
% |
|
|
60,544 |
|
|
|
10.3 |
% |
|
|
13,501 |
|
|
|
4.2 |
% |
|
Other |
|
|
9,592 |
|
|
|
1.3 |
% |
|
|
7,855 |
|
|
|
1.4 |
% |
|
|
3,068 |
|
|
|
1.0 |
% |
|
Total |
|
$ |
754,877 |
|
|
|
100.0 |
% |
|
$ |
585,852 |
|
|
|
100.0 |
% |
|
$ |
320,747 |
|
|
|
100.0 |
% |
Trade accounts receivable from certain customers in excess of 10 percent of total consolidated Company trade accounts receivable at December 31 are as follows:
|
|
|
2016 |
|
|
2015 |
|
||
|
Customer |
|
% of Total |
|
|
% of Total |
|
||
|
Customer 1 - GE |
|
|
24.9 |
% |
|
|
26.5 |
% |
|
Customer 2 - Vestas |
|
|
26.2 |
% |
|
|
27.9 |
% |
|
Customer 3 - Nordex/Acciona |
|
|
26.8 |
% |
|
|
39.3 |
% |
|
Customer 4 - Gamesa |
|
|
16.2 |
% |
|
|
4.1 |
% |
Note 19. Segment Reporting
FASB ASC Topic 280, Segment Reporting, establishes standards for the manner in which companies report financial information about operating segments, products, services, geographic areas and major customers. In managing the Company’s business, management focuses on growing its revenues and earnings in select geographic areas serving primarily the wind energy market. The Company has operations in the United States, China, Turkey and Mexico. The Company’s operating segments are defined geographically as the United States, Asia, EMEA and Mexico. Financial results are aggregated into four reportable segments based on quantitative thresholds. All of the Company’s segments operate in their local currency except for the Mexico and Asia segments, which both include a U.S. parent company.
F-33
TPI COMPOSITES, INC. AND SUBSIDIARIES
Notes to Consolidated Financial Statements
The following tables set forth certain information regarding each of the Company’s segments for the years ended December 31 (in thousands):
|
|
|
2016 |
|
|
2015 |
|
|
2014 |
|
|||
|
Net sales by segment: |
|
|
|
|
|
|
|
|
|
|
|
|
|
U.S. |
|
$ |
190,092 |
|
|
$ |
149,614 |
|
|
$ |
145,691 |
|
|
Asia |
|
|
301,893 |
|
|
|
206,779 |
|
|
|
79,325 |
|
|
Mexico |
|
|
129,756 |
|
|
|
97,912 |
|
|
|
28,725 |
|
|
EMEA |
|
|
133,136 |
|
|
|
131,547 |
|
|
|
67,006 |
|
|
Total net sales |
|
$ |
754,877 |
|
|
$ |
585,852 |
|
|
$ |
320,747 |
|
|
Net sales by geographic location (1): |
|
|
|
|
|
|
|
|
|
|
|
|
|
United States |
|
$ |
190,092 |
|
|
$ |
149,614 |
|
|
$ |
145,691 |
|
|
China |
|
|
301,893 |
|
|
|
206,779 |
|
|
|
79,325 |
|
|
Mexico |
|
|
129,756 |
|
|
|
97,912 |
|
|
|
28,725 |
|
|
Turkey |
|
|
133,136 |
|
|
|
131,547 |
|
|
|
67,006 |
|
|
Total net sales |
|
$ |
754,877 |
|
|
$ |
585,852 |
|
|
$ |
320,747 |
|
|
Depreciation and amortization: |
|
|
|
|
|
|
|
|
|
|
|
|
|
U.S. |
|
$ |
3,336 |
|
|
$ |
3,477 |
|
|
$ |
3,342 |
|
|
Asia |
|
|
4,534 |
|
|
|
4,181 |
|
|
|
1,899 |
|
|
Mexico |
|
|
2,328 |
|
|
|
1,533 |
|
|
|
517 |
|
|
EMEA |
|
|
2,699 |
|
|
|
2,225 |
|
|
|
1,683 |
|
|
Total depreciation and amortization |
|
$ |
12,897 |
|
|
$ |
11,416 |
|
|
$ |
7,441 |
|
|
Capital expenditures |
|
|
|
|
|
|
|
|
|
|
|
|
|
U.S. |
|
$ |
4,056 |
|
|
$ |
5,379 |
|
|
$ |
808 |
|
|
Asia |
|
|
3,287 |
|
|
|
15,632 |
|
|
|
8,903 |
|
|
Mexico |
|
|
5,565 |
|
|
|
2,897 |
|
|
|
4,424 |
|
|
EMEA |
|
|
17,599 |
|
|
|
2,453 |
|
|
|
4,789 |
|
|
Total capital expenditures |
|
$ |
30,507 |
|
|
$ |
26,361 |
|
|
$ |
18,924 |
|
|
Income (loss) from operations: |
|
|
|
|
|
|
|
|
|
|
|
|
|
U.S. |
|
$ |
(25,099 |
) |
|
$ |
(13,405 |
) |
|
$ |
(1,199 |
) |
|
Asia |
|
|
64,393 |
|
|
|
34,998 |
|
|
|
14,771 |
|
|
Mexico |
|
|
9,546 |
|
|
|
7,531 |
|
|
|
(6,567 |
) |
|
EMEA |
|
|
(5,727 |
) |
|
|
(1,505 |
) |
|
|
(1,528 |
) |
|
Total income from operations |
|
$ |
43,113 |
|
|
$ |
27,619 |
|
|
$ |
5,477 |
|
|
Tangible long-lived assets: |
|
|
|
|
|
|
|
|
|
|
|
|
|
U.S. |
|
$ |
16,740 |
|
|
$ |
13,805 |
|
|
|
|
|
|
Asia (China) |
|
|
26,341 |
|
|
|
29,957 |
|
|
|
|
|
|
Mexico |
|
|
24,842 |
|
|
|
12,600 |
|
|
|
|
|
|
EMEA (Turkey) |
|
|
23,243 |
|
|
|
11,370 |
|
|
|
|
|
|
Total tangible long-lived assets |
|
$ |
91,166 |
|
|
$ |
67,732 |
|
|
|
|
|
|
Total assets: |
|
|
|
|
|
|
|
|
|
|
|
|
|
U.S. |
|
$ |
115,213 |
|
|
$ |
116,893 |
|
|
|
|
|
|
Asia |
|
|
172,315 |
|
|
|
92,804 |
|
|
|
|
|
|
Mexico |
|
|
68,231 |
|
|
|
48,002 |
|
|
|
|
|
|
EMEA |
|
|
81,447 |
|
|
|
72,221 |
|
|
|
|
|
|
Total assets |
|
$ |
437,206 |
|
|
$ |
329,920 |
|
|
|
|
|
|
|
(1) |
Net sales are attributable to countries based on the location where the product is manufactured or the services are performed. In 2015, the total assets of the parent company of Asia were included in the U.S. segment’s total assets, whereas in 2016, their total assets are included in the Asia segment’s total assets. |
F-34
TPI COMPOSITES, INC. AND SUBSIDIARIES
Notes to Consolidated Financial Statements
Note 20. Selected Quarterly Financial Data (Unaudited)
The following tables set forth certain unaudited financial information for each quarter of 2016 and 2015. The unaudited quarterly information includes all normal recurring adjustments that, in the opinion of management, are necessary for the fair presentation of the information for the periods presented. The operating results for any quarter are not necessarily indicative of the results for any future period. The unaudited quarterly results are as follows (in thousands, except per share data):
|
|
|
2016 |
|
|||||||||||||
|
|
|
First Quarter |
|
|
Second Quarter |
|
|
Third Quarter |
|
|
Fourth Quarter |
|
||||
|
Net sales |
|
$ |
176,110 |
|
|
$ |
194,255 |
|
|
$ |
198,938 |
|
|
$ |
185,574 |
|
|
Income from operations |
|
|
8,189 |
|
|
|
17,478 |
|
|
|
8,137 |
|
|
|
9,309 |
|
|
Net income (loss) |
|
|
1,746 |
|
|
|
11,555 |
|
|
|
2,797 |
|
|
|
(2,256 |
) |
|
Net income (loss) attributable to common shareholders |
|
|
(691 |
) |
|
|
9,117 |
|
|
|
2,201 |
|
|
|
(2,256 |
) |
|
Net income (loss) per common share: |
|
|
|
|
|
|
|
|
|
|
|
|
|
|
|
|
|
Basic |
|
$ |
(0.16 |
) |
|
$ |
2.15 |
|
|
$ |
0.08 |
|
|
$ |
(0.07 |
) |
|
Diluted |
|
$ |
(0.16 |
) |
|
$ |
2.15 |
|
|
$ |
0.08 |
|
|
$ |
(0.07 |
) |
|
|
|
2015 |
|
|||||||||||||
|
|
|
First Quarter |
|
|
Second Quarter |
|
|
Third Quarter |
|
|
Fourth Quarter |
|
||||
|
Net sales |
|
$ |
95,589 |
|
|
$ |
149,739 |
|
|
$ |
161,578 |
|
|
$ |
178,946 |
|
|
Income (loss) from operations |
|
|
(2,657 |
) |
|
|
9,251 |
|
|
|
4,412 |
|
|
|
16,613 |
|
|
Net income (loss) |
|
|
(5,737 |
) |
|
|
4,090 |
|
|
|
(2,147 |
) |
|
|
11,476 |
|
|
Net income (loss) attributable to common shareholders |
|
|
(8,093 |
) |
|
|
1,734 |
|
|
|
(4,502 |
) |
|
|
9,120 |
|
|
Net income (loss) per common share: |
|
|
|
|
|
|
|
|
|
|
|
|
|
|
|
|
|
Basic |
|
$ |
(1.91 |
) |
|
$ |
0.41 |
|
|
$ |
(1.06 |
) |
|
$ |
2.15 |
|
|
Diluted |
|
$ |
(1.91 |
) |
|
$ |
0.41 |
|
|
$ |
(1.06 |
) |
|
$ |
2.15 |
|
Note 21. Subsequent Events
In February 2017, the Company entered into a credit agreement with a Chinese financial institution to provide up to 150.0 million Renminbi (approximately $21.6 million as of December 31, 2016) unsecured credit line which can be used for the purpose of domestic and foreign currency loans, issuing letters of guarantee or other transactions approved by the lender. Interest on the credit line accrues at the LIBOR rate plus an applicable margin and can be paid monthly, quarterly or at the time of the debt’s maturity (February 23, 2018).
F-35
|
Number |
|
Description |
|
|
|
|
|
3.1 |
|
Amended and Restated Certificate of Incorporation of the Registrant, as currently in effect (incorporated by reference to Exhibit 3.2 to the Registrant’s Registration Statement on Form S-1 (File No. 333-212093) filed on July 11, 2016) |
|
|
|
|
|
3.2 |
|
Second Amended and Restated By-laws of the Registrant, as currently in effect (incorporated by reference to Exhibit 3.4 to the Registrant’s Registration Statement on Form S-1 (File No. 333-212093) filed on July 11, 2016) |
|
|
|
|
|
4.1 |
|
Specimen Stock Certificate (incorporated by reference to Exhibit 4.1 to the Registrant’s Registration Statement on Form S-1 (File No. 333-212093) filed on July 11, 2016) |
|
|
|
|
|
4.2 |
|
Third Amended and Restated Investor Rights Agreement by and among the Registrant and the investors named therein, dated June 17, 2010, as amended (incorporated by reference to Exhibit 4.2 to the Registrant’s Registration Statement on Form S-1 (File No. 333-212093) filed on June 17, 2016) |
|
|
|
|
|
10.1‡ |
|
2008 Stock Option and Grant Plan, as amended by Amendment No. 1, dated August 14, 2008 and Amendment No. 2, dated December 30, 2008, and forms of award agreements thereunder (incorporated by reference to Exhibit 10.1 to the Registrant’s Registration Statement on Form S-1 (File No. 333-212093) filed on June 17, 2016) |
|
|
|
|
|
10.2‡ |
|
Amended and Restated 2015 Stock Option and Incentive Plan and forms of award agreements thereunder (incorporated by reference to Exhibit 10.2 to the Registrant’s Registration Statement on Form S-1 (File No. 333-212093) filed on June 17, 2016) |
|
|
|
|
|
10.3† |
|
Amendment No. 5 to Financing Agreement between the Registrant, HPS Investment Partners, LLC and the other parties named therein, dated August 19, 2014, as amended (incorporated by reference to Exhibit 10.2 to the Registrant’s Current Report on Form 8-K/A (File No. 001-37839) filed on March 9, 2017) |
|
|
|
|
|
10.4† |
|
Amended and Restated Financing Agreement between the Registrant and HPS Investment Partners, LLC, and other parties named therein, dated December 30, 2016 (incorporated by reference to Exhibit 10.1 to the Registrant’s Current Report on Form 8-K/A (File No. 001-37839) filed on March 9, 2017) |
|
|
|
|
|
10.5† |
|
Supply Agreement between General Electric International, Inc. and TPI Mexico III, LLC, entered into as of October 4, 2016 (incorporated by reference to Exhibit 10.3 of the Registrant’s Current Report on Form 8-K/A (File No. 001-37839) filed on January 6, 2017) |
|
|
|
|
|
10.6† |
|
Supply Agreement between General Electric International, Inc. and TPI Kompozit Kanat Sanayi ve Ticaret A.S., entered into as of December 21, 2011, as amended (incorporated by reference to Exhibit 10.7 to the Registrant’s Registration Statement on Form S-1 (File No. 333-212093) filed on June 17, 2016) |
|
|
|
|
|
10.7† |
|
Amended and Restated Supply Agreement between General Electric International, Inc. and TPI Iowa, LLC, entered into as of October 4, 2016 (incorporated by reference to Exhibit 10.1 of the Registrant’s Current Report on Form 8-K/A (File No. 001-37839) filed on January 6, 2017) |
|
|
|
|
|
10.8† |
|
Supply Agreement between General Electric International, Inc. and TPI China, LLC, entered into as of January 1, 2007, as amended (incorporated by reference to Exhibit 10.9 to the Registrant’s Registration Statement on Form S-1 (File No. 333-212093) filed on June 17, 2016) |
|
|
|
|
|
10.9† |
|
Supply Agreement between General Electric International, Inc. and TPI Mexico, LLC, entered into as of October 18, 2013, as amended (incorporated by reference to Exhibit 10.10 to the Registrant’s Registration Statement on Form S-1 (File No. 333-212093) filed on June 17, 2016) |
|
|
|
|
|
Number |
|
Description |
|
|
|
|
|
|
First Amendment to Supply Agreement between General Electric International, Inc. and TPI Mexico, LLC, entered into as of October 4, 2016 (incorporated by reference to Exhibit 10.2 of the Registrant’s Current Report on Form 8-K/A (File No. 001-37839) filed on January 6, 2017) |
|
|
|
|
|
|
10.11 |
|
Lease between TPI Iowa, LLC and Opus Northwest L.L.C., dated November 13, 2007, as amended (incorporated by reference to Exhibit 10.11 to the Registrant’s Registration Statement on Form S-1 (File No. 333-212093) filed on June 17, 2016) |
|
|
|
|
|
10.12 |
|
Commencement Date Memorandum between TPI Iowa LLC and Opus Northwest, L.L.C., entered into as of July 25, 2008 (incorporated by reference to Exhibit 10.12 to the Registrant’s Registration Statement on Form S-1 (File No. 333-212093) filed on June 17, 2016) |
|
|
|
|
|
10.13 |
|
Lease between TPI Kompozit Kanat Sanayi ve Ticaret A.S. and Med Union Containers A.S., dated March 16, 2012 (incorporated by reference to Exhibit 10.13 to the Registrant’s Registration Statement on Form S-1 (File No. 333-212093) filed on June 17, 2016) |
|
|
|
|
|
10.14 |
|
Lease between TPI Wind Blade Dafeng Company Limited and Jiangsu Erhuajie Energy Equipment Co., Ltd, dated November 27, 2013, as amended (incorporated by reference to Exhibit 10.14 to the Registrant’s Registration Statement on Form S-1 (File No. 333-212093) filed on June 17, 2016) |
|
|
|
|
|
10.15 |
|
Lease between the Registrant (f/k/a LCSI Holding, Inc.) and Gainey Center II LLC, dated June 12, 2007, as amended (incorporated by reference to Exhibit 10.15 to the Registrant’s Registration Statement on Form S-1 (File No. 333-212093) filed on June 17, 2016) |
|
|
|
|
|
10.16 |
|
Lease between TPI, Inc. (f/k/a TPI Composites, Inc.) and Borden & Remington Fall River LLC, dated as of December 1, 2008, as superseded by Standard Industrial Lease between TPI, Inc. and Borden & Remington Fall River LLC, dated June 28, 2010, as amended (incorporated by reference to Exhibit 10.16 to the Registrant’s Registration Statement on Form S-1 (File No. 333-212093) filed on June 17, 2016) |
|
|
|
|
|
10.17 |
|
Lease between Composite Solutions, Inc. and TN Realty, LLC, dated September 30, 2004, as amended (incorporated by reference to Exhibit 10.17 to the Registrant’s Registration Statement on Form S-1 (File No. 333-212093) filed on June 17, 2016) |
|
|
|
|
|
10.18 |
|
Lease between TPI-Composites S. de R.L. de C.V. and Deutsche Bank México, S.A. Institución de Banca Múltiple, Division Fiduciaria, as Trustee of Trust F/1638, dated April 15, 2013, as amended (incorporated by reference to Exhibit 10.18 to the Registrant’s Registration Statement on Form S-1 (File No. 333-212093) filed on June 17, 2016) |
|
|
|
|
|
10.19 |
|
Lease between TPI-Composites S. de R.L. de C.V. and The Bank of New York Mellon, S.A., as Trustee in the Trust F/00335, dated September 25, 2013 (incorporated by reference to Exhibit 10.19 to the Registrant’s Registration Statement on Form S-1 (File No. 333-212093) filed on June 17, 2016) |
|
|
|
|
|
10.20 |
|
Lease between TPI Mexico, LLC and Trailer Transfer, Inc., dated October 16, 2013 (incorporated by reference to Exhibit 10.20 to the Registrant’s Registration Statement on Form S-1 (File No. 333-212093) filed on June 17, 2016) |
|
|
|
|
|
10.21 |
|
Lease between TPI Mexico, LLC and Lanestone 1, LLC, dated April 14, 2014 (incorporated by reference to Exhibit 10.21 to the Registrant’s Registration Statement on Form S-1 (File No. 333-212093) filed on June 17, 2016) |
|
|
|
|
|
10.22 |
|
Plant and Equipment Lease between TPI Composites (Taicang) Co., Ltd. and Suzhou Tianneng Power Wind Mold Co., Ltd, dated May 1, 2014 (incorporated by reference to Exhibit 10.22 to the Registrant’s Registration Statement on Form S-1 (File No. 333-212093) filed on June 17, 2016) |
|
|
|
|
|
10.23‡ |
|
Form of Employment Agreement between the Registrant and each of its executive officers (incorporated by reference to Exhibit 10.23 to the Registrant’s Registration Statement on Form S-1 (File No. 333-212093) filed on June 17, 2016) |
|
|
|
|
|
Number |
|
Description |
|
|
|
|
|
|
Form of Indemnification Agreement (incorporated by reference to Exhibit 10.24 to the Registrant’s Registration Statement on Form S-1 (File No. 333-212093) filed on June 17, 2016) |
|
|
|
|
|
|
10.25 |
|
Contract between TPI Composites (Taicang) Co. Ltd. and Mr. Jun Ji, dated August 4, 2015 (incorporated by reference to Exhibit 10.25 to the Registrant’s Registration Statement on Form S-1 (File No. 333-212093) filed on June 17, 2016) |
|
|
|
|
|
10.26 |
|
Lease between TPI Composites, S. de R.L. de C.V. and Vesta Baja California, S. de R.L. de C.V., dated November 20, 2015 (incorporated by reference to Exhibit 10.26 to the Registrant’s Registration Statement on Form S-1 (File No. 333-212093) filed on June 17, 2016) |
|
|
|
|
|
10.27 |
|
Lease between TPI Turkey IZBAS, LLC and Dere Konstruksiyon Demir Celik Insaat Taahhut Muhendislik Musavirlik Sanayi ve Ticaret Anonim Sirketi, dated December 9, 2015 (incorporated by reference to Exhibit 10.27 to the Registrant’s Registration Statement on Form S-1 (File No. 333-212093) filed on June 17, 2016) |
|
|
|
|
|
10.28 |
|
Lease between TPI Composites (Taicang) Co., Ltd. and Suzhou Suchen Chemical & Plastics Co., Ltd., dated August 5, 2014 (incorporated by reference to Exhibit 10.28 to the Registrant’s Registration Statement on Form S-1 (File No. 333-212093) filed on June 17, 2016) |
|
|
|
|
|
10.29 |
|
Lease between TPI Wind Blade Dafeng Co., Ltd. and Jiangsu Jianhao Transmission Machinery Co., Ltd., commencing January 1, 2016 (incorporated by reference to Exhibit 10.29 to the Registrant’s Registration Statement on Form S-1 (File No. 333-212093) filed on June 17, 2016) |
|
|
|
|
|
10.30 |
|
Lease between TPI Kompozit Kanat San. ve Tic. A.S. and BORO Insaat Yatirim Sanayi ve Ticaret A.S., dated October 16, 2015 (incorporated by reference to Exhibit 10.30 to the Registrant’s Registration Statement on Form S-1 (File No. 333-212093) filed on June 17, 2016) |
|
|
|
|
|
10.31 |
|
Sublease between TPI Inc. and Nordex Energy GmbH, dated April 24, 2015 (incorporated by reference to Exhibit 10.31 to the Registrant’s Registration Statement on Form S-1 (File No. 333-212093) filed on June 17, 2016) |
|
|
|
|
|
10.32† |
|
Settlement Agreement and Release between the Registrant and Nordex SE, dated June 3, 2016 (incorporated by reference to Exhibit 10.32 to the Registrant’s Registration Statement on Form S-1 (File No. 333-212093) filed on June 17, 2016) |
|
|
|
|
|
10.33 |
|
Non-Employee Director Compensation Policy (incorporated by reference to Exhibit 10.33 to the Registrant’s Registration Statement on Form S-1 (File No. 333-212093) filed on July 11, 2016) |
|
|
|
|
|
10.34 |
|
Senior Executive Cash Incentive Bonus Plan (incorporated by reference to Exhibit 10.34 to the Registrant’s Registration Statement on Form S-1 (File No. 333-212093) filed on July 11, 2016) |
|
|
|
|
|
21.1 |
|
List of Subsidiaries (incorporated by reference to Exhibit 21.1 to the Registrant’s Registration Statement on Form S-1 (File No. 333-212093) filed on June 17, 2016) |
|
|
|
|
|
23.1* |
|
Consent of KPMG LLP, Independent Registered Public Accounting Firm |
|
|
|
|
|
24.1 |
|
Power of Attorney (incorporated by reference to the signature page of this Annual Report on Form 10-K) |
|
|
|
|
|
31.1* |
|
Certification of Chief Executive Officer pursuant to Section 302 of the Sarbanes-Oxley Act of 2002 |
|
|
|
|
|
31.2* |
|
Certification of Chief Financial Officer pursuant to Section 302 of the Sarbanes-Oxley Act of 2002 |
|
|
|
|
|
32.1** |
|
Certification of Chief Executive Officer pursuant to Section 906 of the Sarbanes-Oxley Act of 2002 |
|
|
|
|
|
32.2** |
|
Certification of Chief Financial Officer pursuant to Section 906 of the Sarbanes-Oxley Act of 2002 |
|
|
|
|
|
101.INS* |
|
XBRL Instance Document |
|
|
|
|
|
101.SCH* |
|
XBRL Taxonomy Extension Schema Document |
|
|
|
|
|
Number |
|
Description |
|
|
|
|
|
|
XBRL Taxonomy Extension Calculation Linkbase Document |
|
|
|
|
|
|
101.DEF* |
|
XBRL Taxonomy Extension Definition Linkbase Document |
|
|
|
|
|
101.LAB* |
|
XBRL Taxonomy Extension Label Linkbase Document |
|
|
|
|
|
101.PRE* |
|
XBRL Taxonomy Extension Presentation Linkbase Document |
|
* |
Filed herewith. |
|
** |
The certifications furnished in Exhibits 32.1 and 32.2 hereto are deemed to accompany this Annual Report on Form 10-K and will not be deemed “filed” for purposes of Section 18 of the Securities Exchange Act of 1934, as amended, except to the extent that the Registrant specifically incorporates it by reference. |
|
† |
Confidential treatment has been requested for certain provisions of this Exhibit pursuant to Rule 406 promulgated under the Securities Act of 1933. |
|
‡ |
Indicates compensatory plan or arrangement |