Attached files
| file | filename |
|---|---|
| EX-99 - EARNINGS RELEASE - Plymouth Industrial REIT, Inc. | ex99-1.htm |
| 8-K - Plymouth Industrial REIT, Inc. | eps8891.htm |
Exhibit 99.2
![]()
Fourth Quarter 2019
Supplemental

| Plymouth Industrial REIT, Inc. |
| Table of Contents |
| Introduction | ||
| Management, Board of Directors & Investor Contacts | 2 | |
| Executive Summary | 3 | |
| Transaction Activity - 2018/2019 | 4 | |
| Capitalization Analysis | 5 | |
| 2020 Guidance | 6 | |
| Financial Information | ||
| Consolidated Balance Sheets (unaudited) | 7 | |
| Consolidated Statements of Operations - GAAP (unaudited) | 8 | |
| Same Store Net Operating Income (NOI) | 9 | |
| NOI | 10 | |
| Earnings Before Interest, Taxes, Depreciation and Amortization for Real Estate (EBITDAre) | 11 | |
| Funds from Operations (FFO) & Adjusted Funds from Operations (AFFO) | 12 | |
| Debt Overview | 13 | |
| Operational & Portfolio Information | ||
| Property Overview - Square Feet & Occupancy | 14 | |
| Market Summary | 16 | |
| Leasing Activity | 17 | |
| Lease Expiration Schedule | 18 | |
| Appendix | ||
| Glossary | 19 |
| Forward looking statements: This supplemental package contains forward-looking statements within the meaning of the U.S. federal securities laws. We make statements in this supplemental package that are forward-looking statements, which are usually identified by the use of words such as “anticipates,” “believes,” “estimates,” “expects,” “intends,” “may,” “plans” “projects,” “seeks,” “should,” “will,” and variations of such words or similar expressions. Our forward-looking statements reflect our current views about our plans, intentions, expectations, strategies and prospects, which are based on the information currently available to us and on assumptions we have made. Although we believe that our plans, intentions, expectations, strategies and prospects as reflected in or suggested by our forward-looking statements are reasonable, we can give no assurance that our plans, intentions, expectations, strategies or prospects will be attained or achieved and you should not place undue reliance on these forward-looking statements. Furthermore, actual results may differ materially from those described in the forward-looking statements and may be affected by a variety of risks and factors. Any forward-looking statement speaks only as of the date on which it is made. New risks and uncertainties arise over time, and it is not possible for us to predict those events or how they may affect us. Except as required by law, we are not obligated to, and do not intend to, update or revise any forward-looking statements, whether as a result of new information, future events or otherwise. |
| Definitions and reconciliations: For definitions of certain terms used throughout this supplemental, including certain non-GAAP financial measures, see the Glossary on page 19. For reconciliations of the non-GAAP financial measures to the most directly comparable GAAP measures, see pages 10-12. |
4Q 2019 Supplemental
1
| Plymouth Industrial REIT, Inc. |
| Management, Board of Directors & Investor Contacts |
| Corporate | ||||
| 260 Franklin Street, Suite 700 | ||||
| Boston, Massachusetts 02110 | ||||
| 617.340.3814 | ||||
| www.plymouthreit.com | ||||
| Executive and Senior Management | ||||
| Jeffrey E. Witherell | Pendleton P. White, Jr. | Daniel C. Wright | James M. Connolly | |
| Chief Executive Officer | President and Chief Investment | Executive Vice President | Executive Vice President | |
| and Chairman | Officer | and Chief Financial Officer | Asset Management | |
| Board of Directors | ||||
| Martin Barber | Philip S. Cottone | Richard J. DeAgazio | ||
| Independent Director | Independent Director | Independent Director | ||
| David G. Gaw | Pendleton P. White, Jr. | Jeffery E. Witherell | ||
| Independent Director | President and Chief Investment | Chief Executive Officer | ||
| Officer | and Chairman | |||
| Transfer Agent |
| Continental Stock Transfer & Trust Company |
| 1 State Street, 30th Floor |
| New York, New York 10004 |
| 212.509.4000 |
| Investor Relations |
| Tripp Sullivan |
| SCR Partners |
| 615.760.1104 |
| IR@plymouthREI.com |
4Q 2019 Supplemental
2
| Plymouth Industrial REIT, Inc. |
| Executive Summary |
| Company overview: Plymouth Industrial REIT, Inc. (NYSE: PLYM) is a vertically integrated and self-managed real estate investment trust focused on the acquisition and operation of single and multi-tenant industrial properties located in secondary and select primary markets across the United States. The Company seeks to acquire properties that provide income and growth that enable the Company to leverage its real estate operating expertise to enhance shareholder value through active asset management, prudent property re-positioning and disciplined capital deployment. |
Unaudited
| As of December 31, 2019 | ||||
| Select Portfolio Statistics | ||||
| Number of Properties | 85 | |||
| Square Footage | 17,798,469 | |||
| Occupancy | 96.6% | |||
| Weighted Average Lease Term Remaining - years | 3.7 | |||
| Balance Sheet ($ in thousands) | ||||
| Cash | $ 22,398 | |||
| Gross Assets | $ 784,063 | |||
| Total Debt | $ 401,077 | |||
| Net Debt (Total Debt less Cash) | $ 378,679 | |||
| Net Debt / Gross Assets | 48.3% | |||
| Three months ended December 31, | Year ended December 31, | ||||
| Operating results ($ in thousands) | 2019 | 2018 | 2019 | 2018 | |
| Total Revenue | $ 22,483 | $ 13,637 | $ 75,290 | $ 49,217 | |
| Net Operating Income | $ 14,462 | $ 8,769 | $ 48,053 | $ 31,234 | |
| 2019 Capital Markets Activity ($ in thousands) | |||
| Secured 7 year term loan with Allianz Life Insurance Company | 3/21/2019 | $ 63,115 | |
| Repaid KeyBank Bridge Loan | 3/21/2019 | $ (63,115) | |
| Issued 278,302 shares of common shares @ average of $16.63 per share | Q1 2019 | $ 4,628 | |
| Issued 147,017 shares of common shares @ average of $16.79 per share | Q2 2019 | $ 2,469 | |
| Issued 3,425,000 common shares @ $17.50 per share | Q2 2019 | $ 59,938 | |
| Amended secured line of credit agreement with KeyBank National | 8/7/2019 | $ 100,000 | |
| Assumption of mortgage debt as part of the South Park Acquisition | 8/29/2019 | $ 9,577 | |
| Assumption of mortgage debt as part of the Orange Point Acquisition | 8/30/2019 | $ 21,004 | |
| Issued 1,194,032 shares of common shares @ average of $18.61 per share | Q3 2019 | $ 22,224 | |
| Issued 3,450,000 common shares @ $18.00 per share | Q3 2019 | $ 62,100 | |
| Issued 562,900 common shares @ $18.59 per share | Q4 2019 | $ 10,462 |
4Q 2019 Supplemental
3
| Plymouth Industrial REIT, Inc. |
| Transaction Activity - 2018/2019 |
| Unaudited ($ in thousands) (at 12/31/2019) |
| Acquisitions | |||||
| Location | Acquisition Date |
# of Properties | Purchase Price (1) |
Square Footage |
Projected Initial Yield |
| Cleveland, OH | 12/20/2019 | 1 | $ 16,800 | 405,000 | 8.5% |
| Indianapolis, IN | 12/4/2019 | 1 | $ 12,150 | 353,000 | 8.1% |
| Indianapolis, IN | 12/4/2019 | 9 | $ 49,815 | 1,747,411 | 8.7% |
| Metro St. Louis | 11/21/2019 | 1 | $ 3,525 | 59,055 | 8.4% |
| Atlanta, GA | 10/30/2019 | 1 | $ 19,400 | 295,693 | 8.4% |
| Multiple, OH | 8/30/2019 | 6 | $ 36,200 | 591,695 | 8.4% |
| Memphis, TN | 8/29/2019 | 1 | $ 22,050 | 566,281 | 8.1% |
| Chicago, IL | 8/29/2019 | 7 | $ 32,250 | 1,071,129 | 8.25% |
| St. Louis, MO | 7/29/2019 | 1 | $ 5,400 | 129,000 | 8.6% |
| Indianapolis, IN | 6/10/2019 | 1 | $ 17,100 | 484,879 | 7.7% |
| Chicago, IL | 1/5/2019 | 1 | $ 5,425 | 73,785 | 8.9% |
| Total 2019 Acquisitions | 30 | $ 220,115 | 5,776,928 | ||
| Jacksonville, FL | 12/14/2018 | 3 | $ 97,100 | 1,133,516 | 8.4% |
| Cincinnati, OH | 10/15/2018 | 1 | $ 24,800 | 1,100,000 | 8.5% |
| Cleveland, OH | 9/27/2018 | 1 | $ 27,000 | 400,184 | 7.6% |
| Elgin/Arlington Heights, IL | 4/9/2018 | 2 | $ 15,675 | 269,999 | 8.0% |
| Total 2018 Acquisitions | 7 | $ 164,575 | 2,903,699 | ||
| Total - Acquisitions | 37 | $ 384,690 | 8,680,627 |
| Subsequent Acquisitions | |||||
| Location | Acquisition Date |
# of Properties | Purchase Price (1) |
Square Footage |
Projected Initial Yield |
| Chicago, IL | 1/24/2020 | 1 | 18,750 | 465,940 | 8.6% |
| Indianapolis, IN | 1/27/2020 | 1 | 8,800 | 276,240 | 7.8% |
| Multiple, GA | 1/28/2020 | 5 | 34,700 | 924,036 | 7.6% |
| Avon, OH | 2/14/2020 | 3 | 15,750 | 408,164 | 8.2% |
| Total - Subsequent Acquisitions | 10 | $ 78,000 | 2,074,380 | ||
| Dispositions | |||||
| Location | Disposition Date |
# of Properties | Sale Price | Square Footage |
Yield |
| Milwaukee, WI | 12/19/2018 | 1 | $ 5,300 | 112,144 | 6.5% |
(1) Represents total direct consideration paid rather than GAAP cost basis.
4Q 2019 Supplemental
4
| Plymouth Industrial REIT, Inc. |
| Capitalization Analysis |
| Unaudited (in thousands except for per-share data and percentages) |
| Three Months Ended | |||||
| 12/31/2019 | 9/30/2019 | 6/30/2019 | 3/31/2019 | 12/31/2018 | |
| Common Stock Data | |||||
| Weighted-Average Common Shares Outstanding - Basic & Diluted (1) | 13,416 | 9,081 | 6,836 | 4,728 | 4,696 |
| High Closing Price | $ 19.08 | $ 19.65 | $ 19.48 | $ 16.98 | $ 15.59 |
| Low Closing Price | $ 17.48 | $ 17.54 | $ 16.55 | $ 13.16 | $ 11.45 |
| Average Closing Price | $ 18.42 | $ 18.60 | $ 17.77 | $ 15.58 | $ 13.25 |
| Closing Price (as of period end) | $ 18.39 | $ 18.32 | $ 18.94 | $ 16.82 | $ 12.61 |
| Dividends / Share (annualized) (2) | $ 1.50 | $ 1.50 | $ 1.50 | $ 1.50 | $ 1.50 |
| Dividend Yield (annualized) (3) | 8.2% | 8.2% | 7.9% | 8.9% | 11.9% |
| Common Shares Outstanding (3) | 14,141 | 13,406 | 8,755 | 5,129 | 4,822 |
| Market Value of Common Shares (3) | $ 260,053 | $ 245,598 | $ 165,816 | $ 86,270 | $ 60,804 |
| Total Market Capitalization (3) (4) | $ 661,130 | $ 568,833 | $ 458,735 | $ 412,396 | $ 382,462 |
| Equity Research Coverage (5) | |||
| D.A. Davidson & Co. | Piper Sandler & Co. | ||
| Barry Oxford | Alexander Goldfarb | ||
| 646.885.5423 | 212.466.7937 | ||
| KeyBanc Capital Markets | Wedbush Securities | ||
| Craig Mailman | Henry Coffey | ||
| 917.368.2316 | 212.833.1382 | ||
| National Securities Corp. | |||
| Guarav Mehta | |||
| 212.417.8008 | |||
Investor Conference Call and Webcast:
The Company will hold a conference call and live audio webcast, both open for the general public to hear, on February 27, 2020 at 10:00 a.m. Eastern Time. The number to call for this interactive teleconference is (412) 717-9587. A replay of the call will be available through March 5, 2020 by dialing (412) 317-0088 and entering the replay access code, 10139151.
(1) Audited consolidated financial statements and notes for the years ended December 31, 2019 and 2018 are available within our 2019 Annual Report on Form 10-K.
(2) Based on annualized dividend declared for the quarter.
(3) Based on closing price and ending shares for the last trading day of the quarter.
(4) Market value of shares plus total debt as of quarter end.
(5) The analysts listed provide research coverage on the Company. Any opinions, estimates or forecasts regarding the Company's performance made by these analysts are theirs alone and do not represent opinions, estimates or forecasts by the Company or its management. The Company does not by reference above imply its endorsement of or concurrence with such information, conclusions or recommendations.
4Q 2019 Supplemental
5
| Plymouth Industrial REIT, Inc. |
| 2020 Guidance |
| Unaudited (in thousands, except per-share amounts) |
| Full Year 2020 Range | |||
| Low | High | ||
| Net loss | $ (0.62) | $ (0.58) | |
| Depreciation and amortization | 3.08 | 3.08 | |
| Preferred stock dividend | (0.41) | (0.41) | |
| FFO attributable to common stockholders and unit holders | $ 2.05 | $ 2.09 | |
| Amortization of debt related costs | 0.08 | 0.08 | |
| Non-cash interest & dividends | - | - | |
| Stock compensation | 0.09 | 0.09 | |
| Change in fair value of warrant derivative | - | - | |
| Straight line rent | (0.03) | (0.03) | |
| Above/below market lease rents | (0.08) | (0.08) | |
| Recurring capital expenditure | (0.30) | (0.30) | |
| AFFO attributable to common stockholders and unit holders | $ 1.81 | $ 1.85 | |
| Weighted average common shares and units outstanding | 15,600 | 15,600 | |
| 2020 Guidance Assumptions | Low | High | |
| Total Revenue | $ 105,500 | $ 106,000 | |
| NOI | $ 69,200 | $ 69,600 | |
| EBITDAre | $ 60,000 | $ 60,400 | |
| General & Administrative (1) | $ 9,400 | $ 9,100 | |
| Recurring Capital Expenditure | $ 4,750 | $ 4,650 | |
| Same Store Occupancy | 95% | 97% | |
| Assumes the completion of approximately $10 million in acquisitions currently under agreement in March 2020. |
(1) Includes non-cash expenses of $1.4 million
4Q 2019 Supplemental
6
| Plymouth Industrial REIT, Inc. |
| Consolidated Balance Sheets (unaudited) |
| (in thousands) |
| 12/31/2019 (1) | 9/30/2019 | 6/30/2019 | 3/31/2019 | 12/31/2018 (1) | ||
| Assets: | ||||||
| Real estate properties: | ||||||
| Land | $ 127,439 | $ 110,287 | $ 96,139 | $ 93,495 | $ 92,628 | |
| Building and improvements | 528,349 | 455,107 | 378,595 | 365,438 | 359,982 | |
| Less accumulated depreciation | (63,877) | (57,331) | (51,676) | (46,438) | (41,279) | |
| Total real estate properties, net | $ 591,911 | $ 508,063 | $ 423,058 | $ 412,495 | $ 411,331 | |
| Cash, cash held in escrow and restricted cash | 22,398 | 36,801 | 24,194 | 14,121 | 14,961 | |
| Deferred lease intangibles, net | 57,088 | 45,768 | 34,931 | 35,339 | 37,940 | |
| Other assets | 14,084 | 11,214 | 10,525 | 11,551 | 5,931 | |
| Total assets | $ 685,481 | $ 601,846 | $ 492,708 | $ 473,506 | $ 470,163 | |
| Liabilities: | ||||||
| Debt, net | $ 397,458 | $ 319,448 | $ 287,990 | $ 320,799 | $ 317,180 | |
| Accounts payable, accrued expenses and other liabilities | 36,284 | 32,222 | 26,577 | 24,870 | 21,996 | |
| Deferred lease intangibles, net | 8,314 | 7,579 | 6,393 | 6,595 | 7,067 | |
| Total liabilities | $ 442,056 | $ 359,249 | $ 320,960 | $ 352,264 | $ 346,243 | |
| Preferred Stock - Series A | $ 48,868 | $ 48,868 | $ 48,868 | $ 48,868 | $ 48,868 | |
| Preferred Stock - Series B | $ 79,793 | $ 77,893 | $ 75,993 | $ 74,092 | $ 72,192 | |
| Equity: | ||||||
| Common stock | $ 141 | $ 134 | $ 88 | $ 51 | $ 49 | |
| Additional paid in capital | 256,259 | 249,827 | 177,557 | 125,739 | 126,327 | |
| Accumulated deficit | (148,403) | (146,072) | (143,406) | (140,929) | (137,983) | |
| Total stockholders' equity | 107,997 | 103,889 | 34,239 | (15,139) | (11,607) | |
| Non-controlling interest | 6,767 | 11,947 | 12,648 | 13,421 | 14,467 | |
| Total equity (deficit) | $ 114,764 | $ 115,836 | $ 46,887 | $ (1,718) | $ 2,860 | |
| Total liabilities, preferred stock and equity (deficit) | $ 685,481 | $ 601,846 | $ 492,708 | $ 473,506 | $ 470,163 | |
(1) Audited consolidated financial statements and notes for the years ended December 31, 2019 and 2018 are available within our 2019 Annual Report on Form 10-K.
4Q 2019 Supplemental
7
| Plymouth Industrial REIT, Inc. |
| Consolidated Statements of Operations - GAAP (unaudited) |
| (in thousands, except per-share amounts) |
| Three Months Ended | |||||||
| 12/31/2019 (1) | 9/30/2019 | 6/30/2019 | 3/31/2019 | 12/31/2018 (1) | |||
| Revenues: | |||||||
| Rental revenue | $ 17,271 | $ 14,481 | $ 12,906 | $ 12,729 | $ 10,387 | ||
| Tenant recoveries | 5,212 | 4,642 | 4,116 | 3,933 | 3,242 | ||
| Other revenue | - | - | - | 8 | |||
| Total revenues | $ 22,483 | $ 19,123 | $ 17,022 | $ 16,662 | $ 13,637 | ||
| Operating expenses: | |||||||
| Property | 8,021 | 6,920 | 6,034 | 6,262 | 4,860 | ||
| Depreciation and amortization | 11,074 | 9,399 | 8,476 | 8,432 | 7,553 | ||
| General and administrative | 2,009 | 2,135 | 1,691 | 1,646 | 1,733 | ||
| Total operating expenses | $ 21,104 | $ 18,454 | $ 16,201 | $ 16,340 | $ 14,146 | ||
| Other income (expense): | |||||||
| Interest expense | (3,887) | (3,643) | (3,576) | (3,842) | (3,957) | ||
| Loss on extinguishment of debt | - | - | - | - | (988) | ||
| Gain on sale of real estate | - | - | - | - | 1,004 | ||
| Change in fair value of warrant derivative | - | - | (102) | (79) | - | ||
| Total other income (expense) | $ (3,887) | $ (3,643) | $ (3,678) | $ (3,921) | $ (3,941) | ||
| Net loss | $ (2,508) | $ (2,974) | $ (2,857) | $ (3,599) | $ (4,450) | ||
| Less: Loss attributable to noncontrolling interest | (177) | (308) | (380) | (653) | (750) | ||
| Net loss attributable to Plymouth Industrial REIT, Inc. | $ (2,331) | $ (2,666) | $ (2,477) | $ (2,946) | $ (3,700) | ||
| Less: Preferred stock dividends | 1,565 | 1,566 | 1,566 | 1,566 | 1,072 | ||
| Less: Series B preferred stock accretion to redemption value | 1,900 | 1,900 | 1,901 | 1,900 | 359 | ||
| Less: Amount allocated to participating securities | 62 | 62 | 58 | 57 | 46 | ||
| Net loss attributable to common stockholders | $ (5,858) | $ (6,194) | $ (6,002) | $ (6,469) | $ (5,177) | ||
| Net loss per share attributable to common stockholders | $ (0.44) | $ (0.68) | $ (0.88) | $ (1.37) | $ (1.10) | ||
| Weighted-average common shares outstanding basic & diluted | 13,416 | 9,081 | 6,836 | 4,728 | 4,696 | ||
(1) Audited consolidated financial statements and notes for the years ended December 31, 2019 and 2018 are available within our 2019 Annual Report on Form 10-K.
4Q 2019 Supplemental
8
| Plymouth Industrial REIT, Inc. |
| Same Store Net Operating Income (NOI) |
| Unaudited (in thousands) |
| Trailing five quarter same store NOI - GAAP basis | Three Months Ended | |||||
| GAAP Basis | 12/31/2019 | 9/30/2019 | 6/30/2019 | 3/31/2019 | 12/31/2018 | |
| Same store properties | 51 | 51 | 51 | 51 | 51 | |
| Revenues: | ||||||
| Rental income | $ 9,870 | $ 9,898 | $ 9,647 | $ 9,495 | $ 9,216 | |
| Tenant recoveries | 3,124 | 3,158 | 3,235 | 3,027 | 3,042 | |
| Total operating revenues | $ 12,994 | $ 13,056 | $ 12,882 | $ 12,522 | $ 12,258 | |
| Property expenses | $ 4,833 | $ 4,680 | $ 4,840 | $ 4,895 | $ 4,589 | |
| Same store net operating income - GAAP basis | $ 8,161 | $ 8,376 | $ 8,042 | $ 7,627 | $ 7,669 | |
| Trailing five quarter same store NOI - Cash basis | Three Months Ended | |||||
| Cash Basis | 12/31/2019 | 9/30/2019 | 6/30/2019 | 3/31/2019 | 12/31/2018 | |
| Same store properties | 51 | 51 | 51 | 51 | 51 | |
| Revenues: | ||||||
| Rental income | $ 9,347 | $ 9,434 | $ 9,222 | $ 9,019 | $ 8,867 | |
| Tenant recoveries | 3,124 | 3,158 | 3,235 | 3,027 | 3,042 | |
| Total operating revenues | $ 12,471 | $ 12,592 | $ 12,457 | $ 12,046 | $ 11,909 | |
| Property expenses | $ 4,833 | $ 4,680 | $ 4,840 | $ 4,895 | $ 4,589 | |
| Same store net operating income - Cash basis | $ 7,638 | $ 7,912 | $ 7,617 | $ 7,151 | $ 7,320 | |
* Our Same Property Portfolio is a subset of our consolidated portfolio and includes properties that were wholly-owned by us for the entire period presented. The trailing 5 quarters same store portfolio includes properties owned as of October 1, 2018, and still owned as of December 31, 2019. Therefore, we exclude from our Same Store Portfolio any properties that were acquired or sold during the period from October 1, 2018 through December 31, 2019. The Company's computation of same store NOI may not be comparable to other REITs.
4Q 2019 Supplemental
9
| Plymouth Industrial REIT, Inc. |
| NOI |
| Unaudited (in thousands) |
| Three Months Ended | ||||||
| 12/31/2019 | 9/30/2019 | 6/30/2019 | 3/31/2019 | 12/31/2018 | ||
| Net loss | $ (2,508) | $ (2,974) | $ (2,857) | $ (3,599) | $ (4,450) | |
| General and administrative | 2,009 | 2,135 | 1,691 | 1,646 | 1,733 | |
| Depreciation and amortization | 11,074 | 9,399 | 8,476 | 8,432 | 7,553 | |
| Interest expense | 3,887 | 3,643 | 3,576 | 3,842 | 3,957 | |
| Loss on extinguishment of debt | - | - | - | - | 988 | |
| Change in fair value of warrant derivative | - | - | 102 | 79 | - | |
| Gain on sale of real estate | - | - | - | - | (1,004) | |
| Other expense (income) | - | - | - | - | (8) | |
| Net Operating Income | $ 14,462 | $ 12,203 | $ 10,988 | $ 10,400 | $ 8,769 | |
4Q 2019 Supplemental
10
| Plymouth Industrial REIT, Inc. |
| Earnings Before Interest, Taxes, Depreciation and Amortization for Real Estate (EBITDAre) |
|
Unaudited (in thousands) |
| Three Months Ended | ||||||
| 12/31/2019 | 9/30/2019 | 6/30/2019 | 3/31/2019 | 12/31/2018 | ||
| Net loss | $ (2,508) | $ (2,974) | $ (2,857) | $ (3,599) | $ (4,450) | |
| Depreciation and amortization | 11,074 | 9,399 | 8,476 | 8,432 | 7,553 | |
| Interest expense | 3,887 | 3,643 | 3,576 | 3,842 | 3,957 | |
| Loss on extinguishment of debt | - | - | - | - | 988 | |
| Gain on sale of real estate | - | - | - | - | (1,004) | |
| EBITDAre | $ 12,453 | $ 10,068 | $ 9,195 | $ 8,675 | $ 7,044 | |
4Q 2019 Supplemental
11
| Plymouth Industrial REIT, Inc. |
| Funds from Operations (FFO) & Adjusted Funds from Operations (AFFO) |
| Unaudited (in thousands, except per-share amounts) |
| Three Months Ended | ||||||
| 12/31/2019 | 9/30/2019 | 6/30/2019 | 3/31/2019 | 12/31/2018 | ||
| Net loss | $ (2,508) | $ (2,974) | $ (2,857) | $ (3,599) | $ (4,450) | |
| Depreciation and amortization | 11,074 | 9,399 | 8,476 | 8,432 | 7,553 | |
| Loss on extinguishment of debt | - | - | - | - | 988 | |
| Gain on sale of real estate | - | - | - | - | (1,004) | |
| FFO | $ 8,566 | $ 6,425 | $ 5,619 | $ 4,833 | $ 3,087 | |
| Preferred stock dividends | (1,565) | (1,566) | (1,566) | (1,566) | (1,072) | |
| FFO attributable to common stockholders and unit holders | $ 7,001 | $ 4,859 | $ 4,053 | $ 3,267 | $ 2,015 | |
| Amortization of debt related costs | 247 | 274 | 273 | 235 | 290 | |
| Non-cash interest expense | 34 | 325 | (62) | (31) | 14 | |
| Stock compensation | 330 | 282 | 305 | 288 | 203 | |
| Change in fair value of warrant derivative | - | - | 102 | 79 | - | |
| Straight line rent | (518) | (298) | (223) | (258) | (71) | |
| Above/below market lease rents | (429) | (373) | (344) | (341) | (340) | |
| Recurring capital expenditures (1) | (921) | (976) | (687) | (559) | (767) | |
| AFFO | $ 5,744 | $ 4,093 | $ 3,417 | $ 2,680 | $ 1,344 | |
| Weighted average common shares and units outstanding | 14,599 | 10,287 | 8,037 | 5,917 | 5,774 | |
| FFO attributable to common stockholders and unit holders per share | $ 0.48 | $ 0.47 | $ 0.50 | $ 0.55 | $ 0.35 | |
| AFFO attributable to common stockholders and unit holders per share | $ 0.39 | $ 0.40 | $ 0.43 | $ 0.45 | $ 0.23 | |
(1) Excludes non-recurring capital expenditures of $1,349, $1,542, $635, $1,053, and $777 for the three months ending December 31, September 30, June 30, March 31, 2019, and December 31, 2018, respectively.
4Q 2019 Supplemental
12
| Plymouth Industrial REIT, Inc. |
| Debt Overview |
| Unaudited ($ in thousands) at 12/31/2019 |
| Debt Instrument - Secured Facility | Maturity | Rate | Rate Type | Properties Encumbered | Balance | % of Total Debt | |
| $100.0 million line of credit | August-23 | 3.72%(1) | Floating | 25 | $ 78,900 | 19.7% | |
| $120.0 million AIG Loan | November-23 | 4.08% | Fixed | 20 | $ 119,592 | 29.8% | |
| $78.0 million Transamerica Loan | August-28 | 4.35% | Fixed | 17 | $ 74,214 | 18.5% | |
| $63.1 million Allianz Loan | April-26 | 4.07% | Fixed | 3 | $ 63,115 | 15.7% | |
| $21.5 million Minnesota Life Loan | May-28 | 3.78% | Fixed | 7 | $ 21,272 | 5.3% | |
| $13.9 million Fisher Park Mortgage (2) | January-27 | 5.23% | Fixed | 1 | $ 13,661 | 3.4% | |
| $9.6 million South Park Mortgage (2) | January-22 | 3.41% | Fixed | 1 | $ 9,507 | 2.4% | |
| $21.0 million Orange Point Mortgage (2) | August-24 | 4.14% | Fixed | 6 | $ 20,816 | 5.2% | |
| 80 | $ 401,077 | 100% | |||||
| Fixed Debt ($ in thousands) at 12/31/2019 | |||
| Total fixed debt | $ 322,177 | ||
| Weighted average interest rate of fixed debt | 4.15% |
| Balance Sheet ($ in thousands) at 12/31/2019 | |||
| Cash | $ 22,398 | ||
| Gross Assets | $ 784,063 | ||
| Total Debt | $ 401,077 | ||
| Net Debt | $ 378,679 |
(1) Interest rate applicable at December 31, 2019. Borrowings under the Line of Credit Agreement bear interest at either (1) the base rate (determined from the highest of (a) KeyBank’s prime rate, (b) the federal funds rate plus 0.50% and (c) the one month LIBOR rate plus 1.0%) or (2) LIBOR, plus, in either case, a spread between 200 and 250 basis points depending on our total leverage ratio.
(2) Debt assumed at acquisition.
4Q 2019 Supplemental
13
| Plymouth Industrial REIT, Inc. |
| Property Overview - Square Feet & Occupancy |
| Unaudited ($ in thousands) at 12/31/19 |
| Property | Market | Rentable Square Feet |
Leased Square Feet |
Occupancy | |
| 32 Dart Road | Atlanta | 194,800 | 194,800 | 100.0% | |
| 1665 Dogwood Drive SW | Atlanta | 198,000 | 198,000 | 100.0% | |
| 1715 Dogwood Drive | Atlanta | 100,000 | 100,000 | 100.0% | |
| 11236 Harland Drive | Atlanta | 32,361 | 32,361 | 100.0% | |
| Peachtree City | Atlanta | 295,693 | 295,694 | 100.0% | |
| Subtotal - Atlanta | 820,854 | 820,855 | 100.0% | ||
| 11351 W. 183rd Street | Chicago | 18,768 | 18,768 | 100.0% | |
| 11601 Central Ave | Chicago | 260,000 | 260,000 | 100.0% | |
| 11746 Austin Ave | Chicago | 162,714 | 162,714 | 100.0% | |
| 13040 South Pulaski Ave | Chicago | 388,403 | 388,403 | 100.0% | |
| 1355 Holmes Road | Chicago | 82,456 | 82,456 | 100.0% | |
| 13970 West Laurel Drive | Chicago | 70,196 | 70,196 | 100.0% | |
| 144 Tower Drive | Chicago | 73,785 | 71,709 | 97.2% | |
| 1455-1645 Greenleaf Ave | Chicago | 150,000 | 150,000 | 100.0% | |
| 1600 Fleetwood | Chicago | 247,000 | 247,000 | 100.0% | |
| 16801 Exchange Ave | Chicago | 455,886 | 455,886 | 100.0% | |
| 1750 South Lincoln Drive | Chicago | 499,200 | 499,200 | 100.0% | |
| 1796 Sherwin Ave | Chicago | 98,879 | 98,879 | 100.0% | |
| 1875 Holmes Road | Chicago | 134,415 | 134,415 | 100.0% | |
| 189-191 Seeger Avenue | Chicago | 25,245 | 25,245 | 100.0% | |
| 2401-2441 Commerce Drive | Chicago | 78,574 | 78,574 | 100.0% | |
| 28160 North Keith Drive | Chicago | 77,924 | 77,924 | 100.0% | |
| 3 West College Drive | Chicago | 33,263 | 33,263 | 100.0% | |
| 330 Armory Drive | Chicago | 98,340 | - | 0.0% | |
| 350 Armory Drive | Chicago | 64,310 | 56,140 | 87.3% | |
| 3841-3865 Swanson Court | Chicago | 99,625 | 99,625 | 100.0% | |
| 3940 Stern Street | Chicago | 146,798 | 146,798 | 100.0% | |
| 440 South McLean Boulevard | Chicago | 74,613 | 74,613 | 100.0% | |
| 4915 West 122nd Street | Chicago | 153,368 | 153,368 | 100.0% | |
| 6000 W. 73rd Street | Chicago | 148,091 | 148,091 | 100.0% | |
| 6510 West 73rd Street | Chicago | 306,552 | 306,552 | 100.0% | |
| 6558 W. 73rd Street | Chicago | 301,000 | 301,000 | 100.0% | |
| 6751 Sayre Ave | Chicago | 242,690 | 242,690 | 100.0% | |
| 7200 South Mason Ave | Chicago | 207,345 | 207,345 | 100.0% | |
| 7207 Mason Avenue | Chicago | 84,195 | 84,195 | 100.0% | |
| 7420 Meade Ave | Chicago | 52,344 | 52,344 | 100.0% | |
| 5110 South 6th Street | Milwaukee | 58,500 | 58,500 | 100.0% | |
| Subtotal - Chicago | 4,894,479 | 4,785,893 | 97.8% | ||
| Mosteller Distribution Center | Cincinnati | 358,386 | 358,386 | 100.0% | |
| 4115 Thunderbird Lane | Cincinnati | 70,000 | 70,000 | 100.0% | |
| Fisher Industrial Park | Cincinnati | 1,123,080 | 1,016,084 | 90.5% | |
| Cornell Commerce Center | Cincinnati | 165,521 | 152,486 | 92.1% | |
| Enterprise Business Center 1 | Cincinnati | 85,718 | 73,016 | 85.2% | |
| Enterprise Business Center 2 | Cincinnati | 82,832 | 68,647 | 82.9% | |
| Graphics Way | Cincinnati | 73,426 | 73,427 | 100.0% | |
| Orange Point | Cincinnati | 143,863 | 143,863 | 100.0% | |
| Subtotal - Cincinnati | 2,102,826 | 1,955,909 | 93.0% | ||
4Q 2019 Supplemental
14
| Plymouth Industrial REIT, Inc. |
| Property Overview - Square Feet & Occupancy |
| Unaudited ($ in thousands) at 12/31/19 |
| Property | Market | Rentable Square Feet |
Leased Square Feet |
Occupancy | |
| 14801 County Rd. 212 | Cleveland | 405,000 | 405,000 | 100.0% | |
| 1755 Enterprise Parkway | Cleveland | 255,570 | 235,370 | 92.1% | |
| 30339 Diamond Parkway | Cleveland | 400,184 | 400,184 | 100.0% | |
| Subtotal - Cleveland | 1,060,754 | 1,040,554 | 98.1% | ||
| 2120-2138 New World Drive | Columbus | 121,200 | 121,200 | 100.0% | |
| 3100 Creekside Parkway | Columbus | 340,000 | 257,962 | 75.9% | |
| 3500 Southwest Blvd | Columbus | 527,127 | 527,127 | 100.0% | |
| 7001 Americana Parkway | Columbus | 54,100 | 54,100 | 100.0% | |
| 8273 Green Meadows Drive | Columbus | 77,271 | 77,271 | 100.0% | |
| 8288 Green Meadows Drive | Columbus | 300,000 | 300,000 | 100.0% | |
| 6900-6918 Fairfield Business Drive | Columbus | 39,558 | 39,558 | 100.0% | |
| Subtotal - Columbus | 1,459,256 | 1,377,218 | 94.4% | ||
| 2900 Shadeland | Indianapolis | 933,439 | 923,156 | 98.9% | |
| 3035 North Shadeland Ave | Indianapolis | 562,497 | 510,454 | 90.7% | |
| 3169 North Shadeland Ave | Indianapolis | 44,374 | 41,960 | 94.6% | |
| 5861 W Cleveland Road | South Bend | 62,550 | 62,550 | 100.0% | |
| West Brick Road | South Bend | 101,450 | 101,450 | 100.0% | |
| 4491 N Mayflower Road | South Bend | 77,000 | 77,000 | 100.0% | |
| 5855 West Carbonmill Road | South Bend | 198,000 | 198,000 | 100.0% | |
| 4955 Ameritech Drive | South Bend | 228,000 | 228,001 | 100.0% | |
| 4430 Sam Jones Expressway | Indianapolis | 484,879 | 484,879 | 100.0% | |
| 6555 E 30th Street | Indianapolis | 314,775 | 308,700 | 98.1% | |
| 6575 E 30th Street | Indianapolis | 60,000 | 60,000 | 100.0% | |
| 6585 E 30th Street | Indianapolis | 100,000 | 100,000 | 100.0% | |
| 6635 E 30th Street | Indianapolis | 99,877 | 99,877 | 100.0% | |
| 6701 E 30th Street | Indianapolis | 7,820 | 7,820 | 100.0% | |
| 6737 E 30th Street | Indianapolis | 87,500 | 87,500 | 100.0% | |
| 6751 E 30th Street | Indianapolis | 100,000 | 100,000 | 100.0% | |
| 6951 E 30th Street | Indianapolis | 44,000 | 35,200 | 80.0% | |
| 7901 W. 21st Street | Indianapolis | 353,000 | 353,000 | 100.0% | |
| Subtotal - Indianapolis/South Bend | 3,859,161 | 3,779,547 | 97.9% | ||
| Center Point Business Park | Jacksonville | 537,800 | 518,083 | 96.3% | |
| Liberty Business Park | Jacksonville | 426,916 | 403,861 | 94.6% | |
| Salisbury Business Park | Jacksonville | 168,800 | 168,800 | 100.0% | |
| Subtotal - Jacksonville | 1,133,516 | 1,090,744 | 96.2% | ||
| 6005, 6045 & 6075 Shelby Dr. | Memphis | 202,303 | 190,951 | 94.4% | |
| 210 American Dr. | Jackson | 638,400 | 638,400 | 100.0% | |
| 3635 Knight Road | Memphis | 131,904 | 131,904 | 100.0% | |
| Business Park Drive | Memphis | 235,006 | 141,789 | 60.3% | |
| South Park | Memphis | 566,281 | 566,281 | 100.0% | |
| Subtotal - Memphis/Jackson | 1,773,894 | 1,669,325 | 94.1% | ||
| 7585 Empire Drive | Florence, KY | 148,415 | 148,415 | 100.0% | |
| 56 Milliken Road | Portland, ME | 200,625 | 200,625 | 100.0% | |
| 4 East Stow Road | Marlton, NJ | 156,634 | 139,959 | 89.4% | |
| Metro St Louis | St Louis, MO | 59,055 | 59,055 | 100.0% | |
| Phantom Drive | St Louis, MO | 129,000 | 125,318 | 97.1% | |
| Subtotal - Others | 693,729 | 673,372 | 97.1% | ||
| Total - All Properties | 17,798,469 | 17,193,417 | 96.6% | ||
4Q 2019 Supplemental
15
| Plymouth Industrial REIT, Inc. |
| Market Summary |
| Unaudited (SF and $ in thousands) (at 12/31/2019) |
| Geography | State | Properties | Total Acquisition Cost (1) |
Gross Real Estate Assets (2) |
% Gross Real Estate Assets | |
| Atlanta | GA | 5 | $ 36,445 | $ 32,733 | 5.0% | |
| Chicago | IL, WI | 31 | 187,585 | 172,520 | 26.3% | |
| Cincinnati | OH | 8 | 73,400 | 71,515 | 10.9% | |
| Cleveland | OH | 3 | 58,800 | 54,276 | 8.3% | |
| Columbus | OH | 7 | 53,482 | 51,699 | 7.9% | |
| Indianapolis/South Bend | IN | 18 | 122,515 | 108,265 | 16.5% | |
| Jacksonville | FL | 3 | 97,100 | 86,307 | 13.2% | |
| Memphis/Jackson | TN | 5 | 53,658 | 48,419 | 7.4% | |
| Other | Various | 5 | 32,925 | 29,490 | 4.5% | |
| Total | 85 | $ 715,910 | $ 655,224 | 100% | ||
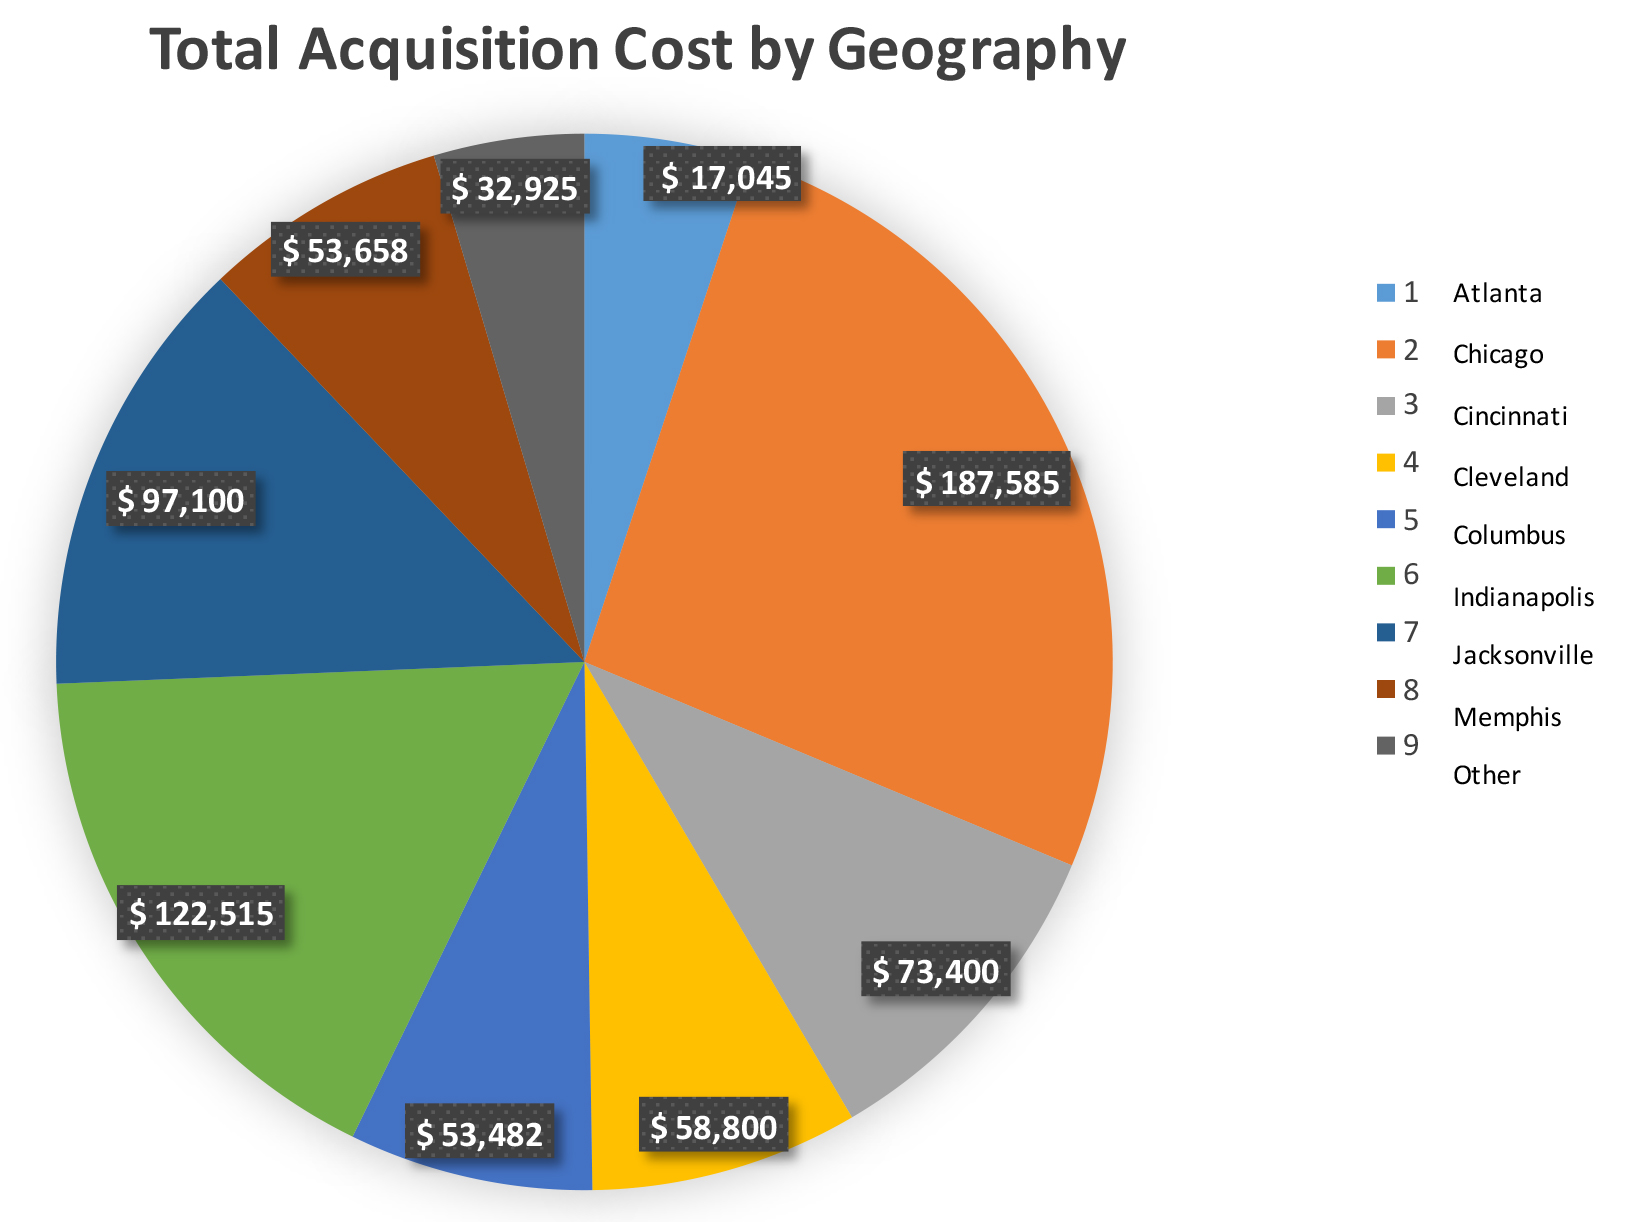
(1) Represents total direct consideration paid prior to the allocations per US GAAP.
(2) The gross book value of real estate assets as of December 31, 2019 excluding $564 in leasehold improvements and assets related to Corporate. Gross book value of real estate assets excludes depreciation and the allocation of the acquisition cost towards intangible asset and liabilities required by US GAAP.
4Q 2019 Supplemental
16
| Plymouth Industrial REIT, Inc. |
| Leasing Activity |
| Year | Type | Square Footage | Percent | Expiring Rent | New Rent | % Change | Tenant Improvements $/SF/YR | Lease Commissions $/SF/YR |
| 2018 | Renewals | 482,067 | 33.2% | $ 5.84 | $ 5.57 | -4.6% | $ 0.24 | $ 0.13 |
| New Leases | 969,207 | 66.8% | $ 2.85 | $ 3.31 | 16.4% | $ 0.39 | $ 0.21 | |
| Total | 1,451,274 | 100% | $ 3.84 | $ 4.06 | 5.7% | $ 0.34 | $ 0.18 | |
| Q1 2019 | Renewals | 545,684 | 98.6% | $ 3.18 | $ 3.63 | 14.2% | $ 0.16 | $ 0.11 |
| New Leases | 8,000 | 1.4% | $ 6.30 | $ 6.50 | 3.2% | $ - | $ 0.40 | |
| Total | 553,684 | 100% | $ 3.22 | $ 3.67 | 14.0% | $ 0.16 | $ 0.11 | |
| Q2 2019 | Renewals | 252,826 | 44.1% | $ 4.87 | $ 4.95 | 1.6% | $ 0.30 | $ 0.11 |
| New Leases | 320,232 | 55.9% | $ 2.64 | $ 3.11 | 17.8% | $ 0.27 | $ 0.17 | |
| Total | 573,058 | 100% | $ 3.62 | $ 3.92 | 8.3% | $ 0.28 | $ 0.14 | |
| Q3 2019 | Renewals | 293,806 | 51.0% | $ 5.34 | $ 5.32 | -0.4% | $ 0.22 | $ 0.17 |
| New Leases | 281,979 | 49.0% | $ 2.22 | $ 3.52 | 58.6% | $ 0.22 | $ 0.29 | |
| Total | 575,785 | 100% | $ 3.81 | $ 4.44 | 16.5% | $ 0.22 | $ 0.23 | |
| Q4 2019 | Renewals | 288,523 | 43.7% | $ 4.26 | $ 4.95 | 16.2% | $ 0.12 | $ 0.18 |
| New Leases | 371,905 | 56.3% | $ 3.51 | $ 3.57 | 1.7% | $ 0.31 | $ 0.22 | |
| Total | 660,428 | 100% | $ 3.84 | $ 4.17 | 8.6% | $ 0.22 | $ 0.20 | |
| 2019 | Renewals | 1,380,839 | 58.4% | $ 4.17 | $ 4.51 | 7.9% | $ 0.19 | $ 0.14 |
| New Leases | 982,116 | 41.6% | $ 2.88 | $ 3.43 | 19.1% | $ 0.27 | $ 0.23 | |
| Total | 2,362,955 | 100% | $ 3.64 | $ 4.06 | 11.6% | $ 0.22 | $ 0.17 |
4Q 2019 Supplemental
17
| Plymouth Industrial REIT, Inc. |
| Lease Expiration Schedule |
| Unaudited ($ in thousands) (at 12/31/2019) |
| Year | Square Footage |
Annualized Base Rent (ABR) (1) |
% of Annual Base Rent Expiring (2) |
| Available | - | $ - | - |
| 2020 | 1,317,847 | 6,546 | 9.1% |
| 2021 | 3,319,072 | 14,528 | 20.1% |
| 2022 | 2,862,010 | 12,890 | 17.8% |
| 2023 | 2,262,408 | 8,384 | 11.6% |
| 2024 | 2,422,114 | 8,992 | 12.4% |
| Thereafter | 5,009,966 | 20,985 | 29.0% |
| Total | 17,193,417 | $ 72,325 | 100% |
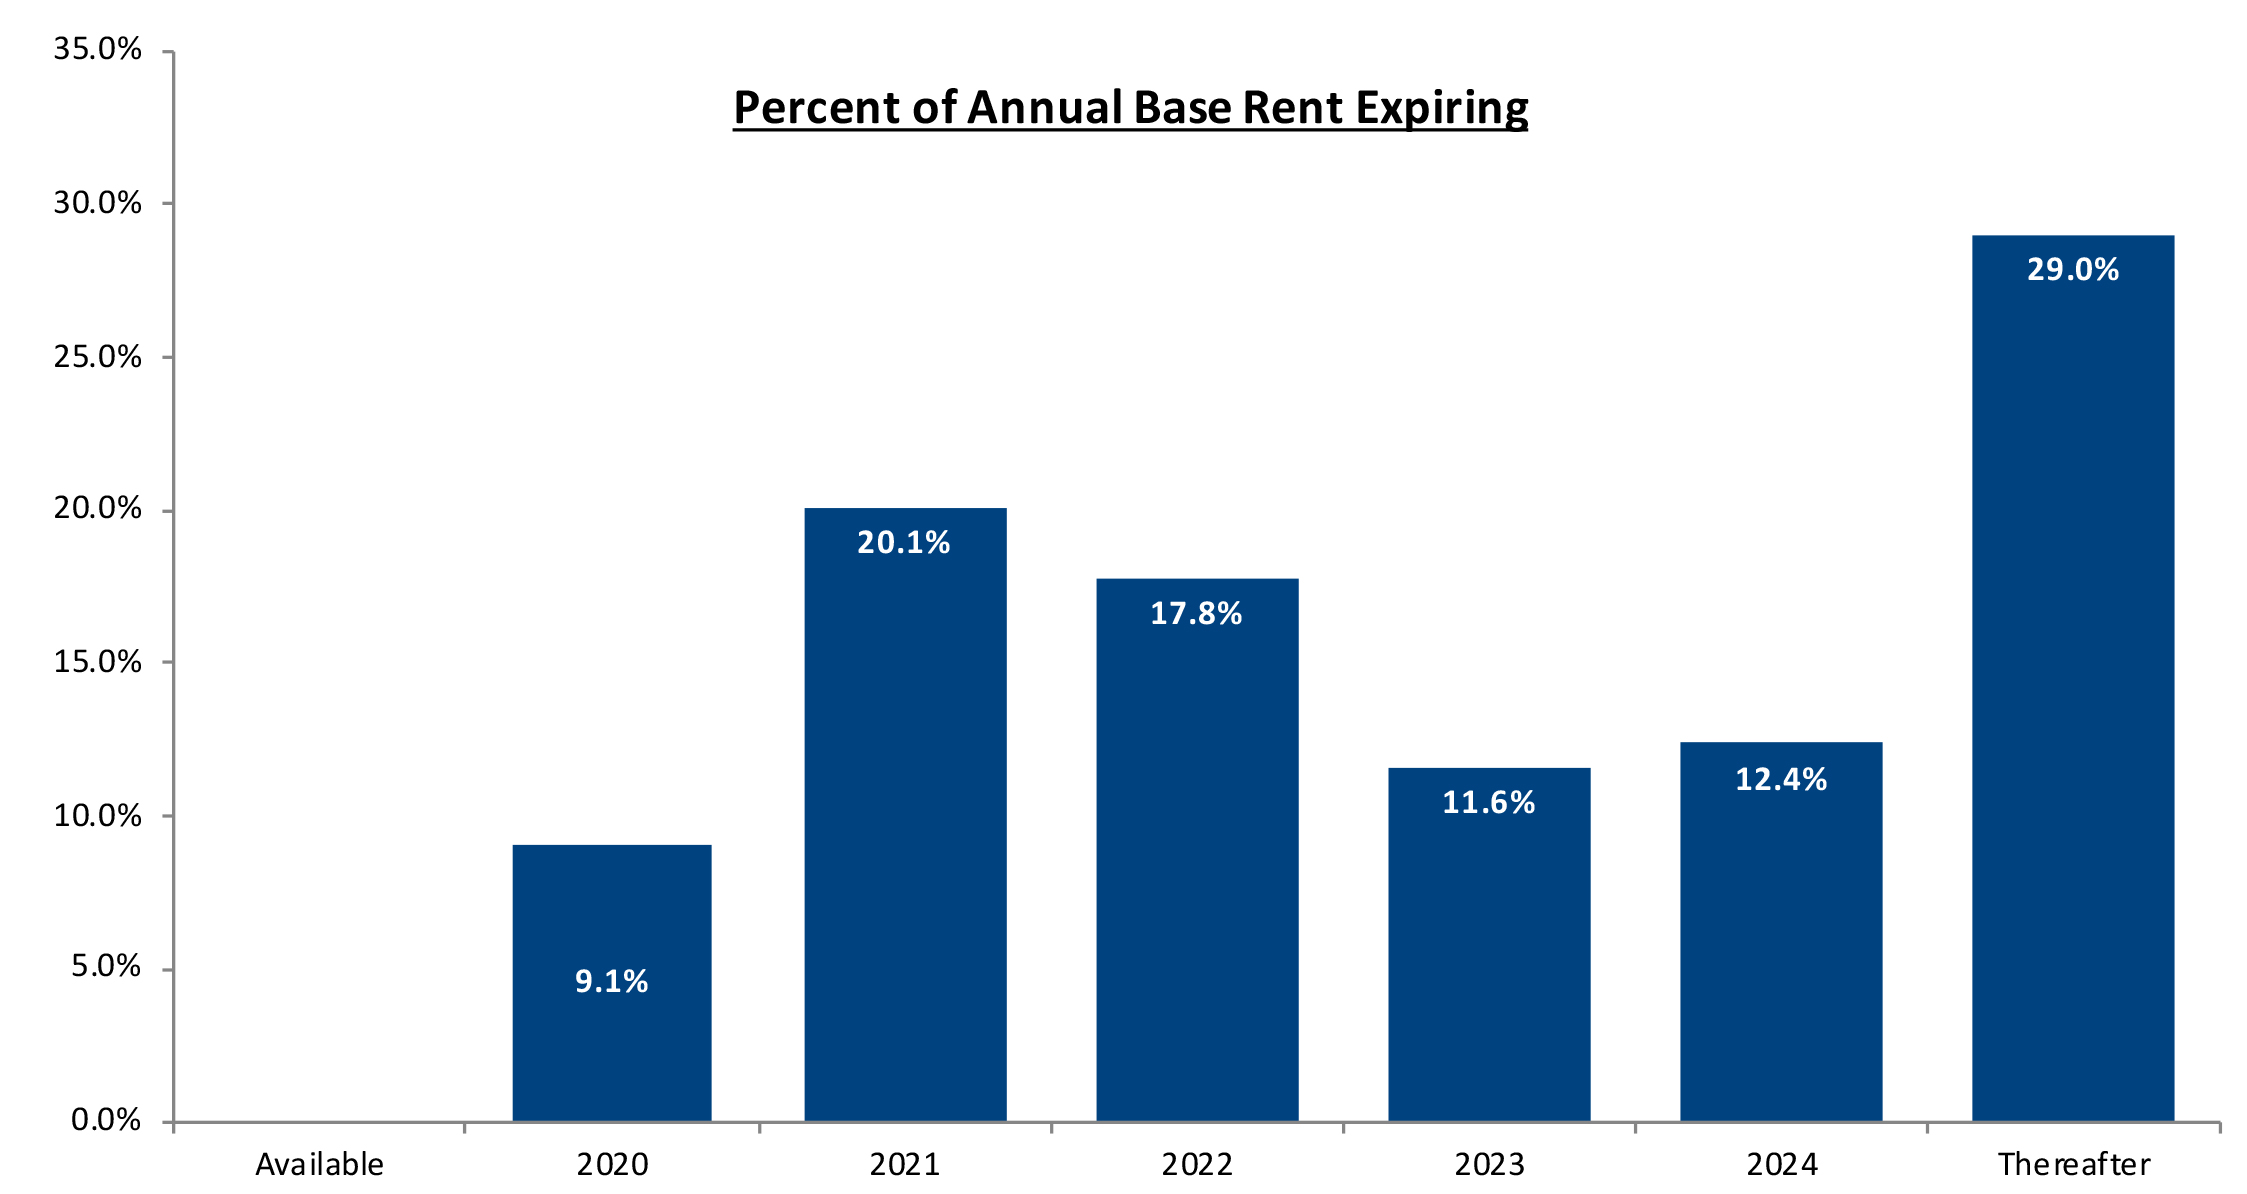
(1) Annualized base rent is calculated as monthly contracted base rent per the terms of such lease, as of December 31, 2019, multiplied by 12. Excludes rent abatements.
(2) Calculated as annualized base rent set forth in this table divided by total annualized base rent for the Company Portfolio as of December 31, 2019.
4Q 2019 Supplemental
18
| Plymouth Industrial REIT, Inc. |
| Glossary |
| Non-GAAP Financial Measures Definitions: |
| Net Operating Income (NOI): We consider net operating income, or NOI, to be an appropriate supplemental measure to net income in that it helps both investors and management understand the core operations of our properties. We define NOI as total revenue (including rental revenue, tenant reimbursements and other income) less property-level operating expenses. NOI excludes depreciation and amortization, general and administrative expenses, impairments, gain/loss on sale of real estate, interest expense, and other non-operating items. Net Operating Income (NOI): We consider net operating income, or NOI, to be an appropriate supplemental measure to net income in that it helps both investors and management understand the core operations of our properties. We define NOI as total revenue (including rental revenue, tenant reimbursements and other income) less property-level operating expenses. NOI excludes depreciation and amortization, general and administrative expenses, impairments, gain/loss on sale of real estate, interest expense, and other non-operating items. |
| Cash Net Operating Income - (Cash NOI): We define Cash NOI as NOI excluding straight-line rent adjustments and amortization of above and below market leases. |
| EBITDAre: We define earnings before interest, taxes, depreciation and amortization for real estate in accordance with the standards established by the National Association of Real Estate Investment Trusts (“NAREIT”). EBITDAre represents net income (loss), computed in accordance with GAAP, before interest expense, tax, depreciation and amortization, gains or losses on the sale of rental property, and loss on impairments. We believe that EBITDAre is helpful to investors as a supplemental measure of our operating performance as a real estate company as it is a direct measure of the actual operating results of our industrial properties. |
| Funds From Operations attributable to common stockholders and unit holders (“FFO”): Funds from operations, or FFO, is a non-GAAP financial measure that is widely recognized as a measure of REIT operating performance. We consider FFO to be an appropriate supplemental measure of our operating performance as it is based on a net income analysis of property portfolio performance that excludes non-cash items such as depreciation. The historical accounting convention used for real estate assets requires straight-line depreciation of buildings and improvements, which implies that the value of real estate assets diminishes predictably over time. Since real estate values rise and fall with market conditions, presentations of operating results for a REIT, using historical accounting for depreciation, could be less informative. In December 2018, NAREIT issued a white paper restating the definition of FFO. The purpose of the restatement was not to change the fundamental definition of FFO, but to clarify existing NAREIT guidance. The restated definition of FFO is as follows: Net Income (calculated in accordance with GAAP), excluding: (i) Depreciation and amortization related to real estate, (ii) Gains and losses from the sale of certain real estate assets, (iii) Gain and losses from change in control, and (iv) Impairment write-downs of certain real estate assets and investments in entities when the impairment is directly attributable to decreases in the value of depreciable real estate held by the entity. This restated definition does not give reference to the add back of loss on extinguishment of debt. Commencing on January 1, 2019, we adopted the restated definition of NAREIT FFO on a prospective basis and exclude the add back of loss on debt extinguishment. We define FFO consistent with the NAREIT definition. Adjustments for unconsolidated partnerships and joint ventures will be calculated to reflect FFO on the same basis. Other equity REITs may not calculate FFO as we do, and, accordingly, our FFO may not be comparable to such other REITs’ FFO. FFO should not be used as a measure of our liquidity, and is not indicative of funds available for our cash needs, including our ability to pay dividends. FFO attributable to common stockholders and unit holders represents FFO reduced by dividends paid (or declared) to holders of our preferred stock. |
| Adjusted Funds From Operations attributable to common stockholders and unit holders (“AFFO” or "Core FFO"): Adjusted funds from operations, or AFFO, is presented in addition to FFO. AFFO is defined as FFO, excluding certain non-cash operating revenues and expenses, acquisition and transaction related costs for transactions not completed and recurring capitalized expenditures. Recurring capitalized expenditures include expenditures required to maintain and re-tenant our properties, tenant improvements and leasing commissions. AFFO further adjusts FFO for certain other non-cash items, including the amortization or accretion of above or below market rents included in revenues, straight line rent adjustments, impairment losses, non-cash equity compensation and non-cash interest expense. We believe AFFO provides a useful supplemental measure of our operating performance because it provides a consistent comparison of our operating performance across time periods that is comparable for each type of real estate investment and is consistent with management’s analysis of the operating performance of our properties. As a result, we believe that the use of AFFO, together with the required GAAP presentations, provide a more complete understanding of our operating performance. As with FFO, our reported AFFO may not be comparable to other REITs’ AFFO, should not be used as a measure of our liquidity, and is not indicative of our funds available for our cash needs, including our ability to pay dividends. |
| Other Definitions: |
| GAAP: U.S generally accepted accounting principles. |
| Gross Assets: the carrying amount of total assets plus accumulated depreciation and amortization, as reported in the Company’s consolidated financial statements. For gross assets as of December 31, 2019 the calculation is as follows: |
| 12/31/2019 | |||
| Total assets | $685,481 | ||
| Add back accumulated depreciation | 63,877 | ||
| Add back intangible amortization | 34,705 | ||
| Gross assets | $784,063 |
| Non-Recurring Capital Expenditures: Non-recurring capital expenditures include capital expenditures of long lived improvements required to upgrade/replace existing systems or items that previously did not exist. |
| Occupancy: We define occupany as the percentage of total leasable square footage as the earlier of lease term commencement or revenue recognition in accordance to GAAP as of the close of the reporting period. |
| Recurring Capital Expenditures: Recurring capitalized expenditures includes capital expenditures required to maintain and re-tenant our properties, tenant improvements and leasing commissions. |
| Same Store Portfolio: Our Same Property Portfolio is a subset of our consolidated portfolio and includes properties that were wholly-owned by us for the entire period presented. The trailing 5 quarters same store portfolio includes properties owned as of October 1, 2018, and still owned as of December 31, 2019. Therefore, we exclude from our Same Store Portfolio any properties that were acquired or sold during the period from October 1, 2018 through December 31, 2019. The Company's computation of same store NOI may not be comparable to other REITs. |
| Weighted average lease term remaining: The average contractual lease term remaining as of the close of the reporting period (in years) weighted by square footage. |
4Q 2019 Supplemental
19