Attached files
| file | filename |
|---|---|
| EX-99.1 - EXHIBIT 99.1 - LAUREATE EDUCATION, INC. | tm2010967d1_ex99-1.htm |
| 8-K - FORM 8-K - LAUREATE EDUCATION, INC. | tm2010967-1_8k.htm |
Exhibit 99.2

1
© 2020 Laureate Education, Inc. Fourth Quarter & Year - End 2019 Earnings Presentation February 27, 2020

2 © 2020 Laureate Education, Inc. Forward Looking Statements This press release includes statements that express Laureate’s opinions, expectations, beliefs, plans, objectives, assumption s o r projections regarding future events or future results and therefore are, or may be deemed to be, ‘‘forward - looking statements’’ within the meaning of the federal secur ities laws, which involve risks and uncertainties. Laureate’s actual results may vary significantly from the results anticipated in these forward - looking statements . You can identify forward - looking statements because they contain words such as ‘‘believes,’’ ‘‘expects,’’ ‘‘may,’’ ‘‘will,’’ ‘‘should,’’ ‘‘seeks,’’ ‘‘approxim ate ly,’’ ‘‘intends,’’ ‘‘plans,’’ ‘‘estimates’’ or ‘‘anticipates’’ or similar expressions that concern our strategy, plans or intentions. All statements we make relating to (i) gu idance (including, but not limited to, total enrollments, revenues, Adjusted EBITDA, Adjusted EBITDA margin, costs, capital expenditures, and Free Cash Flow), (ii) our pl ann ed divestitures and (iii) our exploration of strategic alternatives and potential future plans, strategies or transactions that may be identified, explored or implemented as a result of such review process are forward - looking statements. In addition, we, through our senior management, from time to time make forward - looking p ublic statements concerning our expected future operations and performance and other developments. All of these forward - looking statements are subject to risks and uncertainties that may change at any time, including with respect to our exploration of strategic alternatives, risks and uncertainties as to the terms, timin g, structure, benefits and costs of any divestiture or separation transaction and whether one will be consummated at all, and the impact of any divestiture or separa tio n transaction on our remaining businesses. Accordingly, in light of these uncertainties, our actual results may differ materially from those we expected. W e d erive most of our forward - looking statements from our operating budgets and forecasts, which are based upon many detailed assumptions. While we believe that ou r a ssumptions are reasonable, we caution that it is very difficult to predict the impact of known factors, and, of course, it is impossible for us to anticipa te all factors that could affect our actual results. Important factors that could cause actual results to differ materially from our expectations are disclosed in our Annual Repo rt on Form 10 - K filed with the U.S. Securities and Exchange Commission (the “SEC”) on February 27, 2020, and other filings made with the SEC. These forward - looking statements speak only as of the time of this release and we do not undertake to publicly update or revise them, whether as a result of new information, futur e e vents or otherwise, except as required by law. In addition, this presentation contains various operating data, including market share and market position, that are bas ed on internal company data and management estimates. While management believes that our internal company research is reliable and the definitions of our mar ket s which are used herein are appropriate, neither such research nor these definitions have been verified by an independent source and there are inherent c hal lenges and limitations involved in compiling data across various geographies and from various sources, including those discussed under “Market and Industry Data ” i n Laureate’s filings with the SEC.
3 © 2020 Laureate Education, Inc. Presentation of Non - GAAP Measures In addition to the results provided in accordance with U.S. generally accepted accounting principles (GAAP) throughout this p res entation, Laureate provides the non - GAAP measurements of Adjusted EBITDA, Adjusted EBITDA margin and Free Cash Flow. We have included these non - GAAP measurements be cause they are key measures used by our management and board of directors to understand and evaluate our core operating performance and trends, to prepare and approve our annual budget and to develop short - and long - term operational plans. Adjusted EBITDA consists of income (loss) from continuing operations, adjusted for the items included in the accompanying rec onc iliation. The exclusion of certain expenses in calculating Adjusted EBITDA can provide a useful measure for period - to - period comparisons of our core business. Addi tionally, Adjusted EBITDA is a key input into the formula used by the compensation committee of our board of directors and our Chief Executive Officer in connec tio n with the payment of incentive compensation to our executive officers and other members of our management team. Accordingly, we believe that Adjusted EBITDA an d Adjusted EBITDA margin, which is calculated by dividing Adjusted EBITDA by revenues, provide useful information to investors and others in understand ing and evaluating our operating results in the same manner as our management and board of directors. Free Cash Flow consists of operating cash flow minus capital expenditures. Free Cash Flow provides a useful indicator about L aur eate’s ability to fund its operations and repay its debts. Laureate’s calculations of Adjusted EBITDA, Adjusted EBITDA margin and Free Cash Flow are not necessarily comparable to calcu lat ions performed by other companies and reported as similarly titled measures. These non - GAAP measures should be considered in addition to results prepare d in accordance with GAAP, but should not be considered a substitute for or superior to GAAP results. Reconciliations of non - GAAP measures to the relevant GAAP measures are provided in the appendix to this presentation in the financial tables and in our SEC filings. We evaluate our results of operations on both an as reported and an organic constant currency basis. The organic constant cur ren cy presentation, which is a non - GAAP measure, excludes the impact of fluctuations in foreign currency exchange rates, acquisitions and divestitures, and othe r i tems. We believe that providing organic constant currency information provides valuable supplemental information regarding our results of operations, consist ent with how we evaluate our performance. We calculate organic constant currency amounts using the change from prior - period average foreign exchange rates to current - period average foreign exchange rates, as applied to local - currency operating results for the current period, and then exclude the impact of acquisitio ns and divestitures and other items described in the accompanying presentation.

4 © 2020 Laureate Education, Inc. SUMMARY OVERVIEW Note: Throughout this presentation amounts may not sum to totals due to rounding Amounts presented for enrollments, Revenue and Adjusted EBITDA are for continuing operations only

5 © 2020 Laureate Education, Inc. Summary - Highlights x FY’19 Revenue & Adjusted EBITDA in - line with guidance x FY’19 Margins up 135bps …… margin progression accelerating vs. prior years x FY Free Cash Flow (1) 15% ahead of guidance x Improved Capital Structure… Net Leverage down to 1.7x x Second round of share buybacks completed … $300 million in total repurchased x Continued strong student outcomes and quality x Strategic review of entire portfolio announced in January 2020 Strong Results in 2019 Continued Focus on Value Creation (1) Free Cash Flow (FCF) defined as operating cash flow less capital expenditures

6 © 2020 Laureate Education, Inc. Portfolio Transformation Yielding Strong Operating Results Significant Transformation of The Portfolio Over the Past Two Years Note: Free Cash Flow (FCF) defined as operating cash flow less capital expenditures Adj. EBITDA Margin Free Cash Flow (FCF) Net Leverage 18.2% 2019 18.5% 19.9% 2017 2018 ($102) 2019 2018 $ 166 $ 139 2017 Quality & Rankings * 3.5x 3.0x 1.7x 2019 2018 2017 • Peru: UPC only 4 - star QStars in Peru • Brazil: Strong ENADE Score • Mexico: UVM Top 10 • Chile: UNAB Top 3 * Sources: QS Stars Rankings, Brazil ENADE scores, Guia Universitaria , SCImago Rankings

7 © 2020 Laureate Education, Inc. Q4 2019 & FULL YEAR PERFORMANCE RESULTS

8 © 2020 Laureate Education, Inc. Q4 ’19 Variance Notes ($ in millions) (Enrollments in thousands) Results Vs. Q4 ‘18 New Enrollment 32K 33% • Robust growth in Brazil DL (+62%) during an otherwise small intake quarter New Enrollment – Organic (1) 34% Total Enrollment 875K 1% Total Enrollment – Organic (1) 4% Revenue 883 (1%) Revenue – Organic/CC (2) 3% Adj. EBITDA 244 11% Adj. EBITDA – Organic/CC (2) 14% • Andean, Brazil and G&A efficiencies Adj. EBITDA margin 27.6% 297 bps • Cost actions implemented earlier in the year Adj. EBITDA margin – Organic/CC (2) 248 bps (1) Organic results exclude period - over - period impacts from acquisitions and divestitures (2) Organic Constant Currency (CC) Operations excludes the period - over - period impact from currency fluctuations, acquisitions and di vestitures, and other items. Other items include the impact of acquisition - related contingent liabilities for taxes other - than - income tax, net of changes in recorded indemnification assets. 2019 Fourth Quarter – Financial Summary Margin Progression Driven by Accelerated Transformation Initiatives
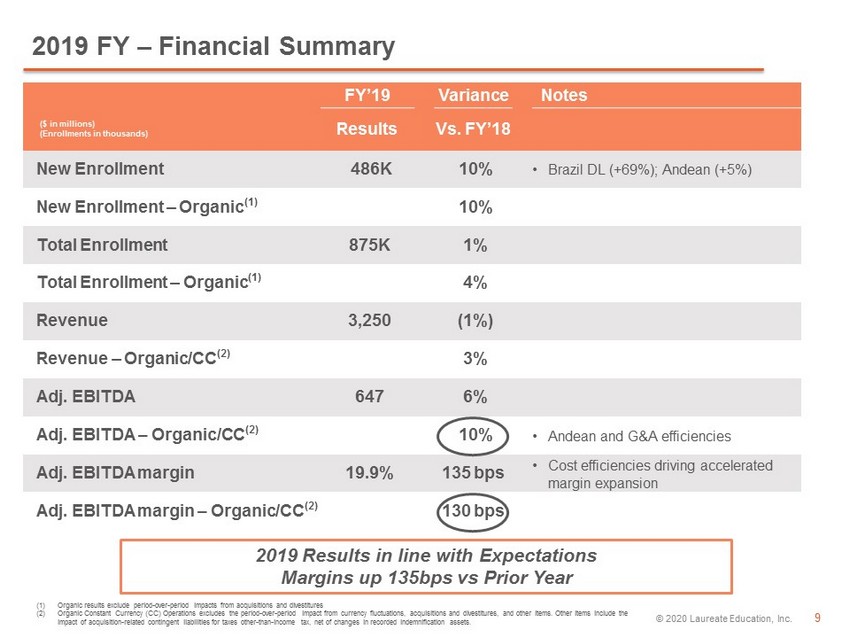
9 © 2020 Laureate Education, Inc. FY’19 Variance Notes ($ in millions) (Enrollments in thousands) Results Vs. FY’18 New Enrollment 486K 10% • Brazil DL (+69%); Andean (+5%) New Enrollment – Organic (1) 10% Total Enrollment 875K 1% Total Enrollment – Organic (1) 4% Revenue 3,250 (1%) Revenue – Organic/CC (2) 3% Adj. EBITDA 647 6% Adj. EBITDA – Organic/CC (2) 10% • Andean and G&A efficiencies Adj. EBITDA margin 19.9% 135 bps • Cost efficiencies driving accelerated margin expansion Adj. EBITDA margin – Organic/CC (2) 130 bps (1) Organic results exclude period - over - period impacts from acquisitions and divestitures (2) Organic Constant Currency (CC) Operations excludes the period - over - period impact from currency fluctuations, acquisitions and di vestitures, and other items. Other items include the impact of acquisition - related contingent liabilities for taxes other - than - income tax, net of changes in recorded indemnification assets. 2019 FY – Financial Summary 2019 Results in line with Expectations Margins up 135bps vs Prior Year
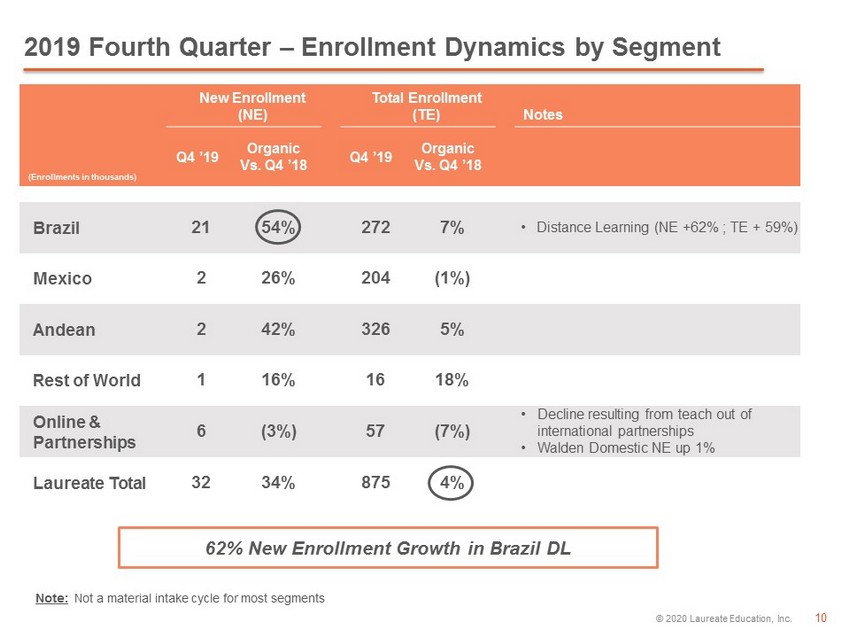
10 © 2020 Laureate Education, Inc. 62% New Enrollment Growth in Brazil DL New Enrollment (NE) Total Enrollment (TE) Notes (Enrollments in thousands) Q4 ’19 Organic Vs. Q4 ’ 18 Q4 ’19 Organic Vs. Q4 ’ 18 Brazil 21 54% 272 7% • Distance Learning (NE +62% ; TE + 59%) Mexico 2 26% 204 (1%) Andean 2 42% 326 5% Rest of World 1 16% 16 18% Online & Partnerships 6 (3%) 57 (7%) • Decline resulting from teach out of international partnerships • Walden Domestic NE up 1% Laureate Total 32 34% 875 4% 2019 Fourth Quarter – Enrollment Dynamics by Segment Note: Not a material intake cycle for most segments

11 © 2020 Laureate Education, Inc. New Enrollment (NE) Total Enrollment (TE) Notes (Enrollments in thousands) FY ’19 Organic Vs. FY ’ 18 FY ’19 Organic Vs. FY ’ 18 Brazil 198 16% 272 7% • Strong growth in Distance Learning • NE Growth DL: 69%, F2F: (2%) • TE Growth DL: 59%, F2F: (3%) Mexico 112 3% 204 (1%) Andean 133 12% 326 5% • Peru NE up 17%; Chile NE up 7% Rest of World 12 20% 16 18% Online & Partnerships 30 (9%) 57 (7%) • Decline resulting from teach out of international partnerships • Walden Domestic NE flat Laureate Total 486 10% 875 4% 2019 FY – Enrollment Dynamics by Segment +10% New Enrollment Growth, +4% Total Enrollment Growth

12 © 2020 Laureate Education, Inc. Revenue Adj. EBITDA Notes ($ millions) Q4 ‘19 Organic/CC Vs. Q4 ’ 18 (1) Q4 ‘19 Organic/CC Vs. Q4 ’ 18 (1) Brazil 157 (4%) 51 4% • Benefitting from cost actions from earlier in the year Mexico 188 1% 67 10% Andean 320 9% 97 22% • Pricing and volume Rest of World 53 20% 12 (24%) • Timing of expenses, FY Adjusted EBITDA up 19% Online & Partnerships 157 (5%) 48 (18%) • Global Partnerships teach - out and investments in Walden Corp. & Elimin. 7 - (32) 36% • G&A reductions Laureate Total 883 3% 244 14% (1) Organic Constant Currency (CC) Operations excludes the period - over - period impact from currency fluctuations, acquisitions and di vestitures, and other items. Other items include the impact of acquisition - related contingent liabilities for taxes other - than - income tax, net of changes in recorded indemnifica tion assets. Q4 Adjusted EBITDA up 14% Y - o - Y 2019 Fourth Quarter – Revenue, Adj. EBITDA Dynamics by Segment

13 © 2020 Laureate Education, Inc. Revenue Adj. EBITDA Notes ($ millions) FY‘19 Organic/CC Vs. FY ’ 18 (1) FY‘19 Organic/CC Vs. FY ’ 18 (1) Brazil 578 (3%) 82 (15%) • Reduction in FIES; cost actions driving 2H Adj. EBITDA (1) up 13% Mexico 653 2% 148 6% Andean 1,190 9% 343 13% • Strong enrollments and pricing Rest of World 190 14% 32 19% • Scaling of Australia Online & Partnerships 634 (5%) 191 (2%) • Impacted by wind down of international online Corp. & Elimin. 5 - (149) 16% • G&A reductions through simplification and scale; $125M current run - rate Laureate Total 3,250 3% 647 10% (1) Organic Constant Currency (CC) Operations excludes the period - over - period impact from currency fluctuations, acquisitions and di vestitures, and other items. Other items include the impact of acquisition - related contingent liabilities for taxes other - than - income tax, net of changes in recorded indemnifica tion assets. Profitability Trends in line with Expectations 2019 FY – Revenue, Adj. EBITDA Dynamics by Segment

14 © 2020 Laureate Education, Inc. Free Cash Flow Trends 20% Improvement in Free Cash Flow ($102) 2017 2018 2019 $ 139 $ 166 +20% (Values in USD millions) Note: Free Cash Flow (FCF) defined as operating cash flow less capital expenditures

15 © 2020 Laureate Education, Inc. 2020 OUTLOOK

16 © 2020 Laureate Education, Inc. 2020 Full Year Guidance Heatmap Market Revenue Contribution Organic/ CC Revenue Growth Adj. EBITDA Margin% Expansion Comments Latin America + + Scale benefits driving operating leverage; continued faster growth in value segment and Distance Learning Rest of World (Australia/New Zealand) ++ ++ Scale and flow through margin Online & Partnerships = - - Investments made for future growth will push margins down in the short - term Corporate N/A ++ Cost actions in 2019 to drive down G&A expenses in 2020 Laureate 2% - 3% +160bps Note: An outlook for 2020 net income and reconciliation of the forward - looking 2020 Adjusted EBITDA outlook to net income are no t being provided as the company does not currently have sufficient data to accurately estimate the variables and individual adjustments for such outl ook and reconciliation. Continued Margin Expansion Net of Additional Investments in Online

17 © 2020 Laureate Education, Inc. 2020 Guidance Summary – Growth Rates (1) Based on actual FX rates for Jan - Feb 2020, and current spot FX rates (local currency per US dollar) of MXN 18.79. BRL 4.39, CLP 806.00, PEN 3.39, AUD 1.51. FX impact may change based on fluctuations in currency rates in future periods. (2) Free Cash Flow defined as operating cash flow less capital expenditures Organic/Constant Currency (CC) Growth Rates Y - o - Y 2019 Actuals FY 2020 Guidance (1) Trend Total Enrollment 4% 4% = Revenue 3% 2% - 3% = Adjusted EBITDA 10% 8% - 11% = Free Cash Flow - FCF ($ millions) (2) $166 ~ $230 ++ Note: An outlook for 2020 net income and reconciliation of the forward - looking 2020 Adjusted EBITDA outlook to net income are no t being provided as the company does not currently have sufficient data to accurately estimate the variables and individual adjustments for such outl ook and reconciliation. 2020 Operating Trends Anticipated to be in line With 2019 Performance Material Increase Expected in FCF Conversion for 2020

18 © 2020 Laureate Education, Inc. 2020 Full Year Guidance Details Note: An outlook for 2020 net income and reconciliation of the forward - looking 2020 Adjusted EBITDA outlook to net income are no t being provided as the company does not currently have sufficient data to accurately estimate the variables and individual adjustments for such outl ook and reconciliation. (USD millions, except enrollments in thousands) Total Enrollment Revenues Adj. EBITDA 2019 Results 875 $3,250 $647 Excl: UniNorte (sold in 2019) - ($30) ($1) 2019 Excl. UniNorte 875 $3,220 $646 Organic Growth 35K $60 – $100 $54 – $69 Growth % 4% 2% - 3% 8% - 11% 2020 Guidance (Constant Currency) 910 $3,280 – $3,320 $700 – $715 FX Impact (spot FX) (1) - ($150) ($30) 2020 Guidance (@ spot FX) (1) 910 $3,130 – $3,170 $670 – $685 Growth % 4% (4%) – (2%) 4% - 6% Continued Strong Operating Trends FX Continues to be a Headwind For Reported Results (1) Based on actual FX rates for Jan - Feb 2020, and current spot FX rates (local currency per US dollar) of MXN 18.79. BRL 4.39, CLP 806.00, PEN 3.39, AUD 1.51. FX impact may change based on fluctuations in currency rates in future periods.

19 © 2020 Laureate Education, Inc. Q1 2020 Guidance Details Note: An outlook for 2020 net income and reconciliation of the forward - looking 2020 Adjusted EBITDA outlook to net income are no t being provided as the company does not currently have sufficient data to accurately estimate the variables and individual adjustments for such outl ook and reconciliation. (USD millions ) Revenues Adj. EBITDA 2019 Q1 Results $601 ($30) Excl: UniNorte (sold in 2019) ($7) $3 2019 Q1 Excl. UniNorte $594 ($27) Organic Growth ($7) – $3 $0 – $4 Growth % (1%) - 1% 0% - 15% 2020 Q1 Guidance (Constant Currency) $587 – $597 ($27) – ($23) FX Impact (spot FX) (1) ($27) $5 2020 Q1 Guidance (@ spot FX) (1) $560 – $570 ($22) – ($18) Impacted by timing of academic calendar (1) Based on actual FX rates for Jan - Feb 2020, and current spot FX rates (local currency per US dollar) of MXN 18.79. BRL 4.39, CLP 806.00, PEN 3.39, AUD 1.51. FX impact may change based on fluctuations in currency rates in future periods.

20 © 2020 Laureate Education, Inc. APPENDIX

21 © 2020 Laureate Education, Inc. Q4 ’19 B / (W) Vs. Q4 ’18 Notes ($ in millions) Reported $ % Adjusted EBITDA 244 24 11% • ($7M) impact from FX Depreciation & Amort. (47) 3 5% Interest Expense, net (28) 23 45% • Significant reduction in debt following completion of asset sales Other (97) (70) n.m. • Primarily related to FX revaluation Income Tax (20) 47 n.m. Income/(Loss) From Continuing Operations 52 26 n.m. Discontinued Operations (Net of Tax) (13) (74) n.m. • Impacted by assets sold during 2019 Net Gain/(Loss) on Sale of Disc. Ops. 21 37 n.m. Net Income / (Loss) 61 (12) n.m. 2019 Fourth Quarter – Net Income Reconciliation Reduction in Interest Expense Helping to Drive Increased Income Levels

22 © 2020 Laureate Education, Inc. FY’19 B / (W) Vs. FY’18 Notes ($ in millions) Reported $ % Adjusted EBITDA 647 36 6% • ($25M) impact from FX Depreciation & Amort. (192) 19 9% Interest Expense, net (155) 68 31% • Significant reduction in debt following completion of asset sales Other (205) (150) n.m. • $98M one - time gain in 2018 related to conversion of preferred equity; FX impact Income Tax (81) 51 n.m. Income/(Loss) From Continuing Operations 14 25 n.m. Discontinued Operations (Net of Tax) 54 (31) n.m. • Impacted by assets sold during 2019 Net Gain/(Loss) on Sale of Disc. Ops. 870 573 n.m. • Large gain primarily attributable to sale of Iberian business unit Net Income / (Loss) 938 567 n.m. 2019 FY – Net Income Reconciliation FY Results Include Large Gain on Asset Sales

23 © 2020 Laureate Education, Inc. • Q1 and Q3 are peak intake quarters, but seasonally weak earnings quarters as institutions are largely out of session during the summer season – Q1 represents the large intake for our Southern Hemisphere institutions (Brazil, Andean & Rest of World) – Q3 represents the large intake for our Northern Hemisphere institutions (Mexico and Online & Partnerships) Seasonality: Main Enrollment Intakes

24 © 2020 Laureate Education, Inc. • Large intake cycles at end of Q1 (Southern Hemisphere) and end of Q3 (Northern Hemisphere) drive seasonality of earnings (Q2 and Q4 are our strongest earnings quarters) Revenue Seasonality Adj. EBITDA Seasonality New Enrollments Seasonality Factors Affecting Seasonality Intake cycles – Q1 Southern Hemisphere – Q3 Northern Hemisphere Academic calendar FX trends Intra - Year Seasonality Trends 18% 29% 25% 28% 18% 30% 24% 28% 19% 31% 24% 27% 18% 31% 24% 27% Q1 Q2 Q3 Q4 2016 2017 2018 2019 - 3% 43% 24% 35% - 5% 44% 18% 42% - 5% 52% 21% 32% - 4% 46% 21% 38% Q1 Q2 Q3 Q4 2016 2017 2018 2019 50% 11% 35% 4% 48% 13% 35% 4% 50% 10% 35% 5% 49% 12% 33% 7% Q1 Q2 Q3 Q4 2016 2017 2018 2019

25 © 2020 Laureate Education, Inc. Financial Results & Tables

26 © 2020 Laureate Education, Inc. Financial Tables Note: Dollars in millions, except per share amounts, and may not sum to total due to rounding Consolidated Statements of Operations For the three months ended For the year ended December 31, December 31, IN MILLIONS 2019 2018 Change 2019 2018 Change Revenues $ 883.2 $ 892.5 $ (9.3 ) $ 3,250.3 $ 3,290.2 $ (39.9 ) Costs and expenses: Direct costs 669.4 652.9 16.5 2,671.6 2,697.0 (25.4 ) General and administrative expenses 58.5 105.1 (46.6 ) 252.2 299.3 (47.1 ) Loss on impairment of assets — — — 0.5 10.0 (9.5 ) Operating income 155.3 134.5 20.8 326.1 283.9 42.2 Interest income 2.7 2.5 0.2 12.2 11.9 0.3 Interest expense (30.9 ) (53.5 ) 22.6 (167.3 ) (235.2 ) 67.9 Loss on debt extinguishment (1.9 ) — (1.9 ) (28.3 ) (7.5 ) (20.8 ) (Loss) gain on derivatives (0.8 ) (3.8 ) 3.0 7.3 88.3 (81.0 ) Other income, net 0.1 1.4 (1.3 ) 9.2 12.2 (3.0 ) Foreign currency exchange (loss) gain, net (16.4 ) 11.4 (27.8 ) (27.1 ) (32.6 ) 5.5 (Loss) gain on sales and disposals of subsidiaries, net (36.3 ) 0.3 (36.6 ) (37.8 ) 0.3 (38.1 ) Income from continuing operations before income taxes and equity in net income of affiliates 71.7 92.8 (21.1 ) 94.4 121.2 (26.8 ) Income tax expense (20.0 ) (66.6 ) 46.6 (80.7 ) (131.8 ) 51.1 Equity in net income of affiliates, net of tax — — — 0.2 — 0.2 Income (loss) from continuing operations 51.7 26.1 25.6 14.0 (10.5 ) 24.5 (Loss) income from discontinued operations, net of tax (12.5 ) 61.3 (73.8 ) 53.9 84.9 (31.0 ) Gain (loss) on sales of discontinued operations, net of tax 21.4 (15.3 ) 36.7 869.8 296.6 573.2 Net income 60.6 72.1 (11.5 ) 937.7 370.9 566.8 Net loss (income) attributable to noncontrolling interests 0.3 (0.5 ) 0.8 0.8 (0.9 ) 1.7 Net income attributable to Laureate Education, Inc. $ 60.9 $ 71.6 $ (10.7 ) $ 938.5 $ 370.1 $ 568.4 Accretion of Series A convertible redeemable preferred stock and other redeemable noncontrolling interests and equity $ (0.5 ) $ (1.4 ) $ 0.9 $ (0.2 ) $ (62.8 ) $ 62.6 Gain upon conversion of Series A preferred stock — — — — 74.1 (74.1 ) Net income available to common stockholders $ 60.4 $ 70.1 $ (9.7 ) $ 938.3 $ 381.4 $ 556.9 Basic and diluted earnings per share: Basic weighted average shares outstanding 214.3 224.0 (9.7 ) 221.9 212.8 9.1 Dilutive weighted average shares outstanding 214.9 224.7 (9.8 ) 222.5 212.8 9.7 Basic earnings per share $ 0.28 $ 0.31 $ (0.03 ) $ 4.23 $ 1.79 $ 2.44 Diluted earnings per share $ 0.28 $ 0.31 $ (0.03 ) $ 4.22 $ 1.73 $ 2.49
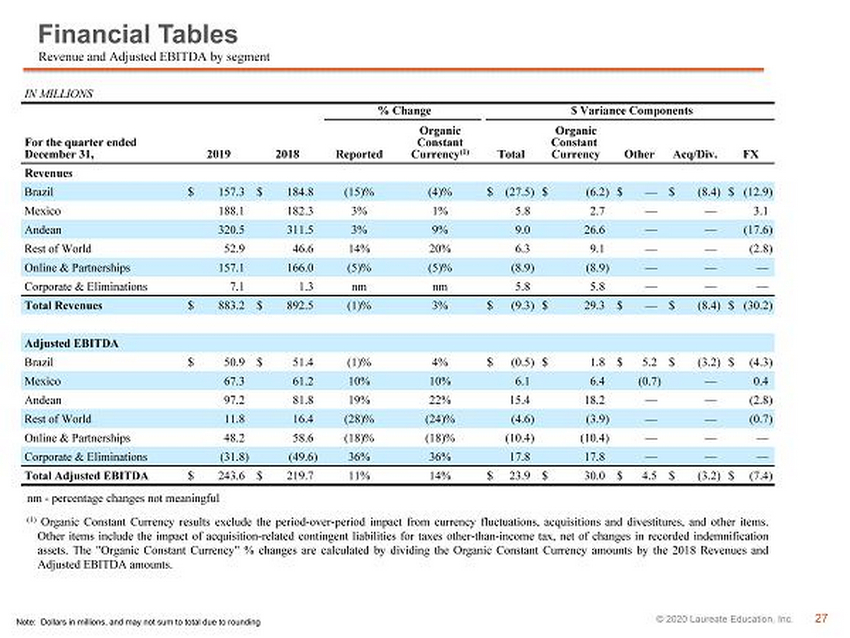
27 © 2020 Laureate Education, Inc. Financial Tables Note: Dollars in millions, and may not sum to total due to rounding Revenue and Adjusted EBITDA by segment IN MILLIONS % Change $ Variance Components For the quarter ended December 31, 2019 2018 Reported Organic Constant Currency (1) Total Organic Constant Currency Other Acq/Div. FX Revenues Brazil $ 157.3 $ 184.8 (15)% (4)% $ (27.5 ) $ (6.2 ) $ — $ (8.4 ) $ (12.9 ) Mexico 188.1 182.3 3% 1% 5.8 2.7 — — 3.1 Andean 320.5 311.5 3% 9% 9.0 26.6 — — (17.6 ) Rest of World 52.9 46.6 14% 20% 6.3 9.1 — — (2.8 ) Online & Partnerships 157.1 166.0 (5)% (5)% (8.9 ) (8.9 ) — — — Corporate & Eliminations 7.1 1.3 nm nm 5.8 5.8 — — — Total Revenues $ 883.2 $ 892.5 (1)% 3% $ (9.3 ) $ 29.3 $ — $ (8.4 ) $ (30.2 ) Adjusted EBITDA Brazil $ 50.9 $ 51.4 (1)% 4% $ (0.5 ) $ 1.8 $ 5.2 $ (3.2 ) $ (4.3 ) Mexico 67.3 61.2 10% 10% 6.1 6.4 (0.7 ) — 0.4 Andean 97.2 81.8 19% 22% 15.4 18.2 — — (2.8 ) Rest of World 11.8 16.4 (28)% (24)% (4.6 ) (3.9 ) — — (0.7 ) Online & Partnerships 48.2 58.6 (18)% (18)% (10.4 ) (10.4 ) — — — Corporate & Eliminations (31.8 ) (49.6 ) 36% 36% 17.8 17.8 — — — Total Adjusted EBITDA $ 243.6 $ 219.7 11% 14% $ 23.9 $ 30.0 $ 4.5 $ (3.2 ) $ (7.4 ) nm - percentage changes not meaningful ( 1 ) Organic Constant Currency results exclude the period - over - period impact from currency fluctuations, acquisitions and divestitures, and other items . Other items include the impact of acquisition - related contingent liabilities for taxes other - than - income tax, net of changes in recorded indemnification assets . The "Organic Constant Currency" % changes are calculated by dividing the Organic Constant Currency amounts by the 2018 Revenues and Adjusted EBITDA amounts .
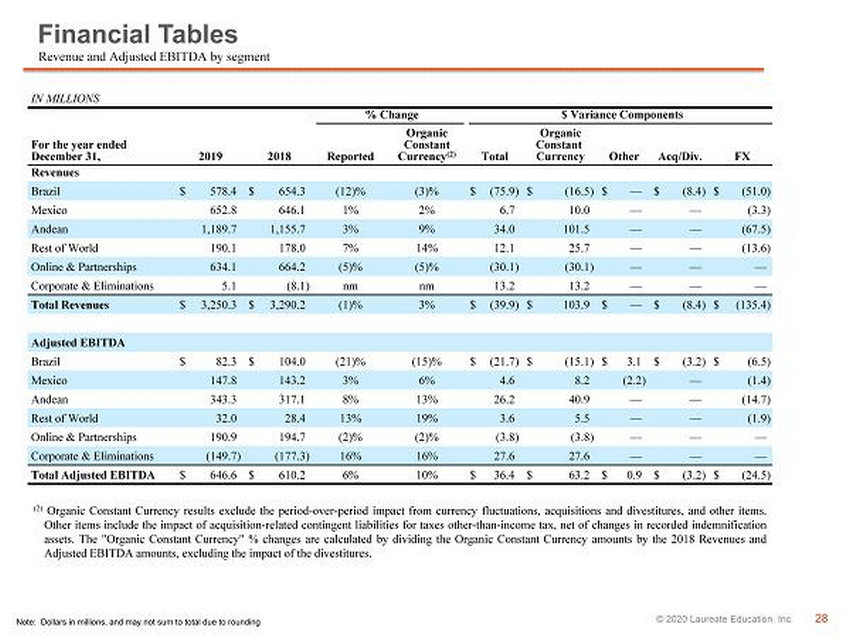
28 © 2020 Laureate Education, Inc. Financial Tables Note: Dollars in millions, and may not sum to total due to rounding Revenue and Adjusted EBITDA by segment IN MILLIONS % Change $ Variance Components For the year ended December 31, 2019 2018 Reported Organic Constant Currency (2) Total Organic Constant Currency Other Acq/Div. FX Revenues Brazil $ 578.4 $ 654.3 (12)% (3)% $ (75.9 ) $ (16.5 ) $ — $ (8.4 ) $ (51.0 ) Mexico 652.8 646.1 1% 2% 6.7 10.0 — — (3.3 ) Andean 1,189.7 1,155.7 3% 9% 34.0 101.5 — — (67.5 ) Rest of World 190.1 178.0 7% 14% 12.1 25.7 — — (13.6 ) Online & Partnerships 634.1 664.2 (5)% (5)% (30.1 ) (30.1 ) — — — Corporate & Eliminations 5.1 (8.1 ) nm nm 13.2 13.2 — — — Total Revenues $ 3,250.3 $ 3,290.2 (1)% 3% $ (39.9 ) $ 103.9 $ — $ (8.4 ) $ (135.4 ) Adjusted EBITDA Brazil $ 82.3 $ 104.0 (21)% (15)% $ (21.7 ) $ (15.1 ) $ 3.1 $ (3.2 ) $ (6.5 ) Mexico 147.8 143.2 3% 6% 4.6 8.2 (2.2 ) — (1.4 ) Andean 343.3 317.1 8% 13% 26.2 40.9 — — (14.7 ) Rest of World 32.0 28.4 13% 19% 3.6 5.5 — — (1.9 ) Online & Partnerships 190.9 194.7 (2)% (2)% (3.8 ) (3.8 ) — — — Corporate & Eliminations (149.7 ) (177.3 ) 16% 16% 27.6 27.6 — — — Total Adjusted EBITDA $ 646.6 $ 610.2 6% 10% $ 36.4 $ 63.2 $ 0.9 $ (3.2 ) $ (24.5 ) ( 2 ) Organic Constant Currency results exclude the period - over - period impact from currency fluctuations, acquisitions and divestitures, and other items . Other items include the impact of acquisition - related contingent liabilities for taxes other - than - income tax, net of changes in recorded indemnification assets . The "Organic Constant Currency" % changes are calculated by dividing the Organic Constant Currency amounts by the 2018 Revenues and Adjusted EBITDA amounts, excluding the impact of the divestitures .

29 © 2020 Laureate Education, Inc. Financial Tables Note: Dollars in millions, and may not sum to total due to rounding Consolidated Balance Sheets IN MILLIONS December 31, 2019 December 31, 2018 Change Assets Cash and cash equivalents $ 339.6 $ 387.8 $ (48.2 ) Receivables (current), net 260.5 225.3 35.2 Other current assets 259.0 266.4 (7.4 ) Current assets held for sale 83.8 337.7 (253.9 ) Property and equipment, net 1,199.2 1,275.3 (76.1 ) Operating lease right - of - use assets, net 861.9 — 861.9 Goodwill and other intangible assets 2,822.4 2,858.8 (36.4 ) Other long - term assets 383.3 383.2 0.1 Long - term assets held for sale 306.0 1,035.2 (729.2 ) Total assets $ 6,515.6 $ 6,769.6 $ (254.0 ) Liabilities and stockholders' equity Accounts payable and accrued expenses $ 516.4 $ 482.3 $ 34.1 Deferred revenue and student deposits 216.8 193.2 23.6 Total operating leases, including current portion 883.9 — 883.9 Total long - term debt, including current portion 1,379.1 2,693.9 (1,314.8 ) Total due to shareholders of acquired companies, including current portion 21.5 45.4 (23.9 ) Other liabilities 492.3 609.1 (116.8 ) Current and long - term liabilities held for sale 189.1 680.4 (491.3 ) Total liabilities 3,699.2 4,704.3 (1,005.1 ) Redeemable noncontrolling interests and equity 12.3 14.4 (2.1 ) Total stockholders' equity 2,804.2 2,050.9 753.3 Total liabilities and stockholders' equity $ 6,515.6 $ 6,769.6 $ (254.0 )

30 © 2020 Laureate Education, Inc. Financial Tables Note: Dollars in millions, and may not sum to total due to rounding Consolidated Statements of Cash Flows For the year ended December 31, IN MILLIONS 2019 2018 Change Cash flows from operating activities Net income $ 937.7 $ 370.9 $ 566.8 Depreciation and amortization 193.4 240.0 (46.6 ) Amortization of operating lease right - of - use assets 122.7 — 122.7 Loss on impairment of assets 43.8 13.1 30.7 Gain on sales and disposal of subsidiaries and property and equipment, net (796.3 ) (292.1 ) (504.2 ) Gain on derivative instruments (7.4 ) (89.1 ) 81.7 (Payments for) proceeds from settlement of derivative contracts (8.8 ) 14.1 (22.9 ) Loss on debt extinguishment 28.8 7.5 21.3 Unrealized foreign currency exchange loss 29.2 37.8 (8.6 ) Income tax receivable/payable, net (36.2 ) 48.9 (85.1 ) Working capital, excluding tax accounts (252.8 ) (77.4 ) (175.4 ) Other non - cash adjustments 86.0 123.2 (37.2 ) Net cash provided by operating activities 339.8 396.9 (57.1 ) Cash flows from investing activities Purchase of property and equipment (155.6 ) (238.0 ) 82.4 Expenditures for deferred costs (17.7 ) (19.9 ) 2.2 Settlement of derivatives related to sale of discontinued operations and net investment hedge 12.9 (10.0 ) 22.9 Receipts from sales of discontinued operations, net of cash sold, property and equipment and other 1,266.0 375.8 890.2 Proceeds from sale of investment 11.5 — 11.5 Business acquisitions, net of cash acquired (1.2 ) (17.0 ) 15.8 Investing other, net 0.9 24.6 (23.7 ) Net cash provided by investing activities 1,116.8 115.5 1,001.3 Cash flows from financing activities Decrease in long - term debt, net (1,384.6 ) (382.4 ) (1,002.2 ) Payments of deferred purchase price for acquisitions (20.2 ) (13.7 ) (6.5 ) Payment of dividends on Series A Preferred Stock — (11.1 ) 11.1 Payments to repurchase common stock (264.1 ) — (264.1 ) Payments of debt issuance costs (9.1 ) (0.6 ) (8.5 ) Financing other, net 4.0 (2.3 ) 6.3 Net cash used in by financing activities (1,674.0 ) (410.1 ) (1,263.9 ) Effects of exchange rate changes on cash (7.3 ) (13.5 ) 6.2 Change in cash included in current assets held for sale 167.8 (30.9 ) 198.7 Net change in cash and cash equivalents (57.0 ) 57.8 (114.8 ) Cash and cash equivalents at beginning of period 583.6 525.7 57.9 Cash and cash equivalents at end of period $ 526.6 $ 583.6 $ (57.0 ) Liquidity (including Undrawn Revolver) $ 547.3 $ 679.3 $ (132.0 )
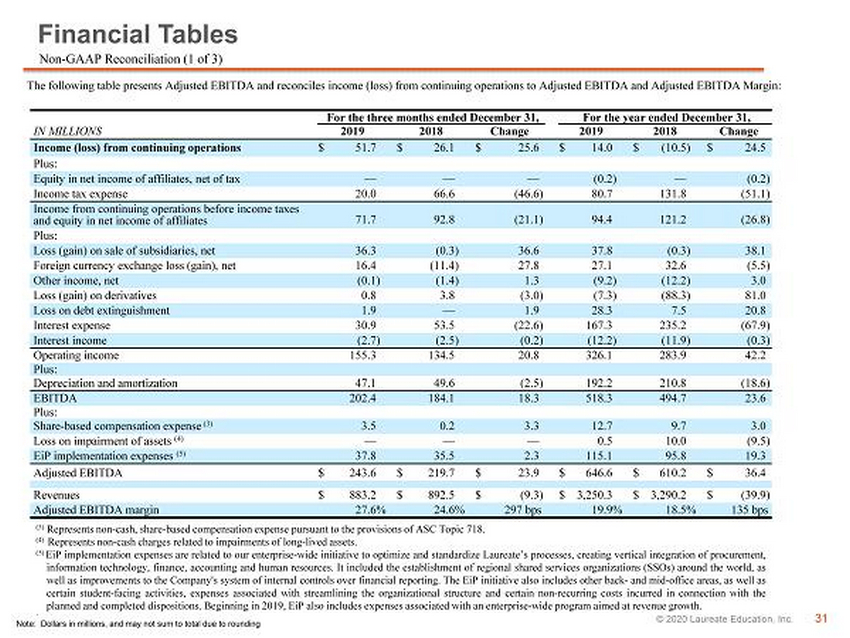
31 © 2020 Laureate Education, Inc. Financial Tables Note: Dollars in millions, and may not sum to total due to rounding Non - GAAP Reconciliation (1 of 3) The following table presents Adjusted EBITDA and reconciles income (loss) from continuing operations to Adjusted EBITDA and Adjusted EBITDA Margin : For the three months ended December 31, For the year ended December 31, IN MILLIONS 2019 2018 Change 2019 2018 Change Income (loss) from continuing operations $ 51.7 $ 26.1 $ 25.6 $ 14.0 $ (10.5 ) $ 24.5 Plus: Equity in net income of affiliates, net of tax — — — (0.2 ) — (0.2 ) Income tax expense 20.0 66.6 (46.6 ) 80.7 131.8 (51.1 ) Income from continuing operations before income taxes and equity in net income of affiliates 71.7 92.8 (21.1 ) 94.4 121.2 (26.8 ) Plus: Loss (gain) on sale of subsidiaries, net 36.3 (0.3 ) 36.6 37.8 (0.3 ) 38.1 Foreign currency exchange loss (gain), net 16.4 (11.4 ) 27.8 27.1 32.6 (5.5 ) Other income, net (0.1 ) (1.4 ) 1.3 (9.2 ) (12.2 ) 3.0 Loss (gain) on derivatives 0.8 3.8 (3.0 ) (7.3 ) (88.3 ) 81.0 Loss on debt extinguishment 1.9 — 1.9 28.3 7.5 20.8 Interest expense 30.9 53.5 (22.6 ) 167.3 235.2 (67.9 ) Interest income (2.7 ) (2.5 ) (0.2 ) (12.2 ) (11.9 ) (0.3 ) Operating income 155.3 134.5 20.8 326.1 283.9 42.2 Plus: Depreciation and amortization 47.1 49.6 (2.5 ) 192.2 210.8 (18.6 ) EBITDA 202.4 184.1 18.3 518.3 494.7 23.6 Plus: Share - based compensation expense (3) 3.5 0.2 3.3 12.7 9.7 3.0 Loss on impairment of assets (4) — — — 0.5 10.0 (9.5 ) EiP implementation expenses (5) 37.8 35.5 2.3 115.1 95.8 19.3 Adjusted EBITDA $ 243.6 $ 219.7 $ 23.9 $ 646.6 $ 610.2 $ 36.4 Revenues $ 883.2 $ 892.5 $ (9.3 ) $ 3,250.3 $ 3,290.2 $ (39.9 ) Adjusted EBITDA margin 27.6 % 24.6 % 297 bps 19.9 % 18.5 % 135 bps (3) Represents non - cash, share - based compensation expense pursuant to the provisions of ASC Topic 718. (4) Represents non - cash charges related to impairments of long - lived assets. ( 5 ) EiP implementation expenses are related to our enterprise - wide initiative to optimize and standardize Laureate’s processes, creating vertical integration of procurement, information technology, finance, accounting and human resources . It included the establishment of regional shared services organizations (SSOs) around the world, as well as improvements to the Company's system of internal controls over financial reporting . The EiP initiative also includes other back - and mid - office areas, as well as certain student - facing activities, expenses associated with streamlining the organizational structure and certain non - recurring costs incurred in connection with the planned and completed dispositions . Beginning in 2019 , EiP also includes expenses associated with an enterprise - wide program aimed at revenue growth . .

32 © 2020 Laureate Education, Inc. Financial Tables Note: Dollars in millions, and may not sum to total due to rounding Non - GAAP Reconciliation (2 of 3) The following table reconciles income ( loss ) from continuing operations to Adjusted EBITDA and Adjusted EBITDA margin for 2016 - 2018 : For the years ended December 31, IN MILLIONS 2018 2017 2016 (Loss) income from continuing operations $ (10.5 ) $ 16.4 $ 329.4 Plus: Equity in net loss (income) of affiliates, net of tax — (0.2 ) (0.1 ) Income tax expense (benefit) 131.8 (93.0 ) 33.3 Income (loss) from continuing operations before income taxes and equity in net income of affiliates 121.2 (76.8 ) 362.6 Plus: (Gain) loss on disposal of subsidiaries, net (0.3 ) 10.5 (398.1 ) Foreign currency exchange loss (gain), net 32.6 (3.2 ) (77.1 ) Other (income) expense, net (12.2 ) 1.9 (0.5 ) (Gain) loss on derivatives (88.3 ) (28.7 ) 6.1 Loss on debt extinguishment 7.5 8.4 17.4 Interest expense 235.2 334.9 390.4 Interest income (11.9 ) (11.9 ) (14.4 ) Operating income 283.9 235.2 286.4 Plus: Depreciation and amortization 210.8 201.1 196.9 EBITDA 494.7 436.3 483.3 Plus: Share - based compensation expense (6) 9.7 61.9 35.9 Loss on impairment of assets (7) 10. 0 7.1 — EiP implementation expenses (8) 95.8 100.2 54.1 Adjusted EBITDA $ 610. 2 $ 605.4 $ 573.2 Revenues $ 3,290.2 $ 3,333.1 $ 3,255.9 Adjusted EBITDA margin 18.5 % 18.2 % 17.6 % (6) Represents non - cash, share - based compensation expense pursuant to the provisions of ASC Topic 718. (7) Represents non - cash charges related to impairments of long - lived assets. ( 8 ) Excellence - in - Process ( EiP ) implementation expenses are related to our enterprise - wide initiative to optimize and standardize Laureate’s processes, creating vertical integration of procurement, information technology, finance, accounting and human resources . It included the establishment of regional shared services organizations (SSOs) around the world, as well as improvements to the Company's system of internal controls over financial reporting . The EiP initiative also includes other back - and mid - office areas, as well as certain student - facing activities, expenses associated with streamlining the organizational structure and certain non - recurring costs incurred in connection with the planned and completed dispositions .

33 © 2020 Laureate Education, Inc. Financial Tables Note: Dollars in millions, and may not sum to total due to rounding Non - GAAP Reconciliation (3 of 3) The following table presents Free cash flow and reconciles Net cash flows from operating activities to Free cash flow : For the year ended December 31, IN MILLIONS 2019 2018 2017 Net cash provided by operating activities $ 339.8 $ 396.9 $ 192.2 Capital expenditures: Purchase of property and equipment (155.6 ) (238.0 ) (274.1 ) Expenditures for deferred costs (17.7 ) (19.9 ) (19.7 ) Free cash flow $ 166.5 $ 139.0 $ (101.6 )

34 © 2020 Laureate Education, Inc.