Attached files
| file | filename |
|---|---|
| EX-10.61 - EXHIBIT 10.61 - LAUREATE EDUCATION, INC. | exhibit1061laureateofferle.htm |
| EX-32 - EXHIBIT 32 - LAUREATE EDUCATION, INC. | exhibit32toform10-qq32017.htm |
| EX-31.2 - EXHIBIT 31.2 - LAUREATE EDUCATION, INC. | exhibit312toform10-qq32017.htm |
| EX-31.1 - EXHIBIT 31.1 - LAUREATE EDUCATION, INC. | exhibit311toform10-qq32017.htm |
| EX-21.1 - EXHIBIT 21.1 - LAUREATE EDUCATION, INC. | exhibit211dated10-23x17.htm |
| EX-10.65 - EXHIBIT 10.65 - LAUREATE EDUCATION, INC. | exhibit1065option2100forml.htm |
| EX-10.64 - EXHIBIT 10.64 - LAUREATE EDUCATION, INC. | exhibit1064option1836laure.htm |
| EX-10.63 - EXHIBIT 10.63 - LAUREATE EDUCATION, INC. | exhibit1063robertzentzsepa.htm |
| EX-10.62 - EXHIBIT 10.62 - LAUREATE EDUCATION, INC. | exhibit1062timothydanielss.htm |
UNITED STATES
SECURITIES AND EXCHANGE COMMISSION
Washington, D.C. 20549
FORM 10-Q
x Quarterly Report pursuant to Section 13 or 15(d) of the Securities Exchange Act of 1934
For the quarterly period ended September 30, 2017
OR
o Transition Report pursuant to Section 13 or 15(d) of the Securities Exchange Act of 1934
For the transition period from __________ to __________.
Commission File Number: 001-38002

Laureate Education, Inc.
(Exact name of registrant as specified in its charter)
Delaware | 52-1492296 | |
(State or other jurisdiction of | (I.R.S. Employer | |
incorporation or organization) | Identification No.) | |
650 S. Exeter Street, Baltimore, Maryland | 21202 | |
(Address of principal executive offices) | (Zip Code) | |
Registrant’s telephone number, including area code: (410) 843-6100
Indicate by check mark whether the registrant (1) has filed all reports required to be filed by Section 13 or 15(d) of the Securities Exchange Act of 1934 during the preceding 12 months (or for such shorter period that the registrant was required to file such reports), and (2) has been subject to such filing requirements for the past 90 days. Yes x No o
Indicate by check mark whether the registrant has submitted electronically and posted on its corporate Web site, if any, every Interactive Data File required to be submitted and posted pursuant to Rule 405 of Regulation S-T (§232.405 of this chapter) during the preceding 12 months (or for such shorter period that the registrant was required to submit and post such files).
Yes x No o
Indicate by check mark whether the registrant is a large accelerated filer, an accelerated filer, a non-accelerated filer, smaller reporting company, or an emerging growth company. See the definitions of "large accelerated filer," "accelerated filer," "smaller reporting company," and "emerging growth company" in Rule 12b-2 of the Exchange Act.
Large accelerated filer o Accelerated filer o Non-accelerated filer x (Do not check if a smaller reporting company)
Smaller reporting company o Emerging Growth Company o
If an emerging growth company, indicate by check mark if the registrant has elected not to use the extended transition period for complying with any new or revised financial accounting standards provided pursuant to Section 13(a) of the Exchange Act. o
Indicate by check mark whether the registrant is a shell company (as defined in Rule 12b-2 of the Exchange Act). Yes o No x
Indicate the number of shares outstanding of each of the issuer's classes of common stock, as of the latest practicable date.
Class | Outstanding at September 30, 2017 | |
Class A common stock, par value $0.004 per share | 54,749,449 shares | |
Class B common stock, par value $0.004 per share | 132,574,979 shares | |
INDEX | |||
PART I. - FINANCIAL INFORMATION | Page No. | ||
Item 1. | Financial Statements (Unaudited) | ||
Consolidated Statements of Operations - Three months ended September 30, 2017 and September 30, 2016 | |||
Consolidated Statements of Operations - Nine months ended September 30, 2017 and September 30, 2016 | |||
Consolidated Statements of Comprehensive Income - Three months ended September 30, 2017 and September 30, 2016 | |||
Consolidated Statements of Comprehensive Income - Nine months ended September 30, 2017 and September 30, 2016 | |||
Consolidated Balance Sheets - September 30, 2017 and December 31, 2016 | |||
Consolidated Statements of Cash Flows - Nine months ended September 30, 2017 and September 30, 2016 | |||
Notes to Consolidated Financial Statements | |||
Item 2. | Management's Discussion and Analysis of Financial Condition and Results of Operations | ||
Item 3. | Quantitative and Qualitative Disclosures About Market Risk | ||
Item 4. | Controls and Procedures | ||
PART II. - OTHER INFORMATION | |||
Item 1. | Legal Proceedings | ||
Item 1A. | Risk Factors | ||
Item 2. | Unregistered Sales of Equity Securities and Use of Proceeds | ||
Item 6. | Exhibits | ||
SIGNATURES | |||
1
PART I - FINANCIAL INFORMATION
Item 1. Financial Statements (Unaudited)
LAUREATE EDUCATION, INC. AND SUBSIDIARIES
Consolidated Statements of Operations
IN THOUSANDS, except per share amounts | |||||||
For the three months ended September 30, | 2017 | 2016 | |||||
(Unaudited) | (Unaudited) | ||||||
Revenues | $ | 983,394 | $ | 929,855 | |||
Costs and expenses: | |||||||
Direct costs | 924,091 | 864,203 | |||||
General and administrative expenses | 64,999 | 53,150 | |||||
Operating (loss) income | (5,696 | ) | 12,502 | ||||
Interest income | 5,840 | 3,437 | |||||
Interest expense | (76,454 | ) | (104,781 | ) | |||
Loss on debt extinguishment | — | (15,682 | ) | ||||
(Loss) gain on derivatives | (19,930 | ) | 516 | ||||
Other (expense) income, net | (718 | ) | 353 | ||||
Foreign currency exchange gain, net | 7,327 | 26,329 | |||||
Gain on sales of subsidiaries, net | — | 155,151 | |||||
(Loss) income from continuing operations before income taxes | (89,631 | ) | 77,825 | ||||
Income tax (expense) benefit | (13,859 | ) | 3,105 | ||||
Net (loss) income | (103,490 | ) | 80,930 | ||||
Net loss attributable to noncontrolling interests | 5,531 | 5,387 | |||||
Net (loss) income attributable to Laureate Education, Inc. | $ | (97,959 | ) | $ | 86,317 | ||
Accretion of Series A convertible redeemable preferred stock and other redeemable noncontrolling interests and equity | (84,060 | ) | 2,160 | ||||
Net (loss) income available to common stockholders | $ | (182,019 | ) | $ | 88,477 | ||
Basic and diluted (loss) earnings per share: | |||||||
Basic (loss) earnings per share | $ | (1.02 | ) | $ | 0.66 | ||
Diluted (loss) earnings per share | $ | (1.02 | ) | $ | 0.66 | ||
The accompanying notes are an integral part of these consolidated financial statements.
2
LAUREATE EDUCATION, INC. AND SUBSIDIARIES
Consolidated Statements of Operations
IN THOUSANDS, except per share amounts | |||||||
For the nine months ended September 30, | 2017 | 2016 | |||||
(Unaudited) | (Unaudited) | ||||||
Revenues | $ | 3,116,766 | $ | 3,068,299 | |||
Costs and expenses: | |||||||
Direct costs | 2,719,569 | 2,697,820 | |||||
General and administrative expenses | 221,909 | 158,566 | |||||
Operating income | 175,288 | 211,913 | |||||
Interest income | 14,994 | 13,305 | |||||
Interest expense | (278,049 | ) | (314,383 | ) | |||
Loss on debt extinguishment | (8,425 | ) | (17,363 | ) | |||
Gain (loss) on derivatives | 19,187 | (8,235 | ) | ||||
Other expense, net | (667 | ) | (964 | ) | |||
Foreign currency exchange (loss) gain, net | (109 | ) | 80,263 | ||||
(Loss) gain on sales of subsidiaries, net | (172 | ) | 398,412 | ||||
(Loss) income from continuing operations before income taxes and equity in net income of affiliates | (77,953 | ) | 362,948 | ||||
Income tax expense | (28,793 | ) | (35,246 | ) | |||
Equity in net income of affiliates, net of tax | 1 | 20 | |||||
Net (loss) income | (106,745 | ) | 327,722 | ||||
Net loss attributable to noncontrolling interests | 2,365 | 2,817 | |||||
Net (loss) income attributable to Laureate Education, Inc. | $ | (104,380 | ) | $ | 330,539 | ||
Accretion of Series A convertible redeemable preferred stock and other redeemable noncontrolling interests and equity | (192,141 | ) | 3,233 | ||||
Net (loss) income available to common stockholders | $ | (296,521 | ) | $ | 333,772 | ||
Basic and diluted (loss) earnings per share: | |||||||
Basic (loss) earnings per share | $ | (1.77 | ) | $ | 2.50 | ||
Diluted (loss) earnings per share | $ | (1.77 | ) | $ | 2.49 | ||
The accompanying notes are an integral part of these consolidated financial statements.
3
LAUREATE EDUCATION, INC. AND SUBSIDIARIES
Consolidated Statements of Comprehensive Income
IN THOUSANDS | |||||||
For the three months ended September 30, | 2017 | 2016 | |||||
(Unaudited) | (Unaudited) | ||||||
Net (loss) income | $ | (103,490 | ) | $ | 80,930 | ||
Other comprehensive income (loss): | |||||||
Foreign currency translation adjustment, net of tax of $0 for both periods | 64,742 | (15,893 | ) | ||||
Unrealized gain on derivative instruments, net of tax of $0 for both periods | 525 | 2,386 | |||||
Minimum pension liability adjustment, net of tax of $0 for both periods | — | 63 | |||||
Total other comprehensive income (loss) | 65,267 | (13,444 | ) | ||||
Comprehensive (loss) income | (38,223 | ) | 67,486 | ||||
Net comprehensive loss attributable to noncontrolling interests | 4,065 | 4,506 | |||||
Comprehensive (loss) income attributable to Laureate Education, Inc. | $ | (34,158 | ) | $ | 71,992 | ||
The accompanying notes are an integral part of these consolidated financial statements.
4
LAUREATE EDUCATION, INC. AND SUBSIDIARIES
Consolidated Statements of Comprehensive Income
IN THOUSANDS | |||||||
For the nine months ended September 30, | 2017 | 2016 | |||||
(Unaudited) | (Unaudited) | ||||||
Net (loss) income | $ | (106,745 | ) | $ | 327,722 | ||
Other comprehensive income (loss): | |||||||
Foreign currency translation adjustment, net of tax of $0 for both periods | 196,593 | (45,005 | ) | ||||
Unrealized gain on derivative instruments, net of tax of $0 for both periods | 6,625 | 5,509 | |||||
Minimum pension liability adjustment, net of tax of $0 and $1,900, respectively | — | 8,948 | |||||
Total other comprehensive income (loss) | 203,218 | (30,548 | ) | ||||
Comprehensive income | 96,473 | 297,174 | |||||
Net comprehensive loss attributable to noncontrolling interests | 10 | 1,817 | |||||
Comprehensive income attributable to Laureate Education, Inc. | $ | 96,483 | $ | 298,991 | |||
The accompanying notes are an integral part of these consolidated financial statements.
5
LAUREATE EDUCATION, INC. AND SUBSIDIARIES
Consolidated Balance Sheets
IN THOUSANDS, except per share amounts | |||||||
September 30, 2017 | December 31, 2016 | ||||||
Assets | (Unaudited) | ||||||
Current assets: | |||||||
Cash and cash equivalents (includes VIE amounts of $265,494 and $169,074, see Note 2) | $ | 504,962 | $ | 464,965 | |||
Restricted cash and investments | 199,300 | 189,319 | |||||
Receivables: | |||||||
Accounts and notes receivable | 771,597 | 494,646 | |||||
Other receivables | 22,446 | 23,758 | |||||
Related party receivables | 4,863 | 6,931 | |||||
Allowance for doubtful accounts | (199,759 | ) | (190,499 | ) | |||
Receivables, net | 599,147 | 334,836 | |||||
Income tax receivable | 59,866 | 29,447 | |||||
Prepaid expenses and other current assets | 104,376 | 97,234 | |||||
Current assets held for sale | 92,248 | — | |||||
Total current assets (includes VIE amounts of $549,721 and $322,210, see Note 2) | 1,559,899 | 1,115,801 | |||||
Notes receivable, net | 12,713 | 61,157 | |||||
Property and equipment: | |||||||
Land | 376,000 | 396,821 | |||||
Buildings | 1,162,800 | 1,219,783 | |||||
Furniture, equipment and software | 1,206,392 | 1,160,350 | |||||
Leasehold improvements | 440,134 | 399,555 | |||||
Construction in-progress | 72,526 | 103,205 | |||||
Accumulated depreciation and amortization | (1,227,618 | ) | (1,128,081 | ) | |||
Property and equipment, net | 2,030,234 | 2,151,633 | |||||
Land use rights, net | 44,470 | 45,275 | |||||
Goodwill | 2,028,286 | 1,934,464 | |||||
Other intangible assets: | |||||||
Tradenames | 1,330,302 | 1,307,633 | |||||
Other intangible assets, net | 43,206 | 46,700 | |||||
Deferred costs, net | 62,043 | 57,748 | |||||
Deferred income taxes | 152,241 | 142,130 | |||||
Derivative instruments | 29,721 | 4,464 | |||||
Other assets | 209,648 | 195,465 | |||||
Long-term assets held for sale | 279,801 | — | |||||
Total assets (includes VIE amounts of $1,558,050 and $1,309,113, see Note 2) | $ | 7,782,564 | $ | 7,062,470 | |||
The accompanying notes are an integral part of these consolidated financial statements.
6
LAUREATE EDUCATION, INC. AND SUBSIDIARIES
Consolidated Balance Sheets (continued)
IN THOUSANDS, except per share amounts | |||||||
September 30, 2017 | December 31, 2016 | ||||||
Liabilities and stockholders' equity | (Unaudited) | ||||||
Current liabilities: | |||||||
Accounts payable | $ | 88,122 | $ | 86,699 | |||
Accrued expenses | 367,560 | 368,973 | |||||
Accrued compensation and benefits | 244,440 | 239,495 | |||||
Deferred revenue and student deposits | 729,855 | 362,891 | |||||
Current portion of long-term debt | 185,848 | 178,989 | |||||
Current portion of due to shareholders of acquired companies | 28,881 | 118,679 | |||||
Income taxes payable | 31,074 | 30,371 | |||||
Derivative instruments | — | 5,218 | |||||
Other current liabilities | 60,919 | 48,917 | |||||
Current liabilities held for sale | 158,280 | — | |||||
Total current liabilities (includes VIE amounts of $504,325 and $320,922, see Note 2) | 1,894,979 | 1,440,232 | |||||
Long-term debt, less current portion | 3,024,560 | 3,629,375 | |||||
Due to shareholders of acquired companies, less current portion | 52,294 | 92,269 | |||||
Deferred compensation | 13,032 | 14,128 | |||||
Income taxes payable | 120,029 | 135,140 | |||||
Deferred income taxes | 450,718 | 452,084 | |||||
Derivative instruments | 8,094 | 7,750 | |||||
Other long-term liabilities | 246,522 | 270,267 | |||||
Long-term liabilities held for sale | 73,199 | — | |||||
Total liabilities (includes VIE amounts of $606,896 and $424,297, see Note 2) | 5,883,427 | 6,041,245 | |||||
Series A convertible redeemable preferred stock, par value $0.001 per share – 512 shares authorized, 400 and 343 shares issued and outstanding as of September 30, 2017 and December 31, 2016, respectively | 302,693 | 332,957 | |||||
Redeemable noncontrolling interests and equity | 14,215 | 23,876 | |||||
Stockholders' equity: | |||||||
Preferred stock, par value $0.001 per share – 49,488 shares authorized, no shares issued and outstanding as of September 30, 2017 and December 31, 2016 | — | — | |||||
Class A common stock, par value $0.004 per share – 700,000 shares authorized, 54,749 shares issued and outstanding as of September 30, 2017 and no shares authorized, issued and outstanding as of December 31, 2016 | 219 | — | |||||
Class B common stock, par value $0.004 per share – 175,000 shares authorized, 132,575 shares issued and outstanding as of September 30, 2017 and no shares authorized, issued and outstanding as of December 31, 2016 | 531 | — | |||||
Common stock, par value $0.004 per share – no shares authorized, issued and outstanding as of September 30, 2017 and 175,000 shares authorized, 133,376 shares issued and outstanding as of December 31, 2016 | — | 534 | |||||
Additional paid-in capital | 3,545,365 | 2,721,432 | |||||
Accumulated deficit | (1,142,081 | ) | (1,037,701 | ) | |||
Accumulated other comprehensive loss | (852,356 | ) | (1,052,055 | ) | |||
Total Laureate Education, Inc. stockholders' equity | 1,551,678 | 632,210 | |||||
Noncontrolling interests | 30,551 | 32,182 | |||||
Total stockholders' equity | 1,582,229 | 664,392 | |||||
Total liabilities and stockholders' equity | $ | 7,782,564 | $ | 7,062,470 | |||
7
LAUREATE EDUCATION, INC. AND SUBSIDIARIES
Consolidated Statements of Cash Flows
IN THOUSANDS | |||||||
For the nine months ended September 30, | 2017 | 2016 | |||||
Cash flows from operating activities | (Unaudited) | (Unaudited) | |||||
Net (loss) income | $ | (106,745 | ) | $ | 327,722 | ||
Adjustments to reconcile net (loss) income to net cash provided by operating activities: | |||||||
Depreciation and amortization | 199,394 | 202,735 | |||||
Loss (gain) on sale of subsidiary and disposal of property and equipment | 3,050 | (398,499 | ) | ||||
(Gain) loss on derivative instruments | (19,621 | ) | 7,211 | ||||
Loss on debt extinguishment | 8,425 | 17,363 | |||||
Payment of redemption and call premiums and fees on debt modification | (65,225 | ) | — | ||||
Non-cash interest expense | 29,809 | 36,892 | |||||
Interest paid on deferred purchase price for acquisitions | (39,419 | ) | — | ||||
Non-cash share-based compensation expense | 43,969 | 28,939 | |||||
Bad debt expense | 88,677 | 76,141 | |||||
Deferred income taxes | (21,787 | ) | (12,309 | ) | |||
Unrealized foreign currency exchange loss (gain) | 4,852 | (73,641 | ) | ||||
Non-cash loss from non-income tax contingencies | 4,032 | 6,016 | |||||
Other, net | 1,637 | 1,574 | |||||
Changes in operating assets and liabilities: | |||||||
Restricted cash | (1,743 | ) | (6,826 | ) | |||
Receivables | (344,661 | ) | (350,078 | ) | |||
Prepaid expenses and other assets | (69,843 | ) | (28,236 | ) | |||
Accounts payable and accrued expenses | 14,624 | (10,655 | ) | ||||
Income tax receivable/payable, net | (19,815 | ) | (23,550 | ) | |||
Deferred revenue and other liabilities | 435,173 | 395,171 | |||||
Net cash provided by operating activities | 144,783 | 195,970 | |||||
Cash flows from investing activities | |||||||
Purchase of property and equipment | (134,629 | ) | (132,904 | ) | |||
Expenditures for deferred costs | (12,712 | ) | (13,996 | ) | |||
Receipts from sale of subsidiary and property and equipment | 1,180 | 553,860 | |||||
Property insurance recoveries | 370 | 1,431 | |||||
Settlement of derivatives related to sale of subsidiaries | — | (5,663 | ) | ||||
Business acquisitions, net of cash acquired | (835 | ) | — | ||||
Payments from related parties | 349 | 1,634 | |||||
Change in restricted cash and investments | (3,921 | ) | (12,032 | ) | |||
Net cash (used in) provided by investing activities | (150,198 | ) | 392,330 | ||||
Cash flows from financing activities | |||||||
Proceeds from issuance of long-term debt, net of original issue discount | 2,349,673 | 513,014 | |||||
Payments on long-term debt | (2,695,511 | ) | (1,037,591 | ) | |||
Payments of deferred purchase price for acquisitions | (93,813 | ) | (9,574 | ) | |||
Payments to purchase noncontrolling interests | — | (25,665 | ) | ||||
Proceeds from issuance of convertible redeemable preferred stock, net of issuance costs | 55,290 | — | |||||
Payment of dividends on Series A Preferred Stock and to noncontrolling interests | (5,252 | ) | (550 | ) | |||
Proceeds from initial public offering, net of issuance costs | 456,359 | — | |||||
Proceeds from exercise of stock options | — | 252 | |||||
Withholding of shares to satisfy tax withholding for vested stock awards and exercised stock options | (1,725 | ) | (1,346 | ) | |||
Payments of debt issuance costs | (11,298 | ) | (10,593 | ) | |||
Noncontrolling interest holder's loan to subsidiaries | 943 | 816 | |||||
Distributions to noncontrolling interest holders | (847 | ) | (1,447 | ) | |||
Net cash provided by (used in) financing activities | 53,819 | (572,684 | ) | ||||
Effects of exchange rate changes on cash | 26,127 | 7,182 | |||||
Change in cash included in current assets held for sale | (34,534 | ) | — | ||||
Net change in cash and cash equivalents | 39,997 | 22,798 | |||||
Cash and cash equivalents at beginning of period | 464,965 | 458,673 | |||||
Cash and cash equivalents at end of period | $ | 504,962 | $ | 481,471 | |||
The accompanying notes are an integral part of these consolidated financial statements.
8
Laureate Education, Inc. and Subsidiaries
Notes to Consolidated Financial Statements (Unaudited)
(Dollars and shares in thousands)
Note 1. Description of Business
Laureate Education, Inc. and subsidiaries (hereinafter Laureate, we, us, our, or the Company) provide higher education programs and services to students through an international network of licensed universities and higher education institutions (institutions). Laureate's programs are provided through institutions that are campus-based and internet-based, or through electronically distributed educational programs (online). On October 1, 2015, we redomiciled in Delaware as a public benefit corporation as a demonstration of our long-term commitment to our mission to benefit our students and society.
On February 6, 2017, the Company completed an initial public offering (IPO) of shares of its Class A common stock, a newly established class of the Company’s common stock of which 700,000 shares were authorized and, as of February 1, 2017, the Company's shares became listed on the Nasdaq Global Select Market under the symbol ‘‘LAUR’’. The Company sold 35,000 shares of its Class A common stock in the IPO at a price of $14.00 per share, resulting in net proceeds to the Company, after deducting underwriting discounts and commissions and offering expenses payable by us, of $456,359. On January 31, 2017, in connection with our IPO, our Amended and Restated Certificate of Incorporation was accepted for filing by the Secretary of State of the State of Delaware, and effective upon such filing, a 4 to 1 reverse stock split for our common stock was consummated and each share of our common stock then outstanding was automatically reclassified into one fourth of one share of Class B Common Stock, a newly established class of the Company’s common stock, with any resulting fractional shares rounded down to the next whole share. These financial statements reflect the reverse stock split.
As previously disclosed in our Quarterly Report on Form 10-Q for the period ended June 30, 2017, and as further discussed in Note 6, Business and Geographic Segment Information, effective August 1, 2017, we changed our operating segments in order to realign our segments according to how our chief operating decision maker now allocates resources and assesses performance. The segment changes resulted in Laureate increasing its number of operating segments from three to six, and is consistent with our goal of flattening our organizational structure to improve decision speed and operating effectiveness.
The change includes the creation of three operating segments (Brazil, Mexico and Andean & Iberian) from the previous Latin America (LatAm) segment. Our institutions in Spain and Portugal (Iberian) have moved from the Europe, Middle East, Africa and Asia Pacific (EMEAA) segment and combined with our institutions in Chile and Peru to form the Andean & Iberian segment. In addition, our institutions in Central America, which were previously part of the LatAm segment, have combined with our campus-based institutions in the United States, which were previously part of the GPS segment, to form the Central America and U.S. Campuses segment. The Online & Partnerships segment consists of the online institutions that were previously part of the GPS segment. In summary, our six operating segments are as follows:
• | Brazil; |
• | Mexico; |
• | Andean & Iberian; |
• | Central America & U.S. Campuses; |
• | EMEAA; and |
• | Online & Partnerships. |
This change has been reflected in the quarterly segment information beginning in the third quarter of 2017, the period in which the change occurred. As required, the 2016 segment information that is presented for comparative purposes has also been revised to reflect this change.
The accompanying unaudited Consolidated Financial Statements have been prepared in accordance with accounting principles generally accepted in the United States (GAAP) for interim financial information and with the instructions to Form 10-Q. Accordingly, they do not include all of the information and footnotes required by GAAP for complete financial statements. In our opinion, these financial statements include all adjustments considered necessary to present a fair statement of our consolidated results of operations, financial position and cash flows. Operating results for any interim period are not necessarily indicative of the results that may be expected for the full year. These unaudited Consolidated Financial Statements should be read in conjunction with Laureate's audited Consolidated Financial Statements included in our Annual Report on Form 10-K for the fiscal year ended December 31, 2016 (the 2016 Form 10-K).
9
Note 2. Significant Accounting Policies
The Variable Interest Entity (VIE) Arrangements
Laureate consolidates in its financial statements certain internationally based educational organizations that do not have shares or other equity ownership interests. Although these educational organizations may be considered not-for-profit entities in their home countries and they are operated in compliance with their respective not-for-profit legal regimes, we believe they do not meet the definition of a not-for-profit entity under GAAP, and therefore we treat them as "for-profit" entities for accounting purposes. These entities generally cannot declare dividends or distribute their net assets to the entities that control them.
Under ASC 810-10, "Consolidation," we have determined that these institutions are VIEs and that Laureate is the primary beneficiary of these VIEs because we have, as further described herein: (1) the power to direct the activities of the VIEs that most significantly affect their educational and economic performance and (2) the right to receive economic benefits from contractual and other arrangements with the VIEs that could potentially be significant to the VIEs. We account for the acquisition of the right to control a VIE in accordance with ASC 805, "Business Combinations."
The VIEs in Brazil and Mexico include several not-for-profit foundations that have insignificant revenues and operating expenses. Selected Consolidated Statements of Operations information for these VIEs was as follows:
For the three months ended September 30, | For the nine months ended September 30, | ||||||||||||||
2017 | 2016 | 2017 | 2016 | ||||||||||||
Selected Statements of Operations information: | |||||||||||||||
Revenues, by segment: | |||||||||||||||
Brazil | $ | 11 | $ | — | $ | 57 | $ | — | |||||||
Mexico | — | — | — | — | |||||||||||
Andean & Iberian | 114,494 | 116,839 | 300,385 | 257,327 | |||||||||||
Central America & U.S. Campuses | 16,350 | 15,113 | 47,362 | 44,088 | |||||||||||
EMEAA | 42,662 | 41,919 | 176,177 | 187,454 | |||||||||||
Revenues | 173,517 | 173,871 | 523,981 | 488,869 | |||||||||||
Depreciation and amortization | 12,697 | 13,422 | 38,171 | 39,190 | |||||||||||
Operating (loss) income, by segment: | |||||||||||||||
Brazil | (23 | ) | (17 | ) | (30 | ) | (60 | ) | |||||||
Mexico | (163 | ) | (105 | ) | (516 | ) | (492 | ) | |||||||
Andean & Iberian | 6,584 | 12,365 | (3,567 | ) | (29,625 | ) | |||||||||
Central America & U.S. Campuses | 910 | 406 | 1,873 | 212 | |||||||||||
EMEAA | (11,510 | ) | (14,606 | ) | 8,377 | 5,075 | |||||||||
Operating (loss) income | (4,202 | ) | (1,957 | ) | 6,137 | (24,890 | ) | ||||||||
Net income (loss) | 378 | 1,563 | 23,418 | (18,517 | ) | ||||||||||
Net income (loss) attributable to Laureate Education, Inc. | 1,265 | 2,707 | 22,284 | (18,474 | ) | ||||||||||
The following table reconciles the Net (loss) income attributable to Laureate Education, Inc. as presented in the table above, to the amounts in our Consolidated Statements of Operations:
For the three months ended September 30, | For the nine months ended September 30, | ||||||||||||||
2017 | 2016 | 2017 | 2016 | ||||||||||||
Net (loss) income attributable to Laureate Education, Inc.: | |||||||||||||||
Variable interest entities | $ | 1,265 | $ | 2,707 | $ | 22,284 | $ | (18,474 | ) | ||||||
Other operations | 49,968 | 61,132 | 264,644 | 387,008 | |||||||||||
Corporate and eliminations | (149,192 | ) | 22,478 | (391,308 | ) | (37,995 | ) | ||||||||
Net (loss) income attributable to Laureate Education, Inc. | $ | (97,959 | ) | $ | 86,317 | $ | (104,380 | ) | $ | 330,539 | |||||
10
The following table presents selected assets and liabilities of the consolidated VIEs. Except for Goodwill, the assets in the table below include the assets that can be used only to settle the obligations for the VIEs. The liabilities in the table are liabilities for which the creditors of the VIEs do not have recourse to the general credit of Laureate.
Selected Consolidated Balance Sheet amounts for these VIEs were as follows:
September 30, 2017 | December 31, 2016 | ||||||||||||||
VIE | Consolidated | VIE | Consolidated | ||||||||||||
Balance Sheets data: | |||||||||||||||
Cash and cash equivalents | $ | 265,494 | $ | 504,962 | $ | 169,074 | $ | 464,965 | |||||||
Current assets held for sale | 2,723 | 92,248 | — | — | |||||||||||
Other current assets | 281,504 | 962,689 | 153,136 | 650,836 | |||||||||||
Total current assets | 549,721 | 1,559,899 | 322,210 | 1,115,801 | |||||||||||
Goodwill | 193,669 | 2,028,286 | 181,669 | 1,934,464 | |||||||||||
Tradenames | 109,394 | 1,330,302 | 104,117 | 1,307,633 | |||||||||||
Other intangible assets, net | — | 43,206 | — | 46,700 | |||||||||||
Long-term assets held for sale | 28,306 | 279,801 | — | — | |||||||||||
Other long-term assets | 676,960 | 2,541,070 | 701,117 | 2,657,872 | |||||||||||
Total assets | 1,558,050 | 7,782,564 | 1,309,113 | 7,062,470 | |||||||||||
Current liabilities held for sale | 6,855 | 158,280 | — | — | |||||||||||
Current liabilities | 497,470 | 1,736,699 | 320,922 | 1,440,232 | |||||||||||
Long-term liabilities held for sale | 11,239 | 73,199 | — | — | |||||||||||
Long-term debt and other long-term liabilities | 91,332 | 3,915,249 | 103,375 | 4,601,013 | |||||||||||
Total liabilities | 606,896 | 5,883,427 | 424,297 | 6,041,245 | |||||||||||
Total stockholders' equity | 951,154 | 1,582,229 | 884,816 | 664,392 | |||||||||||
Total stockholders' equity attributable to Laureate Education, Inc. | 932,384 | 1,551,678 | 866,997 | 632,210 | |||||||||||
The amounts classified as held-for-sale assets and liabilities at September 30, 2017 in the table above relate to VIEs that are included in our EMEAA segment and are subject to finalization. Refer to Note 4, Assets Held for Sale, for further discussion.
Recently Issued Accounting Standards Not Yet Adopted
Accounting Standards Update (ASU) No. 2017-12(ASU 2017-12), Derivatives and Hedging (Topic 815): Targeted Improvements to Accounting for Hedging Activities
On August 28, 2017, the Financial Accounting Standards Board (FASB) issued ASU 2017-12, which contains significant amendments to the hedge accounting model. The new guidance is intended to simplify the application of hedge accounting and should allow for more hedging strategies to qualify for hedge accounting. ASU 2017-12 also amends the presentation and disclosure requirements and changes how companies assess effectiveness. Public business entities like Laureate will have until the end of the first quarter in which a hedge is designated to perform an initial assessment of a hedge’s effectiveness. After initial qualification, the new guidance permits a qualitative effectiveness assessment for certain hedges instead of a quantitative test, such as a regression analysis, if the company can reasonably support an expectation of high effectiveness throughout the term of the hedge. An initial quantitative test to establish that the hedge relationship is highly effective is still required. The effective date of this ASU for Laureate is January 1, 2019. Early adoption is permitted in any interim period or fiscal year before the effective date. However, if the guidance is early adopted in an interim period, any adjustments would be reflected as of the beginning of the fiscal year that includes that interim period. Laureate is evaluating whether to early adopt this ASU as of January 1, 2018.
ASU No. 2017-04 (ASU 2017-04), Intangibles - Goodwill and Other (Topic 350): Simplifying the Test for Goodwill Impairment
In January 2017, the FASB issued ASU 2017-04 in order to simplify the test for goodwill impairment by eliminating Step 2, which measures a goodwill impairment loss by comparing the implied fair value of a reporting unit's goodwill with the carrying amount
11
of that goodwill. Under the amendments in this ASU, an entity should perform its annual goodwill impairment test by comparing the fair value of a reporting unit with its carrying amount and should recognize an impairment charge for the amount by which the carrying amount exceeds the reporting unit's fair value. However, the loss recognized should not exceed the total amount of goodwill allocated to that reporting unit. This ASU is effective for Laureate beginning on January 1, 2020 and early adoption is permitted for interim or annual goodwill impairment tests performed on testing dates after January 1, 2017. We are still evaluating the impact of ASU 2017-04 on our Consolidated Financial Statements and whether we will early adopt this ASU for goodwill impairment tests performed on testing dates after January 1, 2018.
ASU No. 2016-02 (ASU 2016-02), Leases (Topic 842)
On February 25, 2016, the FASB issued ASU 2016-02. Lessees will need to recognize on their balance sheet a right-of-use asset and a lease liability for virtually all of their leases (other than leases that meet the definition of a short-term lease). The liability will be equal to the present value of lease payments. The asset will be based on the liability, subject to adjustment, such as for initial direct costs and uneven rent payments. For income statement purposes, the FASB retained a dual model, requiring leases to be classified as either operating or finance. Operating leases will result in straight-line expense (similar to current operating leases) while finance leases will result in a front-loaded expense pattern (similar to current capital leases). Classification will be based on criteria that are largely similar to those applied in current lease accounting, but without explicit bright lines. The standard is effective for Laureate beginning January 1, 2019. The new standard must be adopted using a modified retrospective transition and provides for certain practical expedients. Transition will require application of the new guidance at the beginning of the earliest comparative period presented. We have completed our diagnostic assessment and have established a cross-functional implementation team which is in the process of identifying changes to our accounting policies, business processes, systems and internal controls in preparation for the implementation. We anticipate that ASU 2016-02 will have a material impact on our Consolidated Balance Sheets, as we will record significant asset and liability balances in connection with our leased properties. We are still evaluating the impact to our Consolidated Statements of Operations. We do not currently plan to early adopt this ASU.
ASU No. 2014-09, (ASU 2014-09), Revenue from Contracts with Customers (Topic 606)
On May 28, 2014, the FASB issued ASU 2014-09, which supersedes the revenue recognition requirements in ASC 605, ‘‘Revenue Recognition’’ and most industry-specific guidance. The core principle of ASU 2014-09 is that a company will recognize revenue when it transfers promised goods or services to customers in an amount that reflects the consideration to which the company expects to be entitled in exchange for those goods or services. On July 9, 2015, the FASB deferred the effective date of ASU 2014-09. The new revenue standard is effective for fiscal years, and interim periods within those years, beginning after December 15, 2017 (January 1, 2018 for Laureate) and allows either a full retrospective adoption to all periods presented or a modified retrospective adoption approach with the cumulative effect of initial application of the revised guidance recognized at the date of initial application. We have completed our diagnostic assessment and are finalizing policies and processes relating to this ASU, which we plan to adopt effective January 1, 2018. We do not expect the adoption of this ASU to result in a significant change to our method of recognizing tuition revenues; however, we are still evaluating and quantifying the potential impact of other aspects of the standard, including variable consideration and costs to obtain a contract. We plan to elect modified retrospective adoption of this new standard.
Recently Adopted Accounting Standards
ASU No. 2015-17 (ASU 2015-17), Income Taxes (Topic 740)
In November 2015, the FASB issued ASU 2015-17 as a part of the Simplification Initiative and in response to concerns that the current requirement that entities separate deferred income tax liabilities and assets into current and noncurrent amounts results in little or no benefit to users of the financial statements. The amendments in this ASU aim to simplify this presentation by requiring that deferred tax liabilities and assets be classified as noncurrent in a classified statement of financial position. ASU 2015-17 was effective for Laureate beginning January 1, 2017 and we adopted this guidance on a retrospective basis. Accordingly, as of September 30, 2017 all deferred tax assets and liabilities are classified as noncurrent and we reclassified current deferred tax assets and liabilities of approximately $110,000 and $6,000, respectively, as of December 31, 2016 to noncurrent.
ASU No. 2016-09 (ASU 2016-09), Compensation—Stock compensation (Topic 718): Improvements to Employee Share-based Payment Accounting
On March 30, 2016, the FASB issued ASU 2016-09 as part of its initiative to reduce complexity in accounting standards. The areas for simplification in this ASU involve several aspects of the accounting for employee share-based payment transactions, including the income tax consequences, classification of awards as either equity or liabilities, and classification on the statement
12
of cash flows. The guidance was effective for Laureate beginning January 1, 2017. Laureate has elected to continue estimating forfeitures when determining the amount of share-based compensation expense to be recognized each period. The Company adopted this standard prospectively in the first quarter of 2017 and it did not have a material impact on our Consolidated Financial Statements.
Note 3. Acquisitions
During the nine months ended September 30, 2017, Laureate consummated the business acquisition outlined below, which is included in our Consolidated Financial Statements commencing from the date of acquisition.
Australia
In June 2017, our EMEAA segment acquired the assets and business of the nursing division of Careers Australia (CA Nursing), a vocational institution in Australia, for a cash purchase price of AUD 1,107 (US $835 at the date of acquisition) plus debt assumed of AUD 9,850 (US $7,433 at the acquisition date). We accounted for this acquisition as a business combination. For this acquisition, Revenues, Operating income and Net (loss) income attributable to Laureate Education, Inc. were immaterial for the nine months ended September 30, 2017.
The following table summarizes the estimated fair value of all assets acquired and the liabilities assumed at the date of acquisition:
CA Nursing Australia | |||
Property and equipment | $ | 9,581 | |
Goodwill | 3,099 | ||
Other intangible assets | 3,293 | ||
Total assets acquired | 15,973 | ||
Current portion of long-term debt | 166 | ||
Other current liabilities | 5,960 | ||
Long-term debt, less current portion | 7,267 | ||
Other long-term liabilities | 1,745 | ||
Total liabilities | 15,138 | ||
Net assets acquired attributable to Laureate Education, Inc. | 835 | ||
Debt assumed | 7,433 | ||
Net assets acquired attributable to Laureate Education, Inc. plus debt assumed | $ | 8,268 | |
Net assets acquired | $ | 835 | |
Net cash paid at acquisition | $ | 835 | |
The amounts recorded in the 2017 acquisition are provisional and Laureate is in the process of finalizing the amounts recorded for the assets and liabilities primarily related to goodwill, intangible assets and deferred revenue. None of the goodwill related to the 2017 acquisition is expected to be deductible for income tax purposes.
Note 4. Assets Held for Sale
The Company has identified certain subsidiaries that may not reach a scale that will be meaningful for Laureate, and has undertaken a process to sell these entities. As of September 30, 2017, several subsidiaries in our EMEAA segment met the criteria for classification as held for sale under ASC 360-10-45-9, "Long-Lived Assets Classified as Held for Sale," in addition to an asset group at a for-profit real estate subsidiary in our Andean & Iberian segment. Accordingly, as of September 30, 2017, the assets and liabilities of these disposal groups were classified as held for sale and recorded at their carrying values, which were lower than their estimated 'fair values less costs to sell'. The Company expects to begin receiving final offers on these entities in the fourth quarter of 2017, and estimates that closing of the sale transactions will begin to occur in the first quarter of 2018.
13
The amounts classified as held-for-sale assets and liabilities are subject to finalization. The carrying amounts of the major classes of long-lived assets and liabilities that were reclassified to held for sale as of September 30, 2017 are presented in the following tables:
Property and equipment, net | $ | 213,593 | |
Goodwill | 32,330 | ||
Tradenames | 16,534 | ||
Other assets | 17,344 | ||
Long-term assets held for sale | $ | 279,801 | |
Long-term debt, including current portion | $ | 34,798 | |
Other liabilities | 196,681 | ||
Total liabilities held for sale | $ | 231,479 | |
In the aggregate, revenues of the disposal groups represented approximately $159,000 and $154,000 of Laureate's total revenues during the nine months ended September 30, 2017 and 2016, respectively.
Note 5. Due to Shareholders of Acquired Companies
The amounts due to shareholders of acquired companies generally arise in connection with Laureate’s acquisition of a majority or all of the ownership interest of these companies. Promissory notes payable to the sellers of acquired companies, referred to as “seller notes,” are commonly used as a means of payment for business acquisitions. Seller note payments are classified as Payments of deferred purchase price for acquisitions within financing activities in our Consolidated Statements of Cash Flows. The amounts due to shareholders of acquired companies, currencies, and interest rates applied were as follows:
September 30, 2017 | December 31, 2016 | Nominal Currency | Interest Rate % | |||||
Universidade Anhembi Morumbi (UAM Brazil) | $ | 46,475 | $ | 52,043 | BRL | CDI + 2% | ||
University of St. Augustine for Health Sciences, LLC (St. Augustine) | 11,550 | 11,550 | USD | 7% | ||||
Monash South Africa (MSA) | 9,591 | 27,462 | AUD | n/a, 6.75% | ||||
Universidad Tecnologica Centroamericana (UNITEC Honduras) | 4,184 | 5,196 | HNL | IIBC | ||||
CH Holding Netherlands B.V. (CH Holding) | 3,885 | 8,587 | USD | n/a | ||||
Faculdade Porto-Alegrense (FAPA) | 3,132 | 2,973 | BRL | IGP-M | ||||
IADE Group | 2,358 | 2,755 | EUR | 3% | ||||
Faculdades Metropolitanas Unidas Educacionais (FMU) | — | 100,382 | BRL | CDI | ||||
Total due to shareholders of acquired companies | 81,175 | 210,948 | ||||||
Less: Current portion of due to shareholders of acquired companies | 28,881 | 118,679 | ||||||
Due to shareholders of acquired companies, less current portion | $ | 52,294 | $ | 92,269 | ||||
AUD: Australian Dollar | CDI: Certificados de Depósitos Interbancários (Brazil) | |
BRL: Brazilian Real | IIBC: Índice de Inflación del Banco Central (Honduras) | |
EUR: European Euro | IGP-M: General Index of Market Prices (Brazil) | |
HNL: Honduran Lempira | ||
USD: United States Dollar | ||
IADE Group
A working capital adjustment was recorded during the year ended December 31, 2015 in accordance with the purchase agreement entered into in connection with this acquisition. This liability of EUR 639 (US $694 at the date of payment) was settled during the second quarter of 2017. The remaining balance outstanding relates to two EUR 1,000 tranches to be paid 36 months and 60 months from the March 27, 2015 date of acquisition.
14
FMU
At the acquisition date of FMU on September 12, 2014, Laureate financed a portion of the purchase price with promissory notes payable to the seller of BRL 250,000. These seller notes matured on September 12, 2017 and the principal and interest were fully repaid in the amount of BRL 358,606 (US $114,578 at the date of payment).
Note 6. Business and Geographic Segment Information
Laureate’s educational services are offered through six operating segments: Brazil, Mexico, Andean & Iberian, Central America & U.S. Campuses, EMEAA and Online & Partnerships. Laureate determines its operating segments based on information utilized by the chief operating decision maker to allocate resources and assess performance.
As previously disclosed in our Quarterly Report on Form 10-Q for the period ended June 30, 2017, effective August 1, 2017, we changed our operating segments in order to realign our segments according to how our chief operating decision maker now allocates resources and assesses performance. The change includes the creation of three operating segments (Brazil, Mexico and Andean & Iberian) from the previous Latin America (LatAm) segment. Our institutions in Spain and Portugal (Iberian) have moved from the Europe, Middle East, Africa and Asia Pacific (EMEAA) segment and combined with our institutions in Chile and Peru to form the Andean & Iberian segment. In addition, our institutions in Central America, which were previously part of the LatAm segment, have combined with our campus-based institutions in the United States, which were previously part of the GPS segment, to form the Central America and U.S. Campuses segment. The Online & Partnerships segment consists of the online institutions that were previously part of the GPS segment. This change has been reflected in the quarterly segment information beginning in the third quarter of 2017, the period in which the change occurred. As required, the 2016 segment information that is presented for comparative purposes has also been revised to reflect this change.
Our campus-based segments generate revenues by providing an education that emphasizes professional-oriented fields of study with undergraduate and graduate degrees in a wide range of disciplines. Our educational offerings are increasingly utilizing online and hybrid (a combination of online and in-classroom) courses and programs to deliver their curriculum. Many of our largest campus-based operations are in developing markets which are experiencing a growing demand for higher education based on favorable demographics and increasing secondary completion rates, driving increases in participation rates and resulting in continued growth in the number of higher education students. Traditional higher education students (defined as 18-24 year olds) have historically been served by public universities, which have limited capacity and are often underfunded, resulting in an inability to meet the growing student demand and employer requirements. This supply and demand imbalance has created a market opportunity for private sector participants. Most students finance their own education. However, there are some government-sponsored student financing programs which are discussed below. These campus-based segments include Brazil, Mexico, Andean & Iberian, Central America & U.S. Campuses and EMEAA. Specifics related to each of these campus-based segments and our Online & Partnerships segment are discussed below:
In Brazil, approximately 75% of post-secondary students are enrolled in private higher education institutions. While the federal government defines the national curricular guidelines, institutions are licensed to operate by city. Laureate owns 13 institutions in eight states throughout Brazil, with a particularly strong presence in the competitive São Paulo market. Many students finance their own education while others rely on the government-sponsored programs such as Prouni and FIES.
Public universities in Mexico enroll approximately two-thirds of students attending post-secondary education. However, many public institutions are faced with capacity constraints or the quality of the education is considered low. Laureate owns two institutions and is present throughout the country with a footprint of over 40 campuses. Each institution in Mexico has a national license. Students in our Mexican institutions typically finance their own education.
The Andean & Iberian segment includes institutions in Chile, Peru, Portugal and Spain and has contractual relationships with a licensed institution in Ecuador. In Chile, private universities enroll approximately 80% of post-secondary students. In Peru, the public sector plays a significant role but private universities are increasingly providing the capacity to meet growing demand. In Spain and Portugal, the high demand for post-secondary education places capacity constraints on the public sector, pushing students to turn to the private sector for high-quality education. Chile has government-sponsored student financing programs, while in the other countries students generally finance their own education.
The Central America & U.S. Campuses segment includes institutions in Costa Rica, Honduras, Panama and the United States. Students in Central America typically finance their own education while students in the United States finance their education in a variety of ways, including Title IV programs.
15
The EMEAA segment includes institutions in the European countries of Cyprus, Germany, Italy and Turkey, as well as locations in the Middle East, Africa and Asia Pacific consisting of campus-based institutions with operations in Australia, China, India, Malaysia, Morocco, New Zealand, South Africa and Thailand. Additionally, EMEAA manages nine licensed institutions in the Kingdom of Saudi Arabia and manages one additional institution in China through a joint venture arrangement.
The Online & Partnerships segment includes fully online institutions operating globally that offer professionally-oriented degree programs in the United States through Walden University, a U.S.-based accredited institution, and through the University of Liverpool and the University of Roehampton in the United Kingdom. These online institutions primarily serve working adults with undergraduate and graduate degree program offerings. Students in the United States finance their education in a variety of ways, including Title IV programs.
Intersegment transactions are accounted for in a similar manner as third-party transactions and are eliminated in consolidation. The “Corporate” amounts presented in the following tables includes corporate charges that were not allocated to our reportable segments and adjustments to eliminate intersegment items.
We evaluate segment performance based on Adjusted EBITDA, which is a non-GAAP performance measure defined as Income (loss) from continuing operations before income taxes and equity in net income of affiliates, adding back the following items: (Loss) gain on sales of subsidiaries, net, Foreign currency exchange (loss) gain, net, Other income (expense), net, Gain (loss) on derivatives, Loss on debt extinguishment, Interest expense, Interest income, Depreciation and amortization expense, Loss on impairment of assets, Share-based compensation expense and expenses related to our Excellence-in-Process (EiP) initiative. EiP is an enterprise-wide initiative to optimize and standardize Laureate’s processes, creating vertical integration of procurement, information technology, finance, accounting and human resources. It includes the establishment of regional shared services organizations (SSOs) around the world, as well as improvements to the Company's system of internal controls over financial reporting. We have also expanded the EiP initiative into other back- and mid-office areas. Certain non-recurring costs incurred in connection with the planned dispositions described in Note 4, Assets Held for Sale, are also included in EiP. The increased EiP expenses during the nine months ended September 30, 2017 as compared to the nine months ended September 30, 2016 relates primarily to severance costs that are predominantly contractual termination benefits recognized in accordance with ASC 712, ‘‘Compensation—Nonretirement Postemployment Benefits.’’
When we review Adjusted EBITDA on a segment basis, we exclude intercompany revenues and expenses, related to network fees and royalties between our segments, which eliminate in consolidation. We use total assets as the measure of assets for reportable segments.
16
The following tables provide financial information for our reportable segments, including a reconciliation of Adjusted EBITDA to Income (loss) from continuing operations before income taxes and equity in net income of affiliates, as reported in the Consolidated Statements of Operations:
For the three months ended September 30, | For the nine months ended September 30, | |||||||||||||
2017 | 2016 | 2017 | 2016 | |||||||||||
Revenues | ||||||||||||||
Brazil | $ | 170,497 | $ | 152,768 | $ | 547,971 | $ | 479,628 | ||||||
Mexico | 141,175 | 140,400 | 451,993 | 455,130 | ||||||||||
Andean & Iberian | 314,788 | 289,182 | 930,335 | 835,477 | ||||||||||
Central America & U.S. Campuses | 69,598 | 65,602 | 219,081 | 207,142 | ||||||||||
EMEAA | 126,353 | 116,967 | 468,339 | 584,979 | ||||||||||
Online & Partnerships | 168,375 | 173,303 | 520,982 | 531,063 | ||||||||||
Corporate | (7,392 | ) | (8,367 | ) | (21,935 | ) | (25,120 | ) | ||||||
Revenues | $ | 983,394 | $ | 929,855 | $ | 3,116,766 | $ | 3,068,299 | ||||||
Adjusted EBITDA of reportable segments | ||||||||||||||
Brazil | $ | 9,138 | $ | 11,856 | $ | 61,289 | $ | 63,174 | ||||||
Mexico | 6,465 | 24,775 | 78,590 | 89,292 | ||||||||||
Andean & Iberian | 74,983 | 63,979 | 240,273 | 179,846 | ||||||||||
Central America & U.S. Campuses | 9,731 | 7,472 | 38,480 | 31,657 | ||||||||||
EMEAA | (13,655 | ) | (24,365 | ) | 54,166 | 67,951 | ||||||||
Online & Partnerships | 42,883 | 51,250 | 145,753 | 149,097 | ||||||||||
Total Adjusted EBITDA of reportable segments | 129,545 | 134,967 | 618,551 | 581,017 | ||||||||||
Reconciling items: | ||||||||||||||
Corporate | (42,976 | ) | (36,379 | ) | (141,556 | ) | (100,255 | ) | ||||||
Depreciation and amortization expense | (67,930 | ) | (66,824 | ) | (199,394 | ) | (202,735 | ) | ||||||
Loss on impairment of assets | — | — | — | — | ||||||||||
Share-based compensation expense | (8,632 | ) | (8,030 | ) | (43,969 | ) | (28,939 | ) | ||||||
EiP expenses | (15,703 | ) | (11,232 | ) | (58,344 | ) | (37,175 | ) | ||||||
Operating (loss) income | (5,696 | ) | 12,502 | 175,288 | 211,913 | |||||||||
Interest income | 5,840 | 3,437 | 14,994 | 13,305 | ||||||||||
Interest expense | (76,454 | ) | (104,781 | ) | (278,049 | ) | (314,383 | ) | ||||||
Loss on debt extinguishment | — | (15,682 | ) | (8,425 | ) | (17,363 | ) | |||||||
(Loss) gain on derivatives | (19,930 | ) | 516 | 19,187 | (8,235 | ) | ||||||||
Other (expense) income, net | (718 | ) | 353 | (667 | ) | (964 | ) | |||||||
Foreign currency exchange gain (loss), net | 7,327 | 26,329 | (109 | ) | 80,263 | |||||||||
Gain (loss) on sales of subsidiaries, net | — | 155,151 | (172 | ) | 398,412 | |||||||||
(Loss) income from continuing operations before income taxes and equity in net income of affiliates | $ | (89,631 | ) | $ | 77,825 | $ | (77,953 | ) | $ | 362,948 | ||||
17
September 30, 2017 | December 31, 2016 | |||||
Assets | ||||||
Brazil | $ | 1,288,014 | $ | 1,245,264 | ||
Mexico | 1,087,323 | 972,171 | ||||
Andean & Iberian | 2,264,689 | 1,951,864 | ||||
Central America & U.S. Campuses | 339,816 | 345,238 | ||||
EMEAA | 1,147,354 | 958,883 | ||||
Online & Partnerships | 1,215,107 | 1,297,798 | ||||
Corporate | 440,261 | 291,252 | ||||
Total assets | $ | 7,782,564 | $ | 7,062,470 | ||
Note 7. Goodwill
The change in the net carrying amount of Goodwill from December 31, 2016 through September 30, 2017 was composed of the following items:
Brazil | Mexico | Andean & Iberian | Central America & U.S. Campuses | EMEAA | Online & Partnerships | Total | |||||||||||||||
Goodwill | $ | 501,055 | $ | 480,985 | $ | 297,519 | $ | 154,759 | $ | 200,254 | $ | 459,787 | $ | 2,094,359 | |||||||
Accumulated impairment loss | — | — | — | (96,754 | ) | (63,141 | ) | — | (159,895 | ) | |||||||||||
Balance at December 31, 2016 | 501,055 | 480,985 | 297,519 | 58,005 | 137,113 | 459,787 | 1,934,464 | ||||||||||||||
Acquisitions | — | — | — | — | 3,099 | — | 3,099 | ||||||||||||||
Dispositions | — | — | — | — | (488 | ) | — | (488 | ) | ||||||||||||
Reclassification to Long-term assets held for sale | — | — | — | — | (32,330 | ) | — | (32,330 | ) | ||||||||||||
Currency translation adjustments | 16,286 | 75,101 | 19,748 | — | 11,506 | 900 | 123,541 | ||||||||||||||
Adjustments to prior acquisitions | — | — | — | — | — | — | — | ||||||||||||||
Balance at September 30, 2017 | $ | 517,341 | $ | 556,086 | $ | 317,267 | $ | 58,005 | $ | 118,900 | $ | 460,687 | $ | 2,028,286 | |||||||
18
Note 8. Debt
Outstanding long-term debt was as follows:
September 30, 2017 | December 31, 2016 | ||||||
Senior long-term debt: | |||||||
Senior Secured Credit Facility (stated maturity dates April 2022 and April 2024 as of September 30, 2017; stated maturity dates June 2018, June 2019 and March 2021 as of December 31, 2016), net of discount | $ | 1,576,845 | $ | 1,497,869 | |||
Senior Notes (stated maturity dates May 2025 as of September 30, 2017 and September 2019 as of December 31, 2016), net of discount | 800,000 | 1,388,036 | |||||
Total senior long-term debt | 2,376,845 | 2,885,905 | |||||
Other debt: | |||||||
Lines of credit | 51,065 | 66,081 | |||||
Notes payable and other debt | 626,687 | 650,184 | |||||
Total senior and other debt | 3,054,597 | 3,602,170 | |||||
Capital lease obligations and sale-leaseback financings | 261,650 | 250,842 | |||||
Total long-term debt | 3,316,247 | 3,853,012 | |||||
Less: total unamortized deferred financing costs | 105,839 | 44,648 | |||||
Less: current portion of long-term debt | 185,848 | 178,989 | |||||
Long-term debt, less current portion | $ | 3,024,560 | $ | 3,629,375 | |||
Approximately $34,798 of long-term debt, including the current portion, is included in the held-for-sale liabilities recorded on the Consolidated Balance Sheet as of September 30, 2017. For further description of the held-for-sale amounts see Note 4, Assets Held for Sale.
Debt Refinancing
During the second quarter of 2017, the Company completed refinancing transactions that resulted in repayment of the previous senior credit facility and the redemption of the 9.250% Senior Notes due 2019 (the Senior Notes due 2019) (other than $250,000 in aggregate principal amount of the Senior Notes due 2019 that the Company exchanged on April 21, 2017 for substantially identical but non-redeemable notes issued under a new indenture (the Exchanged Notes)).
Senior Notes
On April 26, 2017, we completed an offering of $800,000 aggregate principal amount of 8.250% Senior Notes due 2025 (the Senior Notes due 2025). The Senior Notes due 2025 were issued at par and will mature on May 1, 2025. Interest on the Senior Notes due 2025 is payable semi-annually on May 1 and November 1, and the first interest payment date is November 1, 2017.We may redeem the Senior Notes due 2025, in whole or in part, at any time on or after May 1, 2020, at redemption prices starting at 106.188% of the principal amount thereof and decreasing from there each year thereafter until May 1, 2023, plus accrued and unpaid interest. From and after May 1, 2023, we may redeem all or part of the Senior Notes due 2025 at a redemption price of 100%, plus accrued and unpaid interest. We may also redeem up to 40% of the Senior Notes due 2025 using the proceeds of certain equity offerings completed before May 1, 2020, at a redemption price equal to 108.250% of the principal amount thereof, plus accrued and unpaid interest. In addition, at any time prior to May 1, 2020, we may redeem the Senior Notes due 2025, in whole or in part, at a price equal to 100% of the principal amount, plus a ‘‘make-whole’’ premium, plus accrued and unpaid interest.
On April 28, 2017, the Company elected to redeem all of its outstanding Senior Notes due 2019 (other than the Exchanged Notes) and on May 31, 2017 (the Redemption Date), the Senior Notes due 2019 (other than the Exchanged Notes) were redeemed. As described further below, the Exchanged Notes were redeemed on August 11, 2017. The aggregate principal amount outstanding of the Senior Notes due 2019 (excluding the Exchanged Notes) was $1,125,443. The redemption price for the Senior Notes due 2019 that were redeemed was equal to 104.625% of the principal amount thereof, for a total redemption price of $1,177,495, plus accrued and unpaid interest and special interest to the Redemption Date, for an aggregate payment to holders of the Senior Notes of $1,205,630. As of September 30, 2017, the outstanding balance of our senior notes was $800,000, which consisted entirely of the Senior Notes due 2025. As of December 31, 2016, the outstanding balance under our Senior Notes due 2019 was $1,388,036, net of a debt discount.
19
Senior Secured Credit Facility
Substantially concurrently with the issuance of the Senior Notes due 2025, we consummated a refinancing of our Senior Secured Credit Facility by means of an amendment and restatement of the existing amended and restated credit agreement (the Second Amended and Restated Credit Agreement) to provide a new revolving credit facility of $385,000 maturing in April 2022 (the Revolving Credit Facility) and a new syndicated term loan of $1,600,000 maturing in April 2024 (the 2024 Term Loan). The old senior credit facility was fully repaid, and that repayment amount is included in Payments on long-term debt in the Consolidated Statement of Cash Flows for the nine months ended September 30, 2017, with the exception of approximately $283,000 of loan principal related to the old term loan that was rolled over by certain lenders into the 2024 Term Loan. Accordingly, that rollover amount was a non-cash transaction.
As a subfacility under the Revolving Credit Facility, the Second Amended and Restated Credit Agreement provides for letter of credit commitments in the aggregate amount of $141,000. The Second Amended and Restated Credit Agreement also provides, subject to the satisfaction of certain conditions, for incremental revolving and term loan facilities, at the request of the Company, not to exceed $300,000 plus additional amounts so long as both immediately before and after giving effect to such incremental facilities the Company’s Consolidated Senior Secured Debt to Consolidated EBITDA ratio, as defined in the Second Amended and Restated Credit Agreement, on a pro forma basis, does not exceed 2.75x.
The maturity date for the Revolving Credit Facility is April 26, 2022 and the maturity date for the 2024 Term Loan is April 26, 2024. The Revolving Credit Facility bears interest at a per annum interest rate, at the option of the Borrower, at either the LIBOR rate or the ABR rate plus an applicable margin of 3.75% per annum or 3.50% per annum for LIBOR rate loans, and 2.75% per annum or 2.50% per annum for ABR rate loans, in each case, based on the Company’s Consolidated Total Debt to Consolidated EBITDA ratio, as defined in the Second Amended and Restated Credit Agreement. As of September 30, 2017, there was no balance outstanding under the Revolving Credit Facility.
The 2024 Term Loan bears interest at a per annum rate, at the option of the Borrower, at either the LIBOR rate or the ABR rate plus an applicable margin of 4.50% per annum or 4.25% per annum for LIBOR rate loans, and 3.50% per annum or 3.25% per annum for ABR rate loans, in each case, based on the Company’s Consolidated Total Debt to Consolidated EBITDA ratio. As of September 30, 2017, all loans outstanding under the 2024 Term Loan were LIBOR loans and had a total interest rate of 5.73%. A discount equal to 1% of the 2024 Term Loan's original principal amount, or $16,000, was paid at issuance and will be amortized to interest expense over the term of the loan. The 2024 Term Loan amortizes at an annual amount equal to 1% of the original principal amount of the 2024 Term Loan, which annual amount is payable in quarterly payments, with the remaining unpaid principal amount payable on the maturity date. Quarterly principal payments on the 2024 Term Loan commenced June 30, 2017. On or prior to October 26, 2017, except for prepayments made from transactions expressly permitted, the 2024 Term Loan can be prepaid at price equal to 101% of the principal amount prepaid. After October 26, 2017, the 2024 Term Loan can be prepaid at price equal to 100% of the principal amount prepaid.
Loss on Debt Extinguishment, Debt Modification and Debt Issuance Costs
As a result of the refinancing transactions described above and the note exchange transaction described below, Laureate recorded a Loss on debt extinguishment of $8,425 during the nine months ended September 30, 2017 related primarily to the write off of unamortized deferred financing costs associated with certain lenders that did not participate in the new debt instruments. In addition, approximately $22,800 was charged to General and administrative expenses related to new third-party costs paid in connection with the portion of the refinancing transactions that was deemed to be a modification. Also in connection with the refinancing transactions, approximately $70,800 of new deferred financing costs were capitalized, which related primarily to the excess of the redemption price over the principal amount of the Senior Notes due 2019 that were redeemed and the call premium that applied to a portion of the repaid senior credit facilities.
20
Estimated Fair Value of Debt
The estimated fair value of our debt was determined using observable market prices, as the majority of our securities, including the Senior Secured Credit Facility and the Senior Notes due 2025, are traded in a brokered market, as were the Senior Notes due 2019 prior to their redemption. The fair value of our remaining debt instruments approximates carrying value based on their terms. As of September 30, 2017 and December 31, 2016, our long-term debt was classified as Level 2 within the fair value hierarchy, based on the frequency and volume of trading in the brokered market. The estimated fair value of our debt was as follows:
September 30, 2017 | December 31, 2016 | ||||||||||||||
Carrying amount | Estimated fair value | Carrying amount | Estimated fair value | ||||||||||||
Total senior and other debt | $ | 3,054,597 | $ | 3,118,539 | $ | 3,602,170 | $ | 3,632,853 | |||||||
Senior Notes due 2019 - Note Exchange Transaction
On April 15, 2016, Laureate entered into separate, privately negotiated note exchange agreements (the Note Exchange Agreements) with certain existing holders (the Existing Holders) of the Senior Notes due 2019 pursuant to which we agreed to exchange (the Note Exchange) $250,000 in aggregate principal amount of Senior Notes due 2019 for shares of the Company's Class A common stock. The exchange was to be completed within one year and one day after the consummation of an initial public offering of our common stock that generates gross proceeds of at least $400,000 or 10% of the equity value of the Company (a Qualified Public Offering). As discussed in Note 1, Description of Business, on February 6, 2017, the Company completed an initial public offering of its Class A common stock at a price per share of $14.00 that qualified as a Qualified Public Offering.
On August 2, 2017, we sent notices to the holders of these notes indicating that the closing of the exchange contemplated by the Note Exchange Agreements would be consummated on Friday, August 11, 2017. On August 11, 2017, Laureate issued 18,683 shares of Class A common stock, which was equal to 104.625% of the aggregate principal amount of Senior Notes due 2019 to be exchanged, or $261,600, divided by $14.00, the initial public offering price per share of Class A common stock in the Qualified Public Offering. Upon completion of the Note Exchange, the Company also paid approximately $11,100 to the exchanging holders, an amount equal to the interest and special interest accrued with respect to the Exchanged Notes to, but excluding, the date of consummation of the Note Exchange. Shares of our Class A common stock issued in the Note Exchange are listed on the Nasdaq Global Select Market.
The Note Exchange Agreements also provided that, within 60 days after the consummation of a Qualified Public Offering, at the option of the Existing Holders or their transferees, we would repurchase up to an additional $62,500 aggregate principal amount of Senior Notes due 2019 at the redemption price set forth in Section 3.07 of the indenture governing the Senior Notes due 2019 that is applicable as of the date of pricing of the Qualified Public Offering, plus accrued and unpaid interest and special interest. On March 1, 2017, in accordance with the terms of the Note Exchange Agreements, we repurchased Senior Notes due 2019 with an aggregate principal amount of $22,556 at a repurchase price of 104.625% of the aggregate principal amount, for a total payment of $23,599; the difference was recognized as Loss on debt extinguishment along with the portion of unamortized debt issuance costs that were written off.
Certain Covenants
As of September 30, 2017, our senior long-term debt contained certain negative covenants including, among others: (1) limitations on additional indebtedness; (2) limitations on dividends; (3) limitations on asset sales, including the sale of ownership interests in subsidiaries and sale-leaseback transactions; and (4) limitations on liens, guarantees, loans or investments. The Second Amended and Restated Credit Agreement provides, solely with respect to the Revolving Credit Facility, that the Company shall not permit its Consolidated Senior Secured Debt to Consolidated EBITDA ratio, as defined in the Second Amended and Restated Credit Agreement, to exceed 4.50x as of the last day of each quarter ending June 30, 2017 through September 30, 2017, 3.75x as of the last day of each quarter ending December 31, 2017 through March 31, 2018, and 3.50x as of the last day of each quarter ending June 30, 2018 and thereafter. However, the agreement also provides that if (i) the Company’s Consolidated Total Debt to Consolidated EBITDA ratio, as defined in the Second Amended and Restated Credit Agreement, is not greater than 4.75x as of such date and (ii) less than 25% of the Revolving Credit Facility is utilized as of that date, then such financial covenant shall not apply. As of September 30, 2017, these conditions were satisfied and, therefore, we were not subject to the leverage ratio covenant. In addition, notes payable at some of our locations contain financial maintenance covenants.
21
Note 9. Commitments and Contingencies
Noncontrolling Interest Holder Put Arrangements and Company Call Arrangements
The following section provides a summary table and description of the various noncontrolling interest holder put arrangements that Laureate had outstanding as of September 30, 2017. Laureate has elected to accrete changes in the arrangements’ redemption values over the period from the date of issuance to the earliest redemption date. The redeemable noncontrolling interests are recorded at the greater of the accreted redemption value or the traditional noncontrolling interest. Until the first exercise date, the put instruments’ reported values may be lower than the final amounts that will be required to settle the minority put arrangements. As of September 30, 2017, the carrying value of all noncontrolling interest holder put arrangements was $11,911, which includes accreted incremental value of $14,441 in excess of traditional noncontrolling interests.
If the minority put arrangements were all exercised at September 30, 2017, Laureate would be obligated to pay the noncontrolling interest holders an estimated amount of $11,911, as summarized in the following table:
Nominal Currency | First Exercisable Date | Estimated Value as of September 30, 2017 redeemable within 12-months: | Reported Value | ||||||
Noncontrolling interest holder put arrangements | |||||||||
INTI Education Holdings Sdn Bhd (INTI) - 10% | MYR | Current | $ | 10,016 | $ | 10,016 | |||
Pearl Retail Solutions Private Limited and Creative Arts Education Society (Pearl) - 10% | INR | Current | 1,835 | 1,835 | |||||
Stamford International University (STIU) - Puttable preferred stock of TEDCO | THB | Current | 60 | 60 | |||||
Total noncontrolling interest holder put arrangements | 11,911 | 11,911 | |||||||
Puttable common stock - currently redeemable | USD | Current | 4 | 4 | |||||
Puttable common stock - not currently redeemable | USD | * | — | 2,300 | |||||
Total redeemable noncontrolling interests and equity | $ | 11,915 | $ | 14,215 | |||||
* Contingently redeemable
MYR: Malaysian Ringgit
INR: Indian Rupee
THB: Thai Baht
Laureate’s noncontrolling interest put arrangements are specified in agreements with each noncontrolling interest holder. The terms of these agreements determine the measurement of the redemption value of the put options based on a non-GAAP measure of earnings before interest, taxes, depreciation and amortization (EBITDA, or recurring EBITDA), the definition of which varies for each particular contract.
Commitments and contingencies are generally denominated in foreign currencies.
Pearl
As part of the acquisition of Pearl, the minority owners had a put option to require Laureate to purchase the remaining 45% noncontrolling interest, and Laureate has a call option to require the minority owners to sell to Laureate up to 35% of the total equity of Pearl that is still owned by the noncontrolling interest holders (i.e. approximately 78% of the remaining 45% noncontrolling interest). On June 19, 2017, Laureate and the noncontrolling interest holders of Pearl amended the put and call option agreements in order to clarify certain aspects of the formula for determining the purchase price of the noncontrolling interests. The modifications to the agreement resulted in the exclusion of certain campus costs and liabilities in the purchase price calculation.
On July 11, 2017, the noncontrolling interest holders of Pearl notified Laureate of their election to exercise their put option for a portion of their total noncontrolling interest, which requires Laureate to purchase an additional 35% equity interest in Pearl. The purchase price for the 35% equity interest, which has been agreed to by the parties, is approximately $11,400 and has been recorded in Other current liabilities in the Consolidated Balance Sheet as of September 30, 2017. This liability was paid in October 2017. The remaining 10% puttable equity interest that is still held by the minority owners is recorded at its estimated redemption value of $1,835.
22
Series A Convertible Redeemable Preferred Stock Offering
As disclosed in our 2016 Form 10-K, on December 4, 2016, we signed a subscription agreement with six investors, including Kohlberg, Kravis and Roberts Co. L.P. and Snow Phipps Group LLC, both of which are affiliates of ours, pursuant to which we agreed to issue and sell to those investors an aggregate of 400 shares of a new series of our convertible redeemable preferred stock (the Series A Preferred Stock), consisting of 23 shares of Series A-1 Preferred Stock and 377 shares of Series A-2 Preferred Stock, in a private offering for total net proceeds of approximately $383,000. The closing of this transaction, for 343 shares, occurred on December 20, 2016 and we received net proceeds, after issuance costs, of approximately $328,000. One investor funded a portion of its purchase price for 57 shares, equal to $57,000 (approximately $55,000 net of issuance costs), in January 2017. The issuance costs are being accreted to the carrying value of the Series A Preferred Stock over the five-year redemption period.
The Series A Preferred Stock includes a Beneficial Conversion Feature (BCF) that was contingent on a qualified IPO (as defined in the Certificate of Designations governing the terms of the Series A Preferred Stock), which was consummated on February 6, 2017. Accordingly, during the first quarter of 2017, the Company recorded the BCF at its estimated fair value of $261,794 as a reduction of the carrying value of the Series A Preferred Stock and an increase to Additional Paid-In Capital. Beginning in the first quarter of 2017, the accretion of this BCF reduces net income available to common stockholders in the calculation of earnings per share, as shown in Note 15, Earnings (Loss) Per Share. During the nine months ended September 30, 2017, the Company recorded additional BCF of $3,574 related to the paid-in-kind dividends. The total BCF of $265,368 will be accreted using a constant yield approach over a one-year period. For the nine months ended September 30, 2017, we have recorded total accretion on the Series A Preferred Stock of $185,149, and as of September 30, 2017 the Series A Preferred Stock had a carrying value of $302,693. As of December 31, 2016, prior to the January 2017 funding of purchase price for the additional 57 shares of Series A Preferred Stock, and prior to the IPO and the recording of the IPO-contingent BCF, the Series A Preferred Stock had a carrying value of $332,957.
Other Loss Contingencies
Laureate is subject to legal actions arising in the ordinary course of its business. In management's opinion, we have adequate legal defenses, insurance coverage and/or accrued liabilities with respect to the eventuality of such actions. We do not believe that any settlement would have a material impact on our Consolidated Financial Statements.
Contingent Liabilities for Taxes
As of September 30, 2017 and December 31, 2016, Laureate has recorded cumulative liabilities totaling $58,046 and $67,192, respectively, for taxes other-than-income tax, principally payroll-tax-related uncertainties recorded at the time of an acquisition. The changes in this recorded liability are related to acquisitions, interest and penalty accruals, changes in tax laws, expirations of statutes of limitations, settlements and changes in foreign currency exchange rates. The terms of the statutes of limitations on these contingencies vary but can be up to 10 years. This liability is included in Other long-term liabilities on the Consolidated Balance Sheets. We have also recorded current liabilities for taxes other-than-income tax of $248 and $1,896, respectively, as of September 30, 2017 and December 31, 2016, in Other current liabilities on the Consolidated Balance Sheets. The recorded value of contingent liabilities is reduced when they are extinguished or the related statutes of limitations expire.
In addition, as of September 30, 2017 and December 31, 2016, Laureate has recorded cumulative liabilities for income tax contingencies of $110,513 and $103,471, respectively. In addition, we have identified certain tax-related contingencies that we have assessed as being reasonably possible of loss, but not probable of loss, and could have an adverse effect on the Company’s results of operations if the outcomes are unfavorable. In most cases, Laureate has received indemnifications from the former owners and/or noncontrolling interest holders of the acquired businesses for contingencies, and therefore, we do not believe we will sustain an economic loss even if we are required to pay these additional amounts. As of September 30, 2017 and December 31, 2016, indemnification assets primarily related to acquisition contingencies were $90,576 and $97,607, respectively. These indemnification assets primarily covered contingencies for income taxes and taxes other-than-income taxes.
Other Loss Contingencies
Laureate has accrued liabilities for certain civil actions against our institutions, a portion of which existed prior to our acquisition of these entities. As of September 30, 2017 and December 31, 2016, approximately $23,000 and $18,000, respectively, of loss contingencies were included in Other long-term liabilities and Other current liabilities on the Consolidated Balance Sheets. Laureate intends to vigorously defend against these lawsuits.
23
Hunan International Economics University (HIEU), our institution in China, is named as one of five defendants in a civil case involving a loan transaction that was entered into by certain noncontrolling interest holders of HIEU as borrowers, and was allegedly guaranteed by HIEU. The amount of the loan is approximately $29,000, including interest and penalties. The noncontrolling interest holders are the primary defendants in this civil case, with HIEU added in its alleged role as guarantor. Due to developments in the case that occurred during the second quarter of 2017, we determined that the probability of incurring a loss in this legal matter is reasonably possible as of September 30, 2017, but not probable, and therefore a liability has not been recorded. On November 4, 2017, HIEU was informed by the court that the case against it would be dismissed, although no formal judgment has been received. Until it receives the formal judgment of dismissal, HIEU will continue to vigorously defend this case.
Material Guarantees – Student Financing
Chile
The accredited Chilean institutions in the Laureate network also participate in a government-sponsored student financing program known as Crédito con Aval del Estado (the CAE Program). The CAE Program was formally implemented by the Chilean government in 2006 to promote higher education in Chile for lower socio-economic level students in good academic standing. The CAE Program involves tuition financing and guarantees that are provided by our institutions and the government. As part of the CAE Program, these institutions provide guarantees which result in contingent liabilities to third-party financing institutions, beginning at 90% of the tuition loans made directly to qualified students enrolled through the CAE Program and declining to 60% over time. The guarantees by these institutions are in effect during the period in which the student is enrolled, and the guarantees are assumed entirely by the government upon the student’s graduation. When a student leaves one of Laureate's institutions and enrolls in another CAE-qualified institution, the Laureate institution will remain guarantor of the tuition loans that have been granted up to the date of transfer, and until the student's graduation from a CAE-qualified institution. The maximum potential amount of payments our institutions could be required to make under the CAE Program was approximately $515,000 and $479,000 at September 30, 2017 and December 31, 2016, respectively. This maximum potential amount assumes that all students in the CAE Program do not graduate, so that our guarantee would not be assigned to the government, and that all students default on the full amount of the CAE-qualified loan balances. As of September 30, 2017 and December 31, 2016, we recorded $27,900 and $20,636, respectively, as estimated long-term guarantee liabilities for these obligations.
Material Guarantees – Other
In conjunction with the purchase of UNP, Laureate pledged all of the acquired shares as a guarantee of our payments of rents as they become due. In the event that we default on any payment, the pledge agreement provides for a forfeiture of the relevant pledged shares. In the event of forfeiture, Laureate may be required to transfer the books and management of UNP to the former owners.
Laureate acquired the remaining 49% ownership interest in UAM Brazil in April 2013. As part of the agreement to purchase the 49% ownership interest, Laureate pledged 49% of its total shares in UAM Brazil as a guarantee of our payment obligations under the purchase agreement. In the event that we default on any payment, the agreement provides for a forfeiture of the pledged shares.
In connection with the purchase of FMU on September 12, 2014, Laureate pledged 75% of the acquired shares to third-party lenders as a guarantee of our payment obligations under the loans that financed a portion of the purchase price. Laureate pledged the remaining 25% of the acquired shares to the sellers as a guarantee of our payment obligations under the purchase agreement for the seller notes. In the event that we default on any payment of the loans or seller notes, the purchase agreement provides for a forfeiture of the relevant pledged shares. After the payment of the seller notes in September 2017, the shares pledged to the sellers were pledged to the third-party lenders until full payment of the loans, which mature in April 2021. See Note 5, Due to Shareholders of Acquired Companies.
Standby Letters of Credit, Surety Bonds and Other Commitments
As of September 30, 2017 and December 31, 2016, Laureate's outstanding letters of credit (LOCs) and surety bonds primarily consisted of the items discussed below.
As of both September 30, 2017 and December 31, 2016, we had approximately $105,600 posted as LOCs in favor of the United States Department of Education (DOE). These LOCs were required to allow Walden, Kendall, NewSchool, and St. Augustine to continue participating in the DOE Title IV program. These LOCs are fully collateralized with cash equivalents and certificates of deposit, which are classified as Restricted cash and investments on our September 30, 2017 Consolidated Balance Sheet.
24
We received a letter dated October 12, 2017 from the DOE stating that, based on Laureate’s failure to meet standards of financial responsibility for the fiscal year ended December 31, 2016, we are required to either: 1) increase our LOC to an amount equal to 50% of the Title IV, Higher Education Act (HEA) funds received by Laureate in the fiscal year ended December 31, 2016 (calculated by the DOE to be $456,293) and qualify as a financially responsible institution; or 2) increase our LOC to an amount equal to 15% of the Title IV, HEA funds received by Laureate in the fiscal year ended December 31, 2016 (calculated by the DOE to be $136,888) and remain provisionally certified for a period of up to three complete award years. In the letter, the DOE also has required us to continue to comply with additional notification and reporting requirements. We have chosen the second option, to increase our LOC to $136,888 and to remain provisionally certified for a period of up to three complete award years, and we are in the process of obtaining one or more LOCs for such amount. We also chose that option in 2016, resulting in our letter of credit balance of $105,600 that is posted as of September 30, 2017.
As of September 30, 2017 and December 31, 2016, we had $39,236 and $34,746, respectively, posted as cash-collateral for LOCs related to the Spain Tax Audits. The cash collateral for these LOCs was classified as Restricted cash and investments on our September 30, 2017 Consolidated Balance Sheet.
As part of our normal operations, our insurers issue surety bonds on our behalf, as required by various state education authorities in the United States. We are obligated to reimburse our insurers for any payments made by the insurers under the surety bonds. As of September 30, 2017 and December 31, 2016, the total face amount of these surety bonds was $13,980 and $12,162, respectively. These bonds are fully collateralized with cash, which is classified as Restricted cash and investments on our September 30, 2017 Consolidated Balance Sheet.
In November 2016, in order to continue participating in Prouni, a federal program that offers tax benefits designed to increase higher education participation rates in Brazil, UAM Brazil posted a guarantee in the amount of $15,300. In connection with the issuance of the guarantee, UAM Brazil obtained a non-collateralized surety bond from a third party in order to secure the guarantee. The cost of the surety bond was $1,400, of which half was reimbursed by the former owner of UAM Brazil, and is being amortized over the five-year term. The Company believes that this matter will not have a material impact on our Consolidated Financial Statements.
Note 10. Financing Receivables
Laureate’s financing receivables consist primarily of trade receivables related to student tuition financing programs with an initial term in excess of one year. We have offered long-term financing through the execution of note receivable agreements with students at some of our institutions. Our disclosures include financing receivables that are classified in our Consolidated Balance Sheets as both current and long-term, reported in accordance with ASC 310, “Receivables.”
Laureate’s financing receivables balances were as follows:
September 30, 2017 | December 31, 2016 | ||||||
Financing receivables | $ | 36,501 | $ | 29,776 | |||
Allowance for doubtful accounts | (8,289 | ) | (9,175 | ) | |||
Financing receivables, net of allowances | $ | 28,212 | $ | 20,601 | |||
We do not purchase financing receivables in the ordinary course of our business. We may sell certain receivables that are significantly past due. No material amounts of financing receivables were sold during the periods reported herein.
25
Delinquency is the primary indicator of credit quality for our financing receivables. Receivable balances are considered delinquent when contractual payments on the loan become past due. Delinquent financing receivables are placed on non-accrual status for interest income. The accrual of interest is resumed when the financing receivable becomes contractually current and when collection of all remaining amounts due is reasonably assured. We record an Allowance for doubtful accounts to reduce our financing receivables to their net realizable value. The Allowance for doubtful accounts is based on the age of the receivables, the status of past-due amounts, historical collection trends, current economic conditions, and student enrollment status. Each of our institutions evaluates its balances for potential impairment. We consider impaired loans to be those that are past due one year or greater, and those that are modified as a troubled debt restructuring (TDR). The aging of financing receivables grouped by country portfolio was as follows:
Chile | Other | Total | |||||||||
As of September 30, 2017 | |||||||||||
Amounts past due less than one year | $ | 11,317 | $ | 843 | $ | 12,160 | |||||
Amounts past due one year or greater | 3,850 | 1,424 | 5,274 | ||||||||
Total past due (on non-accrual status) | 15,167 | 2,267 | 17,434 | ||||||||
Not past due | 16,564 | 2,503 | 19,067 | ||||||||
Total financing receivables | $ | 31,731 | $ | 4,770 | $ | 36,501 | |||||
As of December 31, 2016 | |||||||||||
Amounts past due less than one year | $ | 8,711 | $ | 834 | $ | 9,545 | |||||
Amounts past due one year or greater | 3,899 | 1,482 | 5,381 | ||||||||
Total past due (on non-accrual status) | 12,610 | 2,316 | 14,926 | ||||||||
Not past due | 11,758 | 3,092 | 14,850 | ||||||||
Total financing receivables | $ | 24,368 | $ | 5,408 | $ | 29,776 | |||||
The following is a rollforward of the Allowance for doubtful accounts related to financing receivables for the nine months ended September 30, 2017 and 2016, grouped by country portfolio:
Chile | Other | Total | |||||||||
Balance at December 31, 2016 | $ | (6,209 | ) | $ | (2,966 | ) | $ | (9,175 | ) | ||
Charge-offs | 2,798 | 330 | 3,128 | ||||||||
Recoveries | — | (36 | ) | (36 | ) | ||||||
Reclassifications | — | 69 | 69 | ||||||||
Provision | (2,089 | ) | 93 | (1,996 | ) | ||||||
Currency adjustments | (360 | ) | 81 | (279 | ) | ||||||
Balance at September 30, 2017 | $ | (5,860 | ) | $ | (2,429 | ) | $ | (8,289 | ) | ||
Balance at December 31, 2015 | $ | (7,240 | ) | $ | (3,336 | ) | $ | (10,576 | ) | ||
Charge-offs | 3,525 | 104 | 3,629 | ||||||||
Recoveries | — | (46 | ) | (46 | ) | ||||||
Reclassifications | — | — | — | ||||||||
Provision | (2,152 | ) | 181 | (1,971 | ) | ||||||
Currency adjustments | (387 | ) | 97 | (290 | ) | ||||||
Balance at September 30, 2016 | $ | (6,254 | ) | $ | (3,000 | ) | $ | (9,254 | ) | ||
Restructured Receivables
A TDR is a financing receivable in which the borrower is experiencing financial difficulty and Laureate has granted an economic concession to the student debtor that we would not otherwise consider. When we modify financing receivables in a TDR, Laureate typically offers the student debtor an extension of the loan maturity and/or a reduction in the accrued interest balance. In certain situations, we may offer to restructure a financing receivable in a manner that ultimately results in the forgiveness of contractually specified principal balances. Our only TDRs are in Chile.
26
The number of financing receivable accounts and the pre- and post-modification account balances modified under the terms of a TDR during the nine months ended September 30, 2017 and 2016 were as follows:
Number of Financing Receivable Accounts | Pre-Modification Balance Outstanding | Post-Modification Balance Outstanding | ||||||||
2017 | 355 | $ | 1,838 | $ | 1,655 | |||||
2016 | 559 | $ | 8,615 | $ | 5,986 | |||||
The preceding table represents accounts modified under the terms of a TDR during the nine months ended September 30, 2017, whereas the following table represents accounts modified as a TDR between January 1, 2016 and September 30, 2017 that subsequently defaulted during the nine months ended September 30, 2017:
Number of Financing Receivable Accounts | Balance at Default | |||||
Total | 156 | $ | 721 | |||
The following table represents accounts modified as a TDR between January 1, 2015 and September 30, 2016 that subsequently defaulted during the nine months ended September 30, 2016:
Number of Financing Receivable Accounts | Balance at Default | |||||
Total | 355 | $ | 1,089 | |||
Note 11. Share-based Compensation
Share-based compensation expense was as follows:
For the three months ended September 30, | For the nine months ended September 30, | ||||||||||||||
2017 | 2016 | 2017 | 2016 | ||||||||||||
Stock options, net of estimated forfeitures | $ | 4,590 | $ | 5,578 | $ | 33,421 | $ | 21,527 | |||||||
Restricted stock awards | 4,042 | 2,235 | 10,548 | 6,897 | |||||||||||
Total non-cash stock compensation | 8,632 | 7,813 | 43,969 | 28,424 | |||||||||||
Deferred compensation arrangement | — | 216 | — | 515 | |||||||||||
Total | $ | 8,632 | $ | 8,029 | $ | 43,969 | $ | 28,939 | |||||||
Stock Option Grant
On January 31, 2017, in connection with the Executive Profits Interests (EPI) agreement, we granted our CEO options (the EPI Options) to purchase 2,773 shares of our Class B common stock. The EPI Options vested upon consummation of the IPO on February 6, 2017. The exercise price of the EPI Options is equal to (i) $17.00 with respect to 50% of the shares of Class B common stock subject to the EPI Option and (ii) $21.32 with respect to 50% of the shares of Class B common stock subject to the EPI Option. The EPI Options are exercisable until December 31, 2019. The Company recorded approximately $14,600 of share-based compensation expense for the EPI Options in the first quarter of 2017.
Amendment to 2013 Long-Term Incentive Plan
On June 19, 2017, the Company’s Board of Directors (the Board) approved, subject to stockholder approval, an amendment and restatement of the Laureate Education, Inc. 2013 Long-Term Incentive Plan (as amended and restated, the 2013 Plan). Among other things, the amendment (i) increases the number of shares of Class A common stock that may be issued pursuant to awards under the 2013 Plan to 14,714; (ii) adds performance metrics, the ability to grant cash awards, and annual limits on grants, intended to qualify awards as performance-based awards that are not subject to certain limits on tax deductibility of compensation payable to certain executives; and (iii) extends the term of the 2013 Plan to June 18, 2027, the day before the 10th anniversary of the date of adoption of the amendment. On June 19, 2017, the holder of the majority of the voting power of the Company's outstanding stock (the Majority Holder) approved by written consent the amended and restated 2013 Plan and it became effective.
27
Stock Option Repricing
On June 19, 2017, the Board and the Majority Holder approved a stock option repricing (the Option Repricing). Pursuant to the Option Repricing, the exercise price of each Relevant Option (as defined below) was amended to reduce such exercise price to the average closing price of a share of the Company's Class A common stock as reported on the Nasdaq Global Select Market over the 20 calendar-day period following the mailing of the Notice and Information Statement to our stockholders. The average closing price of the Company's Class A common stock over such 20-day period was $17.44; accordingly, the exercise price of the Relevant Options was adjusted to $17.44.
Relevant Options were all outstanding stock options as of June 19, 2017 (vested or unvested) to acquire shares of Class B common stock granted under the 2013 Plan during calendar years 2013 through 2016, and totaled approximately 5,300 options. Since the modification of the terms of the awards occurred on June 19, 2017, the Company recorded incremental stock compensation expense during the second quarter of 2017 of approximately $5,100 for options that were vested at the modification date. Additionally, approximately $2,500 of incremental stock compensation expense related to options that were not yet vested at the modification date is being recognized over the remaining vesting period.
Note 12. Stockholders' Equity
The components of net changes in stockholders' equity were as follows:
Laureate Education, Inc. Stockholders | ||||||||||||||||||||||||||||||
Class A Common Stock | Class B Common Stock | Common Stock | Additional paid-in capital | (Accumulated deficit) retained earnings | Accumulated other comprehensive (loss) income | Non-controlling interests | Total stockholders' equity | |||||||||||||||||||||||
Shares | Amount | Shares | Amount | Shares | Amount | |||||||||||||||||||||||||
Balance at December 31, 2016 | — | $ | — | — | $ | — | 133,376 | $ | 534 | $ | 2,721,432 | $ | (1,037,701 | ) | $ | (1,052,055 | ) | $ | 32,182 | $ | 664,392 | |||||||||
Non-cash stock compensation | — | — | — | — | — | — | 43,969 | — | — | — | 43,969 | |||||||||||||||||||
Reclassification of Common stock into Class B common stock on January 31, 2017 | — | — | 133,376 | 534 | (133,376 | ) | (534 | ) | — | — | — | — | — | |||||||||||||||||
Issuance of Class A common stock in initial public offering | 35,000 | 140 | — | — | — | — | 456,219 | — | — | — | 456,359 | |||||||||||||||||||
Conversion of Class B shares to Class A shares | 1,032 | 4 | (1,032 | ) | (4 | ) | — | — | — | — | — | — | — | |||||||||||||||||
Note exchange transaction | 18,683 | 75 | — | — | — | — | 245,672 | — | — | — | 245,747 | |||||||||||||||||||
Vesting of restricted stock and exercise of stock options, net of shares withheld to satisfy tax withholding | 34 | — | 231 | 1 | — | — | (1,726 | ) | — | — | — | (1,725 | ) | |||||||||||||||||
Reclassification to equity upon expiration of put right on share-based awards | — | — | — | — | — | — | 5,500 | — | — | — | 5,500 | |||||||||||||||||||
Dividends to noncontrolling interests | — | — | — | — | — | — | (889 | ) | — | — | — | (889 | ) | |||||||||||||||||
Distributions to noncontrolling interest holders | — | — | — | — | — | — | — | — | — | (847 | ) | (847 | ) | |||||||||||||||||
Change in noncontrolling interests | — | — | — | — | — | — | 1,104 | — | (1,164 | ) | 60 | — | ||||||||||||||||||
Accretion of redeemable noncontrolling interests and equity | — | — | — | — | — | — | (6,135 | ) | — | — | — | (6,135 | ) | |||||||||||||||||
Accretion of Series A Convertible Redeemable Preferred Stock | — | — | — | — | — | — | (185,149 | ) | — | — | — | (185,149 | ) | |||||||||||||||||
Beneficial conversion feature for Series A Convertible Redeemable Preferred Stock | — | — | — | — | — | — | 265,368 | — | — | — | 265,368 | |||||||||||||||||||
Reclassification of redeemable noncontrolling interests and equity | — | — | — | — | — | — | — | — | — | (834 | ) | (834 | ) | |||||||||||||||||
Net loss | — | — | — | — | — | — | — | (104,380 | ) | — | (2,365 | ) | (106,745 | ) | ||||||||||||||||
Foreign currency translation adjustment, net of tax of $0 | — | — | — | — | — | — | — | — | 194,238 | 2,355 | 196,593 | |||||||||||||||||||
Unrealized gain on derivatives, net of tax of $0 | — | — | — | — | — | — | — | — | 6,625 | — | 6,625 | |||||||||||||||||||
Balance at September 30, 2017 | 54,749 | $ | 219 | 132,575 | $ | 531 | — | $ | — | $ | 3,545,365 | $ | (1,142,081 | ) | $ | (852,356 | ) | $ | 30,551 | $ | 1,582,229 | |||||||||
28
Accumulated Other Comprehensive Income (Loss)
Accumulated other comprehensive income (AOCI) in our Consolidated Balance Sheets includes the accumulated translation adjustments arising from translation of foreign subsidiaries' financial statements, the unrealized losses on derivatives designated as cash flow hedges, and the accumulated net gains or losses that are not recognized as components of net periodic benefit cost for our minimum pension liability. The components of these balances were as follows:
September 30, 2017 | December 31, 2016 | ||||||||||||||||||
Laureate Education, Inc. | Noncontrolling Interests | Total | Laureate Education, Inc. | Noncontrolling Interests | Total | ||||||||||||||
Foreign currency translation loss | $ | (851,148 | ) | $ | 51 | $ | (851,097 | ) | $ | (1,044,222 | ) | $ | (2,304 | ) | $ | (1,046,526 | ) | ||
Unrealized gain (loss) on derivatives | 1,407 | — | 1,407 | (5,218 | ) | — | (5,218 | ) | |||||||||||
Minimum pension liability adjustment | (2,615 | ) | — | (2,615 | ) | (2,615 | ) | — | (2,615 | ) | |||||||||
Accumulated other comprehensive (loss) income | $ | (852,356 | ) | $ | 51 | $ | (852,305 | ) | $ | (1,052,055 | ) | $ | (2,304 | ) | $ | (1,054,359 | ) | ||
Note 13. Derivative Instruments
In the normal course of business, our operations are exposed to fluctuations in foreign currency values and interest rate changes. We may seek to control a portion of these risks through a risk management program that includes the use of derivative instruments.
The interest and principal payments for Laureate’s senior long-term debt arrangements are to be paid primarily in USD. Our ability to make debt payments is subject to fluctuations in the value of the USD against foreign currencies, since a majority of our operating cash used to make these payments is generated by subsidiaries with functional currencies other than USD. As part of our overall risk management policies, Laureate has at times entered into foreign currency swap contracts and floating-to-fixed interest rate swap contracts. In addition, we occasionally enter into foreign exchange forward contracts to reduce the impact of other non-functional currency-denominated receivables and payables.
We do not enter into speculative or leveraged transactions, nor do we hold or issue derivatives for trading purposes. We generally intend to hold our derivatives until maturity.
Laureate reports all derivatives at fair value. These contracts are recognized as either assets or liabilities, depending upon the derivative’s fair value. Gains or losses associated with the change in the fair value of these swaps are recognized in our Consolidated Statements of Operations on a current basis over the term of the contracts, unless designated and effective as a hedge. For swaps that are designated and effective as cash flow hedges, gains or losses associated with the change in fair value of the swaps are recognized in our Consolidated Balance Sheets as a component of AOCI and amortized into earnings as a component of Interest expense over the term of the related hedged items.
29
The reported fair values of our derivatives, which are classified in Derivative instruments on our Consolidated Balance Sheets, were as follows:
September 30, 2017 | December 31, 2016 | ||||||
Derivatives designated as hedging instruments: | |||||||
Long-term assets: | |||||||
Interest rate swaps | $ | 1,407 | $ | — | |||
Current liabilities: | |||||||
Interest rate swaps | — | 5,218 | |||||
Derivatives not designated as hedging instruments: | |||||||
Long-term assets: | |||||||
Contingent redemption features - Series A Preferred Stock | 28,314 | 4,464 | |||||
Long-term liabilities: | |||||||
Cross currency and interest rate swaps | 7,864 | 7,420 | |||||
Interest rate swaps | 230 | 330 | |||||
Total derivative instrument assets | $ | 29,721 | $ | 4,464 | |||
Total derivative instrument liabilities | $ | 8,094 | $ | 12,968 | |||
Derivatives Designated as Hedging Instruments
2024 Term Loan Interest Rate Swaps
In May 2017, Laureate entered into, and designated as cash flow hedges, four pay-fixed, receive-floating amortizing interest rate swaps with notional amounts of $100,000, $100,000, $200,000 and $300,000, respectively. These notional amounts match the corresponding principal of the 2024 Term Loan borrowings of which these swaps are effectively hedging the interest payments. As such, the notional values amortize annually based on the terms of the agreements to match the principal borrowings as they are repaid. Refer to Note 8, Debt, for further information regarding the underlying borrowings. These swaps effectively fix the floating interest rate on the term loan to reduce exposure to variability in cash flows attributable to changes in the USD-LIBOR-BBA swap rate. All four swaps have an effective date of May 31, 2017 and mature on May 31, 2022. The terms of the swaps require Laureate to pay interest on the basis of fixed rates of 1.756%, 1.796%, 1.796% and 1.763% on the $100,000, $100,000, $200,000 and $300,000 notional values, respectively. Laureate will receive interest for all four swaps on the basis of one-month USD-LIBOR-BBA, with a floor of 1%. As of September 30, 2017, these interest rate swaps had an estimated fair value of $1,407.
Interest Rate Swaps
In September 2011, Laureate entered into two forward interest rate swap agreements that were designated as cash flow hedges. The swaps effectively fixed interest rates on existing variable-rate borrowings in order to manage our exposure to future interest rate volatility. Both swaps had an effective date of June 30, 2014 and matured on June 30, 2017. The gain or loss on these swaps was deferred in AOCI and then reclassified into earnings as a component of Interest expense in the same periods during which the hedged forecasted transactions affected earnings. During the second quarter of 2017, all of the gain or loss previously deferred in AOCI had been recognized in earnings since the swaps had matured. As of December 31, 2016, these interest rate swaps had an estimated fair value of $5,218.
30
The table below shows the total recorded unrealized gain (loss) of these swaps in Comprehensive income (loss). The impact of derivative instruments designated as hedging instruments on Comprehensive income (loss), Interest expense and AOCI were as follows:
For the three months ended September 30:
Gain Recognized in Comprehensive Income (Effective Portion) | Income Statement Location | Loss Reclassified from AOCI to Income (Effective Portion) | |||||||||||||||
2017 | 2016 | 2017 | 2016 | ||||||||||||||
Interest rate swaps | $ | 525 | $ | 2,386 | Interest expense | $ | (972 | ) | $ | (2,687 | ) | ||||||
For the nine months ended September 30:
Gain Recognized in Comprehensive Income (Effective Portion) | Income Statement Location | Loss Reclassified from AOCI to Income (Effective Portion) | |||||||||||||||
2017 | 2016 | 2017 | 2016 | ||||||||||||||
Interest rate swaps | $ | 6,625 | $ | 5,509 | Interest expense | $ | (6,705 | ) | $ | (8,002 | ) | ||||||
Derivatives Not Designated as Hedging Instruments
Derivatives related to Series A Preferred Stock Offering
The Company identified several derivatives associated with the issuance of the Series A Preferred Stock as discussed in Note 9, Commitments and Contingencies. The embedded derivatives are related to certain contingent redemption features of the Series A Preferred Stock. As of September 30, 2017 and December 31, 2016, the estimated fair values of these derivatives were assets of $28,314 and $4,464, respectively, and were recorded in Derivative instruments as noncurrent assets on the Consolidated Balance Sheets. During the first quarter of 2017, $4,382 was bifurcated from the carrying value of the Series A Preferred Stock and recorded as derivative assets. The increase in estimated fair value during the nine months ended September 30, 2017 of $19,468 was recorded as an unrealized gain on derivatives in the Consolidated Statement of Operations. These derivatives are not designated as hedges for accounting purposes thus the changes in estimated fair value are recognized as a component of earnings.
CLP to Unidad de Fomento (UF) Cross Currency and Interest Rate Swaps
The cross currency and interest rate swap agreements are intended to provide a better correlation between our debt obligations and operating currencies. In 2010, one of our subsidiaries in Chile entered into four cross currency and interest rate swap agreements. One of the swaps matures on December 1, 2024, and the remaining three mature on July 1, 2025 (the CLP to UF cross currency and interest rate swaps). The UF is a Chilean inflation-adjusted unit of account. The four swaps have an aggregate notional amount of approximately $31,000, and convert CLP-denominated, floating-rate debt to fixed-rate UF-denominated debt. The CLP to UF cross currency and interest rate swaps were not designated as hedges for accounting purposes. As of September 30, 2017 and December 31, 2016, these swaps had an estimated fair value of $7,864 and $7,420, respectively, which was recorded in Derivative instruments as a long-term liability.
THINK Interest Rate Swaps
Laureate acquired THINK on December 20, 2013, and financed a portion of the purchase price by borrowing AUD 45,000 (US $35,415 at September 30, 2017) under a syndicated facility agreement in the form of two term loans of AUD 22,500 each. The terms of the syndicated facility agreement required THINK to enter into an interest rate swap within 45 days from the agreement's December 20, 2013 effective date, in order to convert at least 50% of the AUD 45,000 of term loan debt from a variable interest rate based on the BBSY bid rate, an Australia bank rate, to a fixed interest rate. Accordingly, on January 31, 2014, THINK executed an interest rate swap agreement with an original notional amount of AUD 22,500 to satisfy this requirement and converted AUD 22,500 (US $17,708 at September 30, 2017) of the variable rate component of the term loan debt to a fixed interest rate of 3.86%. The notional amount of the swap decreases quarterly based on the terms of the agreement, and the swap matures on December 20, 2018. This interest rate swap was not designated as a hedge for accounting purposes, and had an estimated fair value of $230 and $330 at September 30, 2017 and December 31, 2016, respectively, which was recorded in Derivative instruments as a long-term liability.
31
Components of the reported Gain (loss) on derivatives not designated as hedging instruments in the Consolidated Statements of Operations were as follows:
For the three months ended September 30, | For the nine months ended September 30, | ||||||||||||||
2017 | 2016 | 2017 | 2016 | ||||||||||||
Unrealized (Loss) Gain | |||||||||||||||
Contingent redemption features - Series A Preferred | $ | (19,974 | ) | $ | — | $ | 19,468 | $ | — | ||||||
Cross currency and interest rate swaps | 151 | (3,979 | ) | 24 | (1,514 | ) | |||||||||
Interest rate swaps | 58 | 17 | 129 | (34 | ) | ||||||||||
(19,765 | ) | (3,962 | ) | 19,621 | (1,548 | ) | |||||||||
Realized (Loss) Gain | |||||||||||||||
Cross currency and interest rate swaps | (165 | ) | 4,539 | (434 | ) | (6,530 | ) | ||||||||
Interest rate swaps | — | (61 | ) | — | (157 | ) | |||||||||
(165 | ) | 4,478 | (434 | ) | (6,687 | ) | |||||||||
Total (Loss) Gain | |||||||||||||||
Contingent redemption features - Series A Preferred | (19,974 | ) | — | 19,468 | — | ||||||||||
Cross currency and interest rate swaps | (14 | ) | 560 | (410 | ) | (8,044 | ) | ||||||||
Interest rate swaps | 58 | (44 | ) | 129 | (191 | ) | |||||||||
(Loss) gain on derivatives, net | $ | (19,930 | ) | $ | 516 | $ | 19,187 | $ | (8,235 | ) | |||||
The realized gain on derivatives during the three months ended September 30, 2016 was from foreign exchange forward contracts related to the sale of institutions in France that matured in July 2016. The realized loss on derivatives during the nine months ended September 30, 2016 was from a deal-contingent forward exchange swap agreement related to the sale of our Swiss and associated institutions, less the gain from the aforementioned foreign exchange forward contracts.
Credit Risk and Credit-Risk-Related Contingent Features
Laureate’s derivatives expose us to credit risk to the extent that the counterparty may possibly fail to perform its contractual obligation. The amount of our credit risk exposure is equal to the fair value of the derivative when any of the derivatives are in a net gain position. As of September 30, 2017 and December 31, 2016, the estimated fair values of derivatives in a gain position were $29,721 and $4,464, respectively; however, this carrying value relates almost entirely to the redemption rights of the holders of the Series A Preferred Stock, which do not expose us to credit risk. Our counterparty credit risk is currently limited to the 2024 Term Loan Interest Rate Swaps with aggregate fair values in a gain position of $1,407 as of September 30, 2017.
Laureate has limited its credit risk by only entering into derivative transactions with highly rated major financial institutions. We have not entered into collateral agreements with our derivatives' counterparties. At September 30, 2017, one institution which was rated Aa3, four institutions which were rated A1 and one institution which was rated A3 by the global rating agency of Moody's Investors Service accounted for all of Laureate's derivative credit risk exposure.
Laureate's agreements with its derivative counterparties contain a provision under which we could be declared in default on our derivative obligations if repayment of the underlying indebtedness is accelerated by the lender due to a default on the indebtedness. As of September 30, 2017 and December 31, 2016, we had not breached any default provisions and had not posted any collateral related to these agreements. If we had breached any of these provisions, we could have been required to settle the obligations under the derivative agreements for an amount that we believe would approximate their estimated fair value of $8,094 as of September 30, 2017 and $12,968 as of December 31, 2016.
Note 14. Income Taxes
Laureate uses the liability method to account for income taxes. Deferred income taxes reflect the net tax effects of temporary differences between the carrying amount of assets and liabilities for financial reporting purposes and the amounts used for income tax purposes. For interim purposes, we also apply ASC 740-270, "Income Taxes - Interim Reporting."
Laureate's income tax provisions for all periods consist of federal, state and foreign income taxes. The tax provisions for the nine months ended September 30, 2017 and 2016 were based on estimated full-year effective tax rates, after giving effect to significant
32
items related specifically to the interim periods, including the mix of income for the period between higher-taxed and lower-taxed jurisdictions. Laureate has operations in multiple countries, many of which have statutory tax rates lower than the United States or are tax-exempt entities, and other operations that are loss-making entities for which it is not more likely than not that a tax benefit will be realized on the loss. Generally, lower tax rates in these foreign jurisdictions along with Laureate’s intent and ability to indefinitely reinvest foreign earnings outside of the United States results in an effective tax rate significantly lower than the statutory rate in the United States.
Note 15. Earnings (Loss) Per Share
As discussed in Note 1, Description of Business, on January 31, 2017 our common stock was reclassified into shares of Class B common stock and, on February 6, 2017, we completed our IPO of Class A common stock. Other than voting rights, the Class B common stock has the same rights as the Class A common stock and therefore both are treated as the same class of stock for purposes of the earnings per share calculation. Laureate computes basic earnings per share (EPS) by dividing income available to common shareholders by the weighted average number of common shares outstanding for the reporting period. Diluted EPS reflects the potential dilution that would occur if share-based compensation awards/arrangements or contingently issuable shares were exercised or converted into common stock. To calculate the diluted EPS, the basic weighted average number of shares is increased by the dilutive effect of stock options, restricted stock, and other share-based compensation arrangements determined using the treasury stock method.
The following tables summarize the computations of basic and diluted earnings per share:
For the three months ended September 30, | 2017 | 2016 | |||||
Numerator used in basic and diluted (loss) earnings per common share: | |||||||
(Loss) income from continuing operations attributable to Laureate Education, Inc. | $ | (97,959 | ) | $ | 86,317 | ||
Accretion of redemption value of redeemable noncontrolling interests and equity | (105 | ) | 1,426 | ||||
Adjusted for: accretion related to noncontrolling interests and equity redeemable at fair value | — | 756 | |||||
Accretion of Series A convertible redeemable preferred stock | (83,955 | ) | — | ||||
Distributed and undistributed earnings to participating securities | — | (22 | ) | ||||
Accretion of Series A convertible redeemable preferred stock and other redeemable noncontrolling interests and equity | (84,060 | ) | 2,160 | ||||
Net (loss) income available to common stockholders | $ | (182,019 | ) | $ | 88,477 | ||
Denominator used in basic and diluted (loss) earnings per common share: | |||||||
Basic weighted average shares outstanding | 178,871 | 133,303 | |||||
Effect of dilutive stock options | — | 828 | |||||
Effect of dilutive restricted stock units | — | 98 | |||||
Dilutive weighted average shares outstanding | 178,871 | 134,229 | |||||
Basic and diluted (loss) earnings per share: | |||||||
Basic (loss) earnings per share | $ | (1.02 | ) | $ | 0.66 | ||
Diluted (loss) earnings per share | $ | (1.02 | ) | $ | 0.66 | ||
33
For the nine months ended September 30, | 2017 | 2016 | |||||
Numerator used in basic and diluted (loss) earnings per common share: | |||||||
(Loss) income from continuing operations attributable to Laureate Education, Inc. | $ | (104,380 | ) | $ | 330,539 | ||
Accretion of redemption value of redeemable noncontrolling interests and equity | (635 | ) | 3,538 | ||||
Adjusted for: accretion related to noncontrolling interests and equity redeemable at fair value | (6,357 | ) | (201 | ) | |||
Accretion of redemption value of Series A Preferred Stock | (185,149 | ) | — | ||||
Distributed and undistributed earnings to participating securities | — | (104 | ) | ||||
Accretion of Series A convertible redeemable preferred stock and other redeemable noncontrolling interests and equity | (192,141 | ) | 3,233 | ||||
Net (loss) income available to common stockholders | $ | (296,521 | ) | $ | 333,772 | ||
Denominator used in basic and diluted (loss) earnings per common share: | |||||||
Basic weighted average shares outstanding | 167,261 | 133,291 | |||||
Effect of dilutive stock options | — | 858 | |||||
Effect of dilutive restricted stock units | — | 68 | |||||
Dilutive weighted average shares outstanding | 167,261 | 134,217 | |||||
Basic and diluted (loss) earnings per share: | |||||||
Basic (loss) earnings per share | $ | (1.77 | ) | $ | 2.50 | ||
Diluted (loss) earnings per share | $ | (1.77 | ) | $ | 2.49 | ||
The shares of Class A common stock that would be issued upon completion of the conversion of the Series A Preferred Stock are not included in the calculation of diluted EPS as the effect would have been antidilutive. The following table summarizes the number of stock options and shares of restricted stock that were excluded from the diluted EPS calculations because the effect would have been antidilutive:
For the three months ended September 30, | For the nine months ended September 30, | ||||||||||
2017 | 2016 | 2017 | 2016 | ||||||||
Stock options | 13,443 | 5,414 | 12,957 | 2,931 | |||||||
Restricted stock | 843 | 168 | 730 | 131 | |||||||
Note 16. Related Party Transactions
Corporate
Santa Fe University of Arts and Design (SFUAD)
SFUAD is owned by Wengen Alberta, Limited Partnership (Wengen), our controlling stockholder. Laureate is affiliated with SFUAD, but does not own or control it and, accordingly, SFUAD is not included in the financial results of Laureate. On May 18, 2016, SFUAD announced that it had signed an agreement to be acquired by a private education provider with a global network of colleges and universities that focus on art and design education. This agreement was terminated by the parties thereto on March 29, 2017. On April 12, 2017, SFUAD announced that it plans to close after the end of the 2017-2018 academic year and will work with its students on a phased teach-out and transfer process for students who are eligible to complete their degrees by May 2018 and appropriate transfer opportunities for other students. The teach-out plan has been approved by the Higher Learning Commission (HLC).
Transactions between Laureate and Affiliates, Directors and a Former Executive
During the first quarter of 2017, Laureate made a charitable contribution of $2,000 to the Sylvan Laureate Foundation, a non-profit foundation that supports programs designed to promote education and best practices and principles in teaching. The payment was accrued in prior periods.
34
An affiliate of one of the Wengen investors acted as a financial adviser in connection with our IPO and we paid this affiliate $2,768 for its services during the nine months ended September 30, 2017.
During the nine months ended September 30, 2017, we made payments of approximately $803 in the aggregate to members of our Board for their services as directors.
During the first quarter of 2017, the Company paid in full a note payable to a former executive of approximately $4,280, which represented the original note payable of $3,771 plus accrued interest. As previously disclosed in our 2016 Form 10-K, the note payable was issued in 2014 in exchange for vested share-based compensation and was payable upon consummation of the IPO.
EMEAA
Morocco
Transactions between Laureate and Noncontrolling Interest Holder of Laureate Somed Education Holding SA (LSEH)
LSEH is 60% owned and consolidated by Laureate and is the entity that operates Université Internationale de Casablanca, our institution in Morocco. The 40% noncontrolling interest holder of LSEH has made loans to LSEH, and as of December 31, 2016, we had a related party payable of $7,936 to the noncontrolling interest holder for the outstanding balance of and accrued interest on these loans, all of which was recorded as current.
During the nine months ended September 30, 2017, the maturity dates of five loans made by the noncontrolling interest holder were extended. The first loan was made by the noncontrolling interest holder in December 2013 and the maturity date was extended from December 2016 to December 2018. The second loan was made by the noncontrolling interest holder in March 2015 and the maturity date was extended from September 2016 to September 2019. The third loan was made by the noncontrolling interest holder in June 2015 and the maturity date was extended from December 2016 to December 2018. The fourth loan was made by the noncontrolling interest holder in April 2014 and the maturity date was extended from April 2017 to April 2019. The fifth loan was made by the noncontrolling interest holder in October 2015 and the maturity date was extended from April 2017 to October 2019. The total outstanding balance of these five loans, including accrued interest, at the extension dates was Moroccan Dirham (MAD) 74,262 (US $7,858 at September 30, 2017). Each of these loans bears an interest rate of 4.5% per annum.
As of September 30, 2017, we had total related party payables of $8,841 to the noncontrolling interest holder of LSEH for the outstanding balance on these loans plus accrued interest, of which $881 and $7,960 was recorded as current and noncurrent, respectively.
China
Transactions between China businesses and Noncontrolling Interest Holders of HIEU
A portion of real property that HIEU has paid for, including land and buildings, is mortgaged as collateral for corporate loans that the entity controlled by certain noncontrolling interest holders of HIEU has entered into with third-party banks. In December 2013, the noncontrolling interest holders of HIEU signed an agreement with Laureate and committed to: (1) remove all encumbrances on HIEU’s real property no later than September 30, 2014 and (2) cause the entity to complete the transfer of title relating to the encumbered real property to HIEU no later than December 31, 2014. Under the terms of this agreement, the noncontrolling interest holders also agreed to pay any and all transfer taxes, fees and other costs that are required in connection with the removal of the encumbrances and the transfer of titles, which are estimated to be approximately $2,000. As collateral for their performance under the agreement, the noncontrolling interest holders pledged to Laureate their 30% equity interest in the sponsoring entity of HIEU. The noncontrolling interest holders of HIEU have not completed their commitment to remove the encumbrances over the real property or completed the transfer of the real property. Under the terms of the agreement, Laureate has the right to receive the sale proceeds of the noncontrolling interest holders' 30% equity interest, up to the amount owing to it under the equity pledge, in priority to other creditors of the noncontrolling interest holders.
On February 22, 2016, certain creditors of the noncontrolling interest holders initiated an enforcement process against the noncontrolling interest holders and requested the court to auction a portion of the equity interest of the noncontrolling interest holders (being a 22.8% interest in the sponsoring entity of HIEU). The most recent round of the court auction process was held on August 21, 2017. At that auction, Guangdong Nanbo Education Investment Co. Ltd successfully bid approximately RMB 508,000 (approximately $77,000 as of September 30, 2017) for the shares being auctioned. It is expected that the sale of these
35
shares will be completed before the end of 2017. As the registered pledgee, Laureate has the right to receive the sale proceeds of the noncontrolling interest holders' equity interest, up to the amount owing to it under the equity pledge, in priority to other creditors of the noncontrolling interest holders. As of both September 30, 2017 and December 31, 2016, Laureate’s net carrying value of the encumbered real property was approximately $12,000.
South Africa
Transactions between Laureate and Noncontrolling Interest Holder of Monash South Africa (MSA)
During the first quarter of 2017, we received an additional loan from the noncontrolling interest holder of MSA in the amount of $943. The loan matures in January 2026 and bears interest at a rate of 10.5% per annum.
Note 17. Legal and Regulatory Matters
Laureate is subject to legal proceedings arising in the ordinary course of business. In management's opinion, we have adequate legal defenses, insurance coverage, and/or accrued liabilities with respect to the eventuality of these actions. Management believes that any settlement would not have a material impact on Laureate's financial position, results of operations, or cash flows. For further description, see our 2016 Form 10-K. Discussed below are those matters that had material developments during the nine months ended September 30, 2017.
Turkish Regulation - Bilgi Annual Audit
The Company previously disclosed in its 2016 Form 10-K that the Turkish Higher Education Council (the YÖK), which regulates Istanbul Bilgi University (Bilgi), a member of the Laureate International Universities network located in Istanbul, Turkey, was conducting its annual audit of Bilgi’s operations (the Annual Audit). On April 18, 2017, Bilgi received from the YÖK the results of the Annual Audit. The Annual Audit report requires, among other things, that (i) with respect to the 2017-2018 academic year, there be a reduction in the quota for the number of new students permitted to be admitted into Bilgi’s degree programs and (ii) Bilgi be reimbursed, not later than October 18, 2017, approximately $29,000 for payments previously made by Bilgi to a subsidiary of the Company for certain management, operational and student services, and intellectual property. The Company and Bilgi believe the charges to Bilgi for these services were at fair value and Bilgi has contested the findings of the Annual Audit that they constituted an improper wealth transfer. Demands also were made in the Annual Audit for the return or payment to Bilgi, by October 18, 2017, of other amounts involving approximately $8,000.
The Company believes that Bilgi is in compliance with all laws and regulations. Bilgi exercised its right to appeal this decision to the YÖK to demonstrate the validity and value of the services procured from the Company subsidiary but the YÖK has rejected that appeal. Bilgi has appealed the YÖK’s rejection of its appeal to the Turkish court system and has not been reimbursed for any of the payments made to the Company’s subsidiary for the services described above. As a result, as of October 18, 2017, Bilgi is in non-compliance with certain requirements of the Annual Audit report. As the Company currently consolidates Bilgi under the variable interest entity model, if the Company is unable to provide services under its contracts with Bilgi and receive the economic benefits from those contracts as a result of the determinations in the Annual Audit, deconsolidation of Bilgi could be required. Deconsolidation, if required, could have a material adverse effect on the Company’s business, financial condition and results of operations, including possible write-off of all or a portion of the Company’s investment in Bilgi and a reduction in operating income. At September 30, 2017 and December 31, 2016, Bilgi had total assets of approximately $134,000 and $83,000, respectively, and total liabilities of $117,000 and $63,000, respectively. Total liabilities include approximately $32,000 and $19,000 of net intercompany liabilities as of September 30, 2017 and December 31, 2016, respectively. During fiscal year 2016, Bilgi generated approximately $106,000 of the Company’s consolidated revenue and approximately $26,000 of the Company’s consolidated operating income and incurred approximately $6,000 of depreciation and amortization expense.
Chilean Regulation - Higher Education Bill
On July 5, 2016, the Chilean President submitted to the Chilean Congress a bill (the “2016 Higher Education Bill”) that was intended to change the entire regulatory landscape of higher education in Chile by, among other things, creating new special government administrative agencies and enhancing the requirements for institutional accreditation of higher education institutions. Following its submission to the Chilean Congress, the 2016 Higher Education Bill was subject to national debate among different constituencies in the higher education system. As a result of these discussions, the Chilean executive branch decided to replace the 2016 Higher Education Bill with a new submission that would take into consideration the main concerns that were raised during those discussions. These discussions identified, among other things, (i) the need to reinforce, improve and enhance the state-owned universities, separating their regulation from the regulation applicable to other educational institutions, (ii) the need
36
to develop special regulations for technical education, (iii) the need to improve regulations concerning the compliance by private universities with the requirement that they not be operated for profit, and (iv) the need to grant universal access to educational institutions.
In furtherance of these goals, on April 7, 2017, the Chilean executive branch submitted to the Chilean Congress a new bill (the “2017 Higher Education Bill”), which entirely supersedes the 2016 Higher Education Bill. The 2017 Higher Education Bill represents a simplified version of the 2016 Higher Education Bill and was based on the same principles and ideas as the earlier bill, as informed by the subsequent national debate on that bill. The 2017 Higher Education Bill considers the higher education system to be a mixed system composed of two subsystems, one for university education (including both state-owned institutions and private universities recognized by the state) and another for technical education (both state-owned technical training centers and private technical training centers and professional institutes).
Among other things, the 2017 Higher Education Bill would create the Undersecretary of Higher Education, who would propose policies on higher education to the Ministry of Education and policies regarding access, inclusion, retention and graduation of higher education students. The Undersecretary of Higher Education would also propose the allocation and management of public funds and manage the procedures relating to the granting and revocation of the official recognition of higher education institutions. The Undersecretary of Higher Education would also generate and coordinate instances of participation and dialogue with and among higher education institutions, promoting the connection between these institutions and the secondary education system.
The 2017 Higher Education Bill also includes new regulations applicable to not‑for‑profit educational institutions that would: (i) provide that their controllers and members can only be individuals, other not‑for‑profits or state‑owned entities; (ii) create the obligation to use their resources and reinvest their surplus or profits in the pursuit of their objectives and in enhancing the quality of the education they provide; (iii) create the obligation to have a board of directors, which cannot delegate its functions, and whose members cannot be removed unless approved by the majority of the board and for serious reasons; and (iv) prohibit related party transactions with their founders, controllers, members of the board, rector and their relatives or related entities, unless the counterparty to the transaction is another not‑for‑profit entity, or if the transaction involves entering into a labor agreement to carry out academic work for the educational institution. The bill provides further that in the event the educational institution enters into a related party transaction consistent with the above, or if such educational institution enters into a related party transaction with a different entity than those described above, such transaction also comply with the following requirements: (i) that it contribute to the best interests of the educational institution and to its mission and purpose; (ii) that the transaction be agreed under market conditions as to the price and general terms and conditions prevailing for such types of transactions; and (iii) that it be approved by a majority of the institution’s board of directors. The 2017 Higher Education Bill also would establish a new criminal felony of incompatible negotiations for those persons who, in their capacity of managing the educational institution’s assets, enter into any transaction with related parties having any personal interest or granting benefits to third parties without complying with the foregoing requirements. Among the sanctions for breaching such regulations, the person may be subject to imprisonment plus a fine of double the amount of the benefit that such person or entity had obtained.
On July 17, 2017, the Chamber of Deputies, which is the lower house of the Chilean Congress, passed the 2017 Higher Education Bill, substantially in the form described above. The 2017 Higher Education Bill has now moved to the Chilean Senate, where it has been referred for consideration by the Senate Education Commission. Members of the Chamber of Deputies have announced that they intend to bring constitutional challenges to 16 provisions of the bill passed by the Chamber of Deputies. If the 2017 Higher Education Bill is passed by the Chilean Senate without resolving the challenged provisions, those provisions would be referred to the Chilean Constitutional Court for resolution prior to the bill taking effect.
We are currently evaluating the effect the proposed 2017 Higher Education Bill would have on the Chilean institutions in the Laureate International Universities network if it is adopted in the form introduced in the Chilean Congress and approved by the Chamber of Deputies. We cannot predict whether or not the proposed 2017 Higher Education Bill will be adopted in this form or if it, or any part of it, will survive constitutional challenge, or if any higher education legislation will be adopted that would affect the institutions in the Laureate International Universities network. However, if any such legislation is adopted, it could have a material adverse effect on our results of operations and financial condition.
As the Company currently consolidates certain of its institutions in Chile under the variable interest entity model, the Company will review such consolidation upon passage of any new higher education bill. Deconsolidation of one or more of our Chilean institutions, if required, could have a material adverse effect on our financial condition and results of operations. At September 30, 2017 and December 31, 2016, the Chilean VIEs had total assets of approximately $806,000 and $687,000, respectively, and total liabilities of $186,000 and $93,000, respectively. Total assets include approximately $20,000 and $11,000 of net intercompany assets as of September 30, 2017 and December 31, 2016, respectively, as well as goodwill balances that could be reallocated among the VIE and non-VIE businesses within the Chile reporting unit if deconsolidation of the VIEs were required.
37
Note 18. Fair Value Measurement
Fair value is defined as the price that would be received to sell an asset or paid to settle a liability in an orderly transaction between market participants at the measurement date. Accounting standards utilize a fair value hierarchy that prioritizes the inputs to valuation techniques used to measure fair value into three levels, which are described below:
• | Level 1 – Quoted prices (unadjusted) for identical assets or liabilities in active markets; |
• | Level 2 – Observable inputs other than quoted prices that are either directly or indirectly observable for the asset or liability; |
• | Level 3 – Unobservable inputs that are supported by little or no market activity. |
These levels are not necessarily an indication of the risk of liquidity associated with the financial assets or liabilities disclosed. Assets and liabilities are classified in their entirety based on the lowest level of input that is significant to the fair value measurement, as required under ASC 820-10, "Fair Value Measurement."
Derivative instruments – Laureate uses derivative instruments as economic hedges for bank debt and interest rate risk. Their values are derived using valuation models commonly used for derivatives. These valuation models require a variety of inputs, including contractual terms, market prices, forward-price yield curves, notional quantities, measures of volatility and correlations of such inputs. Our valuation models also reflect measurements for credit risk. Laureate concluded that the fair values of our derivatives are based on unobservable inputs, or Level 3 assumptions. The significant unobservable input used in the fair value measurement of the Company's derivative instruments is our own credit risk. Holding other inputs constant, a significant increase (decrease) in our own credit risk would result in a significantly lower (higher) fair value measurement for the Company's derivative instruments.
Laureate’s financial assets and liabilities that are measured at fair value on a recurring basis as of September 30, 2017 were as follows:
Total | Level 1 | Level 2 | Level 3 | ||||||||||||
Assets | |||||||||||||||
Derivative instruments | $ | 29,721 | $ | — | $ | — | $ | 29,721 | |||||||
Liabilities | |||||||||||||||
Derivative instruments | $ | 8,094 | $ | — | $ | — | $ | 8,094 | |||||||
Laureate’s financial assets and liabilities that are measured at fair value on a recurring basis as of December 31, 2016 were as follows:
Total | Level 1 | Level 2 | Level 3 | ||||||||||||
Assets | |||||||||||||||
Derivative instruments | $ | 4,464 | $ | — | $ | — | $ | 4,464 | |||||||
Liabilities | |||||||||||||||
Derivative instruments | $ | 12,968 | $ | — | $ | — | $ | 12,968 | |||||||
38
The changes in our Level 3 Derivative instruments measured at fair value on a recurring basis for the nine months ended September 30, 2017 were as follows:
Total Assets (Liabilities) | |||
Balance December 31, 2016 | $ | (8,504 | ) |
Gain (loss) included in earnings: | |||
Unrealized gains, net | 19,621 | ||
Realized losses, net | (434 | ) | |
Included in other comprehensive income | 6,625 | ||
Included in issuance of Series A convertible redeemable Preferred Stock | 4,382 | ||
Settlements | 434 | ||
Currency translation adjustment | (497 | ) | |
Balance September 30, 2017 | $ | 21,627 | |
Unrealized gain, net relating to derivatives held at September 30, 2017 | $ | 19,621 | |
The following table presents quantitative information regarding the significant unobservable inputs utilized in the fair value measurements of the Company's assets/(liabilities) classified as Level 3 as of September 30, 2017:
Fair Value at September 30, 2017 | Valuation Technique | Unobservable Input | Range/Input Value | |||||||
Contingent redemption features - Series A Preferred Stock | $ | 28,314 | Monte Carlo Simulation Method | Credit Risk | 5.05 | % | ||||
Derivative instruments - cross currency and interest rate swaps | $ | (6,687 | ) | Discounted Cash Flow | Credit Risk | 4.45 | % | |||
39
Item 2. Management’s Discussion and Analysis of Financial Condition and Results of Operations
Forward-Looking Statements
This Quarterly Report on Form 10-Q contains ‘‘forward-looking statements’’ within the meaning of the federal securities laws, which involve risks and uncertainties. You can identify forward-looking statements because they contain words such as ‘‘believes,’’ ‘‘expects,’’ ‘‘may,’’ ‘‘will,’’ ‘‘should,’’ ‘‘seeks,’’ ‘‘approximately,’’ ‘‘intends,’’ ‘‘plans,’’ ‘‘estimates’’ or ‘‘anticipates’’ or similar expressions that concern our strategy, plans or intentions. Any statements we make relating to estimated and projected earnings, costs, expenditures, cash flows, growth rates and financial results are forward-looking statements. In addition, we, through our senior management, from time to time make forward-looking public statements concerning our expected future operations and performance and other developments. All of these forward-looking statements are subject to risks and uncertainties that may change at any time, and, therefore, our actual results may differ materially from those we expected. We derive most of our forward-looking statements from our operating budgets and forecasts, which are based upon many detailed assumptions. While we believe that our assumptions are reasonable, we caution that it is very difficult to predict the impact of known factors, and, of course, it is impossible for us to anticipate all factors that could affect our actual results. Important factors that could cause actual results to differ materially from our expectations, including, without limitation, in conjunction with the forward-looking statements included in this Form 10-Q, are disclosed in ‘‘Item 1—Business, Item 1A—Risk Factors’’ of our 2016 Form 10-K and in ‘‘Item 1A—Risk Factors’’ of this Quarterly Report on Form 10-Q. Some of the factors that we believe could affect our results include:
• The risks associated with our operation of an increasingly global business, including complex management, foreign currency, political, legal, regulatory, tax and economic risks;
• Our ability to effectively manage the growth of our business;
• Our ability to maintain cash flow from operations and available cash sufficient to meet current and future operating requirements;
• Our ability to continue to make acquisitions and to successfully integrate and operate acquired businesses;
• The development and expansion of our global education network and the effect of new technology applications in the educational services industry;
• The effect of existing laws governing our business or changes in those laws;
• Changes in the political, economic and business climate in the international or the U.S. markets where we operate;
• Risks of downturns in general economic conditions and in the educational services and education technology industries, that could, among other things, impair our goodwill and intangible assets;
• Possible increased competition from other educational service providers;
• Market acceptance of new service offerings by us or our competitors and our ability to predict and respond to changes in the markets for our educational services;
• The effect on our business and results of operations from fluctuations in the value of foreign currencies;
• Our ability to attract and retain key personnel;
• The fluctuations in revenues due to seasonality;
• Our ability to generate anticipated savings from our EiP program or our SSOs;
• Our ability to complete our proposed asset sale of certain subsidiaries and groups, as described herein, and the timing and the terms thereof;
• Our ability to maintain proper and effective internal controls or remediate any of our current material weaknesses necessary to produce accurate financial statements on a timely basis;
• Our focus on a specific public benefit purpose and producing a positive effect for society may negatively influence our financial performance; and
• The future trading prices of our Class A common stock and the impact of any securities analysts’ reports on these prices.
We caution you that the foregoing list of important factors may not contain all of the material factors that are important to you. In addition, in light of these risks and uncertainties, the matters referred to in the forward-looking statements contained in this Quarterly Report on Form 10-Q may not in fact occur. We undertake no obligation to publicly update or revise any forward-looking statement as a result of new information, future events or otherwise, except as otherwise required by law.
40
Introduction
This Management’s Discussion and Analysis of Financial Condition and Results of Operations (the ‘‘MD&A’’) is provided to assist readers of the financial statements in understanding the results of operations, financial condition and cash flows of Laureate Education, Inc. This MD&A should be read in conjunction with the consolidated financial statements and related notes included elsewhere in this Form 10-Q. The consolidated financial statements included elsewhere in this Form 10-Q are presented in U.S. dollars (USD) rounded to the nearest thousand, with the amounts in MD&A rounded to the nearest tenth of a million. Therefore, discrepancies in the tables between totals and the sums of the amounts listed may occur due to such rounding. Our MD&A is presented in the following sections:
• | Overview; |
• | Results of Operations; |
• | Liquidity and Capital Resources; |
• | Critical Accounting Policies and Estimates; and |
• | Recently Issued Accounting Pronouncements. |
Overview
Our Business
We are the largest global network of degree-granting higher education institutions. As of September 30, 2017, we had more than one million students enrolled at our 68 institutions in 25 countries on more than 200 campuses, which we collectively refer to as the Laureate International Universities network. We participate in the global higher education market, which was estimated to account for revenues of approximately $1.5 trillion in 2015, according to Global Silicon Valley (GSV). We believe the global higher education market presents an attractive long-term opportunity, primarily because of the large and growing imbalance between the supply and demand for quality higher education around the world. Advanced education opportunities drive higher earnings potential, and we believe the projected growth in the middle-class population worldwide and limited government resources dedicated to higher education create substantial opportunities for high-quality private institutions to meet this growing and unmet demand. Our outcomes-driven strategy is focused on enabling millions of students globally to prosper and thrive in the dynamic and evolving knowledge economy.
In 1999, we made our first investment in higher education and, since that time, we have developed into the global leader in higher education, based on the number of students, institutions and countries making up our network. As of September 30, 2017, our global network of 68 institutions comprised 56 institutions we owned or controlled, and an additional 12 institutions that we managed or with which we had other relationships. We have six reporting segments as described below. We group our institutions by geography in: 1) Brazil; 2) Mexico; 3) Andean & Iberian; 4) Central America & U.S. Campuses; and 5) Europe, Middle East, Africa and Asia Pacific (EMEAA) for reporting purposes. Our sixth segment, Online & Partnerships, includes fully online institutions that operate globally.
41
Our Segments
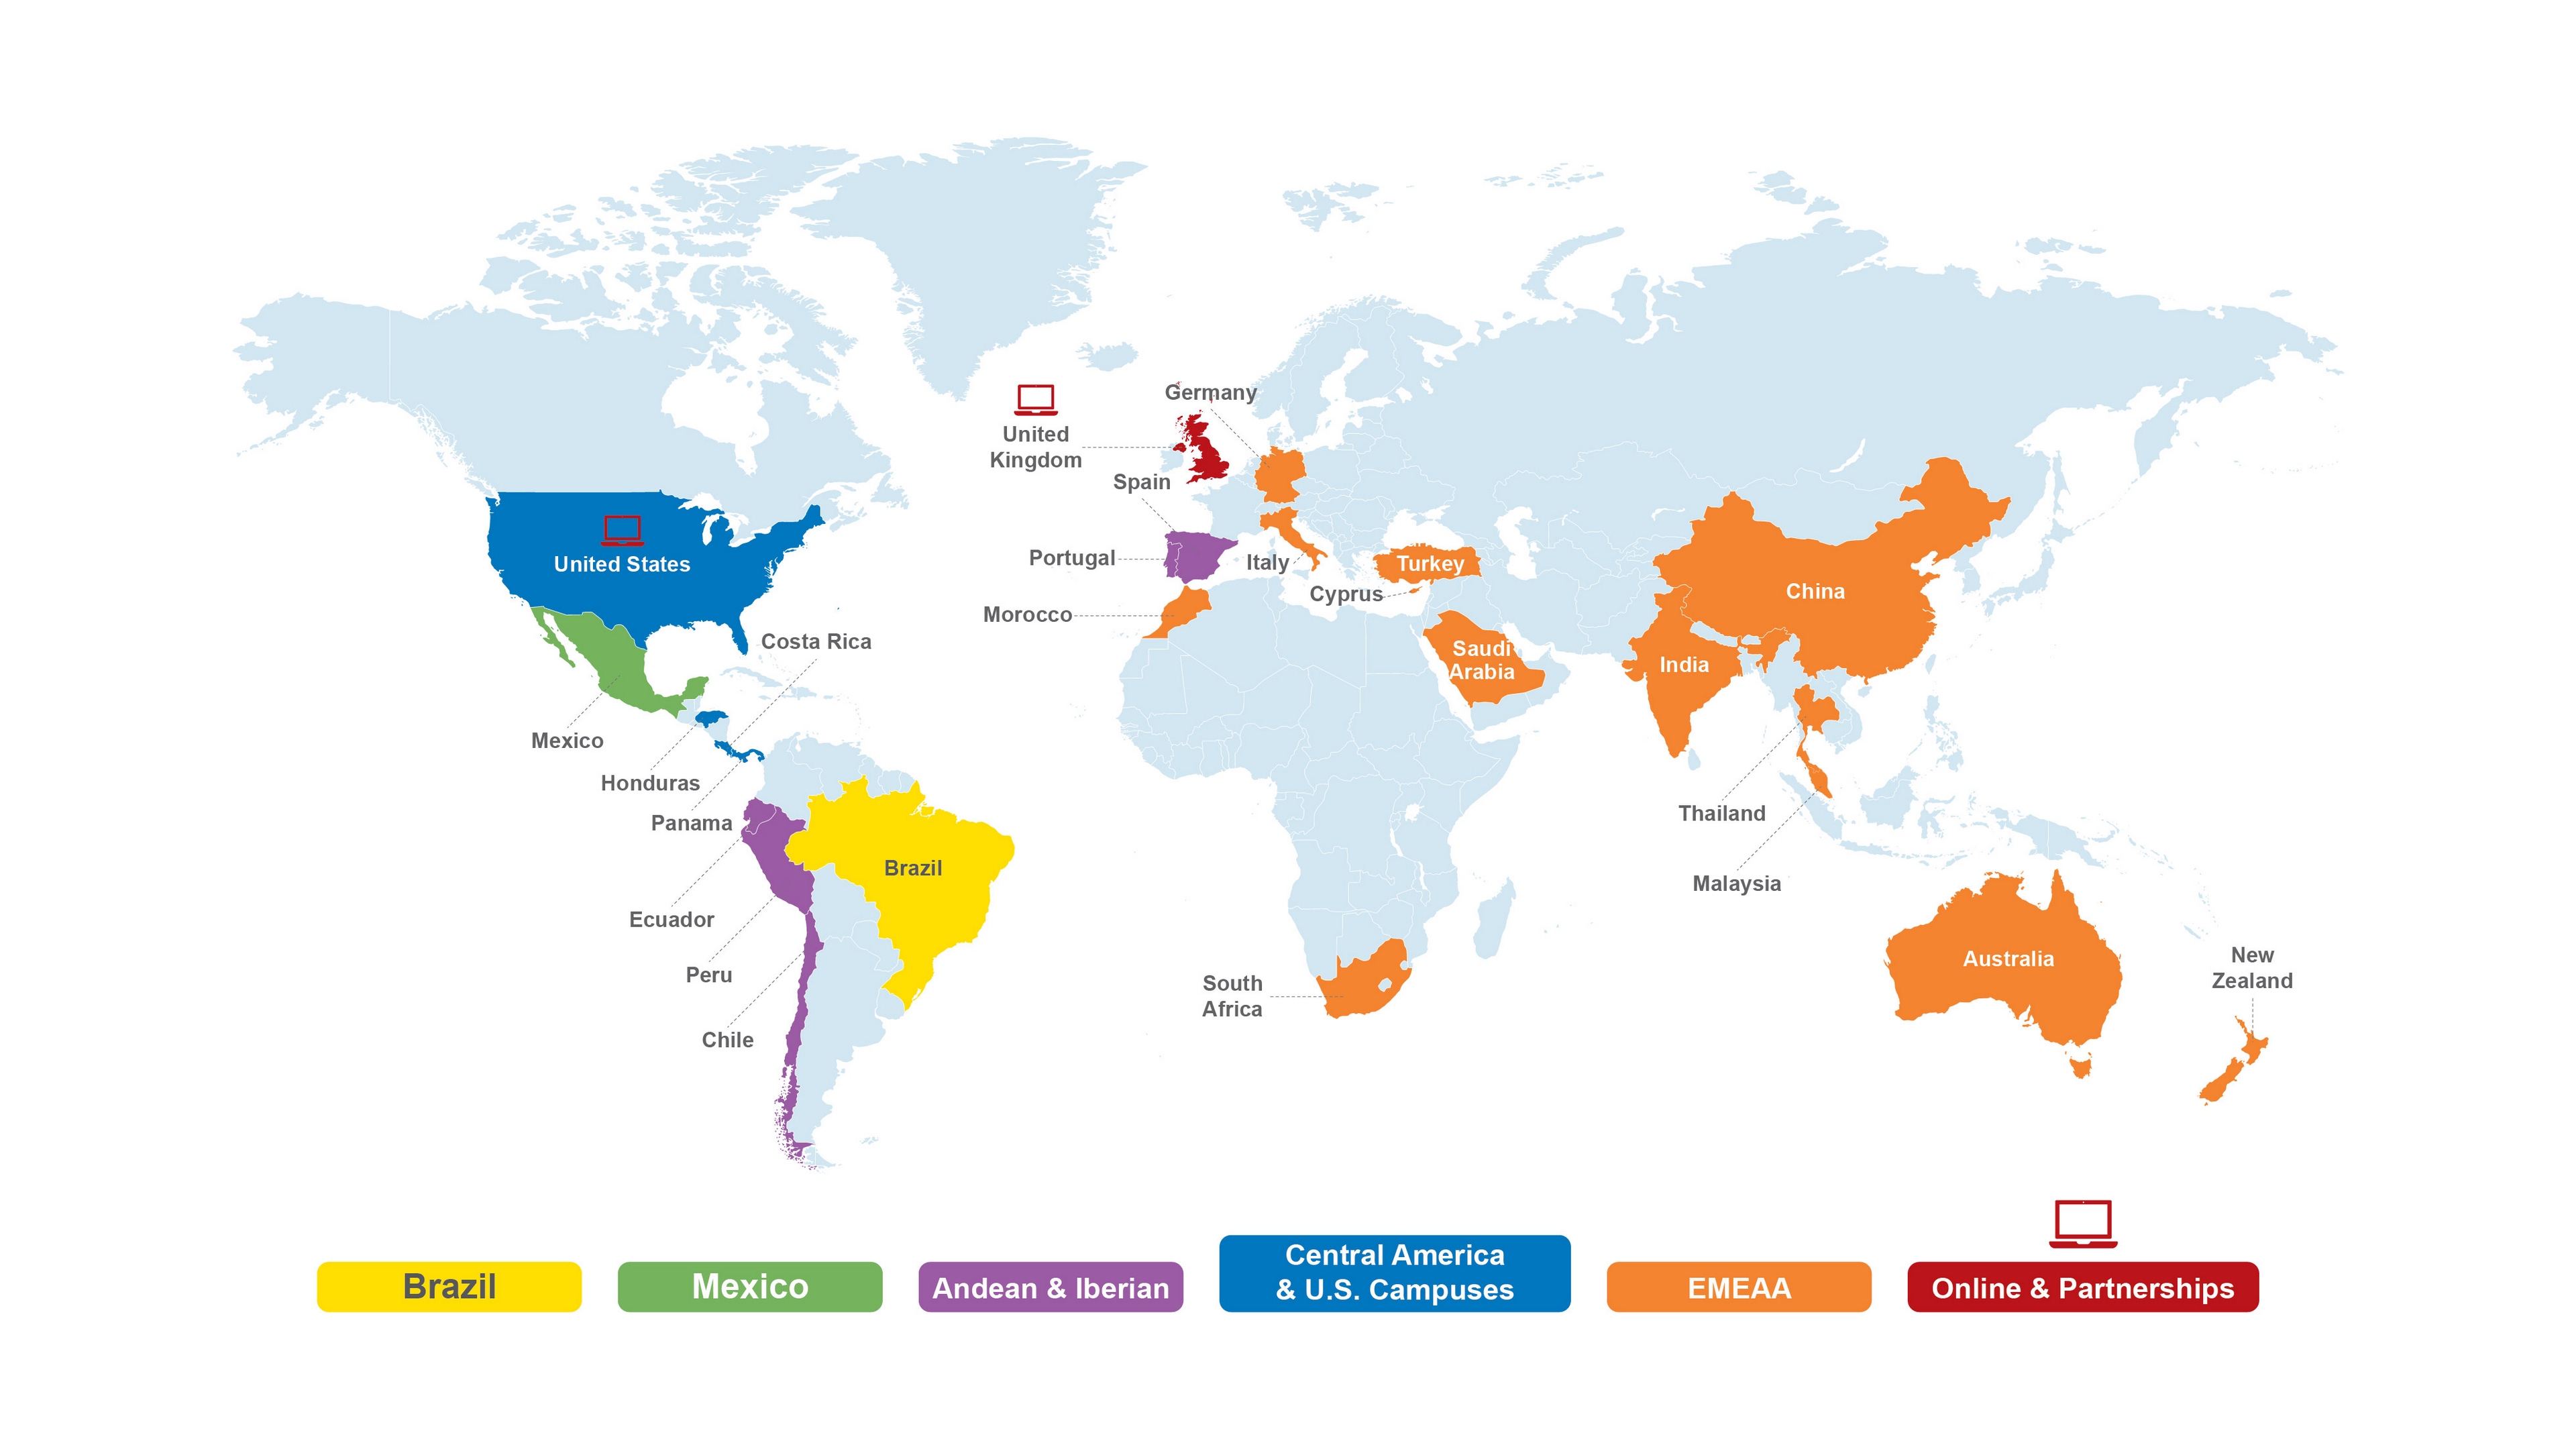
As previously disclosed in our Quarterly Report on Form 10-Q for the period ended June 30, 2017, effective August 1, 2017, we changed our operating segments in order to realign our segments according to how our chief operating decision maker now allocates resources and assesses performance. The change includes the creation of three operating segments (Brazil, Mexico and Andean & Iberian) from the previous Latin America (LatAm) segment. Our institutions in Spain and Portugal (Iberian) have moved from the Europe, Middle East, Africa and Asia Pacific (EMEAA) segment and combined with our institutions in Chile and Peru to form the Andean & Iberian segment. In addition, our institutions in Central America, which were previously part of the LatAm segment, have combined with our campus-based institutions in the United States, which were previously part of the GPS segment, to form the Central America and U.S. Campuses segment. The Online & Partnerships segment consists of the online institutions that were previously part of the GPS segment. This change has been reflected in the quarterly segment information beginning in the third quarter of 2017, the period in which the change occurred. As required, the 2016 segment information that is presented for comparative purposes has also been revised to reflect this change.
Our campus-based segments generate revenues by providing an education that emphasizes professional-oriented fields of study with undergraduate and graduate degrees in a wide range of disciplines. Our educational offerings are increasingly utilizing online and hybrid (a combination of online and in-classroom) courses and programs to deliver their curriculum. Many of our largest campus-based operations are in developing markets which are experiencing a growing demand for higher education based on favorable demographics and increasing secondary completion rates, driving increases in participation rates and resulting in continued growth in the number of higher education students. Traditional higher education students (defined as 18-24 year olds) have historically been served by public universities, which have limited capacity and are often underfunded, resulting in an inability to meet the growing student demand and employer requirements. This supply and demand imbalance has created a market opportunity for private sector participants. Most students finance their own education. However, there are some government-sponsored student financing programs which are discussed below. These campus-based segments include Brazil, Mexico, Andean & Iberian, Central America & U.S. Campuses and EMEAA. Specifics related to each of these campus-based segments and our Online & Partnerships segment are discussed below:
• | In Brazil, approximately 75% of post-secondary students are enrolled in private higher education institutions. While the federal government defines the national curricular guidelines, institutions are licensed to operate by city. Laureate owns 13 institutions in eight states throughout Brazil, with a particularly strong presence in the competitive São Paulo market. Many students finance their own education while others rely on the government-sponsored programs such as Prouni and FIES. |
• | Public universities in Mexico enroll approximately two-thirds of students attending post-secondary education. However, many public institutions are faced with capacity constraints or the quality of the education is considered low. Laureate owns two |
42
institutions and is present throughout the country with a footprint of over 40 campuses. Each institution in Mexico has a national license. Students in our Mexican institutions typically finance their own education.
• | The Andean & Iberian segment includes institutions in Chile, Peru, Portugal and Spain and has contractual relationships with a licensed institution in Ecuador. In Chile, private universities enroll approximately 80% of post-secondary students. In Peru, the public sector plays a significant role but private universities are increasingly providing the capacity to meet growing demand. In Spain and Portugal, the high demand for post-secondary education places capacity constraints on the public sector, pushing students to turn to the private sector for high-quality education. Chile has government-sponsored student financing programs, while in the other countries students generally finance their own education. |
• | The Central America & U.S. Campuses segment includes institutions in Costa Rica, Honduras, Panama and the United States. Students in Central America typically finance their own education while students in the United States finance their education in a variety of ways, including Title IV programs. |
• | The EMEAA segment includes institutions in the European countries of Cyprus, Germany, Italy and Turkey, as well as locations in the Middle East, Africa and Asia Pacific consisting of campus-based institutions with operations in Australia, China, India, Malaysia, Morocco, New Zealand, South Africa and Thailand. Additionally, EMEAA manages nine licensed institutions in the Kingdom of Saudi Arabia and manages one additional institution in China through a joint venture arrangement. |
• | The Online & Partnerships segment includes fully online institutions operating globally that offer professionally-oriented degree programs in the United States through Walden University, a U.S.-based accredited institution, and through the University of Liverpool and the University of Roehampton in the United Kingdom. These online institutions primarily serve working adults with undergraduate and graduate degree program offerings. Students in the United States finance their education in a variety of ways, including Title IV programs. |
Corporate is a non-operating business unit whose purpose is to support operations. Its departments are responsible for establishing operational policies and internal control standards; implementing strategic initiatives; and monitoring compliance with policies and controls throughout our operations. Our Corporate segment is an internal source of capital and provides financial, human resource, information technology, insurance, legal and tax compliance services. The Corporate segment also contains the eliminations of inter-segment revenues and expenses.
The following information for our operating segments is presented as of September 30, 2017:
Countries (2) | Institutions | Enrollment | 2017 YTD Revenues ($ in millions) (1) | % Contribution to 2017 YTD Revenues | |||||||
Brazil | 1 | 13 | 275,000 | $ | 548.0 | 17 | % | ||||
Mexico | 1 | 2 | 212,300 | 452.0 | 14 | % | |||||
Andean & Iberian | 5 | 16 | 329,800 | 930.3 | 30 | % | |||||
Central America & U.S. Campuses (2) | 4 | 8 | 71,000 | 219.1 | 7 | % | |||||
EMEAA (3) | 13 | 26 | 126,900 | 468.3 | 15 | % | |||||
Online & Partnerships (2) | 2 | 3 | 64,700 | 521.0 | 17 | % | |||||
Total (1) (2) | 25 | 68 | 1,079,700 | $ | 3,116.8 | 100 | % | ||||
(1) The elimination of inter-segment revenues and amounts related to Corporate, which total $21.9 million, is not separately presented.
(2) Our Central America & U.S. Campuses and Online & Partnerships segments both have institutions located in the United States. The total reflects the elimination of this duplication.
(3) Effective October 2017, Blue Mountains International Hotel Management School Pty Ltd has transferred its course offerings to Torrens University, another institution in the Laureate International Universities network.
Challenges
Our global operations are subject to complex business, economic, legal, political, tax and foreign currency risks, which may be difficult to adequately address. The majority of our operations are outside the United States. As a result, we face risks that are inherent in international operations, including: fluctuations in exchange rates, possible currency devaluations, inflation and hyper-inflation; price controls and foreign currency exchange restrictions; potential economic and political instability in the countries in which we operate; expropriation of assets by local governments; key political elections and changes in government policies; multiple and possibly overlapping and conflicting tax laws; and compliance with a wide variety of foreign laws. We plan to continue
43
to grow our business globally by acquiring or establishing private higher education institutions. Our success in growing our business will depend on the ability to anticipate and effectively manage these and other risks related to operating in various countries.
Regulatory Environment and Other Matters
Our business is subject to regulation by various agencies based on the requirements of local jurisdictions. These agencies continue to review and update regulations as they deem necessary. We cannot predict the form of the rules that ultimately may be adopted in the future or what effects they might have on our business, financial condition, results of operations and cash flows. We will continue to develop and implement necessary changes that enable us to comply with such regulations. For a detailed discussion of our different regulatory environments, see ‘‘Risk Factors—Risks Relating to Our Business—Political and regulatory developments in Chile may materially adversely affect us,’’ and ‘‘Item 1—Business—Industry Regulation,’’ in our 2016 Form 10-K, and ‘‘Item 1A—Risk Factors’’ of this Quarterly Report on Form 10-Q.
Key Business Metrics
Enrollment
Enrollment is our lead revenue indicator and represents our most important non-financial metric. We define ‘‘enrollment’’ as the number of students registered in a course on the last day of the enrollment reporting period. New enrollments provide an indication of future revenue trends. Total enrollment is a function of continuing student enrollments, new student enrollments and enrollments from acquisitions, offset by graduations, attrition and enrollment decreases due to dispositions. Attrition is defined as a student leaving the institution before completion of the program. To minimize attrition, we have implemented programs that involve assisting students in remedial education, mentoring, counseling and student financing.
Each of our institutions has an enrollment cycle that varies by geographic region and academic program. During each academic year, each institution has a "Primary Intake" period in which the majority of the enrollment occurs. Most institutions also have one or more smaller "Secondary Intake" periods. The first calendar quarter generally coincides with the Primary Intakes for our institutions in Brazil, the Andean Region, Central America, Australia, New Zealand, South Africa and Saudi Arabia. The third calendar quarter generally coincides with the Primary Intakes for our institutions in Mexico, the Iberian Region, U.S. Campuses, Europe, China, India, Malaysia, Thailand and the Online & Partnerships segment.
44
The following chart shows our enrollment cycles. Shaded areas in the chart represent periods when classes are generally in session and revenues are recognized. Areas that are not shaded represent summer breaks during which revenues are not typically recognized. The large circles indicate the Primary Intake start dates of our institutions, and the small circles represent Secondary Intake start dates.
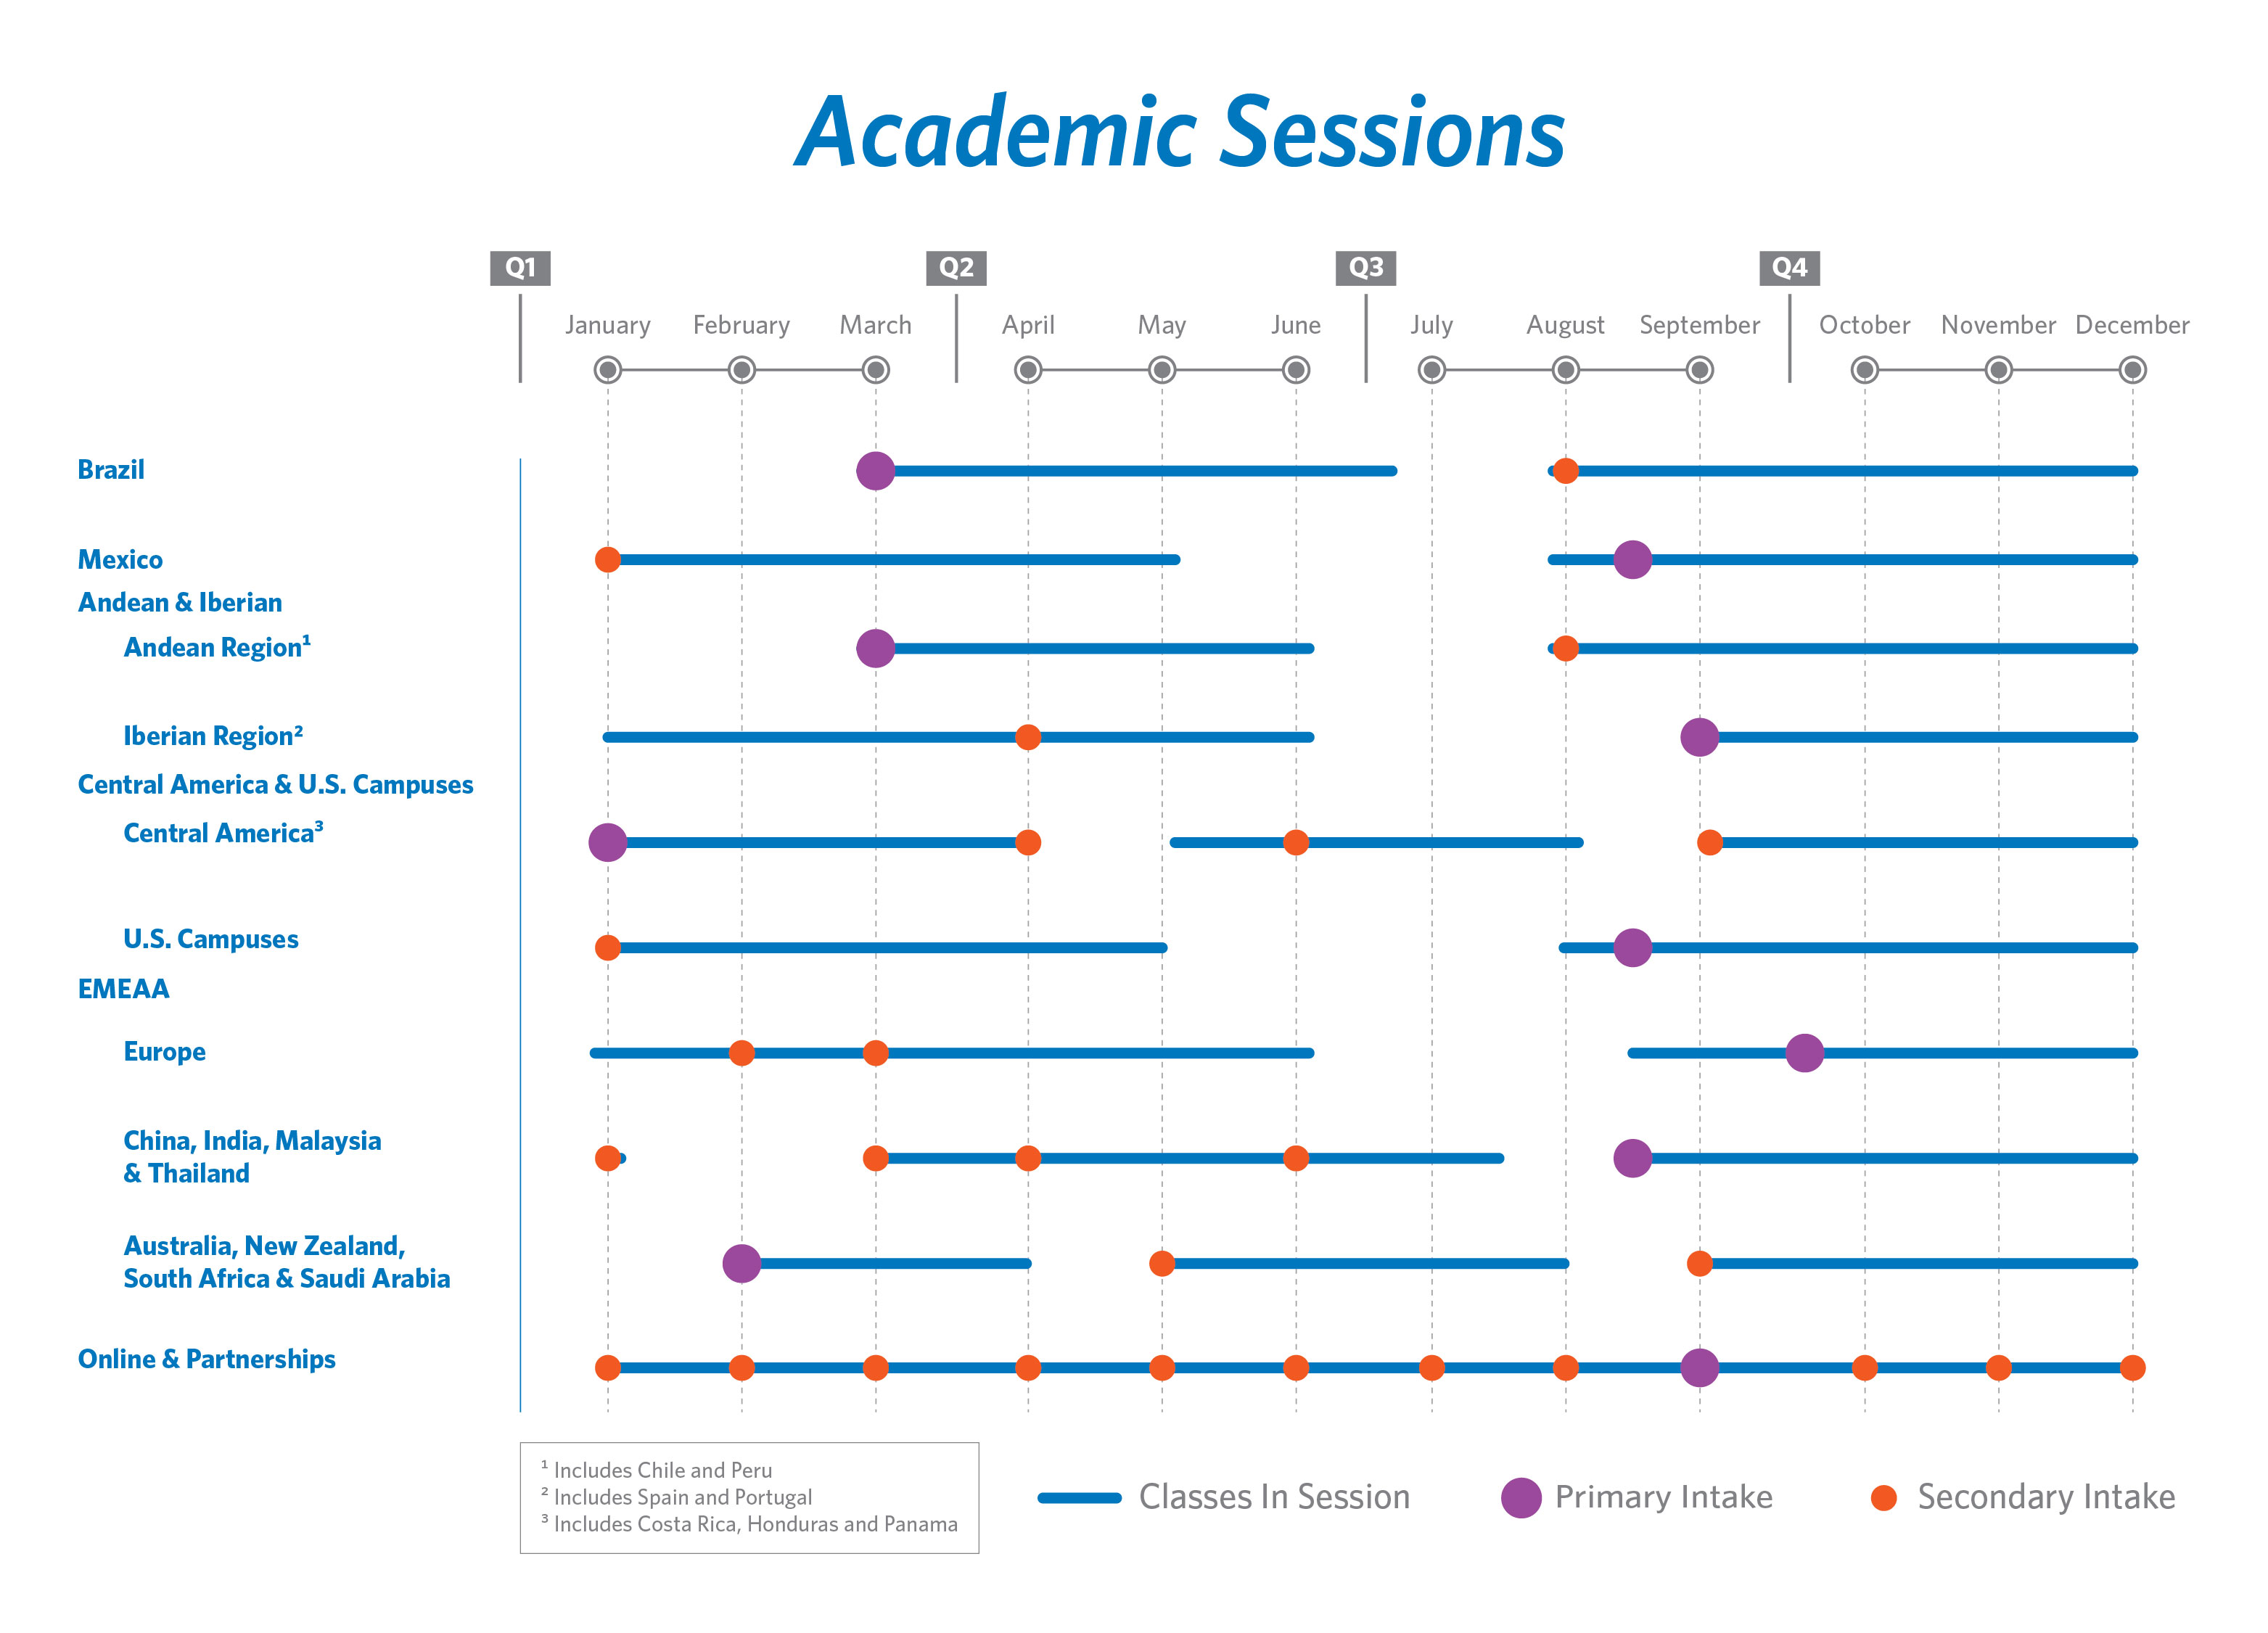
Pricing
We continually monitor market conditions and carefully adjust our tuition rates to meet local demand levels. We proactively seek the best price and content combinations to ensure that we remain competitive in all the markets in which we operate.
Principal Components of Income Statement
Revenues
Tuition is the largest component of our revenues and we recognize tuition revenues on a weekly basis as classes are being taught. The amount of tuition generated in a given period depends on the price per credit hour and the total credit hours or price per program taken by the enrolled student population. Deferred revenue and student deposits on our consolidated balance sheets consist of tuition paid prior to the start of academic sessions and unearned tuition amounts recorded as accounts receivable after an academic session begins. The price per credit hour varies by program, by market and by degree level. Additionally, varying levels of discounts and scholarships are offered depending on market-specific dynamics and individual achievements of our students. Revenues are reported net of scholarships, other discounts, refunds, waivers and the fair value of any guarantees made by Laureate related to student financing programs. In addition to tuition revenues, we generate other revenues from ancillary product sales, dormitory/residency fees, student fees and other education-related services. These other revenues are less material to our overall financial results and have a tendency to trend with tuition revenues. The main drivers of changes in revenues between periods are student enrollment and price.
45
Direct Costs
Our direct costs include labor and operating costs associated with the delivery of services to our students, including the cost of wages, payroll taxes, and benefits for institution employees, depreciation and amortization, rent, utilities, bad debt expenses and marketing and promotional costs to grow future enrollments. In general, a significant portion of our direct costs tend to be variable in nature and trend with enrollment, and management continues to monitor and improve the efficiency of instructional delivery. Conversely, as campuses expand, direct costs may grow faster than enrollment growth as infrastructure investments are made in anticipation of future enrollment growth.
General and Administrative Expenses
Our general and administrative expenses primarily consist of costs associated with corporate departments, including executive management, finance, legal, business development and other departments that do not provide direct operational services.
Factors Affecting Comparability
Acquisitions
Our past experiences provide us with the expertise to further our mission of providing high-quality, accessible and affordable higher education to students by expanding into new markets, primarily through acquisitions. Acquisitions affect the comparability of our financial statements from period to period. Acquisitions completed during one period impact comparability to a prior period in which we did not own the acquired entity. Therefore, changes related to such entities are considered "incremental impact of acquisitions" for the first 12 months of our ownership. We made no acquisitions in 2016 and only one very small acquisition in 2017 that had essentially no impact on the comparability of the 2017 and 2016 periods presented.
Dispositions
Certain strategic initiatives may include the sale of institutions such as the 2016 sales of our Swiss and French institutions. In June 2016, we completed the sale of our Swiss and associated institutions for total net proceeds of approximately $339 million, and in July 2016 we completed the sale of our French institutions for total net proceeds of approximately $207 million. Such dispositions affect the comparability of our financial statements from period to period. Dispositions completed during one period impact comparability to a prior period in which we owned the divested entity. Therefore, changes related to such entities are considered "incremental impact of dispositions" for the first 12 months subsequent to the disposition.
Foreign Exchange
The majority of our institutions are located outside the United States. These institutions enter into transactions in currencies other than USD and keep their local financial records in a functional currency other than the USD. We monitor the impact of foreign currency movements and the correlation between the local currency and the USD. Our revenues and expenses are generally denominated in local currency. The USD is our reporting currency and our subsidiaries operate in various other functional currencies, including: Australian Dollar, Brazilian Real, Chilean Peso, Chinese Renminbi, Costa Rican Colon, Euro, Honduran Lempira, Indian Rupee, Malaysian Ringgit, Mexican Peso, Moroccan Dirham, New Zealand Dollar, Peruvian Nuevo Sol, Polish Złoty, Saudi Riyal, South African Rand, Thai Baht and Turkish Lira. The principal foreign exchange exposure is the risk related to the translation of revenues and expenses incurred in each country from the local currency into USD.
Seasonality
Most of the institutions in our network have a summer break during which classes are generally not in session and minimal revenues are recognized. In addition to the timing of summer breaks, holidays such as Easter also have an impact on our academic calendar. Operating expenses, however, do not fully correlate to the enrollment and revenue cycles, as the institutions continue to incur expenses during summer breaks. Given the geographic diversity of our institutions and differences in timing of summer breaks, our second and fourth quarters are stronger revenue quarters as the majority of our institutions are in session for most of these respective quarters. Our first and third fiscal quarters are weaker revenue quarters because the majority of our institutions have summer breaks for some portion of one of these two quarters. Due to this seasonality, revenues and profits in any one quarter are not necessarily indicative of results in subsequent quarters and may not be correlated to new enrollment in any one quarter.
46
Income Tax Expense
Our consolidated income tax provision is derived based on the combined impact of federal, state and foreign income taxes. Laureate has operations in multiple countries, many of which have statutory tax rates lower than the United States. Generally, lower tax rates in these foreign jurisdictions, along with Laureate's intent and ability to indefinitely reinvest foreign earnings outside of the United States, results in an effective tax rate lower than the statutory rate in the United States. Further, discrete items can arise in the course of our operations that can further impact the Company's effective tax rate for the period. Our tax rate fluctuates from period to period due to changes in the mix of earnings between our tax-paying entities, our tax-exempt entities and our loss-making entities for which it is not more likely than not that a tax benefit will be realized on the loss.
Results of Operations
The following discussion of the results of our operations is organized as follows:
• | Summary Comparison of Consolidated Results; |
• | Non-GAAP Financial Measure; and |
• | Segment Results. |
Summary Comparison of Consolidated Results
Discussion of Significant Items Affecting the Consolidated Results for the Nine Months Ended September 30, 2017 and 2016
Nine Months Ended September 30, 2017
During the second quarter of 2017, the Company completed refinancing transactions that resulted in repayment of the previous senior credit facility and the redemption of the 9.250% Senior Notes due 2019 (the Senior Notes due 2019) (other than $250.0 million in aggregate principal amount of the Senior Notes due 2019 that the Company exchanged on April 21, 2017 for substantially identical but non-redeemable notes issued under a new indenture (the Exchanged Notes)). As a result of the refinancing transactions, during the quarter ended June 30, 2017, we recorded approximately $22.8 million in General and administrative expenses related to new third-party costs, as well as a Loss on debt extinguishment of $6.9 million.
On August 11, 2017, the remaining Senior Notes due 2019 were exchanged for a total of 18.7 million shares of the Company's Class A common stock and the Senior Notes due 2019 were canceled.
Nine Months Ended September 30, 2016
On June 14, 2016, we sold the operations of Glion in Switzerland and the United Kingdom, and the operations of Les Roches in Switzerland and the United States, as well as Haute école spécialisée Les Roches-Gruyère SA (LRG) in Switzerland, Les Roches Jin Jiang in China, Royal Academy of Culinary Arts (RACA) in Jordan and Les Roches Marbella in Spain, which resulted in a gain on sale of approximately $249.0 million. This gain is included in other non-operating income in the tables below.
On July 20, 2016, we sold the operations of École Supérieure du Commerce Extérieur (ESCE), Institut Français de Gestion (IFG), European Business School (EBS), École Centrale d’Electronique (ECE), and Centre d’Études Politiques et de la Communication (CEPC), which resulted in a gain on sale of approximately $149.0 million. This gain is included in other non-operating income in the tables below.
47
Comparison of Consolidated Results for the Three Months Ended September 30, 2017 and 2016
% Change | ||||||||||
Better/(Worse) | ||||||||||
(in millions) | 2017 | 2016 | 2017 vs. 2016 | |||||||
Revenues | $ | 983.4 | $ | 929.9 | 6 | % | ||||
Direct costs | 924.1 | 864.2 | (7 | )% | ||||||
General and administrative expenses | 65.0 | 53.2 | (22 | )% | ||||||
Operating (loss) income | (5.7 | ) | 12.5 | (146 | )% | |||||
Interest expense, net of interest income | (70.6 | ) | (101.3 | ) | 30 | % | ||||
Other non-operating (expense) income | (13.3 | ) | 166.7 | (108 | )% | |||||
(Loss) income from continuing operations before income taxes | (89.6 | ) | 77.8 | nm | ||||||
Income tax (expense) benefit | (13.9 | ) | 3.1 | nm | ||||||
Net (loss) income | (103.5 | ) | 80.9 | nm | ||||||
Net loss attributable to noncontrolling interests | 5.5 | 5.4 | (2 | )% | ||||||
Net (loss) income attributable to Laureate Education, Inc. | $ | (98.0 | ) | $ | 86.3 | nm | ||||
nm - percentage changes not meaningful
For further details on certain discrete items discussed below, see "Discussion of Significant Items Affecting the Consolidated Results."
Comparison of Consolidated Results for the Three Months Ended September 30, 2017 to the Three Months Ended September 30, 2016
Revenues increased by $53.5 million to $983.4 million for the three months ended September 30, 2017 (the 2017 fiscal quarter) from $929.9 million for the three months ended September 30, 2016 (the 2016 fiscal quarter). This revenue increase was driven in part by higher average total enrollment at a majority of our institutions, which increased revenues by $17.9 million. The effect of changes in tuition rates and enrollments in programs at varying price points ("product mix"), pricing and timing resulted in a $13.7 million increase in revenues compared to the 2016 fiscal quarter, which can be partially attributable to price increases at certain institutions. Also included in product mix, pricing and timing is the net effect of the following items: (1) approximately $11.7 million of revenue was deferred at our Mexico institutions during the 2017 fiscal quarter due to class disruptions resulting from the September 2017 Mexico City earthquake and is expected to be recognized in the fourth quarter of 2017; (2) approximately $12.0 million of revenue that was deferred during the second quarter of 2016 at two of our Chilean institutions as a result of a nationwide student protest was recognized during the third quarter of 2016; (3) the first two items were partially offset by approximately $11.9 million of revenue that was recognized during the 2017 fiscal quarter that had been deferred from the first and second quarters of 2017 at our three Peruvian institutions as a result of a period of heavy rains and floods that occurred during the first quarter of 2017. The effect of a net change in foreign currency exchange rates increased revenues by $23.3 million for the 2017 fiscal quarter compared to the 2016 fiscal quarter. Partially offsetting these increases in revenues was the incremental impact of dispositions in 2016, which reduced revenues by $2.4 million for the 2017 fiscal quarter compared to the 2016 fiscal quarter. Other Corporate and Eliminations changes accounted for an increase in revenues of $1.0 million.
Direct costs and general and administrative expenses combined increased by $71.7 million to $989.1 million for the 2017 fiscal quarter from $917.4 million for the 2016 fiscal quarter. This increase in direct costs was driven by the result of overall higher average total enrollments and expanded operations, which increased direct costs by $48.5 million. The effect of a net change in foreign currency exchange rates increased direct costs by $19.3 million for the 2017 fiscal quarter compared to the 2016 fiscal quarter. Acquisition-contingent liabilities for taxes other-than-income tax, net of changes in recorded indemnification assets decreased direct costs by $0.1 million in the 2017 fiscal quarter and by $1.2 million in the 2016 fiscal quarter, increasing net expenses by $1.1 million. Offsetting these direct cost increases was the incremental impact of dispositions, which decreased costs by $4.8 million in the 2017 fiscal quarter. Other Corporate and Eliminations expenses accounted for an increase in costs of $7.6 million in the 2017 fiscal quarter.
Operating (loss) income changed by $18.2 million to an operating loss of $5.7 million for the 2017 fiscal quarter from operating income of $12.5 million for the 2016 fiscal quarter. This decrease in income is primarily driven by an increased operating loss in our Mexico segment, where revenue was deferred due to the earthquake.
48
Interest expense, net of interest income decreased by $30.7 million to $70.6 million for the 2017 fiscal quarter from $101.3 million for the 2016 fiscal quarter. The decrease in interest expense was primarily attributable to lower average debt balances and lower interest rates during the 2017 fiscal quarter resulting from the 2017 debt refinancing transactions.
Other non-operating (expense) income changed by $180.0 million to an expense of $13.3 million for the 2017 fiscal quarter from an income of $166.7 million for the 2016 fiscal quarter. This change was primarily attributable to the 2016 gain on the sale of our French subsidiaries of $155.2 million; a loss on derivatives in the 2017 fiscal quarter compared to a gain in the 2016 fiscal quarter for a change of $20.4 million; and a decrease in gain on foreign currency exchange of $19.0 million, combined with a change in other non-operating (expense) income of $1.1 million in the 2017 fiscal quarter compared to the 2016 fiscal quarter. These decreases were partially offset by a loss on debt extinguishment in the 2016 fiscal quarter of $15.7 million.
Income tax (expense) benefit changed by $17.0 million to an expense of $13.9 million for the 2017 fiscal quarter from a benefit of $3.1 million for the 2016 fiscal quarter. This increase in expense was primarily attributable to a discrete benefit in the 2016 fiscal quarter from the release of a contingent liability in Peru of $21.5 million, partially offset by an increase in income tax expense attributable to changes in the mix of pre-tax book income attributable to taxable and non-taxable entities in various taxing jurisdictions.
Comparison of Consolidated Results for the Nine Months Ended September 30, 2017 and 2016
% Change | ||||||||||
Better/(Worse) | ||||||||||
(in millions) | 2017 | 2016 | 2017 vs. 2016 | |||||||
Revenues | $ | 3,116.8 | $ | 3,068.3 | 2 | % | ||||
Direct costs | 2,719.6 | 2,697.8 | (1 | )% | ||||||
General and administrative expenses | 221.9 | 158.6 | (40 | )% | ||||||
Operating income | 175.3 | 211.9 | (17 | )% | ||||||
Interest expense, net of interest income | (263.1 | ) | (301.1 | ) | 13 | % | ||||
Other non-operating income | 9.8 | 452.1 | (98 | )% | ||||||
(Loss) income from continuing operations before income taxes and equity in net income of affiliates | (78.0 | ) | 362.9 | (121 | )% | |||||
Income tax expense | (28.8 | ) | (35.2 | ) | 18 | % | ||||
Equity in net income of affiliates, net of tax | — | — | nm | |||||||
Net (loss) income | (106.7 | ) | 327.7 | (133 | )% | |||||
Net loss attributable to noncontrolling interests | 2.4 | 2.8 | 14 | % | ||||||
Net (loss) income attributable to Laureate Education, Inc. | $ | (104.4 | ) | $ | 330.5 | (132 | )% | |||
For further details on certain discrete items discussed below, see "Discussion of Significant Items Affecting the Consolidated Results."
Comparison of Consolidated Results for the Nine Months Ended September 30, 2017 to the Nine Months Ended September 30, 2016
Revenues increased by $48.5 million to $3,116.8 million for the nine months ended September 30, 2017 (the 2017 fiscal period) from $3,068.3 million for the nine months ended September 30, 2016 (the 2016 fiscal period). This revenue increase was driven by higher average total enrollment at a majority of our institutions, which increased revenues by $70.5 million. The effect of product mix, pricing and timing resulted in an $85.4 million increase in revenues compared to the 2016 fiscal period. This increase includes approximately $18.0 million of revenues that were deferred during the 2016 fiscal period and recognized in the fourth quarter of 2016 as a result of class disruptions at two of our Chilean institutions during a nationwide student protest that lasted several weeks. The overall increase in product mix, pricing and timing was partially offset by a negative impact to 2017 revenues of approximately $11.7 million that occurred as a result of class disruptions at our Mexican institutions due to the earthquake. The disrupted classes have resumed and are expected to be completed in the fourth quarter. For the 2017 fiscal period, the effect of a net change in foreign currency exchange rates increased revenues by $31.3 million compared to 2016 fiscal period. The incremental impact of dispositions decreased revenues by $141.9 million. Other Corporate and Eliminations changes accounted for an increase in revenues of $3.2 million.
49
Direct costs and general and administrative expenses combined increased by $85.1 million to $2,941.5 million for the 2017 fiscal period from $2,856.4 million for the 2016 fiscal period. The direct costs increase was due to the overall higher enrollments and expanded operations which increased costs by $82.3 million compared to the 2016 fiscal period. The effect of a net change in foreign currency exchange rates increased costs by $45.0 million for the 2017 fiscal period compared to the 2016 fiscal period. For the 2017 fiscal period, share-based compensation expense and EiP implementation expense also increased direct costs by $36.2 million. Other Corporate and Eliminations expenses accounted for an increase in costs of $44.5 million in the 2017 fiscal period, which included an expense of $22.8 million related to the portion of the refinancing transactions that was deemed to be a debt modification. Offsetting these direct cost increases was the incremental impact of dispositions, which decreased costs by $118.3 million for the 2017 fiscal period compared to the 2016 fiscal period. Acquisition-contingent liabilities for taxes other-than-income tax, net of changes in recorded indemnification assets, increased direct costs by $4.2 million in the 2017 fiscal period and increased direct costs by $8.8 million in the 2016 fiscal period, decreasing expenses by $4.6 million in the 2017 fiscal period compared to the 2016 fiscal period.
Operating income decreased by $36.6 million to $175.3 million for the 2017 fiscal period from $211.9 million for the 2016 fiscal period. The decrease in operating income was primarily the result of higher 2017 operating expenses at Corporate, an operating loss at our Mexico segment due to the deferral of revenue resulting from the earthquake and increased operating losses in our EMEAA segment. Increased operating income in our Andean & Iberian segment partially offset these decreases in operating income.
Interest expense, net of interest income decreased by $38.0 million to $263.1 million for the 2017 fiscal period from $301.1 million for the 2016 fiscal period. The decrease in interest expense was primarily attributable to lower average debt balances and lower interest rates during the 2017 fiscal period resulting from the 2017 debt refinancing transactions.
Other non-operating income decreased by $442.3 million to $9.8 million for the 2017 fiscal period from $452.1 million for the 2016 fiscal period. This decrease was primarily attributable to the gain on the sale of our Swiss and French subsidiaries in the 2016 fiscal period, for a change of $398.6 million, and a gain on foreign currency exchange in the 2016 fiscal period for a change of $80.4 million. These decreases were partially offset by a gain on derivative instruments in the 2017 fiscal period compared to a loss in the 2016 fiscal period for a change of $27.4 million and a decrease in loss on debt extinguishment of $8.9 million, combined with a change in other non-operating expense of $0.4 million in the 2017 fiscal period compared to the 2016 fiscal period.
Income tax expense decreased by $6.4 million to $28.8 million for the 2017 fiscal period from $35.2 million for the 2016 fiscal period. This decrease in expense was primarily due to management's decision to redesignate certain intercompany loans from temporary to permanent, which caused a discrete benefit of approximately $30.0 million during the 2017 fiscal period, partially offset by a discrete benefit in the 2016 fiscal period from deferred taxes of $7.9 million related to the sale of the hospitality management schools and a release of a contingent liability related to Peru of $21.5 million. Changes in the mix of pre-tax book income attributable to taxable and non-taxable entities in various taxing jurisdictions also contributed to the overall decrease.
Non-GAAP Financial Measure
We define Adjusted EBITDA as net income (loss), before equity in net (income) loss of affiliates, net of tax, income tax expense (benefit), loss (gain) on sale of subsidiaries, net, foreign currency exchange (gain) loss, net, other (income) expense, net, loss (gain) on derivatives, loss on debt extinguishment, interest expense and interest income, plus depreciation and amortization, share-based compensation expense, loss on impairment of assets and expenses related to implementation of our EiP initiative. When we review Adjusted EBITDA on a segment basis, we exclude inter-segment revenues and expenses that eliminate in consolidation. Adjusted EBITDA is used in addition to and in conjunction with results presented in accordance with GAAP and should not be relied upon to the exclusion of GAAP financial measures.
Adjusted EBITDA is a key measure used by our management and board of directors to understand and evaluate our core operating performance and trends, to prepare and approve our annual budget and to develop short- and long-term operational plans. In particular, the exclusion of certain expenses in calculating Adjusted EBITDA can provide a useful measure for period-to-period comparisons of our core business. Additionally, Adjusted EBITDA is a key financial measure used by the compensation committee of our board of directors and our Chief Executive Officer in connection with the payment of incentive compensation to our executive officers and other members of our management team. Accordingly, we believe that Adjusted EBITDA provides useful information to investors and others in understanding and evaluating our operating results in the same manner as our management and board of directors.
50
The following table presents Adjusted EBITDA and reconciles net (loss) income to Adjusted EBITDA for the three months ended September 30, 2017 and 2016:
% Change | ||||||||||
Better/(Worse) | ||||||||||
(in millions) | 2017 | 2016 | 2017 vs. 2016 | |||||||
Net (loss) income | $ | (103.5 | ) | $ | 80.9 | nm | ||||
Plus: | ||||||||||
Equity in net income of affiliates, net of tax | — | — | nm | |||||||
Income tax expense (benefit) | 13.9 | (3.1 | ) | nm | ||||||
(Loss) income from continuing operations before income taxes and equity in net income of affiliates | (89.6 | ) | 77.8 | nm | ||||||
Plus: | ||||||||||
Gain on sale of subsidiaries, net | — | (155.2 | ) | (100 | )% | |||||
Foreign currency exchange gain, net | (7.3 | ) | (26.3 | ) | (72 | )% | ||||
Other expense (income), net | 0.7 | (0.4 | ) | nm | ||||||
Loss (gain) on derivatives | 19.9 | (0.5 | ) | nm | ||||||
Loss on debt extinguishment | — | 15.7 | 100 | % | ||||||
Interest expense | 76.5 | 104.8 | 27 | % | ||||||
Interest income | (5.8 | ) | (3.4 | ) | 71 | % | ||||
Operating (loss) income | (5.7 | ) | 12.5 | (146 | )% | |||||
Plus: | ||||||||||
Depreciation and amortization | 67.9 | 66.8 | (2 | )% | ||||||
EBITDA | 62.2 | 79.3 | (22 | )% | ||||||
Plus: | ||||||||||
Share-based compensation expense (a) | 8.6 | 8.0 | (8 | )% | ||||||
Loss on impairment of assets | — | — | nm | |||||||
EiP implementation expenses (b) | 15.7 | 11.2 | (40 | )% | ||||||
Adjusted EBITDA | $ | 86.5 | $ | 98.5 | (12 | )% | ||||
nm - percentage changes not meaningful
(a) Represents non-cash, share-based compensation expense pursuant to the provisions of ASC 718.
(b) EiP implementation expenses are related to our enterprise-wide initiative to optimize and standardize our processes, creating vertical integration of procurement, information technology, finance, accounting and human resources. The first wave of EiP, which began in 2014, is expected to be substantially completed by 2017 and includes the establishment of regional SSOs around the world, as well as improvements to our system of internal controls over financial reporting. Given the success of the first wave of EiP, we have expanded the initiative into other back- and mid-office areas in order to generate additional efficiencies and create a more efficient organizational structure. Also included in EiP are certain non-recurring costs incurred in connection with the planned dispositions described in Note 4, Assets Held for Sale, of our consolidated financial statements included elsewhere in this Quarterly Report on Form 10-Q.
Comparison of Depreciation and Amortization, Share-based Compensation and EiP Implementation Expenses for the Three Months Ended September 30, 2017 to the Three Months Ended September 30, 2016
Depreciation and amortization increased by $1.1 million to $67.9 million for the 2017 fiscal quarter from $66.8 million for the 2016 fiscal quarter, which was primarily due to the effects of foreign currency exchange.
Share-based compensation expense increased by $0.6 million to $8.6 million for the 2017 fiscal quarter from $8.0 million for the 2016 fiscal quarter.
EiP implementation expenses increased by $4.5 million to $15.7 million for the 2017 fiscal quarter from $11.2 million for the 2016 fiscal quarter. The EiP expenses are related to an enterprise-wide initiative to optimize and standardize our processes, creating vertical integration of procurement, information technology, financing, accounting and human resources. EiP also includes the
51
establishment of regional SSOs around the world, as well as improvements to our system of internal controls over financial reporting.
The following table presents Adjusted EBITDA and reconciles net (loss) income to Adjusted EBITDA for the nine months ended September 30, 2017 and 2016:
% Change | ||||||||||
Better/(Worse) | ||||||||||
(in millions) | 2017 | 2016 | 2017 vs. 2016 | |||||||
Net (loss) income | $ | (106.7 | ) | $ | 327.7 | (133 | )% | |||
Plus: | ||||||||||
Equity in net income of affiliates, net of tax | — | — | nm | |||||||
Income tax expense | 28.8 | 35.2 | 18 | % | ||||||
(Loss) income from continuing operations before income taxes and equity in net income of affiliates | (78.0 | ) | 362.9 | (121 | )% | |||||
Plus: | ||||||||||
Loss (gain) on sale of subsidiaries, net | 0.2 | (398.4 | ) | (100 | )% | |||||
Foreign currency exchange loss (gain), net | 0.1 | (80.3 | ) | (100 | )% | |||||
Other expense, net | 0.7 | 1.0 | 30 | % | ||||||
(Gain) loss on derivatives | (19.2 | ) | 8.2 | nm | ||||||
Loss on debt extinguishment | 8.4 | 17.4 | 52 | % | ||||||
Interest expense | 278.0 | 314.4 | 12 | % | ||||||
Interest income | (15.0 | ) | (13.3 | ) | 13 | % | ||||
Operating income | 175.3 | 211.9 | (17 | )% | ||||||
Plus: | ||||||||||
Depreciation and amortization | 199.4 | 202.7 | 2 | % | ||||||
EBITDA | 374.7 | 414.6 | (10 | )% | ||||||
Plus: | ||||||||||
Share-based compensation expense (a) | 44.0 | 28.9 | (52 | )% | ||||||
Loss on impairment of assets | — | — | nm | |||||||
EiP implementation expenses (b) | 58.3 | 37.2 | (57 | )% | ||||||
Adjusted EBITDA | $ | 477.0 | $ | 480.7 | (1 | )% | ||||
nm - percentage changes not meaningful
(a) Represents non-cash, share-based compensation expense pursuant to the provisions of ASC 718.
(b) EiP implementation expenses are related to our enterprise-wide initiative to optimize and standardize our processes, creating vertical integration of procurement, information technology, finance, accounting and human resources. The first wave of EiP, which began in 2014, is expected to be substantially completed by 2017 and includes the establishment of regional SSOs around the world, as well as improvements to our system of internal controls over financial reporting. Given the success of the first wave of EiP, we have expanded the initiative into other back- and mid-office areas in order to generate additional efficiencies and create a more efficient organizational structure. Also included in EiP are certain non-recurring costs incurred in connection with the planned dispositions described in Note 4, Assets Held for Sale, of our consolidated financial statements included elsewhere in this Quarterly Report on Form 10-Q.
Comparison of Depreciation and Amortization, Share-based Compensation and EiP Implementation Expenses for the nine months ended September 30, 2017 and 2016
Depreciation and amortization decreased by $3.3 million to $199.4 million for the 2017 fiscal period from $202.7 million for the 2016 fiscal period. The incremental impact of dispositions decreased depreciation and amortization expense by $3.0 million. Other items accounted for a decrease in depreciation and amortization expense of $3.2 million, primarily related to a trend of decreased capital expenditures in prior periods. These decreases were partially offset by the effects of foreign currency exchange, which increased depreciation and amortization expense by $2.9 million for the 2017 fiscal period compared to the 2016 fiscal period.
52
Share-based compensation expense increased by $15.1 million to $44.0 million for the 2017 fiscal period from $28.9 million for the 2016 fiscal period. This increase is primarily attributable to stock options that were granted to the Company’s CEO under the Executive Profits Interests (EPI) agreement. The EPI options vested upon consummation of the IPO on February 6, 2017, resulting in additional share-based compensation expense of $14.6 million during the 2017 fiscal period.
EiP implementation expenses increased by $21.1 million to $58.3 million for the 2017 fiscal period from $37.2 million for the 2016 fiscal period. The EiP expenses are related to an enterprise-wide initiative to optimize and standardize our processes, creating vertical integration of procurement, information technology, financing, accounting and human resources. EiP also includes the establishment of regional SSOs around the world, as well as improvements to our system of internal controls over financial reporting. The increase relates primarily to increased severance costs in the 2017 fiscal period that are predominantly contractual termination benefits recognized in accordance with ASC 712, ‘‘Compensation—Nonretirement Postemployment Benefits.’’
Segment Results
We have six operating segments: Brazil, Mexico, Andean & Iberian, Central America & U.S. Campuses, EMEAA and Online & Partnerships. For purposes of the following comparison of results discussion, "segment direct costs" represent direct costs by segment as they are included in Adjusted EBITDA, such that depreciation and amortization expense, loss on impairment of assets, share-based compensation expense and our EiP implementation expenses have been excluded. For a further description of our segments, see "Overview."
The following tables, derived from our consolidated financial statements included elsewhere in this Quarterly Report on Form 10-Q, presents selected financial information of our segments:
(in millions) | % Change | |||||||||
Better/(Worse) | ||||||||||
For the three months ended September 30, | 2017 | 2016 | 2017 vs. 2016 | |||||||
Revenues: | ||||||||||
Brazil | $ | 170.5 | $ | 152.8 | 12 | % | ||||
Mexico | 141.2 | 140.4 | 1 | % | ||||||
Andean & Iberian | 314.8 | 289.2 | 9 | % | ||||||
Central America & U.S. Campuses | 69.6 | 65.6 | 6 | % | ||||||
EMEAA | 126.4 | 117.0 | 8 | % | ||||||
Online & Partnerships | 168.4 | 173.3 | (3 | )% | ||||||
Corporate | (7.4 | ) | (8.4 | ) | 12 | % | ||||
Consolidated Total Revenues | $ | 983.4 | $ | 929.9 | 6 | % | ||||
Adjusted EBITDA: | ||||||||||
Brazil | $ | 9.1 | $ | 11.9 | (24 | )% | ||||
Mexico | 6.5 | 24.8 | (74 | )% | ||||||
Andean & Iberian | 75.0 | 64.0 | 17 | % | ||||||
Central America & U.S. Campuses | 9.7 | 7.5 | 29 | % | ||||||
EMEAA | (13.7 | ) | (24.4 | ) | 44 | % | ||||
Online & Partnerships | 42.9 | 51.3 | (16 | )% | ||||||
Corporate | (43.0 | ) | (36.4 | ) | (18 | )% | ||||
Consolidated Total Adjusted EBITDA | $ | 86.5 | $ | 98.5 | (12 | )% | ||||
53
(in millions) | % Change | |||||||||
Better/(Worse) | ||||||||||
For the nine months ended September 30, | 2017 | 2016 | 2017 vs. 2016 | |||||||
Revenues: | ||||||||||
Brazil | $ | 548.0 | $ | 479.6 | 14 | % | ||||
Mexico | 452.0 | 455.1 | (1 | )% | ||||||
Andean & Iberian | 930.3 | 835.5 | 11 | % | ||||||
Central America & U.S. Campuses | 219.1 | 207.1 | 6 | % | ||||||
EMEAA | 468.3 | 585.0 | (20 | )% | ||||||
Online & Partnerships | 521.0 | 531.1 | (2 | )% | ||||||
Corporate | (21.9 | ) | (25.1 | ) | 13 | % | ||||
Consolidated Total Revenues | $ | 3,116.8 | $ | 3,068.3 | 2 | % | ||||
Adjusted EBITDA: | ||||||||||
Brazil | $ | 61.3 | $ | 63.2 | (3 | )% | ||||
Mexico | 78.6 | 89.3 | (12 | )% | ||||||
Andean & Iberian | 240.3 | 179.8 | 34 | % | ||||||
Central America & U.S. Campuses | 38.5 | 31.7 | 21 | % | ||||||
EMEAA | 54.2 | 68.0 | (20 | )% | ||||||
Online & Partnerships | 145.8 | 149.1 | (2 | )% | ||||||
Corporate | (141.6 | ) | (100.3 | ) | (41 | )% | ||||
Consolidated Total Adjusted EBITDA | $ | 477.0 | $ | 480.7 | (1 | )% | ||||
Brazil
Financial Overview
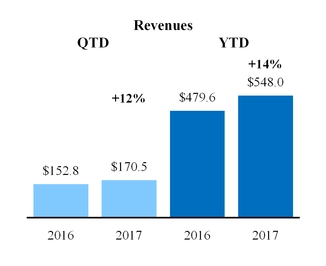
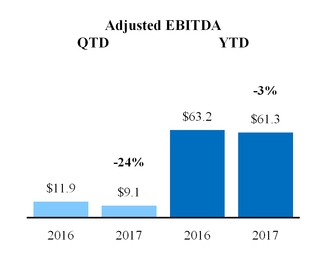
54
Operating results for our Brazil segment for the three months ended September 30, 2017 and 2016 were as follows:
(in millions) | Revenues | Direct Costs | Adjusted EBITDA | ||||||||
September 30, 2016 | $ | 152.8 | $ | 140.9 | $ | 11.9 | |||||
Organic enrollment (1) | 7.2 | ||||||||||
Product mix, pricing and timing (1) | 5.5 | ||||||||||
Organic constant currency | 12.7 | 15.6 | (2.9 | ) | |||||||
Foreign exchange | 5.0 | 4.0 | 1.0 | ||||||||
Acquisitions | — | — | — | ||||||||
Dispositions | — | — | — | ||||||||
Other (2) | — | 0.9 | (0.9 | ) | |||||||
September 30, 2017 | $ | 170.5 | $ | 161.4 | $ | 9.1 | |||||
(1) Organic enrollment and Product mix, pricing and timing are not separable for the calculation of direct costs and therefore are combined and defined as Organic constant currency for the calculation of Adjusted EBITDA.
(2) Other is composed of acquisition-contingent liabilities for taxes other-than-income tax, net of changes in recorded indemnification assets.
Revenues increased by $17.7 million, a 12% increase from the 2016 fiscal quarter.
• | Organic enrollment increased during the fiscal quarter by 4%, increasing revenues by $7.2 million. |
• | Revenues represented 17% of our consolidated total revenues for the 2017 fiscal quarter compared to 16% for the 2016 fiscal quarter. |
Adjusted EBITDA decreased by $2.8 million, a 24% decrease from the 2016 fiscal quarter.
Operating results for our Brazil segment for the nine months ended September 30, 2017 and 2016 were as follows:
(in millions) | Revenues | Direct Costs | Adjusted EBITDA | ||||||||
September 30, 2016 | $ | 479.6 | $ | 416.4 | $ | 63.2 | |||||
Organic enrollment (1) | 15.2 | ||||||||||
Product mix, pricing and timing (1) | 3.7 | ||||||||||
Organic constant currency | 18.9 | 25.1 | (6.2 | ) | |||||||
Foreign exchange | 49.5 | 49.1 | 0.4 | ||||||||
Acquisitions | — | — | — | ||||||||
Dispositions | — | — | — | ||||||||
Other (2) | — | (3.9 | ) | 3.9 | |||||||
September 30, 2017 | $ | 548.0 | $ | 486.7 | $ | 61.3 | |||||
(1) Organic enrollment and Product mix, pricing and timing are not separable for the calculation of direct costs and therefore are combined and defined as Organic constant currency for the calculation of Adjusted EBITDA.
(2) Other is composed of acquisition-contingent liabilities for taxes other-than-income tax, net of changes in recorded indemnification assets.
Revenues increased by $68.4 million, a 14% increase from the 2016 fiscal period.
• | Organic enrollment increased during the fiscal period by 2%, increasing revenues by $15.2 million. |
• | Revenues represented 17% of our consolidated total revenues for the 2017 fiscal period compared to 15% for the 2016 fiscal period. |
Adjusted EBITDA decreased by $1.9 million, a 3% decrease from the 2016 fiscal period.
55
Mexico
Financial Overview
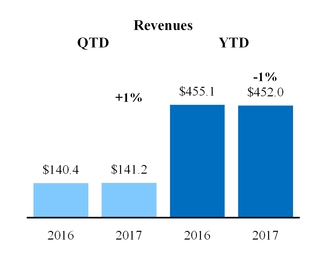
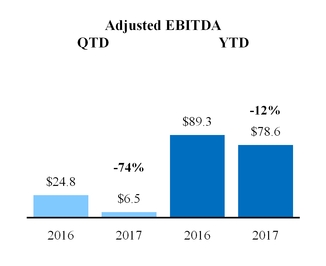
Operating results for our Mexico segment for the three months ended September 30, 2017 and 2016 were as follows:
(in millions) | Revenues | Direct Costs | Adjusted EBITDA | ||||||||
September 30, 2016 | $ | 140.4 | $ | 115.6 | $ | 24.8 | |||||
Organic enrollment (1) | — | ||||||||||
Product mix, pricing and timing (1) | (6.4 | ) | |||||||||
Organic constant currency | (6.4 | ) | 12.5 | (18.9 | ) | ||||||
Foreign exchange | 7.2 | 6.5 | 0.7 | ||||||||
Acquisitions | — | — | — | ||||||||
Dispositions | — | — | — | ||||||||
Other (2) | — | 0.1 | (0.1 | ) | |||||||
September 30, 2017 | $ | 141.2 | $ | 134.7 | $ | 6.5 | |||||
(1) Organic enrollment and Product mix, pricing and timing are not separable for the calculation of direct costs and therefore are combined and defined as Organic constant currency for the calculation of Adjusted EBITDA.
(2) Other is composed of acquisition-contingent liabilities for taxes other-than-income tax, net of changes in recorded indemnification assets.
Revenues increased by $0.8 million, a 1% increase from the 2016 fiscal quarter.
• | The product mix, pricing and timing change primarily resulted from the deferral of approximately $11.7 million of revenues from the 2017 fiscal quarter as a result of class disruptions at our Mexico institutions due to the earthquake. |
• | Revenues represented 14% of our consolidated total revenues for the 2017 fiscal quarter as compared to 15% for the 2016 fiscal quarter. |
Adjusted EBITDA decreased by $18.3 million, a 74% decrease from the 2016 fiscal quarter.
• | The deferral of revenue due to the class disruptions, as well as approximately $2.7 million of repairs and maintenance expenses resulting from the earthquake, accounted for the majority of the decrease. |
56
Operating results for our Mexico segment for the nine months ended September 30, 2017 and 2016 were as follows:
(in millions) | Revenues | Direct Costs | Adjusted EBITDA | ||||||||
September 30, 2016 | $ | 455.1 | $ | 365.8 | $ | 89.3 | |||||
Organic enrollment (1) | 8.1 | ||||||||||
Product mix, pricing and timing (1) | 4.9 | ||||||||||
Organic constant currency | 13.0 | 20.0 | (7.0 | ) | |||||||
Foreign exchange | (16.1 | ) | (11.6 | ) | (4.5 | ) | |||||
Acquisitions | — | — | — | ||||||||
Dispositions | — | — | — | ||||||||
Other (2) | — | (0.8 | ) | 0.8 | |||||||
September 30, 2017 | $ | 452.0 | $ | 373.4 | $ | 78.6 | |||||
(1) Organic enrollment and Product mix, pricing and timing are not separable for the calculation of direct costs and therefore are combined and defined as Organic constant currency for the calculation of Adjusted EBITDA.
(2) Other is composed of acquisition-contingent liabilities for taxes other-than-income tax, net of changes in recorded indemnification assets.
Revenues decreased by $3.1 million, a 1% decrease from the 2016 fiscal period.
• | Organic enrollment increased during the fiscal period by 2%, increasing revenues by $8.1 million. |
• | Product mix, pricing and timing change includes the deferral of approximately $11.7 million of revenues from the 2017 fiscal period as a result of class disruptions at our Mexico institutions due to the earthquake. |
• | Revenues represented 14% of our consolidated total revenues for the 2017 fiscal period as compared to 15% for the 2016 fiscal period. |
Adjusted EBITDA decreased by $10.7 million, a 12% decrease from the 2016 fiscal period.
• | The deferral of revenue due to the class disruptions, as well as approximately $2.7 million of repairs and maintenance expenses resulting from the earthquake, accounted for the majority of the decrease. |
Andean & Iberian
Financial Overview
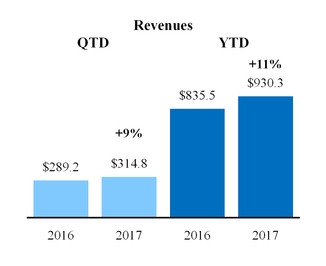
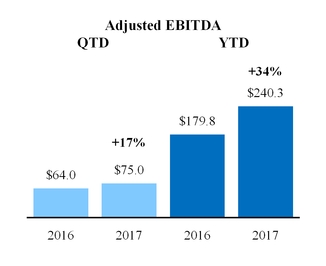
57
Operating results for our Andean & Iberian segment for the three months ended September 30, 2017 and 2016 were as follows:
(in millions) | Revenues | Direct Costs | Adjusted EBITDA | ||||||||
September 30, 2016 | $ | 289.2 | $ | 225.2 | $ | 64.0 | |||||
Organic enrollment (1) | 8.7 | ||||||||||
Product mix, pricing and timing (1) | 6.7 | ||||||||||
Organic constant currency | 15.4 | 6.9 | 8.5 | ||||||||
Foreign exchange | 10.2 | 7.6 | 2.6 | ||||||||
Acquisitions | — | — | — | ||||||||
Dispositions | — | — | — | ||||||||
Other (2) | — | 0.1 | (0.1 | ) | |||||||
September 30, 2017 | $ | 314.8 | $ | 239.8 | $ | 75.0 | |||||
(1) Organic enrollment and Product mix, pricing and timing are not separable for the calculation of direct costs and therefore are combined and defined as Organic constant currency for the calculation of Adjusted EBITDA.
(2) Other is composed of acquisition-contingent liabilities for taxes other-than-income tax, net of changes in recorded indemnification assets.
Revenues increased by $25.6 million, a 9% increase from the 2016 fiscal quarter.
• | Organic enrollment increased during the fiscal quarter by 4%, increasing revenues by $8.7 million. |
• | The product mix, pricing and timing change includes the recognition of approximately $11.9 million revenue in the third quarter of 2017 that had been deferred from the first quarter of 2017 related to class disruptions at our three Peruvian institutions during a period of heavy rains and floods. This increase in product mix, pricing and timing was offset by a quarter-over-quarter impact of approximately $12.0 million of revenue that had been deferred from the second quarter of 2016 to the third quarter of 2016 as a result of class disruptions at two of our Chilean institutions during a nationwide student protest that ended in July 2016. |
• | Revenues represented 32% of our consolidated total revenues for the 2017 fiscal quarter compared to 31% for the 2016 fiscal quarter. |
Adjusted EBITDA increased by $11.0 million, a 17% increase from the 2016 fiscal quarter.
• | Foreign exchange affected the results for the 2017 fiscal quarter due to the strengthening of the Chilean Peso, the Peruvian Nuevo Sol and the Euro relative to the USD. |
Operating results for our Andean & Iberian segment for the nine months ended September 30, 2017 and 2016 were as follows:
(in millions) | Revenues | Direct Costs | Adjusted EBITDA | ||||||||
September 30, 2016 | $ | 835.5 | $ | 655.7 | $ | 179.8 | |||||
Organic enrollment (1) | 32.2 | ||||||||||
Product mix, pricing and timing (1) | 45.1 | ||||||||||
Organic constant currency | 77.3 | 17.1 | 60.2 | ||||||||
Foreign exchange | 17.5 | 17.1 | 0.4 | ||||||||
Acquisitions | — | — | — | ||||||||
Dispositions | — | — | — | ||||||||
Other (2) | — | 0.1 | (0.1 | ) | |||||||
September 30, 2017 | $ | 930.3 | $ | 690.0 | $ | 240.3 | |||||
(1) Organic enrollment and Product mix, pricing and timing are not separable for the calculation of direct costs and therefore are combined and defined as Organic constant currency for the calculation of Adjusted EBITDA.
(2) Other is composed of acquisition-contingent liabilities for taxes other-than-income tax, net of changes in recorded indemnification assets.
58
Revenues increased by $94.8 million, a 11% increase from the 2016 fiscal period.
• | Organic enrollment increased during the fiscal period by 5%, increasing revenues by $32.2 million. |
• | The product mix, pricing and timing change partially resulted from a period-over-period impact to revenue of approximately $18.0 million of revenue that had been deferred from the second quarter of 2016 and was recognized during the fourth of 2016, as a result of the class disruptions at two of our Chilean institutions during a nationwide student protest that ended in July 2016. |
• | Revenue represented 30% of our consolidated total revenues for the 2017 fiscal period compared to 27% for the 2016 fiscal period. |
Adjusted EBITDA increased by $60.5 million, a 34% increase from the 2016 fiscal period.
• | Foreign exchange affected the results for the 2017 fiscal period due to the strengthening of the Chilean Peso and the Peruvian Nuevo Sol partially offset by the weakening of the Euro relative to the USD. |
Central America & U.S. Campuses
Financial Overview
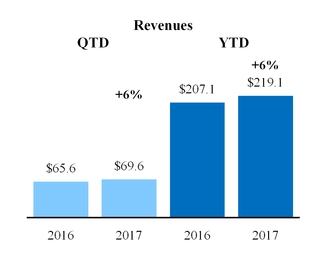
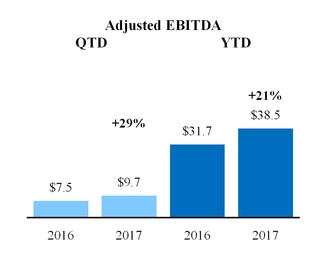
Operating results for our Central America & U.S. Campuses segment for the three months ended September 30, 2017 and 2016 were as follows:
(in millions) | Revenues | Direct Costs | Adjusted EBITDA | ||||||||
September 30, 2016 | $ | 65.6 | $ | 58.1 | $ | 7.5 | |||||
Organic enrollment (1) | 4.6 | ||||||||||
Product mix, pricing and timing (1) | 0.6 | ||||||||||
Organic constant currency | 5.2 | 2.8 | 2.4 | ||||||||
Foreign exchange | (1.2 | ) | (1.0 | ) | (0.2 | ) | |||||
Acquisitions | — | — | — | ||||||||
Dispositions | — | — | — | ||||||||
Other | — | — | — | ||||||||
September 30, 2017 | $ | 69.6 | $ | 59.9 | $ | 9.7 | |||||
(1) Organic enrollment and Product mix, pricing and timing are not separable for the calculation of direct costs and therefore are combined and defined as Organic constant currency for the calculation of Adjusted EBITDA.
Revenues increased by $4.0 million, a 6% increase from the 2016 fiscal quarter.
• | Organic enrollment increased during the fiscal quarter by 3%, increasing revenues by $4.6 million. |
• | Revenues represented 7% of our consolidated total revenues for both the 2017 and 2016 fiscal quarters. |
Adjusted EBITDA increased by $2.2 million, a 29% increase from the 2016 fiscal quarter.
59
Operating results for our Central America & U.S. Campuses segment for the nine months ended September 30, 2017 and 2016 were as follows:
(1) Organic enrollment and Product mix, pricing and timing are not separable for the calculation of direct costs and therefore are combined and defined as Organic constant currency for the calculation of Adjusted EBITDA.
(in millions) | Revenues | Direct Costs | Adjusted EBITDA | ||||||||
September 30, 2016 | $ | 207.1 | $ | 175.4 | $ | 31.7 | |||||
Organic enrollment (1) | 13.1 | ||||||||||
Product mix, pricing and timing (1) | 3.2 | ||||||||||
Organic constant currency | 16.3 | 8.8 | 7.5 | ||||||||
Foreign exchange | (4.3 | ) | (3.6 | ) | (0.7 | ) | |||||
Acquisitions | — | — | — | ||||||||
Dispositions | — | — | — | ||||||||
Other | — | — | — | ||||||||
September 30, 2017 | $ | 219.1 | $ | 180.6 | $ | 38.5 | |||||
Revenues increased by $12.0 million, a 6% increase from the 2016 fiscal period.
• | Organic enrollment increased during the fiscal period by 4%, increasing revenues by $13.1 million. |
• | Revenues represented 7% of our consolidated total revenues for both the 2017 and 2016 fiscal periods. |
Adjusted EBITDA increased by $6.8 million, a 21% increase from the 2016 fiscal period.
EMEAA
Financial Overview
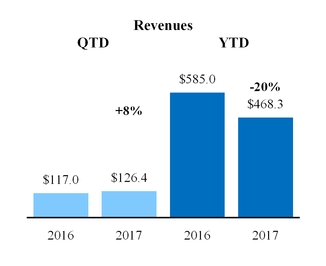
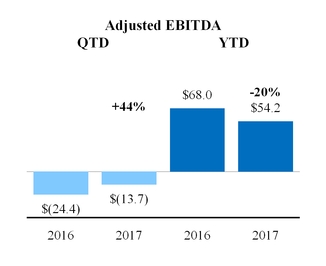
60
Operating results for our EMEAA segment for the three months ended September 30, 2017 and 2016 were as follows:
(in millions) | Revenues | Direct Costs | Adjusted EBITDA | ||||||||
September 30, 2016 | $ | 117.0 | $ | 141.4 | $ | (24.4 | ) | ||||
Organic enrollment (1) | 4.4 | ||||||||||
Product mix, pricing and timing (1) | 5.9 | ||||||||||
Organic constant currency | 10.3 | 3.2 | 7.1 | ||||||||
Foreign exchange | 1.5 | 0.3 | 1.2 | ||||||||
Acquisitions | — | — | — | ||||||||
Dispositions | (2.4 | ) | (4.8 | ) | 2.4 | ||||||
Other | — | — | — | ||||||||
September 30, 2017 | $ | 126.4 | $ | 140.1 | $ | (13.7 | ) | ||||
(1) Organic enrollment and Product mix, pricing and timing are not separable for the calculation of direct costs and therefore are combined and defined as Organic constant currency for the calculation of Adjusted EBITDA.
Revenues increased by $9.4 million, an 8% increase from the 2016 fiscal quarter.
• | Organic enrollment increased during the fiscal quarter by 6%, increasing revenues by $4.4 million. |
• | Revenues represented 13% of our consolidated total revenues for the 2017 fiscal quarter compared to 12% for the 2016 fiscal quarter. |
Adjusted EBITDA increased by $10.7 million, a 44% increase from the 2016 fiscal quarter.
• | Foreign exchange affected the results for the 2017 fiscal quarter primarily due to the strengthening of the Australian Dollar, the Indian Rupee, and the Euro partially offset by the weakening of the Turkish Lira and the Malaysian Ringgit relative to the USD. |
Operating results for the EMEAA segment for the nine months ended September 30, 2017 and 2016 were as follows:
(in millions) | Revenues | Direct Costs | Adjusted EBITDA | ||||||||
September 30, 2016 | $ | 585.0 | $ | 517.0 | $ | 68.0 | |||||
Organic enrollment (1) | 27.6 | ||||||||||
Product mix, pricing and timing (1) | 12.6 | ||||||||||
Organic constant currency | 40.2 | 21.0 | 19.2 | ||||||||
Foreign exchange | (15.0 | ) | (8.6 | ) | (6.4 | ) | |||||
Acquisitions | — | — | — | ||||||||
Dispositions | (141.9 | ) | (115.3 | ) | (26.6 | ) | |||||
Other | — | — | — | ||||||||
September 30, 2017 | $ | 468.3 | $ | 414.1 | $ | 54.2 | |||||
(1) Organic enrollment and Product mix, pricing and timing are not separable for the calculation of direct costs and therefore are combined and defined as Organic constant currency for the calculation of Adjusted EBITDA.
Revenues decreased by $116.7 million, a 20% decrease from the 2016 fiscal period.
• | Organic enrollment increased during the fiscal period by 6%, increasing revenues by $27.6 million. |
• | Revenues represented 15% of our consolidated total revenues for the 2017 fiscal period compared to 19% for the 2016 fiscal period. |
• | The incremental impact of dispositions accounted for $141.9 million of the decrease in revenues. |
Adjusted EBITDA decreased by $13.8 million, a 20% decrease from the 2016 fiscal period.
• | Foreign exchange affected the results for the 2017 fiscal period primarily due to the weakening of the Turkish Lira, the Malaysian Ringgit, the Chinese Renminbi, and the Euro, partially offset by the strengthening of the Australian Dollar, the South African Rand and the Indian Rupee relative to the USD. |
61
Online & Partnerships
Financial Overview
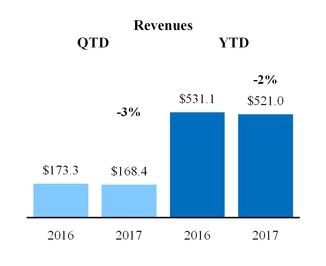
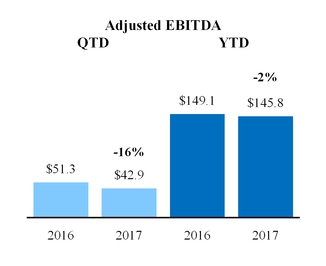
Operating results for our Online & Partnerships segment for the three months ended September 30, 2017 and 2016 were as follows:
(in millions) | Revenues | Direct Costs | Adjusted EBITDA | ||||||||
September 30, 2016 | $ | 173.3 | $ | 122.0 | $ | 51.3 | |||||
Organic enrollment (1) | (7.0 | ) | |||||||||
Product mix, pricing and timing (1) | 1.5 | ||||||||||
Organic constant currency | (5.5 | ) | 2.8 | (8.3 | ) | ||||||
Foreign exchange | 0.6 | 0.7 | (0.1 | ) | |||||||
Acquisitions | — | — | — | ||||||||
Dispositions | — | — | — | ||||||||
Other | — | — | — | ||||||||
September 30, 2017 | $ | 168.4 | $ | 125.5 | $ | 42.9 | |||||
(1) Organic enrollment and Product mix, pricing and timing are not separable for the calculation of direct costs and therefore are combined and defined as Organic constant currency for the calculation of Adjusted EBITDA.
Revenues decreased by $4.9 million, a 3% decrease from the 2016 fiscal quarter.
• | Organic enrollment decreased during the fiscal quarter by 5%, decreasing revenues by $7.0 million. |
• | Revenues represented 17% of our consolidated total revenues for the 2017 fiscal quarter compared to 19% for the 2016 fiscal quarter. |
Adjusted EBITDA decreased by $8.4 million, a 16% decrease compared to the 2016 fiscal quarter.
62
Operating results for the Online & Partnerships segment for the nine months ended September 30, 2017 and 2016 were as follows:
(in millions) | Revenues | Direct Costs | Adjusted EBITDA | ||||||||
September 30, 2016 | $ | 531.1 | $ | 382.0 | $ | 149.1 | |||||
Organic enrollment (1) | (25.7 | ) | |||||||||
Product mix, pricing and timing (1) | 15.9 | ||||||||||
Organic constant currency | (9.8 | ) | (6.5 | ) | (3.3 | ) | |||||
Foreign exchange | (0.3 | ) | (0.3 | ) | — | ||||||
Acquisitions | — | — | — | ||||||||
Dispositions | — | — | — | ||||||||
Other | — | — | — | ||||||||
September 30, 2017 | $ | 521.0 | $ | 375.2 | $ | 145.8 | |||||
(1) Organic enrollment and Product mix, pricing and timing are not separable for the calculation of direct costs and therefore are combined and defined as Organic constant currency for the calculation of Adjusted EBITDA.
Revenues decreased by $10.1 million, a 2% decrease from the 2016 fiscal period.
• | Organic enrollment decreased during the fiscal period by 6%, decreasing revenues by $25.7 million. |
• | Revenues represented 17% of our consolidated total revenues for both the 2017 and 2016 fiscal periods. |
Adjusted EBITDA decreased by $3.3 million, a 2% decrease compared to the 2016 fiscal period.
Corporate
Corporate revenues represent amounts from contractual arrangements with UDLA Ecuador and our consolidated joint venture with the University of Liverpool, as well as Corporate billings for centralized IT costs billed to various segments, offset by the elimination of inter-segment revenues.
Operating results for Corporate for the three months ended September 30, 2017 and 2016 were as follows:
% Change | ||||||||||
Better/(Worse) | ||||||||||
(in millions) | 2017 | 2016 | 2017 vs. 2016 | |||||||
Revenues | $ | (7.4 | ) | $ | (8.4 | ) | 12 | % | ||
Expenses | 35.6 | 28.0 | (27 | )% | ||||||
Adjusted EBITDA | $ | (43.0 | ) | $ | (36.4 | ) | (18 | )% | ||
Adjusted EBITDA decreased by $6.6 million, an 18% decrease from the 2016 fiscal quarter.
• | Labor costs and other professional fees increased expenses by $5.1 million, mostly related to ongoing internal controls compliance initiatives. |
• | Other items accounted for a decrease in Adjusted EBITDA of $1.5 million. |
Operating results for Corporate for the nine months ended September 30, 2017 and 2016 were as follows:
% Change | ||||||||||
Better/(Worse) | ||||||||||
(in millions) | 2017 | 2016 | 2017 vs. 2016 | |||||||
Revenues | $ | (21.9 | ) | $ | (25.1 | ) | 13 | % | ||
Expenses | 119.7 | 75.2 | (59 | )% | ||||||
Adjusted EBITDA | $ | (141.6 | ) | $ | (100.3 | ) | (41 | )% | ||
63
Adjusted EBITDA decreased by $41.3 million, a 41% decrease from the 2016 fiscal period.
• | Expense of $22.8 million recorded related to the portion of the refinancing transactions that was deemed to be a debt modification. |
• | Labor costs and other professional fees increased expenses by $8.5 million, mostly related to ongoing internal controls compliance initiatives. |
• | Expense of $4.5 million recorded related to a transaction with a former business partner. |
• | Other items, including increased IT expenses, accounted for a decrease in Adjusted EBITDA of $5.5 million. |
Liquidity and Capital Resources
Liquidity Sources
We anticipate that cash flow from operations and available cash will be sufficient to meet our current operating requirements for at least the next 12 months.
Our primary source of cash is revenue from tuition charged to students in connection with our various education program offerings. The majority of our students finance the cost of their own education and/or seek third-party financing programs. We anticipate generating sufficient cash flow from operations in the majority of countries where we operate to satisfy the working capital and financing needs of our organic growth plans for each country. If our educational institutions within one country were unable to maintain sufficient liquidity, we would consider using internal cash resources or reasonable short-term working capital facilities to accommodate any short- to medium-term shortfalls.
As of September 30, 2017, our secondary source of cash was cash and cash equivalents of $505.0 million. Our cash accounts are maintained with high-quality financial institutions with no significant concentration in any one institution.
Assets Held For Sale
As discussed in Note 4, Assets Held for Sale, of our consolidated financial statements included elsewhere in this Quarterly Report on Form 10-Q, the Company has identified certain subsidiaries in our EMEAA segment that may not reach a scale that will be meaningful for Laureate, and has undertaken a process to sell these entities. As of September 30, 2017, the assets and liabilities of these subsidiaries, in addition to an asset group at a for-profit real estate subsidiary in our Andean & Iberian segment, have been classified as held for sale in our consolidated balance sheet. The Company expects to begin receiving final offers on these entities in the fourth quarter of 2017, and estimates that closing of the sale transactions will begin to occur in the first quarter of 2018.
Liquidity Restrictions
Our liquidity is affected by restricted cash and investments balances, which totaled $199.3 million and $189.3 million as of September 30, 2017 and December 31, 2016, respectively.
Indefinite Reinvestment of Foreign Earnings
We earn a significant portion of our income from subsidiaries located in countries outside the United States. As part of our business strategies, we have determined that all earnings from our foreign operations will be deemed indefinitely reinvested outside of the United States. As of September 30, 2017, $490.5 million of our total $505.0 million of cash and cash equivalents were held by foreign subsidiaries, including $265.5 million held by VIEs. As of December 31, 2016, $373.4 million of our total $465.0 million of cash and cash equivalents were held by foreign subsidiaries, including $169.1 million held by VIEs. The VIEs' cash and cash equivalents balances are generally required to be used only for the operations of these VIEs.
Liquidity Requirements
Our short-term liquidity requirements include: funding for debt service (including capital leases); operating lease obligations; payments due to shareholders of acquired companies; working capital; operating expenses; payments of third-party obligations; capital expenditures; and business development activities.
64
Long-term liquidity requirements include: principal payments of long-term debt; operating lease obligations; payments of long-term amounts due to shareholders of acquired companies; payments of deferred compensation; settlements of derivatives; payments of third-party obligations; and business development activities.
Debt
During the second quarter of 2017, the Company completed refinancing transactions that resulted in repayment of the previous senior credit facility and the redemption of the 9.250% Senior Notes due 2019 (the Senior Notes due 2019) (other than $250.0 million in aggregate principal amount of the Senior Notes due 2019 that the Company exchanged on April 21, 2017 for substantially identical but non-redeemable notes issued under a new indenture (the Exchanged Notes)). The Exchanged Notes were settled on August 11, 2017 as described further below.
On April 26, 2017, we completed an offering of $800.0 million aggregate principal amount of 8.250% Senior Notes due 2025 (the Senior Notes due 2025). The Senior Notes due 2025 were issued at par and will mature on May 1, 2025. Interest on the Senior Notes due 2025 is payable semi-annually on May 1 and November 1, and the first interest payment date is November 1, 2017.
Substantially concurrently with the issuance of the Senior Notes due 2025, we consummated a refinancing of our Senior Secured Credit Facility by means of an amendment and restatement of the existing amended and restated credit agreement (the Second Amended and Restated Credit Agreement) to provide a new revolving credit facility of $385.0 million maturing in April 2022 (the Revolving Credit Facility) and a new syndicated term loan of $1,600.0 million maturing in April 2024 (the 2024 Term Loan).
As of September 30, 2017, senior long-term borrowings totaled $2,376.8 million and consisted of $1,576.8 million under the Senior Secured Credit Facility that matures in April 2022 and April 2024 and $800.0 million in Senior Notes due 2025 that mature on May 1, 2025.
As of September 30, 2017, other debt balances totaled $677.8 million, and our capital lease obligations and sale-leaseback financings were $261.7 million. Other debt includes lines of credit and short-term borrowing arrangements of subsidiaries, mortgages payable and notes payable.
Senior Secured Credit Facility
As of September 30, 2017, the outstanding balance under our Senior Secured Credit Facility was $1,576.8 million, which consisted of no amount outstanding under our $385.0 million senior secured multi-currency revolving credit facility and an aggregate outstanding balance of $1,576.8 million, net of a debt discount, under the term loans. As of December 31, 2016, the outstanding balance under our previous senior credit facility was $1,497.9 million, which consisted of no amount outstanding under our senior secured multi-currency revolving credit facility and an aggregate outstanding balance of $1,497.9 million, net of a debt discount, under the term loans.
Senior Notes
As of September 30, 2017, the outstanding balance under our Senior Notes due 2025 was $800.0 million, net of a debt discount. As of December 31, 2016, our outstanding balance under our Senior Notes due 2019 was $1,388.0 million, net of a debt discount.
On April 15, 2016, Laureate entered into separate, privately negotiated note exchange agreements (the Note Exchange Agreements) with certain existing holders of the Senior Notes due 2019 pursuant to which we agreed to exchange $250.0 million in aggregate principal amount of Senior Notes due 2019 for shares of the Company's Class A common stock. The exchange was to be completed within one year and one day after the consummation of an initial public offering of our common stock that generates gross proceeds of at least $400.0 million or 10% of the equity value of the Company (a Qualified Public Offering). On February 6, 2017, the Company completed an initial public offering of its Class A common stock at a price per share of $14.00 that qualified as a Qualified Public Offering. On March 1, 2017, in accordance with the terms of the Note Exchange Agreements, we repurchased Senior Notes due 2019 with an aggregate principal amount of $22.6 million at a repurchase price of 104.625% of the aggregate principal amount, for a total payment of $23.6 million. On August 2, 2017, we sent notices to the holders of the notes subject to the Note Exchange Agreements indicating that the closing of the exchange contemplated by the Note Exchange Agreements would be consummated on Friday, August 11, 2017. On August 11, 2017, the remaining Senior Notes due 2019 were exchanged for a total of 18.7 million shares of the Company's Class A common stock and the Senior Notes due 2019 were canceled.
65
Covenants
Under our Second Amended and Restated Credit Agreement we are subject to a Consolidated Senior Secured Debt to Consolidated EBITDA financial maintenance covenant, as defined in the Second Amended and Restated Credit Agreement, unless certain conditions are satisfied. As of September 30, 2017, these conditions were satisfied and, therefore, we were not subject to the leverage ratio covenant. The maximum ratio, as defined, is 4.50x as of the last day of each quarter ending June 30, 2017 through September 30, 2017, 3.75x as of the last day of each quarter ending December 31, 2017 through March 31, 2018, and 3.50x as of the last day of each quarter ending June 30, 2018 and thereafter.
Leases
We conduct a significant portion of our operations from leased facilities. These facilities include our corporate headquarters, other office locations, and many of our higher education facilities.
Due to Shareholders of Acquired Companies
One method of payment for acquisitions is the use of promissory notes payable to the sellers of acquired companies. As of September 30, 2017 and December 31, 2016, we recorded $81.2 million and $210.9 million, respectively, for these liabilities. During the third quarter of 2017 we repaid the FMU seller note of $114.6 million, and as of September 30, 2017 the current portion of these notes payable was $28.9 million. See also Note 5, Due to Shareholders of Acquired Companies, in our consolidated financial statements included elsewhere in this Quarterly Report on Form 10-Q.
Capital Expenditures
Capital expenditures consist of purchases of property and equipment, purchases of land use rights and expenditures for deferred costs. Our capital expenditure program is a component of our liquidity and capital management strategy. This program includes discretionary spending, which we can adjust in response to economic and other changes in our business environment, to grow our network through the following: (1) capacity expansion at institutions to support enrollment growth; (2) new campuses for institutions entering new geographic markets; (3) information technology to increase efficiency and controls; and (4) online content development. Our non-discretionary spending includes the maintenance of existing facilities. We typically fund our capital expenditures through cash flow from operations and external financing.
Our capital expenditures were $147.3 million and $146.9 million during the nine months ended September 30, 2017 and 2016, respectively. The increase in capital expenditures was related to increased spending on growth initiatives in Brazil combined with facilities improvements in Mexico. These increases were partially offset by lower capital expenditures in Chile and Peru combined with the timing of spending related to certain Corporate global transformation initiatives.
Derivatives
In the normal course of business, our operations are exposed to fluctuations in foreign currency values and interest rate changes. We mitigate a portion of these risks through a risk-management program that includes the use of derivatives. We were required to make net cash payments on our derivatives totaling $7.1 million and $14.7 million for the nine months ended September 30, 2017 and 2016, respectively. These amounts include cash payments that were recognized as interest expense for the derivatives designated as cash flow hedges, and in 2016 included net cash payments made for the derivatives related to the sale transactions. For further information on our derivatives, see Note 13, Derivative Instruments, in our consolidated financial statements included elsewhere in this Quarterly Report on Form 10-Q.
Series A Convertible Redeemable Preferred Stock (Series A Preferred Stock)
In December 2016 and January 2017, we issued shares of Series A Preferred Stock for total gross proceeds of $400.0 million. The shares of Series A Preferred Stock are redeemable at our option at any time (subject to certain limitations involving the price of our Class A common stock) and by the holders after the fifth anniversary of the issue date at a redemption price per share equal to 1.15 multiplied by the sum of the issue amount per share plus any accrued and unpaid dividends. The shares of Series A Preferred Stock may also be converted into shares of our common stock upon certain conditions. For further description see Note 9, Commitments and Contingencies, in our consolidated financial statements included elsewhere in this Quarterly Report on Form 10-Q.
66
Redeemable Noncontrolling Interests and Equity
In connection with certain acquisitions, we have entered into put/call arrangements with certain minority shareholders, and we may be required or elect to purchase additional ownership interests in the associated entities within a specified timeframe. Certain of our call rights contain minimum payment provisions. If we exercise such call rights, the consideration required could be higher than the estimated put values. Upon exercise of these puts or calls, our ownership interests in these subsidiaries would increase.
Business Development Activities
Our growth plans have historically included and may include future acquisition activity. Our acquisitions have historically been funded primarily through existing liquidity and seller financing. We evaluate various alternatives to raise additional capital to fund potential acquisitions and other investing activities. These alternatives may include issuing additional equity or debt and entering into operating or other leases relating to facilities that we use, including sale-leaseback transactions involving new or existing facilities. The incurrence covenants in our debt agreements impose limitations on our ability to engage in additional debt and sale-leaseback transactions, as well as on investments that may be made. In the event that we are unable to obtain the necessary funding or capital for potential acquisitions or other business initiatives, it could have a significant impact on our long-term growth strategy. We believe that our internal sources of cash and our ability to incur seller financing and additional third-party financing, subject to market conditions, will be sufficient to fund our investing activities.
DOE Letter of Credit Increase
We received a letter dated October 12, 2017 from the DOE stating that, based on Laureate’s failure to meet standards of financial responsibility for the fiscal year ended December 31, 2016, we are required to either: 1) increase our LOC to an amount equal to 50% of the Title IV, Higher Education Act (HEA) funds received by Laureate in the fiscal year ended December 31, 2016 (calculated by the DOE to be $456.3 million) and qualify as a financially responsible institution; or 2) increase our LOC to an amount equal to 15% of the Title IV, HEA funds received by Laureate in the fiscal year ended December 31, 2016 (calculated by the DOE to be $136.9 million) and remain provisionally certified for a period of up to three complete award years. In the letter, the DOE also has required us to continue to comply with additional notification and reporting requirements. We have chosen the second option, to increase our LOC to $136.9 million and to remain provisionally certified for a period of up to three complete award years, and we are in the process of obtaining one or more LOCs for such amount. We also chose that option in 2016, resulting in our letter of credit balance of $105.6 million that is posted as of September 30, 2017.
Chilean Regulatory Updates
If the 2017 Higher Education Bill passes substantially in the form as described in “Item 1A—Risk Factors—Political and regulatory developments in Chile may materially adversely affect us,” and all constitutional challenges are denied, we believe, based on our interpretation of the current form of the 2017 Higher Education Bill, that Adjusted EBITDA, on an annual consolidated basis, will be reduced thereafter by approximately $50 million, representing approximately 40% of our current Adjusted EBITDA from Chile, and net revenues will be reduced by approximately $350 million. Based on the Company’s understanding of the 2017 Higher Education Bill, the Company believes that if passed substantially in its current form, there would be a two to three year implementation window before the 2017 Higher Education Bill would take full effect.
Cash Flows
In the consolidated statements of cash flows, the changes in operating assets and liabilities are presented excluding the effects of exchange rate changes, acquisitions, and reclassifications, as these effects do not represent operating cash flows. Accordingly, the amounts in the consolidated statements of cash flows do not agree with the changes of the operating assets and liabilities as presented in the consolidated balance sheets. The effects of exchange rate changes on cash are presented separately in the consolidated statements of cash flows.
67
The following table summarizes our cash flows from operating, investing, and financing activities for each of the nine months ended September 30, 2017 and 2016:
(in millions) | 2017 | 2016 | |||||
Cash provided by (used in): | |||||||
Operating activities | $ | 144.8 | $ | 196.0 | |||
Investing activities | (150.2 | ) | 392.3 | ||||
Financing activities | 53.8 | (572.7 | ) | ||||
Effects of exchange rates changes on cash | 26.1 | 7.2 | |||||
Change in cash included in current assets held for sale | (34.5 | ) | — | ||||
Net change in cash and cash equivalents | $ | 40.0 | $ | 22.8 | |||
Comparison of Cash Flows for the Nine Months Ended September 30, 2017 to the Nine Months Ended September 30, 2016
Operating activities
Cash provided by operating activities decreased by $51.2 million to $144.8 million for the 2017 fiscal period, compared to $196.0 million for the 2016 fiscal period. This decrease in operating cash flows during the 2017 fiscal period is due primarily to the payment of redemption and call premiums during the second quarter of 2017 on the debt modification, which totaled $65.2 million, as well as debt modification fees that were paid and expensed during the 2017 fiscal period of $22.8 million. During the third quarter of 2017 we also fully repaid the FMU seller notes, the interest portion of which is classified in operating cash flows and included in the $39.4 million of Interest paid on deferred purchase price for acquisitions. In addition, cash paid for taxes increased by $13.2 million, from $74.8 million for the 2016 fiscal period to $88.0 million for the 2017 fiscal period. Partially offsetting these changes was a decrease in cash paid for interest on all other debt of $7.5 million, from $306.1 million for the 2016 fiscal period to $298.6 million for the 2017 fiscal period, which is primarily attributable to the refinancing transactions completed by the Company in the second quarter of 2017. Changes in operating assets and liabilities and other working capital increased cash by $81.9 million for the 2017 fiscal period, compared to the 2016 fiscal period, which can be partly attributed to the effect on operating cash flows for the 2016 fiscal period of the dispositions of the Swiss and French businesses, combined with positive fall enrollment cycles in the 2017 fiscal period at certain institutions.
Investing activities
Cash used in investing activities increased by $542.5 million for the 2017 fiscal period to $150.2 million, from an investing cash inflow of $392.3 million in the 2016 fiscal period. This change is primarily attributable to the sale of the Glion and Les Roches Hospitality Management schools during the 2016 fiscal period, which resulted in a $552.7 million year-over-year decrease in receipts from the sale of property and equipment. This decrease in cash from investing activities was partially offset by a year-over-year increase in investing cash flows of $5.7 million related to the 2016 cash settlement of derivatives associated with the subsidiary sales. Other items accounted for the remaining change of $4.5 million.
Financing activities
Cash provided by financing activities increased by $626.5 million for the 2017 fiscal period to $53.8 million, compared to a financing cash outflow of $572.7 million for the 2016 fiscal period. This increased cash from financing activities was primarily attributable to the $456.4 million of net proceeds from the IPO and the $55.3 million of net proceeds from issuance of the shares of Series A Preferred Stock. Additionally, net payments of long-term debt during the 2017 fiscal period, which included the repurchase of $22.6 million of Senior Notes due 2019 under the Note Exchange Agreements, were $178.7 million lower than in the 2016 fiscal period due primarily to the prior year including a debt prepayment of $300.0 million made in connection with the 2016 amendment of our credit agreement. In addition, payments to purchase noncontrolling interests were $25.7 million lower during the 2017 fiscal period as compared to the 2016 fiscal period, since the 2016 fiscal period included the purchase of the remaining noncontrolling interest of St. Augustine. These increases in cash from financing activities were partially offset by higher payments of deferred purchase price for acquisitions during the 2017 fiscal period versus the 2016 fiscal period of $84.2 million, due principally to the repayment of the FMU seller note in September 2017. Other items accounted for the remaining change of $5.4 million.
68
Critical Accounting Policies and Estimates
The preparation of the consolidated financial statements in conformity with GAAP requires our management to make estimates and assumptions that affect the reported amounts of assets, liabilities, revenues and expenses, and the related disclosure of contingent assets and liabilities. Actual results could differ from these estimates. Our significant accounting policies are discussed in Note 2 of the audited Consolidated Financial Statements included in our 2016 Form 10-K. Our critical accounting policies require the most significant judgments and estimates about the effect of matters that are inherently uncertain. As a result, these accounting policies and estimates could materially affect our financial statements and are critical to the understanding of our results of operations and financial condition. For a complete discussion of our critical accounting policies, see the “Critical Accounting Policies and Estimates” section of the MD&A in our 2016 Form 10-K. During the nine months ended September 30, 2017, there were no significant changes to our critical accounting policies.
Recently Issued Accounting Pronouncements
Refer to Note 2, Significant Accounting Policies, in our consolidated financial statements included elsewhere in this Quarterly Report on Form 10-Q for recently issued accounting pronouncements.
69
Item 3. Quantitative and Qualitative Disclosures About Market Risk
For information regarding our exposure to certain market risks, see Item 7A, Quantitative and Qualitative Disclosures About Market Risk, in our 2016 Form 10-K. There have been no significant changes in our market risk exposures since our December 31, 2016 fiscal year end.
Item 4. Controls and Procedures
Evaluation of Disclosure Controls and Procedures
Our management, with the participation of our Chief Executive Officer (CEO) and Chief Financial Officer (CFO), has evaluated the effectiveness of our disclosure controls and procedures (as defined in Rules 13a-15(e) and 15d-15(e) under the Securities Exchange Act of 1934 (the Exchange Act)), as of the end of the period covered by this Quarterly Report on Form 10-Q. The purpose of disclosure controls and procedures is to ensure that information required to be disclosed in the reports we file or submit under the Exchange Act is recorded, processed, summarized and reported within the time periods specified in the SEC's rules and forms, and that such information is accumulated and communicated to management, including our CEO and CFO, to allow timely decisions regarding required disclosures.
Based on that evaluation, our CEO and CFO have concluded that, as of the end of the period covered by this Quarterly Report on Form 10-Q, our disclosure controls and procedures were not effective due to the four material weaknesses, which we view as an integral part of our disclosure controls and procedures, previously disclosed in Item 7 of our 2016 Form 10-K. We have commenced the remediation of these material weaknesses; however, as of September 30, 2017 the material weaknesses had not yet been remediated. Nevertheless, we believe that the consolidated financial statements in this Quarterly Report on Form 10-Q fairly present, in all material respects, our financial position, results of operations and cash flows for the periods presented in conformity with GAAP.
Changes in Internal Controls
There were no changes in our internal control over financial reporting during the fiscal quarter ended September 30, 2017 that have materially affected, or are reasonably likely to materially affect, our internal control over financial reporting.
70
PART II - OTHER INFORMATION
Item 1. Legal Proceedings
We are party to various claims and legal proceedings from time to time. Except as described in our 2016 Form 10-K, as updated in our Form 10-Q's for the quarters ended March 31, 2017, June 30, 2017 and below, we are not aware of any legal proceedings that we believe could have, individually or in the aggregate, a material adverse effect on our business, results of operations or financial condition.
On October 5, 2016, a student filed suit against us and Walden University in the United States District Court for the Southern District of Ohio in the matter of Latonya Thornhill v. Walden University, et. al., claiming that her progress in her program was delayed by Walden University and seeking class action status to represent a nationwide class of purportedly similarly situated doctoral students. The claims include fraud in the inducement, breach of contract, consumer fraud under the laws of Maryland and Ohio, and unjust enrichment. We and Walden University were served on October 17, 2016. On December 16, 2016, we and Walden University filed a motion to dismiss the claims and a motion to strike the class action certification request. On January 12, 2017, the plaintiff filed an amended complaint, making modifications to supplement some of the factual allegations and seeking to change the governing law of the case to the law of Minnesota. A substantive response to the amended complaint was filed on February 9, 2017. After the parties fully briefed motions to dismiss the complaint as well as the request for class certification, the Thornhill court ruled on October 10, 2017 that the plaintiff could file a further amended complaint. A Second Amended Complaint was filed on October 13, 2017 supplementing some of the factual allegations and on October 27, 2017 we filed motions to dismiss the complaint and strike the request for class certification. Further, the Court has temporarily stayed discovery in this case in its entirety, other than with respect to plaintiff Thornhill individually, until at least January 10, 2018, pending the outcome of the various motions to dismiss noted above. Walden University and we intend to defend against this case vigorously, including the request to certify a nationwide class.
During 2010, we were notified by the Spanish Taxing Authorities (“STA”) (in this case, by the Regional Inspection Office of the Special Madrid Tax Unit) that an audit of some of our Spanish subsidiaries was being initiated for 2006 and 2007. On June 29, 2012, the STA issued a final assessment to Iniciativas Culturales de España, S.L. (“ICE”), our Spanish holding company, for approximately EUR 11.1 million ($13.1 million at September 30, 2017), including interest, for those two years based on its rejection of the tax deductibility of financial expenses related to certain intercompany acquisitions and the application of the Spanish ETVE regime. On July 25, 2012, we filed a claim with the Regional Economic‑Administrative Court challenging this assessment and, in the same month, we issued a cash‑collateralized letter of credit for the assessment amount, in order to suspend the payment of the tax due. Further, in July 2013, we were notified by the STA (in this case, by the Central Inspection Office for Large Taxpayers) that an audit of ICE was also being initiated for 2008 through 2010. On October 19, 2015, the STA issued a final assessment to ICE for approximately EUR 17.2 million ($20.3 million at September 30, 2017), including interest, for those three years. We have appealed this assessment and, in order to suspend the payment of the tax assessment until the court decision, we issued a cash‑collateralized letter of credit for the assessment amount plus interest and surcharges. We believe the assessments in this case are without merit and intend to defend vigorously against them. During the second quarter of 2016, we were notified by the STA that tax audits of the Spanish subsidiaries were also being initiated for 2011 and 2012; no assessments have yet been issued for these years. Also during the second quarter of 2016, the Regional Administrative Court issued a decision against the Company on its appeal. The Company has further appealed at the Highest Administrative Court level. The Company plans to continue the appeals process for the periods already audited and assessed. During the second quarter of 2017, we were notified by the STA that tax audits of the Spanish subsidiaries for 2011 and 2012 were being extended to include 2013; no assessments have yet been issued for 2013.
In June 2016, Li Shihong and Hunan Lieying Education Investment Management Co Ltd commenced civil proceedings in the Changsha Intermediary Court in the People’s Republic of China against Zhang Jiangbo, Zhang Jianbo, Chin Zhingxian, Hunan New Lieying Science and Education Co Ltd and Hunan International Economics University, our network institution in China (“HIEU”). Zhang Jiangbo, Zhang Jianbo and Chin Zhingxian are the minority shareholders in the HIEU group. The plaintiffs claim that the defendants are liable to pay an amount of RMB 170 million (approximately $25.6 million at September 30, 2017) based on a debt repayment document executed in 2014. The document was signed by the minority shareholders and Hunan New Lieying Science and Education Co Ltd and Zhang Jiangbo, allegedly on behalf of HIEU, in effect as a guarantor and a seal was affixed, allegedly being that of HIEU. The plaintiffs also claim interest and litigation expenses. HIEU has filed a defense and evidence in this matter contending that Zhang Jiangbo was not authorized to execute the document on behalf of HIEU, nor to affix any HIEU seal, and contending further that in any event an education institution is not permitted to guarantee a loan for non-educational purposes. Zhang Jiangbo has admitted to the court that he lacked such authorization. The court has requested that further evidence be submitted. On November 4, 2017, HIEU was informed by the court that the case against it would be dismissed,
71
although no formal judgment has been received. Until it receives the formal judgment of dismissal, HIEU will continue to vigorously defend this case.
72
Item 1A. Risk Factors
Except as set forth below, there have been no material changes in the Risk Factors included in Item 1A of our 2016 Form 10-K, as updated in Item 1A of our Form 10-Q's for the quarters ended March 31, 2017 and June 30, 2017.
Political and regulatory developments in Turkey may materially adversely affect us.
Istanbul Bilgi University (“Bilgi”), a member of the Laureate International Universities network located in Turkey, is established as a Foundation University under the Turkish higher education law, sponsored by the Bilgi Foundation. As such, it is subject to regulation, supervision and inspection by Turkish Higher Education Council (the “YÖK”). In 2014, the Turkish parliament amended the higher education law to provide expanded authority to the YÖK with respect to Foundation Universities, including authorizing additional remedies for violations of the higher education law and of regulations adopted by the YÖK. On November 19, 2015, the YÖK promulgated an “Ordinance Concerned with Amendment to Foundation High Education Institutions” (the “Ordinance”), the principal effects of which relate to the supervision and inspection of Foundation Universities by the YÖK. Under the Ordinance, the YÖK has expanded authority to inspect accounts, transactions, activities and assets of Foundation Universities, as well as their academic units, programs, projects and subjects. The Ordinance establishes a progressive series of five remedies that the YÖK can take in the event it finds a violation of the Ordinance, ranging from (1) a warning and request for correction to (2) the suspension of the Foundation University’s ability to establish new academic units or programs to (3) limiting the number of students the Foundation University can admit, including ceasing new admissions, to (4) provisional suspension of the Foundation University’s license to (5) cancellation of the Foundation University’s license. Since the promulgation of the Ordinance, the YÖK has canceled the licenses of 15 Foundation Universities.
The Ordinance specifies that Foundation Universities cannot be established by foundations in order to gain profit for themselves, and prohibits specified types of fund transfers from Foundation Universities to their sponsoring foundation, with certain exceptions for payments made under contractual arrangements for various goods and services that are provided at or below current market rates. Bilgi has entered into contractual arrangements with a subsidiary of the Company to provide Bilgi with management, operational and student services and certain intellectual property at fair market rates, and certain affiliates of the Company are members of the board of trustees of the Bilgi Foundation. The YÖK conducts annual audits of the operations of Bilgi. If the YÖK were to determine that any of these contracts or the payments made by Bilgi to this Company subsidiary, or any other activities of Bilgi, including the donation of 40.0 million Turkish Liras made by the university to a charitable foundation that was subsequently reimbursed to the university by certain Company‑owned entities, violate the Ordinance or other applicable law, the YÖK could take actions against Bilgi up to and including cancellation of its license.
On April 18, 2017, Bilgi received from the YÖK the results of the most recent annual audit (the “Annual Audit”). The Annual Audit report requires, among other things, that (i) with respect to the 2017-2018 academic year, there be a reduction in the quota for the number of new students permitted to be admitted into Bilgi’s degree programs and (ii) Bilgi be reimbursed, not later than October 18, 2017, approximately $29 million for payments previously made by Bilgi to a subsidiary of the Company for certain management, operational and student services, and intellectual property. The Company and Bilgi believe the charges to Bilgi for these services were at fair value and Bilgi has contested the findings of the Annual Audit that they constituted an improper wealth transfer. Demands also were made in the Annual Audit for the return or payment to Bilgi, by October 18, 2017, of other amounts involving approximately $8 million.
Bilgi exercised its right to appeal this decision to the YÖK to demonstrate the validity and value of the services procured from the Company subsidiary but the YÖK has rejected that appeal. Bilgi has appealed the YÖK’s rejection of its appeal to the Turkish court system and has not been reimbursed for any of the payments made to the Company’s subsidiary for the services described above. As a result, as of October 18, 2017, Bilgi is in non-compliance with certain requirements of the Annual Audit report. As the Company currently consolidates Bilgi under the variable interest entity model, if the Company is unable to provide services under its contracts with Bilgi and receive the economic benefits from those contracts as a result of the determinations in the Annual Audit, deconsolidation of Bilgi could be required. Deconsolidation, if required, could have a material adverse effect on the Company’s business, financial condition and results of operations, including possible write-off of all or a portion of the Company’s investment in Bilgi and a reduction in operating income. At September 30, 2017 and December 31, 2016, Bilgi had total assets of approximately $134 million and $83 million, respectively, and total liabilities of $117 million and $63 million, respectively. Total liabilities include approximately $32 million and $19 million of net intercompany liabilities as of September 30, 2017 and December 31, 2016, respectively. During fiscal year 2016, Bilgi generated approximately $106 million of the Company’s consolidated revenue and approximately $26 million of the Company’s consolidated operating income and incurred approximately $6 million of depreciation and amortization expense.
If the YÖK were to determine that any administrators of Bilgi have directly taken any actions or supported any activities that are intended to harm the integrity of the state, the license of the university could be canceled. In July 2016, a coup attempt increased
73
political instability in Turkey, and the uncertainties arising from the failed coup in Turkey could lead to changes in laws affecting Bilgi or result in modifications to the current interpretations and enforcement of the Ordinance or other laws and regulations by the YÖK. Any such actions by the YÖK, including the actions in relation to the conduct of the Annual Audit and the reimbursement of amounts described above, could have a material adverse impact on Bilgi's future growth or its ability to remain in operation, and could have a material adverse effect on our business, financial condition and results of operations.
Political and regulatory developments in Chile may materially adversely affect us.
As a consequence of student protests and political disturbances during 2011 and 2012, the former Chilean government announced several proposed reforms to the higher education system. The reforms, if they had been adopted, could have included changing the current accreditation system to make it more demanding, revising the student financing system to provide a single financing system for students in all higher education institutions (replacing the CAE Program), establishing a system of information transparency for higher education, creating an agency to promote accountability by higher education institutions, changing certain corporate governance rules for universities (such as the need for a minimum number of independent directors), and establishing procedures for the approval of, or otherwise limiting, transactions between higher education institutions and related parties. Other legislative reforms were promoted by members of the Chilean Congress but were not supported by the previous Chilean government, including proposals to restrict related party transactions between higher education institutions and entities that control them. In November and December 2013, Chile held national elections. The presidential election was won by former president Michelle Bachelet, who assumed office on March 11, 2014, and a political coalition led by Ms. Bachelet won the elections for both houses of the Chilean Congress, in each case for four years beginning on March 11, 2014. Although the election platform of the new government mentioned that stronger regulation of higher education was required, it did not contain specific commitments with respect to the abovementioned reforms, other than the creation of a special agency to oversee higher education institutions’ compliance with law and regulations. In the second quarter of 2014, the new government announced the withdrawal of all of the prior administration’s higher education proposals and its intent to submit new bills to the Chilean Congress.
In April 2016, the Chilean Congress made reforms to specific career disciplines, including pedagogy. Law 20,903 created the teaching professional development system (Sistema de Desarrollo Profesional Docente), which aims to improve the quality of training for those who choose to study pedagogy by setting new program admission requirements and mandatory institutional accreditation standards for pedagogy career programs. For the first enrollment intake of 2017 in the entire sector of private universities in the Chilean market, the new admissions standards caused a roughly 40% reduction in total new enrollment for the covered programs. UNAB, UDLA and UVM Chile, three of our network institutions in Chile, experienced reduced new enrollments in their education programs above the reduction in enrollments in the overall market of private universities. Although such reductions in the first 2017 intake were significant, they did not result in a material negative impact on the projected total new enrollment of our Chilean institutions, and we will have to continue to monitor the situation to take steps to mitigate the effects of the law.
On July 5, 2016, the Chilean President submitted to the Chilean Congress a bill (the “2016 Higher Education Bill”) that was intended to change the entire regulatory landscape of higher education in Chile by, among other things, creating new special government administrative agencies and enhancing the requirements for institutional accreditation of higher education institutions. Following its submission to the Chilean Congress, the 2016 Higher Education Bill was subject to national debate among different constituencies in the higher education system. As a result of these discussions, the Chilean executive branch decided to replace the 2016 Higher Education Bill with a new submission that would take into consideration the main concerns that were raised during those discussions. These discussions identified, among other things, (i) the need to reinforce, improve and enhance the state-owned universities, separating their regulation from the regulation applicable to other educational institutions, (ii) the need to develop special regulations for technical education, (iii) the need to improve regulations concerning the compliance by private universities with the requirement that they not be operated for profit, and (iv) the need to grant universal access to educational institutions.
In furtherance of these goals, on April 7, 2017, the Chilean executive branch submitted to the Chilean Congress a new bill (the “2017 Higher Education Bill”), which entirely supersedes the 2016 Higher Education Bill. The 2017 Higher Education Bill represents a simplified version of the 2016 Higher Education Bill and was based on the same principles and ideas as the earlier bill, as informed by the subsequent national debate on that bill. The 2017 Higher Education Bill considers the higher education system to be a mixed system composed of two subsystems, one for university education (including both state-owned institutions and private universities recognized by the state) and another for technical education (both state-owned technical training centers and private technical training centers and professional institutes).
Among other things, the 2017 Higher Education Bill would create the Undersecretary of Higher Education, who would propose policies on higher education to the Ministry of Education and policies regarding access, inclusion, retention and graduation of higher education students. The Undersecretary of Higher Education would also propose the allocation and management of public funds and manage the procedures relating to the granting and revocation of the official recognition of higher education institutions.
74
The Undersecretary of Higher Education would also generate and coordinate instances of participation and dialogue with and among higher education institutions, promoting the connection between these institutions and the secondary education system.
The 2017 Higher Education Bill also includes new regulations applicable to not‑for‑profit educational institutions that would: (i) provide that their controllers and members can only be individuals, other not‑for‑profits or state‑owned entities; (ii) create the obligation to use their resources and reinvest their surplus or profits in the pursuit of their objectives and in enhancing the quality of the education they provide; (iii) create the obligation to have a board of directors, which cannot delegate its functions, and whose members cannot be removed unless approved by the majority of the board and for serious reasons; and (iv) prohibit related party transactions with their founders, controllers, members of the board, rector and their relatives or related entities, unless the counterparty to the transaction is another not‑for‑profit entity, or if the transaction involves entering into a labor agreement to carry out academic work for the educational institution. The bill provides further that in the event the educational institution enters into a related party transaction consistent with the above, or if such educational institution enters into a related party transaction with a different entity than those described above, such transaction also comply with the following requirements: (i) that it contribute to the best interests of the educational institution and to its mission and purpose; (ii) that the transaction be agreed under market conditions as to the price and general terms and conditions prevailing for such types of transactions; and (iii) that it be approved by a majority of the institution’s board of directors. The 2017 Higher Education Bill also would establish a new criminal felony of incompatible negotiations for those persons who, in their capacity of managing the educational institution’s assets, enter into any transaction with related parties having any personal interest or granting benefits to third parties without complying with the foregoing requirements. Among the sanctions for breaching such regulations, the person may be subject to imprisonment plus a fine of double the amount of the benefit that such person or entity had obtained.
On July 17, 2017, the Chamber of Deputies, which is the lower house of the Chilean Congress, passed the 2017 Higher Education Bill, substantially in the form described above. The 2017 Higher Education Bill has now moved to the Chilean Senate, where it has been referred for consideration by the Senate Education Commission. Members of the Chamber of Deputies have announced that they intend to bring constitutional challenges to 16 provisions of the bill passed by the Chamber of Deputies. If the 2017 Higher Education Bill is passed by the Chilean Senate without resolving the challenged provisions, those provisions would be referred to the Chilean Constitutional Court for resolution prior to the bill taking effect.
We are currently evaluating the effect the proposed 2017 Higher Education Bill would have on the Chilean institutions in the Laureate International Universities network if it is adopted in the form introduced in the Chilean Congress and approved by the Chamber of Deputies. We cannot predict whether or not the proposed 2017 Higher Education Bill will be adopted in this form or if it, or any part of it, will survive constitutional challenge, or if any higher education legislation will be adopted that would affect the institutions in the Laureate International Universities network. However, if any such legislation is adopted, it could have a material adverse effect on our results of operations and financial condition.
As the Company currently consolidates certain of its institutions in Chile under the variable interest entity model, the Company will review such consolidation upon passage of any new higher education bill. Deconsolidation of one or more of our Chilean institutions, if required, could have a material adverse effect on our financial condition and results of operations. At September 30, 2017 and December 31, 2016, the Chilean VIEs had total assets of approximately $806 million and $687 million, respectively, and total liabilities of $186 million and $93 million, respectively. Total assets include approximately $20 million and $11 million of net intercompany assets as of September 30, 2017 and December 31, 2016, respectively, as well as goodwill balances that could be reallocated among the VIE and non-VIE businesses within the Chile reporting unit if deconsolidation of the VIEs were required.
While we believe that all of our institutions in Chile are operating in full compliance with Chilean law, we cannot predict the extent or outcome of any educational reforms that may be implemented in Chile. Depending upon how these reforms are defined and implemented, there could be a material adverse effect on our financial condition and results of operations. Any disruption to our operations in Chile would have a material adverse effect on our financial condition and results of operations. Similar reforms in other countries in which we operate could also have a material adverse effect on our financial condition and results of operations.
Item 2. Unregistered Sales of Equity Securities and Use of Proceeds
Use of Proceeds
On February 6, 2017, we completed our IPO pursuant to a registration statement on Form S-1 (File No. 333-207243), which the SEC declared effective on January 31, 2017, and a registration statement on Form S-1MEF (File No. 333-215845), which became effective on January 31, 2017. We registered a total of 40.25 million shares of our Class A common stock. In our IPO, we issued and sold 35.0 million shares of our Class A common stock to the public at a price of $14.00 per share.
75
As previously disclosed, on March 1, 2017, in accordance with the Note Exchange Agreements, we used a portion of the proceeds from our IPO to redeem Senior Notes due 2019 with an aggregate principal amount of $22.6 million at a repurchase price of 104.625% of the aggregate principal amount for a total payment of $23.6 million, which is consistent with the use of proceeds from our IPO as described in our final prospectus filed with the Securities and Exchange Commission pursuant to Rule 424(b)(4) on February 2, 2017 (Final Prospectus).
As previously disclosed, on May 31, 2017, we used approximately $333 million of the proceeds from our IPO, together with proceeds from the refinancing of our credit facility, to redeem our outstanding Senior Notes due 2019 (other than the Exchanged Notes). The aggregate principal amount outstanding of the Senior Notes due 2019 (excluding the Exchanged Notes) was $1,125.4 million. The redemption price for the Senior Notes due 2019 was equal to 104.625% of the principal amount thereof, plus accrued and unpaid interest and special interest to the redemption date, for an aggregate payment to holders of the Senior Notes of approximately $1,205.6 million. Of this approximately $1,205.6 million, approximately $64.8 million in the aggregate was paid to Douglas L. Becker, our Chairman and CEO, and R. Christopher Hoehn-Saric, an affiliate of the Company, as holders of redeemed Senior Notes due 2019.
On September 12, 2017, we used the remaining proceeds from our IPO, together with cash from operations, to repay the seller notes that were used to partially finance the acquisition of the FMU group. The total payment, including interest, was approximately $114.6 million.
This is consistent with the use of proceeds from our IPO as described in our Final Prospectus.
Item 6. Exhibits
(a) Exhibits filed with this report or, where indicated, previously filed and incorporated by reference:
Exhibit No. | Exhibit Description | Form | File Number | Exhibit Number | Filing Date |
2.5# | S‑1/A | 333‑207243 | 2.5 | 05/20/2016 | |
2.6# | S‑1/A | 333‑207243 | 2.6 | 05/20/2016 | |
3.1 | S‑1/A | 333‑207243 | 3.1 | 01/31/2017 | |
3.2 | S‑1/A | 333‑207243 | 3.2 | 01/31/2017 | |
3.3 | S‑1/A | 333‑207243 | 3.3 | 12/15/2016 | |
4.6 | 8-K | 001-38002 | 4.1 | 04/27/2017 | |
4.7 | 8-K | 001-38002 | 4.1 | 04/27/2017 | |
4.8 | 8-K | 001-38002 | 4.3 | 04/27/2017 | |
4.9 | 8-K | 001-38002 | 4.3 | 04/27/2017 | |
10.1† | S‑1/A | 333‑207243 | 10.31 | 11/20/2015 | |
10.2† | S‑1/A | 333‑207243 | 10.32 | 11/20/2015 | |
10.3† | S‑1/A | 333‑207243 | 10.34 | 11/20/2015 | |
10.4† | S‑1/A | 333‑207243 | 10.35 | 11/20/2015 | |
10.5† | S‑1/A | 333‑207243 | 10.36 | 11/20/2015 | |
10.6† | S‑1/A | 333‑207243 | 10.38 | 12/23/2015 | |
10.7† | S‑4/A | 333‑208758 | 10.37 | 01/20/2016 | |
10.8† | S‑1/A | 333‑207243 | 10.39 | 11/20/2015 | |
10.9† | S‑1/A | 333‑207243 | 10.40 | 11/20/2015 | |
10.10† | S‑1/A | 333‑207243 | 10.41 | 11/20/2015 | |
10.11† | S‑1/A | 333‑207243 | 10.42 | 11/20/2015 | |
10.12† | S‑1/A | 333‑207243 | 10.43 | 11/20/2015 | |
10.13 | S‑1/A | 333‑207243 | 10.44 | 11/20/2015 | |
77
Exhibit No. | Exhibit Description | Form | File Number | Exhibit Number | Filing Date |
10.14 | S‑1/A | 333‑207243 | 10.45 | 11/20/2015 | |
10.15‡ | S‑1/A | 333‑207243 | 10.46 | 11/20/2015 | |
10.16† | S‑1/A | 333‑207243 | 10.47 | 11/20/2015 | |
10.17† | S‑1/A | 333‑207243 | 10.48 | 11/20/2015 | |
10.18† | S‑1/A | 333‑207243 | 10.49 | 11/20/2015 | |
10.19† | S‑1/A | 333‑207243 | 10.50 | 11/20/2015 | |
10.20 | S‑1/A | 333‑207243 | 10.53 | 05/20/2016 | |
10.21† | S‑1/A | 333‑207243 | 10.54 | 05/20/2016 | |
10.22† | S‑1/A | 333‑207243 | 10.55 | 05/20/2016 | |
10.23† | S‑1/A | 333‑207243 | 10.56 | 05/20/2016 | |
10.24† | S‑1/A | 333‑207243 | 10.57 | 05/20/2016 | |
10.25† | S‑1/A | 333‑207243 | 10.58 | 05/20/2016 | |
10.26† | S‑1/A | 333‑207243 | 10.59 | 05/20/2016 | |
10.27† | S‑1/A | 333‑207243 | 10.60 | 05/20/2016 | |
10.28 | S‑1/A | 333‑207243 | 10.63 | 12/15/2016 | |
10.29 | S‑1/A | 333‑207243 | 10.64 | 12/15/2016 | |
10.30 | S‑1/A | 333‑207243 | 10.65 | 12/15/2016 | |
10.31† | S‑1/A | 333‑207243 | 10.68 | 01/10/2017 | |
10.32 | S‑1/A | 333‑207243 | 10.69 | 01/10/2017 | |
10.33† | S‑1/A | 333‑207243 | 10.70 | 01/10/2017 | |
10.34† | S‑1/A | 333‑207243 | 10.71 | 01/10/2017 | |
10.35† | S‑1/A | 333‑207243 | 10.72 | 01/10/2017 | |
10.36† | S‑1/A | 333‑207243 | 10.73 | 01/10/2017 | |
78
Exhibit No. | Exhibit Description | Form | File Number | Exhibit Number | Filing Date |
10.37 | 8‑K | 001‑38002 | 10.1 | 02/06/2017 | |
10.38 | 8‑K | 001‑38002 | 10.2 | 02/06/2017 | |
10.39† | 10-K | 001-38002 | 10.76 | 03/29/2017 | |
10.40† | 8-K | 001-38002 | 10.3 | 02/06/2017 | |
10.41† | 8-K | 001-38002 | 10.4 | 02/06/2017 | |
10.42 | 8-K | 001-38002 | 10.1 | 04/27/2017 | |
10.43† | 10-Q | 001-38002 | 10.80 | 05/11/2017 | |
10.44 | 10-Q | 001-38002 | 10.81 | 05/11/2017 | |
10.45 | 10-Q | 001-38002 | 10.82 | 05/11/2017 | |
10.46 | 10-Q | 001-38002 | 10.83 | 05/11/2017 | |
10.47 | 10-Q | 001-38002 | 10.84 | 05/11/2017 | |
10.48 | 10-Q | 001-38002 | 10.85 | 05/11/2017 | |
10.49 | 10-Q | 001-38002 | 10.86 | 05/11/2017 | |
10.50† | 8-K | 001-38002 | 10.1 | 06/20/2017 | |
10.51† | 10-Q | 001-38002 | 10.51 | 08/08/2017 | |
10.52† | 10-Q | 001-38002 | 10.52 | 08/08/2017 | |
10.53† | 10-Q | 001-38002 | 10.53 | 08/08/2017 | |
10.54† | 10-Q | 001-38002 | 10.54 | 08/08/2017 | |
10.55† | 10-Q | 001-38002 | 10.55 | 08/08/2017 | |
79
Exhibit No. | Exhibit Description | Form | File Number | Exhibit Number | Filing Date |
10.56† | 10-Q | 001-38002 | 10.56 | 08/08/2017 | |
10.57† | 10-Q | 001-38002 | 10.57 | 08/08/2017 | |
10.58† | 10-Q | 001-38002 | 10.58 | 08/08/2017 | |
10.59† | 10-Q | 001-38002 | 10.59 | 08/08/2017 | |
10.60† | 10-Q | 001-38002 | 10.60 | 08/08/2017 | |
10.61*† | Employment Offer Letter, dated August 15, 2017, between Laureate Education, Inc. and Victoria Silbey | ||||
10.62*† | |||||
10.63*† | |||||
10.64*† | |||||
10.65*† | |||||
21.1* | |||||
31.1* | |||||
31.2* | |||||
32* | |||||
Ex. 101.INS* | XBRL Instance Document | ||||
Ex. 101.SCH* | XBRL Taxonomy Extension Schema Document | ||||
Ex. 101.CAL* | XBRL Taxonomy Extension Calculation Linkbase Document | ||||
Ex. 101.LAB* | XBRL Taxonomy Extension Label Linkbase Document | ||||
Ex. 101.PRE* | XBRL Taxonomy Extension Presentation Linkbase Document | ||||
Ex. 101.DEF* | XBRL Taxonomy Extension Definition Linkbase Document | ||||
* | Filed herewith. | ||||
# | Laureate Education, Inc. hereby undertakes to furnish supplementally a copy of any omitted schedule or exhibit to such agreement to the U.S. Securities and Exchange Commission upon request. | ||||
† | Indicates a management contract or compensatory plan or arrangement. | ||||
‡ | Confidential treatment has been granted with respect to certain portions of this exhibit. Omitted portions have been filed separately with the U.S. Securities and Exchange Commission. | ||||
80
SIGNATURES
Pursuant to the requirements of the Securities Exchange Act of 1934, the Registrant has duly caused this report to be signed on its behalf by the undersigned, thereunto duly authorized, on November 8, 2017.
/s/ EILIF SERCK-HANSSEN
Eilif Serck-Hanssen
President, Chief Financial Officer and Chief
Administrative Officer
/s/ TAL DARMON
Tal Darmon
Senior Vice President, Chief Accounting Officer
and Global Controller
81