Attached files
| file | filename |
|---|---|
| EX-32 - EX-32 - EVO Payments, Inc. | evop-20191231xex32.htm |
| EX-31.2 - EX-31.2 - EVO Payments, Inc. | evop-20191231ex312fe7b99.htm |
| EX-31.1 - EX-31.1 - EVO Payments, Inc. | evop-20191231ex31100dfe5.htm |
| EX-23.1 - EX-23.1 - EVO Payments, Inc. | evop-20191231ex231332e86.htm |
| EX-21.1 - EX-21.1 - EVO Payments, Inc. | evop-20191231ex211e22fa8.htm |
| EX-10.34 - EX-10.34 - EVO Payments, Inc. | evop-20191231ex1034e7dea.htm |
| EX-10.33 - EX-10.33 - EVO Payments, Inc. | evop-20191231ex1033820ee.htm |
| EX-10.32 - EX-10.32 - EVO Payments, Inc. | evop-20191231ex1032ee6e4.htm |
| EX-4.2 - EX-4.2 - EVO Payments, Inc. | evop-20191231ex42fdb3b1a.htm |
UNITED STATES
SECURITIES AND EXCHANGE COMMISSION
Washington, D.C. 20549
FORM 10-K
☒ ANNUAL REPORT PURSUANT TO SECTION 13 OR 15(d) OF THE SECURITIES EXCHANGE ACT OF 1934
For the fiscal year ended December 31, 2019
or
☐ TRANSITION REPORT PURSUANT TO SECTION 13 OR 15(d) OF THE SECURITIES EXCHANGE ACT OF 1934
For the transition period from to
Commission file number: 001-38504
EVO Payments, Inc.
(Exact Name of Registrant as Specified in Its Charter)
|
Delaware |
|
82-1304484 |
|
State or Other Jurisdiction of Incorporation or Organization |
|
I.R.S. Employer Identification No. |
|
Ten Glenlake Parkway |
|
30328 |
|
Address of Principal Executive Offices |
|
Zip Code |
(516) 479-9000
Registrant’s telephone number, including area code
Securities registered pursuant to Section 12(b) of the Act:
|
Title of each class |
Trading Symbol(s) |
Name of each exchange on which registered |
|
Class A common stock, par value $0.0001 per share |
EVOP |
Nasdaq Global Market |
Securities registered pursuant to Section 12(g) of the Act: None
Indicate by check mark if the registrant is a well-known seasoned issuer, as defined in Rule 405 of the Securities Act. Yes ☒ No ☐
Indicate by check mark if the registrant is not required to file reports pursuant to Section 13 or 15(d) of the Act. Yes ☐ No ☒
Indicate by check mark whether the registrant (1) has filed all reports required to be filed by Section 13 or 15(d) of the Securities Exchange Act of 1934 during the preceding 12 months (or for such shorter period that the registrant was required to file such reports), and (2) has been subject to such filing requirements for the past 90 days. Yes ☒ No ☐
Indicate by check mark whether the registrant has submitted electronically every Interactive Data File required to be submitted pursuant to Rule 405 of Regulation S-T (§ 232.405 of this chapter) during the preceding 12 months (or for such shorter period that the registrant was required to submit such files). Yes ☒ No ☐
Indicate by check mark whether the registrant is a large accelerated filer, an accelerated filer, a non-accelerated filer, smaller reporting company, or an emerging growth company. See the definitions of “large accelerated filer,” “accelerated filer,” “smaller reporting company,” and “emerging growth company” in Rule 12b-2 of the Exchange Act.
|
Large accelerated filer ☒ |
Accelerated filer ☐ |
|
|
|
|
Non-accelerated filer ☐ |
Smaller reporting company ☐ |
|
|
|
|
Emerging growth company ☐ |
|
If an emerging growth company, indicate by check mark if the registrant has elected not to use the extended transition period for complying with any new or revised financial accounting standards provided pursuant to Section 13(a) of the Exchange Act. ☐
Indicate by check mark whether the registrant is a shell company (as defined in Rule 12b-2 of the Act). Yes ☐ No ☒
The aggregate market value of the registrant’s Class A common stock held by non-affiliates, based on the closing sale price as reported on the Nasdaq Global Market system on June 28, 2019, the last business day of the registrant’s most recently completed second fiscal quarter, was approximately $996,368,085. As of February 17, 2020, there were 41,253,100 shares of the registrant’s Class A common stock, par value $0.0001 per share, issued and outstanding, 34,163,538 shares of the registrant’s Class B common stock, par value $0.0001 per share, issued and outstanding, 2,317,955 shares of the registrant’s Class C common stock, par value $0.0001 per share, issued and outstanding, and 4,339,978 shares of the registrant’s Class D common stock, par value $0.0001 per share, issued and outstanding.
DOCUMENTS INCORPORATED BY REFERENCE:
Specifically identified portions of the registrant’s proxy statement for the 2020 annual meeting of stockholders, which will be filed no later than 120 days after the close of the registrant’s fiscal year ended December 31, 2019, are incorporated by reference into Part III of this report.
EVO PAYMENTS, INC. AND SUBSIDIARIES
2
CAUTIONARY NOTE REGARDING FORWARD-LOOKING STATEMENTS
This Annual Report on Form 10-K contains statements about future events and expectations that constitute forward-looking statements. We intend such forward-looking statements to be covered by the safe harbor provisions for forward-looking statements contained in Section 27A of the Securities Act of 1933 and Section 21E of the Securities Exchange Act of 1934. Forward-looking statements are based on our current beliefs, assumptions, estimates, and expectations, taking into account the information currently available to us, and are not guarantees of future results or performance. None of the forward-looking statements in this Annual Report on Form 10-K are statements of historical fact. Forward-looking statements involve risks and uncertainties that may cause our actual results to differ materially from the expectations of future results we express or imply in any forward-looking statements, and you should not place undue reliance on such statements. Factors that could contribute to these differences include the following: (1) our ability to anticipate and respond to changing industry trends and the needs and preferences of our customers and consumers; (2) the impact of substantial and increasingly intense competition; (3) the impact of changes in the competitive landscape, including disintermediation from other participants in the payments chain; (4) the effects of global economic, political, and other conditions; (5) our compliance with governmental regulations and other legal obligations, particularly related to privacy, data protection, information security, and consumer protection laws; (6) our ability to protect our systems and data from continually evolving cybersecurity risks or other technological risks; (7) failures in our processing systems, software defects, computer viruses, and development delays; (8) degradation of the quality of the products and services we offer, including support services; (9) risks associated with our ability to successfully complete, integrate and realize the expected benefits of acquisitions; (10) continued consolidation in the banking and payment services industries, including the impact of the combination of Banco Popular and Grupo Santander and the related bank branch consolidation; (11) increased customer, referral partner, or sales partner attrition; (12) the incurrence of chargebacks; (13) failure to maintain or collect reimbursements; (14) fraud by merchants or others; (15) the failure of our third-party vendors to fulfill their obligations; (16) failure to maintain merchant and sales relationships or financial institution alliances; (17) ineffective risk management policies and procedures; (18) our inability to retain smaller-sized merchants and the impact of economic fluctuations on such merchants, (19) damage to our reputation, or the reputation of our partners; (20) seasonality and volatility; (21) our inability to recruit, retain and develop qualified personnel; (22) geopolitical and other risks associated with our operations outside of the United States; (23) any decline in the use of cards as a payment mechanism or other adverse developments with respect to the card industry in general; (24) increases in card network fees; (25) failure to comply with card networks requirements; (26) a requirement to purchase our eService subsidiary in Poland; (27) changes in foreign currency exchange rates; (28) future impairment charges; (29) risks relating to our indebtedness, including our ability to raise additional capital to fund our operations on economized terms or at all and exposure to interest rate risks; (30) changes to, or the potential phasing out of, LIBOR and the transition to other benchmarks; (31) restrictions imposed by our credit facilities and outstanding indebtedness; (32) participation in accelerated funding programs; (33) failure to enforce and protect our intellectual property rights; (34) failure to comply with, or changes in, laws, regulations and enforcement activities, including those relating to corruption, anti-money laundering, data privacy, and financial institutions; (35) impact of new or revised tax regulations; (36) legal proceedings; (37) our dependence on distributions from EVO, LLC (as defined in “Basis of Presentation”) to pay our taxes and expenses, including certain payments to the Continuing LLC Owners (as defined in “Basis of Presentation”) and, in the event that any tax benefits are disallowed, our inability to be reimbursed for payments made to the Continuing LLC Owners; (38) our organizational structure, including benefits available to the Continuing LLC Owners that are not available to holders of our Class A common stock to the same extent; (39) the risk that we could be deemed an investment company under the 1940 Act (as defined in Item 1A “Risk Factors”); (40) the significant influence the Continuing LLC Owners continue to have over us, including control over decisions that require the approval of stockholders; (41) certain provisions of Delaware law and antitakeover provisions in our organizational documents could delay or prevent a change of control; (42) certain provisions in our organizational documents, including those that provide Delaware as the exclusive forum for litigation matters and that renounce the doctrine of corporate opportunity; (43) our ability to establish and maintain effective internal control over financial reporting and disclosure controls and procedures; (44) changes in our stock price, including relating to downgrades, analyst reports, and future sales by us or by existing stockholders; and (45) the other risks and uncertainties listed under “Risk Factors” contained in Part I of this Annual Report on Form 10-K.
Words such as “anticipates,” “believes,” “continues,” “estimates,” “expects,” “goal,” “objectives,” “intends,” “may,” “opportunity,” “plans,” “potential,” “near-term,” “long-term,” “projections,” “assumptions,” “projects,” “guidance,” “forecasts,” “outlook,” “target,” “trends,” “should,” “could,” “would,” “will” and similar expressions are intended to identify such forward-looking statements. We qualify any forward-looking statements entirely by the cautionary factors listed above, among others. Other risks, uncertainties and factors, not listed above, could also cause our actual results to differ materially from those projected in any forward-looking statements we make. We assume no obligation to update or revise these forward-looking statements for any reason, even if new information becomes available in the future.
3
As used in this Annual Report on Form 10-K, unless the context otherwise requires, references to:
|
· |
“EVO,” “we,” “us,” “our,” the “Company” and similar references refer (1) on or prior to the completion of the Reorganization Transactions, including our initial public offering, to EVO, LLC and, unless otherwise stated, all of its direct and indirect subsidiaries, and (2) following the consummation of the Reorganization Transactions, including our initial public offering, to EVO, Inc., and, unless otherwise stated, all of its direct and indirect subsidiaries, including EVO, LLC. |
|
· |
“EVO, Inc.” refers to EVO Payments, Inc., a Delaware corporation, and, unless otherwise stated, all of its direct and indirect subsidiaries. |
|
· |
“EVO, LLC” refers to EVO Investco, LLC, a Delaware limited liability company, and, unless otherwise stated, all of its direct and indirect subsidiaries. |
|
· |
“Continuing LLC Owners” refers collectively to the holders of our Class B common stock, Class C common stock and Class D common stock immediately following our initial public offering, which includes Blueapple, MDP, our executive officers and certain of our current and former employees. |
|
· |
“EVO LLC Agreement” refers to the second amended and restated limited liability company agreement, dated as of May 22, 2018, by and between EVO, LLC and the Continuing LLC Owners. |
|
· |
“LLC Interests” refers to the single class of common membership interests of EVO, LLC. |
|
· |
“Blueapple” refers to Blueapple, Inc., a Delaware S corporation, which is controlled by entities affiliated with our founder and Chairman of our board of directors, Rafik R. Sidhom. |
|
· |
“MDP” refers to entities controlled by Madison Dearborn Partners, LLC. |
|
· |
“markets” refers to countries and territories where we are authorized by card networks to acquire transactions. For purposes of determining our markets, territories refers to non-sovereign geographic areas that fall under the authority of another government. As an example, we consider Gibraltar (a territory of the United Kingdom) and the United Kingdom to be two distinct markets as our licensing agreements with the card networks gives us the ability to acquire transactions in both markets. |
|
· |
“merchant” refers to an organization that accepts electronic payments, including for-profit, not-for-profit and governmental entities. |
|
· |
“Reorganization Transactions” refers to the series of reorganization transactions described herein that were undertaken in connection with our initial public offering to implement our “Up-C” capital structure. |
|
· |
“transactions processed” refers to the number of transactions we processed during any given period of time and is a meaningful indicator of our business and financial performance, as a significant portion of our revenue is driven by the number of transactions we process. In addition, transactions processed provides a valuable measure of the level of economic activity across our merchant base. In our Americas segment, transactions include acquired Visa and Mastercard credit and signature debit, American Express, Discover, UnionPay, PIN-debit, electronic benefit transactions, and gift card transactions. In our Europe segment, transactions include acquired Visa and Mastercard credit and signature debit, other card network merchant acquiring transactions, and ATM transactions. |
4
Our business
Founded in 1989, we are a global merchant acquirer and payment processor servicing more than 550,000 merchants and processing more than 3.6 billion transactions annually. We operate at the center of global electronic commerce with local operations in 11 countries and the ability to serve over 50 markets around the world. We differentiate ourselves from our competitors through (1) a highly productive and scaled sales distribution network, including exclusive global financial institution and Tech-enabled referral partnerships, (2) our three proprietary, in-house processing platforms that are connected by a single point of integration, and (3) a comprehensive suite of payment and commerce solutions, including integrated and business-to-business (“B2B”) solutions. We believe these points of differentiation allow us to deliver strong organic growth, increase market share, and attract additional relationships with financial institutions, technology companies, and other strategic partners.
We are focused on delivering products and services that provide the most value and convenience to our merchants. Our payment and commerce solutions consist of our own products as well as services that we enable through technical integrations with third-party providers. Our value-added solutions include gateway solutions, online fraud prevention and management reporting, online hosted payments page capabilities, cellphone-based SMS integrated payment collection services, security tokenization and encryption solutions at the point-of-sale (“POS”), dynamic currency conversion (“DCC”), loyalty offers, and other ancillary solutions. We offer processing capabilities tailored to specific industries and provide merchants with recurring billing, multi-currency authorization and settlement, and cross-border processing. Our global footprint and ease of integration consistently attract new partner relationships, allowing us to develop a robust integrated solutions partner network and uniquely positioning us to stay ahead of major trends in each of our markets.
We operate three proprietary, in-house processing platforms, all connected via our EVO Snap solution and each supporting a different geographic region. EVO Snap provides a technical connection to our regional processing systems and a central point of integration for all third-party product partners. Importantly, our platforms allow us to address the specific needs of specific payment markets and to control the entire customer experience. In-house processing also allows us to directly address merchant and regulatory concerns regarding the flow of cardholder data and other sensitive information. Our systems also provide scale efficiencies which minimize our variable costs as merchant counts and transaction volumes increase.
As an intermediary between merchants and card networks, we collect a series of fees primarily driven by the number, type, and value of transactions processed. These merchant service fees are then split into three components: (1) fees remitted to the financial institution that issued the card (interchange), (2) fees remitted to the card networks, and (3) fees retained by EVO. The allocation of these three components vary greatly based on a number of factors, including merchant size, merchant industry, merchant location, type of card, and type of transaction (in-person, eCommerce, manual entry). In addition, we generate fees for value-added services and more advanced technology solutions that we increasingly provide to our merchants.
Our segments
We classify our business into two segments: the Americas and Europe. In prior periods, the Americas segment was referred to as our North America segment. The alignment of our segments is designed to establish lines of business that support the various geographical markets we operate in and allow us to further globalize our solutions while working seamlessly with our teams across these markets. Both segments provide businesses with merchant acquiring solutions, including integrated solutions for retail transactions at physical business locations, as well as eCommerce and mobile transactions. These also represent the operating segments used by our Chief Executive Officer for evaluation our performance and allocating resources. Refer to Note 19, “Segment Information,” in the Notes to the Consolidated Financial Statements for financial data pertaining to our segments.
5
In 2019, our Americas segment, which includes our operations in the United States, Canada and Mexico, processed more than 1 billion transactions and represented 63% of total revenue for the year ended December 31, 2019. We believe the changing trends in payment technologies, including the adoption of more integrated and B2B payment solutions and the ongoing cash-to-card conversion will continue to drive growth in these markets.
In 2019, our Europe segment, which includes our operations in the Czech Republic, Germany, Ireland, Poland, Spain, and the United Kingdom, as well as supporting merchants in France, Austria, Italy, the Nordics, and other Central and Eastern European countries, processed over 2.5 billion transactions. Our European revenue represented 37% of total revenue for the year ended December 31, 2019.
We experience seasonal fluctuations in our revenue, which can vary by region. In both the Americas and Europe, our revenue has been strongest in our fourth quarter and weakest in our first quarter.
Our sales and distribution network
Within each segment, we have developed a network of highly successful sales distribution channels to drive growth of our merchant portfolio. Through our diverse channels, we target merchants across a wide variety of industries and sizes. A central component of our growth strategy is our strategic investment in new products and distribution channels and the seamless introduction of these assets to our global markets. These proven sales distribution networks consist of our Tech-enabled division, which includes our integrated, B2B and eCommerce businesses, as well as our Direct and Traditional divisions.
Tech-enabled
In both our segments, our Tech-enabled division is supported by partnerships with independent software vendors (“ISVs”), integrated software dealers, and eCommerce gateway providers. In the United States, our Tech-enabled division also supports business-to-business customers via proprietary solutions sold directly to merchants and via enterprise resource planning (“ERP”) software dealers or integrators. These partnerships function by way of a technical integration between us and the third party in which the third party seamlessly passes information to our systems to streamline the merchant boarding process. We have emerged as a preferred partner for these third-party referral partners because of the ease of integration through our proprietary solutions, high merchant satisfaction levels driven by the quality of our service, the ease and speed of our boarding systems for new merchants, and our consistent and transparent approach to risk and underwriting. Through our B2B offering, we provide integration solutions to ERP software to enable companies utilizing this software to accept card payments from its customers.
Our network of over 1,500 integrated partnerships allows us to target small and medium sized enterprises (“SMEs”) who desire an integrated software solution for their physical locations. We also target larger B2B merchants with our differentiated product offerings including payments integration to top-tier and industry-specific ERP systems. Our Tech-enabled division represents approximately 38% of our Americas revenue and approximately 22% of our European revenue for the year ended December 31, 2019.
Over the past several years, we have invested in an infrastructure that allows integrated software providers to offer multiple integrated payment solutions to merchants throughout the markets we serve. For example, software developers can access a simple yet powerful connection point through our EVO Snap platform allowing them to fully leverage their integrated solutions by connecting to all of our processing platforms—thereby expanding their reach to include merchants in all of our geographic markets.
Through our acquisition of Sterling Payment Technologies, LLC (“Sterling”) in 2017, we acquired a portfolio of existing integrated software merchants and hundreds of integrated software and dealer partners in the United States. In October 2018, we acquired ClearONE, a leading POS payments platform integrated to over one hundred software solutions serving more than 10,000 merchants across Europe. In 2019, we continued to expand our Tech-enabled capabilities by acquiring Way2Pay, a European integrated payments gateway focused on schools and clubs, and SF Systems, a Mexican integrated solutions company for large and small merchants.
6
Our Tech-enabled capabilities also include our B2B offering, which allows us to target larger merchants operating in this space. We believe that B2B merchants are increasingly striving to eliminate paper invoices from receivable collections. By using our proprietary processing platforms, we can offer various interchange management and reporting solutions specially created for these larger merchants.
In May 2018, we acquired Nodus Technologies, Inc. (“Nodus”) which develops proprietary integrations to ERP solutions such as Microsoft AX and Microsoft Great Plains. The Nodus acquisition enables our merchants to seamlessly integrate payment solutions into third party ERP solutions by leveraging existing Nodus technologies. In September 2019, we acquired Delego, which offers proprietary integrations to SAP solutions. As a result of these strategic acquisitions and internal development, we are able to offer a broad suite of B2B payment solutions for companies utilizing Microsoft, Oracle, and SAP solutions.
Our domestic and multinational gateway partners refer merchants to us and often board merchants utilizing our eCommerce boarding tool. Our eCommerce tools have been successfully deployed in our European operations, and we expect this business to continue to grow as it is deployed across international markets, especially as those markets experience further penetration and growth in eCommerce transactions. We are able to deploy our proprietary eCommerce gateway solution through our various sales channels to reach a diverse base of multi-channel, integrated, and eCommerce-only merchants throughout our global footprint.
Direct
Our business is also supported by our Direct division, which includes our referral relationships with fourteen leading financial institutions, many of which operate under long-term and exclusive contractual arrangements. In the aggregate, these banks represent thousands of branch locations which actively refer merchant customers to us for payment processing solutions. These financial institutions often provide us with access to their brands, significantly enhancing our credibility and recognition.
We maintain referral partnerships with a number of leading financial institutions, including Deutsche Bank USA, Deutsche Bank Group, Grupo Santander, PKO Bank Polski, Bank of Ireland, Raiffeisenbank, Moneta, Citibanamex, Sabadell, and Liberbank, among others. In several markets, we operate with more than one financial institution partner.
Our Direct division also includes our extensive direct sales capabilities and relationships. We have a long history of operating as a direct sales organization and have succeeded by aggressively pursuing customers through our direct sales efforts and retaining merchants by delivering high levels of customer satisfaction. We view our direct sales force as complementary to our financial institution relationships, as our direct sales force generates new merchant opportunities in addition to the referrals we receive from our various partners. In addition, our financial institution partners benefit from our direct sales force network, as we regularly refer new banking business to them when we successfully recruit merchants though this network.
Our direct sales capabilities have also proven beneficial in the support of our integration solutions products. We offer our sales distribution capabilities to our Tech-enabled partners, extending their sales reach by actively recruiting merchants on their behalf as well as cross-selling their services to our customer base. As we have expanded internationally, we have exported our direct sales expertise and capabilities into all of the markets in which we operate, using tools and sales practices developed over the years in the United States.
A key component of our Direct division is our highly customized lead management, merchant boarding, and risk management software tools. This technology allows us to quickly and efficiently accept leads from sales representatives and bank partners, board merchants online, and manage transaction risks. In both the financial institution referral model and the direct sales model, we build and maintain a direct relationship with our merchants in order to control our sales, price negotiation, underwriting, boarding, and support processes.
7
In our Direct division, we target SME merchants via our direct sales force and referrals from our financial institution and other partners. We also target large merchants through a coordinated sales approach with our financial institution partners. Our Direct division is our largest division as the Mexico and Europe markets are dominated by referrals from our financial institution partners. This division represents approximately 51% of our segment revenue in the Americas and 78% in Europe for the year ended December 31, 2019.
Traditional
Our Traditional division is our heritage United States portfolio comprised primarily of relationships with independent feet-on-the-street agents, independent sales organizations (“ISOs”), and other partners. These partners allow us to penetrate niche segments, verticals, geographies or selected strategic markets and broaden our merchant base without incremental investment obligations. While most of our relationships are commercial partnerships, in select situations we have retained an equity stake in a partner. Historically, we invested in ISOs and received controlling or non-controlling interests in the companies in exchange for a processing relationship with the ISOs. While this division is very profitable, the independent sales group and agents are no longer active with the Company, and as such, we expect this business to decline over time. This division represents approximately 11% of our segment revenue in the Americas for the year ended December 31, 2019.
Our competitive strengths
Global footprint enables us to serve clients around the world
We have operations in 11 countries and the ability to service merchants in more than 50 markets around the world. Our customers include large national and multi-national corporations as well as SMEs spanning across most industry verticals. Our global merchant footprint is diversified among retail, restaurants, petroleum, government, transit, and telecom industries, among others.
We have established sales channels and relationships in large developed economies, such as the United States, Canada, and certain countries in Western Europe, where the penetration of electronic payments is mature. In addition, we have investments and partnerships in fast-growing developing and emerging markets with lower penetration rates of electronic payments, such as Mexico and Central and Eastern Europe.
We believe our global footprint is a significant competitive advantage as we compete for large, multi-national clients as well as ISVs, integrated software and ERP dealers, and other partners. Large, multi-national merchants choose us because we can act as a single acquirer and processor in the markets in which they operate. Additionally, because of our global footprint, our referral partners can reach new markets by leveraging their connection with us to access our global processing services.
Due to our broad distribution, diversified product offering, leading integrated solutions, and client service, we are able to build strong relationships with our merchants and referral partners. These merchants rely on our “one stop” product offerings, including our payment processing, on-boarding, underwriting, technical support, secure infrastructure, and settlement services, and our technology is often heavily embedded in our merchants’ infrastructure.
Strategic distribution partnerships with financial institutions and Tech-enabled referral partners
Across Europe and Mexico, our exclusive financial institution distribution relationships represent thousands of bank branches, including retail and corporate banking locations. We are highly selective in identifying optimal distribution partners, and we seek to align ourselves with financial institutions that have strong networks, a high-quality client portfolio, and a trusted brand name. After forming these relationships, we introduce our sales and technology capabilities to the local market, identify new merchant recruitment opportunities, and strengthen our relationships with existing merchant clients. We have experienced significant success in our financial institution alliances in attracting new customers on behalf of our bank partners. By providing high quality, focused services to merchants, we enhance the goodwill between our financial institution partners and their merchants which can, in turn, curb attrition. We have demonstrated success in integrating and
8
cross-selling our services to this expanded merchant base as well as generating new banking customers for our partners through our direct sales strategies.
We have also established deep relationships with a large network of Tech-enabled referral partners including ISVs, integrated software dealers, ERP dealers and integrators, eCommerce providers, and other membership or distribution partners that wish to offer payment processing services to their merchant customers. We believe our expertise in serving Tech-enabled referral partners is differentiated and enabled by our three proprietary, in-house processing platforms and service-oriented culture. Through a single, easy integration point, partners gain access to our global processing platform and solutions. Furthermore, our commitment to customer service drives high merchant satisfaction levels and has established our strong reputation as a reliable and trusted partner around the world. In the B2B market, our integrations to ERP systems enables us to provide B2B solutions through a network of ERP system implementers, resellers, and buying groups. We believe our expertise in serving Tech-enabled distribution partners is a competitive advantage and will position us for continued growth.
Comprehensive suite of payment and commerce solutions
We are focused on delivering the products and services that provide optimal value and convenience to our merchants. As such, we continuously survey the competitive landscape and our merchants and leverage our experience in markets throughout the world to develop products, services, pricing, promotions, and partnering strategies for each region that we believe best suits the current and future needs of each market. Our wide-ranging experience serving multi-national merchants in markets around the world, as well as our close relationships with large merchants and various card networks, including Visa, Mastercard, American Express, Discover, UnionPay, and other card networks, uniquely position us to stay ahead of major trends in each of our markets.
We offer a broad portfolio of products, services, and pricing solutions with functionality that appeals to a broad range of merchants and that are specifically designed for particular vertical markets. Our extensive product offerings enable us to provide multiple solutions to each of our merchants, allowing our merchants to tailor our offerings to their needs.
In addition, because we operate in markets around the world and have a global perspective, we are able to export our strategies and solutions from one market into another. Specifically, EVO Snap provides a technical connection to our proprietary processing systems and a single point of integration for technology partners and merchants across all our markets and geographies. We believe this capability differentiates us from our competitors.
Leading technology and security
As the rate of innovation has increased dramatically, providing payment and commerce solutions to merchants of all types has become increasingly dependent upon a strong foundation of secure and flexible technology. We have designed our technology infrastructure with a singular focus in mind — to provide the products and services our merchants want in the most secure, efficient, and effective manner possible. Underpinning this focus is a worldwide team of professionals from multiple disciplines, dedicated to continuously improving our service levels while expanding our offerings to merchants across the various regions in which we operate.
Our strategy is to leverage EVO-owned technology in our product and service delivery to the greatest extent possible. We believe that this approach allows us to minimize variable expenses in processing transactions and maximize reliability and speed-to-market in delivering the products and services demanded by our merchant customers throughout our global footprint. In many markets, we provide innovative solutions that merchants are unable to obtain from other local providers. We endeavor to export products, services, platforms, and applications that enjoy success in any one of our markets to all of our markets, allowing our merchants and bank partners to benefit from our global footprint and providing a consistent experience for our multinational customers. We employ local product and technical expertise in every EVO market and then tailor our products and services from other regions to capture underserved market segments and exploit local opportunities.
Our product line is focused on providing a collection of integrated solution offerings, which allow integrated partners to connect to our systems via a simple, single integration, giving them access to our platforms. This product line includes
9
(1) a proprietary eCommerce marketplace solution that allows online merchants to leverage our global suite of products, including paperless reporting and boarding, (2) an ISV platform that offers merchants a variety of direct connections to software companies through various integrated software dealers, (3) payment integrations to ERP systems to enable Accounts Receivable departments to receive and reconcile card payments from customers, and (4) a full eCommerce gateway solution that provides a comprehensive payments solution.
Our EVO Snap platform is fully EMV compliant and provides an extensive menu of advanced features to our current and prospective integrated software partners, including tokenization, point-to-point encryption, and real-time fraud scoring. We believe this platform also allows us to deliver outsized value to our merchants by providing them with access to a broad range of industry-specific third-party business management software tools at the POS (e.g., inventory management, advanced accounting functions, and real-time promotions), even if the software vendor that created the tool is located in another market.
Uninterrupted services are mission-critical to our merchants and bank partners. As such, we have invested in creating a leading technology infrastructure designed to prioritize both efficiency and security. In addition, everything we bring to market is designed and implemented with security as a primary requirement. Our technology infrastructure is supported by professionals with decades of experience in operating high-volume, real-time processing systems and has been developed around data centers located in North America and Europe. We have also designed our environments with the ability to redirect processing to the most appropriate operating location at any given time. This flexibility enables us to continue to offer processing services during catastrophic events and disasters that would otherwise adversely affect our clients.
In addition, we have implemented a formal information security program, EVO Secure, to address threats to our infrastructure. This multi-layered program, led by a team of dedicated security professionals, ensures that we evaluate, protect against, monitor, and react to potential threats in a consistent manner across our global network.
Proven management team with strong track record of value-creating acquisitions
Our senior leadership team includes highly experienced payment technology professionals based in the Americas and Europe, allowing us to operate successfully in our current markets while also evaluating new markets. Many of our executives previously worked together in the industry and have extensive experience in developing and managing a global payments company. As we have expanded our international operations, we have invested substantial resources to attract and retain experienced talent with significant in-country experience to further develop and support our current markets and enter new ones.
Our senior leadership team has also demonstrated exceptional execution capabilities around developing new markets and sales distribution channels, consolidating and insourcing operations, and leading multi-cultural dispersed teams. They have completed eight platform migrations resulting in over 375,000 merchants being migrated to our proprietary platforms. The team has also successfully structured and maintained complex alliance relationships with many large financial institutions, which provide a significant number of merchant referrals to our business.
Our growth strategies
We believe our competitive strengths will continue to generate significant growth opportunities in both existing and new markets. We plan to grow our business and improve our operations by executing the following strategies:
Organically growing existing markets
We believe there is considerable opportunity for growth not only in new markets, but in our existing markets as well. Since 2012, our international operations have grown considerably, accounting for approximately 60% of our revenue for the year ended December 31, 2019.
Many of our international markets are less mature than the United States with respect to the growth drivers of our business. Specifically, these markets exhibit higher overall consumer expenditure growth, provide more opportunity for cash-to-
10
card conversion, offer increased penetration of integrated and eCommerce solutions, and present growth opportunities with new financial institution partners.
In the United States and Canada, which are relatively more mature than our other international markets, we believe there is significant opportunity for sustained, attractive growth in both the integrated and the B2B channels. Merchants of all sizes are increasingly migrating from standalone terminals to integrated point-of-sale solutions, as software becomes cheaper and more customized based on the industry focus of the merchant. B2B merchants, which have historically been underpenetrated for card acceptance, are now enjoying significant growth because of merchants’ desire to automate collections and incentives from the card schemes, which lower the cost of card acceptance based on the data transmitted with each transaction. We have made and continue to make investments through in-house development and acquisitions that ensure market-leading technology solutions for both integrated and B2B payments, as the growth rates of these channels are superior to that of traditional POS merchants. We expect these growth trends to continue for the foreseeable future.
To continue growing our merchant base we focus primarily on the following strategies:
|
· |
Supporting our existing portfolio and adding new customers. Our existing distribution partners currently service merchants that do not utilize our services, which presents new business opportunities within these existing relationships. |
|
· |
Introducing our comprehensive, global set of payment and commerce solutions to our existing markets. With industry leading products and services, such as our proprietary DCC technology, our state-of-the-art integrated platform, our suite of ERP payments integrations, and our eCommerce gateway solution, we believe we are uniquely positioned to enable our distribution partners to offer their merchants the broadest product offering in the market. |
|
· |
Leveraging our global infrastructure to ensure efficiency and competitiveness. As a result of having a proprietary integrated platform, we are able to efficiently manage, update and maintain our technology, increase capacity and speed, and realize significant operating leverage. |
|
· |
Customizing solutions to meet in-market needs. We design our products and services to meet the needs of our local customers and partners. We also enable our systems to utilize local alternative payment mechanisms that are present in particular markets, such as Blik in Poland, Paydirekt in Germany, and Codi in Mexico. |
By implementing these strategies, we believe we will increase adoption of our payment and commerce solutions, continue to grow our merchant base, and offer merchants the broadest set of solutions in the market.
Expanding our global footprint
Our partnership strategy has been a source of significant growth, and we believe it will continue to facilitate growth in the future. Since 2012, we have established partnerships with leading financial institutions around the world, many of which are exclusive and long-term. While we have made meaningful headway in penetrating new markets, we believe considerable opportunities remain in both establishing additional partnerships in our current markets, as well as entirely new markets around the world.
In determining which markets to enter, we evaluate a wide range of factors, including the reputation of our potential bank partner, the size and stability of the domestic economy, the stability of the government, card usage penetration, growth prospects, profitability, commerce and technology trends, regulatory and other risks, required investments, management resources, and the likely return on investment. This strategy drives us to expand into select international markets that we believe present attractive investment opportunities for long-term, sustainable merchant growth, as supported by factors such as:
|
· |
low penetration of cards-per capita among consumers; |
11
|
· |
high volume growth supported by cash-to-card conversion; |
|
· |
regulatory initiatives implemented with an aim to accelerate card acceptance among merchants; |
|
· |
less differentiated competitive landscape, given the prevalence of bank-owned acquiring businesses; |
|
· |
increased adoption of integrated point-of-sale, eCommerce, and integrated technologies; |
|
· |
embedded distribution through partner retail and corporate branch footprint; and |
|
· |
ability to launch our product suite and customer-centric services to accelerate end-market growth and acceptance penetration. |
We enter new markets by creating distribution relationships with leading, in-market financial institutions that possess a high degree of market knowledge, brand recognition and large distribution networks. These distribution agreements enable us to access a diverse group of merchants, expand the reach of our products and services, and form the basis for future investment in sales and infrastructure.
Broadening our distribution network
We aim to grow our business and broaden our global reach by generating new distribution relationships that add merchants to our portfolio. We reach new merchants primarily through our direct sales force and referral relationships. Our focus is to build these relationships across all channels, including financial institutions, software vendors, POS dealers, gateway providers, and agents. In addition to developing these growth channels, we are able to leverage our infrastructure both in servicing our existing markets and in expanding to new markets. For example, we have implemented EVO Snap into our European operations, extending our ability for merchants to tap into EVO Snap as a single, global integration platform. Through EVO Snap, we also have the ability to support integrated software dealers and distributors in multiple geographic markets. We plan to continue to broaden our distribution network by identifying and securing new distribution opportunities within both our existing markets and future markets.
Growing and enhancing our innovative payments and commerce solutions
We believe our innovative payments and commerce solutions represent one of our competitive advantages. We have made significant investments internally and through strategic acquisitions in both technology and personnel to propel our product innovation forward. In order to continue to expand, we believe we must continue to offer our customers leading products and services. Through a combination of building products organically, partnering with leading technology innovators, and selectively pursuing acquisitions, we are constantly driving innovation to enhance our products and services.
Through acquisitions and internal development, we have invested heavily in supporting a diverse network of integrated POS providers, ISVs, and integrated software and ERP dealers. These investments have strengthened our ability to support the software community in the markets where we operate, including POS, mobile, and eCommerce developers, by providing these developers with the tools necessary to develop a broader suite of multi-channel, multi-service solutions for merchants. This distribution-centric strategy has created our key, global technology solution, in which software developers can integrate to our proprietary processing platforms, and we can sign up Tech-enabled solutions providers as strategic distribution partners.
Capitalizing on our operating leverage
Our focus on cost optimization is a key consideration of any new investment opportunity. The deep industry and operating expertise of our management team enables us to identify opportunities to improve the operating efficiencies of our technology, product, and operations infrastructure. With in-house processing solutions and proprietary internal systems in our Americas and Europe segments, we have the ability to generate significant operating leverage as we grow overall volumes and transactions. With each newly acquired business, we utilize this infrastructure to optimize costs and
12
efficiencies. Through the support and reporting capabilities of our global systems, we eliminate redundancies and improve operating efficiencies post-acquisition.
Our products and services
We offer a comprehensive portfolio of card-present and card-not-present payment solutions for a variety of industry types and business sizes to facilitate merchants accepting credit, debit, prepaid, and other alternative payment types. Our portfolio of solutions includes EMV, chip and signature enabled POS terminals, virtual POS terminals for desktops, mobile acceptance and mobile point-of-sale, or mPOS, solutions for mobile devices and tablets, online hosted payments, and PSP for card-not-present bankcard, direct debit, and alternative payment scheme processing. We also offer value-added solutions such as online fraud prevention and management solutions, online hosted payments page capabilities, gateway solutions, security tokenization and encryption solutions at the POS and online, DCC, and loyalty offers, among others. Other industry-specific processing capabilities are also in our product suite, such as recurring billing, multi-currency authorization, and cross-border processing and settlement.
Our solutions enable merchants of all sizes to accept and settle cards, ACH, and closed loop gift, pre-paid and other payment capabilities. This spectrum of solutions includes:
|
· |
EMV chip, magnetic swipe readers, contactless, chip and signature, chip debit, and gift services for hardware terminals; |
|
· |
our mPOS solutions and services including cellphone SMS payments solutions; |
|
· |
integrations to various ERP systems to provide accounts receivable departments with B2B payments options; |
|
· |
a variety of eCommerce solutions including hosted payments, payment link, shopping cart-plug-ins, and gateway and PSP products; |
|
· |
comprehensive real-time digital and signatureless merchant boarding systems (from application to merchant processing); |
|
· |
market-specific business models for partners, including PSP and referral programs; and |
|
· |
online reporting systems for partners, integrators, and merchants providing access to our platforms worldwide. |
In addition, as a merchant acquirer, we provide in-house customer service utilizing in-market call centers, as we believe customers need to be served locally in market. We also have developed a consolidated shared services operational capability, for back-office services, including credit underwriting, risk, chargebacks, and terminal deployment and repair. Our capabilities also include a regionally-based merchant boarding system, risk management, and ISV technology development centers, supporting the Americas and Europe.
Our diverse offerings are supported by our two unique underlying global products, EVO Snap and our proprietary customer relationship management (“CRM”) solutions. EVO Snap is a highly customized, EMV compliant technology platform that allows merchants to easily access our key POS-related products in all of the markets we service with one single integration, including core processing and value-added (ACH, Level 3 processing, DCC) services in many of the markets in which we operate. Our merchants and partners benefit from a single global certification and common interface in the Americas and Europe, a key feature for retail and eCommerce merchants and referral partners with a global customer base. This common application programming interface (“API”) allows ISVs and developers to seamlessly integrate to EVO Snap and access all of its new features.
Our global, state-of-the-art CRM solutions enable all merchants, whether they are recruited through our financial institutions, direct sales, or partner channels, to be seamlessly managed from lead to live. We provide all partners and
13
agents access to these tools to ensure effective digital customer lifecycle management, thus streamlining the boarding and management of customers and complementing our digital payment product and service strategy.
Our markets
Americas
Card penetration in the United States and Canada is among the highest in the world. The largest growth opportunity in these markets is arising from the shift to integrated payment solutions. This includes integrated solutions, B2B, and eCommerce, as merchants are making an effort to enhance the payments experience for their customers. Merchant acquirers are capitalizing on this trend by entering into referral arrangements with technology companies and integrating acquiring services into their software. We have been particularly active in this market, preferring to partner with technology and software providers rather than acquire them in order to avoid channel conflicts and to leverage our partners' software development expertise. Additionally, the development of our EVO Snap platform allows us to provide our partners integrated solutions with a single connection point that is fully integrated with our front-end authorization systems. EVO Snap, along with other innovations in our integrated products, has been accretive to our growth in the Americas. Through the acquisition of Sterling in 2017 we gained a significant number of new integrated relationships, and we have continued to make acquisitions to broaden our Tech-enabled capabilities.
We believe that the merchant acquiring market in Mexico represents a very attractive growth opportunity, as overall card penetration is significantly lower than that of the United States. As card penetration continues to increase, we believe we will enjoy outsized benefits because of our status as the only scaled independent acquirer in the market. In July 2019, we acquired the payment gateway assets of SF Systems in Mexico, enhancing our ability to provide integrated payment solutions to mid-sized and large merchants within the region. We see significant opportunity to differentiate from our competitors, which is principally comprised of financial institutions who view acquiring as a tertiary product necessary to attract core banking business. Additionally, we are introducing our Tech-enabled solutions, including integrated payments and eCommerce, in order to develop those aspects of the market.
Europe
The European merchant acquiring market has certain unique structural characteristics including self-sponsoring with the major card schemes, penetration of local debit networks, terminal-centric SME markets, pooled in-country processing with competitors, and a bank-centric acquiring model, which we believe provide us with future opportunities for growth.
In recent years, Europe enacted comprehensive interchange reform. These changes have generally lowered the major card schemes’ domestic and cross-border interchange rates across Europe and caused in-country debit schemes and banks to lower their rates to levels at or below these new interchange rates as a defensive move to protect their businesses. This “leveling of the playing field” across European markets encourages seamless cross-border acquiring. It has also caused local in-country debit schemes to evolve or face elimination in the face of direct competition from the international card networks. This continued market shift provides us with the opportunity to leverage our existing technology and product infrastructure without the burden of certifying to a myriad of local schemes. Prior to these changes, acquirers seeking to offer merchants a global acceptance model would have needed to invest significantly greater resources to certify to these in-country debit networks. While still evolving, we anticipate this developing uniformity to continue to be a positive, long-term change for the European market.
We believe the evolving payment industry reforms, our positioning across Europe, the organic cash-to-card conversion in many markets, and the opportunity to launch new products and services at the early stage of merchant adoption of market innovations such as gateway integrations and integrated solutions, provide significant opportunities for existing in-market growth coupled with future investment opportunities in adjacent countries.
Many financial institutions across Europe entered the acquiring business decades ago by pooling their capital with their direct, in-country bank competitors to set up “captive” shared processing businesses. These businesses were generally owned by the same banks that utilized the processor services, and the processors were therefore designed to provide each of the owners with common card issuing and merchant acquiring processing solutions. While financially efficient and
14
initially successful, over time this structure has caused a lack of innovation and investment in payments. As such, the banks find themselves with limited differentiating solutions given the evolution of their local markets and now face stiffening competition from cross-border mono-line acquirers. Our European-based platform, coupled with an array of market leading payments products, including integrated and eCommerce solutions, allows our partners and customers to access these solutions as part of our long-term exclusive relationships.
We hold Payments Institution (“PI”) licenses, under the European Payment Services Directive of 2015 (“PSD2”), which enables non-financial institutions to participate in the payments industry provided they can meet the regulatory requirements of the licensing jurisdiction’s regulators. We currently hold PI licenses in three markets: Germany, Poland and Spain, which enable us to operate as a direct member of the payment card networks. In some markets outside the European Union (the “EU”), applicable regulations and the local and international networks generally require non-financial institutions similar to us to be sponsored by a bank to become an acquirer. The ability to participate in the EU payments industry with direct licenses and without the requirement for third-party sponsorship provides us with greater flexibility and control of our European business at a lower cost.
Our competition
We believe the primary competitive factors in our markets are trust, brand recognition, data security, product features and functionality, distribution, price, and servicing capability.
We compete with a variety of merchant acquirers that have different business models, go-to-market strategies, and technical capabilities in the markets in which we operate. Our competitors range in both size and geographic reach. In the United States and Canada, we compete with independent merchant acquirers including Fiserv (primarily through its acquisition of First Data), Global Payments (and its acquired TSYS subsidiary), FIS (primarily through its acquisition of Worldpay), and smaller independent sales organizations and POS providers, in addition to financial institutions that provide acquiring and processing services on their own, including Chase Paymentech Solutions, Truist, and Elavon (a subsidiary of U.S. Bancorp). In Europe (excluding the United Kingdom) and Mexico, financial institutions remain the primary providers of payment processing services to merchants, although outsourcing is becoming more prevalent. In the United Kingdom, we compete primarily with FIS (Worldpay), Barclaycard, Global Payments, Fiserv (First Data), and Elavon.
Our broad and differentiated product offerings, service proposition, pricing, and distribution strategies in our geographically diverse markets drive our ability to compete effectively through the acceptance and use of our payment and commerce solutions by merchants. We specifically focus on the primary customer needs of speed, reliability, and reconciliation, ensuring that at a minimum, our systems, solutions, products, and service models are designed to put these customer expectations at the top of the priority list.
Our intellectual property
Our products and services utilize a combination of proprietary software and hardware that we own and license from third parties. Our owned intellectual property is protected by federal patent, trademark, trade secret, and copyright law, as well as state trade secret laws, as appropriate. We generally control access to and use of our proprietary software and other confidential information through the use of internal and external controls, including entering into non-disclosure and confidentiality agreements with both our employees and third parties.
As of December 31, 2019, we had one patent application pending related to our EVO Snap product. In addition, we own a portfolio of trademarks in multiple jurisdictions around the world, including for our primary mark, EVO.
Our regulatory environment
Various aspects of our service areas are subject to U.S. federal, state and local regulation, as well as regulation outside the United States. Certain of our services also are subject to rules promulgated by various card networks and banking and other authorities as more fully described below.
15
Financial services regulations
As a result of the implementation of the Payment Services Directive of 2007 in the EU, a number of our subsidiaries in our European segment hold a PI license which allows them to operate in the EU member states in which such subsidiaries and their branches do business. As a PI, we are subject to regulation and oversight in the applicable EU member states, which includes, among other obligations, a requirement to maintain specified regulatory capital and adhere to certain rules regarding the conduct of our business. In July 2013, the European Commission proposed legislation in two parts, covering a wide range of proposed regulatory reforms affecting the payments industry across the EU. The first part was an EU-wide regulation on interchange fees for card-based payment transactions (the “Interchange Fee Regulation”). The Interchange Fee Regulation (2015/751) went into effect in June 2015. The second part, PSD2, was a recasting of the Payment Services Directive of 2007. PSD2 entered into effect in January 2016 and contains a number of additional regulatory provisions, including provisions relating to “Strong Customer Authentication” (SCA) which will become fully enforceable in December 2020 and will require industry wide systems upgrades. The EU has also enacted certain legislation relating to the offering of DCC services, which will come into effect in April 2020 and require additional disclosures to consumers as the result of our offering DCC products in a number of markets. Further, several of our international subsidiaries provide services that make them subject to regulation by local banking agencies and other regulatory authorities.
Association and network rules
We are subject to the rules of Mastercard, Visa, and other credit and debit networks. In order to provide processing services, a number of our subsidiaries are registered with Visa or Mastercard as service providers for member institutions. Various subsidiaries of ours are also processor level members of numerous debit and electronic benefits transaction networks or are otherwise subject to various network rules in connection with processing services and other services we provide. As such, we are subject to applicable network rules and to a variety of fines or penalties that may be administered by the card networks for failure to comply. Although these rules are not government regulations, any failure to comply with the networks’ requirements or to pay the fines they impose could cause the termination of our registration and require us to stop providing payment processing services. For example, “EMV” is a credit and debit card authentication methodology that the card networks are requiring processors, issuers, and acquirers to implement. Compliance deadlines for EMV mandates vary by country and by payment network. In addition, card networks and their member financial institutions regularly update, and generally expand, security expectations and requirements related to the security of cardholder data and environments. We are also subject to network operating rules promulgated by the National Automated Clearing House Association relating to payment transactions processed by us using the Automated Clearing House Network and to various state federal and foreign laws regarding such operations, including laws pertaining to electronic benefits transactions.
The Dodd-Frank Act
In July 2010, the Dodd-Frank Wall Street Reform and Consumer Protection Act of 2010 (the “Dodd-Frank Act”) was signed into law in the United States. The Dodd-Frank Act resulted in significant structural and other changes to the regulation of the financial services industry. Among other things, Title X of the Dodd-Frank Act established a new, independent regulatory agency known as the Consumer Financial Protection Bureau (the “CFPB”) to regulate consumer financial products and services. The CFPB enforces prohibitions against unfair, deceptive or abusive acts or practices under the Dodd-Frank Act and may have authority over us as a provider of services to regulated financial institutions in connection with consumer financial products. Separately, under the Dodd-Frank Act, debit interchange transaction fees are regulated by the Board of Governors of the Federal Reserve System (the “Federal Reserve Board”) and must be “reasonable and proportional” to the cost incurred by the card issuer in authorizing, clearing, and settling the transaction. The Dodd-Frank Act also contains provisions that ban debit card networks from entering into exclusivity arrangements, prohibit card issuers and card networks from imposing transaction routing requirements, and require card issuers to enable at least two unaffiliated networks on each debit card.
In addition, the Dodd-Frank Act permits merchants to set minimum dollar amounts (not to exceed $10) for the acceptance of a credit card (while federal governmental entities and institutions of higher education may set maximum amounts for the acceptance of credit cards), and to provide discounts or incentives to consumers who pay with alternative payment methods, such as cash, checks or debit cards.
16
Privacy and information security regulations
We provide services that may be subject to various state, federal, and foreign privacy laws and regulations, including, among others, the Financial Services Modernization Act of 1999 (the “Gramm-Leach-Bliley Act”), PSD2, the General Data Protection Directive (“GDPR”), the California Consumer Privacy Act of 2018 (the “CCPA”), and the Personal Information Protection and Electronic Documents Act in Canada. These laws and their implementing regulations restrict certain collection, processing, storage, use, and disclosure of personal information, require notice to individuals of privacy practices, and provide individuals with certain rights to prevent use and disclosure of protected information. These laws also impose requirements for the safeguarding and proper destruction of personal information through the issuance of data security standards or guidelines. Certain federal, state, and foreign laws and regulations impose similar privacy obligations and, in certain circumstances, obligations to notify affected individuals, state officers or other governmental authorities, the media, and consumer reporting agencies, as well as businesses and governmental agencies, of security breaches affecting personal information. In addition, there are state and foreign laws restricting the ability to collect and utilize certain types of information such as Social Security and driver’s license numbers. In July 2016, the European Parliament adopted an EU-wide directive on security of network and information systems (the “NIS Directive”). The NIS Directive provides legal measures intended to boost the overall level of cybersecurity in the EU and required that EU member states enact national laws to enforce certain cybersecurity obligations in 2018.
The CCPA became effective on January 1, 2020 and establishes strict data privacy and data protection requirements for the data of California residents. The CCPA has been amended and it is likely that further amendments will be proposed to this legislation. As such, it remains unclear how certain provisions of the CCPA will be interpreted and enforced.
As a processor of personal data of EU data subjects, we are also subject to regulation and oversight in the applicable EU member states with regard to data protection legislation. GDPR contains various obligations on the processing of personal data in the EU, including restrictions on transferring personal data outside of the EU to countries which have not been recognized as having adequate data protection standards, unless specific conditions are met. Our businesses operate in accordance with these standards. GDPR contains additional obligations on data controllers and data processors operating in the EU or offering services to consumers within the EU. GDPR also provided significant enhancements with regard to the rights of data subjects (which include the right to be forgotten and the right of data portability), stricter regulation on obtaining consent to processing of personal data and sensitive personal data, stricter obligations with regard to the information to be included in privacy notices, and significant enhanced requirements with regard to compliance, including a regime of “accountability” for processors and controllers and a requirement to embed compliance with GDPR into the fabric of an organization by developing appropriate policies and practices to achieve a standard of data protection by “design and default.” GDPR includes enhanced data security obligations (to run in parallel to those contained in NIS regulations), requiring data processors and controllers to take appropriate technical and organizational measures to protect the data they process and their systems. Organizations that process significant amounts of data may be required to appoint a Data Protection Officer responsible for reporting to the highest level of management within the business. There are greatly enhanced sanctions under GDPR for failing to comply with the core principles of the GDPR or failing to secure data.
Unfair trade practice regulations
We and our clients are subject to various federal, state, and international laws prohibiting unfair or deceptive trade practices, such as Section 5 of the Federal Trade Commission Act. Various regulatory agencies, including the Federal Trade Commission, various consumer protection agencies in Europe and other international markets, the CFPB, and state attorneys general, have authority to take action against parties that engage in unfair or deceptive trade practices or violate other laws, rules, and regulations. To the extent we are processing payments for a client that may be in violation of laws, rules, and regulations, we may be subject to enforcement actions by those agencies and may incur losses that impact our business.
Anti-money laundering, anti-bribery, sanctions, and counter-terrorist regulations
We are subject to anti-money laundering laws and regulations, including certain sections of the USA PATRIOT Act of 2001. We are also subject to anti-corruption laws and regulations, including the U.S. Foreign Corrupt Practices Act (the
17
“FCPA”) and other laws, that prohibit the making or offering of improper payments to foreign government officials and political figures and include anti-bribery provisions enforced by the Department of Justice and accounting provisions enforced by the SEC. The FCPA has a broad reach and requires maintenance of appropriate records and adequate internal controls to prevent and detect possible FCPA violations. Many other jurisdictions where we conduct business also have similar anti-corruption laws and regulations. We have policies, procedures, systems, and controls designed to identify and address potentially impermissible transactions under such laws and regulations.
We are also subject to certain economic and trade sanctions programs that are administered by the Office of Foreign Assets Control (“OFAC”), which prohibit or restrict transactions to or from, or dealings with, specified countries, their governments and, in certain circumstances, their nationals, and with individuals and entities that are specially-designated nationals of those countries, narcotics traffickers, and terrorists or terrorist organizations. Other group entities may be subject to additional local sanctions requirements in other relevant jurisdictions.
Similar anti-money laundering, counter terrorist financing and proceeds of crime laws apply to electronic currency transactions and to dealings with persons specified in lists maintained by the country equivalents to OFAC lists in certain other countries. These laws require specific data retention obligations to be observed by intermediaries in the payment process and our businesses in those jurisdictions are subject to such data retention obligations. For example, in the EU, our European businesses are subject to requirements under the Fourth Money Laundering Directive ((EU) 2015/849) and, as individual countries implement its provisions, they will begin to operate under the Fifth Money Laundering Directive ((EU) 2018/843).
Our employees
As of December 31, 2019, we employed approximately 2,400 professionals. A majority of these employees are located in the United States, however many are also concentrated in Mexico, Poland, and Ireland. None of our employees in the United States are represented by a labor union or covered by a collective bargaining agreement. We consider our relationship with our employees to be in good standing.
Our organizational structure and corporate information
EVO, Inc. was incorporated under the laws of the State of Delaware on April 20, 2017. On May 25, 2018, we completed an initial public offering of 16,100,000 shares of our Class A common stock at a public offering price of $16.00 per share, of which 15,433,333 shares were sold by us and 666,667 shares were sold by one of our stockholders (the “IPO”). The shares began trading on the Nasdaq Global Market system (“Nasdaq”) on May 23, 2018 under the symbol “EVOP.” In connection with the IPO, we completed the Reorganization Transactions to implement an “Up-C” capital structure. As a result of the Reorganization Transactions and the IPO, EVO, Inc. is the sole managing member of EVO, LLC and a holding company whose principal asset is the LLC Interests.
On September 20, 2018, we completed a secondary offering of an aggregate of 8,075,558 shares of Class A common stock (the “September 2018 Secondary Offering”). The September 2018 Secondary Offering consisted of 7,000,000 shares of Class A common stock offered and sold by us, with the net proceeds used to purchase an equivalent number of LLC Interests and shares of Class D common stock (which shares were then canceled) from affiliates of MDP, and 22,225 shares of Class A common stock offered and sold by certain individual selling stockholders. We also offered and sold 1,053,333 shares of Class A common stock as part of an option granted to the underwriters to purchase additional shares of Class A common stock in the September 2018 Secondary Offering.
On April 8, 2019, EVO, Inc. completed a secondary offering (the “April 2019 Secondary Offering”) of an aggregate 5,750,000 shares of its Class A common stock, which consisted of 4,500,000 shares of Class A common stock offered and sold by us, with the net proceeds used to purchase an equivalent number of LLC Interests and shares of Class D common stock (which shares were then cancelled) from affiliates of MDP, and 500,000 shares of Class A common stock offered and sold by us, with the net proceeds used to purchase an equivalent number of LLC Interests and Class B common stock (which shares were then cancelled) from Blueapple. The April 2019 Secondary Offering also included a full exercise of the underwriters’ option to purchase 750,000 additional shares of Class A common stock from the Company.
18
On August 15, 2019, EVO, Inc. completed a secondary offering (the “August 2019 Secondary Offering”) of an aggregate 4,000,000 shares of its Class A common stock, which consisted of 3,250,000 shares of Class A common stock offered and sold by us, with the net proceeds used to purchase an equivalent number of LLC Interests and shares of Class D common stock (which shares were then cancelled) from affiliates of MDP, and 750,000 shares of Class A common stock offered and sold by us, with the net proceeds used to purchase an equivalent number of LLC Interests and Class B common stock (which shares were then cancelled) from Blueapple.
On December 9, 2019, EVO, Inc. completed a secondary offering (the “December 2019 Secondary Offering”) of an aggregate 4,500,000 shares of its Class A common stock, which consisted of 4,000,000 shares of Class A common stock offered and sold by us, with the net proceeds used to purchase an equivalent number of LLC Interests and shares of Class D common stock (which shares were then cancelled) from affiliates of MDP and 500,000 shares of Class A common stock offered and sold by us, with the net proceeds used to purchase an equivalent number of LLC Interests and Class B common stock (which shares were then cancelled) from Blueapple.
We maintain a website with the address www.evopayments.com. We are not including the information contained in our website as part of, or incorporating it by reference into, this Annual Report on Form 10-K. We make available, free of charge through our website, our filings with the Securities and Exchange Commission (the “SEC”), including our annual proxy statements, annual reports on Form 10-K, quarterly reports on Form 10-Q and current reports on Form 8-K.
EXECUTIVE OFFICERS OF THE REGISTRANT
The following table sets forth information regarding our executive officers as of December 31, 2019:
|
Name |
Age |
Position(s) |
|
James G. Kelly |
57 |
Chief Executive Officer and Director |
|
Brendan F. Tansill |
41 |
President, the Americas |
|
Darren Wilson |
52 |
President, International |
|
Thomas E. Panther |
51 |
Executive Vice President, Chief Financial Officer |
|
Steven J. de Groot |
61 |
Executive Vice President, General Counsel and Secretary |
|
Michael L. Reidenbach |
57 |
Executive Vice President, Chief Information Officer |
|
Catherine E. Lafiandra |
56 |
Executive Vice President, Chief Human Resources Officer |
|
David L. Goldman |
37 |
Executive Vice President, Business Development and Strategy |
|
|
||
James G. Kelly has served as EVO, Inc.’s Chief Executive Officer since its formation, as a member of our board of directors since May 2018, and as Chief Executive Officer and a member of the board of managers of the EVO, LLC since January 2012. Before joining EVO, Mr. Kelly served as President of Global Payments Inc., as Senior Executive Vice President of Global Payments Inc. and as Chief Financial Officer of Global Payments Inc. Prior to that, Mr. Kelly served as managing director of Alvarez & Marsal, a global professional services firm, and as manager of Ernst & Young’s mergers and acquisitions and audit groups. Mr. Kelly is a graduate of the University of Massachusetts, Amherst.
19
Brendan F. Tansill has served as EVO, Inc.’s President, the Americas, since its formation, and as President, the Americas, of EVO, LLC since January 2016. Prior to his current role, Mr. Tansill served as Executive Vice President, Business Development and Strategy of EVO, LLC from April 2012 until December 2015, where he was responsible for EVO, Inc.’s global mergers and acquisitions activity and corporate strategy. Before joining EVO, Mr. Tansill was an investment professional at CCMP Capital Advisors. Mr. Tansill received his Masters of Business Administration from the Kellogg School of Management at Northwestern University and his Bachelor of Arts from the University of Virginia.
Darren Wilson has served as EVO, Inc.’s President, International, since its formation, and as President, International, of EVO, LLC since April 2014. Before joining EVO, Mr. Wilson served as Managing Director of Streamline (a Worldpay company) and as CEO/President of Global Payments’ Western European business. Mr. Wilson has also held various positions at HSBC Bank. Mr. Wilson has the Associate of the Chartered Institute of Bankers degree and has studied at Birmingham and Warwick Universities.
Thomas E. Panther has served as EVO’s Executive Vice President and Chief Financial Officer since November 2019. Before joining EVO, Mr. Panther worked for over 19 years at SunTrust Banks, Inc., where he served in numerous leadership roles including Chief Accounting Officer, Corporate Controller, Director of Corporate Finance and Head of Capital Planning & Analysis. Mr. Panther began his career at Arthur Andersen, delivering accounting and advisory services to financial institutions for nine years. Mr. Panther is a certified public accountant and earned his bachelor’s degree from the University of Richmond.
Steven J. de Groot has served as EVO, Inc.’s Executive Vice President, General Counsel and Secretary since its formation, and as Executive Vice President, General Counsel and Secretary of EVO, LLC since March 2013. Before joining EVO, Mr. de Groot was a partner in the corporate group at DLA Piper LLP from October 2009 until October 2012 and a partner in the corporate group at King & Spalding LLP from March 1992 until October 2009. Mr. de Groot received his Juris Doctorate and Bachelor of Business Administration from the University of Notre Dame.
Michael L. Reidenbach has served as EVO, Inc.’s Executive Vice President, Chief Information Officer since its formation, and as Executive Vice President, Chief Information Officer of EVO, LLC since March 2013. Before joining EVO, Mr. Reidenbach served as Executive Vice President, Chief Information Officer of Global Payments Inc. Mr. Reidenbach is a former U.S. Air Force instructor pilot and aircraft commander. Mr. Reidenbach received his Master in Business Administration/Finance from Georgia College and his Bachelor of Science from the U.S. Air Force Academy.
Catherine E. Lafiandra has served as EVO, Inc.’s Chief Human Resources Officer since its formation, and as Chief Human Resources Officer of EVO, LLC since March 2016. Before joining EVO, Ms. Lafiandra served as Vice President of Human Resources of Beazer Homes USA, Inc. from October 2014 to March 2016 and as Senior Vice President of Human Resources of PRGX Global, Inc. from March 2010 to March 2014. Ms. Lafiandra received her Juris Doctorate from the University of Virginia School of Law and her Bachelor of Arts from Southern Methodist University.
David L. Goldman has served as EVO, Inc.’s Executive Vice President of Business Development and Strategy since its formation, and as Executive Vice President of Business Development and Strategy of EVO, LLC since June 2016. Before joining EVO, Mr. Goldman served as Managing Director of PointState Capital LP from January 2011 to April 2014 and as Vice President of Duquesne Capital Management, LLC from April 2007 to December 2010. Prior to that, Mr. Goldman served as an Associate at TPG Capital, L.P. and as an investment banking analyst at Morgan Stanley. Mr. Goldman received his Bachelor of Business Administration from the University of Michigan.
20
The risks described below are not the only risks facing us. Please be aware that additional risks and uncertainties not currently known to us or that we currently deem to be immaterial could also materially and adversely affect our business, results of operations, financial condition, cash flows, or prospects. You should also refer to the other information contained in our periodic reports, including Forward-Looking Statements, our consolidated financial statements and the related notes, and Management’s Discussion and Analysis of Financial Condition and Results of Operations for a further discussion of the risks, uncertainties, and assumptions relating to our business.
Business risks
Our ability to anticipate and respond to changing industry trends and the needs and preferences of our merchants and consumers may adversely affect our competitiveness or the demand for our products and services.
The financial services and payment technology industries are subject to rapid technological advancements, resulting in new products and services, including mobile payment applications and customized integrated software payment solutions, and an evolving competitive landscape, as well as changing industry standards and merchant and consumer needs and preferences. We expect that new services and technologies applicable to the financial services and payment technology industries will continue to emerge and that our merchants and consumers will continue to adopt new technology for business and personal uses. These changes may limit the competitiveness of and demand for our services. We must anticipate and respond to these changes in order to remain competitive within our markets. In addition, failure to develop value-added services that meet the needs and preferences of our merchants could adversely affect our ability to compete effectively in our industry. Furthermore, potential negative reactions to our products and services by merchants or consumers can spread quickly and damage our reputation before we have the opportunity to respond. If we are unable to anticipate or respond to technological or industry changes on a timely basis, our ability to remain competitive could be adversely affected.
Substantial and increasingly intense competition worldwide in the financial services and payment technology industries may adversely affect our overall business and operations.
The financial services and payment technology industries are highly competitive. Our payment services and solutions compete against various financial services and payment systems, including cash and checks, and electronic, mobile, eCommerce, integrated, and B2B payment platforms. If we are unable to differentiate ourselves from our competitors and drive value for our merchants, we may not be able to compete effectively. Our competitors may introduce their own value-added or other innovative services or solutions more effectively than we do, which could adversely impact our current competitive position and prospects for growth. Our competitors also may be able to offer and provide services that we do not. In addition, in certain of the markets in which we operate, we process “on-us” transactions whereby we receive fees as a merchant acquirer and for processing services for the issuing bank. As competition in these markets grows, the number of transactions in which we receive fees for both of these roles may decrease, which could reduce our revenue and margins in these jurisdictions. We also compete against new entrants that have developed alternative payment systems, eCommerce payment systems, payment systems for mobile devices, and customized integrated software and B2B payment solutions. Failure to compete effectively against any of these competitive threats could adversely affect our business, financial condition, or results of operations. In addition, some of our competitors are larger and have greater financial resources than we do, enabling them to maintain a wider range of product offerings, mount extensive promotional campaigns, and be more aggressive in offering products and services at lower rates, which may adversely affect our business, financial condition, or results of operations.
Potential changes in the competitive landscape, including disintermediation from other participants in the payments ecosystem, could harm our business.
We expect that our competitive landscape will continue to undergo changes, including:
|
· |
rapid and significant changes in technology, resulting in new and innovative payment methods and programs, that could place us at a competitive disadvantage and reduce the use of our products and services; |
21
|
· |
competitors, merchants, and other industry participants may enter into new lines of business or develop products and services that compete with or replace our products and services, including products and services that enable card networks and banks to transact with consumers directly; and |
|
· |
participants in the financial services and payment technology industries may merge, create joint ventures, or form other business combinations that may improve their existing business services, or create new payment services that compete with our services |
Additionally, the payments industry has been experiencing significant consolidation, including Fiserv’s acquisition of First Data and FIS’ acquisition of Worldpay, each in July 2019. Most recently, in September 2019, Global Payments and TSYS completed their merger. Continued consolidation in the payments industry may impact our ability to compete for merchants and financial partners.
Failure to compete effectively against any of these or other competitive threats could adversely affect our business, financial condition, or results of operations.
Global economic, political, and other conditions may adversely affect trends in consumer, business, and government spending, which may adversely impact the demand for our services, revenue, and profitability.
The financial services and payment technology industries in which we operate depend heavily upon the overall level of consumer, business, and government spending. A sustained deterioration in general economic conditions (including distress in financial markets, turmoil in specific economies around the world, and additional government intervention), particularly in the Americas or Europe, or increases in interest rates in key countries in which we operate, may adversely affect our financial performance by reducing the number or average purchase amount of transactions we process. A reduction in the amount of consumer or business spending could result in a decrease of our revenue and profits.
Adverse economic trends may accelerate the timing, or increase the impact of, risks to our financial performance. These trends could include:
|
· |
declining economies, foreign currency fluctuations, and the pace of economic recovery can change consumer spending behaviors, such as cross-border travel patterns, on which a significant portion of our revenue and growth is dependent; |
|
· |
low levels of consumer and business confidence typically associated with recessionary environments may result in decreased spending by cardholders; |
|
· |
high unemployment may result in decreased spending by cardholders; |
|
· |
budgetary concerns in the United States and other countries could affect sovereign credit ratings, and impact consumer confidence and spending; |
|
· |
emerging market economies tend to be more sensitive to adverse economic trends than the more established markets we serve; |
|
· |
financial institutions may restrict credit lines to cardholders or limit the issuance of new cards to mitigate cardholder credit concerns; |
|
· |
uncertainty and volatility in the performance of our merchants’ businesses; |
|
· |
cardholders may decrease spending for services we market and sell; and |
|
· |
government intervention, including the effect of laws, regulations, spending, and government investments in our merchants, may have potential negative effects on our business and our relationships with our merchants or otherwise alter their strategic direction away from our products and services. |
22
Our inability to protect our systems and data from continually evolving cybersecurity risks or other technological risks could affect our reputation among merchants, issuers, financial institution, partners, and cardholders and may expose us to penalties, fines, liabilities, and legal claims.
In order to provide our services, we process, transmit, and store sensitive business information and personal information about our merchants, merchants’ customers, vendors, partners, and other parties. This information may include credit and debit card numbers, bank account numbers, personal identification numbers, names and addresses, and other types of personal information or sensitive business information. Some of this information is also processed and stored by our merchants’ third-party service providers to whom we outsource certain functions and other agents (which we refer to collectively as our “associated third parties”).
We have certain responsibilities to the card networks and their member financial institutions for any failure by us or by any of our associated third parties to protect this information. We are a regular target of malicious third party attempts to identify and exploit system vulnerabilities and penetrate or bypass our security measures. While plans and procedures are in place to protect this sensitive data, we cannot be certain that these measures will be successful and will be sufficient to counter all current and emerging technology threats that are designed to breach our systems in order to gain access to confidential information.
Our computer systems are subject to penetration and our data protection measures may not prevent unauthorized access. The techniques used to obtain unauthorized access, disable, or degrade service or sabotage systems change frequently and are often difficult to detect. Threats to our systems and our associated third parties’ systems can derive from human error, fraud, or malice on the part of employees or third parties, or may result from accidental technological failure. Computer viruses and other malware can be distributed and could infiltrate our systems or those of our associated third parties. In addition, denial of service or other attacks could be launched against us for a variety of purposes, including to interfere with our services or create a diversion for other malicious activities. Our defensive measures may not prevent unauthorized access or use of sensitive data. While we maintain insurance coverage that may cover certain aspects of cyber risks and incidents, our insurance coverage may be insufficient to cover all losses. Further, we do not control the actions of our third party partners and customers or their systems. These third parties have experienced security breaches in the past, and any future problems experienced by these third parties, including those resulting from cyberattacks or other breakdowns or disruptions in services, could adversely affect our ability to conduct our business or expose us to liability.
In addition, following an acquisition, we take steps to ensure our data and system security protection measures cover the acquired business as part of our integration process. As such, there may be a period of increased cybersecurity risk during the period between closing an acquisition and the completion of our data and system security integration.
We may also be subject to liability for claims relating to misuse of personal information, such as unauthorized marketing and violation of data privacy laws. We cannot provide assurance that the contractual requirements related to security and privacy that we impose on our service providers who have access to merchant and customer data will be followed or will be adequate to prevent the unauthorized use or disclosure of data. In addition, we have agreed in certain agreements to take certain protective measures to ensure the confidentiality of merchant and consumer data. The costs of systems and procedures associated with such protective measures may increase and could adversely affect our ability to compete effectively. Any failure to adequately enforce or provide these protective measures could result in litigation, governmental and card network intervention, and fines, lost revenue, and other liabilities and reputational harm.
Any type of security breach, attack, or misuse of data described above or otherwise, could harm our reputation and deter existing and prospective merchants and partners from using our services, deter customers from making electronic payments generally, increase our operating expenses in order to contain and remediate the incident, expose us to unbudgeted or uninsured liability, disrupt our operations (including potential service interruptions), distract our management, increase our risk of regulatory scrutiny, result in the imposition of regulatory or card network fines and other penalties, and adversely affect our continued card network registration and financial institution sponsorship. For example, if we were to be removed from the card networks’ lists of PCI DSS compliant service providers, our existing merchants, sales, and financial institution partners, or other third parties may terminate their relationship with us or cease using or referring our services. Also, prospective merchants, sales partners, financial institution partners or other third parties may delay or
23
choose not to consider us for their processing needs. In addition, card networks could refuse to allow us to process through their networks. Any of the foregoing could adversely impact our business, financial condition, or results of operations.
We may experience failures in our processing systems due to software defects, undetected errors, computer viruses, and development delays, which could damage customer relations and expose us to liability.
Our core business depends on the reliability of our processing systems. A system outage or other failure could adversely affect our business, financial condition, or results of operations, including by damaging our reputation or exposing us to third-party liability. Certain laws, regulations, and card network rules allow for penalties if our systems do not meet certain operating standards and may require us to report issues to regulators or the card networks within a specified time period. To successfully operate our business, we must be able to protect our systems from interruption, including from events that may be beyond our control. Events that could cause system interruptions include fire, natural disaster, unauthorized entry, power loss, telecommunications failure, computer viruses, terrorist acts, and war. Although we have taken steps to protect against data loss and system failures, there is still risk that we may lose critical data or experience system failures. In addition, we utilize select third parties for certain disaster recovery operations, particularly outside of the United States. To the extent we outsource any disaster recovery functions, we could be adversely impacted in the event of the vendor’s unresponsiveness or other failures. In addition, our insurance may not be adequate to compensate us for all losses or failures that may occur.
Our products and services are based on sophisticated software and computing systems that are constantly evolving. We often encounter delays and cost overruns in developing and implementing changes to our systems. In addition, the underlying software may contain undetected errors, viruses, or defects. Defects in our software products and errors or delays in our processing of electronic transactions could result in additional development costs, diversion of technical and other resources from our other development efforts, loss of credibility with current or potential merchants, harm to our reputation, or other liabilities. In addition, we rely on technologies supplied to us by third parties that may contain undetected errors, viruses, or defects that could adversely affect our business, financial condition, or results of operations. Although we attempt to limit our potential liability through disclaimers in our software documentation and limitation of liability provisions in our licenses and other agreements with our merchants and partners, we cannot assure that these measures will be successful in limiting our liability.
Degradation of the quality of the products and services we offer, including support services, could adversely impact our ability to attract and retain merchants and partners.
Our merchants and partners expect a consistent level of quality in the provision of our products and services, which are a significant element of the value proposition we offer to them. If the reliability or functionality of our products and services is compromised or the quality or support of such products and services is otherwise degraded, we could lose existing merchants and partners and find it harder to attract new merchants and partners. If we are unable to scale our support functions to address the growth of our merchant portfolio and partner network, the quality of our support may decrease, which could also adversely affect our ability to attract and retain merchants and partners.
Acquisitions create certain risks and may adversely affect our business, financial condition, or results of operations.
We have actively acquired businesses and expect to continue to make acquisitions of businesses and assets in the future. The acquisition and integration of businesses and assets involve a number of risks. These risks include valuation (determining a fair price for the business and assets), integration (managing the process of integrating the acquired business’ people, products, technology, and other assets to extract the value and synergies projected to be realized in connection with the acquisition), regulation (obtaining regulatory or other government approvals that may be necessary to complete the acquisition), and due diligence (including identifying risks to the prospects of the business, including undisclosed or unknown liabilities or restrictions to be assumed in the acquisition).
In addition, acquisitions outside of the United States often involve additional or increased risks including:
|
· |
creating and managing geographically separated organizations, systems, and facilities; |
24
|
· |
integrating personnel with diverse business backgrounds and organizational cultures; |
|
· |
complying with non-U.S. legal, tax, and regulatory requirements; |
|
· |
addressing financial and other impacts to our business resulting from fluctuations in currency exchange rates; |
|
· |
enforcing intellectual property rights in non-U.S. countries; |
|
· |
difficulty entering new non-U.S. markets due to, among other things, consumer acceptance and business knowledge of these markets; and |
|
· |
general economic and political conditions. |
The failure to avoid or mitigate the risks described above or other risks associated with acquisitions could have a material adverse effect on our business, results of operations, cash flows, and financial condition.
In addition, we may not be able to successfully integrate businesses that we acquire or do so within the intended timeframe. We could face significant challenges in managing and integrating our acquisitions, including diversion of management’s attention, migrating services from third-parties to our own systems and infrastructure, and integrating operations and personnel. In addition, the expected cost synergies or new revenue associated with our acquisitions may not be fully realized in the anticipated amount or within the contemplated timeframe or cost expectations, which could result in increased costs and have an adverse effect on our results of operations, cash flows, financial condition, and prospects.
Further, there may be material risks we are unable to identify or quantify through due diligence. If significant liabilities, including those relating to violations of applicable law, arise at one of our joint ventures or acquired subsidiaries, we may be exposed to material liabilities or our business may be materially and adversely affected.
Additional acquisitions may require us to incur additional debt through new or existing credit agreements or issue additional equity securities to fund the purchase price. If we are unable to obtain the required funding on acceptable terms, or at all, we may not be able to complete acquisitions, which could have an adverse impact on our growth.
Finally, future acquisition opportunities may not be available on acceptable terms, or at all, and we may not be able to obtain necessary financing or regulatory approvals to complete potential acquisitions. If we are unable to continue to complete successful acquisitions, our growth and prospects could be adversely impacted.
Continued consolidation in the banking industry could adversely affect our growth.
The banking industry continues to experience consolidation regardless of overall economic conditions. In addition, in times of economic distress, various regulators in the markets we serve have acquired, and in the future may acquire, financial institutions, including banks with which we partner. If a current financial institution referral partner of ours is acquired by another bank, the acquiring bank may seek to terminate our agreement and impose its own merchant services program on the acquired bank. If a financial institution referral partner acquires another bank, our financial institution referral partner may take the opportunity to conduct a competitive bidding process to determine whether to maintain our merchant acquiring services or switch to another provider. In either situation, we may be unable to retain the relationship post-acquisition, or may have to offer financial concessions to do so, which could adversely affect our results of operations or growth. In addition, if a current financial institution referral partner of ours is acquired or becomes subject to a consent decree or similar oversight by a regulator, the regulator may seek to alter the terms or terminate our existing agreement with the acquired financial institution. For example, in October of 2018, BNP Paribas Group acquired one of our financial institutional referral partners, Raiffeisen Bank Polska, in Poland. Under the terms of our contract, BNP Paribas Group elected not to continue the relationship with us in Poland and refunded certain fees to us that we had previously paid to the bank.
25
Additionally, one of our other financial institution referral partners, Grupo Banco Popular, was acquired by Grupo Santander in June 2017. Following the consummation of a merger between the banks, Grupo Santander assumed the obligations of Grupo Banco Popular under our agreements. We believe our referral relationship with Grupo Santander remains in full force and effect and will continue to provide us with referrals during the remainder of the term of the underlying agreement. However, we cannot assure you that the acquisition will not have a long-term adverse impact on our referral relationship during the remaining term of the agreement. If our referral relationship was to be adversely impacted, it could have a material adverse effect on our business.
Increased customer, referral partner, or sales partner attrition could cause our financial results to decline.
We experience attrition in merchant transaction processing volume due to several factors, including business closures, transfers of merchants’ accounts to our competitors, unsuccessful contract renewal negotiations, and account closures that we initiate for various reasons, such as heightened credit risks or contract breaches by merchants. In addition, if an existing sales partner switches to another payment processor, terminates our services, internalizes payment processing functions that we perform, merges with or is acquired by one of our competitors, or shuts down or becomes insolvent, we may no longer receive new customer referrals from the sales partner and we risk losing existing merchants that were originally enrolled by the sales partner. In some jurisdictions, we are reliant on a small concentration of sales partners for a substantial portion of our merchant referrals. We cannot predict the level of attrition that may occur in the future and it could increase. Higher than expected attrition could adversely affect our business, financial condition or results of operations. Our referral partners are a significant source of new business. In addition, in certain of the markets in which we conduct business, a substantial portion of our revenue is derived from long-term contracts. If we are unable to renew our referral partner and merchant contracts on favorable terms, or at all, our business, financial condition, or results of operations could be adversely affected.
We incur a chargeback liability when our merchants refuse to or cannot reimburse chargebacks resolved in favor of their customers. Any increase in chargebacks not paid by our merchants may adversely affect our business, financial condition, or results of operations.
In the event that a dispute between a cardholder and a merchant is not resolved in favor of the merchant, the transaction is normally charged back to the merchant and the purchase price is credited or otherwise refunded to the cardholder. If we are unable to collect such amounts from the merchant’s account or reserve account (if applicable), or if the merchant refuses or is unable, due to closure, bankruptcy, or other reasons, to reimburse us for a chargeback, we are responsible for the amount of the refund paid to the cardholder. The risk of chargebacks is typically greater with those merchants that promise future delivery of goods and services, rather than delivering goods or rendering services at the time of payment, as well as “card not present” transactions in which consumers are not physically present, such as eCommerce, telephonic, and mobile transactions. We may experience significant losses from chargebacks in the future. Any increase in chargebacks not paid by our merchants could have a material adverse effect on our business, financial condition, or results of operations. We have policies and procedures to manage merchant-related credit risks, such as requiring merchant cash reserve accounts and monitoring transaction activity. Notwithstanding our policies and procedures for managing credit risk, it is possible that a default on such obligations by one or more of our merchants could adversely affect our business, financial condition, or results of operations.
In addition, in certain cases, governmental authorities may seek to freeze or take possession of merchant cash reserves as part of an investigation or regulatory proceeding. When that happens, we may be unable to satisfy chargeback losses from the merchant cash reserves and may experience significant losses if we are required to satisfy chargeback losses from our own funds.
Failure to maintain or collect reimbursements from our financial institution referral partners could adversely affect our business.
Certain of our long-term referral arrangements with the financial institutions permit our partners to offer their merchant customers lower rates for processing services than we typically provide to the general market. If one of our bank partners elects to offer these lower rates, they are contractually required to reimburse us for the full amount of the discount provided
26
to their merchant customers. Notwithstanding such contractual commitments, there can be no assurance that these contractual provisions will fully protect us from potential losses should a bank partner default on its obligations to reimburse us or seek to discontinue such reimbursement obligations in the future. If we are unable to collect the full amount of any such reimbursements for any reason, we may incur losses. In addition, any discount provided by our financial institution partner may cause merchants in these markets to demand lower rates for our services in the future, which could further reduce our margins or cause us to lose merchants, either of which could adversely affect our business, financial condition, or results of operations.
Fraud by merchants or others could adversely affect our business, financial condition, or results of operations.
We may be liable for certain fraudulent transactions and credits initiated by merchants or others. For example, to the extent we were to process payments for a merchant that engaged in unfair or deceptive trade practices, we may be subject to enforcement actions by the Federal Trade Commission, other consumer protection agencies, state attorneys general, regulators or other governmental agencies. Examples of merchant fraud include merchants or other parties knowingly using a stolen or counterfeit credit or debit card, card number, or other credentials to record a false sales or credit transaction, processing an invalid card, or intentionally failing to deliver goods or services sold in an otherwise valid transaction. Criminals are using increasingly sophisticated methods to engage in illegal activities such as counterfeiting and fraud, especially through eCommerce transactions. Failure to effectively manage risk and prevent fraud could increase our chargeback liability or cause us to incur other liabilities, including if we are subject to enforcement action by a regulatory authority. It is possible that incidents of fraud could increase in the future. Increases in chargebacks or other liabilities could adversely affect our business, financial condition, or results of operations.
Because we rely on third-party vendors to provide products and services, we could be adversely impacted if they fail to fulfill their obligations.
We depend on third-party vendors and partners to provide us with certain products and services, including components of our computer systems, software, data centers, and telecommunications networks, to conduct our business. For example, we rely on third parties for services such as organizing and accumulating certain daily transaction data from each merchant and card issuer and forwarding the data to the relevant card network. We also rely on third parties for specific software and hardware used in providing our products and services. Some of these organizations and service providers are our competitors or provide similar services and technology to our competitors, and we do not have long-term or exclusive contracts with them. In addition, we rely on various financial institutions to provide clearing services in connection with our settlement activities. If these financial institutions stop providing clearing services, we would need to find other financial institutions to provide those services. If we were unable to do so we would no longer be able to provide processing services to certain merchants, which could adversely affect our business, financial condition, or results of operations.
The systems and operations of our third-party vendors and partners could be exposed to damage or interruption from, among other things, fire, natural disaster, power loss, telecommunications failure, unauthorized access, computer viruses, denial-of-service attacks, acts of terrorism, human error, vandalism or sabotage, financial insolvency, bankruptcy, and similar events. In addition, we may be unable to renew our existing contracts with our most significant vendors and partners or our vendors and partners may stop providing or otherwise supporting the products and services we obtain from them, and we may not be able to obtain these or similar products or services on the same or similar terms as our existing arrangements, if at all. The failure of our vendors and partners to perform their obligations and provide the products and services we obtain from them in a timely manner for any reason could adversely affect our operations and profitability due to, among other consequences:
|
· |
loss of revenues; |
|
· |
loss of merchants and partners; |
|
· |
loss of merchant and cardholder data; |
|
· |
fines imposed by card networks; |
27
|
· |
reputational harm; |
|
· |
exposure to fraud losses or other liabilities; |
|
· |
additional operating and development costs; or |
|
· |
diversion of management, technical, and other resources. |
We depend, in part, on our merchant and strategic relationships with various financial institutions and referral partners to grow our business. If we are unable to maintain these relationships, our business may be adversely affected.
We depend, in part, on our merchant relationships to grow our business. Our merchant processing agreements are our main source of revenue. Our failure to maintain or grow these relationships could adversely affect our business and result in a reduction of our revenue and profit.
We also rely on our various financial institution relationships, including our partnerships with Deutsche Bank USA, Deutsche Bank Group, PKO Bank Polski, Grupo Santander, Bank of Ireland, Raiffeisenbank, Citibanamex, Sabadell, Liberbank, and Moneta, among others, to grow our business. These relationships are structured in various ways, such as commercial alliance relationships, equity method investments, and joint ventures. We enter into long-term relationships with our bank partners where these partners typically provide exclusive referrals and credit facilities to fund our daily settlement obligations. These facilities are generally short term and at preferential interest rates. In some cases, our bank partners provide us with card network sponsorship, which enables us to route transactions under the bank’s control and identification numbers to clear card transactions through the card networks. Under the rules of the card networks, we are required to be a member of the network or sponsored through a member financial institution.
In addition, we rely on our various referral partners to grow our business. Our sales divisions work with a diverse mix of referral partners including ISVs, software dealers, and independent sales agents. These relationships generally consist of non-exclusive referral arrangements pursuant to which we pay our partners a referral fee based on profit generated by the merchants attributable to their referral.
We rely on the growth of our financial institution and referral partner relationships, and our ability to maintain these relationships, to support and grow our business. If we fail to maintain or renew these relationships, or our financial institution partners fail to maintain their brands or decrease the size of their branded networks, or our referral partners fail to penetrate their target markets or fail to remain competitive in such markets, our business may be adversely affected. Furthermore, failure to maintain our financial institution relationships may prevent us from obtaining settlement facilities at preferential terms, and we may be forced to secure alternative arrangements on less favorable terms. The loss of financial institution relationships or referral partners could adversely affect our business and result in a reduction of our revenue and profit.
Finally, we intend to grow our business by partnering with new financial institutions in our existing markets, as well as new markets. The inability to partner with new financial organizations may inhibit our growth prospects.
Our risk management policies and procedures may not be fully effective in mitigating our risk exposure in all market environments or against all types of risk.
We operate in a rapidly changing industry. Accordingly, our risk management policies and procedures may not be fully effective to identify, monitor, and manage all of the risks our business encounters. If our policies and procedures are not fully effective or we are not successful in identifying and mitigating the risks to which we are or may be exposed, we may suffer uninsured liability or harm to our reputation, or be subject to litigation or regulatory actions that could adversely affect our business, financial condition, or results of operations.
28
A significant number of our merchants are small- and medium-sized businesses or small affiliates of large companies, which can be more difficult and costly to retain than larger enterprises and may increase the impact of economic fluctuations on us.
We market and sell our products and services to, among others, SMEs and small affiliates of large companies. To continue to grow our revenue, we must add merchants, sell additional services to existing merchants, and encourage existing merchants to continue doing business with us. However, retaining SMEs can be more difficult than retaining large enterprises because SME merchants:
|
· |
often have higher rates of business failures and more limited resources; |
|
· |
are typically less sophisticated in their ability to make technology-related decisions based on factors other than price; |
|
· |
may have decisions related to the choice of payment processor dictated by their affiliated parent entity; and |
|
· |
are more able to change their payment processors than larger organizations dependent on our services. |
SMEs are typically more susceptible to the adverse effects of economic fluctuations. Adverse changes in the economic environment or business failures of our SME merchants may have a greater impact on us than on our competitors who do not focus on SMEs to the extent that we do. As a result, we may need to attract and retain new merchants at an accelerated rate or decrease our expenses to mitigate negative impacts in the event our SME merchants experience business declines due to economic trends or otherwise, failure of which may negatively impact our results of operations, financial condition, cash flows, or other business prospects.
Our business depends on strong and trusted brands in our markets and damage to our reputation, or the reputation of our partners, could adversely affect our business, financial condition, or results of operations.
We market our products and services under our brand, the brand of our partners or both, and we must protect and grow the value of our brands to continue to be successful in the future. If an incident were to occur that damaged our reputation, or the reputation of our partners, the value of our brands could be adversely affected and our business could be damaged.
Our operating results and operating metrics are subject to seasonality and volatility, which could result in fluctuations in our quarterly revenues and operating results or in perceptions of our business prospects.
We have experienced in the past, and expect to continue to experience, seasonal fluctuations in our revenue, which can vary by region. Our revenue has typically been strongest in our fourth quarter and weakest in our first quarter. Some variability results from seasonal retail events and the number of business days in a month or quarter. We also experience volatility in certain other metrics, such as number of transactions processed and payment processing volumes. Volatility in our key operating metrics or their rates of growth could result in fluctuations in financial condition or results of operations and may lead to adverse inferences about our business prospects, which could result in declines in our stock price.
Our ability to recruit, retain, and develop qualified personnel is critical to our success and growth.
All of our businesses function at the intersection of rapidly changing technological, social, economic, and regulatory environments that require a wide range of expertise and intellectual capital. For us to successfully compete and grow, we must recruit, retain, and develop personnel who can provide the necessary expertise across a broad spectrum of intellectual capital needs. In addition, we must develop, maintain and, as necessary, implement appropriate succession plans to assure we have the necessary human resources capable of maintaining continuity in our business. The market for qualified personnel is competitive, and we may not succeed in recruiting additional personnel or may fail to effectively replace current personnel who depart with qualified or effective successors. Our efforts to retain and develop personnel may also result in significant additional expenses, which could adversely affect our profitability. We cannot assure that key personnel, including our executive officers, will continue to be employed or that we will be able to attract and retain
29
qualified personnel in the future. Failure to recruit, retain, or develop qualified personnel could adversely affect our business, financial condition, or results of operations.
Our business may be adversely affected by geopolitical and other risks associated with operations outside of the United States and, as we continue to expand internationally, we may become more susceptible to these risks.
We offer merchant acquiring and processing services in many geographies outside of the United States, including in Canada, the Czech Republic, Germany, Ireland, Mexico, Poland, Spain, and the United Kingdom. We are subject to risks associated with operations in international markets, including changes in foreign governmental policies and requirements applicable to our business. In particular, some countries where we operate lack well-developed legal systems or have not adopted clear regulatory frameworks for the payment services industry. This lack of legal certainty exposes our operations to increased risks, including difficulty enforcing our agreements in those jurisdictions and increased risks of adverse actions by local government authorities, such as expropriations. As we continue to expand internationally, we may face challenges due to the presence of more established competitors and our lack of experience in certain non-U.S. markets.
In addition, our current and future financial institution partners in foreign jurisdictions, particularly in Europe, may be acquired, reorganized, or otherwise disposed of in the event of further market turmoil or losses in their loan portfolio that result in such financial institutions becoming less than adequately capitalized. Our revenue derived from these and other non-U.S. operations is subject to additional risks, including those resulting from social and geopolitical instability and unfavorable political or diplomatic developments, all of which could adversely affect our business, financial condition, or results of operations. A possible slowdown in global trade caused by increasing tariffs or other restrictions could decrease consumer or corporate confidence and reduce consumer, government, and corporate spending in countries outside the United States, which could adversely affect our foreign operations. Certain of our partners in foreign jurisdictions are also state-controlled entities, which may adversely affect our ability to seek redress for any contractual breach to the extent these partners can successfully claim sovereign immunity. In addition, in the event ongoing or future sovereign debt concerns in a particular country impact any such partner, our business could be negatively impacted.
We have significant operations in the United Kingdom and throughout Europe more generally. In June 2016, the United Kingdom held a referendum in which a majority of voters elected to withdraw from the EU, commonly referred to as “Brexit.” The United Kingdom formally left the EU on January 31, 2020, and is now in a transition period through December 31, 2020. Brexit has created significant uncertainty, including timing of withdrawal, the nature of any transition, implementation, or successor arrangements, and future trading arrangements between the U.K. and the EU, and may in the future have a material adverse effect on global economic conditions and the stability of the global financial markets. Asset valuations, currency exchange rates, and credit ratings may be especially subject to increased market volatility as a result. Lack of clarity about applicable future laws, regulations, or treaties as the United Kingdom finalizes its withdrawal, including financial laws and regulations, tax and free trade agreements, intellectual property rights, immigration and employment laws, and other rules that would apply to us and our subsidiaries, could increase our costs. If the United Kingdom and the EU are unable to negotiate acceptable withdrawal terms, barrier-free access between the United Kingdom and other EU member states or within the EEA overall could be diminished or eliminated. Any of these factors could have a material adverse effect on our business, financial condition, and results of operations.
If we are unable to successfully manage the foregoing risks relating to our business outside the United States, our business, prospects, financial condition, and results of operations could be adversely impacted.
A decline in the use of cards as a payment mechanism for consumers or other adverse developments with respect to the card industry in general may adversely impact us.
In order to consistently increase and maintain our profitability, consumers and businesses must continue to use electronic payment methods that we process, including credit and debit cards, and various factors may impact levels of use. For example, consumer credit risk may make it more difficult or expensive for consumers to gain access to credit facilities such as credit cards. Financial institutions may seek to charge their customers additional fees for use of credit or debit cards which could result in decreased use of credit or debit cards. In addition, various technology alternatives to credit and debit cards, such as digital wallets, have been introduced to the market and we expect that additional alternatives will be
30
developed. Any other development that impacts the cost, convenience, or quality of services of electronic payments could result in a decline in the use of credit and debit cards or other electronic payments. Any such decline may adversely impact our business, financial condition, and results of operations.
Increases in card network fees and other changes to fee arrangements may result in the loss of merchants or a reduction in our earnings.
From time to time, card networks, including Visa and Mastercard, increase the fees that they charge processors. We could attempt to pass these increases along to our merchants but this strategy might result in the loss of merchants to our competitors who do not pass along the increases. If competitive practices prevent us from passing along the higher fees to our merchants in the future, we may have to absorb all or a portion of such increases, which may increase our operating costs and reduce our earnings.
In addition, in certain of our markets, card issuers pay merchant acquirers fees based on debit card usage in an effort to encourage debit card use. If this practice were discontinued, our revenue and margins in jurisdictions where we receive these fees would be adversely affected.
If we fail to comply with the applicable requirements of card networks, they could seek to fine us, suspend us or terminate our registrations. If our merchants or sales partners incur fines or penalties that we cannot collect from them, we may have to bear the cost of such fines or penalties.
In order to provide our transaction processing services, several of our subsidiaries are registered with Visa and Mastercard and other card networks as members or service providers for member institutions. Visa, Mastercard and other card networks set rules and standards with which we must comply. Although these rules are not government regulations, any failure to comply with the networks’ requirements or to pay the fines they impose could cause the termination of our registration or status as a certified service provider and require us to stop providing payment processing services.
The card network rules subject us and our merchants to a variety of fines or penalties for certain acts or omissions by us or our merchants. The rules of card networks are set by their boards, which include members that are card issuers that directly or indirectly sell processing services to merchants in competition with us. There is a risk that these members could use their influence to enact changes to the card network rules or policies that are detrimental to us. Any changes in network rules or standards that increase the cost of doing business or limit our ability to provide processing services to our merchants will adversely affect the operation of our business. In addition, card networks and their member financial institutions regularly update, and generally expand, security expectations and requirements related to the security of cardholder data and environment. Under certain circumstances, we are required to report incidents to the card networks within a specified time frame.
In addition, if a merchant or sales partner fails to comply with the applicable requirements of card networks, it could be subject to a variety of fines or penalties that may be levied by card networks. We may have to bear the cost of such fines or penalties if we are unable to collect them from the applicable merchant or sales partner. The termination of our member registration, any change in our status as a service provider or merchant processor, or any changes in network rules or standards could prevent us from providing processing services relating to the affected card network and could adversely affect our business, financial condition, or results of operations.
Financial risks
Our results of operations may be adversely affected by changes in foreign currency exchange rates.
Revenue and profit generated by our non-U.S. operations will increase or decrease compared to prior periods as a result of changes in foreign currency exchange rates and the impact may be significant. For example, revenue generated by our non-U.S. operations represented approximately 60% of our total revenue for the year ended December 31, 2019, and a hypothetical uniform 10% weakening of the local currencies of our non-U.S. operations would result in an increase of approximately $4.9 million in pretax loss for the year ended December 31, 2019. A greater portion of our revenue is
31
generated outside the United States as compared to certain of our competitors and, as such, foreign currency exchange rates may have a more significant impact on our results.
In addition, we may become subject to exchange control regulations that restrict or prohibit the conversion of our other revenue currencies into U.S. dollars. Any of these factors could decrease the value of revenues and earnings we derive from our non-U.S. operations and adversely affect our business.
While we currently have some degree of diversification in foreign currency, we may seek to reduce our exposure to fluctuations in foreign currency exchange rates in the future through the use of hedging arrangements. To the extent that we hedge our foreign currency exchange rate exposure in the future, we will forgo the benefits we would otherwise experience if foreign currency exchange rates changed in our favor. No strategy can completely insulate us from risks associated with such fluctuations and our currency exchange rate risk management activities could expose us to substantial losses if such rates move materially differently from our expectations.
Our balance sheet includes significant amounts of goodwill and intangible assets. The impairment of a significant portion of these assets would negatively affect our business, financial condition, or results of operations.
As a result of our prior acquisitions, a significant portion of our total assets consists of intangible assets (including goodwill). Goodwill and intangible assets, net of amortization, together accounted for approximately 37% of total assets on our balance sheet as of December 31, 2019. To the extent we engage in additional acquisitions, we may recognize additional intangible assets and goodwill. We evaluate on a regular basis whether all or a portion of our goodwill and other intangible assets may be impaired. Under current accounting rules, any determination that impairment has occurred would require us to record an impairment charge. An impairment of a significant portion of goodwill or intangible assets could adversely affect our stock price, business, financial condition, or results of operations.
If our business does not perform well, we may be required to establish a valuation allowance against the deferred tax assets, which will negatively impact the results of our operations.
We have substantial amounts of deferred tax assets on our balance sheet. The evaluation of realizability of these assets requires us to make significant assumptions related to forecasted revenues and taxable income in the appropriate tax jurisdiction. Estimated future taxable income can be sensitive to changes in the assumed revenue growth rate and expected operating margin, which are affected by expectations about future market conditions and are inherently uncertain due to their forward-looking nature. Future events could cause us to conclude that impairment indicators exist and may require us to record a valuation allowance. Any significant impairment loss would have an adverse impact on our reported earnings in the period in which the charge is recognized.
Our substantial indebtedness could adversely affect our ability to raise additional capital to fund our operations, limit our ability to react to changes in the economy or our industry, expose us to interest rate risk, and prevent us from meeting our debt obligations.
Our substantial indebtedness could have adverse consequences, including:
|
· |
increasing our vulnerability to adverse economic, industry, or competitive developments; |
|
· |
requiring a substantial portion of cash flow from operations to be dedicated to the payment of principal and interest on our indebtedness, thereby reducing our ability to use cash flow to fund our operations, capital expenditures, and future business opportunities; |
|
· |
making it more difficult for us to satisfy our obligations with respect to our indebtedness, including restrictive covenants and borrowing conditions, which could result in an event of default under the agreements governing such indebtedness; |
|
· |
restricting us from making strategic acquisitions, making it more difficult to structure new partnerships or joint ventures, or causing us to make non-strategic divestitures; |
32
|
· |
making it more difficult for us to obtain network sponsorship and clearing services from financial institutions or to obtain or retain other business with financial institutions; |
|
· |
limiting our ability to obtain additional financing for working capital, capital expenditures, product development, debt service requirements, acquisitions, and general corporate or other purposes; or |
|
· |
limiting our flexibility in planning for, or reacting to, changes in our business or market conditions and placing us at a competitive disadvantage compared to our competitors who are less highly leveraged and who, therefore, may be able to take advantage of opportunities in which our leverage prevents us from participating. |
Successful execution of our business strategy is dependent in part upon our ability to manage our capital structure to reduce interest expense, have access to sufficient liquidity, and enhance free cash flow generation. We are party to a first lien Senior Secured Credit Facility pursuant to a credit agreement dated December 22, 2016, as amended (our “Senior Secured Credit Facilities”). As of December 31, 2019, our Senior Secured Credit Facilities include revolver commitments of $200.0 million and a term loan of $665.0 million that are scheduled to mature in June 2023 and December 2023, respectively. We may not be able to refinance our Senior Secured Credit Facilities or our other existing indebtedness at or prior to their maturity at attractive rates of interest because of our high levels of debt, debt incurrence restrictions under our debt agreements, or because of adverse conditions in credit markets generally. We also have the ability to further increase our indebtedness by borrowing additional amounts on the Senior Secured Credit Facilities.
In addition, certain of our borrowings, including borrowings under our Senior Secured Credit Facilities, are at variable rates of interest. If interest rates increase, the interest payment obligations under our variable rate indebtedness will increase even if the amount borrowed remains the same. The condition of the financial and credit markets and prevailing interest rates have fluctuated in the past and are likely to fluctuate in the future. In addition, developments in our business and operations could lead to a ratings downgrade for us. As of December 31, 2019, we had $707.8 million aggregate principal amount of variable rate indebtedness. As a result, as of December 31, 2019, the impact of a 100 basis point increase in interest rates would have increased our annual interest expense by approximately $7.1 million.
Any such fluctuation in the financial and credit markets, or in the credit rating of us or our subsidiaries, may impact our ability to access debt markets in the future or increase our cost of current or future debt, which could adversely affect our business, financial condition, or results of operations.
We may be required to purchase the remainder of our eService subsidiary in Poland.
In December 2013, we acquired a 66% ownership interest in Centrum Elektronicznych Uslug Platniczych eService Sp. z o.o., or eService, from PKO Bank Polski. In connection with the purchase, we granted a put option to PKO Bank Polski that, if exercised, could force us to buy the remainder of the business at the then-current market price. If we are forced to purchase the remainder of our eService subsidiary at a time in which it is not otherwise in our best interest to do so, our business, including our liquidity, could be adversely affected.
Changes in the method pursuant to which the London Interbank Offered Rate (“LIBOR”) is determined and the transition to other benchmarks may adversely affect our results of operations.
LIBOR and certain other “benchmarks” have been the subject of continuing national, international, and other regulatory guidance and proposals for reform. These reforms may cause such benchmarks to perform differently than in the past or have other consequences which cannot be predicted. In July 2017, the United Kingdom’s Financial Conduct Authority, which regulates LIBOR, publicly announced that it intends to stop persuading or compelling banks to submit LIBOR rates after 2021. To identify a successor rate for U.S. dollar LIBOR, the Alternative Reference Rates Committee or ARRC, a U.S. based group convened by the Federal Reserve Board and the Federal Reserve Bank of New York, was formed. The ARRC is comprised of a diverse set of private-sector entities and a wide array of official-sector entities, banking regulators, and other financial sector regulators. The ARRC has identified the Secured Overnight Financing Rate or SOFR as its preferred alternative rate for LIBOR. SOFR is a measure of the cost of borrowing cash overnight, collateralized by U.S. Treasury securities, and is based on directly observable U.S. Treasury-backed repurchase transactions. Financial regulators
33
in the United Kingdom, the European Union, Japan, and Switzerland also have formed working groups with the aim of recommending alternatives to LIBOR denominated in their local currencies. Although SOFR appears to be the preferred replacement rate for U.S. dollar LIBOR, it is unclear if other benchmarks may emerge or if other rates will be adopted outside of the United States.
As of December 31, 2019, approximately $707.8 million of our outstanding indebtedness had interest rate payments determined directly or indirectly based on LIBOR or the U.S. prime rate. Uncertainty regarding the continued use and reliability of LIBOR as a benchmark interest rate could adversely affect the performance of LIBOR relative to its historic values. Even if financial instruments are transitioned to alternative benchmarks, such as SOFR, successfully, the new benchmarks are likely to differ from LIBOR, and our interest expense associated with our outstanding indebtedness or any future indebtedness we incur may increase. Further, transitioning to an alternative benchmark rate, such as SOFR, may result in us incurring significant expense and legal risks, as renegotiation and changes to documentation may be required in effecting the transition. Any alternative benchmark rate may be calculated differently than LIBOR and may increase the interest expense associated with our existing or future indebtedness. In addition, it is possible that LIBOR quotes will become unavailable prior to 2021, in which case risks associated with the transition away from LIBOR would be accelerated.
Any of these occurrences could materially and adversely affect our borrowing costs, financial condition, and results of operations.
Restrictions imposed by our Senior Secured Credit Facilities and our other outstanding indebtedness may materially limit our ability to operate our business and finance our future operations or capital needs.
The terms of our Senior Secured Credit Facilities restrict us and our restricted subsidiaries, which currently include all of our operating subsidiaries, from engaging in specified types of transactions. These covenants impose certain limitations, subject to certain exceptions, on our ability, and that of our restricted subsidiaries, to, among other things:
|
· |
incur indebtedness; |
|
· |
create liens; |
|
· |
engage in mergers or consolidations; |
|
· |
make investments, loans, and advances; |
|
· |
pay dividends and distributions and repurchase capital stock; |
|
· |
sell assets; |
|
· |
engage in certain transactions with affiliates; |
|
· |
enter into sale and leaseback transactions; |
|
· |
make certain accounting changes; and |
|
· |
make prepayments on junior indebtedness. |
In addition, the credit agreements governing our Senior Secured Credit Facilities contain a springing maximum total leverage ratio financial covenant. See Part II, Item 7, “Management’s Discussion and Analysis of Financial Condition and Results of Operations.” A breach of any of these covenants (or any other covenant in the documents governing our Senior Secured Credit Facilities) could result in a default or event of default under our Senior Secured Credit Facilities. If any event of default under our Senior Secured Credit Facilities occurred, the applicable lenders or agents could elect to terminate borrowing commitments and declare all borrowings and loans outstanding thereunder, together with accrued and unpaid interest and any fees and other obligations, to be immediately due and payable. In addition, or in the alternative,
34
the applicable lenders or agents could exercise their rights under the security documents entered into in connection with our Senior Secured Credit Facilities. Subject to certain exceptions specified in our Senior Secured Credit Facilities, we have pledged substantially all of our U.S. assets as collateral securing our Senior Secured Credit Facilities and any such exercise of remedies on any material portion of such collateral would materially and adversely affect our financial condition and our ability to continue operations.
If we were unable to repay or otherwise refinance these borrowings and loans when due, and the applicable lenders proceeded against the collateral granted to them to secure that indebtedness, we may be forced into bankruptcy or liquidation. In the event the applicable lenders accelerate the repayment of our borrowings, we may not have sufficient assets to repay that indebtedness. Any acceleration of amounts due under our Senior Secured Credit Facilities would likely have a material adverse effect on us.
Accelerated funding programs increase our working capital requirements and expose us to incremental credit risk, and if we are unable to access or raise sufficient liquidity to address these funding programs we may be exposed to additional competitive risk.
In response to demand from our merchants and competitive offerings, we offer certain of our merchants various accelerated funding programs which are designed to enable qualified participating merchants to receive their deposits from credit card transactions in an expedited manner. These programs increase our working capital requirements and expose us to incremental credit risk related to our merchants, which could constrain our ability to raise additional capital to fund our operations and adversely affect our business, financial condition, and results of operations. Our inability to access or raise sufficient liquidity to address our needs in connection with the anticipated expansion of such advance funding programs could put us at a competitive disadvantage by restricting our ability to offer programs to all of our merchants similar to those made available by our various competitors.
Legal and regulatory risks
Failure to comply with anti-corruption, anti-money laundering, economic and trade sanctions regulations, and similar laws and regulations could subject us to penalties and other adverse consequences.
We operate our business in various countries where certain business practices are prohibited by U.S., foreign, and other laws and regulations applicable to us. We are subject to anti-corruption laws and regulations, including the FCPA, the U.K. Bribery Act, and other laws that prohibit the making or offering of improper payments. These laws prohibit improper payments or offers, including payments to foreign governments, officials, and business entities for the purpose of obtaining or retaining business. We have implemented policies, procedures, systems, and controls designed to identify and address potentially impermissible transactions under such laws and regulations; however, there can be no assurance that our employees, consultants, and agents, including those that may be based in or from countries where practices that violate U.S. or other laws may be customary, will not take actions in violation of our policies for which we may be ultimately responsible.
In addition, we are subject to certain anti-money laundering laws and regulations. In some jurisdictions, we are directly subject to these regulations. In other cases, we are contractually required to comply with certain regulations to which our bank partners are subject. These regulations, including the Bank Secrecy Act, as amended by the USA PATRIOT Act of 2001, and the EU Anti-Money Laundering Directive typically require businesses to develop and implement risk-based anti-money laundering programs, report large cash transactions and suspicious activity, and maintain transaction records.
We are also subject to certain economic and trade sanctions programs administered by OFAC and similar foreign governmental agencies, which prohibit or restrict transactions with specified countries, governments, and, in certain circumstances, nationals, as well as narcotics traffickers and terrorists or terrorist organizations. Other group entities may be subject to additional foreign or local sanctions requirements in other relevant jurisdictions.
Similar anti-money laundering and counter terrorist financing and proceeds of crime laws apply to movements of currency and payments through electronic transactions and to dealings with persons specified in lists maintained by the country
35
equivalents to OFAC lists in several other countries and require specific data retention obligations to be observed by intermediaries in the payment process. Our businesses in those jurisdictions are subject to those data retention obligations.
Failure to comply with any of these laws or regulations or changes in this legal or regulatory environment, including changing interpretations and the implementation of new or varying regulatory requirements by the government, may result in significant financial penalties, reputational harm, or change the manner in which we currently conduct some aspects of our business, which could adversely affect our business, financial condition, or results of operations.
We are subject to governmental regulation and other legal obligations, particularly related to privacy, data protection, and information security, as well as consumer protection laws across different markets where we conduct our business. Our actual or perceived failure to comply with such obligations could harm our business.
Privacy and data security have become significant issues in North America, Europe, and in many other jurisdictions where we may conduct our operations in the future. As we receive, collect, process, use, and store personal and confidential data, we are subject to diverse laws and regulations relating to data privacy and security, including, in the United States, local state laws such as the CCPA, and, in the EU and the European Economic Area (the “EEA”), GDPR.
The CCPA became effective on January 1, 2020 and establishes strict data privacy and data protection requirements for the data of California residents. The CCPA has been amended and it is likely that further amendments will be proposed to this legislation. As such, it remains unclear how certain provisions of the CCPA will be interpreted and enforced.
GDPR generally took effect in Europe in May 2018. GDPR is directly applicable in each EU member state and applies to companies established in the EU, as well as companies that collect and use personal data to offer goods or services to, or monitor the behavior of, individuals in the EU. GDPR applies more stringent data protection obligations for processors and controllers of personal data, and penalties and fines for failure to comply with GDPR are significant, including fines of up to €20 million, or 4% of total worldwide annual turnover (revenue), whichever is higher. Compliance with these privacy and data security requirements is rigorous and time-intensive and may increase our cost of doing business. Failure to comply with these requirements, or any other laws or regulations applicable to our business, may expose us to fines and other penalties, litigation, and reputational harm, any of which could materially and adversely affect our business, financial condition, and results of operations.
The regulatory framework for the receipt, collection, processing, use, safeguarding, and sharing and transfer of personal and confidential data is rapidly evolving and is likely to remain uncertain for the foreseeable future as new global privacy rules are enacted and existing ones are updated and strengthened. New or evolving regulations could require us to modify our systems, products, or processes, possibly in a material manner, and could limit our ability to develop new services and features.
Failure to enforce and defend our intellectual property rights may diminish our competitive advantages or interfere with our ability to market and promote our products and services.
Our trademarks, trade names, trade secrets, know-how, proprietary technology, and other intellectual property are important to our future success, including the rights associated with our EVO, BOIPA, and eService trademarks and trade names, among others. We believe our trademarks and trade names are widely recognized and associated with quality and reliable service. While it is our policy to vigorously defend our intellectual property, there can be no assurance that the steps we have taken to protect our intellectual property will be adequate to prevent infringement, misappropriation, or other violations. We also cannot guarantee that others will not independently develop technology with the same or similar functions as the proprietary technology we rely on to conduct our business and differentiate ourselves from our competitors. Furthermore, we may face claims of infringement of third-party intellectual property that could interfere with our ability to market and promote our products and services. Any litigation to enforce our intellectual property rights or defend ourselves against claims of infringement of third-party intellectual property rights could be costly, divert attention of management, and may not ultimately be resolved in our favor. Moreover, if we are unable to successfully defend against claims that we have infringed the intellectual property rights of others, we may be prevented from using certain intellectual property and may be liable for damages, which in turn could have a material adverse effect on our business, financial condition, or results of operations. In addition, the laws of certain non-U.S. countries where we do business or may do
36
business in the future may not recognize intellectual property rights or protect them to the same extent as do the laws of the United States.
We may be adversely impacted by new or revised tax regulations or their interpretations, or by becoming subject to additional foreign or U.S. federal, state, or local taxes that cannot be passed through to our merchants or partners.
We are subject to tax laws in each jurisdiction where we do business. Changes in tax laws or their interpretation could decrease the amount of revenues we receive, the value of any tax loss carry-forwards and tax credits recorded on our balance sheet, and the amount of our cash flow or net income, and adversely affect our business, financial condition, or results of operations. In addition, our financial results could be adversely impacted if we become subject to new or additional taxes that cannot be passed through to our merchants or partners.
U.S. tax legislation enacted in 2017 has significantly changed the U.S. federal income taxation of U.S. corporations, including by reducing the U.S. corporate income tax rate, limiting interest deductions, permitting immediate expensing of certain capital expenditures, adopting elements of a territorial tax system, imposing a one-time transition tax, or repatriation tax, on all undistributed earnings and profits of certain U.S.-owned foreign corporations, revising the rules governing net operating losses and the rules governing foreign tax credits, and introducing new anti-base erosion provisions. Many of these changes became effective immediately, without any transition periods or grandfathering of existing transactions. The legislation is unclear in many respects and could be subject to potential amendments and technical corrections, as well as interpretations and implementing regulations by the Internal Revenue Service (the “IRS”), any of which could lessen or increase certain adverse impacts of the legislation. In addition, it is unclear how these changes will affect state and local taxation, which often use federal taxable income as a starting point for computing state and local tax liabilities. While some of the changes made by the 2017 tax legislation may adversely affect us in one or more reporting periods and prospectively, other changes may be beneficial on a going forward basis.
In addition to changes in tax regulations or interpretations, our future effective tax rates could be subject to volatility or adversely affected by a number of factors, including:
|
· |
allocation of expenses to and among different jurisdictions; |
|
· |
changes in the valuation of our deferred tax assets and liabilities; |
|
· |
expected timing and amount of the release of any tax valuation allowances; |
|
· |
tax effects of stock-based compensation; and |
|
· |
mix of future earnings and tax liabilities recognized in foreign jurisdictions at varying rates versus U.S. federal, state, and local income taxes. |
In addition, we may be subject to audits of our income, sales, and other taxes by U.S. federal, state, and local, as well as foreign taxing authorities. Outcomes from these audits could have an adverse effect on our business, results of operations, and financial condition.
Failure to comply with, or changes in, laws, regulations, and enforcement activities may adversely affect our products, services, and the markets in which we operate.
We and our merchants are subject to laws and regulations that affect the electronic payments industry in the many countries in which our services are used. Our merchants are subject to numerous laws and regulations applicable to banks, financial institutions, and card issuers in the United States and abroad, and, consequently, we are at times affected by these foreign, federal, state, and local laws and regulations. A number of our subsidiaries in our European segment hold a PI license, allowing them to operate in the EU member states in which such subsidiaries do business. As a PI, we are subject to regulation and oversight in the applicable EU member states, which includes, among other obligations, a requirement to maintain specific regulatory capital and adhere to certain rules regarding the conduct of our business, including PSD2.
37
PSD2 contains a number of additional regulatory provisions and deadlines, such as provisions relating to SCA, which will require industry wide systems upgrades.
See “Item 1. Business—Regulatory” for more information on certain laws and regulations to which we are subject. In addition, the U.S. government has increased its scrutiny of a number of credit card practices from which some of our merchants derive significant revenue. Regulation of the payments industry, including regulations applicable to us and our merchants, has also increased significantly in recent years.
We are also subject to U.S. and international financial services regulations, a myriad of consumer protection laws, including economic sanctions, laws and regulations, anticorruption laws, escheat regulations, and privacy and information security regulations. In addition, certain of our alliance partners are subject to regulation by federal and state authorities and, as a result, could pass through some of those compliance obligations to us, which could adversely affect our business, financial condition, or results of operations.
Failure to comply with laws and regulations could damage our reputation, result in the suspension or revocation of licenses and registrations (including our PI licenses), and subject us to enforcement or criminal actions or penalties, including fines. A loss of our PI licenses would prevent us from operating our business in the EU. In addition, we are subject to the rules of Mastercard, Visa, and other credit and debit networks. Although these rules are not government regulations, any failure to comply with the networks’ requirements or to pay the fines they impose could cause the termination of our registrations and require us to stop providing payment processing services. Violations of law by our merchants and partners could impact our ability to operate our business and could threaten our licenses and registrations. Any of the foregoing could adversely affect our ability to operate our business, our financial condition, or results of operations.
Changes to regulations that are applicable to us, our merchants, our partners, or the card networks could require us to make capital investments to modify our processes or services and could reduce the fees we are able to charge our merchants. Regulations could also result in greater pricing transparency and increased price-based competition leading to lower margins and higher rates of merchant attrition. Furthermore, any regulatory change that results in modifications to our merchants’ business practices could change the demand for our services and alter the type or volume of transactions that we process on behalf of our merchants. Any of the foregoing could adversely impact our business, financial condition, or results of operations.
From time to time we are subject to various legal proceedings which could adversely affect our business, financial condition, or results of operations.
We are involved in various litigation matters. We are also involved in, or are the subject of, governmental or regulatory agency inquiries or investigations and make voluntary self-disclosures to government or regulatory agencies from time to time. Our insurance or indemnities may not cover all claims that may be asserted against us and any claims asserted against us, regardless of merit or eventual outcome, may harm our reputation. If we are unsuccessful in our defense in these litigation matters, or any other legal proceeding, we may be forced to pay damages or fines, enter into consent decrees or change our business practices, any of which could adversely affect our business, financial condition, or results of operations.
Risks related to our organizational structure
Our principal asset is our interest in EVO, LLC, and, as a result, we depend on distributions from EVO, LLC to pay our taxes and expenses, including payments under the tax receivable agreement with the Continuing LLC Owners (the “TRA”). EVO, LLC’s ability to make such distributions may be subject to various limitations and restrictions.
We are a holding company and have no material assets other than our ownership of LLC Interests. As such, we have no independent means of generating revenue or cash flow, and our ability to pay our taxes and operating expenses or declare and pay dividends in the future, if any, will be dependent upon the financial results and cash flows of EVO, LLC and its subsidiaries and distributions we receive from EVO, LLC. There can be no assurance that our subsidiaries will generate sufficient cash flow to distribute funds to us or that applicable state law and contractual restrictions, including negative
38
covenants in our debt instruments, will permit such distributions. Although EVO, LLC is not currently subject to any debt instruments or other agreements that would restrict its ability to make distributions to EVO, Inc., the terms of our Senior Secured Credit Facilities restrict the ability of our subsidiary, EVO Payments International, LLC, and certain of its subsidiaries to pay dividends to EVO, LLC.
EVO, LLC will continue to report as a partnership for U.S. federal income tax purposes and, as such, will not be subject to any entity-level U.S. federal income tax. Instead, any taxable income of EVO, LLC will be allocated to holders of LLC Interests, including us. Accordingly, we will incur income taxes on our allocable share of any net taxable income of EVO, LLC. Under the terms of its limited liability company agreement, EVO, LLC will be obligated to make tax distributions to holders of LLC Interests, including us. In addition to tax expenses, we may also incur expenses related to our operations. We intend, as its managing member, to cause EVO, LLC to make cash distributions to the owners of LLC Interests in an amount sufficient to (1) fund all or part of their tax obligations in respect of taxable income allocated to them, including as applicable, payments under the TRA, which could be significant, and (2) cover our operating expenses. However, EVO, LLC’s ability to make such distributions may be subject to various limitations and restrictions, such as restrictions on distributions that would violate applicable law or any agreement to which EVO, LLC is then a party, including debt agreements, or that would have the effect of rendering EVO, LLC insolvent. If we do not have sufficient funds to pay taxes or other liabilities or to fund our operations, we may have to borrow funds, which could materially and adversely affect our liquidity and financial condition and subject us to various restrictions imposed by lenders. To the extent we are unable to make timely payments under the TRA for any reason, such payments generally will be deferred and will accrue interest until paid; provided, however, that nonpayment for a specified period may constitute a material breach that would accelerate payments due under the TRA. In addition, if EVO, LLC does not have sufficient funds to make distributions, our ability to declare and pay cash dividends will also be restricted or impaired. See “—Risks related to ownership of our Class A common stock” and “Market for Registrant’s Common Equity and Related Stockholder Matters and Issuer Purchases of Equity Securities—Dividend policy.”
The TRA requires us to make cash payments to the Continuing LLC Owners in respect of certain tax benefits to which we may become entitled, and we expect that those payments will be substantial.
Under the TRA, we are required to make cash payments to the Continuing LLC Owners equal to 85% of the tax benefits, if any, that we actually realize, or in certain circumstances are deemed to realize, as a result of (1) the increases in our share of the tax basis of assets of EVO, LLC resulting from any purchases or redemptions of LLC Interests from the Continuing LLC Owners or exchanges by the Continuing LLC Owners of LLC Interests (and paired Class C common stock or paired Class D common stock) for Class A common stock, and (2) certain other tax benefits related to our making payments under the TRA. In general, we are obligated to fund these payments over time on a pro rata basis to the extent we have realized or are deemed to realize tax benefits. We expect that the amount of the cash payments required under the TRA will be significant. Any payments made by us to the Continuing LLC Owners under the TRA will generally reduce the amount of overall cash flow that might have otherwise been available to us. Furthermore, our future obligation to make payments under the TRA could make us a less attractive target for an acquisition, particularly in the case of an acquirer that cannot use some or all of the tax benefits that are the subject of the TRA.
The actual amount and timing of any payments under the TRA will vary depending upon a number of factors, including the timing of redemptions or exchanges by the holders of LLC Interests, the amount of gain recognized by such holders of LLC Interests, the amount and timing of the taxable income allocated to us or otherwise generated by us in the future, and the federal tax rates then applicable.
Our organizational structure, including the TRA, confers certain benefits upon the Continuing LLC Owners that do not benefit holders of our Class A common stock to the same extent that they benefit the Continuing LLC Owners.
Our organizational structure, including the TRA, confers certain benefits upon the Continuing LLC Owners that do not benefit the holders of our Class A common stock to the same extent, such as the payment by EVO, Inc. to the Continuing LLC Owners of 85% of the amount of certain tax benefits, discussed above. Although EVO, Inc. retains 15% of the amount of such tax benefits, this and other aspects of our organizational structure that benefit the Continuing LLC Owners may adversely impact the future trading market for the Class A common stock.
39
In certain cases, payments under the TRA to the Continuing LLC Owners may be accelerated or significantly exceed any actual benefits we realize in respect of the tax attributes subject to the TRA.
The TRA provides that, upon certain mergers, asset sales, business combinations, or changes of control transactions, or the early termination of the TRA at our election, payments to the Continuing LLC Owners under the TRA are based on certain assumptions, including an assumption that we will have sufficient taxable income to fully utilize the potential future tax benefits that are subject to the TRA.
As a result, (1) we could be required to make payments under the TRA that are greater than the specified percentage of any actual tax benefits we ultimately realize and (2) if we elect to terminate the TRA early, we would be required to make an immediate cash payment equal to the present value of the anticipated future tax benefits that are the subject of the TRA, based on certain assumptions, which payment may occur significantly in advance of the actual realization of such future tax benefits, if any. In these situations, our obligations under the TRA could have a substantial negative impact on our liquidity and could have the effect of delaying, deferring, or preventing certain mergers, asset sales, other forms of business combinations, or other changes of control. There can be no assurance that we will be able to fund or finance our obligations under the TRA.
We will not be reimbursed for any payments made to the Continuing LLC Owners under the TRA in the event that any tax benefits are disallowed.
Payments under the TRA will be based on the tax reporting positions that we determine. The IRS or another tax authority may challenge all or part of the tax basis increases or other tax benefits we claim, as well as other related tax positions we take, and a court could sustain such challenge. If the outcome of any such challenge would reasonably be expected to materially affect a recipient’s payments under the TRA, then we will not be permitted to settle or fail to contest such challenge without the consent (not to be unreasonably withheld or delayed) of each Continuing LLC Owner that owns at least 10% of the outstanding LLC Interests. The interests of the Continuing LLC Owners in any such challenge may differ from or conflict with our interests or the interests of holders of our Class A common stock and therefore the exercise of their consent rights may be adverse to our interests and the interests of holders of our Class A common stock. We will not be reimbursed for any cash payments previously made to the Continuing LLC Owners under the TRA in the event that any tax benefits initially claimed by us and for which payment has been made to a Continuing LLC Owner are subsequently challenged by a taxing authority and are ultimately disallowed. Instead, any excess cash payments made by us to a Continuing LLC Owner will be netted against any future cash payments that we might otherwise be required to make to such Continuing LLC Owner under the terms of the TRA. However, we may not determine that we have effectively made an excess cash payment to a Continuing LLC Owner for a number of years following the initial time of such payment and, if any of our tax reporting positions are challenged by a taxing authority, we will not be permitted to reduce any future cash payments under the TRA until any such challenge is finally settled or determined. Moreover, the excess cash payments we previously made under the TRA could be greater than the amount of future cash payments against which we would otherwise be permitted to net such excess. As a result, payments could be made under the TRA significantly in excess of any tax savings that we realize in respect of the tax attributes with respect to a Continuing LLC Owner that are the subject of the TRA.
If we were deemed to be an investment company under the Investment Company Act of 1940, as amended (the “1940 Act”), as a result of our ownership of EVO, LLC, applicable restrictions could make it impractical for us to continue our business as contemplated and could have a material adverse effect on our business.
Under Sections 3(a)(1)(A) and (C) of the 1940 Act, a company generally will be deemed to be an “investment company” for purposes of the 1940 Act if it (1) is, or holds itself out as being, engaged primarily, or proposes to engage primarily, in the business of investing, reinvesting, or trading in securities or (2) engages, or proposes to engage, in the business of investing, reinvesting, owning, holding, or trading in securities and it owns or proposes to acquire investment securities having a value exceeding 40% of the value of its total assets (exclusive of U.S. government securities and cash items) on an unconsolidated basis. We do not believe that we are an “investment company,” as such term is defined under the 1940 Act.
40
As the sole managing member of EVO, LLC, we control and operate EVO, LLC. On that basis, we believe that our interest in EVO, LLC is not an “investment security” as that term is used in the 1940 Act. However, if we were to cease participation in the management of EVO, LLC, our interest in EVO, LLC could be deemed an “investment security” for purposes of the 1940 Act.
We and EVO, LLC intend to conduct our operations so that we will not be deemed an investment company. However, if we were to be deemed an investment company, restrictions imposed by the 1940 Act, including limitations on our capital structure and our ability to transact with affiliates, could make it impractical for us to continue our business as contemplated and could have a material adverse effect on our business.
Risks related to ownership of our Class A common stock
The Continuing LLC Owners have significant influence over us.
The Continuing LLC Owners control a significant portion of the voting power represented by all our outstanding classes of stock. As a result, the Continuing LLC Owners exercise significant influence over all matters requiring stockholder approval, including the election of directors, amendment of our certificate of incorporation, and approval of significant corporate transactions, and will continue to have significant control over our management and policies. Three members of our board of directors are Continuing LLC Owners or are affiliated with our Continuing LLC Owners. The Continuing LLC Owners can take actions that have the effect of delaying or preventing a change of control of us or discouraging others from making tender offers for our shares, which could prevent stockholders from receiving a premium for their shares. These actions may be taken even if other stockholders oppose them. In addition, the concentration of voting power with the Continuing LLC Owners may have an adverse effect on the price of our Class A common stock and the interests of the Continuing LLC Owners may not be consistent with the interests of our Class A stockholders.
Certain provisions of Delaware law and antitakeover provisions in our organizational documents could delay or prevent a change of control.
Certain provisions of Delaware law and our amended and restated certificate of incorporation and amended and restated bylaws may have an antitakeover effect and may delay, defer, or prevent a merger, acquisition, tender offer, takeover attempt, or other change of control transaction that a stockholder might consider in its best interest, including those attempts that might result in a premium over the market price for the shares held by our stockholders. These provisions provide for, among other things:
|
· |
a multi-class common stock structure; |
|
· |
a classified board of directors with staggered three-year terms; |
|
· |
the ability of our board of directors to issue one or more series of preferred stock; |
|
· |
advance notice for nominations of directors by stockholders and for stockholders to include matters to be considered at our annual meetings; |
|
· |
certain limitations on convening special stockholder meetings; |
|
· |
a prohibition on cumulative voting in the election of directors; |
|
· |
the removal of directors only for cause and only upon the affirmative vote of the holders of at least 66 2/3% of the voting power represented by our then-outstanding common stock; and |
|
· |
amendment of certain provisions of our certificate of incorporation only by the affirmative vote of at least 66 2/3% of the voting power represented by our then-outstanding common stock. |
41
These provisions could make it more difficult for a third party to acquire us, even if the third party’s offer was considered beneficial by many of our stockholders. As a result, our stockholders may be limited in their ability to obtain a premium for their shares.
In addition, we have opted out of Section 203 of the General Corporation Law of the State of Delaware (the “DGCL”), but our amended and restated certificate of incorporation provides that engaging in any of a broad range of business combinations with any “interested” stockholder (any stockholder with 15% or more of our voting stock) for a period of three years following the date on which the stockholder became an “interested” stockholder is prohibited, subject to certain exceptions.
Because we have no current plans to pay regular cash dividends on our Class A common stock, you may not receive any return on investment unless you sell your Class A common stock for a price greater than that which you paid for it.
We do not anticipate paying any regular cash dividends on our Class A common stock. Any decision to declare and pay dividends in the future will be made at the discretion of our board of directors and will depend on, among other things, our results of operations, financial condition, cash requirements, contractual restrictions, and other factors that our board of directors may deem relevant. In addition, our ability to pay dividends is, and may be, limited by covenants of existing and any future outstanding indebtedness we or our subsidiaries incur, including under our existing Senior Secured Credit Facilities. Therefore, any return on investment in our Class A common stock is solely dependent upon the appreciation of the price of our Class A common stock on the open market, which may not occur.
Our amended and restated certificate of incorporation provides, subject to limited exceptions, that the Court of Chancery of the State of Delaware will be the sole and exclusive forum for certain stockholder litigation matters, which could limit our stockholders’ ability to obtain a favorable judicial forum for disputes with us or our directors, officers, employees, or stockholders.
Our amended and restated certificate of incorporation provides, subject to limited exceptions, that unless we consent to the selection of an alternative forum, the Court of Chancery of the State of Delaware shall, to the fullest extent permitted by law, be the sole and exclusive forum for any (1) derivative action or proceeding brought on behalf of our Company, (2) claim of breach of a fiduciary duty owed by any director, officer, employee, or stockholder to the Company or the Company’s stockholders, (3) claim against the Company or any director or officer of the Company arising pursuant to any provision of the DGCL, our amended and restated certificate of incorporation, or our amended and restated bylaws or (4) action asserting a claim against the Company or any director or officer of the Company governed by the internal affairs doctrine.
Any person or entity purchasing or otherwise acquiring any interest in shares of our capital stock shall be deemed to have notice of and consented to the forum provisions in our amended and restated certificate of incorporation. This choice of forum provision may limit a stockholder’s ability to bring a claim in a judicial forum that it finds favorable for disputes with us or any of our directors, officers, other employees or stockholders which may discourage lawsuits with respect to such claims. Alternatively, if a court were to find the choice of forum provision contained in our amended and restated certificate of incorporation to be inapplicable or unenforceable in an action, we may incur additional costs associated with resolving such action in another jurisdiction, which could adversely affect our business, financial condition, or results of operations.
We have renounced the doctrine of corporate opportunity to the fullest extent permitted by applicable law.
Our amended and restated certificate of incorporation provides that the corporate opportunity doctrine will not apply, to the extent permitted by applicable law, against any of our officers, directors, or stockholders or their respective affiliates (other than those officers, directors, stockholders, or affiliates acting in their capacity as our employee or director) in a manner that would prohibit them from investing or participating in competing businesses. To the extent any of our officers, directors or stockholders or their respective affiliates invest in such other businesses, they may have differing interests than our other stockholders. For example, subject to any contractual limitations, our officers, directors or stockholders or their respective affiliates’ funds may currently invest, and may choose in the future to invest, in other companies within
42
the electronic payments industry which may compete with our business. Accordingly, in certain circumstances, the interests of our officers, directors, or stockholders or their respective affiliates may compete against us or pursue opportunities instead of us, for which we have no recourse. These actions on the part of our officers, directors, or stockholders or their respective affiliates could adversely impact our business, financial condition, or results of operations.
If securities analysts do not publish research or reports about our business or if they downgrade our stock or our sector, the price and trading volume of our Class A common stock could decline.
The trading market for our Class A common stock relies, in part, on the research and reports that industry or financial analysts publish about us or our business. We do not control these analysts. Furthermore, if one or more of the analysts who cover us downgrade our stock or our industry, or the stock of any of our competitors, or publish inaccurate or unfavorable research about our business, the price of our stock could decline. If one or more of these analysts stops covering us or fails to publish reports on us regularly, we could lose visibility in the market, which in turn could cause the stock price or trading volume of our Class A common stock to decline.
As a public reporting company, we are subject to rules and regulations established from time to time by the SEC and Nasdaq regarding our internal control over financial reporting. If we fail to establish and maintain effective internal control over financial reporting and disclosure controls and procedures, we may not be able to accurately report our financial results, or report them in a timely manner.
We are a public reporting company subject to the rules and regulations established from time to time by the SEC and Nasdaq. These rules and regulations require, among other things, that we establish and periodically evaluate procedures with respect to our internal control over financial reporting. Public company reporting obligations place a considerable burden on our financial and management systems, processes and controls, as well as on our personnel.
In addition, as a public company we are required to document and test our internal control over financial reporting pursuant to Section 404 of the Sarbanes-Oxley Act so that our management can certify as to the effectiveness of our internal control over financial reporting, which has required us to document and make significant changes to our internal control over financial reporting. Likewise, our independent registered public accounting firm is required to annually provide an attestation report on the effectiveness of our internal control over financial reporting. We must perform system and process evaluation and testing (and any necessary remediation) to comply with management’s certification and, where applicable, the auditor attestation requirements.
We have incurred, and to continue to incur, costs related to implementing and maintaining an internal audit and compliance function. If we identify deficiencies in our internal control over financial reporting or if we are unable to comply with the requirements applicable to us as a public company, including the requirements of Section 404 of the Sarbanes-Oxley Act, in a timely manner, we may be unable to accurately report our financial results, or report them within the timeframes required by the SEC. If this occurs, we could become subject to sanctions or investigations by the SEC or other regulatory authorities. In addition, if we are unable to assert that our internal control over financial reporting is effective, or if our independent registered public accounting firm is unable to express an opinion as to the effectiveness of our internal control over financial reporting, or expresses an adverse opinion, investors may lose confidence in the accuracy and completeness of our financial reports, we may face restricted access to the capital markets, and the market price for our Class A common stock may be adversely affected.
Future sales, or the perception of future sales, by us or our existing stockholders in the public market could cause the market price for our Class A common stock to decline.
The sale of a significant amount of shares of our Class A common stock in the public market, or the perception that such sales could occur, could harm the prevailing market price of shares of our Class A common stock. These sales, or the possibility that these sales may occur, also might make it more difficult for us to sell equity securities in the future at a time and at a price that we deem appropriate.
As part of the Reorganization Transactions, the Continuing LLC Owners received certain sale and exchange rights. Specifically, Blueapple has a sale right providing that, upon our receipt of a sale notice from Blueapple, we will use our
43
commercially reasonable best efforts to pursue a public offering of shares of our Class A common stock and use the net proceeds therefrom to purchase LLC Interests from Blueapple. In addition, pursuant to an exchange agreement (the “Exchange Agreement”) each Continuing LLC Owner (other than Blueapple) has an exchange right providing that, upon receipt of an exchange notice from such Continuing LLC Owner, we will exchange the applicable LLC Interests from such Continuing LLC Owner for newly issued shares of our Class A common stock on a one-for-one basis. Each Continuing LLC Owner (other than Blueapple) also received certain registration rights pursuant to a registration rights agreement, including customary piggyback registration rights, which include the right to participate on a pro rata basis in any public offering we conduct in response to our receipt of a sale notice from Blueapple. In addition, MDP received customary demand registration rights that require us to register shares of Class A common stock held by it, including any Class A common stock received upon our exchange of Class A common stock for its LLC Interests. Blueapple has the right, in connection with any public offering we conduct (including any offering conducted as a result of an exercise by MDP of its registration rights), to request that we use our commercially reasonable best efforts to pursue a public offering of shares of our Class A common stock and use the net proceeds therefrom to purchase a pro rata portion of its LLC Interests. The market price of shares of our Class A common stock could decline, potentially significantly, if any of these stockholders exercise their registration, sale, or exchange rights.
In the future, we may also issue securities in connection with investments, acquisitions, or capital raising activities. In particular, the number of shares of our Class A common stock issued in connection with an investment or acquisition, or to raise additional equity capital, could constitute a material portion of our then-outstanding shares of our Class A common stock. In addition, we have reserved shares of Class A common stock for issuance under our 2018 Omnibus Equity Incentive Plan (the “2018 Plan”) to our employees, directors, officers, and consultants. Any issuance of additional securities in the future may result in additional dilution to the holders of our Class A common stock or may adversely impact the price of our Class A common stock.
The market price for our Class A common stock may change significantly, and holders of our Class A common stock may not be able to resell shares at or above the price they paid or at all.
It is possible that an active trading market for our Class A common stock will not be sustained, which could make it difficult for holders of our Class A common stock to sell their shares at an attractive price or at all. In addition, volatility in the market price of our Class A common stock may prevent shareholders from selling shares of our Class A common stock at or above the price they paid for them. Many factors, which are outside our control, may cause the market price of our Class A common stock to fluctuate significantly, including those described elsewhere in this “Risk Factors” section and elsewhere in this Annual Report on Form 10-K, as well as the following:
|
· |
results of operations that vary from those of our competitors or the expectations of securities analysts and investors; |
|
· |
changes in expectations as to our future financial performance, including financial estimates and investment recommendations by securities analysts and investors; |
|
· |
technology changes, changes in consumer behavior, or changes in merchant relationships in our industry; |
|
· |
security breaches related to our systems or those of our merchants, affiliates, or strategic partners; |
|
· |
changes in market valuations of, or earnings and other announcements by, companies in our industry; |
|
· |
declines in the market prices of stocks generally, particularly those of global payment companies; |
|
· |
announcements by us, our competitors, or our strategic partners of significant contracts, new products, acquisitions, joint marketing relationships, joint ventures, other strategic relationships, or capital commitments; |
|
· |
changes in business, regulatory, economic, or market conditions affecting our industry or the economy as a whole and, in particular, in the consumer spending environment; |
44
|
· |
investor perceptions of the investment opportunity associated with our Class A common stock relative to other investment alternatives; |
|
· |
announcements relating to litigation or governmental investigations; |
|
· |
guidance, if any, that we provide to the public, any changes in this guidance, or our failure to meet this guidance; |
|
· |
the development and sustainability of an active trading market for our Class A common stock; |
|
· |
changes in accounting principles; and |
|
· |
other events or factors, including those resulting from system failures and disruptions, natural disasters, war, acts of terrorism, or responses to these events. |
Furthermore, the stock market may experience extreme volatility that, in some cases, may be unrelated or disproportionate to the operating performance of particular companies. These broad market and industry fluctuations may adversely affect the market price of our Class A common stock, regardless of our actual operating performance. In addition, price volatility may be greater if the public float and trading volume of our Class A common stock is low.
ITEM 1B. UNRESOLVED STAFF COMMENTS
None.
We are headquartered in Atlanta, Georgia. Our other principal operations are located in Melville, New York; Portland, Maine; Addison, Texas; Denver, Colorado; Tampa, Florida; Moorestown, New Jersey; Cincinnati, Ohio; Dublin, Ireland; Cologne, Germany; Madrid, Spain; Prague, Czech Republic; Mexico City, Mexico; Malta; Gibraltar; Montreal, Canada and Warsaw, Poland.
We lease all of the real property used in our business. As of December 31, 2019, we leased 12 domestic properties and 13 international properties, which we use for operational, sales, customer support, and administrative purposes. We believe that our facilities are suitable and adequate for our current business. However, we periodically review our space requirements and may acquire new space to meet the needs of our businesses or consolidate and dispose of or sublet facilities which are no longer required.
The Company is party to various claims and lawsuits incidental to its business. The Company does not believe the ultimate outcome of such matters, individually or in the aggregate, will have a material adverse effect on the Company’s financial position, results of operations, or cash flows.
ITEM 4. MINE SAFETY DISCLOSURES
Not applicable.
45
ITEM 5. MARKET FOR REGISTRANT’S COMMON EQUITY, RELATED STOCKHOLDER MATTERS AND ISSUER PURCHASES OF EQUITY SECURITIES
Market information
Our Class A common stock is traded on the Nasdaq under the symbol “EVOP.” There is currently no established public trading market for our Class B common stock, Class C common stock or Class D common stock.
Holders
There were approximately 6 stockholders of record of our Class A common stock, 1 stockholder of record of our Class B common stock, 7 stockholders of record of our Class C common stock and 7 stockholders of record of our Class D common stock as of January 31, 2020. The number of beneficial owners of our Class A common stock is substantially greater than the number of record holders because a large portion of our Class A common stock is held in “street name” by banks and brokers.
Issuer purchases of equity securities
In connection with the vesting of restricted stock awards, shares of Class A common stock are delivered to the Company by employees to satisfy tax withholding obligations. The following table summarizes such purchases of Class A common stock for the quarter ended December 31, 2019:
|
|
|
|
|
|
|
|
|
|
|
|
|
|
|
|
|
|
|
|
|
|
|
|
|
|
|
|
|
|
|
|
Total Number of Shares |
|
Approximate Dollar Value of Shares |
|
|
|
|
Total Number |
|
Average Price |
|
Purchased as Part of |
|
that May Yet Be Purchased Under |
||
|
|
|
of Shares |
|
Paid per |
|
Publicly Announced |
|
the Plans or Programs |
||
|
Period |
|
Purchased (1) |
|
Share |
|
Plans or Programs |
|
(in millions) |
||
|
October 1, 2019 to October 31, 2019 |
|
151 |
|
$ |
28.50 |
|
— |
|
$ |
— |
|
November 1, 2019 to November 30, 2019 |
|
536 |
|
$ |
28.35 |
|
— |
|
$ |
— |
|
December 1, 2019 to December 31, 2019 |
|
3,210 |
|
$ |
26.16 |
|
— |
|
$ |
— |
|
Total |
|
3,897 |
|
$ |
26.55 |
|
|
|
|
|
|
(1) |
Shares surrendered to the Company to satisfy tax withholding obligations in connection with the vesting of restricted stock awards issued to employees. |
Dividend policy
Since the IPO, we have not declared or paid any cash dividends on our common stock, and we have no current plan to do so. Because a significant portion of our operations is through our subsidiaries, our ability to pay dividends depends in part on our receipt of cash dividends from our operating subsidiaries, which may further restrict our ability to pay dividends as a result of the laws of their jurisdiction of organization, agreements of our subsidiaries or covenants under any existing and future outstanding indebtedness we or our subsidiaries incur. The terms of our Senior Secured Credit Facilities restrict the ability of EVO Payments International, LLC (“EPI”), controlled subsidiary of EVO, Inc. and certain of its subsidiaries from paying dividends to EVO, LLC. In addition, our ability to pay dividends may also be restricted by the terms of any future credit agreement or any future debt or preferred equity securities of us or our subsidiaries.
46
Recent sales of unregistered securities
There were no unregistered sales of equity during the year ended December 31, 2019, except as otherwise previously reported and for shares of Class A common stock issued to the Continuing LLC Owners in satisfaction of the exchange rights granted to them in connection with the IPO.
From time to time following the IPO, the Continuing LLC Owners (other than Blueapple) have the right to require us to exchange all or a portion of their LLC Interests and related shares of Class C common stock or Class D common stock for newly-issued shares of Class A common stock on a one-for-one basis, with their shares of Class C common stock or Class D common stock, as applicable, being cancelled upon any such exchange. We may, under certain circumstances, elect to redeem the LLC Interests from any exchanging holder under the terms of the EVO LLC Agreement in lieu of any such exchange.
Equity compensation plan information
For information regarding securities authorized for issuance under our equity compensation plans, see Part III, Item 12, “Security Ownership of Certain Beneficial Owners and Management and Related Stockholder Matters.”
Stock performance graph
The following graph compares the total shareholder return from May 23, 2018, the date on which our Class A common shares commenced trading on the Nasdaq, through December 31, 2019 of (i) our Class A common stock, (ii) the Standard and Poor's 500 Stock Index (“S&P 500 Index”) and (iii) the Standard and Poor's 500 Information Technology Index (“S&P Information Technology”). The stock performance graph and table assume an initial investment of $100 on May 23, 2018.
The performance graph and table are not intended to be indicative of future performance. The performance graph and table shall not be deemed “soliciting material” or to be “filed” with the SEC for purposes of Section 18 of the Securities Exchange Act of 1934, as amended, or otherwise subject to the liabilities under that Section, and shall not be deemed to be incorporated by reference into any of the Company’s filings under the Securities Act of 1933 or the Exchange Act.
47
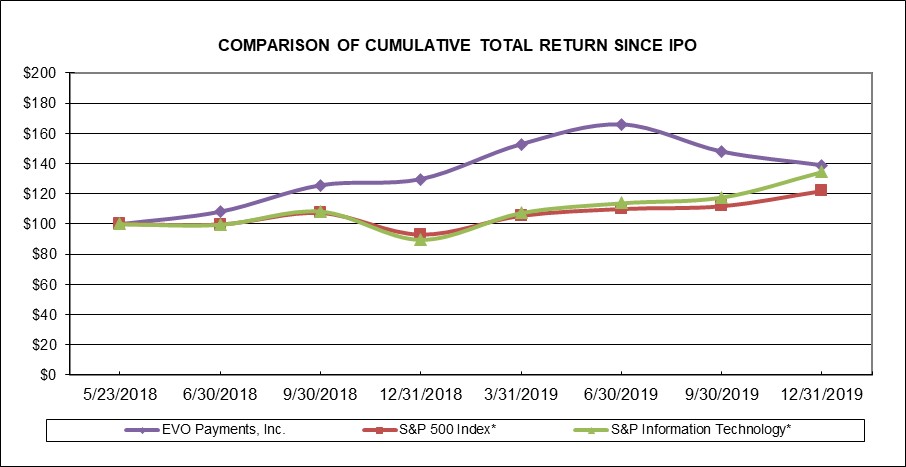
*S&P 500 Index and S&P Information Technology assume reinvestment of all dividends.
|
|
|
EVO Payments, Inc. |
|
S&P 500 Index |
|
S&P Information Technology |
|||
|
May 23, 2018 |
|
$ |
100.00 |
|
$ |
100.00 |
|
$ |
100.00 |
|
June 30, 2018 |
|
|
108.20 |
|
|
99.64 |
|
|
99.63 |
|
September 30, 2018 |
|
|
125.66 |
|
|
107.33 |
|
|
108.40 |
|
December 31, 2018 |
|
|
129.71 |
|
|
92.82 |
|
|
89.61 |
|
March 31, 2019 |
|
|
152.73 |
|
|
105.48 |
|
|
107.40 |
|
June 30, 2019 |
|
|
165.77 |
|
|
110.02 |
|
|
113.92 |
|
September 30, 2019 |
|
|
147.84 |
|
|
111.89 |
|
|
117.72 |
|
December 31, 2019 |
|
|
138.85 |
|
|
122.04 |
|
|
134.67 |
ITEM 6. SELECTED FINANCIAL DATA
The following table sets forth selected historical consolidated financial data for the periods beginning on and after January 1, 2015. EVO Payments, Inc. was formed on April 20, 2017 and, prior to the consummation of the Reorganization Transactions and our IPO, did not conduct any activities other than those incident to its formation and the IPO. Our consolidated financial statements reflect, for all the periods prior to May 23, 2018, the operations of EVO, LLC and its consolidated subsidiaries, and for all periods on or after May 23, 2018, the operations of the Company and its consolidated subsidiaries (including EVO, LLC).
The following selected historical financial and other data should be read in conjunction with “Management’s Discussion and Analysis of Financial Condition and Results of Operations” and our respective consolidated financial statements and the notes to the accompanying consolidated financial statements included elsewhere in this Form 10-K.
48
|
|
|
Year Ended December 31, |
||||||||||||||
|
|
|
2019 |
|
2018 |
|
2017 |
|
2016 |
|
2015 |
|
|||||
|
|
|
(In thousands, except for per share data) |
||||||||||||||
|
Statement of operations data: |
|
|
|
|
|
|
|
|
|
|
|
|
|
|
|
|
|
Revenue(1) |
|
$ |
485,778 |
|
$ |
564,754 |
|
$ |
504,750 |
|
$ |
419,221 |
|
$ |
355,509 |
|
|
Income (loss) from operations(2) |
|
|
16,327 |
|
|
(37,785) |
|
|
45,163 |
|
|
40,352 |
|
|
49,560 |
|
|
Net (loss) income(2) |
|
|
(23,366) |
|
|
(98,850) |
|
|
(32,348) |
|
|
57,451 |
|
|
40,053 |
|
|
Net loss attributable to EVO Payments, Inc.(3) |
|
|
(10,105) |
|
|
(14,712) |
|
|
|
|
|
|
|
|
|
|
|
|
|
|
|
|
|
|
|
|
|
|
|
|
|
|
|
|
|
Per share data: |
|
|
|
|
|
|
|
|
|
|
|
|
|
|
|
|
|
Earnings per share(3) |
|
|
|
|
|
|
|
|
|
|
|
|
|
|
|
|
|
Basic |
|
$ |
(0.31) |
|
$ |
(0.70) |
|
|
|
|
|
|
|
|
|
|
|
Diluted |
|
|
(0.31) |
|
|
(0.70) |
|
|
|
|
|
|
|
|
|
|
|
|
|
|
|
|
|
|
|
|
|
|
|
|
|
|
|
|
|
Balance sheet data: |
|
|
|
|
|
|
|
|
|
|
|
|
|
|
|
|
|
Total assets(4) |
|
$ |
1,706,404 |
|
$ |
1,534,387 |
|
$ |
1,508,298 |
|
$ |
1,259,242 |
|
$ |
1,130,914 |
|
|
Settlement lines of credit(5) |
|
|
33,103 |
|
|
41,819 |
|
|
28,563 |
|
|
2,535 |
|
|
— |
|
|
Total long-term debt(5) |
|
|
701,913 |
|
|
684,056 |
|
|
835,954 |
|
|
806,028 |
|
|
742,589 |
|
|
Redeemable non-controlling interests (6) |
|
|
1,052,448 |
|
|
1,010,093 |
|
|
148,266 |
|
|
100,530 |
|
|
77,878 |
|
|
Total deficit |
|
|
(882,647) |
|
|
(862,682) |
|
|
(166,531) |
|
|
(197,763) |
|
|
(165,790) |
|
|
(1) |
Revenue for the reporting period beginning in 2019 is presented under Accounting Standards Update (“ASC”) 2014-09, Revenue From Contracts With Customers (“ASC 606”), while prior period revenue continue to be reported in accordance with the Company’s historic accounting practices under previous guidance. Refer to Note 1, “Description of Business and Summary of Significant Accounting Policies”, section (t) Recently Adopted Accounting Pronouncements, in the notes to the accompanying consolidated financial statements for further discussion. |
|
(2) |
Net income (loss) from operations and net (loss) income in the table above reflect a gain recorded in connection with the sale of our membership interests in Visa Europe Limited (“Visa Europe”) for the year ended December 31, 2016. Refer to Note 10, “Other Assets”, in the notes to the accompanying consolidated financial statements for further discussion. Net income (loss) from operations and net (loss) income also reflect the share-based compensation for the years ended December 31, 2019 and 2018. Refer to Note 21, “Stock Compensation Plans and Share-Based Compensation Awards”, in the notes to the accompanying consolidated financial statements for further discussion. |
|
(3) |
Net loss attributable to EVO Payments, Inc. and earnings per share information for the year ended December 31, 2018 reflect the historical results of operations of the Company, including consolidation of its investment in EVO, LLC, commencing May 23, 2018. Prior to May 23, 2018, the results of operations represent the financial statements of EVO, LLC and its subsidiaries. Net loss attributable to EVO Payments, Inc. and earnings per share information prior to May 23, 2018 is not presented, as prior to consummation of the Reorganization Transactions and the IPO, EVO Payments, Inc. did not conduct any activities other that those incident to its formation and the IPO. Additionally, earnings per share information is presented for the period from May 23, 2018 through December 31, 2018 as the ownership structure of EVO, LLC prior to the Reorganization Transactions is not a common unit of ownership of the Company. |
|
(4) |
Total assets as of December 31, 2019 include the right-of-use assets recognized in connection with adoption of Accounting Standards Update (“ASC”) 2016-12, Leases (“ASC 842”), while prior period total assets are reported in accordance with the Company’s historic accounting practices under previous guidance. Refer to Note 1, “Description of Business and Summary of Significant Accounting Policies”, section (t) Recently Adopted Accounting Pronouncements, in the notes to the accompanying consolidated financial statements for further discussion. |
|
(5) |
Long-term debt and settlement lines of credit include interest accrued as of the reporting date, where applicable, and are presented net of debt issuance costs. |
|
(6) |
Redeemable non-controlling interests as of December 31, 2019 and 2018 include redeemable non-controlling interests of EVO Investco, LLC and redeemable non-controlling interests related to the Company’s consolidated subsidiary. Redeemable non-controlling interests as of December 31, 2017 and prior include redeemable non-controlling interests related to the Company’s consolidated subsidiary, as redeemable non-controlling interests of EVO Investco, LLC did not exist prior to the Reorganization Transactions and the IPO. Refer to Note 16, “Redeemable Non-controlling Interests”, in the notes to the accompanying consolidated financial statements for further discussion. |
The selected financial data in the table above reflect the effects of acquisitions and borrowings to fund those acquisitions. Refer to Note 6, “Acquisitions”, in the notes to the accompanying consolidated financial statements for further discussion.
49
ITEM 7. MANAGEMENT’S DISCUSSION AND ANALYSIS OF FINANCIAL CONDITION AND RESULTS OF OPERATIONS
Introduction
This “Management’s Discussion and Analysis of Financial Condition and Results of Operations” (“MD&A”) is intended to provide an understanding of our financial condition, changes in financial condition, cash flow, liquidity and results of operations. This MD&A should be read in conjunction with our consolidated financial statements and the notes to the accompanying consolidated financial statements appearing elsewhere in this Form 10-K and the Risk Factors included in Part I, Item 1A of this Form 10-K, as well as other cautionary statements and risks described elsewhere in this Form 10-K.
The following discussion and analysis reflects the historical results of operations and financial position of EVO, LLC and its consolidated subsidiaries prior to the Reorganization Transactions and that of EVO, Inc. and its consolidated subsidiaries (including EVO, LLC) following the completion of the Reorganization Transactions. The historical results of operations and financial condition of EVO, LLC prior to the completion of the Reorganization Transactions, including the IPO, do not reflect certain items that affected our results of operations and financial condition after giving effect to the Reorganization Transactions and the use of proceeds from the IPO.
Company background
We are a leading payments technology and services provider offering an array of payment solutions to merchants ranging from small and mid-size enterprises to multinational companies and organizations across the Americas and Europe. As a fully integrated merchant acquirer and payment processor across more than 50 markets and 150 currencies worldwide, we provide competitive solutions that promote business growth, increase customer loyalty and enhance data security in the markets we serve.
Founded in 1989 as an individually owned, independent sales organization in the United States, by 2012, we had transformed into an international payment processor and merchant acquirer. Today, the Company derives more than 60% of its revenues from markets outside of the United States.
Our business operations are located across two segments: the Americas and Europe; and are comprised of three sales distribution channels: the Tech-enabled division, the Direct division, and the Traditional division. Our European segment is comprised of Western Europe (Spain, United Kingdom, Ireland, Germany and Malta) and Eastern Europe (Poland and the Czech Republic). Our Americas segment is comprised of the United States, Canada, and Mexico. In both Europe and the Americas, our payment technology solutions enable our customers to accept all forms of digital payments, including credit and debit card, gift card, and ACH, among other forms of electronic payments, such as market-specific payment solutions. In both segments, we distribute our products and services through a combination of bank referrals, a direct sales force, and specialized integrated solution companies. Our distribution in the Americas segment also leverages sales agents in the United States (“Traditional”); in our European segment, we also provide ATM processing services to financial institutions and third-party ATM providers. These segments are evaluated based on their segment profits. For a full discussion on how we calculate segment profit, please refer to Note 19, “Segment Information.”
Our Tech-enabled division includes our integrated business, our B2B business, and our eCommerce business. Our Direct division includes long-term, exclusive referral relationships with leading financial institutions as well as our direct sales force, such as our direct salespersons and call center representatives. In markets where we do not have an active bank referral network, such as the United States, our direct sales force represents the entirety of this division. Our Traditional Division, unlike our Direct and Tech-enabled divisions, represents a merchant portfolio which is not actively managed by the Company. This division only exists in the United States, as it represents our heritage ISO relationships, and its profits are used to invest in our growth opportunities, such as tech-enabled capabilities and M&A.
The majority of our revenue is generated from transaction-based fees, calculated as a percentage of transaction value or as a standard fee per transaction.
50
We plan to continue to grow our business and improve our operations by expanding market share in our existing markets and entering new markets. In our current markets, we seek to grow our business through broadening our distribution network, leveraging our innovative payment and technology solutions, and acquiring additional merchant portfolios and tech-enabled businesses. We seek to enter new markets through acquisitions and partnerships in Latin America, Europe, and certain other markets.
Executive overview
On January 1, 2019, the Company adopted ASC 606, and as the result, we changed our revenue recognition from the gross amount billed to a customer to the net amount retained. The new revenue accounting standard impacted our reported revenues and operating expenses during the year ended December 31, 2019 by the same amount. This change in presentation therefore had no impact on the Company’s earnings (loss) or recorded profits. For a full description of ASC 606 and its impact on the Company’s financial statements, please refer to Notes 1(t), “Recently Adopted Accounting Pronouncements.”
The Company delivered strong financial performance in the year ended December 31, 2019, as demonstrated by the following highlights:
|
· |
Revenue for the year ended December 31, 2019 was $485.8 million, a decrease of 14.0% compared to the $564.8 million recognized for the twelve months ended December 31, 2018. The decrease was primarily due to $112.3 million impact of the reclassification of network and processing fees in connection with the Company’s adoption of ASC 606, partially offset by an increase of $33.3 million driven primarily by organic growth in our international markets and the Federated acquisition in the United States. Excluding the $112.3 million impact of the reclassification of network and processing fees following the changes in revenue recognition, revenue for the year ended December 31, 2019 increased 5.9% to $598.0 million1. |
|
· |
Americas segment profit for the year ended December 31, 2019 was $96.6 million, 13.1% higher than the year ended December 31, 2018. |
|
· |
Europe segment profit for the year ended December 31, 2019 was $55.3 million, 9.6% lower than the year ended December 31, 2018. |
|
· |
The Company processed approximately 3.6 billion transactions across the Americas and Europe in the year ended December 31, 2019, an increase of 16.8% from the year ended December 31, 2018. |
Factors impacting our business and results of operations
In general, our revenue is impacted by factors such as global consumer spending trends, foreign exchange rates, the pace of adoption of commerce-enablement and payment solutions, acquisitions and dispositions, types and quantities of products and services provided to enterprises, timing and length of contract renewals, new enterprise wins, retention rates, mix of payment solution types employed by consumers, changes in card network fees including interchange rates and size of enterprises served. In addition, we may pursue acquisitions from time to time. These acquisitions could result in redundant costs, such as increased interest expense resulting from any indebtedness incurred to finance any acquisitions, or could require us to incur losses as we restructure or reorganize our operations following these acquisitions.
Seasonality
We have experienced in the past, and expect to continue to experience, seasonality in our revenues as a result of consumer spending patterns. In both the Americas and Europe, our revenue has been strongest in our fourth quarter and weakest in our first quarter as many of our merchants experience a seasonal lift during the traditional vacation and holiday months. Operating expenses do not typically fluctuate seasonally.
1 The Company adopted ASC 606 using the modified retrospective method as of January 1, 2019, and did not restate the comparative prior periods. Therefore, management’s discussion and analysis includes discussion of the results of operations excluding the impact of adoption of the standard to provide comparability across the periods presented in the financial statements.
51
Foreign currency translation impact on our operations
Our consolidated revenues and expenses are subject to variations caused by the net effect of foreign currency translation on revenues recognized and expenses incurred by our non-U.S. operations. It is difficult to predict the future fluctuations of foreign currency exchange rates and how those fluctuations will impact our consolidated statements of operations and comprehensive (loss) income in the future. As a result of the relative size of our international operations, these fluctuations may be material on individual balances. Our revenues and expenses from our international operations are generally denominated in the local currency of the country in which they are derived or incurred. Therefore, the impact of currency fluctuations on our operating results and margins is partially mitigated.
Increased Regulations and Compliance
We and our merchants are subject to laws and regulations that affect the electronic payments industry in the many countries in which our services are used. Our merchants are subject to numerous laws and regulations applicable to banks, financial institutions, and card issuers in the United States and abroad, and, consequently, we are at times affected by these foreign, federal, state, and local laws and regulations. A number of our subsidiaries in our European segment hold a PI license, allowing them to operate in the EU member states in which such subsidiaries do business. As a PI, we are subject to regulation and oversight in the applicable EU member states, which includes, among other obligations, a requirement to maintain specific regulatory capital and adhere to certain rules regarding the conduct of our business, including PSD2. PSD2 contains a number of additional regulatory provisions and deadlines, such as provisions relating to SCA, which requires industry wide systems upgrades. In the second half of 2019, we began updating our systems in preparation for the new SCA compliance requirements, which will go into effect on December 31, 2020. From an operations perspective, we also increased our focus on coordinating updates and implementations with our merchants and third party providers such as hardware vendors, card issuers, card networks, and among others. The EU has also enacted certain legislation relating to the offering of DCC services, which will come into effect in April 2020 and require additional disclosures to consumers in connection with our DCC product offerings. Compliance with current and upcoming regulations and compliance deadlines remains a focus for the remainder of 2020 and beyond.
Key performance indicators
Transactions Processed
“Transactions processed” refers to the number of transactions we processed during any given period of time and is a meaningful indicator of our business and financial performance, as a significant portion of our revenue is driven by the number of transactions we process. In addition, transactions processed provides a valuable measure of the level of economic activity across our merchant base. In our Americas segment, transactions include acquired Visa and Mastercard credit and signature debit, American Express, Discover, UnionPay, PIN-debit, electronic benefit transactions and gift card transactions. In our Europe segment, transactions include acquired Visa and Mastercard credit and signature debit, other card network merchant acquiring transactions, and ATM transactions.
For the year ended December 31, 2019, we processed approximately 3.6 billion transactions, which included more than 1.0 billion transactions in the Americas and approximately 2.5 billion transactions in Europe. This represents an increase of 12.4% in the Americas and an increase of 18.8% in Europe for an aggregate increase of 16.8% compared to the year ended December 31, 2018, driven by organic growth and the impact of acquisitions. Transactions processed in the Americas and Europe accounted for 30% and 70%, respectively, of the total transactions we processed in 2019.
For the year ended December 31, 2018, we processed approximately 3.0 billion transactions, which included more than 950 million transactions in the Americas and approximately 2.1 billion transactions in Europe, an aggregate increase of 17.0% compared to the year ended December 31, 2017, driven by organic growth and the impact of acquisitions. Transactions processed in the Americas accounted for 31% of the total transactions we processed in 2018.
52
Comparison of results for the years ended December 31, 2019 and 2018
The following table sets forth the consolidated statements of operations in dollars and as a percentage of revenue for the period presented.
|
|
|
Year Ended |
|
|
|
Year Ended |
|
|
|
|
|
|
|
||
|
(dollar amounts in thousands) |
|
December 31, 2019 |
|
% of revenue |
|
December 31, 2018 |
|
% of revenue |
|
$ change |
|
% change |
|||
|
Segment revenue: |
|||||||||||||||
|
Americas |
|
$ |
303,840 |
|
62.5% |
|
$ |
320,481 |
|
56.7% |
|
$ |
(16,641) |
|
(5.2%) |
|
Europe |
|
|
181,938 |
|
37.5% |
|
|
244,273 |
|
43.3% |
|
|
(62,335) |
|
(25.5%) |
|
Revenue |
|
$ |
485,778 |
|
100.0% |
|
$ |
564,754 |
|
100.0% |
|
$ |
(78,976) |
|
(14.0%) |
|
|
|
|
|
|
|
|
|
|
|
|
|
|
|
|
|
|
Operating expenses: |
|
|
|
|
|
|
|
|
|
|
|
|
|
|
|
|
Cost of services and products |
|
$ |
96,365 |
|
19.8% |
|
$ |
189,375 |
|
33.5% |
|
$ |
(93,010) |
|
(49.1%) |
|
Selling, general and administrative |
|
|
267,926 |
|
55.2% |
|
|
311,353 |
|
55.1% |
|
|
(43,427) |
|
(13.9%) |
|
Depreciation and amortization |
|
|
92,059 |
|
19.0% |
|
|
87,184 |
|
15.4% |
|
|
4,875 |
|
5.6% |
|
Impairment of intangible assets |
|
|
13,101 |
|
2.7% |
|
|
14,627 |
|
2.6% |
|
|
(1,526) |
|
(10.4%) |
|
Total operating expenses |
|
|
469,451 |
|
96.6% |
|
|
602,539 |
|
106.7% |
|
|
(133,088) |
|
(22.1%) |
|
Income (loss) from operations |
|
$ |
16,327 |
|
3.4% |
|
$ |
(37,785) |
|
(6.7%) |
|
$ |
54,112 |
|
(143.2%) |
|
|
|
|
|
|
|
|
|
|
|
|
|
|
|
|
|
|
Segment profit: |
|
|
|
|
|
|
|
|
|
|
|
|
|
|
|
|
Americas |
|
$ |
96,587 |
|
19.9% |
|
$ |
85,377 |
|
15.1% |
|
$ |
11,210 |
|
13.1% |
|
Europe |
|
$ |
55,319 |
|
11.4% |
|
$ |
61,195 |
|
10.8% |
|
$ |
(5,876) |
|
(9.6%) |
Revenue
Revenue was $485.8 million for the year ended December 31, 2019, a decrease of $79.0 million, or 14.0%, compared to revenue of $564.8 million for the year ended December 31, 2018, primarily due to the $112.3 million impact of the reclassification of network and processing fees in connection with the Company’s adoption of ASC 606, partially offset by an increase of $33.3 million, driven primarily by organic growth in our international markets and inclusion of our recent acquisitions. Excluding the $112.3 million impact of the reclassification of network and processing fees following the changes in revenue recognition, revenue for the year ended December 31, 2019 increased 5.9% to $598.0 million.
Americas segment revenue was $303.8 million for the year ended December 31, 2019, a decrease of $16.6 million, or 5.2%, compared to the year ended December 31, 2018, primarily due to the $36.9 million impact of the reclassification of network and processing fees in connection with the Company’s adoption of ASC 606, partially offset by an increase of $20.3 million driven primarily by organic growth in Mexico and the Federated acquisition in the United States.
Europe segment revenue was $181.9 million for the year ended December 31, 2019, a decrease of $ 62.3 million, or 25.5%, compared to the year ended December 31, 2018, primarily due to the $75.3 million impact of the reclassification of network and processing fees in connection with the Company’s adoption of ASC 606, partially offset by an increase of $13.0 million driven primarily by organic growth in Poland, Germany, Ireland, and the United Kingdom.
Operating expenses
Cost of services and products
Cost of services and products was $96.4 million for the year ended December 31, 2019, a decrease of $93.0 million, or 49.1%, compared to the year ended December 31, 2018, primarily due to the Company’s adoption of ASC 606. Excluding the impact of the reclassification of network and processing fees following the adoption of ASC 606, costs of services and products increased by $19.2 million, or 10.2%, for the year ended December 31, 2019, primarily due to an increase in transactions processed and an increase in equipment sold. Our cost of services and products includes both fixed and variable components, with variable components dependent upon transactions processed and the number merchants added. The increase in cost was due to the variable component from the increase in transactions and merchants during the year.
53
Selling, general and administrative expenses
Selling, general and administrative expenses were $267.9 million for the year ended December 31, 2019, a decrease of $43.4 million, or 13.9%, compared to the year ended December 31, 2018. The decrease was due primarily to the vesting of share-based compensation awards upon the Company’s IPO during the year ended December 31, 2018, which did not occur in the year ended December 31, 2019.
Depreciation and amortization
Depreciation and amortization was $92.1 million for the year ended December 31, 2019, an increase of $4.9 million, or 5.6%, compared to the year ended December 31, 2018. This increase was due primarily to purchases of POS terminals to support growth in certain of our international markets and other hardware and software purchases as well as the amortization of intangible assets acquired during the second half of 2018.
Impairment of intangible assets
For the year ended December 31, 2019, we recognized non-cash impairment charges of $13.1 million, primarily related to the termination of the Raiffeisen Bank Polska marketing alliance agreement and the retirement of certain trademarks driven by an internal reorganization and the Santander branch consolidation in Spain. For the year ended December 31, 2018, we recognized a non-cash impairment charge of $14.6 million primarily related to the accelerated integration of the Sterling tradename into the EVO portfolio.
Interest expense
Interest expense was $44.0 million for the year ended December 31, 2019, compared to $59.8 million for the year ended December 31, 2018. The decrease was due to lower average variable interest rates, partially offset by the use of debt for acquisitions.
Gain on acquisition of unconsolidated investee
Gain on acquisition of unconsolidated investee was $8.4 million for the year ended December 31, 2018 related to the fair value mark-up on the acquisition of a previously minority owned subsidiary.
Income tax expense
Income tax expense represents federal, state, local and foreign taxes based on income in multiple domestic and foreign jurisdictions. Historically, as a limited liability company treated as a partnership for U.S. federal income tax purposes, EVO, LLC’s income was not subject to corporate tax in the United States, but only on income earned in foreign jurisdictions. In the United States, our members were taxed on their proportionate share of income of EVO, LLC. However, following the Reorganization Transactions, we incur corporate tax at the U.S. federal income tax rate on our share of taxable income of EVO, LLC. Our income tax expense reflects such U.S. federal, state and local income tax as well as taxes payable in foreign jurisdictions by certain of our subsidiaries. Our income tax expense was $4.5 million for the year ended December 31, 2019, compared to income tax expense of $10.4 million for the year ended December 31, 2018.
Net loss
Net loss was $23.4 million for the year ended December 31, 2019, a decrease of $75.5 million, compared to net loss of $98.9 million for the year ended December 31, 2018. This improvement was due to growth in revenue and lower share-based compensation and interest expense for the year ended December 31, 2019, compared to the year ended December 31, 2018.
54
Net loss attributable to non-controlling interests of EVO Investco, LLC
Net income (loss) attributable to non-controlling interests arises from the non-owned portion of businesses where we have a controlling interest but less than 100% ownership. This represents both the non-controlling interests that are consolidating entities of EVO, LLC and EVO, LLC non-controlling interest. Net loss attributable to non-controlling interests of EVO Investco, LLC was $21.1 million for the year ended December 31, 2019, compared to net loss attributable to non-controlling interests of EVO Investco, LLC of $90.8 million for the year ended December 31, 2018. This decrease was due to lower net loss before non-controlling interests, as described in the previous paragraph.
Segment performance
Americas segment profit for the year ended December 31, 2019 was $96.6 million, compared to $85.4 million for the year ended December 31, 2018, an increase of 13.1%. The increase is primarily due to growth in our underlying United States and Mexican markets in the year ended December 31, 2019 and the non-cash impairment charge of $14.6 million recognized in the year ended December 31, 2018. Americas segment profit margin was 31.8% for the year ended December 31, 2019, compared to 26.6% for the year ended December 31, 2018. Excluding the impact of the reclassification of network and processing fees following the adoption of ASC 606, Americas segment profit margin was 28.4% for the year ended December 31, 2019.
Europe segment profit was $55.3 million for the year ended December 31, 2019, compared to $61.2 million for the year ended December 31, 2018, a decrease of 9.6%. The decrease is primarily due to revenue declines in Spain and integration expenses related to acquisitions. Europe segment profit margin was 30.4% for the year ended December 31, 2019, compared to 25.1% for the year ended December 31, 2018. Excluding the impact of the reclassification of network and processing fees following the adoption of ASC 606, Europe segment profit margin was 21.5% for the year ended December 31, 2019.
Corporate expenses not allocated to a segment were $34.5 million for the year ended December 31, 2019, compared to $41.4 million for the year ended December 31, 2018. The decrease in expense is due to initial public company costs for the year ended December 31, 2018, which we did not incur in the year ended December 31, 2019.
Comparison of results for the years ended December 31, 2018 and 2017
The comparison of results for the years ended December 31, 2018 and 2017 that are not included in this Form 10-K are included in “Management’s Discussion and Analysis of Financial Condition and Results of Operations” in Part II, Item 7 of our Annual Report on Form 10-K for the fiscal year ended December 31, 2018.
Liquidity and capital resources for the years ended December 31, 2019 and 2018
Overview
We have historically funded our operations primarily with cash flow from operations and, when needed, with borrowings, including under our Senior Secured Credit Facilities. Our principal uses for liquidity have been debt service, capital expenditures, working capital and funds required to finance acquisitions.
We expect to continue to use capital to innovate and advance our products as new technologies emerge and to accommodate new regulatory requirements in the markets in which we process transactions. We expect these strategies to be funded primarily through cash flow from operations and borrowings from our Senior Secured Credit Facilities, as needed. Short-term liquidity needs will primarily be funded through the revolving credit facility portion of our Senior Secured Credit Facilities.
As of December 31, 2019, our capacity under the revolving credit facility portion of our Senior Secured Credit Facilities was $200.0 million, with availability of $138.4 million for additional borrowings. To the extent that additional funds are necessary to finance future acquisitions, and to meet our long-term liquidity needs as we continue to execute on our strategy, we anticipate that they will be obtained through additional indebtedness, equity or debt issuances, or both.
55
We have structured our operations in a manner to allow for cash to be repatriated through tax-efficient methods using dividends from foreign jurisdictions as our main source of repatriation. We follow local government regulations and contractual restrictions which regulate the nature of cash as well as how much and when dividends can be repatriated. As of December 31, 2019, cash and cash equivalents of $304.1 million includes cash in the United States of $110.8 million and $193.3 million in foreign jurisdictions. Of the United States cash balances, $109.9 million is considered merchant reserves and settlement related cash and is therefore unavailable for the Company’s use. Of the foreign cash balances, $5.0 million is related to the non-controlling interest portion of our consolidated entities and $33.5 is available for general purposes. The remaining $154.8 million is considered settlement and merchant reserves related cash and is therefore unable to be repatriated.
We do not intend to pay cash dividends on our Class A common stock in the foreseeable future. EVO, Inc. is a holding company that does not conduct any business operations of its own. As a result, EVO, Inc.’s ability to pay cash dividends on its common stock, if any, is dependent upon cash dividends and distributions and other transfers from EVO, LLC. The amounts available to EVO, Inc. to pay cash dividends are subject to the covenants and distribution restrictions in its subsidiaries’ loan agreements.
In connection with our IPO, we entered into the Exchange Agreement with certain of the Continuing LLC Owners, under which these Continuing LLC Owners have the right, from time to time, to exchange their units in EVO, LLC and related shares of EVO, Inc. for shares of our Class A common stock or, at our option, cash. If we choose to satisfy the exchange in cash, we anticipate that we will fund such exchange through cash from operations, funds available under the revolving portion of our Senior Secured Credit Facilities, equity or debt issuances or a combination thereof.
In addition, in connection with the IPO, we entered into a Tax Receivable Agreement (“TRA”) with the Continuing LLC Owners. Although the actual timing and amount of any payments that may be made under the TRA will vary, we expect that the payments that we will be required to make to the Continuing LLC Owners will be significant. Any payments made by us to non-controlling LLC owners under the TRA will generally reduce the amount of overall cash flow that might have otherwise been available to us and, to the extent that we are unable to make payments under the TRA for any reason, the unpaid amounts generally will be deferred and will accrue interest until paid by us.
The following table sets forth summary cash flow information for the years ended December 31, 2019, 2018, and 2017:
|
|
|
|
Year Ended December 31, |
|||||||
|
(in thousands) |
|
|
2019 |
|
2018 |
|
2017 |
|||
|
Net cash provided by operating activities |
|
|
$ |
27,889 |
|
$ |
201,998 |
|
$ |
8,210 |
|
Net cash used in investing activities |
|
|
|
(76,643) |
|
|
(125,565) |
|
|
(58,116) |
|
Net cash provided by financing activities |
|
|
|
3,920 |
|
|
80,643 |
|
|
38,471 |
|
Effect of exchange rate changes on cash and cash equivalents |
|
|
|
(1,774) |
|
|
(11,521) |
|
|
13,253 |
|
Net (decrease) increase in cash and cash equivalents |
|
|
$ |
(46,608) |
|
$ |
145,555 |
|
$ |
1,818 |
Operating activities
Net cash provided by operating activities was $27.9 million for the year ended December 31, 2019, a decrease of $174.1 million compared to cash provided by operating activities of $202.0 million for the year ended December 31, 2018. This decrease was due primarily to changes in working capital, including the timing of settlement-related assets and liabilities.
Investing activities
Net cash used in investing activities was $76.6 million for the year ended December 31, 2019, a decrease of $48.9 million compared to net cash used in investing activities of $125.6 million for the year ended December 31, 2018. The decrease was primarily due lower capital expenditures and lower acquisition-related investments during 2019.
56
Capital expenditures were $36.8 million for the year ended December 31, 2019, a decrease of $12.0 million compared to $48.8 million for the year ended December 31, 2018. The decrease was due primarily to fewer terminal purchases in markets outside of the United States. As is customary in those markets, we provide the POS terminal hardware to merchants and charge associated fees related to this hardware. During 2019, we incurred capital expenditures of $19.5 million to provide POS terminal hardware to merchants in these markets. The decrease in terminal expense is attributable to fewer terminal purchases in Poland resulting from the annualization of the cashless program and fewer terminal purchases in Spain related to a large inventory balance at the end of 2018. Additionally, our capital expenditures include hardware and software necessary for our data centers, processing platforms, and information security initiatives. During the year ended December 31, 2019, we spent $38.8 million on assets associated with our business combinations, a decrease of $17.4 million compared to $56.2 million for the year ended December 31, 2018.
Financing activities
Net cash provided by financing activities was $3.9 million for the year ended December 31, 2019, a decrease of $76.7 million, compared to net cash provided by financing activities of $80.6 million for the year ended December 31, 2018. This decrease was primarily due to the net proceeds received in 2018 from the IPO, which were partially offset by debt repayments and the early repayment of deferred purchase price under the Sterling acquisition.
Liquidity and capital resources for the years ended December 31, 2018 and 2017
The discussion of cash flow activities for the year ended December 31, 2018 as compared to the year ended December 31, 2017 that are not included in this Form 10-K are included in “Management’s Discussion and Analysis of Financial Condition and Results of Operations” in Part II, Item 7 of our Annual Report on Form 10-K for the fiscal year ended December 31, 2018.
Senior Secured Credit Facilities
The Company (through its subsidiary EPI) has entered into a first lien senior secured credit facility and a second lien senior secured credit facility pursuant to a credit agreement dated December 22, 2016, and amended on October 24, 2017, April 3, 2018, and June 14, 2018 (the “Senior Secured Credit Facilities”). On May 25, 2018, the Company repaid all outstanding amounts under the second lien credit facility using a portion of the proceeds from the IPO. As of December 31, 2019, the Senior Secured Credit Facilities include revolver commitments of $200.0 million and a term loan of $665.0 million that are scheduled to mature in June 2023 and December 2023, respectively.
In addition, our Senior Secured Credit Facilities also provide us with the option to access incremental credit facilities, refinance the loans with debt incurred outside our Senior Secured Credit Facilities and extend the maturity date of the revolving loans and term loans, subject to certain limitations and terms.
Borrowings under the first lien senior secured credit facility bear interest at an annual rate equal to, at EPI’s option, (a) a base rate, plus an applicable margin or (b) LIBOR, plus an applicable margin. The applicable margin for base rate revolving loans ranges from 0.75% to 2.00% per annum and for LIBOR revolving loans ranges from 1.75% to 3.00% per annum, in each case based upon achievement of certain consolidated leverage ratios. The applicable margin for base rate term loans is 2.25% and for LIBOR term loans is 3.25%, subject to a 25 basis point reduction upon an upgrade to the Company’s credit rating by both Moody’s and S&P. In addition to paying interest on outstanding principal, EPI is required to pay a commitment fee to the lenders in respect of the unutilized revolving commitments thereunder ranging from 0.25% to 0.5% per annum based upon achievement of certain consolidated leverage ratios.
The first lien senior secured credit facility requires prepayment of outstanding loans with: (1) 100% of the net cash proceeds of non-ordinary course asset sales or other dispositions of assets (including casualty events) by EPI and its restricted subsidiaries, subject to reinvestment rights and certain other exceptions, and (2) 50% of the excess cash flow (subject to step-downs to 25% and 0% based on achievement of certain first lien leverage ratios). Upon a change of control, EPI is required to offer to prepay the loans at par.
57
EPI may voluntarily repay outstanding loans under the first lien senior secured credit facility at any time, without premium, subject to a 1% premium in the event of a repricing event within the six-month anniversary of the date of the Restatement Agreement.
All obligations under the first lien senior secured credit facility are unconditionally guaranteed by most of EPI’s direct and indirect, wholly-owned material domestic subsidiaries, subject to certain exceptions. All obligations under the first lien senior secured credit facility, and the guarantees of such obligations, are secured, subject to permitted liens and other exceptions, by:
|
· |
a first-priority lien on the capital stock owned by EPI or by any guarantor in each of EPI’s or their respective subsidiaries (limited, in the case of capital stock of foreign subsidiaries, to 65% of the voting stock and 100% of the non-voting stock of first tier foreign subsidiaries); and |
|
· |
a first-priority lien on substantially all of EPI’s and each guarantor’s present and future intangible and tangible assets (subject to customary exceptions). |
The first lien senior secured credit facility contains a number of significant negative covenants. These covenants, among other things, restrict, subject to certain exceptions, EPI’s and its restricted subsidiaries’ ability to incur indebtedness; create liens; engage in mergers or consolidations; make investments, loans and advances; pay dividends and distributions and repurchase capital stock; sell assets; engage in certain transactions with affiliates; enter into sale and leaseback transactions; make certain accounting changes; and make prepayments on junior indebtedness.
The first lien senior secured credit facility also contains a springing financial covenant that requires EPI to remain under a maximum consolidated leverage ratio determined on a quarterly basis.
In addition, the first lien senior secured credit facility contains certain customary representations and warranties, affirmative covenants and events of default. If an event of default occurs, the lenders will be entitled to take various actions, including the acceleration of amounts due thereunder and the exercise of the remedies on the collateral.
Refer to Note 14, “Long-Term Debt and Lines of Credit”, in the notes to the accompanying consolidated financial statements for additional information on our long-term debt and settlement lines of credit.
Sterling acquisition deferred purchase price
In connection with the acquisition of Sterling on January 4, 2017, we agreed to a deferred purchase price of $70.0 million, which we refer to as the deferred purchase price. The deferred purchase price accrued interest at a rate of 5% per annum, and was payable in quarterly installments of $5.0 million, plus accrued and unpaid interest, beginning September 30, 2017. In May 2018, the Company paid in full the outstanding balance of the Sterling deferred purchase price, utilizing proceeds from the IPO and funds drawn from the revolving credit facility portion of our Senior Secured Credit Facilities.
Settlement lines of credit
We have specialized lines of credit which are restricted for use in funding settlement. The settlement lines of credit generally have variable interest rates and are subject to annual review. As of December 31, 2019, we had $33.3 million outstanding under these lines of credit with additional capacity of $133.9 million as of December 31, 2019 to fund settlement.
58
Contractual obligations
The following table summarizes our contractual obligations as of December 31, 2019.
|
|
|
|
|
|
Less than |
|
|
|
|
|
|
|
More than |
||
|
(in thousands) |
|
Total |
|
1 year |
|
1-3 years |
|
3-5 years |
|
5 years |
|||||
|
|
|
|
|
|
|
|
|
|
|
|
|
|
|
|
|
|
Long-term debt |
$ |
707,762 |
$ |
6,593 |
$ |
13,186 |
$ |
687,983 |
$ |
- |
|||||
|
Interest payments(1) |
143,774 |
36,798 |
71,651 |
35,325 |
- |
||||||||||
|
Operating leases(2) |
65,620 |
11,889 |
20,728 |
11,361 |
21,642 |
||||||||||
|
Settlement lines of credit |
33,342 |
33,342 |
- |
- |
- |
||||||||||
|
Purchase commitments(3) |
9,406 |
5,043 |
4,363 |
- |
- |
||||||||||
|
Other long-term liabilities(4) |
5,214 |
4,566 |
648 |
- |
- |
||||||||||
|
Total |
$ |
965,118 |
$ |
98,231 |
$ |
110,576 |
$ |
734,669 |
$ |
21,642 |
|||||
|
(1) |
Interest on long-term debt and settlement obligations is based on rates effective and amounts borrowed as of December 31, 2019. Since the contractual rates for our long-term debt and settlement obligations are variable, actual cash payments may differ from the estimates provided. |
|
(2) |
Amounts represent undiscounted contractually committed payments under our operating lease obligations. As of December 31, 2019, operating lease obligations recognized on our consolidated balance sheet are measured at the present value of remaining lease payments, utilizing our incremental borrowing rate based on the remaining lease term, which includes renewal options, if the option is reasonably certain to be exercised. Refer to Note 7, "Leases", in the notes to the accompanying consolidated financial statements for additional information. |
|
(3) |
Amounts represent our estimate of future payments for noncancelable contractual obligations related to purchase of goods or services with suppliers for fixed or minimum amounts. |
|
(4) |
Amounts represent our estimate of future payments related to our acquisitions. Some of these payments depend on future performance, and therefore, actual cash payments and the timing of such payments may differ from the estimates. |
The table above excludes the obligations arising from our tax receivable agreement that requires us to make payments to the Continuing LLC Owners in the amount equal to 85% of the applicable cash tax savings, if any, because the timing and amount of such payments is not currently determinable. Refer to Note 5, “Tax Receivable Agreement”, in the notes to the accompanying consolidated financial statements for additional information.
Off-balance sheet transactions
We have not entered into any off-balance sheet arrangements that have, or are reasonably likely to have, a material effect on our financial condition, revenues or expenses, results of operations, liquidity, capital expenditures or capital resources.
Critical accounting policies
Our discussion and analysis of our historical financial condition and results of operations for the periods described is based on our audited consolidated financial statements, which have been prepared in accordance with U.S. GAAP. The preparation of these historical financial statements in conformity with U.S. GAAP requires management to make estimates, assumptions and judgments in certain circumstances that affect the reported amounts of assets, liabilities and contingencies as of the date of the consolidated financial statements and the reported amounts of revenue and expenses during the reporting periods. We evaluate our assumptions and estimates on an ongoing basis. We base our estimates on historical experience and on various other assumptions that we believe to be reasonable under the circumstances, the results of which form the basis for making judgments about the carrying values of assets and liabilities that are not readily apparent from other sources. Actual results may differ from these estimates under different assumptions or conditions. We have provided a summary of our significant accounting policies, as well as a discussion of our evaluation of the impact of recent accounting pronouncements in Note 1, “Description of Business and Summary of Significant Accounting Policies”, in the notes to the accompanying consolidated financial statements. The following discussion pertains to accounting policies management believes are most critical to the portrayal of our historical financial condition and results of operations and that require significant, difficult, subjective or complex judgments. Other companies in similar businesses may use
59
different estimation policies and methodologies, which may impact the comparability of our financial condition, results of operations and cash flows to those of other companies.
Revenue recognition
Our primary revenue sources consist of fees for payment processing services. Payment processing service revenue is primarily based on a percentage of transaction value or on a specified amount per transaction or related services.
As described in Note 1, “Description of Business and Summary of Significant Accounting Policies”, in the notes to the accompanying consolidated financial statements, we adopted a new revenue accounting standard on January 1, 2019 that resulted in revenue being presented net of certain fees that we pay to third parties. This change in presentation affected our reported revenues and operating expenses during the year ended December 31, 2019 by the same amount and had no effect on operating income.
Refer to Note 2, “Revenue”, in the notes to the accompanying consolidated financial statements for further discussion of the Company’s revenue recognition.
Goodwill and intangible assets
We regularly evaluate whether events and circumstances have occurred that indicate the carrying amounts of goodwill and other intangible assets may not be recoverable.
Goodwill represents the excess of the consideration transferred over the fair value of identifiable net assets acquired through business combinations. We evaluate our goodwill for impairment annually as of October 1, or more frequently, if an event occurs or circumstances change that indicate the fair value of a reporting unit is below its carrying amount. Our reporting units are consistent with our segments: the Americas and Europe.
As of October 1, 2019 and 2018, we performed a qualitative assessment as prescribed by ASC 350, Intangibles - Goodwill and Other, to evaluate our goodwill for indicators of impairment. A qualitative assessment includes consideration of macroeconomic conditions, industry and market considerations, changes in certain costs, overall financial performance of each reporting unit and other relevant entity-specific events. In performing the qualitative assessment, we considered the results of the quantitative impairment test performed in 2017 and the financial performance of the reporting units during 2019 and 2018. Based upon such assessment, we determined that it was more likely than not that the fair values of these reporting units exceeded their carrying amounts as of October 1, 2019 and 2018. There were no significant events or changes in the circumstances since the timing of our annual impairment tests that would have required us to reassess the results of the annual tests as of December 31, 2019 and 2018.
As of October 1, 2017, we utilized the two-step quantitative approach to test goodwill for impairment. As a result of the annual impairment testing for 2017, we did not recognize any impairment. As of the date of the 2017 impairment test, the fair values of the Americas and Europe reporting units exceeded their carrying values by approximately $500 million and $300 million, respectively.
For the year ended December 31, 2019, the Company recognized an impairment charge of $13.1 million, primarily related to the termination of Raiffeisen Bank Polska marketing alliance agreement and the retirement of certain trademarks driven by an internal reorganization and the bank consolidations in Spain. For the year ended December 31, 2018, the Company recognized an impairment charge of $14.6 million as a result of the retirement of certain indefinite-lived trademarks, primarily related to the accelerated integration of the Sterling tradename into the EVO portfolio.
As of December 31, 2019, there are no indefinite-lived intangible assets other than goodwill.
Finite-lived intangible assets include merchant contract portfolios and customer relationships, marketing alliance agreements, trademarks and internally developed and acquired software, and non-competition agreements. Finite-lived assets are reviewed for impairment whenever events or changes in circumstances indicate that the carrying amount of an asset may not be recoverable. Recoverability is measured by a comparison of the carrying amount of an asset to estimated
60
undiscounted future cash flows expected to be generated by the asset. Estimated future cash flows for merchant contract portfolios and customer relationships, represented by merchant or customer contracts acquired from third parties that will generate revenue for us, marketing alliance agreements and trademarks are based on our estimates of revenue, expenses and merchant attrition associated with the underlying portfolios of merchant or customer accounts or expected merchant referrals from our referral partners. Estimating merchant attrition involves analysis of historical attrition rates adjusted for our assumptions about future business closures, transfers of merchants’ accounts to our competitors, unsuccessful contract renewal and changes in our relationships with referral partners.
We develop the software that is used in providing services to our customers. Capitalization of internal-use software occurs when we have completed the preliminary project stage. Costs incurred during the preliminary project stage are expensed as incurred. We also acquire the software through our business combinations. Determination of estimated useful lives of internally developed and acquired software requires significant judgment and includes an analysis of potential obsolescence due to new technology, competition and other economic factors.
Refer to Note 1, “Description of Business and Summary of Significant Accounting Policies”, and Note 9, “Goodwill and Intangible Assets”, in the notes to the accompanying consolidated financial statements for further discussion of the Company's goodwill and intangible assets.
Income taxes
EVO, LLC is considered a pass-through entity for U.S. federal and most applicable state and local income tax purposes. As a pass-through entity, taxable income or loss is passed through to and included in the taxable income of its members.
EVO, Inc. is subject to U.S. federal, state, and local income taxes with respect to our allocable share of taxable income of EVO, LLC and is taxed at the prevailing corporate tax rates. In addition to tax expense, we also may make payments under the TRA. We account for the income tax effects and corresponding TRA effects resulting from future taxable purchases or redemptions of LLC Interests of the Continuing LLC Owners or exchanges by the Continuing LLC Owners of LLC Interests and paired Class C common stock or paired Class D common stock for Class A common stock by recognizing an increase in our deferred tax assets based on enacted tax rates at the date of the purchase, redemption or exchange. Further, we evaluate the likelihood that we will realize the benefit represented by the deferred tax asset and, to the extent that we estimate that it is more likely than not that we will not realize the benefit, we will reduce the carrying amount of the deferred tax asset with a valuation allowance. The amounts to be recorded for both the deferred tax assets and the liability for our obligations under the TRA are estimated at the time of any purchase, redemption or exchange and are recorded as a reduction to shareholders’ equity; the effects of changes in any of our estimates after this date are included in net earnings. Similarly, the effects of subsequent changes in the enacted tax rates are included in net earnings. We currently believe our deferred tax assets will be realized based upon the projected profitability of our operations, with the exception of our deferred tax assets in certain European jurisdictions and the United States interest expense limitation. Judgement is required in assessing the future tax consequences of events that will be recognized in EVO, Inc.’s consolidated financial statements. A change in the assessment of such consequences (e.g., realization of deferred tax assets, changes in tax laws or interpretations thereof) could materially impact our results.
Refer to Note 5, “Tax Receivable Agreement”, and Note 13, “Income Taxes”, in the notes to the accompanying consolidated financial statements for further discussion of the Company’s income taxes and the tax receivable agreement.
Redeemable non-controlling interests
Redeemable non-controlling interests (“RNCI”) relate to the portion of equity in a consolidated subsidiary not attributable, directly or indirectly, to us, which is realizable upon the occurrence of an event that is not solely within our control. Such interests are reported in the mezzanine section between total liabilities and permanent shareholders’ equity in our consolidated balance sheets, as temporary equity. We adjust the RNCI to reflect our estimate of the maximum redemption amount against our shareholders’ deficit. Such estimate is based on the conditions that exist as of a balance sheet date, including the estimated current fair value of RNCI. Depending on the underlying non-controlling interest, fair value estimate may be based on projected operating performance and satisfying other conditions specified in the related agreements, or our stock value, and may not be what we will eventually pay for the business.
61
Refer to Note 16, “Redeemable Non-controlling Interests”, in the notes to the accompanying consolidated financial statements for additional information on RNCI.
Stock compensation plans and share-based compensation awards
For our stock options, we utilize the Black-Scholes option-pricing model to compute the estimated fair value. The Black-Scholes model includes assumptions regarding dividend yields, expected volatility, expected lives and risk-free interest rates. These assumptions reflect our best estimates, however, involve uncertainties based on market and other conditions outside of our control. As a result, if other assumptions had been used, stock-based compensation expense could have been materially affected. Furthermore, if different assumptions are used in future periods, share-based compensation expense could be materially affected in future years.
Refer to Note 21, “Stock Compensation Plans and Share-Based Compensation Plans”, in the notes to the accompanying consolidated financial statements for further discussion of stock compensation plans and share-based compensation awards.
New accounting pronouncements
For information regarding new accounting pronouncements, and the impact of these pronouncements on our consolidated financial statements, if any, refer to Note 1, “Description of Business and Summary of Significant Accounting Policies”, in the notes to the accompanying consolidated financial statements.
Inflation
While inflation may impact our revenue and expenses, we believe the effects of inflation, if any, on our results of operations and financial condition have not been significant. However, there can be no assurance that our results of operations and financial condition will not be materially impacted by inflation in the future.
ITEM 7A. QUANTITATIVE AND QUALITATIVE DISCLOSURES ABOUT MARKET RISK
Our future income, cash flows and fair values of the financial instruments are subject to risks relating to interest rates and foreign currency exchange rates.
Interest rate risk
We are subject to interest rate risk in connection with our long-term debt and settlement facilities, which have variable interest rates. The interest rates on these facilities are based on a fixed margin plus a market interest rate, which can fluctuate but is subject to a minimum rate. Interest rate changes could impact the amount of our interest payments, and accordingly, our future earnings and cash flows, assuming other factors are held constant.
As of December 31, 2019, we had approximately $707.8 million of variable rate debt, net of accrued interest, none of which was subject to an interest rate hedge. In the future, the interest rate may increase and we may be subject to interest rate risk. Based on the amount outstanding on our Senior Secured Credit Facilities on December 31, 2019, an increase of 100 basis points in the applicable interest rate would increase our annual interest expense by approximately $7.1 million. A decrease of 100 basis points in the applicable rate (assuming such reduction would not be below the minimum rate) would reduce our annual interest expense by approximately $7.1 million.
62
Foreign currency risk
We are exposed to changes in foreign currency rates as a result of our significant foreign operations. Revenue and income generated by international operations will increase or decrease compared to prior periods as a result of changes in foreign currency exchange rates. A hypothetical uniform 10% weakening in the value of the U.S. dollar relative to all the currencies in which our revenue and income (loss) are denominated would result in an increase to pretax loss of approximately $4.9 million on an annualized basis. The increase results from revenue and income (loss) earned in foreign currencies, primarily denominated in the Euro, Polish Zloty and Mexican Peso. Similarly, a hypothetical uniform 10% strengthening in the value of the U.S. dollar relative to all the currencies in which our revenue and income (loss) are denominated would result in a decrease to pretax loss of approximately $4.9 million on an annualized basis. The decrease results from revenue and income (loss) earned in foreign currencies, primarily denominated in the Euro, Polish Zloty and Mexican Peso. There are inherent limitations in the sensitivity analysis presented, primarily due to the assumption that foreign exchange rate movements are linear and instantaneous. As a result, the analysis is unable to reflect the potential effects of more complex market changes that could arise, which may positively or negatively affect our income (loss).
63
ITEM 8. FINANCIAL STATEMENTS AND SUPPLEMENTARY DATA
Index to Consolidated Financial Statements
|
|
|
|
|
|
65 | |
|
Consolidated Balance Sheets as of December 31, 2019 and 2018 |
|
69 |
|
|
70 | |
|
|
71 | |
|
Consolidated Statements of Cash Flows for each of the years ended December 31, 2019, 2018, and 2017 |
|
75 |
|
|
76 | |
|
|
115 | |
|
|
120 |
64
REPORT OF INDEPENDENT REGISTERED PUBLIC ACCOUNTING FIRM
To the shareholders and the Board of Directors of EVO Payments, Inc.
Opinion on Internal Control over Financial Reporting
We have audited the internal control over financial reporting of EVO Payments, Inc. and subsidiaries (the “Company”) as of December 31, 2019, based on criteria established in Internal Control—Integrated Framework (2013) issued by the Committee of Sponsoring Organizations of the Treadway Commission (COSO). In our opinion, the Company maintained, in all material respects, effective internal control over financial reporting as of December 31, 2019, based on criteria established in Internal Control—Integrated Framework (2013) issued by COSO.
We have also audited, in accordance with the standards of the Public Company Accounting Oversight Board (United States) (PCAOB), the consolidated financial statements of the Company as of and for the year ended December 31, 2019, and our report dated February 27, 2020, expressed an unqualified opinion on those consolidated financial statements.
Basis for Opinion
The Company’s management is responsible for maintaining effective internal control over financial reporting and for its assessment of the effectiveness of internal control over financial reporting, included in the accompanying Management’s Report on Internal Control Over Financial Reporting. Our responsibility is to express an opinion on the Company’s internal control over financial reporting based on our audit. We are a public accounting firm registered with the PCAOB and are required to be independent with respect to the Company in accordance with the U.S. federal securities laws and the applicable rules and regulations of the Securities and Exchange Commission and the PCAOB.
We conducted our audit in accordance with the standards of the PCAOB. Those standards require that we plan and perform the audit to obtain reasonable assurance about whether effective internal control over financial reporting was maintained in all material respects. Our audit included obtaining an understanding of internal control over financial reporting, assessing the risk that a material weakness exists, testing and evaluating the design and operating effectiveness of internal control based on the assessed risk, and performing such other procedures as we considered necessary in the circumstances. We believe that our audit provides a reasonable basis for our opinion.
Definition and Limitations of Internal Control over Financial Reporting
A company’s internal control over financial reporting is a process designed to provide reasonable assurance regarding the reliability of financial reporting and the preparation of financial statements for external purposes in accordance with accounting principles generally accepted in the United States of America (“generally accepted accounting principles”). A company’s internal control over financial reporting includes those policies and procedures that (1) pertain to the maintenance of records that, in reasonable detail, accurately and fairly reflect the transactions and dispositions of the assets of the company; (2) provide reasonable assurance that transactions are recorded as necessary to permit preparation of financial statements in accordance with generally accepted accounting principles, and that receipts and expenditures of the company are being made only in accordance with authorizations of management and directors of the company; and (3) provide reasonable assurance regarding prevention or timely detection of unauthorized acquisition, use, or disposition of the company’s assets that could have a material effect on the financial statements.
Because of its inherent limitations, internal control over financial reporting may not prevent or detect misstatements. Also, projections of any evaluation of effectiveness to future periods are subject to the risk that controls may become inadequate because of changes in conditions, or that the degree of compliance with the policies or procedures may deteriorate.
/s/ Deloitte & Touche LLP
New York, New York
February 27, 2020
65
REPORT OF INDEPENDENT REGISTERED PUBLIC ACCOUNTING FIRM
To the shareholders and the Board of Directors of EVO Payments, Inc.
Opinion on the Consolidated Financial Statements
We have audited the accompanying consolidated balance sheets of EVO Payments, Inc. and subsidiaries (the “Company”) as of December 31, 2019 and 2018, the related consolidated statements of operations and comprehensive (loss) income, changes in equity, and cash flows for each of the three years in the period ended December 31, 2019, and the related notes and the schedules listed in the Index to Consolidated Financial Statements (collectively, the “consolidated financial statements”). In our opinion, the consolidated financial statements present fairly, in all material respects, the financial position of the Company as of December 31, 2019 and 2018, and the results of its operations and its cash flows for each of the three years in the period ended December 31, 2019, in conformity with accounting principles generally accepted in the United States of America.
We have also audited, in accordance with the standards of the Public Company Accounting Oversight Board (United States) (PCAOB), the Company’s internal control over financial reporting as of December 31, 2019, based on criteria established in Internal Control—Integrated Framework (2013) issued by the Committee of Sponsoring Organizations of the Treadway Commission, and our report dated February 27, 2020, expressed an unqualified opinion on the Company’s internal control over financial reporting.
Basis for Opinion
These consolidated financial statements are the responsibility of the Company’s management. Our responsibility is to express an opinion on the Company’s consolidated financial statements based on our audits. We are a public accounting firm registered with the PCAOB and are required to be independent with respect to the Company in accordance with the U.S. federal securities laws and the applicable rules and regulations of the Securities and Exchange Commission and the PCAOB.
We conducted our audits in accordance with the standards of the PCAOB. Those standards require that we plan and perform the audit to obtain reasonable assurance about whether the consolidated financial statements are free of material misstatement, whether due to error or fraud. Our audits included performing procedures to assess the risks of material misstatement of the consolidated financial statements, whether due to error or fraud, and performing procedures that respond to those risks. Such procedures included examining, on a test basis, evidence regarding the amounts and disclosures in the consolidated financial statements. Our audits also included evaluating the accounting principles used and significant estimates made by management, as well as evaluating the overall presentation of the consolidated financial statements. We believe that our audits provide a reasonable basis for our opinion.
Critical Audit Matters
The critical audit matters communicated below are matters arising from the current-period audit of the consolidated financial statements that were communicated or required to be communicated to the audit committee and that (1) relate to accounts or disclosures that are material to the consolidated financial statements and (2) involved our especially challenging, subjective, or complex judgments. The communication of critical audit matters does not alter in any way our opinion on the consolidated financial statements, taken as a whole, and we are not, by communicating the critical audit matters below, providing separate opinions on the critical audit matters or on the accounts or disclosures to which they relate.
Revenue—Refer to Notes 1 and 2 to the consolidated financial statements
Critical Audit Matter Description
The Company’s revenue consists of transaction-based fees that are made up of a significant volume of low-dollar transactions, sourced from multiple systems, platforms, and applications. The processing of payments is highly automated and is based on contractual terms with merchants. Because of the nature of the services, the Company relies on automated systems to process and record its revenue transactions. Netting against the Company’s revenue are commissions for referral partners and third-party processing and assessment costs.
66
We identified revenue as a critical audit matter because the Company’s multiple systems to process and record revenue are highly automated with multiple platforms, including systems to record commissions cost. This required an increased extent of effort, including the need for us to involve professionals with expertise in information technology (IT), to identify, test, and evaluate the Company’s systems, applications, and automated controls.
How the Critical Audit Matter Was Addressed in the Audit
Our audit procedures related to the Company’s systems to process revenue transactions, including commission cost, included the following, among others:
|
· |
With the assistance of our IT specialists, we: |
– Identified the significant systems used to process revenue transactions and tested the general IT controls over each of these systems, including testing of user access controls, change management controls, and IT operations controls.
– Performed testing of system interface controls and automated controls relevant to revenue processes.
|
· |
We tested internal controls within the relevant revenue processes, including those in place to reconcile the various systems to the Company’s general ledger. |
|
· |
For certain components of revenue, we developed an independent expectation of revenue and compared it to the amount recorded by the Company. |
|
· |
For certain components of revenue, we performed detail transaction testing for a sample of such revenue transactions, by agreeing the amounts recognized to source documents, and tested the mathematical accuracy of the recorded revenue. |
|
· |
For commissions to referral partners, we developed an independent expectation for commission cost and compared it to the commission cost recorded by the Company. |
Deferred Tax Assets—Valuation Allowance—Refer to Notes 1 and 13 to the consolidated financial statements
Critical Audit Matter Description
The Company recognizes deferred tax assets to the extent that it is expected that these assets are more likely than not to be realized. The Company evaluates the realizability of the deferred tax assets, and to the extent that the Company estimates that it is more likely than not that a benefit will not be realized, the carrying amount of the deferred tax assets is reduced with a valuation allowance. As a part of this evaluation, the Company assesses all available positive and negative evidence, including future reversals of existing taxable temporary differences, projected future taxable income, tax-planning strategies, and results of recent operations, to determine whether sufficient future taxable income will be generated to realize existing deferred tax assets. The Company has identified objective and verifiable negative evidence in the form of cumulative losses on an unadjusted basis in certain jurisdictions over the preceding 12 quarters ended December 31, 2019. The Company also evaluated its historical core earnings by jurisdiction after adjusting for certain nonrecurring items. On the basis of this assessment and after considering future reversals of existing taxable temporary differences, the Company established valuation allowances in the current and prior periods to reduce the carrying amount of deferred tax assets to an amount that is more likely than not to be realized in certain European jurisdictions. In the U.S. jurisdiction, however, with exception of the valuation allowance for the U.S. interest expense limitation, the Company concluded that its deferred tax assets of $197.8 million will be realizable and recorded no valuation allowance based upon the projected future profitability of its core operations.
We identified the valuation of deferred tax assets in the U.S. jurisdiction as a critical audit matter because of the significant judgments made by management in projecting future taxable income. Our audit procedures required a high degree of auditor judgment and an increased extent of effort, including the need to involve our income tax specialists, to evaluate the reasonableness of management’s estimates of projected future taxable income.
67
How the Critical Audit Matter Was Addressed in the Audit
Our audit procedures related to projected future taxable income and the determination of whether it is more likely than not that the deferred tax assets in the U.S. jurisdiction will be realized included the following, among others:
|
· |
We tested the effectiveness of controls over the valuation of deferred tax assets, including management’s controls over the projections of future taxable income and the determination of whether it is more likely than not that the deferred tax assets will be realized. |
|
· |
With the assistance of our income tax specialists, we considered the appropriateness of the sources of projected future taxable income. |
|
· |
We evaluated the reasonableness of management’s estimates of projected future taxable income by comparing the estimates to: |
– Historical core earnings as adjusted for nonrecurring items.
– Internal communications to management and the Board of Directors.
– Forecasted information included in the Company’s press releases as well as in analyst and industry reports for the Company.
|
· |
We evaluated whether the projected future taxable income and identification of nonrecurring items used to adjust historical losses were consistent with evidence obtained in other areas of the audit. |
|
· |
We evaluated whether the projected future taxable income as adjusted for nonrecurring items in historical periods was of the appropriate character and available under the tax law. |
/s/ Deloitte & Touche LLP
New York, New York
February 27, 2020
We have served as the Company’s auditor since 2016.
68
EVO PAYMENTS, INC. AND SUBSIDIARIES
(In thousands, except share data)
|
|
|
December 31, |
|
December 31, |
||
|
|
|
2019 |
|
2018 |
||
|
Assets |
|
|
|
|
|
|
|
Current assets: |
|
|
|
|
|
|
|
Cash and cash equivalents |
|
$ |
304,089 |
|
$ |
350,697 |
|
Accounts receivable, net |
|
|
15,881 |
|
|
13,248 |
|
Other receivables |
|
|
24,438 |
|
|
56,518 |
|
Due from related parties |
|
|
1,125 |
|
|
1,871 |
|
Inventory |
|
|
9,128 |
|
|
8,867 |
|
Settlement processing assets |
|
|
328,637 |
|
|
248,330 |
|
Other current assets |
|
|
12,867 |
|
|
11,817 |
|
Total current assets |
|
|
696,165 |
|
|
691,348 |
|
Equipment and improvements, net |
|
|
94,464 |
|
|
103,046 |
|
Goodwill, net |
|
|
378,838 |
|
|
353,011 |
|
Intangible assets, net |
|
|
257,560 |
|
|
290,139 |
|
Investment in unconsolidated investees |
|
|
2,078 |
|
|
1,753 |
|
Due from related parties |
|
|
— |
|
|
915 |
|
Deferred tax assets |
|
|
210,275 |
|
|
72,296 |
|
Operating lease right-of-use assets |
|
|
45,664 |
|
|
— |
|
Other assets |
|
|
21,360 |
|
|
21,879 |
|
Total assets |
|
$ |
1,706,404 |
|
$ |
1,534,387 |
|
|
|
|
|
|
|
|
|
Liabilities and Shareholders' Deficit |
|
|
|
|
|
|
|
Current liabilities: |
|
|
|
|
|
|
|
Settlement lines of credit |
|
$ |
33,103 |
|
$ |
41,819 |
|
Current portion of long-term debt |
|
|
8,744 |
|
|
7,191 |
|
Accounts payable |
|
|
13,584 |
|
|
48,935 |
|
Accrued expenses |
|
|
110,079 |
|
|
112,281 |
|
Settlement processing obligations |
|
|
449,302 |
|
|
428,328 |
|
Current portion of operating lease liabilities, inclusive of related party liability of $1.2 million at December 31, 2019 |
|
|
7,087 |
|
|
— |
|
Due to related parties |
|
|
7,325 |
|
|
4,824 |
|
Total current liabilities |
|
|
629,224 |
|
|
643,378 |
|
Long-term debt, net of current portion |
|
|
693,169 |
|
|
676,865 |
|
Due to related parties |
|
|
385 |
|
|
385 |
|
Deferred tax liabilities |
|
|
17,260 |
|
|
13,519 |
|
Tax receivable agreement obligations, inclusive of related party liability of $141.1 million and $40.7 million at December 31, 2019 and 2018, respectively |
|
|
150,274 |
|
|
47,221 |
|
ISO reserves |
|
|
2,758 |
|
|
2,684 |
|
Operating lease liabilities, net of current portion, inclusive of related party liability of $3.2 million at December 31, 2019 |
|
|
41,703 |
|
|
— |
|
Other long-term liabilities |
|
|
1,830 |
|
|
2,924 |
|
Total liabilities |
|
|
1,536,603 |
|
|
1,386,976 |
|
Commitments and contingencies |
|
|
|
|
|
|
|
Redeemable non-controlling interests |
|
|
1,052,448 |
|
|
1,010,093 |
|
Shareholders' deficit: |
|
|
|
|
|
|
|
Shareholders' deficit: |
|
|
|
|
|
|
|
Class A common stock (par value, $0.0001 per share), Authorized - 200,000,000 shares, Issued and Outstanding - 41,233,954 and 26,025,189 shares at December 31, 2019 and 2018, respectively |
|
|
4 |
|
|
3 |
|
Class B common stock (par value, $0.0001 per share), Authorized - 40,000,000 shares, Issued and Outstanding - 34,163,538 and 35,913,538 shares at December 31, 2019 and 2018, respectively |
|
|
3 |
|
|
4 |
|
Class C common stock (par value, $0.0001 per share), Authorized - 4,000,000 shares, Issued and Outstanding - 2,321,955 and 2,461,055 shares at December 31, 2019 and 2018, respectively |
|
|
— |
|
|
— |
|
Class D common stock (par value, $0.0001 per share), Authorized - 32,000,000 shares, Issued and Outstanding - 4,354,978 and 16,785,552 shares at December 31, 2019 and 2018, respectively |
|
|
— |
|
|
1 |
|
Additional paid-in capital |
|
|
— |
|
|
178,176 |
|
Accumulated deficit attributable to Class A common stock |
|
|
(587,358) |
|
|
(223,799) |
|
Accumulated other comprehensive loss |
|
|
(1,948) |
|
|
(2,993) |
|
Total EVO Payments, Inc. shareholders' deficit |
|
|
(589,299) |
|
|
(48,608) |
|
Nonredeemable non-controlling interests |
|
|
(293,348) |
|
|
(814,074) |
|
Total deficit |
|
|
(882,647) |
|
|
(862,682) |
|
Total liabilities and deficit |
|
$ |
1,706,404 |
|
$ |
1,534,387 |
See accompanying notes to consolidated financial statements
69
EVO PAYMENTS, INC. AND SUBSIDIARIES
Consolidated Statements of Operations and Comprehensive (Loss) Income
(In thousands, except share and per share data)
|
|
|
Year Ended December 31, |
|||||||
|
|
|
2019 |
|
2018 |
|
2017 |
|||
|
Revenue |
|
$ |
485,778 |
|
$ |
564,754 |
|
$ |
504,750 |
|
Operating expenses: |
|
|
|
|
|
|
|
|
|
|
Cost of services and products |
|
|
96,365 |
|
|
189,375 |
|
|
164,480 |
|
Selling, general, and administrative |
|
|
267,926 |
|
|
311,353 |
|
|
220,971 |
|
Depreciation and amortization |
|
|
92,059 |
|
|
87,184 |
|
|
74,136 |
|
Impairment of intangible assets |
|
|
13,101 |
|
|
14,627 |
|
|
— |
|
Total operating expenses |
|
|
469,451 |
|
|
602,539 |
|
|
459,587 |
|
Income (loss) from operations |
|
|
16,327 |
|
|
(37,785) |
|
|
45,163 |
|
Other (expense) income: |
|
|
|
|
|
|
|
|
|
|
Interest income |
|
|
2,872 |
|
|
2,219 |
|
|
1,489 |
|
Interest expense |
|
|
(44,011) |
|
|
(59,759) |
|
|
(62,876) |
|
Income from investment in unconsolidated investees |
|
|
560 |
|
|
1,513 |
|
|
941 |
|
Gain on acquisition of unconsolidated investee |
|
|
— |
|
|
8,404 |
|
|
— |
|
Other income (expense), net |
|
|
5,434 |
|
|
(2,998) |
|
|
(477) |
|
Total other expense |
|
|
(35,145) |
|
|
(50,621) |
|
|
(60,923) |
|
Loss before income taxes |
|
|
(18,818) |
|
|
(88,406) |
|
|
(15,760) |
|
Income tax expense |
|
|
(4,548) |
|
|
(10,444) |
|
|
(16,588) |
|
Net loss |
|
|
(23,366) |
|
|
(98,850) |
|
|
(32,348) |
|
Less: Net income attributable to non-controlling interests in consolidated entities |
|
|
7,877 |
|
|
6,696 |
|
|
7,894 |
|
Net loss attributable to EVO Investco, LLC |
|
|
|
|
|
|
|
$ |
(40,242) |
|
Less: Net loss attributable to non-controlling interests of EVO Investco, LLC |
|
|
(21,138) |
|
|
(90,834) |
|
|
|
|
Net loss attributable to EVO Payments, Inc. |
|
$ |
(10,105) |
|
$ |
(14,712) |
|
|
|
|
|
|
|
|
|
|
|
|
|
|
|
Earnings per share |
|
|
|
|
|
|
|
|
|
|
Basic |
|
$ |
(0.31) |
|
$ |
(0.70) |
|
|
|
|
Diluted |
|
$ |
(0.31) |
|
$ |
(0.70) |
|
|
|
|
|
|
|
|
|
|
|
|
|
|
|
Weighted-average Class A common stock outstanding |
|
|
|
|
|
|
|
|
|
|
Basic |
|
|
32,720,370 |
|
|
21,081,447 |
|
|
|
|
Diluted |
|
|
32,720,370 |
|
|
21,081,447 |
|
|
|
|
|
|
|
|
|
|
|
|
|
|
|
Comprehensive loss: |
|
|
|
|
|
|
|
|
|
|
Net loss |
|
$ |
(23,366) |
|
$ |
(98,850) |
|
$ |
(32,348) |
|
Unrealized (loss) gain on defined benefit plan, |
|
|
(15) |
|
|
(228) |
|
|
530 |
|
Unrealized gain (loss) on foreign currency translation adjustment, net of tax (2) |
|
|
339 |
|
|
(18,545) |
|
|
69,917 |
|
Other comprehensive income (loss) |
|
|
324 |
|
|
(18,773) |
|
|
70,447 |
|
Comprehensive (loss) income |
|
|
(23,042) |
|
|
(117,623) |
|
|
38,099 |
|
Less: Comprehensive income attributable to non-controlling interests in consolidated entities |
|
|
7,513 |
|
|
2,224 |
|
|
18,556 |
|
Comprehensive income attributable to EVO Investco, LLC |
|
|
|
|
|
|
|
$ |
19,543 |
|
Less: Comprehensive loss attributable to non-controlling interests of EVO Investco, LLC |
|
|
(21,258) |
|
|
(102,821) |
|
|
|
|
Comprehensive loss attributable to EVO Payments, Inc. |
|
$ |
(9,297) |
|
$ |
(17,026) |
|
|
|
|
(1) |
Net of tax benefit of less than $0.1 million for each of the years ended December 31, 2019 and 2018. |
|
(2) |
Net of tax expense of $0.1 million and benefit of $0.7 million for the years ended December 31, 2019 and 2018, respectively. |
See accompanying notes to consolidated financial statements.
70
EVO PAYMENTS, INC. AND SUBSIDIARIES
Consolidated Statements of Changes in Equity
(In thousands)
|
|
|
|
|
|
|
|
|
|
|
|
|
|
|
|
|
|
|
|
|
|
|
|
|
|
|
|
|
|
|
|
|
|
Total |
|
|
|
|
|
|
|
|
|
|
|
|
|
|
|
|
|
|
|
|
|
|
|
|
|
|
|
|
|
|
|
|
|
|
|
|
|
|
|
|
|
|
|
|
Accumulated |
|
EVO |
|
|
|
|
|
|
|
|
|
|
|
|
||
|
|
|
|
|
|
|
|
|
|
|
|
|
|
|
|
|
|
|
|
|
|
|
|
|
|
|
|
|
|
|
other |
|
Payments, |
|
Non-redeemable |
|
|
|
|
Redeemable |
|
|
|
||||
|
|
|
Class A LLC Units |
|
Class B LLC Units |
|
Class C LLC Units |
|
Class D LLC Units |
|
Class E LLC Units |
|
|
Accumulated |
|
comprehensive |
|
Inc. |
|
non-controlling |
|
Total |
|
non-controlling |
|
|
|||||||||||||||||||||
|
|
|
Interests |
|
Amounts |
|
Interests |
|
Amounts |
|
Interests |
|
Amounts |
|
Interests |
|
Amounts |
|
Interests |
|
Amounts |
|
|
deficit |
|
loss |
|
deficit |
|
interests |
|
deficit |
|
interests |
|
Total |
|||||||||||
|
Balance, January 1, 2017 |
|
6,374 |
|
$ |
54,453 |
|
3,506 |
|
$ |
— |
|
375 |
|
$ |
9,463 |
|
1,085 |
|
$ |
— |
|
— |
|
$ |
— |
|
$ |
(124,028) |
|
$ |
(127,464) |
|
$ |
(187,576) |
|
$ |
(10,187) |
|
$ |
(197,763) |
|
$ |
100,530 |
|
$ |
(97,233) |
|
|
|
|
|
|
|
|
|
|
|
|
|
|
|
|
|
|
|
|
|
|
|
|
|
|
|
|
|
|
|
|
|
|
|
|
|
|
|
|
|
|
|
|
|
|
|
|
|
Net (loss) income |
|
— |
|
|
— |
|
— |
|
|
— |
|
— |
|
|
— |
|
— |
|
|
— |
|
— |
|
|
— |
|
|
(40,242) |
|
|
— |
|
|
(40,242) |
|
|
2,429 |
|
|
(37,813) |
|
|
5,465 |
|
|
(32,348) |
|
Foreign currency translation and other adjustments |
|
— |
|
|
— |
|
— |
|
|
— |
|
— |
|
|
— |
|
— |
|
|
— |
|
— |
|
|
— |
|
|
(29,948) |
|
|
59,255 |
|
|
29,307 |
|
|
16,234 |
|
|
45,541 |
|
|
10,662 |
|
|
56,203 |
|
Defined benefit pension plan |
|
— |
|
|
— |
|
— |
|
|
— |
|
— |
|
|
— |
|
— |
|
|
— |
|
— |
|
|
— |
|
|
— |
|
|
530 |
|
|
530 |
|
|
— |
|
|
530 |
|
|
— |
|
|
530 |
|
Acquisition of additional shares in a consolidated subsidiary |
|
— |
|
|
— |
|
— |
|
|
— |
|
— |
|
|
— |
|
— |
|
|
— |
|
— |
|
|
— |
|
|
(6,401) |
|
|
— |
|
|
(6,401) |
|
|
(2,817) |
|
|
(9,218) |
|
|
— |
|
|
(9,218) |
|
Redeemable non-controlling interests adjustment |
|
— |
|
|
— |
|
— |
|
|
— |
|
— |
|
|
— |
|
— |
|
|
— |
|
— |
|
|
— |
|
|
(34,985) |
|
|
— |
|
|
(34,985) |
|
|
— |
|
|
(34,985) |
|
|
34,985 |
|
|
— |
|
Unit purchase/redemption/forfeiture/grants |
|
— |
|
|
— |
|
— |
|
|
— |
|
— |
|
|
— |
|
22 |
|
|
— |
|
1,012 |
|
|
71,250 |
|
|
— |
|
|
|
|
|
71,250 |
|
|
— |
|
|
71,250 |
|
|
— |
|
|
71,250 |
|
Distributions |
|
— |
|
|
— |
|
— |
|
|
— |
|
— |
|
|
— |
|
— |
|
|
— |
|
— |
|
|
— |
|
|
(1,726) |
|
|
— |
|
|
(1,726) |
|
|
(2,347) |
|
|
(4,073) |
|
|
(3,376) |
|
|
(7,449) |
|
Balance, December 31, 2017 |
|
6,374 |
|
$ |
54,453 |
|
3,506 |
|
$ |
— |
|
375 |
|
$ |
9,463 |
|
1,107 |
|
$ |
— |
|
1,012 |
|
$ |
71,250 |
|
$ |
(237,330) |
|
$ |
(67,679) |
|
$ |
(169,843) |
|
$ |
3,312 |
|
$ |
(166,531) |
|
$ |
148,266 |
|
$ |
(18,265) |
See accompanying notes to consolidated financial statements.
71
|
|
|
Class A LLC Units |
|
Class B LLC Units |
|
Class C LLC Units |
|
Class D LLC Units |
|
Class E LLC Units |
|
Class A common stock |
|
Class B common stock |
|||||||||||||||||||||
|
|
|
Interests |
|
Amounts |
|
Interests |
|
Amounts |
|
Interests |
|
Amounts |
|
Interests |
|
Amounts |
|
Interests |
|
Amounts |
|
Shares |
|
Amounts |
|
Shares |
|
Amounts |
|||||||
|
Balance, January 1, 2018 |
|
6,374 |
|
$ |
54,453 |
|
3,506 |
|
$ |
— |
|
375 |
|
$ |
9,463 |
|
1,107 |
|
$ |
— |
|
1,012 |
|
$ |
71,250 |
|
— |
|
$ |
— |
|
— |
|
$ |
— |
|
|
|
|
|
|
|
|
|
|
|
|
|
|
|
|
|
|
|
|
|
|
|
|
|
|
|
|
|
|
|
|
|
|
|
|
|
|
Net income prior to Reorganization Transactions |
|
— |
|
|
— |
|
— |
|
|
— |
|
— |
|
|
— |
|
— |
|
|
— |
|
— |
|
|
— |
|
— |
|
|
— |
|
— |
|
|
— |
|
Cumulative translation adjustment prior to Reorganization Transactions |
|
— |
|
|
— |
|
— |
|
|
— |
|
— |
|
|
— |
|
— |
|
|
— |
|
— |
|
|
— |
|
— |
|
|
— |
|
— |
|
|
— |
|
Distributions prior to Reorganization Transactions |
|
— |
|
|
— |
|
— |
|
|
— |
|
— |
|
|
— |
|
— |
|
|
— |
|
— |
|
|
— |
|
— |
|
|
— |
|
— |
|
|
— |
|
Acquisition of additional shares in a consolidated subsidiary |
|
— |
|
|
— |
|
— |
|
|
— |
|
— |
|
|
— |
|
— |
|
|
— |
|
— |
|
|
— |
|
— |
|
|
— |
|
— |
|
|
— |
|
Legacy deficit / accumulated comprehensive loss allocation (Class C&D) |
|
— |
|
|
— |
|
— |
|
|
— |
|
— |
|
|
— |
|
— |
|
|
— |
|
— |
|
|
— |
|
— |
|
|
— |
|
— |
|
|
— |
|
Legacy deficit / accumulated comprehensive loss allocation (Class B) |
|
— |
|
|
— |
|
— |
|
|
— |
|
— |
|
|
— |
|
— |
|
|
— |
|
— |
|
|
— |
|
— |
|
|
— |
|
— |
|
|
— |
|
Equity issued in connection with acquisition prior to Reorganization Transactions |
|
(6,374) |
|
|
(54,453) |
|
(3,506) |
|
|
— |
|
(375) |
|
|
(9,463) |
|
(1,107) |
|
|
— |
|
(1,012) |
|
|
(71,250) |
|
1,319 |
|
|
— |
|
35,914 |
|
|
4 |
|
Share-based compensation prior to Reorganization Transactions, net of share settlement |
|
— |
|
|
— |
|
— |
|
|
— |
|
— |
|
|
— |
|
— |
|
|
— |
|
— |
|
|
— |
|
494 |
|
|
— |
|
— |
|
|
— |
|
Class B redeemable non-controlling interests fair value adjustment in connection to Reorganization Transactions |
|
— |
|
|
— |
|
— |
|
|
— |
|
— |
|
|
— |
|
— |
|
|
— |
|
— |
|
|
— |
|
— |
|
|
— |
|
— |
|
|
— |
|
|
|
|
|
|
|
|
|
|
|
|
|
|
|
|
|
|
|
|
|
|
|
|
|
|
|
|
|
|
|
|
|
|
|
|
|
|
Effect of Reorganization Transactions |
|
— |
|
|
— |
|
— |
|
|
— |
|
— |
|
|
— |
|
— |
|
|
— |
|
— |
|
|
— |
|
1,813 |
|
|
— |
|
35,914 |
|
|
4 |
|
|
|
|
|
|
|
|
|
|
|
|
|
|
|
|
|
|
|
|
|
|
|
|
|
|
|
|
|
|
|
|
|
|
|
|
|
|
Sale of Class A common stock in initial public offering, net of underwriter fees |
|
— |
|
|
— |
|
— |
|
|
— |
|
— |
|
|
— |
|
— |
|
|
— |
|
— |
|
|
— |
|
15,434 |
|
|
2 |
|
— |
|
|
— |
|
Contingent consideration settled in Class A common stock |
|
— |
|
|
— |
|
— |
|
|
— |
|
— |
|
|
— |
|
— |
|
|
— |
|
— |
|
|
— |
|
48 |
|
|
— |
|
— |
|
|
— |
|
Deferred taxes in connection with the Reorganization Transaction, and subsequent conversions of shares of Class C common stock and Class D common stock |
|
— |
|
|
— |
|
— |
|
|
— |
|
— |
|
|
— |
|
— |
|
|
— |
|
— |
|
|
— |
|
— |
|
|
— |
|
— |
|
|
— |
|
Tax receivable agreement obligations in connection with the Reorganization Transaction, and subsequent conversions of shares of Class C common stock and Class D common stock |
|
— |
|
|
— |
|
— |
|
|
— |
|
— |
|
|
— |
|
— |
|
|
— |
|
— |
|
|
— |
|
— |
|
|
— |
|
— |
|
|
— |
|
Net income subsequent to the Reorganization Transactions |
|
— |
|
|
— |
|
— |
|
|
— |
|
— |
|
|
— |
|
— |
|
|
— |
|
— |
|
|
— |
|
— |
|
|
— |
|
— |
|
|
— |
|
Cumulative translation adjustment subsequent to the Reorganization Transactions |
|
— |
|
|
— |
|
— |
|
|
— |
|
— |
|
|
— |
|
— |
|
|
— |
|
— |
|
|
— |
|
— |
|
|
— |
|
— |
|
|
— |
|
Distributions subsequent to the Reorganization Transactions |
|
— |
|
|
— |
|
— |
|
|
— |
|
— |
|
|
— |
|
— |
|
|
— |
|
— |
|
|
— |
|
— |
|
|
— |
|
— |
|
|
— |
|
Acquisition of additional shares in a consolidated subsidiary |
|
— |
|
|
— |
|
— |
|
|
— |
|
— |
|
|
— |
|
— |
|
|
— |
|
— |
|
|
— |
|
— |
|
|
— |
|
— |
|
|
— |
|
eService redeemable non-controlling interest fair value adjustment |
|
— |
|
|
— |
|
— |
|
|
— |
|
— |
|
|
— |
|
— |
|
|
— |
|
— |
|
|
— |
|
— |
|
|
— |
|
— |
|
|
— |
|
Sale of Employee Ownership |
|
— |
|
|
— |
|
— |
|
|
— |
|
— |
|
|
— |
|
— |
|
|
— |
|
— |
|
|
— |
|
22 |
|
|
— |
|
— |
|
|
— |
|
Sale of Class A common stock in September 2018 Secondary Offering, net of underwriter fees |
|
— |
|
|
— |
|
— |
|
|
— |
|
— |
|
|
— |
|
— |
|
|
— |
|
— |
|
|
— |
|
8,053 |
|
|
1 |
|
— |
|
|
— |
|
Sale of MDP Class D Shares |
|
— |
|
|
— |
|
— |
|
|
— |
|
— |
|
|
— |
|
— |
|
|
— |
|
— |
|
|
— |
|
— |
|
|
— |
|
— |
|
|
— |
|
Share-based compensation expense |
|
— |
|
|
— |
|
— |
|
|
— |
|
— |
|
|
— |
|
— |
|
|
— |
|
— |
|
|
— |
|
57 |
|
|
— |
|
— |
|
|
— |
|
Conversion of Class C & D shares to Class A |
|
— |
|
|
— |
|
— |
|
|
— |
|
— |
|
|
— |
|
— |
|
|
— |
|
— |
|
|
— |
|
598 |
|
|
— |
|
— |
|
|
— |
|
Revaluation of defined benefit pension plan |
|
— |
|
|
— |
|
— |
|
|
— |
|
— |
|
|
— |
|
— |
|
|
— |
|
— |
|
|
— |
|
— |
|
|
— |
|
— |
|
|
— |
|
Blueapple redeemable non-controlling interest fair value adjustment subsequent to the Reorganization Transactions |
|
— |
|
|
— |
|
— |
|
|
— |
|
— |
|
|
— |
|
— |
|
|
— |
|
— |
|
|
— |
|
— |
|
|
— |
|
— |
|
|
— |
|
Balance, December 31, 2018 |
|
— |
|
$ |
— |
|
— |
|
$ |
— |
|
— |
|
$ |
— |
|
— |
|
$ |
— |
|
— |
|
$ |
— |
|
26,025 |
|
$ |
3 |
|
35,914 |
|
$ |
4 |
See accompanying notes to consolidated financial statements.
72
|
|
|
|
|
|
|
|
|
|
|
|
|
|
|
|
Accumulated |
|
Accumulated |
|
|
|
|
Total |
|
|
|
|
|
|
|
|
|
|
|
|
|||
|
|
|
|
|
|
|
|
|
|
|
|
|
|
|
|
deficit |
|
deficit |
|
Accumulated |
|
EVO |
|
|
|
|
|
|
|
|
|
|
|
|
||||
|
|
|
|
|
|
|
|
|
|
|
|
|
Additional |
|
attributable to |
|
attributable to |
|
other |
|
Payments, |
|
Nonredeemable |
|
|
|
|
Redeemable |
|
|
|
|||||||
|
|
|
Class C common stock |
|
Class D common stock |
|
paid-in |
|
Class A |
|
members of |
|
comprehensive |
|
Inc. (deficit) |
|
non-controlling |
|
Total |
|
non-controlling |
|
|
|
||||||||||||||
|
|
|
Shares |
|
Amounts |
|
Shares |
|
Amounts |
|
capital |
|
common stock |
|
EVO Investco, LLC |
|
loss |
|
/equity |
|
interests |
|
deficit |
|
interests |
|
Total |
|||||||||||
|
Balance, January 1, 2018 |
|
— |
|
$ |
— |
|
— |
|
$ |
— |
|
$ |
— |
|
$ |
— |
|
$ |
(237,330) |
|
$ |
(67,679) |
|
$ |
(169,843) |
|
$ |
3,312 |
|
$ |
(166,531) |
|
$ |
148,266 |
|
$ |
(18,265) |
|
|
|
|
|
|
|
|
|
|
|
|
|
|
|
|
|
|
|
|
|
|
|
|
|
|
|
|
|
|
|
|
|
|
|
|
|
|
|
|
Net income prior to Reorganization Transactions |
|
— |
|
|
— |
|
— |
|
|
— |
|
|
— |
|
|
— |
|
|
(24,412) |
|
|
— |
|
|
(24,412) |
|
|
— |
|
|
(24,412) |
|
|
1,291 |
|
|
(23,121) |
|
Cumulative translation adjustment prior to Reorganization Transactions |
|
— |
|
|
— |
|
— |
|
|
— |
|
|
— |
|
|
— |
|
|
— |
|
|
(6,337) |
|
|
(6,337) |
|
|
— |
|
|
(6,337) |
|
|
(2,104) |
|
|
(8,441) |
|
Distributions prior to Reorganization Transactions |
|
— |
|
|
— |
|
— |
|
|
— |
|
|
— |
|
|
— |
|
|
— |
|
|
— |
|
|
— |
|
|
(1,334) |
|
|
(1,334) |
|
|
(3,770) |
|
|
(5,104) |
|
Acquisition of additional shares in a consolidated subsidiary |
|
— |
|
|
— |
|
— |
|
|
— |
|
|
— |
|
|
— |
|
|
(20,924) |
|
|
— |
|
|
(20,924) |
|
|
(1,141) |
|
|
(22,065) |
|
|
— |
|
|
(22,065) |
|
Legacy deficit / accumulated comprehensive loss allocation (Class C&D) |
|
— |
|
|
— |
|
— |
|
|
— |
|
|
— |
|
|
— |
|
|
132,181 |
|
|
34,612 |
|
|
166,793 |
|
|
(166,793) |
|
|
— |
|
|
— |
|
|
— |
|
Legacy deficit / accumulated comprehensive loss allocation (Class B) |
|
— |
|
|
— |
|
— |
|
|
— |
|
|
— |
|
|
— |
|
|
150,485 |
|
|
39,404 |
|
|
189,889 |
|
|
— |
|
|
189,889 |
|
|
(189,889) |
|
|
— |
|
Equity issued in connection with acquisition prior to Reorganization Transactions |
|
2,561 |
|
|
— |
|
24,305 |
|
|
2 |
|
|
135,160 |
|
|
— |
|
|
— |
|
|
— |
|
|
— |
|
|
— |
|
|
— |
|
|
— |
|
|
— |
|
Share-based compensation prior to Reorganization Transactions, net of share settlement |
|
— |
|
|
— |
|
— |
|
|
— |
|
|
51,339 |
|
|
— |
|
|
— |
|
|
— |
|
|
51,339 |
|
|
— |
|
|
51,339 |
|
|
— |
|
|
51,339 |
|
Class B redeemable non-controlling interests fair value adjustment in connection to Reorganization Transactions |
|
— |
|
|
— |
|
— |
|
|
— |
|
|
— |
|
|
— |
|
|
— |
|
|
— |
|
|
— |
|
|
(735,775) |
|
|
(735,775) |
|
|
735,775 |
|
|
— |
|
|
|
|
|
|
|
|
|
|
|
|
|
|
|
|
|
|
|
|
|
|
|
|
|
|
|
|
|
|
|
|
|
|
|
|
|
|
|
|
Effect of Reorganization Transactions |
|
2,561 |
|
|
— |
|
24,305 |
|
|
2 |
|
|
186,499 |
|
|
— |
|
|
— |
|
|
— |
|
|
186,505 |
|
|
(901,731) |
|
|
(715,226) |
|
|
689,569 |
|
|
(25,657) |
|
|
|
|
|
|
|
|
|
|
|
|
|
|
|
|
|
|
|
|
|
|
|
|
|
|
|
|
|
|
|
|
|
|
|
|
|
|
|
|
Sale of Class A common stock in initial public offering, net of underwriter fees |
|
— |
|
|
— |
|
— |
|
|
— |
|
|
219,020 |
|
|
— |
|
|
— |
|
|
— |
|
|
219,022 |
|
|
— |
|
|
219,022 |
|
|
— |
|
|
219,022 |
|
Contingent consideration settled in Class A common stock |
|
— |
|
|
— |
|
— |
|
|
— |
|
|
771 |
|
|
— |
|
|
— |
|
|
— |
|
|
771 |
|
|
— |
|
|
771 |
|
|
— |
|
|
771 |
|
Deferred taxes in connection with the Reorganization Transaction, and subsequent conversions of shares of Class C common stock and Class D common stock |
|
— |
|
|
— |
|
— |
|
|
— |
|
|
6,714 |
|
|
— |
|
|
— |
|
|
26 |
|
|
6,740 |
|
|
— |
|
|
6,740 |
|
|
— |
|
|
6,740 |
|
Tax receivable agreement obligations in connection with the Reorganization Transaction, and subsequent conversions of shares of Class C common stock and Class D common stock |
|
— |
|
|
— |
|
— |
|
|
— |
|
|
8,333 |
|
|
— |
|
|
— |
|
|
— |
|
|
8,333 |
|
|
— |
|
|
8,333 |
|
|
— |
|
|
8,333 |
|
Net income subsequent to the Reorganization Transactions |
|
— |
|
|
— |
|
— |
|
|
— |
|
|
— |
|
|
(14,712) |
|
|
— |
|
|
— |
|
|
(14,712) |
|
|
(26,802) |
|
|
(41,514) |
|
|
(34,215) |
|
|
(75,729) |
|
Cumulative translation adjustment subsequent to the Reorganization Transactions |
|
— |
|
|
— |
|
— |
|
|
— |
|
|
— |
|
|
— |
|
|
— |
|
|
(2,942) |
|
|
(2,942) |
|
|
(1,540) |
|
|
(4,482) |
|
|
(6,303) |
|
|
(10,785) |
|
Distributions subsequent to the Reorganization Transactions |
|
— |
|
|
— |
|
— |
|
|
— |
|
|
— |
|
|
— |
|
|
— |
|
|
— |
|
|
— |
|
|
(92) |
|
|
(92) |
|
|
(2,380) |
|
|
(2,472) |
|
Acquisition of additional shares in a consolidated subsidiary |
|
|
|
|
— |
|
— |
|
|
— |
|
|
— |
|
|
(58) |
|
|
— |
|
|
— |
|
|
(58) |
|
|
(45) |
|
|
(103) |
|
|
— |
|
|
(103) |
|
eService redeemable non-controlling interest fair value adjustment |
|
— |
|
|
— |
|
— |
|
|
— |
|
|
— |
|
|
6,325 |
|
|
— |
|
|
— |
|
|
6,325 |
|
|
4,677 |
|
|
11,002 |
|
|
(11,002) |
|
|
— |
|
Sale of Employee Ownership |
|
— |
|
|
— |
|
(22) |
|
|
— |
|
|
(857) |
|
— |
— |
|
— |
— |
|
|
— |
|
|
(857) |
|
|
857 |
|
|
— |
|
|
— |
|
|
— |
|
Sale of Class A common stock in the September 2018 Secondary Offering, net of underwriter fees |
|
— |
|
|
— |
|
— |
|
|
— |
|
|
190,161 |
|
|
— |
|
|
— |
|
|
— |
|
|
190,162 |
|
|
— |
|
|
190,162 |
|
|
— |
|
|
190,162 |
|
Sale of MDP Class D Shares |
|
— |
|
|
— |
|
(7,000) |
|
|
(1) |
|
|
(435,850) |
|
|
— |
|
|
— |
|
|
— |
|
|
(435,851) |
|
|
269,924 |
|
|
(165,927) |
|
|
— |
|
|
(165,927) |
|
Share-based compensation expense |
|
— |
|
|
— |
|
— |
|
|
— |
|
|
3,385 |
|
|
— |
|
|
— |
|
|
— |
|
|
3,385 |
|
|
— |
|
|
3,385 |
|
|
— |
|
|
3,385 |
|
Conversion of Class C & D shares to Class A |
|
(100) |
|
|
— |
|
(497) |
|
|
— |
|
|
— |
|
|
— |
|
|
— |
|
|
— |
|
|
— |
|
|
— |
|
|
— |
|
|
— |
|
|
— |
|
Revaluation of defined benefit pension plan |
|
— |
|
|
— |
|
— |
|
|
— |
|
|
— |
|
|
— |
|
|
— |
|
|
(77) |
|
|
(77) |
|
|
(60) |
|
|
(137) |
|
|
(192) |
|
|
(329) |
|
Blueapple redeemable non-controlling interest fair value adjustment subsequent to the Reorganization Transactions |
|
— |
|
|
— |
|
— |
|
|
— |
|
|
— |
|
|
(215,354) |
|
|
— |
|
|
— |
|
|
(215,354) |
|
|
(159,262) |
|
|
(374,616) |
|
|
374,616 |
|
|
— |
|
Balance, December 31, 2018 |
|
2,461 |
|
$ |
— |
|
16,786 |
|
$ |
1 |
|
$ |
178,176 |
|
$ |
(223,799) |
|
$ |
— |
|
$ |
(2,993) |
|
$ |
(48,608) |
|
$ |
(814,074) |
|
$ |
(862,682) |
|
$ |
1,010,093 |
|
$ |
147,411 |
See accompanying notes to consolidated financial statements
73
|
|
|
|
|
|
|
|
|
|
|
|
|
|
|
|
|
|
|
|
|
|
|
|
|
|
Accumulated |
|
|
|
|
Total |
|
|
|
|
|
|
|
|
|
|
|
|
||
|
|
|
|
|
|
|
|
|
|
|
|
|
|
|
|
|
|
|
|
|
|
|
|
|
deficit |
|
Accumulated |
|
EVO |
|
|
|
|
|
|
|
|
|
|
|
|
||||
|
|
|
|
|
|
|
|
|
|
|
|
|
|
|
|
|
|
|
|
|
|
|
Additional |
|
attributable to |
|
other |
|
Payments, |
|
Nonredeemable |
|
|
|
|
Redeemable |
|
|
|
||||||
|
|
|
Class A common stock |
|
Class B common stock |
|
Class C common stock |
|
Class D common stock |
|
paid-in |
|
Class A |
|
comprehensive |
|
Inc. (deficit) |
|
non-controlling |
|
Total |
|
non-controlling |
|
|
||||||||||||||||||||
|
|
|
Shares |
|
Amounts |
|
Shares |
|
Amounts |
|
Shares |
|
Amounts |
|
Shares |
|
Amounts |
|
capital |
|
common stock |
|
loss |
|
/equity |
|
interests |
|
deficit |
|
interests |
|
Total |
||||||||||||
|
Balance, January 1, 2019 |
|
26,025 |
|
$ |
3 |
|
35,914 |
|
$ |
4 |
|
2,461 |
|
$ |
— |
|
16,786 |
|
$ |
1 |
|
$ |
178,176 |
|
$ |
(223,799) |
|
$ |
(2,993) |
|
$ |
(48,608) |
|
$ |
(814,074) |
|
$ |
(862,682) |
|
$ |
1,010,093 |
|
$ |
147,411 |
|
|
|
|
|
|
|
|
|
|
|
|
|
|
|
|
|
|
|
|
|
|
|
|
|
|
|
|
|
|
|
|
|
|
|
|
|
|
|
|
|
|
|
|
|
|
|
Prior period adjustment(1) |
|
— |
|
|
— |
|
— |
|
|
— |
|
— |
|
|
— |
|
— |
|
|
— |
|
|
(20,629) |
|
|
— |
|
|
— |
|
|
(20,629) |
|
|
20,629 |
|
|
— |
|
|
— |
|
|
— |
|
Net loss |
|
— |
|
|
— |
|
— |
|
|
— |
|
— |
|
|
— |
|
— |
|
|
— |
|
|
— |
|
|
(10,105) |
|
|
— |
|
|
(10,105) |
|
|
(6,549) |
|
|
(16,654) |
|
|
(6,712) |
|
|
(23,366) |
|
Cumulative translation adjustment |
|
— |
|
|
— |
|
— |
|
|
— |
|
— |
|
|
— |
|
— |
|
|
— |
|
|
— |
|
|
— |
|
|
1,045 |
|
|
1,045 |
|
|
(378) |
|
|
667 |
|
|
(229) |
|
|
438 |
|
Distributions |
|
— |
|
|
— |
|
— |
|
|
— |
|
— |
|
|
— |
|
— |
|
|
— |
|
|
— |
|
|
— |
|
|
— |
|
|
— |
|
|
(297) |
|
|
(297) |
|
|
(9,475) |
|
|
(9,772) |
|
Sale of Class A common stock in secondary offerings(2) |
|
14,250 |
|
|
1 |
|
(1,750) |
|
|
(1) |
|
— |
|
|
— |
|
(11,750) |
|
|
(1) |
|
|
(470,830) |
|
|
— |
|
|
— |
|
|
(470,831) |
|
|
538,262 |
|
|
67,431 |
|
|
(48,447) |
|
|
18,984 |
|
Fair value adjustment in connection with purchase of Blueapple Class B shares |
|
— |
|
|
— |
|
— |
|
|
— |
|
— |
|
|
— |
|
— |
|
|
— |
|
|
— |
|
|
2,020 |
|
|
— |
|
|
2,020 |
|
|
823 |
|
|
2,843 |
|
|
(2,843) |
|
|
— |
|
Share-based compensation expense |
|
— |
|
|
— |
|
— |
|
|
— |
|
— |
|
|
— |
|
— |
|
|
— |
|
|
10,921 |
|
|
— |
|
|
— |
|
|
10,921 |
|
|
— |
|
|
10,921 |
|
|
— |
|
|
10,921 |
|
Vesting of equity awards |
|
78 |
|
|
— |
|
— |
|
|
— |
|
— |
|
|
— |
|
— |
|
|
— |
|
|
(1,819) |
|
|
— |
|
|
— |
|
|
(1,819) |
|
|
— |
|
|
(1,819) |
|
|
— |
|
|
(1,819) |
|
Exercise of stock options |
|
61 |
|
|
— |
|
— |
|
|
— |
|
— |
|
|
— |
|
— |
|
|
— |
|
|
1,010 |
|
|
— |
|
|
— |
|
|
1,010 |
|
|
— |
|
|
1,010 |
|
|
— |
|
|
1,010 |
|
Exchange of Class C and Class D common stock for Class A common stock |
|
820 |
|
|
— |
|
— |
|
|
— |
|
(139) |
|
|
— |
|
(681) |
|
|
— |
|
|
(37,533) |
|
|
— |
|
|
— |
|
|
(37,533) |
|
|
37,533 |
|
|
— |
|
|
— |
|
|
— |
|
Deferred taxes in connection with share exchanges and secondary offerings(2) |
|
— |
|
|
— |
|
— |
|
|
— |
|
— |
|
|
— |
|
— |
|
|
— |
|
|
8,001 |
|
|
— |
|
|
— |
|
|
8,001 |
|
|
— |
|
|
8,001 |
|
|
— |
|
|
8,001 |
|
Tax receivable agreement in connection with share exchanges and secondary offerings(2) |
|
— |
|
|
— |
|
— |
|
|
— |
|
— |
|
|
— |
|
— |
|
|
— |
|
|
17,993 |
|
|
— |
|
|
— |
|
|
17,993 |
|
|
— |
|
|
17,993 |
|
|
— |
|
|
17,993 |
|
eService redeemable non-controlling interest fair value adjustment |
|
— |
|
|
— |
|
— |
|
|
— |
|
— |
|
|
— |
|
— |
|
|
— |
|
|
— |
|
|
(12,561) |
|
|
— |
|
|
(12,561) |
|
|
(3,655) |
|
|
(16,216) |
|
|
16,216 |
|
|
— |
|
Blueapple redeemable non-controlling interest fair value adjustment |
|
— |
|
|
— |
|
— |
|
|
— |
|
— |
|
|
— |
|
— |
|
|
— |
|
|
— |
|
|
(28,203) |
|
|
— |
|
|
(28,203) |
|
|
(65,642) |
|
|
(93,845) |
|
|
93,845 |
|
|
— |
|
Reclassification of additional paid-in capital to accumulated deficit |
|
— |
|
|
— |
|
— |
|
|
— |
|
— |
|
|
— |
|
— |
|
|
— |
|
|
314,710 |
|
|
(314,710) |
|
|
— |
|
|
— |
|
|
— |
|
|
— |
|
|
— |
|
|
— |
|
Balance, December 31, 2019 |
|
41,234 |
|
$ |
4 |
|
34,164 |
|
$ |
3 |
|
2,322 |
|
$ |
— |
|
4,355 |
|
$ |
— |
|
$ |
— |
|
$ |
(587,358) |
|
$ |
(1,948) |
|
$ |
(589,299) |
|
$ |
(293,348) |
|
$ |
(882,647) |
|
$ |
1,052,448 |
|
$ |
169,801 |
|
(1) |
Refer to Note 1, “Description of Business and Summary of Significant Accounting Policies”, for discussion on presentation. |
|
(2) |
Secondary offerings refers to the sale of Class A common stock and the purchase of an equivalent number of LLC Interests and shares of Class D and Class B common stock in connection with the April 2019 Secondary Offering, the August 2019 Secondary Offering, and the December 2019 Secondary Offering. |
See accompanying notes to consolidated financial statements.
74
EVO PAYMENTS, INC. AND SUBSIDIARIES
Consolidated Statements of Cash Flows
(In thousands)
|
|
|
Year Ended December 31, |
|||||||
|
|
|
2019 |
|
2018 |
|
2017 |
|||
|
Cash flows from operating activities: |
|
|
|
|
|
|
|
|
|
|
Net loss |
|
$ |
(23,366) |
|
$ |
(98,850) |
|
$ |
(32,348) |
|
Adjustments to reconcile net loss to net cash provided by operating activities: |
|
|
|
|
|
|
|
|
|
|
Depreciation and amortization |
|
|
92,059 |
|
|
87,184 |
|
|
74,136 |
|
(Gain) loss on sale of investment |
|
|
(250) |
|
|
— |
|
|
1,308 |
|
Amortization of deferred financing costs |
|
|
2,680 |
|
|
8,528 |
|
|
3,197 |
|
Change in fair value of contingent consideration |
|
|
2,384 |
|
|
(375) |
|
|
— |
|
Loss on extinguishment of debt |
|
|
— |
|
|
2,055 |
|
|
— |
|
Loss on disposal of equipment and improvements |
|
|
3,014 |
|
|
1,311 |
|
|
384 |
|
Share-based compensation expense |
|
|
10,921 |
|
|
55,519 |
|
|
— |
|
Impairment of intangible assets |
|
|
13,101 |
|
|
14,627 |
|
|
— |
|
Accrued interest expense |
|
|
3,492 |
|
|
(340) |
|
|
1,893 |
|
Gain on acquisition of unconsolidated investee |
|
|
— |
|
|
(8,404) |
|
|
— |
|
Deferred taxes, net |
|
|
(9,182) |
|
|
(1,778) |
|
|
11,514 |
|
Other |
|
|
(681) |
|
|
(595) |
|
|
(17) |
|
Changes in operating assets and liabilities, net of effect of acquisitions: |
|
|
|
|
|
|
|
|
|
|
Accounts receivable, net |
|
|
(1,719) |
|
|
3,141 |
|
|
(10,243) |
|
Other receivables |
|
|
27,474 |
|
|
(1,563) |
|
|
5,898 |
|
Inventory |
|
|
(276) |
|
|
2,049 |
|
|
(1,378) |
|
Other current assets |
|
|
(592) |
|
|
(4,018) |
|
|
(9,407) |
|
Operating lease right-of-use assets |
|
|
7,335 |
|
|
— |
|
|
— |
|
Other assets |
|
|
(1,233) |
|
|
2,948 |
|
|
7,093 |
|
Related parties, net |
|
|
3,797 |
|
|
(498) |
|
|
(5,155) |
|
Accounts payable |
|
|
(35,962) |
|
|
(12,426) |
|
|
2,330 |
|
Accrued expenses |
|
|
641 |
|
|
15,509 |
|
|
6,907 |
|
Settlement processing funds, net |
|
|
(59,077) |
|
|
137,898 |
|
|
(48,080) |
|
Operating lease liabilities |
|
|
(6,745) |
|
|
— |
|
|
— |
|
Other |
|
|
74 |
|
|
76 |
|
|
178 |
|
Net cash provided by operating activities |
|
|
27,889 |
|
|
201,998 |
|
|
8,210 |
|
Cash flows from investing activities: |
|
|
|
|
|
|
|
|
|
|
Restricted cash |
|
|
— |
|
|
— |
|
|
125,000 |
|
Acquisition of businesses, net of cash acquired |
|
|
(38,832) |
|
|
(56,193) |
|
|
(124,964) |
|
Purchase of equipment and improvements |
|
|
(36,808) |
|
|
(48,751) |
|
|
(42,021) |
|
Acquisition of intangible assets |
|
|
(8,013) |
|
|
(20,704) |
|
|
(17,310) |
|
Net proceeds from sale of investments |
|
|
250 |
|
|
— |
|
|
205 |
|
Issuance of notes receivable |
|
|
— |
|
|
(37) |
|
|
— |
|
Collections of notes receivable |
|
|
1,878 |
|
|
120 |
|
|
974 |
|
Collection of deferred cash consideration |
|
|
4,882 |
|
|
— |
|
|
— |
|
Net cash used in investing activities |
|
|
(76,643) |
|
|
(125,565) |
|
|
(58,116) |
|
Cash flows from financing activities: |
|
|
|
|
|
|
|
|
|
|
Proceeds from long-term debt |
|
|
583,505 |
|
|
774,359 |
|
|
854,135 |
|
Repayments of long-term debt |
|
|
(580,795) |
|
|
(853,487) |
|
|
(868,990) |
|
Deferred financing costs paid |
|
|
(2) |
|
|
(3,903) |
|
|
(1,232) |
|
Contingent consideration paid |
|
|
(6,276) |
|
|
(2,505) |
|
|
(282) |
|
Deferred cash consideration paid |
|
|
(915) |
|
|
(65,000) |
|
|
(5,000) |
|
Consideration paid for additional shares in a consolidated subsidiary |
|
|
— |
|
|
— |
|
|
(3,962) |
|
Acquisition of additional non-controlling interest |
|
|
— |
|
|
(16,916) |
|
|
— |
|
IPO proceeds, net of underwriter fees |
|
|
— |
|
|
231,500 |
|
|
— |
|
Proceeds from the secondary offerings(1) |
|
|
381,619 |
|
|
190,894 |
|
|
— |
|
Purchase of LLC Interests, Class B common stock, and Class D common stock in connection with the secondary offerings(1) |
|
|
(362,635) |
|
|
(165,927) |
|
|
— |
|
Repurchases of shares to satisfy minimum tax withholding |
|
|
(1,819) |
|
|
(795) |
|
|
— |
|
Proceeds from exercise of common stock options |
|
|
1,010 |
|
|
— |
|
|
— |
|
Distribution to non-controlling interests holders |
|
|
(9,772) |
|
|
(7,577) |
|
|
(5,722) |
|
Contributions by members |
|
|
— |
|
|
— |
|
|
71,250 |
|
Distribution to members |
|
|
— |
|
|
— |
|
|
(1,726) |
|
Net cash provided by financing activities |
|
|
3,920 |
|
|
80,643 |
|
|
38,471 |
|
Effect of exchange rate changes on cash and cash equivalents |
|
|
(1,774) |
|
|
(11,521) |
|
|
13,253 |
|
Net (decrease) increase in cash and cash equivalents |
|
|
(46,608) |
|
|
145,555 |
|
|
1,818 |
|
Cash and cash equivalents, beginning of year |
|
|
350,697 |
|
|
205,142 |
|
|
203,324 |
|
Cash and cash equivalents, end of year |
|
$ |
304,089 |
|
$ |
350,697 |
|
$ |
205,142 |
|
(1) |
For the year ended December 31, 2019, Proceeds from the secondary offerings and Purchase of LLC Interests, Class B common stock, and Class D common stock in connection with the secondary offerings refer to the sale of Class A common stock and the purchase of an equivalent number of LLC Interests and shares of Class D and Class B common stock in connection with the April 2019 Secondary Offering, the August 2019 Secondary Offering, and the December 2019 Secondary Offering. In order to conform to the current year presentation, for the year ended December 31, 2018, Proceeds from the secondary offerings and Purchase of LLC Interests, Class B common stock, and Class D common stock in connection with the secondary offerings, which refer to the sale of Class A common stock and the purchase of an equivalent number of LLC Interests and shares of Class D common stock in connection with the September 2018 Secondary Offering, are presented on a gross basis, as compared to the net presentation in Form 10-K for the year ended December 31, 2018. |
See accompanying notes to consolidated financial statements.
75
(1)Description of Business and Summary of Significant Accounting Policies
(a)Description of Business
EVO Payments, Inc. (“EVO, Inc.” or the “Company”) is a Delaware corporation whose primary asset is its ownership of approximately 50.2% of the membership interests of EVO Investco, LLC (“EVO, LLC”) as of December 31, 2019. EVO, Inc. was incorporated on April 20, 2017 for the purpose of completing a series of reorganization transactions (the “Reorganization Transactions”), in order to consummate the initial public offering of EVO, Inc.’s Class A common stock (“IPO”), and to carry on the business of EVO, LLC. EVO, Inc. is the sole managing member of EVO, LLC and operates and controls all of the businesses and affairs conducted by EVO, LLC and its subsidiaries (the “Group”).
The Company is a leading payment technology and services provider, offering an array of innovative, reliable and secure payment solutions to merchants across the Americas and Europe and servicing over 550,000 merchants across more than 50 markets. The Company supports all major card types in the markets it serves.
The Company provides card-based payment processing services to small and middle market merchants, multinational corporations, government agencies, and other business and nonprofit enterprises located throughout the Americas and Europe. These services enable merchants to accept credit and debit cards and other electronic payment methods as payment for their products and services by providing terminal devices, card authorization, data capture, funds settlement, risk management, fraud detection, and chargeback services. The Company operates two reportable segments: the Americas and Europe.
(b)Basis of Presentation and Use of Estimates
The preparation of the consolidated financial statements in conformity with generally accepted accounting principles in the United States (“U.S. GAAP”) requires management to make certain estimates and assumptions that affect the reported assets and liabilities, as of the date of the consolidated financial statements, and the reported amounts of revenue and expenses during the period. Actual results could differ from those estimates. Estimates used for accounting purposes include, but are not limited to, valuation of redeemable non-controlling interests (“RNCI”), evaluation of realizability of deferred tax assets, determination of liabilities under the tax receivable agreement, determination of liabilities and corresponding right-of-use assets arising from lease agreements, determination of fair value of share-based compensation, and assessment of recoverability of long-lived assets.
Presentation of Consolidated Balance Sheet and Consolidated Statement of Changes in Equity at December 31, 2018:
The previously presented nonredeemable non-controlling interests, which relate to the portion of equity in a consolidated subsidiary not attributable, directly or indirectly, to the Company as of December 31, 2018, were retrospectively adjusted to reflect the exchange of certain Class C and D shares to Class A shares. The Company has deemed the correction to be immaterial as there is no impact to the Company’s results of operations, cash flows from operating, investing, or financing activities, or consolidated shareholders’ deficit. This immaterial adjustment decreased the previously reported amounts of $178.2 million and ($814.1) million of additional paid-in capital and nonredeemable non-controlling interests, as reported in the consolidated balance sheet and consolidated statement of changes in equity as of December 31, 2018, to $157.5 million and ($793.4) million, respectively.
76
(c)Principles of Consolidation
The accompanying consolidated financial statements include the accounts of the Company. As a sole managing member of EVO, LLC, the Company exerts control over the Group. In accordance with Accounting Standards Codification (“ASC”) 810, Consolidation, EVO, Inc. consolidates the Group’s financial statements and records the interests in EVO, LLC that it does not own as non-controlling interests. All intercompany accounts and transactions have been eliminated in consolidation. The Company accounts for investments over which it has significant influence, but not a controlling financial interest using the equity method of accounting.
(d)Cash and Cash Equivalents and Merchant Reserves
Cash and cash equivalents include all cash balances and highly liquid securities with original maturities of three months or less. Cash balances often exceed federally insured limits; however, concentration of credit risk is limited due to the payment of funds on the day following receipt in satisfaction of the settlement process. Included in cash and cash equivalents are merchant reserve cash balances, which represent funds collected from the Company’s merchants that serve as collateral to minimize contingent liabilities associated with any losses that may occur under the respective merchant agreements (“Merchant Reserves”). While this cash is not restricted in its use, the Company believes that maintaining the Merchant Reserves to collateralize merchant losses strengthens its fiduciary standings with its card network sponsors (“Member Banks”) and is in accordance with the guidelines set by the card networks. As of December 31, 2019 and 2018, Merchant Reserves were $85.8 million and $107.8 million, respectively.
(e)Accounts Receivable and Other Receivables
Accounts receivable include amounts due from independent sales organizations (“ISO”) and merchants related to the transaction processing services and sale of point-of-sale (“POS”) equipment and peripherals and amounts of foreign value-added taxes to be recovered through regular business operations. Other receivables include advances to merchants and other amounts due to the Company.
Included in other receivables as of December 31, 2018, is an amount of value-added taxes of $32.0 million, due from the Mexican tax authority as part of the business acquisition in Mexico with a corresponding liability that is included in accounts payable as of December 31, 2018, representing the amount to be paid to the seller. This amount was collected from tax authority and remitted to the seller during the year ended December 31, 2019.
Receivable balances are stated net of allowance for doubtful accounts. The Company periodically evaluates its receivables for collectability. The Company analyzes historical losses, the financial position of its customers and known or expected trends when estimating the allowance for doubtful accounts. As of December 31, 2019 and 2018, allowance for doubtful accounts was $3.7 million and $0.4 million, respectively.
(f)Inventory
Inventory consists primarily of electronic POS terminals and prepaid mobile phone cards and is stated at the lower of cost or net realizable value. Cost is determined based on the first-in, first-out (“FIFO”) method.
77
(g)Earnings Per Share
Basic earnings per Class A common stock are computed by dividing the net loss attributable to EVO, Inc. by the weighted-average number of Class A common stock outstanding for the year ended December 31, 2019, and for the period from May 23, 2018 to December 31, 2018. Diluted earnings per Class A common stock is calculated by dividing the net income (loss) attributable to EVO, Inc., when applicable, by the diluted weighted-average Class A common stock outstanding for the year ended December 31, 2019, and for the period from May 23, 2018 to December 31, 2018. Diluted weighted-average Class A common stock includes unvested stock options, restricted stock units (“RSUs”), restricted stock awards (“RSAs”), and common membership interests of EVO, LLC (“LLC Interests”) corresponding to each Class C common share and Class D common share that are exchangeable for shares of Class A common stock for the period after the closing of the IPO, excluding anti-dilutive securities. Class B common stock is not considered when calculating dilutive EPS as this class of common stock may not convert to Class A common stock. The dilutive effect of outstanding share-based compensation awards, if any, is reflected in diluted earnings per Class A common stock by application of the treasury stock method or if-converted method, as applicable. Refer to Note 4, “Earnings Per Share”, for further information.
(h)Settlement Processing Assets and Obligations
Settlement processing assets and obligations represent intermediary balances arising in our settlement process. Refer to Note 3, “Settlement Processing Assets and Obligations”, for further information.
(i)Equipment and Improvements
Equipment and improvements are stated at cost less accumulated depreciation. Card processing, office equipment, computer software, and furniture and fixtures are depreciated over their respective estimated useful lives on a straight-line basis. Leasehold improvements are depreciated over the lesser of the estimated useful life of the asset or the lease term. Maintenance and repairs, which do not extend the useful life of the respective assets, are recognized as expense when incurred. Refer to Note 8, “Equipment and Improvements”, for further information.
(j)Deferred Financing Costs
The costs associated with obtaining debt financing are capitalized and amortized over the term of the related debt. Such costs are presented as a reduction of the long-term debt.
(k)Goodwill and Intangible Assets
The Company regularly evaluates whether events and circumstances have occurred that indicate the carrying amounts of goodwill and other intangible assets may not be recoverable. Goodwill represents the excess of the consideration transferred over the fair value of identifiable net assets acquired through business combinations. The Company evaluates its goodwill for impairment annually as of October 1, or more frequently, if an event occurs or circumstances change that indicate the fair value of a reporting unit is below its carrying amount. Our reporting units are consistent with our segments: the Americas and Europe.
As of October 1, 2019 and 2018, the Company performed a qualitative assessment as prescribed by ASC 350, Intangibles - Goodwill and Other, to evaluate the Company's goodwill for indicators of impairment. A qualitative assessment includes consideration of macroeconomic conditions, industry and market considerations, changes in certain costs, overall financial performance of each reporting unit, and other relevant entity-specific events. In performing its qualitative assessment, the Company considered the results of the quantitative impairment test performed in 2017 and the financial performance of the reporting units during 2019 and 2018. Based upon such assessment, the Company determined that it was more likely than not that the fair values of these reporting units exceeded their carrying amounts as of October 1, 2019 and 2018. There were no significant events or changes in the circumstances since the timing of the Company’s
78
annual impairment tests that would have required us to reassess the results of the annual tests as of December 31, 2019 and 2018.
As of October 1, 2017, the Company utilized the two-step quantitative approach to test goodwill for impairment. As a result of the annual impairment testing for 2017, we did not recognize any impairment. As of the date of the 2017 impairment test, the fair values of the Americas and Europe reporting units exceeded their carrying values by approximately $500 million and $300 million, respectively.
Finite-lived assets include merchant contract portfolios and customer relationships, marketing alliance agreements, trademarks, internally developed and acquired software, and non-competition agreements, and are stated net of accumulated amortization or impairment charges and foreign currency translation adjustments.
Merchant contract portfolios and customer relationships consist of merchant or customer contracts acquired from third parties that will generate revenue for the Company. The useful lives of these assets are determined using forecasted cash flows, which are based on, among other factors, the estimates of revenue, expenses, and attrition associated with the underlying portfolio of merchant or customer accounts. The useful lives are determined based upon the period of time over which a significant portion of the economic value of such assets is expected to be realized. The useful life of merchant contract portfolios and customer relationships ranges from 5 to 19 years. Amortization of these assets is recognized under an accelerated method, which approximates the expected distribution of the portfolios’ forecasted cash flows.
Marketing alliance agreements are amortized on a straight-line basis over the term of the agreements, which ranges from 5 to 21 years.
Trademarks are amortized on a straight-line basis over the period of time during which a significant portion of the economic value of such assets is expected to be realized, which ranges from 2 to 20 years.
Internally developed and acquired software is amortized on a straight-line basis over the estimated useful lives, which range from 3 to 10 years. The estimated useful lives of the software are based on various factors, including obsolescence, technology, competition, and other economic factors. The costs related to the internally developed software are capitalized during the developmental phase of a project, and amortization commences when the software is placed into use by the Company. The costs incurred during the preliminary project stage are expensed as incurred.
Non-competition agreements are amortized on a straight-line basis over the term of the agreement, which ranges from 2 to 4 years.
When factors indicate that a long-lived asset should be assessed for impairment, the Company evaluates whether the carrying value of the asset will be recovered through the future undiscounted cash flows from the ongoing use of the asset, and if applicable, its eventual disposition. When the carrying value exceeds its fair value, an impairment loss is recognized in an amount equal to the difference.
For the year ended December 31, 2019, the Company recognized an impairment charge of $13.1 million, primarily related to the termination of the marketing alliance agreement with Raiffeisen Bank Polska and the retirement of certain trademarks driven by an internal reorganization in the United States and the Santander branch consolidation in Spain. For the year ended December 31, 2018, the Company recognized an impairment charge of $14.6 million as a result of the retirement of the indefinite-lived trademarks, primarily related to the accelerated integration of the Sterling tradename into the EVO, Inc. portfolio. For the year ended December 31, 2017, there was no long-lived asset impairment.
(l)Revenue Recognition
The Company adopted Accounting Standards Update (“ASU”) 2014-09, Revenue From Contracts With Customers (“ASC 606”) on January 1, 2019, using the modified retrospective method and applying the standard to all contracts not completed on the date of adoption. Results for the reporting period beginning
79
January 1, 2019 are presented under ASC 606, while prior period amounts continue to be reported in accordance with the Company's historic accounting practices under previous guidance.
The Company primarily earns revenue from payment processing services. The payment processing services involve routing and clearing transactions through the applicable payment network. The Company obtains authorization for each transaction and requests funds settlement from the card issuing financial institution through the payment network. In addition, the Company also earns revenue from the sale and rental of electronic POS equipment.
The Company’s revenue consists primarily of transaction-based fees that are made up of a significant volume of low-dollar transactions, sourced from multiple systems, platforms, and applications. The payment processing is highly automated, and is based on contractual terms with merchants. Because of the nature of payment processing services, the Company relies on automated systems to process and record the revenue transactions. Netting against the revenue is commissions for referral partners and third party processing and assessment costs.
The Company’s core performance obligation is to provide continuous access to the Company’s processing services in order to be able to process as many transactions as its customers require on a daily basis over the contract term, as the timing and quantity of transactions to be processed is not determinable. Under a stand-ready obligation, the Company’s performance is defined by each time increment rather than by the underlying activities satisfied over time based on days elapsed. Because the service of standing ready is substantially the same each day, and has the same pattern of transfer to the customer, the Company has determined that its stand-ready performance obligation comprises a series of distinct days of service.
The Company’s contractual agreements outline the pricing related to payment processing services and pricing related to the sale or rental of POS equipment. Given the nature of the promise to stand ready to provide payment processing services and the fees which are based on unknown quantities of services to be performed over the contract term, the consideration related to the payment processing services is determined to be variable consideration. The variable consideration is usage-based and the variability is satisfied each day the services are provided to the customer. The Company allocates variable fees to the distinct day of service to which it relates, considering the services performed each day in order to allocate the appropriate amount of total fees to that day. Therefore, the Company recognizes revenue for payment processing services over time on a daily basis based on the services performed on that day. Revenue from the sale of POS equipment is recognized at a point in time when the POS equipment is shipped and title passes to the customer. Revenue from the rental of electronic POS equipment is recognized over time.
ASC 606 requires disclosure of the aggregate amount of the transaction price allocated to unsatisfied performance obligations; however, as permitted by the standard, the Company has elected to exclude from this disclosure any contracts with an original duration of one year or less and any variable consideration that meets specified criteria. As discussed above, the Company’s core performance obligation is a stand-ready obligation comprised of a series of distinct days of service, and revenue related to this performance obligation is generally billed and recognized as the services are performed. The variable consideration allocated to this performance obligation meets the specified criteria for disclosure exclusion. The aggregate fixed consideration portion of customer contracts with an initial contract duration greater than one year is not material.
The Company follows the requirements of ASC 606-10, Principal Agent Considerations, which states that the determination of whether a company should recognize revenue based on the gross amount billed to a customer or the net amount retained is a matter of judgment that depends on the facts and circumstances of the arrangement.
For payment processing services, the determination of gross versus net recognition for interchange, card network fees, commissions, and other fees depends on whether the Company controls the good or service before it is transferred to the merchant or whether the Company is acting as an agent of a third party.
80
The Company frequently enters into agreements with third parties under which the third party engages the Company to provide payment processing services to all of their customers. Under these agreements the third party acts as supplier of products or services by achieving most of the shared risks and rewards of customer contracts; the Company passes the third party’s share of merchant receipts to them as commissions. The Company incurs interchange and card network pass-through charges from the card issuers and payment networks respectively, and does not have the ability to direct the use of or receive the benefits from the services provided by the card issuers or the payment networks. The Company has no discretion over which card issuing bank will be used to process a transaction and is unable to direct the activity of the merchant to another card issuing bank. Interchange and card network rates are pre-established by the card networks, and the Company has no latitude in determining these fees. Therefore, the Company is acting as an agent with respect to these services. Revenue generated from payment processing is presented net of interchange, card network fees, and commissions.
Commissions payable to referral and reseller partners are recognized as incurred. The Company does not capitalize costs to obtain contracts with customers or costs incurred to fulfill contracts with customers as such amounts are not material.
(m)Share-Based Compensation
The Company accounts for share-based compensation in accordance with ASC 718, Compensation: Stock Compensation. ASC 718 requires a share-based compensation to be measured based on the fair value of the awards issued. The Company granted equity awards prior to the IPO (“pre-IPO awards”). These pre-IPO awards contained a performance condition contingent on a liquidity event, as well as other metrics. These pre-IPO awards were modified on the IPO date by the compensation committee of the board of directors, and the fair value of the modified awards was determined based on the IPO price per share of the Class A common stock. The majority of these awards were fully time-vested, and the Company recorded share-based compensation expense to fully recognize the value of these awards on the IPO date. With respect to equity awards issued as compensation in connection with the Reorganization Transactions and the IPO pursuant to the 2018 Omnibus Equity Incentive Plan (the “2018 Plan”), the fair value of the stock option awards is determined through the application of the Black-Scholes model. The fair values of RSUs and RSAs were determined based on the IPO per share price or the market price at the time of grant. The share-based compensation is recognized as expense based on the vesting conditions of the awards. The Company has elected to recognize forfeitures at the time they occur. Refer to Note 21, “Stock Compensation Plans and Share-Based Compensation Awards”, for further information on the share-based compensation awards.
(n)Income Taxes
Subsequent to consummation of the Reorganization Transactions and the IPO, the Company is subject to United States federal, state and local income taxes. The Company's subsidiaries are subject to income taxes in the respective jurisdictions in which they operate. Prior to the consummation of the Reorganization Transactions and the IPO, provision for United States federal, state, and local income tax was not material, as EVO, LLC is a limited liability company and is treated as a pass-through entity for United States federal, state, and local income tax purposes.
EVO, LLC’s domestic or foreign subsidiary’s income tax filings are periodically audited by the local tax authorities. EVO, LLC’s open tax years by major taxing jurisdictions are as follows:
|
Jurisdiction |
|
|
|
Years |
|
United States |
|
|
|
2017-2019 |
|
Mexico |
|
|
|
2015-2019 |
|
Poland |
|
|
|
2014-2019 |
81
Deferred Taxes
The Company accounts for income taxes under the asset and liability method, which requires the recognition of deferred tax assets and liabilities for the expected future tax consequences of events that have been included in the consolidated financial statements. Under this method, deferred tax assets and liabilities are determined on the basis of the differences between the consolidated financial statements and tax basis of assets and liabilities using enacted jurisdictional tax rates in effect for the year in which the differences are expected to reverse. The effect of a change in tax rates is recognized in the consolidated statements of operations and comprehensive (loss) income in the period that includes the enactment date.
The Company recognizes deferred tax assets to the extent that it is expected that these assets are more likely than not to be realized. The Company evaluates the realizability of the deferred tax assets, and to the extent that the Company estimates that it is more likely than not that a benefit will not be realized, the carrying amount of the deferred tax assets is reduced with a valuation allowance. As a part of this evaluation, the Company assesses all available positive and negative evidence, including future reversals of existing taxable temporary differences, projected future taxable income, tax-planning strategies, and results of recent operations, to determine whether sufficient future taxable income will be generated to realize existing deferred tax assets.
The Company has identified objective and verifiable negative evidence in the form of cumulative losses on an unadjusted basis in certain jurisdictions over the preceding twelve quarters ended December 31, 2019. The Company also evaluated its historical core earnings by jurisdiction, after adjusting for certain nonrecurring items. On the basis of this assessment, and after considering future reversals of existing taxable temporary differences, the Company established valuation allowances in the current and prior periods to reduce the carrying amount of deferred tax assets to an amount that is more likely than not to be realized in certain European jurisdictions. In the United States jurisdiction, however, with exception of the valuation allowance for the United States interest expense limitation, the Company concluded that its deferred tax assets will be realizable and recorded no valuation allowance based upon the projected future profitability of its core operations.
As of December 31, 2019 and 2018, a valuation allowance of $8.2 million and $21.4 million, respectively, has been established to reduce the carrying amount of the deferred tax asset to an amount that is more than likely than not to be realized. The amount of the deferred tax asset considered realizable, however, could be adjusted if estimates of future taxable income during the carryforward period are reduced or increased, or if objective negative evidence in the form of cumulative losses is no longer present, and additional weight may be given to subjective evidence such as the Company’s projections for growth.
Uncertain Tax Positions
The Company records uncertain tax positions in accordance with ASC 740, Income Taxes, on the basis of a two-step process: (1) determine whether it is more likely than not that the tax positions will be sustained on the basis of the technical merits of the position, and (2) for those tax positions that meet the more-likely-than-not recognition threshold, recognize the largest amount of tax benefit that is more than 50 percent likely to be realized upon ultimate settlement with the related tax authority.
The Company is subject to tax audits in various jurisdictions and regularly assesses the likely outcome of such audits in order to determine the need for liabilities for uncertain tax benefits. The Company continually evaluates the appropriateness of liabilities for uncertain tax positions, considering factors such as statutes of limitations, audits, proposed settlements, and changes in tax law. The Company recognizes interest and penalties related to unrecognized tax benefits within the income tax expense line in the accompanying consolidated statements of operations and comprehensive (loss) income. Accrued interest and penalties are included within the deferred tax liability line in the consolidated balance sheets.
82
As of December 31, 2019 and 2018, based on the Company’s evaluation of the tax positions, including its filed tax returns, there were no uncertain tax positions that required recognition or disclosure in the consolidated financial statements.
(o)Nonredeemable Non-controlling Interests and Redeemable Non-controlling Interests
Non-controlling interests relate to the portion of equity in a consolidated subsidiary not attributable, directly or indirectly, to the Company. Where redemption of such non-controlling interests is solely within the control of the Company, such interests are reflected in the consolidated balance sheets as “Nonredeemable non-controlling interests” and in the consolidated statements of operations and comprehensive (loss) income as “Net loss attributable to non-controlling interests of EVO Investco, LLC.”
RNCI refers to non-controlling interests that are redeemable upon the occurrence of an event that is not solely within the Company’s control and is reported in the mezzanine section between total liabilities and shareholders’ deficit, as temporary equity in the Company’s consolidated balance sheets. The Company adjusts RNCI balance to reflect its estimate of the maximum redemption amount each reporting period.
Refer to Note 16, “Redeemable Non-controlling Interests”, for further information.
(p)Foreign-Currency Translation
The Company has operations in foreign countries whose functional currency is the local currency. Gains and losses on transactions denominated in currencies other than the functional currency are included in the net loss for the period.
The assets and liabilities of subsidiaries whose functional currency is a foreign currency are translated at the period-end exchange rates. Income statement items are translated at the average monthly rates for the year. The resulting translation adjustment is recorded as a component of other comprehensive (loss) income and is included in shareholders’ deficit.
(q)Fair-Value Measurements
The Company follows ASC 820, Fair Value Measurements, which defines fair value as the price that would be received to sell an asset or paid to transfer a liability in an orderly transaction between market participants at the measurement date. The determination of fair value is based on the principal or most advantageous market in which the Company could participate and considers assumptions that market participants would use when pricing the asset or liability, such as inherent risk, transfer restrictions, and risk of nonperformance. Also, determination of fair value assumes that market participants will consider the highest and best use of the asset.
The Company uses the hierarchy prescribed in ASC 820 for fair value measurements, based on the available inputs to the valuation and the degree to which they are observable or not observable in the market.
The three levels of the hierarchy are as follows:
Level 1 Inputs—Unadjusted quoted prices in active markets for identical assets or liabilities accessible to the reporting entity at the measurement date;
Level 2 Inputs—Other than quoted prices included in Level 1 inputs that are observable for the asset or liability, either directly or indirectly, for substantially the full term of the asset or liability; and
Level 3 Inputs—Unobservable inputs for the asset or liability used to measure fair value allowing for inputs reflecting the Company’s assumptions about what other market participants would use in pricing the asset or liability, including assumptions about risk.
83
(r)Segment Reporting
The Company has two operating segments: the Americas and Europe. The Company’s reportable segments are the same as the operating segments. The alignment of the Company’s segments is designed to establish lines of business that support the geographical markets in which the Company operates and allows the Company to further globalize its solutions while working seamlessly with teams across these markets.
The America’s segment comprises the geographical markets of the United States, Canada, and Mexico. The Europe segment comprises the geographical markets of Western Europe (Spain, United Kingdom, Ireland, and Germany) and Eastern Europe (Poland and Czech Republic). The Company also provides general corporate services to its segments through corporate functions, the cost of which is not allocated to segments. Such costs are reported as “Corporate.” Refer to Note 19, “Segment Information”, for further information on segment reporting.
(s)Leases
The Company adopted ASU 2016-02, Leases, (“ASC 842”) on January 1, 2019, using the optional modified retrospective method under which the prior period financial statements were not restated for the new guidance.
At contract inception the Company determines whether an arrangement is, or contains a lease, and for each identified lease, evaluates the classification as operating or financing. Leased assets and obligations are recognized at the lease commencement date based on the present value of fixed lease payments to be made over the term of the lease. Renewal and termination options are factored into determination of the lease term only if the option is reasonably certain to be exercised. The Company’s leases do not provide a readily determinable implicit interest rate and the Company uses its incremental borrowing rate to measure the lease liability and corresponding right-of-use asset. The incremental borrowing rate is a fully collateralized rate that considers the Company’s credit rating, market conditions and the term of the lease. The Company accounts for all components in a lease arrangement as a single combined lease component.
Operating lease cost is recognized on a straight-line basis over the lease term. Total lease costs include variable lease costs, which are primarily comprised of the CPI adjustments and cost of insurance and maintenance. Variable payments are expensed in the period incurred and not included in the measurement of lease assets and obligations.
(t)Recent Accounting Pronouncements
New accounting pronouncements are issued by the Financial Accounting Standards Board (the “FASB”) or other standards setting bodies that are adopted by the Company are adopted as of the specified effective date. Unless otherwise discussed, management believes that the impact of recently issued standards that are not yet effective will not have a material impact on the Company’s consolidated financial statements upon adoption.
Recently Adopted Accounting Pronouncements
In May 2014, the FASB issued Accounting Standards Update (“ASU”) 2014-09, Revenue From Contracts With Customers (“ASC 606”), with amendments in 2015, 2016, and 2017. This ASU supersedes the revenue recognition requirements in ASC 605, Revenue Recognition (“ASC 605”). The new standard provides a five-step analysis of transactions to determine when and how revenue is recognized, based upon the core principle that revenue is recognized to depict the transfer of goods or services to customers in an amount that reflects the consideration to which the entity expects to be entitled in exchange for those goods or services. The new standard also requires additional disclosures regarding the nature, amount, timing, and uncertainty of revenue and cash flows arising from contracts with customers.
84
The Company adopted ASC 606 on January 1, 2019, using the modified retrospective method and applied the standard to all contracts not completed on the date of adoption. Results for the reporting period beginning January 1, 2019 are presented under ASC 606, while prior period amounts continue to be reported in accordance with the Company's historic accounting practices under previous guidance.
The primary impact to the Company’s consolidated financial statements as a result of the adoption of ASC 606 is a change in total net revenue attributable to the presentation of network processing fees on a net basis, driven by changes in principal and agent considerations, as compared to previously being presented on a gross basis. Under the modified retrospective method, the Company has not restated its comparative consolidated financial statements for these effects.
The following table presents the impact of adopting ASC 606 on the Company’s consolidated financial statements for the year ended December 31, 2019:
|
|
|
Year Ended December 31, 2019 |
||||||||||
|
|
|
As reported |
|
Adjustment |
|
Presented without |
||||||
|
|
|
(In thousands) |
||||||||||
|
Revenue |
$ |
485,778 |
$ |
112,258 |
$ |
598,036 |
||||||
|
Operating expenses: |
||||||||||||
|
Cost of services and products |
$ |
(96,365) |
$ |
(112,258) |
$ |
(208,623) |
||||||
The adoption of ASC 606 did not have a material impact on the Company’s consolidated balance sheets and statements of cash flows as of and for the year ended December 31, 2019. The Company has expanded its consolidated financial statement disclosures as required by this new standard. See Note 2, “Revenue”, for additional disclosures provided as a result of the adoption of ASC 606.
Leases
In February 2016, the FASB issued ASU 2016-02, Leases (“Topic 842”), with amendments in 2018 and 2019. This update aims to increase transparency and comparability among organizations by requiring recognition of lease assets and lease liabilities on the balance sheet and disclosure of key information about leasing arrangements.
The new standard was effective for public companies for fiscal years beginning after December 15, 2018; however, the Company elected to take advantage of the extended transition period as provided for under the JOBS Act during the period the Company qualified for emerging growth status. The Company became a large accelerated filer effective December 31, 2019, at which point the Company was required to follow the timeline for adoption of new accounting pronouncements for public companies. As a result, the Company retroactively adopted Topic 842 effective January 1, 2019, using the optional modified retrospective transition method, under which the prior period financial statements were not restated for the new guidance.
The Company elected to apply the package of practical expedients whereby the Company did not reassess whether expired or existing leases contain a lease, did not reassess the lease classification for any expired or existing leases, and did not reassess initial direct costs for any existing leases. The Company further elected to account for lease and nonlease components in a lease arrangement as a combined lease component for all classes of leased assets.
The Company also elected to utilize the practical expedient in ASU No. 2018-11 to not separate lease and nonlease components for payment processing service arrangements that include rentals of POS terminals. Since the predominant component in these arrangements is service revenue and not the POS terminal, the Company accounts for the combined components in these arrangements under ASC 606, and not ASC 842.
85
The adoption of Topic 842 resulted in the recognition of the right-of-use assets of $35.6 million and the lease liabilities of $38.2 million as of January 1, 2019 on the consolidated balance sheet. Lease liabilities were measured as the present value of remaining lease payments, utilizing the Company’s incremental borrowing rate based on the remaining lease term as of the adoption date. The right-of-use assets were measured at an amount equal to the lease liabilities adjusted by the amounts of certain assets and liabilities, such as deferred lease obligations and prepaid rent, that were previously recognized on the balance sheet prior to the initial application of Topic 842.
The adoption of Topic 842 did not have a material impact on the consolidated statements of operations and comprehensive (loss) income, consolidated statements of changes in equity, and consolidated statements of cash flows. Refer to Note 7, “Leases”, for further information.
Recently Issued Accounting Pronouncements Not Yet Adopted
Credit Losses
In June 2016, the FASB issued ASU 2016-13, Financial Instruments – Credit Losses: Measurement of Credit Losses on Financial Instruments, with amendments in 2019. This update requires the companies to immediately recognize the estimate for credit losses expected to occur over the remaining life of the financial assets that are in the scope of the standard. This ASU became effective on January 1, 2020. The Company concluded this ASU does not have a material impact on the Company’s consolidated financial statements.
Fair Value Measurement
In August 2018, the FASB issued ASU 2018-13, Fair Value Measurement: Disclosure Framework - Changes to the Disclosure Requirements for Fair Value Measurement. This update provides clarification and modifies the disclosure requirements on fair value measurement in Topic 820, Fair Value Measurement. This ASU became effective on January 1, 2020. The Company concluded this ASU does not have a material impact on the Company’s consolidated financial statements.
Internal Use Software
In August 2018, the FASB issued ASU 2018-15, Intangibles – Goodwill and Other – Internal-Use Software: Customer’s Accounting for Implementation Costs Incurred in a Cloud Computing Arrangement That Is a Service Contract. The update aligns the requirements for capitalizing certain implementation costs incurred in a cloud computing hosting arrangement that is a service contract with the requirements for capitalizing implementation costs incurred to develop or obtain internal-use software. This ASU became effective on January 1, 2020. The Company adopted this guidance prospectively and concluded this ASU does not have a material impact on the Company’s consolidated financial statements.
Simplifying the Accounting for Income Taxes
In December 2019, the FASB issued ASU 2019-12, Simplifying the Accounting for Income Taxes. This update modifies ASC 740 to simplify the accounting for income taxes as part of the FASB’s simplification initiative. This ASU is effective for fiscal years, and interim periods within those years, beginning after December 15, 2020 with early adoption permitted. The Company is currently evaluating the effect of ASU 2019-12 on its consolidated financial statements.
(2) Revenue
The Company primarily earns revenue from payment processing services, and has contractual agreements with its customers that set forth the general terms and conditions of the service relationship, including line item pricing, payment terms and contract duration.
86
The Company also earns revenue from the sale and rental of electronic POS equipment. The revenue recognized from the sale and rental of POS equipment totaled $43.0 million, $44.0 million, and $36.2 million for the years ended December 31, 2019, 2018, and 2017, respectively.
The table below presents a disaggregation of the Company’s revenue by segment and by division. The Company’s divisions are defined as follows:
|
· |
Direct – Includes long-term, exclusive referral relationships with leading financial institutions. In the aggregate, these banks represent thousands of branch locations which actively pursue new merchant relationships on the Company’s behalf. These financial institutions provide the Company with access to their brands, significantly enhancing the Company’s credibility and recognition. The Company also utilizes a direct sales force to build and maintain direct relationships with its merchants and other referral partners in order to control sales, price negotiation, underwriting, boarding, and support processes. |
|
· |
Tech-enabled – Includes partnerships with independent software vendors, integrated software dealers, enterprise resource planning (“ERP”) software dealers, and eCommerce gateway providers. These partnerships function by way of a technical integration between the Company and the third party in which the third party seamlessly passes information to the Company’s systems in order to streamline the merchant boarding process. The Company also drives growth through its own ERP integrations, which support its B2B offering, and its proprietary eCommerce gateway. |
|
· |
Traditional – Represents the Company’s heritage United States portfolio composed primarily of ISO relationships. The Company is not focused on this sales model, and it will represent an increasingly smaller portion of the business over time. |
|
|
|
|
Year Ended December 31, 2019 |
|||||||
|
|
|
|
Americas |
|
Europe |
|
Total |
|||
|
|
|
|
(In thousands) |
|||||||
|
Divisions: |
||||||||||
|
Direct |
$ |
156,112 |
$ |
142,313 |
$ |
298,425 |
||||
|
Tech-enabled |
115,476 |
39,625 |
155,101 |
|||||||
|
Traditional |
32,252 |
— |
32,252 |
|||||||
|
Totals |
$ |
303,840 |
$ |
181,938 |
$ |
485,778 |
||||
|
|
|
|
Year Ended December 31, 2018 |
|||||||
|
|
|
|
Americas |
|
Europe |
|
Total |
|||
|
|
|
|
(In thousands) |
|||||||
|
Divisions: |
||||||||||
|
Direct |
$ |
165,452 |
$ |
189,782 |
$ |
355,234 |
||||
|
Tech-enabled |
115,691 |
54,491 |
170,182 |
|||||||
|
Traditional |
39,338 |
— |
39,338 |
|||||||
|
Totals |
$ |
320,481 |
$ |
244,273 |
$ |
564,754 |
||||
|
|
|
|
|
|
|
|
|
|
|
|
|
|
|
|
|
|
|
|
|
|
|
|
(3) Settlement Processing Assets and Obligations
In certain markets, the Company is a member of various card networks, allowing it to process and settle transactions without third-party sponsorship. In other markets, the Company partners with Member Banks, the sponsorship of which allows the Company to route transactions under the Member Banks’ control to clear transactions through card networks in accordance with card network standards.
The card networks operate as an intermediary between the card issuing banks and the Member Banks, whereby funds are received by the card issuing banks and remitted to the Member Banks on a daily basis. The Company then
87
remits these funds to merchants via the Member Banks to settle their daily card transactions. These balances are presented as receivables from card networks and settlement liabilities due to merchants, respectively, within the settlement processing assets and obligations table below.
Receivables from merchants represent amounts invoiced to the merchants related to the various fees associated with the payment processing services.
As described in Note 1, “Description of Business and Summary of Significant Accounting Policies”, the Company collects funds from merchants that serve as collateral to mitigate potential future losses, and recognizes a corresponding liability which is presented as merchant reserves within the settlement processing assets and obligations table below.
While receivables from card networks and settlement liabilities due to merchants represent intermediary balances in the transaction settlement process, timing differences, interchange expense, merchant reserves and exception items cause differences between the amount the Member Banks receive from the card networks and the amount funded to merchants.
A summary of settlement processing assets and obligations is as follows:
|
|
|
December 31, |
|
December 31, |
||
|
|
|
2019 |
|
2018 |
||
|
|
|
(In thousands) |
||||
|
Settlement processing assets: |
||||||
|
Receivable from card networks |
$ |
232,458 |
$ |
195,817 |
||
|
Receivable from merchants |
96,179 |
52,513 |
||||
|
Totals |
$ |
328,637 |
$ |
248,330 |
||
|
Settlement processing obligations: |
||||||
|
Settlement liabilities due to merchants |
$ |
(363,545) |
$ |
(320,492) |
||
|
Merchant reserves |
(85,757) |
(107,836) |
||||
|
Totals |
$ |
(449,302) |
$ |
(428,328) |
||
(4)Earnings Per Share
Earnings per share information for the year ended December 31, 2018 has been presented on a prospective basis and reflects only the net loss available for holders of the Company’s Class A common stock, as well as both basic and diluted weighted-average Class A common stock outstanding, for the period from May 23, 2018 through December 31, 2018. Earnings per share information prior to May 23, 2018 is not presented since the ownership structure of EVO, LLC is not a common unit of ownership of the Company.
88
The following table sets forth the computation of the Company's basic and diluted net loss per Class A common share (in thousands, except share and per share data):
|
|
|
Year Ended December 31 |
|
May 23 - December 31 |
||
|
|
|
|
2019 |
|
|
2018 |
|
|
|
|
|
|
|
|
|
Numerator: |
|
|
|
|
|
|
|
Net loss attributable to EVO Payments, Inc. |
|
$ |
(10,105) |
|
$ |
(14,712) |
|
|
|
|
|
|
|
|
|
Denominator: |
|
|
|
|
|
|
|
Weighted-average Class A common stock outstanding |
|
|
32,720,370 |
|
|
21,081,447 |
|
Effect of dilutive securities |
|
|
— |
|
|
— |
|
Total dilutive securities |
|
|
32,720,370 |
|
|
21,081,447 |
|
|
|
|
|
|
|
|
|
Earnings per share: |
|
|
|
|
|
|
|
Basic |
|
$ |
(0.31) |
|
$ |
(0.70) |
|
Diluted |
|
$ |
(0.31) |
|
$ |
(0.70) |
|
|
|
|
|
|
|
|
|
Anti-dilutive securities: |
|
|
|
|
|
|
|
Stock options |
|
|
3,082,909 |
|
|
2,086,153 |
|
RSUs |
|
|
807,688 |
|
|
505,975 |
|
RSAs |
|
|
19,903 |
|
|
42,087 |
|
Class C common stock |
|
|
2,380,844 |
|
|
2,461,055 |
|
Class D common stock |
|
|
11,449,784 |
|
|
16,785,552 |
Earnings per share is not separately presented for Class B common stock, Class C common stock, and Class D common stock since they have no economic rights to the earnings of the Company. Class B common stock is not considered when calculating dilutive EPS as this class of common stock may not convert to Class A common stock. Class C common stock and Class D common stock are considered in the calculation of dilutive EPS on an if-converted basis as these classes, together with the related LLC Interests, have exchange rights into Class A common stock that could result in additional Class A common stock being issued. However, the Company is in a net loss position, as such, Class C common stock and Class D common stock are therefore anti-dilutive. All other potentially dilutive securities are determined based on the treasury stock method. Refer to Note 20, “Shareholders’ Equity”, for further information on rights to each class of stock.
(5)Tax Receivable Agreement and Obligations
In connection with the IPO, the Company entered into a Tax Receivable Agreement (“TRA”) that requires the Company to make payments to the Continuing LLC Owners, as defined in Note 20, “Shareholders’ Equity”, that are generally equal to 85% of the applicable cash tax savings, if any, realized as a result of favorable tax attributes that will be available to the Company as a result of the Reorganization Transactions, exchanges of LLC Interests and paired Class C common stock or paired Class D common stock for Class A common stock, purchases or redemptions of LLC Interests, and payments made under the TRA. Payments will occur only after the filing of U.S. federal and state income tax returns and realization of cash tax savings from the favorable tax attributes. Due to net losses attributable to the Company in 2019 and 2018, there were no realized tax savings attributable to the TRA, therefore no payments have been made related to the TRA obligation.
89
As a result of the purchases of LLC Interests and the exchanges of LLC Interests and paired shares of Class C common stock and paired Class D common stock for shares of Class A common stock sold in connection with and following the IPO, through December 31, 2019, the Company’s deferred tax asset and payment liability pursuant to the TRA were approximately $176.8 million ($170.3 million net of amortization) and $150.3 million, respectively at December 31, 2019. The Company recorded a corresponding increase to paid-in capital for the difference between the TRA liability and the related deferred tax asset. The amounts recorded as of December 31, 2019, approximate the current estimate of expected tax savings and are subject to change after the filing of the Company’s U.S. federal and state income tax returns for the year ended December 31, 2019. Future payments under the TRA with respect to subsequent exchanges would be in addition to these amounts.
For the TRA, the cash savings realized by the Company are computed by comparing the actual income tax liability of the Company to the amount of such taxes the Company would have been required to pay had there been no increase to the tax basis of the assets from member exchanges of LLC Interests, and no tax benefit as a result of the Net Operating Losses (“NOLs”) generated by the increase in the Company’s tax basis of the assets in EVO, LLC. Subsequent adjustments of the TRA obligations due to certain events (e.g., changes to the expected realization of NOLs or changes in tax rates) will be recognized within other (expense) income in the consolidated statements of operations and comprehensive (loss) income.
(6) Acquisitions
The Company determined the pro forma impact of the acquisitions below was not significant individually and in the aggregate, to the Company’s operating results and is, therefore, not separately presented.
2019 Acquisitions
|
(a) |
Delego Software ULC |
In September 2019, a subsidiary of EVO, Inc. acquired 100% of the outstanding shares of Delego Software ULC (“Delego”), an unlimited liability company governed by the laws of the Province of British Columbia, Canada, for CAD 42.6 million ($32.4 million, based on the foreign exchange rate at the time of the acquisition), which was funded with cash drawn from the Company’s debt facilities and fully paid at closing. The acquisition of Delego expands the Company’s integrated payment solutions business as Delego is a provider of SAP integrated payments for business to business customers. The results of operations of Delego are included in the Company’s consolidated statement of operations and comprehensive (loss) income from the date of the acquisition in the Company’s Americas segment through the end of the period.
As of December 31, 2019, the allocation of purchase price is preliminary, specifically with regards to deferred tax liabilities, because the Company has not yet completed its analysis of the historical tax records. Thus, the measurements of fair value set forth below are subject to change. The Company expects to finalize the valuations as soon as practical, but not later than one year from the acquisition date.
The estimated acquisition-date fair values of major classes of assets acquired and liabilities assumed are as follows:
|
|
|
As of the |
Estimated |
|
|
|
|
acquisition date |
Useful Life |
|
|
Finite-lived intangible assets |
|
|
(In thousands ) |
|
|
Acquired software |
|
$ |
8,513 |
7 years |
|
Customer relationships |
|
|
2,964 |
15 years |
|
Trademarks |
|
|
836 |
2 years |
|
Deferred tax liabilities |
|
|
(3,116) |
|
|
Other assets (liabilities), net |
|
|
590 |
|
|
Goodwill |
|
|
22,628 |
|
|
Total purchase price |
|
$ |
32,415 |
|
90
Goodwill in the amount of $22.6 million represents the excess of the purchase price over the fair value of the net tangible and intangible assets acquired. Goodwill generated from the Delego acquisition is deductible for U.S. income tax purposes.
|
(b) |
SF Systems |
In July 2019, a subsidiary of EVO, Inc. completed the acquisition of 100% of SF Systems, S.A.P.I. (“SF Systems”) for total consideration of $5.0 million, which includes an upfront payment of $4.0 million and a holdback liability of $1.0 million payable 18 months after the closing date. Net assets acquired in the SF Systems acquisition included purchased software of $2.6 million with a useful life of 5 years and goodwill of $2.4 million. Goodwill generated from the SF Systems acquisition is deductible for United States income tax purposes. SF Systems is presented in the Company’s Americas segment.
|
(c) |
Way2Pay Ltd |
In March 2019, a subsidiary of EVO, Inc. completed the acquisition of 100% of the outstanding shares of Way2Pay Ltd (“Way2Pay”) for total consideration of €3.0 million ($3.4 million, based on the foreign exchange rate at the time of the acquisition), which includes an upfront payment of €2.7 million and a holdback liability of €0.3 million payable 18 months after the date of the agreement. Net assets acquired in the Way2Pay acquisition included purchased software of $4.0 million with a useful life of 5 years and liabilities of $0.6 million. Way2Pay is presented in the Company’s Europe segment.
2018 Acquisitions
|
(a) |
ClearONE, S.L. |
In October 2018, a subsidiary of EVO, Inc. acquired 100% of the outstanding shares of ClearONE for €5.4 million ($6.3 million based on the foreign exchange rate at the time of the acquisition). ClearONE is presented in the Company’s Europe segment. Equipment and intangible assets consist of card processing equipment, merchant contract portfolios, trademarks, internally developed software, and non-competition agreements with useful lives of 3 to 5 years, 5 years, 5 years, 5 years, and 2 to 3 years, respectively.
|
(b) |
Federated Payment Systems, LLC/Federated Payment Canada Corp. |
In September 2018, a subsidiary of EVO, Inc. acquired the remaining 67% of the outstanding membership interests of Federated Payment Systems, LLC (“Federated US”) and 100% of the outstanding shares of Federated Payment Canada Corporation (“Federated Canada,” together with Federated US, “Federated”) for $38.2 million. Certain acquisition-related expenses were incurred in conjunction with the Federated acquisition in the amount of $0.4 million. Federated maintains diverse sales channels which complement the Company’s distribution relationships. As a result of this acquisition, the Company recognized goodwill. Federated is presented in the Company’s Americas segment.
91
The purchase price allocation, including the step-up in the Company’s original carrying value, is as follows:
|
c |
|||
|
|
|
As of the |
|
|
acquisition date |
|||
|
|
|
(in thousands) |
|
|
Tangible assets acquired |
|
$ |
1,702 |
|
Deferred tax liability |
|
|
(1,357) |
|
Amortizable intangible assets: |
|
|
|
|
Trademarks |
|
|
1,200 |
|
Merchant contract portfolios |
|
|
11,400 |
|
Goodwill |
|
|
33,677 |
|
Total net assets acquired |
|
$ |
46,622 |
Intangible assets of $12.6 million have been allocated to amortizable intangible assets consisting of trademarks and merchant contract portfolios, with estimated useful lives of 5 years and 10 years, respectively.
On the date of acquisition, the book value of the investment in Federated US was zero. The Company recorded a gain on the acquisition of the unconsolidated investee of $8.4 million to step-up carrying value of the investment to fair value as of the acquisition date. The gain on acquisition of unconsolidated investee was recorded on the consolidated statements of operations and comprehensive (loss) income for the year ended December 31, 2018.
Goodwill, totaling $33.7 million, represents the excess of the purchase price over the fair value of the net tangible and intangible assets acquired. Goodwill generated from the Federated acquisition is deductible for U.S. income tax purposes.
|
(c) |
Nodus Technologies, Inc. |
In May 2018, a subsidiary of EVO, Inc. acquired 100% of the outstanding shares of Nodus Technologies, Inc. (“Nodus”) for $18.0 million. Nodus is presented in the Company’s Americas segment. Equipment and intangible assets consist of office equipment, computer software, merchant contract portfolios, trademarks, internally developed software, and non-competition agreements with useful lives of 5 to 7 years, 3 years, 15 years, 20 years, 10 years, and 3 years, respectively.
|
(d) |
Liberbank, S.A. |
In April 2018, a subsidiary of EVO, Inc. acquired a portion of the merchant acquiring assets of Liberbank, S.A. and Banco de Castilla la Mancha, S.A. for €7.9 million ($9.5 million, based on the foreign exchange rate at the time of the acquisition). This asset acquisition is presented in the Company’s Europe segment. Equipment and intangible assets acquired consist of card processing equipment, merchant contract portfolios, marketing alliance agreements, and trademarks with useful lives of 3 years, 5 years, 15 years, and 15 years, respectively.
|
(e) |
Nationwide Payment Solutions, LLC |
In March 2018, a subsidiary of EVO, Inc. acquired the remaining 38% membership interest in Nationwide Payment Solutions, LLC (“NPS”) for an upfront payment of $16.9 million, and contingent consideration of $3.8 million paid on April 1, 2019. This transaction resulted in a reduction to members’ deficit and nonredeemable non-controlling interests of $20.1 million and $0.6 million, respectively. NPS is presented in the Company’s Americas segment.
92
|
(f) |
EVO Payments International Corp. - Canada |
In February 2018, a subsidiary of EVO, Inc. acquired the remaining 30% membership interest in EVO Payments International Corp. - Canada (“EVO Canada”) from 7097794 Canada, Inc. for $0.9 million of contingent consideration. This transaction resulted in a reduction to members’ deficit and nonredeemable non-controlling interests of $0.4 million and $0.5 million, respectively. EVO Canada is presented in the Company’s Americas segment.
(7) Leases
As discussed in Note 1, “Description of Business and Summary of Significant Accounting Policies”, the Company retroactively adopted ASC 842 effective January 1, 2019, using the modified retrospective transition method, under which the prior period financial statements were not restated for the new guidance.
The effect of adopting ASC 842 on the Company’s consolidated balance sheet is as follows:
|
|
|
December 31, 2019 |
|
January 1, 2019 |
|
|
|
(In thousands) |
||
|
Operating Leases: |
|
|
|
|
|
Operating lease right-of-use assets |
$ |
45,664 |
$ |
35,555 |
|
|
|
|
|
|
|
Current portion of operating lease liabilities |
|
7,087 |
|
6,601 |
|
Noncurrent portion of operating lease liabilities |
|
41,703 |
|
31,627 |
|
Total operating lease liabilities |
$ |
48,790 |
$ |
38,228 |
The Company’s leases consist primarily of real estate and personal property leases throughout the markets in which the Company operates. At contract inception, the Company determines whether an arrangement is or contains a lease, and for each identified lease, evaluates the classification as operating or financing. The Company had no finance leases during the year ended December 31, 2019. Leased assets and obligations are recognized at the lease commencement date based on the present value of fixed lease payments to be made over the term of the lease. Renewal and termination options are factored into determination of the lease term only if the option is reasonably certain to be exercised. The weighted-average remaining lease term at December 31, 2019 was 7.79 years. The Company had no significant short-term leases during the year ended December 31, 2019.
The Company’s leases do not provide a readily determinable implicit interest rate and the Company uses its incremental borrowing rate to measure the lease liability and corresponding right-of-use asset. The incremental borrowing rates were determined based on a portfolio approach considering the Company’s current secured borrowing rate adjusted for market conditions and the length of the lease term. The weighted-average discount rates used in the measurement of our lease liabilities were 6.62% and 6.67% as of January 1, 2019 and December 31, 2019, respectively.
Operating lease cost is recognized on a straight-line basis over the lease term. Operating lease costs for the year ended December 31, 2019 were $12.1 million and are included in selling, general and administrative expenses in the consolidated statement of operations and comprehensive (loss) income. Total lease costs include variable lease costs of approximately $2.3 million, which are primarily comprised of costs of maintenance and utilities, and are determined based on the actual costs incurred during the period. Variable payments are expensed in the period incurred and not included in the measurement of lease assets and liabilities.
Cash paid for amounts included in the measurement of operating lease liabilities for the year ended December 31, 2019 was $9.4 million, which is included as a component of cash provided by operating activities in the consolidated statement of cash flows. Operating lease liabilities arising from obtaining new or modified lease right-of-use assets, which are treated as non-cash activities, were $18.0 million for the year ended December 31, 2019.
93
As of December 31, 2019, maturities of lease liabilities are as follows:
|
|
|
|
|
|
(In thousands) |
|
|
Years ending December 31: |
|
|
|
2020 |
$ |
9,878 |
|
2021 |
|
9,291 |
|
2022 |
|
8,966 |
|
2023 |
|
6,723 |
|
2024 |
|
5,815 |
|
2025 and thereafter |
|
22,823 |
|
Total future minimum lease payments (undiscounted) |
|
63,496 |
|
Less: present value discount |
|
(14,706) |
|
Present value of lease liability |
$ |
48,790 |
The future minimum lease payments required under operating leases as of December 31, 2018 are as follows:
|
|
|
|
|
|
(In thousands) |
|
|
Years ending December 31: |
|
|
|
2019 |
$ |
7,944 |
|
2020 |
|
6,967 |
|
2021 |
|
5,962 |
|
2022 |
|
4,851 |
|
2023 |
|
2,787 |
|
2024 and thereafter |
|
13,875 |
|
Total |
$ |
42,386 |
Rent expense, inclusive of real estate taxes, utilities, and maintenance incurred under operating leases totaled $15.4 million and $12.6 million for the years ended December 31, 2018 and 2017, respectively, and is included in selling, general, and administrative expenses in the consolidated statements of operations and comprehensive (loss) income.
(8)Equipment and Improvements
Equipment and improvements consisted of the following:
|
|
|
Estimated |
|
|
|
|
|
|
|
|
|
Useful |
|
|
|
|
|
|
|
|
|
Lives in |
|
December 31, |
|
December 31, |
||
|
|
|
Years |
|
2019 |
|
2018 |
||
|
|
|
|
|
(In thousands) |
||||
|
Card processing |
|
3-5 |
|
$ |
137,190 |
|
$ |
128,244 |
|
Office equipment |
|
3-5 |
|
|
42,561 |
|
|
41,771 |
|
Computer software |
|
3 |
|
|
42,621 |
|
|
44,373 |
|
Leasehold improvements |
|
various |
|
|
17,870 |
|
|
16,234 |
|
Furniture and fixtures |
|
5-7 |
|
|
6,019 |
|
|
5,673 |
|
Totals |
|
|
|
|
246,261 |
|
|
236,295 |
|
Less accumulated depreciation |
|
|
|
|
(155,323) |
|
|
(136,947) |
|
Foreign currency translation adjustment |
|
|
|
|
3,526 |
|
|
3,698 |
|
Totals |
|
|
|
$ |
94,464 |
|
$ |
103,046 |
Depreciation expense related to equipment and improvements was $42.6 million, $38.5 million, and $29.1 million for the years ended December 31, 2019, 2018, and 2017, respectively.
94
In the year ended December 31, 2019, equipment and improvements, gross, and accumulated depreciation were each reduced by $27.8 million and $24.8 million, respectively, and in the year ended December 31, 2018 by $9.8 million and $8.5 million, respectively, primarily related to asset retirements. The Company infrequently sells or disposes of assets that are not fully depreciated, and this activity represents an insignificant portion of the total reduction.
(9)Goodwill and Intangible Assets
Intangible assets, net consist of the following:
|
|
|
December 31, |
|
December 31, |
||
|
|
|
2019 |
|
2018 |
||
|
|
|
(In thousands) |
||||
|
Intangible assets with finite lives: |
|
|
|
|
|
|
|
Merchant contract portfolios and customer relationships: |
|
|
|
|
|
|
|
Gross carrying value |
|
$ |
296,033 |
|
$ |
293,069 |
|
Accumulated amortization |
|
|
(163,358) |
|
|
(139,159) |
|
Accumulated impairment losses |
|
|
(7,089) |
|
|
(5,658) |
|
Foreign currency translation adjustment |
|
|
(26,347) |
|
|
(27,975) |
|
Net |
|
|
99,239 |
|
|
120,277 |
|
|
|
|
|
|
|
|
|
Marketing alliance agreements: |
|
|
|
|
|
|
|
Gross carrying value |
|
|
191,879 |
|
|
191,879 |
|
Accumulated amortization |
|
|
(59,545) |
|
|
(47,777) |
|
Accumulated impairment losses |
|
|
(11,920) |
|
|
(7,585) |
|
Foreign currency translation adjustment |
|
|
(17,468) |
|
|
(18,634) |
|
Net |
|
|
102,946 |
|
|
117,883 |
|
|
|
|
|
|
|
|
|
Trademarks, finite-lived: |
|
|
|
|
|
|
|
Gross carrying value |
|
|
29,493 |
|
|
28,657 |
|
Accumulated amortization |
|
|
(13,129) |
|
|
(10,748) |
|
Accumulated impairment losses |
|
|
(2,631) |
|
|
— |
|
Foreign currency translation adjustment |
|
|
(4,600) |
|
|
(4,446) |
|
Net |
|
|
9,133 |
|
|
13,463 |
|
|
|
|
|
|
|
|
|
Internally developed and acquired software: |
|
|
|
|
|
|
|
Gross carrying value |
|
|
84,060 |
|
|
60,876 |
|
Accumulated amortization |
|
|
(26,042) |
|
|
(15,794) |
|
Accumulated impairment losses |
|
|
(10,190) |
|
|
(9,324) |
|
Foreign currency translation adjustment |
|
|
(2,110) |
|
|
(2,260) |
|
Net |
|
|
45,718 |
|
|
33,498 |
|
|
|
|
|
|
|
|
|
Non-competition agreements: |
|
|
|
|
|
|
|
Gross carrying value |
|
|
6,462 |
|
|
6,462 |
|
Accumulated amortization |
|
|
(5,938) |
|
|
(5,316) |
|
Net |
|
|
524 |
|
|
1,146 |
|
Total finite-lived, net |
|
|
257,560 |
|
|
286,267 |
|
|
|
|
|
|
|
|
|
Trademarks, indefinite-lived: |
|
|
|
|
|
|
|
Gross carrying value |
|
|
18,499 |
|
|
18,499 |
|
Accumulated impairment losses |
|
|
(18,499) |
|
|
(14,627) |
|
Net |
|
|
— |
|
|
3,872 |
|
Total intangible assets, net |
|
$ |
257,560 |
|
$ |
290,139 |
95
Amortization expense related to intangible assets was $49.4 million, $48.7 million, and $45.0 million for the years ended December 31, 2019, 2018, and 2017, respectively. Refer to Note 1, “Description of Business and Summary of Significant Accounting Policies”, for further information on the impairment losses.
Estimated amortization expense to be recognized during each of the five years subsequent to December 31, 2019:
|
|
|
|
|
|
|
|
(In thousands) |
|
|
Years ending: |
|
|
|
|
2020 |
|
$ |
48,280 |
|
2021 |
|
|
41,337 |
|
2022 |
|
|
34,431 |
|
2023 |
|
|
27,259 |
|
2024 |
|
|
17,884 |
|
2025 and thereafter |
|
|
88,369 |
|
Total |
|
$ |
257,560 |
The following represents net intangible assets by segment:
|
|
|
December 31, |
|
December 31, |
||
|
|
|
2019 |
|
2018 |
||
|
|
|
(In thousands) |
||||
|
Intangible assets, net: |
|
|
|
|
|
|
|
Americas |
|
|
|
|
|
|
|
Merchant contract portfolios and customer relationships |
|
$ |
74,791 |
|
$ |
88,141 |
|
Marketing alliance agreements |
|
|
72,272 |
|
|
76,590 |
|
Trademarks, finite-lived |
|
|
2,994 |
|
|
2,585 |
|
Internally developed and acquired software |
|
|
28,697 |
|
|
20,167 |
|
Non-competition agreements |
|
|
489 |
|
|
1,089 |
|
Trademarks, indefinite-lived |
|
|
— |
|
|
3,872 |
|
Total |
|
|
179,243 |
|
|
192,444 |
|
|
|
|
|
|
|
|
|
Europe |
|
|
|
|
|
|
|
Merchant contract portfolios and customer relationships |
|
|
24,448 |
|
|
32,136 |
|
Marketing alliance agreements |
|
|
30,674 |
|
|
41,293 |
|
Trademarks, finite-lived |
|
|
6,139 |
|
|
10,878 |
|
Internally developed and acquired software |
|
|
17,021 |
|
|
13,331 |
|
Non-competition agreements |
|
|
35 |
|
|
57 |
|
Total |
|
|
78,317 |
|
|
97,695 |
|
|
|
|
|
|
|
|
|
Total intangible assets, net |
|
$ |
257,560 |
|
$ |
290,139 |
96
Goodwill activity for the years ended December 31, 2019, 2018, and 2017, in total and by reportable segment, was as follows:
|
|
|
Reportable Segment |
|
|
|
||||
|
|
|
|
|
|
|
|
|
||
|
|
|
Americas |
|
Europe |
|
Total |
|||
|
|
|
(In thousands) |
|||||||
|
Goodwill, gross, as of December 31, 2017 |
|
$ |
196,126 |
|
$ |
139,843 |
|
$ |
335,969 |
|
Accumulated impairment losses |
|
|
— |
|
|
(24,291) |
|
|
(24,291) |
|
Goodwill, net, as of December 31, 2017 |
|
|
196,126 |
|
|
115,552 |
|
|
311,678 |
|
Business combinations |
|
|
44,664 |
|
|
3,636 |
|
|
48,300 |
|
Foreign currency translation adjustment |
|
|
47 |
|
|
(7,014) |
|
|
(6,967) |
|
Goodwill, net as of December 31, 2018 |
|
|
240,837 |
|
|
112,174 |
|
|
353,011 |
|
|
|
|
|
|
|
|
|
|
|
|
Goodwill, gross, as of December 31, 2018 |
|
$ |
240,837 |
|
$ |
136,465 |
|
$ |
377,302 |
|
Accumulated impairment losses |
|
|
— |
|
|
(24,291) |
|
|
(24,291) |
|
Goodwill, net, as of December 31, 2018 |
|
|
240,837 |
|
|
112,174 |
|
|
353,011 |
|
Business combinations |
|
|
25,030 |
|
|
40 |
|
|
25,070 |
|
Foreign currency translation adjustment |
|
|
2,182 |
|
|
(1,425) |
|
|
757 |
|
Goodwill, net as of December 31, 2019 |
|
$ |
268,049 |
|
$ |
110,789 |
|
$ |
378,838 |
(10)Other Assets
Membership Interest in Visa Europe Limited
The Company was a member of Visa Europe Limited (“Visa Europe”) through certain of the Company’s subsidiaries in Europe. On June 21, 2016, Visa Inc. (“Visa”) acquired all of the membership interests in Visa Europe.
In connection with the acquisition, the Company received approximately €64.0 million ($72.4 million based on the foreign exchange rate at the time of the acquisition) in proceeds from the sale of its membership interest in Visa Europe. Substantially all of the proceeds were recorded as a gain as the carrying value of the Company’s interest was nominal. The consideration included cash of €47.0 million ($53.2 million based on the foreign exchange rate at the time of the acquisition), Visa Series C preferred stock which is convertible into Visa Class A common stock of €12.9 million ($14.7 million based on the foreign exchange rate at the time of the acquisition) and deferred cash consideration of €4.1 million ($4.6 million based on the foreign exchange rate at the time of the acquisition).
The Visa Series C preferred stock was recorded at the fair value as of the date of the acquisition and is included in other assets in the consolidated balance sheets. The estimated fair value of the Visa Series C preferred stock of $37.8 million and $25.0 million as of December 31, 2019 and 2018, respectively, is based upon inputs classified as Level 3 of the fair value hierarchy. These inputs include the fair value of Visa Class A common stock as of December 31, 2019 and 2018 and the conversion factor of Visa Series C preferred stock to Visa Class A common stock as of December 31, 2019 and 2018, inclusive of a discount rate due to the lack of liquidity, which represents a measure of fair value that is unobservable or requires management’s judgment. The Visa Series C preferred stock is convertible into Visa Class A common stock at periodic intervals over the 12 year period following the acquisition date at Visa’s discretion. Additionally, the conversion factor of the Visa Series C preferred stock could be adjusted down based on the outcome of potential litigation in Europe such that the number of Visa Class A common stock ultimately received could be as low as zero. The Visa Series C preferred stock is accounted for prospectively under the cost method.
The deferred cash consideration was recorded at fair value as of the date of the acquisition and was included in other assets in the consolidated balance sheet as of December 31, 2018. The discount rate used to determine the fair value of the deferred cash consideration was 2.2%, which was based upon the risk-adjusted borrowing rate of Visa for long-term instruments of a similar tenor. The Company collected the deferred cash consideration during the year ended December 31, 2019.
97
(11)Accounts Payable and Accrued Expenses
The Company’s accounts payable and accrued expenses consisted of the following:
|
|
|
December 31, |
|
December 31, |
||
|
|
|
2019 |
|
2018 |
||
|
|
|
(In thousands) |
||||
|
Compensation and related benefits |
|
$ |
18,460 |
|
$ |
22,280 |
|
Third-party processing and payment network fees |
|
|
36,409 |
|
|
37,702 |
|
Trade payables |
|
|
11,571 |
|
|
44,581 |
|
Taxes payable |
|
|
18,556 |
|
|
16,292 |
|
Commissions payable to third parties and agents |
|
|
15,030 |
|
|
13,141 |
|
Unearned revenue |
|
|
4,309 |
|
|
4,579 |
|
Other |
|
|
19,328 |
|
|
22,641 |
|
Total accounts payable and accrued expenses |
|
$ |
123,663 |
|
$ |
161,216 |
(12) Related Party Transactions
Related party balances consist of the following:
|
|
|
December 31, |
|
December 31, |
||
|
|
|
2019 |
|
2018 |
||
|
|
|
(In thousands) |
||||
|
Receivables from sale of POS devices and peripherals |
|
$ |
— |
|
$ |
303 |
|
Receivables from related companies |
|
|
1,125 |
|
|
1,568 |
|
Due from related parties, current |
|
$ |
1,125 |
|
$ |
1,871 |
|
|
|
|
|
|
|
|
|
Notes receivable, long-term |
|
|
— |
|
|
915 |
|
Due from related parties, long-term |
|
$ |
— |
|
$ |
915 |
|
|
|
|
|
|
|
|
|
Liabilities to related companies |
|
|
7,325 |
|
|
4,824 |
|
Due to related parties, current |
|
$ |
7,325 |
|
$ |
4,824 |
|
|
|
|
|
|
|
|
|
ISO commission reserve |
|
|
385 |
|
|
385 |
|
Due to related parties, long-term |
|
$ |
385 |
|
$ |
385 |
|
|
|
|
|
|
|
|
Receivables from related companies include amounts receivable from the Company’s founder and chairman, or entities controlled by the Company’s founder and chairman of $0.7 million as of December 31, 2018, and there were no receivables from the Company’s founder and chairman, or entities controlled by the Company’s founder and chairman, as of December 31, 2019. Receivables from non-controlling interest holders of consolidated subsidiaries and other related companies amounted to $1.1 million and $0.8 million as of December 31, 2019 and 2018, respectively.
In connection with the vesting of certain RSAs, the Company issued loans to certain employees for the purposes of paying withholding taxes. As of December 31, 2018, the amount of notes receivable from related parties related to these loans was $0.9 million. There were no notes receivable from related parties as of December 31, 2019.
Liabilities to related companies include $5.5 million and $3.0 million as of December 31, 2019 and 2018, respectively, primarily due to non-controlling interest holders of consolidated subsidiaries. Related party commissions payable to unconsolidated investees of the Company amounted to $1.8 million and $1.7 million as of
98
December 31, 2019 and 2018, respectively.
The Company leases office space located at 515 Broadhollow Road in Melville, New York from 515 Broadhollow, LLC. 515 Broadhollow, LLC is majority owned, directly and indirectly, by the Company’s chairman. As of December 31, 2019, the liability related to this lease amounted to $4.1 million and is included in the operating lease liabilities on the consolidated balance sheet. The Company subleases a portion of this office space to an unconsolidated investee. Sublease income was $0.1 million for each of the years ended December 31, 2019 and 2018.
The Company leases vehicles from the non-controlling interest holders of consolidated subsidiaries. As of December 31, 2019, these lease liabilities amounted to $0.3 million and are included in the operating lease liabilities on the consolidated balance sheet.
A portion of the TRA obligation is payable to members of management and current employees. Refer to Note 5, “Tax Receivable Agreement”, for further information on the tax receivable agreement.
Related party commission expense incurred with unconsolidated investees of the Company amounted to $20.0 million, $32.2 million, and $38.6 million for the years ended December 31, 2019, 2018, and 2017, respectively. The sale of equipment and services to these unconsolidated investees amounted to $0.4 million, $0.4 million, and $0.5 million for the years ended December 31, 2019, 2018, and 2017, respectively.
Madison Dearborn Partners, LLC (“MDP”), a member of EVO, LLC and shareholder of EVO, Inc., provides the Company with consulting services related to business development, financing matters, and potential acquisition activities on an as needed basis. In addition, the Company reimburses MDP for certain out of pocket expenses. The Company made payments to MDP of less than $0.1 million, less than $0.1 million, and $5.7 million for the years ended December 31, 2019, 2018, and 2017, for consulting services and expense reimbursement.
The Company provides certain professional and other services to Blueapple Inc. (“Blueapple”), a member of EVO, LLC and owner of all outstanding shares of Class B common stock of EVO, Inc. Blueapple is controlled by entities affiliated with the Company’s founder and chairman, Rafik R. Sidhom. The expense related to these services was $0.2 million for each of the years ended December 31, 2019, 2018, and 2017. During 2018, the Company paid Blueapple $2.4 million in satisfaction of the obligation to pay any further commissions associated with processing revenue to Blueapple and all such future revenue will be retained by the Company.
Prior to the Company’s acquisition of the remaining 67% membership interests of Federated US and 100% of the outstanding shares of Federated Canada in September 2018, the Company’s chairman owned one-third of the shares of Federated Canada, and an entity wholly owned by relatives of the Company’s chairman owned one-third of the membership interests of Federated US. As a result of the ownership interests, the Company’s founder and chairman and relatives received $15.5 million of the September 2018 Federated acquisition purchase price. In addition, prior to the acquisition, the Company provided card-based processing services and risk assessment services to Federated US in the ordinary course of business for a nominal fee. For the years ended December 31, 2018 and 2017, the Company received $0.4 million and $0.5 million, respectively, in revenues in connection with providing services to Federated US. In addition, prior to the acquisition, Federated Canada provided certain marketing services to the Company’s business in Canada. For the years ended December 31, 2018 and 2017, the Company paid $5.8 million and $8.6 million, respectively, in fees to Federated Canada for these services.
The Company, through two wholly owned subsidiaries and one unconsolidated investee, conducts business under ISO agreements with a relative of the Company’s founder and chairman pursuant to which the relative of the Company’s founder and chairman provides certain marketing services and equipment in exchange for a commission based on the volume of transactions processed for merchants acquired by the relative of the Company’s founder and chairman. For the years ended December 31, 2019, 2018, and 2017, the Company paid commissions of $0.5 million, $0.6 million, and $0.2 million, respectively, related to this activity.
99
NFP is the Company’s benefit and insurance broker and 401(k) manager. NFP is a portfolio company of MDP and one of the Company’s executive officers owns a minority interest in NFP. For the years ended December 31, 2019, 2018 and 2017, the Company paid $0.3 million, $0.3 million, and $0.4 million, respectively, in commissions and other expenses to NFP.
(13)Income Taxes
Domestic and foreign (loss) income before income taxes is as follows for the years ended December 31:
|
|
|
2019 |
|
2018 |
|
2017 |
|||
|
|
|
(In thousands) |
|||||||
|
Domestic |
|
$ |
(66,850) |
|
$ |
(122,699) |
|
$ |
(76,255) |
|
Foreign |
|
|
48,032 |
|
|
34,293 |
|
|
60,495 |
|
Loss before income taxes |
|
$ |
(18,818) |
|
$ |
(88,406) |
|
$ |
(15,760) |
Income tax expense (benefit) is comprised of the following for the years ended December 31:
|
|
|
2019 |
|
2018 |
|
2017 |
|||
|
|
|
(In thousands) |
|||||||
|
Current: |
|
|
|
|
|
|
|
|
|
|
Foreign |
|
$ |
14,515 |
|
$ |
12,735 |
|
$ |
4,711 |
|
Federal |
|
|
338 |
|
|
146 |
|
|
306 |
|
State |
|
|
61 |
|
|
(43) |
|
|
57 |
|
Total current income tax expense |
|
|
14,914 |
|
|
12,838 |
|
|
5,074 |
|
|
|
|
|
|
|
|
|
|
|
|
Deferred: |
|
|
|
|
|
|
|
|
|
|
Foreign |
|
|
(9,262) |
|
|
4,217 |
|
|
11,294 |
|
Federal |
|
|
(973) |
|
|
(5,821) |
|
|
220 |
|
State |
|
|
(131) |
|
|
(790) |
|
|
— |
|
Total deferred income tax expense (benefit) |
|
|
(10,366) |
|
|
(2,394) |
|
|
11,514 |
|
Totals |
|
$ |
4,548 |
|
$ |
10,444 |
|
$ |
16,588 |
The Company’s effective tax rate, as applied to loss before income taxes, differ from federal statutory rates as follows for the years ended December 31:
|
|
|
2019 |
|
2018(1) |
|
2017(1) |
|
|
Federal statutory rate |
|
21.0 |
% |
21.0 |
% |
— |
% |
|
State taxes, net of federal benefit |
|
(10.9) |
|
1.0 |
|
(0.4) |
|
|
Foreign tax rate differential |
|
(0.9) |
|
— |
|
— |
|
|
Increase in U.S. valuation allowance |
|
(13.6) |
|
— |
|
— |
|
|
Non-controlling interest |
|
(11.5) |
|
(14.1) |
|
— |
|
|
Other miscellaneous permanent differences |
|
9.9 |
|
(0.3) |
|
— |
|
|
Remeasurement of deferred tax assets |
|
11.4 |
|
— |
|
— |
|
|
Undistributed earnings of foreign subsidiaries |
|
43.6 |
|
(2.6) |
|
(17.9) |
|
|
U.S. federal tax related to foreign effectively connected income |
|
(1.2) |
|
(0.2) |
|
(3.1) |
|
|
Mexico income tax provision |
|
(47.7) |
|
(6.3) |
|
(29.6) |
|
|
Poland income tax provision |
|
(21.8) |
|
(5.9) |
|
(29.2) |
|
|
Spain income tax provision |
|
(0.1) |
|
(3.9) |
|
(23.2) |
|
|
Other foreign tax provisions |
|
(2.4) |
|
(0.5) |
|
(1.8) |
|
|
Effective tax rate |
|
(24.2) |
% |
(11.8) |
% |
(105.2) |
% |
|
|
|
|
|
|
|
|
|
|
(1) Certain balances from the comparative prior period have been reclassified to conform to the current year presentation. |
|
||||||
100
The primary components of deferred tax items were as follows as of December 31:
|
|
|
2019 |
|
2018(2) |
||
|
|
|
(In thousands) |
||||
|
Deferred tax assets: |
|
|
|
|
|
|
|
U.S. net operating losses(1) |
|
$ |
8,897 |
|
$ |
4,499 |
|
U.S. interest limitation(1) |
|
|
2,558 |
|
|
1,591 |
|
Partnership basis adjustment(1) |
|
|
170,274 |
|
|
54,599 |
|
Other partnership basis items(1) |
|
|
18,651 |
|
|
8,253 |
|
Foreign net operating losses |
|
|
4,417 |
|
|
20,850 |
|
Foreign intangibles |
|
|
663 |
|
|
2,627 |
|
Foreign accrued expenses and other temporary differences |
|
|
7,302 |
|
|
4,330 |
|
|
|
|
212,762 |
|
|
96,749 |
|
Valuation allowance |
|
|
(8,152) |
|
|
(21,379) |
|
Deferred tax asset |
|
|
204,610 |
|
|
75,370 |
|
|
|
|
|
|
|
|
|
Deferred tax liabilities: |
|
|
|
|
|
|
|
Acquisition related intangibles |
|
|
(6,463) |
|
|
(3,811) |
|
Accrued tax on unremitted earnings |
|
|
— |
|
|
(8,399) |
|
Foreign equipment and improvements |
|
|
(5,132) |
|
|
(4,383) |
|
Deferred tax liability |
|
|
(11,595) |
|
|
(16,593) |
|
Net |
|
$ |
193,015 |
|
$ |
58,777 |
|
(1) |
U.S. jurisdiction deferred tax assets |
|
(2) |
Certain balances from the comparative prior period have been reclassified to conform to the current year presentation. |
The following table includes the valuation allowance associated with the deferred tax assets including additions recognized as expense in the consolidated statements of operations and comprehensive (loss) income for the years ended December 31, 2019, 2018, and 2017.
|
|
|
Valuation |
|
|
|
|
Allowance |
|
|
|
|
(In thousands) |
|
|
|
|
|
|
|
Beginning balance, January 1, 2017 |
|
$ |
11,534 |
|
2017 Additions, net |
|
|
4,400 |
|
December 31, 2017 |
|
|
15,934 |
|
|
|
|
|
|
2018 Additions, net |
|
|
5,445 |
|
December 31, 2018 |
|
|
21,379 |
|
|
|
|
|
|
2019 Addition for U.S. interest limitation |
|
|
2,558 |
|
2019 Additions to other deferred tax assets in foreign jurisdictions |
|
|
1,477 |
|
Reduction resulting from reassessments of available foreign net operating loss carryover |
|
|
(17,262) |
|
December 31, 2019 |
|
$ |
8,152 |
101
The following table includes the total net operating losses carryforwards by country and years which they are available to offset future taxable income as of December 31, 2019:
|
|
|
Net Operating |
|
Available |
|
|
|
|
Losses |
|
Years |
|
|
|
|
(In thousands) |
|
|
|
|
United States |
|
$ |
39,379 |
|
Indefinite |
|
Ireland |
|
|
13,026 |
|
Indefinite |
|
Gibraltar |
|
|
8,621 |
|
Indefinite |
|
Czech Republic |
|
|
4,245 |
|
2020-2024 |
|
Germany |
|
|
3,414 |
|
Indefinite |
(14)Long-Term Debt and Lines of Credit
Credit Facility
On December 22, 2016, EVO Payments International, LLC (“EPI”), a subsidiary of EVO, Inc., entered into a credit agreement (“Senior Secured Credit Facilities”). The Senior Secured Credit Facilities consisted of a first lien Senior Secured Credit Facility totaling $670.0 million (comprised of a $100.0 million revolver (“First Lien Revolver”) and a $570.0 million term loan (“First Lien Term Loan”)) and a second lien Senior Secured Credit Facility comprised of a $175.0 million term loan (“Second Lien Term Loan”).
On October 24, 2017, the Company entered into an incremental amendment agreement to upsize the existing First Lien Revolver from $100.0 million to $135.0 million. On April 3, 2018, the Company entered into a second incremental amendment agreement to the first lien Senior Secured Credit Facility, which increased the existing term loan by $95.0 million to $665.0 million. As a result of this second incremental amendment agreement, $0.9 million in existing deferred financing was recognized as debt extinguishment loss related to the significant modification of a certain lender’s commitment within the syndicate and is included within other expense in the consolidated statements of operations and comprehensive (loss) income for the year ended December 31, 2018. On May 25, 2018, the Company paid in full the Second Lien Term Loan in the amount of $178.2 million, including $1.5 million of accrued interest and $1.8 million of prepayment penalty.
On June 14, 2018, the Company entered into a restatement agreement (the “Restatement Agreement”) whereby the syndicate lenders agreed to replace their existing term loans with replacement term loans. In addition, the Restatement Agreement increased the First Lien Revolver by $65.0 million to $200.0 million and extended the maturity date of the First Lien Revolver to June 14, 2023. As a result of the Restatement Agreement, $1.2 million in existing deferred financing costs were recognized as debt extinguishment loss related to the significant modification of a certain lender’s commitment within the syndicate and is included within other expense in the consolidated statements of operations and comprehensive (loss) income as of December 31, 2018. EVO, LLC utilized the net proceeds from the September 2018 Secondary Offering to pay down the First Lien Revolver and to pay the installment payment on the First Lien Term Loan which was paid on September 27, 2018.
The Senior Secured Credit Facilities provide the Company with the capacity to support both domestic and international growth, as well as fund general operating needs. The loans under the Senior Secured Credit Facilities bear interest, at the Company’s election, at the prime rate or London Interbank Offered Rate (LIBOR), plus leverage based margin. Under the Restatement Agreement, the lenders agreed to reduce the applicable leverage based margins. As of December 31, 2019, the loans under the Senior Secured Credit Facilities had an interest rate of 6.50% for First Lien Prime Rate Revolver, 4.56% for First Lien LIBOR Revolver, and 5.06% for First Lien Term Loan. The Senior Secured Credit Facilities requires quarterly principal payments of the First Lien Term Loan of $1.6 million commencing on June 30, 2018 through September 30, 2023. The First Lien Revolver and First Lien Term Loan mature on June 14, 2023 and December 22, 2023, respectively.
102
All amounts outstanding under the Senior Secured Credit Facilities are secured by a pledge of certain assets of EPI, as well as secured guarantees provided by certain of EPI’s controlled subsidiaries. The Senior Secured Credit Facilities also contain a number of significant negative covenants. These covenants, among other things, restrict, subject to certain exceptions, EPI’s and its controlled subsidiaries ability to: incur indebtedness; create liens; engage in mergers or consolidations; make investments, loans and advances; pay dividends or other distributions and repurchase capital stock; sell assets; engage in certain transactions with affiliates; enter into sale and leaseback transactions; make certain accounting changes; and make prepayments on junior indebtedness. The first lien Senior Secured Credit Facility also contains a springing financial covenant that requires EPI to remain under a maximum consolidated leverage ratio determined on a quarterly basis.
As a result of these restrictions, substantially all of the net assets of EPI at December 31, 2019 were restricted from distribution to EVO, LLC or any of its members. The Company currently intends to retain all available funds and any future earnings for use in the operation of its business.
In addition, the Senior Secured Credit Facilities contain certain customary representations and warranties, affirmative covenants, and events of default. If an event of default occurs, the lenders under the Senior Secured Credit Facilities will be entitled to take various actions, including the acceleration of amounts due thereunder and exercise of the remedies on the collateral. As of December 31, 2019 and 2018, the Company was in compliance with all its financial covenants.
In conjunction with the acquisition of Sterling, a subsidiary of the Company agreed to a deferred purchase price of $70.0 million which accrued interest at a rate of 5% per annum and was payable in quarterly installments of $5.0 million, plus accrued and unpaid interest. In May 2018, the Company paid in full the outstanding balance of $57.4 million of the Sterling deferred purchase price, utilizing proceeds from the IPO and funds drawn from the revolving credit facility of $4.8 million.
Long-term debt, including accrued interest, consists of the following:
|
|
|
December 31, |
|
December 31, |
||
|
|
|
2019 |
|
2018 |
||
|
|
|
(In thousands) |
||||
|
First lien term loan |
|
$ |
650,891 |
|
$ |
654,775 |
|
First lien revolver |
|
|
60,987 |
|
|
42,266 |
|
Less debt issuance costs |
|
|
(9,965) |
|
|
(12,985) |
|
Total long-term debt |
|
|
701,913 |
|
|
684,056 |
|
Less current portion of long-term debt, including accrued interest of $4.1 million and $0.6 million as of December 31, 2019 and 2018, respectively |
|
|
(8,744) |
|
|
(7,191) |
|
Total long-term debt, net of current portion |
|
$ |
693,169 |
|
$ |
676,865 |
Principal payment requirements on the above obligations in each of the years remaining subsequent to December 31, 2019 are as follows:
|
|
|
|
|
|
|
|
(In thousands) |
|
|
Years ending December 31: |
|
|
|
|
2020 |
|
$ |
6,593 |
|
2021 |
|
|
6,593 |
|
2022 |
|
|
6,593 |
|
2023 |
|
|
687,983 |
|
2024 and thereafter |
|
|
— |
|
Total |
|
$ |
707,762 |
103
Settlement Lines of Credit
The Company maintains intraday and overnight facilities to fund its settlement obligations. These facilities are short-term in nature. The weighted-average interest rates on these borrowings were 4.3% and 4.5% as of December 31, 2019 and 2018, respectively. The carrying amounts of these facilities are presented net of unamortized debt issuance costs, as applicable. During the year ended December 31, 2019 and 2018, the Company’s settlement lines of credit consisted of the following:
On August 31, 2015, a subsidiary of the Company entered into an overdraft facility with Bank BGZ BNP Paribas S.A., as the lender, and Centrum Elektronicznych Uslug Platniczych eService Sp. z o. o. (“eService”), as the guarantor. The facility provides the Company with access to settlement-related funding. Under the facility, the Company can draw up to PLN 20.0 million. The loans drawn under the facility bear interest at the Warsaw Interbank Offered Rate (“WIBOR”) plus 0.7% (total drawdowns below PLN 10 million) and at WIBOR plus 1.25% (total drawdowns above PLN 10 million). As of December 31, 2018, the loan drawn under the facility was $2.9 million and the interest rate was 2.34%. The loans drawn under the facility originally had a maturity date of February 15, 2019. On February 15, 2019, the Company extended the line of credit facility until July 31, 2019 and on August 1, 2019 until October 31, 2019. The facility was terminated on October 31, 2019.
On August 31, 2015, a subsidiary of the Company entered into a line of credit facility with Banco Nacional de Mexico, S.A., as the lender, and EVO Payments Mexico, S. de RP.L. de C.V., as the beneficiary; there is no guarantor for this overnight line. The facility provides the Company with access to settlement-related funding. Under the facility, the Company can draw up to USD 10.0 million. The loans drawn under the facility bear interest at the Interbank Equilibrium Interest Rate (“TIIE”), 7.53%. The loans drawn under the facility mature on December 19, 2020. As of December 31, 2019 and 2018, there were no loans drawn under this facility.
On February 26, 2016, a subsidiary of the Company entered into a line of credit facility with Raiffeisen Bank Polska S.A., as the lender, and eService, as the guarantor. The facility provides the Company with access to settlement-related funding. Under the facility, the Company can draw up to CZK 400.0 million. The loans drawn under the facility originally had a maturity date of January 31, 2019 and bore interest at the Prague Interbank Offered Rate (“PRIBOR”) plus 0.8% for CZK, Euro Overnight Index Average (“EONIA”) plus 0.8% for EUR and LIBOR plus 0.8% for GBP and USD. At December 31, 2018, all balances were denominated in CZK resulting in an interest rate of 2.55%, and the loan amounts drawn under the facility were $14.9 million. On January 31, 2019, the Company extended the facility until January 31, 2020 and amended the margin rate to 1.0% and the maximum amount that can be drawn was increased to CZK 420.0 million. On January 30, 2020, the Company amended the facility to include the automatic annual renewals. At December 31, 2019, all balances were denominated in CZK resulting in an interest rate of 3.00% and the loan amount drawn under the facility was $11.9 million.
On June 10, 2016, a subsidiary of the Company entered into an overdraft facility with PKO Bank Polski, as the lender, and eService, as the guarantor. The facility provides the Company with access to settlement-related funding. Under the facility, the Company can draw up to CZK 239.1 million. The loans drawn under the facility bear interest at the PRIBOR plus 1.25%. The loans drawn under the facility have a maturity date of June 8, 2019. On June 8, 2019, the Company extended the facility until June 8, 2020, and the maximum amount that can be drawn was increased to CZK 300.6 million. At December 31, 2019 and 2018, the interest rates were 3.35% and 3.14%, respectively. As of December 31, 2019 and 2018, the loan amounts drawn under the facility were $6.9 million and $6.1 million, respectively.
On December 1, 2017, a subsidiary of the Company entered into a revolving line of credit facility with Deutsche Bank A.G., as the lender, and EVO, LLC, as the guarantor. The facility provides the Company with access to settlement-related funding. Under the facility, the Company can draw up to the lesser of $35.0 million or 95% of the aggregate dollar amount of eligible settlement receivables due. The loans drawn under the facility bear interest at the prime rate plus 1.5%. At December 31, 2019 and 2018, the interest rates were 6.25% and 7.00%, respectively. The loans drawn under the facility do not have a maturity date. As of December 31, 2019 and 2018, the loan amounts drawn under the facility were $2.6 million and $17.8 million, respectively.
104
On December 19, 2017, a subsidiary of the Company entered into a revolving line of credit facility with Wells Fargo Bank N.A., as the lender, and EVO, LLC, as the guarantor. The facility provides the Company with access to settlement-related funding. Under the facility, the Company can draw up to the lesser of $20.0 million or 90% of the aggregate dollar amount of eligible settlement receivables due. The loans drawn under the facility automatically renew on an annual basis. On May 29, 2018, the Company entered into an incremental amendment agreement to the facility, pursuant to which the maximum amount that can be drawn was increased to $15.0 million. On June 25, 2019, the Company entered into a second amendment agreement to the facility, pursuant to which the maximum amount that can be drawn was increased to $20.0 million. The loans drawn under the facility bear interest at the prime rate plus 1.0%. At December 31, 2019 and 2018, the interest rates were 5.75% and 6.50%, respectively. As of December 31, 2019, the loan amount drawn under the facility was $11.4 million. As of December 31, 2018, there were no loans drawn under this facility.
On September 6, 2018, a subsidiary of the Company entered into an overdraft facility with PKO Bank Polski, as the lender, and eService and EPI, as the guarantors. The facility provides the Company with access to settlement-related funding. Under the facility, the Company can draw up to CZK 100.0 million. The loans drawn under the facility bear interest at PRIBOR plus 1.5%. As of December 31, 2019 and 2018, the interest rate was 3.60% and 3.38%, respectively. The loans drawn under the facility have a maturity date of September 9, 2020. As of December 31, 2019 and 2018, the loan amounts drawn under the facility were $0.3 million and $0.1 million, respectively.
On November 12, 2018, a subsidiary of the Company entered into a revolving line of credit facility with Banco Santander, S.A., as the lender, and UniversalPay Entidad De Pago SL, as the guarantor. The facility provides the Company with access to settlement-related funding. Under the facility, the Company can draw up to €10.0 million, with certain restrictions related to the timing of such funding. The loans drawn under the facility bear a fixed interest rate of 3.00%. As of December 31, 2018, there were no loans drawn under this facility. The line was increased to €35.0 million on May 12, 2019. The facility expired on September 30, 2019.
(15) Supplemental Cash Flows Information
Supplemental cash flow disclosures and noncash investing and financing activities are as follows for the years ended December 31:
|
|
|
2019 |
|
2018 |
|
2017 |
|||
|
|
|
(In thousands) |
|||||||
|
Supplemental disclosure of cash flow data: |
|
|
|
|
|
|
|
|
|
|
Interest paid |
|
$ |
38,531 |
|
$ |
48,305 |
|
$ |
53,723 |
|
Income taxes paid |
|
|
10,860 |
|
|
7,025 |
|
|
12,305 |
|
|
|
|
|
|
|
|
|
|
|
|
Supplemental disclosure of non-cash investing and financing activities: |
|
|
|
|
|
|
|
|
|
|
Contingent consideration and acquisition holdback payable |
|
|
1,337 |
|
|
7,485 |
|
|
3,564 |
|
Contingent consideration settled with the issuance of Class A common stock |
|
|
— |
|
|
771 |
|
|
— |
|
Deferred purchase price |
|
|
— |
|
|
— |
|
|
71,200 |
|
Exchanges of Class C and Class D common stock for Class A common stock |
|
|
37,533 |
|
|
— |
|
|
— |
(16) Redeemable Non-controlling Interests
The Company owns 66% of eService, the Company’s Polish subsidiary. The eService shareholders’ agreement includes a provision whereby PKO Bank Polski has the option to compel the Company to purchase 14% of the shares of eService held by PKO Bank Polski, at a price per share based on the fair value. Commencing on January 1, 2020, PKO Bank Polski may exercise an option to sell all of its remaining shares of eService to the Company. Because the exercise of this option is not solely within the Company’s control, the Company has classified this interest as RNCI and presents the redemption value as temporary within the mezzanine equity section of the consolidated balance sheets. At each balance sheet date, the RNCI is reported at its redemption value, which
105
represents estimated fair value, with a corresponding adjustment to accumulated deficit.
As of December 31, 2019, EVO, Inc. owns 50.2% of EVO, LLC. The EVO, LLC operating agreement includes a provision whereby Blueapple may deliver a sale notice to EVO, Inc., upon receipt of which EVO, Inc. will use its commercially reasonable best efforts to pursue a public offering of shares of its Class A common stock and use the net proceeds therefrom to purchase LLC Interests from Blueapple. Upon receipt of such a sale notice, the Company may elect, at the Company’s option (determined solely by its independent directors (within the meaning of the rules of the NASDAQ stock market (“Nasdaq”)) who are disinterested), to cause EVO, LLC to instead redeem the applicable LLC Interests for cash; provided that Blueapple consents to any election by the Company to cause EVO, LLC to redeem the LLC Interests based on the fair value of the Company’s Class A common shares on such date. Because this option is not solely within the Company’s control, the Company has classified this interest as RNCI and reports the redemption value as temporary within the mezzanine equity section of the consolidated balance sheets and will be reported at redemption value, which represents fair value, with a corresponding adjustment to accumulated deficit.
The following table details the components of RNCI for the years ended December 31, 2019 and 2018:
|
|
|
|
|
|
|
|
|
|
Post-IPO |
|
Pre-IPO |
||
|
|
|
December 31, 2019 |
|
December 31 |
|
May 23, |
|||||||
|
|
|
Blueapple |
eService |
Total |
|
2018 |
|
2018 |
|||||
|
|
|
(In thousands) |
|||||||||||
|
Beginning balance |
|
$ |
885,986 |
$ |
124,107 |
$ |
1,010,093 |
|
$ |
689,569 |
|
$ |
148,266 |
|
Net income attributable to RNCI - eService |
|
|
— |
|
7,855 |
|
7,855 |
|
|
4,914 |
|
|
1,291 |
|
Net loss attributable to RNCI - Blueapple |
|
|
(14,567) |
|
— |
|
(14,567) |
|
|
(39,129) |
|
|
— |
|
Loss on OCI - eService |
|
|
— |
|
(470) |
|
(470) |
|
|
(2,368) |
|
|
(2,104) |
|
Gain (loss) on OCI - Blueapple |
|
|
242 |
|
— |
|
242 |
|
|
(3,935) |
|
|
— |
|
Loss on defined benefit plan revaluation - Blueapple |
|
|
(1) |
|
— |
|
(1) |
|
|
(192) |
|
|
— |
|
Legacy accumulated deficit allocation |
|
|
— |
|
— |
|
— |
|
|
— |
|
|
(150,485) |
|
Legacy AOCI allocation |
|
|
— |
|
— |
|
— |
|
|
— |
|
|
(39,404) |
|
Purchase of Blueapple Class B common stock in connection with secondary offerings |
|
|
(48,447) |
|
— |
|
(48,447) |
|
|
— |
|
|
— |
|
Decrease in maximum redemption amount in connection with purchase of Blueapple Class B common stock |
|
|
(2,843) |
|
— |
|
(2,843) |
|
|
— |
|
|
— |
|
Increase (decrease) in the maximum redemption amount of RNCI: |
|
|
|
|
|
|
|
|
|
|
|
|
|
|
eService |
|
|
— |
|
28,173 |
|
28,173 |
|
|
(19,741) |
|
|
— |
|
Blueapple |
|
|
93,845 |
|
— |
|
93,845 |
|
|
374,616 |
|
|
735,775 |
|
Allocation of eService fair value RNCI adjustment to Blueapple |
|
|
(11,957) |
|
— |
|
(11,957) |
|
|
8,739 |
|
|
— |
|
Distributions - eService |
|
|
— |
|
(9,475) |
|
(9,475) |
|
|
(2,380) |
|
|
(3,770) |
|
Ending balance |
|
$ |
902,258 |
$ |
150,190 |
$ |
1,052,448 |
|
$ |
1,010,093 |
|
$ |
689,569 |
106
(17)Fair Value
The table below presents information about items, which are carried at fair value on a recurring basis:
|
|
|
December 31, 2019 |
||||||||||
|
|
|
(In thousands) |
||||||||||
|
|
|
Level 1 |
|
Level 2 |
|
Level 3 |
|
Total |
||||
|
|
|
|
|
|
|
|
|
|
|
|
|
|
|
Cash equivalents |
|
$ |
7,715 |
|
$ |
— |
|
$ |
— |
|
$ |
7,715 |
|
Contingent consideration |
|
|
— |
|
|
— |
|
|
(2,300) |
|
|
(2,300) |
|
Blueapple RNCI |
|
|
(902,258) |
|
|
— |
|
|
— |
|
|
(902,258) |
|
eService RNCI |
|
|
— |
|
|
— |
|
|
(150,190) |
|
|
(150,190) |
|
Total |
|
$ |
(894,543) |
|
$ |
— |
|
$ |
(152,490) |
|
$ |
(1,047,033) |
|
|
|
December 31, 2018 |
||||||||||
|
|
|
(In thousands) |
||||||||||
|
|
|
Level 1 |
|
Level 2 |
|
Level 3 |
|
Total |
||||
|
|
|
|
|
|
|
|
|
|
|
|
|
|
|
Cash equivalents |
|
$ |
106,164 |
|
$ |
— |
|
$ |
— |
|
$ |
106,164 |
|
Contingent consideration |
|
|
— |
|
|
— |
|
|
(8,189) |
|
|
(8,189) |
|
Blueapple RNCI |
|
|
(885,986) |
|
|
— |
|
|
— |
|
|
(885,986) |
|
eService RNCI |
|
|
— |
|
|
— |
|
|
(124,107) |
|
|
(124,107) |
|
Total |
|
$ |
(779,822) |
|
$ |
— |
|
$ |
(132,296) |
|
$ |
(912,118) |
Cash equivalents consist of a money market fund that is valued using a market price in an active market (Level 1). Level 1 instrument valuations are obtained from real‑time quotes for transactions in active exchange markets involving identical assets.
Contingent consideration relates to potential payments that the Company may be required to make associated with acquisitions. To the extent that the valuation of these liabilities are based on inputs that are less observable or not observable in the market, the determination of fair value requires more judgment. Accordingly, the degree of judgment exercised in determining fair value is greatest for measures categorized in Level 3.
The fair value of eService’s RNCI is determined utilizing an income approach, weighted at 75%, based on the forecasts of expected future cash flows, and the market approach, weighted at 25%, based on the guideline public company data. In applying the income approach, significant unobservable inputs included the Weighted-Average Cost of Capital (“WACC”) used to discount the future cash flows, which was 14.0%, based on the markets in which the business operates and growth rates used within the future cash flows, which were between 3.0% and 10.0%, based on historic trends, current and expected market conditions, and management’s forecast assumptions. A future increase in the WACC would result in a decrease in the fair value of RNCI in eService.
The fair value of Blueapple’s RNCI is derived from the closing stock price of the Company’s Class A common stock on the last day of the period.
The estimated fair value of receivables, settlement processing assets and obligations, due to and from related parties, and settlement lines of credit approximate their respective carrying values due to their short term nature. The estimated fair value of total long-term debt, which approximates its carrying value, is based on quoted bid-ask spreads within the lender syndicate (Level 2).
107
(18)Commitments and Contingencies
Litigation
The Company is party to various claims and lawsuits incidental to its business. The Company does not believe the ultimate outcome of such matters, individually or in the aggregate, will have a material adverse effect on the Company’s financial position, results of operations or cash flows.
(19)Segment Information
Information on segments and reconciliations to revenue and net loss attributable to the shareholders of EVO, Inc. and members of EVO, LLC are set forth below. Segment profit, which is the measure used by our chief operating decision maker to evaluate the performance of and allocate resources to our segments, is calculated as segment revenue less (1) segment expenses, plus (2) segment income from unconsolidated investees, plus (3) segment other income, net, less (4) segment non-controlling interests.
Certain corporate-wide governance functions, as well as depreciation and amortization, are not allocated to our segments. The Company does not evaluate performance or allocate resources based on segment assets, and therefore, such information is not presented.
|
|
|
Year Ended December 31, |
|||||||
|
|
|
2019 |
|
2018 |
|
2017 |
|||
|
|
|
(In thousands) |
|||||||
|
Segment revenue: |
|
|
|
|
|
|
|
|
|
|
Americas |
|
$ |
303,840 |
|
$ |
320,481 |
|
$ |
299,034 |
|
Europe |
|
|
181,938 |
|
|
244,273 |
|
|
205,716 |
|
Revenue |
|
$ |
485,778 |
|
$ |
564,754 |
|
$ |
504,750 |
|
|
|
|
|
|
|
|
|
|
|
|
Segment profit: |
|
|
|
|
|
|
|
|
|
|
Americas |
|
$ |
96,587 |
|
$ |
85,377 |
|
$ |
82,759 |
|
Europe |
|
|
55,319 |
|
|
61,195 |
|
|
54,842 |
|
Total segment profit |
|
|
151,906 |
|
|
146,572 |
|
|
137,601 |
|
Corporate |
|
|
(34,482) |
|
|
(41,431) |
|
|
(25,732) |
|
Depreciation and amortization |
|
|
(92,059) |
|
|
(87,184) |
|
|
(74,136) |
|
Net interest expense |
|
|
(41,139) |
|
|
(57,540) |
|
|
(61,387) |
|
Provision for income tax expense |
|
|
(4,548) |
|
|
(10,444) |
|
|
(16,588) |
|
Share-based compensation expense |
|
|
(10,921) |
|
|
(55,519) |
|
|
— |
|
Net loss attributable to EVO Investco, LLC |
|
|
|
|
|
|
|
$ |
(40,242) |
|
Net loss attributable to non-controlling interests of EVO Investco, LLC |
|
|
(21,138) |
|
|
(90,834) |
|
|
|
|
Net loss attributable to EVO Payments, Inc. |
|
$ |
(10,105) |
|
$ |
(14,712) |
|
|
|
|
|
|
|
|
|
|
|
|
|
|
|
Capital expenditures: |
|
|
|
|
|
|
|
|
|
|
Americas |
|
$ |
19,973 |
|
$ |
18,901 |
|
$ |
13,893 |
|
Europe |
|
|
16,835 |
|
|
29,850 |
|
|
28,128 |
|
Consolidated total capital expenditures |
|
$ |
36,808 |
|
$ |
48,751 |
|
$ |
42,021 |
108
Revenue from external customers is attributed to individual countries based on the location where the relationship is managed. For the year ended December 31, 2019, revenue from external customers in the United States, Mexico, and Poland, as a percentage of revenue, was 40.2%, 20.1%, and 17.8%, respectively. For the year ended December 31, 2018, revenue from external customers in the United States, Poland and Mexico, as a percentage of revenue, was 36.1%, 24.1%, and 20.1%, respectively. For the year ended December 31, 2017, revenue from external customers in the United States, Poland and Mexico, as a percentage of revenue, was 37.9%, 21.5%, and 20.4%, respectively. For the years ended December 31, 2019, 2018, and 2017, there is no one customer that represents more than 10% of total revenue.
(20)Shareholders’ Equity
EVO, Inc. is a holding company and its principal asset is the LLC Interests in EVO, LLC. As the sole managing member of EVO, LLC, the Company operates and controls all of the business and affairs of EVO, LLC and its subsidiaries. The Company has the sole voting interest in, and controls the management of, EVO, LLC. Therefore, EVO, Inc. has consolidated the financial results of EVO, LLC and its subsidiaries.
The Company has four classes of common stock outstanding: Class A common stock, Class B common stock (classified as redeemable non-controlling interest), Class C common stock (classified as non-redeemable non-controlling interest) and Class D common stock (classified as non-redeemable non-controlling interest). The voting and economic rights associated with our classes of common stock are summarized in the following table:
|
Class of Common Stock |
|
Holders |
|
Voting rights* |
|
Economic rights |
|
|
|
|
|
|
|
|
|
Class A common stock |
|
Public, MDP, Executive Officers, and Current and Former Employees |
|
One vote per share |
|
Yes |
|
Class B common stock |
|
Blueapple |
|
15.9% |
|
No |
|
Class C common stock |
|
Executive Officers |
|
3.5 votes per share, subject to aggregate cap |
|
No |
|
Class D common stock |
|
MDP and Current and Former Employees |
|
One vote per share |
|
No |
*Subject to certain ownership requirements, on the third anniversary of the consummation of the IPO the voting rights of our Class B common stock will cease and each share of our Class C common stock will automatically convert into a share of our Class D common stock.
Blueapple has a sale right under the EVO LLC Agreement that provides that, upon the receipt of a sale notice from Blueapple, the Company will use its commercially reasonable best efforts to pursue a public offering of shares of Class A common stock and use the net proceeds therefrom to purchase LLC Interests from Blueapple. Upon the Company’s receipt of such a sale notice, the Company may elect, at its option (determined solely by its independent directors (within the meaning of the rules of Nasdaq) who are disinterested), to cause EVO LLC to instead redeem the applicable LLC Interests for cash; provided that Blueapple consents to any election by the Company to cause EVO LLC to redeem the LLC Interests.
109
Continuing LLC Owners (other than Blueapple) have an exchange right providing that, upon receipt of an exchange notice from such Continuing LLC Owners, the Company will exchange the applicable LLC Interests from such Continuing LLC Owners for newly issued shares of its Class A common stock on a one-for-one basis pursuant to the Exchange Agreement. Upon its receipt of such an exchange notice, the Company may elect, at its option (determined solely by its independent directors (within the meaning of the rules of Nasdaq) who are disinterested), to cause EVO, LLC to instead redeem the applicable LLC Interests for cash; provided that such Continuing LLC Owners consents to any election by the Company to cause EVO, LLC to redeem the LLC Interests. In the event that Continuing LLC Owners do not consent to an election by the Company to cause EVO, LLC to redeem the LLC Interests, the Company is required to exchange the applicable LLC Interests for newly issued shares of Class A common stock.
If the Company elects to cause EVO, LLC to redeem LLC Interests in lieu of exchanging LLC Interests for newly issued shares of its Class A common stock, the Company will offer the other Continuing LLC Owners the right to have their respective LLC Interests redeemed in an amount up to such person’s pro rata share of the aggregate LLC Interests to be redeemed. The Company is not required to redeem any LLC Interests from Blueapple or any other Continuing LLC Owners in response to a sale notice from Blueapple if the Company elects to pursue, but is unable to complete, a public offering of shares of its Class A common stock.
Continuing LLC Owners also hold certain registration rights pursuant to a registration rights agreement. MDP holds demand registration rights that require the Company to register shares of Class A common stock held by it, including any Class A common stock received upon its exchange of Class A common stock for its LLC Interests. All Continuing LLC Owners (other than Blueapple) hold customary piggyback registration rights, which includes the right to participate on a pro rata basis in any public offering the Company conducts in response to its receipt of a sale notice from Blueapple. Blueapple also has the right, in connection with any public offering the Company conducts (including any offering conducted as a result of an exercise by MDP of its registration rights), to request that the Company uses its commercially reasonable best efforts to pursue a public offering of shares of its Class A common stock and use the net proceeds therefrom to purchase a like amount of Blueapple’s LLC Interests.
(21)Stock Compensation Plans and Share-Based Compensation Awards
The Company provides share-based compensation awards to its employees under the 2018 Omnibus Equity Incentive Plan (the “2018 Plan”), which the Company adopted in conjunction with its IPO. The 2018 Plan became effective on May 22, 2018. As of the effective date of the 2018 Plan, a total of 7,792,162 shares of the Company’s Class A common stock were reserved for issuance. The 2018 Plan provides for accelerated vesting under certain conditions.
The following table summarizes share-based compensation expense, and the related income tax benefit recognized for share-based compensation awards. Share-based compensation expense is presented within selling, general, and administrative expenses within the consolidated statements of operations and comprehensive (loss) income:
|
|
|
Year Ended December 31, |
|||||||
|
|
|
2019 |
|
2018 |
|
2017 |
|||
|
|
|
(In thousands) |
|||||||
|
Share-based compensation expense |
|
$ |
10,921 |
|
$ |
55,519 |
|
|
N/A |
|
Income tax benefit |
|
$ |
(987) |
|
$ |
(3,347) |
|
|
N/A |
Class D awards
The Company modified the Class D awards in connection with the IPO whereby all vesting conditions were waived,
including performance and service vesting conditions. On the modification date, the Company recorded share-based
110
compensation expense based on the modification date fair value of $16.00 per share. As a result, share-based compensation expense of $42.8 million was recognized for the year ended December 31, 2018, which represented the vesting of all 2,672,666 awarded shares. Prior to the consummation of the IPO, no liquidity event was probable and as such no share-based compensation expense had previously been recognized for these awards. On the modification date there were 15 employees or former employees who held Class D awards.
Unit appreciation rights/Restricted stock awards
The Company assumed EVO, LLC’s obligations under the EVO, LLC Unit Appreciation Rights Plan (“UAR Plan”) and converted all of the outstanding UARs held by members of management and current and former employees at the consummation of the IPO to restricted Class A common stock (“RSAs”). In connection with the Company’s assumption of EVO, LLC’s obligation under the UAR Plan and the issuance of the RSAs, on the IPO date, the Company recorded share-based compensation expense based on the modification date fair value of the RSAs of $16.00 per share. The Company recognized share-based compensation expense related to RSAs of $0.3 million and $9.2 million, respectively, for the years ended December 31, 2019 and 2018. Prior to the consummation of the IPO, no liquidity event was probable and, as such, no share-based compensation expense had been recognized for these awards. On the modification date, there were 35 members of management and current and former employees who held UARs.
A summary of RSAs activity is as follows (in thousands, except per share data):
|
|
|
Number of RSAs |
|
Weighted-average grant date fair value |
|
|
|
|
|
|
|
|
|
Balance at December 31, 2017 |
|
— |
|
$ |
— |
|
Granted |
|
607 |
|
|
16.00 |
|
Vested |
|
(564) |
|
|
16.00 |
|
Forfeited |
|
(1) |
|
|
16.00 |
|
Balance at December 31, 2018 |
|
42 |
|
$ |
16.00 |
|
Granted |
|
— |
|
|
— |
|
Vested |
|
(32) |
|
|
16.00 |
|
Forfeited |
|
(2) |
|
|
16.00 |
|
Balance at December 31, 2019 |
|
8 |
|
$ |
16.00 |
As of December 31, 2019 and 2018, total unrecognized share-based compensation expense related to outstanding RSAs was less than $0.1 million and $0.3 million. The total fair value of shares vested during the years ended December 31, 2019 and 2018, was $0.5 million and $9.0 million, respectively.
Restricted stock units
The Company recognized share-based compensation expense for RSUs granted of $4.8 million and $1.4 million, respectively, for the years ended December 31, 2019 and 2018.
111
A summary of RSUs activity is as follows (in thousands, except per share data):
|
|
|
Number of RSUs |
|
Weighted-average grant date fair value |
|
|
|
|
|
|
|
|
|
Balance at December 31, 2017 |
|
— |
|
$ |
— |
|
Granted |
|
527 |
|
|
16.29 |
|
Vested |
|
— |
|
|
— |
|
Forfeited |
|
(21) |
|
|
16.00 |
|
Balance at December 31, 2018 |
|
506 |
|
$ |
16.30 |
|
Granted |
|
550 |
|
|
26.28 |
|
Vested |
|
(140) |
|
|
16.37 |
|
Forfeited |
|
(40) |
|
|
22.01 |
|
Balance at December 31, 2019 |
|
876 |
|
$ |
22.30 |
As of December 31, 2019 and 2018, total unrecognized share-based compensation expense related to outstanding RSUs was $15.6 million and $6.9 million. Each RSU vests in equal annual vesting installments over a period of four years from the grant date and will settle in Class A common stock. The weighted-average remaining vesting period over which expense will be recognized for unvested RSUs is 2.9 years as of December 31, 2019 and 3.3 years as of December 31, 2018. The total fair value of shares vested during the year ended December 31, 2019 was $2.3 million. No RSUs vested during the year ended December 31, 2018.
Stock options
The Company recognized share-based compensation expense for the stock options granted of $5.8 million and $2.1 million, for the years ended December 31, 2019 and 2018.
A summary of stock option activity is as follows (in thousands, except per share and term data):
|
|
|
Number of Options |
|
Weighted-average grant date fair value |
|
Weighted-average exercise price |
|
Weighted-average remaining contractual term |
|
Total Intrinsic Value |
||||||
|
|
|
|
|
|
|
|
|
|
|
|
|
|
|
|
||
|
Balance at December 31, 2017 |
|
— |
|
$ |
— |
|
$ |
— |
|
|
|
|
|
|
||
|
Granted |
|
2,179 |
|
|
7.06 |
|
|
16.93 |
|
|
|
|
|
|
||
|
Forfeited |
|
(93) |
|
|
6.68 |
|
|
16.00 |
|
|
|
|
|
|
||
|
Exercised |
|
— |
|
|
— |
|
|
— |
|
|
|
|
$ |
— |
||
|
Balance at December 31, 2018 |
|
2,086 |
|
$ |
6.77 |
|
$ |
16.22 |
|
|
9.41 |
|
$ |
17,631 |
||
|
Granted |
|
1,485 |
|
|
9.46 |
|
|
26.27 |
|
|
|
|
|
|
||
|
Forfeited |
|
(140) |
|
|
8.11 |
|
|
20.99 |
|
|
|
|
|
|
||
|
Exercised |
|
(62) |
|
|
6.78 |
|
|
16.25 |
|
|
|
|
|
785 |
||
|
Balance at December 31, 2019 |
3,369 |
$ |
7.90 |
$ |
20.46 |
8.77 |
$ |
20,312 |
||||||||
|
|
|
|
|
|
|
|
|
|
|
|
|
|
|
|
||
|
Exercisable at December 31, 2019 |
|
448 |
|
$ |
6.75 |
|
$ |
16.17 |
|
|
8.40 |
|
$ |
4,585 |
||
112
As of December 31, 2019 and 2018, total unrecognized share-based compensation expense related to unvested stock options was $19.1 million and $12.0 million. The weighted-average remaining vesting period over which expense will be recognized for unvested stock options is 2.8 years in 2019 and 3.4 years in 2018. Each stock option vests in equal annual installments over a period of four years from grant date, and stock options expire no later than 10 years from the date of grant. For the purpose of calculating share-based compensation expense, the fair value of the stock option grants was determined through the application of the Black-Scholes model with the following assumptions:
|
|
|
Year Ended December 31, |
||||||||||
|
|
|
2019 |
|
2018 |
||||||||
|
|
|
|
|
|
|
|
|
|
|
|
|
|
|
Expected life (in years) |
|
|
7.00 |
|
|
7.00 | ||||||
|
Weighted-average risk-free interest rate |
|
|
2.44% |
|
|
3.02% | ||||||
|
Expected volatility |
|
|
29.04% |
|
|
33.98% | ||||||
|
Dividend yield |
|
|
0.00% |
|
|
0.00% | ||||||
|
Weighted-average fair value at grant date |
|
$ |
9.46 |
|
$ |
7.06 | ||||||
The risk-free interest rate is based on the yield of a zero coupon United States Treasury security with a maturity equal to the expected life of the stock option from the date of the grant. The assumption for expected volatility is based on the historical volatility of a peer group of market participants as the Company has limited historical volatility. It is the Company’s intent to retain all profits for the operations of the business for the foreseeable future, as such the dividend yield assumption is zero. The Company applied the simplified method in determining the expected life of the stock options as the Company has limited historical basis upon which to determine historical exercise periods. The Company based the assumptions of the expected term of the options as the vesting period plus half of the remaining life through expiration. All stock options exercised will be settled in Class A common stock.
(22)Employee Benefit Plans
The Company maintains retirement plans for employees in various countries where the Company maintains an office. Each plan is subject to allowable contributions and limitations based on local country laws and regulations covering retirement plans. In each location and plan, the Company, at its discretion, may contribute to the plan and, depending on location, the Company may match a percentage of the employee contributions. The Company’s contributions are vested over time, at different rates depending on location. The Company incurred a contribution expense of $1.8 million, $1.6 million, and $1.3 million for the years ended December 31, 2019, 2018 and 2017, respectively.
113
(23)Selected Quarterly Financial Data (Unaudited)
The following tables sets forth certain unaudited quarterly results of operations for 2019 and 2018 (in thousands, except per share data):
|
|
|
Three Months Ended |
|||||||||||
|
|
|
March 31, 2019 |
|
June 30, 2019 |
|
September 30, 2019 |
|
December 31, 2019 |
|||||
|
Revenue(2) |
|
$ |
111,518 |
|
$ |
122,517 |
|
$ |
122,363 |
|
$ |
129,380 |
|
|
(Loss) income from operations |
|
|
(8,364) |
|
|
8,596 |
|
|
7,758 |
|
|
8,337 |
|
|
Net (loss) income |
|
|
(19,019) |
|
|
3,827 |
|
|
(5,004) |
|
|
(3,170) |
|
|
Net (loss) income attributable to EVO |
|
|
(5,290) |
|
|
463 |
|
|
(1,844) |
|
|
(3,434) |
|
|
(Loss) earnings per share(1) |
|
|
|
|
|
|
|
|
|
|
|
|
|
|
Basic |
|
|
(0.20) |
|
|
0.01 |
|
|
(0.05) |
|
|
(0.09) |
|
|
Diluted |
|
|
(0.20) |
|
|
0.01 |
|
|
(0.05) |
|
|
(0.09) |
|
|
|
|
|
|
|
|
|
|
|
|
|
|
|
|
|
|
|
Three Months Ended |
|||||||||||
|
|
|
March 31, 2018 |
|
June 30, 2018 |
|
September 30, 2018 |
|
December 31, 2018 |
|||||
|
Revenue(2) |
|
$ |
128,282 |
|
$ |
140,891 |
|
$ |
144,758 |
|
$ |
150,823 |
|
|
Income (loss) from operations |
|
|
4,269 |
|
|
(45,973) |
|
|
9,519 |
|
|
(5,600) |
|
|
Net loss |
|
|
(15,025) |
|
|
(40,667) |
|
|
(23,878) |
|
|
(19,280) |
|
|
Net income (loss) attributable to EVO |
|
|
|
|
|
16,713 |
|
|
(27,389) |
|
|
(4,036) |
|
|
Earnings (loss) per share(1) |
|
|
|
|
|
|
|
|
|
|
|
|
|
|
Basic |
|
|
|
|
|
0.97 |
|
|
(1.51) |
|
|
(0.16) |
|
|
Diluted |
|
|
|
|
|
0.96 |
|
|
(1.51) |
|
|
(0.16) |
|
|
(1) |
The sum of the quarterly earnings per share amounts may not equal the full year amount reported since per share amounts are computed independently for each quarter and for the full year based upon the respective weighted-average common shares outstanding and other dilutive potential common shares for each respective period. |
|
(2) |
Revenue for the reporting period beginning in 2019 is presented under Accounting Standards Update (“ASC”) 2014-19, Revenue From Contracts With Customers (“ASC 606”), while prior period revenue continues to be reported in accordance with the Company’s historic accounting practices under previous guidance. Refer to Note 1, “Description of Business and Summary of Significant Accounting Policies”, section (l) Revenue Recognition, in the notes to the accompanying consolidated financial statements for further discussions of the adoption of ASC 606. |
114
SCHEDULE I – CONDENSED FINANCIAL INFORMATION OF REGISTRANT
EVO PAYMENTS, INC.
(Parent Company Only)
Condensed Statements of Balance Sheets
(In thousands)
|
|
|
December 31, |
|
December 31, |
||
|
|
|
2019 |
|
2018 |
||
|
Assets |
|
|
|
|
|
|
|
Due from related parties |
|
$ |
1,518 |
|
$ |
— |
|
Other current assets |
|
|
75 |
|
|
— |
|
Total current assets |
|
|
1,593 |
|
|
— |
|
Deferred tax asset, net |
|
|
197,822 |
|
|
68,941 |
|
Other |
|
|
106 |
|
|
— |
|
Total assets |
|
$ |
199,521 |
|
$ |
68,941 |
|
|
|
|
|
|
|
|
|
Liabilities and Shareholders' Deficit |
|
|
|
|
|
|
|
Accrued expenses |
|
$ |
1,817 |
|
$ |
— |
|
Total current liabilities |
|
|
1,817 |
|
|
— |
|
Tax receivable agreement obligations, inclusive of related party liability of $141.1 million and $40.7 million at December 31, 2019 and 2018, respectively. |
|
|
150,274 |
|
|
47,221 |
|
Net deficit in investment in a subsidiary |
|
|
636,623 |
|
|
70,328 |
|
Other long-term liabilities |
|
|
106 |
|
|
— |
|
Total liabilities |
|
|
788,820 |
|
|
117,549 |
|
|
|
|
|
|
|
|
|
Shareholders' deficit: |
|
|
|
|
|
|
|
Class A common stock (par value, $0.0001 per share), Authorized - 200,000,000 shares, Issued and Outstanding - 41,233,954 and 26,025,189 shares at December 31, 2019 and 2018, respectively. |
|
|
4 |
|
|
3 |
|
Class B common stock (par value, $0.0001 per share), Authorized - 40,000,000 shares, Issued and Outstanding - 34,163,538 and 35,913,538 shares at December 31, 2019 and 2018, respectively. |
|
|
3 |
|
|
4 |
|
Class C common stock (par value, $0.0001 per share), Authorized - 4,000,000 shares, Issued and Outstanding - 2,321,955 and 2,461,055 shares at December 31, 2019 and 2018, respectively. |
|
|
— |
|
|
— |
|
Class D common stock (par value, $0.0001 per share), Authorized - 32,000,000 shares, Issued and Outstanding - 4,354,978 and 16,785,552 shares at December 31, 2019 and 2018, respectively. |
|
|
— |
|
|
1 |
|
Additional paid-in capital |
|
|
— |
|
|
178,176 |
|
Accumulated deficit |
|
|
(587,358) |
|
|
(223,799) |
|
Accumulated other comprehensive loss |
|
|
(1,948) |
|
|
(2,993) |
|
Total deficit |
|
|
(589,299) |
|
|
(48,608) |
|
Total liabilities and deficit |
|
$ |
199,521 |
|
$ |
68,941 |
See accompanying notes to condensed financial statements.
115
SCHEDULE I – CONDENSED FINANCIAL INFORMATION OF REGISTRANT
EVO PAYMENTS, INC.
(Parent Company Only)
Condensed Statements of Operations and Comprehensive (Loss) Income
(In thousands)
|
|
|
Year Ended December 31, |
|||||||
|
|
|
2019 |
|
2018 |
|
2017 |
|||
|
Net revenue |
|
$ |
— |
|
$ |
— |
|
$ |
— |
|
Operating expenses: |
|
|
|
|
|
|
|
|
|
|
Cost of services and products |
|
|
— |
|
|
— |
|
|
2 |
|
Selling, general and administrative |
|
|
6,903 |
|
|
8,107 |
|
|
1,308 |
|
Total operating expenses |
|
|
6,903 |
|
|
8,107 |
|
|
1,310 |
|
Loss from operations |
|
|
(6,903) |
|
|
(8,107) |
|
|
(1,310) |
|
Other (expense) income: |
|
|
|
|
|
|
|
|
|
|
Interest expense |
|
|
— |
|
|
— |
|
|
(211) |
|
Loss from investment in unconsolidated investee |
|
|
(12,180) |
|
|
(45,060) |
|
|
(38,635) |
|
Other income (expense) |
|
|
8,362 |
|
|
7,095 |
|
|
(36) |
|
Total other expense |
|
|
(3,818) |
|
|
(37,965) |
|
|
(38,882) |
|
Loss before income taxes |
|
|
(10,721) |
|
|
(46,072) |
|
|
(40,192) |
|
Income tax benefit (expense) |
|
|
616 |
|
|
6,709 |
|
|
(50) |
|
Net loss |
|
|
|
|
|
(39,363) |
|
$ |
(40,242) |
|
Net loss attributable to EVO Payments, Inc. |
|
$ |
(10,105) |
|
$ |
(14,712) |
|
|
|
|
|
|
|
|
|
|
|
|
|
|
|
Comprehensive (loss) income: |
|
|
|
|
|
|
|
|
|
|
Net loss |
|
$ |
(10,105) |
|
$ |
(39,363) |
|
$ |
(40,242) |
|
Unrealized (loss) gain on defined benefit pension plan, net of tax(1) |
|
|
(2) |
|
|
(59) |
|
|
530 |
|
Unrealized gain (loss) on foreign currency translation adjustment, net of tax(2) |
|
|
810 |
|
|
(8,599) |
|
|
59,255 |
|
Other comprehensive income (loss) |
|
|
808 |
|
|
(8,658) |
|
|
59,785 |
|
Comprehensive (loss) income |
|
|
(9,297) |
|
|
(48,021) |
|
$ |
19,543 |
|
Comprehensive loss attributable to EVO Payments, Inc. |
|
$ |
(9,297) |
|
$ |
(17,026) |
|
|
|
|
(1) |
Net of tax benefit of less than $0.1 million for each of the years ended December 31, 2019 and 2018. |
|
(2) |
Net of tax expense of $0.2 million and benefit of $0.7 million for the years ended December 31, 2019 and 2018, respectively. |
See accompanying notes to condensed financial statements.
116
SCHEDULE I – CONDENSED FINANCIAL INFORMATION OF REGISTRANT
EVO PAYMENTS, INC.
(Parent Company Only)
Condensed Statements of Cash Flows
(In thousands)
|
|
|
Year Ended December 31, |
|||||||
|
|
|
2019 |
|
2018 |
|
2017 |
|||
|
|
|
|
|
|
|
|
|
|
|
|
Cash flows from operating activities: |
|
|
|
|
|
|
|
|
|
|
Change in operating assets and liabilities, net |
|
|
— |
|
|
— |
|
|
(4,369) |
|
Net cash used in operating activities |
|
|
— |
|
|
— |
|
|
(4,369) |
|
Cash flows from investing activities: |
|
|
|
|
|
|
|
|
|
|
Investment in unconsolidated investee |
|
|
(18,175) |
|
|
(225,672) |
|
|
— |
|
Net cash used in investing activities |
|
|
(18,175) |
|
|
(225,672) |
|
|
— |
|
Cash flows from financing activities: |
|
|
|
|
|
|
|
|
|
|
Repayments of long-term debt |
|
|
— |
|
|
— |
|
|
(65,208) |
|
IPO Proceeds, net of underwriter fees |
|
|
— |
|
|
231,500 |
|
|
— |
|
Proceeds from secondary offerings(1) |
|
|
381,619 |
|
|
190,894 |
|
|
— |
|
Purchase of LLC Interests, Class B common stock, and Class D common stock in connection with the secondary offerings(1) |
|
|
(362,635) |
|
|
(165,927) |
|
|
— |
|
Cash received from option exercises |
|
|
1,010 |
|
|
— |
|
|
— |
|
Repurchases of shares to satisfy minimum tax withholding |
|
|
(1,819) |
|
|
(795) |
|
|
— |
|
Contributions by members |
|
|
— |
|
|
— |
|
|
71,250 |
|
Distribution to members |
|
|
— |
|
|
— |
|
|
(1,726) |
|
Net cash provided by financing activities |
|
|
18,175 |
|
|
255,672 |
|
|
4,316 |
|
Effect of exchange rate changes on cash and cash equivalents |
|
|
— |
|
|
— |
|
|
— |
|
Net decrease in cash and cash equivalents |
|
|
— |
|
|
— |
|
|
(53) |
|
Cash and cash equivalents, beginning of year |
|
|
— |
|
|
— |
|
|
180 |
|
Cash and cash equivalents, end of year |
|
$ |
— |
|
$ |
— |
|
$ |
127 |
(1) For the year ended December 31, 2019, Proceeds from the secondary offerings and Purchase of LLC Interests, Class B common stock, and Class D common stock in connection with the secondary offerings refers to the sale of Class A common stock and the purchase of an equivalent number of LLC Interests and shares of Class D and Class B common stock in connection with the April 2019 Secondary Offering, the August 2019 Secondary Offering, and the December 2019 Secondary Offering. For the year ended December 31, 2018, Proceeds from the secondary offerings and Purchase of LLC Interests, Class B common stock, and Class D common stock in connection with the secondary offerings refers to the sale of Class A common stock and the purchase of an equivalent number of LLC Interests and shares of Class D common stock in connection with the September 2018 Secondary Offering.
See accompanying notes to condensed financial statements.
117
SCHEDULE I – CONDENSED FINANCIAL INFORMATION OF REGISTRANT
EVO PAYMENTS, INC.
(Parent Company Only)
Notes to the Condensed Financial Statements
(1)Basis of Presentation
EVO Payments, Inc. (“EVO, Inc.,” or the “Parent Company”) is a Delaware corporation whose value is driven by its ownership of approximately 50.2% of the membership interests of EVO Investco, LLC (“EVO, LLC”) as of December 31, 2019. EVO, Inc. was incorporated on April 20, 2017 for the purpose of completing a series of reorganization transactions (the “Reorganization Transactions”), in order to consummate the initial public offering of EVO, Inc.’s Class A common stock (the “IPO”), and to carry on the business of EVO, LLC. The accompanying condensed parent company-only financial statements are required in accordance with Rule 5-04 of Regulation S-X. These condensed financial statements have been presented on a standalone basis for EVO Payments, Inc. The condensed financial statements of EVO Payments, Inc. reflect the historical results of operations and the financial position of EVO, Inc., commencing on May 23, 2018. Prior to May 23, 2018, the condensed financial statements included herein represent the financial statements of EVO, LLC on a standalone basis.
EVO, Inc. is a holding company that does not conduct any business operations of its own and therefore its assets consist primarily of investments in subsidiaries. In the ordinary course of business, EVO, Inc. will incur certain expenses which are paid on behalf of EVO, Inc. by EVO, LLC and recognized as guaranteed payments in other income. Additionally, EVO, Inc. anticipates the settlement of certain future tax liabilities will require future distributions from EVO, LLC. EVO, Inc. may not be able to access cash generated by its subsidiaries in order to fulfill cash commitments or to pay cash dividends on its common stock. The amounts available to EVO, Inc. to fulfill cash commitments or to pay cash dividends are also subject to the covenants and distribution restrictions in its subsidiaries’ loan agreements. For a discussion on the tax receivable agreements, see Note 5, “Tax Receivable Agreement”, in the notes to the accompanying consolidated financial statements. Net loss attributable to EVO Payments, Inc. and comprehensive loss attributable to EVO Payments, Inc. represent the amount of loss and comprehensive loss attributable to EVO, Inc. exclusive of losses incurred prior to the Reorganization Transactions, which is allocable to EVO, LLC and, therefore, the members of EVO, LLC. This loss has been excluded from net loss attributable to EVO Payments, Inc. as EVO, Inc. was not a member of EVO, LLC prior to the Reorganization Transactions.
For the purposes of this condensed financial information, the Parent Company’s investment in its consolidated subsidiary is presented under the equity method of accounting. Under the equity method, investment in its subsidiary is stated at cost plus contributions and equity in undistributed income (loss) of subsidiary less distributions received. As of December 31, 2019 and 2018, the Parent Company’s investment in EVO, LLC was in a net deficit due to the accumulation of net losses to date, therefore it is presented as a liability on the condensed balance sheet. The Parent Company financial statements should be read in conjunction with the Company's consolidated financial statements appearing in this Annual Report on Form 10-K.
(2)Distributions
There were no distributions made to EVO, Inc. from EVO, LLC or its subsidiaries, for the years ended December 31, 2019, 2018, and 2017.
118
SCHEDULE I – CONDENSED FINANCIAL INFORMATION OF REGISTRANT
EVO PAYMENTS, INC.
(Parent Company Only)
Notes to the Condensed Financial Statements
(3)Long-term debt and credit facilities
As of December 31, 2019 and 2018, EVO, Inc. held no debt. Certain subsidiaries of the Company are subject to debt agreements. The subsidiaries’ long-term debt, including accrued interest, consists of the following:
|
December 31, |
||||||
|
|
|
2019 |
|
2018 |
||
|
|
|
(In thousands) |
||||
|
Subsidiary debt: |
|
|
|
|
|
|
|
First lien term loan |
|
$ |
650,891 |
|
$ |
654,775 |
|
First lien revolver |
|
|
60,987 |
|
|
42,266 |
|
Deferred financing costs |
|
|
(9,965) |
|
|
(12,985) |
|
Total subsidiary debt |
|
$ |
701,913 |
|
$ |
684,056 |
|
Settlement lines of credit |
|
$ |
33,103 |
|
$ |
41,819 |
For further discussion on the nature and terms of these agreements, refer to Note 14, “Long-Term Debt and Lines of Credit”, to the Company’s consolidated financial statements.
(4)Commitments and Contingencies
For a discussion of commitments and contingencies, see Note 18, “Commitments and Contingencies”, to the Company’s consolidated financial statements.
119
Valuation and Qualifying Accounts
(In thousands)
|
|
|
Balance at |
|
Additions: |
|
|
|
Balance at |
||||
|
|
|
Beginning of |
|
Charged to Costs |
|
|
|
End of |
||||
|
Description |
|
Period |
|
and Expenses |
|
Deductions(1) |
|
Period |
||||
|
Allowance for doubtful accounts |
||||||||||||
|
Year ended December 31, 2019 |
$ |
380 |
$ |
3,926 |
$ |
(570) |
$ |
3,736 |
||||
|
Year ended December 31, 2018 |
— |
2,169 |
(1,789) |
380 |
||||||||
|
Year ended December 31, 2017 |
— |
— |
— |
— |
||||||||
|
Deferred income tax asset valuation allowance |
||||||||||||
|
Year ended December 31, 2019 |
$ |
21,379 |
$ |
4,035 |
$ |
(17,262) |
$ |
8,152 |
||||
|
Year ended December 31, 2018 |
15,934 |
5,643 |
(198) |
21,379 |
||||||||
|
Year ended December 31, 2017 |
11,534 |
4,401 |
(1) |
15,934 |
||||||||
|
(1) Includes accounts receivable written off, the write-off or write-down of valuation allowances, and translation adjustments. |
||||||||||||
120
ITEM 9. CHANGES IN AND DISAGREEMENTS WITH ACCOUNTANTS ON ACCOUNTING AND FINANCIAL DISCLOSURE
None.
ITEM 9A. CONTROLS AND PROCEDURES
Evaluation of Disclosure Controls and Procedures
The Company's management conducted an evaluation, under the supervision and with the participation of its CEO and CFO, of the effectiveness of the design and operation of the Company’s disclosure controls and procedures (as defined in Rule 13a-15(e) of the Exchange Act) at December 31, 2019. The Company’s disclosure controls and procedures are designed to ensure that information required to be disclosed by the Company in the reports that it files or submits under the Exchange Act is recorded, processed, summarized, and reported within the time periods specified in the rules and forms of the SEC, and that such information is accumulated and communicated to the Company’s management, including its CEO and CFO, as appropriate, to allow timely decisions regarding required disclosure. Based upon the evaluation, the CEO and CFO concluded that the Company’s disclosure controls and procedures were effective at December 31, 2019.
Changes to Internal Control over Financial Reporting
During the fourth quarter ended December 31, 2019, the Company adopted ASC 842 and implemented relevant changes to its control activities and processes to monitor and maintain appropriate control over financial reporting. There have been no other changes to the Company’s internal control over financial reporting during the year ended December 31, 2019 that have materially affected, or are reasonably likely to materially affect, the Company’s internal control over financial reporting.
Management’s Report on Internal Control over Financial Reporting
Management is responsible for establishing and maintaining adequate internal control over financial reporting (as defined in Rule 13a-15(f) of the Exchange Act) for the Company. The Company’s internal control over financial reporting is a process designed under the supervision of the Company’s CEO and CFO to provide reasonable assurance regarding the reliability of financial reporting and the preparation of the Company’s financial statements for external purposes in accordance with U.S. GAAP.
We completed our acquisition of Delego in the third quarter of 2019. As permitted by the SEC rules and regulations, management's assessment did not include the internal control of the acquired operations of this business which are included in our consolidated financial statements as of December 31, 2019 and for the period from the acquisition date through December 31, 2019. In accordance with our integration efforts, we plan to incorporate the operations of the acquired business into our internal control over financial reporting program within the time period provided by applicable SEC rules and regulations.
Because of its inherent limitations, internal control over financial reporting may not prevent or detect misstatements. Also, projections of any evaluation of effectiveness to future periods are subject to the risk that controls may become inadequate because of changes in conditions or that the degree of compliance with the policies or procedures may deteriorate. Internal control over financial reporting cannot provide absolute assurance of achieving financial reporting objectives because of its inherent limitations. Internal control over financial reporting is a process that involves human diligence and compliance and is subject to lapses in judgment and breakdowns resulting from human failures. Due to such limitations, there is a risk that material misstatements may not be prevented or detected on a timely basis by internal control over financial reporting. However, these inherent limitations are known features of the financial reporting process. Therefore, it is possible to design into the process safeguards to reduce, though not eliminate, such risk.
121
Management has made a comprehensive review, evaluation, and assessment of the Company’s internal control over financial reporting at December 31, 2019. In making this assessment, management used the criteria set forth by the Committee of Sponsoring Organizations of the Treadway Commission (“COSO”) in the Internal Control — Integrated Framework (2013). Based on that assessment, management concluded that, at December 31, 2019, the Company’s internal control over financial reporting is effective.
Deloitte & Touche LLP has issued an attestation report on our internal control over financial reporting, which is included herein as the Report of Independent Registered Public Accounting Firm under Item 8 - Financial Statements and Supplementary Data for the year ended December 31, 2019.
ITEM 10. DIRECTORS, EXECUTIVE OFFICERS AND CORPORATE GOVERNANCE
Information relating to our executive officers is included in Part I, Item 1 of this Form 10-K. The other information with respect to this Item will be set forth in our proxy statement for the 2020 annual meeting of stockholders (the “2020 Proxy Statement”), which will be filed with the SEC no later than 120 days after December 31, 2019. For the limited purpose of providing the information necessary to comply with this Item 10, the 2020 Proxy Statement is incorporated herein by this reference.
Our board of directors has adopted a Code of Business Conduct and Ethics applicable to all officers, directors and employees, which is available on our website (www.evopayments.com) under “Corporate Governance.” We intend to satisfy the disclosure requirement under Item 5.05 of Form 8-K regarding amendment to, or waiver from, a provision of our Code of Business Conduct and Ethics by posting such information on our website at the address and location specified.
ITEM 11. EXECUTIVE COMPENSATION
Information with respect to this Item will be set forth in our 2020 Proxy Statement, which will be filed with the SEC no later than 120 days after December 31, 2019. For the limited purpose of providing the information necessary to comply with this Item 11, the 2020 Proxy Statement is incorporated herein by this reference.
ITEM 12. SECURITY OWNERSHIP OF CERTAIN BENEFICIAL OWNERS AND MANAGEMENT AND RELATED STOCKHOLDER MATTERS
Information with respect to this Item will be set forth in our 2020 Proxy Statement, which will be filed with the SEC no later than 120 days after December 31, 2019. For the limited purpose of providing the information necessary to comply with this Item 12, the 2020 Proxy Statement is incorporated herein by this reference.
ITEM 13. CERTAIN RELATIONSHIPS AND RELATED TRANSACTIONS AND DIRECTOR INDEPENDENCE
Information with respect to this Item will be set forth in our 2020 Proxy Statement, which will be filed with SEC no later than 120 days after December 31, 2019. For the limited purpose of providing the information necessary to comply with this Item 13, the 2020 Proxy Statement is incorporated herein by this reference.
ITEM 14. PRINCIPAL ACCOUNTING FEES AND SERVICES
Information with respect to this Item will be set forth in our 2020 Proxy Statement, which will be filed with the SEC no later than 120 days after December 31, 2019. For the limited purpose of providing the information necessary to comply with this Item 14, the 2020 Proxy Statement is incorporated herein by this reference.
122
PART IV
ITEM 15. EXHIBITS AND FINANCIAL STATEMENT SCHEDULES
1. Consolidated Financial Statements
Our consolidated financial statements are included in Part II, Item 8, “Financial Statements and Supplementary Data.”
2. Financial Statement Schedules
Schedules I and II to our consolidated financial statements are included in Part II, Item 8, “Financial Statements and Supplementary Data.”
3. Exhibits
|
Exhibit |
|
|
|
No. |
|
Description |
|
|
|
|
|
3.1 |
|
|
|
|
|
|
|
3.2 |
|
|
|
|
|
|
|
4.1 |
|
|
|
|
|
|
|
4.2 |
|
|
|
10.1 |
|
|
|
|
|
|
|
10.2 |
|
|
|
|
|
|
|
10.3 |
|
|
|
|
|
|
|
10.4 |
|
|
|
|
|
|
|
10.5 |
|
123
|
|
|
|
|
10.6 |
|
|
|
|
|
|
|
10.7 |
|
|
|
|
|
|
|
10.8 |
|
|
|
|
|
|
|
10.9 |
|
|
|
|
|
|
|
10.10 |
|
|
|
10.11 |
|
|
|
|
|
|
|
10.12 |
|
|
|
|
|
|
|
10.13 |
|
|
|
|
|
|
|
10.14 |
|
124
|
|
|
|
|
10.15 |
|
|
|
|
|
|
|
10.16 |
|
|
|
|
|
|
|
10.17 |
|
|
|
|
|
|
|
10.18 |
|
|
|
|
|
|
|
10.19 |
|
|
|
|
|
|
|
10.20 |
|
|
|
|
|
|
|
10.21 |
|
|
|
|
|
|
|
10.22 |
|
|
|
|
|
|
|
10.23 |
|
|
|
|
|
|
|
10.24 |
|
|
|
|
|
|
|
10.25 |
|
|
|
|
|
|
|
10.26 |
|
|
|
|
|
|
|
10.27 |
|
|
|
|
|
|
|
10.28 |
|
|
|
|
|
|
125
|
10.29 |
|
|
|
|
|
|
|
10.30 |
|
|
|
|
|
|
|
10.31 |
|
|
|
|
|
|
|
10.32 |
|
|
|
10.33 |
|
|
|
10.34 |
|
|
|
|
|
|
|
21.1 |
|
|
|
|
|
|
|
23.1 |
|
|
|
|
|
|
|
31.1 |
|
Certification of Chief Executive Officer required by Rule 13a-14(a). |
|
|
|
|
|
31.2 |
|
Certification of Chief Financial Officer required by Rule 13a-14(a). |
|
|
|
|
|
32 |
|
|
|
|
|
|
|
101.INS |
|
XBRL Instance Document |
|
|
|
|
|
101.SCH |
|
XBRL Taxonomy Extension Schema Document |
|
|
|
|
|
101.CAL |
|
XBRL Taxonomy Extension Calculation Linkbase Document |
|
|
|
|
|
101.DEF |
|
XBRL Extension Definition Linkbase Document |
|
|
|
|
|
101.LAB |
|
XBRL Taxonomy Label Linkbase Document |
|
|
|
|
|
101.PRE |
|
XBRL Taxonomy Extension Presentation Linkbase Document |
# Indicates management contract or compensatory plan.
126
Pursuant to the requirements of Section 13 or 15(d) of the Securities Exchange Act of 1934, the registrant has duly caused this report to be signed on its behalf by the undersigned, hereunto duly authorized.
|
Name |
|
Title |
|
Date |
|
|
|
|
|
|
|
/S/ JAMES G. KELLY |
|
Chief Executive Officer and Director |
|
February 27, 2020 |
|
James G. Kelly |
|
(principal executive officer) |
|
|
|
|
|
|
|
|
|
/S/ TOM PANTHER |
|
Executive Vice President, Chief Financial Officer |
|
February 27, 2020 |
|
Tom Panther |
|
(principal financial officer) |
|
|
|
/S/ ANTHONY RADESCA |
Senior Vice President, Chief Accounting Officer |
February 27, 2020 |
||
|
Anthony Radesca |
(principal accounting officer) |
|||
|
/S/ RAFIK R. SIDHOM |
|
Chairman of the Board and Director |
|
February 27, 2020 |
|
Rafik R. Sidhom |
|
|
|
|
|
/S/ VAHE A DOMBALAGIAN |
|
Director |
|
February 27, 2020 |
|
Vahe A. Dombalagian |
|
|
|
|
|
/S/ DAVID W. LEEDS |
|
Director |
|
February 27, 2020 |
|
David W. Leeds |
|
|
|
|
|
/S/ LAURA M. MILLER |
Director |
February 27, 2020 |
||
|
Laura M. Miller |
||||
|
/S/ GREGORY S. POPE |
|
Director |
|
February 27, 2020 |
|
Gregory S. Pope |
|
|
|
|
|
/S/ JOHN GARABEDIAN |
|
Director |
|
February 27, 2020 |
|
John Garabedian |
|
|
|
|
127