Attached files
| file | filename |
|---|---|
| EX-99.1 - EXHIBIT 99.1 - Berry Corp (bry) | exhibit991-dmreservereport.htm |
| EX-32.1 - EXHIBIT 32.1 - Berry Corp (bry) | a2019exhibit321-906certifi.htm |
| EX-31.2 - EXHIBIT 31.2 - Berry Corp (bry) | a2019exhibit312-cfo302cert.htm |
| EX-31.1 - EXHIBIT 31.1 - Berry Corp (bry) | a2019exhibit311-ceo302cert.htm |
| EX-23.2 - EXHIBIT 23.2 - Berry Corp (bry) | a2019exhibit232-dmconsent.htm |
| EX-23.1 - EXHIBIT 23.1 - Berry Corp (bry) | a2019exhibit231-kpmgconsent.htm |
| EX-21.1 - EXHIBIT 21.1 - Berry Corp (bry) | a2019exhibit211-listofsubs.htm |
| EX-10.13 - EXHIBIT 10.13 - Berry Corp (bry) | a2019exhibit1013-smith2are.htm |
| EX-10.12 - EXHIBIT 10.12 - Berry Corp (bry) | a2019exh1012-emplagmtsilva.htm |
| EX-10.11 - EXHIBIT 10.11 - Berry Corp (bry) | a2019exh1011-emplagmthunter.htm |
| EX-4.4 - EXHIBIT 4.4 - Berry Corp (bry) | a2019exhibit44-descofsecur.htm |
UNITED STATES SECURITIES AND EXCHANGE COMMISSION
Washington, D.C. 20549
FORM 10-K
ý | ANNUAL REPORT PURSUANT TO SECTION 13 OR 15(d) OF THE SECURITIES EXCHANGE ACT OF 1934 | |
For the Fiscal Year Ended December 31, 2019
OR
¨ | TRANSITION REPORT PURSUANT TO SECTION 13 OR 15(d) OF THE SECURITIES EXCHANGE ACT OF 1934 | |
For the transition period from_______________ to _______________
Commission file number 001-38606
BERRY CORPORATION (bry)
(Exact name of registrant as specified in its charter)
Delaware (State of incorporation or organization) | 81-5410470 (I.R.S. Employer Identification Number) | |
16000 Dallas Parkway, Suite 500
Dallas, Texas 75248
(661) 616-3900
(Address of principal executive offices, including zip code
Registrant’s telephone number, including area code):
Securities registered pursuant to Section 12(b) of the Act:
Title of each class Common Stock, par value $0.001 per share | Trading Symbol BRY | Name of each exchange on which registered Nasdaq Global Select Market |
Securities registered pursuant to Section 12(g) of the Act: None
Indicate by check mark if the registrant is a well-known seasoned issuer, as defined in Rule 405 of the Securities Act. Yes ¨ No ý
Indicate by check mark if the registrant is not required to file reports pursuant to Section 13 or Section 15(d) of the Act. Yes ¨ No ý
Indicate by check mark whether the registrant (1) has filed all reports required to be filed by Section 13 or 15(d) of the Securities Exchange Act of 1934 during the preceding 12 months (or for such shorter period that the registrant was required to file such reports), and (2) has been subject to such filing requirements for the past 90 days. Yes ý No ¨
Indicate by check mark whether the registrant has submitted electronically every Interactive Data File required to be submitted pursuant to Rule 405 of Regulation S-T (§232.405) during the preceding 12 months (or for such shorter period that the registrant was required to submit such files). Yes ý No ¨
Indicate by check mark whether the registrant is a large accelerated filer, an accelerated filer, a non-accelerated filer, a smaller reporting company or emerging growth company. See definitions of “large accelerated filer,” “accelerated filer,” “smaller reporting company” and “emerging growth company” in Rule 12b-2 of the Exchange Act.
Large accelerated filer ¨ | Accelerated filer ¨ | Non-accelerated filer ý | Smaller reporting company ¨ | |||
Emerging Growth Company ý | ||||||
If an emerging growth company, indicate by check mark if the registrant has elected not to use the extended transition period for complying with any new or revised financial accounting standards provided pursuant to Section 13(a) of the Exchange Act. ¨
Indicate by check mark whether the registrant is a shell company (as defined in Rule 12b-2 of the Act). Yes ¨ No ý
The aggregate market value of the voting and non-voting common equity held by non-affiliates computed by reference to the price at which the common equity was last sold, as of the last business day of the registrant’s most recently completed second fiscal quarter was $575.4 million.
Shares of common stock outstanding as of January 31, 2020 79,546,417
DOCUMENTS INCORPORATED BY REFERENCE
The Company’s definitive proxy statement relating to the annual meeting of shareholders (to be held May 5, 2020) will be filed with the Securities and Exchange Commission within 120 days after the close of the Company’s fiscal year ended December 31, 2019 and is incorporated by reference in Part III to the extent described herein.
Table of Contents
i
The financial information and certain other information presented in this report have been rounded to the nearest whole number or the nearest decimal. Therefore, the sum of the numbers in a column may not conform exactly to the total figure given for that column in certain tables in this report. In addition, certain percentages presented in this report reflect calculations based upon the underlying information prior to rounding and, accordingly, may not conform exactly to the percentages that would be derived if the relevant calculations were based upon the rounded numbers, or may not sum due to rounding.
ii
Part I
Items 1 and 2. Business and Properties
Effective February 18, 2020, Berry Petroleum Corporation changed its name to Berry Corporation (bry) and introduced a new logo. We believe that the name Berry Corporation (bry) is a name that better represents our progressive approach to evolving and growing the business in today’s dynamic oil and gas industry.
When we use the terms “we,” “us,” “our,” the “Company,” or similar words in this report, unless the context otherwise requires, (i) on or after the Effective Date (as defined below in “Item 7. Management's Discussion and Analysis of Financial Condition and Results of Operations—Liquidity and Capital Resources—Commitments, and Contingencies”), we are referring to Berry Corporation (bry), a Delaware corporation formerly known as Berry Petroleum Corporation ("Berry Corp."), together with its subsidiary Berry Petroleum LLC, a Delaware limited liability company ("Berry LLC"), the successor company and(ii) prior to the Effective Date, we are referring to Berry LLC, as the predecessor company.
Our Company
We are a western United States independent upstream energy company with a focus on onshore, low geologic risk, long-lived, oil reserves in conventional reservoirs.
In the aggregate, the Company’s assets are characterized by high oil content. Most of our assets are located in the oil-rich reservoirs in the San Joaquin basin of California, which has more than 150 years of production history and substantial remaining oil in place. As a result of the substantial data produced over the basin’s long history, its reservoir characteristics are well understood, leading to predictable, repeatable, low geological risk and low-cost development opportunities. In California, we focus on conventional, shallow oil reservoirs, the drilling and completion of which are relatively low-cost in contrast to unconventional resource plays. For example, we estimate the cost to drill and complete our PUD wells in California will be less than $375,000 per well. In contrast, we estimate the cost to drill and complete our PUD wells in our Rockies (Utah and Colorado) operations will average $1.5 million per well.
We also have assets in the Uinta basin in Utah and in the Piceance basin in Colorado. The Uinta basin is a mature, light-oil-prone play covering more than 15,000 square miles with significant undeveloped resources where we have high operational control and additional behind pipe potential. The Piceance basin in Colorado, which is a prolific low geologic risk natural gas play with trillions of cubic feet of natural gas in place where we produce from a conventional, tight sandstone reservoir using proven slick water stimulation techniques to increase recoveries.
As of December 31, 2019, we had estimated total proved reserves of 138 MMBoe, of which 122 MMBoe was in California. For the year ended December 31, 2019, we had average production of approximately 29.0 MBoe/d, of which approximately 87% was oil. For the three months ended December 31, 2019, we had average production of approximately 31.3 MBoe/d, of which approximately 89% was oil. In California, our average production for the year ended and the three months ended December 31, 2019 was 22.6 MBoe/d and 25.5 MBoe/d, respectively, of which 100% was oil.
We are committed to creating long-term stockholder value. We believe that the successful execution of our strategy across our extensive inventory of identified drilling opportunities with attractive full-cycle economics and stable, oil-weighed production base with low and predictable production decline rates will support our objectives to return capital to our stockholders, produce capital efficient growth, generate Levered Free Cash Flow to fund our operations while maintaining a low leverage profile through commodity price cycles. “Levered Free Cash Flow” is a non-GAAP financial measure defined as Adjusted EBITDA less capital expenditures, interest expense and dividends. “Adjusted EBITDA” is also a non-GAAP financial measure defined as earnings before interest expense; income taxes; depreciation, depletion, and amortization; derivative gains or losses net of cash received or paid for scheduled derivative settlements; impairments; stock compensation expense; and other unusual, out-of-period and infrequent items, including restructuring costs and reorganization items. Please see “Management’s Discussion and Analysis-“Non-GAAP Financial Measures” for reconciliations of Levered Free Cash Flow and Adjusted EBITDA to
1
net cash provided by operating activities and of Adjusted EBITDA to net income (loss), our most directly comparable financial measure calculated and presented in accordance with GAAP.
As part of our commitment to creating long-term stockholder value, we strive to conduct our operations in an ethical, safe and responsible manner, to protect the environment and to take care of our people and the communities in which we live and operate. We also seek proactive and transparent engagement with regulatory agencies, the communities in which we operate and our other stakeholders in order to realize the full potential of our resources in a timely fashion that safeguards people and the environment and complies with existing laws and regulations. We believe that the oil and gas industry will remain an important part of the energy landscape going forward and our goal is to grow our business safely and with great support for the environment, while supporting economic growth and social equity through our operations and engagement with our stakeholders
The Berry Advantage
Our strategy is focused on creating long-term stockholder value by returning capital to stockholders, producing capital-efficient growth and generating positive Levered Free Cash Flow while maintaining a low leverage profile through commodity price cycles. We generated positive Levered Free Cash Flow in 2019 when Brent oil prices ranged from $54.91 to $74.57, and averaged $64.16 for the year. Factoring in current interest, dividend and production levels, our Levered Free Cash Flow is expected to be break even at approximately $50 Brent.
We believe the following competitive strengths will allow us to successfully execute our business strategy:
• | Extensive inventory of low geological risk identified drilling opportunities with attractive full-cycle economics, high operational control and a stable development and production cost environment provides capital flexibility. We expect our operations to continue to generate attractive rates of return and positive Levered Free Cash Flow, which, if sustained, would allow us to continue returning capital to stockholders, sustain current production levels and fund organic growth, among other things. For example, our PUD reserves in California are projected to average single-well rates of return of approximately 50% based on the assumptions used in preparing our SEC reserves report as of December 31, 2019. We operate approximately 95% of our producing wells and expect to operate a similar percentage of our identified gross drilling locations. In addition, a substantial majority of our acreage is currently held by production and fee interest, including 94% of our acreage in California. Our high degree of control over our properties gives us flexibility in executing our development program, including the timing, amount and allocation of our capital expenditures, technological enhancements and marketing of production. Also, unlike our peers, who operate primarily in unconventional plays, our assets generally do not necessitate inventory-constrained and highly specialized equipment, which provides us relative insulation from service cost inflation pressures. Our high degree of operational control and relatively stable cost environment provide us significant visibility and understanding of our expected cash flows. |
• | Stable, long-lived, oil-weighted conventional asset base with low and predictable production decline rates. The majority of our interests are in properties that have produced oil for decades. As a result, the geology and reservoir characteristics are well understood, and new development well results are generally predictable, repeatable and present lower risk than unconventional resource plays. The properties are characterized by long-lived reserves with low production decline rates, a stable development cost structure and low-geologic risk developmental drilling opportunities with predictable production profiles. The nature of our assets provides us with significant capital flexibility and an ability to hedge efficiently material quantities of future expected production. For example, our PDP reserves have an estimated annual decline rate of approximately 13% to 20% in the years between 2020 and 2025 based on total PDP Boe reserves as of December 31, 2019. Based on the assumptions underlying our PUD estimates, we estimate that we will require slightly more than $11 per Boe in annual capital expenditures to keep production volumes consistent each year over the next three years. |
• | Brent-influenced crude oil pricing advantage. California oil prices are Brent-influenced as California refiners import approximately 73% of the state’s demand from outside the state, most of which comes from OPEC |
2
and other waterborne sources. There is a closer correlation of prices in California to Brent pricing than to WTI. Without the higher costs associated with importing crude via rail or supertanker, we believe our in-state production and low-cost crude transportation options, coupled with Brent-influenced pricing, will allow us to continue to realize strong cash margins in California. Our highly oil-weighted production combined with a Brent-influenced California pricing dynamic has resulted, and is expected to continue to result, in strong operating margins at current commodity prices.
• | Simple capital structure and conservative balance sheet leverage with ample liquidity and minimal contractual obligations. Since our 2018 initial public offering ("IPO"), our capital structure has consisted of common stock and 7.0% senior unsecured notes due February 2026 (the "2026 Notes"). As of December 31, 2019, we had $391 million of available liquidity, defined as cash on hand plus availability under our reserves-based lending facility we entered into on July 31, 2017 (as amended, the “RBL Facility”). In addition, we have minimal long-term service or fixed-volume delivery commitments. This liquidity and flexibility permit us to capitalize on opportunities that may arise to grow and increase stockholder value. |
• | Experienced, principled and disciplined management team. Our management team has significant experience operating and managing oil and gas businesses across numerous domestic and international basins, as well as reservoir and recovery types. We use our deep technical, operational and strategic management experience to optimize the value of our assets and the Company. We are focused on the principles of growing Levered Free Cash Flows as well as the value of our production and reserves. In doing so, we take a disciplined approach to development and operating cost management, field development efficiencies and the application of proven technologies and processes new to our properties in order to generate a sustained life-cycle cost advantage. |
Our Business Strategy
The principal elements of our business strategy include the following:
• | Return capital to our stockholders. Our objective is to maintain a disciplined value creation and returns-focused approach to capital allocation in order to generate excess free cash flow. We have returned capital to our shareholders, primarily in the form of a quarterly dividend, since our first quarter as a public company and we continue to target an attractive dividend yield. Additionally, our stock repurchase program approved by our Board of Directors in December 2018 provides an additional opportunity to return value to our existing shareholders. As of December 31, 2019, we repurchased approximately 6% of our outstanding shares for approximately $50 million and in February 2020 the Board authorized us to repurchase an additional $50 million of stock. If commodity prices increase for a sustained period of time, we would consider repaying debt obligations or returning additional capital to stockholders. For a discussion of our dividend policy, as well as our stock repurchase program, please see “Item 5. Market for the Registrant’s Common Equity, Related Stockholder Matters and Issuer Purchases of Equity Securities.” |
• | Grow production and reserves in a capital efficient manner while producing positive internally generated Levered Free Cash Flow. We intend to allocate capital in a disciplined manner to projects that will produce predictable and attractive rates of return. We plan to direct capital to our oil-rich and low-geologic risk development opportunities while focusing on leveraging capital efficiencies across our asset base with the primary objective of internally funding our capital budget and growth plan. We may also use our capital flexibility to pursue value-enhancing, bolt-on acquisitions to opportunistically improve our positions in existing basins. |
• | Maintain balance sheet strength and flexibility through commodity price cycles. We intend to fund our capital program while producing positive internally generated Levered Free Cash Flow. Over time, we expect to maintain low leverage through organic growth and with excess Levered Free Cash Flow. Our objective is to achieve and maintain a long-term, through-cycle leverage ratio (as defined in our RBL Facility) between 1.0x and 2.0x, or lower. |
3
• | Proactively and collaboratively engage in matters related to regulation, safety, the environmental and community relations. We seek to work closely with regulators and legislators throughout the rulemaking process to minimize adverse impacts that new legislation and regulations might have on our ability to maximize our resources and to mitigate adverse impacts to our permitting process. We have found constructive dialogue with legislative and regulatory agencies can help avert compliance and permitting issues. We also believe that running our operations in a manner that protects the safety and health of our employees and is in compliance with existing laws and regulations is not only the right way to run our business, but it helps us build and maintain relationships with the communities in which we operate as well as credibility with the relevant agencies governing our operations. With ultimate oversight by our Board of Directors, Environmental, Health & Safety (“EH&S”) considerations are an integral part of our day-to-day operations and are incorporated into the strategic decision-making process across our business. |
• | Maximize ultimate hydrocarbon recovery from our assets by optimizing drilling, completion and production techniques and investigating deeper reservoirs and areas beyond our known productive areas. While we continue to utilize proven techniques and technologies, we will also continuously seek efficiencies in our drilling, completion and production techniques in order to optimize ultimate resource recoveries, rates of return and cash flows. We will continue to advance and use innovative EOR and other recovery techniques to unlock additional value and will allocate capital towards these next generation technologies where applicable. In addition, we intend to take advantage of underdevelopment in basins where we operate by expanding our geologic investigation of reservoirs on our acreage and adjacent acreage below existing producing reservoirs. Through these studies, we will seek to expand our development beyond our known productive areas in order to add probable and possible reserves to our inventory at attractive all-in costs. |
• | Enhance future cash flow stability and visibility through an active and continuous hedging program. Our hedging strategy is designed to insulate our capital program from price fluctuations by securing price realizations and cash flows for production. We also seek to protect our operating expenses through fixed-price gas purchase agreements and other hedging contracts. We have protected a significant portion of our anticipated crude oil production realizations and gas purchases through 2020 and have begun to hedge anticipated crude oil production and gas purchases for 2021. We will review our hedging program continuously as conditions change. |
4
Our Capital Program
For the years ended December 31, 2019 and 2018 our capital expenditures were approximately $211 million and $148 million, respectively, on an accrual basis excluding acquisitions. Our 2020 anticipated capital expenditure budget is approximately $125 to $145 million, which we expect to generate significant year-over-year oil production growth in California, while holding overall production close to flat throughout the year. We reduced our 2020 capital program compared to 2019 in response to current oil market volatility and the industry's focus on returning capital to shareholders, which we have been doing since our IPO in July 2018. We have been and continue to be a market leader in returning capital to shareholders, while continuing to generate production growth. We currently anticipate oil production will be approximately 90% of total production in 2020, compared to 87% in 2019 and 82% in 2018. Based on current commodity prices and our drilling success rate to date, we expect to be able to fund our 2020 capital development programs with cash flow from operations and produce positive Levered Free Cash Flow, which includes continuing to target an attractive dividend yield.
The table below sets forth the current expected allocation of our 2020 capital expenditure budget by area as compared to the allocation of our 2019 capital expenditures.
2020 Budget | 2019 Actual | |||||
(in millions) | ||||||
California | $ | 113-130 | $ | 192 | ||
Utah | 4-5 | 10 | ||||
Colorado | 1-2 | 1 | ||||
Corporate | 7-8 | 8 | ||||
Total | $ | 125-145 | $ | 211 | ||
The amount and timing of capital expenditures is within our control and subject to our management’s discretion, and may be adjusted during the year depending on commodity prices and other factors. We retain the flexibility to defer planned capital expenditures depending on a variety of factors, including but not limited to the success of our drilling activities, prevailing and anticipated prices for oil, natural gas and NGLs, the receipt and timing of required regulatory permits and approvals, the availability of necessary equipment, infrastructure and capital, seasonal conditions, drilling and acquisition costs and the level of participation by other interest owners, as well as general market conditions.
We currently expect to employ up to three drilling rigs in California during the last three quarters of 2020, and up to one rig throughout most, if not all, of the first quarter of 2020. Additionally, we currently expect to drill approximately 195 to 225 gross development wells during 2020, almost all of which will be in California for oil production. However, the execution of these plans requires certain regulatory permits and approvals, and changes in laws and regulations, including those relating to the permit review and approval process, could impact our ability to successfully execute our plans. Any postponement or elimination of our development drilling program could result in a reduction of proved reserve volumes and materially affect our business, financial condition and results of operations. Please see “Regulation of Health, Safety and Environmental Matters” for additional discussion of the laws and regulations impacting our business. For additional information about the potential risks related to our capital program, see “Item 1A. Risk Factors” and for a more detailed discussion of capital expenditures, see “Item 7. Management’s Discussion and Analysis of Financial Condition and Results of Operations—Liquidity and Capital Resources—Capital Program”.
In addition to capital expenditures, we also incur costs associated with retiring assets and remediating property at the end of its useful life, both due to regulatory obligations and our focus on EH&S as we develop existing fields. Most of these obligations and activities are regulated by governmental agencies. During 2019, we spent approximately $27 million in fulfilling these obligations and in 2020 we expect to spend approximately $20 million. A significant portion of these costs is a result of California's new idle well regulations which became effective in 2019 and accelerated the timing of abandonment of certain existing idle wells. In accordance with these regulations, we expect to plug and abandon a majority of our existing idle wells over the next eight years.
5
Our Areas of Operation
Our predominant operating area is in California, and we also have operations in Utah and Colorado, which we refer to collectively as our Rockies operating area.
California
California is and has been one of the most productive oil and natural gas regions in the world. According to the U.S. Geological Survey as of 2012, the San Joaquin basin in California contained three of the 10 largest oil fields in the United States based on cumulative production and proved reserves. We have operations in two of those three fields —Midway-Sunset and South Belridge.
We also have operations in the McKittrick and Poso Creek fields in the San Joaquin basin in Kern County as well as in the Placerita Field in the Ventura basin in Los Angeles County. According to the California Geologic Energy Management Division (“CalGEM”), formerly known as the Division of Oil, Gas, and Geothermal Resources ("DOGGR") of the California Department of Conservation, approximately 74% of California’s daily oil production of 443 MBbl/d for 2018 was produced in the San Joaquin basin. We believe there are extensive existing field redevelopment opportunities in our areas of operation within the San Joaquin basin. We also believe that our California focus and strong balance sheet will allow us to take advantage of these opportunities.
We currently hold nearly 15,000 net acres in the San Joaquin and Ventura basins with a 99% average working interest, and our producing areas include:
• | Northwest San Joaquin operations: (i) our McKittrick Field property, which is a newer steamflood development with potential for infill and extension drilling; (ii) our South Belridge Field Hill property, which is characterized by two known reservoirs with low geological risk containing a significant number of drilling prospects, including downspacing opportunities, as well as additional steamflood opportunities; (iii) our thermal North Midway-Sunset Diatomite properties, where we utilize innovative EOR techniques to unlock significant value and maximize recoveries; and (iv) our North Midway-Sunset sandstone properties, where we use cyclic and continuous steam injection to develop these known reservoirs. |
• | Southeast San Joaquin operations: (i) our South Midway-Sunset, properties, which are long-life, low-decline, strong-margin thermal oil properties with additional development opportunities; (ii) our Poso Creek property, which is an active mature shallow, heavy oil asset that we continue to develop across the property; and (iii) our Placerita property, which is a mature shallow, heavy oil asset with additional recompletion opportunities. |
Our California proved reserves represented approximately 88% of our total proved reserves at December 31, 2019. California accounted for 22.6 MBoe/d or 78% of our average daily production for the year ended December 31, 2019 and 25.5 MBoe/d or 81% of our average daily production for the three months ended December 31, 2019.
Along with these upstream operations, we have extensive infrastructure and excess available takeaway capacity in place to support additional development in California. We produce oil from heavy crude reservoirs using steam to heat the oil so that it will flow to the wellbore for production. To help support this operation, we own and operate five natural gas cogeneration plants that produce electricity and steam. These plants supply approximately 22% of our steam needs and approximately 48% of our field electricity needs in California generally at a discount to electricity market prices. To further help offset our costs, we currently also sell surplus power produced by three of our cogeneration facilities under power purchase agreement (“PPA”) contracts with California utility companies. We also own 80 conventional steam generators to help satisfy the steam required by our operations.
In addition, we own gathering, treatment, water recycling and softening facilities, and storage facilities in California that currently have excess capacity, reducing our need to spend capital to develop nearby assets and generally allowing us to control certain operating costs. Approximately 86% of our California oil production is sold through pipeline connections, and we have contracts in place with third-party purchasers of our crude.
6
Commercial petroleum development began in the San Joaquin basin in the late 1860s when asphalt deposits were mined and shallow wells were hand dug and drilled. Rapid discovery of many of the largest oil accumulations followed during the next several decades. Operations on our properties began in 1909. In the 1960s, introduction of thermal techniques resulted in substantial new additions to reserves in heavy oil fields. The San Joaquin basin contains multiple stacked benches that have allowed continuing discoveries of stratigraphic, structural and non-structural traps. Most oil accumulations discovered in the San Joaquin basin occur in the Eocene age through Pleistocene age sedimentary sections. Organic rich shales from the Monterey, Kreyenhagen and Tumey formations form the source rocks that generate the oil for these accumulations.
Rockies
Uinta Basin, Utah
Our Uinta basin operations in the Brundage Canyon, Ashley Forest and Lake Canyon areas in Utah target the Green River and Wasatch formations that produce oil and natural gas at depths ranging from 5,000 feet to 8,000 feet. We have high operational control of our existing acreage which has significant upside for additional vertical and or horizontal development and recompletions.
Our Uinta basin proved reserves represented approximately 11% of our total proved reserves at December 31, 2019 and accounted for 5.0 MBoe/d or 17% of our average daily production for the year ended December 31, 2019.
We also have extensive gas infrastructure and available takeaway capacity in place to support additional development along with existing gas transportation contracts. We have natural gas gathering systems consisting of approximately 500 miles of pipeline and associated compression and metering facilities that connect to numerous sales outlets in the area. We also own a natural gas processing plant in the Brundage Canyon area located in Duchesne County, Utah with capacity of approximately 30 MMcf/d. This facility takes delivery from gathering and compression facilities we operate. Approximately 95% of the gas gathered at these facilities is produced from wells that we operate. Current throughput at the processing plant is 16-18 MMcf/d and sufficient capacity remains for additional large-scale development drilling.
Formed during the late Cretaceous to Eocene periods, the Uinta basin is a mature, light-oil-prone play located primarily in Duchesne and Uintah Counties of Utah and covers more than 15,621 square miles. Exploration efforts immediately after the Second World War led to the first commercial oil discoveries in the Uinta basin. Oil was discovered in, and produced from fluvial to lacustrine sandstones of the Green River formation in these early discoveries. The application of improved hydraulic stimulation techniques in the mid-2000s greatly increased production from the Uinta basin. As reported by the Utah Department of Natural Resources, total Utah production more than doubled from 36 MBbl/d in 2003 to 102 MBbl/d in 2018. Approximately 84% of Utah’s production in 2018 came from the Uinta basin in Duchesne and Uintah counties.
Piceance Basin, Colorado
Our primary operating areas in the Piceance basin are Garden Gulch and North Parachute in northwestern Colorado where we target the Williams Fork formation of the Mesaverde Group and produce at depths ranging from 7,500 feet to 12,500 feet. We have utilized a proven slick water completion method that has resulted in lower costs and increased recoveries. In addition, we have infrastructure and available takeaway capacity in place to support additional development along with existing gas transportation contracts.
Our Piceance basin proved reserves represented approximately 1% of our total proved reserves at December 31, 2019 and accounted for 1.4 MBoe/d or 5% of our average daily production for the year ended December 31, 2019.
The Piceance basin is located in northwestern Colorado and is a low geologic risk gas play with trillions of cubic feet of natural gas in place. Natural gas generated from coals and carbonaceous shales in the Upper Cretaceous Mesaverde Group migrated into low permeability Mesaverde Group fluvial sandstones resulting in a basin-centered gas accumulation, or what the U.S. Geological Survey terms a “continuous petroleum accumulation.” Operators recognized
7
for years that the Mesaverde Group, and the Williams Fork formation in particular, contained significant quantities of gas over a large area, but the low permeability of the reservoir sandstones made it difficult to complete economic wells. Improvements in hydraulic stimulation design and completion fluids in the 1990s and 2000s, coupled with an increase in commodity prices, led to the economic development of the gas resources in the Piceance basin.
At year end 2019, we recorded an impairment charge for these properties due to the decline in our expectations of future gas prices, as such we have no plans to drill in these properties.
Our Assets and Production Information
For the year ended December 31, 2019, we had average production of approximately 29.0 MBoe/d, of which approximately 87% was oil. In California, our average production for the year ended December 31, 2019 was 22.6 MBoe/d, of which 100% was oil.
The table below summarizes our average net daily production for the year ended December 31, 2019:
Average Net Daily Production(1) for the Year Ended | |||||||||||
December 31, 2019 | December 31, 2018 | ||||||||||
(MBoe/d) | Oil (%) | (MBoe/d) | Oil (%) | ||||||||
California | 22.6 | 100 | % | 19.7 | 100 | % | |||||
Utah | 5.0 | 54 | % | 5.0 | 48 | % | |||||
Colorado | 1.4 | 2 | % | 1.7 | 1 | % | |||||
East Texas(2) | — | — | % | 0.6 | — | % | |||||
Total | 29.0 | 87 | % | 27.0 | 82 | % | |||||
__________
(1) Production represents volumes sold during the period.
(2) On November 30, 2018, we sold our non-core gas-producing properties and related assets located in the East Texas basin
Production Data
The following table sets forth information regarding production for the years ended December 31, 2019 and 2018.
Year Ended | |||||
December 31, 2019 | December 31, 2018 | ||||
Average daily production(1)(3): | |||||
Oil (MBbl/d) | 25.3 | 22.0 | |||
Natural gas (MMcf/d) | 20.0 | 26.3 | |||
NGLs (MBbl/d) | 0.4 | 0.6 | |||
Total (MBOE/d)(2) | 29.0 | 27.0 | |||
__________
(1) | Production represents volumes sold during the period. We also consume a portion of the natural gas we produce on lease to extract oil and gas. |
(2) | Natural gas volumes have been converted to Boe based on energy content of six Mcf of gas to one Bbl of oil. Barrels of oil equivalence does not necessarily result in price equivalence. The price of natural gas on a barrel of oil equivalent basis is currently substantially lower than the corresponding price for oil and has been similarly lower for a number of years. For example, in the year ended December 31, 2019, the average prices of Brent oil and Henry Hub natural gas were $64.16 per Bbl and $2.56 per Mcf, respectively, resulting in an oil-to-gas ratio of over 4 to 1 on an energy equivalent basis. |
(3) | On November 30, 2018, we sold our non-core gas-producing properties and related assets located in the East Texas basin. |
8
Our Development Inventory
We have an extensive inventory of low-geologic risk, high-return development opportunities. As of December 31, 2019, we identified 10,859 gross drilling locations across our asset base. For a discussion of how we identify drilling locations, please see “—Our Reserves—Determination of Identified Drilling Locations.”
We operate approximately 95% of our producing wells. In addition, a substantial majority of our acreage is currently held by production and fee interest, including 94% of our acreage in California. As of December 31, 2019, the combined net acreage covered by leases expiring in the next three years represented approximately 13% of our total net acreage of which 11% is in Utah. Our high degree of operational control, together with the large portion of our acreage that is held by production, gives us flexibility over the execution of our development program, including the timing, amount and allocation of our capital expenditures, technological enhancements and marketing of production.
The following table summarizes certain information concerning our active producing and identified development assets as of December 31, 2019:
Acreage | Net Acreage Held By Production and Fee Interest(%) | Producing Wells, Gross(2)(3) | Average Working Interest (%)(3)(4) | Net Revenue Interest (%)(3)(5) | Identified Drilling Locations(6) | ||||||||||||||||
Gross | Net(1) | Gross | Net | ||||||||||||||||||
California | 18,517 | 14,144 | 94 | % | 3,014 | 99 | % | 93 | % | 10,822 | 10,785 | ||||||||||
Utah | 123,665 | 92,921 | 70 | % | 943 | 95 | % | 62 | % | 37 | 29 | ||||||||||
Colorado | 10,553 | 8,008 | 85 | % | 167 | 83 | % | 79 | % | — | — | ||||||||||
Total | 152,735 | 115,073 | 80 | % | 4,124 | 98 | % | 90 | % | 10,859 | 10,814 | ||||||||||
__________
(1) | Represents our weighted-average interest in our acreage. |
(2) | Includes 658 steamflood and waterflood injection wells in California. |
(3) | Excludes 90 wells in the Piceance basin each with a 5% working interest. |
(4) | Represents our weighted-average working interest in our active wells. |
(5) | Represents our weighted-average net revenue interest for the year ended December 31, 2019. |
(6) | Our total identified drilling locations include approximately 1,289 gross (1,276 net) locations associated with PUDs as of December 31, 2019, including 123 gross (121 net) steamflood injection wells. Please see “—Our Reserves—Determination of Identified Drilling Locations” for more information regarding the process and criteria through which we identified our drilling locations. |
Our Reserves
Reserve Data
As of December 31, 2019, we had estimated total proved reserves of 138 MBoe.
The majority of our reserves are composed of crude oil in shallow, long-lived reservoirs. As of December 31, 2019, approximately 88% of our proved reserves and approximately 96% of the PV-10 value of our proved reserves are derived from our assets in California. We also operate in the Uinta basin in Utah, a mature, light-oil-prone play with significant undeveloped resources, as well as in the Piceance basin in Colorado, a prolific natural gas play with low geologic risk.
As of December 31, 2019, the standardized measure of discounted future net cash flows of our proved reserves and the PV-10 of our proved reserves were approximately $1.5 billion and $1.8 billion, respectively. PV-10 is a financial measure that is not calculated in accordance with U.S. generally accepted accounting principles (“GAAP”). For a definition of PV-10 and a reconciliation to the standardized measure of discounted future net cash flows, please see in “—PV-10” below.
9
The tables below summarize our proved reserves and PV-10 by category as of December 31, 2019:
Proved Reserves as of December 31, 2019(1) | ||||||||||||||||||||||
Oil (MMBbl) | Natural Gas (Bcf) | NGLs (MMBbl) | Total (MMBoe)(2) | % of Proved | % Proved Developed | Capex(3) ($MM) | PV-10(4) ($B) | |||||||||||||||
PDP | 61 | 39 | 1 | 68 | 49 | % | 84 | % | 54 | 1.0 | ||||||||||||
PDNP | 13 | — | — | 13 | 10 | % | 16 | % | 30 | 0.2 | ||||||||||||
PUD | 56 | 6 | — | 57 | 41 | % | — | % | 706 | 0.6 | ||||||||||||
Total | 130 | 45 | 1 | 138 | 100 | % | 100 | % | 790 | 1.8 | ||||||||||||
California | 122 | — | — | 122 | 747 | 1.7 | ||||||||||||||||
__________
(1) | Our estimated net reserves were determined using average first-day-of-the-month prices for the prior 12 months in accordance with SEC guidance. The unweighted arithmetic average first-day-of-the-month prices for the prior 12 months were $63.15 per Bbl Brent for oil and natural gas liquids (“NGLs”) and $2.62 per MMBtu Henry Hub for natural gas at December 31, 2019. The volume-weighted average prices over the lives of the properties were estimated at $58.88 per Bbl of oil and condensate, $16.93 per Bbl of NGLs and $2.84 per Mcf of gas. The prices were held constant for the lives of the properties and we took into account pricing differentials reflective of the market environment. Prices were calculated using oil and natural gas price parameters established by current SEC guidelines and accounting rules, including adjustment by lease for quality, fuel deductions, geographical differentials, marketing bonuses or deductions and other factors affecting the price received at the wellhead. Please see “—Our Reserves and Production Information—PV-10”. |
(2) | Estimated using a conversion ratio of one Bbl of oil per six Mcf of natural gas. |
(3) | Represents undiscounted future capital expenditures estimated as of December 31, 2019. |
(4) | PV-10 is a financial measure that is not calculated in accordance with GAAP. For a definition of PV-10 and a reconciliation to the standardized measure of discounted future net cash flows, please see “—Our Reserves and Production Information—PV-10”. PV-10 does not give effect to derivatives transactions. |
The following table summarizes our estimated proved reserves and related PV-10 as of December 31, 2019. The reserve estimates presented in the table below are based on reports prepared by DeGolyer and MacNaughton. The reserve estimates were prepared in accordance with current SEC rules and regulations regarding oil, natural gas and NGL reserve reporting. Reserves are stated net of applicable royalties.
10
Proved Reserves as of December 31, 2019(1) | |||||||||||||||
California (San Joaquin and Ventura basins) | Utah (Uinta basin) | Colorado (Piceance basin) | Total | ||||||||||||
Proved developed reserves: | |||||||||||||||
Oil (MMBbl) | 68 | 6 | — | 74 | |||||||||||
Natural Gas (Bcf) | — | 30 | 9 | 39 | |||||||||||
NGLs (MMBbl) | — | 1 | — | 1 | |||||||||||
Total (MMBoe)(2)(3) | 68 | 12 | 1 | 82 | |||||||||||
Proved undeveloped reserves: | |||||||||||||||
Oil (MMBbl) | 54 | 2 | — | 56 | |||||||||||
Natural Gas (Bcf) | — | 6 | — | 6 | |||||||||||
NGLs (MMBbl) | — | — | — | — | |||||||||||
Total (MMBoe)(3) | 54 | 3 | — | 57 | |||||||||||
Total proved reserves: | |||||||||||||||
Oil (MMBbl) | 122 | 8 | — | 130 | |||||||||||
Natural Gas (Bcf) | — | 36 | 9 | 45 | |||||||||||
NGLs (MMBbl) | — | 1 | — | 1 | |||||||||||
Total (MMBoe)(3) | 122 | 15 | 1 | 138 | |||||||||||
PV-10 ($billion)(4) | $ | 1.7 | $ | 0.1 | $ | — | $ | 1.8 | |||||||
(1) | Our estimated net reserves were determined using average first-day-of-the-month prices for the prior 12 months in accordance with SEC guidance. The unweighted arithmetic average first-day-of-the-month prices for the prior 12 months were $63.15 per Bbl Brent for oil and NGLs and $2.62 per MMBtu Henry Hub for natural gas at December 31, 2019. The volume-weighted average prices over the lives of the properties were $58.88 per Bbl of oil and condensate, $16.93 per Bbl of NGLs and $2.84 per Mcf. The prices were held constant for the lives of the properties and we took into account pricing differentials reflective of the market environment. Prices were calculated using oil and natural gas price parameters established by current guidelines of the SEC and accounting rules including adjustments by lease for quality, fuel deductions, geographical differentials, marketing bonuses or deductions and other factors affecting the price received at the wellhead. For more information regarding commodity price risk, please see “Item 1A. Risk Factors—Risks Related to Our Business and Industry—Oil, natural gas and NGL prices are volatile and directly affect our results.” |
(2) | Approximately 18% of proved developed oil reserves, 0% of proved developed NGL reserves, 0% of proved developed natural gas reserves and 16% of total proved developed reserves are non-producing. |
(3) | Natural gas volumes have been converted to Boe based on energy content of six Mcf of gas to one Bbl of oil. Barrels of oil equivalence does not necessarily result in price equivalence. The price of natural gas on a barrel of oil equivalent basis is currently substantially lower than the corresponding price for oil and has been similarly lower for a number of years. For example, in the year ended December 31, 2019, the average prices of Brent oil and Henry Hub natural gas were $64.16 per Bbl and $2.56 per Mcf, respectively, resulting in an oil-to-gas ratio of over 4 to 1 on an energy equivalent basis. |
(4) | For a definition of PV-10 and a reconciliation to the standardized measure of discounted future net cash flows, please see “—PV-10.” PV-10 does not give effect to derivatives transactions. |
PV-10
PV-10 is a non-GAAP financial measure and represents the present value of estimated future cash inflows from proved oil and gas reserves, less future development and production costs, discounted at 10% per annum to reflect the timing of future cash flows and does not give effect to derivative transactions or estimated future income taxes. Management believes that PV-10 provides useful information to investors because it is widely used by analysts and investors in evaluating oil and natural gas companies. Because there are many unique factors that can impact an individual company when estimating the amount of future income taxes to be paid, management believes the use of a pre-tax measure is valuable for evaluating the Company. PV-10 should not be considered as an alternative to the standardized measure of discounted future net cash flows as computed under GAAP.
11
The following table provides a reconciliation of PV-10 of our proved reserves to the standardized measure of discounted future net cash flows at December 31, 2019:
At December 31, 2019 | |||
(in billions) | |||
California PV-10 | $ | 1.7 | |
Utah PV-10 | 0.1 | ||
Colorado PV-10 | — | ||
Total Company PV-10 | 1.8 | ||
Less: present value of future income taxes discounted at 10% | (0.3 | ) | |
Standardized measure of discounted future net cash flows | $ | 1.5 | |
Proved Reserves Additions
Our proved reserves in California increased 24 MMBoe, or 23% before production, resulting in a 299% replacement ratio. The decrease in the Colorado reserves of 17 MMBoe was a result of the current unfavorable gas market. The total changes to our proved reserves from December 31, 2018 to December 31, 2019 were as follows:
California (San Joaquin and Ventura basins) | Utah (Uinta basin) | Colorado (Piceance basin) | Total | ||||||||
(in MMBoe)(1) | |||||||||||
Beginning balance as of December 31, 2018 | 106 | 19 | 18 | 143 | |||||||
Extensions and discoveries | 13 | — | — | 13 | |||||||
Revisions of previous estimates | 11 | (2 | ) | (16 | ) | (7 | ) | ||||
Purchases of minerals in place | — | — | — | — | |||||||
Current year production | (8 | ) | (2 | ) | (1 | ) | (11 | ) | |||
Ending balance as of December 31, 2019 | 122 | 15 | 1 | 138 | |||||||
(1) | Natural gas volumes have been converted to Boe based on energy content of six Mcf of gas to one Bbl of oil. Barrels of oil equivalence does not necessarily result in price equivalence. The price of natural gas on a barrel of oil equivalent basis is currently substantially lower than the corresponding price for oil and has been similarly lower for a number of years. For example, in the year ended December 31, 2019, the average prices of Brent oil and Henry Hub natural gas were $64.16 per Bbl and $2.56 per Mcf, respectively, resulting in an oil-to-gas ratio of over 4 to 1 on an energy equivalent basis. |
Extensions and Discoveries. During 2019, we added 13 MMBoe of proved reserves from extensions and discoveries principally in our California properties. These extensions included McKittrick steamflood expansions based on delineation wells drilled in 2019, Homebase Pliocene development, as well as expansion of our thermal Diatomite operations.
Revisions of Previous Estimates.
Revisions related to impairment - At year end 2019, we performed impairment tests with respect to our proved and unproved properties triggered by the persistent decline in gas prices throughout 2019. As a result, we recorded an impairment charge for our Piceance gas properties. Our revisions of previous estimates total includes the removal of 16 MMBoe of proved undeveloped reserves related to this impairment.
Revisions related to price - Product price changes affect the proved reserves we record. For example, higher prices generally increase the economically recoverable reserves in all of our operations because the extra margin extends their expected lives and renders more projects economic. Conversely, when prices drop, we experience the opposite effects.
12
In 2019, our total net negative price revision was 2 MMBoe in California and 2 MMBoe in Utah. This was primarily the result of lower prices in the current commodity price environment.
Revisions related to performance - Performance-related revisions can include upward or downward changes to previous proved reserves estimates due to the evaluation or interpretation of recent geologic, production decline or operating performance data. In 2019, there were positive technical revisions of approximately 13 MMBoe primarily due to improved base performance and redevelopment in our thermal Diatomite area.
Current Year Production - Please refer to “Item 7. Management's Discussion and Analysis of Financial Condition and Results of Operations—Certain Operating and Financial Information” for discussion of our current year production.
Proved Undeveloped Reserves Changes
Our California proved undeveloped reserves increased 25 MMBoe in 2019 mainly due to extensions and technical revisions. These increases were offset by reclassifications to proved developed reserves of 10 MMboe. The Colorado proved undeveloped reserves were fully written down due to the worsening gas market there. The total changes to our proved undeveloped reserves from December 31, 2018 to December 31, 2019 were as follows:
California (San Joaquin and Ventura basins) | Utah (Uinta basin) | Colorado (Piceance basin) | Total | ||||||||
(in MMBoe)(1) | |||||||||||
Beginning balance as of December 31, 2018 | 40 | 1 | 14 | 55 | |||||||
Extensions and discoveries | 12 | — | — | 12 | |||||||
Revisions of previous estimates | 13 | 1 | (14 | ) | — | ||||||
Reclassifications to proved developed | (10 | ) | — | — | (10 | ) | |||||
Ending balance as of December 31, 2019 | 55 | 2 | 0 | 57 | |||||||
(1) | Natural gas volumes have been converted to Boe based on energy content of six Mcf of gas to one Bbl of oil. Barrels of oil equivalence does not necessarily result in price equivalence. The price of natural gas on a barrel of oil equivalent basis is currently substantially lower than the corresponding price for oil and has been similarly lower for a number of years. For example, in the year ended December 31, 2019, the average prices of Brent oil and Henry Hub natural gas were $64.16 per Bbl and $2.56 per Mcf, respectively, resulting in an oil-to-gas ratio of approximately 4 to 1 on an energy equivalent basis. |
Extensions and Discoveries. During 2019, we added 12 MMBoe of proved undeveloped reserves from extensions and discoveries due to drilling unproven locations in the Midway Sunset and McKittrick fields.
Revisions of previous estimates.
Revisions related to price - In 2019, our net negative price revision on proved undeveloped reserves were approximately 1 MMBoe in California, which was primarily the result of lower prices due to the current commodity price environment. Oil prices have decreased by 12%, and gas prices have decreased by 15%.
Revisions related to performance - In 2019, our net positive performance-related revision on proved undeveloped reserves was 13 MMBoe in California which resulted primarily from our thermal Diatomite area, and 1 MMBoe due to the improved type curve performance in our Uinta basin resulting from 2019 drilling activity.
Reclassifications to proved developed. Through the 2019 drilling program, we transferred 10 MMBoe of proved undeveloped reserves to the proved developed category in California. As a result, we converted 23% of our beginning-of-the year inventory of proved undeveloped reserves, spending approximately $74 million of capital. The conversion rate reflected a gradual increase in capital spend from the lower pace of development in the prior year. At average Brent oil prices between $60 to $65 per barrel and average Henry Hub gas prices of at least $2.60 per mcf, we expect to have
13
sufficient future capital to develop our proved undeveloped reserves at December 31, 2019 within five years. Prices substantially below these levels for a prolonged period of time may require us to reduce expected capital expenditures over the next five years, potentially impacting either the quantity or the development timing of proved undeveloped reserves. Our year-end proved undeveloped reserves are determined in accordance with SEC guidelines for development within five years. We believe we have management's commitment and sufficient future capital to develop all of our proved undeveloped reserves.
Reserves Evaluation and Review Process
Independent engineers, DeGolyer and MacNaughton (“D&M”), prepared our reserve estimates reported herein. The process performed by D&M to prepare reserve amounts included their estimation of reserve quantities, future production rates, future net revenue and the present value of such future net revenue, based in part on data provided by us. When preparing the reserve estimates, D&M did not independently verify the accuracy and completeness of the information and data furnished by us with respect to ownership interests, production, well test data, historical costs of operation and development, product prices, or any agreements relating to current and future operations of the properties and sales of production. However, if in the course of D&M's work, something came to their attention that brought into question the validity or sufficiency of any such information or data, they did not rely on such information or data until they had satisfactorily resolved their related questions. The estimates of reserves conform to SEC guidelines, including the criteria of “reasonable certainty,” as it pertains to expectations about the recoverability of reserves in future years. Under SEC rules, reasonable certainty can be established using techniques that have been proven effective by actual production from projects in the same reservoir or an analogous reservoir or by other evidence using reliable technology that establishes reasonable certainty. Reliable technology is a grouping of one or more technologies (including computational methods) that have been field tested and have been demonstrated to provide reasonably certain results with consistency and repeatability in the formation being evaluated or in an analogous formation. To establish reasonable certainty with respect to our estimated proved reserves, the technologies and economic data used in the estimation of our proved reserves have been demonstrated to yield results with consistency and repeatability and include production and well test data, downhole completion information, geologic data, electrical logs, radioactivity logs, core analyses, available seismic data and historical well cost, operating expense and commodity revenue data.
D&M also prepared estimates with respect to reserves categorization, using the definitions of proved reserves set forth in Regulation S-X Rule 4-10(a) and subsequent SEC staff interpretations and guidance.
Our internal control over the preparation of reserves estimates is designed to provide reasonable assurance regarding the reliability of our reserves estimates in accordance with SEC regulations. The preparation of reserve estimates was overseen by Kurt Neher, Executive Vice President of Business Development, who has a Masters in Geology from the University of South Carolina and a Bachelors in Geology from Carleton College, and more than 32 years of oil and natural gas industry experience. The reserve estimates were reviewed and approved by our senior engineering staff and management, and presented to our board of directors. Within D&M, the technical person primarily responsible for reviewing our reserves estimates was Gregory K. Graves, P.E. Mr. Graves is a Registered Professional Engineer in the State of Texas (License No. 70734), is a member of both the Society of Petroleum Engineers and the Society of Petroleum Evaluation Engineers and has in excess of 35 years of experience in oil and gas reservoir studies and reserves evaluations. Mr. Graves graduated from the University of Texas at Austin in 1984 with a Bachelor of Science degree in Petroleum Engineering.
Reserve engineering is inherently a subjective process of estimating underground accumulations of oil, natural gas and NGLs that cannot be measured exactly. For more information, see “Item 1A. Risk Factors—Risks Related to Our Business and Industry—Estimates of proved reserves and related future net cash flows are not precise. The actual quantities of our proved reserves and future net cash flows may prove to be lower than estimated.”
14
Determination of Identified Drilling Locations
Proven Drilling Locations
Based on our reserves report as of December 31, 2019, we have approximately 1,289 gross (1,276 net) drilling locations attributable to our proved undeveloped reserves, compared to 1,071 gross (1,058 net) as of December 31, 2018. The increases in drilling locations attributable to our proved undeveloped reserves is primarily due to development in the Homebase and McKittrick fields. We use production data and experience gained from our development programs to identify and prioritize development of this proven drilling inventory. These drilling locations are included in our inventory only after they have been evaluated technically and are deemed to have a high likelihood of being drilled within a five-year time frame. As a result of technical evaluation of geologic and engineering data, it can be estimated with reasonable certainty that reserves from these locations will be commercially recoverable in accordance with SEC guidelines. Management considers the availability of local infrastructure, drilling support assets, state and local regulations and other factors it deems relevant in determining such locations.
Unproven Drilling Locations
We have also identified a multi-year inventory of 9,570 gross (9,379 net) drilling locations as of December 31, 2019, compared to 5,959 gross (5,604 net) drilling locations as of December 31, 2018. Our unproven drilling locations are specifically identified on a field-by-field basis considering the applicable geologic, engineering and production data. We analyze past field development practices and identify analogous drilling opportunities taking into consideration historical production performance, estimated drilling and completion costs, spacing and other performance factors. These drilling locations primarily include (i) infill drilling locations, (ii) additional locations due to field extensions or (iii) potential IOR and EOR project expansions, some of which are currently in the pilot phase across our properties, but have yet to be determined to be proven locations. We believe the assumptions and data used to estimate these drilling locations are consistent with established industry practices based on the type of recovery process we are using.
We plan to analyze our acreage for exploration drilling opportunities at appropriate levels. We expect to use internally generated information and proprietary models consisting of data from analog plays, 3-D seismic data, open hole and mud log data, cores and reservoir engineering data to help define the extent of the targeted intervals and the potential ability of such intervals to produce commercial quantities of hydrocarbons.
Well Spacing Determination
Our well spacing determinations in the above categories of identified well locations are based on actual operational spacing within our existing producing fields, which we believe are reasonable for the particular recovery process employed (i.e., primary, waterflood and thermal EOR). Spacing intervals can vary between various reservoirs and recovery techniques. Our development spacing can be less than one acre for a thermal steamflood development in California and greater than ten acres for a primary gas expansion development in our Piceance asset in Colorado.
Drilling Schedule
Our identified drilling locations have been scheduled as part of our current multi-year drilling schedule or are expected to be scheduled in the future. However, we may not drill our identified sites at the times scheduled or at all. We view the risk profile for our prospective drilling locations and any exploration drilling locations we may identify in the future as being higher than for our other proved drilling locations.
Our ability to profitably drill and develop our identified drilling locations depends on a number of variables, including crude oil and natural gas prices, the availability of capital, costs, drilling results, regulatory approvals, available transportation capacity and other factors. If future drilling results in these projects do not establish sufficient reserves to achieve an economic return, we may curtail drilling or development of these projects. For a discussion of the risks associated with our drilling program, see “Item 1A. Risk Factors—Risks Related to Our Business and Industry—We may not drill our identified sites at the times we scheduled or at all.”
15
The table below sets forth our proved undeveloped drilling locations and unproven drilling locations as of December 31, 2019.
PUD Drilling Locations (Gross) | Unproven Drilling Locations (Gross) | Total Drilling Locations (Gross) | |||||||||||||||
Oil and Natural Gas Wells | Injection Wells | Oil and Natural Gas Wells | Injection Wells | Oil and Natural Gas Wells | Injection Wells | ||||||||||||
California | 1,129 | 123 | 8,099 | 1,471 | 9,228 | 1,594 | |||||||||||
Utah | 37 | — | — | — | 37 | — | |||||||||||
Colorado | — | — | — | — | — | — | |||||||||||
Total Identified Drilling Locations | 1,166 | 123 | 8,099 | 1,471 | 9,265 | 1,594 | |||||||||||
The following tables sets forth information regarding production volumes for fields with equal to or greater than 15% of our total proved reserves for each of the periods indicated:
Berry Corp. (Successor) | Berry LLC (Predecessor) | |||||||||||
Year Ended December 31, 2019 | Year Ended December 31, 2018 | Ten Months Ended December 31, 2017 | Two Months Ended February 28, 2017 | |||||||||
SJV Midway Sunset Field | ||||||||||||
Total production(1): | ||||||||||||
Oil (MBbls) | 5,543 | 4,495 | 3,560 | 693 | ||||||||
Natural gas (Bcf) | — | — | — | — | ||||||||
NGLs (MBbls) | — | — | — | — | ||||||||
Total (MBoe)(2) | 5,543 | 4,495 | 3,560 | 693 | ||||||||
Berry Corp. (Successor) | Berry LLC (Predecessor) | |||||||||||
Year Ended December 31, 2019 | Year Ended December 31, 2018 | Ten Months Ended December 31, 2017 | Two Months Ended February 28, 2017 | |||||||||
SJV Belridge Hill(3) | ||||||||||||
Total production(1): | ||||||||||||
Oil (MBbls) | 1,312 | 1,196 | 609 | 35 | ||||||||
Natural gas (Bcf) | — | — | — | — | ||||||||
NGLs (MBbls) | — | — | — | — | ||||||||
Total (MBoe)(2) | 1,312 | 1,196 | 609 | 35 | ||||||||
Berry Corp. (Successor) | Berry LLC (Predecessor) | |||||||||
Year Ended December 31, 2019 | Year Ended December 31, 2018 | Ten Months Ended December 31, 2017 | Two Months Ended February 28, 2017 | |||||||
Piceance | ||||||||||
Total production(1): | ||||||||||
Oil (MBbls) | * | * | 14 | 2 | ||||||
Natural gas (Bcf) | * | * | 3.6 | 0.8 | ||||||
NGLs (MBbls) | * | * | — | — | ||||||
Total (MBoe)(2) | * | * | 610 | 138 | ||||||
__________
* | Represented less than 15% of our total proved reserves for the periods indicated. |
(1) | Production represents volumes sold during the period. |
16
(2) | Natural gas volumes have been converted to Boe based on energy content of six Mcf of gas to one Bbl of oil. Barrels of oil equivalence does not necessarily result in price equivalence. The price of natural gas on a barrel of oil equivalent basis is currently substantially lower than the corresponding price for oil and has been similarly lower for a number of years. For example, in the year ended December 31, 2019, the average prices of Brent oil and Henry Hub natural gas were $64.16 per Bbl and $2.56 per Mcf, respectively, resulting in an oil-to-gas ratio of over 4 to 1. |
(3) | In July 2017, we acquired the remaining 84% working interest in the South Belridge Hill property located in Kern County, California, in which we previously owned a 16% working interest. |
Productive Wells
As of December 31, 2019, we had a total of 3,666 gross (3,541 net) productive wells (including 610 gross and net steamflood and waterflood injection wells), approximately 95% of which were oil wells. Our average working interests in our productive wells is approximately 98%. Many of our oil wells produce associated gas and some of our gas wells also produce condensate and NGLs.
The following table sets forth our productive oil and natural gas wells (both producing and capable of producing) as of December 31, 2019.
California (San Joaquin and Ventura basins) | Utah (Uinta basin) | Colorado (Piceance basin) | Total | |||||||
Oil | ||||||||||
Gross(1) | 2,504 | 986 | — | 3,490 | ||||||
Net(2) | 2,479 | 937 | — | 3,416 | ||||||
Gas | ||||||||||
Gross(1) | — | — | 176 | 176 | ||||||
Net(2) | — | — | 125 | 125 | ||||||
(1) | The total number of wells in which interests are owned. Includes 610 steamflood and waterflood injection wells in California. |
(2) | The sum of fractional interests. |
Acreage
The following table sets forth certain information regarding the total developed and undeveloped acreage in which we owned an interest as of December 31, 2019.
California (San Joaquin and Ventura basins) | Utah and Other (Uinta and Piceance basins) | Total | |||
Developed(1) | |||||
Gross(2) | 9,835 | 94,268 | 104,103 | ||
Net(3) | 9,289 | 72,103 | 81,392 | ||
Undeveloped(4) | |||||
Gross(2) | 8,682 | 39,950 | 48,632 | ||
Net(3) | 4,855 | 28,827 | 33,682 | ||
(1) | Acres spaced or assigned to productive wells. |
(2) | Total acres in which we hold an interest. |
(3) | Sum of fractional interests owned based on working interests or interests under arrangements similar to production sharing contracts. |
(4) | Acres on which wells have not been drilled or completed to a point that would permit the production of commercial quantities of oil and natural gas, regardless of whether the acreage contains proved reserves. |
17
Participation in Wells Being Drilled
As of December 31, 2019, we were not participating in any development or exploratory wells. We were participating in 14 steamflood and waterflood pressure maintenance projects - 12 steamflood projects and one waterflood project were located in the San Joaquin basin, and one waterflood project was located in the Uinta basin.
Drilling Activity
The following table shows the net development wells we drilled during the periods indicated. We did not drill any exploratory wells during the periods presented. The information should not be considered indicative of future performance, nor should it be assumed that there is necessarily any correlation among the number of productive wells drilled, quantities of reserves found or economic value. Productive wells are those that produce, or are capable of producing, commercial quantities of hydrocarbons, regardless of whether they produce a reasonable rate of return.
California (San Joaquin and Ventura basins) | Utah (Uinta basin) | Colorado (Piceance basin) | Total | ||||||||
2019 | |||||||||||
Oil(2) | 335 | 3 | — | 338 | |||||||
Natural Gas | — | — | — | — | |||||||
Dry | — | — | — | — | |||||||
2018 | |||||||||||
Oil(1) | 224 | 8 | — | 232 | |||||||
Natural Gas | — | — | — | — | |||||||
Dry | — | — | — | — | |||||||
2017 | |||||||||||
Oil(1) | 124 | — | — | 124 | |||||||
Natural Gas | — | — | — | — | |||||||
Dry | — | — | — | — | |||||||
(1) | Includes injector wells. |
(2) | Includes 50 wells that had not yet been connected to gathering systems in California. |
Delivery Commitments
We have contractual agreements to provide gas volumes for transportation, processing and sales, some of which specify fixed and determinable quantities and all of which were in Utah. As of December 31, 2019, the volumes contracted to be delivered were approximately 7,170 MMBtu/d of gas beginning in 2020 and will decrease over time to 4,560 MMBtu/d in 2022. We have significantly more production capacity than the amounts committed and have the ability to secure additional volumes in case of a shortfall.
18
Methods of Recovery and Marketing Arrangements
We seek to be the operator of our properties so that we can develop and implement drilling programs and optimization projects that not only replace production but add value through reserve and production growth and future operational synergies. We have an average of 98% working interest and 95% operating control in our properties.
Our California operations are primarily focused on the thermal Sandstones, thermal Diatomite and Hill Diatomite, development areas. We also have operations in the Uinta basin in Utah and Piceance in Colorado, as noted in the following table.
Gross Drilling Locations(1) | |||||||||||
State | Project Type | Well Type | Completion Type | Recovery Mechanism | Total | ||||||
California | Thermal Sandstones | Vertical / Horizontal | Perforation/Slotted liner/gravel pack | Continuous and cyclic steam injection | 6,143 | ||||||
California | Thermal Diatomite | Vertical | Short interval perforations | High-pressure cyclic steam injection | 3,198 | ||||||
California | Hill Diatomite (non-thermal) | Vertical | Hydraulic stimulation, low intensity pin point | Pressure depletion augmented with water injection | 1,481 | ||||||
Utah | Uinta | Vertical / Horizontal | Low intensity hydraulic stimulation | Pressure depletion | 37 | ||||||
Colorado | Piceance | Vertical | Proppantless slick water stimulation | Pressure depletion | — | ||||||
Total | 10,859 | ||||||||||
__________
(1) | We had 1,289 gross (1,276 net) locations associated with PUDs as of December 31, 2019 including 123 gross (121 net) steamflood injection wells. Of those 1,289 gross PUD locations, 1,252 are associated with projects in California, 37 are associated with the Uinta basin. Please see “—Our Reserves —Determination of Identified Drilling Locations” for more information regarding the process and criteria through which we identified our drilling locations. During the year ended December 31, 2019, we drilled 292 gross (292 net) wells that were associated with PUDs at December 31, 2018, including 25 gross (25 net) steamflood injection wells. |
Thermal Recovery
Most of our assets in California consist of heavy crude oil, which requires heat, supplied in the form of steam, injected into the oil producing formations to reduce the oil viscosity, thereby allowing the oil to flow to the wellbore for production. We have cyclic and continuous steam injection projects in the San Joaquin and Ventura basins, primarily in Kern County and in fields such as Midway-Sunset, Poso Creek, McKittrick, South Belridge and Placerita. This technique has many years of demonstrated success in thousands of wells drilled by us and others. Historically, we start production from heavy oil reservoirs with cyclic injection and then expand operations to include continuous injection in adjacent wells. We intend to continue employing both recovery techniques as long as a favorable oil to gas price spread exists. Full development of these projects typically takes multiple years and involves upfront infrastructure construction for steam and water processing facilities and follow on development drilling. These thermal recovery projects are generally shallower in depth (300 to 1,200 ft) than our other programs and the wells are relatively inexpensive to drill and complete at approximately $210,000 per well. Therefore, we can normally implement a drilling program quickly with attractive rates of return.
Cogeneration Steam Supply and Conventional Steam Generation
We produce oil from heavy crude reservoirs using steam to heat the oil so that it will flow to the wellbore for production. To assist in this operation, we own and operate five natural gas burning cogeneration plants that produce electricity and steam: (i) a 38 MW facility (“Cogen 38”), an 18 MW facility (“Cogen 18”) and a 5 MW facility (“Pan Fee Cogen”), each located in the Midway-Sunset Field, (ii) another 5MW facility (“21Z Cogen”) located in the McKittrick Field, and (iii) a 42 MW facility (“Cogen 42”) located in the Placerita Field. Cogeneration plants, also referred to as combined heat and power plants, use hot turbine exhaust to produce steam while generating electrical
19
power. This combined process is more efficient than producing power or steam separately. For more information please see “—Electricity.” and “Item 1A. Risk Factors—Risks Related to Our Business and Industry—We are dependent on our cogeneration facilities to produce steam for our operations. Contracts for the sale of surplus electricity, economic market prices and regulatory conditions affect the economic value of these facilities to our operations.”
We own 80 fully permitted conventional steam generators. The number of generators operated at any point in time is dependent on (i) the steam volume required to achieve our targeted injection rate and (ii) the price of natural gas compared to our oil production rate and the realized price of oil sold. Ownership of these varied steam generation facilities allows for maximum operational control over the steam supply, location and, to some extent, the aggregated cost of steam generation. The natural gas we purchase to generate steam and electricity is primarily based on California price indexes, and in some cases includes transportation charges.
Hydraulic Stimulation
Hydraulic stimulation is an important and common practice that is used to stimulate production of hydrocarbons from tight geologic formations. The process involves the injection of water, sand and trace amounts of chemicals under pressure into formations to enhance the permeability of the surrounding rock and stimulate production. Our California hydraulic stimulation projects use significantly lower fluid and sand volumes than is typical in other areas. For example, we expect to use approximately 150 thousand gallons of water per well for our Hill hydraulic stimulations compared to a median of nearly 4 million gallons for horizontal, unconventional shale wells hydraulically stimulated in the United States in 2014. Similarly, we expect to use only about 325 thousand pounds of sand per Hill well compared to a nationwide average of over 4 million pounds of sand per well in 2015. We use low-volume hydraulic reservoir stimulation in the San Joaquin basin to stimulate our non-thermal Diatomite reservoir at the Hill property. We applied this technique in 2019 and plan to continue this stimulation method on our inventory of Hill non-thermal Diatomite development wells.
We use more traditional hydraulic stimulation techniques to complete our wells in the Piceance basin. However, in this area, we use a more advanced technique known as “proppantless stimulation” to stimulate the reservoir with water and no proppant, such as sand.
Marketing Arrangements
We market crude oil, natural gas, NGLs, gas purchasing and electricity.
Crude Oil. Approximately 86% of our California crude oil production is connected to California markets via crude oil pipelines. We generally do not transport, refine or process the crude oil we produce and do not have any long-term crude oil transportation arrangements in place. California oil prices are Brent-influenced as California refiners import approximately 73% of the state’s demand from OPEC countries and other waterborne sources. This dynamic has led to periods, including recent years, where the price for the primary benchmark, Midway-Sunset, a 13° API heavy crude, has been equal to or exceeded the price for WTI, a light 40° API crude. Without the higher costs associated with importing crude via rail or supertanker, we believe our in-state production and low transportation costs, coupled with Brent-influenced pricing, will allow us to continue to realize strong cash margins in California. Our oil production is primarily sold under market-sensitive contracts that are typically priced at a differential to purchaser-posted prices for the producing area. As of December 31, 2019, all of our oil production was sold under short-term contracts. The waxy quality of oil in Utah has historically limited sales primarily to the Salt Lake City market, which is largely dependent on the supply and demand of oil in the area. The recent success of a tight oil play in the basin has increased supply and put downward pressure on physical oil prices. Due to these circumstances, we are endeavoring to sell our crude to markets outside the basin. Export options to other markets via rail are available and have been used in the past, but are comparatively expensive. We also entered into oil hedges to protect our operating expenses from price fluctuations.
Natural Gas. Our natural gas production is primarily sold under market-sensitive contracts that are typically priced at a differential to the published natural gas index price for the producing area. Our natural gas production is sold to purchasers under seasonal spot price or index contracts. As of December 31, 2019, all of our natural gas and NGL production was sold under short-term contracts at market-sensitive or spot prices. In certain circumstances, we have
20
entered into natural gas processing contracts whereby the residual natural gas is sold under short-term contracts but the related NGLs are sold under long-term contracts. In all such cases, the residual natural gas and NGLs are sold at market-sensitive index prices.
NGLs. We do not have long-term or long-haul interstate NGL transportation agreements. We sell substantially all of our NGLs to third parties using market-based pricing. Our NGL sales are generally pursuant to processing contracts or short-term sales contracts. The relatively small volumes of condensate produced in Colorado are sold under market-based short-term contracts.
Gas Purchasing. We enter into hedges for gas purchases to protect our operating expenses from price fluctuations.
Electricity Generation. Our cogeneration facilities generate both electricity and steam for our properties and electricity for off-lease sales. The total nameplate electrical generation capacity of our five cogeneration facilities, which are centrally located on certain of our oil producing properties, is approximately 108 MW. The steam generated by each facility is capable of being delivered to numerous wells that require steam for our EOR processes. The main purpose of the cogeneration facilities is to reduce the steam and electricity costs in our heavy oil operations.
Electricity and steam produced from our Pan Fee and 21Z cogeneration facilities are used solely for field operations.
For the year ended December 31, 2019, we sold approximately 1,700 megawatt-hours (“MWhs”) per day of cogen power into the grid and consumed approximately 700 MWhs per day of cogen power for lease operations. The five cogeneration facilities produced an average of approximately 36,000 barrels of steam per day. Contracts for the sale of surplus electricity, economic market prices and regulatory conditions affect the economic value of these facilities to our operations.
Electricity Sales Contracts. We sell electricity produced by three of our cogeneration facilities under long-term PPAs approved by the California Public Utilities Commission (the “CPUC”) to two California investor-owned utilities, Southern California Edison Company (“Edison”) and Pacific Gas and Electric (“PG&E”). These PPAs expire in various years between 2021 and 2026.
Principal Customers
For the year ended Year Ended December 31, 2019, sales to Andeavor, Phillips 66 and Kern Oil & Refining accounted for approximately 36%, 24%, and 13% respectively, of our sales. At December 31, 2019, trade accounts receivable from three customers represented approximately 40%, 17% and 11% of our receivables.
If we were to lose any one of our major oil and natural gas purchasers, the loss could cease or delay production and sale of our oil and natural gas in that particular purchaser’s service area and could have a detrimental effect on the prices and volumes of oil, natural gas and NGLs that we are able to sell. For more information related to marketing risks, see “Item 1A. Risk Factors—Risks Related to Our Business and Industry”.
Title to Properties
As is customary in the oil and natural gas industry, we initially conduct only a preliminary review of the title to our properties at the time of acquisition. Prior to the commencement of drilling operations on those properties, we conduct a more thorough title examination and perform curative work with respect to significant defects. We do not commence drilling operations on a property until we have cured known title defects on such property that are material to the project. Individual properties may be subject to burdens that we believe do not materially interfere with the use or affect the value of the properties. Burdens on properties may include customary royalty interests, liens incident to operating agreements and for current taxes, obligations or duties under applicable laws, development obligations, or net profits interests.
21
Competition
The oil and natural gas industry is highly competitive. We encounter strong competition from other companies, including independent operators in acquiring properties, contracting for drilling and other related services, and securing trained personnel. We also are affected by competition for drilling rigs and the availability of related equipment. In the past, the oil and natural gas industry has experienced shortages of drilling rigs, equipment, pipe and personnel, which has delayed development drilling and has caused significant price increases. The lower-cost, commoditized nature of our equipment and service providers partially insulates us from the cost inflation pressures experienced by producers in unconventional plays. We are unable to predict when, or if, such shortages may occur or how they would affect our drilling program. For more information regarding competition and the related risks in the oil and natural gas industry, please see “Item 1A. Risk Factors—Risks Related to Our Business and Industry—Competition in the oil and natural gas industry is intense, making it more difficult for us to acquire properties, market oil or natural gas and secure trained personnel.”
We also face indirect competition from alternative energy sources, such as wind or solar power, and these alternative energy sources could become even more competitive as future legislation and regulation as California and the federal government develops renewable energy and climate-related policies.
Seasonality
Seasonal weather conditions can impact our drilling and production activities. These seasonal conditions can occasionally pose challenges in our operations for meeting well-drilling objectives and increase competition for equipment, supplies and personnel, which could lead to shortages and increase costs or delay operations. For example, our operations may have been and in the future may be impacted by ice and snow in the winter and by electrical storms and high temperatures in the spring and summer, as well as by wild fires and rain.
Natural gas prices can fluctuate based on seasonal and other market-related impacts. We purchase significantly more gas than we sell to generate steam and electricity in our cogeneration facilities for our producing activities. As a result, our key exposure to gas prices is in our costs. We mitigate a substantial portion of this exposure by selling excess electricity from our cogeneration operations to third parties. The pricing of these electricity sales is closely tied to the purchase price of natural gas. We also hedge a significant portion of the gas we expect to consume.
Regulation of Health, Safety and Environmental Matters
Like other companies in the oil and gas industry, our operations are subject to stringent federal, state and local laws and regulations governing the discharge of materials into the environment or otherwise relating to environmental protection. These laws and regulations:
• | Establish air, soil and water quality standards for a given region, such as the San Joaquin Valley, and attainment plans to meet those regional standards, which may significantly restrict development, economic activity and transportation in the region; |
• | require the acquisition of various permits before drilling, workover production, underground fluid injection, enhanced oil recovery methods, or waste disposal commences; |
• | require notice to stakeholders of proposed and ongoing operations; |
• | require the installation of expensive safety and pollution control equipment—such as leak detection, monitoring and control systems—to prevent or reduce the release or discharge of regulated materials into the air, land, surface water or groundwater; |
• | restrict the types, quantities and concentration of various regulated materials, including oil, natural gas, produced water or wastes, that can be released into the environment in connection with drilling and production activities, and impose energy efficiency or renewable energy standards on us or users of our products; |
22
• | limit or prohibit drilling activities on lands located within coastal, wilderness, wetlands, groundwater recharge or endangered species inhabited areas, and other protected areas, or otherwise restrict or prohibit activities that could impact the environment, including water resources, and require the dedication of surface acreage for habitat conservation; |
• | establish waste management standards or require remedial measures to limit pollution from former operations, such as pit closure, reclamation and plugging and abandonment of wells or decommissioning of facilities; |
• | impose substantial liabilities for pollution resulting from operations or for preexisting environmental conditions on our current or former properties and operations and other locations where such materials generated by us or our predecessors were released or discharged; |
• | require comprehensive environmental analyses, recordkeeping and reports with respect to operations affecting federal, state, and private lands or leases, including preparation of a Resource Management Plan, an Environmental Assessment, and/or an Environmental Impact Statement with respect to operations affecting federal lands or leases. |
CalGEM is California's primary regulator of the oil and natural gas industry on private and state lands, with additional oversight from the State Lands Commission’s administration of state surface and mineral interests. The Bureau of Land Management (BLM) of the U.S. Department of the Interior exercises similar jurisdiction on federal lands in California, on which CalGEM also asserts jurisdiction over certain activities. Government actions, including the issuance of certain permits or approval of projects, by state and local agencies or by federal agencies may be subject to environmental reviews, respectively, under the California Environmental Quality Act (“CEQA”) or the National Environmental Policy Act (“NEPA”), which may result in delays, imposition of mitigation measures or litigation.
In April 2019 new idle well regulations went into effect in California, which includes a comprehensive well testing regime to prevent leaks, a compliance schedule for testing or plugging and abandoning idle wells, the collection of data necessary to prioritize testing and sealing idle wells, requirements for a long-term idle well management plan, an engineering analysis for each well idled 15 years or longer, and requirements for active observation wells. In California, an idle well is one that has not been used for two years or more and has not yet been permanently sealed pursuant to CalGEM regulations. We have submitted our idle well management plan to meet our obligations.
CalGEM’s predecessor also finalized new Underground Injection Control (“UIC”) regulations, effective April 2019, which affects two types of wells: (i) those that inject water or steam for enhanced oil recovery and (ii) those that return the briny groundwater that comes up from oil formations during production. The key regulations include stronger testing requirements designed to identify potential leaks, increased data requirements to ensure proposed projects are fully evaluated, continuous well pressure monitoring, requirements to automatically cease injection when there is a risk to safety or the environment, and requirements to disclose chemical additives for injection wells close to water supply wells. Our California development and production activities are subject to UIC regulations.
Also, in 2019, the Governor of California signed AB 1057, legislation that required state agencies to review emissions from idle and abandoned wells, evaluate plugging and abandonment and restoration costs and associated bonding requirements. This legislation also expanded CalGEM’s duties effective on January 1, 2020 to include public health and safety and reducing or mitigating greenhouse gas emissions while meeting the state’s energy needs. Other 2019 legislation specifically addressed oil and natural gas leasing by the State Lands Commission, including imposing conditions on assignment of state leases, requiring lessees to complete abandonment and decommissioning upon the termination of state leases, and prohibiting leasing or conveyance of state lands for new oil and natural gas infrastructure that would advance production on certain federal lands such as national monuments, parks, wilderness areas and wildlife refuges.
Additionally, in November 2019, the State Department of Conservation issued a press release announcing three actions by CalGEM: (1) a moratorium on approval of new high–pressure cyclic steam wells pending a study of the practice to address surface expressions experienced by certain operators; (2) review and updating of regulations regarding public health and safety near oil and natural gas operations pursuant to additional duties assigned to CalGEM
23
by the Legislature in 2019; and (3) a performance audit of CalGEM's permitting processes for well stimulation treatment (“WST”) permits and project approval letters (“PALs”) for underground injection by the State Department of Finance and an independent review and approval of the technical content of pending WST and PAL applications by Lawrence Livermore National Laboratory. In January 2020, CalGEM issued a formal notice to operators, including us, that they had issued restrictions imposing a moratorium to prohibit new underground oil-extraction wells from using high-pressure cyclic steaming process. Only our undeveloped thermal diatomite assets are currently impacted by the moratorium.
CalGEM currently requires an operator to identify the manner in which CEQA has been satisfied prior to issuing various state permits or approval of projects, typically through either an environmental impact review (“EIR”) or an exemption by a state or local agency. In Kern County this requirement has typically been satisfied by complying with the local oil and gas ordinance, which was supported by an Environmental Impact Report (“Kern County EIR”) certified by the Kern County Board of Supervisors in 2015. A group of plaintiffs challenged the Kern County EIR and on February 25, 2020, the California Fifth District Court of Appeals issued a ruling that invalidates a portion of the Kern County EIR, effective 30 days after entry of the ruling, until Kern County makes certain revisions to the Kern County EIR and recertifies it (“Kern County Ruling”). Other state agencies, including CalGEM, have relied on the Kern County EIR to satisfy the CEQA requirements in connection with permitting and project approval decisions for oil and gas projects in unincorporated Kern County. We cannot predict how long it will take Kern County to recertify the Kern County EIR or to conduct a new EIR, either of which could ultimately result in the imposition of more onerous permit application requirements and limits on exploration and production activities. It is not yet known how Kern County will resolve this issue, or how long it will take to do so, and we cannot predict how long it will take or what the requirements and costs will be to obtain new permits and project approvals in the interim. It is also not yet known whether there will be significant delays or a pause in the issuance of new permits and approvals in unincorporated Kern County pending resolution of this issue. While the near- and longer- term impacts of the Kern County Ruling on oil and gas activities in Kern County are not yet fully known, we are actively monitoring Kern County’s response, considering the potential impacts to the permitting process, and evaluating the potential impact to our operations. We do not currently expect the Kern County Ruling to materially affect our plans and operations in Kern County as the ruling does not invalidate existing permits.
Our 2019 results were not significantly impacted by the moratorium and we currently do not expect our 2020 results to be impacted by the moratorium. Our current 2020 development and production plans do not require new high–pressure cyclic steam injection and the moratorium does not impact existing production or previously approved permits. Our 2020 plans anticipate primarily thermal sandstone development, which do not require us to use a high–pressure cyclic steam steaming process. However, our 2020 plans may be impacted by existing and pending regulatory changes or other government activity impacting the timing of, and conditions imposed on, required permits and approvals.
With the changes in the UIC regulations and its impact on the permitting process, we experienced delays in obtaining the permits required to continue our planned drilling operations over the latter half of 2019 and into 2020. In late 2019 and in early 2020 we discontinued two drilling rigs and we are currently operating one rig. We are actively reviewing the UIC regulatory developments and considering the potential impacts of the Kern County Ruling, as well as our internal processes. As part of a contingency plan, we are preparing our internal resources to support a more time-intensive and burdensome permitting application process and the potential environmental impact review requirements to mitigate the impact to our development and production plans. If we are unable to obtain the required permits on a timely basis or at all, we may not be able to continue operating this one rig or to redeploy the other two as planned and we may have to change our strategy and plans, which could adversely affect our financial and operating results.
Existing and potential future laws, rules and regulations may restrict the production rate of oil, natural gas and NGLs below the rate that would otherwise be possible. Additionally, the regulatory burden on the industry increases the cost of doing business and consequently may have an adverse effect upon capital expenditures, earnings or competitive position. Violations and liabilities with respect to these laws and regulations could result in significant administrative, civil, or criminal penalties, remedial clean-ups, natural resource damages, permit modifications or revocations, operational interruptions or shutdowns and other liabilities. The costs of remedying such conditions may be significant, and remediation obligations could adversely affect our financial condition, results of operations and
24
prospects. Additionally, Congress and federal and state agencies frequently revise environmental laws and regulations, and any changes that result in more stringent and costly waste handling, disposal and cleanup requirements for the oil and natural gas industry could have a significant impact on operations. For more information related to regulatory risks, see “Item 1A. Risk Factors—Risks Related to Our Business and Industry”.
The environmental laws and regulations applicable to us and our operations include, among others, the following U.S. federal laws and regulations:
• | Clean Air Act (the “CAA”), which governs air emissions; |
• | Clean Water Act (the “CWA”), which governs discharges to and excavations within the waters of the United States; |
• | Comprehensive Environmental Response, Compensation and Liability Act (“CERCLA”), which imposes liability where hazardous substances have been released into the environment (commonly known as “Superfund”); |
• | The Oil Pollution Act of 1990, which amends and augments the CWA and imposes certain duties and liabilities related to the prevention of oil spills and damages resulting from such spills; |
• | Energy Independence and Security Act of 2007, which prescribes new fuel economy standards and other energy saving measures; |
• | National Environmental Policy Act (“NEPA”), which requires careful evaluation of the environmental impacts of oil and natural gas production activities on federal lands; |
• | Resource Conservation and Recovery Act (“RCRA”), which governs the management of solid waste; |
• | SDWA, which governs the underground injection and disposal of wastewater; and |
• | U.S. Department of Interior regulations, which regulate oil and gas production activities on federal lands and impose liability for pollution cleanup and damages. |
Various states regulate the drilling for, and the production, gathering and sale of, oil, natural gas and NGL, including imposing production taxes and requirements for obtaining drilling permits. Our planned capital expenditures depend on a variety of factors, including but not limited to the receipt and timing of required regulatory permits and approvals. Any postponement or elimination of our development drilling program could result in a reduction of proved reserve volumes and materially affect our business, financial condition and results of operations. States also regulate the method of developing new fields, the spacing and operation of wells and the prevention of waste of resources. States may regulate rates of production and may establish maximum daily production allowables from wells based on market demand or resource conservation, or both. States do not regulate wellhead prices or engage in other similar direct economic regulations, but there can be no assurance that they will not do so in the future. The effect of these regulations may be to limit the amounts of oil, natural gas and NGLs that may be produced from our wells and to limit the number of wells or locations we can drill. The oil and natural gas industry is also subject to compliance with various other federal, state and local regulations and laws. Some of those laws relate to occupational safety, resource conservation and equal opportunity employment.
We believe that compliance with currently applicable environmental laws and regulations is unlikely to have a material adverse impact on our business, financial condition, results of operations or cash flows. However, we cannot guarantee this will always be the case given the historical trend of increasingly stringent environmental regulations. Future regulatory issues that could impact us include new rules or legislation, or the reinterpretation of existing rules or legislation, relating to the items discussed below.
25
Climate Change
The threat of climate change continues to attract considerable attention in the United States and in foreign countries. Numerous proposals have been made and could continue to be made at the international, national, regional and state levels of government to monitor and limit existing emissions of greenhouse gases (“GHGs”) as well as to restrict or eliminate such future emissions. As a result, our oil and natural gas exploration and production operations are subject to a series of regulatory, political, litigation, and financial risks associated with the production and processing of fossil fuels and emission of GHGs.
In the United States, no comprehensive climate change legislation has been implemented at the federal level. However, with the U.S. Supreme Court finding that GHG emissions constitute a pollutant under the CAA, the U.S. Environmental Protection Agency (“EPA”) has adopted rules that, among other things, establish construction and operating permit reviews for GHG emissions from certain large stationary sources, require the monitoring and annual reporting of GHG emissions from certain petroleum and natural gas system sources in the United States, implement New Source Performance Standards directing the reduction of methane from certain new, modified, or reconstructed facilities in the oil and natural gas sector, and together with the U.S. Department of Transportation, (“DOT”), implement GHG emissions limits on vehicles manufactured for operation in the United States.
Additionally, various states and groups of states have adopted or are considering adopting legislation, regulations or other regulatory initiatives that are focused on such areas as GHG cap and trade programs, carbon taxes, reporting and tracking programs, and restriction of emissions. For example, California, through the California Air Resources Board (“CARB”) has implemented a cap and trade program for GHG emissions that sets a statewide maximum limit on covered GHG emissions, and this cap declines annually to reach 40% below 1990 levels by 2030. Covered entities must either reduce their GHG emissions or purchase allowances to account for such emissions. Separately, California has implemented low carbon fuel standard (“LCFS”) and associated tradable credits that require a progressively lower carbon intensity of the state's fuel supply than baseline gasoline and diesel fuels. CARB has also promulgated regulations regarding monitoring, leak detection, repair and reporting of methane emissions from both existing and new oil and gas production facilities. Similar regulations applicable to oil and gas facilities have been promulgated in Colorado.
In September 2018, California adopted a law committing California , the fifth largest economy in the world, to the use of 100% zero-carbon electricity by 2045, and the Governor of California also signed an executive order committing California to total economy-wide carbon neutrality by 2045. We cannot predict how these various laws, regulations and orders may ultimately affect our operations. However, these initiatives could result in decreased demand for the oil, natural gas, and NGLs that we produce, and therefore adversely effect our revenues and results of operations.
At the international level, there is a non-binding agreement, the United Nations-sponsored “Paris Agreement,” for nations to limit their GHG emissions through individually-determined reduction goals every five years after 2020. Although the United States has announced its withdrawal from such agreement, effective November 4, 2020, several U.S. states and local governments have announced their intention to adhere to the goals of the Paris Agreement.
Governmental, scientific, and public concern over the threat of climate change arising from GHG emissions has resulted in increasing political risks in the United States, including climate change related pledges made by certain candidates seeking the office of the President of the United States in 2020. Two critical declarations made by one or more candidates running for the Democratic nomination for President include threats to take actions banning hydraulic fracturing of oil and natural gas wells and banning new leases for production of minerals on federal properties. Our operations involve the use of hydraulic fracturing activities and we also have operations on federal lands under the jurisdiction of the U.S. Bureau of Land Management (“BLM”). Other actions that could be pursued by presidential candidates may include more restrictive requirements for the establishment of pipeline infrastructure or the permitting of LNG export facilities, as well as the reversal of the United States’ withdrawal from the Paris Agreement in November 2020.
26
Litigation risks are also increasing, as a number of cities and other local governments have sought to bring suit against the largest oil and natural gas exploration and production companies in state or federal court, alleging, among other things, that such companies created public nuisances by producing fuels that contributed to global warming effects, such as rising sea levels, and therefore are responsible for roadway and infrastructure damages as a result, or alleging that the companies have been aware of the adverse effects of climate change for some time but withheld material information from their investors by failing to adequately disclose those impacts.
There are also increasing financial risks for fossil fuel producers as shareholders currently invested in fossil-fuel energy companies concerned about the potential effects of climate change may elect in the future to shift some or all of their investments into non-energy related sectors. Institutional lenders who provide financing to fossil-fuel energy companies also have become more attentive to sustainable lending practices and some of them may elect not to provide funding for fossil fuel energy companies. Additionally, the lending practices of institutional lenders have been the subject of intensive lobbying efforts in recent years by environmental activists, proponents of the international Paris Agreement, and other groups concerned about climate change to restrict fossil fuel producers’ access to capital. Limitation of investments in and financings for fossil fuel energy companies could result in the restriction, delay or cancellation of drilling programs or development or production activities.
The adoption and implementation of new or more stringent international, federal or state legislation, regulations or other regulatory initiatives that impose more stringent standards for GHG emissions from oil and natural gas producers such as ourselves or otherwise restrict the areas in which we may produce oil and natural gas or generate GHG emissions could result in increased costs of compliance or costs of consuming, and thereby reduce demand for or erode value for, the oil and natural gas that we produce. Additionally, political, litigation, and financial risks may result in our restricting or canceling oil and natural gas production activities, incurring liability for infrastructure damages as a result of climatic changes, or impairing our ability to continue to operate in an economic manner. Moreover, there are increasing risks to operations resulting from the potential physical impacts of climate change, such as drought, wildfires, damage to infrastructure and resources from flooding and other natural disasters and other physical disruptions. One or more of these developments could have a material adverse effect on our business, financial condition and results of operation.
For more information, please see “Item 1A. Risk Factors—Risks Related to Our Business and Industry—Concerns about climate change and other air quality issues may affect our operations or results;” and “—Our operations are subject to a series of risks arising out of the threat of climate change that could result in increased operating costs, limit the areas in which we may conduct oil and natural gas exploration and production activities, and reduce demand for the oil and natural gas we produce.”
Hydraulic Stimulation
Hydraulic stimulation is an important and common practice that is used to stimulate production of hydrocarbons from tight geologic formations. The process involves the injection of water, sand and trace amounts of chemicals under pressure into formations to enhance the permeability of the surrounding rock and stimulate production. Recently, as part of their oil and natural gas regulatory programs, state regulators have overseen hydraulic stimulation operations in more detail. However, the EPA has asserted federal regulatory authority pursuant to the federal SDWA over certain hydraulic stimulation activities involving the use of diesel fuels and published permitting guidance in February 2014 addressing the performance of such activities using diesel fuels. The EPA has issued final regulations under the federal Clean Air Act establishing performance standards, including standards for the capture of air emissions released during hydraulic stimulation, and also finalized rules in June 2016 that prohibit the discharge of wastewater from hydraulic stimulation operations to publicly owned wastewater treatment plants. The BLM previously issued regulations regarding the public disclosure of chemicals used in stimulation treatments, well construction and integrity, and management of waste fluids resulting from hydraulic fracturing activities on federal and Tribal lands. While the BLM rescinded these regulations in 2017, the rescission is subject to ongoing legal challenge. If the rule is reinstated, the outcome of this litigation could materially impact our operations in the Uinta basin and other areas. In addition, from time to time legislation has been introduced before Congress that would provide for federal regulation of hydraulic stimulation and would require disclosure of the chemicals used in the stimulation process. If enacted, these or similar bills could result in additional permitting requirements for hydraulic stimulation operations as well as various restrictions on those
27
operations. These permitting requirements and restrictions could result in delays in operations at well sites and also increased costs to make wells productive.
There may be other attempts to further regulate hydraulic stimulation under the SDWA, the Toxic Substances Control Act and/or other regulatory mechanisms. In December 2016, the EPA released its final report on a wide ranging study on the effects of hydraulic stimulation on water resources. While no widespread impacts from hydraulic stimulation were found, the EPA identified a number of activities and factors that may have increased risk for future impacts.
Moreover, some states and local governments have adopted, and other states and local governments are considering adopting, regulations that could restrict hydraulic stimulation in certain circumstances or otherwise impose enhanced permitting, fluid disclosure, or well construction requirements on hydraulic stimulation activities. For example, in Colorado, there have been several initiatives underway to limit or ban crude oil and natural gas exploration, development or operations. In April 2019, Colorado adopted Senate Bill 19-181 (“SB 181”), which makes sweeping changes in Colorado oil and gas law, including, among other matters, requiring the Colorado Oil and Gas Conservation Commission (“COGCC”) to prioritize public health and environmental concerns in its decisions, instructing the COGCC to adopt rules to minimize emissions of methane and other air contaminants, and delegating considerable new authority to local governments to regulate surface impacts. Some local communities have adopted additional restrictions for oil and gas activities, such as requiring greater setbacks, and other groups have sought a cessation of permit issuances entirely until the COGCC publishes new rules in keeping with SB 181. Additionally, activist groups have submitted new ballot proposals for the 2020 election year, including proposals for increased drilling setbacks and increased bonding requirements. Separately, in California, Assembly Bill 345 was introduced but failed to advance in the California Legislature to impose a statewide setback distance of 2,500 feet between certain oil and natural gas operations and residences, schools and healthcare facilities. In January 2020, the State Assembly passed an amended version of AB 345 that, if passed by the State Senate and signed by the Governor, would require CalGEM, to adopt a land use setback in its rulemaking by July 2022. As amended, the bill no longer specifies a mandatory setback distance, but would require CalGEM to consider a 2,500 foot setback as well as enhanced monitoring and maintenance requirements.
As described above, the regulation or prohibition of hydraulic stimulation is the subject of significant political activity in a number of jurisdictions, some of which have resulted in tighter regulation including recognition of local government authority to implement such restrictions. Many of these restrictions are being challenged in court cases. If new laws or regulations that significantly restrict hydraulic stimulation are adopted, such laws could make it more difficult or costly for us to perform work to stimulate production from tight formations or otherwise impact the value of our assets. In addition, any such added regulation could lead to operational delays, increased operating costs and additional regulatory burdens, and reduced production of oil and natural gas, which could adversely affect our revenues, results of operations and net cash provided by operating activities.
Additionally, hydraulic stimulation operations require large volumes of water. Our inability to locate sufficient amounts of water or dispose of or recycle water used in our drilling and production operations, could adversely impact our operations. Drought conditions, competing water uses, and other physical disruptions to our access to water could adversely affect our operations. Moreover, new environmental initiatives and regulations could include restrictions on our ability to conduct certain operations such as hydraulic stimulation or disposal of waste, including but not limited to produced water, drilling fluids and other wastes associated with the development or production of natural gas.
The SDWA and the Underground Injection Control (the “UIC”) Program
The SDWA and the UIC program promulgated under the SDWA and relevant state laws regulate the drilling and operation of disposal wells that manage produced water (brine wastewater containing salt and other constituents produced by natural gas and oil wells). The EPA directly administers the UIC program in some states, and in others administration is delegated to the state. Permits must be obtained before developing and using deep injection wells for the disposal of produced water, and well casing integrity monitoring must be conducted periodically to ensure the well casing is not leaking produced water to groundwater. Contamination of groundwater by natural gas and oil drilling, production and related operations may result in fines, penalties, remediation costs and natural resource damages, among other sanctions and liabilities under the SDWA and other federal and state laws. In addition, third-party claims may be
28
filed by landowners and other parties claiming damages for groundwater contamination, alternative water supplies, property impacts and bodily injury.
Solid and Hazardous Waste
Although oil and natural gas wastes generally are exempt from regulation as hazardous wastes under the federal RCRA and some comparable state statutes, it is possible some wastes we generate presently or in the future may be subject to regulation under the RCRA or other similar statutes. The EPA and various state agencies have limited the disposal options for certain wastes, including hazardous wastes and there is no guarantee that the EPA or the states will not adopt more stringent requirements in the future. For example, in December 2016, the EPA and several environmental groups entered into a consent decree to address EPA’s alleged failure to timely assess its RCRA Subtitle D criteria regulations exempting certain exploration and production related oil and gas wastes from regulation as a hazardous waste under RCRA. In keeping with the consent decree, in April 2019, EPA signed a determination that revision of these regulations was not warranted at this time. However, a loss of the RCRA exclusion for drilling fluids, produced waters and related wastes could result in an increase in the costs to manage and dispose of generated wastes.
In addition, the federal CERCLA can impose joint and several liability without regard to fault or legality of conduct on classes of persons who are statutorily responsible for the release of a hazardous substance into the environment. These persons can include the current and former owners or operators of a site where a release occurs, and anyone who disposes or arranges for the disposal of a hazardous substance released at a site. Under CERCLA, such persons may be subject to strict, joint and several liability for the entire cost of cleaning up hazardous substances that have been released into the environment and for other costs, including response costs, alternative water supplies, damage to natural resources and for the costs of certain health studies. Moreover, it is not uncommon for neighboring landowners and other third parties to file claims for personal injury and property damage allegedly caused by hazardous substances released into the environment. Each state also has environmental cleanup laws analogous to CERCLA. Petroleum hydrocarbons or wastes may have been previously handled, disposed of, or released on or under the properties owned or leased by us or on or under other locations where such wastes have been taken for disposal. These properties and any materials disposed or released on them may subject us to liability under CERCLA, RCRA and analogous state laws. Under such laws, we could be required to remove or remediate previously disposed wastes or property contamination, to contribute to remediation costs, or to perform remedial activities to prevent future environmental harm.
Endangered Species Act
The federal Endangered Species Act (the “ESA”) restricts activities that may affect endangered and threatened species or their habitats. Some of our operations may be located in areas that are designated as habitats for endangered or threatened species. In February 2016, the U.S. Fish and Wildlife Service published a final policy which alters how it identifies critical habitat for endangered and threatened species. A critical habitat designation could result in further material restrictions to federal and private land use and could delay or prohibit land access or development. Moreover, the U.S. Fish and Wildlife Service continues its effort to make listing decisions and critical habitat designations where necessary for over 250 species, as required under a 2011 settlement approved by the U.S. District Court for the District of Columbia. The U.S. Fish and Wildlife Service agreed to complete the review by the end of the agency’s 2017 fiscal year. The agency missed the deadline but continues to review species for listing under the ESA. Similar protections are offered to migratory birds under the Migratory Bird Treaty Act (“MTBA”). The federal government in the past has pursued enforcement actions against oil and natural gas companies under the Migratory Bird Treaty Act after dead migratory birds were found near reserve pits associated with drilling activities. However, in January 2020, the Department of Interior proposed new regulations clarifying that only the intentional taking of protected migratory birds is subject to prosecution under the MTBA. The ESA and MBTA have not previously had a significant impact on our operations. Nevertheless, the designation of previously unprotected species, such as the Greater Sage Grouse, as being endangered or threatened could cause us to incur additional costs or become subject to operating restrictions in areas where the species are known to exist. If a portion of any area where we operate were to be designated as a critical or suitable habitat, it could adversely impact the value of our assets.
29
Air Emissions
The CAA and comparable state laws restrict the emission of air pollutants from many sources (e.g., compressor stations), through the imposition of air emission standards, construction and operating permitting programs and other compliance requirements. These laws and regulations may require us to obtain pre-approval for the construction or modification of projects or facilities expected to produce or significantly increase air emissions, obtain and strictly comply with stringent air permit requirements or utilize specific equipment or technologies to control emissions of certain pollutants. For example, in October 2015, the EPA lowered the National Ambient Air Quality Standard (the “NAAQS”) for ozone from 75 to 70 parts per billion and completed attainment/non-attainment designations in 2018. In 2016, EPA published a Federal Implementation Plan (“FIP”) to implement minor new source review for oil and gas production and processing on tribal lands. In April 2018, the EPA proposed revisions to reportedly streamline the FIP. Although neither the original FIP nor its revisions originally applied to areas of ozone non-attainment, a May 2019 rule extended the FIP to the Indian country portion of the Uinta Basin Ozone Nonattainment Area.
Implementation of the revised NAAQS could result in stricter permitting requirements, delay or prohibit our ability to obtain such permits, and result in increased expenditures for pollution control equipment, the costs of which could be significant. Over the next several years we may be required to incur certain capital expenditures for air pollution control equipment or other air emissions related issues. In addition, the EPA has adopted new rules under the CAA that require the reduction of volatile organic compound and methane emissions from certain stimulated oil and natural gas wells for which well completion operations are conducted and further require that most wells use reduced emission completions, also known as “green completions.” These regulations also establish specific new requirements regarding emissions from production-related wet seal and reciprocating compressors, and from pneumatic controllers and storage vessels. Subsequently, the Trump Administration has made several attempts to modify CAA regulations related to methane emissions from oil and gas sources. These attempts are subject to ongoing litigation. Most recently, in August 2019, the EPA proposed amendments to the existing methane requirements that, among other things, could rescind methane-specific requirements applicable to upstream facilities but retain requirements for volatile organic compound emissions. Legal challenges to any final rule rescinding federal methane requirements are expected.
In addition, the regulations place new requirements to detect and repair volatile organic compound and methane at certain well sites and compressor stations. In May 2016, the EPA also finalized rules regarding criteria for aggregating multiple small surface sites into a single source for air-quality permitting purposes applicable to the oil and gas industry. This rule could cause small facilities, on an aggregate basis, to be deemed a major source, thereby triggering more stringent air permitting processes and requirements. Compliance with these and other air pollution control and permitting requirements has the potential to delay the development of oil and natural gas projects and increase the costs of development, which costs could be significant.
NEPA
Oil and natural gas exploration and production activities on federal lands are subject to NEPA. NEPA requires federal agencies to evaluate major agency actions having the potential to significantly impact the environment. The NEPA process involves public input through comments which can alter the nature of a proposed project either by limiting the scope of the project or requiring resource-specific mitigation. NEPA decisions can be appealed through the court system by process participants. This process may result in delaying the permitting and development of projects, increase the costs of permitting and developing some facilities and could result in certain instances in the cancellation of existing leases. In January 2020, the Council on Environmental Quality issued a proposed revisions to NEPA regulations that seek to conform the scope of direct, indirect, and cumulative impact analyses for proposed projects subject to NEPA with existing case law; however, the final form or impact of any such revisions is uncertain at this time.
Water Resources
The CWA and analogous state laws restrict the discharge of pollutants, including produced waters and other oil and natural gas wastes, into waters of the United States, a term broadly defined to include, among other things, certain wetlands. Under the CWA, permits must be obtained for the discharge of pollutants into waters of the United States.
30
The CWA provides for administrative, civil and criminal penalties for unauthorized discharges, both routine and accidental, of pollutants and of oil and hazardous substances. It imposes substantial potential liability for the costs of removal or remediation associated with discharges of oil or hazardous substances. State laws governing discharges to water also provide varying civil, criminal and administrative penalties and impose liabilities in the case of a discharge of petroleum or its derivatives, or other hazardous substances, into state waters. In addition, the EPA has promulgated regulations that may require permits to discharge storm water runoff, including discharges associated with construction activities. Pursuant to these laws and regulations, we may be required to develop and implement spill prevention, control and countermeasure plans, (“SPCC plans”) in connection with on-site storage of significant quantities of oil. Some states also maintain groundwater protection programs that require permits for discharges or operations that may impact groundwater conditions. The CWA also prohibits the discharge of fill materials to regulated waters including wetlands without a permit from the U.S. Army Corps of Engineers. The process for obtaining permits has the potential to delay our operations. SPCC plans and other federal requirements require appropriate containment berms and similar structures to help prevent the contamination of navigable waters by a petroleum hydrocarbon tank spill, rupture or leak. Also, in June 2016, the EPA finalized new wastewater pretreatment standards that prohibit onshore unconventional oil and natural gas extraction facilities from sending wastewater to publicly owned treatment works.
In August 2015, the EPA and U.S. Army Corps of Engineers issued a rule expanding the scope of the federal jurisdiction over wetlands and other types of waters (the “Clean Water Rule”). However, there have been attempts to modify the Clean Water Rule by the Trump Administration. On January 23, 2020, the EPA and the Corps finalized the Navigable Waters Protection Rule, which narrows the definition of jurisdictional water relative to the Clean Water Rule. However, legal challenges to the new rule are expected, and multiple challenges to the EPA’s prior rulemakings remain pending. We cannot predict the outcome of any of this litigation. To the extent any final rule expands the range of properties subject to the CWA’s jurisdiction, we could face increased costs and delays with respect to obtaining dredge and fill activity permits in wetland areas, which could materially impact our operations in the San Joaquin basin and other areas.
In recent years, water districts and the California state government have implemented regulations and policies that may restrict groundwater extraction and water usage and increase the cost of water. We treat and reuse water that is co-produced with oil and natural gas for a substantial portion of our needs in activities such as pressure management, steamflooding and well drilling, completion and stimulation. We use water supplied from various local and regional sources, particularly for power plants and to support operations like steam injection in certain fields.
Natural Gas Sales and Transportation
Section 1(b) of the Natural Gas Act (the “NGA”) exempts natural gas gathering facilities from regulation by the Federal Energy Regulatory Commission (“FERC”) as a natural gas company under the NGA. We believe that the natural gas pipelines in our gathering systems meet the traditional tests FERC has used to establish a pipeline’s status as a gatherer not subject to regulation as a natural gas company, but the status of these lines has never been challenged before FERC. The distinction between FERC-regulated transmission services and federally unregulated gathering services is subject to change based on future determinations by FERC, the courts, or Congress, and application of existing FERC policies to individual factual circumstances. Accordingly, the classification and regulation of some of our natural gas gathering facilities may be subject to challenge before FERC or subject to change based on future determinations by FERC, the courts, or Congress. In the event our gathering facilities are reclassified to FERC-regulated transmission services, we may be required to charge lower rates and our revenues could thereby be reduced.
FERC requires certain participants in the natural gas market, including natural gas gatherers and marketers which engage in a minimum level of natural gas sales or purchases, to submit annual reports regarding those transactions to FERC. Should we fail to comply with this requirement or any other applicable FERC-administered statute, rule, regulation or order, it could be subject to substantial penalties and fines.
Federal Energy Regulations
The enactment of the Public Utility Regulatory Policies Act (“PURPA”) and the adoption of regulations thereunder by the FERC provided incentives for the development of cogeneration facilities such as those we own. A domestic
31
electricity generating project must be a Qualifying Facility (“QF”) under FERC regulations in order to benefit from certain rate and regulatory incentives provided by PURPA.
PURPA provides two primary benefits to QFs. First, QFs and entities that own QFs generally are relieved of compliance with certain federal regulations pursuant to the Public Utility Holding Company Act of 2005. Second, FERC’s regulations promulgated under PURPA require that electric utilities purchase electricity generated by QFs at a price based on the purchasing utility’s avoided cost and that the utility sell back-up power to the QF on a nondiscriminatory basis. The Energy Policy Act of 2005 amended PURPA to allow a utility to petition FERC to be relieved of its obligation to enter into any new contracts with QFs if FERC determines that a competitive wholesale electricity market is available to QFs in the service territory. Effective November 23, 2011, the California utility companies have been relieved of their PURPA obligation to enter into new contracts with cogeneration QFs larger than 20 MW. While the California utility companies are still required to enter into new contracts with smaller facilities, such as our Cogen 18 facility, there is no assurance that we will be able to secure new contracts upon the expiration of the existing contracts for our larger facilities. Even if new contracts are available for our larger facilities, there is no assurance that the prices and terms of such contracts will not adversely affect our financial condition, results of operations and net cash provided by operating activities.
State Energy Regulation
The CPUC has broad authority to regulate both the rates charged by, and the financial activities of, electric utilities operating in California and to promulgate regulation for implementation of PURPA. Since a power sales agreement becomes a part of a utility’s cost structure (generally reflected in its retail rates), power sales agreements between electric utilities and independent electricity producers, such as us, are under the regulatory purview of the CPUC. While we are not subject to direct regulation by the CPUC, the CPUC’s implementation of PURPA and its authority granted to the investor-owned utilities to enter into other PPAs are important to us, as is other regulatory oversight provided by the CPUC to the electricity market in California. The CPUC’s implementation of PURPA may be subject to change based on past and future determinations by the courts, or policy determinations made by the CPUC.
Operations on Indian Lands
A portion of our leases and drill-to-earn arrangements in the Uinta basin operating area and some of our future leases in this and other operating areas may be subject to laws promulgated by an Indian tribe with jurisdiction over such lands. In addition to potential regulation by federal, state and local agencies and authorities, an entirely separate and distinct set of laws and regulations may apply to lessees, operators and other parties on Indian lands, tribal or allotted. These regulations include lease provisions, royalty matters, drilling and production requirements, environmental standards, tribal employment and contractor preferences and numerous other matters. Further, lessees and operators on Indian lands may be subject to the jurisdiction of tribal courts, unless there is a specific waiver of sovereign immunity by the relevant tribe allowing resolution of disputes between the tribe and those lessees or operators to occur in federal or state court.
These laws, regulations and other issues present unique risks that may impose additional requirements on our operations, cause delays in obtaining necessary approvals or permits, or result in losses or cancellations of our oil and natural gas leases, which in turn may materially and adversely affect our operations on Indian lands.
Pipeline Safety Regulations
The U.S. Department of Transportation’s Pipeline and Hazardous Materials Safety Administration (“PHMSA”) regulates safety of oil and natural gas pipelines, including, with some specific exceptions, oil and natural gas gathering lines. From time to time, PHMSA, the courts or Congress may make determinations that affect PHMSA’s regulations or their applicability to our pipelines. These determinations may affect the costs we incur in complying with applicable safety regulations.
32
Worker Safety
The Occupational Safety and Health Act of 1970 (“OSHA”) and analogous state laws regulate the protection of the safety and health of workers. The OSHA hazard communication standard requires maintenance of information about hazardous materials used or produced in operations and provision of such information to employees. Other OSHA standards regulate specific worker safety aspects of our operations. Failure to comply with OSHA requirements can lead to the imposition of penalties. In December 2015, the U.S. Departments of Justice and Labor announced a plan to more frequently and effectively prosecute worker health and safety violations, including enhanced penalties.
Future Impacts and Current Expenditures
We cannot predict how future environmental laws and regulations may impact our properties or operations. For the year ended December 31, 2019, we did not incur any material capital expenditures for installation of remediation or pollution control equipment at any of our facilities. We are not aware of any environmental issues or claims that will require material capital expenditures during 2020 or that will otherwise have a material impact on our financial position, results of operations or cash flows.
Employees
As of December 31, 2019, we had 355 employees. None of our employees are currently covered under collective bargaining/union agreements.
We consider employee relations to be good. We strive to create a corporate culture that is reflective of our core values, including accountability, ownership, communication, leadership and entrepreneurship. We are committed to the development of our employees and provide learning and engagement opportunities.
Corporate Information
On May 11, 2016, our predecessor filed petitions for reorganization in the U.S. Bankruptcy Court (the “Bankruptcy Court”) for the Southern District of Texas (collectively, the “Chapter 11 Proceedings”). On February 28, 2017, Berry LLC emerged from bankruptcy as a stand-alone company and wholly-owned subsidiary of Berry Corp. with new management, a new board of directors and new ownership. Berry Corp. was incorporated in Delaware in February 2017 in connection with the Chapter 11 Proceedings. A final decree closing the Chapter 11 Proceedings was entered September 28, 2018, with the Court retaining jurisdiction as described in the confirmation order and without prejudice to the request of any party-in-interest to reopen the case including with respect to certain, immaterial remaining matters. Berry Corp. completed its IPO and its common stock has been trading on the Nasdaq Global Select Market ("NASDAQ") under the ticker symbol "BRY" since July 26, 2018.
We have executive offices located at 11117 River Run Boulevard, Bakersfield, California 93311 and at 16000 N. Dallas Pkwy, Ste. 500, Dallas, Texas 75248, where we have our principal executive offices. Our telephone number is (661) 616-3900 and our web address is www.bry.com. Information contained in or accessible through our website is not, and should not be deemed to be, part of this report.
Item 1A. Risk Factors
If any of the following risks actually occur, our business, financial condition and results of operations could be materially and adversely affected and we may not be able to achieve our goals. We cannot assure you that any of the events discussed in the risk factors below will not occur. Further, the risks and uncertainties described below are not the only risks and uncertainties we face. Additional risks and uncertainties not presently known to us or that we currently deem immaterial may ultimately materially affect our business.
33
Risks Related to Our Business and Industry
The risks and uncertainties described below are among the items we have identified that could materially adversely affect our business, production, strategy, growth plans, acquisitions, hedging, reserves quantities or value, operating or capital costs, financial condition, results of operations, liquidity, cash flows, our ability to meet our capital expenditure plans and other obligations and financial commitments, and our plans to return capital.
Oil, natural gas and NGL prices are volatile and directly affect our results.
The prices we receive for our oil, natural gas and NGL production and pay for natural gas purchases heavily influence our revenue, operating expenses, profitability, access to capital, future rate of growth and the carrying value of our properties. Prices for these commodities have, and may continue to, fluctuate widely in response to market uncertainty and to relatively minor changes in the supply of and demand for oil, natural gas and NGLs. For example, Brent crude oil contract prices ranged from $54.91 per Bbl at the beginning of 2019, to a high of $74.57 per Bbl and back to $56.23 per Bbl at the end of 2019. In California, the price we pay for fuel gas purchases is generally based on the Kern, Delivered Index, as well as the SoCal Index which were as low as $0.99 per MMBtu and as high as $22.38 per MMBtu for a short time in 2019 due to market disruptions. Prices remain volatile in 2020. The prices we receive for our production and pay for our gas purchases, and the levels of our production, depend on numerous factors beyond our control, which include the following:
• | worldwide and regional political, regulatory, economic and social conditions impacting the global supply and demand for, and transportation costs of, oil and natural gas, including relaxation of rules against U.S. exports; |
• | military action, war, sanctions and other conflicts; |
• | the price and quantity of foreign imports of oil, particularly in California which imports from foreign countries more than half of the oil it consumes; |
• | the impact of the U.S. dollar exchange rates on oil and expectations about future oil and gas prices; |
• | prevailing prices on local price indexes in the areas in which we operate which are affected by local market conditions and the proximity, capacity, cost and availability of gathering and transportation facilities as well as refining and processing disruptions or bottlenecks; |
• | the level of global exploration, development and production, and resulting inventories, including the significant increase in U.S. activities over the past decade; |
• | actions of OPEC, its members and other state-controlled oil companies relating to oil price and production controls; |
• | actions of other significant producers; |
• | the cost of exploring for, developing, producing and transporting reserves; |
• | weather conditions and natural disasters; |
• | other irregular events that impact our ability to conduct business or demand for our products, such as the coronavirus outbreak; and |
• | technological advances, conservation efforts and availability of alternative fuels affecting oil and gas consumption. |
Lower oil prices and higher gas prices may reduce our cash flow, borrowing ability and access to capital needed to develop existing and future reserves.
Lower oil prices and higher gas prices generally reduce the quantity of our oil reserves as those reserves expected to be produced in later years, which tend to be costlier on a per unit basis, become uneconomic. Lower gas prices may also reduce our gas reserves. In addition, a portion of our PUDs may no longer meet the economic producibility criteria
34
under the applicable rules or may be removed due to a lower amount of capital available to develop these projects within the SEC-mandated five-year limit.
In addition, oil and natural gas prices affect our drilling economics, and lower oil prices may require us to postpone or eliminate all or part of our development program, and result in the reduction of some of our proved undeveloped reserves, reducing the net present value of our proved reserves.
Our business requires continual capital expenditures. We may be unable to fund these investments through operating cash flow or obtain any needed additional capital on satisfactory terms or at all, which could lead to a decline in our oil and natural gas reserves or production. Our capital program is also susceptible to risks, including regulatory and permitting risks, that could materially affect its implementation.
Our industry is capital intensive. We have a 2020 capital expenditure budget of approximately $125 to $145 million. The actual amount and timing of our future capital expenditures may differ materially from our estimates as a result of, among other things, commodity prices, actual drilling results, the availability of drilling rigs and other services and equipment, the availability of permits, and our ability to obtain them in a timely manner or at all, legal and regulatory processes and other restrictions, and technological and competitive developments. A reduction or sustained decline in commodity prices from current levels may force us to reduce our capital expenditures, which would negatively impact our ability to grow production. Current and future laws and regulations may prevent us from being able to execute our drilling programs and development and optimization projects.
We expect to fund our capital expenditures with cash flows from our operations; however, our cash flows from operations, and access to capital should such cash flows prove inadequate, are subject to a number of variables, including:
• | the volume of hydrocarbons we are able to produce from existing wells; |
• | the prices at which our production is sold and our operating expenses; |
• | the success of our hedging program; |
• | our proved reserves, including our ability to acquire, locate and produce new reserves; |
• | our ability to borrow under the RBL Facility; |
• | and our ability to access the capital markets. |
If our revenues or the borrowing base under the RBL Facility decrease as a result of lower oil, natural gas and NGL prices, lack of required permits and other operating difficulties, declines in reserves or for any other reason, we may have limited ability to obtain the capital necessary to sustain our operations and growth at current levels. If additional capital were needed, we may not be able to obtain debt or equity financing on terms acceptable to us, if at all. Any additional debt financing, would carry interest costs, diverting capital from our business activities, which in turn could lead to a decline in our reserves and production. If cash flows generated by our operations or available borrowings under the RBL Facility were not sufficient to meet our capital requirements, the failure to obtain additional financing could result in a curtailment of our operations relating to development of our properties. See “Item 7. Management’s Discussion and Analysis of Financial Condition and Results of Operations-Liquidity and Capital Resources.”
Our business is highly regulated and governmental authorities can delay or deny permits and approvals or change the requirements governing our operations, including the permitting approval process for oil and gas exploration, extraction, operations and production activities, well stimulation, enhanced production techniques and fluid injection or disposal, that could increase costs, restrict operations and delay our implementation of, or cause us to change, our business strategy and plans.
Our operations are subject to complex and stringent federal, state, local and other laws and regulations relating to environmental protection and the exploration and development of our properties, as well as the production, transportation, marketing and sale of our products. Federal, state and local agencies may assert overlapping authority to regulate in these areas. For example, the jurisdiction, duties and enforcement authority of various state agencies have
35
significantly increased with respect to oil and natural gas activities in recent years, and these state agencies as well as certain cities and counties have significantly revised their regulations, regulatory interpretations and data collection and reporting requirements and plan to issue additional regulations of certain oil and natural gas activities in 2020. In addition, certain of these laws and regulations may apply retroactively and may impose strict or joint and several liability on us for events or conditions over which we and our predecessors had no control, without regard to fault, legality of the original activities, or ownership or control by third parties.
See “Items 1 and 2. Business and Properties—Regulation of Health, Safety and Environmental Matters” for a description of laws and regulations that affect our business. To operate in compliance with these laws and regulations, we must obtain and maintain permits, approvals and certificates from federal, state and local government authorities for a variety of activities including siting, drilling, completion, fluid injection and disposal, stimulation, operation, maintenance, transportation, marketing, site remediation, decommissioning, abandonment and water recycling and reuse. These permits are generally subject to protest, appeal or litigation, which could in certain cases delay or halt projects, production of wells and other operations. Additionally, failure to comply may result in the assessment of administrative, civil and criminal fines and penalties and liability for noncompliance, costs of corrective action, cleanup or restoration, compensation for personal injury, property damage or other losses, and the imposition of injunctive or declaratory relief restricting or limiting our operations.
Our operations in California are subject to numerous and stringent state, local and other laws and regulations that could delay or otherwise adversely impact our operations. For example, in 2019, new legislation expanded CalGEM’s duties to include public health and safety and reducing or mitigating greenhouse gas emissions while meeting the state’s energy needs, and will require CalGEM to study and prioritize controlling emissions from idle and abandoned wells, evaluate plugging and abandonment and restoration costs and associated bonding requirements. Additionally, in November 2019, the State Department of Conservation issued a press release announcing three actions by CalGEM: (1) a moratorium on approval of new high-pressure cyclic steam wells pending a study of the practice to address surface expressions experienced by certain operators; (2) review and updating of regulations regarding public health and safety near oil and natural gas operations pursuant to additional duties assigned to CalGEM by the Legislature in 2019; and (3) a performance audit of CalGEM's permitting processes for WST permits and PALs for underground injection by the State Department of Finance and an independent review and approval of the technical content of pending WST and PAL applications by Lawrence Livermore National Laboratory. In January 2020, CalGEM issued a formal notice to operators, including us, that they had issued restrictions imposing a moratorium to prohibit new underground oil-extraction wells from using high-pressure cyclic steaming process. Most recently, on February 24, 2020, a California Court of Appeals effectively invalidated a Kern County ordinance that streamlined the permitting process for oil and gas exploration, extraction, operations and production activities in unincorporated Kern County, until the County makes certain revisions to the Kern County EIR supporting the ordinance and recertifies it. Other state agencies, including CalGEM, have relied on the Kern County EIR to satisfy the CEQA requirements in connection with permitting and project approval decisions for oil and gas projects in unincorporated Kern County. We cannot predict how long it will take Kern County to recertify the Kern County EIR or to conduct a new EIR, either of which could ultimately result in the imposition of more onerous permit application requirements and limits on exploration and production activities. It is not yet known how Kern County will resolve this issue, or how long it will take to do so, and we cannot predict how long it will take or what the requirements and costs will be to obtain new permits and project approvals in the interim. It is also not yet known whether there will be significant delays or a pause in the issuance of new permits and approvals in unincorporated Kern County pending resolution of this issue.
With these regulatory changes in 2019, we have experienced delays in obtaining the permits required to develop our properties in accordance with our existing development and production plans. In late 2019 and in early 2020, we discontinued two drilling rigs and we are currently operating one rig. We are actively reviewing the UIC developments and considering the potential impacts of the Kern County Ruling, as well as our internal internal processes. As part of a contingency plan, we are preparing our internal resources to support a more time-intensive and burdensome permitting application process and the potential environmental impact review requirements to mitigate the impact to our development and production plans. If we are unable to obtain the required permits on a timely basis or at all, we may not be able to continue operating this one rig or to redeploy the other two as planned. If we are unable to employ these rigs on a timely basis, or at all, or execute our drilling program, our financial and operating results could be adversely affected.
36
Our operations may also be adversely affected by seasonal or permanent restrictions on drilling activities designed to protect various wildlife. Such restrictions may limit our ability to operate in protected areas and can intensify competition for drilling rigs, oilfield equipment, services, supplies and qualified personnel, which may lead to periodic shortages when drilling is allowed. Permanent restrictions imposed to protect threatened or endangered species or their habitat could prohibit drilling in certain areas or require the implementation of expensive mitigation measures.
Our customers, including refineries and utilities, and the businesses that transport our products to customers are also highly regulated. For example, federal and state agencies have subjected or, proposed subjecting, more gas and liquid gathering lines, pipelines and storage facilities to regulations that have increased business costs and otherwise affect the demand, volatility and other aspects of the price we pay for fuel gas. Certain municipalities have enacted restrictions on the installation of natural gas appliances and infrastructure in new residential or commercial construction, which could affect the retail natural gas market for our utility customers and the demand and prices we receive for the natural gas we produce.
Costs of compliance may increase, and operational delays or restrictions may occur as existing laws and regulations are revised or reinterpreted, or as new laws and regulations become applicable to our operations, each of which has occurred in the past. For example, our costs have recently begun to increase due to new fluid injection regulations, data requirements for permitting, and idle well decommissioning regulations. For instance, in 2019 we paid $27 million in asset retirement obligations, an increase from $8 million in 2018, largely due to the new idle well regulations and our focus on EH&S as we develop existing fields. In addition, we may experience delays, as we have in the past, due to insufficient internal processes and personnel resource constraints at regulatory agencies that impede their ability to process permits in a timely manner that aligns with our production projects.
Government authorities and other organizations continue to study health, safety and environmental aspects of oil and natural gas operations, including those related to air, soil and water quality, ground movement or seismicity and natural resources. Government authorities have also adopted or proposed new or more stringent requirements for permitting, well construction and public disclosure or environmental review of, or restrictions on, oil and natural gas operations. Such requirements or associated litigation could result in potentially significant added costs to comply, delay or curtail our exploration, development, fluid injection and disposal or production activities, and preclude us from drilling, completing or stimulating wells, which could have an adverse effect on our expected production, other operations and financial condition.
Changes to elected or appointed officials or their priorities and policies could result in different approaches to the regulation of the oil and natural gas industry. We cannot predict the actions the California governor or legislature may take with respect to the regulation of our business, the oil and natural gas industry or the state's economic, fiscal or environmental policies.
We may be unable to, or may choose not to, enter into sufficient fixed-price purchase or other hedging agreements to fully protect against decreasing spreads between the price of natural gas and oil on an energy equivalent basis or may otherwise be unable to obtain sufficient quantities of natural gas to conduct our steam operations economically or at desired levels, and our commodity-price risk-management activities may prevent us from fully benefiting from price increases and may expose us to other risks.
To develop our heavy oil in California we must economically generate steam using natural gas. We seek to reduce our exposure to the potential unavailability of, pricing increases for, and volatility in pricing of, natural gas by entering into fixed-price purchase agreements and other hedging transactions. We seek to reduce our exposure to potential price increases and volatility in pricing of oil by entering into swaps, calls and other hedging transactions. We may be unable to, or may choose not to, enter into sufficient such agreements to fully protect against decreasing spreads between the price of natural gas and oil on an energy equivalent basis or may otherwise be unable to obtain sufficient quantities of natural gas to conduct our steam operations economically or at desired levels. Our commodity-price risk-management activities may prevent us from fully benefiting from price increases. Additionally, our hedges are based on major oil and gas indexes, which may not fully reflect the prices we realize locally. Consequently, the price protection we receive may not fully offset local price declines.
37
As of December 31, 2019, we have hedged crude oil production at the following approximate volumes and Brent prices: 16.7 MBbl/d at $64 per barrel in 2020, and 1.0 MBbl/d at $59 per barrel in 2021. We have also hedged gas purchases at the following approximate volumes and prices: 51.7 MMbtu/d at $2.95 per in 2020, and 1.2 MMbtu/d at $2.50 in 2021.
Our commodity-price risk-management activities may also expose us to the risk of financial loss in certain circumstances, including instances in which:
• | the counterparties to our hedging or other price-risk management contracts fail to perform under those arrangements; and |
• | an event materially impacts oil and natural gas prices in the opposite direction of our derivative positions. |
Estimates of proved reserves and related future net cash flows are not precise. The actual quantities of our proved reserves and future net cash flows may prove to be lower than estimated.
Estimation of reserves and related future net cash flows is a partially subjective process of estimating accumulations of oil and natural gas that includes many uncertainties. Our estimates are based on various assumptions, which may ultimately prove to be inaccurate, including:
• | the similarity of reservoir performance in other areas to expected performance from our assets; |
• | the quality, quantity and interpretation of available relevant data; |
• | commodity prices (see “—Oil, natural gas and NGL prices are volatile and directly affect our results.”); |
• | production, operating costs, taxes and costs related to GHG regulations; |
• | development costs; |
• | the effects of government regulations; and |
• | future workover and asset retirement costs. |
Misunderstanding these variables, inaccurate assumptions, changed circumstances or new information could require us to make significant negative reserves revisions.
We currently expect improved recovery, extensions and discoveries and, potentially acquisitions, to be our main sources for reserves additions. However, factors such as the availability of capital, geology, government regulations and permits, the effectiveness of development plans and other factors could affect the source or quantity of future reserves additions. Any material inaccuracies in our reserves estimates could materially affect the net present value of our reserves, which could adversely affect our borrowing base and liquidity under the RBL Facility, as well as our results of operations.
Unless we replace oil and natural gas reserves, our future reserves and production will decline.
Unless we conduct successful development and exploration activities or acquire properties containing proved reserves, our proved reserves will decline as those reserves are produced. Success requires us to deploy sufficient capital to projects that are geologically and economically attractive which is subject to the capital, development, operating and regulatory risks already discussed above under the heading “—Our business requires continual capital expenditures. We may be unable to fund these investments through operating cash flow or obtain any needed additional capital on satisfactory terms or at all, which could lead to a decline in our oil and natural gas reserves or production. Our capital program is also susceptible to risks, including regulatory and permitting risks, that could materially affect its implementation.” Over the long-term, a continuing decline in our production and reserves would reduce our liquidity and ability to satisfy our debt obligations by reducing our cash flow from operations and the value of our assets.
38
Drilling for and producing oil and natural gas are high risk activities with many uncertainties that could adversely affect our business.
The success of our development, production and acquisition activities are subject to numerous risks beyond our control, including the risk that drilling will not result in commercially viable production or may result in a downward revision of our estimated proved reserves due to:
• | poor production response; |
• | ineffective application of recovery techniques; |
• | increased costs of drilling, completing, stimulating, equipping, operating, maintaining and abandoning wells; |
• | delays or cost overruns caused by equipment failures, accidents, environmental hazards, adverse weather conditions, permitting or construction delays, title disputes, surface access disputes and other matters; and |
• | misinterpretation of geophysical and geological analyses, production data and engineering studies. |
Additional factors may delay or cancel our operations, including:
• | delays due to regulatory requirements and procedures, including unavailability or other restrictions limiting permits and limitations on water disposal, emission of GHGs, steam injection and well stimulation, such as California’s recent limitations on cyclic steaming above the fracture gradient; |
• | pressure or irregularities in geological formations; |
• | shortages of or delays in obtaining equipment, qualified personnel or supplies including water for steam used in production or pressure maintenance; |
• | delays in access to production or pipeline transmission facilities; and |
• | power outages imposed by utilities which provide a portion of our electricity needs in order to avoid fire hazards and inspect lines in connection with seasonal strong winds, have begun to occur recently and may impact our operations. |
Any of these risks can cause substantial losses, including personal injury or loss of life, damage to property, reserves and equipment, pollution, environmental contamination and regulatory penalties.
We may not drill our identified sites at the times we scheduled or at all.
We have specifically identified locations for drilling over the next several years, which represent a significant part of our long-term growth strategy. Our actual drilling activities may materially differ from those presently identified. Legislative and regulatory developments, such as the California moratorium on approval of new high-pressure cyclic steam wells pending a study of the practice to address surface expressions experienced by certain operators, could prevent us from planned drilling activities. Additionally, as we experienced late in the fourth quarter and continuing to date, new regulations and legislative activity could result in a significant decline in the permits required to develop our properties in accordance with our plans. If future drilling results in these projects do not establish sufficient reserves to achieve an economic return, we may curtail drilling or development of these projects. Accordingly, we cannot guarantee that these prospective drilling locations or any other drilling locations we have identified will ever be drilled or if we will be able to economically produce oil or natural gas from these drilling locations. In addition, some of our leases could expire if we do not establish production in the leased acreage. The combined net acreage covered by leases expiring in the next three years represented approximately 13% of our total net acreage at December 31, 2019.
39
Potential future legislation may generally affect the taxation of natural gas and oil exploration and development companies and may adversely affect our operations.
In past years, federal and state level legislation has been proposed that would, if enacted into law, make significant changes to tax laws, including to certain key U.S. federal and state income tax provisions currently available to natural gas and oil exploration and development companies.
For example, in California, there have been proposals for new taxes on profits that might have a negative impact on us. Although the proposals have not become law, campaigns by various special interest groups could lead to future additional oil and natural gas severance or other taxes. The imposition of such taxes could significantly reduce our profit margins and cash flow and otherwise significantly increase our costs.
Competition in the oil and natural gas industry is intense, making it more difficult for us to acquire properties, market oil or natural gas and secure trained personnel.
Our future success will depend on our ability to evaluate, select and acquire suitable properties, market our production and secure skilled personnel to operate our assets in a highly competitive environment. Also, there is substantial competition for capital available for investment in the oil and natural gas industry. Many of our competitors possess and employ greater financial, technical and personnel resources than we do.
We may be unable to make attractive acquisitions or successfully integrate acquired businesses or assets or enter into attractive joint ventures, and any inability to do so may disrupt our business and hinder our ability to grow.
There is no guarantee we will be able to identify or complete attractive acquisitions. Our capital expenditure budget for 2020 does not allocate any amounts for acquisitions of oil and natural gas properties. If we make acquisitions, we would need to use cash flows or seek additional capital, both of which are subject to uncertainties discussed in this section. Competition may also increase the cost of, or cause us to refrain from, completing acquisitions. Our debt arrangements impose certain limitations on our ability to enter into mergers or combination transactions and to incur certain indebtedness. See “—Our existing debt agreements have restrictive covenants that could limit our growth, financial flexibility and our ability to engage in certain activities.” In addition, the success of completed acquisitions will depend on our ability to integrate effectively the acquired business into our existing operations, may involve unforeseen difficulties and may require a disproportionate amount of our managerial and financial resources.
We are dependent on our cogeneration facilities to produce steam for our operations. Contracts for the sale of surplus electricity, economic market prices and regulatory conditions affect the economic value of these facilities to our operations.
We are dependent on five cogeneration facilities that, combined, provide approximately 22% of our steam capacity and approximately 48% of our field electricity needs in California at a discount to market rates. To further offset our costs, we sell surplus power to California utility companies produced by three of our cogeneration facilities under long-term contracts. Should we lose, be unable to renew on favorable terms, or be unable to replace such contracts, we may be unable to realize the cost offset currently received. Our ability to benefit from these facilities is also affected by our ability to consistently generate surplus electricity and fluctuations in commodity prices. For example, during 2019 electricity sales decreased by $6 million, or 17%, due to lower unit sales resulting from unexpected downtime at our largest cogen during the summer when we receive peak pricing, and lower year–over–year gas pricing. Furthermore, market fluctuations in electricity prices and regulatory changes in California could adversely affect the economics of our cogeneration facilities and any corresponding increase in the price of steam could significantly impact our operating costs. If we were unable to find new or replacement steam sources, lose existing sources or experience installation delays, we may be unable to maximize production from our heavy oil assets. If we were to lose our electricity sources, we would be subject to the electricity rates we could negotiate. For a more detailed discussion of our electricity sales contracts, see “Items 1 and 2. Business and Properties—Operational Overview—Electricity.”
40
Our existing debt agreements have restrictive covenants that could limit our growth, financial flexibility and our ability to engage in certain activities. In addition, the borrowing base under the RBL Facility is subject to periodic redeterminations and our lenders could reduce capital available to us for investment.
The RBL Facility and the indenture governing our 2026 Notes have restrictive covenants that could limit our growth, financial flexibility and our ability to engage in activities that may be in our long-term best interests. Failure to comply with these covenants could result in an event of default that, if not cured or waived, could result in the acceleration of all of our indebtedness. The amount available to be borrowed under the RBL Facility is subject to a borrowing base, which will be redetermined semiannually and will depend on the estimated volumes and cash flows of our proved oil and natural gas reserves and other information deemed relevant by the administrative agent of, or two-thirds of the lenders under, the RBL facility. Reduction of our borrowing base under the RBL Facility could reduce the capital available to us for investment in our business. For details regarding the terms of the RBL Facility and our 2026 Notes, see "Liquidity and Capital Resources".
These agreements contain covenants, that, among other things, limit our ability to:
• | incur or guarantee additional indebtedness or issue certain types of preferred stock; |
• | pay dividends on capital stock or redeem, repurchase or retire our capital stock or subordinated indebtedness; |
• | transfer, sell or dispose of assets; |
• | make investments; |
• | create certain liens securing indebtedness; |
• | enter into agreements that restrict dividends or other payments from our restricted subsidiaries to us; |
• | consolidate, merge or transfer all or substantially all of our assets; |
• | hedge future production or interest rates; |
• | repay or prepay certain indebtedness prior to the due date; |
• | engage in transactions with affiliates; and |
• | engage in certain other transactions without the prior consent of the lenders. |
In addition, the RBL Facility requires us to maintain certain financial ratios or to reduce our indebtedness if we are unable to comply with such ratios, which may limit our ability to borrow funds to withstand a future downturn in our business, or to otherwise conduct necessary corporate activities. We may also be prevented from taking advantage of business opportunities that arise because of these limitations.
Our failure to comply with these covenants could result in an event of default that, if not cured or waived, could result in the acceleration of all of our indebtedness. If that occurs, we may not be able to make all of the required payments or borrow sufficient funds to refinance such indebtedness. Even if new financing were available at that time, it may not be on terms that are acceptable to us.
The amount available to be borrowed under the RBL Facility is subject to a borrowing base and will be redetermined semiannually and will depend on the estimated volumes and cash flows of our proved oil and natural gas reserves and other information deemed relevant by the administrative agent of, or two-thirds of the lenders under, the RBL Facility. We, the administrative agent and lenders, each may request one additional redetermination between each regularly scheduled redetermination. Furthermore, our borrowing base is subject to automatic reductions due to certain asset sales and hedge terminations, the incurrence of certain other debt and other events as provided in the RBL Facility. For example, the RBL Facility currently provides that to the extent we incur certain unsecured indebtedness, our borrowing base will be reduced by an amount equal to 25% of the amount of such unsecured debt that exceeds the amount, if any, of certain other debt that is being refinanced by such unsecured debt. We could be required to repay a portion of the RBL Facility to the extent that after a redetermination our outstanding borrowings at such time exceed the redetermined
41
borrowing base. Currently, we have elected to limit the amount we can borrow under the RBL Facility to an amount well below our borrowing base.
We may not be able to generate sufficient cash to service all of our indebtedness and may be forced to take other actions to satisfy our obligations under our debt arrangements, which may not be successful.
Our ability to make scheduled payments on or to refinance our debt obligations, including the RBL Facility and our 2026 Notes, depends on our financial condition and operating performance, which are subject to prevailing economic and competitive conditions and certain financial, business and other factors that may be beyond our control. If oil and natural gas prices were to deteriorate and remain at low levels for an extended period of time, our cash flows from operating activities may be insufficient to permit us to pay the principal, premium, if any, and interest on our indebtedness. In the absence of sufficient cash flows and capital resources, we could face substantial liquidity problems and might be required to dispose of material assets or operations to meet debt service and other obligations. The RBL Facility and our 2026 Notes currently restrict our ability to dispose of assets and our use of the proceeds from any such disposition. We may not be able to consummate dispositions, and the proceeds of any such disposition may not be adequate to meet any debt service obligations then due.
Declines in commodity prices, changes in expected capital development, increases in operating costs or adverse changes in well performance may result in write-downs of the carrying amounts of our assets.
We evaluate the impairment of our oil and natural gas properties whenever events or changes in circumstances indicate that the carrying value may not be recoverable. Based on specific market factors and circumstances at the time of prospective impairment reviews, and the continuing evaluation of development plans, production data, economics and other factors, we may be required to write down the carrying value of our properties. A write down constitutes a non-cash charge to earnings. For example, for the year ended December 31, 2019, we recorded an impairment charge of $51 million for the Piceance gas properties in Colorado.
We have significant concentrations of credit risk with our customers and the inability of one or more of our customers to meet their obligations or the loss of any one of our major oil and natural gas purchasers may have a material adverse effect on our business, financial condition, results of operations and cash flows.
We have significant concentrations of credit risk with the purchasers of our oil and natural gas. For the year ended December 31, 2019, sales to Andeavor, Phillips 66 and Kern Oil & Refining accounted for approximately 36%, 24% and 13%, respectively, of our sales. This concentration may impact our overall credit risk because our customers may be similarly affected by changes in economic conditions or commodity price fluctuations. We do not require our customers to post collateral. If the purchasers of our oil and natural gas become insolvent, we may be unable to collect amounts owed to us. Also, if we were to lose any one of our major customers, the loss could cause us to cease or delay both production and sale of our oil and natural gas in the area supplying that customer.
Due to the terms of supply agreements with our customers, we may not know that a customer is unable to make payment to us until almost two months after production has been delivered. We do not require our customers to post collateral to protect our ability to be paid.
Our producing properties are located primarily in California, making us vulnerable to risks associated with having operations concentrated in this geographic area.
We operate primarily in California. This geographic concentration disproportionately affects the success and profitability of our operations exposing us to local price fluctuations, changes in state or regional laws and regulations, political risks, limited acquisition opportunities where we have the most operating experience and infrastructure, limited storage options, drought conditions, and other regional supply and demand factors, including gathering, pipeline and transportation capacity constraints, limited potential customers, infrastructure capacity and availability of rigs, equipment, oil field services, supplies and labor. We discuss such specific risks in more detail elsewhere in this section.
42
Many of our operations are currently conducted in locations in California that may be at risk of damage from fire, mudslides, earthquakes or other natural disasters.
We currently conduct operations in California near known wildfire and mudslide areas and earthquake fault zones. A future natural disaster, such as a fire, mudslide or an earthquake, could cause substantial delays in our operations, damage or destroy equipment, prevent or delay transport of our products and cause us to incur additional expenses, which would adversely affect our business, financial condition and results of operations. In addition, our facilities would be difficult to replace and would require substantial lead time to repair or replace. These events could occur with greater frequency as a result of the potential impacts from climate change. The insurance we maintain against earthquakes, mudslides, fires and other natural disasters would not be adequate to cover a total loss of our facilities, may not be adequate to cover our losses in any particular case and may not continue to be available to us on acceptable terms, or at all.
Operational issues and inability or unwillingness of third parties to provide sufficient facilities and services to us on commercially reasonable terms or otherwise could restrict access to markets for the commodities we produce.
Our ability to market our production of oil, gas and NGLs depends on a number of factors, including the proximity of production fields to pipelines, refineries and terminal facilities, competition for capacity on such facilities, damage, shutdowns and turnarounds at such facilities and their ability to gather, transport or process our production. If these facilities are unavailable to us on commercially reasonable terms or otherwise, we could be forced to shut in some production or delay or discontinue drilling plans and commercial production following a discovery of hydrocarbons. We rely, and expect to rely in the future, on third party facilities for services such as storage, processing and transmission of our production. Our plans to develop and sell our reserves could be materially and adversely affected by the inability or unwillingness of third parties to provide sufficient facilities and services to us on commercially reasonable terms or otherwise. If our access to markets for commodities we produce is restricted, our costs could increase and our expected production growth may be impaired.
Derivatives legislation and regulations could have an adverse effect on our ability to use derivative instruments to reduce the risks associated with our business.
The Dodd-Frank Act, enacted in 2010, establishes federal oversight and regulation of the over-the-counter (“OTC”) derivatives market and entities, like us, that participate in that market. Rules and regulations applicable to OTC derivatives transactions, and these rules may affect both the size of positions that we may hold and the ability or willingness of counterparties to trade opposite us, potentially increasing costs for transactions. Moreover, such changes could materially reduce our hedging opportunities which could adversely affect our revenues and cash flow during periods of low commodity prices. While many Dodd-Frank Act regulations are already in effect, the rulemaking and implementation process is ongoing, and the ultimate effect of the adopted rules and regulations and any future rules and regulations on our business remains uncertain.
In addition, the European Union and other non-U.S. jurisdictions are implementing regulations with respect to the derivatives market. To the extent we transact with counterparties in foreign jurisdictions or counterparties with other businesses that subject them to regulation in foreign jurisdictions, we may become subject to, or otherwise be affected by, such regulations. Even though certain of the European Union implementing regulations have become effective, the ultimate effect on our business of the European Union implementing regulations (including future implementing rules and regulations) remains uncertain.
Our operations are subject to a series of risks arising out of the threat of climate change that could result in increased operating costs, limit the areas in which we may conduct oil and natural gas exploration and production activities, and reduce demand for the oil and natural gas we produce.
The threat of climate change continues to attract considerable attention in the United States and in foreign countries. Numerous proposals have been made and could continue to be made at the international, national, regional and state levels of government to monitor and limit existing emissions of GHGs as well as to restrict or eliminate such future emissions. As a result, our oil and natural gas exploration and production operations are subject to a series of regulatory,
43
political, litigation, and financial risks associated with the production and processing of fossil fuels and emission of GHGs.
In the United States, no comprehensive climate change legislation has been implemented at the federal level. However, with the U.S. Supreme Court finding that GHG emissions constitute a pollutant under the CAA, the EPA has adopted rules that, among other things, establish construction and operating permit reviews for GHG emissions from certain large stationary sources, require the monitoring and annual reporting of GHG emissions from certain petroleum and natural gas system sources in the United States, implement New Source Performance Standards directing the reduction of methane from certain new, modified, or reconstructed facilities in the oil and natural gas sector, and together with the DOT, implement GHG emissions limits on vehicles manufactured for operation in the United States.
Additionally, various states and groups of states have adopted or are considering adopting legislation, regulations or other regulatory initiatives that are focused on such areas as GHG cap and trade programs, carbon taxes, reporting and tracking programs, and restriction of emissions. For example, California, through the CARB has implemented a cap and trade program for GHG emissions that sets a statewide maximum limit on covered GHG emissions, and this cap declines annually to reach 40% below 1990 levels by 2030. Covered entities must either reduce their GHG emissions or purchase allowances to account for such emissions. Separately, California has implemented LCFS and associated tradable credits that require a progressively lower carbon intensity of the state's fuel supply than baseline gasoline and diesel fuels. CARB has also promulgated regulations regarding monitoring, leak detection, repair and reporting of methane emissions from both existing and new oil and gas production facilities. Similar regulations applicable to oil and gas facilities have been promulgated in Colorado.
In September 2018, California adopted a law committing California , the fifth largest economy in the world, to the use of 100% zero-carbon electricity by 2045, and the Governor of California also signed an executive order committing California to total economy-wide carbon neutrality by 2045. We cannot predict how these various laws, regulations and orders may ultimately affect our operations. However, these initiatives could result in decreased demand for the oil, natural gas, and NGLs that we produce, and therefore adversely effect our revenues and results of operations.
At the international level, there is a non-binding agreement, the United Nations-sponsored “Paris Agreement,” for nations to limit their GHG emissions through individually-determined reduction goals every five years after 2020. Although the United States has announced its withdrawal from such agreement, effective November 4, 2020, several U.S. states and local governments have announced their intention to adhere to the goals of the Paris Agreement.
Governmental, scientific, and public concern over the threat of climate change arising from GHG emissions has resulted in increasing political risks in the United States, including climate change related pledges made by certain candidates seeking the office of the President of the United States in 2020. Two critical declarations made by one or more candidates running for the Democratic nomination for President include threats to take actions banning hydraulic fracturing of oil and natural gas wells and banning new leases for production of minerals on federal properties. Our operations involve the use of hydraulic fracturing activities and we also have operations on federal lands under the jurisdiction of the BLM. Other actions that could be pursued by presidential candidates may include more restrictive requirements for the establishment of pipeline infrastructure or the permitting of LNG export facilities, as well as the reversal of the United States’ withdrawal from the Paris Agreement in November 2020.
Litigation risks are also increasing, as a number of cities and other local governments have sought to bring suit against the largest oil and natural gas exploration and production companies in state or federal court, alleging, among other things, that such companies created public nuisances by producing fuels that contributed to global warming effects, such as rising sea levels, and therefore are responsible for roadway and infrastructure damages as a result, or alleging that the companies have been aware of the adverse effects of climate change for some time but withheld material information from their investors by failing to adequately disclose those impacts.
There are also increasing financial risks for fossil fuel producers as shareholders currently invested in fossil-fuel energy companies concerned about the potential effects of climate change may elect in the future to shift some or all of their investments into non-energy related sectors. Institutional lenders who provide financing to fossil-fuel energy companies also have become more attentive to sustainable lending practices and some of them may elect not to provide
44
funding for fossil fuel energy companies. Additionally, the lending practices of institutional lenders have been the subject of intensive lobbying efforts in recent years by environmental activists, proponents of the international Paris Agreement, and other groups concerned about climate change to restrict fossil fuel producers’ access to capital. Limitation of investments in and financings for fossil fuel energy companies could result in the restriction, delay or cancellation of drilling programs or development or production activities.
The adoption and implementation of new or more stringent international, federal or state legislation, regulations or other regulatory initiatives that impose more stringent standards for GHG emissions from oil and natural gas producers such as ourselves or otherwise restrict the areas in which we may produce oil and natural gas or generate GHG emissions could result in increased costs of compliance or costs of consuming, and thereby reduce demand for or erode value for, the oil and natural gas that we produce. Additionally, political, litigation, and financial risks may result in our restricting or canceling oil and natural gas production activities, incurring liability for infrastructure damages as a result of climatic changes, or impairing our ability to continue to operate in an economic manner. Moreover, there are increasing risks to operations resulting from the potential physical impacts of climate change, such as drought, wildfires, damage to infrastructure and resources from flooding and other natural disasters and other physical disruptions. One or more of these developments could have a material adverse effect on our business, financial condition and results of operation.
We may incur substantial losses and be subject to substantial liability claims as a result of catastrophic events. We may not be insured for, or our insurance may be inadequate to protect us against, these risks.
We are not fully insured against all risks. Our oil and natural gas exploration and production activities, are subject to risks such as fires, explosions, oil and natural gas leaks, oil spills, pipeline and tank ruptures and unauthorized discharges of brine, well stimulation and completion fluids, toxic gases or other pollutants into the surface and subsurface environment, equipment failures and industrial accidents. We are exposed to similar risks indirectly through our customers and other market participants such as refiners. Other catastrophic events such as earthquakes, floods, mudslides, fires, droughts, contagious diseases, terrorist attacks and other events that cause operations to cease or be curtailed may adversely affect our business and the communities in which we operate. For example, utilities have begun to suspend electric services to avoid wildfires during windy periods in California, a risk that is not insured. We may be unable to obtain, or may elect not to obtain, insurance for certain risks if we believe that the cost of available insurance is excessive relative to the risks presented.
We may be involved in legal proceedings that could result in substantial liabilities.
Like many oil and natural gas companies, we are from time to time involved in various legal and other proceedings, such as title, royalty or contractual disputes, regulatory compliance matters and personal injury or property damage matters, in the ordinary course of our business. Such legal proceedings are inherently uncertain and their results cannot be predicted. Regardless of the outcome, such proceedings could have a material adverse impact on us because of legal costs, diversion of the attention of management and other personnel and other factors. In addition, resolution of one or more such proceedings could result in liability, loss of contractual or other rights, penalties or sanctions, as well as judgments, consent decrees or orders requiring a change in our business practices. Accruals for such liability, penalties or sanctions may be insufficient, and judgments and estimates to determine accruals or range of losses related to legal and other proceedings could change materially from one period to the next.
The loss of senior management or technical personnel could adversely affect operations.
We depend on, and could be deprived of, the services of our senior management and technical personnel. We do not maintain, nor do we plan to obtain, any insurance against the loss of services of any of these individuals.
Information technology failures and cyberattacks could affect us significantly.
We rely on electronic systems and networks to communicate, control and manage our operations and prepare our financial management and reporting information. Without accurate data from and access to these systems and networks, our ability to communicate and control and manage our business could be adversely affected.
45
We face various security threats, including cybersecurity threats to gain unauthorized access to sensitive information or to render data or systems unusable, threats to the security of our facilities and infrastructure or third-party facilities and infrastructure, such as processing plants and pipelines, and threats from terrorist acts. Our implementation of various procedures and controls to monitor and mitigate security threats and to increase security for our information, facilities and infrastructure may result in increased capital and operating costs. Moreover, there can be no assurance that such procedures and controls will be sufficient to prevent security breaches from occurring. If security breaches were to occur, they could lead to losses of sensitive information, critical infrastructure or capabilities essential to our operations. If we were to experience an attack and our security measures failed, the potential consequences to our business and the communities in which we operate could be significant and could harm our reputation and lead to financial losses from remedial actions, loss of business or potential liability.
Risks Related to our Capital Stock
There may be circumstances in which the interests of our significant stockholders could be in conflict with the interests of our other stockholders.
A large portion of our common stock is beneficially owned by a relatively small number of stockholders. Circumstances may arise in which these stockholders may have an interest in pursuing or preventing acquisitions, divestitures, hostile takeovers or other transactions, including the payment of dividends or the issuance of additional equity or debt, that, in their judgment, could enhance their investment in us or in another company in which they invest. Such transactions might adversely affect us or other holders of our common stock. In addition, our significant concentration of share ownership may adversely affect the trading price of our common stock because investors may perceive disadvantages in owning shares in companies with significant stockholder concentrations.
Our significant stockholders and their affiliates are not limited in their ability to compete with us, and the corporate opportunity provisions in the Certificate of Incorporation could enable our significant stockholders to benefit from corporate opportunities that might otherwise be available to us.
Our governing documents provide that our stockholders and their affiliates are not restricted from owning assets or engaging in businesses that compete directly or indirectly with us. In particular, subject to the limitations of applicable law, the Certificate of Incorporation, among other things:
• | permits stockholders to make investments in competing businesses; and |
• | provides that if one of our directors who is also an employee, officer or director of a stockholder (a “Dual Role Person”), becomes aware of a potential business opportunity, transaction or other matter, they will have no duty to communicate or offer that opportunity to us. |
Our director who is a Dual Role Person may become aware, from time to time, of certain business opportunities (such as acquisition opportunities) and may direct such opportunities to other businesses in which our stockholders have invested, in which case we may not become aware of, or otherwise have the ability to pursue, such opportunity. Further, such businesses may choose to compete with us for these opportunities, possibly causing these opportunities to be unavailable to us or causing them to be more expensive for us to pursue.
Future sales of our common stock in the public market could reduce our stock price, and any additional capital raised by us through the sale of equity or convertible securities may dilute your ownership in us.
Certain of our largest stockholders comprised creditors of Berry LLC prior to the Chapter 11 Proceedings and we cannot predict when or whether they will sell their shares of common stock. Future sales, or concerns about them, may put downward pressure on the market price of our common stock
We may sell or otherwise issue additional shares of common stock or securities convertible into shares of our common stock. Berry Corp.'s Certificate of Incorporation provides for authorized capital stock consisting of 750,000,000
46
shares of common stock and 250,000,000 shares of preferred stock. In addition, we registered shares of the great majority of our common stock for resale. For more information see Exhibit 4.4 to our Annual Report on Form 10-K.
The issuance of any securities for acquisitions, financing, upon conversion or exercise of convertible securities, or otherwise may result in a reduction of the book value and market price of our outstanding common stock. If we issue any such additional securities, the issuance will cause a reduction in the proportionate ownership and voting power of all current stockholders. We cannot predict the size of any future issuances of our common stock or securities convertible into common stock or the effect, if any, that future issuances and sales of shares of our common stock will have on the market price of our common stock. Sales of substantial amounts of our common stock (including shares issued in connection with an acquisition), or the perception that such sales could occur, may adversely affect prevailing market prices of our common stock.
Shares of our common stock are also reserved for issuance as equity-based awards to employees, directors and certain other persons under the second amended and restated 2017 Omnibus Incentive Plan (our “Omnibus Plan”). We have filed a registration statement with the SEC on Form S-8 providing for the registration of shares of our common stock issued or reserved for issuance under our Omnibus Plan. Subject to the satisfaction of vesting conditions, the expiration of certain lock-up agreements and the requirements of Rule 144, shares registered under the registration statement on Form S-8 may be made available for resale immediately in the public market without restriction. Investors may experience dilution in the value of their investment upon the exercise of any equity awards that may be granted or issued pursuant to the Omnibus Plan in the future.
The payment of dividends will be at the discretion of our Board of Directors.
While we have regularly declared a quarterly dividend since our July IPO, including a dividend of $0.12 per share for the first quarter of 2020, and we currently intend to continue to pay a dividend , the payment and amount of future dividend payments, if any, are subject to declaration by our Board of Directors. Such payments will depend on various factors, including actual results of operations, liquidity and financial condition, net cash provided by operating activities, restrictions imposed by applicable law, our taxable income, our operating expenses and other factors our board of directors deems relevant. Covenants contained in our RBL Facility and the indentures governing our 2026 Notes could limit the payment of dividends. We are under no obligation to make dividend payments on our common stock and may cease such payments at any time in the future.
We may issue preferred stock whose terms could adversely affect the voting power or value of our common stock.
The Certificate of Incorporation authorizes us to issue, without the approval of our stockholders, one or more classes or series of preferred stock having such designations, preferences, limitations and relative rights, including preferences over our common stock respecting dividends and distributions, as our board of directors may determine. The terms of one or more classes or series of preferred stock could adversely impact the voting power or value of our common stock. For example, we might grant holders of preferred stock the right to elect some number of our directors in all events or on the happening of specified events or the right to veto specified transactions. Similarly, the repurchase or redemption rights or liquidation preferences we might assign to holders of preferred stock could affect the residual value of our common stock.
We are an “emerging growth company,” and are able take advantage of reduced disclosure requirements applicable to “emerging growth companies,” which could make our common stock less attractive to investors.
We are an “emerging growth company” and, for as long as we continue to be an “emerging growth company,” we intend to take advantage of certain exemptions from various reporting requirements, including auditor attestation requirements or any new requirements adopted by the Public Company Accounting Oversight Board (the “PCAOB”) requiring mandatory audit firm rotation, reduced disclosure obligations regarding executive compensation in our periodic reports and proxy statements and exemptions from the requirements of holding a non-binding advisory vote on executive compensation and stockholder approval of any golden parachute payments not previously approved. We could be an “emerging growth company” for up to five years, or until the earliest of (i) the last day of the first fiscal year in which our annual gross revenues exceed $1.07 billion, (ii) as of the end of the fiscal year that we become a
47
“large accelerated filer” as defined in Rule 12b-2 under the Securities Exchange Act of 1934, as amended (the “Exchange Act”), which would occur if the market value of our common stock that is held by non-affiliates exceeds $700 million as of the last business day of our most recently completed second fiscal quarter, or (iii) the date on which we have issued more than $1 billion in non-convertible debt during the preceding three-year period.
We intend to take advantage of the reduced reporting requirements and exemptions, including the longer phase-in periods for the adoption of new or revised financial accounting standards which lasts until those standards apply to private companies or we no longer qualify as an emerging growth company. Our election to use the phase-in periods permitted by this election may make it difficult to compare our financial statements to those companies who will comply with new or revised financial accounting standards. If we were to subsequently elect instead to comply with these public company effective dates, such election would be irrevocable.
To the extent investors find our common stock less attractive as a result of our reduced reporting and exemptions, there may be a less active trading market for our common stock, and our stock price may be more volatile.
Our internal control over financial reporting is not currently required to meet all of the standards required by Section 404 of the Sarbanes-Oxley Act, but failure to achieve and maintain effective internal control over financial reporting in accordance with Section 404 of the Sarbanes-Oxley Act could have a material adverse effect on our business and share price.
Section 404 of the Sarbanes-Oxley Act requires us to provide annual management assessments of the effectiveness of our internal control over financial reporting. However, our independent registered public accounting firm will not be required to attest to the effectiveness of our internal control over financial reporting pursuant to Section 404 of the Sarbanes-Oxley Act until we are no longer an “emerging growth company,” which could be up to five years from our IPO.
Effective internal controls are necessary for us to provide reliable financial reports, safeguard our assets, and prevent fraud. If we cannot provide reliable financial reports, safeguard our assets or prevent fraud, our reputation and operating results could be harmed. The rules governing the standards that must be met for our management to assess our internal control over financial reporting are complex and require significant documentation, testing and possible remediation.
We may encounter problems or delays in completing the implementation of effective internal controls. Further, failure to achieve and maintain an effective internal control environment could have a material adverse effect on our business and share price and could limit our ability to report our financial results accurately and timely.
Certain provisions of our Certificate of Incorporation and Bylaws, may make it difficult for stockholders to change the composition of our board of directors and may discourage, delay or prevent a merger or acquisition that some stockholders may consider beneficial.
Certain provisions of the Certificate of Incorporation and Bylaws may have the effect of delaying or preventing changes in control if our board of directors determines that such changes in control are not in the best interests of us and our stockholders. For more information see Exhibit 4.4 to our Annual Report on Form 10-K.
For example, the Certificate of Incorporation and Bylaws include provisions that (i) authorize our board of directors to issue “blank check” preferred stock and to determine the price and other terms, including preferences and voting rights, of those shares without stockholder approval and (ii) establish advance notice procedures for nominating directors or presenting matters at stockholder meetings.
These provisions could enable the board of directors to delay or prevent a transaction that some, or a majority, of the stockholders may believe to be in their best interests and, in that case, may discourage or prevent attempts to remove and replace incumbent directors. These provisions may also discourage or prevent any attempts by our stockholders to replace or remove our current management by making it more difficult for stockholders to replace members of our board of directors, which is responsible for appointing the members of our management.
48
Our Certificate of Incorporation designates the Court of Chancery of the State of Delaware as the sole and exclusive forum for certain types of actions and proceedings that may be initiated by our stockholders, which could limit our stockholders’ ability to obtain a favorable judicial forum for disputes with us or our directors, officers, employees or agents.
Our Certificate of Incorporation provides that, unless we consent in writing to the selection of an alternative forum, the Court of Chancery of the State of Delaware will, to the fullest extent permitted by applicable law, be the sole and exclusive forum for (i) any derivative action or proceeding brought on our behalf, (ii) any action asserting a claim of breach of a fiduciary duty owed by any of our directors, officers or other employees to us or our stockholders, (iii) any action asserting a claim against us, our directors, officers or employees arising pursuant to any provision of the Delaware General Corporation Law, our Certificate of Incorporation or our Bylaws or (iv) any action asserting a claim against us, our directors, officers or employees that is governed by the internal affairs doctrine, in each such case subject to such Court of Chancery having subject matter jurisdiction and personal jurisdiction over the indispensable parties named as defendants therein. This choice of forum provision may limit a stockholder’s ability to bring a claim in a judicial forum that it finds favorable for disputes with us or our directors, officers or other employees, which may discourage such lawsuits against us and such persons. Alternatively, if a court were to find these provisions of our Certificate of Incorporation inapplicable to, or unenforceable in respect of, one or more of the specified types of actions or proceedings, we may incur additional costs associated with resolving such matters in other jurisdictions.
Changes in the method of determining London Interbank Offered Rate (“LIBOR”), or the replacement of LIBOR with an alternative reference rate, may adversely affect interest expense related to outstanding debt.
Amounts drawn under the RBL Facility may bear interest rates in relation to LIBOR, depending on our selection of repayment options. On July 27, 2017, the Financial Conduct Authority in the U.K. announced that it would phase out LIBOR as a benchmark by the end of 2021. It is unclear whether new methods of calculating LIBOR will be established such that it continues to exist after 2021. If LIBOR ceases to exist, we may need to renegotiate the RBL Facility and may not be able to do so with terms that are favorable to us. The overall financial market may be disrupted as a result of the phase-out or replacement of LIBOR.
Item 1B. Unresolved Staff Comments
None.
Item 3. Legal Proceedings
We are involved in various legal and administrative proceedings in the normal course of business, the ultimate resolutions of which, in the opinion of management, are not anticipated to have a material effect on our results of operations, liquidity or financial condition.
For additional information regarding legal proceedings, see “Item 7. Management’s Discussion and Analysis of Financial Condition and Results of Operations—Liquidity and Capital Resources—Commitments, and Contingencies” and “Item 7. Management’s Discussion and Analysis of Financial Condition and Results of Operations—Liquidity and Capital Resources—Contractual Obligations.”
Item 4. Mine Safety Disclosure
Not applicable.
49
Part II
Item 5. Market for the Registrant’s Common Equity, Related Stockholder Matters and Issuer Purchases of Equity Securities
Market Information
Our common stock has been trading on the Nasdaq Global Select Market ("NASDAQ") under the ticker symbol “BRY” since July 26, 2018. Prior to that there was no established public trading market for our common stock.
Holders of Record
Our common stock was held by 33 stockholders of record at January 31, 2020.
Dividend Policy
We plan to use our operating cash flows to cover our interest requirements, fund operations at sustained production levels, and consistently return meaningful capital to stockholders through quarterly dividends. We expect remaining cash flows will be allocated to fund internal growth opportunities. Our dividends will be determined by our board of directors in light of existing conditions, including our earnings, financial condition, restrictions in financing agreements, business conditions and other factors.
Securities Authorized for Issuance Under Equity Compensation Plans
On June 27, 2018, our Board approved our second amended and restated 2017 Omnibus Incentive Plan (the “Omnibus Plan”). A description of the plans can be found in Item 8. Financial Statements and Supplementary Data – Note 6–Equity. The aggregate number of shares of our common stock authorized for issuance under stock-based compensation plans for our employees and non-employee directors is 10 million, of which 3.0 million have been issued or reserved through December 31, 2019.
The following table summarizes information related to our equity compensation plans under which our equity securities are authorized for issuance as of December 31, 2019.
Plan Category | Number of Securities to be Issued Upon Exercise of Outstanding Options and Rights (#)(1) | Weighted-Average Exercise Price of Outstanding Options and Rights ($) | Number of Securities Remaining Available for Future Issuance Under Equity Compensation Plans (#)(3) | |||
Equity compensation plans not approved by security holders(2) | 2,348,334 | N/A | 6,954,454 | |||
________________
(1) | The number of securities to be issued upon vesting of unvested restricted stock units ("RSUs") subject to time vesting and performance-based restricted stock units ("PSUs"), assumes maximum achievement of certain market-based performance goals over a specified period of time |
(2) | In connection with the IPO, our Board amended and restated the Company’s First Amended and Restated 2017 Omnibus Incentive Plan, which had amended and restated the Company’s 2017 Omnibus Incentive Plan (the “Prior Plans” and, collectively with the Omnibus Plan, the “Equity Compensation Plans”), which allowed us to grant equity-based compensation awards with respect to up to 10,000,000 shares of common stock (which number includes the number of shares of common stock previously issued pursuant to an award (or made subject to an award that has not expired or been terminated) under the Prior Plans), to employees, consultants and directors of the Company and its affiliates who perform services for the Company. The Omnibus Plan provides for grants of stock options, stock appreciation rights, restricted stock, restricted stock units, stock awards, dividend equivalents and other types of awards. |
(3) | The number of securities remaining available for future issuances has been reduced by the number of securities to be issued upon settlement of RSUs subject to time vesting and PSUs assuming maximum achievement of certain market-based performance goals over a specified period of time |
50
Sales of Unregistered Securities
In February 2019, we issued and sold 350,000 shares of our common stock to Berry LLC at par value for aggregate consideration of $350, and Berry LLC agreed to issue those shares on our behalf in satisfaction of any liability arising from the remaining unsecured claim pending related to the Chapter 11 Proceeding. The shares were issued pursuant to an exemption from registration under Section 1145(a) of the U.S. Bankruptcy Code.
Stock Repurchase Program
In December 2018, we announced that our Board of Directors had adopted a program for the opportunistic repurchase of up to $100 million of our common stock. Based on the Board’s evaluation of market conditions for our common stock they authorized repurchases of up to $50 million under the program at that time. Purchases may be made from time to time in the open market, in privately negotiated transactions or otherwise. The manner, timing and amount of any purchases will be determined based on our evaluation of market conditions, stock price, compliance with outstanding agreements and other factors, may be commenced or suspended at any time without notice and does not obligate Berry Corp. to purchase shares during any period or at all. Any shares acquired will be available for general corporate purposes. As of December 31, 2019, we had purchased shares for the full $50 million initially authorized. In February 2020, the Board of Directors authorized the remaining $50 million of our $100 million repurchase program.
Our share repurchase activities for the three months ended December 31, 2019, were as follows:
Period | Total Number of Shares Purchased | Average Price Paid per Share | Total Number of Shares Purchased as Part of Publicly Announced Plans or Programs | Approximate Dollar Value of Shares that May Yet Be Purchased Under the Plan | ||||||||||
October 1 - 31, 2019 | — | $ | — | — | ||||||||||
November 1 - 30, 2019 | 1,252,696 | $ | 7.60 | 1,252,696 | ||||||||||
December 1 - 31, 2019 | 156,163 | $ | 7.98 | 156,163 | ||||||||||
Total | 1,408,859 | $ | 7.64 | 1,408,859 | $ | — | ||||||||
In 2019, the Company repurchased 4,609,021 shares at an average price of $9.99. Since 2018, the Company has repurchased a total of 5,057,682 shares at an average price of $9.88 per share under the Stock Repurchase Program.
Performance Graph
The following graph compares the cumulative total return to stockholders on our common stock relative to the cumulative total returns of the S&P Smallcap 600, the Dow Jones U.S. Exploration and Production indexes and the Vanguard Energy ETF (with reinvestment of all dividends). The graph assumes that on July 26, 2018, the date our common stock began trading on the NASDAQ, $100 was invested in our common stock and in each index, and that all dividends were reinvested. The returns shown are based on historical results and are not intended to suggest future performance.
51
COMPARISON OF CUMULATIVE TOTAL RETURN(1)(2)
Among Berry Corporation (bry), the S&P Smallcap 600 Index,
the Dow Jones U.S. Exploration & Production Index
and the Vanguard Energy ETF
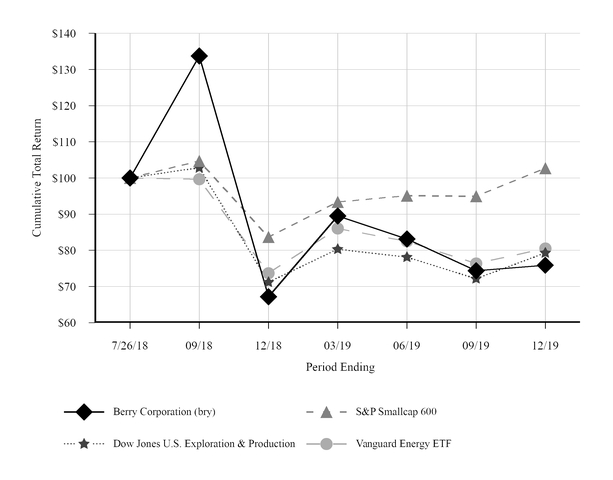
7/26/18 | 09/18 | 12/18 | 03/19 | 06/19 | 09/19 | 12/19 | |||||||||||||||||||||
Berry Corporation (bry) | $ | 100.00 | $ | 133.73 | $ | 67.17 | $ | 89.50 | $ | 83.16 | $ | 74.34 | $ | 75.90 | |||||||||||||
S&P Smallcap 600 | $ | 100.00 | $ | 104.71 | $ | 83.66 | $ | 93.37 | $ | 95.12 | $ | 94.93 | $ | 102.72 | |||||||||||||
Dow Jones U.S. Exploration & Production | $ | 100.00 | $ | 102.81 | $ | 71.18 | $ | 80.30 | $ | 78.12 | $ | 72.14 | $ | 79.29 | |||||||||||||
Vanguard Energy ETF | $ | 100.00 | $ | 99.64 | $ | 73.67 | $ | 86.02 | $ | 82.49 | $ | 76.35 | $ | 80.50 | |||||||||||||
__________
(1) | The performance graph shall not be deemed “soliciting material” or to be “filed” with the SEC for purposes of Section 18 of the Exchange Act, or otherwise subject to the liabilities under that Section, and shall not be deemed to be incorporated by reference into any filing of the Company under the Securities Act of 1933, as amended (the "Securities Act") or the Exchange Act except to the extent that we specifically request it be treated as soliciting material or specifically incorporate it by reference. |
(2) | $100 invested on July 26, 2018 in stock or June 30, 2018 in index, including reinvestment of dividends. |
52
Item 6. Selected Financial Data
The following table shows the selected historical financial information, for the periods and as of the dates indicated, of Berry LLC, the predecessor company, and following the Effective Date, Berry Corp. and its subsidiary, Berry LLC, together, the successor company. The selected historical financial information as of and for the year ended December 31, 2019, the year ended December 31, 2018, and the ten months ended December 31, 2017 is derived from audited consolidated financial statements of the successor company. The selected historical financial information as of and for the two months ended February 28, 2017 and the year ended December 31, 2016 is derived from the audited historical financial statements of our predecessor company.
Berry LLC emerged from bankruptcy on February 28, 2017 ("the Effective Date") in connection with "the Plan", which is the reorganization plan approved and confirmed by the Bankruptcy Court in the Chapter 11 Proceeding. On that date Berry LLC adopted fresh-start accounting and was recapitalized, which resulted in Berry LLC becoming a wholly-owned subsidiary of Berry Corp. and Berry Corp. being treated as the new entity for financial reporting. As a result, our consolidated financial statements subsequent to the Effective Date are not comparable to our financial statements prior to such date. Our financial results for future periods following the application of fresh-start accounting will be different from historical trends and the differences may be material.
Berry Corp. (Successor) | Berry LLC (Predecessor) | |||||||||||||||||||
Year Ended December 31, 2019 | Year Ended December 31, 2018 | Ten Months Ended December 31, 2017 | Two Months Ended February 28, 2017 | Year Ended December 31, 2016 | ||||||||||||||||
(in thousands, except per share amounts) | ||||||||||||||||||||
Statements of Operations Data: | ||||||||||||||||||||
Revenues and other | $ | 559,405 | $ | 586,557 | $ | 319,669 | $ | 92,718 | $ | 410,991 | ||||||||||
Net income (loss) attributable to common stockholders(1)(4) | $ | 43,539 | $ | 49,160 | $ | (39,316 | ) | $ | (502,964 | ) | $ | (1,283,196 | ) | |||||||
Net income (loss) per share of common stock | ||||||||||||||||||||
Basic | $ | 0.54 | $ | 0.85 | $ | (1.02 | ) | n/a | n/a | |||||||||||
Diluted | $ | 0.53 | $ | 0.85 | $ | (1.02 | ) | n/a | n/a | |||||||||||
Dividends per common share | $ | 0.48 | $ | 0.21 | $ | — | $ | — | $ | — | ||||||||||
Weighted-average common stock outstanding(2) | ||||||||||||||||||||
Basic | 81,379 | 57,743 | 38,644 | n/a | n/a | |||||||||||||||
Diluted(2) | 81,951 | 57,932 | 38,644 | n/a | n/a | |||||||||||||||
Cash Flow Data: | ||||||||||||||||||||
Operating activities(3) | $ | 241,829 | $ | 105,471 | $ | 107,399 | $ | 22,431 | $ | 13,197 | ||||||||||
Capital expenditures | $ | (223,154 | ) | $ | (129,652 | ) | $ | (65,479 | ) | $ | (3,158 | ) | $ | (34,796 | ) | |||||
Balance Sheet Data (at period end): | ||||||||||||||||||||
Total assets | $ | 1,690,198 | $ | 1,692,263 | $ | 1,546,402 | $ | 1,561,038 | $ | 2,652,050 | ||||||||||
Long-term debt, net | $ | 394,319 | $ | 391,786 | $ | 379,000 | $ | 400,000 | $ | — | ||||||||||
__________
(1) | Refer to “Item 7. Management's Discussion and Analysis of Financial Condition and Results of Operations—Results of Operations” for discussion regarding factors in comparability, such as, impairment of its Piceance gas properties and income taxes in 2019. |
(2) | The Series A Preferred Stock was not a participating security; therefore, we calculated diluted earnings per share using the “if-converted” method, under which the preferred dividends are added back to the numerator and the Series A Preferred Stock is assumed to be converted at the beginning of the period. No incremental shares of Series A Preferred Stock were included in the diluted EPS calculation for the years ended December 31, 2019 or 2018, as all outstanding shares of our Series A Preferred (the "Series A Preferred Stock") were converted to common shares (the "Series A Preferred Stock Conversion") in connection with the IPO of our common stock in July 2018. No incremental shares of Series A Preferred Stock were included in the diluted earnings per share calculation for the ten months ended December 31, 2017 as their effect was antidilutive under the “if-converted” method. Please see Note 6 for further detail. |
53
(3) | 2018 includes a one-time payment of $127 million in the second quarter to early terminate unsettled derivative contracts. The elective cancellation was effected to realign our hedging pricing with current market rates and move from WTI to Brent underlying. |
(4) | Net Income Attributable to Common Stockholders for year ended December 31, 2019 includes a $51 million non-cash impairment charge for the Piceance gas properties, and $39 million in income tax credits from prior periods. |
54
Item 7. Management's Discussion and Analysis of Financial Condition and Results of Operations
Management’s Discussion and Analysis of Financial Condition and Results of Operations should be read in conjunction with the financial statements and related notes included elsewhere in this report. The following discussion contains forward-looking statements that reflect our future plans, estimates, beliefs and expected performance. The forward-looking statements are dependent upon events, risks and uncertainties that may be outside our control. Our actual results could differ materially from those discussed in these forward-looking statements. Factors that could cause or contribute to such differences are described in “Item 1A. Risk Factors” included earlier in this report. Please see “—Cautionary Note Regarding Forward-Looking Statements.”
This section of the Form 10-K generally discusses 2019 and 2018 items and year-to-year comparisons between those years. For discussion of our ten months ended December 31, 2017 and two months ended February 28, 2017, as well as the year ended 2018 compared to ten months ended December 31, 2017 and two months ended February 28, 2017, refer to Part II, Item 7— "Management's Discussion and Analysis of Financial Condition and Results of Operations" of our 2018 Annual Report on Form 10-K.
Executive Overview
We are a western United States independent upstream energy company with a focus on onshore, low geologic risk, long-lived, oil reserves in conventional reservoirs.
Most of our assets are located in the oil-rich reservoirs in the San Joaquin basin of California, which has more than 100 years of production history and substantial remaining oil in place. As a result of the substantial data produced over the basin's long history, its reservoir characteristics are well understood, leading to predictable, repeatable, low geological risk and low-c and, to a lesser extent, in our Rockies assets which include low-cost, oil-rich reservoirs in the Uinta basin of Utah and low geologic risk natural gas resource plays in the Piceance basin in Colorado. Successful execution of our strategy across our low-declining production base and extensive inventory of identified drilling locations will result in our ability to continue returning capital to our stockholders and demonstrate long-term, capital efficient, consistent, and predictable production growth while living within levered free cash flow.
Effective February 18, 2020, Berry Petroleum Corporation changed its name to Berry Corporation (bry) and introduced a new logo. We believe that the name Berry Corporation (bry) is a name that better represents our progressive approach to evolving and growing the business in today’s dynamic oil and gas industry. We are proactively engaging the many forces driving our industry to maximize our assets, create value for shareholders, and support environmental goals that align with a more positive future. One of the more visible elements of our business is our publicly traded stock, and our new logo echoes the public value of the company by using our ticker symbol as an identifiable element of our brand.
How We Plan and Evaluate Operations
We use Levered Free Cash Flow in planning our capital allocation to sustain production levels and fund internal growth opportunities, as well as determine hedging needs. We define Levered Free Cash Flow as Adjusted EBITDA less capital expenditures, interest expense, and dividends.
We use the following metrics to manage and assess the performance of our operations and are part of our incentive program for all employees: (a) Adjusted EBITDA; (b) operating expenses; (c) environmental, health & safety (“EH&S”) results; (d) general and administrative expenses; and (e) production.
Adjusted EBITDA
Adjusted EBITDA is the primary financial and operating measurement that our management uses to analyze and monitor the operating performance of our business. We define Adjusted EBITDA as earnings before interest expense; income taxes; depreciation, depletion, and amortization (“DD&A”); derivative gains or losses net of cash received or
55
paid for scheduled derivative settlements; impairments; stock compensation expense; and other unusual, out-of-period and infrequent items, including restructuring costs and reorganization items.
Operating expenses
We define operating expenses as lease operating expenses, electricity generation expenses, transportation expenses, and marketing expenses, offset by the third-party revenues generated by electricity, transportation and marketing activities, as well as the effect of derivative settlements (received or paid) for gas purchases. Lease operating expenses include fuel, labor, field office, vehicle, supervision, maintenance, tools and supplies, and workover expenses. Taxes other than income taxes are excluded from operating expenses. The electricity, transportation and marketing activity related revenues are viewed and treated internally as a reduction to operating costs when tracking and analyzing the economics of development projects and the efficiency of our hydrocarbon recovery. Additionally, we strive to minimize the variability of our fuel gas costs for our steam operations with gas hedges. Overall, operating expense is used by management as a measure of the efficiency with which operations are performing.
Environmental, health & safety
Like other companies in the oil and gas industry, our operations are subject to stringent federal, state and local laws and regulations governing the discharge of materials into the environment or otherwise relating to environmental protection. Current and future laws and regulations can materially impact our exploration, development and production plans.
We are committed to good corporate citizenship in our communities, operating safely and protecting the environment and our employees. We monitor our EH&S performance through various measures, holding our employees and contractors to high standards.
General and administrative expenses
We monitor our cash general and administrative expenses as a measure of the efficiency of our overhead activities. Such expenses are a key component of the appropriate level of support our corporate and professional team provides to the development of our assets and our day-to-day operations.
Production
Oil and gas production is a key driver of our operating performance, an important factor to the success of our business, and used in forecasting future development economics. We measure and closely monitor production on a continuous basis, adjusting our property development efforts in accordance with the results. We track production by commodity type and compare it to prior periods and expected results.
Business Environment and Market Conditions
The oil and gas industry is heavily influenced by commodity prices. Average oil prices were lower for 2019 compared to 2018 . Brent crude oil contract prices ranged during 2019 from $54.91 per Bbl at the beginning, to a high of $74.57 per Bbl and back to $56.23 per Bbl. In California, the price we pay for fuel gas purchases is generally based on the Kern, Delivered Index, as well as the SoCal Index which were as low as $0.99 per MMBtu and as high as $22.38 per MMBtu for a short time in 2019 due to market disruptions, while we paid an average of $3.14 for the year. The Henry Hub spot price for natural gas fluctuated between $1.75 per MMBtu and $4.25 per MMBtu, with an average of $2.56 during 2019. Our revenue, costs, profitability and future growth are highly dependent on the prices we receive for our oil and natural gas production and the prices we pay for our natural gas purchases which will continue to be affected by a variety of factors. Please see “Item 1A. Risk Factors—Risks Related to Our Business and Industry—Oil, natural gas and NGL prices are volatile and directly affect our results.”
56
The following table presents the average Brent, WTI, Kern, and Henry Hub prices for the years ended December 31, 2019 and 2018:
Year Ended | |||||||
December 31, 2019 | December 31, 2018 | ||||||
Brent oil ($/Bbl) | $ | 64.16 | $ | 71.69 | |||
WTI oil ($/Bbl) | $ | 57.03 | $ | 64.81 | |||
Kern, Delivered natural gas ($/MMBtu) | $ | 3.14 | $ | 3.36 | |||
Henry Hub natural gas ($/MMBtu) | $ | 2.56 | $ | 3.15 | |||
California oil prices are Brent-influenced as California refiners import approximately 73% of the state’s demand from OPEC countries and other waterborne sources, primarily the Middle East and South America. There is a closer correlation of prices in California to Brent pricing than to WTI. Without the higher costs associated with importing crude via rail or supertanker, we believe our in-state production and low-cost crude transportation options, coupled with Brent-influenced pricing, will allow us to continue to realize strong cash margins in California.
Utah oil prices have historically traded at a discount to WTI as the local refineries are designed for oil's unique characteristics and the remoteness of the assets makes access to other markets logistically challenging.
Prices and differentials for NGLs are related to the supply and demand for the products making up these liquids. Some of them more typically correlate to the price of oil while others are affected by natural gas prices as well as the demand for certain chemical products for which they are used as feedstock. In addition, infrastructure constraints magnify pricing volatility.
Natural gas prices and differentials are strongly affected by local market fundamentals, availability of transportation capacity from producing areas and seasonal impacts. We purchase substantially more natural gas for our steamfloods and cogeneration facilities, than we produce and sell. Consequently, higher gas prices have a negative impact on our operating costs. However, we mitigate a portion of this exposure by selling excess electricity from our cogeneration operations to third parties at prices linked to the price of natural gas. Additionally, we strive to minimize the variability of our fuel gas costs for our steam operations by hedging a significant portion of such gas purchases. Also, the negative impact of higher gas prices is partially offset by higher gas sales for the gas we produce.
Our earnings are also affected by the performance of our cogeneration facilities. These cogeneration facilities generate both electricity and steam for our properties and electricity for off-lease sales. We have negotiated terms of a new power purchase agreement for our 18 MW cogeneration facility which began in December 2019 for a period of seven years. While a portion of the electric output of our cogeneration facilities is utilized within our production facilities to reduce operating expenses, we also sell electricity produced by three of our cogeneration facilities under long-term contracts with terms ending in July 1, 2021 through December 1, 2026. The most significant input and cost of the cogeneration facilities is natural gas. We generally receive significantly more revenue from these cogeneration facilities in the summer months, June through September, due to negotiated capacity payments we receive.
Natural gas prices can fluctuate based on seasonal and other market-related impacts. We purchase significantly more gas than we sell to generate steam and electricity in our cogeneration facilities for our producing activities. As a result, our key exposure to gas prices is in our costs. We mitigate a substantial portion of this exposure by selling excess electricity from our cogeneration operations to third parties. The pricing of these electricity sales is closely tied to the purchase price of natural gas. We also hedge a significant portion of the gas we expect to consume.
Seasonal weather conditions can impact our drilling and production activities. These seasonal conditions can occasionally pose challenges in our operations for meeting well-drilling objectives and increase competition for equipment, supplies and personnel, which could lead to shortages and increase costs or delay operations. For example, our operations may have been and in the future may be impacted by ice and snow in the winter and by electrical storms and high temperatures in the spring and summer, as well as by wild fires and rain.
57
Additionally, like other companies in the oil and gas industry, our operations are subject to stringent federal, state and local laws and regulations relating to drilling, completion, well stimulation, operation, maintenance or abandonment of wells or facilities, managing energy, water, land, greenhouse gases or other emissions, protection of health, safety and the environment, or transportation, marketing, and sale of our products. Federal, state and local agencies may assert overlapping authority to regulate in these areas. See “Items 1 and 2. Business and Properties-Regulation of Health, Safety and Environmental Matters” for a description of laws and regulations that affect our business. For more information related to regulatory risks, see “Item 1A. Risk Factors-Risks Related to Our Business and Industry”
58
Certain Operating and Financial Information
The following tables set forth information regarding average daily production, total production, and average prices for the years ended December 31, 2019 and 2018.
Year Ended | |||||||
December 31, 2019 | December 31, 2018 | ||||||
Average daily production:(1)(3) | |||||||
Oil (MBbl/d) | 25.3 | 22.0 | |||||
Natural Gas (MMcf/d) | 20.0 | 26.3 | |||||
NGLs (MBbl/d) | 0.4 | 0.6 | |||||
Total (MBoe/d)(2) | 29.0 | 27.0 | |||||
Total Production:(3) | |||||||
Oil (MBbl) | 9,226 | 8,045 | |||||
Natural gas (MMcf) | 7,302 | 9,589 | |||||
NGLs (MBbl) | 151 | 211 | |||||
Total (MBoe)(2) | 10,594 | 9,855 | |||||
Weighted-average realized prices: | |||||||
Oil with hedges (Bbl) | $ | 63.61 | $ | 59.67 | |||
Oil without hedges (Bbl) | $ | 58.93 | $ | 64.76 | |||
Natural gas (Mcf) | $ | 2.66 | $ | 2.74 | |||
NGLs (Bbl) | $ | 17.02 | $ | 26.74 | |||
Average Benchmark prices: | |||||||
Oil (Bbl) – Brent | $ | 64.16 | $ | 71.69 | |||
Oil (Bbl) – WTI | $ | 57.03 | $ | 64.81 | |||
Gas (MMBtu) – Kern, Delivered(4) | $ | 3.14 | $ | 3.36 | |||
Natural gas (MMBtu) – Henry Hub(5) | $ | 2.56 | $ | 3.15 | |||
__________
(1) | Production represents volumes sold during the period. We also consume a portion of the natural gas we produce on lease to extract oil and gas. |
(2) | Natural gas volumes have been converted to Boe based on energy content of six Mcf of gas to one Bbl of oil. Barrels of oil equivalence does not necessarily result in price equivalence. The price of natural gas on a barrel of oil equivalent basis is currently substantially lower than the corresponding price for oil and has been similarly lower for a number of years. For example, in the year ended December 31, 2019, the average prices of Brent oil and Henry Hub natural gas were $64.16 per Bbl and $2.56 per MMBtu respectively, resulting in an oil-to-gas ratio of approximately 4 to 1 on an energy equivalent basis. |
(3) | On November 30, 2018, we sold our non-core gas-producing properties and related assets located in the East Texas basin. |
(4) | Kern, Delivered Index is the relevant index used for gas purchases in California. |
(5) | Henry Hub is the relevant index used for gas sales in the Rockies. |
The following table sets forth average daily production by operating area for the periods indicated:
Year Ended | |||||
December 31, 2019 | December 31, 2018 | ||||
Average daily production (MBoe/d)(1): | |||||
California | 22.6 | 19.7 | |||
Utah | 5.0 | 4.9 | |||
Colorado | 1.4 | 1.7 | |||
East Texas(2) | — | 0.7 | |||
Total average daily production | 29.0 | 27.0 | |||
59
__________
(1) | Production represents volumes sold during the period. |
(2) | On November 30, 2018, we sold our non-core gas-producing properties and related assets located in the East Texas basin. |
Average daily oil production increased 15% for the year ended December 31, 2019 compared to the year ended December 31, 2018. Year-over-year daily overall production increased 7% due to production response from the development capital spending throughout 2019 and 2018, which more than offset the natural decline of our properties and the sale of our East Texas properties in November 2018
California production increased 15% year-over-year in response to the deployment of the substantial majority of our development capital. This increase strongly demonstrated the ability of our California properties to respond to capital investment. The 2019 development activities accelerated our California production growth during the year, resulting in a 17% increase from 21.7 MBoe/d in the three months ended December 31, 2018 to 25.5 MBoe/d in the three months ended December 31, 2019. Additionally, our 2019 capital program contributed to the increase in our California proved reserves of 24.5 MMBoe, or 23% before production, resulting in a 299% replacement ratio. We also replaced 159% of our total company proved undeveloped drilling location inventory.
The production in Utah and Colorado declined 3% year-over-year. The overall decline is primarily due to no capital allocated to Colorado, while there was a slight increase in Utah due to the deployed capital there. Additionally, we sold our East Texas gas properties in November 2018.
60
Summary by Area
The following table shows a summary by area of our selected historical financial information and operating data for the periods indicated.
California (San Joaquin and Ventura basins) | Utah (Uinta basin) | Colorado (Piceance basin) | ||||||||||||||||||
Year Ended December 31, 2019 | Year Ended December 31, 2018 | Year Ended December 31, 2019 | Year Ended December 31, 2018 | Year Ended December 31, 2019 | Year Ended December 31, 2018 | |||||||||||||||
($ in thousands, unless noted otherwise) | ||||||||||||||||||||
Oil, natural gas and natural gas liquids sales | $ | 498,325 | $ | 471,802 | $ | 59,383 | $ | 65,605 | $ | 7,740 | $ | 10,657 | ||||||||
Operating income(1) | $ | 230,500 | $ | 185,965 | $ | 7,624 | $ | 15,066 | $ | (48,955 | ) | $ | 6,346 | |||||||
Depreciation, depletion, and amortization (DD&A) | $ | 93,025 | $ | 72,260 | $ | 11,754 | $ | 10,420 | $ | 1,055 | $ | 646 | ||||||||
Impairment of oil and gas properties | $ | — | $ | — | $ | — | $ | — | $ | 51,081 | $ | — | ||||||||
Average daily production (MBoe/d) | 22.6 | 19.7 | 5.0 | 5.0 | 1.4 | 1.7 | ||||||||||||||
Production (oil % of total) | 100 | % | 100 | % | 54 | % | 48 | % | 2 | % | 1 | % | ||||||||
Realized sales prices: | ||||||||||||||||||||
Oil (per Bbl) | $ | 60.51 | $ | 65.64 | $ | 45.72 | $ | 57.30 | $ | 52.36 | $ | 61.50 | ||||||||
NGLs (per Bbl) | $ | — | $ | — | $ | 17.08 | $ | 26.95 | $ | — | $ | — | ||||||||
Gas (per Mcf) | $ | — | $ | — | $ | 2.94 | $ | 2.68 | $ | 2.26 | $ | 2.75 | ||||||||
Capital expenditures(2) | $ | 191,955 | $ | 125,565 | $ | 10,229 | $ | 16,738 | $ | 603 | $ | 613 | ||||||||
Total proved reserves (MMBoe) | 122 | 106 | 15 | 19 | 1 | 18 | ||||||||||||||
__________
(1) | Operating income includes oil, natural gas and NGL sales, marketing revenues, other revenues, and scheduled oil derivative settlements, offset by operating expenses, general and administrative expenses, DD&A, impairment of oil and gas properties, and taxes, other than income taxes. |
(2) | Excludes corporate capital expenditures. |
Results of Operations
Year Ended December 31, 2019 | Year Ended December 31, 2018 | $ Change | % Change | |||||||||||
(in thousands) | ||||||||||||||
Revenues and other: | ||||||||||||||
Oil, natural gas and natural gas liquid sales | $ | 565,596 | $ | 552,874 | $ | 12,722 | 2 | % | ||||||
Electricity sales | 29,397 | 35,208 | (5,811 | ) | (17 | )% | ||||||||
(Losses) gains on oil derivatives | (37,998 | ) | (4,621 | ) | (33,377 | ) | 722 | % | ||||||
Marketing and other revenues | 2,410 | 3,096 | (686 | ) | (22 | )% | ||||||||
Total revenues and other | $ | 559,405 | $ | 586,557 | $ | (27,152 | ) | (5 | )% | |||||
Revenues and Other
Oil, natural gas and NGL sales increased $13 million to $566 million for the year ended December 31, 2019 from $553 million for the year ended December 31, 2018. The increase was driven by $76 million of higher oil volumes that was partially offset by $54 million of lower oil prices and $8 million of lower gas and natural gas liquid sales, mainly volume-related.
61
Electricity sales represent sales to utilities which decreased by $6 million or 17%, to approximately $29 million for the year ended December 31, 2019 when compared to the year ended December 31, 2018. The decrease was due to lower unit sales that were affected by unexpected downtime at our largest cogen during the summer when we receive peak pricing, and lower year-over-year gas pricing.
Included in the results of our oil derivatives for the year ended December 31, 2019 were $43 million of settlement gains reflecting the positions that expired during the year with hedge prices below the respective Brent index prices. During 2019, the change in Brent prices relative to our remaining positions at year end resulted in reduced value, resulting in mark-to-market losses in 2019. Losses on oil derivatives were $4.6 million for the year ended December 31, 2018. Our losses in 2018 were due to the mark-to-market losses incurred on oil derivatives prior to being terminated in May 2018 and settled with a $127 million payment. We terminated these derivatives and entered into new hedges to better align our hedge pricing with the then prevailing market pricing. These early-2018 losses were offset by gains on oil derivatives in the latter portion of the year, primarily due to the decline in oil prices in the fourth quarter compared to the higher hedge pricing.
Marketing and other revenues were comparable for the year ended December 31, 2019 and the year ended December 31, 2018. Marketing revenues in these periods represented sales of natural gas purchased from third-parties.
Year Ended December 31, 2019 | Year Ended December 31, 2018 | $ Change | % Change | |||||||||||
(in thousands) | ||||||||||||||
Expenses and other: | ||||||||||||||
Lease operating expenses | $ | 216,294 | $ | 188,776 | $ | 27,518 | 15 | % | ||||||
Electricity generation expenses | 19,490 | 20,619 | (1,129 | ) | (5 | )% | ||||||||
Transportation expenses | 8,059 | 9,860 | (1,801 | ) | (18 | )% | ||||||||
Marketing expenses | 2,073 | 2,140 | (67 | ) | (3 | )% | ||||||||
General and administrative expenses | 62,643 | 54,026 | 8,617 | 16 | % | |||||||||
Depreciation, depletion and amortization | 106,006 | 86,271 | 19,735 | 23 | % | |||||||||
Impairment of oil and gas properties(6) | 51,081 | — | 51,081 | 100 | % | |||||||||
Taxes, other than income taxes | 40,645 | 33,117 | 7,528 | 23 | % | |||||||||
Losses (gains) on natural gas derivatives | 6,957 | (6,357 | ) | 13,314 | n/a | |||||||||
Other operating expense (income) | 4,588 | (2,747 | ) | 7,335 | (267 | )% | ||||||||
Total expenses and other | 517,836 | 385,705 | 132,131 | 34 | % | |||||||||
Other income (expenses): | ||||||||||||||
Interest expense | (34,234 | ) | (35,648 | ) | 1,414 | (4 | )% | |||||||
Other, net | 80 | 243 | (163 | ) | (67 | )% | ||||||||
Total other income (expenses) | (34,154 | ) | (35,405 | ) | 1,251 | (4 | )% | |||||||
Reorganization items, net | (426 | ) | 24,690 | (25,116 | ) | (102 | )% | |||||||
Income (loss) before income taxes | 6,989 | 190,137 | (183,148 | ) | (96 | )% | ||||||||
Income tax expense (benefit) | (36,550 | ) | 43,035 | (79,585 | ) | (185 | )% | |||||||
Net (loss) income | 43,539 | 147,102 | (103,563 | ) | (70 | )% | ||||||||
Series A Preferred Stock dividends and conversion to common stock | — | (97,942 | ) | 97,942 | (100 | )% | ||||||||
Net (loss) income attributable to common stockholders | $ | 43,539 | $ | 49,160 | $ | (5,621 | ) | (11 | )% | |||||
Adjusted EBITDA(7) | $ | 302,184 | $ | 257,924 | $ | 44,260 | 17 | % | ||||||
Adjusted Net Income (Loss)(7) | $ | 110,228 | $ | 100,001 | $ | 10,227 | 10 | % | ||||||
62
Expenses per Boe:(1) | ||||||||||||||
Lease operating expenses | $ | 20.42 | $ | 19.16 | $ | 1.26 | 7 | % | ||||||
Electricity generation expenses | 1.84 | 2.09 | (0.25 | ) | (12 | )% | ||||||||
Electricity sales | (2.77 | ) | (3.57 | ) | 0.80 | (22 | )% | |||||||
Transportation expenses | 0.76 | 1.00 | (0.24 | ) | (24 | )% | ||||||||
Transportation sales | (0.03 | ) | (0.08 | ) | 0.05 | (63 | )% | |||||||
Marketing expenses | 0.20 | 0.22 | (0.02 | ) | (9 | )% | ||||||||
Marketing revenues | (0.20 | ) | (0.24 | ) | 0.04 | (17 | )% | |||||||
Gas purchase derivatives settlement (gains) losses | 0.10 | (0.24 | ) | 0.34 | (142 | )% | ||||||||
Total operating expenses | $ | 20.32 | $ | 18.33 | $ | 1.99 | 11 | % | ||||||
Total unhedged operating expenses(2) | $ | 20.22 | $ | 18.57 | $ | 1.65 | 9 | % | ||||||
Total non-energy operating expenses(3) | $ | 14.80 | $ | 13.80 | $ | 1.00 | 7 | % | ||||||
Total energy operating expenses(4) | $ | 5.51 | $ | 4.53 | $ | 0.98 | 22 | % | ||||||
General and administrative expenses(5) | $ | 5.91 | $ | 5.48 | $ | 0.43 | 8 | % | ||||||
Depreciation, depletion and amortization | $ | 10.01 | $ | 8.75 | $ | 1.26 | 14 | % | ||||||
Taxes, other than income taxes | $ | 3.84 | $ | 3.36 | $ | 0.48 | 14 | % | ||||||
__________
(1) | We report electricity, transportation and marketing sales separately in our financial statements as revenues in accordance with GAAP. However, these revenues are viewed and used internally in calculating operating expenses which is used to track and analyze the economics of development projects and the efficiency of our hydrocarbon recovery. We purchase third-party gas to generate electricity through our cogeneration facilities to be used in our field operations activities and view the added benefit of any excess electricity sold externally as a cost reduction/benefit to generating steam for our thermal recovery operations. Marketing revenues and expenses mainly relate to natural gas purchased from third parties that moves through our gathering and processing systems and then is sold to third parties. Transportation sales relate to water and other liquids that we transport on our systems on behalf of third parties and have not been significant to date. Operating expenses also include the effect of derivative settlements (received or paid) for gas purchases. |
(2) | Total unhedged operating expenses equals total operating expenses less the derivatives settlements paid for gas purchases. |
(3) | Total non-energy operating expenses equals total operating expenses, excluding fuel, electricity sales and gas purchase derivatives settlement (gains) losses. |
(4) | Total energy operating expenses equals fuel and gas purchase derivative settlement (gains) losses less electricity sales. |
(5) | Includes restructuring and other non-recurring costs and non-cash stock compensation expense, in aggregate, of approximately $1.08 per Boe and $1.36 per Boe for the year ended December 31, 2019 and December 31, 2018, respectively. |
(6) | For the year ended December 31, 2019, we recorded an impairment charge of $51 million for the Piceance gas properties in Colorado. |
(7) | Adjusted EBITDA and Adjusted Net Income (Loss) are financial measures that are not calculated in accordance with GAAP. For definitions and a reconciliation to the Net Cash Provided by Operating Activities and Net Income (Loss), please see “Item 7 — Non-GAAP Financial Measures” |
Expenses
Operating expenses increased to $20.32 per Boe for the year ended December 31, 2019 from $18.33 for the year ended December 31, 2018. This increase included approximately $1.26 per Boe of increased repair and maintenance expenses, $0.80 decreased electricity sales, and $0.18 increased hedged fuel cost. This was partially offset by $0.24 lower transportation expense. On an unhedged basis, operating expenses increased $1.65 per Boe to $20.22 for the year ended December 31, 2019 from $18.57 for the year ended December 31, 2018. Operating expenses are defined above in "How We Plan And Evaluate Operations".
Lease operating expenses increased $1.26 per Boe to $20.42 for the year ended December 31, 2019 from $19.16 for the year ended December 31, 2018. The increase included repair and maintenance costs of $0.66 per Boe for facility tanks and vessels, and $0.61 for well servicing maintenance. These increases in maintenance costs for facilities and wells during 2019 resulted from our continuing efforts to aggressively manage repair and maintenance activities, in
63
particular, long-term delayed maintenance on some equipment. Lease operating expenses include fuel, maintenance, labor including supervision, vehicles, workover expenses, field office, and tools and supplies.
Electricity generation expenses decreased $0.25 to $1.84 per Boe for the year ended December 31, 2019 from $2.09 for the year ended December 31, 2018 mostly due to higher downtime and lower natural gas costs. These fuel costs exclude the effects of natural gas derivative settlements mentioned elsewhere.
Losses on natural gas derivatives of $7 million for the year ended December 31, 2019 included $6 million of mark-to-market valuation losses and $1 million, or $0.10 per Boe of gas hedge settlements. For the year ended December 31, 2018, gains on natural gas derivatives were $6 million including $4 million of mark-to-market valuation gains and $2 million, or $0.24 per Boe of gas hedge settlements.
In late 2018 we began hedging a portion of our internal consumption of natural gas used primarily to fuel our cogeneration units. Early in 2019 we increased the volume of natural gas volume hedged given the increase in natural gas prices at that time. Gains on natural gas derivatives in 2018 and in early 2019 reflected relatively high gas prices in California, compared to the strike price of our derivatives. However, the price decrease towards the end of the year resulted in mark-to-market hedging losses in 2019.
Transportation expenses decreased $0.24 per Boe to $0.76 for the year ended December 31, 2019 from $1.00 for the year ended December 31, 2018, mainly due to the impact from selling our East Texas asset during the fourth quarter of 2018 and lower volumes shipped from our Rockies assets.
Marketing expenses were comparable for the year ended December 31, 2019 and the year ended December 31, 2018. Marketing expenses in these periods, which exclude the effects of hedging, represented the cost of natural gas purchased from third-parties.
General and administrative expenses increased by $9 million or 16%, to approximately $63 million for the year ended December 31, 2019 compared to the year ended December 31, 2018. General and administrative expenses included restructuring and other non-recurring costs that decreased year over year to approximately $3.1 million from $6.8 million due to the completion of those activities in early 2019. For the same periods non-cash stock compensation costs increased to approximately $8.4 million from $6.6 million due to increased headcount.
Adjusted general and administrative expenses, which exclude restructuring and other non-recurring costs and non-cash stock compensation costs, were approximately $51 million or $4.84 per Boe for the year ended December 31, 2019 compared to $41 million or $4.13 per Boe for the year ended December 31, 2018. The increases in both general and administrative expenses and adjusted general and administrative expenses were primarily due to increased costs associated with our growth and public company status, and the continuing development and growth of our corporate affairs department and activities whose purpose is to support our efforts and participation in the regulatory, political and legislative process primarily in California.
DD&A increased by approximately $20 million or 23%, to approximately $106 million, for the year ended December 31, 2019 compared to the year ended December 31, 2018. On a per Boe basis, DD&A increased $1.26 to $10.01 year over year primarily due to higher 2019 depreciation and depletion rates caused by increasing capital development programs in 2018 and 2019.
Impairment of Oil and Gas Properties
At year end 2019, we evaluated our proved and unproved natural gas properties in regards to the decline in our expectations of future gas prices. As a result, we recorded a non-cash pre-tax asset impairment charge of $51 million for our Piceance gas properties in Colorado, of which $23 million was for proved properties and $28 million for unproved properties.
64
Taxes, Other Than Income Taxes
Year Ended December 31, 2019 | Year Ended December 31, 2018 | $ Change | % Change | |||||||||||
(per Boe) | ||||||||||||||
Severance taxes | $ | 0.63 | $ | 0.95 | $ | (0.32 | ) | (34 | )% | |||||
Ad valorem taxes | 1.38 | 1.38 | 0.00 | 0 | % | |||||||||
Greenhouse gas allowances | 1.83 | 1.03 | 0.80 | 78 | % | |||||||||
Total taxes other than income taxes | $ | 3.84 | $ | 3.36 | $ | 0.48 | 14 | % | ||||||
Taxes, other than income taxes, increased to $3.84 per Boe for the year ended December 31, 2019 from $3.36 for the year ended December 31, 2018 due to higher greenhouse gas allowance costs, partially offset by lower severance taxes than in the year ended December 31, 2018. Greenhouse gas allowance costs increased as a result of fewer free allowances from the state of California and higher spot prices for those allowances purchased, both of which increased the average unit cost of emissions incurred. The lower severance taxes in the year ended December 31, 2019 were the result of increased exemptions.
Other Operating Expense (Income)
Other operating expenses were $5 million in the year ended December 31, 2019 and mainly consisted of excess abandonment costs. The gains in 2018 included a $4 million gain from the sale of our East Texas property, offset by a $1 million loss on settlement of asset retirement obligations, largely due to a change in timing of the retirements.
Interest Expense
Interest expense decreased slightly due to less borrowings throughout 2019 compared to 2018.
Reorganization Items, Net
Reorganization items, net, consisted of less than $1 million expense for the year ended December 31, 2019, compared to $25 million of income primarily from the return of undistributed funds reserved for settlement of claims of general unsecured creditors for the year ended December 31, 2018.
Income Tax Expense (Benefit)
For the year ended December 31, 2019 we had an income tax benefit of approximately $37 million and for the year ended December 31, 2018 we had an income tax provision of approximately $43 million. The key contributor to the year-over-year change in income taxes and our effective rate from 23% for the year ended December 31, 2018 to (523)% for the year ended December 31, 2019 is due to the recognition of US federal general business credits in 2019 and are related to the 2017 and 2018 tax periods. These credits are available to offset future federal income tax liabilities. Refer to Note 8 of the consolidated financial statements for more information about our income taxes.
Series A Preferred Stock dividends and conversion to common stock
There were no Series A Preferred Stock dividends in 2019. Series A Preferred Stock (the "Series A Preferred Stock") was converted to common stock (the "Series A Preferred Stock Conversion") in 2018 when a $60 million payment was made to preferred stockholders in the Series A Preferred Stock Conversion in conjunction with our IPO, and the $27 million conversion value assigned to the additional 1.9 million shares of common stock received by the preferred stockholders, and $11 million of dividends paid prior to the conversion.
65
Liquidity and Capital Resources
Currently, we expect our primary sources of liquidity and capital resources will be Levered Free Cash Flow, and as needed, borrowings under the RBL Facility. Depending upon market conditions and other factors, we have issued and may issue additional equity and debt securities; however, we expect our operations to continue to generate positive Levered Free Cash Flow at current commodity prices allowing us to fund operations at sustained production levels and organic growth. Remaining excess cash flow could be used in various ways, including additional return of capital to shareholders, debt repurchases, bolt-on acquisitions and maintained as cash. As of December 31, 2019, we have available liquidity of $391 million under our RBL Facility. We believe our liquidity and capital resources will be sufficient to conduct our business and operations for the next 12 months.
Cash Dividends
Our Board of Directors approved a $0.12 per share quarterly cash dividend on our common stock each quarter in 2019. We paid the fourth quarter dividend in January 2020 and declared the first quarter 2020 dividend of $0.12 per share in February 2020, which is payable in April 2020. Since our IPO in July 2018 through February 2020, we have returned $65 million in regular quarterly dividends.
2026 Notes Offering
In February 2018, we issued our 7.0% 2026 Notes through our operating subsidiary, Berry LLC, which resulted in net proceeds to us of approximately $391 million after deducting expenses and the initial purchasers’ discount. We used the net proceeds from the issuance to repay the $379 million outstanding balance on the RBL Facility and used the remainder for general corporate purposes.
We may, at our option, redeem all or a portion of the 2026 Notes at any time on or after February 15, 2021. We are also entitled to redeem up to 35% of the aggregate principal amount of the 2026 Notes before February 15, 2021, with an amount of cash not greater than the net proceeds that we raise in certain equity offerings at a redemption price equal to 107% of the principal amount of the 2026 Notes being redeemed, plus accrued and unpaid interest, if any. In addition, prior to February 15, 2021, we may redeem some or all of the 2026 Notes at a price equal to 100% of the principal amount thereof, plus a “make-whole” premium, plus any accrued and unpaid interest. If we experience certain kinds of changes of control, holders of the 2026 Notes may have the right to require us to repurchase their notes at 101% of the principal amount of the 2026 Notes, plus accrued and unpaid interest, if any.
The 2026 Notes are our senior unsecured obligations and rank equally in right of payment with all of our other senior indebtedness and senior to any of our subordinated indebtedness. The notes are fully and unconditionally guaranteed on a senior unsecured basis by us and will also be guaranteed by certain of our future subsidiaries (other than Berry LLC). The 2026 Notes and related guarantees are effectively subordinated to all of our secured indebtedness (including all borrowings and other obligations under the RBL Facility) to the extent of the value of the collateral securing such indebtedness, and structurally subordinated in right of payment to all existing and future indebtedness and other liabilities (including trade payables) of any future subsidiaries that do not guarantee the 2026 Notes.
The indenture governing the 2026 Notes contains restrictive covenants and customary events of default, including, among others, (a) non-payment; (b) non-compliance with covenants (in some cases, subject to grace periods); (c) payment default under, or acceleration events affecting, material indebtedness and (d) bankruptcy or insolvency events involving us or certain of our subsidiaries.
The 2026 Notes do not restrict us from making open market and other purchases of such notes.
Bond Repurchase Program
66
In February 2020, our Board of Directors adopted a program for the opportunistic repurchase of up to $75 million of our 2026 Notes. The manner, timing and amount of any purchases will be determined based on our evaluation of market conditions, compliance with outstanding agreements and other factors, may be commenced or suspended at any time without notice and does not obligate Berry Corp. to purchase the 2026 Notes during any period or at all.
The RBL Facility
On July 31, 2017, we entered into the RBL Facility. The RBL Facility provides for a revolving loan with up to $1.5 billion of commitments, subject to a reserve borrowing base.
The RBL Facility also provides a letter of credit subfacility for the issuance of letters of credit in an aggregate amount not to exceed $25 million. Issuances of letters of credit reduce the borrowing availability for revolving loans under the RBL Facility on a dollar for dollar basis. Borrowing base redeterminations become effective each May and November, although each of the administrative agent and Berry LLC may make one interim redetermination between scheduled redeterminations. The RBL Facility has an elected commitment feature that allows us to increase commitments to the amount of our borrowing base with lender approval. In late 2019, we completed a borrowing base redetermination under our RBL Facility that set our borrowing base to $500 million and reaffirmed our elected commitment amount at $400 million. The RBL Facility matures on July 29, 2022, unless terminated earlier in accordance with the RBL Facility terms. As of December 31, 2019, we had approximately $7 million in letters of credit outstanding, $2 million borrowed and borrowing availability of $391 million under the RBL Facility. As of January 31, 2020, we had no borrowings outstanding, $7 million in letters of credit outstanding, and approximately $393 million of available borrowings capacity under the RBL Facility.
The outstanding borrowings under the RBL Facility bear interest at a rate equal to either (i) a customary London interbank offered rate plus an applicable margin ranging from 2.50% to 3.50% per annum, and (ii) a customary base rate plus an applicable margin ranging from 1.50% to 2.50% per annum, in each case depending on levels of borrowing base utilization. In addition, we must pay the lenders a quarterly commitment fee of 0.50% on the average daily unused amount of the borrowing availability under the RBL Facility. We have the right to prepay any borrowings under the RBL Facility with prior notice at any time without a prepayment penalty, other than customary “breakage” costs with respect to eurodollar loans.
The RBL Facility contains events of default and remedies customary for this type of credit facility. If we do not comply with the financial and other covenants in the RBL Facility, the lenders may, subject to customary cure rights, require immediate payment of all amounts outstanding under the RBL Facility and exercise all of their other rights and remedies, including foreclosure on all of the collateral.
The RBL Facility requires us to maintain on a consolidated basis as of each quarter-end (i) a Leverage Ratio of no more than 4.00 to 1.00 and (ii) a Current Ratio of at least 1.00 to 1.00. The RBL Facility also contains customary restrictions. As of December 31, 2019, our Leverage Ratio and Current Ratio were 1.4:1.00 and 3.2:1.00, respectively. As of December 31, 2019, we were in compliance with the financial covenants under the RBL Facility.
The RBL Facility permits us to repurchase equity and indebtedness, among other things, if availability is equal to or greater than 15% of the elected commitments or borrowing base, whichever is in effect, and our pro forma leverage ratio is less than or equal to 2.75 to 1.00.
Berry Corp. guarantees, and each future subsidiary of Berry Corp. (other than Berry LLC), with certain exceptions, is required to guarantee, our obligations and obligations of the other guarantors under the RBL Facility and under certain hedging transactions and banking services arrangements (the “Guaranteed Obligations”). In addition, pursuant to a Guaranty Agreement dated as of July 31, 2017, Berry LLC guarantees the Guaranteed Obligations. The lenders under the RBL Facility hold a mortgage on at least 85% of the present value of our proven oil and gas reserves. The obligations of Berry LLC and the guarantors are also secured by liens on substantially all of our personal property, subject to customary exceptions. The RBL Facility, with certain exceptions, also requires that any future subsidiaries of Berry LLC are required to grant mortgages, security interests and equity pledges.
67
Corporate Organization
Berry Corp., as Berry LLC's parent company, has no independent assets or operations. Any guarantees of potential future registered debt securities by Berry Corp. or Berry LLC would be full and unconditional. Berry Corp. and Berry LLC currently do not have any other subsidiaries. In addition, there are no significant restrictions upon the ability of Berry LLC to distribute funds to Berry Corp. by distribution or loan other than under the RBL Facility. None of the assets of Berry Corp. or Berry LLC represent restricted net assets.
The RBL permits Berry LLC to make distributions to Berry Corp. so long as both before and after giving pro forma effect to such distribution no default or borrowing base deficiency exists, availability equals or exceeds 15% of the then effective borrowing base, and Berry Corp. demonstrates a pro forma leverage ratio less than or equal to 2.75 to 1.00. The conditions are currently met with significant margin.
Hedging
We have protected a significant portion of our anticipated cash flows through our commodity hedging program, including through fixed-price derivative contracts for oil production and gas purchases. For information regarding risks related to our hedging program, see “Item 1A. Risk Factors—Risks Related to Our Business and Industry”.
We currently have hedged a significant portion of our crude oil production through 2020 and into 2021. Our generally low-decline production base, coupled with our stable operating cost environment, affords an ability to hedge a material amount of our future expected production. Oil derivative settlements increased for the year ended December 31, 2019 when compared to the year ended December 31, 2018, as a result of an increase in realized oil prices with hedges, as well as, an increase in oil volumes hedged.
As of December 31, 2019, we had the following crude oil production and gas purchases hedges.
Q1 2020 | Q2 2020 | Q3 2020 | Q4 2020 | FY 2021 | |||||||||||||||
Fixed Price Oil Swaps (Brent): | |||||||||||||||||||
Hedged volume (MBbls) | 1,729 | 1,456 | 1,472 | 1,472 | 730 | ||||||||||||||
Weighted average price ($/Bbl) | $ | 63.92 | $ | 64.30 | $ | 64.21 | $ | 64.21 | $ | 58.50 | |||||||||
Fixed Price Oil Swaps (WTI): | |||||||||||||||||||
Hedged volume (MBbls) | 91 | 30 | — | — | — | ||||||||||||||
Weighted average price ($/Bbl) | $ | 61.75 | $ | 61.75 | $ | — | $ | — | $ | — | |||||||||
Fixed Price Gas Purchase Swaps (Kern, Delivered): | |||||||||||||||||||
Hedged volume (MMBtu) | 5,005,000 | 5,005,000 | 5,060,000 | 2,315,000 | 900,000 | ||||||||||||||
Weighted average price ($/MMBtu) | $ | 2.89 | $ | 2.89 | $ | 2.89 | $ | 2.79 | $ | 2.50 | |||||||||
Fixed Price Gas Purchase Swaps (SoCal Citygate): | |||||||||||||||||||
Hedged volume (MMBtu) | 455,000 | 455,000 | 460,000 | 155,000 | — | ||||||||||||||
Weighted average price ($/MMBtu) | $ | 3.80 | $ | 3.80 | $ | 3.80 | $ | 3.80 | $ | — | |||||||||
After December 31, 2019 we added fixed price gas purchase swaps (Kern, Delivered) of 5,000 MMBtu/d at $2.55 beginning November 2020 through October 2021.
68
The following table summarizes the historical results of our hedging activities.
Year Ended | |||||||
December 31, 2019 | December 31, 2018 | ||||||
Crude Oil (per Bbl): | |||||||
Realized sales price, before the effects of derivative settlements | $ | 58.93 | $ | 64.76 | |||
Effects of derivative settlements | $ | 4.69 | $ | (5.09 | ) | ||
Natural Gas (per MMBtu): | |||||||
Purchase price, before the effects of derivative settlements | $ | 3.18 | $ | 3.27 | |||
Effects of derivative settlements | $ | 0.04 | $ | (0.10 | ) | ||
In 2019, our gas purchase derivative settlements resulted in payments as the strike price of our hedges were higher than the index price. In 2018, our gas purchase derivative settlements resulted in receipts as the strike price of our hedges were lower than the index price.
In May 2018, we elected to terminate outstanding commodity derivative contracts for all WTI oil swaps and certain WTI/Brent basis swaps for July 2018 through December 2019 and all WTI oil sold call options for July 2018 through June 2020. Termination costs totaled approximately $127 million and were calculated in accordance with a bilateral agreement on the cost of elective termination included in these derivative contracts; the present value of the contracts using the forward price curve as of the date termination was elected. No penalties were charged as a result of the elective termination.
Capital Program
For the years ended December 31, 2019 and 2018 our capital expenditures were approximately $211 million and $148 million, respectively, on an accrual basis excluding acquisitions. California production increased 15% year-over-year in response to the deployment of the substantial majority of our development capital. This increase strongly demonstrated the ability of our California properties to respond to capital and perform as expected. Additionally, our 2019 capital program contributed to the increase in our California proved reserves of 24.5 MMBoe, or 23% before production, resulting in a 299% replacement ratio. We also replaced 159% of our total company proved undeveloped drilling location inventory.
Our 2020 anticipated capital expenditure budget is approximately $125 to $145 million. Using the mid-point of this range, we expect to have a decrease of approximately 36% over 2019 capital expenditures. Our 2020 capital program is focused on generating strong year-over-year oil production growth in California, while holding overall production close to flat throughout the year, and continue returning capital to our shareholders. Based on current commodity prices and our drilling success rate, we expect to be able to fund our 2020 capital development programs while producing positive Levered Free Cash Flow and continue to pay quarterly dividends. We anticipate oil production will be approximately 90% of total production in 2020, compared to 87% in 2019 and 82% in 2018. During 2020, we expect to employ up to three drilling rigs in California throughout the last three quarters of the year, and averaging up to one rig in the first quarter. For the year, we expect to drill 195 to 225 gross development wells, almost all of which will be in California for oil production. However, the execution of these plans requires certain regulatory review and approvals, and current and future laws and regulations could impact our ability to successfully execute our plans. Please see “Regulation of Health, Safety and Environmental Matters” for additional discussion.
In addition to capital expenditures, we also incur costs associated with retiring assets and remediating property at the end of its useful life, both due to regulatory obligations and our focus on EH&S as we develop existing fields. Most of these obligations and activities are regulated by governmental agencies. During 2019, we spent approximately $27 million in fulfilling these obligations and in 2020 we expect to spend approximately $20 million. A significant portion of these costs is a result of California's new idle well regulations which became effective in 2019 and accelerated the timing of abandonment of certain existing idle wells. In accordance with these regulations, we expect to plug and abandon a majority of our existing idle wells over the next eight years.
69
The amount and timing of capital expenditures is within our control and subject to our management’s discretion, and may be adjusted during the year depending on commodity prices and other factors. We retain the flexibility to defer planned capital expenditures depending on a variety of factors, including but not limited to the success of our drilling activities, prevailing and anticipated prices for oil, natural gas and NGLs, the receipt and timing of required regulatory permits and approvals, the availability of necessary equipment, infrastructure and capital, seasonal conditions, drilling and acquisition costs and the level of participation by other interest owners, as well as general market conditions.
IPO and Preferred Stock Conversion
In July 2018, we completed the IPO and as a result, on July 26, 2018, our common stock began trading on the NASDAQ under the ticker symbol BRY. We received approximately $110 million of net proceeds, after deducting underwriting discounts and offering expenses payable by us, for the 8,695,653 shares of common stock issued for our benefit in the IPO, net of the shares sold for the benefit of certain selling stockholders. The price to the public for the shares sold in our IPO was $14.00 per share.
Of the approximately $110 million of net proceeds we received in the IPO, we used approximately $105 million to repay borrowings under our RBL Facility, which included $60 million we borrowed to make the payment due to the holders of our Series A Preferred Stock in connection with the conversion of preferred stock to common stock. We used the remainder for general corporate purposes.
In connection with the IPO, on July 17, 2018, we entered into stock purchase agreements with certain funds affiliated with Oaktree Capital Management and Benefit Street Partners, pursuant to which we purchased an aggregate of 410,229 and 1,391,967 shares of our common stock, respectively, or 1,802,196 in total. In addition to the 8,695,653 shares of common stock issued and sold for our benefit in the IPO, we simultaneously received $24 million for issuing and selling 1,802,196 shares to the public and paid $24 million to purchase 1,802,196 shares under the stock purchase agreements. We purchased the shares immediately following the closing of the IPO and retired and returned them to the status of authorized but unissued shares.
The selling stockholders sold an additional 2,545,630 shares at a price to the public of $14.00 per share, for which we did not receive any proceeds.
In connection with the IPO, each of the 37.7 million shares of our Series A Preferred Stock outstanding was automatically converted to common stock in the Series A Preferred Stock Conversion. The cash payment was to be reduced in respect of any cash dividend paid by the Company on such share of Series A Preferred Stock for any period commencing on or after April 1, 2018. Because we paid the second quarter preferred dividend of $0.15 per share in June, the cash payment for the conversion was reduced to $1.60 per share, or approximately $60 million in aggregate. In connection with the IPO, we assigned the additional 1.9 million shares of common stock issued in the Series A Preferred Stock Conversion a value of $14.00 per share, which was equal to the value of shares sold in the IPO. The approximate $27 million value assigned to the 1.9 million shares and the $60 million cash payment for the Series A Preferred Stock Conversion reduced the income available to common stockholders by approximately $87 million.
Stock Repurchase Program
In December 2018, our Board of Directors adopted a program for the opportunistic repurchase of up to $100 million of our common stock. Based on the Board’s evaluation of current market conditions for our common stock they authorized current repurchases of up to $50 million under the program. Purchases may be made from time to time in the open market, in privately negotiated transactions or otherwise. The manner, timing and amount of any purchases will be determined based on our evaluation of market conditions, stock price, compliance with outstanding agreements and other factors, may be commenced or suspended at any time without notice and does not obligate Berry Corp. to purchase shares during any period or at all. Any shares acquired will be available for general corporate purposes.
In 2019 the Company repurchased 4,609,021 shares at an average price of $9.99. Since 2018 the Company has repurchased a total of 5,057,682 shares at an average price of $9.88 per share under the Stock Repurchase Program,
70
which is reflected as treasury stock. In February 2020, the Board of Directors authorized the remaining $50 million of our $100 million repurchase program.
Preferred Stock Dividends
In March 2018, our board of directors approved a cumulative paid-in-kind dividend on the Series A Preferred Stock for the periods through December 31, 2017. The cumulative dividend was 0.050907 new shares per outstanding share or approximately 1,825,000 shares in total. Also in the first and second quarter of 2018 the board of directors approved a $0.158 per share and a $0.15 per share cash dividend on the Series A Preferred Stock, respectively, for a total of $11.3 million.
Statements of Cash Flows
The following is a comparative cash flow summary:
Year Ended | |||||||
December 31, 2019 | December 31, 2018 | ||||||
(in thousands) | |||||||
Net cash: | |||||||
Provided by operating activities(1) | $ | 241,829 | $ | 105,471 | |||
Used in investing activities | (225,025 | ) | (121,440 | ) | |||
(Used in) provided by financing activities | (85,484 | ) | 15,911 | ||||
Net decrease in cash, cash equivalents and restricted cash | $ | (68,680 | ) | $ | (58 | ) | |
(1) | The amounts provided by operating activities in 2018 were negatively impacted by a one-time $127 million payment in May 2018 for early termination on derivatives. |
Operating Activities
Cash provided by operating activities increased for the year ended December 31, 2019 by approximately $136 million when compared to the year ended December 31, 2018, due to the early termination of certain hedge contracts paid during the second quarter of 2018 of $127 million, the year-over-year increase in oil derivative cash settlements received of $84 million, and the increase in oil, natural gas and natural gas liquids sales of approximately $13 million, offset by increased operating expenses of $35 million, increased taxes, other than income of approximately $8 million, increased general and administrative expenses of $9 million and working capital changes of approximately $39 million.
71
Investing Activities
The following provides a comparative summary of cash flow from investing activities:
Year Ended | |||||||
December 31, 2019 | December 31, 2018 | ||||||
(in thousands) | |||||||
Capital expenditures (1) | |||||||
Development of oil and natural gas properties | $ | (219,176 | ) | $ | (94,225 | ) | |
Changes in capital investment accruals | 12,814 | (20,371 | ) | ||||
Purchase of other property and equipment | (16,792 | ) | (15,056 | ) | |||
Acquisition of properties and equipment | (2,840 | ) | — | ||||
Proceeds from sale of properties and equipment and other | 969 | 8,212 | |||||
Cash used in investing activities: | $ | (225,025 | ) | $ | (121,440 | ) | |
__________
(1) | Based on actual cash payments rather than accrual. |
Cash used in investing activities increased $104 million for the year ended December 31, 2019 when compared to the year ended December 31, 2018, primarily due to an increase in capital spending in accordance with the 2019 capital program.
Financing Activities
Cash used in financing activities was approximately $85 million for the year ended December 31, 2019 and was primarily used to purchase treasury stock of $47 million and pay dividends on common stock of approximately $39 million, offset by approximately $2 million of net borrowings under the RBL Facility for monthly working capital fluctuations.
Cash provided by financing activities was approximately $16 million for the year ended December 31, 2018 and was due to the net proceeds of $391 million from the issuance of our 2026 Notes and $110 million from our IPO in July 2018, offset by $379 million in payments on our RBL Facility, a $60 million payment to preferred stockholders in connection with the Series A Preferred Stock Conversion, $20 million payments to repurchase the rights to our common stock from certain claimholders originating from the bankruptcy process, $11 million in cash dividends declared on our Series A Preferred Stock, $7 million in dividends paid on our common stock and $3 million to acquire treasury shares under our stock repurchase program.
Commitments, and Contingencies
In the normal course of business, we, or our subsidiary, are subject to lawsuits, environmental and other claims and other contingencies that seek, or may seek, among other things, compensation for alleged personal injury, breach of contract, property damage or other losses, punitive damages, civil penalties, or injunctive or declaratory relief.
On May 11, 2016 our predecessor company filed the Chapter 11 Proceeding. Our bankruptcy case was jointly administered with that of Linn Energy and its affiliates under the caption In re Linn Energy, LLC, et al., Case No. 16-60040. On January 27, 2017, the Bankruptcy Court approved and confirmed our plan of reorganization in the Chapter 11 Proceeding. On February 28, 2017, the Effective Date occurred and the Plan became effective and was implemented. A final decree closing the Chapter 11 Proceeding was entered September 28, 2018, with the Court retaining jurisdiction as described in the confirmation order and without prejudice to the request of any party-in-interest to reopen the case including with respect to certain, immaterial remaining matters.
We accrue reserves for currently outstanding lawsuits, claims and proceedings when it is probable that a liability has been incurred and the liability can be reasonably estimated. We have not recorded any reserve balances at
72
December 31, 2019 and December 31, 2018. We also evaluate the amount of reasonably possible losses that we could incur as a result of these matters. We believe that reasonably possible losses that we could incur in excess of reserves accrued on our balance sheet would not be material to our consolidated financial position or results of operations.
We have certain commitments under contracts, including purchase commitments for goods and services. We previously had an obligation to a counterparty in connection with our Piceance assets to either build a road or secure a license for alternative access, in lieu of paying a $6 million penalty. As of December 31, 2019, we fulfilled the obligation by delivering the access license pursuant to the agreement. The counterparty has since filed a claim challenging the sufficiency of such access.
We, or our subsidiary, or both, have indemnified various parties against specific liabilities those parties might incur in the future in connection with transactions that they have entered into with us. As of December 31, 2019, we are not aware of material indemnity claims pending or threatened against us.
Contractual Obligations
The following is a summary of our commitments and contractual obligations as of December 31, 2019:
Payments Due | ||||||||||||||||||||
Total | 2020 | 2021-2022 | 2023-2024 | Thereafter | ||||||||||||||||
(in thousands) | ||||||||||||||||||||
Debt obligations: | ||||||||||||||||||||
RBL Facility | $ | 1,850 | $ | — | $ | 1,850 | $ | — | $ | — | ||||||||||
2026 Notes | 400,000 | — | — | — | 400,000 | |||||||||||||||
Interest(1) | 171,529 | 28,000 | 56,000 | 56,000 | 31,529 | |||||||||||||||
Other: | ||||||||||||||||||||
Asset retirement obligations(2) | 149,227 | 21,434 | — | — | 127,793 | |||||||||||||||
Off-Balance Sheet arrangements: | ||||||||||||||||||||
Processing and transportation contracts(3) | 13,462 | 7,136 | 5,265 | 1,061 | — | |||||||||||||||
Operating lease obligations | 11,969 | 1,723 | 3,471 | 3,067 | 3,708 | |||||||||||||||
Other(4) | 6,000 | 6,000 | — | — | — | |||||||||||||||
Total contractual obligations | $ | 754,037 | $ | 64,293 | $ | 66,586 | $ | 60,128 | $ | 563,030 | ||||||||||
__________
(1) | Represents interest on the 2026 Notes computed at 7.0% through contractual maturity in 2026. |
(2) | Represents the estimated future asset retirement obligations on a discounted basis. We do not show the long-term asset retirement obligations by year as we are not able to precisely predict the timing of these amounts. Because these costs typically extend many years into the future, estimating these future costs requires management to make estimates and judgments that are subject to revisions based on numerous factors, including the rate of inflation, changing technology, and changes to federal, state and local laws and regulations. See Note 1 in the Notes to Consolidated Financial Statements in Part II—Item 8. Financial Statements and Supplementary Data for more information. |
(3) | Amounts include payments which will become due under long-term agreements to purchase goods and services used in the normal course of business to secure transportation of our natural gas production to market as well as pipeline and processing capacity. |
(4) | We have certain commitments under contracts, including purchase commitments for goods and services. We previously had an obligation to a counterparty in connection with our Piceance assets to either build a road or secure a license for alternative access, in lieu of paying a $6 million penalty. As of December 31, 2019, we fulfilled the obligation by delivering the access license pursuant to the agreement. The counterparty has since filed a claim challenging the sufficiency of such access. |
73
Balance Sheet Analysis
The changes in our balance sheet from December 31, 2018 to December 31, 2019 are discussed below.
December 31, 2019 | December 31, 2018 | ||||||
(in thousands) | |||||||
Cash and cash equivalents | $ | — | $ | 68,680 | |||
Accounts receivable, net | $ | 71,867 | $ | 57,379 | |||
Derivative instruments - current and long-term | $ | 9,691 | $ | 91,885 | |||
Other current assets | $ | 19,399 | $ | 14,367 | |||
Property, plant & equipment, net | $ | 1,576,267 | $ | 1,442,708 | |||
Other non-current assets | $ | 12,974 | $ | 17,244 | |||
Accounts payable and accrued liabilities | $ | 151,811 | $ | 144,118 | |||
Derivative instruments - current and long-term | $ | 4,958 | $ | — | |||
Long-term debt | $ | 394,319 | $ | 391,786 | |||
Asset retirement obligation | $ | 124,019 | $ | 89,176 | |||
Other non-current liabilities | $ | 33,586 | $ | 14,902 | |||
Equity | $ | 972,448 | $ | 1,006,446 | |||
See “—Liquidity and Capital Resources” for discussions about the changes in cash and cash equivalents.
The $14 million increase in accounts receivable was driven mostly by higher sales period-over-period, partially offset by lower hedge settlements outstanding at each period-end.
The $77 million decrease in derivative assets and liabilities reflected the reduction in the mark-to-market values relative to the strike price of the derivatives at the end of each period presented, as well as the change in positions held at the end of each period and the settlements received throughout the period.
The $5 million increase in other current assets was mainly due to purchases of materials inventory related to our capital development program.
The $134 million increase in property, plant and equipment was largely the result of increased capital investments in oil and gas properties, as well as revisions to timing and cost estimates in our asset retirement obligations noted below, partially offset by increased accumulated depreciation of all properties and the Piceance property impairment.
The $4 million decrease in other non-current assets was primarily due to amortization of debt issuance costs.
The $8 million increase in accounts payable and accrued liabilities included approximately $19 million for the increased current portion of the asset retirement obligation partially offset by decreased accruals for various capital and operating costs of $10 million due to the level of these costs at the end of each year.
The $3 million increase in long-term debt primarily represented borrowing and repayment activity from our RBL Facility for monthly working capital fluctuations.
The $35 million increase in the long-term portion of the asset retirement obligation reflected revisions to timing and cost estimates of $57 million, $12 million for new wells, and $8 million of accretion expense. A significant portion of the change in estimate was a result of California's new idle well regulations which became effective in 2019. These regulations accelerated the abandonment timing of certain long existing idle wells. These increases were partially offset by increased liability settlements of $22 million and a $19 million change from long to short-term asset retirement obligation.
74
The $19 million increase in other non-current liabilities primarily represented increases to the greenhouse gas liability, which is due for payment more than one year from December 31, 2019.
The $34 million decrease in equity was due to the purchase of treasury stock for $46 million and common stock dividends declared of $39 million. These decreases were offset by $44 million of net income and $8 million related to our stock-based incentive awards.
Non-GAAP Financial Measures
Adjusted EBITDA, Levered Free Cash Flow, Adjusted Net Income (Loss) and Adjusted General and Administrative Expenses
Adjusted Net Income (Loss) is not a measure of net income (loss), Levered Free Cash Flow is not a measure of cash flow, and Adjusted EBITDA is not a measure of either, in all cases, as determined by GAAP. Adjusted EBITDA, Adjusted Net Income (Loss) and Levered Free Cash Flow are supplemental non-GAAP financial measures used by management and external users of our financial statements, such as industry analysts, investors, lenders and rating agencies.
We define Adjusted EBITDA as earnings before interest expense; income taxes; depreciation, depletion, and amortization; derivative gains or losses net of cash received or paid for scheduled derivative settlements; impairments; stock compensation expense; and other unusual, out-of-period and infrequent items, including restructuring costs and reorganization items. We define Levered Free Cash Flow as Adjusted EBITDA less capital expenditures, interest expense and dividends.
Our management believes Adjusted EBITDA provides useful information in assessing our financial condition, results of operations and cash flows and is widely used by the industry and the investment community. The measure also allows our management to more effectively evaluate our operating performance and compare the results between periods without regard to our financing methods or capital structure. Levered Free Cash Flow is used by management as a primary metric to plan capital allocation to sustain production levels and for internal growth opportunities, as well as hedging needs. It also serves as a measure for assessing our financial performance and our ability to generate excess cash from operations to service debt and pay dividends.
Adjusted Net Income (Loss) excludes the impact of unusual, out-of-period and infrequent items affecting earnings that vary widely and unpredictably, including non-cash items such as derivative gains and losses. This measure is used by management when comparing results period over period. We define Adjusted Net Income (Loss) as net income (loss) adjusted for derivative gains or losses net of cash received or paid for scheduled derivative settlements, other unusual, out-of-period and infrequent items, including restructuring costs and reorganization items and the income tax expense or benefit of these adjustments using our effective tax rate.
While Adjusted EBITDA, Adjusted Net Income (Loss) and Levered Free Cash Flow are non-GAAP measures, the amounts included in the calculation of Adjusted EBITDA, Adjusted Net Income (Loss) and Levered Free Cash Flow were computed in accordance with GAAP. These measures are provided in addition to, and not as an alternative for, income and liquidity measures calculated in accordance with GAAP. Certain items excluded from Adjusted EBITDA are significant components in understanding and assessing our financial performance, such as our cost of capital and tax structure, as well as the historic cost of depreciable and depletable assets. Our computations of Adjusted EBITDA, Adjusted Net Income (Loss) and Levered Free Cash Flow may not be comparable to other similarly titled measures used by other companies. Adjusted EBITDA, Adjusted Net Income (Loss) and Levered Free Cash Flow should be read in conjunction with the information contained in our financial statements prepared in accordance with GAAP.
Adjusted General and Administrative Expenses is a supplemental non-GAAP financial measure that is used by management and external users of our financial statements, such as industry analysts, investors, lenders and rating agencies. We define Adjusted General and Administrative Expenses as general and administrative expenses adjusted for restructuring and other non-recurring costs and non-cash stock compensation expense. Management believes
75
Adjusted General and Administrative Expenses is useful because it allows us to more effectively compare our performance from period to period.
We exclude the items listed above from general and administrative expenses in arriving at Adjusted General and Administrative Expenses because these amounts can vary widely and unpredictably in nature, timing, amount and frequency and stock compensation expense is non-cash in nature. Adjusted General and Administrative Expenses should not be considered as an alternative to, or more meaningful than, general and administrative expenses as determined in accordance with GAAP. Our computations of Adjusted General and Administrative Expenses may not be comparable to other similarly titled measures of other companies.
The following tables present reconciliations of the non-GAAP financial measures Adjusted EBITDA, Levered Free Cash Flow, and Adjusted Net Income (Loss) to the GAAP financial measures of net income (loss) and net cash provided or used by operating activities, as applicable, for each of the periods indicated.
Year Ended | |||||||
December 31, 2019 | December 31, 2018 | ||||||
(in thousands) | |||||||
Adjusted EBITDA reconciliation to net income (loss): | |||||||
Net (loss) income | $ | 43,539 | $ | 147,102 | |||
Add (Subtract): | |||||||
Interest expense | 34,234 | 35,648 | |||||
Income tax expense (benefit) | (36,550 | ) | 43,035 | ||||
Depreciation, depletion, and amortization | 106,006 | 86,271 | |||||
Impairment of oil and gas properties | 51,081 | — | |||||
Derivative losses (gains) | 44,955 | (1,735 | ) | ||||
Net cash received (paid) for scheduled derivative settlements(1) | 42,197 | (38,482 | ) | ||||
Other operating expenses (income) | 4,588 | (2,747 | ) | ||||
Stock compensation expense | 8,647 | 6,750 | |||||
Restructuring and other non-recurring costs | 3,061 | 6,773 | |||||
Reorganization items, net | 426 | (24,690 | ) | ||||
Adjusted EBITDA | $ | 302,184 | $ | 257,924 | |||
__________
(1) | Net cash received (paid) for scheduled derivative settlements does not include the $127 million in cash paid for early terminated derivatives in 2018. |
76
Year Ended | |||||||
December 31, 2019 | December 31, 2018 | ||||||
(in thousands) | |||||||
Adjusted EBITDA and Levered Free Cash Flow reconciliation to net cash provided by (used in) operating activities: | |||||||
Net cash provided by operating activities | $ | 241,829 | $ | 105,471 | |||
Add (Subtract): | |||||||
Cash interest payments | 30,720 | 19,761 | |||||
Cash income tax refunds | (2 | ) | (1,901 | ) | |||
Cash reorganization item payments | — | 832 | |||||
Restructuring and other non-recurring costs | 3,061 | 6,773 | |||||
Derivative early termination payment | — | 126,949 | |||||
Other changes in operating assets and liabilities | 26,576 | 39 | |||||
Adjusted EBITDA | $ | 302,184 | $ | 257,924 | |||
Subtract: | |||||||
Capital expenditures - accrual basis | (211,095 | ) | (147,831 | ) | |||
Interest expense | (34,234 | ) | (35,648 | ) | |||
Cash dividends declared(1) | (39,053 | ) | (28,658 | ) | |||
Levered Free Cash Flow(2) | $ | 17,802 | $ | 45,787 | |||
__________
(1) | Cash dividends declared in 2018 include $11 million of dividends for Series A Preferred Stock for the first two quarters of 2018 and $17 million of dividends for common stock. In connection with our IPO in July 2018, all of our outstanding Series A Preferred Stock was automatically converted into common stock. Common stock dividends were $0.09 per share for the third quarter of 2018, which was pro-rated from the date of our IPO through September 30, 2018, and $0.12 per share for the fourth quarter of 2018 and each quarter in 2019. |
(2) | Levered Free Cash Flow includes cash received for scheduled derivative settlements of $42 million for the year ended December 31, 2019, and cash paid for scheduled derivative settlements $38 million for the year ended December 31, 2018. |
The following table presents a reconciliation of the non-GAAP financial measure Adjusted Net Income (Loss) to the GAAP financial measure of Net income (loss).
Year Ended | |||||||
December 31, 2019 | December 31, 2018 | ||||||
(in thousands) | |||||||
Adjusted Net Income (Loss) reconciliation to net income (loss): | |||||||
Net (loss) income | $ | 43,539 | $ | 147,102 | |||
Subtract: prior year income tax credits | (38,653 | ) | — | ||||
Add (Subtract): | |||||||
Losses (gains) on oil and natural gas derivatives | 44,955 | (1,735 | ) | ||||
Net cash received (paid) for scheduled derivative settlements | 42,197 | (38,482 | ) | ||||
Other operating expenses (income) | 4,588 | (2,747 | ) | ||||
Impairment of oil and gas properties | 51,081 | — | |||||
Restructuring and other non-recurring costs | 3,061 | 6,773 | |||||
Reorganization items, net | 426 | (24,690 | ) | ||||
Total additions (subtractions), net | 146,308 | (60,881 | ) | ||||
Income tax (expense) benefit of adjustments at effective tax rate(1) | (40,966 | ) | 13,780 | ||||
Adjusted Net Income (Loss) | $ | 110,228 | $ | 100,001 | |||
77
__________
(1) | Excludes prior year income tax credits from the total additions (subtractions), net line item and the tax effect the prior tax credits have on the current year effective tax rate. |
The following table presents a reconciliation of the non-GAAP financial measure Adjusted General and Administrative Expenses to the GAAP financial measure of general and administrative expenses for each of the periods indicated.
Year Ended | |||||||
December 31, 2019 | December 31, 2018 | ||||||
(in thousands) | |||||||
Adjusted General and Administrative Expense reconciliation to general and administrative expenses: | |||||||
General and administrative expenses | $ | 62,643 | $ | 54,026 | |||
Subtract: | |||||||
Restructuring and other non-recurring costs | (3,061 | ) | (6,773 | ) | |||
Non-cash stock compensation expense (G&A portion) | (8,356 | ) | (6,585 | ) | |||
Adjusted general and administrative expenses | $ | 51,226 | $ | 40,668 | |||
Adjusted general and administrative expenses ($/MBoe) | $ | 4.84 | $ | 4.13 | |||
Off-Balance Sheet Arrangements
See “—Liquidity and Capital Resources—Commitments, and Contingencies” and “—Contractual Obligations ” for information regarding our off-balance sheet arrangements.
Critical Accounting Policies and Estimates
The process of preparing financial statements in accordance with generally accepted accounting principles requires management to select appropriate accounting policies and to make informed estimates and judgments regarding certain items and transactions. Changes in facts and circumstances or discovery of new information may result in revised estimates and judgments, and actual results may differ from these estimates upon settlement. We consider the following to be our most critical accounting policies and estimates that involve management’s judgment and that could result in a material impact on the financial statements due to the levels of subjectivity and judgment.
Oil and Natural Gas Properties
Proved Properties
We account for oil and natural gas properties in accordance with the successful efforts method. Under this method, all acquisition costs of proved properties are capitalized and amortized on a unit-of-production basis over the remaining life of the proved reserves. All development costs of proved properties are capitalized and amortized on a unit-of-production basis over the remaining life of the proved developed reserves. Costs of retired, sold or abandoned properties that constitute a part of an amortization base are charged or credited, net of proceeds, to accumulated depreciation, depletion and amortization unless doing so significantly affects the unit-of-production amortization rate, in which case a gain or loss is recognized in the current period. Gains or losses from the disposal of other properties are recognized in the current period. For assets acquired, we base the capitalized cost on fair value at the acquisition date. We expense expenditures for maintenance and repairs necessary to maintain properties in operating condition, as well as annual lease rentals, as they are incurred. Estimated dismantlement and abandonment costs are capitalized, net of salvage, at their estimated net present value and amortized over the remaining lives of the related assets. Interest is capitalized only during the periods in which these assets are brought to their intended use. We only capitalize the interest on borrowed funds related to our share of costs associated with qualifying capital expenditures.
78
We evaluate the impairment of our proved oil and natural gas properties generally on a field by field basis or at the lowest level for which cash flows are identifiable, whenever events or changes in circumstance indicate that the carrying value may not be recoverable. We reduce the carrying values of proved properties to fair value when the expected undiscounted future cash flows are less than net book value. We measure the fair values of proved properties using valuation techniques consistent with the income approach, converting future cash flows to a single discounted amount. Significant inputs used to determine the fair values of proved properties include estimates of: (i) reserves; (ii) future operating and development costs; (iii) future commodity prices; and (iv) a risk-adjusted discount rate. These inputs require significant judgments and estimates by our management at the time of the valuation and are the most sensitive estimates that we make and the most likely to change. The underlying commodity prices are embedded in our estimated cash flows and are the product of a process that begins with the relevant forward curve pricing, adjusted for estimated location and quality differentials, as well as other factors our management believes will impact realizable prices. The fair value was estimated using inputs characteristic of a Level 3 fair value measurement.
Unproved Properties
A portion of the carrying value of our oil and gas properties was attributable to unproved properties. At December 31, 2019 and 2018, the net capitalized costs attributable to unproved properties were approximately $314 million and $388 million, respectively. The unproved amounts were not subject to depreciation, depletion and amortization until they were classified as proved properties and amortized on a unit-of-production basis. We evaluate the impairment of our unproved oil and gas properties whenever events or changes in circumstances indicate the carrying value may not be recoverable. If the exploration and development work were to be unsuccessful, or management decided not to pursue development of these properties as a result of lower commodity prices, higher development and operating costs, contractual conditions or other factors, the capitalized costs of such properties would be expensed. The timing of any write-downs of unproved properties, if warranted, depends upon management’s plans, the nature, timing and extent of future exploration and development activities and their results. We believe our current plans and exploration and development efforts will allow us to realize the carrying value of our unproved property balance at December 31, 2019.
At year end 2019, we evaluated our proved and unproved natural gas properties in regards to the decline in our expectations of future gas prices. As a result, we recorded a non-cash pre-tax asset impairment charge of $51 million for our Piceance gas properties in Colorado, of which $23 million was for proved properties and $28 million for unproved properties.
Asset Retirement Obligation
We recognize the fair value of asset retirement obligations (“AROs”) in the period in which a determination is made that a legal obligation exists to dismantle an asset and remediate the property at the end of its useful life and the cost of the obligation can be reasonably estimated.
The liability amounts are based on future retirement cost estimates and incorporate many assumptions such as time to abandonment, technological changes, future inflation rates and the risk-adjusted discount rate. When the liability is initially recorded, we capitalize the cost by increasing the related property, plant and equipment (“PP&E”) balances. If the estimated future cost of the AROs changes, we record an adjustment to both the ARO and PP&E. Over time, the liability is increased, and expense is recognized through accretion, and the capitalized cost is depreciated over the useful life of the asset.
In certain cases, we do not know or cannot estimate when we may settle these obligations and therefore we cannot reasonably estimate the fair value of the liabilities. We will recognize these AROs in the periods in which sufficient information becomes available to reasonably estimate their fair values.
Fair Value Measurements
We have categorized our assets and liabilities that are measured at fair value in a three-level fair value hierarchy, based on the inputs to the valuation techniques: Level 1—using quoted prices in active markets for the assets or liabilities; Level 2—using observable inputs other than quoted prices for the assets or liabilities; and Level 3—using unobservable
79
inputs. Transfers between levels, if any, are recognized at the end of each reporting period. We primarily apply the market approach for recurring fair value measurement, maximize our use of observable inputs and minimize use of unobservable inputs. We generally use an income approach to measure fair value when observable inputs are unavailable. This approach utilizes management’s judgments regarding expectations of projected cash flows and discounts those cash flows using a risk-adjusted discount rate.
The most significant items on our balance sheet that would be affected by recurring fair value measurements are derivatives. We determine the fair value of our oil and natural gas derivatives using valuation techniques which utilize market quotes and pricing analysis. Inputs include publicly available prices and forward price curves generated from a compilation of data gathered from third parties. We classify these measurements as Level 2.
Stock-based Compensation
We have issued restricted stock units (“RSUs”) that vest over time and performance-based restricted stock units (“PSUs”) that vest based on our achievement of certain average prices per share or total shareholder return, to certain employees and non-employee directors. The fair value of the stock-based awards is determined at the date of grant and is not remeasured. Prior to our IPO in July 2018, we determined the fair value of the RSUs based on an estimate of the fair value of our equity using an income approach. We used a discounted cash flow method to value the estimated future cash flows at an appropriate discount rate. Subsequent to our IPO, since the underlying shares are now trading in the public markets, these estimates are no longer necessary. For PSUs, compensation value is measured on the grant date using payout values derived from a Monte-Carlo valuation model. Estimates used in the Monte Carlo valuation model are considered highly complex and subjective. Compensation expense, net of actual forfeitures, for the RSUs and PSUs is recognized on a straight-line basis over the requisite service periods, which is over the awards’ respective vesting or performance periods which range from one to three years.
Other Loss Contingencies
In the normal course of business, we are involved in lawsuits, claims and other environmental and legal proceedings and audits. We accrue reserves for these matters when it is probable that a liability has been incurred and the liability can be reasonably estimated. In addition, we disclose, if material, in aggregate, our exposure to loss in excess of the amount recorded on the balance sheet for these matters if it is reasonably possible that an additional material loss may be incurred. We review our loss contingencies on an ongoing basis.
Loss contingencies are based on judgments made by management with respect to the likely outcome of these matters and are adjusted as appropriate. Management’s judgments could change based on new information, changes in, or interpretations of, laws or regulations, changes in management’s plans or intentions, opinions regarding the outcome of legal proceedings, or other factors.
80
Fresh-Start Accounting
Upon our emergence from Chapter 11 bankruptcy, we adopted fresh-start accounting which resulted in our becoming a new entity for financial reporting purposes. We were required to adopt fresh-start accounting upon our emergence from Chapter 11 bankruptcy because (i) the holders of existing voting ownership interests of Berry LLC received less than 50% of the voting shares of Berry Corp. and (ii) the reorganization value of our assets immediately prior to confirmation of the Plan was less than the total of all post-petition liabilities and allowed claims, as shown below:
(in thousands) | |||
Liabilities subject to compromise | $ | 1,000,336 | |
Pre-petition debt not classified as subject to compromise | 891,259 | ||
Post-petition liabilities | 245,702 | ||
Total post-petition liabilities and allowed claims | 2,137,297 | ||
Reorganization value of assets immediately prior to implementation of the Plan | (1,722,585 | ) | |
Excess post-petition liabilities and allowed claims | $ | 414,712 | |
Upon adoption of fresh-start accounting, the reorganization value derived from the enterprise value was allocated to our assets and liabilities based on their fair values in accordance with GAAP. The Effective Date fair values of our assets and liabilities differed materially from their recorded values as reflected on the historical balance sheet. The effects of the Plan and the application of fresh-start accounting were reflected in the financial statements as of February 28, 2017, and the related adjustments thereto were recorded on the statement of operations for the two months ended February 28, 2017.
As a result of the adoption of fresh-start accounting and the effects of the implementation of the Plan, our consolidated financial statements subsequent to February 28, 2017 are not comparable to our financial statements prior to February 28, 2017.
Our consolidated financial statements and related footnotes are presented with a black line division, which delineates the lack of comparability between amounts presented after February 28, 2017, and amounts presented on or prior to February 28, 2017. Our financial results for future periods following the application of fresh-start accounting will be different from historical trends and the differences may be material.
Reorganization Value
Under GAAP, Berry Corp. determined a value to be assigned to the equity of the emerging entity as of the date of adoption of fresh-start accounting. The Plan and disclosure statement approved by the Bankruptcy Court did not include an enterprise value or reorganization value, nor did the Bankruptcy Court approve a value as part of its confirmation of the Plan. Our reorganization value was derived from an estimate of enterprise value, or the fair value of our long-term debt, stockholders’ equity and working capital. Reorganization value approximates the fair value of the entity before considering liabilities and approximates the amount a willing buyer would pay for the assets of the entity immediately after the restructuring. Based on the various estimates and assumptions necessary for fresh-start accounting, we estimated our enterprise value as of the Effective Date to be approximately $1.3 billion. The enterprise value was estimated using a sum of parts approach. The sum of parts approach represents the summation of the indicated fair value of the component assets of the Company. The fair value of our assets was estimated by relying on a combination of the income, market and cost approaches.
The estimated enterprise value, reorganization value and equity value are highly dependent on the achievement of the financial results contemplated in our underlying projections. While we believe the assumptions and estimates used to develop enterprise value and reorganization value are reasonable and appropriate, different assumptions and estimates could materially impact the analysis and resulting conclusions. Additionally, the assumptions used in estimating these values are inherently uncertain and require judgment. The primary assumptions for which there is a reasonable possibility
81
of the occurrence of a variation that would have significantly affected the reorganization value include those regarding pricing, discount rates and the amount and timing of capital expenditures.
Our principal assets are our oil and natural gas properties. The fair values of oil and natural gas properties were estimated using a valuation technique consistent with the income approach, specifically the discounted cash flows method. We also used the market approach to corroborate the valuation results from the income approach. We used a market-based weighted-average cost of capital discount rate of 10% for proved and unproved reserves, with further risk adjustment factors applied to the discounted values. The underlying commodity prices embedded in our estimated cash flows are based on the Brent and Henry Hub forward curve pricing, adjusted for estimated location and quality differentials, as well as other factors that we believe will impact realizable prices. Forward curve pricing was used for years 2017 through 2019 and then was escalated at approximately 2.0%.
The following table reconciles the enterprise value to the estimated reorganization value as of the Effective Date:
(in thousands) | |||
Enterprise value | $ | 1,278,527 | |
Plus: Fair value of non-debt liabilities | 282,511 | ||
Reorganization value of the successor’s assets | $ | 1,561,038 | |
The fair value of non-debt liabilities consists of liabilities assumed by Berry Corp. on the Effective Date and excludes the fair value of long-term debt.
Consolidated Balance Sheet
The adjustments included in the fresh-start consolidated balance sheet in the accompanying financial statements reflect the effects of the transactions contemplated by the Plan and executed on the Effective Date as well as fair value and other required accounting adjustments resulting from the adoption of fresh-start accounting. The explanatory notes provide additional information with regard to the adjustments recorded, methods used to determine the fair values and significant assumptions.
Significant Accounting and Disclosure Changes
See Note 1 in the Notes to Consolidated Financial Statements in Part II—Item 8. Financial Statements and Supplementary Data of this report for a discussion of new accounting matters.
Inflation
Inflation in the United States has been relatively low in recent years and did not have a material impact on our results of operations for the periods discussed. Although the impact of inflation has been insignificant in recent years, it is still a factor in the United States economy and we may experience inflationary pressure on the cost of oilfield services and equipment as increasing oil, natural gas and NGL prices increase drilling activity in our areas of operations. An increase in oil, natural gas and NGL prices may cause the costs of materials and services to rise.
82
CAUTIONARY NOTE REGARDING FORWARD-LOOKING STATEMENTS
The information included or incorporated by reference in this report includes forward-looking statements that involve risks and uncertainties that could materially affect our expected results of operations, liquidity, cash flows and business prospects. Such statements specifically include our expectations as to our future financial position, liquidity, cash flows, results of operations and business strategy, potential acquisition opportunities, other plans and objectives for operations, capital for sustained production levels, expected production and costs, reserves, hedging activities, capital expenditures, return of capital, improvement of recovery factors and other guidance. Actual results may differ from anticipated results, sometimes materially, and reported results should not be considered an indication of future performance. You can typically identify forward-looking statements by words such as aim, anticipate, achievable, believe, budget, continue, could, effort, estimate, expect, forecast, goal, guidance, intend, likely, may, might, objective, outlook, plan, potential, predict, project, seek, should, target, will or would and other similar words that reflect the prospective nature of events or outcomes. For any such forward-looking statement that includes a statement of the assumptions or bases underlying such forward-looking statement, we caution that, while we believe such assumptions or bases to be reasonable and make them in good faith, assumed facts or bases almost always vary from actual results, sometimes materially. Material risks that may affect us are discussed above in “Item 1A. Risk Factors” in this prospectus, in any applicable prospectus supplement and in the documents incorporated by reference.
Factors (but not necessarily all the factors) that could cause results to differ include among others:
• | volatility of oil, natural gas and NGL prices; |
• | inability to generate sufficient cash flow from operations or to obtain adequate financing to fund capital expenditures, meet our working capital requirements or fund planned investments; |
• | price and availability of natural gas; |
• | our ability to use derivative instruments to manage commodity price risk; |
• | availability or timing of, or conditions imposed on, permits and approvals; |
• | our ability to meet our planned drilling schedule, including due to our ability to obtain permits, and to successfully drill wells that produce oil and natural gas in commercially viable quantities; |
• | the impact of current laws and regulations, and of pending or future legislative and regulatory changes and other government activities, including those related to drilling, completion, well stimulation, operation, maintenance or abandonment of wells or facilities, managing energy, water, land, greenhouse gases or other emissions, protection of health, safety and the environment, or transportation, marketing and sale of our products; |
• | concerns about climate change and other air quality issues; |
• | uncertainties associated with estimating proved reserves and related future cash flows; |
• | our ability to replace our reserves through exploration and development activities; |
• | lower–than–expected production, reserves or resources from development projects or higher–than–expected decline rates; |
• | our ability to obtain timely and available drilling and completion equipment and crew availability and access to necessary resources for drilling, completing and operating wells |
• | changes in tax laws; |
• | effects of competition; |
• | our ability to make acquisitions and successfully integrate any acquired businesses; |
• | market fluctuations in electricity prices and the cost of steam; |
• | asset impairments from commodity price declines; |
83
• | large or multiple customer defaults on contractual obligations, including defaults resulting from actual or potential insolvencies; |
• | geographical concentration of our operations; |
• | our ability to improve our financial results and profitability following our emergence from bankruptcy and other risks and uncertainties related to our emergence from bankruptcy; |
• | impact of derivatives legislation affecting our ability to hedge; |
• | ineffectiveness of internal controls; |
• | catastrophic events; |
• | litigation; |
• | our ability to retain key members of our senior management and key technical employees; and |
• | information technology failures or cyber attacks. |
Except as required by law, we undertake no responsibility to publicly release the result of any revision of our forward-looking statements after the date they are made.
All forward-looking statements, expressed or implied, included in this report are expressly qualified in their entirety by this cautionary statement. This cautionary statement should also be considered in connection with any subsequent written or oral forward-looking statements that we or persons acting on our behalf may issue.
84
Item 7A. Quantitative and Qualitative Disclosures About Market Risk
Our primary market risks are attributable to fluctuations in commodity prices and interest rates, which can affect our business, financial condition, operating results and cash flows. The following should be read in conjunction with the financial statements and related notes included elsewhere in this report.
Price Risk
Our most significant market risk relates to prices for oil, natural gas, and NGLs. Management expects energy prices to remain unpredictable and potentially volatile. As energy prices decline or rise significantly, revenues, certain costs such as fuel gas, and cash flows are likewise affected. In addition, a non-cash write-down of our oil and gas properties may be required if commodity prices experience a significant decline.
We have hedged a large portion of our expected crude oil production and our natural gas purchase requirements to reduce exposure to fluctuations in commodity prices. We use derivatives such as swaps, calls and puts to hedge. We do not enter into derivative contracts for speculative trading purposes and we have not accounted for our derivatives as cash-flow or fair-value hedges. We continuously consider the level of our oil production and gas purchases that is appropriate to hedge based on a variety of factors, including, among other things, current and future expected commodity prices, our expected capital and operating costs, our overall risk profile, including leverage, size and scale, as well as any requirements for, or restrictions on, levels of hedging contained in any credit facility or other debt instrument applicable at the time.
We determine the fair value of our oil and natural gas derivatives using valuation techniques which utilize market quotes and pricing analysis. Inputs include publicly available prices and forward price curves generated from a compilation of data gathered from third parties. At December 31, 2019, the fair value of our hedge positions was a net asset of approximately $5 million. A 10% increase in the oil and natural gas index prices above the December 31, 2019 prices would result in a net liability of approximately $31 million, which represents a decrease in the fair value of our derivative position of approximately $36 million; conversely, a 10% decrease in the oil and natural gas index prices below the December 31, 2019 prices would result in a net asset of approximately $46 million, which represents an increase in the fair value of approximately $42 million. For additional information about derivative activity, see Note 4 to our consolidated financial statements.
Actual gains or losses recognized related to our derivative contracts depend exclusively on the price of the underlying commodities on the specified settlement dates provided by the derivative contracts. Additionally, we cannot be assured that our counterparties will be able to perform under our derivative contracts. If a counterparty fails to perform and the derivative arrangement is terminated, our cash flows could be negatively impacted.
Counterparty Credit Risk
Our credit risk relates primarily to trade receivables and derivative financial instruments. Credit exposure for each customer is monitored for outstanding balances and current activity. We actively manage this credit risk by selecting customers that we believe to be financially strong and continue to monitor their financial health. Concentration of credit risk is regularly reviewed to ensure that customer credit risk is adequately diversified.
We had seven commodity derivative counterparties at December 31, 2019 and nine at December 31, 2018. We did not receive collateral from any of our counterparties. We minimize the credit risk of our derivative instruments by limiting our exposure to any single counterparty. In addition, the RBL Facility prevents us from entering into hedging arrangements that are secured (except with our lenders and their affiliates), that have margin call requirements, that otherwise require us to provide collateral or with a non-lender counterparty that does not have an A- or A3 credit rating or better from Standard & Poor’s or Moody’s, respectively. In accordance with our standard practice, our commodity derivatives are subject to counterparty netting under agreements governing such derivatives and therefore the risk of loss due to counterparty nonperformance is somewhat mitigated. Considering these factors together, we believe exposure to credit losses related to our business at December 31, 2019 was not material and losses associated with credit risk have been insignificant for all periods presented.
85
Interest Rate Risk
Our RBL Facility has a variable interest rate on outstanding balances. As of December 31, 2019, we had approximately $2 million in borrowings under our RBL Facility and thus the interest rate risk exposure is not material. The 2026 Notes have a fixed interest rate and thus we are not exposed to interest rate risk on these instruments. See Note 3 to our consolidated financial statements for additional information regarding interest rates on our outstanding debt.
86
Item 8. Financial Statements and Supplementary Data
INDEX TO FINANCIAL STATEMENTS AND SUPPLEMENTARY DATA
Page | |
87
REPORT OF INDEPENDENT REGISTERED PUBLIC ACCOUNTING FIRM
The Stockholders and Board of Directors
Berry Corporation (bry):
Opinion on the Consolidated Financial Statements
We have audited the accompanying consolidated balance sheets of Berry Corporation (bry) and its subsidiary (the “Company”) as of December 31, 2019 and 2018 (Successor), the related consolidated statements of operations, equity, and cash flows for the year ended December 31, 2019 and 2018 (Successor), the ten months ended December 31, 2017 (Successor), and the two months ended February 28, 2017 (Predecessor), and the related notes (collectively, the consolidated financial statements). In our opinion, the consolidated financial statements present fairly, in all material respects, the financial position of the Company as of December 31, 2019 and 2018 (Successor) and the results of its operations and its cash flows for the year ended December 31, 2019 and 2018 (Successor), the ten months ended December 31, 2017 (Successor), and the two months ended February 28, 2017 (Predecessor), in conformity with U.S. generally accepted accounting principles.
Basis of Presentation
As discussed in Note 14 to the consolidated financial statements, the Company emerged from bankruptcy on February 28, 2017. Accordingly, the accompanying consolidated financial statements have been prepared in conformity with Accounting Standards Codification Subtopic 852-10, Reorganizations, for the Successor as a new entity with assets, liabilities, and a capital structure having carrying amounts not comparable with prior periods as described in Note 14.
Basis for Opinion
These consolidated financial statements are the responsibility of the Company’s management. Our responsibility is to express an opinion on these consolidated financial statements based on our audits. We are a public accounting firm registered with the Public Company Accounting Oversight Board (United States) (PCAOB) and are required to be independent with respect to the Company in accordance with the U.S. federal securities laws and the applicable rules and regulations of the Securities and Exchange Commission and the PCAOB.
We conducted our audits in accordance with the standards of the PCAOB. Those standards require that we plan and perform the audit to obtain reasonable assurance about whether the consolidated financial statements are free of material misstatement, whether due to error or fraud. The Company is not required to have, nor were we engaged to perform, an audit of its internal control over financial reporting. As part of our audits, we are required to obtain an understanding of internal control over financial reporting but not for the purpose of expressing an opinion on the effectiveness of the Company’s internal control over financial reporting. Accordingly, we express no such opinion.
Our audits included performing procedures to assess the risks of material misstatement of the consolidated financial statements, whether due to error or fraud, and performing procedures that respond to those risks. Such procedures included examining, on a test basis, evidence regarding the amounts and disclosures in the consolidated financial statements. Our audits also included evaluating the accounting principles used and significant estimates made by management, as well as evaluating the overall presentation of the consolidated financial statements. We believe that our audits provide a reasonable basis for our opinion.
/s/ KPMG LLP
We have served as the Company’s auditor since 2013.
Los Angeles, California
February 27, 2020
88
BERRY CORPORATION (bry)
CONSOLIDATED BALANCE SHEETS
Berry Corp. (Successor) | |||||||
December 31, 2019 | December 31, 2018 | ||||||
(in thousands, except share amounts) | |||||||
ASSETS | |||||||
Current assets: | |||||||
Cash and cash equivalents | $ | — | $ | 68,680 | |||
Accounts receivable, net of allowance for doubtful accounts of $1,103 at December 31, 2019 and $950 at December 31, 2018 | 71,867 | 57,379 | |||||
Derivative instruments | 9,166 | 88,596 | |||||
Other current assets | 19,399 | 14,367 | |||||
Total current assets | 100,432 | 229,022 | |||||
Non-current assets: | |||||||
Oil and natural gas properties | 1,675,717 | 1,461,993 | |||||
Accumulated depletion and amortization | (209,105 | ) | (123,217 | ) | |||
Total oil and natural gas properties, net | 1,466,612 | 1,338,776 | |||||
Other property and equipment | 135,117 | 119,710 | |||||
Accumulated depreciation | (25,462 | ) | (15,778 | ) | |||
Total other property and equipment, net | 109,655 | 103,932 | |||||
Derivative instruments | 525 | 3,289 | |||||
Other non-current assets | 12,974 | 17,244 | |||||
Total assets | $ | 1,690,198 | $ | 1,692,263 | |||
LIABILITIES AND EQUITY | |||||||
Current liabilities: | |||||||
Accounts payable and accrued expenses | $ | 151,811 | $ | 144,118 | |||
Derivative instruments | 4,817 | — | |||||
Total current liabilities | 156,628 | 144,118 | |||||
Non-current liabilities: | |||||||
Long term debt | 394,319 | 391,786 | |||||
Derivative instruments | 141 | — | |||||
Deferred income taxes | 9,057 | 45,835 | |||||
Asset retirement obligation | 124,019 | 89,176 | |||||
Other non-current liabilities | 33,586 | 14,902 | |||||
Commitments and Contingencies - Note 5 | |||||||
Equity: | |||||||
Common stock ($.001 par value; 750,000,000 shares authorized; 84,655,222 and 81,651,098 shares issued; and 79,542,976 and 81,202,437 shares outstanding, at December 31, 2019 and December 31, 2018, respectively) | 85 | 82 | |||||
Additional paid-in capital | 901,830 | 914,540 | |||||
Treasury stock, at cost (5,112,246 shares at December 31, 2019 and 448,661 December 31, 2018) | (49,995 | ) | (24,218 | ) | |||
Retained earnings | 120,528 | 116,042 | |||||
Total equity | 972,448 | 1,006,446 | |||||
Total liabilities and equity | $ | 1,690,198 | $ | 1,692,263 | |||
The accompanying notes are an integral part of these financial statements.
89
BERRY CORPORATION (bry)
CONSOLIDATED STATEMENTS OF OPERATIONS
Berry Corp. (Successor) | Berry LLC (Predecessor) | |||||||||||||||
Year Ended December 31, 2019 | Year Ended December 31, 2018 | Ten Months Ended December 31, 2017 | Two Months Ended February 28, 2017 | |||||||||||||
(in thousands, except per share amounts) | ||||||||||||||||
Revenues and other: | ||||||||||||||||
Oil, natural gas and natural gas liquid sales | $ | 565,596 | $ | 552,874 | $ | 357,928 | $ | 74,120 | ||||||||
Electricity sales | 29,397 | 35,208 | 21,972 | 3,655 | ||||||||||||
(Losses) gains on oil derivatives | (37,998 | ) | (4,621 | ) | (66,900 | ) | 12,886 | |||||||||
Marketing revenues | 2,094 | 2,322 | 2,694 | 633 | ||||||||||||
Other revenues | 316 | 774 | 3,975 | 1,424 | ||||||||||||
Total revenues and other | 559,405 | 586,557 | 319,669 | 92,718 | ||||||||||||
Expenses and other: | ||||||||||||||||
Lease operating expenses | 216,294 | 188,776 | 149,599 | 28,238 | ||||||||||||
Electricity generation expenses | 19,490 | 20,619 | 14,894 | 3,197 | ||||||||||||
Transportation expenses | 8,059 | 9,860 | 19,238 | 6,194 | ||||||||||||
Marketing expenses | 2,073 | 2,140 | 2,320 | 653 | ||||||||||||
General and administrative expenses | 62,643 | 54,026 | 56,009 | 7,964 | ||||||||||||
Depreciation, depletion and amortization | 106,006 | 86,271 | 68,478 | 28,149 | ||||||||||||
Impairment of oil and gas properties | 51,081 | — | — | — | ||||||||||||
Taxes, other than income taxes | 40,645 | 33,117 | 34,211 | 5,212 | ||||||||||||
Losses (gains) on natural gas derivatives | 6,957 | (6,357 | ) | — | — | |||||||||||
Other operating expense (income) | 4,588 | (2,747 | ) | (22,930 | ) | (183 | ) | |||||||||
Total expenses and other | 517,836 | 385,705 | 321,819 | 79,424 | ||||||||||||
Other income (expenses): | ||||||||||||||||
Interest expense | (34,234 | ) | (35,648 | ) | (18,454 | ) | (8,245 | ) | ||||||||
Other, net | 80 | 243 | 4,071 | (63 | ) | |||||||||||
Total other income (expenses) | (34,154 | ) | (35,405 | ) | (14,383 | ) | (8,308 | ) | ||||||||
Reorganization items, net | (426 | ) | 24,690 | (1,732 | ) | (507,720 | ) | |||||||||
Income (loss) before income taxes | 6,989 | 190,137 | (18,265 | ) | (502,734 | ) | ||||||||||
Income tax expense (benefit) | (36,550 | ) | 43,035 | 2,803 | 230 | |||||||||||
Net (loss) income | 43,539 | 147,102 | (21,068 | ) | $ | (502,964 | ) | |||||||||
Series A Preferred Stock dividends and conversion to common stock | — | (97,942 | ) | (18,248 | ) | n/a | ||||||||||
Net (loss) income attributable to common stockholders | $ | 43,539 | $ | 49,160 | $ | (39,316 | ) | n/a | ||||||||
Net (loss) income per share attributable to common stockholders: | ||||||||||||||||
Basic | $ | 0.54 | $ | 0.85 | $ | (1.02 | ) | n/a | ||||||||
Diluted | $ | 0.53 | $ | 0.85 | (1.02 | ) | n/a | |||||||||
The accompanying notes are an integral part of these financial statements.
90
BERRY CORPORATION (bry)
CONSOLIDATED STATEMENTS OF EQUITY
Berry LLC (Predecessor) | |||||||||||
Member’s Capital | Retained Earnings (Accumulated Deficit) | Total Member’s Equity | |||||||||
(in thousands) | |||||||||||
December 31, 2016 | $ | 2,798,713 | $ | (2,295,750 | ) | $ | 502,963 | ||||
Net loss | — | (502,964 | ) | (502,964 | ) | ||||||
Other | 1 | — | 1 | ||||||||
Balance before cancellation of Predecessor Equity | 2,798,714 | (2,798,714 | ) | — | |||||||
Cancellation of Predecessor Equity | (2,798,714 | ) | 2,798,714 | — | |||||||
Predecessor February 28, 2017 | $ | — | $ | — | $ | — | |||||
The accompanying notes are an integral part of these financial statements.
91
Berry Corp. (Successor) | |||||||||||||||||||||||
Series A Preferred Stock | Common Stock | Additional Paid-in Capital | Treasury Stock | Retained Earnings (Accumulated Deficit) | Total Equity | ||||||||||||||||||
(in thousands) | |||||||||||||||||||||||
Issuance of Series A convertible preferred stock | $ | 335,000 | $ | — | $ | — | $ | — | $ | — | $ | 335,000 | |||||||||||
Issuance of Common Stock | — | 33 | 543,494 | — | — | 543,527 | |||||||||||||||||
Successor February 28, 2017 | 335,000 | 33 | 543,494 | — | — | 878,527 | |||||||||||||||||
Net loss | — | — | — | — | (21,068 | ) | (21,068 | ) | |||||||||||||||
Stock based compensation | — | — | 1,851 | — | — | 1,851 | |||||||||||||||||
December 31, 2017 | 335,000 | 33 | 545,345 | — | (21,068 | ) | 859,310 | ||||||||||||||||
Cash dividends declared on Series A Preferred Stock, $0.308/share | — | — | (11,301 | ) | — | — | (11,301 | ) | |||||||||||||||
Conversion of Series A Preferred Stock into common stock | (335,000 | ) | 40 | 334,960 | — | — | — | ||||||||||||||||
Cash payment to Series A Preferred Stockholders | — | — | (60,273 | ) | — | — | (60,273 | ) | |||||||||||||||
Issuance of common stock in initial public offering | — | 10 | 133,795 | — | — | 133,805 | |||||||||||||||||
Repurchase of common stock | — | (2 | ) | (23,710 | ) | — | — | (23,712 | ) | ||||||||||||||
Shares withheld for payment of taxes on equity awards | — | 1 | (3,700 | ) | — | — | (3,699 | ) | |||||||||||||||
Stock based compensation | — | — | 6,789 | — | — | 6,789 | |||||||||||||||||
Purchase of rights to common stock | — | — | — | (20,265 | ) | — | (20,265 | ) | |||||||||||||||
Purchase of treasury stock | — | — | — | (3,953 | ) | — | (3,953 | ) | |||||||||||||||
Dividends declared on common stock, $0.21/share | — | — | (7,365 | ) | — | (9,992 | ) | (17,357 | ) | ||||||||||||||
Net income (loss) | — | — | — | — | 147,102 | 147,102 | |||||||||||||||||
December 31, 2018 | — | 82 | 914,540 | (24,218 | ) | 116,042 | 1,006,446 | ||||||||||||||||
Shares withheld for payment of taxes on equity awards | — | — | (1,268 | ) | — | — | (1,268 | ) | |||||||||||||||
Stock based compensation | — | — | 8,826 | — | — | 8,826 | |||||||||||||||||
Purchase of rights to common stock | — | — | (20,265 | ) | 20,265 | — | — | ||||||||||||||||
Purchase of treasury stock | — | — | — | (46,042 | ) | — | (46,042 | ) | |||||||||||||||
Common stock issued to settle unsecured claims | — | 3 | (3 | ) | — | — | — | ||||||||||||||||
Dividends declared on common stock, $0.48/share | — | — | — | — | (39,053 | ) | (39,053 | ) | |||||||||||||||
Net income (loss) | — | — | — | — | 43,539 | 43,539 | |||||||||||||||||
December 31, 2019 | $ | — | $ | 85 | $ | 901,830 | $ | (49,995 | ) | $ | 120,528 | $ | 972,448 | ||||||||||
The accompanying notes are an integral part of these financial statements.
92
BERRY CORPORATION (bry)
CONSOLIDATED STATEMENTS OF CASH FLOWS
Berry Corp. (Successor) | Berry LLC (Predecessor) | |||||||||||||||
Year Ended December 31, 2019 | Year Ended December 31, 2018 | Ten Months Ended December 31, 2017 | Two Months Ended February 28, 2017 | |||||||||||||
(in thousands) | ||||||||||||||||
Cash flow from operating activities: | ||||||||||||||||
Net (loss) income | $ | 43,539 | $ | 147,102 | $ | (21,068 | ) | $ | (502,964 | ) | ||||||
Adjustments to reconcile net (income) loss to net cash provided by (used in) operating activities: | ||||||||||||||||
Depreciation, depletion and amortization | 106,006 | 86,271 | 68,478 | 28,149 | ||||||||||||
Amortization of debt issuance costs | 5,059 | 5,430 | 1,988 | 416 | ||||||||||||
Impairment of oil and gas properties | 51,081 | — | — | — | ||||||||||||
Stock-based compensation expense | 8,647 | 6,750 | 1,851 | — | ||||||||||||
Deferred income taxes | (36,778 | ) | 43,946 | 1,888 | 9 | |||||||||||
Increase (decrease) in allowance for doubtful accounts | 153 | (20 | ) | 970 | — | |||||||||||
Other operating expenses (income) | 5,518 | (2,747 | ) | (22,930 | ) | (25 | ) | |||||||||
Reorganization expenses, net (non-cash) | — | (25,523 | ) | — | 501,872 | |||||||||||
Derivatives activities: | ||||||||||||||||
Total losses (gains) | 44,955 | (1,735 | ) | 66,900 | (12,886 | ) | ||||||||||
Cash settlements on derivatives | 42,197 | (38,482 | ) | 3,068 | 534 | |||||||||||
Cash payments on early-terminated derivatives | — | (126,949 | ) | — | — | |||||||||||
Changes in assets and liabilities: | ||||||||||||||||
(Increase) decrease in accounts receivable | (14,597 | ) | (1,683 | ) | (7,022 | ) | (9,152 | ) | ||||||||
(Increase) decrease in other assets | (5,136 | ) | (819 | ) | (13,175 | ) | (2,842 | ) | ||||||||
Increase (decrease) in accounts payable and accrued expenses | (917 | ) | 19,526 | 6,619 | 18,330 | |||||||||||
(Decrease) increase in other liabilities | (7,898 | ) | (5,596 | ) | 19,832 | 990 | ||||||||||
Net cash provided by operating activities | 241,829 | 105,471 | 107,399 | 22,431 | ||||||||||||
Cash flow from investing activities: | ||||||||||||||||
Capital expenditures: | ||||||||||||||||
Development of oil and natural gas properties | (219,176 | ) | (94,225 | ) | (50,229 | ) | (247 | ) | ||||||||
Changes in capital investment accruals | 12,814 | (20,371 | ) | (2,483 | ) | (2,249 | ) | |||||||||
Purchases of other property and equipment | (16,792 | ) | (15,056 | ) | (12,767 | ) | (662 | ) | ||||||||
Acquisition of properties and equipment | (2,840 | ) | — | (249,338 | ) | — | ||||||||||
Proceeds from sale of property and equipment and other | 969 | 8,212 | 234,292 | 25 | ||||||||||||
Net cash (used in) investing activities | (225,025 | ) | (121,440 | ) | (80,525 | ) | (3,133 | ) | ||||||||
Cash flow from financing activities: | ||||||||||||||||
Borrowings under RBL credit facility | 355,132 | 203,510 | 402,285 | — | ||||||||||||
Repayments on RBL credit facility | (353,282 | ) | (582,510 | ) | (23,285 | ) | — | |||||||||
Dividends paid on common stock | (39,157 | ) | (7,365 | ) | — | — | ||||||||||
Purchase of treasury stock | (46,909 | ) | (23,351 | ) | — | — | ||||||||||
Shares withheld for payment of taxes on equity awards and other | (1,268 | ) | (3,699 | ) | — | — | ||||||||||
Issuance of 2026 Senior Unsecured Notes | — | 400,000 | — | — | ||||||||||||
Debt issuance costs | — | (9,193 | ) | (22,170 | ) | — | ||||||||||
IPO proceeds net of issuance costs | — | 133,805 | — | — | ||||||||||||
Repurchase of common stock | — | (23,712 | ) | — | — | |||||||||||
Payment to preferred stockholders in conversion | — | (60,273 | ) | — | — | |||||||||||
Dividends paid on Series A Preferred Stock | — | (11,301 | ) | — | — | |||||||||||
Borrowings on emergence credit facility | — | — | 51,000 | — | ||||||||||||
Repayments on emergence credit facility | — | — | (451,000 | ) | — | |||||||||||
Proceeds from sale of Series A Preferred Stock | — | — | — | 335,000 | ||||||||||||
Repayments on pre-emergence credit facility | — | — | — | (497,668 | ) | |||||||||||
The accompanying notes are an integral part of these financial statements.
93
Berry Corp. (Successor) | Berry LLC (Predecessor) | |||||||||||||||
Year Ended December 31, 2019 | Year Ended December 31, 2018 | Ten Months Ended December 31, 2017 | Two Months Ended February 28, 2017 | |||||||||||||
(in thousands) | ||||||||||||||||
Net cash (used in) provided by financing activities | (85,484 | ) | 15,911 | (43,170 | ) | (162,668 | ) | |||||||||
Net decrease in cash and cash equivalents | (68,680 | ) | (58 | ) | (16,296 | ) | (143,370 | ) | ||||||||
Cash, cash equivalents and restricted cash: | ||||||||||||||||
Beginning | 68,680 | 68,738 | 85,034 | 228,404 | ||||||||||||
Ending | $ | — | $ | 68,680 | $ | 68,738 | $ | 85,034 | ||||||||
The accompanying notes are an integral part of these financial statements.
94
BERRY CORPORATION (bry)
NOTES TO CONSOLIDATED FINANCIAL STATEMENTS
Note 1—Basis of Presentation and Significant Accounting Policies
Effective February 18, 2020, Berry Petroleum Corporation changed its name to Berry Corporation (bry) and introduced a new logo. We believe that the name Berry Corporation (bry) is a name that better represents our progressive approach to evolving and growing the business in today’s dynamic oil and gas industry.
“Berry Corp.” refers to Berry Corporation (bry), a Delaware corporation which, on and after February 28, 2017 is the sole member of Berry Petroleum Company, LLC.
“Berry LLC” refers to Berry Petroleum Company, LLC, a Delaware limited liability company.
As the context may require, the “Company”, “we”, “our” or similar words refer to (i) Berry Corp. (the “Successor”) and Berry LLC, its consolidated subsidiary, as of and after February 28, 2017, as a whole or (ii) either Berry Corp. or Berry LLC on an individual basis as of and after February 28, 2017. References to historical activities of the “Company” prior to February 28, 2017, refer to activities of Berry LLC (the “Predecessor”).
“Linn Energy” refers to Linn Energy, LLC, a Delaware limited liability company of which Berry LLC was formerly a wholly-owned, indirect subsidiary and LinnCo, LLC (“LinnCo” and, together with Linn Energy, the “Linn Entities”), until February 28, 2017.
Nature of Business
Berry Corp. is an independent oil and natural gas company that was incorporated under Delaware law on February 13, 2017. Berry Corp. operates through its wholly-owned subsidiary, Berry LLC. Our properties are located in the United States (the “U.S.”), in California (in the San Joaquin and Ventura basins), Utah (in the Uinta basin), and Colorado (in the Piceance basin).
In July 2018, we completed the initial public offering (the “IPO”) of our common stock and as a result, on July 26, 2018, our common stock began trading on the Nasdaq Global Select Market (“NASDAQ”) under the ticker symbol BRY.
As discussed further in Note 14, on May 11, 2016 (the “Petition Date”), the Linn entities and, consequently, Berry LLC, filed voluntary petitions for relief under Chapter 11 (“Chapter 11”) of the U.S. Bankruptcy Code. Berry LLC emerged from bankruptcy as a stand-alone company separate from Linn Energy effective February 28, 2017 (the “Effective Date”).
Principles of Consolidation and Reporting
The consolidated financial statements have been prepared in conformity with U.S. generally accepted accounting principles (“GAAP”), which requires management to make estimates and assumptions that affect the amounts reported in the financial statements and accompanying notes. We eliminated all significant intercompany transactions and balances upon consolidation. For oil and gas exploration and production joint ventures in which we have a direct working interest, we account for our proportionate share of assets, liabilities, revenue, expense and cash flows within the relevant lines of the financial statements.
Reclassification
We reclassified certain prior year amounts in the cash flow statements to conform to the current year presentation. These reclassifications had no material impact on the financial statements.
95
BERRY CORPORATION (bry)
NOTES TO CONSOLIDATED FINANCIAL STATEMENTS (Continued)
NOTES TO CONSOLIDATED FINANCIAL STATEMENTS (Continued)
Use of Estimates
The preparation of the accompanying consolidated financial statements in conformity with GAAP required management of the Company to make informed estimates and assumptions about future events. These estimates and the underlying assumptions affect the amount of assets and liabilities reported, disclosures about contingent assets and liabilities, and reported amounts of revenues and expenses.
Estimates that are particularly significant to the financial statements include estimates of our reserves of oil and gas, future cash flows from oil and gas properties, depreciation, depletion and amortization, asset retirement obligations, fair values of commodity derivatives and fair values of assets acquired and liabilities assumed. In addition, as part of fresh-start accounting, we made estimates and assumptions related to our reorganization value, liabilities subject to compromise and the fair value of assets and liabilities recorded.
Cash Equivalents
We consider all highly liquid short-term investments with original maturities of three months or less to be cash equivalents.
Inventories
Inventories were included in other current assets. Oil and natural gas inventories were valued at the lower of cost or net realizable value. Materials and supplies were valued at their weighted-average cost and are reviewed periodically for obsolescence.
Oil and Natural Gas Properties
Proved Properties
We account for oil and natural gas properties in accordance with the successful efforts method. Under this method, all acquisition costs of proved properties are capitalized and amortized on a unit-of-production basis over the remaining life of the proved reserves. All development costs of proved properties are capitalized and amortized on a unit-of-production basis over the remaining life of the proved developed reserves. Costs of retired, sold or abandoned properties that constitute a part of an amortization base are charged or credited, net of proceeds, to accumulated depreciation, depletion and amortization unless doing so significantly affects the unit-of-production amortization rate, in which case a gain or loss is recognized in the current period. Gains or losses from the disposal of other properties are recognized in the current period. For assets acquired, we base the capitalized cost on fair value at the acquisition date. We expense expenditures for maintenance and repairs necessary to maintain properties in operating condition, as well as annual lease rentals, as they are incurred. Estimated dismantlement and abandonment costs are capitalized, net of salvage, at their estimated net present value and amortized over the remaining lives of the related assets. Interest is capitalized only during the periods in which these assets are brought to their intended use. The amount of capitalized interest in 2019 was approximately $2 million, and in 2018 and 2017 these costs were not significant. The amount of capitalized exploratory well costs was zero for all periods. We only capitalize the interest on borrowed funds related to our share of costs associated with qualifying capital expenditures.
We evaluate the impairment of our proved oil and natural gas properties generally on a field by field basis or at the lowest level for which cash flows are identifiable, whenever events or changes in circumstance indicate that the carrying value may not be recoverable. We reduce the carrying values of proved properties to fair value when the expected undiscounted future cash flows are less than net book value. We measure the fair values of proved properties using valuation techniques consistent with the income approach, converting future cash flows to a single discounted amount. Significant inputs used to determine the fair values of proved properties include estimates of: (i) reserves; (ii) future operating and development costs; (iii) future commodity prices; and (iv) a risk-adjusted discount rate. These inputs require significant judgments and estimates by our management at the time of the valuation and are the most
96
BERRY CORPORATION (bry)
NOTES TO CONSOLIDATED FINANCIAL STATEMENTS (Continued)
NOTES TO CONSOLIDATED FINANCIAL STATEMENTS (Continued)
sensitive estimates we make and the most likely to change. The underlying commodity prices are embedded in our estimated cash flows and are the product of a process that begins with the relevant forward curve pricing, adjusted for estimated location and quality differentials, as well as other factors our management believes will impact realizable prices. The fair value was estimated using inputs characteristic of a Level 3 fair value measurement.
Unproved Properties
A portion of the carrying value of our oil and gas properties was attributable to unproved properties. At December 31, 2019 and 2018, the net capitalized costs attributable to unproved properties were approximately $314 million and $388 million, respectively. The unproved amounts were not subject to depreciation, depletion and amortization until they were classified as proved properties and amortized on a unit-of-production basis. We evaluate the impairment of our unproved oil and gas properties whenever events or changes in circumstances indicate the carrying value may not be recoverable. If the exploration and development work were to be unsuccessful, or management decided not to pursue development of these properties as a result of lower commodity prices, higher development and operating costs, contractual conditions or other factors, the capitalized costs of such properties would be expensed. The timing of any write-downs of unproved properties, if warranted, depends upon management’s plans, the nature, timing and extent of future exploration and development activities and their results. We believe our current plans and exploration and development efforts will allow us to realize the carrying value of our unproved property balance at December 31, 2019.
At year end 2019, we evaluated our proved and unproved natural gas properties in regards to the decline in our expectations of future gas prices. As a result, we recorded a non-cash pre-tax asset impairment charge of $51 million for our Piceance gas properties in Colorado, of which $23 million was for proved properties and $28 million for unproved properties.
Other Property and Equipment
Other property and equipment includes natural gas gathering systems, pipelines, buildings, software, data processing and telecommunications equipment, office furniture and equipment, and other fixed assets. These assets are recorded at cost, depreciated using the straight-line method based on expected useful lives ranging from 5 to 30 years for buildings and leasehold improvements and 2 to 30 years for plant and pipeline, drilling and other equipment, and the salvage value is considered as applicable.
Asset Retirement Obligation
We recognize the fair value of asset retirement obligations (“AROs”) in the period in which a determination is made that a legal obligation exists to dismantle an asset and remediate the property at the end of its useful life and the cost of the obligation can be reasonably estimated. The liability amounts were based on future retirement cost estimates and incorporate many assumptions such as time to abandonment, technological changes, future inflation rates and the risk-adjusted discount rate. When the liability was initially recorded, we capitalized the cost by increasing the related property, plant and equipment (“PP&E”) balances. If the estimated future cost of the AROs changes, we record an adjustment to both the ARO and PP&E. Over time, the liability is increased and the capitalized cost is depreciated over the useful life of the asset. Accretion expense is also recognized over time as the discounted liabilities are accreted to their expected settlement value and is included in depreciation, depletion and amortization in the statement of operations.
The following table summarizes activity in our ARO account in which approximately $124 million and $89 million were included in long term liabilities as of December 31, 2019 and December 31, 2018, respectively, with the remaining current portion included in accrued liabilities:
97
BERRY CORPORATION (bry)
NOTES TO CONSOLIDATED FINANCIAL STATEMENTS (Continued)
NOTES TO CONSOLIDATED FINANCIAL STATEMENTS (Continued)
Berry Corp. (Successor) | |||||||
Year Ended December 31, 2019 | Year Ended December 31, 2018 | ||||||
(in thousands) | |||||||
Beginning balance | $ | 95,548 | $ | 97,422 | |||
Liabilities incurred | 11,534 | 4,901 | |||||
Settlements and payments | (22,036 | ) | (3,555 | ) | |||
Accretion expense | 7,570 | 6,258 | |||||
Reduction due to property sales | — | (4,145 | ) | ||||
Revisions | 56,611 | (5,333 | ) | ||||
Ending balance | $ | 149,227 | $ | 95,548 | |||
The increase in the long-term portion of the asset retirement obligation largely reflected revisions to timing and cost estimates of $57 million, $12 million for new wells, and accretion expense of $8 million. A significant portion of the change in estimate was a result of California's new idle well regulations which became effective in the second quarter and accelerated the timing of abandonment of certain long existing idle wells. These increases were partially offset by liabilities settled or paid during the period of $22 million and an increase to the current portion of the asset retirement obligation of $19 million due to the change in timing and estimated costs
Revenue Recognition
Substantially all of the Company’s revenue is from the sale of crude oil, natural gas and NGLs. See Note 13 for information regarding the Company’s revenue recognition policy.
Fair Value Measurements
We have categorized our assets and liabilities that are measured at fair value in a three-level fair value hierarchy, based on the inputs to the valuation techniques: Level 1—using quoted prices in active markets for the assets or liabilities; Level 2—using observable inputs other than quoted prices for the assets or liabilities; and Level 3—using unobservable inputs. Transfers between levels, if any, are recognized at the end of each reporting period. We primarily apply the market approach for recurring fair value measurement, maximize our use of observable inputs and minimize use of unobservable inputs. We generally use an income approach to measure fair value when observable inputs are unavailable. This approach utilizes management’s judgments regarding expectations of projected cash flows and discounts those cash flows using a risk-adjusted discount rate.
The most significant items on our balance sheet that would be affected by recurring fair value measurements are derivatives. We determine the fair value of our oil and natural gas derivatives using valuation techniques which utilize market quotes and pricing analysis. Inputs include publicly available prices and forward price curves generated from a compilation of data gathered from third parties. We classify these measurements as Level 2.
Our PP&E is written down to fair value if we determine that there has been an impairment in its value. The fair value is determined as of the date of the assessment using discounted cash flow models based on management’s expectations for the future. Inputs include estimates of future production, prices based on commodity forward price curves as of the date of the estimate, estimated future operating and development costs and a risk-adjusted discount rate. We classify these measurements as Level 3.
98
BERRY CORPORATION (bry)
NOTES TO CONSOLIDATED FINANCIAL STATEMENTS (Continued)
NOTES TO CONSOLIDATED FINANCIAL STATEMENTS (Continued)
Stock-based Compensation
We have issued restricted stock units (“RSUs”) that vest over time and performance-based restricted stock units (“PSUs”) that vest based on our achievement of certain average prices per share or total shareholder return, to certain employees and non-employee directors. The fair value of the stock-based awards is determined at the date of grant and is not remeasured. Prior to our IPO in July 2018, we determined the fair value of the RSUs based on an estimate of the fair value of our equity using an income approach. We used a discounted cash flow method to value the estimated future cash flows at an appropriate discount rate. Subsequent to our IPO, since the underlying shares are now trading in the public markets, these estimates are no longer necessary. For PSUs, compensation value is measured on the grant date using payout values derived from a Monte-Carlo valuation model. Estimates used in the Monte Carlo valuation model are considered highly complex and subjective. Compensation expense, net of actual forfeitures, for the RSUs and PSUs is recognized on a straight-line basis over the requisite service periods, which is over the awards’ respective vesting or performance periods which range from one to three years.
Other Loss Contingencies
In the normal course of business, we are involved in lawsuits, claims and other environmental and legal proceedings and audits. We accrue reserves for these matters when it is probable that a liability has been incurred and the liability can be reasonably estimated. In addition, we disclose, if material, in aggregate, our exposure to loss in excess of the amount recorded on the balance sheet for these matters if it is reasonably possible that an additional material loss may be incurred. We review our loss contingencies on an ongoing basis.
Loss contingencies are based on judgments made by management with respect to the likely outcome of these matters and are adjusted as appropriate. Management’s judgments could change based on new information, changes in, or interpretations of, laws or regulations, changes in management’s plans or intentions, opinions regarding the outcome of legal proceedings, or other factors.
Electricity Cost Allocation
We own five cogeneration facilities. Our investment in cogeneration facilities has been for the express purpose of lowering steam costs in our heavy oil operations in California and securing operating control of the respective steam generation. Cogeneration, also called combined heat and power, extracts energy from the exhaust of a turbine, which would otherwise be wasted, to produce steam. Such cogeneration operations also produce electricity. We allocate steam and electricity costs to lease operating expenses based on the conversion efficiency of the cogeneration facilities plus certain direct costs of producing steam. We also allocate a portion of the electricity production costs related to the power we sell to third parties, which is reported in “electricity generation expenses” in the statement of operations.
Income Taxes
Prior to the consummation of the Plan, as defined below, the Predecessor was a limited liability company treated as a disregarded entity for federal and state income tax purposes, with the exception of the state of Texas, in which income tax liabilities and/or benefits of the company are passed through to its members. Limited liability companies are subject to Texas margin tax. As such, with the exception of the state of Texas, the Predecessor was not a taxable entity, it did not directly pay federal and state income taxes and recognition was not given to federal and state income taxes for the operations of the company.
On the Effective Date, upon consummation of the Plan, the Successor became a C Corporation subject to federal and state income taxes. The impact of changes in tax regulation are reflected when enacted. Deferred tax assets and liabilities are recognized for the estimated future tax consequences attributable to differences between the financial statement carrying amounts of assets and liabilities and their tax bases. Deferred tax assets are recognized when it is more likely than not that they will be realized. We periodically assess our deferred tax assets and reduce such assets by a valuation allowance if we deem it is more likely than not that some portion, or all, of the deferred tax assets will
99
BERRY CORPORATION (bry)
NOTES TO CONSOLIDATED FINANCIAL STATEMENTS (Continued)
NOTES TO CONSOLIDATED FINANCIAL STATEMENTS (Continued)
not be realized. We recognize a tax benefit from an uncertain tax position when it is more likely than not that the position will be sustained upon examination, based on the technical merits of the position. Interest and penalties related to unrecognized tax benefits are recognized in income tax expense (benefit).
Earnings per Share
We computed basic and diluted earnings per share (EPS) using the two-class method required for participating securities. Restricted and performance stock awards are considered participating securities when such shares have non-forfeitable dividend rights at the same rate as common stock.
Under the two-class method, undistributed earnings allocated to participating securities are subtracted from net income attributable to common stock in determining net income attributable to common stockholders. In loss periods, no allocation is made to participating securities because the participating securities do not share in losses. For basic EPS, the weighted-average number of common shares outstanding excludes outstanding shares related to unvested restricted stock awards. For diluted EPS, the basic shares outstanding are adjusted by adding potentially dilutive securities, unless their effect is anti-dilutive.
Business and Credit Concentrations
We maintain our cash in bank deposit accounts which, at times, may exceed federally insured amounts. We have not experienced any losses in such accounts. We believe we are not exposed to any significant credit risk on our cash.
We also sell oil, natural gas and NGLs to various types of customers, including pipelines, refineries and other oil and natural gas companies and electricity to utility companies. Based on the current demand for oil, natural gas and NGLs and the availability of other purchasers, we believe that the loss of any one of our major purchasers would not have a material adverse effect on our financial condition, results of operations or net cash provided by operating activities.
For the year ended December 31, 2019, our three largest customers represented approximately 36%, 24% and 13% of our sales. For the year ended December 31, 2018, our three largest customers represented 35%, 28%, and 13% of our sales. For the ten months ended December 31, 2017, our three largest customers represented approximately 36%, 29% and 13% of our sales. For the two months ended February 28, 2017, our two largest customers represented approximately 34% and 29% of our sales.
At December 31, 2019, trade accounts receivable from three customers represented approximately 40%, 17%, and 11% of our receivables. At December 31, 2018, trade accounts receivable from three customers represented approximately 26%, 22% and 10% of our receivables.
Bankruptcy Accounting
The consolidated financial statements have been prepared as if the Company will continue as a going concern and reflect the application of GAAP. GAAP requires that the financial statements, for periods subsequent to filing of the bankruptcy proceedings, distinguish transactions and events that are directly associated with the reorganization from the ongoing operations of the business. Accordingly, certain expenses, gains and losses that are realized or incurred in connection with the bankruptcy proceedings are recorded in “reorganization items, net” on our consolidated statements of operations. In addition, pre-petition unsecured and under-secured obligations that may be impacted by the bankruptcy reorganization process have been classified as “liabilities subject to compromise” on our balance sheet. These liabilities are reported at the amounts allowed as claims by the Bankruptcy Court, although they may be settled for less.
Upon emergence from bankruptcy on February 28, 2017, we adopted fresh-start accounting which resulted in Berry Corp. becoming the financial reporting entity. As a result of the application of fresh-start accounting and the effects of the implementation of the Plan (see Note 14 for definition), the financial statements on or after February 28, 2017 are not comparable to the financial statements prior to that date. See Note 14 for additional information.
100
BERRY CORPORATION (bry)
NOTES TO CONSOLIDATED FINANCIAL STATEMENTS (Continued)
NOTES TO CONSOLIDATED FINANCIAL STATEMENTS (Continued)
Recently Adopted Accounting Standards
During 2016, the FASB issued rules clarifying the new revenue recognition standard issued in 2014. The new rules are intended to improve and converge the financial reporting requirements for revenue from contracts with customers. We are an emerging growth company and elected to delay adoption of these rules until they are applicable to non-SEC issuers which is for fiscal years beginning after December 31, 2018. As such, we adopted these rules in the first quarter of 2019 and applied the modified retrospective approach, meaning the cumulative effect of initially applying the standard is recognized in the most current period presented in the financial statements. We have performed an analysis of existing contracts and determined adoption did not have a material impact on our condensed consolidated financial statements. In addition, we have evaluated the changes to relevant business practices, accounting policies and control activities and we did not experience a material change in our revenue accounting as a result of the adoption of these rules. Refer to Note 13 for additional disclosure information.
New Accounting Standards Issued, But Not Yet Adopted
In February 2016, the FASB issued rules requiring lessees to recognize assets and liabilities on the balance sheet for the rights and obligations created by all leases with terms of more than 12 months and to include qualitative and quantitative disclosures with respect to the amount, timing, and uncertainty of cash flows arising from leases. As an emerging growth company, we have elected to delay the adoption of these rules until they are applicable to non-SEC issuers which is for fiscal years beginning after December 15, 2020, including interim periods within those fiscal years. We are currently identifying our lease population in accordance with the new lease standard. We expect the adoption of these rules to increase other assets and other liabilities on our balance sheet and we are currently evaluating the impact on our consolidated results of operations.
In December 2019, the FASB issued rules which simplifies the accounting for income taxes. As an emerging growth company, we have elected to delay the adoption of these rules until they are applicable to non-SEC issuers which is for fiscal years beginning after December 15, 2021, including interim periods within those fiscal years. We are currently evaluating the impact of these rules on our consolidated financial statements.
Note 2—Oil and Natural Gas Properties and Other Property and Equipment
Oil and Natural Gas Capitalized Costs
Aggregate capitalized costs related to oil, natural gas and NGL production activities with applicable accumulated depletion and amortization are presented below:
Berry Corp. (Successor) | |||||||
December 31, 2019 | December 31, 2018 | ||||||
(in thousands) | |||||||
Proved properties | $ | 1,361,814 | $ | 1,073,959 | |||
Unproved properties | 313,903 | 388,034 | |||||
Total proved and unproved properties | 1,675,717 | 1,461,993 | |||||
Less accumulated depletion and amortization | (209,105 | ) | (123,217 | ) | |||
Total proved and unproved properties, net | $ | 1,466,612 | $ | 1,338,776 | |||
101
BERRY CORPORATION (bry)
NOTES TO CONSOLIDATED FINANCIAL STATEMENTS (Continued)
NOTES TO CONSOLIDATED FINANCIAL STATEMENTS (Continued)
Other Property and Equipment
Other property and equipment consisted of the following:
Berry Corp. (Successor) | |||||||
December 31, 2019 | December 31, 2018 | ||||||
(in thousands) | |||||||
Cogens, natural gas plants and pipelines | $ | 94,619 | $ | 86,562 | |||
Buildings and leasehold improvements | 3,752 | 3,359 | |||||
Vehicles and service equipment | 9,124 | 6,753 | |||||
Furniture and equipment | 20,078 | 14,964 | |||||
Land | 7,544 | 8,073 | |||||
Total other property and equipment | 135,117 | 119,710 | |||||
Less: accumulated depreciation | (25,462 | ) | (15,778 | ) | |||
Total other property and equipment, net | $ | 109,655 | $ | 103,932 | |||
Note 3—Debt
The following table summarizes our outstanding debt:
December 31, 2019 | December 31, 2018 | Interest Rate | Maturity | Security | ||||||
(in thousands) | ||||||||||
RBL Facility | $ | 1,850 | $ | — | variable rates of 5.5% (2019) and 4.5% (2018), respectively | June 29, 2022 | Mortgage on 85% of Present Value of proven oil and gas reserves | |||
2026 Notes | 400,000 | 400,000 | 7.0% | February 15, 2026 | Unsecured | |||||
Long-Term Debt - Principal Amount | 401,850 | 400,000 | ||||||||
Less: Debt Issuance Costs | (7,531 | ) | (8,214 | ) | ||||||
Long-Term Debt, net | $ | 394,319 | $ | 391,786 | ||||||
Deferred Financing Costs
We incurred legal and bank fees related to the issuance of debt. At December 31, 2019 and December 31, 2018, debt issuance costs for the RBL Facility (as defined below) reported in “other non-current assets” on the balance sheet were approximately $11 million and $16 million net of amortization, respectively. At December 31, 2019 and 2018, debt issuance costs, net of amortization, for the 2026 Senior Unsecured Notes were both approximately $8 million.
The amortization of debt issuance costs is presented in interest expense on the consolidated statements of operations. For the year ended December 31, 2019, the year ended December 31, 2018, the ten months ended December 31, 2017, and the two months ended February 28, 2017, the amortization expense for the RBL Facility and 2026 Senior Unsecured Notes were approximately $5 million, $5 million, $2 million and zero, respectively.
Fair Value
Our debt is recorded at the carrying amount on the balance sheets. The carrying amount of the RBL Facility approximates fair value because the interest rates are variable and reflect market rates. The fair value of the 2026 Senior
102
BERRY CORPORATION (bry)
NOTES TO CONSOLIDATED FINANCIAL STATEMENTS (Continued)
NOTES TO CONSOLIDATED FINANCIAL STATEMENTS (Continued)
Unsecured Notes was approximately $376 million and $368 million at December 31, 2019 and December 31, 2018, respectively.
The RBL Facility
On July 31, 2017, we entered into the RBL Facility. The RBL Facility provides for a revolving loan with up to $1.5 billion of commitments, subject to a reserve borrowing base. The RBL Facility also provides a letter of credit subfacility for the issuance of letters of credit in an aggregate amount not to exceed $25 million. Issuances of letters of credit reduce the borrowing availability for revolving loans under the RBL Facility on a dollar for dollar basis. Borrowing base redeterminations become effective each May and November, although each of the administrative agent and Berry LLC may make one interim redetermination between scheduled redeterminations. The RBL Facility has an elected commitment feature that allows us to increase commitments to the amount of our borrowing base with lender approval. In late 2019, we completed a borrowing base redetermination under our RBL Facility that set our borrowing base to $500 million and reaffirmed our elected commitment amount at $400 million. The RBL Facility matures on July 29, 2022, unless terminated earlier in accordance with the RBL Facility terms.
As of December 31, 2019, we had approximately $2 million in borrowings outstanding, $7 million in letters of credit outstanding, and approximately $391 million of available borrowings capacity under the RBL Facility.
The outstanding borrowings under the RBL Facility bear interest at a rate equal to either (i) a customary London interbank offered rate plus an applicable margin ranging from 2.50% to 3.50% per annum, and (ii) a customary base rate plus an applicable margin ranging from 1.50% to 2.50% per annum, in each case depending on levels of borrowing base utilization. In addition, we must pay the lenders a quarterly commitment fee of 0.50% on the average daily unused amount of the borrowing availability under the RBL Facility. We have the right to prepay any borrowings under the RBL Facility with prior notice at any time without a prepayment penalty, other than customary “breakage” costs with respect to euro-dollar loans.
The RBL Facility contains customary events of default and remedies for credit facilities of a similar nature. If we do not comply with the financial and other covenants in the RBL Facility, the lenders may, subject to customary cure rights, require immediate payment of all amounts outstanding under the RBL Facility and exercise all of their other rights and remedies, including foreclosure on all of the collateral.
The RBL Facility requires us to maintain on a consolidated basis as of each quarter-end (i) a Leverage Ratio of no more than 4.00 to 1.00 and (ii) a Current Ratio of at least 1.00 to 1.00. The RBL Facility also contains customary restrictions. As of December 31, 2019, our Leverage Ratio and Current Ratio were 1.4:1.00 and 3.2:1.00, respectively. In addition, the RBL Facility currently provides that to the extent we incur unsecured indebtedness, including any mounts raised in the future, the borrowing base will be reduced by an amount equal to 25% of the amount of such unsecured debt. We were in compliance with all financial covenants under the RBL Facility as of December 31, 2019.
The RBL Facility permits us to repurchase equity and indebtedness, among other things, if availability is equal to or greater than 15% of the elected commitments or borrowing base, whichever is in effect, and our pro forma leverage ratio is less than or equal to 2.75 to 1.00.
Berry Corp. guarantees and each future subsidiary of Berry Corp. (other than Berry LLC), with certain exceptions, is required to guarantee, our obligations and obligations of the other guarantors under the RBL Facility and under certain hedging transactions and banking services arrangements (the “Guaranteed Obligations”). In addition, pursuant to a Guaranty Agreement dated as of July 31, 2017, Berry LLC guarantees the Guaranteed Obligations. The lenders under the RBL Facility hold a mortgage on 85% of the present value of our proven oil and gas reserves. The obligations of Berry LLC and the guarantors are also secured by liens on substantially all of our personal property, subject to customary exceptions. The RBL Facility, with certain exceptions, also requires that any future subsidiaries of Berry LLC will also have to grant mortgages, security interests and equity pledges.
103
BERRY CORPORATION (bry)
NOTES TO CONSOLIDATED FINANCIAL STATEMENTS (Continued)
NOTES TO CONSOLIDATED FINANCIAL STATEMENTS (Continued)
Senior Unsecured Notes Offering
In February 2018, we completed a private issuance of $400 million in aggregate principal amount of 7.0% senior unsecured notes due February 2026 (the “2026 Notes”), which resulted in net proceeds to us of approximately $391 million after deducting expenses and the initial purchasers’ discount. We used a portion of the net proceeds from the issuance of the 2026 Notes to repay the $379 million outstanding balance on the RBL Facility and used the remainder for general corporate purposes.
We may, at our option, redeem all or a portion of the 2026 Notes at any time on or after February 15, 2021. We are also entitled to redeem up to 35% of the aggregate principal amount of the 2026 Notes before February 15, 2021, with an amount of cash not greater than the net proceeds that we raise in certain equity offerings at a redemption price equal to 107% of the principal amount of the 2026 Notes being redeemed, plus accrued and unpaid interest, if any. In addition, prior to February 15, 2021, we may redeem some or all of the 2026 Notes at a price equal to 100% of the principal amount thereof, plus a “make-whole” premium, plus any accrued and unpaid interest. If we experience certain kinds of changes of control, holders of the 2026 Notes may have the right to require us to repurchase their notes at 101% of the principal amount of the 2026 Notes, plus accrued and unpaid interest, if any.
The 2026 Notes are our senior unsecured obligations and rank equally in right of payment with all of our other senior indebtedness and senior to any of our subordinated indebtedness. The notes are fully and unconditionally guaranteed on a senior unsecured basis by us and will also be guaranteed by certain of our future subsidiaries (other than Berry LLC). The 2026 Notes and related guarantees are effectively subordinated to all of our secured indebtedness (including all borrowings and other obligations under our RBL Facility) to the extent of the value of the collateral securing such indebtedness, and structurally subordinated in right of payment to all existing and future indebtedness and other liabilities (including trade payables) of any future subsidiaries that do not guarantee the 2026 Notes.
The indenture governing the 2026 Notes contains restrictive covenants that may limit our ability to, among other things:
• | incur or guarantee additional indebtedness or issue certain types of preferred stock; |
• | pay dividends on capital stock or redeem, repurchase or retire our capital stock or subordinated indebtedness; |
• | transfer, sell or dispose of assets; |
• | make investments; |
• | create certain liens securing indebtedness; |
• | enter into agreements that restrict dividends or other payments from our restricted subsidiaries to us; |
• | consolidate, merge or transfer all or substantially all of our assets; and |
• | engage in transactions with affiliates. |
The indenture governing the 2026 Notes contains customary events of default, including, among others, (a) non-payment; (b) non-compliance with covenants (in some cases, subject to grace periods); (c) payment default under, or acceleration events affecting, material indebtedness and (d) bankruptcy or insolvency events involving us or certain of our subsidiaries. We were in compliance with all covenants as of December 31, 2019.
Bond Repurchase Program
In February 2020, our Board of Directors adopted a program for the opportunistic repurchase of up to $75 million of our bonds. The manner, timing and amount of any purchases will be determined based on our evaluation of market conditions, compliance with outstanding agreements and other factors, may be commenced or suspended at any time without notice and does not obligate Berry Corp. to purchase bonds during any period or at all.
104
BERRY CORPORATION (bry)
NOTES TO CONSOLIDATED FINANCIAL STATEMENTS (Continued)
NOTES TO CONSOLIDATED FINANCIAL STATEMENTS (Continued)
Corporate Organization
Berry Corp., as Berry LLC's parent company, has no independent assets or operations. Any guarantees of potential future registered debt securities by Berry Corp. or Berry LLC would be full and unconditional. Berry Corp. and Berry LLC currently do not have any other subsidiaries. In addition, there are no significant restrictions upon the ability of Berry LLC to distribute funds to Berry Corp. by distribution or loan other than under the RBL Facility. None of the assets of Berry Corp. or Berry LLC represent restricted net assets.
The RBL permits Berry LLC to make distributions to Berry Corp. so long as both before and after giving pro forma effect to such distribution no default or borrowing base deficiency exists, availability equals or exceeds 15% of the then effective borrowing base, and Berry Corp. demonstrates a pro forma leverage ratio less than or equal to 2.75 to 1.00. The conditions are currently met with significant margin.
Note 4—Derivatives
We utilize derivatives, such as swaps, puts and calls, to hedge a portion of our forecasted oil production and gas purchases to reduce exposure to fluctuations in oil and natural gas prices. We target covering our operating expenses and a majority of our fixed charges, including capital for sustained production levels, interest and dividends, with the oil hedges for a period of up to two years out. We have hedged a portion of our exposure to differentials between ICE Brent oil (“Brent”) and NYMEX West Texas Intermediate oil (“WTI”). Additionally, we target fixing the price for a large portion of our natural gas purchases used in our steam operations for up to two years. We also, from time to time, have entered into agreements to purchase a portion of the natural gas we require for our operations, which we do not record at fair value as derivatives because they qualify for normal purchases and normal sales exclusions.
For fixed-price oil swaps, we make settlement payments for prices above the indicated weighted-average price per barrel of Brent or WTI and receive settlement payments for prices below the indicated weighted‑average price per barrel of Brent or WTI.
For oil basis swaps, we make settlement payments if the difference between Brent and WTI is greater than the indicated weighted-average price per barrel of our contracts and receive settlement payments if the difference between Brent and WTI is below the indicated weighted-average price per barrel.
For our purchased oil puts, we would receive settlement payments for prices below the indicated weighted-average price per barrel of Brent. For some of our purchased puts we paid a premium at the time the positions were created and for others, the premium payment is deferred until the time of settlement. We have mitigated the exposure to a substantial portion of the deferred premium payments by entering into offsetting put positions. We paid approximately $17 million of the net deferred premiums during the year ended December 31, 2019, which included premiums we received during these periods. As of December 31, 2019 we have offsetting put positions with an outstanding net deferred premium of approximately $55,000, which is reflected in the mark-to-market valuation and will be payable through the first quarter of 2020.
For our sold oil calls, we would make settlement payments for prices above the indicated weighted-average price per barrel of Brent.
For fixed-price gas purchase swaps, we are the buyer so we make settlement payments for prices below the weighted-average price per MMBtu and receive settlement payments for prices above the weighted-average price per MMBtu.
We use oil swaps and puts to protect against decreases in the oil price and natural gas swaps to protect against increases in natural gas prices. We do not enter into derivative contracts for speculative trading purposes and have not accounted for our derivatives as cash-flow or fair-value hedges. The changes in fair value of these instruments are recorded in current earnings. (Gains) losses on oil hedges are classified in the revenues and other section of the statement
105
BERRY CORPORATION (bry)
NOTES TO CONSOLIDATED FINANCIAL STATEMENTS (Continued)
NOTES TO CONSOLIDATED FINANCIAL STATEMENTS (Continued)
of operations and (gains) losses on natural gas hedges are presented in the expenses and other section of the statement of operations.
As of December 31, 2019, we had the following crude oil production and gas purchases hedges.
Q1 2020 | Q2 2020 | Q3 2020 | Q4 2020 | FY 2021 | |||||||||||||||
Fixed Price Oil Swaps (Brent): | |||||||||||||||||||
Hedged volume (MBbls) | 1,729 | 1,456 | 1,472 | 1,472 | 730 | ||||||||||||||
Weighted-average price ($/Bbl) | $ | 63.92 | $ | 64.30 | $ | 64.21 | $ | 64.21 | $ | 58.50 | |||||||||
Fixed Price Oil Swaps (WTI): | |||||||||||||||||||
Hedged volume (MBbls) | 91 | 30 | — | — | — | ||||||||||||||
Weighted-average price ($/Bbl) | $ | 61.75 | $ | 61.75 | $ | — | $ | — | $ | — | |||||||||
Fixed Price Gas Purchase Swaps (Kern, Delivered): | |||||||||||||||||||
Hedged volume (MMBtu) | 5,005,000 | 5,005,000 | 5,060,000 | 2,315,000 | 900,000 | ||||||||||||||
Weighted-average price ($/MMBtu) | $ | 2.89 | $ | 2.89 | $ | 2.89 | $ | 2.79 | $ | 2.50 | |||||||||
Fixed Price Gas Purchase Swaps (SoCal Citygate): | |||||||||||||||||||
Hedged volume (MMBtu) | 455,000 | 455,000 | 460,000 | 155,000 | — | ||||||||||||||
Weighted-average price ($/MMBtu) | $ | 3.80 | $ | 3.80 | $ | 3.80 | $ | 3.80 | $ | — | |||||||||
Our commodity derivatives are measured at fair value using industry-standard models with various inputs including publicly available underlying commodity prices and forward curves, and all are classified as Level 2 in the required fair value hierarchy for the periods presented. These commodity derivatives are subject to counterparty netting. The following tables present the fair values (gross and net) of our outstanding derivatives as of December 31, 2019 and December 31, 2018:
Berry Corp. (Successor) | |||||||||||||
December 31, 2019 | |||||||||||||
Balance Sheet Classification | Gross Amounts Recognized at Fair Value | Gross Amounts Offset on Balance Sheet | Net Fair Value Presented on Balance Sheet | ||||||||||
(in thousands) | |||||||||||||
Assets: | |||||||||||||
Commodity Contracts | Current assets | $ | 17,799 | $ | (8,633 | ) | $ | 9,166 | |||||
Commodity Contracts | Non-current assets | 773 | (248 | ) | 525 | ||||||||
Liabilities: | |||||||||||||
Commodity Contracts | Current liabilities | (13,450 | ) | 8,633 | (4,817 | ) | |||||||
Commodity Contracts | Non-current liabilities | (389 | ) | 248 | (141 | ) | |||||||
Total derivatives | $ | 4,733 | $ | — | $ | 4,733 | |||||||
106
BERRY CORPORATION (bry)
NOTES TO CONSOLIDATED FINANCIAL STATEMENTS (Continued)
NOTES TO CONSOLIDATED FINANCIAL STATEMENTS (Continued)
Berry Corp. (Successor) | |||||||||||||
December 31, 2018 | |||||||||||||
Balance Sheet Classification | Gross Amounts Recognized at Fair Value | Gross Amounts Offset in the Balance Sheet | Net Fair Value Presented in the Balance Sheet | ||||||||||
(in thousands) | |||||||||||||
Assets: | |||||||||||||
Commodity Contracts | Current assets | $ | 89,981 | $ | (1,385 | ) | $ | 88,596 | |||||
Commodity Contracts | Non-current assets | 3,289 | — | 3,289 | |||||||||
Liabilities: | |||||||||||||
Commodity Contracts | Current liabilities | (1,385 | ) | 1,385 | — | ||||||||
Total derivatives | $ | 91,885 | $ | — | $ | 91,885 | |||||||
In May 2018, we elected to terminate outstanding commodity derivative contracts for all WTI oil swaps and certain WTI/Brent basis swaps for July 2018 through December 2019 and all WTI oil sold call options for July 2018 through June 2020. Termination costs totaled approximately $127 million and were calculated in accordance with a bilateral agreement on the cost of elective termination included in these derivative contracts; the present value of the contracts using the forward price curve as of the date termination was elected. No penalties were charged as a result of the elective termination. Concurrently, Berry Corp. entered into commodity derivative contracts consisting of Brent oil swaps for July 2018 through March 2019.
By using derivative instruments to economically hedge exposure to changes in commodity prices, we expose ourselves to credit risk and market risk. Credit risk is the failure of the counterparty to perform under the terms of the derivative contract. When the fair value of a derivative contract is positive, the counterparty owes us, which creates credit risk. We do not receive collateral from our counterparties.
We minimize the credit risk in derivative instruments by limiting our exposure to any single counterparty. In addition, our RBL Facility prevents us from entering into hedging arrangements that are secured, except with our lenders and their affiliates that have margin call requirements, that otherwise require us to provide collateral or with a non-lender counterparty that does not have an A- or A3 credit rating or better from Standards & Poor’s or Moody’s, respectively. In accordance with our standard practice, our commodity derivatives are subject to counterparty netting under agreements governing such derivatives which mitigates the counterparty nonperformance risk somewhat.
(Losses) Gains on Derivatives
A summary of losses and gains on the derivatives included on the statements of operations is presented below:
Berry Corp. (Successor) | Berry LLC (Predecessor) | |||||||||||||||
Year Ended December 31, 2019 | Year Ended December 31, 2018 | Ten Months Ended December 31, 2017 | Two Months Ended February 28, 2017 | |||||||||||||
(in thousands) | ||||||||||||||||
(Losses) gains on oil derivatives | $ | (37,998 | ) | $ | (4,621 | ) | $ | (66,900 | ) | $ | 12,886 | |||||
(Losses) gains on natural gas derivatives | (6,957 | ) | 6,357 | — | — | |||||||||||
Total (losses) gains on oil and natural gas derivatives | $ | (44,955 | ) | $ | 1,735 | $ | (66,900 | ) | $ | 12,886 | ||||||
For the year ended December 31, 2019, we received net cash scheduled settlements of approximately $42 million. For the year ended December 31, 2018, we paid net cash scheduled settlements of approximately $38 million, excluding
107
BERRY CORPORATION (bry)
NOTES TO CONSOLIDATED FINANCIAL STATEMENTS (Continued)
NOTES TO CONSOLIDATED FINANCIAL STATEMENTS (Continued)
the payments for the early terminated derivatives. For the ten months ended December 31, 2017, and the two months ended February 28, 2017, we received net cash settlements of approximately $3 million, and $0.5 million, respectively.
Note 5—Commitments and Contingencies
In the normal course of business, we, or our subsidiary, are subject to lawsuits, environmental and other claims and other contingencies that seek, or may seek, among other things, compensation for alleged personal injury, breach of contract, property damage or other losses, punitive damages, civil penalties, or injunctive or declaratory relief.
We accrue reserves for currently outstanding lawsuits, claims and proceedings when it is probable that a liability has been incurred and the liability can be reasonably estimated. We have not recorded any reserve balances at December 31, 2019 and December 31, 2018. We also evaluate the amount of reasonably possible losses that we could incur as a result of these matters. We believe that reasonably possible losses that we could incur in excess of reserves accrued on our balance sheet would not be material to our consolidated financial position or results of operations.
We, or our subsidiary, or both, have indemnified various parties against specific liabilities those parties might incur in the future in connection with transactions that they have entered into with us. As of December 31, 2019, we are not aware of material indemnity claims pending or threatened against us.
On May 11, 2016 our predecessor company filed the Chapter 11 Proceeding. Our bankruptcy case was jointly administered with that of Linn Energy and its affiliates under the caption In re Linn Energy, LLC, et al., Case No. 16-60040. On January 27, 2017, the Bankruptcy Court approved and confirmed the Plan. On February 28, 2017, the Effective Date occurred and the Plan became effective and was implemented. A final decree closing the Chapter 11 Proceeding was entered September 28, 2018, with the Court retaining jurisdiction as described in the confirmation order and without prejudice to the request of any party-in-interest to reopen the case including with respect to certain, immaterial remaining matters.
We have certain commitments under contracts, including purchase commitments for goods and services. We previously had an obligation to a counterparty in connection with our Piceance assets to either build a road or secure a license for alternative access, in lieu of paying a $6 million penalty. As of December 31, 2019, we fulfilled the obligation by delivering the access license pursuant to the agreement. The counterparty has since filed a claim challenging the sufficiency of such access.
In addition, we entered into certain firm commitments to secure transportation of our natural gas production to market as well as pipeline and processing capacity which require a minimum monthly charge regardless of whether the contracted capacity is used or not. We have also entered into operating lease agreements mainly for office space. Lease payments are generally expensed as part of general and administrative expenses. At December 31, 2019, future net minimum payments for non-cancelable purchase obligations and operating leases (excluding oil and natural gas and other mineral leases, utilities, taxes and insurance and maintenance expense) were as follows:
2020 | 2021 | 2022 | 2023 | 2024 | Thereafter | Total | |||||||||||||||
(in thousands) | |||||||||||||||||||||
Minimum purchase obligations(1) | $ | 7,136 | $ | 2,675 | $ | 2,590 | $ | 1,061 | $ | — | $ | — | $ | 13,462 | |||||||
Minimum lease payments | $ | 1,723 | $ | 1,731 | $ | 1,740 | $ | 1,647 | $ | 1,420 | $ | 3,708 | $ | 11,969 | |||||||
(1) | Amounts include payments which will become due under long-term agreements to purchase goods and services used in the normal course of business to secure transportation of our natural gas production to market as well as pipeline and processing capacity. |
108
BERRY CORPORATION (bry)
NOTES TO CONSOLIDATED FINANCIAL STATEMENTS (Continued)
NOTES TO CONSOLIDATED FINANCIAL STATEMENTS (Continued)
Note 6—Equity
On the Effective Date, Berry Corp. filed with the Secretary of State of the State of Delaware the Amended and Restated Certificate of Incorporation of Berry Corp. (the “Certificate of Incorporation”) and the Certificate of Designation of Series A Convertible Preferred Stock of Berry Corp. (the “Series A Certificate of Designation”). Berry Corp. also adopted the Amended and Restated Bylaws of Berry Corp. (the “Bylaws”) on the Effective Date. The Certificate of Incorporation provides that Berry Corp.’s authorized capital stock consists of 750,000,000 shares of common stock, par value $0.001 per share, and 250,000,000 shares of undesignated preferred stock, par value $0.001 per share.
Cash Dividends
Our board of directors approved a $0.12 per share quarterly cash dividend on our common stock each quarter in 2019 for a total of $0.48 per share. We paid the fourth quarter dividend in January 2020 and declared the first quarter dividend of $0.12 per share in February 2020, which is payable in April 2020. For the year ended December 31, 2019 we paid approximately $39 million in cash dividends on our common stock.
For the year ended December 31, 2018, we declared cash dividends on our common stock beginning at our IPO, resulting in $0.21 per share. In 2018 we paid approximately $7 million in cash dividends on our common stock.
Common Stock
The Plan contemplated the distribution of 40,000,000 shares of common stock in Berry Corp. On the Effective Date, 32,920,000 shares of common stock were distributed, pro rata, to holders of Unsecured Notes claims. The holders of Unsecured Claims received a right to receive their pro rata share of either (i) 7,080,000 shares of common stock in Berry Corp. or (ii) in the event that such holder irrevocably elected to receive a cash recovery, cash distributions from the Cash Distribution Pool. Since the Effective Date we have negotiated with all claimants to settle their claims and in 2019 we issued approximately 2,770,000 shares instead of 7,080,000 to resolve these claims for approximately $20 million.
Voting Rights. Each share of common stock is entitled to one vote with respect to each matter on which holders of common stock are entitled to vote. Holders of common stock do not have cumulative voting rights.
Dividend Rights. Holders of common stock will be entitled to receive dividends, if any, as may be declared from time to time by our board of directors (the “Board”) out of legally available funds.
Liquidation Rights. Upon liquidation, dissolution or winding up of the Company, subject to the rights of the holders of outstanding preferred stock, holders of our common stock will be entitled to share ratably in the assets of the Company that are legally available for distribution to holders of our common stock after payment of the Company’s debts and other liabilities.
Holders of preferred stock that is outstanding may be entitled to dividend or liquidation preferences over holders of our common stock, which means that the Company would have to pay distributions to holders of preferred stock before paying any distributions to holders of our common stock.
Preemptive and Conversion Rights. Holders of common stock have no preemptive, conversion or other rights to subscribe for additional shares.
Preferred Stock
On the Effective Date, we issued 35,845,001 shares of preferred stock to participants in the rights offerings extended by the Company to certain holders of claims and in satisfaction of a backstop commitment fee for proceeds of $335
109
BERRY CORPORATION (bry)
NOTES TO CONSOLIDATED FINANCIAL STATEMENTS (Continued)
NOTES TO CONSOLIDATED FINANCIAL STATEMENTS (Continued)
million. In July 2018, all shares of our Series A Preferred Stock, approximately 37.7 million in total, were converted to approximately 39.6 million common shares and, as a result, there were no shares of our Series A Preferred Stock outstanding as of December 31, 2018 and December 31, 2019.
Dividend Rights. Holders of Series A Preferred Stock were entitled to receive, when, as and if declared by the board of directors, cumulative dividends at a rate of 6.0% per annum either in cash or in additional shares of Series A Preferred Stock at the discretion of the board of directors. No dividends had been declared or paid as of December 31, 2017. The accreted cumulative and per share value of the dividends as of December 31, 2017 was approximately $18 million and $0.51, respectively.
In 2018, the board of directors approved a 0.050907 per share cumulative paid-in-kind dividend on the Series A Preferred Stock of approximately 1,825,000 shares for the periods through December 31, 2017. Also in 2018, the board approved $0.308 per share, or approximately $11.3 million in cash dividends on the Series A Preferred Stock.
A beneficial conversion feature exists when the effective conversion price of a convertible security is less than the fair value per share on the commitment date. The conversion price of the preferred stock on the date of issuance was less than the estimated fair value of the common stock distributable under the Plan. Since the preferred stock is not mandatorily redeemable and is immediately convertible, the entire amount of the beneficial conversion feature was recognized immediately. In accordance with GAAP, we recorded a non-cash deemed dividend and a corresponding increase to additional paid in capital of approximately $27 million that is attributable to this beneficial conversion feature. The financial statement impact of the deemed dividend is eliminated in the consolidated statement of equity as adopting fresh-start accounting results in an entity with no beginning retained earnings or accumulated deficit.
Registration Rights Agreement
On the Effective Date, Berry Corp. entered into a registration rights agreement (the “Registration Rights Agreement”) with certain holders of the Unsecured Notes. Subsequently, the registration rights agreement was amended and restated in connection with our IPO.
In accordance with the Registration Rights Agreement, Berry Corp. filed a shelf registration statement with the SEC subsequent to the Effective Date. The shelf registration statement registered the resale, on a delayed or continuous basis, of all Registrable Securities that have been timely designated for inclusion by specified Holders (as defined in the Registration Rights Agreement). Generally, “Registrable Securities” includes (i) common stock issued or to be issued by Berry Corp. under the Plan, (ii) preferred stock that was purchased by the participants in the Berry Rights Offerings and (iii) common stock into which the preferred stock converts, except that “Registrable Securities” does not include securities that have been sold under an effective registration statement or Rule 144 under the Securities Act. The Registration Rights Agreement will terminate when there are no longer any Registrable Securities outstanding.
Initial Public Offering of Common Stock
In July 2018, we completed our IPO and as a result, on July 26, 2018, our common stock began trading on the NASDAQ under the ticker symbol BRY. We received approximately $110 million of net proceeds, after deducting underwriting discounts and offering expenses payable by us, for the 8,695,653 shares of common stock issued for our benefit in the IPO, net of the shares sold for the benefit of certain selling stockholders. The price to the public for the shares sold in our IPO was $14.00 per share. See “—Use of IPO proceeds” below for additional information.
In connection with the IPO, each of the 37.7 million shares of our Series A Preferred Stock was automatically converted into 1.05 shares of our common stock or 39.6 million shares in aggregate and the right to receive a cash payment of $1.75 (the “Series A Preferred Stock Conversion”). The cash payment was reduced in respect of any cash dividend paid by the Company on such share of Series A Preferred Stock for any period commencing on or after April 1, 2018. Because we paid the second quarter preferred dividend of $0.15 per share in June, the cash payment for the conversion was reduced to $1.60 per share, or approximately $60 million. In connection with the IPO, we assigned the
110
BERRY CORPORATION (bry)
NOTES TO CONSOLIDATED FINANCIAL STATEMENTS (Continued)
NOTES TO CONSOLIDATED FINANCIAL STATEMENTS (Continued)
additional 1.9 million shares of common stock issued in the Series A Preferred Stock Conversion a value of $14.00 per share, which was equal to the value of shares sold in the IPO. This approximate $27 million value and the $60 million conversion cash payment reduced the income attributable to common stockholders by approximately $87 million for the year ended December 31, 2018.
Shares Outstanding
As of December 31, 2019, there were 79,542,976 shares of common stock outstanding. Up to an additional 2,348,334 shares were issuable for unvested restricted stock units and performance restricted stock units under the Company's 2017 Omnibus Incentive Plan as of December 31, 2019.
Stock Repurchase Program
In December 2018, our Board of Directors adopted a program for the opportunistic repurchase of up to $100 million of our common stock. Based on the Board’s evaluation of current market conditions for our common stock they authorized current repurchases of up to $50 million under the program. Purchases may be made from time to time in the open market, in privately negotiated transactions or otherwise. The manner, timing and amount of any purchases will be determined based on our evaluation of market conditions, stock price, compliance with outstanding agreements and other factors, may be commenced or suspended at any time without notice and does not obligate Berry Corp. to purchase shares during any period or at all. Any shares acquired will be available for general corporate purposes.
In 2019 the Company repurchased 4,609,021 shares at an average price of $9.99. Since 2018 the Company has repurchased a total of 5,057,682 shares at an average price of $9.88 per share under the Stock Repurchase Program, which is reflected as treasury stock. In February 2020, the Board of Directors authorized the remaining $50 million of our $100 million repurchase program.
Stock-Based Compensation
The RSUs awarded are service based awards. The performance-based restricted stock units PSUs awarded include (i) awards that vest if the Company's stock price reaches certain levels over defined periods of time and (ii) awards with a market objective measured against both absolute total stockholder return (“Absolute TSR”) and total stockholder return relative (“Relative TSR”), to the Vanguard World Fund - Vanguard Energy ETF index (the “Index”) over the performance period, assuming the reinvestment of dividends. Depending on the results achieved during the two or three year performance period, the actual number of shares that a grant recipient receives at the end of the period may range from 0% to 200% of the Target Shares granted.
The fair value of the PSUs was determined using a Monte Carlo simulation analysis to estimate the total shareholder return ranking of the Company, including a comparison against the Index over the performance periods. The expected volatility of the Company’s common stock at the date of grant was estimated based on blended historical average volatility rates for the Company and selected guideline public companies. The dividend yield assumption was based on the current annualized declared dividend. The risk-free interest rate assumption was based on observed interest rates consistent with the approximate two and three year performance measurement period.
As of July 2018, the fair value of our common stock underlying our stock-based compensation awards granted will no longer be based on complex models using inputs and assumptions, but will be based on the price of our stock at the date of grant.
On June 27, 2018, our board of directors adopted the second amended and restated 2017 Omnibus Incentive Plan, as amended and restated (our “Restated Incentive Plan”). This plan constitutes an amendment and restatement of the plan (the “Prior Plan”) as in effect immediately prior to the adoption of the Restated Incentive Plan. The Prior Plan constituted an amendment and restatement of the plan originally adopted as of June 15, 2017 (the “2017 Plan”). The Restated Incentive Plan provides for the grant, from time to time, at the discretion of the board of directors or a committee
111
BERRY CORPORATION (bry)
NOTES TO CONSOLIDATED FINANCIAL STATEMENTS (Continued)
NOTES TO CONSOLIDATED FINANCIAL STATEMENTS (Continued)
thereof, of stock options, stock appreciation rights (“SARs”), restricted stock, restricted stock units, stock awards, dividend equivalents, other stock-based awards, cash awards and substitute awards. The maximum number of shares of common stock that may be issued pursuant to an award under the Restated Incentive Plan is 10,000,000 inclusive of the number of shares of common stock previously issued pursuant to awards granted under the Prior Plan or the 2017 Plan. The maximum number of shares remaining that may be issued is 6,954,454 as of December 31, 2019.
For the year ended December 31, 2019, year ended December 31, 2018, ten months ended December 31, 2017 and two months ended February 28, 2017 the stock-based compensation expense was approximately $9 million, $7 million, $2 million and zero, respectively. For the years ended December 31, 2019 and year ended December 31, 2018 the stock-based compensation had an income tax benefit of approximately zero and $1.5 million, respectively.
The table below summarizes the activity relating RSUs issued under the Restated Incentive Plan during the year ended December 31, 2019. The RSUs vest ratably over three years. Unrecognized compensation cost associated with the RSUs at December 31, 2019 was approximately $8 million which will be recognized over a weighted-average period of approximately two years.
Number of shares | Weighted-average Grant Date Fair Value | |||||
(shares in thousands) | ||||||
Non-vested at December 31, 2018 | 641 | $ | 10.82 | |||
Granted | 767 | $ | 12.62 | |||
Vested | (308 | ) | $ | 10.87 | ||
Forfeited | (86 | ) | $ | 12.19 | ||
Non-vested at December 31, 2019 | 1,014 | $ | 12.05 | |||
The table below summarizes the activity relating to the PSUs issued under the Revised Incentive Plan during the year ended December 31, 2019. Unrecognized compensation cost associated with the PSUs at December 31, 2019 is approximately $5 million which will be recognized over a weighted-average period of approximately two years.
Number of shares | Weighted-average Grant Date Fair Value | |||||
(shares in thousands) | ||||||
Non-vested at December 31, 2018 | 282 | $ | 6.73 | |||
Granted | 554 | $ | 12.75 | |||
Vested | — | $ | — | |||
Forfeited | (38 | ) | $ | 9.69 | ||
Non-vested at December 31, 2019 | 798 | $ | 10.77 | |||
Use of IPO Proceeds
Of the approximately $110 million of net proceeds received by us in the IPO, we used approximately $105 million to repay borrowings under our RBL Facility. This included the $60 million we borrowed on the RBL Facility to make the payment due to the holders of our Series A Preferred Stock in connection with the conversion of preferred stock to common stock. We used the remainder for general corporate purposes.
112
BERRY CORPORATION (bry)
NOTES TO CONSOLIDATED FINANCIAL STATEMENTS (Continued)
NOTES TO CONSOLIDATED FINANCIAL STATEMENTS (Continued)
In connection with the IPO, on July 17, 2018, we entered into stock purchase agreements with certain funds affiliated with Oaktree Capital Management and Benefit Street Partners, pursuant to which we purchased an aggregate of 410,229 and 1,391,967 shares of our common stock, respectively, or 1,802,196 in total. In addition to the 8,695,653 shares of common stock issued and sold for our benefit in the IPO, we simultaneously received $24 million for selling 1,802,196 shares to the public and paid $24 million to purchase 1,802,196 shares under the stock purchase agreements. We purchased the shares immediately following the closing of the IPO and retired and returned them to the status of authorized but unissued shares. The selling stockholders also directly sold an additional 2,545,630 shares at a price to the public of $14.00 per share for which we did not receive any proceeds.
Note 7—Defined Contribution Plan
We sponsor a defined contribution retirement plan under section 401(k) of the Internal Revenue Code to assist all full-time employees in providing for retirement or other future financial needs. The 401(k) plan provides for a matching contribution of up to 6% of an employee’s eligible compensation. Employees are eligible to participate in the 401(k) plan on their date of hire.
We expensed approximately $1.7 million, $1.4 million, $0.8 million, and zero for the year ended December 31, 2019, year ended December 31, 2018, the ten months ended December 31, 2017, and the two months ended February 28, 2017, respectively, under the provisions of the 401(k) plan.
Note 8—Income taxes
Prior to the Effective Date, Berry LLC was a limited liability company treated as a disregarded entity for federal and state income tax purposes, with the exception of the state of Texas. Limited liability companies are subject to Texas margin tax. As such, with the exception of the state of Texas, Berry LLC was not a taxable entity, it did not directly pay federal and state income taxes and recognition was not given to federal and state income taxes for the operations of Berry LLC. Upon emergence from bankruptcy, Berry Corp. acquired the assets of Berry LLC in a taxable asset acquisition as part of the restructuring. Consequently, we are now taxed as a corporation and have no net operating loss carryforwards for the periods prior to February 28, 2017.
On December 22, 2017, the U.S. Tax Cuts and Jobs Act (the “Act”) made significant changes to the Internal Revenue Code of 1986, including lowering the maximum federal corporate income tax rate from 35% to 21% and imposing limitations on the use of net operating losses arising in taxable years ending after December 31, 2017. The SEC permitted the recognition of provisional amounts based on a reasonable estimate, subject to adjustments in a one-year measurement period. For the ten months ended December 31, 2017, we recorded provisional estimates for the remeasurement of our net deferred tax asset before valuation allowance of $2.7 million for the reduction in the corporate tax rate and a $1.9 million increase in the valuation allowance as a result of the Act. During 2018, we completed our accounting related to the income tax effects of the Act, resulting in no significant adjustments to the provisional amounts recorded.
The key contributor to the change in our effective rate from 23% in the year ended December 31, 2018 to (523)% for the year ended December 31, 2019 is due to the recognition of US federal general business credits in 2019 and are related to the 2017 and 2018 tax periods. These credits are available to offset future federal income tax liabilities.
113
BERRY CORPORATION (bry)
NOTES TO CONSOLIDATED FINANCIAL STATEMENTS (Continued)
NOTES TO CONSOLIDATED FINANCIAL STATEMENTS (Continued)
Income tax expense (benefit) consisted of the following:
Berry Corp. (Successor) | Berry LLC (Predecessor) | |||||||||||||||
Year Ended December 31, 2019 | Year Ended December 31, 2018 | Ten Months Ended December 31, 2017 | Two Months Ended February 28, 2017 | |||||||||||||
(in thousands) | ||||||||||||||||
Current taxes: | ||||||||||||||||
Federal | $ | — | $ | (465 | ) | $ | 465 | $ | — | |||||||
State | 227 | (446 | ) | 450 | 221 | |||||||||||
Total current taxes | 227 | (911 | ) | 915 | 221 | |||||||||||
Deferred taxes: | ||||||||||||||||
Federal | (36,756 | ) | 33,227 | 1,888 | — | |||||||||||
State | (21 | ) | 10,719 | — | 9 | |||||||||||
Total deferred taxes | (36,777 | ) | 43,946 | 1,888 | 9 | |||||||||||
Total current and deferred taxes | $ | (36,550 | ) | $ | 43,035 | $ | 2,803 | $ | 230 | |||||||
A reconciliation of the federal statutory tax rate to the effective tax rate is as follows:
Berry Corp. (Successor) | Berry LLC (Predecessor) | |||||||||||
Year Ended December 31, 2019 | Year Ended December 31, 2018 | Ten Months Ended December 31, 2017 | Two Months Ended February 28, 2017 | |||||||||
Federal statutory rate | 21.0 | % | 21.0 | % | 35.0 | % | 35.0 | % | ||||
State, net of federal tax benefit | 8.9 | % | 6.3 | % | 7.2 | % | — | % | ||||
Effect of permanent differences | 0.2 | % | (0.6 | )% | (0.4 | )% | — | % | ||||
Tax credits and federal return to provision | (546.4 | )% | — | % | — | % | — | % | ||||
State return to provision | (6.6 | )% | — | % | — | % | — | % | ||||
Tax reform—rate change(1) | — | % | — | % | (14.7 | )% | — | % | ||||
Income excluded from nontaxable entities | — | % | — | % | — | % | (35.0 | )% | ||||
Change in valuation allowance | — | % | (4.1 | )% | (42.4 | )% | — | % | ||||
Effective tax rate | (522.9 | )% | 22.6 | % | (15.3 | )% | — | % | ||||
__________
(1) | For the ten months ended December 31, 2017, includes the tax rate reduction. The impact of the rate change is fully offset in the “Change in valuation allowance” item. |
114
BERRY CORPORATION (bry)
NOTES TO CONSOLIDATED FINANCIAL STATEMENTS (Continued)
NOTES TO CONSOLIDATED FINANCIAL STATEMENTS (Continued)
Significant components of the deferred tax assets and liabilities are as follows:
Berry Corp. (Successor) | |||||||
December 31, 2019 | December 31, 2018 | ||||||
(in thousands) | |||||||
Deferred tax assets: | |||||||
Net operating loss carryforwards | $ | 14,542 | $ | 14,310 | |||
Accruals | 12,218 | 2,993 | |||||
Asset retirement obligations | 41,382 | 26,383 | |||||
Tax credits and federal return to provision | 47,803 | — | |||||
Interest limitation carryforward | 13,892 | 7,486 | |||||
Other | 5,154 | 2,033 | |||||
Total deferred tax assets | 134,991 | 53,205 | |||||
Deferred tax liabilities: | |||||||
Book tax differences in property basis | (143,896 | ) | (95,348 | ) | |||
Derivative instruments | (152 | ) | (3,692 | ) | |||
Total deferred tax liabilities | (144,048 | ) | (99,040 | ) | |||
Net deferred tax asset (liability) | $ | (9,057 | ) | $ | (45,835 | ) | |
As of December 31, 2019, the Company had approximately $56 million of federal net operating loss (“NOL”) carryforwards and $33 million of state net operating loss carryforwards. The federal net operating loss carryovers have no expiration date. State net operating loss carry forwards will expire in varying amounts beginning after taxable year ended 2027. In addition, as of December 31, 2019, the Company had US federal general business tax credit carryforwards totaling $48 million, which, if unused, will expire after taxable years ended 2037.
The Act signed into law in 2017 imposed new limitations on the ability to deduct interest paid or accrued. As of December 2019, we recorded a deferred tax asset related to the $66 million tax benefit of interest expense that was not currently deductible in tax years 2018 and 2019. This attribute can be carried forward indefinitely but utilized subject to certain annual limitations.
We assessed the available positive and negative evidence to estimate whether sufficient future taxable income will be generated to permit use of the existing deferred tax assets. As of December 31, 2019, due to the positive evidence of cumulative income since the Effective Date and the reversal of existing federal and state temporary differences, we determined there is sufficient positive evidence to conclude that it is more likely than not that our deferred tax assets are realizable.
Berry Corp. (Successor) | |||||||
December 31, 2019 | December 31, 2018 | ||||||
(in thousands) | |||||||
Unrecognized tax benefits - January 1 | $ | — | $ | — | |||
Prior year - increase | 6,720 | — | |||||
Current year - increase | 7,172 | — | |||||
Unrecognized tax benefits - December 31 | $ | 13,892 | $ | — | |||
115
BERRY CORPORATION (bry)
NOTES TO CONSOLIDATED FINANCIAL STATEMENTS (Continued)
NOTES TO CONSOLIDATED FINANCIAL STATEMENTS (Continued)
The $13.9 million of unrecognized tax benefits as of December 31, 2019 do not affect the effective tax rate if recognized. We believe it is reasonably possible that the total unrecognized benefits may significantly decrease within the next 12 months as new guidance and regulations related to the Act are issued. No penalties or interest expense have been accrued on unrecognized tax benefits as of December 31, 2019.
We are subject to taxation in the United States and various state jurisdictions. We are not currently under audit by any federal or state income tax authority. The 2017, 2018, and 2019 federal and state tax returns remain open to examination under the respective statute of limitations.
Note 9—Supplemental Disclosures to the Balance Sheets and Statements of Cash Flows
Other current assets reported on the balance sheets included the following:
Berry Corp. (Successor) | |||||||
December 31, 2019 | December 31, 2018 | ||||||
(in thousands) | |||||||
Prepaid expenses | $ | 4,577 | $ | 4,656 | |||
Materials and supplies | 10,544 | 5,461 | |||||
Oil inventories | 3,432 | 3,786 | |||||
Other | 846 | 464 | |||||
Other current assets | $ | 19,399 | $ | 14,367 | |||
Other non-current assets at December 31, 2019 and December 31, 2018 included approximately $11 million and $16 million of deferred financing costs, net of amortization, respectively.
Accounts payable and accrued expenses on the balance sheets included the following:
Berry Corp. (Successor) | |||||||
December 31, 2019 | December 31, 2018 | ||||||
(in thousands) | |||||||
Accounts payable-trade | $ | 25,475 | $ | 13,564 | |||
Accrued expenses | 45,589 | 66,417 | |||||
Royalties payable | 25,385 | 26,189 | |||||
Taxes other than income tax liability | 9,150 | 10,766 | |||||
Accrued interest | 10,500 | 10,500 | |||||
Dividends payable | 9,888 | 9,992 | |||||
Asset retirement obligation - current portion | 25,208 | 6,372 | |||||
Other | 616 | 318 | |||||
Total accounts payable and accrued expenses | $ | 151,811 | $ | 144,118 | |||
Other non-current liabilities at December 31, 2019 and December 31, 2018 included approximately $33 million and $15 million of greenhouse gas liability, respectively.
Supplemental Information on the Statement of Operations
Other operating (income) expenses mainly consist of excess abandonment costs, as well as gain (loss) on sale of assets.
116
BERRY CORPORATION (bry)
NOTES TO CONSOLIDATED FINANCIAL STATEMENTS (Continued)
NOTES TO CONSOLIDATED FINANCIAL STATEMENTS (Continued)
Supplemental Cash Flow Information
Supplemental disclosures to the statements of cash flows are presented below:
Berry Corp. (Successor) | Berry LLC (Predecessor) | |||||||||||||||
Year Ended December 31, 2019 | Year Ended December 31, 2018 | Ten Months Ended December 31, 2017 | Two Months Ended February 28, 2017 | |||||||||||||
(in thousands) | ||||||||||||||||
Supplemental Disclosures of Significant Non-Cash Investing Activities: | ||||||||||||||||
Material inventory transfers to oil and natural gas properties | $ | 10,056 | $ | 2,371 | $ | — | $ | — | ||||||||
Supplemental Disclosures of Cash Payments (Receipts): | ||||||||||||||||
Interest, net of amounts capitalized | $ | 30,720 | $ | 19,761 | $ | 14,276 | $ | 8,057 | ||||||||
Income taxes | $ | (2 | ) | $ | (1,901 | ) | $ | 1,994 | $ | — | ||||||
Reorganization items, net | $ | — | $ | 832 | $ | 1,732 | $ | 11,838 | ||||||||
The following table provides a reconciliation of cash, cash equivalents and restricted cash as reported in the consolidated statements of cash flows to the line items within the consolidated balance sheets:
Berry Corp. (Successor) | Berry LLC (Predecessor) | |||||||||||||||
Year Ended December 31, 2019 | Year Ended December 31, 2018 | Ten Months Ended December 31, 2017 | Two Months Ended February 28, 2017 | |||||||||||||
(in thousands) | ||||||||||||||||
Beginning of Period | ||||||||||||||||
Cash and cash equivalents | $ | 68,680 | $ | 33,905 | $ | 32,049 | $ | 30,483 | ||||||||
Restricted cash | — | 34,833 | 52,860 | 197,793 | ||||||||||||
Restricted cash in other noncurrent assets | — | — | 125 | 128 | ||||||||||||
Cash, cash equivalents and restricted cash | $ | 68,680 | $ | 68,738 | $ | 85,034 | $ | 228,404 | ||||||||
Ending of Period | ||||||||||||||||
Cash and cash equivalents | $ | — | $ | 68,680 | $ | 33,905 | $ | 32,049 | ||||||||
Restricted cash | — | — | 34,833 | 52,860 | ||||||||||||
Restricted cash in other noncurrent assets | — | — | — | 125 | ||||||||||||
Cash, cash equivalents and restricted cash | $ | — | $ | 68,680 | $ | 68,738 | $ | 85,034 | ||||||||
Restricted cash is associated with cash reserved to settle claims with general unsecured creditors. Cash and cash equivalents consists primarily of highly liquid investments with original maturities of three months or less and are stated at cost, which approximates fair value. As part of our cash management system, we use a controlled disbursement account to fund cash distribution checks presented for payment by the holder. Checks issued but not yet presented to banks may result in overdraft balances for accounting purposes in the accounts payable and accrued expenses account.
117
BERRY CORPORATION (bry)
NOTES TO CONSOLIDATED FINANCIAL STATEMENTS (Continued)
NOTES TO CONSOLIDATED FINANCIAL STATEMENTS (Continued)
Note 10—Certain Relationships and Related Party Transactions
In connection with our emergence from bankruptcy, we entered into agreements with certain of our affiliates and with parties who received shares of our common stock and Series A Preferred Stock in exchange for their claims.
Transition Services and Separation Agreement (“TSSA”)
On the Effective Date, Berry LLC entered into a TSSA with Linn Energy and certain of its subsidiaries to facilitate the separation of Berry LLC’s operations from Linn Energy’s operations. Under the TSSA, Berry LLC reimbursed Linn Energy for third-party out-of-pocket costs and expenses actually incurred by Linn Energy in connection with providing certain transition services. For the ten months ended December 31, 2017, we incurred management fee expenses of approximately $17 million under the TSSA. Since the agreement commenced on the Effective Date, no expenses were incurred for the periods ended February 28, 2017.
Note 11—Acquisitions and Divestitures
During 2019 we had various property acquisitions of approximately $2.9 million that individually were not significant.
Disposition of East Texas Properties
On November 30, 2018, we sold our non-core gas-producing properties and related assets located in the East Texas basin for approximately $7 million, before purchase price adjustments, which resulted in a gain of approximately $4 million. Production comprised approximately 0.7 MBoe per day of natural gas in the third quarter of 2018.
Acquisition of Chevron North Midway-Sunset
In April 2018, we acquired 2 leases on an aggregate of 214 acres of land owned by Chevron U.S.A. in the north Midway-Sunset field immediately adjacent to assets we currently operate. We assumed a drilling commitment of approximately $35 million to drill 115 wells on or before April 1, 2020, which we extended to April 1, 2022. We drilled 18 wells of these wells as of December 31, 2019. We paid no other consideration for the acquisition. Our drilling commitment will be tolled for a month for each consecutive 30-day period for which the posted price of WTI is less than $45 per barrel. This transaction is consistent with our business strategy to investigate areas beyond our known productive areas.
Disposition of Hugoton Properties
On July 31, 2017, we divested our 78% working interest in the Hugoton natural gas field located in Southwest Kansas and the Oklahoma Panhandle (the “Hugoton Disposition”) because we deemed it a non-core asset. This resulted in approximately $234 million of proceeds and a $23 million gain.
Acquisition of Hill Properties
On July 31, 2017, we acquired the remaining 84% working interest in the South Belridge Hill property located in Kern County, California, in which we previously owned a 16% working interest (the “Hill Acquisition”). We purchased the properties for approximately $249 million.
Note 12—Earnings Per Share
The Predecessor was organized as a limited liability company and, as such, did not issue any stock. Accordingly, we have not presented earnings per share calculations for the predecessor company periods.
118
BERRY CORPORATION (bry)
NOTES TO CONSOLIDATED FINANCIAL STATEMENTS (Continued)
NOTES TO CONSOLIDATED FINANCIAL STATEMENTS (Continued)
We calculate basic earnings (loss) per share by dividing net income (loss) attributable to common stockholders by the weighted-average number of common shares outstanding during the year ended December 31, 2019, year ended December 31, 2018, and ten months ended December 31, 2017 which is approximately 81 million, 58 million, and 39 million shares, respectively. Common shares issuable upon the satisfaction of certain conditions pursuant to a contractual agreement, are considered common shares outstanding and are included in the computation of net income (loss) per share. Our initial capitalization included the issuance of 32,920,000 shares of common stock and another 7,080,000 shares reserved to settle claims of unsecured creditors, all of which were included in our computation of net income (loss) per share until the claims were settled and the shares issued. In March 2019, we finalized settlement of these claims, issuing approximately 2,770,000 shares. In all prior periods presented we retrospectively adjusted the weighted average shares in our earnings per share calculations for the ultimate shares issued, instead of the 7,080,000 shares that had been reserved.
In July 2018, all outstanding shares of our Series A Preferred Stock were converted to common shares in connection with the IPO of our common stock (see Note 6). The conversion was characterized as an induced conversion that required a deduction in our EPS calculation, from net income, of approximately $87 million in determining income attributable to common stockholders. This deduction represents the excess of fair value of the total consideration given to preferred stockholders in the transaction over the fair value of the common stock issuable under the original conversion terms. Included in the $87 million is a $60 million cash payment and approximately $27 million of value from the 1.9 million additional common shares received by preferred stockholders as a result of the automatic conversion that occurred in conjunction with our IPO.
The Series A Preferred Stock was not a participating security, therefore, we calculated diluted EPS using the “if-converted” method under which the preferred dividends are added back to the numerator and the convertible preferred stock is assumed to be converted at the beginning of the period. No incremental shares of Series A Preferred Stock were included in the diluted EPS calculation for the year ended December 31, 2019 as all outstanding shares of our Series A Preferred Stock were converted to common shares in connection with the IPO of our common stock in July 2018. No Series A Preferred Stock were included in the diluted EPS calculations for the year ended December 31, 2018 and for the ten months ended December 31, 2017 as their effect was anti-dilutive under the “if-converted” method.
The RSUs and PSUs are not a participating security as the dividends are forfeitable. The incremental RSU and PSU shares of 572,000 for the year ended December 31, 2019 and the incremental RSU shares of 189,000 for the year ended December 31, 2018 were included in the diluted EPS calculation for those respective years, as their effect was dilutive under the “if-converted” method. No incremental shares of RSUs were included in the diluted EPS calculation for the ten months ended December 31, 2017 as their effect was anti-dilutive under the “if-converted” method. No PSUs were included in the EPS calculations for the year end December 31, 2018, the ten months ended December 21, 2017, and the two months ended February 28, 2017, due to their contingent nature.
119
BERRY CORPORATION (bry)
NOTES TO CONSOLIDATED FINANCIAL STATEMENTS (Continued)
NOTES TO CONSOLIDATED FINANCIAL STATEMENTS (Continued)
Berry Corp. (Successor) | Berry LLC (Predecessor) | |||||||||||||
Year Ended December 31, 2019 | Year Ended December 31, 2018 | Ten Months Ended December 31, 2017 | Two Months Ended February 28, 2017 | |||||||||||
(in thousands except per share amounts) | ||||||||||||||
Basic EPS calculation | ||||||||||||||
Net income (loss) | $ | 43,539 | $ | 147,102 | $ | (21,068 | ) | n/a | ||||||
less: Series A Preferred Stock dividends and conversion to common stock | — | (97,942 | ) | (18,248 | ) | n/a | ||||||||
Net income (loss) attributable to common stockholders | $ | 43,539 | $ | 49,160 | $ | (39,316 | ) | n/a | ||||||
Weighted-average shares of common stock outstanding(1) | 81,379 | 57,743 | 38,644 | n/a | ||||||||||
Basic earnings (loss) per share(2) | $ | 0.54 | $ | 0.85 | $ | (1.02 | ) | n/a | ||||||
Diluted EPS calculation | ||||||||||||||
Net income (loss) | $ | 43,539 | $ | 147,102 | $ | (21,068 | ) | n/a | ||||||
less: Series A Preferred Stock dividends and conversion to common stock | — | (97,942 | ) | (18,248 | ) | n/a | ||||||||
Net income (loss) attributable to common stockholders | $ | 43,539 | $ | 49,160 | $ | (39,316 | ) | n/a | ||||||
Weighted-average shares of common stock outstanding(1) | 81,379 | 57,743 | 38,644 | n/a | ||||||||||
Dilutive effect of potentially dilutive securities(3) | 572 | 189 | — | n/a | ||||||||||
Weighted-average common shares outstanding - diluted | 81,951 | 57,932 | 38,644 | n/a | ||||||||||
Diluted earnings (loss) per share(2) | $ | 0.53 | $ | 0.85 | $ | (1.02 | ) | n/a | ||||||
__________
(1) | For the year ended December 31, 2018, we retrospectively adjusted the weighted average shares in our earnings per share calculations for the 2,770,000 shares issued instead of 7,080,000 shares that had been reserved for the year ended December 31, 2018 and the ten months ended December 31, 2017. |
(2) | Per share amounts are stated net of tax. |
(3) | No potentially dilutive securities were included in computing earnings (loss) per share for the ten months ended December 31, 2017 because the effect of inclusion would have been anti-dilutive. |
120
BERRY CORPORATION (bry)
NOTES TO CONSOLIDATED FINANCIAL STATEMENTS (Continued)
NOTES TO CONSOLIDATED FINANCIAL STATEMENTS (Continued)
Note 13—Revenue Recognition
We account for revenue in accordance with the Accounting Standards Codification 606, Revenue from Contracts with Customers, which we adopted on January 1, 2019, using the modified retrospective method, which was applied to all contracts that were not completed as of that date. Prior period results were not adjusted and continue to be reported under the accounting standards in effect for the prior period. The new standard did not affect the timing of our revenue recognition and did not impact net income; accordingly, we did not record an adjustment to the opening balance of retained earnings.
We adopted the practical expedient related to disclosing the aggregate amount of the transaction price allocated to performance obligations that are unsatisfied at the end of the reporting period. The performance obligations that are unsatisfied at the end of a reporting period relate solely to future volumes that we have yet to sell. As such, these are wholly unsatisfied performance obligations as each unit of product represents a separate performance obligation as well as a wholly unsatisfied promise to transfer a distinct good that forms part of a single performance obligation.
We derive substantially all of our revenue from sales of oil, natural gas and natural gas liquids ("NGL"), with the remaining revenue generated from sales of electricity and marketing activities.
The following is a description of our principal activities from which we generate revenue. Revenues are recognized when a customer obtains control of promised goods or services, in an amount that reflects the consideration we expect to receive in exchange for those goods or services.
Oil, Natural Gas and NGLs
We recognize revenue from the sale of our oil, natural gas and NGLs production when delivery has occurred and control passes to the customer. Our oil and natural gas contracts are short term, typically less than a year and our NGL contracts are both short and long term. We consider our performance obligations to be satisfied upon transfer of control of the commodity. Our commodity sales contracts are indexed to a market price or an average index price. We recognize revenue in the amount that we expect to receive once we are able to adequately estimate the consideration (i.e., when market prices are known). Our contracts with customers typically require payment within 30 days following invoicing.
Electricity Sales
The electrical output of our cogeneration facilities that is not used in our operations is sold to the California market based on market pricing, which includes capacity payments. The majority of the portion sold from three of our cogeneration facilities is sold under long-term contracts to two California utility companies, based on the market pricing. Revenue is recognized over time when obligations under the terms of a contract with our customer are satisfied; generally, this occurs upon delivery of the electricity. Revenue is measured as the amount of consideration we expect to receive based on average index pricing with payment due the month following delivery. Capacity payments are based on a fixed annual amount per kilowatt hour and monthly rates vary based on seasonality, which is consistent with how we earn the capacity payment. Capacity payments are settled monthly. We consider our performance obligations to be satisfied upon delivery of electricity or as the contracted amount of energy is made available to the customer in the case of capacity payments. We report electricity revenue as electricity sales on our consolidated statements of operations. We recognize revenue in the amount that we have a right to invoice once we are able to adequately estimate the consideration (i.e., when market prices are known).
Marketing Revenue
Marketing revenue primarily includes our activities associated with transporting and marketing third-party volumes. These sales are made under the same agreements with the same purchaser as our natural gas sales discussed above. We consider our performance obligations to be satisfied upon transfer of control of the commodity. Revenues are presented excluding costs incurred prior to transferring control of these volumes to the customer, or the costs to purchase these
121
BERRY CORPORATION (bry)
NOTES TO CONSOLIDATED FINANCIAL STATEMENTS (Continued)
NOTES TO CONSOLIDATED FINANCIAL STATEMENTS (Continued)
volumes when we are acting as the principal. The revenues and expenses related to the sale and purchase of third-party volumes are presented separately as marketing revenue and marketing expenses on the condensed consolidated statements of operations.
Disaggregated Revenue
As a result of adoption of this standard, we are now required to disclose the following information regarding revenue from contracts with customers on a disaggregated basis.
Berry Corp. (Successor) | Berry LLC (Predecessor) | |||||||||||||||
Year Ended December 31, 2019 | Year Ended December 31, 2018 | Ten Months Ended December 31, 2017 | Two Months Ended February 28, 2017 | |||||||||||||
(in thousands) | ||||||||||||||||
Oil sales | $ | 543,634 | $ | 520,979 | $ | 303,589 | $ | 54,110 | ||||||||
Natural gas sales | 19,391 | 26,244 | 40,887 | 14,476 | ||||||||||||
Natural gas liquids sales | 2,571 | 5,651 | 13,452 | 5,534 | ||||||||||||
Electricity sales | 29,397 | 35,208 | 21,972 | 3,655 | ||||||||||||
Marketing revenues | 2,094 | 2,322 | 2,694 | 633 | ||||||||||||
Other revenues | 316 | 774 | 3,975 | 1,424 | ||||||||||||
Revenues from contracts with customers | 597,403 | 591,178 | 386,569 | 79,832 | ||||||||||||
(Losses) gains on oil derivatives | (37,998 | ) | (4,621 | ) | (66,900 | ) | 12,886 | |||||||||
Total revenues and other | $ | 559,405 | $ | 586,557 | $ | 319,669 | $ | 92,718 | ||||||||
Note 14—Emergence from Voluntary Reorganization under Chapter 11
On May 11, 2016 our predecessor company filed bankruptcy. Our bankruptcy case was jointly administered with that of Linn Energy and its affiliates under the caption In re Linn Energy, LLC, et al., Case No. 16–60040 (the “Chapter 11 Proceeding”). On January 27, 2017, the Bankruptcy Court approved and confirmed our plan of reorganization in the Chapter 11 Proceeding (the “Plan”). On February 28, 2017 (the “Effective Date”), the Plan became effective and was implemented. A final decree closing the Chapter 11 Proceeding was entered September 28, 2018, with the Court retaining jurisdiction as described in the confirmation order and without prejudice to the request of any party–in–interest to reopen the case including with respect to certain, immaterial remaining matters.
Plan of Reorganization
On the Effective Date, the Company consummated the following reorganization transactions in accordance with the Plan:
• | Linn Acquisition Company, LLC transferred 100% of the outstanding membership interests in Berry LLC to Berry Corp. pursuant to an assignment agreement, dated February 28, 2017 between Linn Acquisition Company, LLC and Berry Corp. (the “Assignment Agreement”). Under the Assignment Agreement, Berry LLC became a wholly-owned operating subsidiary of Berry Corp. |
• | The holders of claims under the Company’s Second Amended and Restated Credit Agreement, dated November 15, 2010, by and among Berry LLC, as borrower, Wells Fargo Bank, N.A., as administrative agent, and certain lenders, (as amended, the “Pre-Emergence Credit Facility”), received (i) their pro-rated share of a cash paydown and (ii) pro-rated participation in the new facility (the “Emergence Credit Facility”). As a result, all outstanding obligations under the Pre-Emergence Credit Facility were canceled and the agreements governing these obligations were terminated. |
122
BERRY CORPORATION (bry)
NOTES TO CONSOLIDATED FINANCIAL STATEMENTS (Continued)
NOTES TO CONSOLIDATED FINANCIAL STATEMENTS (Continued)
• | Berry LLC, as borrower, entered into the Emergence Credit Facility with the holders of claims under the Pre-Emergence Credit Facility, as lenders, and Wells Fargo Bank, N.A, as administrative agent, providing for a new reserves-based revolving loan with up to $550 million in borrowing commitments. This facility was replaced with the RBL Facility in July 2017 noted above. |
• | The holders of Berry LLC’s 6.75% senior notes due 2020, issued by Berry LLC pursuant to a Second Supplemental Indenture, dated November 1, 2010, and 6.375% senior notes due 2022, issued by Berry LLC pursuant to a Third Supplemental Indenture, dated March 9, 2012 (collectively, the “Unsecured Notes”), received a right to their pro-rated share of either (i) 32,920,000 shares of common stock in Berry Corp. or, for those non-accredited investors holding the Unsecured Notes that irrevocably elected to receive a cash recovery, cash distributions from a $35 million cash distribution pool (the “Cash Distribution Pool”) and (ii) specified rights to participate in a two-tranche offering of rights to purchase Series A Preferred Stock at an aggregate purchase price of $335 million (as further defined in the Plan, the “Berry Rights Offerings”). As a result, all outstanding obligations under the Unsecured Notes were canceled and the indentures and related agreements governing these obligations were terminated. |
• | The holders of unsecured claims against Berry LLC, (other than the Unsecured Notes) (the “Unsecured Claims”) received a right to their pro-rated share of either (i) 7,080,000 shares of common stock in Berry Corp. or (ii) in the event that such holder irrevocably elected to receive a cash recovery, cash distributions from the Cash Distribution Pool. After the Effective Date we have negotiated with claimants to settle their claims. As a result, in early 2019, we issued 2,770,000 shares to settle these claims for which we had originally reserved 7,080,000 shares. |
• | Berry LLC settled all intercompany claims against Linn Energy and its affiliates pursuant to a settlement agreement approved as part of the Plan and the Confirmation Order. The settlement agreement provided Berry LLC with a $25 million general unsecured claim against Linn Energy which Berry LLC has fully-reserved. |
Bank RSA
Prior to the Petition Date, on May 10, 2016, the Debtors entered into a restructuring support agreement (the “Bank RSA”) with certain holders (the “Consenting Bank Creditors”). The Bank RSA set forth, subject to certain conditions, the commitment of the Consenting Bank Creditors to support a comprehensive restructuring of the Debtors’ long-term debt. The Bank RSA required the Debtors and the Consenting Bank Creditors to, among other things, support and not interfere with consummation of the restructuring transactions contemplated by the Bank RSA and, as to the Consenting Bank Creditors, vote their claims in favor of the Plan.
Liabilities Subject to Compromise
Through the claims resolution process, many claims were disallowed by the Bankruptcy Court because they were duplicative, amended or superseded by later filed claims, were without merit, or were otherwise overstated. Throughout the Chapter 11 proceedings, the Debtors also resolved many claims through settlements or by Bankruptcy Court orders following the filing of an objection. As a result, in early 2019, we issued 2,770,000 shares to settle these claims for which we had originally reserved 7,080,000 shares. We settled all liabilties subject to compromise through cash recovery as of December 31, 2018, resulting in a significant recognition of gains due to the return of undistributed funds. See “Reorganization Items, net” below.
123
BERRY CORPORATION (bry)
NOTES TO CONSOLIDATED FINANCIAL STATEMENTS (Continued)
NOTES TO CONSOLIDATED FINANCIAL STATEMENTS (Continued)
Reorganization Items, Net
We have incurred expenses associated with the reorganization. Reorganization items, net represents costs and income directly associated with the Chapter 11 proceedings since the Petition Date, and also includes adjustments to reflect the carrying value of certain liabilities subject to compromise at their estimated allowed claim amounts, as such adjustments were determined. The following table summarizes the components of reorganization items included in the consolidated statements of operations:
Berry Corp. (Successor) | Berry LLC (Predecessor) | |||||||||||||||
Year Ended December 31, 2019 | Year Ended December 31, 2018 | Ten Months Ended December 31, 2017 | Two Months Ended February 28, 2017 | |||||||||||||
(in thousands) | ||||||||||||||||
Return of undistributed funds from cash distribution pool(1) | $ | — | $ | 22,855 | $ | — | $ | — | ||||||||
Gains on resolution of pre-emergence liabilities and claims | — | 3,713 | — | — | ||||||||||||
Legal and other professional advisory fees | (426 | ) | (3,083 | ) | (1,027 | ) | (19,481 | ) | ||||||||
Gains on settlement of liabilities subject to compromise | — | — | — | 421,774 | ||||||||||||
Fresh-start valuation adjustments | — | — | — | (920,699 | ) | |||||||||||
Other | — | 1,205 | (705 | ) | 10,686 | |||||||||||
Reorganization items, net | $ | (426 | ) | $ | 24,690 | $ | (1,732 | ) | $ | (507,720 | ) | |||||
__________
(1) | This amount was reclassed from restricted cash to general cash, thus does not represent a cash transaction. |
Effect of Filing on Creditors
Subject to certain exceptions, under the Bankruptcy Code, the filing of Bankruptcy Petitions automatically enjoined, or stayed, the continuation of most judicial or administrative proceedings or filing of other actions against the Debtors or their property to recover, collect or secure a claim arising prior to the Petition Date. Absent an order of the Bankruptcy Court, substantially all of the Debtors’ pre-petition liabilities were subject to settlement under the Bankruptcy Code. Although the filing of Bankruptcy Petitions triggered defaults on the Debtors’ debt obligations, creditors were stayed from taking any actions against the Debtors as a result of such defaults, subject to certain limited exceptions permitted by the Bankruptcy Code. The Predecessor did not record interest expense on its senior notes for the period from January 1, 2017 through February 28, 2017. For this period, unrecorded contractual interest was approximately $9 million.
Covenant Violations
The Predecessor’s filing of the Bankruptcy Petitions constituted an event of default that accelerated the Predecessor’s obligations under its Pre-Emergence Credit Facility and its senior notes. Additionally, other events of default, including cross-defaults, occurred, including the failure to make interest payments on the Predecessor’s senior notes. Under the Bankruptcy Code, the creditors under these debt agreements were stayed from taking any action against the Predecessor as a result of any default.
Prior Credit Facility
The Pre-Emergence Credit Facility contained a requirement to deliver audited financial statements without a going concern or like qualification or exception. Consequently, the filing of the Predecessor’s 2015 Annual Report on Form 10-K which included a going concern explanatory paragraph resulted in a default under the Pre-Emergence Credit Facility as of the filing date, March 28, 2016, subject to a 30-day grace period.
124
BERRY CORPORATION (bry)
NOTES TO CONSOLIDATED FINANCIAL STATEMENTS (Continued)
NOTES TO CONSOLIDATED FINANCIAL STATEMENTS (Continued)
On April 12, 2016, the Predecessor entered into an amendment to the Pre-Emergence Credit Facility. The amendment provided for, among other things, an agreement that (i) certain events would not become defaults or events of default until May 11, 2016, (ii) the borrowing base would remain constant until May 11, 2016, unless reduced as a result of swap agreement terminations or collateral sales, (iii) the Predecessor would have access to $45 million in cash that was previously restricted in order to fund ordinary course operations and (iv) the Predecessor, the administrative agent and the lenders would negotiate in good faith the terms of a restructuring support agreement in furtherance of a restructuring of the capital structure of the Predecessor. As a condition to closing the amendment, the Predecessor provided control agreements over certain deposit accounts.
The filing of the Bankruptcy Petitions constituted an event of default that accelerated the Predecessor’s obligations under the Pre-Emergence Credit Facility. However, under the Bankruptcy Code, the creditors under this debt agreement were stayed from taking any action against the Predecessor as a result of the default.
Senior Notes
The Predecessor deferred making an interest payment totaling approximately $18 million due March 15, 2016, on the Predecessor’s 6.375% senior notes due September 2022, which resulted in the Predecessor being in default under these senior notes. The indenture governing the notes provided the Predecessor a 30-day grace period to make the interest payment.
On April 14, 2016, within the 30-day interest payment grace period provided for in the indenture governing the notes, the Predecessor made an interest payment of approximately $18 million in satisfaction of its obligations.
The Predecessor failed to make interest payments due on its senior notes subsequent to April 14, 2016.
The filing of the Bankruptcy Petitions constituted an event of default that accelerated the Predecessor’s obligations under the indentures governing the senior notes. However, under the Bankruptcy Code, holders of the senior notes were stayed from taking any action against the Predecessor as a result of the default.
Note 15—Fresh-Start Accounting
Upon our emergence from bankruptcy, we were required to adopt fresh-start accounting, which, with the recapitalization described above, resulted in Berry Corp. being treated as the new entity for financial reporting purposes. We were required to adopt fresh-start accounting upon our emergence from bankruptcy because (i) the holders of existing voting ownership interests of our predecessor company received less than 50% of the voting shares of Berry Corp. and (ii) the reorganization value of our assets immediately prior to confirmation of the Plan was less than the total of all post-petition liabilities and allowed claims. An entity applying fresh-start accounting upon emergence from bankruptcy is viewed as a new reporting entity from an accounting perspective, and accordingly, may select new accounting policies.
The reorganization value of our assets immediately prior to confirmation of the Plan was less than the total of all post-petition liabilities and allowed claims, as shown below:
(in thousands) | |||
Liabilities subject to compromise | $ | 1,000,336 | |
Pre-petition debt not classified as subject to compromise | 891,259 | ||
Post-petition liabilities | 245,702 | ||
Total post-petition liabilities and allowed claims | 2,137,297 | ||
Reorganization value of assets immediately prior to implementation of the Plan | (1,722,585 | ) | |
Excess post-petition liabilities and allowed claims | $ | 414,712 | |
125
BERRY CORPORATION (bry)
NOTES TO CONSOLIDATED FINANCIAL STATEMENTS (Continued)
NOTES TO CONSOLIDATED FINANCIAL STATEMENTS (Continued)
Upon adoption of fresh-start accounting, the reorganization value derived from the enterprise value was allocated to our assets and liabilities based on their fair values in accordance with GAAP. The Effective Date fair values of our assets and liabilities differed materially from their recorded values as reflected on the historical balance sheet. The effects of the Plan and the application of fresh-start accounting were reflected in the financial statements as of February 28, 2017, and the related adjustments thereto were recorded on the statement of operations for the two months ended February 28, 2017.
As a result of the adoption of fresh-start accounting and the effects of the implementation of the Plan, our consolidated financial statements subsequent to February 28, 2017, are not comparable to our financial statements prior to February 28, 2017.
Our consolidated financial statements and related footnotes are presented with a black line division, which delineates the lack of comparability between amounts presented after February 28, 2017, and amounts presented on or prior to February 28, 2017. Our financial results for future periods following the application of fresh-start accounting will be different from historical trends and the differences may be material.
Reorganization Value
Under GAAP, a value was assigned to the equity of the emerging entity as of the date of adoption of fresh-start accounting. The Plan and disclosure statement approved by the Bankruptcy Court did not include an enterprise value or reorganization value, nor did the Bankruptcy Court approve a value as part of its confirmation of our Plan. Our reorganization value was derived from an estimate of enterprise value, or the fair value of our long-term debt, stockholders’ equity and working capital. Reorganization value approximates the fair value of the entity before considering liabilities and approximates the amount a willing buyer would pay for the assets of the entity immediately after the restructuring. Based on the various estimates and assumptions necessary for fresh-start accounting, our enterprise value as of the Effective Date was estimated to be approximately $1.3 billion. The enterprise value was estimated using a sum of parts approach. The sum of parts approach represents the summation of the indicated fair value of the component assets of the Company. The fair value of our assets was estimated by relying on a combination of the income, market and cost approaches.
The estimated enterprise value, reorganization value and equity value are highly dependent on the achievement of the financial results contemplated in our underlying projections. While we believe the assumptions and estimates used to develop enterprise value and reorganization value are reasonable and appropriate, different assumptions and estimates could materially impact the analysis and resulting conclusions. Additionally, the assumptions used in estimating these values are inherently uncertain and require judgment. The primary assumptions for which there is a reasonable possibility of the occurrence of a variation that would have significantly affected the reorganization value include those regarding pricing, discount rates and the amount and timing of capital expenditures.
Our principal assets are our oil and natural gas properties. The fair values of oil and natural gas properties were estimated using a valuation technique consistent with the income approach; specifically, the discounted cash flows method. We also used the market approach to corroborate the valuation results from the income approach. We used a market-based weighted-average cost of capital discount rate of 10% for proved and unproved reserves, with further risk adjustment factors applied to the discounted values. The underlying commodity prices embedded in our estimated cash flows were based on the New York Mercantile Exchange (“NYMEX”) forward curve pricing, adjusted for estimated location and quality differentials, as well as other factors that we believe will impact realizable prices. NYMEX forward curve pricing was used for years 2017 through 2019 and then was escalated at approximately 2.0%.
See below under “Fresh-Start Adjustments” for additional information regarding assumptions used in the valuation of our various other significant assets and liabilities.
126
BERRY CORPORATION (bry)
NOTES TO CONSOLIDATED FINANCIAL STATEMENTS (Continued)
NOTES TO CONSOLIDATED FINANCIAL STATEMENTS (Continued)
The following table reconciles the enterprise value to the estimated reorganization value as of the Effective Date:
(in thousands) | |||
Enterprise value | $ | 1,278,527 | |
Plus: Fair value of non-debt liabilities | 282,511 | ||
Reorganization value of the Successor’s assets | $ | 1,561,038 | |
The fair value of non-debt liabilities consists of liabilities assumed by the Successor on the Effective Date and excludes the fair value of long-term debt.
Consolidated Balance Sheet
The adjustments included in the following fresh-start consolidated balance sheet reflect the effects of the transactions contemplated by the Plan and executed on the Effective Date (reflected in the column “Reorganization Adjustments”) as well as fair value and other required accounting adjustments resulting from the adoption of fresh-start accounting (reflected in the column “Fresh-Start Adjustments”). The explanatory notes provide additional information with regard to the adjustments recorded, methods used to determine the fair values and significant assumptions.
127
BERRY CORPORATION (bry)
NOTES TO CONSOLIDATED FINANCIAL STATEMENTS (Continued)
NOTES TO CONSOLIDATED FINANCIAL STATEMENTS (Continued)
As of February 28, 2017 | |||||||||||||||||
Berry LLC (Predecessor) | Reorganization Adjustments(1) | Fresh-Start Adjustments | Berry Corp. (Successor) | ||||||||||||||
(in thousands) | |||||||||||||||||
ASSETS | |||||||||||||||||
Current assets: | |||||||||||||||||
Cash and cash equivalents | $ | 27,407 | $ | 4,642 | (2) | $ | — | $ | 32,049 | ||||||||
Accounts receivable | 76,027 | (15,700 | ) | (3) | (816 | ) | (14 | ) | 59,511 | ||||||||
Derivative instruments | 243 | — | — | 243 | |||||||||||||
Restricted cash | 128 | 52,732 | (4) | — | 52,860 | ||||||||||||
Other current assets | 18,437 | (5,558 | ) | (5) | 3,873 | (15 | ) | 16,752 | |||||||||
Total current assets | 122,242 | 36,116 | 3,057 | 161,415 | |||||||||||||
Non-current assets: | |||||||||||||||||
Oil and natural gas properties | 5,031,498 | — | (3,787,898 | ) | (16 | ) | 1,243,600 | ||||||||||
Less accumulated depletion and amortization | (2,814,999 | ) | — | 2,814,999 | (16 | ) | — | ||||||||||
Total oil and natural gas properties, net | 2,216,499 | — | (972,899 | ) | 1,243,600 | ||||||||||||
Other property and equipment | 124,379 | — | (15,576 | ) | (17 | ) | 108,803 | ||||||||||
Less accumulated depreciation | (22,107 | ) | — | 22,107 | (17 | ) | — | ||||||||||
Total other property and equipment, net | 102,273 | — | 6,530 | 108,803 | |||||||||||||
Derivative instruments | 57 | — | — | 57 | |||||||||||||
Restricted cash | 197,939 | (197,814 | ) | (2) | — | 125 | |||||||||||
Other non-current assets | 16,076 | 151 | (6) | 30,811 | (18 | ) | 47,038 | ||||||||||
Total assets | $ | 2,655,086 | $ | (161,547 | ) | $ | (932,501 | ) | $ | 1,561,038 | |||||||
LIABILITIES AND EQUITY | |||||||||||||||||
Current liabilities: | |||||||||||||||||
Accounts payable and accrued expenses | $ | 60,323 | $ | 52,371 | (7) | $ | 3,818 | (19 | ) | $ | 116,512 | ||||||
Derivative instruments | 5,355 | — | — | 5,355 | |||||||||||||
Current portion of long-term debt, net | 891,259 | (891,259 | ) | (8) | — | — | |||||||||||
Other accrued liabilities | 7,335 | (3,760 | ) | (9) | 1,295 | (20 | ) | 4,870 | |||||||||
Total current liabilities | 964,272 | (842,648 | ) | 5,113 | 126,737 | ||||||||||||
Non-current liabilities: | |||||||||||||||||
Derivative instruments | 1,710 | — | — | 1,710 | |||||||||||||
Long-term debt | — | 400,000 | (10 | ) | — | 400,000 | |||||||||||
Other non-current liabilities | 170,979 | — | (16,915 | ) | (21 | ) | 154,064 | ||||||||||
Liabilities subject to compromise | 1,000,336 | (1,000,336 | ) | (11 | ) | — | — | ||||||||||
Equity: | |||||||||||||||||
Predecessor additional paid-in capital | 2,798,714 | (2,798,714 | ) | (12 | ) | — | — | ||||||||||
Predecessor accumulated deficit | (2,280,925 | ) | 375,159 | (13 | ) | 1,905,766 | (22 | ) | — | ||||||||
Successor preferred stock | — | 335,000 | (12 | ) | — | 335,000 | |||||||||||
Successor common stock | — | 33 | (12 | ) | — | 33 | |||||||||||
Successor additional paid-in capital | — | 3,369,959 | (12 | ) | (2,826,465 | ) | (22 | ) | 543,494 | ||||||||
Total equity | 517,789 | 1,281,437 | (920,699 | ) | 878,527 | ||||||||||||
Total liabilities and equity | $ | 2,655,086 | $ | (161,547 | ) | $ | (932,501 | ) | $ | 1,561,038 | |||||||
128
BERRY CORPORATION (bry)
NOTES TO CONSOLIDATED FINANCIAL STATEMENTS (Continued)
NOTES TO CONSOLIDATED FINANCIAL STATEMENTS (Continued)
__________
Reorganization Adjustments:
(1) | Represent amounts recorded as of the Effective Date for the implementation of the Plan, including, among other items, settlement of the Predecessor’s liabilities subject to compromise, repayment of certain of the Predecessor’s debt, cancellation of the Predecessor’s equity, issuances of the Successor’s common stock and preferred stock, proceeds received from the Berry Rights Offerings and issuance of the Successor’s debt. |
(2) | Changes in cash and cash equivalents included the following: |
(in thousands) | |||
Borrowings under the Emergence Credit Facility | $ | 400,000 | |
Proceeds from issuance of preferred stock pursuant the Berry Rights Offerings | 335,000 | ||
Cash receipt from Linn Energy, LLC for ad valorem taxes | 23,366 | ||
Removal of restriction on cash balance (includes $128 previously recorded as short term) | 197,942 | ||
Payment to the holders of claims under the Pre-Emergence Credit Facility (including $29 in bank fees and $3,760 in interest) | (897,663) | ||
Payment of professional fees | (992) | ||
Payment of Emergence Credit Facility fee that was capitalized | (151) | ||
Funding of the general unsecured claims Cash Distribution Pool | (35,000) | ||
Funding of the professional fees escrow account | (17,860) | ||
Changes in cash and cash equivalents | $ | 4,642 | |
(3) | Collection of overpayment to Linn Energy, LLC for ad valorem taxes. |
(4) | Primarily reflects the transfer to restricted cash to fund the Predecessor’s professional fees escrow account and general unsecured claims Cash Distribution Pool. |
(5) | Primarily reflects the write-off of the Predecessor’s deferred financing fees. |
(6) | Reflects the capitalization of deferred financing fees related to the Emergence Credit Facility. |
(7) | Net increase in accounts payable and accrued expenses reflects: |
(in thousands) | |||
Recognition of payables for the general unsecured claims Cash Distribution Pool | $ | 35,000 | |
Recognition of payables for the professional fees escrow account | 17,860 | ||
Recognition of payable for ad valorem tax liability | 7,666 | ||
Net change of other professional fees payable | (8,161) | ||
Other | 6 | ||
Net increase in accounts payable and accrued expenses | $ | 52,371 | |
(8) | Reflects the repayment of the Pre-Emergence Credit Facility. |
(9) | Reflects the payment of accrued interest on the Pre-Emergence Credit Facility. |
(10) | Reflects borrowings under the Emergence Credit Facility. |
(11) | Settlement of liabilities subject to compromise and the resulting net gains were determined as follows: |
(in thousands) | |||
Accounts payable and accrued expenses | $ | 151,298 | |
Accrued interest payable | 15,238 | ||
Debt | 833,800 | ||
Total liabilities subject to compromise | 1,000,336 | ||
Funding of the general unsecured claims Cash Distribution Pool | (35,000) | ||
Common stock to holders of Unsecured Notes and general unsecured creditors | (543,562) | ||
Gains on settlement of liabilities subject to compromise | $ | 421,774 | |
(12) | Net increase in capital accounts reflects: |
129
BERRY CORPORATION (bry)
NOTES TO CONSOLIDATED FINANCIAL STATEMENTS (Continued)
NOTES TO CONSOLIDATED FINANCIAL STATEMENTS (Continued)
(in thousands) | |||
Common stock to holders of Unsecured Notes and general unsecured creditors | $ | 543,562 | |
Payment of issuance costs | (35) | ||
Dividend related to beneficial conversion feature of preferred stock | 27,751 | ||
Cancellation of the Predecessor’s additional paid-in capital | 2,798,714 | ||
Par value of common stock | (33) | ||
Change in additional paid-in capital | 3,369,959 | ||
Proceeds from issuance of preferred stock | 335,000 | ||
Par value of common stock | 33 | ||
Predecessor’s additional paid-in capital | (2,798,714) | ||
Net increase in capital accounts | $ | 906,278 | |
See Note 6 for additional information on the issuances and distributions of the Successor’s common and preferred stock.
(13) | Net decrease in accumulated deficit reflects: |
(in thousands) | |||
Recognition of gains on settlement of liabilities subject to compromise | $ | 421,774 | |
Recognition of professional fees | (13,667) | ||
Write-off of deferred financing fees | (5,197) | ||
Total reorganization items, net | 402,910 | ||
Dividend related to beneficial conversion feature of preferred stock | (27,751 | ) | |
Net decrease in accumulated deficit | $ | 375,159 | |
Fresh-Start Adjustments:
(14) | Reflects a change in accounting policy from the entitlements method to the sales method for natural gas production imbalances. |
(15) | Primarily reflects an increase in the current portion of greenhouse gas allowances. |
(16) | Reflects a decrease of oil and natural gas properties, based on the methodology discussed in Note 2, and the elimination of accumulated depletion and amortization. The following table summarizes the components of oil and natural gas properties as of the Effective Date: |
Berry Corp. (Successor) | Berry LLC (Predecessor) | |||||||
Fair Value | Historical Book Value | |||||||
(in thousands) | ||||||||
Proved properties | $ | 712,400 | $ | 4,266,843 | ||||
Unproved properties | 531,200 | 764,655 | ||||||
Total proved and unproved properties | 1,243,600 | 5,031,498 | ||||||
Less accumulated depletion and amortization | — | (2,814,999 | ) | |||||
Total proved and unproved properties, net | $ | 1,243,600 | $ | 2,216,499 | ||||
(17) | Reflects a decrease of other property and equipment and the elimination of accumulated depreciation. The following table summarizes the components of other property and equipment as of the Effective Date: |
130
BERRY CORPORATION (bry)
NOTES TO CONSOLIDATED FINANCIAL STATEMENTS (Continued)
NOTES TO CONSOLIDATED FINANCIAL STATEMENTS (Continued)
Berry Corp. (Successor) | Berry LLC (Predecessor) | |||||||
Fair Value | Historical Book Value | |||||||
(in thousands) | ||||||||
Natural gas plants and pipelines | $ | 91,427 | $ | 109,675 | ||||
Land | 8,262 | 201 | ||||||
Furniture and office equipment | 5,040 | 3,879 | ||||||
Buildings and leasehold improvements | 2,740 | 5,884 | ||||||
Vehicles | 1,156 | 4,542 | ||||||
Drilling and other equipment | 178 | 198 | ||||||
Total other property and equipment | 108,803 | 124,379 | ||||||
Less accumulated depreciation | — | (22,107 | ) | |||||
Total other property and equipment, net | $ | 108,803 | $ | 102,273 | ||||
In estimating the fair value of other property and equipment, we used a combination of cost and market approaches. A cost approach was used to value our natural gas plants and pipelines, buildings, and furniture and office equipment based on current replacement costs of the assets less depreciation based on the estimated economic useful lives of the assets and age of the assets. A market approach was used to value our vehicles, drilling and other equipment, and land, using recent transactions of similar assets to determine the fair value from a market participant perspective.
(18) | Primarily reflects an increase in greenhouse gas allowances of approximately $30 million and a joint venture investment of approximately $1 million. Greenhouse gas allowances were valued using a market approach based on trading prices for carbon credits on February 28, 2017. Our joint venture investment was valued based on a market approach using a market EBITDA multiple. |
(19) | Reflects increases for greenhouse gas emissions liabilities of approximately $4 million and a change in accounting policy from the entitlements method to the sales method for gas production imbalances of approximately $200,000, partially offset by a decrease for the current portion of intangibles liabilities of approximately $500,000. |
(20) | Reflects an increase of the current portion of asset retirement obligations. |
(21) | Primarily reflects a decrease for asset retirement obligations of approximately $30 million and for intangible liabilities of approximately$6 million, partially offset by an increase for greenhouse gas emissions liabilities of approximately $19 million. The fair value of asset retirement obligations was estimated using valuation techniques that convert future cash flows to a single discounted amount. Significant inputs to the valuation include estimates of: (i) plugging and abandonment costs per well based on existing regulatory requirements; (ii) remaining life per well; (iii) future inflation factors; and (iv) a credit-adjusted risk-free interest rate. The intangible liabilities identified on the Effective Date were valued based on a combination of market and incomes approaches and will be amortized over the remaining life of the respective contract. Greenhouse gas emissions liabilities were valued using a market approach based on trading prices for greenhouse gas allowances on February 28, 2017. |
(22) | Reflects the cumulative impact of the fresh-start accounting adjustments discussed above and the elimination of the Predecessor’s accumulated deficit. |
131
BERRY CORPORATION (bry)
SUPPLEMENTAL QUARTERLY FINANCIAL DATA
(Unaudited)
Berry Corp. (Successor) | |||||||||||||||
Quarters Ended | |||||||||||||||
March 31 | June 30 | September 30 | December 31 | ||||||||||||
(in thousands, except per share amounts) | |||||||||||||||
2019: | |||||||||||||||
Oil, natural gas and natural gas liquid sales | $ | 131,102 | $ | 136,908 | $ | 141,250 | $ | 156,336 | |||||||
Electricity sales | $ | 9,729 | $ | 5,364 | $ | 7,460 | $ | 6,844 | |||||||
(Losses) gains on oil derivatives | $ | (65,239 | ) | $ | 27,276 | $ | 45,509 | $ | (45,544 | ) | |||||
Marketing revenues | $ | 830 | $ | 414 | $ | 413 | $ | 437 | |||||||
Other revenues | $ | 117 | $ | 104 | $ | 40 | $ | 55 | |||||||
Total expenses(2) | $ | 114,853 | $ | 116,886 | $ | 113,008 | $ | 173,089 | |||||||
Total other (expenses) income | $ | (8,651 | ) | $ | (8,961 | ) | $ | (8,674 | ) | $ | (7,868 | ) | |||
Reorganization items, net, (income) expense | $ | (231 | ) | $ | (26 | ) | $ | (170 | ) | $ | — | ||||
Net (loss) income | $ | (34,098 | ) | $ | 31,972 | $ | 52,649 | $ | (6,984 | ) | |||||
Net (loss) income attributable to common stockholders | $ | (34,098 | ) | $ | 31,972 | $ | 52,649 | $ | (6,984 | ) | |||||
(Loss) earnings per share attributable to common stockholders: | |||||||||||||||
Basic(1) | $ | (0.42 | ) | $ | 0.39 | $ | 0.65 | $ | (0.09 | ) | |||||
Diluted(1) | $ | (0.42 | ) | $ | 0.39 | $ | 0.65 | $ | (0.09 | ) | |||||
Berry Corp. (Successor) | |||||||||||||||
Quarters Ended | |||||||||||||||
March 31 | June 30 | September 30 | December 31 | ||||||||||||
(in thousands) | |||||||||||||||
2018: | |||||||||||||||
Oil, natural gas and natural gas liquid sales | $ | 125,624 | $ | 137,385 | $ | 147,004 | $ | 142,861 | |||||||
Electricity sales | $ | 5,453 | $ | 5,971 | $ | 14,268 | $ | 9,517 | |||||||
(Losses) gains on oil derivatives | $ | (34,644 | ) | $ | (78,143 | ) | $ | (18,994 | ) | $ | 127,160 | ||||
Marketing revenues | $ | 785 | $ | 518 | $ | 486 | $ | 534 | |||||||
Other revenues | $ | 66 | $ | 251 | $ | 183 | $ | 274 | |||||||
Total expenses | $ | 91,121 | $ | 90,581 | $ | 102,530 | $ | 101,473 | |||||||
Total other (expenses) income | $ | (7,769 | ) | $ | (9,394 | ) | $ | (9,530 | ) | $ | (8,712 | ) | |||
Reorganization items, net, expense (income) | $ | 8,955 | $ | 456 | $ | 13,781 | $ | 1,498 | |||||||
Net income (loss) | $ | 6,410 | $ | (28,061 | ) | $ | 36,985 | $ | 131,768 | ||||||
Net income (loss) attributable to common stockholders | $ | 760 | $ | (33,711 | ) | $ | (49,657 | ) | $ | 131,768 | |||||
Earnings (loss) per share attributable to common stockholders: | |||||||||||||||
Basic(1) | $ | 0.02 | $ | (0.94 | ) | $ | (0.70 | ) | $ | 1.56 | |||||
Diluted(1) | $ | 0.02 | $ | (0.94 | ) | $ | (0.70 | ) | $ | 1.56 | |||||
132
BERRY CORPORATION (bry)
SUPPLEMENTAL QUARTERLY FINANCIAL DATA (Continued)
(Unaudited)
__________
(1) | In March 2019, we finalized settlement of claims from unsecured creditors, issuing approximately 2,770,000 shares. We retrospectively adjusted the weighted average shares in our earnings per share calculations for the 2,770,000 shares issued instead of the 7,080,000 shares that had been reserved. See Note 12 of our consolidated financial statements for further information. |
(2) | Total expenses for the fourth quarter of 2019 includes an impairment charge of $51 million for the Piceance gas properties in Colorado. |
133
BERRY CORPORATION (bry)
SUPPLEMENTAL OIL & NATURAL GAS DATA
(Unaudited)
(Unaudited)
The following should be read in conjunction with our Consolidated Financial Statements and Notes to Consolidated Financial Statements.
Costs Incurred in Oil and Natural Gas Property Acquisition, Exploration and Development Activities
Costs incurred in oil and natural gas property acquisition, exploration and development, whether capitalized or expensed, are presented below:
Berry Corp. (Successor) | Berry LLC (Predecessor) | |||||||||||||||
Year Ended December 31, 2019 | Year Ended December 31, 2018 | Ten Months Ended December 31, 2017 | Two Months Ended February 28, 2017 | |||||||||||||
(in thousands) | ||||||||||||||||
Property acquisition costs: | ||||||||||||||||
Proved | $ | 2,939 | $ | — | $ | 249,338 | $ | — | ||||||||
Unproved | — | — | — | — | ||||||||||||
Exploration costs | — | — | — | — | ||||||||||||
Development costs(1) | 279,954 | 143,002 | 60,381 | 4,544 | ||||||||||||
Total costs incurred | $ | 282,893 | $ | 143,002 | $ | 309,719 | $ | 4,544 | ||||||||
__________
(1) | Included in development costs for the year ended December 31, 2019 and 2018 are non-cash additions related to the estimated future asset retirement obligations of the Company's oil and gas properties of $68.1 million and $3.4 million, respectively. |
Oil and Natural Gas Capitalized Costs
Aggregate capitalized costs related to oil, natural gas and NGL production activities, support equipment and facilities, and natural gas plants and pipelines with applicable accumulated depreciation, depletion and amortization are presented below:
Berry Corp. (Successor) | |||||||
December 31, 2019 | December 31, 2018 | ||||||
(in thousands) | |||||||
Proved properties | $ | 1,465,383 | $ | 1,168,245 | |||
Unproved properties | 313,903 | 388,034 | |||||
Total proved and unproved properties | 1,779,286 | 1,556,279 | |||||
Less accumulated depreciation, depletion and amortization | (223,919 | ) | (132,587 | ) | |||
Net capitalized costs | $ | 1,555,367 | $ | 1,423,692 | |||
134
BERRY CORPORATION (bry)
SUPPLEMENTAL OIL & NATURAL GAS DATA (Continued)
(Unaudited)
(Unaudited)
Results of Oil and Natural Gas Producing Activities
The results of operations for oil, natural gas and NGL producing activities (excluding items such as corporate overhead, interest costs and reorganization items, net) are presented below:
Berry Corp. (Successor) | Berry LLC (Predecessor) | |||||||||||||||
Year Ended December 31, 2019 | Year Ended December 31, 2018 | Ten Months Ended December 31, 2017 | Two Months Ended February 28, 2017 | |||||||||||||
(in thousands) | ||||||||||||||||
Net revenues from production: | ||||||||||||||||
Oil, natural gas and NGL sales | $ | 565,596 | $ | 552,874 | $ | 357,928 | $ | 74,120 | ||||||||
Electricity sales | 29,397 | 35,208 | 21,972 | 3,655 | ||||||||||||
Other production-related revenue | 2,258 | 2,908 | 6,569 | 2,003 | ||||||||||||
Total net revenues from production | 597,251 | 590,990 | 386,469 | 79,778 | ||||||||||||
Operating costs for production: | ||||||||||||||||
Lease operating expenses | 216,294 | 188,776 | 149,599 | 28,238 | ||||||||||||
Electricity generation expenses | 19,490 | 20,619 | 14,894 | 3,197 | ||||||||||||
Transportation expenses | 8,059 | 9,860 | 19,238 | 6,194 | ||||||||||||
Production-related general and administrative expenses | 2,735 | 1,876 | 5,786 | — | ||||||||||||
Taxes, other than income taxes | 40,254 | 33,117 | 34,211 | 5,212 | ||||||||||||
Other production-related costs | 2,073 | 2,140 | 2,320 | 653 | ||||||||||||
Total operating costs for production | 288,905 | 256,388 | 226,048 | 43,494 | ||||||||||||
Other costs: | ||||||||||||||||
Depreciation, depletion and amortization | 101,816 | 81,927 | 67,051 | 26,743 | ||||||||||||
Impairment of long-lived assets | 51,081 | — | — | — | ||||||||||||
Other operating (income) expenses | 4,545 | (2,747 | ) | (22,930 | ) | — | ||||||||||
Total other costs | 157,442 | 79,180 | 44,121 | 26,743 | ||||||||||||
Pretax income (loss) | 150,904 | 255,422 | 116,300 | 9,541 | ||||||||||||
Income tax expense | 10,084 | 69,807 | 45,887 | 230 | ||||||||||||
Results of operations | $ | 140,820 | $ | 185,615 | $ | 70,412 | $ | 9,311 | ||||||||
Income tax is calculated as if the results presented above represented a stand-alone tax filing entity by applying the current federal and state statutory tax rates to the revenues after deducting costs, which include DD&A allowances, after giving effect to permanent differences. There is no federal tax provision included in the Predecessors results above because the Predecessor was not subject to federal income taxes during those periods. The income tax amount included in the Predecessor’s results above relates to Texas margin tax expense. Limited liability companies are subject to Texas margin tax. See Note 8 for additional information about income taxes.
135
BERRY CORPORATION (bry)
SUPPLEMENTAL OIL & NATURAL GAS DATA (Continued)
(Unaudited)
(Unaudited)
Proved Oil, Natural Gas and NGL Reserves
The Company's proved oil, natural gas and NGL reserve quantities and the related discounted future net cash flows before income taxes are based on estimates prepared by the independent engineering firm, DeGolyer and MacNaughton. In accordance with SEC regulations, proved reserves at December 31, 2019, December 31, 2018 and December 31, 2017 were estimated using the average price during the 12-month period, determined as an unweighted average of the first-day-of-the-month price for each month, excluding escalations based upon future conditions. An analysis of the change in the Company's net interests in estimated quantities of proved oil, natural gas, and NGL reserves, all of which are attributable to properties located in the United States, is shown below:
Year Ended December 31, 2019 | |||||||||||
Oil MBbls | NGLs MBbls | Natural Gas MMcf | Total MBoe | ||||||||
Total proved reserves: | |||||||||||
Beginning of year | 114,765 | 1,147 | 160,849 | 142,720 | |||||||
Extensions and discoveries | 13,321 | — | — | 13,321 | |||||||
Revisions of previous estimates | 10,759 | 160 | (109,323 | ) | (7,302 | ) | |||||
Purchases of minerals in place | 159 | 24 | 701 | 300 | |||||||
Sales of minerals in place | — | — | — | — | |||||||
Production | (9,231 | ) | (151 | ) | (7,412 | ) | (10,617 | ) | |||
End of year | 129,773 | 1,180 | 44,815 | 138,422 | |||||||
Proved developed reserves: | |||||||||||
Beginning of year | 73,203 | 1,047 | 76,331 | 86,971 | |||||||
End of year | 74,102 | 1,054 | 39,063 | 81,667 | |||||||
Proved undeveloped reserves: | |||||||||||
Beginning of year | 41,562 | 100 | 84,518 | 55,749 | |||||||
End of year | 55,670 | 127 | 5,752 | 56,756 | |||||||
136
BERRY CORPORATION (bry)
SUPPLEMENTAL OIL & NATURAL GAS DATA (Continued)
(Unaudited)
(Unaudited)
Year Ended December 31, 2018 | |||||||||||
Oil MBbls | NGLs MBbls | Natural Gas MMcf | Total MBoe | ||||||||
Total proved reserves: | |||||||||||
Beginning of year | 100,596 | 1,271 | 237,104 | 141,385 | |||||||
Extensions and discoveries | 21,276 | 126 | 5,762 | 22,362 | |||||||
Revisions of previous estimates | 80 | 211 | (62,141 | ) | (10,066 | ) | |||||
Purchases of minerals in place | 865 | — | — | 865 | |||||||
Sales of minerals in place | (7 | ) | (250 | ) | (10,287 | ) | (1,972 | ) | |||
Production | (8,045 | ) | (211 | ) | (9,589 | ) | (9,855 | ) | |||
End of year | 114,765 | 1,147 | 160,849 | 142,720 | |||||||
Proved developed reserves: | |||||||||||
Beginning of year | 68,490 | 1,271 | 100,384 | 86,492 | |||||||
End of year | 73,203 | 1,047 | 76,331 | 86,971 | |||||||
Proved undeveloped reserves: | |||||||||||
Beginning of year | 32,106 | — | 136,720 | 54,893 | |||||||
End of year | 41,562 | 100 | 84,518 | 55,749 | |||||||
Year Ended December 31, 2017 | |||||||||||
Oil MBbls | NGLs MBbls | Natural Gas MMcf | Total MBoe | ||||||||
Total proved reserves: | |||||||||||
Beginning of year (Predecessor) | 55,876 | 15,078 | 372,760 | 133,080 | |||||||
Revisions of previous estimates | 9,089 | 431 | 32,144 | 14,878 | |||||||
Sales of proved reserves in place | (13 | ) | (13,329 | ) | (285,168 | ) | (60,870 | ) | |||
Purchase of proved reserves in place | 24,332 | — | — | 24,332 | |||||||
Extensions and discoveries | 18,783 | — | 136,719 | 41,570 | |||||||
Production | (7,471 | ) | (909 | ) | (19,351 | ) | (11,605 | ) | |||
End of year | 100,596 | 1,271 | 237,104 | 141,385 | |||||||
Proved developed reserves: | |||||||||||
Beginning of year (Predecessor) | 55,422 | 15,078 | 372,760 | 132,626 | |||||||
End of year | 68,490 | 1,271 | 100,384 | 86,492 | |||||||
Proved undeveloped reserves: | |||||||||||
Beginning of year (Predecessor) | 454 | — | — | 454 | |||||||
End of year | 32,106 | — | 136,720 | 54,893 | |||||||
The tables above include changes in estimated quantities of natural gas reserves shown in Boe using the ratio of six Mcf to one barrel.
137
BERRY CORPORATION (bry)
SUPPLEMENTAL OIL & NATURAL GAS DATA (Continued)
(Unaudited)
(Unaudited)
Proved reserves decreased by approximately 4,298 MBoe to approximately 138,422 MBoe for the year ended December 31, 2019, from 142,720 MBoe for the year ended December 31, 2018. Extensions and discoveries, principally in our California properties, contributed 13,321 MMBoe to the overall change in proved reserves. These extensions included McKittrick steamflood expansions based on delineation wells drilled in 2019, Homebase Pliocene development, as well as expansion of our thermal Diatomite operations. The year ended December 31, 2019, includes 7,302 MBoe of negative revisions of previous estimates. Negative revisions due to price were 6,829 MMBoe and this was caused by the current commodity price environment. Performance revisions included a decrease of 13,532 MMBoe due to the impairment of our Piceance gas properties and the removal of the proved undeveloped reserves related to this impairment. However, there were positive technical revisions of 13,329 MMBoe primarily related to the improved base performance and redevelopment in our thermal Diatomite area.
Proved reserves increased by approximately 1,335 MBoe to approximately 142,720 MBoe for the year ended December 31, 2018, from 141,385 MBoe for the year ended December 31, 2017. Extensions and discoveries, principally in our California properties, most of which was thermal Diatomite, as well as in Utah, contributed 22,362 MBoe to the increase in proved reserves. The year ended December 31, 2018, includes approximately 10,066 MBoe of negative revisions of previous estimates (17,992 MBoe of negative performance-related revisions resulting from 9,411 MBoe to remove proved undeveloped reserves due to a downward adjustment of our committed capital in the Piceance basin and technical revisions of 8,581 MBoe due to a shift in the development strategy as laid out in our 5-year capital plan offset by 7,926 MBoe of positive revisions due to higher commodity prices).
Proved reserves increased by approximately 8,305 MBoe to approximately 141,385 MBoe for the year ended December 31, 2017, from 133,080 MBoe for the year ended December 31, 2016. The year ended December 31, 2017, includes approximately 14,878 MBoe of positive revisions of previous estimates due to higher commodity prices. Extensions and discoveries, contributed approximately 41,570 MBoe to the increase in proved reserves, primarily due to the certainty attained in the Company’s future commitment to capital as a result of its emergence from bankruptcy allowing inclusion of PUDs previously excluded due to the SEC five-year development limitation on PUDs, as well as from 93 productive wells drilled during the year. Lastly, the Hugoton Disposition and Hill Acquisition had a net negative impact on proved reserves of approximately 36,538 MBoe (negative impact on reserves from the Hugoton Disposition of approximately 60,870 MBoe offset by the positive impact on reserves from the Hill Acquisition of approximately 24,332 MBoe).
138
BERRY CORPORATION (bry)
SUPPLEMENTAL OIL & NATURAL GAS DATA (Continued)
(Unaudited)
(Unaudited)
Standardized Measure of Discounted Future Net Cash Flows
Information with respect to the standardized measure of discounted future net cash flows relating to proved reserves is summarized below. Future cash inflows are computed by applying applicable prices relating to the Company’s proved reserves to the year-end quantities of those reserves. Future production, development, site restoration and abandonment costs are derived based on current costs assuming continuation of existing economic conditions. See Note 8 for additional information about income taxes.
Berry Corp. (Successor) | |||||||||||
December 31, 2019 | December 31, 2018 | December 31, 2017 | |||||||||
(in thousands, except for prices) | |||||||||||
Future cash inflows | $ | 7,788,647 | $ | 8,119,309 | $ | 5,580,448 | |||||
Future production costs | (3,623,688 | ) | (3,357,149 | ) | (2,725,548 | ) | |||||
Future development costs | (1,106,333 | ) | (884,055 | ) | (678,312 | ) | |||||
Future income tax expenses(1) | (587,487 | ) | (757,470 | ) | (365,330 | ) | |||||
Future net cash flows | 2,471,139 | 3,120,635 | 1,811,258 | ||||||||
10% annual discount for estimated timing of cash flows | (1,005,002 | ) | (1,359,089 | ) | (833,910 | ) | |||||
Standardized measure of discounted future net cash flows | $ | 1,466,137 | $ | 1,761,546 | $ | 977,348 | |||||
Representative prices:(2) | |||||||||||
Brent Oil (Bbl) | $ | 63.15 | $ | 71.54 | $ | 54.42 | |||||
Henry Hub Natural gas (MMBtu) | $ | 2.62 | $ | 3.10 | $ | 2.98 | |||||
__________
(1) | Future income tax expenses are based on current statutory rates, adjusted for the tax basis of oil and gas properties and applicable tax credits, deductions and allowances. |
(2) | In accordance with SEC regulations, reserves were estimated using the average price during the 12-month period, determined as an unweighted average of the first-day-of-the-month price for each month, excluding escalations based upon future conditions. The average price used to estimate reserves is held constant over the life of the reserves. |
139
BERRY CORPORATION (bry)
SUPPLEMENTAL OIL & NATURAL GAS DATA (Continued)
(Unaudited)
(Unaudited)
The following table summarizes the changes in the standardized measure of discounted future net cash flows:
Berry Corp. (Successor) | |||||||||||
December 31, 2019 | December 31, 2018 | December 31, 2017 | |||||||||
(in thousands) | |||||||||||
Standardized measure—beginning of year | $ | 1,761,546 | $ | 977,348 | $ | 596,222 | |||||
Net change in sales and transfer prices and production costs related to future production | (309,347 | ) | 818,705 | 224,064 | |||||||
Changes in estimated future development costs | (120,688 | ) | 35,313 | 6,399 | |||||||
Sales and transfers of oil, natural gas and NGLs produced during the period | (300,261 | ) | (321,148 | ) | (189,355 | ) | |||||
Net change due to extensions, discoveries and improved recovery | 180,825 | 363,450 | 157,717 | ||||||||
Purchase of minerals in place | 2,649 | 5,240 | 317,616 | ||||||||
Sales of minerals in place | — | (5,593 | ) | (141,998 | ) | ||||||
Net change due to revisions in quantity estimates | (124,110 | ) | (175,947 | ) | 124,609 | ||||||
Previously estimated development costs incurred during the period | 116,921 | 78,803 | 6,913 | ||||||||
Accretion of discount | 215,153 | 111,416 | 59,622 | ||||||||
Changes in production rates and other | (5,939 | ) | 127,135 | (47,651 | ) | ||||||
Net change in income taxes | 49,388 | (253,176 | ) | (136,810 | ) | ||||||
Net increase (decrease) | (295,409 | ) | 784,198 | 381,126 | |||||||
Standardized measure—end of year | $ | 1,466,137 | $ | 1,761,546 | $ | 977,348 | |||||
The standardized measure of discounted future net cash flows is not intended to represent the replacement cost or fair value of the Company's oil and gas properties. The data presented should not be viewed as representing the expected cash flow from, or current value of, existing proved reserves since the computations are based on a large number of estimates and assumptions. The required projection of production and related expenditures over time requires further estimates with respect to pipeline availability, rates of demand and governmental control. Actual future prices and costs are likely to be substantially different from the current prices and costs utilized in the computation of reported amounts. Any analysis or evaluation of the reported amounts should give specific recognition to the computational methods utilized and the limitations inherent therein.
140
The following table summarizes the average sales price and production costs:
Berry Corp. (Successor) | Berry LLC (Predecessor) | |||||||||||||||
Year Ended December 31, 2019 | Year Ended December 31, 2018 | Ten Months Ended December 31, 2017 | Two Months Ended February 28, 2017 | |||||||||||||
Weighted-average realized prices: | ||||||||||||||||
Oil without hedges (Bbl) | $ | 58.93 | $ | 64.76 | $ | 48.05 | $ | 46.94 | ||||||||
Natural gas (Mcf) | $ | 2.66 | $ | 2.74 | $ | 2.70 | $ | 3.42 | ||||||||
NGLs (Bbl) | $ | 17.02 | $ | 26.74 | $ | 22.23 | $ | 18.20 | ||||||||
Production costs (per Boe): | ||||||||||||||||
Lease operating expenses | $ | 20.42 | $ | 19.16 | $ | 15.84 | $ | 13.06 | ||||||||
141
Item 9. Changes in and Disagreements with Accountants on Accounting and Financial Disclosure
None.
Item 9A. Controls and Procedures
Evaluation of Disclosure Controls and Procedures
In accordance with Exchange Act Rules 13a-15 and 15d-15, our President and Chief Executive Officer and our Executive Vice President and Chief Financial Officer supervised and participated in our evaluation of our disclosure controls and procedures (as defined in Rules 13a-15(e) and 15d-15(e) under the Exchange Act) as of December 31, 2019. Our disclosure controls and procedures are designed to provide reasonable assurance that the information required to be disclosed by us in reports that we file under the Exchange Act is accumulated and communicated to our management, including our principal executive officer and principal financial officer, as appropriate, to allow timely decisions regarding required disclosure and is recorded, processed, summarized and reported within the time periods specified in the rules and forms of the SEC. Based upon that evaluation, our principal executive officer and principal financial officer concluded that our disclosure controls and procedures were effective as of December 31, 2019 at the reasonable assurance level.
Management’s Annual Report on Internal Control Over Financial Reporting and Attestation Report of the Registered Public Accounting Firm
Our management, including our principal executive officer and principal financial officer, is responsible for establishing and maintaining adequate internal control over financial reporting as defined in Rules 13a-15(f) under the Exchange Act. Our internal control over financial reporting is designed to provide reasonable assurance regarding the reliability of financial reporting and the preparation of our consolidated financial statements for external purposes in accordance with GAAP.
Because of its inherent limitations, internal control over financial reporting may not prevent or detect misstatements. Also, projections of any evaluation of the effectiveness to future periods are subject to the risk that controls may become inadequate because of changes in conditions, or that the degree of compliance with the policies or procedures may deteriorate.
Our management assessed the effectiveness of the Company's internal control over financial reporting as of December 31, 2019, using the criteria in Internal Control-Integrated Framework (2013) issued by the Committee of Sponsoring Organizations of the Treadway Commission ("COSO"). Based on this evaluation, our management concluded that our internal control over financial reporting was effective as of December 31, 2019.
Management’s report was not subject to attestation by our independent registered public accounting firm pursuant to rules of the Securities and Exchange Commission that permit us to provide only management’s report in this Annual Report on Form 10-K. Therefore, this Annual Report on Form 10-K does not include such an attestation.
Changes in the Company’s Internal Control Over Financial Reporting
The Company’s management is responsible for establishing and maintaining adequate internal control over financial reporting, as defined in Rules 13a-15(f) and 15d-15(f) of the Exchange Act. There have been no changes in the Company’s internal control over financial reporting during the quarter ended December 31, 2019 that materially affected, or were reasonably likely to materially affect, the Company’s internal control over financial reporting.
142
Item 9B. Other Information
Amended and Restated Employment Agreement with Arthur T. Smith
On February 26, 2020, the Compensation Committee of our Board of Directors approved an amended and restated employment agreement to be entered into by Berry LLC, a wholly-owned subsidiary of Berry Corp., with our Chief Executive Officer, Arthur T. “Trem” Smith (the “Amended Agreement”), to replace and supersede Mr. Smith’s previous employment agreement with the Company (the “Prior Agreement”). The Amended Agreement will become effective as of March 1, 2020, subject to Mr. Smith’s continued employment through that date.
The Amended Agreement modifies certain terms of the Prior Agreement, including the following:
• | The initial term of the Amended Agreement is three years, with automatic one-year extensions on each anniversary of the effective date, unless either party gives notice of non-renewal at least 60 days prior to the such anniversary date. |
• | Mr. Smith’s base salary remains $650,000, which will be reviewed at least annually by the Board of Directors (or a committee thereof) and may be increased, but not decreased without Mr. Smith’s consent; provided, however, that Mr. Smith’s consent will not be required on a determination by the Board (or a committee thereof) that a decrease of no more than 10% is necessary and appropriate, and such decreases are part of similar reductions applicable to the Company’s similarly situated executive officers. |
• | Mr. Smith is eligible to receive an annual equity award in an amount and under terms to be determined in the sole discretion of the Board of Directors (or a committee thereof). It is contemplated that the amount will be equal to but not less than three times the sum of Mr. Smith’s base salary and target bonus amount for the applicable year, but ultimately subject to determination in the sole discretion of the Board of Directors (or a committee thereof). |
• | Mr. Smith must give 90 days’ notice in the event he voluntarily resigns from employment. |
• | Upon a termination of Mr. Smith’s employment under certain circumstances, including termination without Cause (as defined in the Amended Agreement) by the Company, his voluntary resignation on the basis of Good Reason (as defined in the Amended Agreement), his death or disability, he is eligible to receive, among other payments and benefits, severance in an amount equal to two times (or, if such termination occurs within 12 months following a Sale of Berry (as defined in the Amended Agreement), three times) the sum of Mr. Smith’s base salary and target annual bonus amount for the year of termination, plus an additional cash payment to cover health insurance premiums in certain circumstances. |
All other material terms contained in the Prior Agreement remains substantially unchanged in the Amended Agreement. A copy of the Amended Agreement is filed as Exhibit 10.13 to this Annual Report on Form 10-K and is incorporated herein by reference. The description of the material changes to the Prior Agreement contained herein is qualified in its entirety by reference to the full text of the Amended Agreement.
Employment Agreement with Danielle Hunter
Effective January 28, 2020, the Board of Directors appointed Danielle Hunter to the office of Executive Vice President, General Counsel and Corporate Secretary. In connection with her appointment as an executive officer, the Board approved entry into a definitive employment agreement to be entered into by Berry LLC, a wholly-owned subsidiary of Berry Corp., with Ms. Hunter. A copy of the employment agreement is filed as Exhibit 10.11 to this Annual Report on Form 10-K and is incorporated herein by reference.
143
Employment Agreement with Megan Silva
Effective February 4, 2020, the Board of Directors appointed Megan Silva to the office of Executive Vice President, Corporate Affairs. In connection with her appointment as an executive officer, the Board approved entry into a definitive employment agreement to be entered into by Berry LLC, a wholly-owned subsidiary of Berry Corp., with Ms. Silva. A copy of the employment agreement is filed as Exhibit 10.13 to this Annual Report on Form 10-K and is incorporated herein by reference.
Part III
Item 10. Directors, Executive Officers and Corporate Governance
The information required by this Item 10 is incorporated herein by reference to our definitive Proxy Statement, for the 2020 Annual Meeting of Stockholders, to be filed with the SEC pursuant to Regulation 14A within 120 days of December 31, 2019.
Our board of directors has adopted a code of business conduct applicable to all officers, directors and employees, which is available on our website (www.ir.berrypetroleum.com/corporate-governance). We intend to satisfy the disclosure requirement under Item 5.05 of Form 8-K regarding amendment to, or waiver from, a provision of our code of business conduct by posting such information on our website at the address specified above.
Item 11. Executive Compensation
The information required by this Item 11 is incorporated herein by reference to our definitive Proxy Statement, for the 2020 Annual Meeting of Stockholders, to be filed with the SEC pursuant to Regulation 14A within 120 days of December 31, 2019.
Item 12. Security Ownership of Certain Beneficial Owners and Management
The information required by this Item 12 is incorporated herein by reference to our definitive Proxy Statement, for the 2020 Annual Meeting of Stockholders, to be filed with the SEC pursuant to Regulation 14A within 120 days of December 31, 2019.
Item 13. Certain Relationships and Related Transactions and Director Independence
The information required by this Item 13 is incorporated herein by reference to our definitive Proxy Statement, for the 2020 Annual Meeting of Stockholders, to be filed with the SEC pursuant to Regulation 14A within 120 days of December 31, 2019.
Item 14. Principal Accounting Fees and Services
The information required by this Item 14 is incorporated herein by reference to our definitive Proxy Statement, for the 2020 Annual Meeting of Stockholders, to be filed with the SEC pursuant to Regulation 14A within 120 days of December 31, 2019.
144
Part IV
Item 15. Exhibits
Exhibit Number | Description | |
2.1 | ||
3.1* | ||
3.2* | ||
3.3 | ||
3.4 | ||
4.1 | ||
4.2 | ||
4.3 | ||
4.4* | ||
10.1 | ||
10.2 | ||
10.3 | ||
10.4 | ||
10.5† | ||
10.6† | ||
10.7† | ||
10.8† | ||
10.9† | ||
10.10† | ||
145
Exhibit Number | Description | |
10.11†* | ||
10.12†* | ||
10.13†* | ||
10.14† | ||
10.15† | ||
10.16† | ||
10.17† | ||
10.18† | ||
10.19† | ||
10.20† | ||
10.21† | ||
10.22† | ||
10.23† | ||
10.24† | ||
10.25† | ||
10.26† | ||
10.27 | ||
10.28 | ||
146
Exhibit Number | Description | |
10.29 | ||
10.30 | ||
10.31 | ||
10.32 | ||
10.33 | ||
10.34 | ||
21.1* | ||
23.1* | ||
23.2* | ||
31.1* | ||
31.2* | ||
32.1* | ||
99.1* | ||
101.INS* | XBRL Instance Document | |
101.SCH* | XBRL Taxonomy Extension Schema Document | |
101.CAL* | XBRL Taxonomy Extension Calculation Linkbase Document | |
101.DEF* | XBRL Taxonomy Extension Definition Linkbase Document | |
101.LAB* | XBRL Taxonomy Extension Label Linkbase Data Document | |
101.PRE* | XBRL Taxonomy Extension Presentation Linkbase Document | |
__________
(*) | Filed herewith. |
(†) Indicates a management contract or compensatory plan or arrangement.
Item 16. Form 10-K Summary
Not applicable.
147
GLOSSARY OF COMMONLY USED TERMS
The following are abbreviations and definitions of certain terms used in this report, which are commonly used in the oil and natural gas industry:
"Absolute TSR" means absolute total stockholder return.
"AROs" means asset retirement obligations.
“Adjusted EBITDA” is a non-GAAP financial measure defined as earnings before interest expense; income taxes; depreciation, depletion, and amortization; derivative gains or losses net of cash received or paid for scheduled derivative settlements; impairments; stock compensation expense; and other unusual, out-of-period and infrequent items, including gains and losses on sale of assets, restructuring costs and reorganization items.
“Adjusted G&A” or “Adjusted General and Administrative Expenses” is a non-GAAP financial measure defined as general and administrative expenses adjusted for restructuring and other non-recurring costs and non-cash stock compensation expense.
“Adjusted Net Income (Loss)” is a non-GAAP financial measure defined as net income (loss) adjusted for derivative gains or losses net of cash received or paid for scheduled derivative settlements, other unusual, out-of-period and infrequent items, including restructuring costs and reorganization items and the income tax expense or benefit of these adjustments using our effective tax rate.
“API” gravity means the relative density, expressed in degrees, of petroleum liquids based on a specific gravity scale developed by the American Petroleum Institute.
“basin” means a large area with a relatively thick accumulation of sedimentary rocks.
“Bbl” means one stock tank barrel, or 42 U.S. gallons liquid volume, used in reference to oil or other liquid hydrocarbons.
“Bcf” means one billion cubic feet, which is a unit of measurement of volume for natural gas.
“BLM” means for the U.S. Bureau of Land Management.
“Boe” means barrel of oil equivalent, determined using the ratio of one Bbl of oil, condensate or natural gas liquids to six Mcf of natural gas.
“Boe/d” means Boe per day.
“Break even” means the Brent price at which we expect to generate positive Levered Free Cash Flow.
“Brent” means the reference price paid in U.S. dollars for a barrel of light sweet crude oil produced from the Brent field in the UK sector of the North Sea.
“Btu” means one British thermal unit—a measure of the amount of energy required to raise the temperature of a one-pound mass of water one degree Fahrenheit at sea level.
“CAA” is an abbreviation for the Clean Air Act, which governs air emissions.
“CalGEM” is an abbreviation for the California Geologic Energy Management Division.
148
“Cap-and-trade” is a statewide program in California established by the Global Warming Solutions Act of 2006 which outlined an enforceable compliance obligation beginning with 2013 GHG emissions and currently extended through 2030.
“CARB” is an abbreviation for the California Air Resources Board.
“CCA” or “CCAs” is an abbreviation for California carbon allowances.
“CERCLA” is an abbreviation for the Comprehensive Environmental Response, Compensation and Liability Act, which imposes liability where hazardous substances have been released into the environment (commonly known as “Superfund”).
“Clean Water Rule” refers to the rule issued in August 2015 by the EPA and U.S. Army Corps of Engineers which expanded the scope of the federal jurisdiction over wetlands and other types of waters.
"COGCC" is an abbreviation for the Colorado Oil and Gas Conservation Commission.
“Completion” means the installation of permanent equipment for the production of oil or natural gas.
“Condensate” means a mixture of hydrocarbons that exists in the gaseous phase at original reservoir temperature and pressure, but that, when produced, is in the liquid phase at surface pressure and temperature.
“CPUC” is an abbreviation for the California Public Utilities Commission.
“CWA” is an abbreviation for the Clean Water Act, which governs discharges to and excavations within the waters of the United States.
“DD&A” means depreciation, depletion & amortization.
“Development drilling” or “Development well” means a well drilled to a known producing formation in a previously discovered field, usually offsetting a producing well on the same or an adjacent oil and natural gas lease.
“Diatomite” means a sedimentary rock composed primarily of siliceous, diatom shells.
“Differential” means an adjustment to the price of oil or natural gas from an established spot market price to reflect differences in the quality and/or location of oil or natural gas.
“DOGGR” is an abbreviation for the Division of Oil, Gas, and Geothermal Resources of the California Department of Conservation.
“Downspacing” means additional wells drilled between known producing wells to better develop the reservoir.
"EH&S" is an abbreviation for Environmental, Health & Safety.
“Enhanced oil recovery” means a technique for increasing the amount of oil that can be extracted from a field.
“EOR” means enhanced oil recovery.
“EPA” is an abbreviation for the United States Environmental Protection Agency.
"EPS" is an abbreviation for earnings per share.
“ESA” is an abbreviation for the federal Endangered Species Act.
149
“Exploration activities” means the initial phase of oil and natural gas operations that includes the generation of a prospect or play and the drilling of an exploration well.
“FASB” is an abbreviation for the Financial Accounting Standards Board.
“FERC” is an abbreviation for the Federal Energy Regulatory Commission.
“Field” means an area consisting of a single reservoir or multiple reservoirs all grouped on or related to the same individual geological structural feature or stratigraphic condition.
"FIP" is an abbreviation for Federal Implementation Plan.
“Formation” means a layer of rock which has distinct characteristics that differ from those of nearby rock.
“Fracturing” means mechanically inducing a crack or surface of breakage within rock not related to foliation or cleavage in metamorphic rock in order to enhance the permeability of rocks by connecting pores together.
“GAAP” is an abbreviation for U.S. generally accepted accounting principles.
“Gas” or “Natural gas” means the lighter hydrocarbons and associated non-hydrocarbon substances occurring naturally in an underground reservoir, which under atmospheric conditions are essentially gases but which may contain liquids.
“GHG” or “GHGs” is an abbreviation for greenhouse gases.
“Gross Acres” or “Gross Wells” means the total acres or wells, as the case may be, in which we have a working interest.
“Held by production” means acreage covered by a mineral lease that perpetuates a company’s right to operate a property as long as the property produces a minimum paying quantity of oil or natural gas.
“Henry Hub” is a distribution hub on the natural gas pipeline system in Erath, Louisiana.
“Hydraulic fracturing” means a procedure to stimulate production by forcing a mixture of fluid and proppant (usually sand) into the formation under high pressure. This creates artificial fractures in the reservoir rock, which increases permeability.
“Horizontal drilling” means a wellbore that is drilled laterally.
“ICE” means Intercontinental Exchange.
“Infill drilling” means drilling of an additional well or wells at less than existing spacing to more adequately drain a reservoir.
“Injection Well” means a well in which water, gas or steam is injected, the primary objective typically being to maintain reservoir pressure and/or improve hydrocarbon recovery.
“IOR” means improved oil recovery.
"IPO" is an abbreviation for initial public offering.
"LCFS" is an abbreviation for low carbon fuel standard.
150
“Leases” means full or partial interests in oil or gas properties authorizing the owner of the lease to drill for, produce and sell oil and natural gas in exchange for any or all of rental, bonus and royalty payments. Leases are generally acquired from private landowners (fee leases) and from federal and state governments on acreage held by them.
“Levered Free Cash Flow” is a non-GAAP financial measure defined as Adjusted EBITDA less interest expense, dividends and capital expenditures.
"LIBOR" is an abbreviation for London Interbank Offered Rate.
“MBbl” means one thousand barrels of oil, condensate or NGLs.
“MBbl/d” means MBbl per day.
“MBoe” means one thousand barrels of oil equivalent.
“MBoe/d” means MBoe per day.
“Mcf” means one thousand cubic feet, which is a unit of measurement of volume for natural gas.
“MMBbl” means one million barrels of oil, condensate or NGLs.
“MMBoe” means one million barrels of oil equivalent.
“MMBtu” means one million Btus.
“MMcf” means one million cubic feet, which is a unit of measurement of volume for natural gas.
“MMcf/d” means MMcf per day.
"MTBA" is an abbreviation for Migratory Bird Treaty Act.
“MW” means megawatt.
"MWHs" means megawatt hours.
“NAAQS” is an abbreviation for the National Ambient Air Quality Standard.
"NASDAQ" means Nasdaq Global Select Market.
“NEPA” is an abbreviation for the National Environmental Policy Act, which requires careful evaluation of the environmental impacts of oil and natural gas production activities on federal lands.
“Net Acres” or “Net Wells” is the sum of the fractional working interests owned in gross acres or wells, as the case may be, expressed as whole numbers and fractions thereof.
“Net revenue interest” means all of the working interests, less all royalties, overriding royalties, non-participating royalties, net profits interest or similar burdens on or measured by production from oil and natural gas.
“NGA” is an abbreviation for the Natural Gas Act.
“NGL” or “NGLs” means natural gas liquids, which are the hydrocarbon liquids contained within natural gas.
"NRI" is an abbreviation for net revenue interest.
151
“NYMEX” means New York Mercantile Exchange.
“Oil” means crude oil or condensate.
“OPEC” is an abbreviation for the Organization of the Petroleum Exporting Countries.
“Operator” means the individual or company responsible to the working interest owners for the exploration, development and production of an oil or natural gas well or lease.
“OSHA” is an abbreviation for the Occupational Safety and Health Act of 1970.
"OTC" means over-the-counter
"PALs" is an abbreviation for project approval letters.
“PCAOB” is an abbreviation for the Public Company Accounting Oversight Board.
“PDNP” is an abbreviation for proved developed non-producing.
“PDP” is an abbreviation for proved developed producing.
“Permeability” means the ability, or measurement of a rock’s ability, to transmit fluids.
“PHMSA” is an abbreviation for the U.S. Department of Transportation’s Pipeline and Hazardous Materials Safety Administration.
“Play” means a regionally distributed oil and natural gas accumulation. Resource plays are characterized by continuous, aerially extensive hydrocarbon accumulations.
“PPA” is an abbreviation for power purchase agreement.
“Production costs” means costs incurred to operate and maintain wells and related equipment and facilities, including depreciation and applicable operating costs of support equipment and facilities and other costs of operating and maintaining those wells and related equipment and facilities. For a complete definition of production costs, refer to the SEC’s Regulation S-X, Rule 4-10(a)(20).
“Productive well” means a well that is producing oil, natural gas or NGLs or that is capable of production.
“Proppant” means sized particles mixed with fracturing fluid to hold fractures open after a hydraulic fracturing treatment.
“Prospect” means a specific geographic area which, based on supporting geological, geophysical or other data and also preliminary economic analysis using reasonably anticipated prices and costs, is deemed to have potential for the discovery of commercial hydrocarbons.
“Proved developed reserves” means reserves that can be expected to be recovered through existing wells with existing equipment and operating methods.
“Proved developed producing reserves” means reserves that are being recovered through existing wells with existing equipment and operating methods.
“Proved reserves” means the estimated quantities of oil, gas and gas liquids, which, by analysis of geoscience and engineering data, can be estimated with reasonable certainty to be economically producible from a given date forward, from known reservoirs, and under existing economic conditions, operating methods, and government regulations prior
152
to the time at which contracts providing the right to operate expire, unless evidence indicates that renewal is reasonably certain, regardless of whether deterministic or probabilistic methods are used for the estimation. The project to extract the hydrocarbons must have commenced or the operator must be reasonably certain that it will commence the project within a reasonable time.
“Proved undeveloped drilling location” means a site on which a development well can be drilled consistent with spacing rules for purposes of recovering proved undeveloped reserves.
“Proved undeveloped reserves” or “PUDs” means proved reserves that are expected to be recovered from new wells on undrilled acreage, or from existing wells where a relatively major expenditure is required for recompletion. Reserves on undrilled acreage are limited to those directly offsetting development spacing areas that are reasonably certain of production when drilled, unless evidence using reliable technology exists that establishes reasonable certainty of economic producibility at greater distances. Undrilled locations can be classified as having proved undeveloped reserves only if a development plan has been adopted indicating that they are scheduled to be drilled within five years, unless the specific circumstances justify a longer time. Estimates for proved undeveloped reserves are not attributed to any acreage for which an application of fluid injection or other improved recovery technique is contemplated, unless such techniques have been proved effective by actual projects in the same reservoir or an analogous reservoir, or by other evidence using reliable technology establishing reasonable certainty.
"PSUs" means performance-based restricted stock units
“PURPA” is an abbreviation for the Public Utility Regulatory Policies Act.
“PV-10” is a non-GAAP financial measure and represents the present value of estimated future cash inflows from proved oil and gas reserves, less future development and production costs, discounted at 10% per annum to reflect the timing of future cash flows and using SEC-prescribed pricing assumptions for the period. While this measure does not include the effect of income taxes as it would in the use of the standardized measure calculation, it does provide an indicative representation of the relative value of the company on a comparative basis to other companies and from period to period.
"QF" means qualifying facility.
“RCRA” is an abbreviation for the Resource Conservation and Recovery Act, which governs the management of solid waste.
“Realized price” means the cash market price less all expected quality, transportation and demand adjustments.
“Reasonable certainty” means a high degree of confidence. For a complete definition of reasonable certainty, refer to the SEC’s Regulation S-X, Rule 4-10(a)(24).
“Recompletion” means the completion for production from an existing wellbore in a formation other than that in which the well has previously been completed.
"Relative TSR" means relative total stockholder return.
“Reserves” means estimated remaining quantities of oil and natural gas and related substances anticipated to be economically producible, as of a given date, by application of development projects to known accumulations. In addition, there must exist, or there must be a reasonable expectation that there will exist, the legal right to produce or a revenue interest in the production, installed means of delivering oil and natural gas or related substances to market and all permits and financing required to implement the project. Reserves should not be assigned to adjacent reservoirs isolated by major, potentially sealing, faults until those reservoirs are penetrated and evaluated as economically producible. Reserves should not be assigned to areas that are clearly separated from a known accumulation by a non-productive reservoir (i.e., absence of reservoir, structurally low reservoir or negative test results). Such areas may contain prospective resources (i.e., potentially recoverable resources from undiscovered accumulations).
153
“Reservoir” means a porous and permeable underground formation containing a natural accumulation of producible natural gas and/or oil that is confined by impermeable rock or water barriers and is individual and separate from other reservoirs.
“Resources” means quantities of oil and natural gas estimated to exist in naturally occurring accumulations. A portion of the resources may be estimated to be recoverable and another portion may be considered to be unrecoverable. Resources include both discovered and undiscovered accumulations.
“Royalty” means the share paid to the owner of mineral rights, expressed as a percentage of gross income from oil and natural gas produced and sold unencumbered by expenses relating to the drilling, completing and operating of the affected well.
“Royalty interest” means an interest in an oil and natural gas property entitling the owner to shares of oil and natural gas production, free of costs of exploration, development and production operations.
"RSUs" is an abbreviation for restricted stock units.
"SARs" is an abbreviation for stock appreciation rights.
“SDWA” is an abbreviation for the Safe Drinking Water Act, which governs the underground injection and disposal of wastewater;.
“SEC Pricing” means pricing calculated using oil and natural gas price parameters established by current guidelines of the SEC and accounting rules based on the unweighted arithmetic average of oil and natural gas prices as of the first day of each of the 12 months ended on the given date.
“Seismic Data” means data produced by an exploration method of sending energy waves into the earth and recording the wave reflections to indicate the type, size, shape and depth of a subsurface rock formation. 2-D seismic provides two-dimensional information and 3-D seismic provides three-dimensional views.
“Spacing” means the distance between wells producing from the same reservoir. Spacing is often expressed in terms of acres, e.g., 40-acre spacing, and is often established by regulatory agencies.
“SPCC plans” means spill prevention, control and countermeasure plans.
“Steamflood” means cyclic or continuous steam injection.
“Standardized measure” means discounted future net cash flows estimated by applying year-end prices to the estimated future production of proved reserves. Future cash inflows are reduced by estimated future production and development costs based on period-end costs to determine pre-tax cash inflows. Future income taxes, if applicable, are computed by applying the statutory tax rate to the excess of pre-tax cash inflows over our tax basis in the oil and natural gas properties. Future net cash inflows after income taxes are discounted using a 10% annual discount rate.
“Stimulating” means mechanically inducing a crack or surface of breakage within rock not related to foliation or cleavage in metamorphic rock in order to enhance the permeability of rocks by connecting pores together.
“Strip Pricing” means pricing calculated using oil and natural gas price parameters established by current guidelines of the SEC and accounting rules with the exception of pricing that is based on average annual forward-month ICE (Brent) oil and NYMEX Henry Hub natural gas contract pricing in effect on a given date to reflect the market expectations as of that date.
“Superfund” is a commonly known term for CERLA.
“UIC” is an abbreviation for the Underground Injection Control program.
154
“Undeveloped acreage” means lease acres on which wells have not been drilled or completed to a point that would permit the production of commercial quantities of oil and gas regardless of whether or not such acreage contains proved reserves.
“Unit” means the joining of all or substantially all interests in a reservoir or field, rather than a single tract, to provide for development and operation without regard to separate property interests. Also, the area covered by a unitization agreement.
“Unproved reserves” means reserves that are considered less certain to be recovered than proved reserves. Unproved reserves may be further sub-classified to denote progressively increasing uncertainty of recoverability and include probable reserves and possible reserves.
“Wellbore” means the hole drilled by the bit that is equipped for natural resource production on a completed well. Also called well or borehole.
“Working interest” means an interest in an oil and natural gas lease entitling the holder at its expense to conduct drilling and production operations on the leased property and to receive the net revenues attributable to such interest, after deducting the landowner’s royalty, any overriding royalties, production costs, taxes and other costs.
“Workover” means maintenance on a producing well to restore or increase production.
"WST" is an abbreviation for well stimulation treatment.
“WTI” means West Texas Intermediate.
155
SIGNATURES
Pursuant to the requirements of Section 13 or 15(d) of the Securities Exchange Act of 1934, the registrant has duly caused this report to be signed on its behalf by the undersigned, thereunto duly authorized.
BERRY CORPORATION (bry) | ||
Date: | February 27, 2020 | /s/ A. T. Smith |
A. T. “Trem” Smith | ||
President and Chief Executive Officer | ||
Pursuant to the requirements of the Securities Exchange Act of 1934, this report has been signed below by the following persons on behalf of the registrant and in the capacities and on the dates indicated.
Date | Signature | Title |
February 27, 2020 | /s/ A. T. Smith | President and Chief Executive Officer, and Director |
A. T. “Trem” Smith | (Principal Executive Officer) | |
February 27, 2020 | /s/ Cary Baetz | Executive Vice President and Chief |
Cary Baetz | Financial Officer, and Director | |
(Principal Financial Officer) | ||
February 27, 2020 | /s/ M. S. Helm | Chief Accounting Officer |
Michael S. Helm | (Principal Accounting Officer) | |
February 27, 2020 | /s/ E. J. Voiland | Director |
Eugene J. Voiland | ||
February 27, 2020 | /s/ Brent S. Buckley | Director |
Brent S. Buckley | ||
February 27, 2020 | /s/ C K Potter | Director |
C. Kent Potter | ||
February 27, 2020 | /s/ Anne L. Mariucci | Director |
Anne L. Mariucci | ||
February 27, 2020 | /s/ Donald L. Paul | Director |
Donald L. Paul | ||
156