Attached files
| file | filename |
|---|---|
| EX-32.1 - EX-32.1 - Revolve Group, Inc. | rvlv-ex321_6.htm |
| EX-31.2 - EX-31.2 - Revolve Group, Inc. | rvlv-ex312_8.htm |
| EX-31.1 - EX-31.1 - Revolve Group, Inc. | rvlv-ex311_9.htm |
| EX-23.1 - EX-23.1 - Revolve Group, Inc. | rvlv-ex231_164.htm |
| EX-21.1 - EX-21.1 - Revolve Group, Inc. | rvlv-ex211_165.htm |
| EX-4.2 - EX-4.2 - Revolve Group, Inc. | rvlv-ex42_182.htm |
/
UNITED STATES
SECURITIES AND EXCHANGE COMMISSION
Washington, D.C. 20549
Form 10-K
(Mark One)
|
☒ |
ANNUAL REPORT PURSUANT TO SECTION 13 OR 15(d) OF THE SECURITIES EXCHANGE ACT OF 1934 |
For the fiscal year ended December 31, 2019
|
☐ |
TRANSITION REPORT PURSUANT TO SECTION 13 OR 15(d) OF THE SECURITIES EXCHANGE ACT OF 1934 |
For the transition period from to
Commission file number: 001-38927
REVOLVE GROUP, INC.
(Exact Name of Registrant as Specified in Its Charter)
|
Delaware |
|
46-1640160 |
|
(State or Other Jurisdiction of Incorporation or Organization) |
|
(I.R.S. Employer Identification No.) |
|
|
|
|
|
12889 Moore Street Cerritos, California 90703 |
||
|
(Address of Principal Executive Offices) |
||
(562) 677-9480
(Registrant’s telephone number, including area code)
Securities registered pursuant to Section 12(b) of the Act:
|
Title of each class |
|
Trading Symbol(s) |
|
Name of each exchange on which registered |
|
Class A Common Stock, par value $0.001 per share |
|
RVLV |
|
New York Stock Exchange |
Securities registered pursuant to Section 12(g) of the Act:
None
Indicate by check mark if the registrant is a well-known seasoned issuer, as defined in Rule 405 of the Securities Act. Yes ☐ No ☒
Indicate by check mark if the registrant is not required to file reports pursuant to Section 13 or Section 15(d) of the Act. Yes ☐ No ☒
Indicate by check mark whether the registrant: (1) has filed all reports required to be filed by Section 13 or 15(d) of the Securities Exchange Act of 1934 during the preceding 12 months (or for such shorter period that the registrant was required to file such reports), and (2) has been subject to such filing requirements for the past 90 days. Yes ☒ No ☐
Indicate by check mark whether the registrant has submitted electronically every Interactive Data File required to be submitted pursuant to Rule 405 of Regulation S-T (§ 232.405 of this chapter) during the preceding 12 months (or for such shorter period that the registrant was required to submit such files). Yes ☒ No ☐
Indicate by check mark whether the registrant is a large accelerated filer, an accelerated filer, a non-accelerated filer, a smaller reporting company, or emerging growth company. See the definitions of “large accelerated filer,” “accelerated filer,” “smaller reporting company,” and "emerging growth company" in Rule 12b-2 of the Exchange Act:
|
Large accelerated filer |
☐ |
|
Accelerated filer |
☐ |
|
|
|
|
|
|
|
Non-accelerated filer |
☒ |
|
Smaller reporting company |
☐ |
|
|
|
|
|
|
|
Emerging growth company |
☒ |
|
|
|
If an emerging growth company, indicate by check mark if the registrant has elected not to use the extended transition period for complying with any new or revised financial accounting standards provided pursuant to Section 13(a) of the Exchange Act. ☐
Indicate by check mark whether registrant is a shell company (as defined in Rule 12b-2 of the Exchange Act). Yes ☐ No ☒
There were 15,779,401 shares of Class A common stock and 53,568,912 shares of Class B common stock outstanding as of February 19, 2020. The aggregate market value of the Registrant’s common equity held by non-affiliates was approximately $466.8 million as of June 30, 2019, based upon the last reported sales price on the New York Stock Exchange on that date of $34.50.
DOCUMENTS INCORPORATED BY REFERENCE
Portions of the registrant’s Definitive Proxy Statement to be filed with the Securities and Exchange Commission no later than 120 days after the end of the Registrant’s fiscal year ended December 31, 2019, are incorporated by reference in Part III of this Annual Report on Form 10-K.
|
|
|
|
Page |
|
|
|
||
|
|
|
|
|
|
Item 1. |
|
5 |
|
|
Item 1a. |
|
13 |
|
|
Item 1b. |
|
43 |
|
|
Item 2. |
|
43 |
|
|
Item 3. |
|
44 |
|
|
Item 4. |
|
44 |
|
|
|
|
|
|
|
|
|
||
|
|
|
|
|
|
Item 5. |
|
45 |
|
|
Item 6. |
|
47 |
|
|
Item 7. |
|
Management’s Discussion and Analysis of Financial Condition and Results of Operations |
50 |
|
Item 7a. |
|
68 |
|
|
Item 8. |
|
68 |
|
|
Item 9. |
|
Changes In and Disagreements With Accountants On Accounting and Financial Disclosure |
68 |
|
Item 9a. |
|
69 |
|
|
Item 9b. |
|
69 |
|
|
|
|
|
|
|
|
|
||
|
|
|
|
|
|
Item 10. |
|
70 |
|
|
Item 11. |
|
70 |
|
|
Item 12. |
|
Security Ownership of Certain Beneficial Owners and Management and Related Stockholder Matters |
70 |
|
Item 13. |
|
Certain Relationships and Related Transactions, and Director Independence |
70 |
|
Item 14. |
|
70 |
|
|
|
|
|
|
|
|
|
||
|
|
|
|
|
|
Item 15. |
|
71 |
|
|
Item 16. |
|
99 |
|
|
100 |
|||
2
This report contains “forward-looking statements” within the meaning of Section 27A of the Securities Act of 1933, as amended, and Section 21E of the Securities Exchange Act of 1934, as amended. All statements other than statements of historical fact are “forward-looking statements” for purposes of federal and state securities laws, including any projections of earnings, revenue or other financial items; any statements of the plans, strategies and objectives of management for future operations; any statements concerning proposed new services or developments; any statements regarding future economic conditions or performance; any statements of belief; and any statements of assumptions underlying any of the foregoing. Forward-looking statements may include, among other, the words “may,” “will,” “estimate,” “intend,” “continue,” “believe,” “expect,” “anticipate” or any other similar words.
Although we believe that the expectations reflected in any of our forward-looking statements are reasonable, actual results could differ materially from those projected or assumed in any of our forward-looking statements. Our future financial condition and results of operations, as well as any forward-looking statements, are subject to change and to inherent risks and uncertainties, such as those disclosed or incorporated by reference in our filings with the Securities and Exchange Commission. Important factors that could cause our actual results, performance and achievements, or industry results to differ materially from estimates or projections contained in our forward-looking statements include, among others, the following:
|
|
• |
our ability to effectively manage or sustain our growth and to effectively expand our operations; |
|
|
• |
our ability to retain our existing customers and acquire new customers; |
|
|
• |
our ability to retain existing vendors and brands and to attract new vendors and brands; |
|
|
• |
our ability to obtain and maintain differentiated high-quality products from appropriate brands in sufficient quantities from vendors; |
|
|
• |
our ability to obtain and maintain sufficient inventory at prices that will make our business model profitable, and of a quality that will continue to retain existing customers and attract new customers; |
|
|
• |
our reliance on overseas suppliers and manufacturing partners, particularly in China; |
|
|
• |
our ability to respond to consumer demand, spending and tastes, and our ability to accurately and effectively engage in predictive analytics; |
|
|
• |
general economic conditions and their impact on consumer demand; |
|
|
• |
our ability to expand our operations in an efficient and cost-effective manner; |
|
|
• |
our ability to sustain and expand our gross margin and Adjusted EBITDA margin, a non-GAAP financial measure; |
|
|
• |
our ability to maintain and enhance our brand; |
|
|
• |
our ability to optimize, operate, manage and expand our network infrastructure and our fulfillment center and delivery channels; |
|
|
• |
the growth of the market for premium lifestyle and luxury products, and the online market for premium lifestyle and luxury products in particular; |
|
|
• |
our ability to accurately forecast demand for our products and our results of operations; |
|
|
• |
seasonal sales fluctuations, and |
|
|
• |
our ability to expand our product offerings, including our owned brands. |
3
Additional factors that could cause actual results to differ materially from our forward-looking statements are set forth in this report, including under the headings “Risk Factors,” “Management’s Discussion and Analysis of Financial Condition and Results of Operations” and in our Consolidated Financial Statements and the related Notes.
Forward-looking statements in this Annual Report on Form 10-K speak only as of the date hereof, and forward-looking statements in documents attached that are incorporated by reference speak only as of the date of those documents. We do not undertake any obligation to update or release any revisions to any forward-looking statement or to report any events or circumstances after the date hereof or to reflect the occurrence of unanticipated events, except as required by law.
In addition, statements that “we believe” and similar statements reflect our beliefs and opinions on the relevant subject. These statements are based upon information available to us as of the date of this report, and although we believe such information forms a reasonable basis for such statements, such information may be limited or incomplete, and our statements should not be read to indicate that we have conducted a thorough inquiry into, or review of, all potentially available relevant information. These statements are inherently uncertain and investors are cautioned not to unduly rely upon these statements. Furthermore, if our forward-looking statements prove to be inaccurate, the inaccuracy may be material. In light of the significant uncertainties in these forward-looking statements, you should not regard these statements as a representation or warranty by us or any other person that we will achieve our objectives and plans in any specified time frame, or at all. We undertake no obligation to publicly update any forward-looking statements, whether as a result of new information, future events or otherwise, except as required by law.
In this report, “we,” “our,” “us,” “Company” and “Revolve” refer to Revolve Group, Inc., and where appropriate its subsidiaries.
4
Our Business
REVOLVE is the next-generation fashion retailer for Millennial and Generation Z consumers. As a trusted, premium lifestyle brand, and a go-to online source for discovery and inspiration, we deliver an engaging customer experience from a vast yet curated offering totaling over 45,000 apparel, footwear, accessories and beauty styles. Our dynamic platform connects a deeply engaged community of millions of consumers, thousands of global fashion influencers, and more than 500 emerging, established and owned brands. Through 17 years of continued investment in technology, data analytics, and innovative marketing and merchandising strategies, we have built a powerful platform and brand that we believe is connecting with the next generation of consumers and is redefining fashion retail for the 21st century.
REVOLVE was founded in 2003, with the vision of leveraging digital channels and technology to transform the shopping experience. REVOLVE was created to offer a scaled, one-stop destination for youthful, aspirational consumers. We believe that our model, which is more targeted than department stores or mass market online retailers, and provides a greater selection than specialty retailers, allows us to more effectively serve consumers.
To improve on the merchandise offerings from traditional retail, we have built a custom, proprietary technology platform to manage nearly all aspects of our business, with a particular focus on developing sophisticated and highly automated inventory management, pricing, and trend-forecasting algorithms. Our proprietary technology leverages data from a vast net of styles, attributes and customer interactions to create a strategic asset of hundreds of millions of data points. We have complemented these efforts with an organization built from the ground-up to make decisions in a data-first, customer centric way. Our approach facilitates constant newness, with over 1,000 new styles launched per week on average. Illustrating the efficacy of our data-driven merchandising, in 2019, approximately 79% of our net sales were at full price, which we define as sales at not less than 95% of the full retail price.
Our powerful brand and innovative marketing strategy connect with the increasingly important Millennial and Generation Z demographics. We are recognized as a pioneer and a leader in social media and influencer marketing. We have built a community of thousands of influencers and brand partners, including many of the most influential social media celebrities in the world. Through our recognized leadership position, deep relationships and history of mutually beneficial partnerships, we believe we have become a partner of choice for influencers worldwide, leading to a significant competitive advantage. These marketing efforts deliver authentic, aspirational experiences and lifestyle content that drive loyalty and engagement. We pair this emotional brand marketing with sophisticated, data-driven performance marketing to further drive efficient customer acquisition and strong customer retention and lifetime value.
Our data-driven merchandising and innovative marketing competencies enable a powerful owned brand strategy that drives consumer demand, increases control of our supply chain, and expands gross profit margins. We have built a portfolio of 24 owned brands, each crafted with unique attributes and supported by independent marketing investments. We believe our consumers perceive these as highly desirable, independent brands, rather than private labels or house brands. As a result, during the year ended December 31, 2019, our owned brands represented eight out of our top 10 brands and contributed 36.1% of the REVOLVE segment’s net sales.
Our Industry
Large and Growing Addressable Market. We participate in the large and growing apparel and footwear, accessories and beauty sectors. We believe the key drivers shaping growth within these markets include favorable demographic trends, constant product newness and the proliferation of emerging brands, as well as an increased focus on fashion and beauty as a reflection of self-expression.
5
Significant Growth in Digital Channels. Consumers are increasingly using digital channels to make purchases, and as a result, the growth of online sales has outpaced that of traditional brick-and-mortar channels. Mobile sales in particular have rapidly increased as consumers leverage their ability to discover, browse and purchase anytime from anywhere through their smartphones. As evidence, in 2019, customer orders placed through mobile devices represented 56.2% of our total orders and revenue from mobile devices represented 53.7% of our total net sales.
Media Consumption and Shopping Behaviors of Next-Generation Consumers. Consumers, especially Millennials (born between 1982 and 2000) and Generation Z (born after 2000), are spending more and more time on digital media and less time on more traditional forms of print media. Millennials, who came of age in a hyper-connected, digital world, spend a significant amount of time on digital media, especially social media.
The nature of consumer engagement with brands and retailers is evolving in tandem with the transition to digital channels. Next-generation consumers often aspire to express their individual style through fashion and beauty. More than older generations of consumers, they frequently seek an emotional connection with brands that are unique and on-trend and resonate with their values. They look to social media and digital content from influencers as their source of inspiration and discovery and to inform their purchasing decisions. Influencers have an outsized impact on the purchasing behaviors of next-generation consumers. Influencers maintain a social media presence on platforms such as Instagram and YouTube, and have thousands or even millions of engaged followers. Influencers can have a more powerful impact than traditional advertising methods because they bring their followers into their daily lives and share their personal tastes and preferences in an authentic way. This evolution in consumer behavior accompanies a significant transition of purchasing power to the Millennial generation. According to the 2015 U.S. Census Bureau, Millennials accounted for more than 25% of the U.S. population, exceeding the number of baby boomers and making it the largest percentage of the workforce in the United States. Further, according to the U.S. Bureau of Labor Statistics, people born after 1981, including Millennials and Generation Z, accounted for approximately $1.7 trillion or 22% of the nation’s total consumer expenditure in 2017. We expect this number to significantly increase as Millennials enter their peak earning years and an increasing percentage of Generation Z joins the workforce.
Next-Generation Consumers are Underserved by Retail and eCommerce. Although the apparel and footwear, accessories and beauty sectors are large, next-generation consumers are currently underserved by traditional brick-and-mortar and online retailers. Department stores and national retailers try to serve a broad demographic with ubiquitous brands and are slow to react to changing trends. Specialty boutiques, while highly curated, often offer a narrow assortment and are limited in their reach. Many online retailers tend to deliver a purely transactional customer experience, with limited original fashion content and style advice to facilitate inspiration and discovery.
Our Competitive Strengths
Leading Millennial Destination for Online Fashion. We believe we are the leading U.S. online destination targeted towards Millennial consumers seeking premium fashion. In 2019, we generated $601.0 million in net sales, served approximately 1.5 million active customers, offered over 500 brands and delivered over 110,000 unique styles, which we believe makes us one of the largest standalone fashion eCommerce businesses in the United States. Our average order value was $275 in 2019, which is reflective of our focus on premium merchandise and our differentiation from mass market or value-based retailers. Our business is specifically targeted towards Millennial consumers and we believe this more specific targeting results in a better experience for our customer, leading to strong customer loyalty and increases in market share over time. We further believe our scaled leadership position has strong network effects among our customers, brands, and influencers, as we are able to provide increasing value to each of those constituents as our scale and leadership position increases.
Data-driven Merchandising Model. Our disciplined, data-driven merchandising approach allows us to offer a broad, yet curated assortment of on-trend apparel and accessories while managing fashion and inventory risk. We employ a “read and react” model that combines qualitative and quantitative decision-making to identify trends, curate assortments, facilitate our merchandise planning and re-order processes, and manage pricing. Our technology enables us to automate the rapid identification of new trends and emerging brands, allowing us to offer a vast and diversified product assortment that does not rely on any given trend or style and has minimal overlap with other retailers. Furthermore, by introducing products daily in limited quantities, we create a sense of urgency for our customers. As a result, in 2019, sales of products at full retail price represented approximately 79% of total net sales.
6
The REVOLVE Brand. Since inception, we have worked to build a deep connection with our community of youthful, aspirational consumers. Our consumers frequently engage with us, coming to us for our inspiring content and styling, and our distinct and constantly changing assortment of on-trend fashion. REVOLVE is a brand in its own right, commanding a premium positioning, strong consumer affinity and reputation as a key fashion influencer for the Millennial consumer. As our scale grows, our brand value is increasingly becoming a significant point of differentiation with customers, influencers and third-party brands.
Innovative Marketing Approach. REVOLVE’s marketing approach is integrated across all parts of the customer funnel and allows us to efficiently increase brand awareness, promote customer acquisition, encourage retention and maximize lifetime customer value. We have a history of being a leader in innovative digital and community-driven marketing and we believe we have positioned ourselves as a preferred partner for influencers and traditional marketing providers. We continuously provide our customers with aspirational and engaging content and amplify our message in a highly efficient manner through our network of over 4,500 influencers and buzzworthy social events. In 2019, we drove 51% of traffic for REVOLVE from free and low-cost sources, as measured by the visitors that landed on the REVOLVE website or mobile application directly, via email marketing links, or though paid branded search terms and organic search results (regardless of whether a purchase was made). Our brand marketing reach has increased rapidly, particularly surrounding events. We tightly integrate our marketing messaging into the shopping experience through compelling product curation, editorial content and daily product stories, creating a consistent experience for our customers across all touch points and allowing us to further control our merchandise sell-through. We pair our social media and community-driven brand marketing with sophisticated performance marketing efforts, including retargeting, paid search/product listing ads, affiliate marketing, paid social, search engine optimization, personalized email marketing and mobile “push” communications through our apps, which together support our highly attractive customer acquisition and retention metrics.
Deep Connection with Our Loyal Customers. We understand the next-generation consumer, how she communicates and where she seeks fashion and lifestyle inspiration. We engage with her through social media, events, press and other digital channels, generating multiple touchpoints in a way that we believe traditional retailers and brands do not. We integrate our marketing content with our product curation, visual merchandising, and editorial content, using our “Hot List,” daily product stories, and head-to-toe style suggestions to create an inspirational user experience and enhance our reputation as a fashion discovery destination. We enhance our customer experience and encourage our customers to use the home as a dressing room through exceptional customer service and a no-hassle free shipping and returns policy, which we have offered since our launch in 2003, making us one of the pioneers of free returns. She rewards our efforts with her loyalty, as demonstrated by our strong customer economics. Our efficient customer acquisition, strong net revenue retention rates and high average order values drive attractive customer lifetime value and rapid payback, with the average contribution margin from a customer exceeding our average customer acquisition cost within a short timeframe.
Unique Owned Brand Platform. We leverage our data-driven merchandising model to optimize our product assortment through the development of new owned brands and additional styles within our existing portfolio of owned brands. Our team develops brands that embody a unique aesthetic and authentic point of view, using our proprietary data analytics to identify trends and assortment gaps and inform design and merchandising decisions, and supporting them with robust brand marketing. Unlike traditional private label, our owned brands command pricing similar to third-party brands due to their brand equity, as demonstrated by their collective social media following, which exceeded 3.0 million followers on Instagram as of December 31, 2019. Further, the owned brand portfolio enhances loyalty, given that the substantial majority of our owned brand styles are available only on the REVOLVE site. We bring new products to market quickly by working with a flexible network of manufacturing partners and employ our “read and react” model. The broad reach of our pioneering social media–driven marketing and events generate instant consumer appeal and credibility for our owned brands, expanding our reach and driving incremental traffic to our sites. The expansion of owned brands, with their higher gross margin profile, has provided us with the opportunity to expand profitability and further invest in our business. Net sales of owned brands represented 36.1%, 30.9% and 20.2% of REVOLVE segment net sales for 2019, 2018, and 2017 respectively.
Proprietary, Scalable Technology and Data Analytics Platform. Our proprietary, scalable technology and data analytics platform efficiently and seamlessly manages our merchandising, marketing, product development, sourcing, and pricing decisions. We have a proven history of leveraging our technology platform to flexibly expand capacity in a capital-efficient manner. We leverage a strategic asset of hundreds of millions of data points, drawing from 17 years of data across hundreds of thousands of styles, up to 60 attributes per style, and millions of customer interactions. This data is leveraged throughout our operations to provide an optimized product offering, tailor our marketing efforts and continually enhance the experience on our sites. Our team of engineers and data scientists continuously innovates to improve our platform and business processes to best serve our customers.
7
Founder-led Management and Innovative Culture. The inspiration of our co-CEOs, Michael Mente and Mike Karanikolas, to transform the apparel shopping experience by leveraging data, innovative business strategies and the emerging eCommerce channel continues to influence everything we do. Our company culture and team mirror the attributes of our core customer; we are socially engaged, digital-first, high energy, results driven and collaborative. We hire people who are passionate about fashion, technology and entrepreneurialism, and who are not burdened by conventional notions of traditional retail. We encourage creativity and constant improvement with a singular focus on customer experience. We give our employees the opportunity to make an immediate contribution to our business, while maintaining our commitment to maximizing value over the long term. The success of our managerial strategies and innovative culture is evident in our track record.
Our Growth Strategies
Continue to Acquire New Customers. Our efficient customer acquisition combines with strong repeat purchase behavior to generate an attractive ratio of customer lifetime value to customer acquisition cost. We believe we are well-positioned in the market and there is significant room to expand our customer base. As a result, we will continue to invest in attracting new customers to the REVOLVE community and convert them into active customers.
Continue to Increase Customer Loyalty and Wallet Share. We intend to deepen our existing customer relationships to improve our already strong revenue retention and increase our wallet share through enhancing our customer experience and expanding our nascent loyalty and preferred customer programs for high-value consumers.
Grow Sales of Owned Brands. We intend to continue optimizing our assortment to drive revenue and profitability growth by introducing new owned brands and expanding our current owned brands into additional styles and categories.
Grow International Sales. We intend to further localize and improve the shopping experience for our international customers and leverage the global reach of the REVOLVE brand and our influencer network to accelerate growth outside of the United States.
Enhance and Broaden Our Offering. We intend to leverage our community and influencer network and integrated, data-driven operating model to expand our share of adjacent categories through a strategic mix of third-party and owned brands.
Continue to Innovate. We are innovating across our user interface, technology platform, supply chain and distribution capabilities to improve service levels, further enhance and personalize the customer experience, and reduce lead times for our owned brands portfolio.
Our Merchandising, Assortment and Content
We leverage one platform to sell merchandise primarily through two differentiated retail segments, REVOLVE and FORWARD. We believe we are well-positioned in the market and that REVOLVE offers a highly-curated assortment of premium apparel and footwear, accessories and beauty products. FORWARD offers a full assortment of iconic and emerging luxury brands.
We offer a broad yet curated assortment totaling over 45,000 apparel and footwear styles, as well as accessories and beauty products, presented in a visually compelling manner to encourage discovery and engagement. Since our inception, we have attracted and maintained strong relationships with a diversified group of premium lifestyle and luxury brands, from emerging designers to globally recognized brands. These brand relationships provide customers with breadth across product categories and styles, while reinforcing REVOLVE’s position as the destination for discovery. We continuously identify new brands and refine the brands we feature to foster a sense of newness and encourage discovery. We optimize our assortment through the development of a portfolio of 24 owned brands that span multiple categories. We apply market insights and proprietary data analytics to identify gaps and emerging trends within the marketplace. We then develop new styles for existing brands or launch new brands with a unique aesthetic or category focus to address these areas. When coupled with our innovative marketing approach, we develop strong brand equity for each owned brand. In 2019, emerging third-party brands, established third-party brands, owned brands and other net sales contributed approximately 40%, 23%, 36% and 1% of net sales through the REVOLVE segment, respectively. In 2019, approximately 84% of net sales came from apparel and substantially all of net sales came from women’s products. No third-party brand accounted for more than 2% of 2019 net sales.
8
We bring new owned brand products to market quickly by working with a flexible network of manufacturing partners and third-party suppliers. We work with suppliers and manufacturers in China, India, the United States, and other countries. A substantial majority of our owned brand products and a substantial portion of the products we source from third parties are manufactured in China. The COVID-19 coronavirus will impact our supply chain and may delay or prevent the manufacturing or transport of product that is sourced in China. As of the date of this report, the magnitude of the impact is unclear; however, it may materially and adversely impact net sales and other operating results, growth prospects and financial condition. We will continue to evaluate our supplier network in existing and other geographies. We have developed deep relationships with a number of our suppliers and make efforts to ensure that they share our commitment to quality and ethics. We do not, however, have any long-term agreements requiring us to use any manufacturer, and no manufacturer is required to produce our products in the long term.
We update the sites daily with new editorial content to generate a constant flow of fresh, high-quality, authentic and engaging content to provide an inspiring and engaging experience for our customers, driving frequent visits to our sites and helping to promote the discovery of new, relevant brands and products.
Our Marketing Approach
We leverage a variety of marketing and advertising programs to increase brand awareness, acquire new customers, drive customer traffic across our channels, and strengthen and reinforce our brand.
We are pioneers of social media and influencer marketing, using social channels and cultural events designed to deliver authentic and aspirational, yet attainable, experiences to attract and retain customers and these efforts have led to higher earned media value than competitors. We have a global network of thousands of influencers who regularly post about REVOLVE content. We believe we are a preferred partner for influencers, as their association with REVOLVE enhances our influencers’ personal brands. Our network is constantly evolving as we assess the breadth of individual influencers’ social media followings and resonance with our core demographic. We complement our social media efforts through a variety of brand marketing campaigns and events, including the #REVOLVEfestival, #REVOLVEsummer, #REVOLVEaroundtheworld and the #REVOLVEawards. Our brand marketing events are attended by our top influencers, who promote both the REVOLVE brand and our merchandise. Our online presence includes over 7.0 million Instagram followers across REVOLVE, FORWARD and our owned brands as of December 31, 2019. While social media and influencer marketing are key components of our strategy, approximately 75% of our marketing expense is devoted to performance marketing efforts. We acquire and retain customers through retargeting, paid search/product listing ads, affiliate marketing, paid social, personalized email marketing and mobile “push” communications through our apps.
Our Technology Platform
Our technology integrates seamlessly across multiple functions throughout the organization, connecting in a way that allows constant iteration and optimization. Our proprietary algorithms and technology infrastructure create the foundation for everything we do and include:
|
|
• |
Data Science. Our technology mines data from a database we have built over 17 years, consisting of hundreds of thousands of styles and millions of customer interactions, creating a strategic asset of hundreds of millions of data points. |
|
|
• |
Merchandising. Our algorithms optimize pricing based on demand, automatically identify and re-order best sellers based on purchase trends and browsing feedback, and maintain the right depth of available inventory to maximize margins and sales at full price. |
|
|
• |
Marketing. Our algorithms analyze the billions of impressions generated by our influencer network and the number of click-throughs and conversion rates from our performance marketing efforts to cost-efficiently and effectively market to consumers. We utilize customer shopping and purchase behavior to personalize our email and retargeting efforts seamlessly across multiple customer touch points. |
9
|
|
• |
Customer Service and Relationships. Our customer service technology provides our representatives with up to date and relevant product and fulfillment information to better serve our customer on an order-by-order basis. We generate highly personalized and relevant full life-cycle email and retargeting messaging. Our systems also continue to learn about each customer through direct customer feedback and these learnings are applied to future interactions. |
|
|
• |
Fulfillment. The algorithms we use in our fulfillment center allows us to efficiently position inventory and combine orders. These algorithms also determine the most efficient manner to fulfill each order, including by optimizing the way in which inventory is picked based on order patterns and personnel. We recently enhanced our fulfillment operations with the implementation of automation, which furthers our ability to serve our customers in a rapid and efficient manner. |
Our proprietary technology infrastructure is highly scalable and has allowed us to grow with our customer demand, vendor base and brands. We supplement our technology team with a team of data scientists that support teams across the organization through reporting and analysis.
Our Customer Service, Fulfillment and Logistics
A key element of our business is our ability to provide an exceptional customer experience from the initial transaction and returns process, to the way in which we communicate with them and also in our ability to fulfill orders quickly and accurately.
Customers can engage with us in 10 languages, use one of 20 payment methods and pay in up to 80 currencies. While we do not extend credit to our customers, we do offer third-party payment alternatives that allow our customers to make installment payments. We typically offer a return policy of 30 days. We are also currently testing a loyalty program and a preferred customer program for high-value customers. The loyalty program affords these customers additional benefits such as early access to new styles and invitations to exclusive events. The preferred customer program sends clients products specifically curated for them by our stylists.
Our technology platform is supplemented by our customer service, fulfillment and logistics teams. Our customer service team, through interactions with our customers by phone, email or instant-message, primarily addresses questions relating to orders, deliveries and returns, and also answers questions regarding fit, color, size, and other style matters to ensure customer satisfaction. Our fulfillment and logistics team oversees order fulfillment, ensuring that orders are efficiently and accurately processed, packed, shipped and delivered to customers. We recently consolidated our fulfillment operations into a single facility and incorporated automation processes into our warehouse workflow. These enhancements have created a highly scalable, flexible infrastructure that optimizes inventory and order allocation, reduces shipping and fulfillment expenses and delivers merchandise quickly and efficiently to our customers. Our fulfillment, shipping and return processes create a seamless customer experience, which fosters customer loyalty. Our proprietary inventory tracking system enables our customers to receive real-time updates regarding the status of their orders. We offer free two-day shipping and free returns to customers in the United States and in certain areas of California, we offer free next-day shipping. Our efficient operations allow us to ship approximately 98% of orders on the same day if placed before noon Pacific Time or the next business day if placed after. We are also able to ship to and service customers in over 200 countries and territories and are able to serve 85% of our international sales within two to three days.
We have a proven history of leveraging our technology platform to expand capacity and increase service levels in a capital-efficient manner. We will continue to evaluate opportunities to enhance our platform in the United States and internationally.
10
As of December 31, 2019, we had 1,008 full-time employees, all of which are employed in the United States. On a limited basis, we may use temporary personnel to supplement our workforce as business needs arise. None of our employees are represented by a labor union or covered by a collective bargaining agreement. We consider our relationship with our employees to be good. The following table sets forth the number of employees by team as of December 31, 2019:
|
Team |
|
As of December 31, 2019 |
|
|
|
Fulfillment and logistics |
|
|
436 |
|
|
Owned brand design |
|
|
137 |
|
|
Customer service |
|
|
91 |
|
|
Creative |
|
|
80 |
|
|
Merchandising |
|
|
74 |
|
|
Technology and data science |
|
|
52 |
|
|
Marketing |
|
|
38 |
|
|
Other |
|
|
100 |
|
|
Total |
|
|
1,008 |
|
Seasonality
Seasonality in our business does not follow that of traditional retailers, such as typical concentration of net sales in the holiday quarter. We believe our results are impacted by a pattern of increased sales leading up to #REVOLVEfestival in April and during May and June, which results in peak sales during the second quarter of each fiscal year. We also have experienced seasonally lower activity during the first quarter of each fiscal year. The COVID-19 coronavirus will have an impact to our supply chain and may delay or prevent the manufacturing or transport of product that is sourced from China, which may impact our results during our traditional sales season and beyond.
Competition
The online and offline retail markets generally, as well as the premium lifestyle and luxury product markets more specifically, are highly competitive and rapidly evolving. We face significant competition from e-Commerce websites including apparel and accessories oriented eCommerce websites as well as the eCommerce websites of traditional retailers and premium and luxury brands. We also face competition from in-person stores and boutiques including traditional retailers, as well as fashion boutiques.
We compete based on product selection and curation, brand quality and strength of brand relationships, relevance, convenience, ease of use and consumer experience, including shipping time and return policies. We believe we compete favorably across these factors taken as a whole.
Intellectual Property
We primarily protect our intellectual property through the trademark, copyright and trade secret laws of the United States. As of December 31, 2019, we owned over 200 trademark registrations, over 125 trademark applications, and over 25 Internet domain names. Although we have not sought copyright registration for our technology or works to date, we rely on common law copyright and trade secret protections in relation to our proprietary technology, products and the content displayed on our sites, including our photography and fabric prints that we design. Our trademark registrations and applications, which we have filed in the United States and in various jurisdictions outside the United States, have focused primarily on the REVOLVE and FORWARD word and design marks and those marks associated with our owned brands. Our trademarks, including domain names, are material to our business and brand identity.
11
Information About Segment and Geographic Revenue
Information about segment and geographic revenue is set forth in "Segment Information" in Note 11 of the Notes to Consolidated Financial Statements included in Item 8, Financial Statements and Supplementary Data, of this report.
Government Regulation
Our business is subject to a number of domestic and foreign laws and regulations that affect companies conducting business on the Internet, many of which are still evolving and could be interpreted in ways that could harm our business. These laws and regulations include federal and state consumer protection laws and regulations, which address, among other things, the privacy and security of consumer information, sending of commercial email, and unfair and deceptive trade practices.
Our international business is subject to additional laws and regulations, including restrictions on imports from, exports to, and services provided to persons located in certain countries and territories, as well as foreign laws and regulations addressing topics such as advertising and marketing practices, customs duties and taxes, privacy, data protection, information security and consumer rights, any of which might apply by virtue of our operations in foreign countries and territories or our contacts with consumers in such foreign countries and territories.
In addition, our beauty products are subject to regulation by the Federal Trade Commission, Food and Drug Administration, and the Consumer Product Safety Commission, as well as various other federal, state, local and foreign regulatory authorities. These laws and regulations principally relate to the ingredients, proper labeling, advertising, marketing, manufacture, safety, shipment and disposal of our products.
For more information about laws and regulations applicable to our business, see “Risk Factors—Failure to comply with federal, state and international laws and regulations and our contractual obligations relating to privacy, data protection and consumer protection, or the expansion of current or the enactment of new laws or regulations relating to privacy, data protection and consumer protection, could adversely affect our business and our financial condition.”
Corporate Information
We were originally formed as Advance Holdings, LLC in December 2012 as a Delaware limited liability company. In October 2018, we changed our name to “Revolve Group, LLC.” In connection with our initial public offering, or IPO, on June 6, 2019, Revolve Group, LLC converted into a Delaware corporation pursuant to a statutory conversion and changed its name to Revolve Group, Inc. so that the top-tier entity in our corporate structure was a corporation rather than a limited liability company, which we refer to as the Corporate Conversion. In conjunction with the Corporate Conversion, all of the outstanding Class T and Class A units of Revolve Group, LLC were converted into an aggregate of 67,889,013 shares of our Class B common stock. The holders of Class T units received an aggregate of 2,400,960 shares, representing the total preference amount for the Class T units. The remaining 65,488,053 shares of our Class B common stock were allocated on a pro rata basis to the Class T and Class A unitholders based on the number of units held by each holder. In connection with the Corporate Conversion, Revolve Group, Inc. holds all property and assets of Revolve Group, LLC and assumed all of the debts and obligations of Revolve Group, LLC. The members of the board of managers and the officers of Revolve Group, LLC became the members of the board of directors and the officers of Revolve Group, Inc. Our principal executive office is located at 12889 Moore Street, Cerritos, California 90703. Our telephone number is (562) 677-9480.
Available Information
Our Internet website address is www.Revolve.com. We make available free of charge on our website our Annual Reports on Form 10-K, Quarterly Reports on Form 10-Q, Current Reports on Form 8-K and amendments to those reports filed or furnished pursuant to Section 13(a) or 15(d) of the Securities Exchange Act of 1934, as amended, or the Exchange Act, as soon as reasonably practical after we file such material with, or furnish it to, the Securities and Exchange Commission, or SEC. The SEC also maintains an Internet website that contains reports, and other information regarding issuers that file electronically with the SEC at www.sec.gov.
12
Investing in our common stock involves certain risks. You should carefully consider the following risk factors, in addition to the other information contained in this report, including the section of this report captioned “Management’s Discussion and Analysis of Financial Condition and Results of Operations” and our unaudited condensed consolidated financial statements and related notes. If any of the events described in the following risk factors or the risks described elsewhere in this report occurs, our business, operating results and financial condition could be seriously harmed. This report also contains forward-looking statements that involve risks and uncertainties. Our actual results could differ materially from those anticipated in the forward-looking statements as a result of factors that are described below and elsewhere in this report.
Risks Related to Us and Our Business
If we fail to effectively manage our growth, our business, financial condition and operating results could be harmed.
We have grown rapidly and to effectively manage our growth, we must continue to implement our operational plans and strategies, improve our business processes, improve and expand our infrastructure of people and information systems, and expand, train and manage our employee base. Since our inception, we have rapidly increased our employee headcount across our organization to support the growth of our business. To support continued growth, we must effectively integrate, develop and motivate a large number of new employees while maintaining our corporate culture. We face significant competition for personnel. To attract top talent, we have had to offer, and expect to continue to offer, competitive compensation and benefits packages before we can validate the productivity of new employees. We may also need to increase our employee compensation levels to remain competitive in attracting and retaining talented employees. The risks associated with a rapidly growing workforce will be particularly acute as we choose to expand into new merchandise categories and internationally. Additionally, we may not be able to hire new employees quickly enough to meet our needs. If we fail to effectively manage our hiring needs or successfully integrate new hires, our efficiency, our ability to meet forecasts and our employee morale, productivity and retention could suffer, which may have an adverse effect on our business, financial condition and operating results.
We are also required to manage numerous relationships with various vendors and other third parties. Further growth of our operations, vendor base, fulfillment center, information technology systems or internal controls and procedures may not be adequate to support our operations. If we are unable to manage the growth of our organization effectively, our business, financial condition and operating results may be adversely affected.
If we are unable to anticipate and respond to changing customer preferences and shifts in fashion and industry trends in a timely manner, our business, financial condition and operating results could be harmed.
Our success largely depends on our ability to consistently gauge tastes and trends and provide a diverse and balanced assortment of merchandise that satisfies customer demands in a timely manner. We typically enter into agreements to manufacture and purchase our merchandise in advance of the applicable selling season and our failure to anticipate, identify or react appropriately, or in a timely manner to changes in customer preferences, tastes and trends or economic conditions could lead to, among other things, missed opportunities, excess inventory or inventory shortages, markdowns and write-offs, all of which could negatively impact our profitability and have a material adverse effect on our business, financial condition and operating results. Failure to respond to changing customer preferences and fashion trends could also negatively impact our brand image with our customers and result in diminished brand loyalty.
13
Our business depends on our ability to maintain a strong community of brands, engaged customers and influencers. We may not be able to maintain and enhance our existing brand community if we receive customer complaints, negative publicity or otherwise fail to live up to consumers’ expectations, which could materially adversely affect our business, operating results and growth prospects.
Over the course of 2019, we offered over 750 emerging and established brands through REVOLVE, including 24 brands developed and owned by us, which we refer to as owned brands, and over 300 brands through FORWARD, but we have a limited operating history with many of these brands. Our ability to identify new brands and maintain and enhance our relationships with our existing brands is critical to expanding our base of customers. A significant portion of our customers’ experience depends on third parties outside of our control, including vendors, suppliers and logistics providers such as FedEx, UPS and the U.S. Postal Service. If these third parties do not meet our or our customers’ expectations or if they increase their rates, our business may suffer irreparable damage or our costs may increase. In addition, maintaining and enhancing relationships with third-party brands may require us to make substantial investments, and these investments may not be successful. Also, if we fail to promote and maintain our brands, or if we incur excessive expenses in this effort, our business, operating results and financial condition may be materially adversely affected. We anticipate that, as our market becomes increasingly competitive, maintaining and enhancing our brands may become increasingly difficult and expensive. Maintaining and enhancing our brands will depend largely on our ability to provide high quality products to our customers and a reliable, trustworthy and profitable sales channel to our vendors, which we may not do successfully.
Customer complaints or negative publicity about our sites, products, product delivery times, customer data handling and security practices or customer support, especially on blogs, social media websites and our sites, could rapidly and severely diminish consumer use of our sites and consumer and supplier confidence in us and result in harm to our brands. We believe that much of the growth in our customer base to date has originated from social media and our influencer-driven marketing strategy. If we are not able to develop and maintain positive relationships with our large network influencers, our ability to promote and maintain awareness of our sites and brands and leverage social media platforms to drive visits to our sites may be adversely affected.
Our industry is highly competitive and if we do not compete effectively our operating results could be adversely affected.
The retail industry is highly competitive. We compete with department stores, specialty retailers, independent retail stores, the online offerings of these traditional retail competitors and eCommerce companies that market merchandise similar to the merchandise we offer. We believe our ability to compete depends on many factors within and beyond our control, including:
|
|
• |
attracting new customers and engaging with existing customers; |
|
|
• |
cultivating our relationships with our customers; |
|
|
• |
further developing our data analytics capabilities; |
|
|
• |
maintaining favorable brand recognition and effectively marketing our services to customers; |
|
|
• |
the amount, diversity and quality of brands and merchandise that we or our competitors offer; |
|
|
• |
expanding and maintaining appealing owned brands and merchandise; |
|
|
• |
the price at which we are able to offer our merchandise; |
|
|
• |
maintaining and growing our market share; |
|
|
• |
price fluctuations or demand disruptions of our third-party vendors; |
14
|
|
• |
the speed and cost at which we can deliver merchandise to our customers and the ease with which they can use our services to return merchandise; and |
|
|
• |
anticipating and quickly responding to changing apparel trends and consumer shopping preferences. |
We expect competition to increase as other established and emerging companies enter the markets in which we compete, as customer requirements evolve and as new products and technologies are introduced.
Many of our current competitors have, and potential competitors may have, longer operating histories, larger fulfillment infrastructures, greater technical capabilities, faster shipping times, lower-cost shipping, larger databases, greater financial, marketing, institutional and other resources and larger customer bases than we do. These factors may allow our competitors to derive greater revenue and profits from their existing customer bases, acquire customers at lower costs or respond more quickly than we can to new or emerging technologies and changes in apparel trends and consumer shopping behavior. These competitors may engage in more extensive research and development efforts, enter or expand their presence in the personalized retail market, undertake more far-reaching marketing campaigns, and adopt more aggressive pricing policies, which may allow them to build larger customer bases or generate revenue from their existing customer bases more effectively than we do. If we fail to execute on any of the above better than our competitors, our operating results may be adversely affected.
Competition, along with other factors such as consolidation within the retail industry and changes in consumer spending patterns, could also result in significant pricing pressure. These factors may cause us to reduce prices to our customers, which could cause our gross margins to decline if we are unable to appropriately manage inventory levels and/or otherwise offset price reductions with comparable reductions in our operating costs. If our prices decline and we fail to sufficiently reduce our product costs or operating expenses, our profitability may decline, which could have a material adverse effect on our business, financial condition and operating results.
We may be unable to accurately forecast net sales and appropriately plan our expenses in the future.
We base our current and future expense levels on our operating forecasts and estimates of future net sales and gross margins. Net sales and operating results are difficult to forecast because they generally depend on the volume, timing, value and type of the orders we receive, all of which are uncertain. In addition, we cannot be sure the same growth rates, trends and other key performance metrics are meaningful predictors of future growth. Our business is affected by general economic and business conditions in the United States, and we anticipate that it will be increasingly affected by conditions in international markets. In addition, we experience seasonal trends in our business, and our mix of product offerings is highly variable from day-to-day and quarter-to-quarter. This variability makes it difficult to predict sales and could result in significant fluctuations in our net sales, margins and profitability from period-to-period. A significant portion of our expenses is fixed, and as a result, we may be unable to adjust our spending in a timely manner to compensate for any unexpected shortfall in net sales. Any failure to accurately predict net sales or gross margins could cause our operating results to be lower than expected, which could materially adversely affect our financial condition and stock price.
Our recent growth rates may not be sustainable or indicative of our future growth.
Although our net sales and profitability have grown rapidly, this should not be considered as indicative of our future performance. We may not be successful in executing our growth strategy, and even if we achieve our strategic plan, we may not be able to sustain profitability. In future periods, our net sales could decline or grow more slowly than we expect.
We believe that our continued revenue growth will depend upon, among other factors, our ability to:
|
|
• |
identify new and emerging brands, maintain relationships with emerging and established brands, and develop and grow existing owned brands or develop new owned brands; |
|
|
• |
acquire new customers and retain existing customers; |
15
|
|
• |
develop new features to enhance the consumer experience on our sites; |
|
|
• |
increase the frequency with which new and repeat customers purchase products on our sites through merchandising, data analytics and technology; |
|
|
• |
add new suppliers and deepen our relationships with our existing suppliers; |
|
|
• |
enhance and scale the systems our consumers use to interact with our sites and invest in our infrastructure platform; |
|
|
• |
target additional categories and price points beyond premium apparel for Millennials, such as luxury, beauty, men’s apparel and lower price points; |
|
|
• |
expand internationally; and |
|
|
• |
pursue strategic acquisitions. |
We cannot assure you we will be able to achieve any of the foregoing. Our customer base may not continue to grow or may decline as a result of increased competition and the maturation of our business. Failure to continue our revenue growth rates could have a material adverse effect on our financial condition and operating results. You should not rely on our historical rate of revenue growth as an indication of our future performance or the rate of growth we may experience in any new category or internationally.
Use of social media and influencers may materially and adversely affect our reputation or subject us to fines or other penalties.
We use third-party social media platforms as, among other things, marketing tools. For example, we maintain Instagram, Facebook, Pinterest, YouTube and TikTok accounts. We also maintain relationships with thousands of social media influencers and engage in sponsorship initiatives. As existing eCommerce and social media platforms continue to rapidly evolve and new platforms develop, we must continue to maintain a presence on these platforms and establish presences on new or emerging popular social media platforms. If we are unable to cost-effectively use social media platforms as marketing tools or if the social media platforms we use change their policies or algorithms, we may not be able to fully optimize such platforms, and our ability to maintain and acquire customers and our financial condition may suffer. Furthermore, as laws and regulations and public opinion rapidly evolve to govern the use of these platforms and devices, the failure by us, our employees, our network of social media influencers, our sponsors or third parties acting at our direction to abide by applicable laws and regulations in the use of these platforms and devices or otherwise could subject us to regulatory investigations, class action lawsuits, liability, fines or other penalties and have a material adverse effect on our business, financial condition and operating results.
In addition, an increase in the use of social media for product promotion and marketing may cause an increase in the burden on us to monitor compliance of such materials, and increase the risk that such materials could contain problematic product or marketing claims in violation of applicable regulations. For example, in some cases, the FTC has sought enforcement action where an endorsement has failed to clearly and conspicuously disclose a financial relationship or material connection between an influencer and an advertiser. We do not prescribe what our influencers post, and if we were held responsible for the content of their posts or their actions, we could be fined or forced to alter our practices, which could have an adverse impact on our business.
Negative commentary regarding us, our products or influencers and other third parties who are affiliated with us may also be posted on social media platforms and may be adverse to our reputation or business. Influencers with whom we maintain relationships could engage in behavior or use their platforms to communicate directly with our customers in a manner that reflects poorly on our brand and may be attributed to us or otherwise adversely affect us. It is not possible to prevent such behavior, and the precautions we take to detect this activity may not be effective in all cases. Our target consumers often value readily available information and often act on such information without further investigation and without regard to its accuracy. The harm may be immediate, without affording us an opportunity for redress or correction.
16
Our quarterly operating results may fluctuate, which could cause our stock price to decline.
Our quarterly operating results may fluctuate for a variety of reasons, many of which are beyond our control. These reasons include those described in these risk factors as well as the following:
|
|
• |
fluctuations in net sales generated from the brands on our sites, including as a result of seasonality and the timing and success of events that we host, such as our annual #REVOLVEfestival in the Coachella Valley; |
|
|
• |
fluctuations in product mix between sites and between owned and non-owned brands; |
|
|
• |
our ability to effectively launch and manage new sites and brands; |
|
|
• |
fluctuations in the levels or quality of inventory; |
|
|
• |
fluctuations in the percentage of full price sales, levels of markdowns and gross margins; |
|
|
• |
fluctuations in capacity as we expand our operations; |
|
|
• |
our success in engaging existing customers and attracting new customers; |
|
|
• |
the amount and timing of our operating expenses; |
|
|
• |
the timing and success of new products and brands we introduce; |
|
|
• |
the impact of competitive developments and our response to those developments; |
|
|
• |
our ability to manage our existing business and future growth; |
|
|
• |
disruptions or defects in our sites, or actual or perceived privacy or data security breaches; and |
|
|
• |
economic and market conditions, particularly those affecting our industry. |
Fluctuations in our quarterly operating results may cause those results to fall below the expectations of analysts or investors, which could cause the price of our Class A common stock to decline. Fluctuations in our results could also cause a number of other problems. For example, analysts or investors might change their models for valuing our Class A common stock, we could experience short-term liquidity issues, our ability to retain or attract key personnel may diminish and other unanticipated issues may arise.
In addition, we believe that our quarterly operating results may vary in the future and that period-to-period comparisons of our operating results may not be meaningful. For example, our historical growth may have overshadowed the seasonal effects on our historical operating results. These seasonal effects may become more pronounced over time, which could also cause our operating results to fluctuate. You should not rely on the results of one quarter as an indication of future performance.
If we fail to acquire new customers, or fail to do so in a cost-effective manner, we may not be able to increase net sales or maintain profitability.
Our success depends on our ability to acquire customers in a cost-effective manner. In order to expand our customer base, we must appeal to and acquire customers who have historically used other means of commerce in shopping for apparel and may prefer alternatives to our offerings, such as traditional brick-and-mortar retailers and the websites of our competitors. We have made significant investments related to customer acquisition and expect to continue to spend significant amounts to acquire additional customers. For example, we engage in social media marketing campaigns and maintain relationships with thousands of social media and celebrity influencers. Such campaigns are expensive and may not result in the cost-effective acquisition of customers. In addition, the competition for relationships with influencers is increasing, and the cost of maintaining such relationships will likely increase. We cannot assure you that the net sales contribution from new customers we acquire will ultimately exceed the cost of
17
acquiring those customers. If we fail to deliver a quality shopping experience, or if consumers do not perceive the products we offer to be of high value and quality, we may not be able to acquire new customers. If we are unable to acquire new customers who purchase products in numbers sufficient to grow our business, we may not be able to generate the scale necessary to drive beneficial network effects with our suppliers, our net sales may decrease, and our business, financial condition and operating results may be materially adversely affected. As social media and influencer based marketing gains popularity, the market for these channels has become increasingly competitive. We believe we have maintained the effectiveness and efficiency of these channels in recent periods; however, if competition continues to increase, it may impact our operating results.
We also seek to engage with our customers and build awareness of our brands through sponsoring unique events and experiences such as #REVOLVEfestival, #REVOLVEaroundtheworld, and #REVOLVEawards, as well as short-term pop-up retail experiences. We anticipate that our marketing initiatives may become increasingly expensive as competition increases, and generating a meaningful return on those initiatives may be difficult. If our marketing efforts are not successful in promoting awareness of our brands and products, driving customer engagement or attracting new customers, or if we are not able to cost-effectively manage our marketing expenses, our operating results will be adversely affected.
We obtain a significant amount of traffic via social networking websites or other channels used by our current and prospective customers. As eCommerce and social networking continue to rapidly evolve, we must continue to establish relationships with these channels and may be unable to develop or maintain these relationships on acceptable terms. We also use paid and non-paid advertising. We acquire and retain customers through retargeting, paid search/product listing ads, affiliate marketing, paid social, personalized email marketing and mobile “push” communications through our mobile apps. If we are unable to cost-effectively drive traffic to our sites, our ability to acquire new customers and our financial condition would suffer.
If we fail to retain existing customers, or fail to maintain average order value levels, we may not be able to maintain our revenue base and margins, which would have a material adverse effect on our business and operating results.
A significant portion of our net sales are generated from sales to existing customers, particularly those existing customers who are highly engaged and make frequent and/or large purchases of the merchandise we offer. If existing customers no longer find our offerings appealing, or if we are unable to timely update our offerings to meet current trends and customer demands, our existing customers may make fewer or smaller purchases in the future. A decrease in the number of our customers who make repeat purchases or a decrease in their spending on the merchandise we offer could negatively impact our operating results. Further, we believe that our future success will depend in part on our ability to increase sales to our existing customers over time, and if we are unable to do so, our business may suffer. If we fail to generate repeat purchases or maintain high levels of customer engagement and average order value, our growth prospects, operating results and financial condition could be materially adversely affected.
We purchase inventory in anticipation of sales, and if we are unable to manage our inventory effectively, our operating results could be adversely affected.
Our business requires us to manage a large volume of inventory effectively. We add over 1,000 new apparel, footwear, accessories and beauty styles to our sites in a typical week, and we depend on our forecasts of demand for and popularity of various products to make purchase decisions and to manage our inventory of stock-keeping units, or SKUs. Demand for products, however, can change significantly between the time inventory is ordered and the date of sale. Demand may be affected by seasonality, new product launches, rapid changes in product cycles and pricing, product defects, promotions, changes in consumer spending patterns, changes in consumer tastes with respect to our products and other factors, and our consumers may not purchase products in the quantities that we expect.
Seasonality in our business does not follow that of traditional retailers, such as typical concentration of net sales in the holiday quarter. We believe our results are impacted by a pattern of increased sales leading up to #REVOLVEfestival in April and during May and June, which results in peak sales during the second quarter of each fiscal year. We have experienced seasonally slower activity during the first quarter. We expect this seasonality to continue in future years.
18
It may be difficult to accurately forecast demand and determine appropriate levels of product. We generally do not have the right to return unsold products to our suppliers. If we fail to manage our inventory effectively or negotiate favorable credit terms with third-party suppliers, we may be subject to a heightened risk of inventory obsolescence, a decline in inventory values, and significant inventory write-downs or write-offs. In addition, if we are required to lower sale prices in order to reduce inventory level or to pay higher prices to our suppliers, our profit margins might be negatively affected. Any failure to manage owned brand expansion or accurately forecast demand for owned brands could adversely affect growth, margins and inventory levels. In addition, our ability to meet customer demand may be negatively impacted by disruptions in the supply chain from a number of factors, including, for example, the COVID-19 coronavirus outbreak in China. A substantial majority of our owned brand products and a substantial portion of the products we source from third parties are manufactured in China. The COVID-19 coronavirus will impact our supply chain and may delay or prevent the manufacturing or transport of product that is sourced in China. Any of the above may materially and adversely affect our business, financial condition and operating results.
Merchandise returns could harm our business.
We allow our customers to return products, subject to our return policy. If the rate of merchandise returns increases significantly or if merchandise return economics become less efficient, our business, financial condition and operating results could be harmed. Further, we modify our policies relating to returns from time to time, which may result in customer dissatisfaction or an increase in the number of product returns. From time to time our products are damaged in transit, which can increase return rates and harm our brand.
We rely on consumer discretionary spending, which may be adversely affected by economic downturns and other macroeconomic conditions or trends.
Our business and operating results are subject to global economic conditions and their impact on consumer discretionary spending. Some of the factors that may negatively influence consumer spending include high levels of unemployment, higher consumer debt levels, reductions in net worth, declines in asset values and related market uncertainty, home foreclosures and reductions in home values, fluctuating interest rates and credit availability, fluctuating fuel and other energy costs, fluctuating commodity prices and general uncertainty regarding the overall future political and economic environment. Economic conditions in certain regions may also be affected by natural disasters, such as earthquakes, hurricanes, tropical storms and wildfires. Consumer purchases of discretionary items, including the merchandise that we offer, generally decline during periods of economic uncertainty, when disposable income is reduced or when there is a reduction in consumer confidence. For example, our business was adversely affected by the Great Recession in 2008.
Adverse economic changes could reduce consumer confidence, and thereby could negatively affect our operating results. In challenging and uncertain economic environments, we cannot predict when macroeconomic uncertainty may arise, whether or when such circumstances may improve or worsen or what impact such circumstances could have on our business.
Our inability to identify, develop and introduce new merchandise offerings in a timely and cost-effective manner may damage our business, financial condition and operating results.
The retail industry is driven in part by fashion and beauty trends, which may shift quickly. Our continued success depends on our ability to anticipate, gauge and react in a timely and cost-effective manner to changes in consumer preferences for products, consumer attitudes toward our industry and brand and where and how consumers shop for those products. We must continually work to develop, produce and market new products, maintain and enhance the recognition of our brands, maintain a favorable mix of products and develop our approach as to how and where we market and sell our products.
We have an established process for the identification, development, evaluation and validation of our new products. Nonetheless, each new product launch involves risks, as well as the possibility of unexpected consequences. For example, sales of our new products may not be as high as we anticipate, due to lack of acceptance of the products themselves or their price, or limited effectiveness of our marketing strategies. In addition, our ability to launch new products may be limited by delays or difficulties affecting the ability of our suppliers or manufacturers to timely manufacture, distribute and ship new products. Sales of new products may also be affected by inventory management.
19
We may also experience a decrease in sales of certain existing products as a result of newly-launched products. Any of these occurrences could delay or impede our ability to achieve our sales objectives, which could have a material adverse effect on our business, financial condition and operating results. In recent periods, our inventory position has increased at a greater rate than that of net sales, particularly in our REVOLVE segment where we have made significant investments in our owned brand platform and the launch of the superdown.com site, our lower price point offering. We believe our efforts to manage inventory levels have impacted the percentage of sales at full price and gross margin in the current period and will likely continue to impact the percentage of sales at full price and gross margin in the near term. These efforts may also impact the pace of growth in net sales in the near term.
As part of our ongoing business strategy we expect we will need to continue to introduce new products in our traditional product categories of clothing, shoes and accessories, while also expanding our product launches into adjacent categories in which we may have little to no operating experience. For example, we launched a lower price point offering in March 2019, which may cannibalize sales from our other sites and adversely affect customer lifetime value and our operating results. The success of product launches in adjacent categories could be hampered by our relative inexperience operating in such categories, the strength of our competitors or any of the other risks referred to above. Furthermore, any expansion into new product categories may prove to be an operational and financial constraint which inhibits our ability to successfully accomplish such expansion. Our inability to introduce successful products in our traditional categories or in adjacent categories could limit our future growth and have a material adverse effect on our business, financial condition and operating results.
There is no assurance that consumers will continue to purchase our products in the future. Customers may consider our offerings to be premium products and purchase fewer or lower-priced products if their discretionary income decreases. During periods of economic uncertainty, we may need to reduce prices in response to competitive pressures or otherwise, to maintain sales, which may adversely affect margins and profitability.
Our business, including our costs and supply chain, is subject to risks associated with sourcing, manufacturing and warehousing.
A majority of the merchandise we offer on our sites is sourced from third-party vendors, and as a result we may be subject to price fluctuations or demand disruptions. Our operating results would be negatively impacted by increases in the prices of our merchandise, and we have no guarantees that prices will not rise. In addition, as we expand into new categories and product types, we expect that we may not have strong purchasing power in these new areas, which could lead to higher prices than we have historically seen in our current categories. We may not be able to pass increased prices on to customers, which could adversely affect our operating results. Moreover, in the event of a significant disruption in the supply of the fabrics or raw materials used in the manufacture of the merchandise we offer, we and the vendors that we work with might not be able to locate alternative suppliers of materials of comparable quality at an acceptable price.
In addition, merchandise and materials we receive from vendors and suppliers may not be of sufficient quality or free from damage, or such merchandise may be damaged during shipping, while stored in our fulfillment center or when returned by customers. We may incur additional expenses and our reputation could be harmed if customers and potential customers believe that our merchandise does not meet their expectations, is not properly labeled or is damaged.
If we do not successfully optimize, operate and manage the expansion of capacity of our fulfillment center, our business, financial condition and operating results could be harmed.
If we do not optimize and operate our fulfillment center successfully and efficiently, it could result in excess or insufficient fulfillment capacity, an increase in costs or impairment charges or harm our business in other ways. If we do not have sufficient fulfillment capacity or experience a problem fulfilling orders in a timely manner, our customers may experience delays in receiving their purchases, which could harm our reputation and our relationship with our customers.
20
We have designed and built our own fulfillment center infrastructure, including customizing third-party inventory and package handling software systems, which is tailored to meet the specific needs of our business. If we continue to add fulfillment and warehouse capabilities, add new businesses or categories with different fulfillment requirements or change the mix in products that we sell, our fulfillment network will become increasingly complex and operating it will become more challenging. Failure to successfully address such challenges in a cost-effective and timely manner could impair our ability to timely deliver our customers’ purchases and could harm our reputation and ultimately, our business, financial condition and operating results.
In September 2018, we entered into a five-year lease for approximately 281,000 square feet of fulfillment and office space. In the first quarter of 2019, we consolidated substantially all of our fulfillment activities into this centralized facility and have terminated the lease of our prior distribution facility. In May and in June 2019, we sublet two of our existing fulfillment centers through substantially all of their remaining lease terms. In October 2019, we sublet the majority of the unoccupied warehouse space portions of our fulfillment centers. Additionally, by the end of 2019 we had terminated the leases on two of the buildings in our prior distribution facility footprint. We expect that our current capacity will support our near-term growth plans. Over the long term, we cannot assure you that we will be able to locate suitable facilities on commercially acceptable terms in accordance with our expansion plans, nor can we assure you that we will be able to recruit qualified managerial and operational personnel to support our expansion plans. If we are unable to secure new facilities for the expansion of our fulfillment operations or to effectively control expansion-related expenses, our business, prospects, financial condition and operating results could be materially and adversely affected. If we grow faster than we anticipate, we may exceed our fulfillment center capacity sooner than we anticipate, we may experience problems fulfilling orders in a timely manner or our customers may experience delays in receiving their purchases, which could harm our reputation and our relationship with our customers, and we would need to increase our capital expenditures more than anticipated. Many of the expenses and investments with respect to our fulfillment center are fixed, and any expansion of such fulfillment center will require additional investment of capital. We expect to incur higher capital expenditures in the future for our fulfillment center operations. We may incur such expenses or make such investments in advance of expected sales, and such expected sales may not occur.
We rely on third-party suppliers, manufacturers, distributors and other vendors, and they may not continue to produce products or provide services that are consistent with our standards or applicable regulatory requirements, which could harm our brand, cause consumer dissatisfaction, and require us to find alternative suppliers of our products or services.
We do not own or operate any manufacturing facilities. We use multiple third-party suppliers and manufacturers based primarily in China and, to a lesser extent, the United States and other countries including India to source and manufacture all of our products under our owned brands. We engage our third-party suppliers and manufacturers on a purchase order basis and are not party to long-term contracts with any of them. The ability of these third parties to supply and manufacture our products may be affected by competing orders placed by other customers and the demands of those customers. If we experience significant increases in demand, or need to replace a significant number of existing suppliers or manufacturers, there can be no assurance that additional supply and manufacturing capacity will be available when required on terms that are acceptable to us, or at all, or that any supplier or manufacturer will allocate sufficient capacity to us in order to meet our requirements. Furthermore, our reliance on suppliers and manufacturers outside of the United States, the number of third parties with whom we transact and the number of jurisdictions to which we sell complicates our efforts to comply with customs duties and excise taxes; any failure to comply could adversely affect our business.
In addition, quality control problems, such as the use of materials and delivery of products that do not meet our quality control standards and specifications or comply with applicable laws or regulations, could harm our business. In the past, we have experienced negative press and government enforcement actions as a result of our vendors’ failure to comply with certain applicable laws and regulations, and may experience similar negative press as a result of any future non-compliance by our vendors. We do not regularly inspect these vendors and quality control problems could result in regulatory action, such as restrictions on importation, products of inferior quality or product stock outages or shortages, harming our sales and creating inventory write-downs for unusable products.
We have also outsourced portions of our distribution process, as well as certain technology-related functions, to third-party service providers. Specifically, we rely on third parties in a number of foreign countries and territories, we are dependent on third-party vendors for credit card processing, and we use third-party hosting and networking providers to host our sites. The failure of one or more of these entities to provide the expected services on a timely basis, or at all, or at the prices we expect, or the costs and disruption incurred in changing these outsourced functions to being performed under our management and direct control or that of a third party, may have a material adverse effect on our business, financial condition and results of operations. We are not party to long-term contracts with some of our distributors, and upon expiration of these existing agreements, we may not be able to renegotiate the terms on a commercially reasonable basis, or at all.
21
Further, our third-party manufacturers, suppliers and distributors may:
|
|
• |
have economic or business interests or goals that are inconsistent with ours; |
|
|
• |
take actions contrary to our instructions, requests, policies or objectives; |
|
|
• |
be unable or unwilling to fulfill their obligations under relevant purchase orders, including obligations to meet our production deadlines, quality standards, pricing guidelines and product specifications, and to comply with applicable regulations, including those regarding the safety and quality of products; |
|
|
• |
have financial difficulties; |
|
|
• |
encounter raw material or labor shortages; |
|
|
• |
encounter increases in raw material or labor costs which may affect our procurement costs; |
|
|
• |
encounter difficulties with proper payment of custom duties or excise taxes; |
|
|
• |
disclose our confidential information or intellectual property to competitors or third parties; |
|
|
• |
engage in activities or employ practices that may harm our reputation; and |
|
|
• |
work with, be acquired by, or come under control of, our competitors. |
Any current or future outbreak of a health epidemic or other adverse public health developments, such as the pneumonia caused by the COVID-19 coronavirus, could disrupt our supply chain and materially and adversely affect our business, operating results, growth prospects and financial condition.
A substantial majority of our owned brand products and a substantial portion of the products we source from third parties are manufactured in China. Beginning in December 2019, several cases of a highly contagious form of pneumonia were diagnosed in Wuhan, China, caused by a novel strain of coronavirus named COVID-19. Since then the outbreak has rapidly spread and Chinese health officials have reported tens of thousands of infections with COVID-19 in China. COVID-19 infections are also being reported in the United States and a growing number of international locations. The COVID-19 outbreak will, and future public health crises may, impact our supply chain any may delay or prevent the manufacturing or transport of product that is sourced in China. In addition, these types of events could negatively impact consumer spending in impacted regions. As of the date of this report, the magnitude of the impact of the COVID-19 outbreak is unclear; however, it may materially and adversely impact net sales and other operating results, growth prospects and financial condition.
Shipping is a critical part of our business and any changes in our shipping arrangements or any interruptions in shipping could adversely affect our operating results.
We primarily rely on two major vendors for our shipping. If we are not able to negotiate acceptable pricing and other terms with these entities or they experience performance problems or other difficulties, it could negatively impact our operating results and our customer experience. In addition, our ability to receive inbound inventory efficiently and ship merchandise to customers may be negatively affected by inclement weather, fire, flood, power loss, earthquakes, labor disputes, acts of war or terrorism, trade embargoes, customs and tax requirements and similar factors. For example, strikes at major international shipping ports have in the past impacted our supply of inventory from our vendors, and the escalating trade dispute between the United States and China could lead to increased tariffs on our goods and restrict the flow of the goods between the United States and China. We are also subject to risks of damage or loss during delivery by our shipping vendors. If our merchandise is not delivered in a timely fashion or is damaged or lost during the delivery process, our customers could become dissatisfied and cease shopping on our sites, which would adversely affect our business and operating results.
22
Our failure to adequately and effectively staff our fulfillment center, through third parties or with our own employees, could adversely affect our customer experience and operating results.
We currently receive and distribute merchandise at a fulfillment center in the United States, which is not operated by a third party. If we are unable to adequately staff our fulfillment center to meet demand or if the cost of such staffing is higher than historical or projected costs due to mandated wage increases, regulatory changes, international expansion or other factors, our operating results could be harmed. In addition, operating fulfillment centers comes with potential risks, such as workplace safety issues and employment claims for the failure or alleged failure to comply with labor laws or laws respecting union organizing activities. Any such issues may result in delays in shipping times or packing quality, and our reputation and operating results may be harmed.
Any failure by us or our vendors to comply with product safety, labor or other laws, or to provide safe conditions for our or their workers may damage our reputation and brand and harm our business.
The merchandise we sell to our customers is subject to regulation by the Federal Consumer Product Safety Commission, the Federal Trade Commission and similar state and international regulatory authorities. As a result, such merchandise could be in the future subject to recalls and other remedial actions. Product safety, labeling and licensing concerns, including consumer disclosure and warning regarding chemical exposure, may require us to voluntarily remove selected merchandise from our inventory. Such recalls or voluntary removal of merchandise can result in, among other things, lost sales, diverted resources, potential harm to our reputation and increased customer service costs and legal expenses, which could have a material adverse effect on our operating results.
We purchase our merchandise from numerous domestic and international vendors. Failure of our vendors to comply with applicable laws and regulations and contractual requirements could lead to litigation against us, resulting in increased legal expenses and costs. In addition, the failure of any such vendors to provide safe and humane factory conditions and oversight at their facilities could damage our reputation with customers or result in legal claims against us.
If our suppliers fail to use ethical business practices and fail to comply with changing laws and regulations, our brand image could be harmed due to negative publicity.
Our core values, which include developing the highest quality products while operating with integrity, are an important component of our brand image, which makes our reputation sensitive to allegations of unethical or improper business practices, whether real or perceived. We do not control our suppliers and manufacturers or their business, and they may not comply with our guidelines or the law. A lack of compliance could lead to reduced sales or recalls or damage to our brand or cause us to seek alternative suppliers, which could increase our costs and result in delayed delivery of our products, product shortages or other disruptions of our operations. In addition, we rely on our manufacturers’ and suppliers’ compliance reporting in order to comply with regulations applicable to our products. This is further complicated by the fact that expectations of ethical business practices continually evolve and may be substantially more demanding than applicable legal requirements. Ethical business practices are also driven in part by legal developments and by diverse groups active in publicizing and organizing public responses to perceived ethical shortcomings. Accordingly, we cannot predict how such regulations or expectations might develop in the future and cannot be certain that our guidelines or current practices would satisfy all parties who are active in monitoring our products or other business practices worldwide.
Certain of our key operating metrics are subject to inherent challenges in measurement, and real or perceived inaccuracies in such metrics may harm our reputation and negatively affect our business.
We track certain key operating metrics using internal data analytics tools, which have certain limitations. In addition, we rely on data received from third parties, including third-party platforms, to track certain performance indicators. Data from both such sources may include information relating to fraudulent accounts and interactions with our sites or the social media accounts of our influencers (including as a result of the use of bots, or other automated or manual mechanisms to generate false impressions that are delivered through our sites or their accounts). We have only a limited ability to verify data from our sites or third parties, and perpetrators of fraudulent impressions may change their tactics and may become more sophisticated, which would make it still more difficult to detect such activity.
23
Our methodologies for tracking metrics may also change over time, which could result in changes to the metrics we report. If we undercount or overcount performance due to the internal data analytics tools we use or issues with the data received from third parties, or if our internal data analytics tools contain algorithmic or other technical errors, the data we report may not be accurate or comparable with prior periods. In addition, limitations, changes or errors with respect to how we measure data may affect our understanding of certain details of our business, which could affect our longer-term strategies.
If our performance metrics are not accurate representations of the reach or monetization of our network, if we discover material inaccuracies in our metrics or the data on which such metrics are based, or if we can no longer calculate any of our key performance metrics with a sufficient degree of accuracy and cannot find an adequate replacement for the metric, our business, financial condition and operating results could be adversely affected.
Increases in labor costs, including wages, could adversely affect our business, financial condition and results of operations.
Labor is a significant portion of our cost structure and is subject to many external factors, including unemployment levels, prevailing wage rates, minimum wage laws, potential collective bargaining arrangements, health insurance costs and other insurance costs and changes in employment and labor legislation or other workplace regulation. From time to time, legislative proposals are made to increase the federal minimum wage in the United States, as well as the minimum wage in California and a number of other states and municipalities, and to reform entitlement programs, such as health insurance and paid leave programs. As minimum wage rates increase or related laws and regulations change, we may need to increase not only the wage rates of our minimum wage employees, but also the wages paid to our other hourly or salaried employees. Any increase in the cost of our labor could have an adverse effect on our business, financial condition and results of operations or if we fail to pay such higher wages we could suffer increased employee turnover. Increases in labor costs could force us to increase prices, which could adversely impact our sales. If competitive pressures or other factors prevent us from offsetting increased labor costs by increases in prices, our profitability may decline and could have a material adverse effect on our business, financial condition and results of operations. In particular, the job market in Southern California, where our principal offices and fulfillment center as well as the majority of our employees are located, is very competitive.
Developments in labor and employment law and any unionizing efforts by employees could have a material adverse effect on our results of operations.
We face the risk that Congress, federal agencies or one or more states could approve legislation or regulations significantly affecting our businesses and our relationship with our employees and other individuals providing valuable services to us, such as our influencers and models. For example, the previously proposed federal legislation referred to as the Employee Free Choice Act would have substantially liberalized the procedures for union organization. None of our domestic employees are currently covered by a collective bargaining agreement, but any attempt by our employees to organize a labor union could result in increased legal and other associated costs. Additionally, given the National Labor Relations Board’s “speedy election” rule, our ability to timely and effectively address any unionizing efforts would be difficult. If we enter into a collective bargaining agreement with our domestic employees, the terms could materially adversely affect our costs, efficiency and ability to generate acceptable returns on the affected operations.
Federal and state wage and hour rules establish minimum salary requirements for employees to be exempt from overtime payments. For example, among other requirements, California law requires employers to pay employees who are classified as exempt from overtime a minimum salary of at least twice the minimum wage, which is currently $54,080 per year for executive, administrative and professional employees with employers that have 26 or more employees. Minimum salary requirements impact the way we classify certain employees, increases our payment of overtime wages and provision of meal or rest breaks, and increases the overall salaries we are required to pay to currently exempt employees to maintain their exempt status. As such, these requirements may have a material adverse effect on our business, financial condition and results of operations.
24
Further, the laws and regulations that govern the status and classification of independent contractors and other similar non-employee services providers are subject to change and divergent interpretations by various authorities, which can create uncertainty and unpredictability for us. For example, a new law in California, known as Assembly Bill 5, which took effect in January 2020, codifies and extends an employment classification test set forth by the California Supreme Court that established a new standard for determining employee or independent contractor status. The passage of this bill, and other similar initiatives throughout the United States, could lead to additional challenges to the classification of influencers and models, and a potential increase in claims, lawsuits, arbitration proceedings, administrative actions, government investigations and other legal and regulatory proceedings at the federal, state and municipal levels challenging the classification of any influencers or models as independent contractors. Such regulatory scrutiny or actions over such classification practices also may create different or conflicting obligations from one jurisdiction to another. Although we are currently not involved in any material legal actions and, to our knowledge, there have been no materials claims of misclassification made against us, the likelihood of misclassification claims in states like California has increased in light of laws such as Assembly Bill 5, and the results of any such litigation or arbitration are inherently unpredictable and legal proceedings related to such claims, individually or in the aggregate, could have a material impact on the Company’s business, financial condition and results of operations. Regardless of the outcome, litigation and arbitration of misclassification and wage and hour claims can have an adverse impact on us because of defense and settlement costs individually and in the aggregate, diversion of management resources and other factors, which could have a material adverse effect on our business, financial condition and results of operations.
If sensitive information, including such information about our customers, is disclosed or accessed without authorization, or if we or our third-party providers are subject to real or perceived cyberattacks, our customers may curtail use of our platform, we may be exposed to liability and our reputation would suffer.
We collect, transmit and store personal and financial information provided by our customers, such as names, email addresses, the details of transactions and credit card and other financial information. Some of our third-party service providers, such as identity verification and payment processing providers, also regularly have access to customer data. Additionally, we maintain other confidential, proprietary, or otherwise sensitive information relating to our business and from third parties. In an effort to protect sensitive information, we rely on a variety of security measures, including encryption and authentication technology licensed from third parties. However, advances in computer capabilities, increasingly sophisticated tools and methods used by hackers and cyber terrorists, new discoveries in the field of cryptography or other developments may result in our failure or inability to adequately protect sensitive information.
Our servers are located in close proximity to one another in Southern California and are vulnerable to power outages, telecommunications failures and catastrophic events. Like other online services, they are also vulnerable to computer viruses, unauthorized access, phishing or social engineering attacks, ransomware attacks, denial-of-service attacks and other real or perceived cyberattacks. Any of these incidents could lead to interruptions or shutdowns of our platform, loss or corruption of data, or unauthorized access to or disclosure of personal data or other sensitive information. Cyberattacks could also result in the theft of our intellectual property. We have been subject to attempted cyber, phishing or social engineering attacks in the past and may continue to be subject to such attacks in the future. If we gain greater visibility, we may face a higher risk of being targeted by cyberattacks. Advances in computer capabilities, new technological discoveries or other developments may result in cyberattacks becoming more sophisticated and more difficult to detect. We and our third-party service providers may not have the resources or technical sophistication to anticipate or prevent all such cyberattacks, and we or they may face difficulties or delays in identifying and responding to cyberattacks and data security breaches. Moreover, techniques used to obtain unauthorized access to systems change frequently and may not be known until launched against us or our third-party service providers. Security breaches can also occur as a result of non-technical issues, including phishing attacks, social engineering, and other intentional or inadvertent actions by our employees, our third-party service providers, or their personnel. Our third-party service providers also face these risks.
We incur significant costs in an effort to detect and prevent security breaches and other security-related incidents and we expect our costs will increase as we make improvements to our systems and processes to prevent further breaches and incidents. In the event of a future breach or incident, we could be required to expend additional significant capital and other resources in an effort to prevent further breaches or incidents, which may require us to divert substantial resources. Moreover, we could be required or otherwise find it appropriate to expend significant capital and other resources to respond to, notify third parties of, and otherwise address the incident or breach and its root cause. Each of these could require us to divert substantial resources.
25
We and our third-party service providers regularly experience cyberattacks aimed at disrupting our and their services. If we or our third-party service providers experience, or are believed to have experienced, security breaches that result in marketplace performance or availability problems or the loss or corruption of, or unauthorized access to or disclosure of, personal data or confidential information, people may become unwilling to provide us the information necessary to make purchases on our sites and our reputation and market position could be harmed. Existing customers may also decrease their purchases or close their accounts altogether. We could also face potential claims, investigations, regulatory proceedings, liability and litigation, and bear other substantial costs in connection with remediating and otherwise responding to any data security breach, all of which may not be adequately covered by insurance, and which may result in an increase in our costs for insurance or insurance not being available to us on economically feasible terms, or at all. Insurers may also deny us coverage as to any future claim. Any of these results could harm our growth prospects, financial condition, business and reputation.
Failure to comply with federal, state and international laws and regulations and our contractual obligations relating to privacy, data protection and consumer protection, or the expansion of current or the enactment of new laws or regulations relating to privacy, data protection and consumer protection, could adversely affect our business and our financial condition.
We collect and maintain significant amounts of personal data and other data relating to our customers and employees. A variety of federal, state and international laws and regulations, and certain industry standards, govern or apply to our collection, use, retention, sharing and security of consumer data. We are subject to certain laws, regulations, contractual obligations and industry standards (including, for example, the Payment Card Industry Data Security Standard, or PCI-DSS) relating to privacy, data protection, information security and consumer protection, including California’s Consumer Legal Remedies Act and unfair competition and false advertising laws, which are evolving and subject to potentially differing interpretations. These requirements may be interpreted and applied in a manner that is inconsistent from one jurisdiction to another or may conflict with other rules or our practices. As a result, our practices likely have not complied or may not comply in the future with all such laws, regulations, requirements and obligations. Any failure, or perceived failure, by us to comply with our privacy policies or with any federal, state or international laws, regulations, industry self-regulatory principles, industry standards or codes of conduct, regulatory guidance, orders to which we may be subject or other legal or contractual obligations relating to privacy, data protection, information security or consumer protection could adversely affect our reputation, brand and business, and may result in claims, proceedings or actions against us by governmental entities or others or other liabilities or require us to change our operations and/or cease or modify our use of certain data sets. Any such claim, proceeding or action could hurt our reputation, brand and business, force us to incur significant expenses in defense of such proceedings, distract our management, increase our costs of doing business, result in a loss of customers and suppliers or an inability to process credit card payments and may result in the imposition of monetary penalties. We may also be contractually required to indemnify and hold harmless third parties from the costs or consequences of non-compliance with any laws, regulations or other legal obligations relating to privacy or consumer protection or any inadvertent or unauthorized use or disclosure of data that we store or handle as part of operating our business. Additionally, any failure by us comply with the PCI-DSS may violate payment card association operating rules, applicable laws and regulations, and contractual obligations to which we are subject. Any such failure to comply with the PCI-DSS also may subject us to fines, penalties, damages, and civil liability, or the loss of our ability to accept credit and debit card payments, any of which may materially adversely affect our business, financial condition and operating results.
Federal, state and international governmental authorities continue to evaluate the privacy implications inherent in the use of third-party “cookies” and other methods of online tracking for behavioral advertising and other purposes. The United States and foreign governments have enacted, have considered or are considering legislation or regulations that could significantly restrict the ability of companies and individuals to engage in these activities, such as by regulating the level of consumer notice and consent required before a company can employ cookies or other electronic tracking tools or the use of data gathered with such tools. Additionally, some providers of consumer devices and web browsers have implemented, or announced plans to implement, means to make it easier for Internet users to prevent the placement of cookies or to block other tracking technologies, which could if widely adopted result in the use of third-party cookies and other methods of online tracking becoming significantly less effective. Regulation of the use of these cookies and other online tracking and advertising practices, or a loss in our ability to make effective use of services that employ such technologies, could increase our costs of operations and limit our ability to track trends, optimize our product assortment or acquire new customers on cost-effective terms and consequently, materially adversely affect our business, financial condition and operating results.
26
Foreign laws and regulations relating to privacy, data protection, information security, and consumer protection often are more restrictive than those in the United States. The European Union, for example, traditionally has imposed stricter obligations under its laws and regulations relating to privacy, data protection and consumer protection than the United States. In May 2018 the European Union’s regulation governing data practices and privacy called the General Data Protection Regulation, or GDPR, became effective. The GDPR requires companies to meet more stringent requirements regarding the handling of personal data of individuals in the EU than were required under predecessor EU requirements. In the United Kingdom, a Data Protection Act that substantially implements the GDPR also became law in May 2018, and was further amended pursuant to a statutory amendment in 2019 that further aligns it with the GDPR. The GDPR also increases the penalties for non-compliance, which may result in monetary penalties of up to 20.0 million Euros or 4% of a company’s worldwide turnover, whichever is higher. The GDPR and other similar regulations require companies to give specific types of notice and in some cases seek consent from consumers and other data subjects before collecting or using their data for certain purposes, including some marketing activities. Outside of the European Union, many countries and territories have laws, regulations, or other requirements relating to privacy, data protection, information security, localized storage of data, and consumer protection, and new countries and territories are adopting such legislation or other obligations with increasing frequency. Many of these laws may require consent from consumers for the use of data for various purposes, including marketing, which may reduce our ability to market our products. There is no harmonized approach to these laws and regulations globally. Consequently, we would increase our risk of non-compliance with applicable foreign data protection laws by expanding internationally. We may need to change and limit the way we use personal information in operating our business and may have difficulty maintaining a single operating model that is compliant. In addition, various federal, state and foreign legislative and regulatory bodies, or self-regulatory organizations, may expand current laws or regulations, enact new laws or regulations or issue revised rules or guidance regarding privacy, data protection, information security and consumer protection. For example, in 2018, California enacted the California Consumer Privacy Act, or CCPA, which, among other things, requires new disclosures to California consumers and affords such consumers new abilities to opt out of certain sales of personal information. The CCPA was amended in 2018, and additional substantive amendments to the CCPA were signed into law on October 11, 2019. The California Attorney General issued proposed regulations regarding certain aspects of the CCPA on October 10, 2019, and those regulations have yet to be finalized. Aspects of the CCPA remain unclear and there is uncertainty regarding its interpretation and enforcement. The effects of the CCPA potentially are significant, however, and may require us to modify our data processing practices and policies and to incur substantial costs and expenses in an effort to comply. As a general matter, compliance with laws, regulations, and any applicable rules or guidance from self-regulatory organizations relating to privacy, data protection, information security and consumer protection, may result in substantial costs and may necessitate changes to our business practices, which may compromise our growth strategy, adversely affect our ability to acquire customers, and otherwise adversely affect our business, financial condition and operating results.
System interruptions that impair customer access to our sites or other performance failures in our technology infrastructure could damage our business, reputation and brand and substantially harm our business and results of operations.
The satisfactory performance, reliability and availability of our sites, transaction-processing systems and technology infrastructure are critical to our reputation and our ability to acquire and retain customers, as well as maintain adequate customer service levels.
We currently use two redundant third-party data center hosting facilities in Los Angeles County, California. If the facilities where the computer and communications hardware are located fail, or if we suffer an interruption or degradation of services at our main facility, we could lose customer data and miss order fulfillment deadlines, which could harm our business. Our systems and operations are vulnerable to damage or interruption from fire, flood, power loss, telecommunications failure, terrorist attacks, cyberattacks, data loss, acts of war, break-ins, earthquake and similar events. For example, in September 2018 a distributed denial of service, or DDoS, attack caused our sites to be down for several hours, and we could be the subject of similar attacks in the future. In the event of a failure of our main facility, the failover to our back-up facility could take substantial time, during which time our sites could be completely shut down. Our back-up facility is designed to support transaction volume at a level slightly above our average daily sales, but is not adequate to support spikes in demand. The back-up facility may not process effectively during time of higher traffic to our sites and may process transactions more slowly and may not support all of our sites’ functionality.
27
We use complex custom-built proprietary software in our technology infrastructure, which we seek to continually update and improve. We may not always be successful in executing these upgrades and improvements, and the operation of our systems may be subject to failure. In particular, we have in the past and may in the future experience slowdowns or interruptions in some or all of our sites when we are updating them, and new technologies or infrastructures may not be fully integrated with existing systems on a timely basis, or at all. Additionally, if we expand our use of third-party services, including cloud-based services, our technology infrastructure may be subject to increased risk of slowdown or interruption as a result of integration with such services and/or failures by such third parties, which are out of our control. Our net sales depend on the number of visitors who shop on our sites and the volume of orders we can handle. Unavailability of our sites or reduced order fulfillment performance would reduce the volume of goods sold and could also materially adversely affect consumer perception of our brand. We may experience periodic system interruptions from time to time. In addition, continued growth in our transaction volume, as well as surges in online traffic and orders associated with promotional activities or seasonal trends in our business, place additional demands on our technology platform and could cause or exacerbate slowdowns or interruptions. If there is a substantial increase in the volume of traffic on our sites or the number of orders placed by customers, we will be required to further expand, scale and upgrade our technology, transaction processing systems and network infrastructure. There can be no assurance that we will be able to accurately project the rate or timing of increases, if any, in the use of our sites or expand, scale and upgrade our technology, systems and infrastructure to accommodate such increases on a timely basis. In order to remain competitive, we must continue to enhance and improve the responsiveness, functionality and features of our sites, which is particularly challenging given the rapid rate at which new technologies, customer preferences and expectations and industry standards and practices are evolving in the eCommerce industry. Accordingly, we redesign and enhance various functions on our sites on a regular basis, and we may experience instability and performance issues as a result of these changes.
Any slowdown or failure of our sites and the underlying technology infrastructure could harm our business, reputation and our ability to acquire, retain and serve our customers, which could materially adversely affect our results of operations and our business interruption insurance may not be sufficient to compensate us for the losses that could occur.
We are increasingly dependent on information technology, and if we are unable to protect against service interruptions, data corruption, cyber-based attacks or network security breaches, our operations could be disrupted.
We rely on information technology networks and systems to market and sell our products, to process, transmit and store electronic and financial information, to manage a variety of business processes and activities and to comply with regulatory, legal and tax requirements. We are increasingly dependent on a variety of information systems to effectively process customer orders. We depend on our information technology infrastructure for digital marketing activities and for electronic communications among our personnel, customers, manufacturers and suppliers around the world. These information technology systems, some of which are managed by third parties, may be susceptible to damage, disruptions or shutdowns due to failures during the process of upgrading or replacing software, databases or components, power outages, hardware failures, computer viruses, attacks by computer hackers, telecommunication failures, user errors or catastrophic events. Any material disruption of our systems, or the systems of our third-party service providers, could disrupt our ability to track, record and analyze the products that we sell and could negatively impact our operations, shipment of goods, ability to process financial information and transactions, and our ability to receive and process retail customers and eCommerce orders or engage in normal business activities. If our information technology systems suffer damage, disruption or shutdown and we do not effectively resolve the issues in a timely manner, our business, financial condition and results of operations may be materially and adversely affected, and we could experience delays in reporting our financial results.
Our eCommerce operations are important to our business. Our website serves as an effective extension of our marketing strategies by exposing potential new consumers to our brand, product offerings and enhanced content. Due to the importance of our website and eCommerce operations, we are vulnerable to website downtime and other technical failures. Our failure to successfully respond to these risks could reduce eCommerce sales and damage our brand’s reputation.
We must successfully maintain, scale and upgrade our information technology systems, and our failure to do so could have a material adverse effect on our business, financial condition and results of operations.
We have identified the need to significantly expand, scale and improve our information technology systems and personnel to support recent and expected future growth. As such, we are in process of implementing, and will continue to invest in and implement, significant modifications and upgrades to our information technology systems and procedures, including replacing legacy systems with successor systems, making changes to legacy systems or acquiring new systems with new functionality, hiring employees with information technology expertise and building
28
new policies, procedures, training programs and monitoring tools. These types of activities subject us to inherent costs and risks associated with replacing and changing these systems, including impairment of our ability to leverage our eCommerce channels, fulfill customer orders, potential disruption of our internal control structure, substantial capital expenditures, additional administration and operating expenses, acquisition and retention of sufficiently skilled personnel to implement and operate the new systems, demands on management time, the introduction of errors or vulnerabilities and other risks and costs of delays or difficulties in transitioning to or integrating new systems into our current systems. These implementations, modifications and upgrades may not result in productivity improvements at a level that outweighs the costs of implementation, or at all. Additionally, difficulties with implementing new technology systems, delays in our timeline for planned improvements, significant system failures, or our inability to successfully modify our information systems to respond to changes in our business needs may cause disruptions in our business operations and have a material adverse effect on our business, financial condition and results of operations.
Some of our software and systems contain open source software, which may pose particular risks to our proprietary applications.
We use open source software in the applications we have developed to operate our business and will use open source software in the future. We may face claims from third parties demanding the release or license of the open source software or derivative works that we developed from such software (which could include our proprietary source code) or otherwise seeking to enforce the terms of the applicable open source license. These claims could result in litigation and could require us to purchase a costly license, publicly release the affected portions of our source code, or cease offering the implicated solutions unless and until we can re-engineer them to avoid infringement. In addition, our use of open source software may present additional security risks because the source code for open source software is publicly available, which may make it easier for hackers and other third parties to determine how to breach our website and systems that rely on open source software. Any of these risks could be difficult to eliminate or manage and, if not addressed, could have an adverse effect on our business and operating results.
Our software is highly complex and may contain undetected errors.
The software underlying our sites is highly complex and may contain undetected errors or vulnerabilities, some of which may only be discovered after the code has been released. We rely heavily on a software engineering practice known as “continuous deployment,” meaning that we typically release software code multiple times per day. This practice may result in the more frequent introduction of errors or vulnerabilities into the software underlying our platform. Any errors or vulnerabilities discovered in our code after release could result in damage to our reputation, loss of customers, disruption to our eCommerce channels, loss of revenue or liability for damages, any of which could adversely affect our growth prospects and our business.
Our business may be adversely affected if we are unable to provide our customers a cost-effective shopping platform that is able to respond and adapt to rapid changes in technology.
The number of people who access the Internet through devices other than personal computers, including mobile phones, smartphones, handheld computers such as notebooks and tablets, video game consoles, and television set-top devices, has increased dramatically in the past few years. The smaller screen size, functionality, and memory associated with some alternative devices may make the use of our sites and purchasing our products more difficult. The versions of our sites developed for these devices may not be compelling to consumers. In addition, it is time consuming and costly to keep pace with rapidly changing and continuously evolving technology. We launched our mobile applications for REVOLVE and FORWARD in 2013, and all of our North American sites and a majority of our international sites are mobile-optimized. In 2019, a majority of orders were placed from a mobile device. However, we cannot be certain that our mobile applications or our mobile-optimized sites will be successful in the future.
As existing mobile devices and platforms evolve and new mobile devices and platforms are released, it is difficult to predict the problems we may encounter in adjusting and developing applications for changed and alternative devices and platforms, and we may need to devote significant resources to the creation, support and maintenance of such applications. If we are unable to attract consumers to our websites through these devices or are slow to develop a version of our websites that is more compatible with alternative devices or a mobile application, we may fail to capture a significant share of consumers in the fashion retail market, which could materially and adversely affect our business.
29
Further, we continually upgrade existing technologies and business applications, and we may be required to implement new technologies or business applications in the future. The implementation of upgrades and changes requires significant investments. Our results of operations may be affected by the timing, effectiveness and costs associated with the successful implementation of any upgrades or changes to our systems and infrastructure. In the event that it is more difficult for our customers to buy products from us on their mobile devices, or if our customers choose not to buy products from us on their mobile devices or to use mobile products that do not offer access to our websites, our customer growth could be harmed and our business, financial condition and operating results may be materially adversely affected.
Government regulation of the Internet and eCommerce is evolving, and unfavorable changes or failure by us to comply with these regulations could substantially harm our business and results of operations.
We are subject to general business regulations and laws as well as regulations and laws specifically governing the Internet and eCommerce. Existing and future regulations and laws could impede the growth of the Internet, eCommerce or mobile commerce. These regulations and laws may involve taxes, tariffs, privacy, data protection, data security, anti-spam, content protection, electronic contracts and communications, consumer protection, website accessibility, Internet neutrality and gift cards. It is not clear how existing laws governing issues such as property ownership, sales and other taxes and consumer privacy apply to the Internet as many of these laws were adopted prior to the advent of the Internet and do not contemplate or address the unique issues raised by the Internet or eCommerce. It is possible that general business regulations and laws, or those specifically governing the Internet or eCommerce, may be interpreted and applied in a manner that is inconsistent from one jurisdiction to another and may conflict with other rules or our practices. We cannot be sure that our practices have complied, comply or will comply fully with all such laws and regulations. Any failure, or perceived failure, by us to comply with any of these laws or regulations could result in damage to our reputation, a loss in business and proceedings or actions against us by governmental entities or others. Any such proceeding or action could hurt our reputation, force us to spend significant amounts in defense of these proceedings, distract our management, increase our costs of doing business, decrease the use of our sites by consumers and suppliers and may result in the imposition of monetary liability. We may also be contractually liable to indemnify and hold harmless third parties from the costs or consequences of non-compliance with any such laws or regulations. In addition, it is possible that governments of one or more countries or territories may seek to censor content available on our sites or may even attempt to completely block access to our sites. Adverse legal or regulatory developments could substantially harm our business. In particular, in the event that we are restricted, in whole or in part, from operating in one or more countries or territories, our ability to retain or increase our customer base may be adversely affected, and we may not be able to maintain or grow our net sales and expand our business as anticipated.
If we cannot successfully protect our intellectual property, our business would suffer.
We rely on trademark, copyright, trade secrets, confidentiality agreements and other practices to protect our brands, designs, proprietary information, technologies and processes. Our principal trademark assets include the registered trademarks “REVOLVE,” “FORWARD BY ELYSE WALKER” and multiple other brand names and our logos. Our trademarks are valuable assets that support our brand and consumers’ perception of our services and merchandise. We also hold the rights to the “revolve.com” and “fwrd.com” Internet domain names and various other related domain names, which are subject to Internet regulatory bodies and trademark and other related laws of each applicable jurisdiction. We have copyrights and other proprietary rights associated with our owned brands’ apparel and other products.
If we are unable to protect our trademarks or domain names in the United States or in other jurisdictions in which we may ultimately operate, our brand recognition and reputation would suffer, we would incur significant expense establishing new brands and our operating results would be adversely impacted. We expend substantial resources in the development of new high-quality products but are susceptible to counterfeiting, which may harm our reputation for producing such products and force us to incur expenses in enforcing our intellectual property rights. Counterfeiting of our products may be difficult or costly to detect and any related claims or lawsuits to enforce our rights can be expensive to resolve, require management time and resources, and may not provide a satisfactory or timely result. Despite our efforts to enforce our intellectual property rights, counterfeiters may continue to violate our intellectual property rights by using our trademarks or imitating or copying our products, which could harm our brand, reputation and financial condition. Since our products are sold internationally, we are also dependent on the laws of a range of countries and territories to protect and enforce our intellectual property rights.
30
We currently have no registered copyrights, applications for copyright registrations, patents issued or applications pending in the United States or internationally. Any registered copyrights or patents that may be issued in the future may not provide us with any competitive advantages or may be challenged by third parties, and future registered copyrights or patent applications may never be granted. Even if issued, there can be no assurance that these registered copyrights or patents will adequately protect our intellectual property or survive a legal challenge, as the legal standards relating to the validity, enforceability and scope of protection of registered copyright, patent and other intellectual property rights are uncertain. Our limited registered copyright and patent protection may restrict our ability to protect our technologies and processes from competition. We primarily rely on unregistered copyrights to protect our designs and products and on trade secret laws to protect our technologies and processes, including the algorithms we use throughout our business. Others may independently develop the same or similar designs, products, technologies and processes, or may improperly acquire and use information about our technologies and processes, which may allow them to provide products or services similar to ours, which could harm our competitive position.
We may be required to spend significant resources to monitor and protect our intellectual property rights, and the efforts we take to protect our proprietary rights may not be sufficient.
The inability to acquire, use or maintain our marks and domain names for our sites could substantially harm our business, financial condition and operating results.
We currently are the registrant of marks for our brands in numerous jurisdictions and are the registrant of the Internet domain name for the websites of revolve.com and fwrd.com and our other sites, as well as various related domain names. However, we have not registered our marks or domain names in all major international jurisdictions. Domain names generally are regulated by Internet regulatory bodies. As our business grows we may incur material costs in connection with the registration, maintenance, and protection of our marks. If we do not have or cannot obtain on reasonable terms the ability to use our marks in a particular country, or to use or register our domain name, we could be forced either to incur significant additional expenses to market our products within that country, including the development of a new brand and the creation of new promotional materials and packaging, or to elect not to sell products in that country. Either result could materially adversely affect our business, financial condition and operating results.
Furthermore, the regulations governing domain names and laws protecting marks and similar proprietary rights could change in ways that block or interfere with our ability to use relevant domains or our current brand. Also, we might not be able to prevent third parties from registering, using or retaining domain names that interfere with our consumer communications or infringe or otherwise decrease the value of our marks, domain names and other proprietary rights. Regulatory bodies also may establish additional generic or country-code top-level domains or may allow modifications of the requirements for registering, holding or using domain names. As a result, we might not be able to register, use or maintain the domain names that use the name REVOLVE, FORWARD, superdown or the names of our other brands in all of the countries and territories in which we currently or intend to conduct business.
We may be accused of infringing intellectual property or other proprietary rights of third parties.
We are also at risk of claims by others that we have infringed their copyrights, trademarks or patents, or improperly used or disclosed their trade secrets, or otherwise infringed or violated their proprietary rights, such as the right of publicity. The costs of supporting any litigation or disputes related to these claims can be considerable, and we cannot assure you that we will achieve a favorable outcome of any such claim. If any such claim is valid, we may be compelled to cease our use of such intellectual property or other proprietary rights and pay damages, which could adversely affect our business. Even if such claims were not valid, defending them could be expensive and distracting, adversely affecting our operating results.
We are subject to payment-related risks.
We accept payments using a variety of methods, including credit card, gift cards, debit card, PayPal and other third-party payment vendors, which subjects us to certain regulations and the risk of fraud, and we may in the future offer new payment options to customers that would be subject to additional regulations and risks. We pay interchange and other fees in connection with credit card payments, which may increase over time and adversely affect our operating results. While we use a third party to process payments, we are subject to payment card association operating rules and certification requirements, including the PCI-DSS and rules governing electronic funds transfers. If we fail to comply with applicable rules and regulations, we may be subject to fines or higher transaction fees and may lose our ability to accept online payments or other payment card transactions. If any of these events were to occur, our business, financial condition and operating results could be adversely affected.
31
We may incur significant losses from fraud.
We have in the past incurred and may in the future incur losses from various types of fraud, including stolen credit card numbers, claims that a customer did not authorize a purchase, merchant fraud and customers who have closed bank accounts or have insufficient funds in open bank accounts to satisfy payments. Although we have measures in place to detect and reduce the occurrence of fraudulent activity in our marketplace, those measures may not always be effective. In addition to the direct costs of such losses, if the fraud is related to credit card transactions and becomes excessive, it could potentially result in us paying higher fees or losing the right to accept credit cards for payment. In addition, under current credit card practices, we are liable for fraudulent credit card transactions because we do not obtain a cardholder’s signature. Our failure to adequately prevent fraudulent transactions could damage our reputation, result in litigation or regulatory action and lead to expenses that could substantially impact our operating results.
If our internal control over financial reporting or our disclosure controls and procedures are not effective, we may not be able to accurately report our financial results, prevent fraud or file our periodic reports in a timely manner, which may cause investors to lose confidence in our reported financial information and may lead to a decline in our stock price.
We are subject to the SEC’s rules implementing Sections 302 and 404 of the Sarbanes-Oxley Act, which require our management to certify financial and other information in our quarterly and annual reports and provide, beginning with our second Annual Report on Form 10-K, an annual management report on the effectiveness of internal controls over financial reporting. However, our independent registered public accounting firm will not be required to report on the effectiveness of our internal control over financial reporting pursuant to Section 404 of the Sarbanes-Oxley Act until we are no longer an “emerging growth company” as defined in the Jumpstart Our Business Startups Act, or the JOBS Act, which could be as early as the beginning of the third quarter of 2020.
Our testing of key controls over financial reporting, or the subsequent testing by our independent registered public accounting firm once required under the Sarbanes-Oxley Act, may reveal deficiencies in our internal control over financial reporting that are deemed to be material weaknesses. If we are not able to comply with the requirements of Section 404 in a timely manner, or if we or our independent registered public accounting firm identify deficiencies in our internal control over financial reporting that are deemed to be material weaknesses, the market price of our stock would likely decline and we could be subject to lawsuits, sanctions or investigations by regulatory authorities, which would require additional financial and management resources.
We continue to invest in more robust technology and in more resources in order to manage applicable reporting requirements. Implementing the appropriate changes to our internal controls and remediating a material weakness may distract our officers and employees, result in substantial costs to implement new processes or modify our existing processes and require significant time to complete. Any difficulties or delays in implementing the system could impact our ability to timely report our financial results. In addition, we currently rely on a manual process in some areas which increases our exposure to human error or intervention in reporting our financial results. For these reasons, we may encounter difficulties in the timely and accurate reporting of our financial results, which would impact our ability to provide our investors with information in a timely manner. As a result, our investors could lose confidence in our reported consolidated financial information, and our stock price could decline.
In addition, any such changes do not guarantee that we will be effective in maintaining the adequacy of our internal controls, and any failure to maintain that adequacy could prevent us from accurately reporting our financial results.
Customer growth and activity on mobile devices depends upon effective use of mobile operating systems, networks and standards that we do not control.
Purchases using mobile devices by consumers generally, and by our customers specifically, have increased significantly, and we expect this trend to continue. To optimize the mobile shopping experience, we are dependent on our customers downloading our specific mobile applications for their particular device or accessing our sites from an Internet browser on their mobile device. As new mobile devices and platforms are released, it is difficult to predict the problems we may encounter in developing applications for these alternative devices and platforms, and we may need to devote significant resources to the creation, support and maintenance of such applications. In addition, our future growth and our results of operations could suffer if we experience difficulties in the future in integrating our mobile applications into mobile devices, if problems arise with our relationships with providers of mobile operating
32
systems or mobile application download stores, such as those of Apple Inc. or Google Inc., if our applications receive unfavorable treatment compared to competing applications, such as the order of our products in the Apple App Store, or if we face increased costs to distribute or have customers use our mobile applications. We are further dependent on the interoperability of our sites with popular mobile operating systems that we do not control, such as iOS and Android, and any changes in such systems that degrade the functionality of our sites or give preferential treatment to competitive products could adversely affect the usage of our sites on mobile devices. In the event that it is more difficult for our customers to access and use our sites on their mobile devices, or if our customers choose not to access or to use our sites on their mobile devices or to use mobile products that do not offer access to our sites, our customer growth could be harmed and our business, financial condition and operating results may be materially and adversely affected.
We may expand our business through acquisitions of other businesses, which may divert management’s attention and/or prove to be unsuccessful.
We acquired Alliance, Inc. in 2014 and may acquire additional businesses or technologies in the future. Acquisitions may divert management’s time and focus from operating our business. Acquisitions also may require us to spend a substantial portion of our available cash, incur debt or other liabilities, amortize expenses related to intangible assets or incur write-offs of goodwill or other assets. In addition, integrating an acquired business or technology is risky. Completed and future acquisitions may result in unforeseen operational difficulties and expenditures associated with:
|
|
• |
incorporating new businesses and technologies into our infrastructure; |
|
|
• |
consolidating operational and administrative functions; |
|
|
• |
coordinating outreach to our community; |
|
|
• |
maintaining morale and culture and retaining and integrating key employees; |
|
|
• |
maintaining or developing controls, procedures and policies (including effective internal control over financial reporting and disclosure controls and procedures); and |
|
|
• |
identifying assuming liabilities related to the activities of the acquired business before the acquisition, including liabilities for violations of laws and regulations, intellectual property issues, commercial disputes, taxes and other matters. |
Moreover, we may not benefit from our acquisitions as we expect, or in the time frame we expect. We also may issue additional equity securities in connection with an acquisition, which could cause dilution to our stockholders. Finally, acquisitions could be viewed negatively by analysts, investors or our customers.
If we fail to attract and retain key personnel, or effectively manage succession, our business, financial condition and operating results could be adversely affected.
Our success, including our ability to anticipate and effectively respond to changing style trends, depends in part on our ability to attract and retain key personnel on our executive team, particularly our co-chief executive officers, and in our merchandising, data science, engineering, marketing, design and other organizations. Competition for key personnel is strong, and we cannot be sure that we will be able to attract and retain a sufficient number of qualified personnel in the future, or that the compensation costs of doing so will not adversely affect our operating results. We do not have long-term employment or non-competition agreements with any of our personnel. If we are unable to retain, attract and motivate talented employees with the appropriate skills at cost-effective compensation levels, or if changes to our business adversely affect morale or retention, we may not achieve our objectives and our business and operating results could be adversely affected. In addition, the loss of one or more of our key personnel or the inability to promptly identify a suitable successor to a key role could have an adverse effect on our business. In particular, our co-chief executive officers have unique and valuable experiences leading our company from its inception through today. If either of them were to depart or otherwise reduce their focus on our company, our business may be disrupted. We do not currently maintain key-person life insurance policies on any member of our senior management team or other key employees.
33
Adverse litigation judgments or settlements resulting from legal proceedings in which we may be involved could expose us to monetary damages or limit our ability to operate our business.
We have in the past and may in the future become involved in private actions, collective actions, investigations and various other legal proceedings by customers, employees, suppliers, competitors, government agencies, law enforcement, customs officials or others. The results of any such litigation, investigations and other legal proceedings are inherently unpredictable and expensive. Any claims against us, whether meritorious or not, could be time-consuming, result in costly litigation, damage our reputation, require significant amounts of management time, result in impositions of fines or other remedial measures as a result of underpayment and divert significant resources. If any of these legal proceedings were to be determined adversely to us, or we were to enter into a settlement arrangement, we could be exposed to monetary damages or limits on our ability to operate our business, which could have an adverse effect on our business, financial condition and operating results.
Expansion of our operations internationally will require management attention and resources, involves additional risks and may be unsuccessful.
We have limited experience with operating internationally and selling our merchandise outside of the United States and do not have physical operations outside of the United States. If we choose to expand internationally we would need to adapt to different local cultures, standards and policies. The business model we employ and the merchandise we currently offer may not have the same appeal to consumers outside of the United States. Furthermore, to succeed with customers in international locations, it likely will be necessary to locate fulfillment centers in foreign markets and hire local employees in those international centers, and we may have to invest in these facilities before proving we can successfully run foreign operations. We may not be successful in expanding into international markets or in generating revenue from foreign operations for a variety of reasons, including:
|
|
• |
localization of our merchandise offerings, including translation into foreign languages and adaptation for local practices; |
|
|
• |
navigating shipping and returns in a more fragmented geography, particularly following the United Kingdom’s departure from the European Union and if the European Union were to lose other members or change its policies regarding the flow of goods across country borders; |
|
|
• |
different consumer demand dynamics, which may make our model and the merchandise we offer less successful compared to the United States; |
|
|
• |
competition from local incumbents that understand the local market and may operate more effectively; |
|
|
• |
regulatory requirements, taxes, trade laws, trade sanctions and economic embargoes, tariffs, export quotas, custom duties or other trade restrictions or any unexpected changes thereto; |
|
|
• |
laws and regulations regarding anti-bribery and anti-corruption compliance; |
|
|
• |
differing labor regulations where labor laws may be more advantageous to employees as compared to the United States and increased labor costs; |
|
|
• |
more stringent regulations relating to privacy, data protection, and data security and access to, or use of, commercial and personal information, particularly in Europe; |
|
|
• |
changes in a specific country’s or region’s political or economic conditions; and |
|
|
• |
risks resulting from changes in currency exchange rates. |
If we invest substantial time and resources to establish and expand our operations internationally and are unable to do so successfully and in a timely manner, our operating results would suffer.
34
We have operations in China, which exposes us to risks inherent in doing business there.
We use multiple third-party suppliers and manufacturers based primarily in China. With the rapid development of the Chinese economy, the cost of labor has increased and may continue to increase in the future. Furthermore, pursuant to Chinese labor laws, employers in China are subject to various requirements when signing labor contracts, paying remuneration, determining the term of employees’ probation and unilaterally terminating labor contracts. Our results of operations will be materially and adversely affected if the labor costs of our third-party suppliers and manufacturers increase significantly. In addition, we and our manufacturers and suppliers may not be able to find a sufficient number of qualified workers due to the intensely competitive and fluid market for skilled labor in China.
Operating in China exposes us to political, legal and economic risks. In particular, the political, legal and economic climate in China, both nationally and regionally, is fluid and unpredictable. Our ability to operate in China may be adversely affected by changes in U.S. and Chinese laws and regulations such as those related to, among other things, taxation, import and export tariffs, custom duties, environmental regulations, land use rights, intellectual property, currency controls, network security, employee benefits, hygiene supervision and other matters. In addition, we may not obtain or retain the requisite legal permits to continue to operate in China, and costs or operational limitations may be imposed in connection with obtaining and complying with such permits. In addition, Chinese trade regulations are in a state of flux, and we may become subject to other forms of taxation, tariffs and duties in China. Furthermore, the third parties we rely on in China may disclose our confidential information or intellectual property to competitors or third parties, which could result in the illegal distribution and sale of counterfeit versions of our products. If any of these events occur, our business, financial condition and results of operations could be materially and adversely affected. See also “—Recent and potential tariffs imposed by the U.S. government or a global trade war could increase the cost of our products, which could have a material adverse effect on our business, financial condition and results of operations.”
Our reliance on overseas manufacturing and supply partners, including vendors located in jurisdictions presenting an increased risk of bribery and corruption, exposes us to legal, reputational, and supply chain risk through the potential for violations of federal and international anti-corruption law.
We derive a significant portion of our merchandise for our owned brands from third-party manufacturing and supply partners in foreign countries and territories, including countries and territories perceived to carry an increased risk of corrupt business practices. The U.S. Foreign Corrupt Practices Act, or the FCPA, prohibits U.S. corporations and their representatives from offering, promising, authorizing or making payments to any foreign government official, government staff member, political party or political candidate in an attempt to obtain or retain business abroad. Likewise, the SEC, the U.S. Department of Justice, the U.S. Treasury Department’s Office of Foreign Assets Control (“OFAC”), the U.S. Department of State, as well as other foreign regulatory authorities continue to enforce economic and trade regulations and anti‑corruption laws, across industries. U.S. trade sanctions relate to transactions with designated foreign countries and territories as well as specially targeted individuals and entities that are identified on U.S. and other government blacklists, and those owned by them or those acting on their behalf. Notwithstanding our efforts to conduct our operations in material compliance with these regulations, our international vendors could be determined to be our “representatives” under the FCPA, which could expose us to potential liability for the actions of these vendors under the FCPA. If we or our vendors were determined to have violated OFAC regulations, the FCPA, the U.K. Bribery Act of 2010, or any of the anti-corruption and anti-bribery laws in the countries and territories where we and our vendors do business, we could suffer severe fines and penalties, profit disgorgement, injunctions on future conduct, securities litigation, bans on transacting certain business, and other consequences that may have a material adverse effect on our business, financial condition and results of operations. In addition, the costs we may incur in defending against any anti-corruption investigations stemming from our or our vendors’ actions could be significant. Moreover, any actual or alleged corruption in our supply chain could carry significant reputational harms, including negative publicity, loss of good will, and decline in share price.
Recent and potential tariffs imposed by the U.S. government or a global trade war could increase the cost of our products, which could have a material adverse effect on our business, financial condition and results of operations.
The U.S. government has and continues to make significant changes in U.S. trade policy and has taken certain actions that could negatively impact U.S. trade, including imposing tariffs on certain goods imported into the United States. In retaliation, China has implemented, and continues to evaluate imposing additional tariffs on a wide range of American products. There is also a concern that the imposition of additional tariffs by the United States could result in the adoption of tariffs by other countries as well, leading to a global trade war. More specifically, the U.S.
35
government has from time to time imposed significant tariffs on certain product categories imported from China, including apparel, footwear, handbags, accessories and cosmetics. Such tariffs could have a significant impact on our business, particularly the REVOLVE segment and our owned brands, of which a large portion are manufactured in China. While we attempt to renegotiate prices with suppliers or diversify our supply chain in response to tariffs, such efforts may not yield immediate results or may be ineffective. We might also consider increasing prices to the end consumer; however, this could reduce the competitiveness of our products and adversely affect net sales. If we fail to manage these dynamics successfully, gross margins and profitability could be adversely affected. As of the date of this report, tariffs have not had a material impact on our business, but increased tariffs or trade restrictions implemented by the United States or other countries in connection with a global trade war could have a material adverse effect on our business, financial condition and results of operations.
We may experience fluctuations in our tax obligations and effective tax rate, which could adversely affect our operating results.
We are subject to taxes in the United States and the United Kingdom. We record tax expense based on current tax liabilities and our estimates of future tax liabilities, which may include reserves for estimates of probable settlements of tax audits. At any one time, multiple tax years are subject to audit by various taxing jurisdictions. The results of these audits and negotiations with taxing authorities may affect the ultimate settlement of these issues. As a result, we expect that throughout the year there could be ongoing variability in our quarterly tax rates as taxable events occur and exposures are re-evaluated. Further, our effective tax rate in a given financial statement period may be materially impacted by changes in tax laws, changes in the mix and level of earnings by taxing jurisdictions, or changes to existing accounting rules or regulations. For example, the Tax Cuts and Jobs Act, or the 2017 Tax Act. Foreign governments may enact tax laws in response to the 2017 Tax Act that could result in further changes to global taxation. There are numerous factors that could affect our tax rate. These may include, among other factors, intercompany transactions, losses incurred in jurisdictions for which we are not able to realize the related tax benefits, and entry into new businesses and geographies. Fluctuations in our tax obligations and effective tax rate could adversely affect our business, financial condition and operating results.
The enactment of tax reform legislation, including legislation implementing changes in taxation of international business activities, could materially impact our financial position and results of operations.
Legislation or other changes in tax laws could increase our liability and adversely affect our after-tax profitability. For example, the 2017 Tax Act could have a significant impact on our effective tax rate, cash tax expenses and net deferred tax assets. The 2017 Tax Act reduces the U.S. corporate statutory tax rate, eliminates or limits the deduction of several expenses that were previously deductible, imposes a mandatory deemed repatriation tax on undistributed historic earnings of foreign subsidiaries, requires a minimum tax on earnings generated by foreign subsidiaries and permits a tax-free repatriation of foreign earnings through a dividends received deduction (subject to certain exceptions). We have completed our evaluation of the overall impact of the 2017 Tax Act on our effective tax rate and balance sheet and reflected the amounts in our financial statements. The 2017 Tax Act may have significant impacts in future periods.
We could be required to collect additional sales taxes or be subject to other tax liabilities that may increase the costs our customers would have to pay for our offering and adversely affect our operating results.
On June 21, 2018, the U.S. Supreme Court held in South Dakota v. Wayfair, Inc. that states could impose sales tax collection obligations on out-of-state retailers even if those retailers lack any physical presence within the states imposing sales taxes. Under Wayfair, a person requires only a “substantial nexus” with the taxing state before the state may subject the person to sales tax collection obligations therein. An increasing number of states, both before and after the Supreme Court’s ruling, have considered or adopted laws that attempt to impose sales tax collection obligations on out-of-state retailers. The Supreme Court’s Wayfair decision has removed a significant impediment to the enactment of these laws, and it is possible that states may seek to tax out-of-state retailers, including for prior tax years. Although we believe that we currently collect sales taxes in all states that have adopted laws imposing sales tax collection obligations on out-of-state retailers since Wayfair was decided, a successful assertion by one or more states requiring us to collect sales taxes where we presently do not do so, or to collect more taxes in a jurisdiction in which we currently do collect some sales taxes, could result in substantial tax liabilities, including taxes on past sales, as well as penalties and interest. The imposition by state governments of sales tax collection obligations on out-of-state retailers in jurisdictions where we do not currently collect sales taxes, whether for prior years or prospectively, could also create additional administrative burdens for us, put us at a competitive disadvantage if they do not impose similar obligations on our competitors and decrease our future sales, which could have a material adverse impact on our business and operating results.
36
We may require additional capital to support business growth, and this capital might not be available or may be available only by diluting existing stockholders.
We intend to continue making investments to support our business growth and may require additional funds to support this growth and respond to business challenges, including the need to develop our services, expand our inventory, enhance our operating infrastructure, expand the markets in which we operate and potentially acquire complementary businesses and technologies. Accordingly, we may need to engage in equity or debt financings to secure additional funds. If we raise additional funds through further issuances of equity or convertible debt securities, our existing stockholders could suffer significant dilution, and any new equity securities we issue could have rights, preferences and privileges superior to those of holders of our Class A common stock. Any debt financing secured by us in the future could involve restrictive covenants relating to our capital-raising activities and other financial and operational matters, which may make it more difficult for us to obtain additional capital and to pursue business opportunities. In addition, we may not be able to obtain additional financing on terms favorable to us, if at all. If we are unable to obtain adequate financing or financing on terms satisfactory to us, when we require it, our ability to continue to support our business growth and to respond to business challenges could be significantly limited, and our business and prospects could fail or be adversely affected.
Operating as a public company will require us to incur substantial costs and will require substantial management attention. In addition, our management team has limited experience managing a public company.
As a public company, we incur and will continue to incur substantial legal, accounting and other expenses that we did not incur as a private company. For example, we are subject to the reporting requirements of the Exchange Act, the applicable requirements of the Sarbanes-Oxley Act and the Dodd-Frank Wall Street Reform and Consumer Protection Act, or the Dodd-Frank Act, and the rules and regulations of the Securities and Exchange Commission, or the SEC. The rules and regulations of NYSE also apply to us. As part of these requirements, we must maintain effective disclosure and financial controls and make changes to our corporate governance practices. We expect that compliance with these requirements will increase our legal and financial compliance costs and will make some activities more time-consuming.
Most of our management and other personnel have little experience managing a public company and preparing public filings. In addition, we expect that our management and other personnel will need to divert attention from other business matters to devote substantial time to the reporting and other requirements of being a public company. In particular, we expect to incur significant expense and devote substantial management effort to complying with the requirements of Section 404 of the Sarbanes-Oxley Act. We may need to hire additional accounting and financial staff with appropriate public company experience and technical accounting knowledge.
Our credit facility contains restrictive covenants that may limit our operating flexibility.
Our credit facility contains restrictive covenants that limit our ability to transfer or dispose of assets, merge with other companies or consummate certain changes of control, acquire other companies, incur additional indebtedness and liens and enter into new businesses. We therefore may not be able to engage in any of the foregoing transactions unless we obtain the consent of the lender or terminate the credit facility, which may limit our operating flexibility. In addition, our credit facility is secured by all of our assets, including our intellectual property, and requires us to satisfy certain financial covenants. There is no guarantee that we will be able to generate sufficient cash flow or sales to meet these financial covenants or pay the principal and interest on any debt under our facility. Furthermore, there is no guarantee that future working capital, borrowings or equity financing will be available to repay or refinance any such debt. Any inability to make scheduled payments or meet the financial covenants on our credit facility would adversely affect our business.
Our operating results could be adversely affected by natural disasters, public health crises, political crises or other catastrophic events.
Our principal offices, data centers and our fulfillment center are located in Southern California, an area which has a history of earthquakes, and are thus vulnerable to damage. Natural disasters, such as earthquakes, wildfires, hurricanes, tornadoes, floods and other adverse weather and climate conditions; unforeseen public health crises, such as pandemics and epidemics; political crises, such as terrorist attacks, war and other political instability; or other catastrophic events, whether occurring in the United States or internationally, could disrupt our operations in any of our offices and fulfillment center or the operations of one or more of our third-party providers or vendors.
37
Risks Related to Our Class A Common Stock
The market price of our Class A common stock may be volatile or may decline steeply or suddenly regardless of our operating performance, and we may not be able to meet investor or analyst expectations.
Prior to our initial public offering in June 2019, there was no public market for our common stock. The lack of an active market for our common stock may impair investors’ ability to sell their shares at the time they wish to sell them or at a price that they consider reasonable, may reduce the market value of their shares and may result in significant price and volume fluctuations. The market price of our Class A common stock may fluctuate or decline significantly in response to numerous factors, many of which are beyond our control, including:
|
|
• |
actual or anticipated fluctuations in our customer base, the level of customer engagement, net sales or other operating results; |
|
|
• |
variations between our actual operating results and the expectations of securities analysts, investors and the financial community; |
|
|
• |
any forward-looking financial or operating information we may provide to the public or securities analysts, any changes in this information or our failure to meet expectations based on this information; |
|
|
• |
actions of securities analysts who initiate or maintain coverage of us, changes in financial estimates by any securities analysts who follow our company or our failure to meet these estimates or the expectations of investors; |
|
|
• |
whether investors or securities analysts view our stock structure unfavorably, particularly our dual-class structure and the significant voting control of our executive officers, directors and their affiliates; |
|
|
• |
additional shares of our Class A common stock being sold into the market by us or our existing stockholders, or the anticipation of such sales; |
|
|
• |
announcements by us or our competitors of significant products or features, technical innovations, acquisitions, strategic partnerships, joint ventures or capital commitments; |
|
|
• |
changes in operating performance and stock market valuations of companies in our industry, including our vendors and competitors; |
|
|
• |
price and volume fluctuations in the overall stock market, including as a result of trends in the economy as a whole; |
|
|
• |
lawsuits threatened or filed against us; |
|
|
• |
developments in new legislation and pending lawsuits or regulatory actions, including interim or final rulings by judicial or regulatory bodies; |
|
|
• |
imposition of fines or other remedial measures as a result of the underpayment of customs duties; and |
|
|
• |
other events or factors, including those resulting from war or incidents of terrorism, or responses to these events. |
In addition, extreme price and volume fluctuations in the stock markets have affected and continue to affect many eCommerce and other technology companies’ stock prices. Often, their stock prices have fluctuated in ways unrelated or disproportionate to the companies’ operating performance. In the past, stockholders have filed securities class action litigation following periods of market volatility. If we were to become involved in securities litigation, it could subject us to substantial costs, divert resources and the attention of management from our business and seriously harm our business.
38
Moreover, because of these fluctuations, comparing our operating results on a period-to-period basis may not be meaningful. You should not rely on our past results as an indication of our future performance. This variability and unpredictability could also result in our failing to meet the expectations of industry or financial analysts or investors for any period. If our revenue or operating results fall below the expectations of analysts or investors or below any forecasts we may provide to the market, or if the forecasts we provide to the market are below the expectations of analysts or investors, the price of our Class A common stock could decline substantially. Such a stock price decline could occur even when we have met any previously publicly stated revenue or earnings forecasts that we may provide.
Future sales of shares could cause our stock price to decline.
Sales of a substantial number of shares of our Class A common stock into the public market, particularly sales by our directors, executive officers and principal stockholders, or the perception that such sales might occur, could cause our stock price to decline. These sales, or the possibility that these sales may occur, also might make it more difficult for us to sell equity securities in the future at a time and at a price that we deem appropriate.
All shares of common stock sold are freely tradable without restriction or further registration under the Securities Act, unless held by our “affiliates,” as that term is defined in Rule 144 under the Securities Act. The holders of all of our Class B common stock have rights, subject to certain conditions, to require us to file registration statements for the public resale of the shares of Class A common stock issuable upon conversion of their shares of Class B common stock, or to include such shares in registration statements that we may file. If we register the offer and sale of shares for the holders of registration rights, those shares can be freely sold in the public market upon issuance, subject to the restrictions of Rule 144 under the Securities Act in the case of our affiliates.
In addition, the shares subject to outstanding options and restricted stock units, or RSUs, and the shares reserved for future issuance under our equity incentive plans will become available for sale immediately upon the exercise of such options. We register the offer and sale of all shares of common stock that we may issue under our equity incentive plans and, as a result, the sale of shares to be issued under our equity incentive plans can be freely sold in the public market upon issuance, subject to the restrictions of Rule 144 under the Securities Act in the case of our affiliates.
The dual class structure of our common stock will have the effect of concentrating voting control with our executive officers, directors and their affiliates, and it may depress the trading price of our Class A common stock.
Our Class B common stock has ten votes per share and our Class A common stock has one vote per share. Our stockholders who held shares prior to our initial public offering, all of which hold shares of Class B common stock, collectively own shares representing approximately 98% of the voting power of our outstanding capital stock as of December 31, 2019. MMMK Development, Inc., an entity controlled by our co-chief executive officers, controls 68% of the voting power of our outstanding capital stock as of December 31, 2019 and therefore is able to control all matters submitted to our stockholders for approval, including the election of directors and approval of significant corporate transactions, such as a merger or other sale of our company or our assets, even if their stock holdings represent less than 50% of the outstanding shares of our capital stock. Our co-chief executive officers may have interests that differ from yours and may vote in a way with which you disagree and which may be adverse to your interests. This concentration of ownership will limit the ability of other stockholders to influence corporate matters and may cause us to make strategic decisions that could involve risks to you or that may not be aligned with your interests.
This control may also adversely affect the market price of our Class A common stock. In July 2017, FTSE Russell and Standard & Poor’s announced that they would cease to allow most newly public companies utilizing dual or multi-class capital structures to be included in their indices. Affected indices include the Russell 2000 and the S&P 500, S&P MidCap 400 and S&P SmallCap 600, which together make up the S&P Composite 1500. Under the announced policies, our dual class capital structure would make us ineligible for inclusion in any of these indices, and as a result, mutual funds, exchange-traded funds and other investment vehicles that attempt to passively track these indices will not be investing in our stock. It is possible that they may depress these valuations compared to those of other similar companies that are included in the indices.
39
If securities or industry analysts either do not publish research about us or publish inaccurate or unfavorable research about us, our business or our market, or if they adversely change their recommendations regarding our Class A common stock, the trading price or trading volume of our Class A common stock could decline.
The trading market for our Class A common stock will be influenced in part by the research and reports that securities or industry analysts may publish about us, our business, our market or our competitors. If one or more of the analysts initiate research with an unfavorable rating or downgrade our Class A common stock, provide a more favorable recommendation about our competitors or publish inaccurate or unfavorable research about our business, our Class A common stock price would likely decline. If any analyst who may cover us were to cease coverage of us or fail to regularly publish reports on us, we could lose visibility in the financial markets, which in turn could cause the trading price or trading volume of our Class A common stock to decline.
We are an emerging growth company, and any decision on our part to comply only with certain reduced reporting and disclosure requirements applicable to emerging growth companies could make our Class A common stock less attractive to investors.
We are an emerging growth company, and for as long as we continue to be an emerging growth company, we may choose to take advantage of exemptions from various reporting requirements applicable to other public companies but not to “emerging growth companies,” including:
|
|
• |
not being required to have our independent registered public accounting firm audit our internal control over financial reporting under Section 404 of the Sarbanes-Oxley Act; |
|
|
• |
reduced disclosure obligations regarding executive compensation in our periodic reports and annual report on Form 10-K; and |
|
|
• |
exemptions from the requirements of holding non-binding advisory votes on executive compensation and stockholder approval of any golden parachute payments not previously approved. |
We could be an emerging growth company for up to five years following the completion of our initial public offering, although we expect to not be an emerging growth company sooner. Our status as an emerging growth company will end as soon as any of the following takes place:
|
|
• |
the last day of the fiscal year in which we have more than $1.07 billion in annual revenue; |
|
|
• |
the date we qualify as a “large accelerated filer,” with at least $700.0 million of equity securities held by non-affiliates; |
|
|
• |
the date on which we have issued, in any three-year period, more than $1.0 billion in non-convertible debt securities; or |
|
|
• |
the last day of the fiscal year ending after the fifth anniversary of the completion of our initial public offering. |
We cannot predict if investors will find our Class A common stock less attractive if we choose to rely on any of the exemptions afforded emerging growth companies. If some investors find our Class A common stock less attractive because we rely on any of these exemptions, there may be a less active trading market for our Class A common stock and the market price of our Class A common stock may be more volatile.
Under the JOBS Act, emerging growth companies can also delay adopting new or revised accounting standards until such time as those standards apply to private companies. We have elected to take advantage of this extended transition period, and as a result, our financial statements may not be comparable with similarly situated public companies.
40
We have elected to take advantage of the “controlled company” exemption to the corporate governance rules for NYSE-listed companies, which could make our Class A common stock less attractive to some investors or otherwise harm our stock price.
Because we qualify as a “controlled company” under the corporate governance rules for NYSE-listed companies, we are not required to have a majority of our board of directors be independent, nor are we required to have a compensation committee or an independent nominating function. In light of our status as a controlled company, in the future we could elect not to have a majority of our board of directors be independent or not to have a compensation committee or nominating and corporate governance committee. Accordingly, should the interests of our management and MMMK Development, Inc., an entity controlled by our co-chief executive officers, differ from those of other stockholders, the other stockholders may not have the same protections afforded to stockholders of companies that are subject to all of the corporate governance rules for NYSE-listed companies. Our status as a controlled company could make our Class A common stock less attractive to some investors or otherwise harm our stock price.
Future securities issuances could result in significant dilution to our stockholders and impair the market price of our Class A common stock.
Future issuances of shares of our Class A common stock or the conversion of a substantial number of shares of our Class B common stock, or the perception that these sales or conversions may occur, could depress the market price of our Class A common stock and result in dilution to existing holders of our Class A common stock. Also, to the extent outstanding options and warrants to purchase our shares of our Class A or Class B common stock are exercised or options or other equity-based awards are issued or become vested, there will be further dilution. The amount of dilution could be substantial depending upon the size of the issuances or exercises. Furthermore, we may issue additional equity securities that could have rights senior to those of our Class A common stock.
As of December 31, 2019, there were 4,916,074 shares of Class B common stock subject to outstanding options. All of the shares of Class A common stock issuable upon the conversion of shares of Class B common stock subject to outstanding options have been registered for public resale under the Securities Act. Accordingly, these shares are able to be freely sold in the public market upon issuance as permitted by any applicable vesting requirements, and subject to compliance with applicable securities laws.
In addition, the holders of all of our Class B common stock have rights, subject to certain conditions, to require us to file registration statements for the public resale of the shares of Class A common stock issuable upon conversion of their shares of Class B common stock, or to include such shares in registration statements that we may file.
The requirements of being a public company may strain our resources, result in more litigation and divert management’s attention.
As a public company, we are subject to the reporting requirements of the Exchange Act, the Sarbanes-Oxley Act, the Dodd-Frank Act, the listing requirements of the NYSE and other applicable securities rules and regulations. Complying with these rules and regulations has increased and will increase our legal and financial compliance costs, make some activities more difficult, time consuming or costly and increase demand on our systems and resources. To address these challenges, we recently expanded our finance and accounting teams. The Exchange Act requires, among other things, that we file annual, quarterly and current reports with respect to our business and operating results. The Sarbanes-Oxley Act requires, among other things, that we maintain effective disclosure controls and procedures and internal control over financial reporting. We are required to disclose changes made in our internal control and procedures on a quarterly basis. In order to maintain and, if required, improve our disclosure controls and procedures and internal control over financial reporting to meet this standard, significant resources and management oversight may be required. As a result, management’s attention may be diverted from other business concerns, which could adversely affect our business and operating results. We may need to hire additional employees or engage outside consultants to comply with these requirements, which will increase our costs and expenses.
41
In addition, changing laws, regulations and standards relating to corporate governance and public disclosure are creating uncertainty for public companies, increasing legal and financial compliance costs and making some activities more time consuming. These laws, regulations and standards are subject to varying interpretations, in many cases due to their lack of specificity, and, as a result, their application in practice may evolve over time as new guidance is provided by regulatory and governing bodies. This could result in continuing uncertainty regarding compliance matters and higher costs necessitated by ongoing revisions to disclosure and governance practices. We intend to invest resources to comply with evolving laws, regulations and standards, and this investment may result in increased general and administrative expenses and a diversion of management’s time and attention from revenue-generating activities to compliance activities. If our efforts to comply with new laws, regulations and standards differ from the activities intended by regulatory or governing bodies due to ambiguities related to their application and practice, regulatory authorities may initiate legal proceedings against us and our business may be adversely affected.
These new rules and regulations may make it more expensive for us to obtain director and officer liability insurance, and in the future, we may be required to accept reduced coverage or incur substantially higher costs to obtain coverage. These factors could also make it more difficult for us to attract and retain qualified members of our board of directors, particularly to serve on our audit committee and compensation committee, and qualified executive officers.
By disclosing information in filings required of a public company, our business and financial condition will become more visible, which we believe may result in threatened or actual litigation, including by competitors and other third parties. If those claims are successful, our business could be seriously harmed. Even if the claims do not result in litigation or are resolved in our favor, the time and resources needed to resolve them could divert our management’s resources and seriously harm our business.
Delaware law and provisions in our certificate of incorporation and bylaws could make a merger, tender offer or proxy contest difficult, thereby depressing the trading price of our Class A common stock.
Our certificate of incorporation and bylaws contain provisions that could depress the trading price of our Class A common stock by acting to discourage, delay or prevent a change of control of our company or changes in our management that the stockholders of our company may deem advantageous. These provisions include the following:
|
|
• |
permit the board of directors to establish the number of directors and fill any vacancies and newly created directorships; |
|
|
• |
require super-majority voting to amend some provisions in our certificate of incorporation and bylaws; |
|
|
• |
authorize the issuance of “blank check” preferred stock that our board of directors could use to implement a stockholder rights plan; |
|
|
• |
eliminate the ability of our stockholders to call special meetings of stockholders; |
|
|
• |
prohibit stockholder action by written consent, which requires all stockholder actions to be taken at a meeting of our stockholders; |
|
|
• |
provide that the board of directors is expressly authorized to make, alter or repeal our bylaws; |
|
|
• |
restrict the forum for certain litigation against us to Delaware; |
|
|
• |
reflect the dual class structure of our common stock; and |
|
|
• |
establish advance notice requirements for nominations for election to our board of directors or for proposing matters that can be acted upon by stockholders at annual stockholder meetings. |
Any provision of our certificate of incorporation or bylaws or Delaware law that has the effect of delaying or deterring a change in control could limit the opportunity for our stockholders to receive a premium for their shares of our common stock, and could also affect the price that some investors are willing to pay for our Class A common stock.
42
Our bylaws provide that the Court of Chancery of the State of Delaware (or, if the Court of Chancery does not have jurisdiction, the federal district court for the District of Delaware) will be the exclusive forums for substantially all disputes between us and our stockholders, which could limit our stockholders’ ability to obtain a favorable judicial forum for disputes with us or our directors, officers or employees.
Our bylaws provide that the Court of Chancery of the State of Delaware (or, if the Court of Chancery does not have jurisdiction, the federal district court for the District of Delaware) is the exclusive forum for:
|
|
• |
any derivative action or proceeding brought on our behalf; |
|
|
• |
any action asserting a breach of fiduciary duty; |
|
|
• |
any action asserting a claim against us arising under the Delaware General Corporation Law, our certificate of incorporation or our bylaws; and |
|
|
• |
any action asserting a claim against us that is governed by the internal-affairs doctrine. |
These exclusive-forum provisions may limit a stockholder’s ability to bring a claim in a judicial forum that it finds favorable for disputes with us or our directors, officers or other employees, which may discourage lawsuits against us and our directors, officers and other employees. If a court were to find the exclusive-forum provision in our bylaws to be inapplicable or unenforceable in an action, we may incur additional costs associated with resolving the dispute in other jurisdictions, which could seriously harm our business. These exclusive-forum provisions do not apply to claims under the Securities Act or the Exchange Act.
None.
We currently occupy approximately 382,200 square feet of office and warehouse space in the state of California, United States, with leases that expire between 2020 and 2023. In September 2018, we entered into a five-year lease for approximately 281,000 square feet of fulfillment and office space located in Cerritos, California. In the first quarter of 2019, we consolidated substantially all of our fulfillment activities into this centralized facility and have terminated the lease of our existing distribution facility. In May 2019 and June 2019, we sublet two of our existing fulfillment centers through their remaining lease terms. In October 2019, we sublet the warehouse portion of one of our fulfillment centers through its remaining lease term.
The following table sets forth information with respect to our facilities:
|
Location |
|
Type |
|
Square Footage (approximate) |
|
|
Lease Expiration |
|
|
Cerritos, California |
|
Corporate Headquarters/Fulfillment Center |
|
|
281,100 |
|
|
2023 |
|
Cerritos, California(1) |
|
Fulfillment Center |
|
|
73,500 |
|
|
2020 |
|
Cerritos, California(1) |
|
Fulfillment Center |
|
|
38,700 |
|
|
2020 |
|
Cerritos, California |
|
Office Space |
|
|
23,700 |
|
|
2020 |
|
Cerritos, California(1) |
|
Fulfillment Center |
|
|
28,200 |
|
|
2021 |
|
Los Angeles, California |
|
Office Space |
|
|
40,800 |
|
|
2022 |
|
Los Angeles, California |
|
Social Club |
|
|
3,300 |
|
|
2020 |
|
(1) |
Properties are sublet through the remainder of their respective lease terms. |
43
From time to time, we are involved in legal proceedings and subject to claims that arise in the ordinary course of business. Although the results of legal proceedings and claims cannot be predicted with certainty, we believe we are not currently party to any legal proceedings which, if determined adversely to us, would individually or taken together have a material adverse effect on our business, operating results, cash flows or financial condition. We also pursue litigation to protect our legal rights and additional litigation may be necessary in the future to enforce our intellectual property and our contractual rights, to protect our confidential information or to determine the validity and scope of the proprietary rights of others.
We are a defendant in a purported class action lawsuit filed in the Superior Court of California, Los Angeles County, which was filed in May 2019, arising from employee wage-and-hour claims under California law for alleged meal period, rest period, payment of wages at separation, wage statement violations, and unfair business practices. On January 6, 2020, we and the individual defendant in the case entered into a binding memorandum of understanding to settle the case, which will need to be submitted for court approval prior to becoming final. As a result, we have accrued approximately $1.0 million to general and administrative expenses in the accompanying consolidated statement of income as of December 31, 2019.
Not applicable.
44
|
Item 5. |
MARKET FOR REGISTRANT’S COMMON EQUITY, RELATED STOCKHOLDER MATTERS AND ISSUER PURCHASES OF EQUITY SECURITIES |
Information with Respect to our Common Stock
Our Class A common stock is listed on the New York Stock Exchange, or NYSE, and began trading under the symbol “RVLV” on June 7, 2019.
Holders of Record
As of February 19, 2020, we had 124 holders of record of our Class A common stock and 17 holders of record of our Class B common stock. Because many of our shares of Class A common stock are held by brokers and other institutions on behalf of stockholders, we are unable to estimate the total number of beneficial owners of our Class A common stock represented by these holders.
Information with Respect to Dividends
We have never declared or paid cash dividends on our capital stock. We currently intend to retain all available funds and future earnings, if any, to fund the development and expansion of our business, and we do not anticipate paying any cash dividends in the foreseeable future. Any future determination regarding the declaration and payment of dividends, if any, will be at the discretion of our board of directors and will depend on then-existing conditions, including our financial condition, operating results, contractual restrictions, capital requirements, business prospects and other factors our board of directors may deem relevant. Our future ability to pay cash dividends on our capital stock is limited by the terms of our existing credit facility and may be limited by any future debt instruments or preferred securities.
Unregistered Sales of Equity Securities
None.
Issuer Purchases of Equity Securities
None.
Use of Proceeds from Public Offering of Common Stock
On June 7, 2019, we completed our IPO and sold 3,382,352 shares of our Class A common stock, including shares sold in connection with the exercise in full of the underwriters’ option to purchase additional shares, at a price to the public of $18.00 per share. The total gross proceeds to us from the offering were $60.9 million. After deducting underwriting discounts and commissions and offering expenses payable by us, the aggregate net proceeds received by us totaled approximately $53.3 million. We used $40.8 million of the net proceeds from the offering to repurchase an aggregate of 2,400,960 shares of Class B common stock held by TSG6 L.P. and certain of its affiliates, or TSG, and Capretto, LLC. No payments were made by us to directors, officers or persons owning 10% or more of our capital stock or to their associates, or to our affiliates, other than payments in the ordinary course of business to officers for salaries. There has been no material change in the planned use of proceeds from our initial public offering as described in our final prospectus filed with the SEC on June 7, 2019 pursuant to Rule 424(b) under the Securities Act of 1933. The managing underwriters of our initial public offering were Morgan Stanley & Co. LLC, Credit Suisse Securities (USA) LLC and BofA Securities, Inc.
45
Cumulative Stock Performance Graph
The following graph and table compare the performance of (1) an investment in our Class A common stock over the period of June 7, 2019 through December 31, 2019, beginning with an investment at the $34.00 closing market price on June 7, 2019, the end of the first day our Class A common stock traded on the NYSE following our initial public offering at $18.00 per share, and thereafter based on the closing price of our Class A common stock on the NYSE, with (2) an investment in the S&P 500 and the S&P Retail Select Industry, in each case beginning with an investment at the closing price on June 7, 2019 and thereafter based on the closing price of the index. The graph and table assume $100 was invested on the starting date at the price indicated above and that dividends, if any, were reinvested. The comparisons are based on historical data and are not indicative of, nor intended to forecast, the future performance of our Class A common stock.
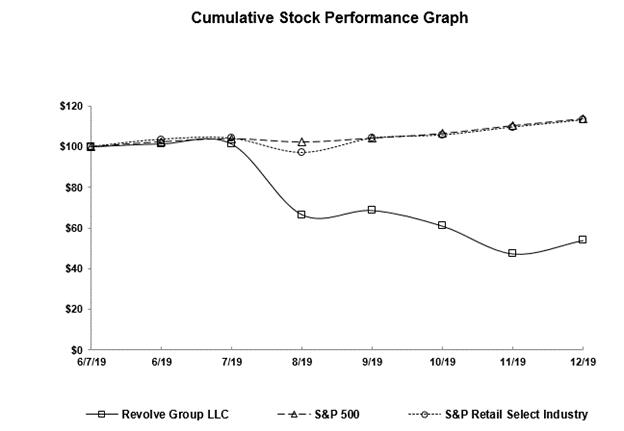
|
(in dollars) |
|
June 7, 2019 |
|
|
December 31, 2019 |
|
||
|
Revolve Group, Inc. |
|
$ |
100.00 |
|
|
$ |
54.00 |
|
|
S&P 500 |
|
$ |
100.00 |
|
|
$ |
113.67 |
|
|
S&P Retail Select Industry |
|
$ |
100.00 |
|
|
$ |
113.11 |
|
46
The following table sets forth certain of our historical financial data. We have derived the selected historical consolidated financial data for the years ended December 31, 2019, 2018, 2017 and 2016 from our consolidated financial statements and the related notes. Not all periods shown below are discussed in this Annual Report on Form 10-K. The selected consolidated historical financial data set forth below are not necessarily indicative of the results of future operations and should be read in conjunction with the discussion under Item 7 — Management’s Discussion and Analysis of Financial Condition and Results of Operations, and the historical consolidated financial statements and accompanying notes included elsewhere in this Annual Report on Form 10-K.
|
|
|
Years Ended December 31, |
|
|||||||||||||
|
|
|
2019(1) |
|
|
2018 |
|
|
2017 |
|
|
2016 |
|
||||
|
|
|
(in thousands, except per share data, average order value and percentages) |
|
|||||||||||||
|
Income Statement Data: |
|
|
|
|
|
|
|
|
|
|
|
|
|
|
|
|
|
Net sales |
|
$ |
600,993 |
|
|
$ |
498,739 |
|
|
$ |
399,597 |
|
|
$ |
312,082 |
|
|
Cost of sales |
|
|
279,040 |
|
|
|
233,433 |
|
|
|
205,907 |
|
|
|
166,707 |
|
|
Gross profit |
|
|
321,953 |
|
|
|
265,306 |
|
|
|
193,690 |
|
|
|
145,375 |
|
|
Operating expenses: |
|
|
|
|
|
|
|
|
|
|
|
|
|
|
|
|
|
Fulfillment |
|
|
19,413 |
|
|
|
13,292 |
|
|
|
9,458 |
|
|
|
8,618 |
|
|
Selling and distribution |
|
|
87,706 |
|
|
|
70,621 |
|
|
|
50,766 |
|
|
|
42,114 |
|
|
Marketing |
|
|
89,141 |
|
|
|
74,394 |
|
|
|
55,476 |
|
|
|
39,000 |
|
|
General and administrative |
|
|
77,595 |
|
|
|
65,201 |
|
|
|
57,468 |
|
|
|
50,102 |
|
|
Total operating expenses |
|
|
273,855 |
|
|
|
223,508 |
|
|
|
173,168 |
|
|
|
139,834 |
|
|
Income from operations |
|
|
48,098 |
|
|
|
41,798 |
|
|
|
20,522 |
|
|
|
5,541 |
|
|
Other expense, net |
|
|
931 |
|
|
|
631 |
|
|
|
1,431 |
|
|
|
895 |
|
|
Income before income taxes |
|
|
47,167 |
|
|
|
41,167 |
|
|
|
19,091 |
|
|
|
4,646 |
|
|
Provision for income tax |
|
|
11,500 |
|
|
|
10,529 |
|
|
|
14,091 |
|
|
|
2,448 |
|
|
Net income |
|
|
35,667 |
|
|
|
30,638 |
|
|
|
5,000 |
|
|
|
2,198 |
|
|
Less: Net loss attributable to non-controlling interest |
|
|
— |
|
|
|
47 |
|
|
|
347 |
|
|
|
205 |
|
|
Net income attributable to Revolve Group, Inc. |
|
|
35,667 |
|
|
|
30,685 |
|
|
|
5,347 |
|
|
|
2,403 |
|
|
Less: Repurchase of Class B common stock upon corporate conversion |
|
|
(40,816 |
) |
|
|
— |
|
|
|
— |
|
|
|
— |
|
|
Net (loss) income attributable to common stock holders: |
|
$ |
(5,149 |
) |
|
$ |
30,685 |
|
|
$ |
5,347 |
|
|
$ |
2,403 |
|
|
(Net loss) earnings per share of Class A and Class B common stock: |
|
|
|
|
|
|
|
|
|
|
|
|
|
|
|
|
|
Basic |
|
|
(0.09 |
) |
|
|
0.47 |
|
|
|
0.08 |
|
|
|
0.04 |
|
|
Diluted |
|
|
(0.09 |
) |
|
|
0.44 |
|
|
|
0.08 |
|
|
|
0.04 |
|
|
Weighted average Class A and Class B common shares outstanding: |
|
|
|
|
|
|
|
|
|
|
|
|
|
|
|
|
|
Basic |
|
|
57,294 |
|
|
|
41,936 |
|
|
|
41,936 |
|
|
|
41,936 |
|
|
Diluted |
|
|
57,294 |
|
|
|
44,584 |
|
|
|
44,044 |
|
|
|
43,786 |
|
|
Other Financial and Operating Data: |
|
|
|
|
|
|
|
|
|
|
|
|
|
|
|
|
|
Gross margin(2) |
|
|
53.6 |
% |
|
|
53.2 |
% |
|
|
48.5 |
% |
|
|
46.6 |
% |
|
Adjusted EBITDA(3) |
|
$ |
55,605 |
|
|
$ |
46,495 |
|
|
$ |
28,428 |
|
|
$ |
9,520 |
|
|
Free cash flow(4) |
|
$ |
33,602 |
|
|
$ |
23,610 |
|
|
$ |
14,217 |
|
|
$ |
(4,516 |
) |
|
Active customers(5) |
|
|
1,488 |
|
|
|
1,175 |
|
|
|
842 |
|
|
|
712 |
|
|
Total orders placed(6) |
|
|
4,715 |
|
|
|
3,710 |
|
|
|
2,552 |
|
|
|
1,999 |
|
|
Average order value(7) |
|
$ |
275 |
|
|
$ |
279 |
|
|
$ |
304 |
|
|
$ |
293 |
|
|
Consolidated Balance Sheet Data: |
|
|
|
|
|
|
|
|
|
|
|
|
|
|
|
|
|
Cash |
|
$ |
65,418 |
|
|
$ |
16,369 |
|
|
$ |
10,588 |
|
|
$ |
11,357 |
|
|
Working capital(8) |
|
|
97,816 |
|
|
|
56,897 |
|
|
|
29,530 |
|
|
|
19,418 |
|
|
Total assets |
|
|
232,290 |
|
|
|
162,074 |
|
|
|
123,976 |
|
|
|
116,085 |
|
|
Total liabilities |
|
|
101,526 |
|
|
|
82,256 |
|
|
|
75,988 |
|
|
|
74,008 |
|
|
Total equity |
|
$ |
130,764 |
|
|
$ |
79,818 |
|
|
$ |
47,988 |
|
|
$ |
42,077 |
|
|
(1) |
Reflects the adoption of Accounting Standards Codification (ASC) Topic 606, Revenue from Contracts with Customers. The prior periods have not been restated and continue to be reported under accounting standards in effect for those periods. For more information on the transitional impact of adopting ASC 606, please see the section entitled “Recent Accounting Pronouncements” in Note 2, Significant Accounting Policies of the consolidated financial statements included elsewhere in this Annual Report on Form 10-K. |
|
(2) |
Gross margin is gross profit as a percentage of our net sales. Gross profit is equal to our net sales less cost of sales. |
|
(3) |
To provide investors with additional information regarding our financial results, we have disclosed in the table above and elsewhere in this Annual Report on Form 10-K Adjusted EBITDA, a non-GAAP financial measure that we calculate as net income before other expense, net, taxes, depreciation and amortization, adjusted to exclude the effects of equity-based compensation expense, and certain non-routine items. We have provided below a reconciliation of Adjusted EBITDA to net income, the most directly comparable generally accepted accounting principles, or GAAP, financial measure. |
47
We have included Adjusted EBITDA in this Annual Report on Form 10-K because it is a key measure used by our management and board of directors to evaluate our operating performance, generate future operating plans and make strategic decisions regarding the allocation of capital. In particular, the exclusion of certain expenses in calculating Adjusted EBITDA facilitates operating performance comparisons on a period-to-period basis and, in the case of exclusion of the impact of equity-based compensation, excludes an item that we do not consider to be indicative of our core operating performance. Accordingly, we believe that Adjusted EBITDA provides useful information to investors and others in understanding and evaluating our operating results in the same manner as our management and board of directors.
Adjusted EBITDA has limitations as an analytical tool, and you should not consider it in isolation or as a substitute for analysis of our results as reported under GAAP. Some of these limitations are:
|
|
• |
although depreciation and amortization are non-cash charges, the assets being depreciated and amortized may have to be replaced in the future, and Adjusted EBITDA does not reflect cash capital expenditure requirements for such replacements or for new capital expenditure requirements; |
|
|
• |
Adjusted EBITDA does not reflect changes in, or cash requirements for, our working capital needs; |
|
|
• |
Adjusted EBITDA does not consider the potentially dilutive impact of equity-based compensation; |
|
|
• |
Adjusted EBITDA does not reflect tax payments that may represent a reduction in cash available to us; |
|
|
• |
Adjusted EBITDA does not reflect certain non-routine items that may represent a reduction in cash available to us; and |
|
|
• |
other companies, including companies in our industry, may calculate Adjusted EBITDA differently, which reduces its usefulness as a comparative measure. |
Because of these limitations, you should consider Adjusted EBITDA alongside other financial performance measures, including various cash flow metrics, net income and our other GAAP results.
Our financial results included certain items that we consider non-routine and not reflective of the underlying trends in our core business operations. Non-routine items in 2019 primarily related to legal settlements. Non-routine items in 2018 primarily related to our initial public offering as well expenses related to our entity restructuring. Non-routine items in 2017 included expenses related to our entity restructuring as well as one-time bonuses to certain employees. Non-routine items in 2016 included legal fees and a one-time employee severance. Although we believe these expenses to be non-routine in nature, we cannot guarantee that these expenses will not be incurred again in the future.
A reconciliation of non-GAAP adjusted EBITDA to net income is as follows:
|
|
|
Years Ended December 31, |
|
|||||||||||||
|
|
|
2019 |
|
|
2018 |
|
|
2017 |
|
|
2016 |
|
||||
|
|
|
(in thousands) |
|
|||||||||||||
|
Net income |
|
$ |
35,667 |
|
|
$ |
30,638 |
|
|
$ |
5,000 |
|
|
$ |
2,198 |
|
|
Excluding: |
|
|
|
|
|
|
|
|
|
|
|
|
|
|
|
|
|
Other expense, net |
|
|
931 |
|
|
|
631 |
|
|
|
1,431 |
|
|
|
895 |
|
|
Provision for income tax |
|
|
11,500 |
|
|
|
10,529 |
|
|
|
14,091 |
|
|
|
2,448 |
|
|
Depreciation and amortization |
|
|
3,952 |
|
|
|
2,867 |
|
|
|
2,849 |
|
|
|
2,367 |
|
|
Equity-based compensation |
|
|
2,067 |
|
|
|
1,400 |
|
|
|
911 |
|
|
|
20 |
|
|
Non-routine items |
|
|
1,488 |
|
|
|
430 |
|
|
|
4,146 |
|
|
|
1,592 |
|
|
Adjusted EBITDA |
|
$ |
55,605 |
|
|
$ |
46,495 |
|
|
$ |
28,428 |
|
|
$ |
9,520 |
|
|
(4) |
To provide investors with additional information regarding our financial results, we have also disclosed in the table above and elsewhere in this Annual Report on Form 10-K free cash flow, a non-GAAP financial measure that we calculate as net cash provided by (used in) operating activities less cash used in purchases of property and equipment. We have provided below a reconciliation of free cash flow to net cash provided by (used in) operating activities, the most directly comparable GAAP financial measure. |
We have included free cash flow in this Annual Report on Form 10-K because it is a key measure used by our management and board of directors, which we believe is an important indicator of our liquidity because it measures the amount of cash we generate. Free cash flow also reflects changes in working capital. Accordingly, we believe that free cash flow provides useful information to investors and others in understanding and evaluating our operating results in the same manner as our management and board of directors.
Free cash flow has limitations as an analytical tool, and you should not consider it in isolation or as a substitute for analysis of our results as reported under GAAP. There are limitations to using non-GAAP financial measures, including that other companies, including companies in our industry, may calculate free cash flow differently. Because of these limitations, you should consider free cash flow alongside other financial performance measures, including net cash provided by (used in) operating activities, purchases of property and equipment and our other GAAP results.
48
The following table presents a reconciliation of free cash flow to net cash provided by (used in) operating activities, as well as information regarding net cash used in investing activities and net cash provided by (used in) financing activities, for each of the periods indicated:
|
|
|
Years Ended December 31, |
|
|||||||||||||
|
|
|
2019 |
|
|
2018 |
|
|
2017 |
|
|
2016 |
|
||||
|
|
|
(in thousands) |
|
|||||||||||||
|
Net cash provided by (used in) operating activities |
|
$ |
46,057 |
|
|
$ |
26,655 |
|
|
$ |
16,479 |
|
|
$ |
(1,490 |
) |
|
Purchases of property and equipment |
|
|
(12,455 |
) |
|
|
(3,045 |
) |
|
|
(2,262 |
) |
|
|
(3,026 |
) |
|
Free cash flow |
|
$ |
33,602 |
|
|
$ |
23,610 |
|
|
$ |
14,217 |
|
|
$ |
(4,516 |
) |
|
Net cash used in investing activities(9) |
|
$ |
(12,455 |
) |
|
$ |
(3,045 |
) |
|
$ |
(2,262 |
) |
|
$ |
(3,026 |
) |
|
Net cash provided by (used in) financing activities |
|
|
15,179 |
|
|
|
(17,621 |
) |
|
|
(15,086 |
) |
|
|
5,142 |
|
|
(5) |
We define an active customer as an individual customer who has purchased from us at least once in the preceding 12-month period. In any particular period, we determine our number of active customers by counting the total number of unique customers who have made at least one purchase in the preceding 12-month period, measured from the last date of such period. |
|
(6) |
We define total orders placed as the total number of customer orders placed by our customers in any period. |
|
(7) |
We define average order value as the sum of the total gross sales from orders on our sites in a given period divided by the total orders placed in that period. |
|
(8) |
Working capital for all periods presented above is defined as current assets less current liabilities. |
|
(9) |
Net cash used in investing activities includes payments for purchases of property and equipment, which is also included in our calculation of free cash flow. |
49
The following discussion and analysis of our financial condition and results of operations should be read in conjunction with Item 6 — Selected Financial Data and our consolidated financial statements and related notes, each included elsewhere in this Annual Report on Form 10-K. This discussion contains forward-looking statements based upon current plans, expectations and beliefs that involve risks and uncertainties. Our actual results and the timing of certain events could differ materially from those anticipated in or implied by these forward-looking statements as a result of several factors, including those discussed in the section titled “Risk Factors” included under Part I, Item 1A and elsewhere in this Annual Report. See “Forward-Looking Statements” in this Annual Report.
A discussion regarding our financial condition and results of operations for fiscal year ended December 31, 2018, compared to the fiscal year ended December 31, 2017, can be found in our prospectus filed pursuant to Rule 424(b) under the Securities Act of 1933, as amended, with the SEC on June 7, 2019.
Overview
REVOLVE is the next-generation fashion retailer for Millennial and Generation Z consumers. As a trusted, premium lifestyle brand, and a go-to online source for discovery and inspiration, we deliver an engaging customer experience from a vast yet curated offering of apparel, footwear, accessories and beauty styles. Our dynamic platform connects a deeply engaged community of millions of consumers, thousands of global fashion influencers, and hundreds of emerging, established and owned brands. Through 17 years of continued investment in technology, data analytics, and innovative marketing and merchandising strategies, we have built a powerful platform and brand that we believe is connecting with the next generation of consumers and is redefining fashion retail for the 21st century.
We were founded in 2003 by our co-CEOs, Michael Mente and Mike Karanikolas. We sell merchandise through two differentiated segments, REVOLVE and FORWARD, that leverage one platform. Through REVOLVE we offer a highly-curated assortment of full-price premium apparel and footwear, accessories and beauty products from emerging, established and owned brands. Through FORWARD we offer an assortment of iconic and emerging luxury brands. We believe that FORWARD provides our customer with a destination for luxury products as her spending power increases and her desire for fashion and inspiration remains central to her self-expression.
We believe our product mix reflects the desires of the next-generation consumer and we optimize this mix through the identification and incubation of emerging brands and continued development of our owned brand portfolio. In 2019, emerging third-party brands, established third-party brands, owned brands and other net sales contributed approximately 40%, 23%, 36% and 1% of net sales through the REVOLVE segment, respectively. The focus on emerging and owned brands minimizes our assortment overlap with other retailers, supporting marketing efficiency, conversion and sales at full price.
We have invested in our robust and scalable internally-developed technology platform to meet the specific needs of our business and to support our customers’ experience. We use proprietary algorithms and 17 years of data to efficiently manage our merchandising, marketing, product development, sourcing and pricing decisions. Our platform works seamlessly across devices and analyzes browsing and purchasing patterns and preferences to help us make purchasing decisions, which when combined with the small initial orders for new products, allows us to manage inventory and fashion risk. We have also invested in our creative capabilities to produce high-quality visual merchandising that caters to our customers by focusing on style with a distinct point of view rather than on individual products. The combination of our online sales platform and our in-house creative photography allows us to showcase brands in a distinctive and compelling manner.
We are pioneers of social media and influencer marketing, using social channels and cultural events designed to deliver authentic and aspirational, yet attainable, experiences to attract and retain Millennial consumers, and these efforts have led to higher earned media value than competitors. We complement our social media efforts through a variety of brand marketing campaigns and events, which generate a constant flow of authentic content. While social media and influencer marketing are key components of our strategy, approximately 75% of our marketing expenses is devoted to performance marketing efforts. Once we have attracted potential new customers to our sites, our goal is to convert them into active customers and then encourage repeat purchases. We acquire and retain customers through retargeting, paid search/product listing ads, affiliate marketing, paid social, personalized email marketing and mobile “push” communications through our app.
50
We have developed an efficient logistics infrastructure, which allows us to provide free shipping and returns to our customers in the United States. We support our logistics network with proprietary algorithms to optimize inventory allocation, reduce shipping and fulfillment expenses and deliver merchandise quickly and efficiently to our customers, which allows us to ship approximately 98% of orders on the same day if placed before noon Pacific Time or the next business day if placed after. In 2019, we expanded our capacity by occupying a new centralized warehouse facility, which we believe will support growth beyond 2023.
To date, we have primarily focused on expanding our U.S. business and have grown internationally with limited investment and no physical presence. We began offering a more localized shopping experience, including free returns and all-inclusive pricing, for customers in the United Kingdom and the European Union in May 2018, in Australia in late 2018, and in New Zealand and Singapore in January 2020. For 2019 and 2018, we generated $98.1 million and $89.4 million, respectively, in net sales shipped to customers internationally, or 16.3% and 17.9% of total net sales, respectively. In addition to expanding our global footprint of influencers, we are gradually increasing our level of investment in international expansion, by focusing on Europe, Australia and Canada as well as Asia Pacific over the long term. We will continue to invest in and develop international markets while maintaining our focus on the core U.S. market.
Key Operating and Financial Metrics
We use the following metrics to assess the progress of our business, make decisions on where to allocate capital, time and technology investments and assess the near-term and longer-term performance of our business.
|
|
|
Years Ended December 31, |
|
|||||||||
|
|
|
2019 |
|
|
2018 |
|
|
2017 |
|
|||
|
|
|
(in thousands, except average order value and percentages) |
|
|||||||||
|
Gross margin |
|
|
53.6 |
% |
|
|
53.2 |
% |
|
|
48.5 |
% |
|
Adjusted EBITDA |
|
$ |
55,605 |
|
|
$ |
46,495 |
|
|
$ |
28,428 |
|
|
Free cash flow |
|
$ |
33,602 |
|
|
$ |
23,610 |
|
|
$ |
14,217 |
|
|
Active customers |
|
|
1,488 |
|
|
|
1,175 |
|
|
|
842 |
|
|
Total orders placed |
|
|
4,715 |
|
|
|
3,710 |
|
|
|
2,552 |
|
|
Average order value |
|
$ |
275 |
|
|
$ |
279 |
|
|
$ |
304 |
|
Adjusted EBITDA and free cash flow are non-GAAP measures. See the section captioned “Item 6 — Selected Financial Data” for information regarding our use of Adjusted EBITDA and free cash flow and their reconciliation to net income and net cash provided by operating activities, respectively.
Gross Margin
Gross profit is equal to our net sales less cost of sales. Gross profit as a percentage of our net sales is referred to as gross margin. Cost of sales consists of our purchase price of merchandise sold to customers and includes import duties and other taxes, freight in, defective merchandise returned from customers, receiving costs, inventory write-offs, and other miscellaneous shrinkage.
Gross margin is impacted by the mix of brands that we sell on our sites. Gross margin on sales of owned brands is higher than that for third-party brands. Gross margin is also affected by the percentage of sales through the REVOLVE segment, which consists primarily of emerging third-party, established third-party and owned brands, compared to our FORWARD segment, which consists primarily of established third-party brands. One of our long-term strategies has been to increase the percentage of net sales from owned brands given the attractive margin profile associated with them. However, in the near term, we expect that the contribution of owned brands will moderate or potentially decrease, which would adversely impact our overall gross margin. Merchandise mix will vary from period to period and if we do not effectively manage our owned brands and accurately forecast demand, our growth, margins and inventory levels may be adversely affected.
51
We review our inventory levels on an ongoing basis to identify slow-moving merchandise and use product markdowns to efficiently sell these products. We monitor the percentage of sales that occur at full price, which we believe reflects customer acceptance of our merchandise and the sense of urgency we create through frequent product introductions in limited quantities. Gross margin is impacted by the mix of sales at full price and markdowns, as well as the level of markdowns.
Certain of our competitors and other retailers report cost of sales differently than we do. As a result, the reporting of our gross profit and gross margin may not be comparable to other companies.
Adjusted EBITDA
Adjusted EBITDA is a non-GAAP financial measure that we calculate as net income before other expense, net, taxes, depreciation and amortization, adjusted to exclude the effects of equity-based compensation expense and certain non-routine items. Adjusted EBITDA is a key measure used by management to evaluate our operating performance, generate future operating plans and make strategic decisions regarding the allocation of capital. In particular, the exclusion of certain expenses in calculating Adjusted EBITDA facilitates operating performance comparisons on a period-to-period basis and, in the case of exclusion of the impact of equity-based compensation, excludes an item that we do not consider to be indicative of our core operating performance. See the section captioned “Item 6 — Selected Financial Data” for information regarding our use of Adjusted EBITDA and a reconciliation of Adjusted EBITDA to net income, the most directly comparable GAAP measurement, for the periods presented.
Free Cash Flow
Free cash flow is a non-GAAP financial measure that we calculate as net cash provided by (used in) operating activities less net cash used in capital expenditures. We view free cash flow as an important indicator of our liquidity because it measures the amount of cash we generate. Free cash flow also reflects changes in working capital. See the section captioned “Item 6 — Selected Financial Data” for information regarding our use of free cash flow and a reconciliation of free cash flow to net cash provided by (used in) operating activities, the most directly comparable GAAP measurement, for the periods presented.
Adjusted Diluted Earnings per Share
Adjusted diluted earnings per share is a non-GAAP financial measure that we calculate as diluted earnings (net loss) per share adjusted to exclude the per share impact of the issuance and repurchase of Class B common stock as part of our initial public offering, or IPO. We believe adjusted earnings per share, excluding the impact of the repurchase of our Class B common stock, is a measure that is useful to investors and management in understanding our ongoing operations and in analysis of ongoing operating trends. See Note 9, (Net loss) Earnings per Share, of our consolidated financial statements included elsewhere in this Annual Report on Form 10-K for more information regarding our calculation of (net loss) earnings per share.
A reconciliation of non-GAAP adjusted diluted earnings per share to diluted (net loss) earnings per share for the years ended December 31, 2019, 2018 and 2017 is as follows (in dollars):
|
|
|
Years Ended December 31, |
|
|||||||||||||
|
|
|
2019 |
|
|
2018 |
|
|
2017 |
|
|||||||
|
|
|
Class A |
|
|
Class B |
|
|
Class B |
|
|
Class B |
|
||||
|
(Net loss) earnings per share — diluted |
|
$ |
(0.09 |
) |
|
$ |
(0.09 |
) |
|
$ |
0.44 |
|
|
$ |
0.08 |
|
|
Repurchase of Class B common stock, net |
|
|
0.59 |
|
|
|
0.59 |
|
|
|
— |
|
|
|
— |
|
|
Adjusted earnings per share — diluted |
|
$ |
0.50 |
|
|
$ |
0.50 |
|
|
$ |
0.44 |
|
|
$ |
0.08 |
|
52
Active Customers
We define an active customer as a unique customer account from which a purchase was made across our platform at least once in the preceding 12-month period. We calculate the number of active customers on a trailing 12-month basis given the volatility that can be observed when calculating it on the basis of shorter periods that may not be reflective of longer-term trends; however, such a methodology may not be indicative of other short-term trends, such as changes in new customers. In any particular period, we determine our number of active customers by counting the total number of customers who have made at least one purchase in the preceding 12-month period, measured from the last date of such period. We view the number of active customers as a key indicator of our growth, the reach of our sites, the value proposition and consumer awareness of our brand, the continued use of our sites by our customers and their desire to purchase our products. We believe the number of active customers is a measure that is useful to investors and management in understanding our growth, brand awareness and market opportunity. Our number of active customers drives both net sales and our appeal to vendors.
Total Orders Placed
We define total orders placed as the total number of customer orders placed by our customers across our platform in any period. We view total orders placed as a key indicator of the velocity of our business and an indication of the desirability of our products and sites to our customers. Total orders placed, together with average order value, is an indicator of the net sales we expect to recognize in a given period. We believe that total orders placed is a measure that is useful to investors and management in understanding our ongoing operations and in analysis of ongoing operating trends. In 2019, average order value for merchandise sold through the REVOLVE and FORWARD segments was approximately $256 and $636, respectively, reflecting the brands sold and typical profile of the shoppers on such sites. Total orders placed and total orders shipped in any given period may differ slightly due to orders that are in process at the end of any particular period.
Average Order Value
We define average order value as the sum of the total gross sales from our sites in a given period divided by the total orders placed in that period. We believe our high average order value demonstrates the premium nature of our product. We believe that average order value is a measure that is useful to investors and management in understanding our ongoing operations and in analysis of ongoing operating trends. Average order value varies depending on the site through which we sell merchandise, the percentage of sales at full price and for sales at less than full price, the level of markdowns. Average order value may also fluctuate as we expand into and increase our presence in additional product categories and price points, including the expansion of lower price points including the launch of the superdown.com site in 2019.
Factors Affecting Our Performance
Overall Economic Trends
The overall economic environment and related changes in consumer behavior have a significant impact on our business. In general, positive conditions in the broader economy promote customer spending on our sites, while economic weakness, which generally results in a reduction of customer spending, may have a more pronounced negative effect on spending on our sites. Macroeconomic factors that can affect customer spending patterns, and thereby our results of operations, include employment rates, business conditions, changes in the housing market, the availability of credit, interest rates, fuel and energy costs, geo-political activity and region-specific or worldwide health crises. In addition, during periods of low unemployment, we generally experience higher labor costs.
53
Customer Acquisition and Growth in Brand Awareness
Our focus since inception has been on profitable growth, which has created our disciplined approach to acquiring new customers and retaining existing customers at a reasonable cost, relative to the contributions we expect from such customers. Growth in the number of new customers has in the past, and is expected in the future, to vary from period to period and the percentage of new customer growth rate may slow as our customer base grows. Failure to attract new visitors to our sites and convert them to customers impacts future net sales growth. As social media and influencer based marketing gains popularity, the market for these channels has become increasingly competitive. We believe we have maintained the effectiveness and efficiency of these channels in recent periods; however, if competition continues to increase, it may impact our operating results.
We intend to continue investing in our brand marketing efforts, with a specific focus on increasing REVOLVE brand awareness. Since 2013 we have made significant investments to strengthen the REVOLVE brand through a series of high-profile events and expansion of our social media presence. If we fail to cost-effectively promote our brand or convert impressions into new customers, our net sales growth and profitability would be adversely affected.
Customer Retention
Our success is impacted not only by efficient and profitable customer acquisition and growth in brand awareness, but also by our ability to retain customers and encourage repeat purchases. Existing customers, whom we define as customers in a year who have purchased from us in any prior year, account for a greater and greater share of active customers over time. Existing customers as a percentage of total active customers were 33%, 33%, 38%, 41%, 41% and 45% for 2014, 2015, 2016, 2017, 2018 and 2019, respectively.
Existing customers place more orders annually than new customers, resulting in existing customers representing approximately 71% of orders and approximately 74% of net sales in 2019, up from 57% of orders and 58% of net sales in 2014, again having increased in each year. We believe these increasing metrics are reflective of our ability to engage and retain our customers through our differentiated marketing and compelling merchandise offering and shopping experience. The increasing share of our net sales from existing customers reflects our customer loyalty and the net sales retention behavior we see in our cohorts. This cohort behavior demonstrates our ability to not only retain customers, but also increase the customers’ spend on our platform as our loyal customers place orders more frequently and at increasing average order values.
We have substantially increased the net sales contribution and retention from existing customer cohorts as our active customer base has grown. Cohort net sales retention is calculated as net sales attributable to a given customer cohort divided by the total net sales attributable to the same customer cohort from one year prior. In 2019, we retained 89% of the prior cohorts’ net sales in 2018, which represents an improvement from 84% net sales retention in 2014. We believe that the trends reflected by these cohorts are illustrative of the value of our customer base; however, changes in customer retention and purchasing patterns could adversely impact our operating results.
Merchandise Mix
We offer merchandise across a variety of product types, brands and price points. The brands we sell on our platform consist of a mix of emerging third-party, established third-party and owned brands. Our product mix consists primarily of apparel, footwear and accessories. In 2016, we launched beauty products on REVOLVE and expect to offer additional product types in the future. We sell merchandise across a broad range of price points and we launched superdown, our lower price point site in early 2019 that further broadens our price point offerings.
Our merchandise mix across our two reporting segments and across our owned brand and third-party products within the REVOLVE segment carry a range of margin profiles and may cause fluctuations in our gross margin. For example, our owned brands have generally contributed higher gross margin as compared to third-party brands. Historically, we have sought to increase the percentage of net sales from owned brands, which has led to an increase in gross margin over time. The mix between owned and third-party net sales and the pace of growth for owned-brand net sales will vary. In the near term, we expect that the contribution of owned brands will moderate or potentially decrease, which would adversely impact our overall gross margin. In addition, shifts in merchandise mix driven by customer demand may result in fluctuations in our gross margin from period to period.
54
We leverage our platform to buy and manage our inventory, including merchandise assortment and fulfillment center optimization. We utilize a data-driven “read and react” buying process to merchandise and curate the latest on-trend fashion. We make shallow initial inventory buys, and then use our proprietary technology tools to identify and re-order best sellers, taking into account customer feedback across a variety of key metrics, which allows us to manage inventory and fashion risk. To ensure sufficient availability of merchandise, we generally purchase inventory in advance and frequently before apparel trends are confirmed. As a result, we are vulnerable to demand and pricing shifts and to suboptimal selection and timing of merchandise purchases. We incur inventory write-offs, which impact our gross margins. Moreover, our inventory investments will fluctuate with the needs of our business. For example, entering new categories will require additional investments in inventory. Shifts in inventory levels may result in fluctuations in the percentage of full price sales, levels of markdowns, merchandise mix, as well as gross margin. In recent periods, our inventory position has increased at a greater rate than that of net sales, particularly in our REVOLVE segment where we have made significant investments in our owned brand platform and the launch of the superdown.com site, our lower price point offering. We believe our efforts to manage inventory levels have impacted the percentage of sales at full price, gross margins on marked-down merchandise, and gross margin in the current period and will likely continue to impact the percentage of sales at full price, gross margin on marked-down merchandise, and gross margin in the near term. These efforts have and may continue to impact the pace of growth in net sales in the near term.
Investment in our Operations and Infrastructure
To grow our client base and enhance our offering, we will incur additional expenses. We intend to leverage our platform and understanding of fashion trends to inform investments in operations and infrastructure. We anticipate that our expenses will increase as we continue to hire additional personnel and further improve our platform. Moreover, we have made and will continue to make capital investments in our inventory, fulfillment center, and logistics infrastructure as we launch new brands, expand internationally and drive operating efficiencies. We expect to continue to invest in these areas in the future and cannot be certain that these efforts will grow our customer base or be cost-effective. However, we believe these strategies will yield positive returns in the long term.
Segment and Geographic Performance
Our financial results are affected by the performance across our two reporting segments, REVOLVE and FORWARD, as well as across the various geographies in which we serve our customers.
The REVOLVE segment contributes to a majority of our net sales, representing 87.7% and 86.9% of our net sales for the years ended December 31, 2019 and 2018, respectively. During the years ended December 31, 2019 and 2018, REVOLVE generated $527.3 million and $433.5 million in net sales, respectively, representing an increase of 21.6%. The net sales increase in the year ended December 31, 2019, as compared to 2018, was primarily due to an increase in the number of orders placed by customers, partially offset by a decrease in average order value. Contributing to the increase in orders and net sales was the investment in inventory to support the expansion of our owned brand platform and the launch of the superdown.com site, our lower price point offering. We believe our efforts to manage inventory levels have impacted, and may continue to impact, the pace of growth in net sales and our gross margin in the near term. If we are unable to re-accelerate net sales growth and improve gross margins as a result of the inventory correction, our financial results would be adversely impacted.
The FORWARD segment contributes to a smaller portion of our overall net sales, representing 12.3% and 13.1% or our net sales for the years ended December 31, 2019 and 2018, respectively. During the years ended December 31, 2019 and 2018, FORWARD generated $73.7 million and $65.2 million in net sales, respectively, representing an increase of 13.1%. The net sales increase in the year ended December 31, 2019, as compared to 2018, was primarily due to an increase in the number of orders placed by customers, partially offset by a decrease in average order value. After completing the normalization of our FORWARD segment inventory levels in the second quarter of 2019 and as we continued to enhance our product offering, we experienced year-over-year growth in 2019. However, if we are unable to continue to generate revenue and gross profit growth in the FORWARD segment, our financial results would be adversely impacted.
55
Net sales to customers outside of the United States contributed to 16.3% and 17.9% of our net sales for the years ended December 31, 2019 and 2018, respectively. During the years ended December 31, 2019 and 2018, net sales to customers outside of the United States were $98.1 million and $89.4 million, respectively, representing an increase of 9.7%. Net sales to customers outside of the United States is impacted by various factors including import and export taxes, currency fluctuations and other macroeconomic conditions described in “—Overall Economic Trends” above. Increases in taxes and negative movements in currencies have had, and may continue to have, an adverse impact on our financial results.
Seasonality
Seasonality in our business does not follow that of traditional retailers, such as typical concentration of net sales in the holiday quarter. We believe our results are impacted by a pattern of increased sales leading up to #REVOLVEfestival in April and during May and June, which results in peak sales during the second quarter of each fiscal year. We also have experienced seasonally lower activity during the first quarter of each fiscal year. In 2020, we expect the outbreak of COVID-19 coronavirus will have an impact to our supply chain and may delay the receipt of product that is sourced from China in the first and second quarters, which may change the seasonality trends that we have experienced historically. With the exception of this specific event or events like it, we expect this seasonality to continue in future years. Our operating income has also been affected by these historical trends because many of our expenses are relatively fixed in the short term. If our growth rates begin to moderate, the impact of these seasonality trends on our results of operations may become more pronounced.
Components of Our Results of Operations
Net Sales
Net sales consist primarily of sales of women’s apparel, footwear and accessories. We recognize product sales at the time control is transferred to the customer, which is when the product is shipped. Net sales represent the sales of these items and shipping revenue when applicable, net of estimated returns and promotional discounts. Net sales are primarily driven by growth in the number of our customers, the frequency with which customers purchase and average order value.
Cost of Sales
Cost of sales consists of our purchase price for merchandise sold to customers and includes import duties and other taxes, freight-in, defective merchandise returned from customers, receiving costs, inventory write-offs, and other miscellaneous shrinkage. Cost of sales is primarily driven by growth in orders placed by customers, the mix of the product available for sale on our sites and transportation costs related to inventory receipts from our vendors. We expect our cost of sales to fluctuate as a percentage of net sales primarily due to how we manage our inventory and merchandise mix.
Fulfillment Expenses
Fulfillment expenses represent those costs incurred in operating and staffing the fulfillment center, including costs attributed to inspecting and warehousing inventories and picking, packaging and preparing customer orders for shipment. Fulfillment expenses also include the cost of warehousing facilities. We expect fulfillment expenses to increase in absolute dollars as we continue to scale our business. As a percentage of net sales, we experienced a short-term increase as a result of the expansion of our warehouse facilities, which led to short-term inefficiencies. Over the long term, we expect fulfillment expenses to decrease as a percentage of net sales.
Selling and Distribution Expenses
Selling and distribution expenses consist primarily of shipping and other transportation costs incurred delivering merchandise to customers and from customers returning merchandise, merchant processing fees, and customer service. We expect selling and distribution expenses to increase in absolute dollars as we continue to scale our business. Over the long term, we expect selling and distribution costs to decrease as a percentage of net sales.
56
Marketing expenses consist primarily of targeted online performance marketing costs, such as retargeting, paid search/product listing ads, affiliate marketing, paid social, search engine optimization, personalized email marketing and mobile “push” communications through our app. Marketing expenses also include our spend on brand marketing channels, including cash compensation to influencers, events and other forms of online and offline marketing. Marketing expenses are primarily related to growing and retaining our customer base, building the REVOLVE and FORWARD brands and expanding our owned brand presence. We make opportunistic investments in marketing and expect marketing expenses to increase in absolute dollars as we continue to scale our business, but remain relatively consistent as a percentage of net sales.
General and Administrative Expenses
General and administrative expenses consist primarily of payroll and related benefit costs and equity-based compensation expense for our employees involved in general corporate functions including merchandising, marketing, studio and technology, as well as costs associated with the use by these functions of facilities and equipment, such as depreciation, rent and other occupancy expenses. General and administrative expenses are primarily driven by increases in headcount required to support business growth and meet our obligations as a public company. We expect general and administrative expenses to decline as a percentage of net sales as we scale our business and leverage investments in these areas.
Other Expense, Net
Other expense, net consists primarily of interest expense and other fees associated with our line of credit and interest income on our money market funds.
Results of Operations
The following tables set forth our results of operations for the periods presented and express the relationship of certain line items as a percentage of net sales for those periods. The period-to-period comparison of financial results is not necessarily indicative of future results.
|
|
|
Years Ended December 31, |
|
|||||||||
|
|
|
2019 |
|
|
2018 |
|
|
2017 |
|
|||
|
|
|
(in thousands) |
|
|||||||||
|
Net sales |
|
$ |
600,993 |
|
|
$ |
498,739 |
|
|
$ |
399,597 |
|
|
Cost of sales |
|
|
279,040 |
|
|
|
233,433 |
|
|
|
205,907 |
|
|
Gross profit |
|
|
321,953 |
|
|
|
265,306 |
|
|
|
193,690 |
|
|
Operating expenses: |
|
|
|
|
|
|
|
|
|
|
|
|
|
Fulfillment expenses |
|
|
19,413 |
|
|
|
13,292 |
|
|
|
9,458 |
|
|
Selling and distribution expenses |
|
|
87,706 |
|
|
|
70,621 |
|
|
|
50,766 |
|
|
Marketing expenses |
|
|
89,141 |
|
|
|
74,394 |
|
|
|
55,476 |
|
|
General and administrative expenses |
|
|
77,595 |
|
|
|
65,201 |
|
|
|
57,468 |
|
|
Total operating expenses |
|
|
273,855 |
|
|
|
223,508 |
|
|
|
173,168 |
|
|
Income from operations |
|
|
48,098 |
|
|
|
41,798 |
|
|
|
20,522 |
|
|
Other expense, net |
|
|
931 |
|
|
|
631 |
|
|
|
1,431 |
|
|
Income before income taxes |
|
|
47,167 |
|
|
|
41,167 |
|
|
|
19,091 |
|
|
Provision for income tax |
|
|
11,500 |
|
|
|
10,529 |
|
|
|
14,091 |
|
|
Net income |
|
$ |
35,667 |
|
|
$ |
30,638 |
|
|
$ |
5,000 |
|
57
|
|
|
Years Ended December 31, |
|
|||||||||
|
|
|
2019 |
|
|
2018 |
|
|
2017 |
|
|||
|
Net sales |
|
|
100.0 |
% |
|
|
100.0 |
% |
|
|
100.0 |
% |
|
Cost of sales |
|
|
46.4 |
|
|
|
46.8 |
|
|
|
51.5 |
|
|
Gross profit |
|
|
53.6 |
|
|
|
53.2 |
|
|
|
48.5 |
|
|
Operating expenses: |
|
|
|
|
|
|
|
|
|
|
|
|
|
Fulfillment expenses |
|
|
3.2 |
|
|
|
2.7 |
|
|
|
2.4 |
|
|
Selling and distribution expenses |
|
|
14.6 |
|
|
|
14.2 |
|
|
|
12.7 |
|
|
Marketing expenses |
|
|
14.8 |
|
|
|
14.9 |
|
|
|
13.9 |
|
|
General and administrative expenses |
|
|
12.9 |
|
|
|
13.1 |
|
|
|
14.4 |
|
|
Total operating expenses |
|
|
45.6 |
|
|
|
44.8 |
|
|
|
43.4 |
|
|
Income from operations |
|
|
8.0 |
|
|
|
8.4 |
|
|
|
5.1 |
|
|
Other expense, net |
|
|
0.2 |
|
|
|
0.1 |
|
|
|
0.4 |
|
|
Income before income taxes |
|
|
7.8 |
|
|
|
8.3 |
|
|
|
4.8 |
|
|
Provision for income tax |
|
|
1.9 |
|
|
|
2.1 |
|
|
|
3.5 |
|
|
Net income |
|
|
5.9 |
% |
|
|
6.1 |
% |
|
|
1.3 |
% |
Comparison of Years Ended 2019 and 2018
Net Sales
|
|
|
Years Ended December 31, |
|
|
Change |
|
||||||||||
|
|
|
2019 |
|
|
2018 |
|
|
$ |
|
|
% |
|
||||
|
|
|
(dollars in thousands) |
|
|||||||||||||
|
Net sales |
|
$ |
600,993 |
|
|
$ |
498,739 |
|
|
$ |
102,254 |
|
|
|
20.5 |
% |
The overall increase in net sales was primarily due to sales to a larger number of customers, as the number of active customers increased 26.6% in 2019 compared to the number of active customers in 2018. Additionally, the number of orders placed by customers increased 27.1% in 2019 as compared to 2018. These increases were partially offset by a decrease in average order value to $275 in the 2019 from $279 in 2018, primarily due to lower average order values within each segment as well as the REVOLVE segment comprising a larger percentage of consolidated net sales.
Net sales in the REVOLVE segment increased 21.6% to $527.3 million in 2019 compared to net sales of $433.5 million in 2018. Net sales generated from our FORWARD segment increased 13.1% to $73.7 million in 2019 compared to net sales of $65.2 million in 2018.
Cost of Sales
|
|
|
Years Ended December 31, |
|
|
Change |
|
||||||||||
|
|
|
2019 |
|
|
2018 |
|
|
$ |
|
|
% |
|
||||
|
|
|
(dollars in thousands) |
|
|||||||||||||
|
Cost of sales |
|
$ |
279,040 |
|
|
$ |
233,433 |
|
|
$ |
45,607 |
|
|
|
19.5 |
% |
|
Percentage of net sales |
|
|
46.4 |
% |
|
|
46.8 |
% |
|
|
|
|
|
|
|
|
The increase in cost of sales was primarily due to an increase in the volume of merchandise sold. The decrease in cost of sales as a percentage of net sales was due to a favorable mix of merchandise sales combined with a higher mix of sales generated from the REVOLVE segment which generally carry a higher margin than that of the FORWARD segment. Further, within the FORWARD segment, we experienced higher gross margin year over year.
58
|
|
|
Years Ended December 31, |
|
|
Change |
|
||||||||||
|
|
|
2019 |
|
|
2018 |
|
|
$ |
|
|
% |
|
||||
|
|
|
(dollars in thousands) |
|
|||||||||||||
|
Fulfillment expenses |
|
$ |
19,413 |
|
|
$ |
13,292 |
|
|
$ |
6,121 |
|
|
|
46.1 |
% |
|
Percentage of net sales |
|
|
3.2 |
% |
|
|
2.7 |
% |
|
|
|
|
|
|
|
|
The increase in fulfillment expenses was the result of an increase in the number of units processed as well as the expansion of our fulfillment center infrastructure which led to overcapacity and duplicative capacity that we believe will be reduced over time. We also incurred incremental costs related to the implementation of additional automation during the third quarter.
Selling and Distribution Expenses
|
|
|
Years Ended December 31, |
|
|
Change |
|
||||||||||
|
|
|
2019 |
|
|
2018 |
|
|
$ |
|
|
% |
|
||||
|
|
|
(dollars in thousands) |
|
|||||||||||||
|
Selling and distribution expenses |
|
$ |
87,706 |
|
|
$ |
70,621 |
|
|
$ |
17,085 |
|
|
|
24.2 |
% |
|
Percentage of net sales |
|
|
14.6 |
% |
|
|
14.2 |
% |
|
|
|
|
|
|
|
|
The increase in selling and distribution expenses was the result of an increase in the number of orders shipped and increases in merchant processing fees and customer service costs. Shipping and handling costs increased $9.9 million, merchant processing fees increased $4.3 million, and customer service costs increased $1.8 million in 2019 as compared to 2018. The increase in selling and distribution expenses as a percentage of net sales was due to higher merchant processing fees and employee-related customer service costs.
Marketing Expenses
|
|
|
Years Ended December 31, |
|
|
Change |
|
||||||||||
|
|
|
2019 |
|
|
2018 |
|
|
$ |
|
|
% |
|
||||
|
|
|
(dollars in thousands) |
|
|||||||||||||
|
Marketing expenses |
|
$ |
89,141 |
|
|
$ |
74,394 |
|
|
$ |
14,747 |
|
|
|
19.8 |
% |
|
Percentage of net sales |
|
|
14.8 |
% |
|
|
14.9 |
% |
|
|
|
|
|
|
|
|
The increase in marketing expenses primarily due to increased marketing investment to acquire customers and retain existing customers to drive higher net sales. Performance marketing expenses increased $10.5 million in 2019 as compared to 2018. We also experienced an increase of $4.2 million in 2019 as compared to 2018, in marketing expenses related to REVOLVE branded marketing events.
General and Administrative Expenses
|
|
|
Years Ended December 31, |
|
|
Change |
|
||||||||||
|
|
|
2019 |
|
|
2018 |
|
|
$ |
|
|
% |
|
||||
|
|
|
(dollars in thousands) |
|
|||||||||||||
|
General and administrative expenses |
|
$ |
77,595 |
|
|
$ |
65,201 |
|
|
$ |
12,394 |
|
|
|
19.0 |
% |
|
Percentage of net sales |
|
|
12.9 |
% |
|
|
13.1 |
% |
|
|
|
|
|
|
|
|
The increase in general and administrative expenses was due to a $4.9 million increase in salaries and related benefits and equity-based compensation expenses related to increases in our headcount across functions, a $3.8 million increase in professional services and occupancy costs to support business growth and operate as a public company, and a $2.5 million increase in other operating expenses, studio, and design costs, as a result of our business growth. The decrease in general and administrative expenses as a percentage of net sales resulted primarily from efficiencies gained from scale, partially offset by an increase in costs to operate as a public company.
59
Income Taxes
|
|
|
Years Ended December 31, |
|
|||||
|
|
|
2019 |
|
|
2018 |
|
||
|
|
|
(in thousands) |
|
|||||
|
Income before income taxes |
|
$ |
47,167 |
|
|
$ |
41,167 |
|
|
Provision for income tax |
|
|
11,500 |
|
|
|
10,529 |
|
|
Effective tax rate |
|
|
24.4 |
% |
|
|
25.6 |
% |
The decrease in the effective tax rate was primarily due to the exercise of non-qualified stock options and the use of federal net operating losses during 2019.
Quarterly Results of Operations and Other Financial and Operations Data
The following tables set forth selected unaudited quarterly results of operations and other financial and operations data for each of the quarters indicated. The information for each of these quarters has been prepared on the same basis as the audited annual consolidated financial statements included elsewhere in this Annual Report on Form 10-K and in the opinion of management, includes all adjustments, which include only normal recurring adjustments, necessary for the fair statement of our consolidated results of operations for these periods. This data should be read in conjunction with our consolidated financial statements and related notes included elsewhere in this Annual Report on Form 10-K. Our quarterly results of operations will vary in the future. These quarterly operating results are not necessarily indicative of our operating results for any future period.
|
|
|
Three Months Ended |
|
|||||||||||||||||||||||||||||
|
|
|
December 31, 2019 |
|
|
September 30, 2019 |
|
|
June 30, 2019 |
|
|
March 31, 2019 |
|
|
December 31, 2018 |
|
|
September 30, 2018 |
|
|
June 30, 2018 |
|
|
March 31, 2018 |
|
||||||||
|
|
|
(in thousands, except per share data) |
|
|||||||||||||||||||||||||||||
|
Net sales |
|
$ |
147,556 |
|
|
$ |
154,197 |
|
|
$ |
161,897 |
|
|
$ |
137,343 |
|
|
$ |
127,723 |
|
|
$ |
125,909 |
|
|
$ |
131,802 |
|
|
$ |
113,305 |
|
|
Cost of sales |
|
|
69,453 |
|
|
|
71,519 |
|
|
|
71,479 |
|
|
|
66,589 |
|
|
|
58,567 |
|
|
|
59,524 |
|
|
|
58,470 |
|
|
|
56,872 |
|
|
Gross profit |
|
|
78,103 |
|
|
|
82,678 |
|
|
|
90,418 |
|
|
|
70,754 |
|
|
|
69,156 |
|
|
|
66,385 |
|
|
|
73,332 |
|
|
|
56,433 |
|
|
Operating expenses: |
|
|
|
|
|
|
|
|
|
|
|
|
|
|
|
|
|
|
|
|
|
|
|
|
|
|
|
|
|
|
|
|
|
Fulfillment expenses |
|
|
4,499 |
|
|
|
5,118 |
|
|
|
5,301 |
|
|
|
4,495 |
|
|
|
3,920 |
|
|
|
3,327 |
|
|
|
3,263 |
|
|
|
2,782 |
|
|
Selling and distribution expenses |
|
|
20,895 |
|
|
|
22,581 |
|
|
|
23,639 |
|
|
|
20,591 |
|
|
|
17,794 |
|
|
|
18,305 |
|
|
|
18,669 |
|
|
|
15,853 |
|
|
Marketing expenses |
|
|
21,602 |
|
|
|
23,127 |
|
|
|
24,914 |
|
|
|
19,498 |
|
|
|
18,924 |
|
|
|
18,956 |
|
|
|
21,161 |
|
|
|
15,353 |
|
|
General and administrative expenses |
|
|
20,471 |
|
|
|
19,019 |
|
|
|
18,836 |
|
|
|
19,269 |
|
|
|
17,836 |
|
|
|
16,280 |
|
|
|
16,145 |
|
|
|
14,940 |
|
|
Total operating expenses |
|
|
67,467 |
|
|
|
69,845 |
|
|
|
72,690 |
|
|
|
63,853 |
|
|
|
58,474 |
|
|
|
56,868 |
|
|
|
59,238 |
|
|
|
48,928 |
|
|
Income from operations |
|
|
10,636 |
|
|
|
12,833 |
|
|
|
17,728 |
|
|
|
6,901 |
|
|
|
10,682 |
|
|
|
9,517 |
|
|
|
14,094 |
|
|
|
7,505 |
|
|
Other expense (income), net |
|
|
278 |
|
|
|
(7 |
) |
|
|
444 |
|
|
|
216 |
|
|
|
156 |
|
|
|
155 |
|
|
|
123 |
|
|
|
197 |
|
|
Income before income taxes |
|
|
10,358 |
|
|
|
12,840 |
|
|
|
17,284 |
|
|
|
6,685 |
|
|
|
10,526 |
|
|
|
9,362 |
|
|
|
13,971 |
|
|
|
7,308 |
|
|
Provision for income tax |
|
|
1,953 |
|
|
|
3,281 |
|
|
|
4,543 |
|
|
|
1,723 |
|
|
|
2,827 |
|
|
|
2,222 |
|
|
|
3,504 |
|
|
|
1,976 |
|
|
Net income |
|
|
8,405 |
|
|
|
9,559 |
|
|
|
12,741 |
|
|
|
4,962 |
|
|
|
7,699 |
|
|
|
7,140 |
|
|
|
10,467 |
|
|
|
5,332 |
|
|
Less: Repurchase of Class B common stock upon corporate conversion |
|
|
— |
|
|
|
— |
|
|
|
(40,816 |
) |
|
|
— |
|
|
|
— |
|
|
|
— |
|
|
|
— |
|
|
|
— |
|
|
Net income (loss) attributable to common stockholders |
|
$ |
8,405 |
|
|
$ |
9,559 |
|
|
$ |
(28,075 |
) |
|
$ |
4,962 |
|
|
$ |
7,699 |
|
|
$ |
7,140 |
|
|
$ |
10,467 |
|
|
$ |
5,332 |
|
|
Earnings (net loss) per share of Class A and Class B common stock: |
|
|
|
|
|
|
|
|
|
|
|
|
|
|
|
|
|
|
|
|
|
|
|
|
|
|
|
|
|
|
|
|
|
Basic |
|
|
0.12 |
|
|
|
0.14 |
|
|
|
(0.57 |
) |
|
|
0.08 |
|
|
|
0.12 |
|
|
|
0.11 |
|
|
|
0.16 |
|
|
|
0.08 |
|
|
Diluted |
|
|
0.12 |
|
|
|
0.13 |
|
|
|
(0.57 |
) |
|
|
0.07 |
|
|
|
0.11 |
|
|
|
0.10 |
|
|
|
0.15 |
|
|
|
0.08 |
|
|
Weighted average Class A and Class B common shares outstanding: |
|
|
|
|
|
|
|
|
|
|
|
|
|
|
|
|
|
|
|
|
|
|
|
|
|
|
|
|
|
|
|
|
|
Basic |
|
|
68,921 |
|
|
|
68,871 |
|
|
|
49,025 |
|
|
|
41,936 |
|
|
|
41,936 |
|
|
|
41,936 |
|
|
|
41,936 |
|
|
|
41,936 |
|
|
Diluted |
|
|
71,947 |
|
|
|
72,658 |
|
|
|
49,025 |
|
|
|
44,821 |
|
|
|
44,810 |
|
|
|
44,798 |
|
|
|
44,394 |
|
|
|
44,183 |
|
60
|
|
|
Three Months Ended |
|
|||||||||||||||||||||||||||||
|
|
|
December 31, 2019 |
|
|
September 30, 2019 |
|
|
June 30, 2019 |
|
|
March 31, 2019 |
|
|
December 31, 2018 |
|
|
September 30, 2018 |
|
|
June 30, 2018 |
|
|
March 31, 2018 |
|
||||||||
|
Net sales |
|
|
100.0 |
% |
|
|
100.0 |
% |
|
|
100.0 |
% |
|
|
100.0 |
% |
|
|
100.0 |
% |
|
|
100.0 |
% |
|
|
100.0 |
% |
|
|
100.0 |
% |
|
Cost of sales |
|
|
47.1 |
|
|
|
46.4 |
|
|
|
44.2 |
|
|
|
48.5 |
|
|
|
45.9 |
|
|
|
47.3 |
|
|
|
44.4 |
|
|
|
50.2 |
|
|
Gross profit |
|
|
52.9 |
|
|
|
53.6 |
|
|
|
55.8 |
|
|
|
51.5 |
|
|
|
54.1 |
|
|
|
52.7 |
|
|
|
55.6 |
|
|
|
49.8 |
|
|
Operating expenses: |
|
|
|
|
|
|
|
|
|
|
|
|
|
|
|
|
|
|
|
|
|
|
|
|
|
|
|
|
|
|
|
|
|
Fulfillment expenses |
|
|
3.0 |
|
|
|
3.3 |
|
|
|
3.3 |
|
|
|
3.3 |
|
|
|
3.1 |
|
|
|
2.6 |
|
|
|
2.5 |
|
|
|
2.5 |
|
|
Selling and distribution expenses |
|
|
14.2 |
|
|
|
14.6 |
|
|
|
14.6 |
|
|
|
15.0 |
|
|
|
13.9 |
|
|
|
14.5 |
|
|
|
14.2 |
|
|
|
14.0 |
|
|
Marketing expenses |
|
|
14.6 |
|
|
|
15.0 |
|
|
|
15.4 |
|
|
|
14.2 |
|
|
|
14.8 |
|
|
|
15.1 |
|
|
|
16.1 |
|
|
|
13.6 |
|
|
General and administrative expenses |
|
|
13.9 |
|
|
|
12.3 |
|
|
|
11.6 |
|
|
|
14.0 |
|
|
|
14.0 |
|
|
|
12.9 |
|
|
|
12.2 |
|
|
|
13.2 |
|
|
Total operating expenses |
|
|
45.7 |
|
|
|
45.3 |
|
|
|
44.9 |
|
|
|
46.5 |
|
|
|
45.8 |
|
|
|
45.2 |
|
|
|
44.9 |
|
|
|
43.2 |
|
|
Income from operations |
|
|
7.2 |
|
|
|
8.3 |
|
|
|
11.0 |
|
|
|
5.0 |
|
|
|
8.4 |
|
|
|
7.6 |
|
|
|
10.7 |
|
|
|
6.6 |
|
|
Other expense (income), net |
|
|
0.2 |
|
|
|
(0.0 |
) |
|
|
0.3 |
|
|
|
0.2 |
|
|
|
0.1 |
|
|
|
0.1 |
|
|
|
0.1 |
|
|
|
0.2 |
|
|
Income before income taxes |
|
|
7.0 |
|
|
|
8.3 |
|
|
|
10.7 |
|
|
|
4.9 |
|
|
|
8.2 |
|
|
|
7.4 |
|
|
|
10.6 |
|
|
|
6.4 |
|
|
Provision for income tax |
|
|
1.3 |
|
|
|
2.1 |
|
|
|
2.8 |
|
|
|
1.3 |
|
|
|
2.2 |
|
|
|
1.8 |
|
|
|
2.7 |
|
|
|
1.7 |
|
|
Net income |
|
|
5.7 |
% |
|
|
6.2 |
% |
|
|
7.9 |
% |
|
|
3.6 |
% |
|
|
6.0 |
% |
|
|
5.7 |
% |
|
|
7.9 |
% |
|
|
4.7 |
% |
|
|
|
Three Months Ended |
|
|||||||||||||||||||||||||||||
|
|
|
December 31, 2019 |
|
|
September 30, 2019 |
|
|
June 30, 2019 |
|
|
March 31, 2019 |
|
|
December 31, 2018 |
|
|
September 30, 2018 |
|
|
June 30, 2018 |
|
|
March 31, 2018 |
|
||||||||
|
|
|
(in thousands, except average order value and percentages) |
|
|||||||||||||||||||||||||||||
|
Other Financial and Operations Data |
|
|
|
|
|
|
|
|
|
|
|
|
|
|
|
|
|
|
|
|
|
|
|
|
|
|
|
|
|
|
|
|
|
Gross margin |
|
|
52.9 |
% |
|
|
53.6 |
% |
|
|
55.8 |
% |
|
|
51.5 |
% |
|
|
54.1 |
% |
|
|
52.7 |
% |
|
|
55.6 |
% |
|
|
49.8 |
% |
|
Adjusted EBITDA(1) |
|
$ |
13,650 |
|
|
$ |
14,438 |
|
|
$ |
18,968 |
|
|
$ |
8,549 |
|
|
$ |
11,876 |
|
|
$ |
10,312 |
|
|
$ |
15,610 |
|
|
$ |
8,697 |
|
|
Free cash flow |
|
$ |
13,226 |
|
|
$ |
7,448 |
|
|
$ |
1,991 |
|
|
$ |
10,937 |
|
|
$ |
(2,762 |
) |
|
$ |
1,822 |
|
|
$ |
12,834 |
|
|
$ |
11,716 |
|
|
Active customers |
|
|
1,488 |
|
|
|
1,438 |
|
|
|
1,359 |
|
|
|
1,262 |
|
|
|
1,175 |
|
|
|
1,080 |
|
|
|
998 |
|
|
|
904 |
|
|
Total orders placed |
|
|
1,092 |
|
|
|
1,194 |
|
|
|
1,294 |
|
|
|
1,135 |
|
|
|
954 |
|
|
|
950 |
|
|
|
989 |
|
|
|
817 |
|
|
Average order value |
|
$ |
282 |
|
|
$ |
275 |
|
|
$ |
275 |
|
|
$ |
259 |
|
|
$ |
274 |
|
|
$ |
280 |
|
|
$ |
281 |
|
|
$ |
282 |
|
|
(1) |
Adjusted EBITDA is a non-GAAP financial measure that we calculate as net income before other expense (income), net, taxes, depreciation and amortization, adjusted to exclude the effects of equity-based compensation expense, and certain non-routine items. Please see Item 6 of this report captioned “Selected Financial Data” for more information. Non-routine items include certain items that we consider non-routine and not reflective of the underlying trends in our core business operations. Non-routine items in the first quarter of 2018 included expenses related to our entity restructuring. Non-routine items in the second and third quarters of 2018 related to our initial public offering. Non-routine items in the first and fourth quarters of 2019 related primarily to legal settlements. The following table reflects the reconciliation of net income to Adjusted EBITDA: |
61
|
|
|
Three Months Ended |
|
|||||||||||||||||||||||||||||
|
|
|
December 31, 2019 |
|
|
September 30, 2019 |
|
|
June 30, 2019 |
|
|
March 31, 2019 |
|
|
December 31, 2018 |
|
|
September 30, 2018 |
|
|
June 30, 2018 |
|
|
March 31, 2018 |
|
||||||||
|
|
|
(in thousands) |
|
|||||||||||||||||||||||||||||
|
Net income |
|
$ |
8,405 |
|
|
$ |
9,559 |
|
|
$ |
12,741 |
|
|
$ |
4,962 |
|
|
$ |
7,699 |
|
|
$ |
7,140 |
|
|
$ |
10,467 |
|
|
$ |
5,332 |
|
|
Excluding: |
|
|
|
|
|
|
|
|
|
|
|
|
|
|
|
|
|
|
|
|
|
|
|
|
|
|
|
|
|
|
|
|
|
Other expense (income), net |
|
|
278 |
|
|
|
(7 |
) |
|
|
444 |
|
|
|
216 |
|
|
|
156 |
|
|
|
155 |
|
|
|
123 |
|
|
|
197 |
|
|
Provision for income tax |
|
|
1,953 |
|
|
|
3,281 |
|
|
|
4,543 |
|
|
|
1,723 |
|
|
|
2,827 |
|
|
|
2,222 |
|
|
|
3,504 |
|
|
|
1,976 |
|
|
Depreciation and amortization |
|
|
1,236 |
|
|
|
1,132 |
|
|
|
889 |
|
|
|
695 |
|
|
|
658 |
|
|
|
750 |
|
|
|
730 |
|
|
|
729 |
|
|
Equity-based compensation |
|
|
522 |
|
|
|
513 |
|
|
|
521 |
|
|
|
511 |
|
|
|
536 |
|
|
|
352 |
|
|
|
403 |
|
|
|
109 |
|
|
Non-routine items |
|
|
1,256 |
|
|
|
(40 |
) |
|
|
(170 |
) |
|
|
442 |
|
|
— |
|
|
|
(307 |
) |
|
|
383 |
|
|
|
354 |
|
|
|
Adjusted EBITDA |
|
$ |
13,650 |
|
|
$ |
14,438 |
|
|
$ |
18,968 |
|
|
$ |
8,549 |
|
|
$ |
11,876 |
|
|
$ |
10,312 |
|
|
$ |
15,610 |
|
|
$ |
8,697 |
|
The following table presents a reconciliation of free cash flow, a non-GAAP financial measure, to net cash provided by operating activities, as well as information regarding net cash used in investing activities and net cash provided by (used in) financing activities:
|
|
|
Three Months Ended |
|
|||||||||||||||||||||||||||||
|
|
|
December 31, 2019 |
|
|
September 30, 2019 |
|
|
June 30, 2019 |
|
|
March 31, 2019 |
|
|
December 31, 2018 |
|
|
September 30, 2018 |
|
|
June 30, 2018 |
|
|
March 31, 2018 |
|
||||||||
|
|
|
(in thousands) |
|
|||||||||||||||||||||||||||||
|
Net cash provided by (used in) operating activities |
|
$ |
14,224 |
|
|
$ |
9,150 |
|
|
$ |
6,759 |
|
|
$ |
15,924 |
|
|
$ |
(1,382 |
) |
|
$ |
2,410 |
|
|
$ |
13,471 |
|
|
$ |
12,156 |
|
|
Purchases of property and equipment |
|
|
(998 |
) |
|
|
(1,702 |
) |
|
|
(4,768 |
) |
|
|
(4,987 |
) |
|
|
(1,380 |
) |
|
|
(588 |
) |
|
|
(637 |
) |
|
|
(440 |
) |
|
Free cash flow(1) |
|
$ |
13,226 |
|
|
$ |
7,448 |
|
|
$ |
1,991 |
|
|
$ |
10,937 |
|
|
$ |
(2,762 |
) |
|
$ |
1,822 |
|
|
$ |
12,834 |
|
|
$ |
11,716 |
|
|
|
|
|
|
|
|
|
|
|
|
|
|
|
|
|
|
|
|
|
|
|
|
|
|
|
|
|
|
|
|
|
|
|
|
Net cash used in investing activities(2) |
|
$ |
(998 |
) |
|
$ |
(1,702 |
) |
|
$ |
(4,768 |
) |
|
$ |
(4,987 |
) |
|
$ |
(1,380 |
) |
|
$ |
(588 |
) |
|
$ |
(637 |
) |
|
$ |
(440 |
) |
|
Net cash provided by (used in) financing activities |
|
|
612 |
|
|
|
(968 |
) |
|
|
15,783 |
|
|
|
(248 |
) |
|
|
(741 |
) |
|
|
(1,780 |
) |
|
— |
|
|
|
(15,100 |
) |
|
|
(1) |
Free cash flow is a non-GAAP financial measure that we calculate as net cash provided by (used in) operating activities less net cash used for purchases of property and equipment. Please see Item 6 of this report captioned “Selected Financial Data” for more information. |
|
(2) |
Net cash used in investing activities includes payments for purchases of property and equipment, which is also included in our calculation of free cash flow. |
62
Seasonality and Quarterly Trends
Seasonality in our business does not follow that of traditional retailers, such as typical concentration of net sales in the holiday quarter. We believe our results are impacted by a pattern of increased sales leading up to #REVOLVEfestival in April and during May and June, which results in peak sales during the second quarter of each fiscal year. We have also experienced seasonally lower activity during the first quarter of each fiscal year. In 2020, we expect the outbreak of COVID-19 coronavirus will have an impact to our supply chain and may delay the receipt of product that is sourced from China in the first and second quarters, which may change the seasonality trends that we have experienced historically. With the exception of this specific event or events like it, we expect this seasonality to continue in future years. Our operating income has also been affected by these historical trends because many of our expenses are relatively fixed in the short term. As our growth rates begin to moderate, the impact of these seasonality trends on our results of operations will become more pronounced.
We focus our internal measurements of performance on quarterly year-over-year comparisons but discuss quarterly sequential information below to help investors understand fluctuations in our business.
Our quarterly net sales are reflective of the seasonality as discussed above with the second quarter of 2018 reflecting the impact of #REVOLVEfestival and seasonal increases leading up to the early summer months. Net sales decreased in the third quarter of 2018 and increased in the fourth quarter of 2018 due to seasonality. Net sales increased in the first quarter of 2019 due to continued growth in the business and further increased in the second quarter of 2019 due to growth in the business and seasonality. Net sales decreased in the third quarter of 2019 due to seasonality. We believe net sales in the fourth quarter of 2019 were impacted by a reduction in new inventory receipts within the REVOLVE segment. As noted above, the seasonality of our business has resulted in variability in our total net sales quarter-to-quarter. As a result, we believe that comparisons of net sales and results of operations for a given quarter to net sales and results of operations for the corresponding quarter in the prior fiscal year are generally more meaningful than comparisons of net sales and results of operations for sequential quarters.
Our quarterly gross profit has fluctuated quarter to quarter primarily due to the quarterly fluctuations in net sales. In addition, gross margin has been lower in the first quarter of each year and higher in the second quarter of each year, reflecting the seasonal demand of our merchandise as discussed above. We believe the fourth quarter of 2019 was sequentially lower due to increased levels of discounting that we believe was due to a reduction in the new inventory receipts in the REVOLVE segment as discussed above.
Fulfillment expenses and selling and distribution expenses have also fluctuated quarter-to-quarter, primarily due to the quarterly fluctuation in net sales. The fluctuation in fulfillment costs is driven by the costs incurred to fulfill orders placed by our customers, while the fluctuation in selling and distribution costs is primarily due to the costs incurred to package and ship products ordered by our customers, ship returns from our customers, provide customer service and costs incurred related to merchant processing. Fulfilment expenses increased in the first, second and third quarters of 2019, partially as the result of investments in our fulfillment capabilities through the expansion of our fulfillment center infrastructure and the implementation of further automation within our facility.
Marketing expenses vary quarter-to-quarter, primarily due to the timing of our brand marketing events. The second quarters of 2018 and 2019 include marketing expense related to #REVOLVEfestival. The third quarters of 2018 and 2019 included marketing expense related to #REVOLVEsummer. The fourth quarters of 2018 and 2019 included marketing expense related to the #REVOLVEawards. Marketing expense will continue to fluctuate quarter-to-quarter, depending on the timing of events.
General and administrative expenses have generally increased sequentially quarter-to-quarter as we have continued to increase our headcount to support business growth. The first and fourth quarters of 2019 included incremental professional services costs associated with operating as a public company and certain non-routine items primarily related to legal settlements.
We had net income for all periods presented.
63
Our business is directly affected by the behavior of consumers. Economic conditions and competitive pressures can significantly impact, both positively and negatively, the level of demand by customers for our products. Consequently, the results of any prior quarterly or annual periods should not be relied upon as indications of our future operating performance.
Liquidity and Capital Resources
The following tables show our cash and cash equivalents, accounts receivable and working capital as of the dates indicated:
|
|
|
As of |
|
|||||
|
|
|
December 31, 2019 |
|
|
December 31, 2018 |
|
||
|
|
|
(in thousands) |
|
|||||
|
Cash and cash equivalents |
|
$ |
65,418 |
|
|
$ |
16,369 |
|
|
Accounts receivable, net |
|
|
4,751 |
|
|
|
5,337 |
|
|
Working capital |
|
|
97,816 |
|
|
|
56,897 |
|
As of December 31, 2019, the majority of our cash and cash equivalents was held for working capital purposes. We increased our capital expenditures in the fourth quarter of 2018 as well as in the first and second quarters of 2019, and to a lesser extent in the third quarter of 2019, to support the growth in our business and operations, specifically the consolidation of and increased automation within our fulfillment facility.
We believe that our existing cash and cash equivalents as well as the available borrowing capacity under our line of credit will be sufficient to meet our anticipated cash needs for at least the next 12 months. However, our liquidity assumptions may prove to be incorrect, and we could exhaust our available financial resources sooner than we currently expect. We may seek to borrow funds under our line of credit or raise additional funds at any time through equity, equity-linked or debt financing arrangements. Our future capital requirements and the adequacy of available funds will depend on many factors, including those described in Item 1A — Risk Factors of this report. We may not be able to secure additional financing to meet our operating requirements on acceptable terms, or at all.
Sources of Liquidity
Since our inception, we have financed our operations and capital expenditures primarily through cash flows generated by operations, private sales of equity securities, the incurrence of debt, as well as the net proceeds we received through our IPO. As of December 31, 2019, we have raised a total of $68.3 million from the sale of equity units, net of costs and expenses associated with such financings, including net proceeds from our IPO.
Our primary use of cash includes operating costs such as merchandise purchases, compensation and benefits, marketing and other expenditures necessary to support our business growth. We used a substantial portion of the proceeds from the IPO to repurchase shares of our Class B common stock. We believe our existing cash and cash equivalent balances and cash flows from operations will be sufficient to meet our working capital and capital expenditure needs for at least the next 12 months.
Line of Credit
In March 2016, we entered into a line of credit with Bank of America, N.A. with an expiration date of March 23, 2021, that provides us with up to $75.0 million aggregate principal in revolver borrowings. Borrowings under the credit agreement accrue interest, at our option, at (1) a base rate equal to the highest of (a) the federal funds rate plus 0.50%, (b) the prime rate and (c) the LIBOR rate plus 1.00%, in each case plus a margin ranging from 0.25% to 0.75%, or (2) an adjusted LIBOR rate plus a margin ranging from 1.25% to 1.75%. We are also obligated to pay other customary fees for a credit facility of this size and type, including an unused commitment fee and fees associated with letters of credit. The credit agreement also permits us, in certain circumstances, to request an increase in the facility by an additional amount of up to $25.0 million (in an initial minimum amount of $10 million and in increments of $5 million thereafter) at the same maturity, pricing and other terms. As of December 31, 2019 and 2018, there were no amounts outstanding under the line of credit. Historically, our debt has resulted from the need to help fund our normal operations and working capital needs.
64
Our obligations under the credit agreement are secured by substantially all of our assets. The credit agreement also contains customary covenants restricting our activities, including limitations on our ability to sell assets, engage in mergers and acquisitions, enter into transactions involving related parties, obtain letters of credit, incur indebtedness or grant liens or negative pledges on our assets, make loans or make other investments. Under these covenants, we are prohibited from paying cash dividends with respect to our capital stock. We were in compliance with all covenants as of December 31, 2019.
Historical Cash Flows
|
|
|
Years Ended December 31, |
|
|||||||||
|
|
|
2019 |
|
|
2018 |
|
|
2017 |
|
|||
|
|
|
(in thousands) |
|
|||||||||
|
Net cash provided by operating activities |
|
$ |
46,057 |
|
|
$ |
26,655 |
|
|
$ |
16,479 |
|
|
Net cash used in investing activities |
|
|
(12,455 |
) |
|
|
(3,045 |
) |
|
|
(2,262 |
) |
|
Net cash provided by (used in) financing activities |
|
|
15,179 |
|
|
|
(17,621 |
) |
|
|
(15,086 |
) |
Net Cash Provided by Operating Activities
Cash from operating activities consists primarily of net income adjusted for certain non-cash items, including depreciation, equity-based compensation, and the effect of changes in working capital and other activities.
For the year ended December 31, 2019, we generated $46.1 million of operating cash flow as compared to $26.7 million in 2018. The increase in our operating cash flow was primarily due to higher net income generated and favorable changes in working capital.
Net Cash Used in Investing Activities
Our primary investing activities have consisted of purchases of property and equipment to support our fulfillment center and our overall business growth and internally developed software for the continued development of our proprietary technology infrastructure. Purchases of property and equipment may vary from period-to-period due to timing of the expansion of our operations.
Net cash used in investing activities was $12.5 million and $3.0 million for the year ended December 31, 2019 and 2018, respectively. The increase in 2019 was primarily due to capital expenditures relating to the consolidation of and investment in our fulfillment center infrastructure.
Net Cash Provided by (Used in) Financing Activities
Until our IPO, our financing activities historically have consisted of borrowings and repayments related to the existing line of credit.
Net cash provided by financing activities was $15.2 million for the year ended December 31, 2019, which was attributable to the proceeds from our IPO, net of the repurchase of the preference amount and underwriting discounts, and proceeds from the exercise of stock options, partially offset by the payment of deferred offering costs.
Net cash used in financing activities was $17.6 million in 2018, which was attributable to repayments made on our line of credit and payments of deferred offering costs in connection with our IPO.
Off Balance Sheet Arrangements
We did not have any off balance sheet arrangements in 2019 or 2018, except for operating leases as discussed below.
65
As of December 31, 2019, we leased various offices and our fulfilment center, including our corporate headquarters in Los Angeles County, California, under operating lease agreements that expire from 2020 to 2023. The terms of the lease agreements provide for rental payments on a graduated basis. We recognize rent expense on a straight-line basis over the lease periods. We do not have any debt or material capital lease obligations and most of our property, equipment and software have been purchased with cash. We have no material long-term purchase obligations outstanding with any vendors or third parties. Our future minimum payments under non-cancelable operating leases for equipment and office facilities are as follows as of December 31, 2019:
|
|
|
Payments Due by Period |
|
|||||||||||||||||
|
|
|
Total |
|
|
2020 |
|
|
2021 - 2022 |
|
|
2023 - 2024 |
|
|
2025 & Thereafter |
|
|||||
|
|
|
(in thousands) |
|
|||||||||||||||||
|
Operating lease obligations |
|
$ |
15,021 |
|
|
$ |
4,443 |
|
|
$ |
7,381 |
|
|
$ |
3,197 |
|
|
$ |
— |
|
The contractual commitment amounts in the table above are associated with agreements that are enforceable and legally binding.
Critical Accounting Policies
Our management’s discussion and analysis of our financial condition and results of operations is based on our consolidated financial statements, which have been prepared in accordance with GAAP. The preparation of these consolidated financial statements requires us to make estimates and assumptions that affect the reported amounts of assets, liabilities, net sales, expenses and related disclosures. We evaluate our estimates and assumptions on an ongoing basis. Our estimates are based on historical experience and various other assumptions that we believe to be reasonable under the circumstances. Our actual results could differ from these estimates.
We believe that the assumptions and estimates associated with revenue recognition, inventory, and income taxes have the greatest potential impact on our consolidated financial statements. Therefore, we consider these to be our critical accounting policies and estimates. For further information on all of our significant accounting policies, please see Note 2, Significant Accounting Policies, of the accompanying notes to our consolidated financial statements included elsewhere in this report.
Net Sales
Revenue is primarily derived from the sale of apparel merchandise through our sites and, when applicable, shipping revenue. Prior to the adoption of Accounting Standards Codification, or ASC, 606, Revenues from Contracts with Customers, on January 1, 2019, revenue was recognized when all of the following criteria were satisfied in accordance with the then applicable accounting literature: (1) persuasive evidence of an arrangement existed; (2) the sales price was fixed or determinable; (3) collectability was reasonably assured; and (4) the product had been shipped and title passed to the customer. These criteria were met when the customer ordered an item, the customer’s credit card had been charged, and the item was fulfilled and shipped to the customer. In accordance with ASC 606, we now recognize revenue through the following steps: (1) identification of the contract, or contracts, with the customer; (2) identification of the performance obligations in the contract; (3) determination of the transaction price; (4) allocation of the transaction price to the performance obligations in the contract; and (5) recognition of revenue when, or as, we satisfy a performance obligation. A contract is created with our customer at the time the order is placed by the customer, which creates a single performance obligation to deliver the product to the customer. We recognize revenue for our single performance obligation at the time control of the merchandise passes to the customer, which is at the time of shipment. In addition, we have elected to treat shipping and handling as fulfillment activities and not a separate performance obligation.
In accordance with our return policy, merchandise returns are accepted for full refund if returned within 30 days of the original purchase date and may be exchanged up to 60 days from the original purchase date. At the time of sale, we establish a reserve for merchandise returns, based on historical experience and expected future returns, which is recorded as a reduction of sales and cost of sales.
66
We may also issue store credit in lieu of cash refunds or exchanges and sell gift cards without expiration dates to our customers. Store credits issued and proceeds from the issuance of gift cards are recorded as deferred revenue and recognized as revenue when the store credit or gift cards are redeemed or, as a result of the adoption of ASC 606, upon inclusion in our store credit and gift card breakage estimates. Revenue recognized in net sales on breakage on store credit and gift cards for the year ended December 31, 2019 was $2.4 million. In the third quarter of 2019, our breakage revenue increased as the result of a change in our breakage rate estimate which is periodically updated based on historical redemption patterns. We did not recognize any revenue related to unredeemed gift cards or store credits in 2018 or 2017.
Results for reporting periods beginning January 1, 2019 and thereafter are presented under ASC 606, while prior period amounts have not been adjusted and continue to be reported in accordance with ASC 605. For more information on the transitional impact of adopting ASC 606, please see the section entitled, “Recent Accounting Pronouncements” in Note 2 to our consolidated financial statements included elsewhere in this Annual Report on Form 10-K.
Sales taxes and duties collected from customers and remitted to governmental authorities are accounted for on a net basis and therefore are excluded from net sales.
We have exposure to losses from fraudulent credit card charges. We record losses when incurred related to fraudulent charges as such amounts have historically been insignificant.
Inventory
Inventories are stated at the lower of cost and net realizable value. Cost is determined using the specific identification method. Cost of inventory includes import duties and other taxes and transport and handling costs. We write down inventory where it appears that the carrying cost of the inventory may not be recovered through subsequent sale of the inventory. We analyze the quantity of inventory on hand, the quantity sold in the past year, the anticipated sales volume, the expected sales price and the cost of making the sale when evaluating the value of our inventory. If the sales volume or sales price of specific products declines, additional write-downs may be required.
Income Taxes
Income taxes are accounted for under the asset and liability method. Deferred tax assets and liabilities are recognized for the future tax consequences attributable to differences between the financial statement carrying amounts of existing assets and liabilities and their respective tax bases and are recorded net on the face of the balance sheet. Deferred tax assets and liabilities are measured using enacted tax rates expected to apply to taxable income in the years in which those temporary differences are expected to be recovered or settled. The effect on deferred tax assets and liabilities of a change in tax rates is recognized in income in the period that includes the enactment date. We recognize the effect of income tax positions only if those positions are more-likely than-not of being sustained. Recognized income tax positions are measured at the largest amount that is greater than 50% likely of being realized. Changes in recognition or measurement are reflected in the period in which the change in judgment occurs.
Deferred tax assets are recognized to the extent it is believed that these assets are more-likely than-not to be realized. In assessing the realizability of deferred tax assets, management considers whether it is more likely than not that some portion or all of the deferred tax assets will not be realized. The ultimate realization of deferred tax assets is dependent upon the generation of future taxable income during the periods in which those temporary differences become deductible. Management considers the scheduled reversal of deferred tax liabilities (including the impact of available carryback and carryforward periods), projected future taxable income, and tax-planning strategies in making this assessment. Based upon the level of historical taxable income and projections for future taxable income over the periods in which the deferred tax assets are deductible, management believes it is more-likely than-not that we will realize the benefits of these deductible differences, net of the valuation allowance. The amount of the deferred tax asset considered realizable, however, could be reduced in the near term if estimates of future taxable income during the carryforward period are reduced.
67
Recent Accounting Pronouncements
See Note 2, Significant Accounting Policies, to our consolidated financial statements included elsewhere in this Annual Report on Form 10-K for additional information regarding recent accounting pronouncements.
We have operations both within the United States and internationally, and we are exposed to market risks in the ordinary course of our business, including the effects of foreign currency fluctuations, interest rate changes and inflation. Information relating to quantitative and qualitative disclosures about these market risks is set forth below.
Interest Rate Sensitivity
Cash and cash equivalents were held primarily in money market funds and cash deposits. The fair value of our cash and cash equivalents would not be significantly affected by either an increase or decrease in interest rates due mainly to the short-term nature of these instruments. Interest on any line of credit borrowings incurred pursuant to the credit agreement described above would accrue at a floating rate based on a formula tied to certain market rates at the time of incurrence; however, we do not expect that any change in prevailing interest rates will have a material impact on our results of operations.
Foreign Currency Risk
Most of our sales are denominated in U.S. dollars, and therefore, our net sales are not currently subject to significant foreign currency risk. Our operating expenses are denominated in the currencies of the countries and territories in which our operations are located, and may be subject to fluctuations due to changes in foreign currency exchange rates, particularly changes in the British Pound. Fluctuations in foreign currency exchange rates may cause us to recognize transaction gains and losses in our consolidated statements of income. To date, foreign currency transaction gains and losses have not been material to our consolidated financial statements, and we have not engaged in any foreign currency hedging transactions.
Inflation
We do not believe that inflation has had a material effect on our business, financial condition or results of operations. We continue to monitor the impact of inflation in order to minimize its effects through pricing strategies, productivity improvements and cost reductions. If our costs were to become subject to significant inflationary pressures, we may not be able to fully offset such higher costs through price increases. Our inability or failure to do so could harm our business, financial condition and results of operations.
Our consolidated financial statements and notes thereto and the report of KPMG LLP, independent registered public accounting firm, are set forth in the Index to Financial Statements under Item 15 — Exhibits and Financial Statement Schedules of this Annual Report on Form 10-K, and are incorporated herein by reference.
None.
68
Disclosure Controls and Procedures
Our management, with the participation of our Chief Executive Officers and Chief Financial Officer, has evaluated the effectiveness of our disclosure controls and procedures (as defined in Rules 13a-15(e) and 15d-15(e) under the Securities Exchange Act of 1934, as amended), as of the end of the period covered by this Annual Report. Based on the evaluation of our disclosure controls and procedures as of December 31, 2019, our Chief Executive Officer and Chief Financial Officer concluded that our disclosure controls and procedures were effective as of December 31, 2019.
Management’s Report on Internal Control over Financial Reporting
This Annual Report does not include a report of management’s assessment regarding internal control over financial reporting or an attestation report of our registered public accounting firm due to a transition period established by SEC rules for newly public companies.
Changes in Internal Control over Financial Reporting
There were no changes in our internal control over financial reporting during the fourth quarter ended December 31, 2019, that have materially affected, or are reasonably likely to materially affect, our internal control over financial reporting.
Inherent Limitation on Effectiveness of Internal Control
The effectiveness of any system of internal control over financial reporting, including ours, is subject to inherent limitations, including the exercise of judgment in designing, implementing, operating and evaluating the controls and procedures, and the inability to eliminate misconduct completely. Accordingly, any system of internal control over financial reporting, including ours, no matter how well designed and operated, can only provide reasonable, not absolute assurances. In addition, projections of any evaluation of effectiveness to future periods are subject to the risk that controls may become inadequate because of changes in conditions, or that the degree of compliance with the policies or procedures may deteriorate. We intend to continue to monitor and upgrade our internal controls as necessary or appropriate for our business, but cannot assure you that such improvements will be sufficient to provide us with effective internal control over financial reporting.
None.
69
The information required under this Item is incorporated herein by reference to the information set forth in our Proxy Statement for the 2020 Annual Meeting of Stockholders, or the Proxy Statement.
The information required under this Item is incorporated herein by reference to the information set forth in the Proxy Statement.
|
Item 12. |
SECURITY OWNERSHIP OF CERTAIN BENEFICIAL OWNERS AND MANAGEMENT AND RELATED STOCKHOLDER MATTERS |
The information required under this Item is incorporated herein by reference to the information set forth in the Proxy Statement.
The information required under this Item is incorporated herein by reference to the information set forth in the Proxy Statement.
The information required under this Item is incorporated herein by reference to the information set forth in the Proxy Statement.
70
The following documents are filed as part of this Annual Report on Form 10-K, or incorporated herein by reference:
|
|
1. |
Financial Statements. The following financial statements of Revolve Group, Inc. are filed as part of this Annual Report on Form 10-K on the pages indicated: |
|
|
Page No. |
|
REVOLVE GROUP, INC. |
|
|
74 |
|
|
75 |
|
|
76 |
|
|
77 |
|
|
Consolidated Statements of Changes in Members’/Stockholders’ Equity |
78 |
|
79 |
|
|
80 |
|
|
2. |
Financial Statement Schedules. Schedules are omitted because the required information is inapplicable, not material, or the information is presented in the consolidated financial statements or related notes. |
|
|
3. |
Exhibits. The exhibits listed in the Exhibit Index immediately below are filed as part of this Annual Report on Form 10-K, or are incorporated by reference herein. |
71
|
Exhibit Number |
|
Description |
|
Form |
|
File No. |
|
Exhibit No. |
|
Filing Date |
|
Filed/ Furnished Herewith |
|
|
|
|
|
|
|
|
|
|
|
|
|
|
|
3.1 |
|
|
10-Q |
|
001-38927 |
|
3.1 |
|
August 12, 2019 |
|
|
|
|
|
|
|
|
|
|
|
|
|
|
|
|
|
|
3.2 |
|
|
10-Q |
|
001-38927 |
|
3.2 |
|
August 12, 2019 |
|
|
|
|
|
|
|
|
|
|
|
|
|
|
|
|
|
|
4.1 |
|
|
S-1/A |
|
333-227614 |
|
4.1 |
|
November 21, 2018 |
|
|
|
|
|
|
|
|
|
|
|
|
|
|
|
|
|
|
4.2 |
|
|
|
|
|
|
|
|
|
|
X |
|
|
|
|
|
|
|
|
|
|
|
|
|
|
|
|
10.1+ |
|
Form of Director and Executive Officer Indemnification Agreement |
|
S-1/A |
|
333-227614 |
|
10.1 |
|
October 9, 2018 |
|
|
|
|
|
|
|
|
|
|
|
|
|
|
|
|
|
10.2+ |
|
|
S-1/A |
|
333-227614 |
|
10.2 |
|
October 9, 2018 |
|
|
|
|
|
|
|
|
|
|
|
|
|
|
|
|
|
|
10.3+ |
|
|
S-1/A |
|
333-227614 |
|
10.3 |
|
October 9, 2018 |
|
|
|
|
|
|
|
|
|
|
|
|
|
|
|
|
|
|
10.4+ |
|
Form of Option Agreement under the 2013 Advance Holdings, LLC Equity Incentive Plan |
|
S-1/A |
|
333-227614 |
|
10.4 |
|
October 9, 2018 |
|
|
|
|
|
|
|
|
|
|
|
|
|
|
|
|
|
10.5+ |
|
|
S-1/A |
|
333-227614 |
|
10.4 |
|
October 9, 2018 |
|
|
|
|
|
|
|
|
|
|
|
|
|
|
|
|
|
|
10.6+ |
|
Form of Notice of Stock Option Grant and Stock Option Agreement under the 2019 Equity Incentive Plan |
|
S-1/A |
|
333-227614 |
|
10.4 |
|
October 9, 2018 |
|
|
|
|
|
|
|
|
|
|
|
|
|
|
|
|
|
10.7+ |
|
|
S-1/A |
|
333-227614 |
|
10.4 |
|
October 9, 2018 |
|
|
|
|
|
|
|
|
|
|
|
|
|
|
|
|
|
|
10.8+ |
|
|
S-1/A |
|
333-227614 |
|
10.8 |
|
March 14, 2019 |
|
|
|
|
|
|
|
|
|
|
|
|
|
|
|
|
|
|
10.9+ |
|
|
S-1/A |
|
333-227614 |
|
10.9 |
|
October 9, 2018 |
|
|
|
|
|
|
|
|
|
|
|
|
|
|
|
|
|
|
10.10+ |
|
|
S-1/A |
|
333-227614 |
|
10.16 |
|
October 9, 2018 |
|
|
|
|
|
|
|
|
|
|
|
|
|
|
|
|
|
|
10.11 |
|
|
S-1/A |
|
333-227614 |
|
10.10 |
|
October 9, 2018 |
|
|
|
|
|
|
|
|
|
|
|
|
|
|
|
|
|
|
10.12 |
|
|
S-1/A |
|
333-227614 |
|
10.11 |
|
October 9, 2018 |
|
|
|
|
|
|
|
|
|
|
|
|
|
|
|
|
|
|
10.13+ |
|
Executive Employment Agreement between Eminent, Inc. and Michael Karanikolas |
|
S-1/A |
|
333-227614 |
|
10.12 |
|
October 9, 2018 |
|
|
|
|
|
|
|
|
|
|
|
|
|
|
|
|
|
10.14+ |
|
Executive Employment Agreement between Eminent, Inc. and Michael Mente |
|
S-1/A |
|
333-227614 |
|
10.13 |
|
October 9, 2018 |
|
|
|
|
|
|
|
|
|
|
|
|
|
|
|
|
|
10.15+ |
|
Executive Employment Agreement between Eminent, Inc. and Jesse Timmermans |
|
S-1/A |
|
333-227614 |
|
10.14 |
|
October 9, 2018 |
|
|
|
|
|
|
|
|
|
|
|
|
|
|
|
|
|
10.16+ |
|
Executive Employment Agreement between Eminent, Inc. and David Pujades |
|
S-1/A |
|
333-227614 |
|
10.15 |
|
October 9, 2018 |
|
|
|
|
|
|
|
|
|
|
|
|
|
|
|
|
|
10.17 |
|
|
S-1/A |
|
333-227614 |
|
10.17 |
|
May 28, 2019 |
|
|
|
|
|
|
|
|
|
|
|
|
|
|
|
|
|
|
21.1 |
|
|
|
|
|
|
|
|
|
|
X |
|
|
|
|
|
|
|
|
|
|
|
|
|
|
|
|
23.1 |
|
Consent of KPMG LLP, Independent Registered Public Accounting Firm |
|
|
|
|
|
|
|
|
|
X |
72
|
|
|
|
|
|
|
|
|
|
|
|
|
|
|
31.1 |
|
|
|
|
|
|
|
|
|
|
X |
|
|
|
|
|
|
|
|
|
|
|
|
|
|
|
|
31.2 |
|
|
|
|
|
|
|
|
|
|
X |
|
|
|
|
|
|
|
|
|
|
|
|
|
|
|
|
32.1* |
|
|
|
|
|
|
|
|
|
|
X |
|
|
|
|
|
|
|
|
|
|
|
|
|
|
|
|
101.INS |
|
XBRL Instance Document |
|
|
|
|
|
|
|
|
|
X |
|
|
|
|
|
|
|
|
|
|
|
|
|
|
|
101.SCH |
|
XBRL Taxonomy Extension Schema Linkbase Document |
|
|
|
|
|
|
|
|
|
X |
|
|
|
|
|
|
|
|
|
|
|
|
|
|
|
101.CAL |
|
XBRL Taxonomy Extension Calculation Linkbase Document |
|
|
|
|
|
|
|
|
|
X |
|
|
|
|
|
|
|
|
|
|
|
|
|
|
|
101.DEF |
|
XBRL Taxonomy Definition Linkbase Document |
|
|
|
|
|
|
|
|
|
X |
|
|
|
|
|
|
|
|
|
|
|
|
|
|
|
101.LAB |
|
XBRL Taxonomy Extension Label Linkbase Document |
|
|
|
|
|
|
|
|
|
X |
|
|
|
|
|
|
|
|
|
|
|
|
|
|
|
101.PRE |
|
XBRL Taxonomy Extension Presentation Linkbase Document |
|
|
|
|
|
|
|
|
|
X |
|
+ |
Indicates a management contract or compensatory plan. |
|
* |
The certifications attached as Exhibit 32.1 accompanying this Annual Report on Form 10-K are deemed furnished and not filed with the Securities and Exchange Commission and are not to be incorporated by reference into any filing of Revolve Group, Inc. under the Securities Act of 1933, as amended, or the Securities Exchange Act of 1934, as amended, whether made before or after the date of this Annual Report on Form 10-K, irrespective of any general incorporation language contained in such filing. |
73
REPORT OF INDEPENDENT REGISTERED PUBLIC ACCOUNTING FIRM
To the Stockholders and Board of Directors
Revolve Group, Inc.:
Opinion on the Consolidated Financial Statements
We have audited the accompanying consolidated balance sheets of Revolve Group, Inc. and subsidiaries (the Company) as of December 31, 2019 and 2018, the related consolidated statements of income, comprehensive income, changes in members’/stockholders’ equity, and cash flows for each of the years in the three‑year period ended December 31, 2019, and the related notes (collectively, the consolidated financial statements). In our opinion, the consolidated financial statements present fairly, in all material respects, the financial position of the Company as of December 31, 2019 and 2018, and the results of its operations and its cash flows for each of the years in the three‑year period ended December 31, 2019, in conformity with U.S. generally accepted accounting principles.
Change in Accounting Principle
As discussed in Note 2 to the consolidated financial statements, the Company has changed its method of accounting for net sales and expected merchandise to be returned as of January 1, 2019 due to the adoption of Accounting Standards Update (ASU) No. 2014-09, Revenue from Contacts with Customers (Topic 606).
Basis for Opinion
These consolidated financial statements are the responsibility of the Company’s management. Our responsibility is to express an opinion on these consolidated financial statements based on our audits. We are a public accounting firm registered with the Public Company Accounting Oversight Board (United States) (PCAOB) and are required to be independent with respect to the Company in accordance with the U.S. federal securities laws and the applicable rules and regulations of the Securities and Exchange Commission and the PCAOB.
We conducted our audits in accordance with the standards of the PCAOB. Those standards require that we plan and perform the audit to obtain reasonable assurance about whether the consolidated financial statements are free of material misstatement, whether due to error or fraud. Our audits included performing procedures to assess the risks of material misstatement of the consolidated financial statements, whether due to error or fraud, and performing procedures that respond to those risks. Such procedures included examining, on a test basis, evidence regarding the amounts and disclosures in the consolidated financial statements. Our audits also included evaluating the accounting principles used and significant estimates made by management, as well as evaluating the overall presentation of the consolidated financial statements. We believe that our audits provide a reasonable basis for our opinion.
/s/ KPMG LLP
We have served as the Company’s auditor since 2014.
Irvine, California
February 26, 2020
74
REVOLVE GROUP, INC. AND SUBSIDIARIES
(In thousands, except unit, share, and per share data)
|
|
|
December 31, |
|
|||||
|
|
|
2019 |
|
|
2018 |
|
||
|
Assets |
|
|
|
|
|
|
|
|
|
Current assets: |
|
|
|
|
|
|
|
|
|
Cash and cash equivalents |
|
$ |
65,418 |
|
|
$ |
16,369 |
|
|
Accounts receivable, net |
|
|
4,751 |
|
|
|
5,337 |
|
|
Inventory |
|
|
104,257 |
|
|
|
102,220 |
|
|
Income taxes receivable |
|
|
761 |
|
|
|
— |
|
|
Prepaid expenses and other current assets |
|
|
24,155 |
|
|
|
15,227 |
|
|
Total current assets |
|
|
199,342 |
|
|
|
139,153 |
|
|
Property and equipment, net |
|
|
14,734 |
|
|
|
5,907 |
|
|
Intangible assets, net |
|
|
240 |
|
|
|
564 |
|
|
Goodwill |
|
|
2,042 |
|
|
|
2,042 |
|
|
Other assets |
|
|
642 |
|
|
|
731 |
|
|
Deferred income taxes, net |
|
|
15,290 |
|
|
|
13,677 |
|
|
Total assets |
|
$ |
232,290 |
|
|
$ |
162,074 |
|
|
Liabilities and Members'/Stockholders' Equity |
|
|
|
|
|
|
|
|
|
Current liabilities: |
|
|
|
|
|
|
|
|
|
Accounts payable |
|
$ |
29,813 |
|
|
$ |
20,219 |
|
|
Income taxes payable |
|
|
470 |
|
|
|
917 |
|
|
Accrued expenses |
|
|
19,399 |
|
|
|
18,398 |
|
|
Returns reserve |
|
|
35,104 |
|
|
|
29,184 |
|
|
Other current liabilities |
|
|
16,740 |
|
|
|
13,538 |
|
|
Total current liabilities |
|
|
101,526 |
|
|
|
82,256 |
|
|
Members' equity: |
|
|
|
|
|
|
|
|
|
Class T Preferred Units, no par value—zero and 23,551,834 units authorized, issued and outstanding as of December 31, 2019 and December 31, 2018, respectively. |
|
|
— |
|
|
|
15,000 |
|
|
Class A Common Units, no par value—zero and 41,936,219 units authorized, issued and outstanding as of December 31, 2019 and December 31, 2018, respectively. |
|
|
— |
|
|
|
3,548 |
|
|
Stockholders' equity: |
|
|
|
|
|
|
|
|
|
Class A common stock, $0.001 par value; 1,000,000,000 and zero shares authorized as of December 31, 2019 and December 31, 2018, respectively; 14,009,859 and zero shares issued and outstanding as of December 31, 2019 and December 31, 2018, respectively. |
|
|
14 |
|
|
|
— |
|
|
Class B common stock, $0.001 par value; 125,000,000 and zero shares authorized as of December 31, 2019 and December 31, 2018, respectively; 55,069,124 and zero shares issued and outstanding as of December 31, 2019 and December 31, 2018, respectively. |
|
|
55 |
|
|
|
— |
|
|
Accumulated members' equity |
|
|
— |
|
|
|
61,270 |
|
|
Additional paid-in capital |
|
|
74,018 |
|
|
|
— |
|
|
Retained earnings |
|
|
56,677 |
|
|
|
— |
|
|
Total members'/stockholders' equity |
|
|
130,764 |
|
|
|
79,818 |
|
|
Total liabilities and members’/stockholders’ equity |
|
$ |
232,290 |
|
|
$ |
162,074 |
|
The accompanying notes are an integral part of these consolidated financial statements.
75
REVOLVE GROUP, INC. AND SUBSIDIARIES
CONSOLIDATED STATEMENTS OF INCOME
(In thousands, except per unit and per share data)
|
|
|
Years Ended December 31, |
|
|||||||||
|
|
|
2019 |
|
|
2018 |
|
|
2017 |
|
|||
|
Net sales |
|
$ |
600,993 |
|
|
$ |
498,739 |
|
|
$ |
399,597 |
|
|
Cost of sales |
|
|
279,040 |
|
|
|
233,433 |
|
|
|
205,907 |
|
|
Gross profit |
|
|
321,953 |
|
|
|
265,306 |
|
|
|
193,690 |
|
|
Operating expenses: |
|
|
|
|
|
|
|
|
|
|
|
|
|
Fulfillment |
|
|
19,413 |
|
|
|
13,292 |
|
|
|
9,458 |
|
|
Selling and distribution |
|
|
87,706 |
|
|
|
70,621 |
|
|
|
50,766 |
|
|
Marketing |
|
|
89,141 |
|
|
|
74,394 |
|
|
|
55,476 |
|
|
General and administrative |
|
|
77,595 |
|
|
|
65,201 |
|
|
|
57,468 |
|
|
Total operating expenses |
|
|
273,855 |
|
|
|
223,508 |
|
|
|
173,168 |
|
|
Income from operations |
|
|
48,098 |
|
|
|
41,798 |
|
|
|
20,522 |
|
|
Other expense, net |
|
|
931 |
|
|
|
631 |
|
|
|
1,431 |
|
|
Income before income taxes |
|
|
47,167 |
|
|
|
41,167 |
|
|
|
19,091 |
|
|
Provision for income tax |
|
|
11,500 |
|
|
|
10,529 |
|
|
|
14,091 |
|
|
Net income |
|
|
35,667 |
|
|
|
30,638 |
|
|
|
5,000 |
|
|
Less: Net loss attributable to non-controlling interest |
|
|
— |
|
|
|
47 |
|
|
|
347 |
|
|
Net income attributable to Revolve Group, Inc. |
|
|
35,667 |
|
|
|
30,685 |
|
|
|
5,347 |
|
|
Less: Repurchase of Class B common stock upon corporate conversion |
|
|
(40,816 |
) |
|
|
— |
|
|
|
— |
|
|
Net (loss) income attributable to common stockholders |
|
$ |
(5,149 |
) |
|
$ |
30,685 |
|
|
$ |
5,347 |
|
|
(Net loss) earnings per share of Class A and Class B common stock: |
|
|
|
|
|
|
|
|
|
|
|
|
|
Basic |
|
$ |
(0.09 |
) |
|
$ |
0.47 |
|
|
$ |
0.08 |
|
|
Diluted |
|
$ |
(0.09 |
) |
|
$ |
0.44 |
|
|
$ |
0.08 |
|
|
Weighted average Class A and Class B common shares outstanding: |
|
|
|
|
|
|
|
|
|
|
|
|
|
Basic |
|
|
57,294 |
|
|
|
41,936 |
|
|
|
41,936 |
|
|
Diluted |
|
|
57,294 |
|
|
|
44,584 |
|
|
|
44,044 |
|
The accompanying notes are an integral part of these consolidated financial statements.
76
REVOLVE GROUP, INC. AND SUBSIDIARIES
CONSOLIDATED STATEMENTS OF COMPREHENSIVE INCOME
(In thousands)
|
|
|
Years Ended December 31, |
|
|||||||||
|
|
|
2019 |
|
|
2018 |
|
|
2017 |
|
|||
|
Net income |
|
$ |
35,667 |
|
|
$ |
30,638 |
|
|
$ |
5,000 |
|
|
Other comprehensive income: |
|
|
|
|
|
|
|
|
|
|
|
|
|
Cumulative translation adjustment |
|
|
268 |
|
|
|
(208 |
) |
|
|
— |
|
|
Total other comprehensive income |
|
|
268 |
|
|
|
(208 |
) |
|
|
— |
|
|
Total comprehensive income |
|
|
35,935 |
|
|
|
30,430 |
|
|
|
5,000 |
|
|
Less: Comprehensive loss attributable to non-controlling interest |
|
|
— |
|
|
|
47 |
|
|
|
347 |
|
|
Total comprehensive income attributable to Revolve Group, Inc. |
|
$ |
35,935 |
|
|
$ |
30,477 |
|
|
$ |
5,347 |
|
The accompanying notes are an integral part of these consolidated financial statements.
77
REVOLVE GROUP, INC. AND SUBSIDIARIES
CONSOLIDATED STATEMENTS OF CHANGES IN MEMBERS’/STOCKHOLDERS’ EQUITY
(In thousands, except unit and share data)
|
|
|
Class T Preferred Units |
|
|
Class A Common Units |
|
|
Common Stock |
|
|
Non- Controlling |
|
|
Additional Paid-in |
|
|
Accumulated Members' Equity/ Retained |
|
|
Total Members'/ Stockholders' |
|
|||||||||||||||||||
|
|
|
Number |
|
|
Amount |
|
|
Number |
|
|
Amount |
|
|
Number |
|
|
Amount |
|
|
Interest |
|
|
Capital |
|
|
Earnings |
|
|
Equity |
|
||||||||||
|
Balance as of December 31, 2016 |
|
|
22,242,073 |
|
|
$ |
15,000 |
|
|
|
41,936,219 |
|
|
$ |
1,237 |
|
|
|
— |
|
|
$ |
— |
|
|
$ |
(276 |
) |
|
$ |
— |
|
|
$ |
26,116 |
|
|
$ |
42,077 |
|
|
Equity-based compensation |
|
|
— |
|
|
|
— |
|
|
|
— |
|
|
|
911 |
|
|
|
— |
|
|
|
— |
|
|
|
— |
|
|
|
— |
|
|
|
— |
|
|
|
911 |
|
|
Net income |
|
|
— |
|
|
|
— |
|
|
|
— |
|
|
|
— |
|
|
|
— |
|
|
|
— |
|
|
|
(347 |
) |
|
|
— |
|
|
|
5,347 |
|
|
|
5,000 |
|
|
Balance as of December 31, 2017 |
|
|
22,242,073 |
|
|
|
15,000 |
|
|
|
41,936,219 |
|
|
|
2,148 |
|
|
|
— |
|
|
|
— |
|
|
|
(623 |
) |
|
|
— |
|
|
|
31,463 |
|
|
|
47,988 |
|
|
Issuance of Units and Repurchases of Non-controlling Interest |
|
|
1,309,761 |
|
|
|
— |
|
|
|
— |
|
|
|
— |
|
|
|
— |
|
|
|
— |
|
|
|
670 |
|
|
|
— |
|
|
|
(670 |
) |
|
|
— |
|
|
Equity-based compensation |
|
|
— |
|
|
|
— |
|
|
|
— |
|
|
|
1,400 |
|
|
|
— |
|
|
|
— |
|
|
|
— |
|
|
|
— |
|
|
|
— |
|
|
|
1,400 |
|
|
Cumulative translation adjustment |
|
|
— |
|
|
|
— |
|
|
|
— |
|
|
|
— |
|
|
|
— |
|
|
|
— |
|
|
|
— |
|
|
|
— |
|
|
|
(208 |
) |
|
|
(208 |
) |
|
Net income |
|
|
— |
|
|
|
— |
|
|
|
— |
|
|
|
— |
|
|
|
— |
|
|
|
— |
|
|
|
(47 |
) |
|
|
— |
|
|
|
30,685 |
|
|
|
30,638 |
|
|
Balance as of December 31, 2018 |
|
|
23,551,834 |
|
|
|
15,000 |
|
|
|
41,936,219 |
|
|
|
3,548 |
|
|
|
— |
|
|
|
— |
|
|
|
— |
|
|
|
— |
|
|
|
61,270 |
|
|
|
79,818 |
|
|
Corporate conversion |
|
|
(23,551,834 |
) |
|
|
(15,000 |
) |
|
|
(41,936,219 |
) |
|
|
(3,548 |
) |
|
|
67,889,013 |
|
|
|
68 |
|
|
|
— |
|
|
|
18,480 |
|
|
|
— |
|
|
|
— |
|
|
Repurchase of Class B common stock |
|
|
— |
|
|
|
— |
|
|
|
— |
|
|
|
— |
|
|
|
(2,400,960 |
) |
|
|
(2 |
) |
|
|
— |
|
|
|
— |
|
|
|
(40,814 |
) |
|
|
(40,816 |
) |
|
Issuance of Class A common stock upon initial public offering, net of offering costs |
|
|
— |
|
|
|
— |
|
|
|
— |
|
|
|
— |
|
|
|
3,382,352 |
|
|
|
3 |
|
|
|
— |
|
|
|
52,719 |
|
|
|
|
|
|
|
52,722 |
|
|
Issuance of Class A common stock from exercise of stock options |
|
|
— |
|
|
|
— |
|
|
|
— |
|
|
|
— |
|
|
|
208,578 |
|
|
|
— |
|
|
|
— |
|
|
|
752 |
|
|
|
— |
|
|
|
752 |
|
|
Equity-based compensation |
|
|
— |
|
|
|
— |
|
|
|
— |
|
|
|
— |
|
|
|
— |
|
|
|
— |
|
|
|
— |
|
|
|
2,067 |
|
|
|
— |
|
|
|
2,067 |
|
|
Cumulative effect of adoption of ASC 606 |
|
|
— |
|
|
|
— |
|
|
|
— |
|
|
|
— |
|
|
|
— |
|
|
|
— |
|
|
|
— |
|
|
|
— |
|
|
|
286 |
|
|
|
286 |
|
|
Cumulative translation adjustment |
|
|
— |
|
|
|
— |
|
|
|
— |
|
|
|
— |
|
|
|
— |
|
|
|
— |
|
|
|
— |
|
|
|
— |
|
|
|
268 |
|
|
|
268 |
|
|
Net income |
|
|
— |
|
|
|
— |
|
|
|
— |
|
|
|
— |
|
|
|
— |
|
|
|
— |
|
|
|
— |
|
|
|
— |
|
|
|
35,667 |
|
|
|
35,667 |
|
|
Balance as of December 31, 2019 |
|
|
— |
|
|
$ |
— |
|
|
|
— |
|
|
$ |
— |
|
|
|
69,078,983 |
|
|
$ |
69 |
|
|
$ |
— |
|
|
$ |
74,018 |
|
|
$ |
56,677 |
|
|
$ |
130,764 |
|
The accompanying notes are an integral part of these consolidated financial statements.
78
REVOLVE GROUP, INC. AND SUBSIDIARIES
CONSOLIDATED STATEMENTS OF CASH FLOWS
(In thousands)
|
|
|
Year Ended December 31, |
|
|||||||||
|
|
|
2019 |
|
|
2018 |
|
|
2017 |
|
|||
|
Operating activities: |
|
|
|
|
|
|
|
|
|
|
|
|
|
Net income |
|
$ |
35,667 |
|
|
$ |
30,638 |
|
|
$ |
5,000 |
|
|
Adjustments to reconcile net income to net cash provided by operating activities: |
|
|
|
|
|
|
|
|
|
|
|
|
|
Depreciation and amortization |
|
|
3,952 |
|
|
|
2,867 |
|
|
|
2,849 |
|
|
Equity-based compensation |
|
|
2,067 |
|
|
|
1,400 |
|
|
|
911 |
|
|
Deferred income taxes, net |
|
|
(1,613 |
) |
|
|
(3,768 |
) |
|
|
3,627 |
|
|
Changes in operating assets and liabilities: |
|
|
|
|
|
|
|
|
|
|
|
|
|
Accounts receivable |
|
|
586 |
|
|
|
361 |
|
|
|
489 |
|
|
Inventories |
|
|
(15,623 |
) |
|
|
(26,046 |
) |
|
|
(7,012 |
) |
|
Income taxes receivable |
|
|
(761 |
) |
|
|
3,708 |
|
|
|
(3,372 |
) |
|
Prepaid expenses and other current assets |
|
|
1,662 |
|
|
|
(3,356 |
) |
|
|
(3,067 |
) |
|
Other assets |
|
|
89 |
|
|
|
(517 |
) |
|
|
(13 |
) |
|
Accounts payable |
|
|
9,594 |
|
|
|
2,365 |
|
|
|
751 |
|
|
Income taxes payable |
|
|
(447 |
) |
|
|
917 |
|
|
|
— |
|
|
Accrued expenses |
|
|
1,001 |
|
|
|
5,579 |
|
|
|
6,301 |
|
|
Returns reserve |
|
|
5,920 |
|
|
|
10,179 |
|
|
|
5,807 |
|
|
Other current liabilities |
|
|
3,963 |
|
|
|
2,328 |
|
|
|
4,208 |
|
|
Net cash provided by operating activities |
|
|
46,057 |
|
|
|
26,655 |
|
|
|
16,479 |
|
|
Investing activities: |
|
|
|
|
|
|
|
|
|
|
|
|
|
Purchases of property and equipment |
|
|
(12,455 |
) |
|
|
(3,045 |
) |
|
|
(2,262 |
) |
|
Net cash used in investing activities |
|
|
(12,455 |
) |
|
|
(3,045 |
) |
|
|
(2,262 |
) |
|
Financing activities: |
|
|
|
|
|
|
|
|
|
|
|
|
|
Proceeds from initial public offering, net of underwriting discounts paid |
|
|
57,077 |
|
|
|
— |
|
|
|
— |
|
|
Repurchase of Class B common stock upon corporate conversion |
|
|
(40,816 |
) |
|
|
— |
|
|
|
— |
|
|
Repayment of line of credit |
|
|
— |
|
|
|
(15,100 |
) |
|
|
(15,086 |
) |
|
Payment of deferred offering costs |
|
|
(1,834 |
) |
|
|
(2,521 |
) |
|
|
— |
|
|
Proceeds from the exercise of stock options, net |
|
|
752 |
|
|
|
— |
|
|
|
— |
|
|
Net cash provided by (used in) financing activities |
|
|
15,179 |
|
|
|
(17,621 |
) |
|
|
(15,086 |
) |
|
Effect of exchange rate changes on cash and cash equivalents |
|
|
268 |
|
|
|
(208 |
) |
|
|
— |
|
|
Net increase in cash and cash equivalents |
|
|
49,049 |
|
|
|
5,781 |
|
|
|
(869 |
) |
|
Cash and cash equivalents, beginning of period |
|
|
16,369 |
|
|
|
10,588 |
|
|
|
11,457 |
|
|
Cash and cash equivalents, end of period |
|
$ |
65,418 |
|
|
$ |
16,369 |
|
|
$ |
10,588 |
|
|
Supplemental disclosure of cash flow information: |
|
|
|
|
|
|
|
|
|
|
|
|
|
Cash paid during the period for: |
|
|
|
|
|
|
|
|
|
|
|
|
|
Interest |
|
$ |
— |
|
|
$ |
87 |
|
|
$ |
668 |
|
|
Income taxes, net of refund |
|
$ |
14,324 |
|
|
$ |
9,673 |
|
|
$ |
13,892 |
|
The accompanying notes are an integral part of these consolidated financial statements.
79
REVOLVE GROUP, INC. AND SUBSIDIARIES
NOTES TO CONSOLIDATED FINANCIAL STATEMENTS
Note 1. Description of Business
Revolve Group, Inc., or REVOLVE, is an online fashion retailer for Millennial and Generation Z consumers. Through our websites and mobile apps we deliver an aspirational customer experience from a vast, yet curated offering. Our dynamic platform connects a deeply engaged community of consumers, global fashion influencers, and emerging, established and owned brands. We are headquartered in Los Angeles County, California.
Note 2. Significant Accounting Policies
Basis of Presentation
The accompanying consolidated financial statements have been prepared in accordance with generally accepted accounting principles in the United States, or GAAP, and applicable rules and regulations of the Securities and Exchange Commission. The accompanying consolidated financial statements include the balances of Revolve Group, Inc. and all of its subsidiaries. All intercompany transactions and balances have been eliminated in consolidation. Certain prior year amounts have been reclassified for consistency with the current year presentation. These reclassifications had no effect on the reported results of operations. Our fiscal year ends on December 31 of each year.
Reorganization
Historically, Revolve Group, Inc., formerly Advance Holdings, LLC, or Advance, included its wholly owned subsidiary Advance Development, Inc. which in turn had a majority controlling interest in Forward by Elyse Walker, or FORWARD. A non-controlling interest in FORWARD was held by an outside investor, Capretto, LLC, or Capretto. Twist Holdings, LLC, or Twist, included its wholly owned subsidiaries Alliance Apparel Group, Inc. and Eminent, Inc., doing business as REVOLVE. Twist and Advance were controlled by the same group of owners. Twist and Advance are Delaware limited liability companies formed in 2012. Eminent, Inc. and Advance Development, Inc. are Delaware corporations also formed in 2012. Alliance Apparel Group, Inc. is a Delaware corporation and was formed in 2014. FORWARD was formed in 2011 as a California limited liability company.
On March 15, 2018, we reorganized these entities, by contributing Twist and subsidiaries to Advance through an exchange of equity interests in Twist for additional equity interests in Advance, resulting in Advance becoming the parent and reporting entity of the consolidated group of companies. The exchange was done using an equity unit conversion ratio to ensure each Advance and Twist equity unit holder maintained the same intrinsic value before and after the exchange.
The contribution of Twist and subsidiaries in exchange for Advance equity qualified as a combination of entities under common control. Accordingly, the contribution of net assets and the issuance of equity in Advance was recorded at the carrying amounts of assets and liabilities on the date of contribution.
The accompanying consolidated financial statements include the results of the new consolidated group as if the reorganization took place at the inception of the earliest period presented, January 1, 2018, under the principles of change in reporting entity guidance.
Additionally, on March 15, 2018, Capretto exchanged its equity interest in FORWARD, for an equity interest in Advance in the form of 1,309,761 Class T Preferred units. This exchange took place at book value and at a conversion ratio to ensure that there was neither a gain nor loss upon issuance of equity by Advance to Capretto. As a result, the non-controlling interest in FORWARD was eliminated on this date.
As further described in Note 8, Equity-based Compensation, consistent with the reorganization, options to purchase equity units in Twist were exchanged for options to purchase equity units in Advance and the Twist equity incentive plan was terminated.
80
On May 24, 2019, we effected a one-for-22.31 reverse split of all of our issued and outstanding Class T units and Class A units. All figures have been presented on the basis of the reverse split wherever applicable for all the periods presented in these consolidated financial statements.
Corporate Conversion
Prior to our initial public offering, or IPO, we operated as a Delaware limited liability company under the name Revolve Group, LLC. In connection with the IPO, Revolve Group, LLC converted into a Delaware corporation and changed its name to Revolve Group, Inc. so that the top-tier entity in our corporate structure was a corporation rather than a limited liability company, which we refer to as the Corporate Conversion. In conjunction with the Corporate Conversion, all of the outstanding Class T and Class A units of Revolve Group, LLC were converted into an aggregate of 67,889,013 shares of our Class B common stock. The holders of Class T units received an aggregate of 2,400,960 shares, representing the total preference amount for the Class T units. The remaining 65,488,053 shares of our Class B common stock were allocated on a pro rata basis to the Class T and Class A unitholders based on the number of units held by each holder. In connection with the Corporate Conversion, Revolve Group, Inc. holds all property and assets of Revolve Group, LLC and assumed all of the debts and obligations of Revolve Group, LLC. The members of the board of managers and the officers of Revolve Group, LLC became the members of the board of directors and the officers of Revolve Group, Inc.
Initial Public Offering
On June 7, 2019, we completed an IPO, in which we issued and sold 2,941,176 shares of our Class A common stock at a public offering price of $18.00 per share. We received approximately $45.8 million in net proceeds after deducting $3.3 million of underwriting discounts and approximately $3.8 million in offering costs. Upon the closing of the IPO, we used $40.8 million of the net proceeds from the offering to repurchase an aggregate of 2,400,960 shares of Class B common stock held by TSG6 L.P. and certain of its affiliates, or TSG, and Capretto.
In June 2019, we issued and sold an additional 441,176 shares of Class A common stock at a price of $18.00 per share following the underwriters’ exercise of their option to purchase additional shares and received proceeds of $7.5 million, net of underwriting discounts and commissions of $0.5 million.
In connection with the IPO, 10,147,059 Class B shares were converted into Class A shares by the selling stockholders.
Use of Estimates
The preparation of consolidated financial statements in conformity with GAAP requires management to make estimates and assumptions that affect the reported amounts of assets and liabilities and disclosure of contingent assets and liabilities at the date of the consolidated financial statements and the reported amounts of revenues and expenses during the reporting period. Actual results could differ from those estimates. Significant items subject to such estimates and assumptions include: the allowance for sales returns, the valuation of deferred tax assets, inventory, equity‑based compensation, valuation of goodwill, reserves for income tax uncertainties and other contingencies, and breakage of store credit and gift cards.
Deferred Offering Costs
Deferred offering costs of $3.8 million, which consisted of direct incremental legal, consulting, accounting fees and other direct costs relating to the IPO, were capitalized and offset against proceeds upon the consummation of the IPO, which became effective on June 6, 2019. In the third and fourth quarters of 2019, we paid an additional $0.5 million in offering costs.
81
As a result of applying ASC 606 (see Recent Accounting Pronouncements below), the impact to our consolidated balance sheet as of December 31, 2019 was as follows (in thousands):
|
|
|
December 31, 2019 |
|
|||||||||
|
|
|
As reported |
|
|
Impact due to ASC 606 |
|
|
Without adoption |
|
|||
|
Assets: |
|
|
|
|
|
|
|
|
|
|
|
|
|
Inventory |
|
$ |
104,257 |
|
|
$ |
13,586 |
|
|
$ |
117,843 |
|
|
Prepaid expenses and other current assets |
|
|
24,155 |
|
|
|
(12,989 |
) |
|
|
11,166 |
|
|
Total assets |
|
|
232,290 |
|
|
|
597 |
|
|
|
232,887 |
|
|
Liabilities: |
|
|
|
|
|
|
|
|
|
|
|
|
|
Other current liabilities |
|
|
16,740 |
|
|
|
3,149 |
|
|
|
19,889 |
|
|
Total current liabilities |
|
|
101,526 |
|
|
|
3,149 |
|
|
|
104,675 |
|
|
Stockholders' equity: |
|
|
|
|
|
|
|
|
|
|
|
|
|
Retained earnings |
|
|
56,677 |
|
|
|
(2,552 |
) |
|
|
54,125 |
|
|
Total liabilities and members’/stockholders’ equity |
|
|
232,290 |
|
|
|
597 |
|
|
|
232,887 |
|
As a result of applying Topic 606, the impact to our consolidated statements of income for the year ended December 31, 2019 was as follows (in thousands):
|
|
|
Year ended December 31, 2019 |
|
|||||||||
|
|
|
As reported |
|
|
Impact due to ASC 606 |
|
|
Without adoption |
|
|||
|
Net sales |
|
$ |
600,993 |
|
|
$ |
(2,389 |
) |
|
$ |
598,604 |
|
|
Selling and distribution |
|
|
87,706 |
|
|
|
123 |
|
|
|
87,829 |
|
|
Net income |
|
|
35,667 |
|
|
|
(2,266 |
) |
|
|
33,401 |
|
As a result of applying Topic 606, the impact to our consolidated statements of cash flows for the year ended December 31, 2019 was not material.
Revenue is primarily derived from the sale of apparel merchandise through our sites and, when applicable, shipping revenue. Prior to the adoption of ASC 606 on January 1, 2019, revenue was recognized when all of the following criteria were satisfied in accordance with the then applicable accounting literature: (1) persuasive evidence of an arrangement existed; (2) the sales price was fixed or determinable; (3) collectability was reasonably assured; and (4) the product had been shipped and title passed to the customer. These criteria were met when the customer ordered an item, the customer’s credit card had been charged, and the item was fulfilled and shipped to the customer. In accordance with ASC 606, we now recognize revenue through the following steps: (1) identification of the contract, or contracts, with the customer; (2) identification of the performance obligations in the contract; (3) determination of the transaction price; (4) allocation of the transaction price to the performance obligations in the contract; and (5) recognition of revenue when, or as, we satisfy a performance obligation. A contract is created with our customer at the time the order is placed by the customer, which creates a single performance obligation to deliver the product to the customer. We recognize revenue for our single performance obligation at the time control of the merchandise passes to the customer, which is at the time of shipment. In addition, we have elected to treat shipping and handling as fulfillment activities and not a separate performance obligation.
In accordance with our return policy, merchandise returns are accepted for full refund if returned within 30 days of the original purchase date and may be exchanged up to 60 days from the original purchase date. At the time of sale, we establish a reserve for merchandise returns, based on historical experience and expected future returns, which is recorded as a reduction of sales and cost of sales.
82
The following table presents a rollforward of our sales return reserve for the years ended December 31, 2019, 2018, and 2017:
|
|
|
December 31, |
|
|||||||||
|
|
|
2019 |
|
|
2018 |
|
|
2017 |
|
|||
|
Beginning balance |
|
$ |
29,184 |
|
|
$ |
19,005 |
|
|
$ |
13,198 |
|
|
Returns |
|
|
(691,953 |
) |
|
|
(530,824 |
) |
|
|
(385,022 |
) |
|
Provisions |
|
|
697,873 |
|
|
|
541,003 |
|
|
|
390,829 |
|
|
Ending balance |
|
$ |
35,104 |
|
|
$ |
29,184 |
|
|
$ |
19,005 |
|
We may also issue store credit in lieu of cash refunds or exchanges and sell gift cards without expiration dates to our customers. Store credits issued and proceeds from the issuance of gift cards are recorded as deferred revenue and recognized as revenue when the store credit or gift cards are redeemed or, as a result of the adoption of ASC 606, upon inclusion in our store credit and gift card breakage estimates. Revenue recognized in net sales on breakage on store credit and gift cards for the year ended December 31, 2019 was $2.4 million. In the third quarter of 2019, our breakage revenue increased as the result of a change in our breakage rate estimate which is periodically updated based on historical redemption patterns. We did not recognize any revenue related to unredeemed gift cards or store credits in 2018 or 2017. For more information on the transitional impact of adopting ASC 606, please see the section entitled, “Recent Accounting Pronouncements” below.
Sales taxes and duties collected from customers and remitted to governmental authorities are accounted for on a net basis and therefore are excluded from net sales. We currently collect sales taxes in all states that have adopted laws imposing sales tax collection obligations on out-of-state retailers and are subject to audits by state governments of sales tax collection obligations on out-of-state retailers in jurisdictions where we do not currently collect sales taxes, whether for prior years or prospectively. No significant interest or penalties related to sales taxes are recognized in the accompanying consolidated financial statements.
We have exposure to losses from fraudulent credit card charges. We record losses when incurred related to these fraudulent charges as amounts have historically been insignificant.
See Note 10, Segment Information, for disaggregation of revenue by reportable segment and by geographic area.
Cost of Sales
Cost of sales consists of the purchase price of merchandise sold to customers and includes import duties and other taxes, freight‑in, defective merchandise returned from customers, receiving costs, inventory write-offs and defective merchandise, and other miscellaneous shrinkage.
Fulfillment
Fulfillment expenses primarily consist of those costs incurred in operating and staffing the fulfillment center, including costs attributable to inspecting and warehousing inventories, picking, packaging and preparing customer orders for shipment. Fulfillment expenses also includes the cost of warehousing facilities.
Selling and Distribution
Selling and distribution expenses consist of customer service, shipping and other transportation costs incurred delivering merchandise to customers and customers returning merchandise, merchant processing fees and shipping supplies. The amount of shipping and handling costs included in selling and distribution is $57.0 million, $47.1 million, and $31.1 million for the years ended December 31, 2019, 2018, and 2017, respectively.
83
Marketing expenses are expensed as incurred and consist primarily of targeted online performance marketing costs, such as retargeting, paid search/product listing ads, affiliate marketing, paid social, search engine optimization, personalized email marketing and mobile “push” communications through our app. Marketing expenses also include our spend on brand marketing channels, including cash compensation to influencers, events and other forms of online and offline marketing. Marketing expenses are primarily related to growing and retaining the customer base.
General and Administrative
General and administrative expenses consist primarily of payroll and related benefit costs and equity‑based compensation expense for employees involved in general corporate functions including merchandising, marketing, studio and technology, as well as costs associated with the use by these functions of facilities and equipment, including depreciation, rent and other occupancy expenses.
(Net Loss) Earnings per Share
Basic (net loss) earnings per share is computed by dividing the net (loss) income attributable to common stockholders by the weighted-average number of common shares outstanding during the period. Diluted (net loss) earnings per share represents net (loss) income divided by the weighted-average number of common shares outstanding, inclusive of the effect of dilutive stock options and RSUs. See Note 9, (Net Loss) Earnings per Share, for further information.
Cash and Cash Equivalents
We maintain the majority of our cash and cash equivalents in money market funds and checking accounts with major financial institutions within the United States. Deposits in these institutions may exceed federally insured limits.
Accounts Receivable, Net
Accounts receivable are composed primarily of amounts due from financial institutions related to credit card sales. We do not maintain an allowance for doubtful accounts related to these receivables as payment is typically received in full within a few business days after the sale. We carry the remaining portion of accounts receivable at invoiced amounts less allowances for doubtful accounts and other deductions. Allowances for doubtful accounts was $0.1 million and $0.2 million at December 31, 2019 and 2018, respectively. Management evaluates the ability to collect accounts receivable based on a combination of factors. An allowance for doubtful accounts is maintained based on the length of time receivables are past due and the status of a customer’s financial position. Receivables are written off in the period deemed uncollectible after collection efforts have proven unsuccessful. We do not accrue interest on our trade receivables.
Inventory
Inventories are stated at the lower of cost and net realizable value. Cost is determined using the specific identification method. Cost of inventory includes import duties and other taxes and transport and handling costs. We write down inventory when it appears that the carrying cost of the inventory may not be recovered through subsequent sale of the inventory. We analyze the quantity of inventory on hand, the quantity sold in the past year, the anticipated sales volume, the expected sales price and the cost of making the sale when evaluating the value of our inventory. If the sales volume or sales price of specific products declines, additional write-downs may be required.
Prepaid Expenses and Other Current Assets
Prepaid expenses and other current assets consist primarily of expected merchandise returns net of related costs, prepaid rent, advanced payments on inventory to be delivered from vendors, prepaid packaging, and prepaid insurance.
84
Property and equipment are stated at cost net of accumulated depreciation and amortization. Repair and maintenance costs are expensed as incurred.
Depreciation is calculated on the straight‑line method over the estimated useful lives of the assets. The estimated useful lives of equipment and fixtures, and leasehold improvements range from three to five years or if shorter, the remaining lease term for leasehold improvements. The estimated useful life of our capitalized software is three years.
Impairment of Long-Lived Assets
We review long‑lived assets for possible impairment whenever events or changes in circumstances indicate the carrying amount may not be recoverable. This determination includes evaluation of factors such as future asset utilization and future net undiscounted cash flows expected to result from the use of the assets. If circumstances require a long‑lived asset or asset group be tested for possible impairment, we first compare undiscounted cash flows expected to be generated by that asset group to its carrying amount. If the carrying amount of the long‑lived asset or asset group is not recoverable on an undiscounted cash flow basis, an impairment is recognized to the extent that the carrying amount exceeds its fair value. No impairment losses were recognized during the years ended December 31, 2019, 2018, and 2017.
Goodwill
Goodwill represents the excess of acquisition cost over the fair value of the related net assets acquired and is not subject to amortization. As of December 31, 2019 and 2018, we had goodwill of $2.0 million. We review our goodwill annually for impairment or when circumstances indicate its carrying value may not be recoverable.
We perform this evaluation at the reporting unit level, comprised of the principle business units within our REVOLVE segment, through the application of a two-step fair value test. We have the option to perform a qualitative assessment of whether it is more likely than not that a reporting unit’s fair value is less than its carrying amount before applying the two-step goodwill impairment test. If we conclude it is not more likely than not that the fair value of a reporting unit is less than its carrying amount, then there is no need to perform the two-step impairment test. The first step in the two-step test compares the carrying value of the reporting unit to its estimated fair value, which is based on the expected present value of future cash flows (income approach), comparable public companies and acquisitions (market approach) or a combination of both. If fair value is lower than the carrying value, then a second step is performed to quantify the amount of the impairment. The implied fair value of goodwill is determined by allocating the fair value of the reporting unit in a manner similar to a purchase price allocation and the residual fair value after this allocation is the implied fair value of the reporting unit goodwill. Fair value of the reporting unit is determined using a discounted cash flow analysis. If the fair value of the reporting unit exceeds its carrying amount, step two does not need to be performed.
We perform our annual impairment review of goodwill at December 31, and when a triggering event occurs between annual impairment tests. No goodwill impairment was recorded for the years ended December 31, 2019, 2018, and 2017.
85
Income taxes are accounted for under the asset and liability method. Deferred tax assets and liabilities are recognized for the future tax consequences attributable to differences between the financial statement carrying amounts of existing assets and liabilities and their respective tax bases and are recorded net on the face of the balance sheet. Deferred tax assets and liabilities are measured using enacted tax rates expected to apply to taxable income in the years in which those temporary differences are expected to be recovered or settled. The effect on deferred tax assets and liabilities of a change in tax rates is recognized in income in the period that includes the enactment date. We recognize the effect of income tax positions only if those positions are more-likely than-not of being sustained. Recognized income tax positions are measured at the largest amount that is greater than 50% likely of being realized. Changes in recognition or measurement are reflected in the period in which the change in judgment occurs.
Deferred tax assets are recognized to the extent it is believed that these assets are more likely than not to be realized. In assessing the realizability of deferred tax assets, management considers whether it is more-likely than-not that some portion or all of the deferred tax assets will not be realized. The ultimate realization of deferred tax assets is dependent upon the generation of future taxable income during the periods in which those temporary differences become deductible. Management considers the scheduled reversal of deferred tax liabilities (including the impact of available carryback and carryforward periods), projected future taxable income, and tax‑planning strategies in making this assessment. Based upon the level of historical taxable income and projections for future taxable income over the periods in which the deferred tax assets are deductible, management believes it is more‑likely than‑not that we will realize the benefits of these deductible differences, net of the valuation allowance. The amount of the deferred tax asset considered realizable, however, could be reduced in the near term if estimates of future taxable income during the carryforward period are reduced.
Equity-based Compensation
We measure equity-based compensation expense associated with the awards granted based on their estimated fair values at the grant date. For awards with service conditions only, equity-based compensation expense is recognized over the requisite service period using the straight-line method. Forfeitures are recorded as they occur. See Note 8, Equity-based Compensation, for additional details.
We have historically granted options that contain performance conditions. The performance conditions for these awards have been met and the expense associated with these awards has been fully recognized.
Employee Benefit Plan
We sponsor a qualified 401(k) defined contribution plan covering eligible employees. Participants may contribute a percentage of their pretax earnings annually, subject to limitations imposed by the Internal Revenue Service. We have the ability to make discretionary contributions to the 401(k) plan but have not done so to date.
Commitments and Contingencies
Liabilities for loss contingencies arising from claims, assessments, litigation, fines, and penalties and other sources are recorded when it is probable that a liability has been incurred and the amount can be reasonably estimated. Legal costs incurred in connection with loss contingencies are expensed as incurred.
86
We utilize valuation techniques that maximize the use of observable inputs and minimize the use of unobservable inputs to the extent possible. We determine fair value based on assumptions that market participants would use in pricing an asset or liability in the principal or most advantageous market. The carrying amounts for our cash and cash equivalents, accounts receivable, accounts payable, line of credit and accrued expenses approximate fair value due to their short-term maturities. When considering market participant assumptions in fair value measurements, the following fair value hierarchy distinguishes between observable and unobservable inputs, which are categorized in one of the following levels:
|
|
• |
Level 1 Inputs: Unadjusted quoted prices in active markets for identical assets or liabilities. |
|
|
• |
Level 2 Inputs: Other than quoted prices included in Level 1 inputs that are observable for the asset or liability, either directly or indirectly, for substantially the full-term of the asset or liability. |
|
|
• |
Level 3 Inputs: Unobservable inputs for the asset or liability used to measure fair value to the extent that observable inputs are not available, thereby allowing for situations in which there is little, if any, market activity for the asset or liability at measurement date. |
We consider all highly liquid investments purchased with a maturity of three months or less to be cash equivalents. Our cash equivalents are comprised of money market funds, which are valued based on Level 1 inputs consisting of quoted prices in active markets. We did not have any cash equivalents as of December 31, 2018. Our cash equivalents as of December 31, 2019 were $37.6 million.
Comprehensive Income
Comprehensive income consists of net income and foreign currency translation adjustments.
Related Party Transactions
TSG is a related party of TSG6 L.P., an investor in our Company. We incurred $0.5 million, $0.3 million, and $0.3 million of management fees from TSG for the years ended December 31, 2019, 2018 and 2017. Upon the closing of our IPO, our management agreement with TSG was terminated. There were no amounts owed to TSG as of December 31, 2019 and 2018.
Certain Risks and Concentrations
We are subject to certain risks, including dependence on third‑party technology providers and hosting services for our website servers, exposure to risks associated with online commerce security, credit card fraud, as well as the interpretation of state and local laws and regulations in regards to the collection and remittance of sales and use taxes. We do not have significant vendor concentrations.
Recent Accounting Pronouncements
Under the Jumpstart Our Business Startups Act of 2012, or the JOBS Act, we meet the definition of an emerging growth company. We have elected to use this extended transition period for complying with new or revised accounting standards pursuant to Section 107(b) of the JOBS Act and as a result of this election, our financial statements may not be comparable to companies that comply with public company effective dates. We will remain an emerging growth company until the earliest of (1) the end of the fiscal year in which the market value of our common stock that is held by non-affiliates is at least $700 million as of the last business day of our most recently completed second fiscal quarter, (2) the end of the fiscal year in which we have total annual gross revenues of $1.07 billion or more during such fiscal year, (3) the date on which we issue more than $1.0 billion in non-convertible debt in a three-year period, or (4) the end of the fiscal year in which the fifth anniversary of our IPO occurs.
87
On January 1, 2019 we adopted Accounting Standards Update, or ASU, No. 2016-16, Income Taxes (Topic 740): Intra-Entity Transfer of Assets Other than Inventory. This ASU removes the prohibition against the immediate recognition of the current and deferred income tax consequences of an intra-entity transfer of an asset, other than inventory, when the transfer occurs. The adoption of this ASU in the first quarter of 2019 did not have a material impact on our consolidated financial statements.
On January 1, 2019 we adopted ASU No. 2014-09, Revenue from Contacts with Customers (Topic 606), and its subsequent updates, which replaces most existing revenue recognition guidance under Accounting Standards Codification, or ASC, 605. It provides principles for recognizing revenue for the transfer of promised goods or services to customers with the consideration to which the entity expects to be entitled in exchange for those goods or services. Upon the adoption of ASC 606 under the modified retrospective approach, we have recorded a net increase of $0.3 million to beginning retained earnings as of January 1, 2019 resulting primarily from the recognition of breakage revenue from estimated unredeemed store credit and gift cards over the expected customer redemption period. In addition, we have prospectively included expected merchandise to be returned, net of related costs, within prepaid expenses and other current assets rather than including it in our inventory balance within our consolidated balance sheets. Results for reporting periods beginning January 1, 2019 and thereafter are presented under ASC 606, while prior period amounts have not been adjusted and continue to be reported in accordance with ASC 605. For more information on the transitional impact of adopting ASC 606, see the section entitled “Net Sales” above.
Accounting Pronouncements Not Yet Effective
In December 2019, the Financial Accounting Standards Board, FASB, issued ASU 2019-12, Income Taxes (Topic 740): Simplifying the Accounting for Income Taxes, which is intended to simplify various aspects related to the accounting for income taxes. The pronouncement is effective for fiscal years, and for interim periods within those fiscal years, beginning after December 15, 2020, with early adoption permitted. ASU 2019-12 is effective for us for annual periods beginning after December 15, 2021 and interim periods within fiscal years beginning after December 15, 2022. We are currently in the process of evaluating the effects of this pronouncement on our consolidated financial statements.
In January 2017, the FASB issued ASU No. 2017-04, Intangibles—Goodwill and Other (Topic 350): Simplifying the Test for Goodwill Impairment, which simplifies the accounting for goodwill impairment by removing step two from the goodwill impairment test. Under this new guidance, if the carrying amount of a reporting unit exceeds its estimated fair value, an impairment charge shall be recognized in an amount equal to that excess, limited to the total amount of goodwill allocated to that reporting unit. The update also eliminates the requirement for any reporting unit with a zero or negative carrying amount to perform a qualitative assessment. This guidance is effective for us for annual or interim goodwill impairment tests in fiscal years beginning December 15, 2021 with early adoption permitted. We do not expect that this ASU will have a significant impact on our consolidated financial statements and related disclosures.
In February 2016, the FASB issued ASU No. 2016-02, Leases (Topic 842). Under this ASU, a lessee is generally required to recognize the lessee’s rights and obligations resulting from leases on the balance sheet by recording a right-of-use asset and a lease liability. The new standard requires lessees to classify leases as either finance or operating leases based on the principle of whether or not the lease is effectively a financed purchase by the lessee. This classification will determine whether lease expense is recognized based on an effective interest method or on a straight-line basis over the term of the lease. In November 2019, the FASB issued ASU No. 2019-10 extending the effective date of this new lease standard by one year making it effective for us for annual periods beginning after December 15, 2020 and interim periods within fiscal years beginning after December 15, 2021. The standard requires recognizing and measuring leases using a modified retrospective approach or allowing for application of the guidance at the beginning of the period in which it is adopted by recognizing a cumulative-effect adjustment to the opening balance of retained earnings in the period of adoption rather than at the beginning of the earliest comparative period presented. We plan to elect the package of practical expedients permitted under the transition guidance within the new standard, which among other things, will allow us to carryforward the historical lease classification of our existing leases. However, we are still evaluating the potential impact of this ASU on our consolidated financial statements and related disclosures.
88
Note 3. Goodwill and Other Intangible Assets, Net
The carrying value of goodwill as of December 31, 2019 and 2018, was $2.0 million. No goodwill impairment was recorded for the years ended December 31, 2019, 2018 and 2017.
The gross amounts and accumulated amortization of our acquired identifiable intangible assets with finite useful lives as of December 31, 2019 and 2018, included in intangible assets, net in the accompanying consolidated balance sheets, are as follows (in thousands):
|
|
|
|
|
December 31, |
|
|||||
|
|
|
Useful life |
|
2019 |
|
|
2018 |
|
||
|
Customer relationships |
|
3 – 6 years |
|
$ |
381 |
|
|
$ |
381 |
|
|
Trademarks |
|
4 – 7 years |
|
|
1,690 |
|
|
|
1,690 |
|
|
Total intangible assets |
|
|
|
|
2,071 |
|
|
|
2,071 |
|
|
Less accumulated amortization |
|
|
|
|
(1,831 |
) |
|
|
(1,507 |
) |
|
Total intangible assets, net |
|
|
|
$ |
240 |
|
|
$ |
564 |
|
Our amortization expense for acquired identifiable intangible assets with finite useful lives was $0.3 million for each of the years ended December 31, 2019, 2018, and 2017. Future estimated amortization expense for acquired identifiable intangible assets is as follows (in thousands):
|
|
|
Amortization Expense |
|
|
|
Year ending December 31: |
|
|
|
|
|
2020 |
|
|
240 |
|
|
Total amortization expense |
|
$ |
240 |
|
Note 4. Property and Equipment, Net
Property and equipment, net is summarized as follows (in thousands):
|
|
|
December 31, |
|
|||||
|
|
|
2019 |
|
|
2018 |
|
||
|
Office and warehouse equipment and fixtures |
|
$ |
13,566 |
|
|
$ |
5,052 |
|
|
Computer equipment and capitalized software |
|
|
6,287 |
|
|
|
6,236 |
|
|
Leasehold improvements |
|
|
3,411 |
|
|
|
2,826 |
|
|
Other |
|
|
1,740 |
|
|
|
1,233 |
|
|
Total property and equipment |
|
|
25,004 |
|
|
|
15,347 |
|
|
Less accumulated depreciation and amortization |
|
|
(10,270 |
) |
|
|
(9,440 |
) |
|
Total property and equipment, net |
|
$ |
14,734 |
|
|
$ |
5,907 |
|
Total depreciation and amortization expense for the years ended December 31, 2019, 2018 and 2017 was $3.6 million, $2.5 million, and $2.5 million, respectively. For the years ended December 31, 2019, 2018 and 2017, $2.2 million was recorded in general and administrative expense and $1.4 million, $0.3 million, and $0.3 million, respectively, was recorded in fulfillment expense in the accompanying consolidated statement of income.
89
On March 23, 2016, we entered into a line of credit agreement with Bank of America, N.A, with an expiration date of March 23, 2021. The line of credit provides us with up to $75.0 million aggregate principal in revolver borrowings, based on eligible inventory and accounts receivable less reserves. Borrowings under the credit agreement accrue interest, at our option, at (1) a base rate equal to the highest of (a) the federal funds rate plus 0.50%, (b) the prime rate and (c) the LIBOR rate plus 1.00%, in each case plus a margin ranging from 0.25% to 0.75%, or (2) an adjusted LIBOR rate plus a margin ranging from 1.25% to 1.75%. No borrowings were outstanding as of December 31, 2019 or December 31, 2018. As of December 31, 2017, we had $15.1 million outstanding on the new line of credit. The weighted-average interest rate of debt outstanding at December 31, 2017 was 5%.
We are also obligated to pay other customary fees for a credit facility of this size and type, including an unused commitment fee. The credit agreement also permits us, in certain circumstances, to request an increase in the facility by an additional amount of up to $25.0 million (in an initial minimum amount of $10 million and in increments of $5 million thereafter) at the same maturity, pricing and other terms. Our obligations under the credit agreement are secured by substantially all of our assets. The credit agreement also contains customary covenants restricting our activities, including limitations on our ability to sell assets, engage in mergers and acquisitions, enter in transactions involving related parties, obtain letters of credit, incur indebtedness or grant liens or negative pledges on our assets, make loans or make other investments. Under the covenants, we are prohibited from paying cash dividends with respect to our capital stock. We were in compliance with all covenants as of December 31, 2019 and 2018.
Note 6. Commitments and Contingencies
Contingencies
We record a loss contingency when it is probable that a liability has been incurred and the amount of the loss can be reasonably estimated. We also disclose material contingencies when we believe a loss is not probable but reasonably possible. Accounting for contingencies requires us to use judgment related to both the likelihood of a loss and the estimate of the amount or range of loss. Although we cannot predict with assurance the outcome of any litigation or tax matters, we do not believe there are currently any such actions that, if resolved unfavorably, would have a material impact on our operating results, financial position and cash flows.
Indemnifications
In the ordinary course of business, we may provide indemnifications of varying scope and terms to vendors, directors, officers and other parties with respect to certain matters. We have not incurred any material costs as a result of such indemnifications and have not accrued any liabilities related to such obligations in our consolidated financial statements.
Tax Contingencies
We are subject to income taxes in the United States and the United Kingdom. Significant judgment is required in evaluating our tax positions and determining our provision for income taxes. During the ordinary course of business, there are transactions and calculations for which the ultimate tax determination is uncertain. We establish reserves for tax-related uncertainties based on estimates or whether, and the extent to which, additional taxes will be due. These reserves are established when we believe that certain positions might be challenged despite our belief that our tax return positions are fully supportable. We adjust these reserves in light of changing facts and circumstances, such as the outcome of tax audits. Our provision for income taxes does not include any reserve provision because we believe that all of our tax positions are highly certain.
Legal Proceedings
We are a defendant in a purported class action lawsuit filed in the Superior Court of California, Los Angeles County, which was filed in May 2019, arising from employee wage-and-hour claims under California law for alleged meal period, rest period, payment of wages at separation, wage statement violations, and unfair business practices. On January 6, 2020, the Company and the individual defendant in the case entered into a binding memorandum of understanding to settle the case which will need to be submitted for court approval prior to becoming final. As a result, we have accrued approximately $1.0 million to general and administrative expenses in the accompanying consolidated statement of income as of December 31, 2019.
90
We lease office and warehouse space and equipment used in connection with our operations under various operating leases, some of which provide for rental payments on a graduated basis, rent holidays and other incentives. At the inception of the lease, we evaluate each agreement to determine whether the lease will be accounted for as an operating or capital lease. We record rent expense on a straight‑line basis over the lease period. Any lease incentives are recognized as reductions of rental expense on a straight‑line basis over the term of the lease.
Rental expense was $5.4 million and $3.6 million for the years ended December 31, 2019 and 2018, respectively, and is included in fulfillment expenses and general and administrative expenses in the accompanying consolidated statements of income.
Rental expense included in fulfillment expenses was $3.2 million and $1.7 million for the years ended December 31, 2019 and 2018, respectively.
Rental expense included in general and administrative expenses was $2.2 million and $1.9 million, respectively, for the years ended December 31, 2019 and 2018, respectively.
Future minimum lease payments under noncancelable operating leases (with initial or remaining lease terms in excess of one year) as of December 31, 2019 are as follows (in thousands):
|
|
|
Operating Leases |
|
|
|
Year ending December 31: |
|
|
|
|
|
2020 |
|
$ |
4,443 |
|
|
2021 |
|
|
4,183 |
|
|
2022 |
|
|
3,198 |
|
|
2023 |
|
|
3,197 |
|
|
2024 |
|
|
— |
|
|
Total minimum lease payments |
|
$ |
15,021 |
|
Note 7. Income Taxes
The components of the provision for income tax expense (benefit) are as follows (in thousands):
|
|
|
December 31, 2019 |
|
|||||||||
|
|
|
Current |
|
|
Deferred |
|
|
Total |
|
|||
|
U.S. federal |
|
$ |
8,446 |
|
|
$ |
(700 |
) |
|
$ |
7,746 |
|
|
State and local |
|
|
4,218 |
|
|
|
(913 |
) |
|
|
3,305 |
|
|
Foreign |
|
|
449 |
|
|
|
— |
|
|
|
449 |
|
|
|
|
$ |
13,113 |
|
|
$ |
(1,613 |
) |
|
$ |
11,500 |
|
|
|
|
December 31, 2018 |
|
|||||||||
|
|
|
Current |
|
|
Deferred |
|
|
Total |
|
|||
|
U.S. federal |
|
$ |
9,877 |
|
|
$ |
(2,847 |
) |
|
$ |
7,030 |
|
|
State and local |
|
|
3,867 |
|
|
|
(921 |
) |
|
|
2,946 |
|
|
Foreign |
|
|
553 |
|
|
|
— |
|
|
|
553 |
|
|
|
|
$ |
14,297 |
|
|
$ |
(3,768 |
) |
|
$ |
10,529 |
|
91
|
|
|
December 31, 2017 |
|
|||||||||
|
|
|
Current |
|
|
Deferred |
|
|
Total |
|
|||
|
U.S. federal |
|
$ |
8,656 |
|
|
$ |
3,763 |
|
|
$ |
12,419 |
|
|
State and local |
|
|
1,808 |
|
|
|
(136 |
) |
|
|
1,672 |
|
|
|
|
$ |
10,464 |
|
|
$ |
3,627 |
|
|
$ |
14,091 |
|
The components of net deferred tax assets (liabilities) are as follows (in thousands):
|
|
|
December 31, |
|
|||||
|
|
|
2019 |
|
|
2018 |
|
||
|
Deferred tax assets: |
|
|
|
|
|
|
|
|
|
Accrued liabilities, reserves and other |
|
$ |
11,152 |
|
|
$ |
9,283 |
|
|
UNICAP |
|
|
3,310 |
|
|
|
3,071 |
|
|
Tax basis goodwill |
|
|
2,121 |
|
|
|
2,398 |
|
|
Investment in FORWARD |
|
|
2,753 |
|
|
|
2,402 |
|
|
Equity-based compensation |
|
|
1,371 |
|
|
|
855 |
|
|
Deferred revenue |
|
|
1,229 |
|
|
|
— |
|
|
Net operating loss |
|
|
786 |
|
|
|
1,291 |
|
|
Gross deferred tax assets |
|
|
22,722 |
|
|
|
19,300 |
|
|
Valuation allowance |
|
|
(786 |
) |
|
|
(1,291 |
) |
|
Deferred tax assets, net of valuation allowance |
|
|
21,936 |
|
|
|
18,009 |
|
|
Deferred tax liabilities: |
|
|
|
|
|
|
|
|
|
Accrued expenses and reserves |
|
|
(4,364 |
) |
|
|
(3,723 |
) |
|
State taxes |
|
|
(53 |
) |
|
|
48 |
|
|
Depreciation |
|
|
(2,146 |
) |
|
|
(487 |
) |
|
Intangible assets |
|
|
(83 |
) |
|
|
(170 |
) |
|
Total gross deferred liabilities |
|
|
(6,646 |
) |
|
|
(4,332 |
) |
|
Net deferred tax assets |
|
$ |
15,290 |
|
|
$ |
13,677 |
|
As of December 31, 2019 and 2018, we had gross federal and state operating loss carryforwards of $5.4 million and $9.3 million, respectively. If not utilized, these losses will begin to expire in 2034. For the years ended December 31, 2019 and 2018, we recorded a full valuation allowance of $0.8 million and $1.3 million, respectively, on the net operating loss carryforwards deferred tax asset, as management concluded that it is more-likely than-not that the asset will not be realized.
Our effective tax rate was different than the statutory U.S. federal income tax rate for the following reasons:
|
|
|
December 31, |
|
|||||||||
|
|
|
2019 |
|
|
2018 |
|
|
2017 |
|
|||
|
Computed “expected” tax expense |
|
|
21.0 |
% |
|
|
21.0 |
% |
|
|
35.0 |
% |
|
Deferred rate adjustment |
|
|
— |
|
|
|
— |
|
|
|
27.0 |
|
|
Valuation allowance |
|
|
(1.1 |
) |
|
|
0.2 |
|
|
|
6.1 |
|
|
State and local income taxes, net of federal tax benefit |
|
|
5.8 |
|
|
|
5.7 |
|
|
|
4.7 |
|
|
Foreign-derived intangible income |
|
|
(1.3 |
) |
|
|
(1.6 |
) |
|
|
— |
|
|
Permanent items |
|
|
1.2 |
|
|
|
1.3 |
|
|
|
0.3 |
|
|
Equity-based compensation |
|
|
(1.2 |
) |
|
|
— |
|
|
|
— |
|
|
Other |
|
|
— |
|
|
|
(1.0 |
) |
|
|
0.7 |
|
|
|
|
|
24.4 |
% |
|
|
25.6 |
% |
|
|
73.8 |
% |
92
On December 22, 2017, the U.S. Tax Cuts and Jobs Act, or the Tax Reform Act, was signed into law. The Tax Reform Act significantly revised the U.S. corporate income tax law by, among other things, lowering the U.S. corporate tax rate from 35% to 21%, effective January 1, 2018 and repealing the Alternative Minimum Tax. ASC, 740 requires that the impact of tax legislation be recognized in the period in which the law was enacted. We recorded tax expense of $5.1 million due to the remeasurement of deferred tax assets and liabilities in the year ended December 31, 2017 as a result of the Tax Reform Act.
For the year ended December 31, 2017, Twist Holdings, LLC and Advance Holdings, LLC filed separate consolidated federal and state income tax returns. For the years ended December 31, 2019 and 2018, we filed a consolidated federal and state income tax return for Revolve Group, Inc. We believe that there are no uncertain tax positions that would impact the accompanying consolidated financial statements. We do not anticipate there will be a material change in our recognition of uncertain tax positions in the next 12 months.
The tax years ended December 31, 2016 through 2019 remain subject to possible examination by the Internal Revenue Service and possible examination by state tax jurisdictions. No interest or penalties related to income taxes are recognized in the accompanying consolidated financial statements.
Note 8. Equity-based Compensation
In 2013, Twist and Advance adopted equity incentive plans, which we refer to collectively as the 2013 Plan, pursuant to which the board of managers could grant options to purchase Class A units to officers and employees. Options could be granted with an exercise price equal to or greater than the unit’s fair value at the date of grant. All issued awards have 10 year terms and generally vest and become fully exercisable annually over five years of service from the date of grant. Awards will become fully vested upon the sale of the company.
On March 15, 2018, in connection with the reorganization described in Note 2, Significant Accounting Policies, to which Revolve Group, Inc. issued Class T and Class A units to its members in exchange for the Class T and Class A units of Twist, all outstanding options to purchase Class A units of Twist granted under the Twist Holdings, LLC 2013 Equity Incentive Plan, each of which we refer to as a Twist Option, were exchanged for options to purchase Class A units of Revolve Group, Inc. under the 2013 Plan. The number of Revolve Group, Inc. Class A units and the per unit exercise price of each converted option was adjusted from the underlying Twist Option by taking into account the implied values of Twist and Revolve Group, Inc. as of immediately before the exchange and in a manner that did not result in an increase to the intrinsic value of the converted option. As no incremental value was created for the option holders as a result of the restructuring, no incremental equity-based compensation expense was recorded for the year ended December 31, 2018 related to the exchange. In connection with the reorganization described in Note 2, Significant Accounting Policies, the 2013 Plan was amended to increase the maximum number of Class A units available to be issued to 6,207,978.
Upon the effectiveness of the Corporate Conversion on June 6, 2019, as discussed in Note 2, Significant Accounting Policies, the options to purchase Class A units of Revolve Group, LLC were converted into options to purchase Class B common stock of Revolve Group, Inc. on a 1:1 basis and in a manner that did not result in an increase to the intrinsic value of the converted option.
In September 2018, the board of directors adopted the 2019 Equity Incentive Plan, or the 2019 Plan, which became effective in June 2019. Under the 2019 Plan, a total of 4,500,000 shares of our Class A common stock are reserved for issuance as options, stock appreciation rights, restricted stock, restricted stock units, or RSUs, performance units or performance shares. Upon the completion of our IPO, the 2019 Plan replaced the 2013 Plan, however, the 2013 Plan will continue to govern the terms and conditions of the outstanding awards previously granted under that plan. The number of shares that will be available for issuance under our 2019 Plan also will increase annually on the first day of each year beginning in 2020, in an amount equal to the least of: (1) 6,900,000 shares, (2) 5% of the outstanding shares of all classes of our common stock as of the last day of the immediately preceding year and (3) such other amount as our board of directors may determine. All future grants going forward will be issued under the 2019 Plan. As of December 31, 2019, approximately 4.5 million common shares remain available for future issuance under the 2019 Plan.
93
The grant-date fair value of each option award is estimated on the date of grant using the Black-Scholes option pricing model. The Black-Scholes option pricing model requires inputs such as expected term, fair value per unit of our Class A shares, expected volatility and risk-free interest rate. These inputs are subjective and generally require significant analysis and judgment to develop. We utilized the simplified method for calculating expected term for the years ended December 31, 2019, 2018 and 2017 as there was no exercise history prior to our IPO, using the average of the vesting period and the contractual life of the option. The dividend yield is 0%, as we have not paid, nor do we expect to pay, dividends. The risk-free interest rate is based on the implied yield available on U.S. Treasury issues with an equivalent remaining term. Expected volatility was historically estimated based on the average historical volatility of similar entities with publicly traded shares. For the options granted during 2017, the fair value per Class A share was calculated by us using a market multiples valuation approach by applying a multiple to historical financial performance and adjusting for changes in cash, third-party debt, liquidation preferences of holders of our preferred units, and assumed cash to be received from option exercises. For the options granted during 2018 and 2019, we relied on valuations of our Class A shares prepared by an independent third-party valuation firm in accordance with the guidance provided by the American Institute of Certified Public Accountants 2013 Practice Guide, Valuation of Privately-Held-Company Equity Securities Issued as Compensation, the results of which were aligned with our internal valuation approach. We have not issued any option awards to employees subsequent to our IPO, however, the fair of any future option award grants will be based on observable market prices and volatility will be based on the historical volatility of our common shares validated against the volatility rates of similar entities with publicly traded shares.
All historical data presented in the tables within this footnote have been recast to retroactively reflect all share and per share data of options as if they had been issued by Revolve Group, Inc. and that both the reverse split and Corporate Conversion had occurred. See Note 2, Significant Accounting Policies, for further information regarding the reverse split and Corporate Conversion.
The weighted average assumptions for the grants in the years ended December 31, 2019, 2018 and 2017 are provided in the following table:
|
|
|
December 31, |
|
|||||||||
|
|
|
2019 |
|
|
2018 |
|
|
2017 |
|
|||
|
Valuation assumptions: |
|
|
|
|
|
|
|
|
|
|
|
|
|
Expected dividend yield |
|
|
— |
% |
|
|
— |
% |
|
|
— |
% |
|
Expected volatility |
|
|
37.3 |
% |
|
|
43.4 |
% |
|
|
40.2 |
% |
|
Expected term (years) |
|
|
6.5 |
|
|
|
6.5 |
|
|
|
6.5 |
|
|
Risk-free interest rate |
|
|
2.4 |
% |
|
|
2.6 |
% |
|
|
1.9 |
% |
Option activity under the 2013 Plan is as follows:
|
|
|
Number of Shares |
|
|
Weighted Average Exercise Price |
|
|
Weighted Average Remaining Contractual Term |
|
|
Aggregate Intrinsic Value (000's) |
|
||||
|
Balance at January 1, 2019 |
|
|
5,139,304 |
|
|
$ |
6.22 |
|
|
|
7.1 |
|
|
$ |
48,416 |
|
|
Granted |
|
|
67,232 |
|
|
|
15.62 |
|
|
|
9.3 |
|
|
|
|
|
|
Exercised |
|
|
(208,578 |
) |
|
|
3.60 |
|
|
|
|
|
|
|
|
|
|
Forfeited |
|
|
(79,619 |
) |
|
|
15.62 |
|
|
|
|
|
|
|
|
|
|
Expired |
|
|
(2,265 |
) |
|
|
15.62 |
|
|
|
|
|
|
|
|
|
|
Balance at December 31, 2019 |
|
|
4,916,074 |
|
|
|
6.30 |
|
|
|
5.6 |
|
|
|
59,368 |
|
|
Exercisable at December 31, 2019 |
|
|
3,521,797 |
|
|
|
4.26 |
|
|
|
4.7 |
|
|
|
49,705 |
|
|
Vested and expected to vest |
|
|
4,805,523 |
|
|
|
6.30 |
|
|
|
5.5 |
|
|
|
58,001 |
|
94
RSU award activity under the 2019 Plan is as follows:
|
|
|
Class A Common Stock |
|
|
Weighted Average Grant Date Fair Value |
|
|
Weighted Average Remaining Contractual Term |
|
|
Aggregate Intrinsic Value (000's) |
|
||||
|
Unvested at January 1, 2019 |
|
|
— |
|
|
$ |
— |
|
|
|
— |
|
|
$ |
— |
|
|
Granted |
|
|
13,130 |
|
|
|
19.04 |
|
|
|
3.6 |
|
|
|
— |
|
|
Vested |
|
|
— |
|
|
|
— |
|
|
|
|
|
|
|
|
|
|
Forfeited |
|
|
— |
|
|
|
— |
|
|
|
|
|
|
|
|
|
|
Unvested at December 31, 2019 |
|
|
13,130 |
|
|
|
19.04 |
|
|
|
3.6 |
|
|
|
242 |
|
There were 67,232 options and 13,130 RSUs granted during the year ended December 31, 2019. The weighted average grant-date fair value of options and RSUs granted during the year ended December 31, 2019 was $15.62 per share and $19.04 per share, respectively.
As of December 31, 2019, there was $5.9 million of total unrecognized compensation cost related to unvested options and RSUs granted under the 2013 Plan and 2019 Plan, which is expected to be recognized over a weighted average service period of 3.8 years.
Equity‑based compensation cost that has been included in general and administrative expense in the accompanying consolidated statements of income amounted to $2.1 million, $1.4 million, and $0.9 million for the years ended December 31, 2019, 2018, and 2017 respectively. An excess income tax benefit of $0.6 million was recognized in the consolidated statements of income for equity‑based compensation arrangements for the year ended December 31, 2019. There was no such excess income tax benefit recognized in the consolidated statements of income for the years ended December 31, 2018 and 2017.
Note 9. (Net Loss) Earnings per Share
Basic and diluted (net loss) earnings per share is presented in conformity with the two-class method required for participating securities and multiple classes of common stock. We considered the Class T preferred units, which were outstanding prior to the Corporate Conversion, to be a participating security. In connection with our IPO, we established two classes of authorized common stock: Class A common stock and Class B common stock. The rights of the holders of Class A and Class B common stock are identical, except for voting and conversion rights. Each share of Class A common stock is entitled to one vote per share. Each share of Class B common stock is entitled to ten votes per share and is convertible at any time into one share of Class A common stock.
Undistributed earnings allocated to the Class T preferred units are subtracted from net income in determining net income attributable to common stockholders. Basic (net loss) earnings per share is computed by dividing the net (loss) income attributable to common stockholders by the weighted-average number of common shares outstanding during the period. As a participating security, the Class T preferred units are excluded from basic weighted-average common shares outstanding.
Diluted (net loss) earnings per share represents net (loss) income divided by the weighted-average number of common shares outstanding, inclusive of the effect of dilutive stock options and RSUs. For the year ended December 31, 2019, our potential dilutive shares relating to stock options and RSUs were not included in the computation of diluted (net loss) earnings per share as the effect of including these shares in the calculation would have been anti-dilutive. The undistributed (net losses) earnings are allocated based on the participation rights of Class A and Class B common shares as if the earnings for the year have been distributed and losses allocated. As the liquidation and dividend rights are identical for both classes, the undistributed earnings are allocated on a proportionate basis.
95
For the calculation of basic and diluted (net loss) earnings per share for the year ended December 31, 2019, the $40.8 million of Class B shares issued and subsequently repurchased in connection with our IPO to satisfy the total preference amount for the Class T Units is treated as a dividend and subtracted from net income available to common stockholders on a proportionate basis. In addition, the net losses for the year ended December 31, 2019 were not allocated to our participating security as the Class T preferred units were not contractually obligated to share in the Company’s losses.
Basic and diluted (net loss) earnings per share and the weighted-average shares outstanding have been computed for all periods shown below to give effect to the reverse split, the Corporate Conversion, and the repurchase of Class B shares that occurred in connection with our IPO. See Note 2, Significant Accounting Policies, for further information regarding the reverse split and Corporate Conversion.
The following table presents the calculation of basic and diluted (net loss) earnings per share:
|
|
|
Year Ended |
|
|||||||||||||
|
|
|
2019 |
|
|
2018 |
|
|
2017 |
|
|||||||
|
|
|
Class A |
|
|
Class B |
|
|
Class B |
|
|
Class B |
|
||||
|
Numerator |
|
|
|
|
|
|
|
|
|
|
|
|
|
|
|
|
|
Net income |
|
$ |
4,805 |
|
|
$ |
30,862 |
|
|
$ |
30,638 |
|
|
$ |
5,000 |
|
|
Net loss attributable to non-controlling interest |
|
|
— |
|
|
|
— |
|
|
|
47 |
|
|
|
347 |
|
|
Repurchase of Class B common stock |
|
|
(5,499 |
) |
|
|
(35,317 |
) |
|
|
— |
|
|
|
— |
|
|
Undistributed earnings to participating security |
|
|
— |
|
|
|
— |
|
|
|
(10,957 |
) |
|
|
(1,853 |
) |
|
Net (loss) income attributable to common stockholders |
|
$ |
(694 |
) |
|
$ |
(4,455 |
) |
|
$ |
19,728 |
|
|
$ |
3,494 |
|
|
Denominator |
|
|
|
|
|
|
|
|
|
|
|
|
|
|
|
|
|
Weighted average shares used to compute (net loss) earnings per share — basic |
|
|
7,719 |
|
|
|
49,575 |
|
|
|
41,936 |
|
|
|
41,936 |
|
|
Effect of dilutive stock options and RSUs |
|
|
— |
|
|
|
— |
|
|
|
2,648 |
|
|
|
2,108 |
|
|
Weighted average number of shares used to compute (net loss) earnings per share — diluted |
|
|
7,719 |
|
|
|
49,575 |
|
|
|
44,584 |
|
|
|
44,044 |
|
|
(Net loss) earnings per share: |
|
|
|
|
|
|
|
|
|
|
|
|
|
|
|
|
|
Basic |
|
$ |
(0.09 |
) |
|
$ |
(0.09 |
) |
|
$ |
0.47 |
|
|
$ |
0.08 |
|
|
Diluted |
|
$ |
(0.09 |
) |
|
$ |
(0.09 |
) |
|
$ |
0.44 |
|
|
$ |
0.08 |
|
The following have been excluded from the computation of basic and diluted (net loss) earnings per share as their effect would have been anti-dilutive (in thousands):
|
|
|
Years Ended December 31, |
|
|||||||||
|
|
|
2019 |
|
|
2018 |
|
|
2017 |
|
|||
|
Stock options to purchase Class B shares and RSUs |
|
|
4,917 |
|
|
|
1,162 |
|
|
|
505 |
|
Note 10. Segment Information
We have two reportable segments, REVOLVE and FORWARD, each offering clothing, shoes, accessories, and beauty products available for sale to customers through their respective websites. Our reportable segments have been identified based on how our chief operating decision makers manage our business, make operating decisions, and evaluate operating performance. Our chief operating decision makers are our co-chief executive officers. We evaluate the performance of our reportable segments based on net sales and gross profit. Management does not evaluate the performance of our reportable segments using asset measures.
96
Revenue from external customers for each group of similar products and services is not reported to our chief operating decision makers. The separate identification for purposes of segment disclosure is impracticable, as it is not readily available and the cost to develop would be excessive. During the years ended December 31, 2019, 2018 and 2017, no customer represented over 10% of net sales.
The following table summarizes our net sales and gross profit for each of our reportable segments (in thousands):
|
|
|
Years Ended December 31, |
|
|||||||||
|
|
|
2019 |
|
|
2018 |
|
|
2017 |
|
|||
|
Net sales |
|
|
|
|
|
|
|
|
|
|
|
|
|
REVOLVE |
|
$ |
527,251 |
|
|
$ |
433,548 |
|
|
$ |
330,577 |
|
|
FORWARD |
|
|
73,742 |
|
|
|
65,191 |
|
|
|
69,020 |
|
|
Total |
|
$ |
600,993 |
|
|
$ |
498,739 |
|
|
$ |
399,597 |
|
|
Gross profit |
|
|
|
|
|
|
|
|
|
|
|
|
|
REVOLVE |
|
$ |
292,042 |
|
|
$ |
241,061 |
|
|
$ |
169,070 |
|
|
FORWARD |
|
|
29,911 |
|
|
|
24,245 |
|
|
|
24,620 |
|
|
Total |
|
$ |
321,953 |
|
|
$ |
265,306 |
|
|
$ |
193,690 |
|
All of our long-lived assets and goodwill are located in the United States as of the years ended December 31, 2019, 2018 and 2017. The following table lists net sales by geographic area (in thousands):
|
|
|
Years Ended December 31, |
|
|||||||||
|
|
|
2019 |
|
|
2018 |
|
|
2017 |
|
|||
|
United States |
|
$ |
502,882 |
|
|
$ |
409,320 |
|
|
$ |
324,622 |
|
|
Rest of the world (1) |
|
|
98,111 |
|
|
|
89,419 |
|
|
|
74,975 |
|
|
Total net sales |
|
$ |
600,993 |
|
|
$ |
498,739 |
|
|
$ |
399,597 |
|
|
(1) |
No individual country exceeded 10% of total net sales for any period presented. |
Note 11. Detail of Certain Balance Sheet Accounts
Prepaid Expenses and Other Current Assets
Prepaid expenses and other current assets consist of the following (in thousands):
|
|
|
December 31, |
|
|||||
|
|
|
2019 |
|
|
2018 |
|
||
|
Expected merchandise returns, net(1) |
|
$ |
12,989 |
|
|
$ |
— |
|
|
Advanced payments on inventory to be delivered from vendors |
|
|
4,605 |
|
|
|
6,664 |
|
|
Deferred offering costs(2) |
|
|
— |
|
|
|
2,521 |
|
|
Prepaid insurance |
|
|
1,858 |
|
|
|
1,013 |
|
|
Prepaid rent |
|
|
381 |
|
|
|
460 |
|
|
Prepaid packaging |
|
|
393 |
|
|
|
443 |
|
|
Other |
|
|
3,929 |
|
|
|
4,126 |
|
|
Total prepaid expenses and other current assets |
|
$ |
24,155 |
|
|
$ |
15,227 |
|
|
(1) |
Reflects the adoption of ASC 606. The prior period has not been restated and continues to be reported under accounting standards in effect for that period. For more information on the transitional impact of adopting ASC 606, please see the section entitled “Recent Accounting Pronouncements” in Note 2, Significant Accounting Policies. |
|
(2) |
Deferred offering costs, which consist of direct incremental legal, consulting, banking, accounting fees and other direct costs relating to the IPO were capitalized and subsequently offset against proceeds upon the consummation of the IPO, which became effective on June 6, 2019. |
97
Accrued expenses consist of the following (in thousands):
|
|
|
December 31, |
|
|||||
|
|
|
2019 |
|
|
2018 |
|
||
|
Marketing |
|
$ |
6,127 |
|
|
$ |
6,223 |
|
|
Salaries and related benefits |
|
|
4,275 |
|
|
|
6,259 |
|
|
Selling and distribution |
|
|
3,360 |
|
|
|
2,090 |
|
|
Sales taxes |
|
|
3,023 |
|
|
|
1,970 |
|
|
Other |
|
|
2,614 |
|
|
|
1,856 |
|
|
Total accrued expenses |
|
$ |
19,399 |
|
|
$ |
18,398 |
|
Other Current Liabilities
Other current liabilities consist of the following (in thousands):
|
|
|
December 31, |
|
|||||
|
|
|
2019 |
|
|
2018 |
|
||
|
Store credit(1) |
|
$ |
10,080 |
|
|
$ |
9,900 |
|
|
Gift cards(1) |
|
|
2,133 |
|
|
|
1,568 |
|
|
Other |
|
|
4,527 |
|
|
|
2,070 |
|
|
Total other current liabilities |
|
$ |
16,740 |
|
|
$ |
13,538 |
|
|
(1) |
Reflects the adoption of ASC 606. The prior period has not been restated and continues to be reported under accounting standards in effect for that period. For more information on the transitional impact of adopting ASC 606, please see the section entitled “Recent Accounting Pronouncements” in Note 2, Significant Accounting Policies. |
98
None.
99
Pursuant to the requirements of Section 13 or 15(d) of the Securities Exchange Act of 1934, the Registrant has duly caused this report to be signed on its behalf by the undersigned, thereunto duly authorized.
|
REVOLVE GROUP, INC. |
||
|
|
||
|
By: |
|
/s/ JESSE TIMMERMANS |
|
|
|
Jesse Timmermans Chief Financial Officer |
Dated: February 26, 2020
KNOW ALL PERSONS BY THESE PRESENTS, that each person whose signature appears below constitutes and appoints Michael Karanikolas, Michael Mente and Jesse Timmermans, and each of them, with full power of substitution and resubstitution and full power to act without the other, as his or her true and lawful attorney-in-fact and agent to act in his or her name, place and stead and to execute in the name and on behalf of each person, individually and in each capacity stated below, and to file, any and all documents in connection therewith, with the Securities and Exchange Commission, granting unto said attorneys-in-fact and agents, and each of them, full power and authority to do and perform each and every act and thing, ratifying and confirming all that said attorneys-in-fact and agents or any of them or their and his or her substitute or substitutes, may lawfully do or cause to be done by virtue thereof.
Pursuant to the requirements of the Securities Exchange Act of 1934, this report has been signed below by the following persons on behalf of the Registrant and in the capacities and on the date indicated.
|
Signature |
|
Title |
|
Date |
|
|
|
|
|
|
|
/s/ Michael Karanikolas |
|
Co-Chief Executive Officer and Director |
|
February 26, 2020 |
|
Michael Karanikolas |
|
(Principal Executive Officer) |
|
|
|
|
|
|
|
|
|
/s/ Michael Mente |
|
Co-Chief Executive Officer and Director |
|
February 26, 2020 |
|
Michael Mente |
|
|
|
|
|
|
|
|
|
|
|
/s/ Jesse Timmermans |
|
Chief Financial Officer |
|
February 26, 2020 |
|
Jesse Timmermans |
|
(Principal Accounting and Financial Officer) |
|
|
|
|
|
|
|
|
|
/s/ Hadley Mullin |
|
Director |
|
February 26, 2020 |
|
Hadley Mullin |
|
|
|
|
|
|
|
|
|
|
|
/s/ Jennifer Moser |
|
Director |
|
February 26, 2020 |
|
Jennifer Moser |
|
|
|
|
|
|
|
|
|
|
|
/s/ Marc Stolzman |
|
Director |
|
February 26, 2020 |
|
Marc Stolzman |
|
|
|
|
100