Attached files
| file | filename |
|---|---|
| EX-32.2 - EXHIBIT 32.2 - Rangers Sub I, LLC | felcorlpexhibit32212312019.htm |
| EX-32.1 - EXHIBIT 32.1 - Rangers Sub I, LLC | rangersexhibit32112312019.htm |
| EX-31.4 - EXHIBIT 31.4 - Rangers Sub I, LLC | felcorlpexhibit31412312019.htm |
| EX-31.3 - EXHIBIT 31.3 - Rangers Sub I, LLC | felcorlpexhibit31312312019.htm |
| EX-31.2 - EXHIBIT 31.2 - Rangers Sub I, LLC | rangersexhibit31212312019.htm |
| EX-31.1 - EXHIBIT 31.1 - Rangers Sub I, LLC | rangersexhibit31112312019.htm |
| EX-21.1 - EXHIBIT 21.1 - Rangers Sub I, LLC | rangersfelcorlpexhibit2111.htm |
UNITED STATES
SECURITIES AND EXCHANGE COMMISSION
Washington, D.C. 20549
FORM 10-K
x | ANNUAL REPORT PURSUANT TO SECTION 13 OR 15(d) OF THE SECURITIES EXCHANGE ACT OF 1934 | |
For the fiscal year ended December 31, 2019 | ||
OR | ||
o | TRANSITION REPORT PURSUANT TO SECTION 13 OR 15(d) OF THE SECURITIES EXCHANGE ACT OF 1934 | |
For the transition period from to | ||
Commission File Number 333-220497 (Rangers Sub I, LLC)
Commission File Number 333-39595-01 (FelCor Lodging Limited Partnership)
RANGERS SUB I, LLC
FELCOR LODGING LIMITED PARTNERSHIP
(Exact Name of Registrant as Specified in Its Charter)
Maryland (Rangers Sub I, LLC) | 30-1001580 | |
Delaware (FelCor Lodging Limited Partnership) | 75-2544994 | |
(State or Other Jurisdiction of Incorporation or Organization) | (I.R.S. Employer Identification No.) | |
c/o RLJ Lodging Trust | ||
3 Bethesda Metro Center, Suite 1000 | ||
Bethesda, Maryland | 20814 | |
(Address of Principal Executive Offices) | (Zip Code) | |
(301) 280-7777
(Registrant’s Telephone Number, Including Area Code)
Securities registered pursuant to Section 12(b) of the Exchange Act:
Title of Class | Trading Symbol | Name of Exchange on Which Registered | ||
Not applicable (1) | ||||
(1) Neither Rangers Sub I, LLC nor FelCor Lodging Limited Partnership has securities registered pursuant to Section 12(b) of the Act. | ||||
Indicate by check mark if the registrant is a well-known seasoned issuer, as defined in Rule 405 of the Securities Act.
Rangers Sub I, LLC (refer to the Note below) o Yes ý No
FelCor Lodging Limited Partnership (refer to the Note below) o Yes ý No
Indicate by check mark if the registrant is not required to file reports pursuant to Section 13 or 15(d) of the Act.
Rangers Sub I, LLC (refer to the Note below) ý Yes o No
FelCor Lodging Limited Partnership (refer to the Note below) ý Yes o No
Indicate by check mark whether the registrant: (1) has filed all reports required to be filed by Section 13 or 15(d) of the Securities Exchange Act of 1934 during the preceding 12 months (or for such shorter period that the registrant was required to file such reports), and (2) has been subject to such filing requirements for the past 90 days.
Rangers Sub I, LLC (refer to the Note below) o Yes ý No
FelCor Lodging Limited Partnership (refer to the Note below) o Yes ý No
Note: As voluntary filers not subject to the filing requirements of the Securities Exchange Act of 1934, the registrants have filed all reports pursuant to Section 13 or 15(d) for the preceding 12 months as if they were subject to such filing requirements.
Indicate by check mark whether the registrant has submitted electronically every Interactive Data File required to be submitted pursuant to Rule 405 of Regulation S-T (§232.405 of this chapter) during the preceding 12 months (or for such shorter period that the registrant was required to submit and post such files).
Rangers Sub I, LLC ý Yes o No
FelCor Lodging Limited Partnership ý Yes o No
Indicate by check mark whether the registrant is a large accelerated filer, an accelerated filer, a non-accelerated filer, smaller reporting company, or an emerging growth company. See the definitions of "large accelerated filer," "accelerated filer," "smaller reporting company," and "emerging growth company" in Rule 12b-2 of the Exchange Act.
Rangers Sub I, LLC:
Large accelerated filer | o | Accelerated filer | o | |||
Non-accelerated filer | ý | Smaller reporting company | o | |||
Emerging growth company | o | |||||
If an emerging growth company, indicate by check mark if the registrant has elected not to use the extended transition period for complying with any new or revised financial accounting standards provided pursuant to Section 13(a) of the Exchange Act. o | ||||||
FelCor Lodging Limited Partnership:
Large accelerated filer | o | Accelerated filer | o | |||
Non-accelerated filer | ý | Smaller reporting company | o | |||
Emerging growth company | o | |||||
If an emerging growth company, indicate by check mark if the registrant has elected not to use the extended transition period for complying with any new or revised financial accounting standards provided pursuant to Section 13(a) of the Exchange Act. o | ||||||
Indicate by check mark whether the registrant is a shell company (as defined in Rule 12b-2 of the Exchange Act).
Rangers Sub I, LLC o Yes ý No
FelCor Lodging Limited Partnership o Yes ý No
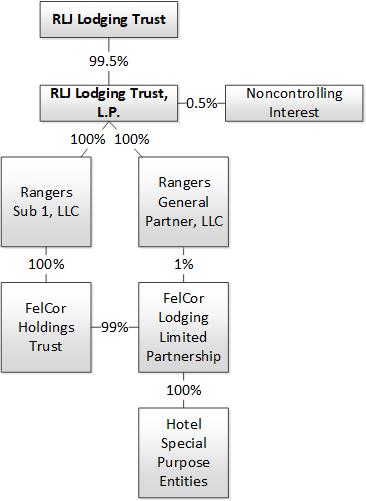
As of February 26, 2020, RLJ Lodging Trust, L.P. owns 100% of the percentage interests of Rangers Sub I, LLC. As of February 26, 2020, FelCor Holdings Trust, a wholly-owned subsidiary of RLJ Lodging Trust, L.P., owns 99% of the percentage interests of FelCor Lodging Limited Partnership, and Rangers General Partner, LLC, a wholly-owned subsidiary of RLJ Lodging Trust, L.P., owns 1% of the percentage interests of FelCor Lodging Limited Partnership.
EXPLANATORY NOTE
On August 31, 2017 (the "Acquisition Date"), RLJ Lodging Trust ("RLJ"), RLJ Lodging Trust, L.P. ("RLJ LP"), Rangers Sub I, LLC, a wholly-owned subsidiary of RLJ LP ("Rangers"), and Rangers Sub II, LP, a wholly-owned subsidiary of RLJ LP ("Partnership Merger Sub"), consummated the transactions contemplated by the Agreement and Plan of Merger (the "Merger Agreement") dated as of April 23, 2017 with FelCor Lodging Trust Incorporated ("FelCor") and FelCor Lodging Limited Partnership ("FelCor LP"), pursuant to which Partnership Merger Sub merged with and into FelCor LP, with FelCor LP surviving as a wholly-owned subsidiary of RLJ LP (the "Partnership Merger"), and, immediately thereafter, FelCor merged with and into Rangers, with Rangers surviving as a wholly owned subsidiary of RLJ LP (the "REIT Merger" and, together with the Partnership Merger, the "Mergers").
Where it is important to distinguish between the entities, we either refer specifically to Rangers, FelCor, as predecessor to Rangers, or FelCor LP. Otherwise, we use the terms "we" or "our" to refer to (i) Rangers and FelCor LP, collectively (including their consolidated subsidiaries) following the Mergers and (ii) FelCor and FelCor LP, collectively (including their consolidated subsidiaries) prior to consummation of the Mergers, unless the content indicates otherwise.
This annual report on Form 10-K for the fiscal year ended December 31, 2019 combines the filings for Rangers and FelCor LP. Rangers indirectly owns a 99% partnership interest in FelCor LP. Through FelCor LP, Rangers owns hotel properties and conducts other business.
We believe combining the periodic reports for Rangers and FelCor LP into a single combined report results in the following benefits:
• | presents the business as a whole (the same way management views and operates the business); |
• | eliminates duplicative disclosure and provides a more streamlined presentation (a substantial portion of our disclosure applies to both Rangers and FelCor LP); and |
• | saves time and cost by preparing combined reports instead of separate reports. |
Rangers consolidates FelCor LP for financial reporting purposes. Rangers has no assets other than its indirect investment in FelCor LP and no liabilities separate from FelCor LP. Therefore, the reported assets and liabilities for Rangers and FelCor LP are substantially identical.
RLJ LP owns 100% of Rangers. Rangers indirectly owns 99% of FelCor LP. A wholly-owned subsidiary of RLJ LP owns the remaining 1% of FelCor LP, which is a noncontrolling interest that is reflected within the equity section of the consolidated balance sheets and in the consolidated statements of equity. Apart from the different equity treatment, the consolidated financial statements for Rangers and FelCor LP are nearly identical, except that net income (loss) attributable to the 1% noncontrolling interest in FelCor LP is deducted from Rangers' net income (loss) in order to arrive at net income (loss) attributable to Rangers.
We present the sections in this report combined unless separate disclosure is required for clarity.
RLJ accounted for the Mergers noted above under the acquisition method of accounting in ASC 805, Business Combinations. In accordance with the guidance, RLJ elected to apply pushdown accounting to our consolidated financial statements in order to reflect the new basis of accounting established by RLJ for the individual assets acquired and the liabilities assumed in the Mergers. Accordingly, our consolidated financial statements for the periods before and after the Acquisition Date reflect different bases of accounting, and the financial positions and the results of operations for those periods are not comparable. As a result, the consolidated financial statements and the notes to those financial statements are separated into two distinct periods; the periods prior to the Acquisition Date are identified as "Predecessor," and the periods after the Acquisition Date are identified as "Successor." The new basis of accounting for the assets and liabilities that existed on the Acquisition Date will be used in the preparation of our future financial statements and footnotes.
1
TABLE OF CONTENTS
Item No. | Form 10-K Report Page | |
PART I | ||
PART II | ||
PART III | ||
PART IV | ||
2
SPECIAL NOTE ABOUT FORWARD-LOOKING STATEMENTS
Certain statements in this Annual Report on Form 10-K, other than purely historical information, including estimates, projections, statements relating to our business plans, objectives and expected operating results, and the assumptions upon which those statements are based, are "forward-looking statements" within the meaning of the Private Securities Litigation Reform Act of 1995, Section 27A of the Securities Act of 1933, as amended, and Section 21E of the Securities Exchange Act of 1934, as amended. These forward-looking statements generally are identified by the use of the words "believe," "project," "expect," "anticipate," "estimate," "plan," "may," "will," "will continue," "intend," "should," "may" or similar expressions. Although we believe that the expectations reflected in such forward-looking statements are based upon reasonable assumptions, beliefs and expectations, such forward-looking statements are not predictions of future events or guarantees of future performance and our actual results could differ materially from those set forth in the forward-looking statements. Some factors that might cause such a difference include the following: the current global economic uncertainty, increased direct competition, changes in government regulations or accounting rules, changes in local, national and global real estate conditions, declines in the lodging industry, seasonality of the lodging industry, risks related to natural disasters, such as earthquakes and hurricanes, hostilities, including future terrorist attacks or fear of hostilities that affect travel, our ability to obtain lines of credit or permanent financing on satisfactory terms, changes in interest rates, and inaccuracies of our accounting estimates. A discussion of these and other risks and uncertainties that could cause actual results and events to differ materially from such forward-looking statements is included in "Risk Factors" and "Management's Discussion and Analysis of Financial Condition and Results of Operations" within this Annual Report on Form 10-K. Given these uncertainties, undue reliance should not be placed on such statements. Except as required by law, we undertake no obligation to update or revise publicly any forward-looking statements, whether as a result of new information, future events or otherwise. Except where the context suggests otherwise, we define certain terms in this Annual Report on Form 10-K as follows:
• | "our company," "we," "us" and "our" refer to Rangers and FelCor LP, collectively (including their consolidated subsidiaries) following the Mergers and to FelCor and FelCor LP, collectively (including their consolidated subsidiaries) prior to consummation of the Mergers, unless the content indicates otherwise; |
• | "our hotel properties" refers to the 28 hotels owned by us as of December 31, 2019; |
• | a "compact full-service hotel" typically refers to any hotel with (1) less than 300 guestrooms and less than 12,000 square feet of meeting space or (2) more than 300 guestrooms where, unlike traditional full-service hotels, the operations focus primarily on the rental of guestrooms such that a significant majority of its total revenue is generated from room rentals rather than other sources, such as food and beverage; |
• | "Average Daily Rate" ("ADR") represents the total hotel room revenues divided by the total number of rooms sold in a given period; |
• | "Occupancy" represents the total number of hotel rooms sold in a given period divided by the total number of rooms available; and |
• | "Revenue Per Available Room" ("RevPAR") is the product of ADR and Occupancy. |
For a more in depth discussion of ADR, Occupancy and RevPAR, please refer to the "Key Indicators of Operating Performance" section.
3
PART I
Item 1. Business
Our Company
Rangers is a Maryland limited liability company that, through FelCor LP, owns hotel properties and conducts other business. Substantially all of Rangers' assets and liabilities are held by, and all of its operations are conducted through, FelCor LP. 100% of the ownership interests of Rangers are held by RLJ LP, which is the operating partnership of RLJ, one of the largest U.S. publicly traded lodging real estate investment trusts ("REIT") in terms of both number of hotels and number of rooms. Rangers indirectly owns a 99% partnership interest in FelCor LP. Rangers General Partner, LLC ("Rangers GP"), a wholly-owned subsidiary of RLJ LP, owns the remaining 1% partnership interest and is the sole general partner of FelCor LP.
Our hotels are concentrated in markets that we believe exhibit multiple demand generators and attractive long-term growth prospects. We believe premium-branded, compact full-service hotels with these characteristics generate high levels of RevPAR, strong operating margins and attractive returns.
As of December 31, 2019, we owned 28 hotel properties with approximately 8,100 rooms, located in 13 states. We owned, through wholly-owned subsidiaries, a 100% interest in 25 of our hotel properties, a 95% controlling interest in The Knickerbocker, and 50% interests in entities owning two hotel properties. We consolidate our real estate interests in the 26 hotel properties in which we hold a controlling financial interest, and we record the real estate interests in the two hotel properties in which we hold an indirect 50% interest using the equity method of accounting. We lease 27 of the 28 hotel properties to subsidiaries of RLJ LP.
Merger with RLJ
On August 31, 2017, RLJ, RLJ LP, Rangers, Partnership Merger Sub, FelCor and FelCor LP consummated the transactions contemplated by the Merger Agreement, whereby Partnership Merger Sub merged with and into FelCor LP, with FelCor LP surviving as a wholly-owned subsidiary of RLJ LP, and immediately thereafter, FelCor merged with and into Rangers, with Rangers surviving as a wholly-owned subsidiary of RLJ LP.
Upon completion of the REIT Merger and under the terms of the Merger Agreement, each issued and outstanding share of FelCor common stock (other than shares held by any wholly-owned subsidiary of FelCor) was converted into the right to receive 0.362 (the “Common Exchange Ratio”) of RLJ's common shares, and each issued and outstanding share of FelCor $1.95 Series A cumulative convertible preferred stock was converted into the right to receive one of RLJ's $1.95 Series A cumulative convertible preferred shares.
Upon completion of the Partnership Merger and under the terms of the Merger Agreement, each limited partner of FelCor LP was entitled to elect to exchange its outstanding common limited partnership units in FelCor LP (the "FelCor LP Common Units") for a number of RLJ's newly issued common shares based on the Common Exchange Ratio. Upon completion of the Partnership Merger, each outstanding FelCor LP Common Unit of any holder who did not make the foregoing election was converted into the right to receive a number of units of limited partnership interest in RLJ LP ("OP units") based on the Common Exchange Ratio. No fractional shares or units of RLJ's common shares or RLJ LP's OP units were issued in the Mergers, and the value of any fractional interests was paid in cash.
At the closing of the Mergers, FelCor LP had controlling financial interests in various hotel property-owning subsidiaries (the "FelCor Lessors"), and FelCor TRS Holdings, LLC ("FelCor TRS") and its property-operating subsidiaries (the "FelCor Lessees"). The hotel properties were leased through intercompany lease agreements between the FelCor Lessors and the FelCor Lessees, resulting in the FelCor Lessees' payments being eliminated in consolidation. Immediately after the consummation of the Mergers and RLJ's push down of the allocation of the purchase price consideration, FelCor LP distributed the equity interests in FelCor TRS to RLJ LP. As a result of the distribution of the equity interests in FelCor TRS, the FelCor Lessees' payments pursuant to the leases are no longer eliminated in consolidation of our consolidated financial statements.
Additional information on the Mergers can be found in Note 2 to our accompanying consolidated financial statements.
The Lodging Industry
The lodging industry in the United States consists of public and private entities that operate in an extremely diversified market under a variety of brand names. The key participants in the lodging industry are as follows:
4
• | Owners — own the hotel property and typically enter into a management agreement with an independent third party to manage the hotel property. The hotel properties may be branded and operated under the manager’s brand or branded under a separate franchise agreement. |
• | Franchisors — own a brand or brands and provide the franchised hotels with brand recognition, marketing support and worldwide reservation systems. |
• | Managers — responsible for the day-to-day operation of the hotel property, including the employment of the hotel staff, the determination of room rates, the development of sales and marketing plans, the preparation of operating and capital expenditure budgets and the preparation of financial reports for the owner. |
Our Investment and Business Strategies
Both Rangers and FelCor LP are wholly-owned subsidiaries of RLJ LP, therefore, Rangers and FelCor LP carry out RLJ's investment and business strategies, which are noted below.
RLJ's objective is to generate strong returns for its shareholders by acquiring and owning primarily premium-branded, focused-service and compact full-service hotels at prices where it believes it can generate attractive returns on investment and long-term value appreciation through proactive asset management. RLJ also intends to selectively dispose of hotel properties when it believes the returns have been maximized or the hotel properties no longer meet its strategy in order to have investment capacity for other opportunities, which may include acquisitions. RLJ intends to pursue this objective through the following investment and business strategies:
Investment Strategies
• | Targeted ownership of premium-branded, focused-service and compact full-service hotels. RLJ believes that premium-branded, focused-service and compact full-service hotels have the potential to generate attractive returns relative to other types of hotels due to their ability to achieve RevPAR levels at or close to those generated by traditional full-service hotels, while achieving higher profit margins due to their more efficient operating model and less volatile cash flows. |
• | Use of premium hotel brands. RLJ believes in affiliating its hotels with premium brands owned by leading international franchisors such as Hilton, Wyndham and Marriott. RLJ believes that utilizing premium brands provides significant advantages because of their guest loyalty programs, worldwide reservation systems, effective product segmentation, global distribution and strong customer awareness. |
• | Focus on high-growth markets. RLJ focuses on owning and acquiring hotel properties in markets that it believes exhibit multiple demand generators and attractive long-term growth prospects. As a result, RLJ believes that these hotel properties generate higher returns on investment. |
Business Strategies
• | Maximize returns from our hotel properties. RLJ believes that its hotel properties have the potential to generate improvements in RevPAR and earnings before interest, taxes, depreciation and amortization ("EBITDA") as a result of its proactive asset management and the anticipated long-term growth in the United States economy. RLJ actively monitors and advises its third-party management companies on most aspects of its hotels' operations, including property positioning, physical design, capital planning and investment, guest experience and overall strategic direction. RLJ regularly reviews opportunities to further invest in its hotel properties in an effort to enhance quality and attractiveness, increase long-term value and generate attractive returns on investment. |
• | Pursue a disciplined hotel acquisition strategy. RLJ seeks to acquire additional hotel properties at prices below replacement cost where it believes it can generate attractive returns on investment. RLJ intends to target acquisition opportunities where it can enhance value by pursuing proactive investment strategies such as renovation, repositioning or rebranding. |
• | Pursue a disciplined capital recycling program. RLJ intends to continue to pursue a disciplined capital allocation strategy designed to maximize the return on its investments by selectively selling hotel properties that are no longer consistent with its investment strategy or whose returns appear to have been maximized. To the extent that RLJ sells its hotel properties, RLJ intends to redeploy the capital into other investment opportunities, including without limitation, acquisitions, brand conversions, green initiatives and space configuration opportunities. |
5
• | Continue to improve its balance sheet. RLJ intends to continue to maintain a flexible capital structure that allows it to execute its strategy. RLJ believes that a strong balance sheet is a key competitive advantage that affords it a lower cost of capital and positions it for growth. RLJ structures its debt profile to maintain financial flexibility and a balanced maturity schedule with access to different forms of financing. |
• | Execute its share repurchase program. RLJ intends to create value over the long-term for its shareholders by deploying investment capacity into share repurchases during periods of share price dislocation. |
Our Hotels
Our hotel properties operate under strong, premium brands, with approximately 93% of our hotel properties operating under existing relationships with Hilton, Wyndham or Marriott. The following table sets forth the brand affiliations of our hotel properties as of December 31, 2019:
Brand Affiliations | Number of hotels | Percentage of total hotels | Number of rooms | Percentage of total rooms | ||||||||
Hilton | ||||||||||||
Embassy Suites | 15 | 53.6 | % | 4,293 | 52.7 | % | ||||||
DoubleTree | 2 | 7.1 | % | 417 | 5.1 | % | ||||||
Subtotal | 17 | 60.7 | % | 4,710 | 57.8 | % | ||||||
Marriott | ||||||||||||
Marriott | 1 | 3.6 | % | 401 | 4.9 | % | ||||||
Subtotal | 1 | 3.6 | % | 401 | 4.9 | % | ||||||
Wyndham | ||||||||||||
Wyndham | 8 | 28.6 | % | 2,528 | 31.1 | % | ||||||
Subtotal | 8 | 28.6 | % | 2,528 | 31.1 | % | ||||||
Other Brand Affiliation | 2 | 7.1 | % | 501 | 6.2 | % | ||||||
Total | 28 | 100.0 | % | 8,140 | 100.0 | % | ||||||
Asset Management
RLJ has a dedicated team of asset management professionals that proactively work with the third-party management companies to maximize profitability at each of our hotels. The asset management team monitors the performance of our hotels on a daily basis and holds frequent ownership meetings with corporate operations executives and key personnel at the hotels. The asset management team works closely with the third-party management companies on key aspects of each hotel's operation, including, among others, revenue management, market positioning, cost structure, capital and operational budgeting, as well as the identification and evaluation of return on investment initiatives and overall business strategy. In addition, RLJ retains approval rights on key staffing positions at many of our hotels, such as the hotel's general manager and director of sales. We believe that the strong asset management process helps to ensure that each hotel is being operated to our and the franchisors' standards, that our hotel properties are being adequately maintained in order to preserve the value of the asset and to ensure the safety of our customers, and that the management companies are maximizing revenues, profits and operating margins.
Competition
The U.S. lodging industry is highly competitive. Our hotel properties compete with other participants in the lodging industry for guests in each of their markets on the basis of several factors, including, among others, location, quality of accommodations, convenience, brand affiliation, room rates, service levels, amenities and the availability of lodging and event space. Competition is often specific to the individual markets in which our hotel properties are located and includes competition from existing and new hotels in the compact full-service hotel segment and non-traditional accommodations for travelers, such as online room sharing services. We believe that hotels, such as our hotels, that are affiliated with leading national brands, such as the Hilton, Wyndham and Marriott brands, will enjoy competitive advantages associated with operating under such brands.
Seasonality
6
The lodging industry is seasonal in nature, which can cause quarterly fluctuations in our revenues. For example, our hotels in Pennsylvania experience lower revenues and profits during the winter months of December through March, while our hotels in Florida generally have higher revenues in the months of January through April. This seasonality can be expected to cause periodic fluctuations in a hotel's room revenues, occupancy levels, room rates, operating expenses and cash flows.
Our Financing Strategy
We carry out RLJ's financing strategy, which is to continue to maintain a prudent capital structure by limiting its net debt-to-EBITDA ratio to 4.0x or below. RLJ defines net debt as total indebtedness minus cash and cash equivalents. Over time, RLJ intends to finance its long-term growth with equity issuances and debt financing with staggered maturities. RLJ's strategy with respect to its debt profile is to primarily have unsecured debt and a greater percentage of fixed rate and hedged floating rate debt as compared to unhedged floating rate debt. Our debt is currently comprised of unsecured senior notes and mortgage loans secured by our hotel properties. We have a mix of fixed and floating rate debt; however, the majority of our debt bears interest at fixed rates.
Organizational Structure
RLJ is a Maryland real estate investment trust that conducts its business through a traditional umbrella partnership real estate investment trust ("UPREIT") in which its hotel properties are indirectly owned by RLJ LP, through limited partnerships, limited liability companies or other subsidiaries. RLJ is the sole general partner of RLJ LP and, as of December 31, 2019, RLJ owned 99.5% of the OP units in RLJ LP.
Rangers was formed as a Maryland corporation in April 2017 and FelCor LP was formed as a Delaware limited partnership in May 1994. RLJ LP owns 100% of Rangers. Rangers indirectly owns a 99% partnership interest in FelCor LP. A wholly-owned subsidiary of RLJ LP owns the remaining 1% of FelCor LP. Through FelCor LP, Rangers owns hotel properties and conducts other business.
7
The following chart generally depicts our corporate structure as of December 31, 2019:
Regulation
General
Our hotel properties are subject to various U.S. federal, state and local laws, ordinances and regulations, including regulations relating to common areas and fire and life safety requirements. We believe that each of our hotel properties has the necessary permits and approvals to operate its business.
Americans with Disabilities Act
Our hotel properties must comply with the applicable provisions of the Americans with Disabilities Act of 1990 and the Accessibility Guidelines promulgated thereunder (the "ADA"), to the extent that such hotels are "public accommodations" as defined by the ADA. The ADA may require the removal of structural barriers to access by persons with disabilities in certain public areas of our hotels where such removal is readily achievable. We believe that our hotel properties are in substantial compliance with the ADA and that we will not be required to make substantial capital expenditures to address the requirements of the ADA. However, non-compliance with the ADA could result in imposition of fines or an award of damages to private litigants. The obligation to make readily achievable accommodations is an ongoing one, and we will continue to assess our hotels and to make alterations as appropriate in this respect.
8
Environmental Matters
Under various federal, state and local laws, ordinances and regulations relating to the protection of the environment, a current or previous owner or operator (including tenants) of real estate may be subject to liability related to contamination resulting from the presence or discharge of hazardous or toxic substances at that property and may be required to investigate and clean up such contamination at that property or emanating from that property. These costs could be substantial and liability under these laws may attach without regard to whether the owner or operator knew of, or was responsible for, the presence of the contaminants, and the liability may be joint and several. The presence of contamination or the failure to remediate contamination at our hotels may expose us to third-party liability for cleanup costs, property damage or bodily injury, natural resource damages and costs or expenses related to liens or property use restrictions and materially and adversely affect our ability to sell, lease or develop the real estate or to incur debt using the real estate as collateral.
Our hotel properties are subject to various federal, state, and local environmental, health and safety laws and regulations. Our hotel properties incur costs to comply with these laws and regulations and could be subject to fines and penalties for non-compliance. The costs of complying with environmental, health and safety laws could increase as new laws are enacted and existing laws are modified.
Some of our hotel properties contain asbestos-containing building materials. We believe that the asbestos is appropriately contained in accordance with current environmental regulations and that we have no need for any immediate remediation or current plans to remove the asbestos.
We believe that our hotel properties are in compliance, in all material respects, with all federal, state and local environmental ordinances and regulations regarding hazardous or toxic substances and other environmental matters, the violation of which could have a material adverse effect on us. Although we have not received written notice from any governmental authority of any material noncompliance, liability or claim relating to hazardous or toxic substances or other environmental matters in connection with any of our present properties, we can offer no assurance that a material environmental claim will not be asserted against us in the future.
Insurance
RLJ carries comprehensive general liability, fire, extended coverage, business interruption, rental loss coverage and umbrella liability coverage on all of our hotels, and earthquake, wind, flood and hurricane coverage on hotels in areas where RLJ believes such coverage is warranted, in each case with limits of liability that RLJ deems adequate. Similarly, RLJ is insured against the risk of direct physical damage in amounts it believes to be adequate to reimburse itself, on a replacement cost basis, for the costs incurred to repair or rebuild each hotel, including loss of income during the reconstruction period. RLJ has selected policy specifications and insured limits which it believes to be appropriate given the relative risk of loss, the cost of the coverage and industry practice. RLJ does not carry insurance for generally uninsurable risks, including, but not limited to losses caused by riots, war or acts of God. In the opinion of RLJ's management, our hotels are adequately insured.
Employees
As of December 31, 2019, RLJ LP had 87 employees. Rangers and FelCor LP do not have any employees.
Corporate Information
Our principal executive offices are located at 3 Bethesda Metro Center, Suite 1000, Bethesda, Maryland 20814, which is RLJ's corporate headquarters. Our telephone number is (301) 280-7777. We do not have our own website, but RLJ's website is located at www.rljlodgingtrust.com. The information that is found on or accessible through RLJ's website is not incorporated into, and does not form a part of, this Annual Report on Form 10-K or any other report or document that we file with or furnish to the Securities and Exchange Commission (the "SEC"). We have included RLJ's website address in this Annual Report on Form 10-K as an inactive textual reference and do not intend it to be an active link to RLJ's website.
RLJ does not make available on its website our Annual Report on Form 10-K, Quarterly Reports on Form 10-Q, Current Reports on Form 8-K and amendments to those reports filed or furnished pursuant to Section 13(a) or 15(d) of the Exchange Act. However, upon filing those reports with, or furnishing them to, the SEC, those reports can be viewed on the SEC's website. On RLJ's website, specifically the Corporate Governance page under the Investor Relations section, there are various documents related to RLJ's corporate governance including its: Board Committee Charters; Corporate Governance Guidelines; Code of Business Conduct and Ethics; Complaint Procedures for Financial and Auditing Matters; Declaration of Trust; and Bylaws.
9
This Annual Report on Form 10-K and other reports filed with the SEC are available on the SEC's website, which contains reports, proxy and information statements, and other information regarding issuers that file electronically with the SEC. The SEC's website address is www.sec.gov.
Item 1A. Risk Factors
Set forth below are the risks that we believe are material to our stakeholders. You should carefully consider the following risks in evaluating our Company and our business. The occurrence of any of the following risks could materially and adversely impact our financial condition, results of operations, cash flows, and our ability to, among other things, satisfy our debt service obligations. Some statements in this report including statements in the following risk factors constitute forward-looking statements. Please refer to the section entitled "Special Note About Forward-Looking Statements" at the beginning of our Annual Report on Form 10-K.
Risks Related to Our Business and Hotel Properties
We will continue to be significantly influenced by the economies and other conditions in the specific markets in which we operate, particularly in the metropolitan areas where we have high concentrations of hotels.
Our hotels are located in metropolitan and resort areas which may be susceptible to adverse market conditions, including industry downturns, relocation of businesses, any oversupply of hotel rooms, political unrest or a reduction in lodging demand. Adverse economic developments in the markets in which we have a concentration of hotels, or in any of the other markets in which we operate, or any increase in hotel supply or decrease in lodging demand resulting from the local, regional or national business or political climate, could materially and adversely affect us.
We are dependent on the performance of the third-party management companies that manage the operations of each of our hotels and we could be materially and adversely affected if such third-party hotel managers do not manage our hotels in our best interests.
Our hotel properties are operated by third-party hotel managers pursuant to management agreements. There are individual management agreements for all of our hotel properties.
Under the terms of the management agreements, the hotel managers are responsible for all aspects of the operations of our hotels, including ensuring those operations are conducted in accordance with applicable laws and regulations and in our best interests, and our ability to participate in operating decisions regarding our hotels is limited to certain matters, including approval of the annual operating budget. While we closely monitor the performance and operations of the third-party hotel managers, we cannot assure you that the hotel managers will manage our hotels in a manner that is consistent with their respective obligations under the applicable management agreement or the obligations under the franchise agreements our hotel properties are subject to.
The success of our hotel properties depends largely on RLJ's ability to establish and maintain good relationships with the hotel managers. From time to time, disputes may arise between RLJ and the third-party managers regarding their performance or compliance with the terms of the management agreements, which in turn could adversely affect our results of operations. If RLJ is unable to reach satisfactory results through discussions and negotiations, it may choose to terminate the management agreement, litigate the dispute or submit the matter to third-party dispute resolution, the outcome of which may be unfavorable to us.
In the event that any of the management agreements our hotel properties are subject to are terminated, we can provide no assurances that a replacement manager can be found or that the franchisors will consent to a replacement manager in a timely manner, or at all, or that any replacement manager will be successful in operating our hotels.
We are subject to the risks associated with the employment of hotel personnel, particularly with hotels that employ unionized labor.
10
The third-party management companies that manage our hotel properties are responsible for hiring and maintaining the labor force at each of our hotels. Although we do not directly employ or manage the employees at our hotels, we still are subject to many of the costs and risks generally associated with the hotel labor force, particularly those hotels with unionized labor. From time to time, the hotel operations may be disrupted as a result of strikes, lockouts, public demonstrations or other negative actions and publicity. The resolution of labor disputes or re-negotiated labor contracts could lead to higher labor costs, either by increases in wages or benefits or by changes in work rules that raise hotel operating costs. We do not have the ability to affect the outcome of these negotiations.
Restrictive covenants in certain of the management and franchise agreements our hotel properties are subject to contain provisions limiting or restricting the sale or financing of our hotels, which could have a material and adverse effect on us.
The management and franchise agreements typically contain restrictive covenants that limit or restrict our ability to sell or refinance a hotel without the consent of the management company or franchisor. Many of the franchise agreements our hotel properties are subject to provide the franchisor with a right of first offer in the event of certain sales or transfers of a hotel and provide that the franchisor has the right to approve any change in the management company engaged to manage the hotel. Generally, we may not agree to sell, lease or otherwise transfer particular hotels unless the transferee is not a competitor of the management company or franchisor and the transferee assumes the related management and franchise agreements. If the management company or franchisor does not consent to the sale or financing of our hotels, we may be prohibited from taking actions that would otherwise be in our best interests.
Substantially all of our hotel properties operate under either Hilton, Wyndham or Marriott brands; therefore, we are subject to the risks associated with concentrating our portfolio in just three brand families.
26 of the 28 hotel properties that we owned as of December 31, 2019 utilize brands owned by Hilton, Wyndham or Marriott. As a result, our success is dependent in part on the continued success of Hilton, Wyndham or Marriott and their respective brands. We believe that building brand value is critical to increasing demand and building customer loyalty. Consequently, if market recognition or the positive perception of Hilton and/or Wyndham and/or Marriott is reduced or compromised, the goodwill associated with the Hilton-, Wyndham- or Marriott-branded hotels in our portfolio may be adversely affected. Furthermore, if our relationship with Hilton, Wyndham or Marriott were to deteriorate or terminate as a result of disputes regarding the management of our hotels or for other reasons, Hilton and/or Wyndham and/or Marriott could, under certain circumstances, terminate the current franchise licenses that our hotel properties are subject to or decline to provide franchise licenses for our hotel properties in the future. If any of the foregoing were to occur, it could have a material adverse effect on us.
Any difficulties in obtaining the capital necessary to make required periodic capital expenditures and to renovate our hotel properties could materially and adversely affect our financial condition and results of operations.
Our hotel properties have an ongoing need for renovations and other capital improvements, including the replacement of furniture, fixtures and equipment ("FF&E"). Our lenders will also likely require that we set aside annual amounts for capital improvements to our hotel properties. The costs of these capital improvements could materially and adversely affect us. If we are unable to obtain the capital necessary to make the required periodic capital expenditures and to renovate our hotel properties on favorable terms, or at all, our financial condition, liquidity and results of operations could be materially and adversely affected.
Adverse global market and economic conditions and dislocations in the markets could materially and adversely affect the value of our hotel properties and our business, financial condition and results of operations.
We can provide no assurance that adverse changes in the global or domestic economy will not have an adverse effect on
the hotel revenue or earnings at our hotel properties. A reduction in our revenue or earnings as a result of an adverse change in
the economy may reduce our working capital and revenue, impact our long-term business strategy and impact the value of our
assets. In addition, we may incur impairment charges in the future, which charges will affect negatively our results of
operations. We can provide no assurance that an impairment loss recognized will not be material to our results of operations.
Competition from other lodging industry participants in the markets in which we operate could adversely affect occupancy levels and/or ADRs, which could have a material and adverse effect on us.
11
We face significant competition from owners and operators of other hotels and other lodging industry participants. In addition, we face competition from non-traditional accommodations for travelers, such as online room sharing services. We compete based on a number of factors, including location, quality of accommodations, convenience, brand affiliation, room rates, service levels, amenities, customer service, and the availability of lodging and event space. Our competitors may have an operating model that enables them to offer accommodations at lower rates than we can, which could result in our competitors increasing their occupancy at our expense and adversely affecting our ADRs. Given the importance of occupancy and ADR at compact full-service hotels, this competition could adversely affect our ability to attract prospective guests, which could materially and adversely affect our business, financial condition and results of operations.
At December 31, 2019, we had approximately $798.7 million of debt outstanding, which could materially and adversely affect our operating performance and put us at a competitive disadvantage.
Required repayments of debt and related interest may materially and adversely affect our operating performance. At December 31, 2019, we had approximately $798.7 million of outstanding debt, of which approximately $181.0 million bears interest at variable rates. Increases in interest rates on our existing or future variable rate debt would increase our interest expense, which could adversely affect our cash flows.
Because we anticipate that our operating cash will be adequate to repay only a portion of our debt at maturity, we expect that we will be required to repay debt through debt refinancings and/or offerings of our securities. The amount of our outstanding debt may adversely affect our ability to refinance our debt.
If we are unable to refinance our debt on acceptable terms, or at all, we may be forced to dispose of one or more of our hotels on disadvantageous terms, which may result in losses to us. In addition, if the prevailing interest rates or other factors at the time of refinancing result in higher interest rates upon refinancing, our interest expense would increase, which would adversely affect our future operating results and liquidity.
Our outstanding debt, and any additional debt borrowed in the future, may subject us to many risks, including the risk that:
• | our cash flows from operations may be insufficient to make required payments of principal and interest; |
• | we may be at a competitive disadvantage compared to our competitors that have less debt; |
• | we may be vulnerable to economic volatility, particularly if growth were to slow or stall and reduce our flexibility to respond to difficult market, industry, or economic conditions; |
• | the terms of any refinancing may not be in the same amount or on terms as favorable as the terms of the debt being refinanced; and |
• | the use of leverage could adversely affect our ability to borrow more money for operations and capital improvements. |
Disruptions in the financial markets could adversely affect our ability to obtain sufficient third-party financing for our capital needs on favorable terms, or at all, which could materially and adversely affect us.
In recent years, the U.S. financial markets experienced significant price volatility, dislocations and liquidity disruptions, which caused stock market prices to fluctuate substantially and the spreads on prospective debt financings to widen considerably. Renewed volatility and uncertainty in the financial markets may negatively impact our ability to access additional financing for our capital needs, including growth, acquisition activities and other business initiatives, on favorable terms or at all, which may negatively affect our business. Additionally, due to this potential uncertainty, in the future we may be unable to refinance or extend our debt, or the terms of any refinancing may not be as favorable as the terms of our existing debt. If we are not successful in refinancing our debt when it becomes due, we may be forced to dispose of hotels on disadvantageous terms, which may adversely affect our ability to service other debt and to meet our other liquidity and business obligations. A prolonged downturn in the financial markets may cause us to seek alternative capital sources of potentially less attractive financing and may require us to further adjust our business plan accordingly. These events also may make it more difficult or costly for us to raise capital through the issuance of new equity or the incurrence of additional secured or unsecured debt, which could materially and adversely affect us.
Replacement of the LIBOR benchmark interest rate could materially and adversely affect our business, financial condition, results of operations and cash flows.
12
In 2017, the United Kingdom’s Financial Conduct Authority (“FCA”), which regulates the London Interbank Offered Rate (“LIBOR”), announced that the FCA intends to stop persuading or compelling banks to submit the rates required to calculate LIBOR after 2021. This announcement indicates that the continuation of LIBOR on the current basis cannot and will not be guaranteed after 2021. Consequently, at this time, it is not possible to predict whether and to what extent banks will continue to provide submissions for the calculation of LIBOR. Similarly, it is not possible to predict whether LIBOR will continue to be viewed as an acceptable market benchmark or what rate or rates may become acceptable alternatives to LIBOR. The transition from LIBOR could create considerable costs and additional risk, which could materially and adversely impact our financial condition or results of operations.
Our existing indebtedness contains covenants and our failure to comply with all covenants in our debt agreements could materially and adversely affect us.
Our existing indebtedness contains customary and financial covenants that may limit our ability to enter into future indebtedness. Our failure to comply with covenants in our existing or future indebtedness, as well as our inability to make required principal and interest payments, could cause a default under the applicable debt agreement, which could result in the acceleration of the debt and require us to repay such debt with capital obtained from other sources, which may not be available to us or may be available only on unattractive terms. Furthermore, if we default on secured debt, lenders can take possession of the hotel(s) securing such debt. In addition, debt agreements may contain specific cross-default provisions with respect to specified other indebtedness, giving the lenders the right to declare a default on its debt and to enforce remedies, including accelerating the maturity of such debt upon the occurrence of a default under such other indebtedness. If we default on our debt agreements, we could be materially and adversely affected.
Joint venture investments that we make could be adversely affected by our lack of sole decision-making authority, our reliance on joint venture partners' financial condition and liquidity and disputes between us and our joint venture partners.
We own certain hotel properties and other real estate investments through joint ventures. In the future, we may enter into additional joint ventures to acquire, develop, improve or partially dispose of hotel properties, thereby reducing the amount of capital required by us to make investments and diversifying our capital sources for growth. Such joint venture investments involve risks not otherwise present in a wholly-owned hotel property or a redevelopment project, including the following:
• | we may not have exclusive control over the development, financing, leasing, management and other aspects of the hotel property or the joint venture, which may prevent us from taking actions that are in our best interest but opposed by our partners; |
• | joint venture agreements often restrict the transfer of a partner's interest or may otherwise restrict our ability to sell the interest when we desire, or on advantageous terms; |
• | joint venture agreements may contain buy-sell provisions pursuant to which one partner may initiate procedures requiring the other partner to choose between buying the other partner's interest or selling its interest to that partner; |
• | a partner may, at any time, have economic or business interests or goals that are, or that may become, inconsistent with our business interests or goals; |
• | a partner may fail to fund its share of required capital contributions or may become bankrupt, which would mean that we and any other remaining partners generally would remain liable for the joint venture's liabilities; or |
• | we may, in certain circumstances, be liable for the actions of a partner, and the activities of a partner could adversely affect RLJ's ability to qualify as a REIT, even though we do not control the joint venture. |
Any of the above might subject a hotel property to liabilities in excess of those contemplated and adversely affect the value of our current and future joint venture investments.
13
Risks Related to the Lodging Industry
The seasonality of the lodging industry could have a material and adverse effect on us.
The lodging industry is seasonal in nature, which causes quarterly fluctuations in our revenues. Our quarterly earnings may be adversely affected by factors outside our control, including weather conditions and poor economic factors in certain markets in which we operate. The seasonality causes periodic fluctuations in room revenues, occupancy levels, room rates and operating expenses in particular hotels. We can provide no assurances that our cash flows will be sufficient to offset any shortfalls that occur as a result of these fluctuations. Consequently, volatility in our financial performance resulting from the seasonality of the lodging industry could have a material and adverse effect on us.
The cyclical nature of the lodging industry may cause fluctuations in our operating performance, which could have a material and adverse effect on us.
The lodging industry historically has been highly cyclical in nature. Fluctuations in lodging demand and, therefore, operating performance, are caused largely by general economic and local market conditions, which subsequently affect levels of business and leisure travel. In addition to general economic conditions, new hotel room supply is an important factor that can affect the lodging industry's performance, and overbuilding has the potential to further exacerbate the negative impact of an economic recession. Room rates and occupancy, and thus RevPAR, tend to increase when demand growth exceeds supply growth. We can provide no assurances regarding whether, or the extent to which, lodging demand will rebound or whether any such rebound will be sustained. An adverse change in lodging fundamentals could result in returns that are substantially below our expectations or result in losses, which could have a material and adverse effect on us.
Our ownership of hotel properties with ground leases exposes us to the risks that we may be forced to sell such hotel properties for a lower price, we may have difficulties financing such hotel properties, we may be unable to renew a ground lease or we may lose such hotel properties upon breach of a ground lease.
As of December 31, 2019, six of our consolidated hotel properties and two of our unconsolidated hotel properties were on land subject to ground leases. Accordingly, we only own a long-term leasehold or similar interest in those eight hotel properties. Two of the ground leases expire in 2028 and 2029. Our ground lease agreements require the consent of the lessor or sub-lessor prior to transferring our interest in the ground lease. These provisions may impact our ability to sell our hotel properties which, in turn, could adversely impact the price realized from any such sale. In addition, at any given time, investors may be disinterested in buying hotel properties subject to a ground lease and may pay a lower price for such hotel properties than for a comparable hotel property with a fee simple interest or they may not purchase such hotel properties at any price. Secured lenders may be unwilling to lend, or otherwise charge higher interest rates, for loans secured by a leasehold mortgage as compared to loans secured by a fee simple mortgage. If we are found to be in breach of a ground lease, we could lose the right to use the hotel property. In addition, unless we can purchase a fee simple interest in the underlying land and improvements or extend the terms of these leases before their expiration, as to which no assurance can be given, we will lose our right to own these hotel properties and our interest in the improvements upon expiration of the leases. If we were to lose the right to use a hotel property due to a breach or non-renewal of the ground lease, we would be unable to derive income from such hotel property and we would be required to purchase an interest in another hotel property in an attempt to replace that income, which could materially and adversely affect us.
Technology is used in our operations, and any material failure, inadequacy, interruption or security failure of that technology could harm the business.
We, and the hotel managers and franchisors, rely on information technology networks and systems to process, transmit and store electronic information, and to manage or support a variety of business processes, including financial transactions and records, personal identifiable information, reservations, billing and operating data. These information technology networks and systems can be vulnerable to threats such as system, network or internet failures; computer hacking or business disruption; cyber-terrorism; viruses, worms or other malicious software programs; and employee error, negligence or fraud. Although we believe we and the hotel managers and franchisors have taken commercially reasonable steps to protect the security of our systems, there can be no assurance that such security measures will prevent failures, inadequacies or interruptions in system services, or that system security will not be breached.
In addition to the information technology networks and systems of the hotel managers that are used to operate our hotel properties, RLJ has its own corporate information technology networks and systems that are used to access, store, transmit, and manage or support a variety of business processes. There can be no assurance that the security measures we have taken to protect the contents of these information technology networks and systems will succeed. Any failure to maintain proper
14
function, security and availability of information technology networks and systems could interrupt our operations, our financial reporting and compliance, damage our reputation, and subject us to liability claims or regulatory penalties, which could have a material and adverse effect on our business, financial condition and results of operations.
Future terrorist attacks or changes in terror alert levels could materially and adversely affect us.
Historically, terrorist attacks and subsequent terrorist alerts have adversely affected the U.S. travel and hospitality industries, often disproportionately to the effect on the overall economy. The extent of the impact that actual or threatened terrorist attacks in the U.S. or elsewhere could have on domestic and international travel and our business in particular cannot be determined, but any such attacks or the threat of such attacks could have a material and adverse effect on travel and hotel demand and our ability to insure our hotel properties, which could materially and adversely affect us.
The outbreak of influenza or other widespread contagious diseases could reduce travel and adversely affect hotel demand, which would have a material and adverse effect on us.
A widespread outbreak of an infectious or contagious disease in the U.S. could reduce travel and hotel demand within the lodging industry. If demand at our hotel properties decreases significantly or for a prolonged period of time as a result of an outbreak of an infectious or contagious disease, our revenue would be adversely affected, which could have a material and adverse effect on us.
We face possible risks associated with natural disasters, weather events, and the physical effects of climate change.
We are subject to the risks associated with natural disasters, weather events, and the physical effects of climate change, which can include more frequent or severe storms, droughts, hurricanes and flooding, any of which could have a material adverse effect on our properties, operations and business. Over time, our hotel properties located in coastal markets and other
areas that may be impacted by climate change, are expected to experience increases in storm intensity and rising sea-levels
causing damage to our hotel properties. As a result, we could become subject to significant losses and/or repair costs that may or may not be fully covered by insurance. Other markets may experience prolonged variations in temperature or precipitation that may limit access to the water needed to operate our hotel properties or significantly increase energy costs, which may subject those properties to additional regulatory burdens, such as limitations on water usage or stricter energy efficiency standards. Weather events and climate change may also affect our business by increasing the cost of (or making unavailable) property insurance on terms we find acceptable in areas most vulnerable to such events, increasing operating costs at our hotel properties, such as the cost of water or energy, and requiring us to expend funds as we seek to repair and protect our hotel properties against such risks. There can be no assurance that natural disasters, weather events, and climate change will not have a material adverse effect on our hotel properties, operations or business.
If we fail to maintain an effective system of internal control over financial reporting, we may not be able to accurately report our financial results.
To monitor the accuracy and reliability of our financial reporting, we have established an internal audit function that oversees our internal controls. In addition, we have developed policies and procedures with respect to company-wide business processes and cycles in order to implement an effective system of internal control over financial reporting. We have established controls and procedures designed to ensure that hotel revenues and expenses are properly recorded at our hotels. While we have undertaken substantial work to comply with Section 404 of the Sarbanes-Oxley Act of 2002, we cannot be certain that we will be successful in maintaining effective internal control over financial reporting and we may determine in the future that our existing internal controls need improvement. If we fail to maintain an effective system of internal control, we could be materially harmed or we could fail to meet our reporting obligations. In addition, the existence of a material weakness or significant deficiency in our internal controls could result in errors to our financial statements that could require a restatement, cause us to fail to meet our reporting obligations, result in increased costs to remediate any deficiencies, attract regulatory scrutiny or lawsuits and cause investors to lose confidence in our reported financial information.
Risks Related to the Real Estate Industry
The illiquid nature of real estate investments could significantly impede our ability to respond to changing economic, financial, and investment conditions or changes in the operating performance of our hotel properties, which could materially and adversely affect our cash flows and results of operations.
Real estate investments, including the compact full-service hotels in our portfolio, are relatively illiquid. As a result, we may not be able to sell a hotel or hotels quickly or on favorable terms in response to the changing economic, financial and
15
investment conditions or changes in the hotel's operating performance when it otherwise may be prudent to do so. We cannot predict whether we will be able to sell any hotel property we desire to sell for the price or on the terms set by us or whether any price or other terms offered by a prospective purchaser would be acceptable to us. We may be required to expend funds to correct defects or to make improvements before a hotel can be sold, and we cannot provide any assurances that we will have the funds available to correct such defects or to make such improvements. Our inability to dispose of assets at opportune times or on favorable terms could materially and adversely affect our cash flows and results of operations.
Uninsured and underinsured losses at our hotel properties could materially and adversely affect us.
We maintain comprehensive property insurance on all of our hotel properties and we intend to maintain comprehensive property insurance on any hotels that we acquire in the future, including fire, terrorism, and extended coverage. Our
comprehensive property insurance program has a $250,000 deductible per claim. In addition to the comprehensive property insurance, we maintain general liability insurance at all of our hotel properties. Our general liability insurance program has no deductible. Certain types of catastrophic losses, such as windstorms, earthquakes, floods, and losses from foreign and domestic terrorist activities may not be insurable or may not be economically insurable. Even when insurable, these policies may have high deductibles and/or high premiums. Our coastal hotel properties each have a deductible of 5% of total insured value for a named storm. Our lenders may require such insurance and our failure to obtain such insurance could constitute a default under the loan agreements, which could have a material and adverse effect on us.
In the event of a substantial loss, our insurance coverage may not be sufficient to cover the full current market value or replacement cost of our lost investment, which could have a material and adverse effect on us. Should an uninsured loss or a loss in excess of insured limits occur, or should we be unsuccessful in obtaining coverage from an insurance carrier, we could lose all or a portion of the capital we have invested in a hotel property, as well as the anticipated future revenue from the hotel property. In that event, we might nevertheless remain obligated for any mortgage debt or other financial obligations related to the hotel property.
Compliance or failure to comply with the ADA and other safety regulations and requirements could result in substantial costs.
Under the ADA, all public accommodations must meet various federal requirements related to access and use by disabled persons. Compliance with the ADA's requirements could require removal of access barriers, and non-compliance could result in the U.S. government imposing fines or private damage awards. If we are required to make substantial modifications to the hotel properties that we own or the hotel properties that we acquire, whether to comply with the ADA or other changes in governmental rules and regulations, we could be materially and adversely affected.
Our hotel properties are also subject to various federal, state and local regulatory requirements, such as state and local fire and life safety requirements. If we fail to comply with these requirements, we could incur fines or private damage awards. If we incur substantial costs to comply with the ADA or other safety regulations and requirements, our financial condition, results of operations, cash flows and our ability to satisfy our debt obligations could be materially and adversely affected.
We could incur significant costs related to government regulation and litigation with respect to environmental matters, which could have a material and adverse effect on us.
Our hotel properties are subject to various U.S. federal, state and local environmental, health and safety laws and regulations, certain of which impose liability for contamination. Under these laws, governmental entities have the authority to require us, as the current owner of a hotel property, to perform or pay for the clean-up of contamination (including hazardous substances, asbestos and asbestos-containing materials ("ACM"), waste or petroleum products) at, on, under or emanating from the hotel and to pay for natural resource damages arising from such contamination. Because these laws also impose liability on persons who owned or operated a property at the time it became contaminated, it is possible we could incur cleanup costs or other environmental liabilities even after we sell or no longer operate the hotel properties.
Certain of our hotel properties contain ACM. Federal, state and local environmental, health and safety laws require that ACM be properly managed and maintained. Such laws regarding ACM may impose fines and penalties on building owners, employers and operators for failure to comply with these requirements. In addition, third parties may seek recovery from owners or operators for personal injury associated with exposure to asbestos-containing building materials.
The liabilities and the costs associated with environmental contamination at our hotel properties, defending against the claims related to alleged or actual environmental issues, or complying with environmental, health and safety laws could be
16
material and could materially and adversely affect us. The discovery of material environmental liabilities at our hotel properties could subject us to unanticipated costs, which could significantly reduce or eliminate our profitability.
We may from time to time be subject to litigation that could expose us to uncertain or uninsured costs.
As owners of hotel properties, we may from time to time face potential claims, litigation and threatened litigation from guests, visitors to our hotel properties, contractors, sub-contractors and others. These claims and proceedings are inherently uncertain and their costs and outcomes cannot be predicted with certainty. Some of these claims may result in defense costs, settlements, fines or judgments against us, and some of which are not, or cannot be, covered by insurance. Payment of any such costs, settlements, fines or judgments that are not insured could have a material and adverse impact on our financial position and results of operations. In addition, certain litigation or the resolution of certain litigation may affect the availability or cost of some of our insurance coverage, which could materially and adversely impact our results of operations and cash flows, expose us to increased risks that would be uninsured, and/or adversely impact our ability to attract officers and trustees.
Increases in real estate taxes on our hotel properties could materially and adversely affect us.
We are subject to a variety of state and local taxes, including real estate taxes. Real estate taxes on our hotel properties may increase as tax rates change and as the properties are assessed or reassessed by taxing authorities. As a result of the Mergers, some of our hotel properties located in jurisdictions that may provide for property tax reappraisal upon a change of ownership may face such a reassessment. Additionally, all our hotel properties located in California may be reassessed as a result of changes in California laws that contain certain limitations on annual increases of assessed real estate values. We would expect to appeal any such assessments or reassessments, but we may not be successful in our efforts. If real estate or other taxes increase, our result of operations would be materially and adversely affected.
Risks Related to Taxes and the Mergers
We would incur adverse tax consequences if FelCor failed to qualify as a REIT for U.S. federal income tax purposes prior to the Mergers.
In connection with the closing of the Mergers, FelCor received an opinion of counsel to the effect that it qualified as a REIT for U.S. federal income tax purposes under the Code through the time of the Mergers. FelCor, however, did not request a ruling from the Internal Revenue Service that it qualified as a REIT. If, notwithstanding this opinion, FelCor’s REIT status prior to the Mergers were successfully challenged, we would face serious tax consequences that would substantially reduce our core funds from operations and cash available for distribution because:
• | FelCor would be subject to U.S. federal, state and local income tax on its net income at regular corporate rates for the years that it did not qualify as a REIT (and, for such years, would not be allowed a deduction for dividends paid to shareholders in computing its taxable income) and we would succeed to the liability for such taxes; and |
• | The deemed sale of assets by FelCor in the REIT Merger would be subject to U.S. federal, state and local income tax at regular corporate rates (and FelCor would not be allowed a deduction for dividends paid for the deemed liquidating distribution paid to its shareholders) and we would succeed to the liability for such taxes. |
Item 1B. Unresolved Staff Comments
None.
17
Item 2. Properties
Our Hotel Properties
The following table provides a comprehensive list of our hotel properties as of December 31, 2019:
State | Hotel Property Name | Rooms | State | Hotel Property Name | Rooms | |
Alabama | Massachusetts | |||||
Embassy Suites Birmingham | 242 | Wyndham Boston Beacon Hill | 304 | |||
Arizona | Minnesota | |||||
Embassy Suites Phoenix - Biltmore | 232 | Embassy Suites Minneapolis - Airport | 310 | |||
California | New Jersey | |||||
Embassy Suites Los Angeles - International Airport South | 349 | Embassy Suites Secaucus - Meadowlands (2) | 261 | |||
Embassy Suites Mandalay Beach - Hotel & Resort | 250 | New York | ||||
Embassy Suites Milpitas Silicon Valley | 266 | The Knickerbocker New York (3) | 330 | |||
Embassy Suites San Francisco Airport - South San Francisco | 312 | Pennsylvania | ||||
Embassy Suites San Francisco Airport - Waterfront | 340 | Wyndham Philadelphia Historic District | 364 | |||
San Francisco Marriott Union Square | 401 | Wyndham Pittsburgh University Center | 251 | |||
Wyndham San Diego Bayside | 600 | South Carolina | ||||
Wyndham Santa Monica At The Pier | 132 | The Mills House Wyndham Grand Hotel | 216 | |||
Florida | Texas | |||||
DoubleTree Suites by Hilton Orlando - Lake Buena Vista | 229 | DoubleTree Suites by Hilton Austin | 188 | |||
Embassy Suites Deerfield Beach - Resort & Spa | 244 | Embassy Suites Dallas - Love Field | 248 | |||
Embassy Suites Fort Lauderdale 17th Street | 361 | Wyndham Houston - Medical Center Hotel & Suites | 287 | |||
Embassy Suites Miami - International Airport | 318 | |||||
Embassy Suites Orlando - International Drive South/Convention Center | 244 | |||||
Georgia | ||||||
Embassy Suites Atlanta - Buckhead | 316 | |||||
Louisiana | ||||||
Chateau LeMoyne - French Quarter, New Orleans (1) | 171 | |||||
Wyndham New Orleans - French Quarter | 374 | |||||
(1) | We own an indirect 50% ownership interest in this hotel property and we account for the ownership interest using the equity method of accounting. |
(2) | We own an indirect 50% ownership interest in the real estate at this hotel property, and we record the real estate interest using the equity method of accounting. |
(3) | We own a 95% controlling ownership interest in this hotel property. |
Management Agreements
In order for our parent, RLJ, to qualify as a REIT, it cannot directly or indirectly operate any of its hotel properties. Our hotel property-owning subsidiaries (the “Lessors”) lease our hotel properties to lessees owned by TRS subsidiaries of RLJ LP (the “Lessees”), which in turn engage hotel property management companies to manage our hotel properties. As discussed in Note 2 to our accompanying consolidated financial statements, we distributed our equity interests in FelCor TRS to RLJ LP immediately after consummation of the Mergers. As a result of the distribution of our equity interests in FelCor TRS, our consolidated financial statements do not include the financial information related to the Lessees' management agreements. Although the financial information related to the Lessees' management agreements is not included in our consolidated financial statements, the management agreements noted below are still in place at our hotel properties and we are dependent on the performance of the management companies to manage the operations of each of our hotel properties.
18
As of December 31, 2019, our 28 hotel properties were managed by six different management companies as follows:
Management Company | Number of Hotel Properties | |
Aimbridge Hospitality | 1 | |
Hilton Management and affiliates | 16 | |
Highgate Hotels | 1 | |
InterContinental Hotels Group | 1 | |
Marriott International, Inc. | 1 | |
Wyndham | 8 | |
28 | ||
All but three of our hotel properties receive the benefits of a franchise agreement pursuant to management agreements with Hilton, Wyndham, Marriott and InterContinental Hotels Group ("IHG").
The management agreements have initial terms that range from five to 20 years, and some provide for one or two automatic extension periods ranging from one to ten years. Each management company receives a base management fee between 2.0% and 3.0% of hotel revenues.
The management companies are also eligible to receive an incentive management fee upon the achievement of certain financial thresholds as set forth in each applicable management agreement. The incentive management fee is generally calculated as a percentage of hotel operating income after RLJ has received a priority return on its investment in the hotel.
Each of the management agreements provides us with a right to terminate such management agreement if the management company fails to reach certain performance targets (as provided in the applicable management agreement). Certain management agreements also provide us with a right to terminate the management agreement in our sole and absolute discretion. In addition, certain management agreements give us the right to terminate the management agreement upon the sale of the hotel property or for any reason upon payment of a stipulated termination fee. The management agreements are also generally terminable by either party upon material casualty, or condemnation of the hotel property, or the occurrence of certain customary events of default.
The Wyndham management agreements guaranteed minimum levels of annual net operating income at each of the Wyndham-managed hotels for each year of the initial 10-year term to December 31, 2022, subject to an aggregate $100.0 million limit over the term and an annual $21.5 million limit. RLJ recognized the net operating income guaranties as a reduction of Wyndham's contractual management and other fees. In September 2019, RLJ entered into an agreement with Wyndham to terminate the management agreements and the related net operating income guarantee, effective December 31, 2019. In addition, RLJ entered into eight separate transitional franchise and management agreements effective January 1, 2020 through December 31, 2020. At its sole discretion, RLJ has the right to extend these agreements through December 31, 2021. The transitional franchise and management fees are 3% and 2%, respectively, of hotel revenues. In December 2019, RLJ received a lump sum termination payment of $35.0 million from Wyndham. Wyndham also forgave the $4.6 million remaining balance of a key money loan. RLJ will recognize the $35.0 million termination payment and $4.6 million key money loan forgiveness over the estimated term of the transitional agreements beginning January 1, 2020 as a reduction to management and franchise fee expense.
Franchise Agreements
As of December 31, 2019, two of our hotels operated under franchise agreements with Embassy Suites. This number excludes the 25 hotel properties that receive the benefits of a franchise agreement pursuant to management agreements with Hilton, Wyndham, Marriott and IHG. In addition, The Knickerbocker is not operated with a hotel brand so the hotel does not have a franchise agreement.
As discussed in Note 2 to our accompanying consolidated financial statements, we distributed our equity interests in FelCor TRS to RLJ LP immediately after consummation of the Mergers. As a result of the distribution of our equity interests in FelCor TRS, our consolidated financial statements do not include the financial information related to the Lessees' franchise agreements. Although the financial information related to the Lessees' franchise agreements is not included in our consolidated financial statements, the franchise agreements noted below are still in-place at our hotel properties and we are dependent on the franchisors to provide our franchised hotels with brand recognition, marketing supporting and worldwide reservation systems.
19
Franchise agreements allow the hotel properties to operate under the respective brands. The franchisors provide a variety of benefits to the franchisees, including centralized reservation systems, national advertising, marketing programs and publicity designed to increase brand awareness, personnel training and operational quality at the hotels across the brand system. The franchise agreements generally specify management, operational, record-keeping, accounting, reporting and marketing standards and procedures, all of which the Lessees, as the franchisees, must follow. The franchise agreements require the Lessees to comply with the franchisors' standards and requirements, including the training of operational personnel, safety, maintaining specified insurance, the types of services and products ancillary to guest room services that may be provided by the Lessees, the display of signage and the type, quality and age of furniture, fixtures and equipment included in the guest rooms and the nature of the lobbies and other common areas. The franchise agreements have an initial term of 15 years. Each of our franchise agreements require that we pay a royalty fee of 5.5% of room revenue, plus additional fees for marketing, central reservation systems and other franchisor costs of 4.0% of room revenue.
The franchise agreements also provide for termination at the applicable franchisor's option upon the occurrence of certain events, including the failure to pay royalties and fees, the failure to perform our obligations under the franchise license, bankruptcy and the abandonment of the franchise, or a change in control. The Lessees are responsible for making all payments under the applicable franchise agreement to the franchisor; however, we are required to guarantee the obligations under each of the franchise agreements. In addition, many of our existing franchise agreements provide the franchisor with a right of first offer in the event of certain sales or transfers of a hotel and provide the franchisor the right to approve a change in the management company who manages the hotel.
TRS Leases
In order for our parent, RLJ, to qualify as a REIT, it cannot directly or indirectly operate any of its hotels. The Lessors lease our hotel properties to the Lessees under lease agreements. These lease agreements are known as the "TRS Leases." The Lessees are the parties to the existing management agreements with the third-party management companies at each of our hotel properties. The TRS Leases contain the following provisions:
Lease Terms
The TRS Leases have initial terms that generally range from three to five years and a majority of the leases can be renewed by the Lessees for three successive five-year renewal terms unless the lessee is in default at the expiration of the then-current term. In addition, the TRS Leases are subject to early termination by us in the event that we sell the hotel to an unaffiliated party, a change in control occurs, or the applicable provisions of the Internal Revenue Code of 1986 are amended to permit us to operate our hotels. The TRS Leases are also subject to early termination upon the occurrence of certain events of default and/or other contingencies described in the lease.
Amounts Payable under the Leases
During the term of each TRS Lease, the Lessees are obligated to pay us a fixed annual base rent plus a percentage rent and certain other additional charges that the Lessees agree to pay under the terms of the respective TRS Lease. The percentage rent is calculated based on the revenues generated from the rental of guest rooms, food and beverage sales, and certain other sources, including meeting room rentals.
The TRS Leases require the Lessees to pay rent, all costs and expenses, management fees, franchise fees, certain insurance policies and all utility and other charges incurred in the operation of the hotels. The TRS Leases also provide for rent reductions and abatements in the event of damage to, destruction, or a partial taking of, any hotel.
As discussed in Note 2 to our accompanying consolidated financial statements, Merger with RLJ, we distributed our equity interests in FelCor TRS to RLJ LP immediately after consummation of the Mergers. As a result of the distribution of its equity interests in FelCor TRS, the Lessees' lease payments pursuant to the TRS Leases are no longer eliminated in consolidation. We recognize lease revenue from the Lessees under the TRS Leases.
For the Predecessor period, all of the above mentioned intercompany transactions are eliminated in consolidation.
20
Maintenance and Modifications
Under each TRS Lease, the Lessee may, at its expense, make additions, modifications or improvements to the hotel that it deems desirable, and that RLJ approves. In addition, the Lessees are required, at their expense, to maintain the hotels in good order and repair, except for ordinary wear and tear, and to make repairs that may be necessary and appropriate to keep the hotel in good order and repair. Under the TRS Lease, we are responsible for maintaining, at our cost, any underground utilities or structural elements, including the exterior walls and the roof of the hotel (excluding, among other things, windows and mechanical, electrical and plumbing systems). Each Lessee, when and as required to meet the standards of the applicable management agreement, any applicable hotel franchise agreement, or to satisfy the requirements of any lender, must establish an FF&E reserve in an amount equal to up to 5% of gross revenue for the purpose of periodically repairing, replacing or refurbishing the furnishings and equipment.
Events of Default
The events of default under each of the TRS Leases include, among others: the failure by a Lessee to pay rent when due; the breach by a Lessee of a covenant, condition or term under the lease, subject to the applicable cure period; the bankruptcy or insolvency of a Lessee; cessation of operations by a Lessee of the leased hotel for more than 30 days, except as a result of damage, destruction, or a partial or complete condemnation; or the default by a Lessee under a franchise agreement subject to any applicable cure period.
Termination of Leases on Disposition of the Hotels or Change of Control
In the event that RLJ sells a hotel to a non-affiliate or a change of control occurs, we generally have the right to terminate the lease by paying the applicable Lessee a termination fee to be governed by the terms and conditions of the lease.
Ground Leases
As of December 31, 2019, six of our consolidated hotel properties and two of our unconsolidated hotel properties were subject to ground lease agreements that cover the land under the respective hotel properties. Additional information on the ground leases can be found in Note 11 to our accompanying consolidated financial statements.
Item 3. Legal Proceedings
The nature of the operations of our hotels exposes our hotel properties, us, and RLJ to the risk of claims and litigation in the normal course of business. Other than routine litigation arising out of the ordinary course of business and the pension trust litigation matter noted in Note 11 to our accompanying consolidated financial statements, we are not presently subject to any material litigation nor, to our knowledge, is any material litigation threatened against us.
Item 4. Mine Safety Disclosures
Not applicable.
PART II
Item 5. Market for Registrant's Common Equity, Related Shareholder Matters and Issuer Purchases of Equity Securities
Since our August 31, 2017 acquisition by RLJ, 100% of the ownership interests of Rangers and FelCor LP are held by RLJ LP (either directly or indirectly). There is no established public trading market for equity of Rangers or FelCor LP.
Distribution Information
Our senior notes indentures limit our ability to pay dividends and make other payments based on our ability to satisfy certain financial requirements. We do not expect to make any dividends or other similar payments.
21
Item 6. Selected Financial Data
The following selected financial information for Rangers and FelCor LP should be read in conjunction with "Management's Discussion and Analysis of Financial Condition and Results of Operations" and the consolidated financial statements as of December 31, 2019 and 2018 and for the Successor years ended December 31, 2019 and 2018, the Successor period of September 1, 2017 through December 31, 2017, the Predecessor period of January 1, 2017 through August 31, 2017, and the related notes included elsewhere in this Annual Report on Form 10-K.
The selected financial information as of December 31, 2019, 2018 and 2017, and for the Predecessor as of December 31, 2016 and 2015, and for the Successor years ended December 31, 2019 and 2018, the Successor period of September 1, 2017 through December 31, 2017, the Predecessor period of January 1, 2017 through August 31, 2017, and for the Predecessor years ended December 31, 2016 and 2015 has been derived from our audited historical financial statements.
As a result of the merger with RLJ, certain prior period amounts in the selected Predecessor financial information have been reclassified to conform to the financial statement presentation of the Company's parent company, RLJ. The reclassifications had no impact to net income (loss) and comprehensive income (loss) or member's/shareholders’ equity (partners' capital).
22
Rangers Sub I, LLC
Successor | Predecessor | ||||||||||||||||||||||||
(In thousands, except share and per share data) | For the year ended December 31, | September 1 through December 31, | January 1 through August 31, | For the year ended December 31, | |||||||||||||||||||||
2019 | 2018 | 2017 | 2017 | 2016 | 2015 | ||||||||||||||||||||
Statement of Operations Data: | |||||||||||||||||||||||||
Revenues | |||||||||||||||||||||||||
Room revenue | $ | — | $ | — | $ | — | $ | 425,682 | $ | 661,640 | $ | 673,276 | |||||||||||||
Other property revenue | 196,695 | 217,597 | 81,259 | 125,833 | 205,314 | 212,978 | |||||||||||||||||||
Total revenues | 196,695 | 217,597 | 81,259 | 551,515 | 866,954 | 886,254 | |||||||||||||||||||
Expenses | |||||||||||||||||||||||||
Room expense | — | — | — | 112,813 | 171,883 | 172,252 | |||||||||||||||||||
Other property expense | — | — | — | 239,556 | 379,282 | 400,007 | |||||||||||||||||||
Total property operating expenses | — | — | — | 352,369 | 551,165 | 572,259 | |||||||||||||||||||
Depreciation and amortization | 72,389 | 78,491 | 28,965 | 73,065 | 114,054 | 114,452 | |||||||||||||||||||
Impairment loss | — | — | — | 35,109 | 26,459 | 20,861 | |||||||||||||||||||
Property tax, insurance and other | 40,965 | 53,754 | 17,062 | 44,278 | 70,057 | 71,686 | |||||||||||||||||||
General and administrative | 1,289 | 1,056 | 1,019 | 16,006 | 27,037 | 27,283 | |||||||||||||||||||
Transaction costs | 241 | 2,186 | 4,193 | 68,248 | — | — | |||||||||||||||||||
Total operating expenses | 114,884 | 135,487 | 51,239 | 589,075 | 788,772 | 806,541 | |||||||||||||||||||
Interest and other income | 406 | 424 | 10 | 226 | 404 | 190 | |||||||||||||||||||
Interest expense | (31,930 | ) | (37,930 | ) | (19,270 | ) | (51,690 | ) | (78,244 | ) | (79,142 | ) | |||||||||||||
Related party interest expense | (4,529 | ) | (708 | ) | — | — | — | — | |||||||||||||||||
(Loss) gain on sale of hotel properties, net | (21,451 | ) | 18,423 | (6,637 | ) | (1,764 | ) | 6,322 | 19,426 | ||||||||||||||||
Gain (loss) on extinguishment of indebtedness, net | — | 11,266 | — | (3,278 | ) | — | (30,909 | ) | |||||||||||||||||
Income (loss) from continuing operations before equity in income from unconsolidated joint ventures and income tax expense | 24,307 | 73,585 | 4,123 | (94,066 | ) | 6,664 | (10,722 | ) | |||||||||||||||||
Equity in income from unconsolidated joint ventures | 816 | 1,395 | 661 | 1,074 | 1,533 | 7,833 | |||||||||||||||||||
Income tax expense | — | — | — | (499 | ) | (873 | ) | (1,245 | ) | ||||||||||||||||
Net income (loss) from continuing operations | 25,123 | 74,980 | 4,784 | (93,491 | ) | 7,324 | (4,134 | ) | |||||||||||||||||
Discontinued operations | — | — | — | (3,415 | ) | (3,131 | ) | 669 | |||||||||||||||||
Net income (loss) and comprehensive income (loss) | 25,123 | 74,980 | 4,784 | (96,906 | ) | 4,193 | (3,465 | ) | |||||||||||||||||
Net (income) loss attributable to noncontrolling interest in consolidated joint ventures | (248 | ) | (159 | ) | (157 | ) | 545 | 673 | (4,157 | ) | |||||||||||||||
Net (income) loss attributable to noncontrolling interest in FelCor LP | (235 | ) | (733 | ) | (41 | ) | 495 | 93 | 194 | ||||||||||||||||
Preferred distributions - consolidated joint venture | (186 | ) | (1,483 | ) | (496 | ) | (979 | ) | (1,461 | ) | (1,437 | ) | |||||||||||||
Redemption of preferred equity - consolidated joint venture | (1,153 | ) | — | — | — | — | — | ||||||||||||||||||
23
Preferred dividends | — | — | — | (16,744 | ) | (25,115 | ) | (36,234 | ) | ||||||||||||||||
Net income (loss) and comprehensive income (loss) attributable to ownership interests/common shareholders | $ | 23,301 | $ | 72,605 | $ | 4,090 | $ | (113,589 | ) | $ | (21,617 | ) | $ | (45,099 | ) | ||||||||||
Basic and diluted per common share data: | |||||||||||||||||||||||||
Loss from continuing operations per share attributable to common shareholders (1) | $ | (0.80 | ) | $ | (0.13 | ) | $ | (0.33 | ) | ||||||||||||||||
Net loss per share attributable to common shareholders (1) | $ | (0.83 | ) | $ | (0.16 | ) | $ | (0.33 | ) | ||||||||||||||||
Weighted-average shares - basic | 137,331,743 | 138,128,165 | 137,730,438 | ||||||||||||||||||||||
Weighted-average shares - diluted (1) | 137,331,743 | 138,128,165 | 137,730,438 | ||||||||||||||||||||||
Dividends declared per share | $ | 0.16 | $ | 0.24 | $ | 0.18 | |||||||||||||||||||
(1) | Income allocated to the noncontrolling interest in the Operating Partnership has been excluded from the numerator, and the OP units of the Operating Partnership have been omitted from the denominator, since the effect of including these amounts in the numerator and denominator would have no impact. |
Successor | Predecessor | ||||||||||||||||||
As of December 31, | |||||||||||||||||||
2019 | 2018 | 2017 | 2016 | 2015 | |||||||||||||||
(In thousands) | |||||||||||||||||||
Balance Sheet Data: | |||||||||||||||||||
Investment in hotel properties, net | $ | 1,946,826 | $ | 2,123,423 | $ | 2,497,880 | $ | 1,566,823 | $ | 1,729,531 | |||||||||
Cash and cash equivalents | $ | 19,572 | $ | 21,351 | $ | 14,728 | $ | 47,317 | $ | 59,786 | |||||||||
Total assets | $ | 2,123,075 | $ | 2,233,194 | $ | 2,743,774 | $ | 1,707,092 | $ | 1,865,912 | |||||||||
Debt, net | $ | 713,727 | $ | 626,628 | $ | 1,299,105 | $ | 1,338,326 | $ | 1,409,889 | |||||||||
Related party debt | $ | 85,000 | $ | 85,000 | $ | — | $ | — | $ | — | |||||||||
Total liabilities | $ | 882,256 | $ | 757,606 | $ | 1,373,415 | $ | 1,469,621 | $ | 1,550,303 | |||||||||
Total equity | $ | 1,240,819 | $ | 1,475,588 | $ | 1,370,359 | $ | 232,583 | $ | 311,145 | |||||||||
24
FelCor Lodging Limited Partnership
Successor | Predecessor | ||||||||||||||||||||||||
(In thousands, except share and per share data) | For the year ended December 31, | September 1 through December 31, | January 1 through August 31, | For the year ended December 31, | |||||||||||||||||||||
2019 | 2018 | 2017 | 2017 | 2016 | 2015 | ||||||||||||||||||||
Statement of Operations Data: | |||||||||||||||||||||||||
Revenues | |||||||||||||||||||||||||
Room revenue | $ | — | $ | — | $ | — | $ | 425,682 | $ | 661,640 | $ | 673,276 | |||||||||||||
Other property revenue | 196,695 | 217,597 | 81,259 | 125,833 | 205,314 | 212,978 | |||||||||||||||||||
Total revenues | 196,695 | 217,597 | 81,259 | 551,515 | 866,954 | 886,254 | |||||||||||||||||||
Expenses | |||||||||||||||||||||||||
Room expense | — | — | — | 112,813 | 171,883 | 172,252 | |||||||||||||||||||
Other property expense | — | — | — | 239,556 | 379,282 | 400,007 | |||||||||||||||||||
Total property operating expenses | — | — | — | 352,369 | 551,165 | 572,259 | |||||||||||||||||||
Depreciation and amortization | 72,389 | 78,491 | 28,965 | 73,065 | 114,054 | 114,452 | |||||||||||||||||||
Impairment loss | — | — | — | 35,109 | 26,459 | 20,861 | |||||||||||||||||||
Property tax, insurance and other | 40,965 | 53,754 | 17,062 | 44,278 | 70,057 | 71,686 | |||||||||||||||||||
General and administrative | 1,289 | 1,056 | 1,019 | 16,006 | 27,037 | 27,283 | |||||||||||||||||||
Transaction costs | 241 | 2,186 | 4,193 | 68,248 | — | — | |||||||||||||||||||
Total operating expenses | 114,884 | 135,487 | 51,239 | 589,075 | 788,772 | 806,541 | |||||||||||||||||||
Interest and other income | 406 | 424 | 10 | 226 | 404 | 190 | |||||||||||||||||||
Interest expense | (31,930 | ) | (37,930 | ) | (19,270 | ) | (51,690 | ) | (78,244 | ) | (79,142 | ) | |||||||||||||
Related party interest expense | (4,529 | ) | (708 | ) | — | — | — | — | |||||||||||||||||
(Loss) gain on sale of hotel properties, net | (21,451 | ) | 18,423 | (6,637 | ) | (1,764 | ) | 6,322 | 19,426 | ||||||||||||||||
Gain (loss) on extinguishment of indebtedness, net | — | 11,266 | — | (3,278 | ) | — | (30,909 | ) | |||||||||||||||||
Income (loss) from continuing operations before equity in income from unconsolidated joint ventures and income tax expense | 24,307 | 73,585 | 4,123 | (94,066 | ) | 6,664 | (10,722 | ) | |||||||||||||||||
Equity in income from unconsolidated joint ventures | 816 | 1,395 | 661 | 1,074 | 1,533 | 7,833 | |||||||||||||||||||
Income tax expense | — | — | — | (499 | ) | (873 | ) | (1,245 | ) | ||||||||||||||||
Net income (loss) from continuing operations | 25,123 | 74,980 | 4,784 | (93,491 | ) | 7,324 | (4,134 | ) | |||||||||||||||||
Discontinued operations | — | — | — | (3,415 | ) | (3,131 | ) | 669 | |||||||||||||||||
Net income (loss) and comprehensive income (loss) | 25,123 | 74,980 | 4,784 | (96,906 | ) | 4,193 | (3,465 | ) | |||||||||||||||||
Net (income) loss attributable to noncontrolling interest in consolidated joint ventures | (248 | ) | (159 | ) | (157 | ) | 545 | 673 | (4,157 | ) | |||||||||||||||
Preferred distributions - consolidated joint venture | (186 | ) | (1,483 | ) | (496 | ) | (979 | ) | (1,461 | ) | (1,437 | ) | |||||||||||||
Redemption of preferred capital - consolidated joint venture | (1,153 | ) | — | — | — | — | — | ||||||||||||||||||
Preferred distributions | — | — | — | (16,744 | ) | (25,115 | ) | (36,234 | ) | ||||||||||||||||
25
Net income (loss) and comprehensive income (loss) attributable to FelCor LP partners and common unitholders | $ | 23,536 | $ | 73,338 | $ | 4,131 | $ | (114,084 | ) | $ | (21,710 | ) | $ | (45,293 | ) | ||||||||||
Basic and diluted per common unit data: | |||||||||||||||||||||||||
Loss from continuing operations per unit attributable to common unitholders | $ | (0.80 | ) | $ | (0.13 | ) | $ | (0.33 | ) | ||||||||||||||||
Net loss per unit attributable to common unitholders | $ | (0.83 | ) | $ | (0.16 | ) | $ | (0.33 | ) | ||||||||||||||||
Weighted-average number of common units - basic | 137,941,926 | 138,739,214 | 138,341,900 | ||||||||||||||||||||||
Weighted-average number of common units - diluted | 137,941,926 | 138,739,214 | 138,341,900 | ||||||||||||||||||||||
Distributions declared per common unit | $ | 0.16 | $ | 0.24 | $ | 0.18 | |||||||||||||||||||
Successor | Predecessor | ||||||||||||||||||
As of December 31, | |||||||||||||||||||
2019 | 2018 | 2017 | 2016 | 2015 | |||||||||||||||
(In thousands) | |||||||||||||||||||
Balance Sheet Data: | |||||||||||||||||||
Investment in hotel properties, net | $ | 1,946,826 | $ | 2,123,423 | $ | 2,497,880 | $ | 1,566,823 | $ | 1,729,531 | |||||||||
Cash and cash equivalents | $ | 19,572 | $ | 21,351 | $ | 14,728 | $ | 47,317 | $ | 59,786 | |||||||||
Total assets | $ | 2,123,075 | $ | 2,233,194 | $ | 2,743,774 | $ | 1,707,092 | $ | 1,865,912 | |||||||||
Debt, net | $ | 713,727 | $ | 626,628 | $ | 1,299,105 | $ | 1,338,326 | $ | 1,409,889 | |||||||||
Related party debt | $ | 85,000 | $ | 85,000 | $ | — | $ | — | $ | — | |||||||||
Total liabilities | $ | 882,256 | $ | 757,606 | $ | 1,373,415 | $ | 1,469,621 | $ | 1,550,303 | |||||||||
Total partners' capital | $ | 1,240,819 | $ | 1,475,588 | $ | 1,370,359 | $ | 232,583 | $ | 311,145 | |||||||||
Item 7. Management’s Discussion and Analysis of Financial Condition and Results of Operations.
The following discussion and analysis should be read in conjunction with the accompanying consolidated financial statements, the related notes included thereto, and Item 1A., "Risk Factors" all of which appear elsewhere in this Annual Report on Form 10-K.
Overview
Rangers is a Maryland limited liability company that, through FelCor LP, owns hotel properties and conducts other business. Substantially all of Rangers' assets and liabilities are held by, and all of its operations are conducted through, FelCor LP. 100% of the ownership interests of Rangers are held by RLJ LP, which is the operating partnership of RLJ. Rangers indirectly owns a 99% partnership interest in FelCor LP. Rangers GP, a wholly-owned subsidiary of RLJ LP, owns the remaining 1% partnership interest and is the sole general partner of FelCor LP.
Our hotels are concentrated in markets that we believe exhibit multiple demand generators and attractive long-term growth prospects. We believe premium-branded, compact full-service hotels with these characteristics generate high levels of RevPAR, strong operating margins and attractive returns.
As we look at factors that could impact our business, we find that the consumer is generally in good financial health, job creation remains positive and an increase in wages is adding to consumers' disposable income. While geopolitical and global economic uncertainty still exists, we remain cautiously optimistic that positive employment trends, high consumer confidence
26
and generally stable corporate sentiment will continue to drive moderate economic expansion in the U.S. and generate positive lodging demand and RevPAR growth for the industry. However, in light of new supply, RevPAR growth is likely to be moderate. Low unemployment rates can impact the cost of labor through higher wages and benefits, which negatively impact our financial and operating results.
RLJ continues to follow a prudent and disciplined capital allocation strategy. RLJ will continue to look for and weigh all possible investment decisions against the highest and best returns for its shareholders over the long term. RLJ believes that its cash on hand and expected access to capital along with its senior management team's experience, extensive industry relationships and asset management expertise, will enable us to pursue investment opportunities, including without limitation, brand conversions, green initiatives and space configuration opportunities, that generate additional internal and external growth.
Our Customers
Our hotel property-owning subsidiaries (the "Lessors") receive rental income from the property-operating subsidiaries (the "Lessees") under lease agreements. The lease agreements contain a specific base rent amount or a percentage rent amount, which is calculated based on a percentage of room revenues, food and beverage revenues, and other revenues at the hotel properties.
Substantially all of our hotel properties consist of premium-branded, compact full-service hotels. As a result of this property profile, the majority of our hotel properties' customers are transient in nature. Transient business typically represents individual business or leisure travelers. As a result, macroeconomic factors that impact both business travel and leisure travel have an effect on our business. Group business is typically defined as a minimum of 10 guestrooms booked together as part of the same piece of business. Group business may or may not use the meeting space at any given hotel. A number of our hotels are affiliated with brands marketed toward extended-stay customers. Extended-stay customers are generally defined as those staying five nights or longer.
Key Indicators of Financial Performance
We use financial information to evaluate the amount of rental income we receive from the Lessees under our lease agreements. We earn a base rent amount or a percentage rent amount, which is calculated based on a percentage of room revenues, food and beverage revenues, and other revenues at the hotel properties. Industry standard statistical information and comparative data, such as ADR, occupancy, and RevPAR (described further below), are used to measure the operating performance of our hotel properties, including its impact on the amount of rental income recognized from base rent or percentage rent. We also use financial information to evaluate the significance of the property taxes, insurance, and other property-related costs at our hotel properties.
We use a variety of operating, financial and other information to evaluate the operating performance of our business. These key indicators include financial information that was prepared in accordance with accounting principles generally accepted in the United States of America ("GAAP"). In addition, we use other information that may not be financial in nature, including industry standard statistical information and comparative data. We use this information to measure the operating performance of our individual hotels, groups of hotels and/or business as a whole. We also use these metrics to evaluate the hotel properties in our portfolio to determine each hotel's contribution to cash flow and its potential to provide attractive long-term total returns. The key indicators included:
• | ADR — ADR represents the total hotel room revenues divided by the total number of rooms sold in a given period. ADR measures the average room price attained by a hotel and ADR trends provide useful information concerning the pricing environment and the nature of the customer base at a hotel or group of hotels. We use ADR to assess the pricing levels that we are able to generate, as changes in rates have a greater impact on operating margins and profitability than changes in occupancy. |
• | Occupancy — Occupancy represents the total number of hotel rooms sold in a given period divided by the total number of rooms available. Occupancy measures the utilization of our hotel properties' available capacity. We use occupancy to measure demand at a specific hotel or group of hotels in a given period. Additionally, occupancy levels help us determine the achievable ADR levels. |
• | RevPAR — RevPAR is the product of ADR and occupancy. RevPAR does not include non-room revenues, such as food and beverage revenue or other revenue. We use RevPAR to identify trend information with respect to room revenues from comparable hotel properties and to evaluate hotel performance on a regional basis. |
27
ADR, Occupancy and RevPAR are commonly used measures within the lodging industry to evaluate operating performance. RevPAR is an important statistic for monitoring the operating performance at the individual hotel property level and across our entire business. We evaluate individual hotel RevPAR performance on an absolute basis with comparisons to budget and prior periods, as well as on a regional and company-wide basis. ADR and RevPAR include only room revenue.
Principal Factors Affecting Our Results of Operations
The principal factors affecting our operating results include the overall demand for lodging compared to the supply of available hotel rooms and other lodging options, and the ability of our third-party management companies to increase or maintain revenues while controlling expenses.
• | Demand — The demand for lodging, especially business travel, generally fluctuates with the overall economy. Historically, periods of declining demand are followed by extended periods of relatively strong demand, which typically occurs during the growth phase of the lodging cycle. |
• | Supply — The development of new hotels is driven largely by construction costs, the availability of financing, the expected performance of existing hotels and other lodging options. |
We expect that our ADR, Occupancy and RevPAR performance will be impacted by macroeconomic factors such as regional and local employment growth, government spending, personal income and corporate earnings, office vacancy rates, business relocation decisions, airport activity, business and leisure travel demand, new hotel construction and the pricing strategies of our competitors. In addition, our ADR, Occupancy and RevPAR performance are dependent on the continued success of the Hilton, Wyndham and Marriott hotel brands.
• | Revenues — Substantially all of our revenues are derived from the operation of hotels. Specifically, our revenues are comprised of: |
◦ | Room revenue — For the Predecessor period, occupancy and ADR were the major drivers of room revenue. Room revenue accounted for the majority of our total revenues. |
◦ | Food and beverage revenue — For the Predecessor period, occupancy, the nature of the hotel property and the type of customer staying at the hotel were the major drivers of food and beverage revenue (i.e., group business typically generates more food and beverage revenue through catering functions as compared to transient business, which may or may not utilize the hotel's food and beverage outlets). |
◦ | Related party lease revenue — For the Successor period, the lease revenue earned under the TRS Leases is the greater of a base rent amount or a percentage rent amount, which is calculated based on a percentage of room revenue, food and beverage revenue, and other revenue at the hotel properties. |
◦ | Other revenue — For the Predecessor period, occupancy and the nature of the hotel property were the main drivers of other ancillary revenue, such as parking fees, golf, pool and other resort fees, gift shop sales and other guest service fees. Some hotels, due to the limited focus of the services offered and size or space limitations at the hotel, may not have the type of facilities that generate other revenue. |
• | Property Operating Expenses — The components of our property operating expenses are as follows: |
◦ | Room expense — For the Predecessor period, these expenses included housekeeping and front office wages and payroll taxes, reservation systems, room supplies, laundry services and other room-related costs. Like room revenue, occupancy was the major driver of room expense. These costs can increase based on an increase in salaries and wages, as well as the level of service and amenities that are provided at the hotel property. |
◦ | Food and beverage expense —For the Predecessor period, these expenses primarily included food, beverage and labor costs. Occupancy and the type of customer staying at the hotel (i.e., catered functions are generally more profitable than restaurant, bar, and other food and beverage outlets that are located on the hotel property) were the major drivers of food and beverage expense, which correlates closely with food and beverage revenue. |
◦ | Management and franchise fee expense — For the Predecessor period, a base management fee was computed as a percentage of gross hotel revenues. An incentive management fee was typically paid when the hotel's operating income exceeded certain thresholds, and it was generally calculated as a percentage of hotel operating income after we received a priority return on our investment in the hotel. A franchise fee was computed as a percentage of room revenue, plus an additional percentage of room revenue for marketing, central reservation systems and other franchisor costs. For a more in depth discussion of the management and franchise fees, please refer to the |
28
"Our Hotel Properties — Management Agreements" and "Our Hotel Properties — Franchise Agreements" sections.
◦ | Other operating expense — For the Predecessor period, these expenses included labor and other costs associated with the sources of our other revenue, as well as the labor and other costs associated with the administrative departments, sales and marketing, repairs and maintenance, and utility costs at the hotel properties. |
Most categories of variable operating expenses, including labor costs, fluctuate with changes in occupancy. Increases in occupancy are accompanied by increases in most categories of variable operating expenses, while increases in ADR typically only result in increases in certain categories of operating costs and expenses, such as management fees, franchise fees, travel agency commissions, and credit card processing fees, all of which are based on hotel revenues. Therefore, changes in ADR have a more significant impact on operating margins than changes in occupancy.
2019 Significant Activities
Our significant activities reflect RLJ's commitment to creating long-term shareholder value through enhancing its hotel
portfolio's quality, recycling capital and maintaining a prudent capital structure. During the year ended December 31, 2019, the following significant activities took place:
• | In February 2019, we redeemed in full The Knickerbocker preferred equity under the EB-5 Immigrant Investor Program for $45.6 million. |
• | In April 2019, we entered into a new $96.0 million mortgage loan. |
• | In June 2019, we sold the Embassy Suites Myrtle Beach - Oceanfront Resort and the Hilton Myrtle Beach Resort in Myrtle Beach, SC for a total sales price of approximately $147.4 million. |
Results of Operations
At December 31, 2019 and 2018, we owned 28 and 30 hotel properties, respectively. Based on when a hotel property is acquired, sold or closed for renovation, the operating results for certain hotel properties are not comparable for the years ended December 31, 2019 and 2018. For the comparison between the years ended December 31, 2019 and 2018, the non-comparable properties include eight hotels that were sold between January 1, 2018 and December 31, 2019.
For similar operating and financial data and discussion of our results for the year ended December 31, 2018 compared to
our results for the year ended December 31, 2017, refer to Item 7, “Management’s Discussion and Analysis of Financial
Condition and Results of Operations” under Part II of our annual report on Form 10-K for the year ended December 31, 2018,
which was filed with the SEC on March 1, 2019 and is incorporated herein by reference.
29
Comparison of the year ended December 31, 2019 to the year ended December 31, 2018
For the year ended December 31, | ||||||||||||||
2019 | 2018 | $ Change | % Change | |||||||||||
(amounts in thousands) | ||||||||||||||
Revenues | ||||||||||||||
Operating revenues | ||||||||||||||
Related party lease revenue | $ | 196,695 | $ | 217,597 | $ | (20,902 | ) | (9.6 | )% | |||||
Total revenues | 196,695 | 217,597 | (20,902 | ) | (9.6 | )% | ||||||||
Expenses | ||||||||||||||
Operating expenses | ||||||||||||||
Depreciation and amortization | 72,389 | 78,491 | (6,102 | ) | (7.8 | )% | ||||||||
Property tax, insurance and other | 40,965 | 53,754 | (12,789 | ) | (23.8 | )% | ||||||||
General and administrative | 1,289 | 1,056 | 233 | 22.1 | % | |||||||||
Transaction costs | 241 | 2,186 | (1,945 | ) | (89.0 | )% | ||||||||
Total operating expenses | 114,884 | 135,487 | (20,603 | ) | (15.2 | )% | ||||||||
Other income | 59 | 113 | (54 | ) | (47.8 | )% | ||||||||
Interest income | 347 | 311 | 36 | 11.6 | % | |||||||||
Interest expense | (31,930 | ) | (37,930 | ) | 6,000 | (15.8 | )% | |||||||
Related party interest expense | (4,529 | ) | (708 | ) | (3,821 | ) | — | % | ||||||
(Loss) gain on sale of hotel properties, net | (21,451 | ) | 18,423 | (39,874 | ) | — | % | |||||||
Gain on extinguishment of indebtedness, net | — | 11,266 | (11,266 | ) | (100.0 | )% | ||||||||
Income before equity in income from unconsolidated joint ventures | 24,307 | 73,585 | (49,278 | ) | (67.0 | )% | ||||||||
Equity in income from unconsolidated joint ventures | 816 | 1,395 | (579 | ) | (41.5 | )% | ||||||||
Net income and comprehensive income | 25,123 | 74,980 | (49,857 | ) | (66.5 | )% | ||||||||
Net income attributable to noncontrolling interests: | ||||||||||||||
Noncontrolling interest in consolidated joint ventures | (248 | ) | (159 | ) | (89 | ) | 56.0 | % | ||||||
Noncontrolling interest in FelCor LP | (235 | ) | (733 | ) | 498 | (67.9 | )% | |||||||
Preferred distributions - consolidated joint venture | (186 | ) | (1,483 | ) | 1,297 | (87.5 | )% | |||||||
Redemption of preferred equity - consolidated joint venture | (1,153 | ) | — | (1,153 | ) | 100.0 | % | |||||||
Net income and comprehensive income attributable to Rangers | $ | 23,301 | $ | 72,605 | $ | (49,304 | ) | (67.9 | )% | |||||
Revenues
Related Party Lease Revenue
Related party lease revenue for the year ended December 31, 2019 decreased $20.9 million, or 9.6%, to $196.7 million from $217.6 million for the year ended December 31, 2018. The decrease was the result of a $32.5 million decrease in related party lease revenue attributable to the non-comparable properties, partially offset by a $11.6 million increase in related party lease revenue attributable to the comparable properties. The increase in related party lease revenue from the comparable properties was attributable to an increase in percentage lease revenue as a result of higher room revenues, food and
beverage revenues and other revenues of the Lessees. The percentage rent amounts are calculated based on a percentage of
room revenues, food and beverage revenues and other revenues at the hotel properties.
30
Depreciation and Amortization
Depreciation and amortization expense for the year ended December 31, 2019 decreased $6.1 million, or 7.8%, to $72.4 million from $78.5 million for the year ended December 31, 2018. The decrease was the result of a $13.6 million decrease in depreciation and amortization expense attributable to the non-comparable properties, which was partially offset by a $7.5 million increase in depreciation and amortization expense attributable to the comparable properties.
Property Tax, Insurance and Other
Property tax, insurance and other expense for the year ended December 31, 2019 decreased $12.8 million, or 23.8%, to $41.0 million from $53.8 million for the year ended December 31, 2018. The decrease was primarily attributable to an $11.7 million decrease in property tax, insurance and other expense attributable to the non-comparable properties and a $1.1 million decrease in property tax, insurance and other expense attributable to the comparable properties.
General and Administrative
General and administrative expense for the year ended December 31, 2019 increased $0.2 million, or 22.1%, to $1.3 million from $1.1 million for the year ended December 31, 2018. The increase was primarily attributable to $0.9
million in employee tax credits received during the year ended December 31, 2018, partially offset by decreases in other general and administrative expenses of $0.7 million.
Interest Expense
Interest expense for the year ended December 31, 2019 decreased $6.0 million, or 15.8%, to $31.9 million from $37.9 million for the year ended December 31, 2018. The decrease in interest expense was due to a lower average
debt balance during the year ended December 31, 2019. The lower average debt balance was the result of the
redemption of the 5.625% Senior Secured Notes due 2023 (the "Senior Secured Notes") in March 2018, the early payoff of a
mortgage loan that encumbered a hotel property that was sold in July 2018, the repayment of an $85.0 million mortgage loan
that encumbered the hotel property owned by our consolidated joint venture in November 2018 and scheduled mortgage
loans principal payments. These decreases were partially offset by an increase in interest expense resulting from entering into
a new $96.0 million mortgage loan during the year ended December 31, 2019.
Related Party Interest Expense
Related party interest expense for the year ended December 31, 2019 increased $3.8 million to $4.5 million from $0.7 million for the year ended December 31, 2018. In November 2018, our consolidated joint venture entered into an $85.0 million related party mortgage loan with RLJ LP. The hotel property owned by our consolidated joint venture is encumbered by the related party mortgage loan.
Gain on Extinguishment of Indebtedness, net
During the year ended December 31, 2018, we recognized a net gain on extinguishment of indebtedness of approximately $11.3 million. In March 2018, we recognized a $12.9 million gain on extinguishment of indebtedness, which was due to the early redemption of the Senior Secured Notes. In July 2018, we recognized a $1.7 million loss on extinguishment of indebtedness, which was due to the early payoff of a mortgage loan that encumbered a hotel property sold during the year ended December 31, 2018. There was no gain or loss on extinguishment of indebtedness during the year ended December 31, 2019.
31
Liquidity and Capital Resources
Our short-term liquidity requirements consist primarily of the funds necessary to pay for operating expenses and other expenditures directly associated with our hotel properties, including:
• | recurring maintenance and capital expenditures necessary to maintain our hotel properties in accordance with brand standards; |
• | interest expense and scheduled principal payments on outstanding indebtedness; and |
• | corporate and other general and administrative expenses. |
We expect to meet our short-term liquidity requirements generally through the net cash provided by operations, existing cash balances, and proceeds from the sale of hotel properties.
Our long-term liquidity requirements consist primarily of the funds necessary to pay for the costs of redevelopments, renovations, expansions and other capital expenditures that need to be made periodically with respect to our hotel properties, and scheduled debt payments, at maturity or otherwise. We expect to meet our long-term liquidity requirements through various sources of capital, including existing working capital, the net cash provided by operations, long-term mortgage loans and other secured and unsecured borrowings, the proceeds from the sale of hotel properties, and if necessary, related party borrowings from RLJ that would be funded from RLJ's revolving credit facility.
Sources and Uses of Cash
As of December 31, 2019, we had $23.7 million of cash, cash equivalents and restricted cash reserves as compared to $24.6 million at December 31, 2018.
Cash flows from Operating Activities
The net cash flow provided by operating activities totaled $85.0 million and $173.2 million for the years ended December 31, 2019 and 2018, respectively. Our cash flows provided by operating activities generally consist of the cash received from the hotel property lease agreements between the Lessors and the Lessees, which is partially offset by the cash paid for corporate expenses and other working capital changes. Refer to the "Results of Operations" section for further discussion of our operating results for the years ended December 31, 2019 and 2018.
Cash flows from Investing Activities
The net cash flow provided by investing activities totaled $81.8 million for the year ended December 31, 2019 primarily due to $144.4 million of net cash proceeds from the sale of two hotel properties. The net cash flow provided by investing activities was partially offset by $62.0 million in capital improvements and additions to our hotel properties.
The net cash flow provided by investing activities totaled $370.9 million for the year ended December 31, 2018 primarily due to $445.3 million of net cash proceeds from the sale of six hotel properties. The net cash flow provided by investing activities was partially offset by $74.4 million in capital improvements and additions to our hotel properties.
Cash flows from Financing Activities
The net cash flow used in financing activities totaled $167.7 million for the year ended December 31, 2019 primarily due to $404.7 million in distributions to members, a payment of $45.6 million to redeem the preferred equity in a consolidated joint venture, $2.7 million in repayments of borrowings and $1.0 million in deferred financing cost payments. The net cash flow used in financing activities was partially offset by $188.3 million in contributions from members, $96.0 million in new mortgage borrowings and $2.3 million in contributions from consolidated joint venture partners.
The net cash flow used in financing activities totaled $537.6 million for the year ended December 31, 2018 primarily due to $698.8 million in distributions to members, a payment of approximately $539.0 million to redeem the senior secured notes, $113.1 million in repayments of mortgage loans, and $2.7 million in scheduled mortgage loans principal payments. The net cash flow used in financing activities was partially offset by $732.3 million in contributions from members and $85.0 million in related party borrowings.
32
Capital Expenditures and Reserve Funds
We maintain each of our hotel properties in good repair and condition and in conformity with applicable laws and regulations, franchise agreements and management agreements. Generally, the cost of routine improvements and alterations are paid out of the FF&E reserves, which are funded by a portion of each hotel property’s gross revenues. Routine capital expenditures are administered by us with the assistance of the property management companies. However, we have approval rights over the capital expenditures as part of the annual budget process for each of our hotel properties.
From time to time, certain of our hotel properties may undergo renovations as a result of our decision to upgrade portions of the hotels, such as guestrooms, public space, meeting space, and/or restaurants, in order to better compete with other hotels and alternative lodging options in our markets. In addition, upon acquisition of a hotel we often are required to complete a property improvement plan in order to bring the hotel up to the respective franchisor’s standards. If permitted by the terms of the management agreement, funding for a renovation will first come from the FF&E reserves. To the extent that the FF&E reserves are not available or sufficient to cover the cost of the renovation, we will fund all or the remaining portion of the renovation with cash and cash equivalents on hand and/or other sources of available liquidity.
With respect to some of our hotel properties that are operated under franchise agreements with major national hotel brands and for some of our hotel properties subject to first mortgage liens, we are obligated to maintain FF&E reserve accounts for future capital expenditures at these hotels. The amount funded into each of these reserve accounts is generally determined pursuant to the management agreements, franchise agreements and/or mortgage loan documents for each of the respective hotels, and typically ranges between 4.0% and 5.0% of the respective hotel’s total gross revenue. As of December 31, 2019, approximately $2.2 million was held in FF&E reserve accounts for future capital expenditures.
Off-Balance Sheet Arrangements
As of December 31, 2019, we owned 50% interests in joint ventures that owned two hotel properties. RLJ LP owns more than 50% of the operating lessee for one of these hotels and the other hotel is operated without a lease. None of our officers or employees holds an ownership interest in any of these joint ventures or entities.
One of the 50% unconsolidated joint ventures that owns a hotel property has $20.4 million of non-recourse mortgage debt, of which our pro rata portion was $10.2 million, none of which is reflected as a liability on our consolidated balance sheet. Our liabilities with regard to the non-recourse debt and the liabilities of our subsidiaries that are members or partners in joint ventures are generally limited to guaranties of the borrowing entity's obligations to pay for the lender's losses caused by misconduct, fraud or misappropriation of funds by the venture and other typical exceptions from the non-recourse provisions in the mortgages, such as for environmental liabilities. In addition, this joint venture is subject to two ground leases with terms expiring in 2044 and 2094.
The other 50% unconsolidated joint venture that owns a hotel property is subject to a ground lease with an initial term expiring in 2021. After the initial term, the joint venture may extend the ground lease for an additional term of 10 years to 2031.
Contractual Obligations
The following table sets forth our contractual obligations as of December 31, 2019 (in thousands):
Obligations and Commitments | 2020 | 2021 | 2022 | 2023 | 2024 | Thereafter | Total | |||||||||||||||||||||
Senior Notes and interest (1) | $ | 28,493 | $ | 28,493 | $ | 28,493 | $ | 28,493 | $ | 28,493 | $ | 486,760 | $ | 629,225 | ||||||||||||||
Mortgage loans and interest (1) | 10,991 | 11,697 | 119,279 | 3,228 | 97,076 | — | 242,271 | |||||||||||||||||||||
Related party mortgage loan and interest (1) | 4,048 | 4,048 | 4,048 | 88,520 | — | — | 100,664 | |||||||||||||||||||||
Operating lease obligations | 4,884 | 4,909 | 4,968 | 4,990 | 5,011 | 114,008 | 138,770 | |||||||||||||||||||||
$ | 48,416 | $ | 49,147 | $ | 156,788 | $ | 125,231 | $ | 130,580 | $ | 600,768 | $ | 1,110,930 | |||||||||||||||
(1) | Amounts include principal and interest payments. The interest payments are based on the interest rate at December 31, 2019. |
Critical Accounting Policies
The preparation of the financial statements in conformity with GAAP requires management to make estimates and assumptions that affect the reported amount of assets and liabilities at the date of our financial statements and the reported amounts of revenues and expenses during the reporting period. We have provided a summary of our significant accounting policies in the notes to the consolidated financial statements included elsewhere in this filing. We have set forth below those accounting policies that we believe require material subjective or complex judgments and have the most significant impact on our financial condition and results of operations. It is possible that the actual amounts may differ significantly from these estimates and assumptions. We evaluate our estimates, assumptions and judgments on an ongoing basis, based on information that is available to us, our business and industry experience, and various other matters that we believe are reasonable and appropriate for consideration under the circumstances.
As discussed in Note 2 to our accompanying consolidated financial statements, Merger with RLJ, we distributed our equity interests in FelCor TRS to RLJ LP, so certain critical accounting policies that impact the Lessees will not be applicable to the Company.
Investment in Hotel Properties
Our acquisitions generally consist of land, land improvements, buildings, building improvements, FF&E and inventory. We may also acquire intangible assets or liabilities related to in-place leases, management agreements, franchise agreements, and advanced bookings. We allocate the purchase price among the assets acquired and the liabilities assumed based on their respective fair values at the date of acquisition. We determine the fair value by using market data and independent appraisals available to us and making numerous estimates and assumptions. Transaction costs are expensed for acquisitions that are considered business combinations and capitalized for asset acquisitions.
Our investments in hotel properties are carried at cost and are depreciated using the straight-line method over the estimated useful lives of 15 years for land improvements, 15 years for building improvements, 40 years for buildings and three to five years for FF&E. For the Predecessor period, FelCor's investments in hotel properties were carried at cost and depreciated using the straight-line method over the estimated useful lives of 15 to 30 years for improvements, 40 years for buildings and three to 10 years for FF&E. Maintenance and repairs are expensed and major renewals or improvements to the hotel properties are capitalized. Indirect project costs, including interest, salaries and benefits, travel and other related costs that are directly attributable to the development, are also capitalized. Upon the sale or disposition of a hotel property, the asset and related
33
accumulated depreciation accounts are removed and the related gain or loss is included in the gain or loss on sale of hotel properties in the consolidated statements of operations and comprehensive income. A sale or disposition of a hotel property that represents a strategic shift that has or will have a major effect on our operations and financial results is presented as discontinued operations in the consolidated statements of operations and comprehensive income.
In accordance with the guidance on impairment or disposal of long-lived assets, we do not consider the "held for sale" classification on the consolidated balance sheet until it is expected to qualify for recognition as a completed sale within one year and the other requisite criteria for such classification have been met. We do not depreciate assets so long as they are classified as held for sale. Upon designation as held for sale and quarterly thereafter, we review the realizability of the carrying value, less costs to sell, in accordance with the guidance. Any such adjustment to the carrying value is recorded as an impairment loss.
We assess the carrying value of our investments in hotel properties whenever events or changes in circumstances indicate that the carrying amounts may not be recoverable. The recoverability is measured by comparing the carrying amount to the estimated undiscounted future cash flows expected to be generated from the operations and the eventual disposition of the hotel properties over the estimated hold period, which take into account current market conditions and our intent with respect to holding or disposing of the hotel properties. If our analysis indicates that the carrying value is not recoverable on an undiscounted cash flow basis, we will recognize an impairment loss for the amount by which the carrying value exceeds the fair value. The fair value is determined through various valuation techniques, including internally developed discounted cash flow models, comparable market transactions, third-party appraisals, the net sales proceeds from pending offers, or the net sales proceeds from transactions that closed subsequent to the end of the reporting period. The use of projected future cash flows is based on assumptions that are consistent with a market participant’s future expectations for the travel industry and the economy in general, including discount rates, terminal capitalization rates, average daily rates, occupancy rates, operating expenses and capital expenditures, and our intent with respect to holding or disposing of the underlying hotel properties. Fair value may also be based on assumptions including, but not limited to, room revenue multiples and comparable sales adjusted for capital expenditures, if necessary.
Revenue
Our hotel properties are leased through intercompany lease agreements between the Lessors and the Lessees. As a result of the distribution of our equity interests in FelCor TRS to RLJ LP, the Lessees' lease payments are no longer eliminated in consolidation. Base lease revenue is reported as income by the Lessor on a straight-line basis over the lease term. Percentage lease revenue is reported as income by the Lessor over the lease term when it is earned and becomes receivable from the Lessees, according to the provisions of the respective lease agreements.
For the Predecessor period, our revenues consisted of room revenue, food and beverage revenue, and revenue from other hotel operating departments (such as parking fees, golf, pool and other resort fees, gift shop sales and other guest service fees). These revenues were recorded net of any sales and occupancy taxes collected from the hotel guests. All rebates or discounts were recorded as a reduction to revenue, and there are no material contingent obligations with respect to rebates and discounts offered by the hotels. All revenues were recorded on an accrual basis as they were earned. An allowance for doubtful accounts was our best estimate of the amount of probable credit losses in the accounts receivable portfolio and it was recorded as bad debt expense. The allowance for doubtful accounts was calculated as a percentage of the aged accounts receivable. Any cash received prior to a guest's arrival is recorded as an advance deposit from the guest and recognized as revenue at the time of the guest's occupancy at the hotel property.
Item 7A. Quantitative and Qualitative Disclosures About Market Risk.
Market risk includes the risks that arise from changes in interest rates, equity prices and other market changes that affect market sensitive instruments. Our primary market risk exposure is to changes in interest rates on our variable rate debt. As of December 31, 2019, we had approximately $96.0 million of total variable rate debt outstanding (or 12.4% of total indebtedness) with a weighted-average interest rate of 3.36% per annum. As of December 31, 2019, if market interest rates on our variable rate debt were to increase by 1.00%, or 100 basis points, interest expense would decrease future earnings and cash flows by approximately $1.0 million annually. As of December 31, 2019, we also had approximately $85.0 million of total variable rate related party debt outstanding (or 11.0% of total indebtedness) with a weighted-average interest rate of 4.76% per annum. As of December 31, 2019, if market interest rates on our variable rate related party debt were to increase by 1.00%, or 100 basis points, related party interest expense would decrease future earnings and cash flows by approximately $0.9 million annually.
34
Our interest rate risk objectives are to limit the impact of interest rate fluctuations on earnings and cash flows and to lower our overall borrowing costs. To achieve these objectives, we manage our exposure to fluctuations in market interest rates through the use of fixed rate debt instruments to the extent that reasonably favorable rates are obtainable. From time to time, we may enter into derivative financial instruments such as interest rate swaps to mitigate our interest rate risk or to effectively lock the interest rate on a portion of our variable rate debt. We do not enter into derivative or interest rate transactions for speculative purposes.
The following table provides information about our financial instruments that are sensitive to changes in interest rates. For debt obligations outstanding as of December 31, 2019, the following table presents the principal repayments and related weighted-average interest rates by contractual maturity dates (in thousands):
2020 | 2021 | 2022 | 2023 | 2024 | Thereafter | Total | |||||||||||||||||||||
Fixed rate debt (2) | $ | 2,461 | $ | 2,824 | $ | 110,997 | $ | — | $ | — | $ | 474,888 | $ | 591,170 | |||||||||||||
Weighted-average interest rate | 4.95 | % | 4.95 | % | 4.95 | % | — | % | — | % | 6.00 | % | 5.79 | % | |||||||||||||
Variable rate debt (1) | $ | — | $ | — | $ | — | $ | — | $ | 96,000 | $ | — | $ | 96,000 | |||||||||||||
Weighted-average interest rate | — | % | — | % | — | % | — | % | 3.36 | % | — | % | 3.36 | % | |||||||||||||
Variable rate debt - related party debt | $ | — | $ | — | $ | — | $ | 85,000 | $ | — | $ | — | $ | 85,000 | |||||||||||||
Weighted-average interest rate | — | % | — | % | — | % | 4.76 | % | — | % | — | % | 4.76 | % | |||||||||||||
Total | $ | 2,461 | $ | 2,824 | $ | 110,997 | $ | 85,000 | $ | 96,000 | $ | 474,888 | $ | 772,170 | |||||||||||||
(1) | Excludes $0.8 million of net deferred financing costs on the mortgage loan. |
(2) | Excludes a total of $27.4 million related to fair value adjustments on the debt that RLJ pushed down to our consolidated financial statements as a result of the Mergers. |
Our ultimate realized gain or loss with respect to interest rate fluctuations will depend on the exposures that arise during future periods, prevailing interest rates, and our hedging strategies at that time.
Changes in market interest rates on our fixed rate debt impact the fair value of our debt, but such changes have no impact to our consolidated financial statements. As of December 31, 2019, the estimated fair value of our fixed rate debt was $618.9 million, which is based on having the same debt service requirements that could have been borrowed at the date presented, at prevailing current market interest rates. If interest rates were to rise by 1.00%, or 100 basis points, and our fixed rate debt balance remains constant, we expect the fair value of our debt to decrease by approximately $3.2 million.
Item 8. Financial Statements and Supplementary Data
Refer to the Index to Financial Statements on page F-1.
Item 9. Changes in and Disagreements with Accountants on Accounting and Financial Disclosures
None.
Item 9A. Controls and Procedures
Rangers
Evaluation of Disclosure Controls and Procedures
Rangers' management has evaluated, under the supervision and with the participation of the Chief Executive Officer and its Chief Financial Officer, the effectiveness of the disclosure controls and procedures (as defined in Rules 13a-15(e) and 15d-15(e) under the Securities Exchange Act of 1934, as amended, or the Exchange Act) of Rangers, as required by paragraph (b) of Rules 13a-15 and 15d-15 of the Exchange Act. Based on this evaluation, Rangers' Chief Executive Officer and Chief Financial Officer have concluded that as of December 31, 2019, Rangers' disclosure controls and procedures were effective to ensure that information we are required to disclose in reports filed or submitted with the SEC (i) is recorded, processed, summarized and reported within the time periods specified in the SEC's rules and forms, and (ii) is accumulated and communicated to Rangers' management, including Rangers' Chief Executive Officer and Chief Financial Officer, as appropriate to allow timely decisions regarding disclosure.
35
Management's Annual Report on Internal Control over Financial Reporting
Rangers' management is responsible for establishing and maintaining adequate internal control over financial reporting (as defined in Rule 13a-15(f) and 15d-15(f) of the Exchange Act). Rangers' internal control over financial reporting is a process designed to provide reasonable assurance regarding the reliability of financial reporting and the preparation of financial statements for external purposes in accordance with accounting principles generally accepted in the United States of America.
Because of its inherent limitations, internal control over financial reporting may not prevent or detect misstatements. Also, projections of any evaluations of effectiveness to future periods are subject to the risk that controls may become inadequate because of changes in conditions, or that the degree of compliance with the policies or procedures may deteriorate.
Rangers' management assessed the effectiveness of its internal control over financial reporting as of December 31, 2019. In making this assessment, management used the criteria set forth by the Committee of Sponsoring Organizations of the Treadway Commission ("COSO") in Internal Control - Integrated Framework (2013). Based on this assessment, Rangers' management has concluded that, as of December 31, 2019, its internal control over financial reporting is effective based on those criteria.
This Annual Report does not include an attestation report of our independent registered public accounting firm regarding internal control over financial reporting. Management's report was not subject to attestation by our independent registered public accounting firm pursuant to SEC rules that permit us to provide only management's report in this Annual Report.
Changes in Internal Control over Financial Reporting
There have been no changes in Rangers' internal control over financial reporting (as defined in Rule 13a-15 and 15d-15 of the Exchange Act) during the period ended December 31, 2019 that have materially affected, or are reasonably likely to materially affect, its internal control over financial reporting.
FelCor LP
Evaluation of Disclosure Controls and Procedures
The management of Rangers GP, the sole general partner of FelCor LP, has evaluated, under the supervision and with the participation of its Chief Executive Officer and its Chief Financial Officer, the effectiveness of the disclosure controls and procedures (as defined in Rules 13a-15(e) and 15d-15(e) under the Securities Exchange Act of 1934, as amended, or the Exchange Act) of FelCor LP, as required by paragraph (b) of Rules 13a-15 and 15d-15 of the Exchange Act. Based on this evaluation, Rangers GP's Chief Executive Officer and Chief Financial Officer have concluded that as of December 31, 2019, FelCor LP's disclosure controls and procedures were effective to ensure that information we are required to disclose in reports filed or submitted with the SEC (i) is recorded, processed, summarized and reported within the time periods specified in the SEC's rules and forms, and (ii) is accumulated and communicated to Rangers GP's management, including its Chief Executive Officer and Chief Financial Officer, as appropriate to allow timely decisions regarding disclosure.
Management's Annual Report on Internal Control over Financial Reporting
The management of Rangers GP, the sole general partner of FelCor LP, is responsible for establishing and maintaining adequate internal control over financial reporting (as defined in Rule 13a-15(f) and 15d-15(f) of the Exchange Act). FelCor LP's internal control over financial reporting is a process designed to provide reasonable assurance regarding the reliability of financial reporting and the preparation of financial statements for external purposes in accordance with accounting principles generally accepted in the United States of America.
Because of its inherent limitations, internal control over financial reporting may not prevent or detect misstatements. Also, projections of any evaluations of effectiveness to future periods are subject to the risk that controls may become inadequate because of changes in conditions, or that the degree of compliance with the policies or procedures may deteriorate.
The management of Rangers GP, the sole general partner of FelCor LP, assessed the effectiveness of FelCor LP's internal control over financial reporting as of December 31, 2019. In making this assessment, Rangers GP's management used the criteria set forth by the Committee of Sponsoring Organizations of the Treadway Commission ("COSO") in Internal Control - Integrated Framework (2013). Based on this assessment, Rangers GP's management has concluded that, as of December 31, 2019, FelCor LP's internal control over financial reporting is effective based on those criteria.
36
This Annual Report does not include an attestation report of our independent registered public accounting firm regarding internal control over financial reporting. Management's report was not subject to attestation by our independent registered public accounting firm pursuant to SEC rules that permit us to provide only management's report in this Annual Report.
Changes in Internal Control over Financial Reporting
There have been no changes in FelCor LP's internal control over financial reporting (as defined in Rule 13a-15 and 15d-15 of the Exchange Act) during the period ended December 31, 2019 that have materially affected, or are reasonably likely to materially affect, its internal control over financial reporting.
Item 9B. Other Information
None.
PART III
Item 10. Directors, Executive Officers and Corporate Governance
Directors
Not applicable.
Executive Officers
The following table sets forth certain information concerning the executive officers of Rangers and Rangers GP, the sole general partner of FelCor LP:
Name | Age (1) | Title | ||
Leslie D. Hale | 47 | President and Chief Executive Officer | ||
Sean M. Mahoney | 48 | Executive Vice President and Chief Financial Officer | ||
(1) | Age as of February 26, 2020. |
Leslie D. Hale has served as the President and Chief Executive Officer of Rangers and Rangers GP since August 22, 2018. She has served as the President and Chief Executive Officer of RLJ since August 22, 2018. Prior to her present roles, Ms. Hale served as the Executive Vice President and Chief Financial Officer of Rangers and Rangers GP since August 31, 2017 and as the Chief Operating Officer, Chief Financial Officer and Executive Vice President of RLJ since July 2016. Ms. Hale previously served as Chief Financial Officer, Treasurer and Executive Vice President of RLJ since February 2013. She previously served as chief financial officer and senior vice president of real estate and finance of RLJ Development from 2007 until the formation of the Company, when she became the Company’s chief financial officer, treasurer and senior vice president. She previously was the vice president of real estate and finance for RLJ Development from 2006 to September 2007 and director of real estate and finance from 2005 until her 2006 promotion. In these positions, Ms. Hale was responsible for the finance, tax, treasury and portfolio management functions as well as executing all real estate transactions. From 2002 to 2005, she held several positions within the global financial services division of General Electric Corp., including as a vice president in the business development group of GE Commercial Finance, and as an associate director in the GE Real Estate strategic capital group. Prior to that, she was an investment banker at Goldman, Sachs & Co. Ms. Hale received her Bachelor of Business Administration degree from Howard University and her Master of Business Administration degree from Harvard Business School. Ms. Hale serves on the board of directors of Macy’s Inc. (NYSE: M) and is a member of the Howard University Board of Trustees.
Sean M. Mahoney has served as the Executive Vice President and Chief Financial Officer of Rangers and Rangers GP since August 22, 2018. He has also served as the Executive Vice President and Chief Financial Officer of RLJ since August 1, 2018. Mr. Mahoney previously served as executive vice president, chief financial officer and treasurer of DiamondRock Hospitality Company from September 2008 to March 2018 and previously served as senior vice president, chief accounting officer and corporate controller from August 2004 to September 2008. Earlier in his career, he worked in the audit practices of Arthur Andersen, KPMG and Ernst & Young. Mr. Mahoney received a B.S. in accounting from Syracuse University in 1993.
Code of Ethics
37
We do not have our own code of ethics, as we are wholly-owned subsidiaries of RLJ LP. Instead, our executive officers and employees adhere to RLJ’s Code of Business Conduct and Ethics. For more information on RLJ’s Code of Business Conduct and Ethics, please refer to RLJ’s definitive Proxy Statement for its 2020 Annual Meeting of Shareholders.
Corporate Governance
Not applicable.
Item 11. Executive Compensation
Our executive officers are not compensated for their roles at Rangers and Rangers GP. RLJ provides compensation to our executive officers for their roles at RLJ and such compensation is governed by the policies and principals of the RLJ compensation program established by the Compensation Committee of the RLJ Board of Trustees. For more information on RLJ’s executive compensation, please refer to RLJ’s definitive Proxy Statement for its 2020 Annual Meeting of Shareholders.
Item 12. Security Ownership of Certain Beneficial Owners and Management and Related Shareholder Matters
Securities Authorized for Issuance Under Equity Compensation Plans
None.
Security Ownership of Certain Beneficial Owners and Management
Since our August 31, 2017 acquisition by RLJ, 100% of the ownership interests of Rangers and FelCor LP are held by RLJ LP (either directly or indirectly).
Item 13. Certain Relationships and Related Transactions and Director Independence
Related Party Transactions
Our hotel properties are leased by the Lessors to the Lessees. Therefore, the TRS Leases are between related parties. For the years ended December 31, 2019 and 2018, the revenue earned under the TRS Leases was $196.7 million and $217.6 million, respectively. The revenue earned under the TRS Leases for the Successor period of September 1, 2017 through December 31, 2017 was $81.3 million. This revenue is based on a specific base rent amount or a percentage rent amount, which is calculated based on a percentage of room revenue, food and beverage revenue and other revenue at the hotel properties.
In November 2018, the Company's consolidated joint venture entered into an $85.0 million related party loan with RLJ LP, which is included in related party debt in the accompanying consolidated balance sheets. The related party mortgage loan has an interest rate of LIBOR + 3.00% and a maturity date of November 9, 2023. The related party loan requires payments of interest only through maturity. The hotel property owned by the Company's consolidated joint venture is encumbered by the related party loan. For the years ended December 31, 2019 and 2018, the Company recognized $4.5 million and $0.7 million of interest expense, respectively, related to its related party loan with RLJ LP.
Director Independence
Not applicable.
Item 14. Principal Accountant Fees and Services
Our consolidated financial statements for the years ended December 31, 2019 and 2018 have been audited by PricewaterhouseCoopers LLP, which served as our independent registered public accounting firm for these years. The fees billed by PricewaterhouseCoopers LLP for the services performed for the year ended December 31, 2019 and 2018 are included as part of the fees billed by PricewaterhouseCoopers LLP for the audit of RLJ’s consolidated financial statements for the years ended December 31, 2019 and 2018, which are included in RLJ’s definitive Proxy Statements for its 2020 and 2019 Annual Meetings of Shareholders.
PART IV
38
Item 15. Exhibits and Financial Statement Schedules
The following is a list of documents filed as a part of this report:
(1) Financial Statements — Refer to the Index to Financial Statements on page F-1
(2) Financial Statement Schedules — The following financial statement schedule is included herein on pages F-61 through F-63:
Schedule III — Real Estate and Accumulated Depreciation for Rangers Sub I, LLC and FelCor Lodging Limited Partnership
All other schedules for which a provision is made in Regulation S-X are either not required to be included herein under the related instructions, are inapplicable, or the related information is included in the footnotes to the applicable financial statement and, therefore, have been omitted.
(3) Exhibits — The exhibits required to be filed by Item 601 of Regulation S-K are noted below:
39
Exhibit Index
Exhibit Number | Description of Exhibit | |||
3.1 | ||||
3.2 | ||||
3.3 | ||||
3.4 | ||||
4.1 | ||||
4.2 | ||||
4.3 | ||||
21.1* | ||||
31.1* | ||||
31.2* | ||||
31.3* | ||||
31.4* | ||||
32.1* | ||||
32.2* | ||||
101.INS | XBRL Instance Document | Submitted electronically with this report | ||
101.SCH | XBRL Taxonomy Extension Schema Document | Submitted electronically with this report | ||
101.CAL | XBRL Taxonomy Calculation Linkbase Document | Submitted electronically with this report | ||
101.DEF | XBRL Taxonomy Extension Definition Linkbase Document | Submitted electronically with this report | ||
101.LAB | XBRL Taxonomy Label Linkbase Document | Submitted electronically with this report | ||
101.PRE | XBRL Taxonomy Presentation Linkbase Document | Submitted electronically with this report | ||
*Filed herewith
40
Item 16. Form 10-K Summary
Not applicable.
41
SIGNATURES
Pursuant to the requirements of Section 13 or 15(d) of the Securities Exchange Act of 1934, as amended, the registrant has duly caused this report to be signed on its behalf by the undersigned, thereunto duly authorized.
RANGERS SUB I, LLC | |
Dated: February 26, 2020 | /s/ LESLIE D. HALE |
Leslie D. Hale | |
President and Chief Executive Officer | |
Dated: February 26, 2020 | /s/ SEAN M. MAHONEY |
Sean M. Mahoney | |
Executive Vice President and Chief Financial Officer | |
(Principal Financial Officer) | |
Dated: February 26, 2020 | /s/ CHRISTOPHER A. GORMSEN |
Christopher A. Gormsen | |
Senior Vice President and Chief Accounting Officer | |
(Principal Accounting Officer) | |
FELCOR LODGING LIMITED PARTNERSHIP | |
By: Rangers General Partner, LLC, its General Partner | |
Dated: February 26, 2020 | /s/ LESLIE D. HALE |
Leslie D. Hale | |
President and Chief Executive Officer | |
Dated: February 26, 2020 | /s/ SEAN M. MAHONEY |
Sean M. Mahoney | |
Executive Vice President and Chief Financial Officer | |
(Principal Financial Officer) | |
Dated: February 26, 2020 | /s/ CHRISTOPHER A. GORMSEN |
Christopher A. Gormsen | |
Senior Vice President and Chief Accounting Officer | |
(Principal Accounting Officer) | |
42
Item 8. Financial Statements
INDEX TO FINANCIAL STATEMENTS
Rangers Sub I, LLC | |
Consolidated Financial Statements | |
FelCor Lodging Limited Partnership | |
Consolidated Financial Statements | |
F-1
REPORT OF INDEPENDENT REGISTERED PUBLIC ACCOUNTING FIRM
To the Member of Rangers Sub I, LLC
Opinion on the Financial Statements
We have audited the accompanying consolidated balance sheets of Rangers Sub I, LLC and its subsidiaries (the "Company") (Successor), a subsidiary of RLJ Lodging Trust, as of December 31, 2019 and 2018, and the related consolidated statements of operations and comprehensive income (loss), of changes in equity and of cash flows for the years ended December 31, 2019 and 2018, and for the period from September 1, 2017 through December 31, 2017, including the related notes and financial statement schedule listed in the accompanying index (collectively referred to as the “consolidated financial statements”). In our opinion, the consolidated financial statements present fairly, in all material respects, the financial position of the Company as of December 31, 2019 and 2018, and the results of its operations and its cash flows for the years ended December 31, 2019 and 2018, and for the period from September 1, 2017 through December 31, 2017 in conformity with accounting principles generally accepted in the United States of America.
Basis for Opinion
These consolidated financial statements are the responsibility of the Company's management. Our responsibility is to express an opinion on the Company’s consolidated financial statements based on our audits. We are a public accounting firm registered with the Public Company Accounting Oversight Board (United States) (PCAOB) and are required to be independent with respect to the Company in accordance with the U.S. federal securities laws and the applicable rules and regulations of the Securities and Exchange Commission and the PCAOB.
We conducted our audits of these consolidated financial statements in accordance with the standards of the PCAOB. Those standards require that we plan and perform the audit to obtain reasonable assurance about whether the consolidated financial statements are free of material misstatement, whether due to error or fraud. The Company is not required to have, nor were we engaged to perform, an audit of its internal control over financial reporting. As part of our audits we are required to obtain an understanding of internal control over financial reporting but not for the purpose of expressing an opinion on the effectiveness of the Company's internal control over financial reporting. Accordingly, we express no such opinion.
Our audits included performing procedures to assess the risks of material misstatement of the consolidated financial statements, whether due to error or fraud, and performing procedures that respond to those risks. Such procedures included examining, on a test basis, evidence regarding the amounts and disclosures in the consolidated financial statements. Our audits also included evaluating the accounting principles used and significant estimates made by management, as well as evaluating the overall presentation of the consolidated financial statements. We believe that our audits provide a reasonable basis for our opinion.
/s/ PricewaterhouseCoopers LLP
McLean, Virginia
February 26, 2020
We have served as the Company's auditor since 1994.
F-2
REPORT OF INDEPENDENT REGISTERED PUBLIC ACCOUNTING FIRM
To the Partners of FelCor Lodging Limited Partnership
Opinion on the Financial Statements
We have audited the accompanying consolidated balance sheets of FelCor Lodging Limited Partnership and its subsidiaries (the "Company") (Successor), a subsidiary of RLJ Lodging Trust, as of December 31, 2019 and 2018, and the related consolidated statements of operations and comprehensive income (loss), of partners' capital and of cash flows for the years ended December 31, 2019 and 2018, and for the period from September 1, 2017 through December 31, 2017, including the related notes and financial statement schedule listed in the accompanying index (collectively referred to as the “consolidated financial statements”). In our opinion, the consolidated financial statements present fairly, in all material respects, the financial position of the Company as of December 31, 2019 and 2018, and the results of its operations and its cash flows for the years ended December 31, 2019 and 2018, and for the period from September 1, 2017 through December 31, 2017 in conformity with accounting principles generally accepted in the United States of America.
Basis for Opinion
These consolidated financial statements are the responsibility of the Company's management. Our responsibility is to express an opinion on the Company’s consolidated financial statements based on our audits. We are a public accounting firm registered with the Public Company Accounting Oversight Board (United States) (PCAOB) and are required to be independent with respect to the Company in accordance with the U.S. federal securities laws and the applicable rules and regulations of the Securities and Exchange Commission and the PCAOB.
We conducted our audits of these consolidated financial statements in accordance with the standards of the PCAOB. Those standards require that we plan and perform the audit to obtain reasonable assurance about whether the consolidated financial statements are free of material misstatement, whether due to error or fraud. The Company is not required to have, nor were we engaged to perform, an audit of its internal control over financial reporting. As part of our audits we are required to obtain an understanding of internal control over financial reporting but not for the purpose of expressing an opinion on the effectiveness of the Company's internal control over financial reporting. Accordingly, we express no such opinion.
Our audits included performing procedures to assess the risks of material misstatement of the consolidated financial statements, whether due to error or fraud, and performing procedures that respond to those risks. Such procedures included examining, on a test basis, evidence regarding the amounts and disclosures in the consolidated financial statements. Our audits also included evaluating the accounting principles used and significant estimates made by management, as well as evaluating the overall presentation of the consolidated financial statements. We believe that our audits provide a reasonable basis for our opinion.
/s/ PricewaterhouseCoopers LLP
McLean, Virginia
February 26, 2020
We have served as the Company's auditor since 2011.
F-3
REPORT OF INDEPENDENT REGISTERED PUBLIC ACCOUNTING FIRM
To the Member of Rangers Sub I, LLC
In our opinion, the accompanying consolidated statements of operations and comprehensive income (loss), of changes in equity and of cash flows for the period from January 1, 2017 through August 31, 2017 present fairly, in all material respects, the results of operations and cash flows of Rangers Sub I, LLC and its subsidiaries (Predecessor) for the period from January 1, 2017 through August 31, 2017 in conformity with accounting principles generally accepted in the United States of America. In addition, in our opinion, the financial statement schedule reconciliation of land and buildings and improvements and the financial statement schedule reconciliation of accumulated depreciation (collectively referred to as the “financial statement schedule reconciliations”) for the period from January 1, 2017 through August 31, 2017 present fairly, in all material respects, the information set forth therein when read in conjunction with the related consolidated financial statements. These financial statements and financial statement schedule reconciliations are the responsibility of the Company's management. Our responsibility is to express an opinion on these financial statements and financial statement schedule reconciliations based on our audit. We conducted our audit of these financial statements in accordance with the standards of the Public Company Accounting Oversight Board (United States). Those standards require that we plan and perform the audit to obtain reasonable assurance about whether the financial statements are free of material misstatement. An audit includes examining, on a test basis, evidence supporting the amounts and disclosures in the financial statements, assessing the accounting principles used and significant estimates made by management, and evaluating the overall financial statement presentation. We believe that our audit provides a reasonable basis for our opinion.
/s/ PricewaterhouseCoopers LLP
Dallas, Texas
March 2, 2018
F-4
REPORT OF INDEPENDENT REGISTERED PUBLIC ACCOUNTING FIRM
To the Partners of FelCor Lodging Limited Partnership
In our opinion, the accompanying consolidated statements of operations and comprehensive income (loss), of partners’ capital and of cash flows for the period from January 1, 2017 through August 31, 2017 present fairly, in all material respects, the results of operations and cash flows of FelCor Lodging Limited Partnership and its subsidiaries (Predecessor) for the period from January 1, 2017 through August 31, 2017 in conformity with accounting principles generally accepted in the United States of America. In addition, in our opinion, the financial statement schedule reconciliation of land and buildings and improvements and the financial statement schedule reconciliation of accumulated depreciation (collectively referred to as the “financial statement schedule reconciliations”) for the period from January 1, 2017 through August 31, 2017 present fairly, in all material respects, the information set forth therein when read in conjunction with the related consolidated financial statements. These financial statements and financial statement schedule reconciliations are the responsibility of the Company's management. Our responsibility is to express an opinion on these financial statements and financial statement schedule reconciliations based on our audit. We conducted our audit of these financial statements in accordance with the standards of the Public Company Accounting Oversight Board (United States). Those standards require that we plan and perform the audit to obtain reasonable assurance about whether the financial statements are free of material misstatement. An audit includes examining, on a test basis, evidence supporting the amounts and disclosures in the financial statements, assessing the accounting principles used and significant estimates made by management, and evaluating the overall financial statement presentation. We believe that our audit provides a reasonable basis for our opinion.
/s/ PricewaterhouseCoopers LLP
Dallas, Texas
March 2, 2018
F-5
Rangers Sub I, LLC
Consolidated Balance Sheets
(Amounts in thousands)
December 31, | |||||||
2019 | 2018 | ||||||
Assets | |||||||
Investment in hotel properties, net | $ | 1,946,826 | $ | 2,123,423 | |||
Investment in unconsolidated joint ventures | 15,171 | 15,716 | |||||
Cash and cash equivalents | 19,572 | 21,351 | |||||
Restricted cash reserves | 4,147 | 3,211 | |||||
Related party receivable | 49,181 | 16,501 | |||||
Lease right-of-use assets | 80,635 | — | |||||
Intangible assets, net | — | 46,260 | |||||
Prepaid expense and other assets | 7,543 | 6,552 | |||||
Related party prepaid interest | — | 180 | |||||
Total assets | $ | 2,123,075 | $ | 2,233,194 | |||
Liabilities and Equity | |||||||
Debt, net | $ | 713,727 | $ | 626,628 | |||
Related party debt | 85,000 | 85,000 | |||||
Accounts payable and other liabilities | 32,676 | 43,389 | |||||
Lease liabilities | 48,200 | — | |||||
Accrued interest | 2,463 | 2,463 | |||||
Related party accrued interest | 190 | — | |||||
Distributions payable | — | 126 | |||||
Total liabilities | 882,256 | 757,606 | |||||
Equity | |||||||
Member's/Shareholders' equity: | |||||||
Member's equity | 1,119,913 | 1,334,154 | |||||
Retained earnings | 99,996 | 76,695 | |||||
Total member's/shareholders’ equity | 1,219,909 | 1,410,849 | |||||
Noncontrolling interest: | |||||||
Noncontrolling interest in consolidated joint ventures | 8,588 | 6,059 | |||||
Noncontrolling interest in FelCor LP | 12,322 | 14,250 | |||||
Total noncontrolling interest | 20,910 | 20,309 | |||||
Preferred equity in a consolidated joint venture, liquidation value of $45,544 at December 31, 2018 | — | 44,430 | |||||
Total equity | 1,240,819 | 1,475,588 | |||||
Total liabilities and equity | $ | 2,123,075 | $ | 2,233,194 | |||
The accompanying notes are an integral part of these consolidated financial statements.
F-6
Rangers Sub I, LLC
Consolidated Statements of Operations and Comprehensive Income (Loss)
(Amounts in thousands, except share and per share data)
Successor | Predecessor | ||||||||||||||||
For the year ended December 31, | September 1 through December 31, | January 1 through August 31, | |||||||||||||||
2019 | 2018 | 2017 | 2017 | ||||||||||||||
Revenues | |||||||||||||||||
Operating revenues | |||||||||||||||||
Room revenue | $ | — | $ | — | $ | — | $ | 425,682 | |||||||||
Food and beverage revenue | — | — | — | 90,572 | |||||||||||||
Related party lease revenue | 196,695 | 217,597 | 81,259 | — | |||||||||||||
Other revenue | — | — | — | 35,261 | |||||||||||||
Total revenues | 196,695 | 217,597 | 81,259 | 551,515 | |||||||||||||
Expenses | |||||||||||||||||
Operating expenses | |||||||||||||||||
Room expense | — | — | — | 112,813 | |||||||||||||
Food and beverage expense | — | — | — | 71,828 | |||||||||||||
Management and franchise fee expense | — | — | — | 19,901 | |||||||||||||
Other operating expense | — | — | — | 147,827 | |||||||||||||
Total property operating expenses | — | — | — | 352,369 | |||||||||||||
Depreciation and amortization | 72,389 | 78,491 | 28,965 | 73,065 | |||||||||||||
Impairment loss | — | — | — | 35,109 | |||||||||||||
Property tax, insurance and other | 40,965 | 53,754 | 17,062 | 44,278 | |||||||||||||
General and administrative | 1,289 | 1,056 | 1,019 | 16,006 | |||||||||||||
Transaction costs | 241 | 2,186 | 4,193 | 68,248 | |||||||||||||
Total operating expenses | 114,884 | 135,487 | 51,239 | 589,075 | |||||||||||||
Other income | 59 | 113 | — | 100 | |||||||||||||
Interest income | 347 | 311 | 10 | 126 | |||||||||||||
Interest expense | (31,930 | ) | (37,930 | ) | (19,270 | ) | (51,690 | ) | |||||||||
Related party interest expense | (4,529 | ) | (708 | ) | — | — | |||||||||||
(Loss) gain on sale of hotel properties, net | (21,451 | ) | 18,423 | (6,637 | ) | (1,764 | ) | ||||||||||
Gain (loss) on extinguishment of indebtedness, net | — | 11,266 | — | (3,278 | ) | ||||||||||||
Income (loss) before equity in income from unconsolidated joint ventures | 24,307 | 73,585 | 4,123 | (94,066 | ) | ||||||||||||
Equity in income from unconsolidated joint ventures | 816 | 1,395 | 661 | 1,074 | |||||||||||||
Income (loss) before income tax expense | 25,123 | 74,980 | 4,784 | (92,992 | ) | ||||||||||||
Income tax expense | — | — | — | (499 | ) | ||||||||||||
Income (loss) from continuing operations | 25,123 | 74,980 | 4,784 | (93,491 | ) | ||||||||||||
Loss from discontinued operations | — | — | — | (3,415 | ) | ||||||||||||
Net income (loss) and comprehensive income (loss) | 25,123 | 74,980 | 4,784 | (96,906 | ) | ||||||||||||
Net (income) loss attributable to noncontrolling interests: | |||||||||||||||||
Noncontrolling interest in consolidated joint ventures | (248 | ) | (159 | ) | (157 | ) | 545 | ||||||||||
Noncontrolling interest in FelCor LP | (235 | ) | (733 | ) | (41 | ) | 495 | ||||||||||
Preferred distributions - consolidated joint venture | (186 | ) | (1,483 | ) | (496 | ) | (979 | ) | |||||||||
Redemption of preferred equity - consolidated joint venture | (1,153 | ) | — | — | — | ||||||||||||
Net income (loss) and comprehensive income (loss) attributable to Rangers | 23,301 | 72,605 | 4,090 | (96,845 | ) | ||||||||||||
F-7
Preferred dividends | — | — | — | (16,744 | ) | ||||||||||||
Net income (loss) and comprehensive income (loss) attributable to ownership interests/common shareholders | $ | 23,301 | $ | 72,605 | $ | 4,090 | $ | (113,589 | ) | ||||||||
Basic and diluted per common share data: | |||||||||||||||||
Loss from continuing operations per share attributable to common shareholders | $ | (0.80 | ) | ||||||||||||||
Net loss per share attributable to common shareholders | $ | (0.83 | ) | ||||||||||||||
Weighted-average number of common shares | 137,331,743 | ||||||||||||||||
The accompanying notes are an integral part of these consolidated financial statements.
F-8
Rangers Sub I, LLC
Consolidated Statements of Changes in Equity
(Amounts in thousands)
Member's Equity | Noncontrolling Interest | ||||||||||||||||||||||
Equity | Retained Earnings | FelCor LP | Consolidated Joint Ventures | Preferred Equity in a Consolidated Joint Venture | Total Equity | ||||||||||||||||||
Balance at December 31, 2018 | $ | 1,334,154 | $ | 76,695 | $ | 14,250 | $ | 6,059 | $ | 44,430 | $ | 1,475,588 | |||||||||||
Net income and comprehensive income | — | 23,301 | 235 | 248 | 1,339 | 25,123 | |||||||||||||||||
Contributions | 186,435 | — | 1,883 | — | — | 188,318 | |||||||||||||||||
Distributions | (400,676 | ) | — | (4,046 | ) | — | — | (404,722 | ) | ||||||||||||||
Preferred distributions - consolidated joint venture | — | — | — | — | (186 | ) | (186 | ) | |||||||||||||||
Redemption of preferred equity - consolidated joint venture | — | — | — | — | (45,583 | ) | (45,583 | ) | |||||||||||||||
Contributions from consolidated joint venture partners | — | — | — | 2,281 | — | 2,281 | |||||||||||||||||
Balance at December 31, 2019 | $ | 1,119,913 | $ | 99,996 | $ | 12,322 | $ | 8,588 | $ | — | $ | 1,240,819 | |||||||||||
The accompanying notes are an integral part of these consolidated financial statements.
F-9
Rangers Sub I, LLC
Consolidated Statements of Changes in Equity
(Amounts in thousands, except share data)
Member's Equity | Noncontrolling Interest | |||||||||||||||||
Equity | Retained Earnings | FelCor LP | Consolidated Joint Ventures | Preferred Equity in a Consolidated Joint Venture | Total Equity | |||||||||||||
Balance at December 31, 2017 | 1,302,739 | 4,090 | 13,200 | 5,900 | 44,430 | $ | 1,370,359 | |||||||||||
Net income and comprehensive income | — | 72,605 | 733 | 159 | 1,483 | $ | 74,980 | |||||||||||
Contributions | 724,997 | — | 7,322 | — | — | $ | 732,319 | |||||||||||
Distributions | (693,582 | ) | — | (7,005 | ) | — | — | $ | (700,587 | ) | ||||||||
Preferred distributions- consolidated joint venture | — | — | — | — | (1,483 | ) | $ | (1,483 | ) | |||||||||
Balance at December 31, 2018 | 1,334,154 | 76,695 | 14,250 | 6,059 | 44,430 | 1,475,588 | ||||||||||||
The accompanying notes are an integral part of these consolidated financial statements.
F-10
Rangers Sub I, LLC
Consolidated Statements of Changes in Equity
(Amounts in thousands, except share data)
Shareholders’ Equity | Noncontrolling Interest | ||||||||||||||||||||||||||||||||
Preferred Stock | Common Stock | ||||||||||||||||||||||||||||||||
Shares | Amount | Shares | Par Value | Additional Paid-in Capital | Accumulated Deficit | Consolidated Joint Ventures | Preferred Equity in a Consolidated Joint Venture | Total Equity | |||||||||||||||||||||||||
Predecessor - Balance at December 31, 2016 | 12,879,475 | $ | 309,337 | 137,990,097 | $ | 1,380 | $ | 2,576,988 | $ | (2,706,408 | ) | $ | 7,503 | $ | 43,783 | $ | 232,583 | ||||||||||||||||
Net (loss) income and comprehensive (loss) income | — | — | — | — | — | (96,845 | ) | (545 | ) | 979 | (96,411 | ) | |||||||||||||||||||||
Issuance of stock awards | — | — | 1,998,497 | 20 | 839 | — | — | — | 859 | ||||||||||||||||||||||||
Amortization of share-based compensation | — | — | — | — | 11,946 | — | — | — | 11,946 | ||||||||||||||||||||||||
Shares acquired to satisfy minimum required federal and state tax withholding on vesting restricted stock | — | — | (893,309 | ) | (9 | ) | — | (6,425 | ) | — | — | (6,434 | ) | ||||||||||||||||||||
Allocation to the redeemable noncontrolling interests in FelCor LP | — | — | — | — | (196 | ) | — | — | — | (196 | ) | ||||||||||||||||||||||
Contributions from consolidated joint venture partners | — | — | — | — | — | — | 333 | — | 333 | ||||||||||||||||||||||||
Distributions to consolidated joint venture partners | — | — | — | — | — | — | (150 | ) | — | (150 | ) | ||||||||||||||||||||||
Distributions on Series A preferred shares | — | — | — | — | — | (16,744 | ) | — | — | (16,744 | ) | ||||||||||||||||||||||
Distributions on common shares and units | — | — | — | — | — | (22,468 | ) | — | — | (22,468 | ) | ||||||||||||||||||||||
Preferred distributions in a consolidated joint venture | — | — | — | — | — | — | — | (979 | ) | (979 | ) | ||||||||||||||||||||||
Issuance of preferred equity in a consolidated joint venture | — | — | — | — | — | — | — | 647 | 647 | ||||||||||||||||||||||||
Predecessor - Balance at August 31, 2017 | 12,879,475 | $ | 309,337 | 139,095,285 | $ | 1,391 | $ | 2,589,577 | $ | (2,848,890 | ) | $ | 7,141 | $ | 44,430 | $ | 102,986 | ||||||||||||||||
The accompanying notes are an integral part of these consolidated financial statements.
F-11
Rangers Sub I, LLC
Consolidated Statements of Changes in Equity
(Amounts in thousands)
Member's Equity | Noncontrolling Interest | ||||||||||||||||||||||
Equity | Retained Earnings | FelCor LP | Consolidated Joint Ventures | Preferred Equity in a Consolidated Joint Venture | Total Equity | ||||||||||||||||||
Successor - Balance at September 1, 2017 | $ | 1,462,054 | $ | — | $ | 14,768 | $ | 5,493 | $ | 44,430 | $ | 1,526,745 | |||||||||||
Distribution of FelCor TRS | (102,350 | ) | — | (1,034 | ) | 250 | — | (103,134 | ) | ||||||||||||||
Net income and comprehensive income | — | 4,090 | 41 | 157 | 496 | 4,784 | |||||||||||||||||
Contributions | 128,775 | — | 1,301 | — | — | 130,076 | |||||||||||||||||
Distributions | (185,740 | ) | — | (1,876 | ) | — | — | (187,616 | ) | ||||||||||||||
Preferred distributions - consolidated joint venture | — | — | — | — | (496 | ) | (496 | ) | |||||||||||||||
Successor - Balance at December 31, 2017 | $ | 1,302,739 | $ | 4,090 | $ | 13,200 | $ | 5,900 | $ | 44,430 | $ | 1,370,359 | |||||||||||
The accompanying notes are an integral part of these consolidated financial statements.
F-12
Rangers Sub I, LLC
Consolidated Statements of Cash Flows
(Amounts in thousands)
Successor | Predecessor | |||||||||||||||||
For the year ended December 31, | September 1 through December 31, | January 1 through August 31, | ||||||||||||||||
2019 | 2018 | 2017 | 2017 | |||||||||||||||
Cash flows from operating activities | ||||||||||||||||||
Net income (loss) | $ | 25,123 | $ | 74,980 | $ | 4,784 | $ | (96,906 | ) | |||||||||
Adjustments to reconcile net income (loss) to cash flow provided by operating activities: | ||||||||||||||||||
Loss (gain) on sale of hotel properties and other assets, net | 21,451 | (18,423 | ) | 6,637 | 5,079 | |||||||||||||
Depreciation and amortization | 72,389 | 78,491 | 28,966 | 73,065 | ||||||||||||||
Amortization of deferred financing costs | 148 | 241 | 23 | 2,803 | ||||||||||||||
Other amortization | (2,604 | ) | (3,649 | ) | (2,660 | ) | — | |||||||||||
Equity in income from unconsolidated joint ventures | (816 | ) | (1,395 | ) | (661 | ) | (1,074 | ) | ||||||||||
Distributions of income from unconsolidated joint ventures | 1,964 | 2,591 | 1,500 | 333 | ||||||||||||||
Amortization of fixed stock and directors' compensation | — | — | — | 3,833 | ||||||||||||||
Equity-based severance | — | — | — | 2,891 | 8,372 | |||||||||||||
(Gain) loss on extinguishment of indebtedness, net | — | (11,266 | ) | — | 3,278 | |||||||||||||
Impairment loss | — | — | — | 35,109 | ||||||||||||||
Changes in assets and liabilities: | ||||||||||||||||||
Related party receivable | (32,680 | ) | 63,588 | (80,090 | ) | — | ||||||||||||
Hotel and other receivables, net | — | — | — | (6,155 | ) | |||||||||||||
Prepaid expense and other assets | (1,348 | ) | 4,142 | (449 | ) | 2,954 | ||||||||||||
Related party prepaid interest | 180 | (180 | ) | — | — | |||||||||||||
Accounts payable and other liabilities | 1,017 | (6,052 | ) | (19,876 | ) | 54,361 | ||||||||||||
Advance deposits and deferred revenue | — | — | — | 4,426 | ||||||||||||||
Accrued interest | — | (9,823 | ) | (10,326 | ) | 9,862 | ||||||||||||
Related party accrued interest | 190 | — | — | — | ||||||||||||||
Net cash flow provided by (used in) operating activities | 85,014 | 173,245 | (72,152 | ) | 99,340 | |||||||||||||
Cash flows from investing activities | ||||||||||||||||||
Proceeds from the sale of hotel properties, net | 144,447 | 445,287 | 165,893 | 73,416 | ||||||||||||||
Improvements and additions to hotel properties | (62,015 | ) | (74,384 | ) | (23,637 | ) | (63,802 | ) | ||||||||||
Distributions from unconsolidated joint ventures in excess of earnings | — | — | — | 840 | ||||||||||||||
Contributions to unconsolidated joint ventures | (603 | ) | — | — | — | |||||||||||||
Net cash flow provided by investing activities | 81,829 | 370,903 | 142,256 | 10,454 | ||||||||||||||
Cash flows from financing activities | ||||||||||||||||||
Proceeds from borrowings | 96,000 | — | — | 66,000 | ||||||||||||||
Proceeds from borrowings - related party | — | 85,000 | — | — | ||||||||||||||
Repayments of borrowings | (2,678 | ) | (654,656 | ) | (2,164 | ) | (121,691 | ) | ||||||||||
Repurchase of common shares to satisfy employee tax withholding requirements | — | — | — | (6,434 | ) | |||||||||||||
Contributions from members | 188,318 | 732,319 | 130,076 | — | ||||||||||||||
Distributions to members | (404,722 | ) | (698,787 | ) | (187,616 | ) | — | |||||||||||
Distribution of FelCor TRS | — | — | (51,867 | ) | — | |||||||||||||
Distributions on preferred shares | — | — | (4,186 | ) | (18,836 | ) | ||||||||||||
Distributions on common shares | — | — | — | (30,926 | ) | |||||||||||||
Distributions on Operating Partnership units | — | — | — | (134 | ) | |||||||||||||
Payments of deferred financing costs | (990 | ) | (10 | ) | (254 | ) | — | |||||||||||
Distributions to consolidated joint venture partners | — | — | — | (150 | ) | |||||||||||||
Contributions from consolidated joint venture partners | 2,281 | — | — | 333 | ||||||||||||||
Preferred distributions - consolidated joint venture | (312 | ) | (1,483 | ) | (496 | ) | (977 | ) | ||||||||||
Net proceeds from the issuance of preferred equity in a consolidated joint venture | — | — | — | 647 | ||||||||||||||
Redemption of preferred equity - consolidated joint venture | (45,583 | ) | — | — | — | |||||||||||||
Net cash flow used in financing activities | (167,686 | ) | (537,617 | ) | (116,507 | ) | (112,168 | ) | ||||||||||
Net change in cash, cash equivalents, and restricted cash reserves | (843 | ) | 6,531 | (46,403 | ) | (2,374 | ) | |||||||||||
Cash, cash equivalents, and restricted cash reserves, beginning of period | 24,562 | 18,031 | 64,434 | 66,808 | ||||||||||||||
Cash, cash equivalents, and restricted cash reserves, end of period | $ | 23,719 | $ | 24,562 | $ | 18,031 | $ | 64,434 | ||||||||||
The accompanying notes are an integral part of these consolidated financial statements.
F-13
FelCor Lodging Limited Partnership
Consolidated Balance Sheets
(Amounts in thousands)
December 31, | |||||||
2019 | 2018 | ||||||
Assets | |||||||
Investment in hotel properties, net | $ | 1,946,826 | $ | 2,123,423 | |||
Investment in unconsolidated joint ventures | 15,171 | 15,716 | |||||
Cash and cash equivalents | 19,572 | 21,351 | |||||
Restricted cash reserves | 4,147 | 3,211 | |||||
Related party receivable | 49,181 | 16,501 | |||||
Lease right-of-use assets | 80,635 | — | |||||
Intangible assets, net | — | 46,260 | |||||
Prepaid expense and other assets | 7,543 | 6,552 | |||||
Related party prepaid interest | — | 180 | |||||
Total assets | $ | 2,123,075 | $ | 2,233,194 | |||
Liabilities and Partners' Capital | |||||||
Debt, net | $ | 713,727 | $ | 626,628 | |||
Related party debt | 85,000 | 85,000 | |||||
Accounts payable and other liabilities | 32,676 | 43,389 | |||||
Lease liabilities | 48,200 | — | |||||
Accrued interest | 2,463 | 2,463 | |||||
Related party accrued interest | 190 | — | |||||
Distributions payable | — | 126 | |||||
Total liabilities | 882,256 | 757,606 | |||||
Partners' Capital | |||||||
Partners’ capital: | |||||||
Partners' capital | 1,131,226 | 1,347,630 | |||||
Retained earnings | 101,005 | 77,469 | |||||
Total partners’ capital, excluding noncontrolling interest | 1,232,231 | 1,425,099 | |||||
Noncontrolling interest in consolidated joint ventures | 8,588 | 6,059 | |||||
Preferred capital in a consolidated joint venture, liquidation value of $45,544 at December 31, 2018 | — | 44,430 | |||||
Total partners' capital | 1,240,819 | 1,475,588 | |||||
Total liabilities and partners' capital | $ | 2,123,075 | $ | 2,233,194 | |||
The accompanying notes are an integral part of these consolidated financial statements.
F-14
FelCor Lodging Limited Partnership
Consolidated Statements of Operations and Comprehensive Income (Loss)
(Amounts in thousands, except unit and per unit data)
Successor | Predecessor | ||||||||||||||||
For the year ended December 31, | September 1 through December 31, | January 1 through August 31, | |||||||||||||||
2019 | 2018 | 2017 | 2017 | ||||||||||||||
Revenues | |||||||||||||||||
Operating revenues | |||||||||||||||||
Room revenue | $ | — | $ | — | $ | — | $ | 425,682 | |||||||||
Food and beverage revenue | — | — | — | 90,572 | |||||||||||||
Related party lease revenue | 196,695 | 217,597 | 81,259 | — | |||||||||||||
Other revenue | — | — | — | 35,261 | |||||||||||||
Total revenues | 196,695 | 217,597 | 81,259 | 551,515 | |||||||||||||
Expenses | |||||||||||||||||
Operating expenses | |||||||||||||||||
Room expense | — | — | — | 112,813 | |||||||||||||
Food and beverage expense | — | — | — | 71,828 | |||||||||||||
Management and franchise fee expense | — | — | — | 19,901 | |||||||||||||
Other operating expense | — | — | — | 147,827 | |||||||||||||
Total property operating expenses | — | — | — | 352,369 | |||||||||||||
Depreciation and amortization | 72,389 | 78,491 | 28,965 | 73,065 | |||||||||||||
Impairment loss | — | — | — | 35,109 | |||||||||||||
Property tax, insurance and other | 40,965 | 53,754 | 17,062 | 44,278 | |||||||||||||
General and administrative | 1,289 | 1,056 | 1,019 | 16,006 | |||||||||||||
Transaction costs | 241 | 2,186 | 4,193 | 68,248 | |||||||||||||
Total operating expenses | 114,884 | 135,487 | 51,239 | 589,075 | |||||||||||||
Other income | 59 | 113 | — | 100 | |||||||||||||
Interest income | 347 | 311 | 10 | 126 | |||||||||||||
Interest expense | (31,930 | ) | (37,930 | ) | (19,270 | ) | (51,690 | ) | |||||||||
Related party interest expense | (4,529 | ) | (708 | ) | — | — | |||||||||||
(Loss) gain on sale of hotel properties, net | (21,451 | ) | 18,423 | (6,637 | ) | (1,764 | ) | ||||||||||
Gain (loss) on extinguishment of indebtedness, net | — | 11,266 | — | (3,278 | ) | ||||||||||||
Income (loss) before equity in income from unconsolidated joint ventures | 24,307 | 73,585 | 4,123 | (94,066 | ) | ||||||||||||
Equity in income from unconsolidated joint ventures | 816 | 1,395 | 661 | 1,074 | |||||||||||||
Income (loss) before income tax expense | 25,123 | 74,980 | 4,784 | (92,992 | ) | ||||||||||||
Income tax expense | — | — | — | (499 | ) | ||||||||||||
Income (loss) from continuing operations | 25,123 | 74,980 | 4,784 | (93,491 | ) | ||||||||||||
Loss from discontinued operations | — | — | — | (3,415 | ) | ||||||||||||
Net income (loss) and comprehensive income (loss) | 25,123 | 74,980 | 4,784 | (96,906 | ) | ||||||||||||
Net (income) loss attributable to noncontrolling interests: | |||||||||||||||||
Noncontrolling interest in consolidated joint ventures | (248 | ) | (159 | ) | (157 | ) | 545 | ||||||||||
Preferred distributions - consolidated joint venture | (186 | ) | (1,483 | ) | (496 | ) | (979 | ) | |||||||||
Redemption of preferred capital - consolidated joint venture | (1,153 | ) | — | — | — | ||||||||||||
F-15
Net income (loss) and comprehensive income (loss) attributable to FelCor LP | 23,536 | 73,338 | 4,131 | (97,340 | ) | ||||||||||||
Preferred distributions | — | — | — | (16,744 | ) | ||||||||||||
Net income (loss) and comprehensive income (loss) attributable to FelCor LP partners and common unitholders | $ | 23,536 | $ | 73,338 | $ | 4,131 | $ | (114,084 | ) | ||||||||
Basic and diluted per common unit data: | |||||||||||||||||
Loss from continuing operations per unit attributable to common unitholders | $ | (0.80 | ) | ||||||||||||||
Net loss per unit attributable to common unitholders | $ | (0.83 | ) | ||||||||||||||
Weighted-average number of common units | 137,941,926 | ||||||||||||||||
The accompanying notes are an integral part of these consolidated financial statements.
F-16
FelCor Lodging Limited Partnership
Consolidated Statements of Partners' Capital
(Amounts in thousands)
Partners' Capital | Noncontrolling Interest | ||||||||||||||||||
Capital | Retained Earnings | Consolidated Joint Ventures | Preferred Capital in a Consolidated Joint Venture | Total Partners' Capital | |||||||||||||||
Balance at December 31, 2018 | $ | 1,347,630 | $ | 77,469 | $ | 6,059 | $ | 44,430 | $ | 1,475,588 | |||||||||
Net income and comprehensive income | — | 23,536 | 248 | 1,339 | 25,123 | ||||||||||||||
Contributions | 188,318 | — | — | — | 188,318 | ||||||||||||||
Distributions | (404,722 | ) | — | — | (404,722 | ) | |||||||||||||
Preferred distributions - consolidated joint venture | — | — | — | (186 | ) | (186 | ) | ||||||||||||
Redemption of preferred equity - consolidated joint venture | — | — | — | (45,583 | ) | (45,583 | ) | ||||||||||||
Contributions from consolidated joint venture partners | — | — | 2,281 | — | 2,281 | ||||||||||||||
Balance at December 31, 2019 | $ | 1,131,226 | $ | 101,005 | $ | 8,588 | $ | — | $ | 1,240,819 | |||||||||
The accompanying notes are an integral part of these consolidated financial statements.
F-17
FelCor Lodging Limited Partnership
Consolidated Statements of Partners' Capital
(Amounts in thousands)
Partners' Capital | Noncontrolling Interest | ||||||||||||||||||
Capital | Retained Earnings | Consolidated Joint Ventures | Preferred Capital in a Consolidated Joint Venture | Total Partners' Capital | |||||||||||||||
Balance at December 31, 2017 | $ | 1,315,898 | $ | 4,131 | $ | 5,900 | $ | 44,430 | $ | 1,370,359 | |||||||||
Net income and comprehensive income | — | 73,338 | 159 | 1,483 | 74,980 | ||||||||||||||
Contributions | 732,319 | — | — | — | 732,319 | ||||||||||||||
Distributions | (700,587 | ) | — | — | — | (700,587 | ) | ||||||||||||
Preferred distributions - consolidated joint venture | — | — | — | (1,483 | ) | (1,483 | ) | ||||||||||||
Balance at December 31, 2018 | $ | 1,347,630 | $ | 77,469 | $ | 6,059 | $ | 44,430 | $ | 1,475,588 | |||||||||
The accompanying notes are an integral part of these consolidated financial statements.
F-18
FelCor Lodging Limited Partnership
Consolidated Statements of Partners' Capital
(Amounts in thousands)
Partners’ Capital | Noncontrolling Interest | ||||||||||||||||||
Preferred Units | Common Units | Consolidated Joint Ventures | Preferred Capital in a Consolidated Joint Venture | Total Partners' Capital | |||||||||||||||
Predecessor - Balance at December 31, 2016 | $ | 309,337 | $ | (128,040 | ) | $ | 7,503 | $ | 43,783 | $ | 232,583 | ||||||||
Net (loss) income and comprehensive (loss) income | — | (97,340 | ) | (545 | ) | 979 | (96,906 | ) | |||||||||||
Issuance of FelCor restricted stock | — | 859 | — | — | 859 | ||||||||||||||
Amortization of FelCor share-based compensation | — | 11,946 | — | — | 11,946 | ||||||||||||||
Shares acquired to satisfy minimum required federal and state tax withholding on vesting restricted stock | — | (6,434 | ) | — | — | (6,434 | ) | ||||||||||||
Allocation to the redeemable units in the Operating Partnership | — | 433 | — | — | 433 | ||||||||||||||
Contributions from consolidated joint venture partners | — | — | 333 | — | 333 | ||||||||||||||
Distributions to consolidated joint venture partners | — | — | (150 | ) | — | (150 | ) | ||||||||||||
Distributions on preferred units | — | (16,744 | ) | — | — | (16,744 | ) | ||||||||||||
Distributions on common units | — | (22,602 | ) | — | — | (22,602 | ) | ||||||||||||
Preferred distributions in a consolidated joint venture | — | — | — | (979 | ) | (979 | ) | ||||||||||||
Issuance of preferred capital in a consolidated joint venture | — | — | — | 647 | 647 | ||||||||||||||
Predecessor - Balance at August 31, 2017 | $ | 309,337 | $ | (257,922 | ) | $ | 7,141 | $ | 44,430 | $ | 102,986 | ||||||||
The accompanying notes are an integral part of these consolidated financial statements.
F-19
FelCor Lodging Limited Partnership
Consolidated Statements of Partners' Capital
(Amounts in thousands)
Partners' Capital | Noncontrolling Interest | ||||||||||||||||||
Capital | Retained Earnings | Consolidated Joint Ventures | Preferred Capital in a Consolidated Joint Venture | Total Partners' Capital | |||||||||||||||
Successor - Balance at September 1, 2017 | $ | 1,476,822 | $ | — | $ | 5,493 | $ | 44,430 | $ | 1,526,745 | |||||||||
Distribution of FelCor TRS | (103,384 | ) | — | 250 | — | (103,134 | ) | ||||||||||||
Net income and comprehensive income | — | 4,131 | 157 | 496 | 4,784 | ||||||||||||||
Contributions | 130,076 | — | — | — | 130,076 | ||||||||||||||
Distributions | (187,616 | ) | — | — | — | (187,616 | ) | ||||||||||||
Preferred distributions - consolidated joint venture | — | — | — | (496 | ) | (496 | ) | ||||||||||||
Successor - Balance at December 31, 2017 | $ | 1,315,898 | $ | 4,131 | $ | 5,900 | $ | 44,430 | $ | 1,370,359 | |||||||||
The accompanying notes are an integral part of these consolidated financial statements.
F-20
FelCor Lodging Limited Partnership
Consolidated Statements of Cash Flows
(Amounts in thousands)
Successor | Predecessor | ||||||||||||||||
For the year ended December 31, | September 1 through December 31, | January 1 through August 31, | |||||||||||||||
2019 | 2018 | 2017 | 2017 | ||||||||||||||
Cash flows from operating activities | |||||||||||||||||
Net income (loss) | $ | 25,123 | $ | 74,980 | $ | 4,784 | $ | (96,906 | ) | ||||||||
Adjustments to reconcile net income (loss) to cash flow provided by operating activities: | |||||||||||||||||
Loss (gain) on sale of hotel properties and other assets, net | 21,451 | (18,423 | ) | 6,637 | 5,079 | ||||||||||||
Depreciation and amortization | 72,389 | 78,491 | 28,966 | 73,065 | |||||||||||||
Amortization of deferred financing costs | 148 | 241 | 23 | 2,803 | |||||||||||||
Other amortization | (2,604 | ) | (3,649 | ) | (2,660 | ) | — | ||||||||||
Equity in income from unconsolidated joint ventures | (816 | ) | (1,395 | ) | (661 | ) | (1,074 | ) | |||||||||
Distributions of income from unconsolidated joint ventures | 1,964 | 2,591 | 1,500 | 333 | |||||||||||||
Amortization of fixed stock and directors' compensation | — | — | — | 3,833 | |||||||||||||
Equity-based severance | — | — | — | 8,372 | |||||||||||||
(Gain) loss on extinguishment of indebtedness, net | — | (11,266 | ) | — | 3,278 | ||||||||||||
Impairment loss | — | — | — | 35,109 | |||||||||||||
Changes in assets and liabilities: | |||||||||||||||||
Related party receivable | (32,680 | ) | 63,588 | (80,090 | ) | — | |||||||||||
Hotel and other receivables, net | — | — | — | (6,155 | ) | ||||||||||||
Prepaid expense and other assets | (1,348 | ) | 4,142 | (449 | ) | 2,954 | |||||||||||
Related party prepaid interest | 180 | (180 | ) | — | — | ||||||||||||
Accounts payable and other liabilities | 1,017 | (6,052 | ) | (19,876 | ) | 54,361 | |||||||||||
Advance deposits and deferred revenue | — | — | — | 4,426 | |||||||||||||
Accrued interest | — | (9,823 | ) | (10,326 | ) | 9,862 | |||||||||||
Related party accrued interest | 190 | — | — | — | |||||||||||||
Net cash flow provided by (used in) operating activities | 85,014 | 173,245 | (72,152 | ) | 99,340 | ||||||||||||
Cash flows from investing activities | |||||||||||||||||
Proceeds from the sale of hotel properties, net | 144,447 | 445,287 | 165,893 | 73,416 | |||||||||||||
Improvements and additions to hotel properties | (62,015 | ) | (74,384 | ) | (23,637 | ) | (63,802 | ) | |||||||||
Distributions from unconsolidated joint ventures in excess of earnings | — | — | — | 840 | |||||||||||||
Contributions to unconsolidated joint ventures | (603 | ) | — | — | — | ||||||||||||
Net cash flow provided by investing activities | 81,829 | 370,903 | 142,256 | 10,454 | |||||||||||||
Cash flows from financing activities | |||||||||||||||||
Proceeds from borrowings | 96,000 | — | — | 66,000 | |||||||||||||
Proceeds from borrowings - related party | — | 85,000 | — | — | |||||||||||||
Repayments of borrowings | (2,678 | ) | (654,656 | ) | (2,164 | ) | (121,691 | ) | |||||||||
Repurchase of FelCor common shares to satisfy employee tax withholding requirements | — | — | — | (6,434 | ) | ||||||||||||
Contributions from partners | 188,318 | 732,319 | 130,076 | — | |||||||||||||
Distributions to partners | (404,722 | ) | (698,787 | ) | (187,616 | ) | — | ||||||||||
Distribution of FelCor TRS | — | — | (51,867 | ) | — | ||||||||||||
Distributions to preferred unitholders | — | — | (4,186 | ) | (18,836 | ) | |||||||||||
Distributions to common unitholders | — | — | — | (30,926 | ) | ||||||||||||
Distributions to FelCor LP limited partners | — | — | — | (134 | ) | ||||||||||||
Payments of deferred financing costs | (990 | ) | (10 | ) | (254 | ) | — | ||||||||||
Distributions to consolidated joint venture partners | — | — | — | (150 | ) | ||||||||||||
Contributions from consolidated joint venture partners | 2,281 | — | — | 333 | |||||||||||||
Preferred distributions - consolidated joint venture | (312 | ) | (1,483 | ) | (496 | ) | (977 | ) | |||||||||
Net proceeds from the issuance of preferred capital in a consolidated joint venture | — | — | — | 647 | |||||||||||||
Redemption of preferred capital - consolidated joint venture | (45,583 | ) | — | — | — | ||||||||||||
Net cash flow used in financing activities | (167,686 | ) | (537,617 | ) | (116,507 | ) | (112,168 | ) | |||||||||
Net change in cash, cash equivalents, and restricted cash reserves | (843 | ) | 6,531 | (46,403 | ) | (2,374 | ) | ||||||||||
Cash, cash equivalents, and restricted cash reserves, beginning of period | 24,562 | 18,031 | 64,434 | 66,808 | |||||||||||||
Cash, cash equivalents, and restricted cash reserves, end of period | $ | 23,719 | $ | 24,562 | $ | 18,031 | $ | 64,434 | |||||||||
The accompanying notes are an integral part of these consolidated financial statements.
F-21
Rangers Sub I, LLC and FelCor Lodging Limited Partnership
Notes to the Consolidated Financial Statements
1. Organization
Rangers Sub I, LLC ("Rangers") is a Maryland limited liability company and a wholly-owned subsidiary of RLJ Lodging Trust, L.P. ("RLJ LP"). Rangers owns an indirect 99% partnership interest in FelCor Lodging Limited Partnership ("FelCor LP"). Rangers General Partner, LLC, also a wholly-owned subsidiary of RLJ LP, owns the remaining 1% partnership interest and is the sole general partner of FelCor LP. Rangers and FelCor LP are collectively referred to as the "Company." Substantially all of the Company’s assets and liabilities are held by, and all of its operations are conducted through FelCor LP. The Company owns primarily premium-branded, upper-upscale hotels located in major markets and resort locations.
As of December 31, 2019, the Company owned 28 hotel properties with approximately 8,100 rooms, located in 13 states. The Company, through wholly-owned subsidiaries, owned a 100% interest in 25 hotel properties, a 95% controlling interest in The Knickerbocker, and 50% interests in entities owning two hotel properties. The Company consolidates its real estate interests in the 26 hotel properties in which it holds a controlling financial interest, and the Company records the real estate interests in the two hotels in which it holds an indirect 50% interest using the equity method of accounting. The Company leases 27 of its 28 hotel properties to subsidiaries of RLJ LP.
2. Merger with RLJ
On August 31, 2017 (the "Acquisition Date"), RLJ Lodging Trust ("RLJ"), RLJ LP, Rangers, and Rangers Sub II, LP, a wholly-owned subsidiary of RLJ LP ("Partnership Merger Sub"), consummated the transactions contemplated by the definitive Agreement and Plan of Merger (the "Merger Agreement"), dated as of April 23, 2017, with FelCor and FelCor LP pursuant to which Partnership Merger Sub merged with and into FelCor LP, with FelCor LP surviving as a wholly-owned subsidiary of RLJ LP (the "Partnership Merger"), and, immediately thereafter, FelCor merged with and into Rangers, with Rangers surviving as a wholly-owned subsidiary of RLJ LP (the "REIT Merger" and, together with the Partnership Merger, the "Mergers").
RLJ accounted for the Mergers under the acquisition method of accounting in ASC 805, Business Combinations. In accordance with the guidance, RLJ elected to apply pushdown accounting to the Company's consolidated financial statements in order to reflect the new basis of accounting established by RLJ for the individual assets acquired and the liabilities assumed in the Mergers. Accordingly, the consolidated financial statements of the Company for the periods before and after the Acquisition Date reflect different bases of accounting, and the financial positions and the results of operations for those periods are not comparable. As a result, the consolidated financial statements and the notes to those financial statements are separated into two distinct periods; the periods prior to the Acquisition Date are identified as "Predecessor," and the period after the Acquisition Date is identified as "Successor". The new basis of accounting for the assets and liabilities that existed on the Acquisition Date will be used in the preparation of the Company's future financial statements and footnotes.
At the closing of the Mergers, FelCor LP had controlling financial interests in various hotel property-owning subsidiaries (the "Lessors"), and FelCor TRS Holdings, LLC (the "FelCor TRS") and its property-operating subsidiaries (the "Lessees"). The hotel properties were leased through intercompany lease agreements between the Lessors and the Lessees, resulting in the Lessees' lease payments being eliminated in consolidation. Immediately after the consummation of the Mergers and the push down of the allocation of the purchase price consideration, FelCor LP distributed its equity interests in FelCor TRS to RLJ LP. The Company accounted for the distribution as a transaction amongst entities under common control. As a result of the distribution of the equity interests in FelCor TRS, the Lessees' lease payments pursuant to the leases are no longer eliminated in consolidation.
F-22
The following table reflects the new basis of accounting for the assets and liabilities that existed on the Acquisition Date and the impact of the distribution of the equity interests in FelCor TRS to RLJ LP:
August 31, 2017 | |||||||||||
New Basis Before FelCor TRS Distribution | FelCor TRS Distribution | New Basis After FelCor TRS Distribution | |||||||||
Investment in hotel properties | $ | 2,661,114 | $ | (2,000 | ) | $ | 2,659,114 | ||||
Investment in unconsolidated joint ventures | 25,651 | (7,900 | ) | 17,751 | |||||||
Cash and cash equivalents | 47,396 | (40,878 | ) | 6,518 | |||||||
Restricted cash reserves | 17,038 | (10,989 | ) | 6,049 | |||||||
Hotel and other receivables | 28,308 | (28,308 | ) | — | |||||||
Deferred income tax assets | 58,170 | (58,170 | ) | — | |||||||
Intangible assets | 139,673 | (20,262 | ) | 119,411 | |||||||
Prepaid expenses and other assets | 23,811 | (11,417 | ) | 12,394 | |||||||
Debt | (1,305,337 | ) | — | (1,305,337 | ) | ||||||
Accounts payable and other liabilities | (118,360 | ) | 52,995 | (65,365 | ) | ||||||
Advance deposits and deferred revenue | (23,795 | ) | 23,795 | — | |||||||
Accrued interest | (22,612 | ) | — | (22,612 | ) | ||||||
Distributions payable | (4,312 | ) | — | (4,312 | ) | ||||||
Total equity | $ | 1,526,745 | $ | (103,134 | ) | $ | 1,423,611 | ||||
The Company recognized the following intangible assets in the Mergers (dollars in thousands):
Weighted Average Amortization Period (in Years) | ||||||
Below market ground leases | $ | 118,050 | 54 | |||
Advanced bookings | 13,862 | 1 | ||||
Other intangible assets | 7,761 | 6 | ||||
Total intangible assets | $ | 139,673 | 46 | |||
For the year ended December 31, 2018, the Company recognized approximately $2.0 million of integration costs. The Company recognized approximately $4.2 million of integration costs during the Successor period of September 1, 2017 through December 31, 2017. The Company recognized approximately $68.2 million of transaction costs during the Predecessor period of January 1, 2017 through August 31, 2017. The transaction costs primarily related to financial advisory, legal, accounting, severance, other professional service fees, and other transaction-related costs in connection with the Mergers. The integration costs primarily related to professional fees and employee-related costs, including compensation for transition employees. The merger-related transaction and integration costs were expensed to transaction costs in the accompanying consolidated statements of operations and comprehensive income (loss). There were no merger-related costs incurred during the year ended December 31, 2019.
3. Summary of Significant Accounting Policies
Basis of Presentation and Principles of Consolidation
The consolidated financial statements and related notes have been prepared on the accrual basis of accounting in accordance with accounting principles generally accepted in the United States of America ("GAAP").
The consolidated financial statements include the accounts of Rangers, FelCor LP and its wholly-owned subsidiaries, and joint ventures in which the Company has a majority voting interest and control. For the controlled subsidiaries that are not wholly-owned, the third-party ownership interest represents a noncontrolling interest, which is presented separately in the consolidated financial statements. The Company also records the real estate interests in two joint ventures in which it holds an indirect 50% interest using the equity method of accounting. All intercompany balances and transactions have been eliminated in consolidation.
F-23
Use of Estimates
The preparation of the Company’s financial statements in conformity with GAAP requires management to make estimates and assumptions that affect the reported amounts of certain assets and liabilities and the amounts of contingent assets and liabilities at the balance sheet date and the reported amounts of revenues and expenses during the reporting period. Actual results could differ from those estimates.
Reclassifications
Certain prior year amounts in these financial statements have been reclassified to conform to the current year presentation with no impact to net income and comprehensive income, shareholders’ equity or cash flows.
As a result of the merger with RLJ, the Company conformed the consolidated statements of operations and comprehensive loss for the Predecessor period of January 1, 2017 through August 31, 2017 to the financial statement presentation of the Company's parent company, RLJ. The reclassification had no impact to net income (loss) and comprehensive income (loss), member's/shareholders’ equity (partners' capital), or cash flows.
Revenue
For the Predecessor period, the Company’s revenue consisted of room revenue, food and beverage revenue, and revenue from other hotel operating departments (such as parking fees, golf, pool and other resort fees, gift shop sales and other guest service fees). These revenues were recorded net of any sales and occupancy taxes collected from the hotel guests. All rebates or discounts were recorded as a reduction to revenue, and there are no material contingent obligations with respect to rebates and discounts offered by the hotels. All revenues were recorded on an accrual basis as they were earned. An allowance for doubtful accounts is the Company's best estimate of the amount of probable credit losses in the existing accounts receivable portfolio and it was recorded as a bad debt expense. The allowance for doubtful accounts was calculated as a percentage of the aged accounts receivable. Any cash received prior to a guest's arrival was recorded as an advance deposit from the guest and recognized as revenue at the time of the guest's occupancy at the hotel property.
Investment in Hotel Properties
The Company’s acquisitions generally consist of land, land improvements, buildings, building improvements, furniture, fixtures and equipment ("FF&E"), and inventory. The Company may also acquire intangible assets or liabilities related to in-place leases, management agreements, franchise agreements and advanced bookings. The Company allocates the purchase price among the assets acquired and the liabilities assumed based on their respective fair values at the date of acquisition. The Company estimates the fair values of the assets acquired and the liabilities assumed by using a combination of the market, cost and income approaches. The Company determines the fair value by using market data and independent appraisals available to us and making numerous estimates and assumptions, such as estimates of future income growth, capitalization rates, discount rates, capital expenditures and cash flow projections at the respective hotel properties. Transaction costs are expensed for acquisitions that are considered business combinations and capitalized for asset acquisitions.
The Company’s investments in hotel properties are carried at cost and are depreciated using the straight-line method over the estimated useful lives of 15 years for land improvements, 15 years for building improvements, 40 years for buildings and three to five years for FF&E. For the Predecessor period, FelCor's investments in hotel properties were carried at cost and depreciated using the straight-line method over the estimated useful lives of 15 to 30 years for improvements, 40 years for buildings and three to 10 years for FF&E. Maintenance and repairs are expensed and major renewals or improvements to the hotel properties are capitalized. Indirect project costs, including interest, salaries and benefits, travel and other related costs that are directly attributable to the development, are also capitalized. Upon the sale or disposition of a hotel property, the asset and related accumulated depreciation accounts are removed and the related gain or loss is included in the gain or loss on sale of hotel properties in the consolidated statements of operations and comprehensive income. A sale or disposition of a hotel property that represents a strategic shift that has or will have a major effect on the Company's operations and financial results is presented as discontinued operations in the consolidated statements of operations and comprehensive income.
In accordance with the guidance on impairment or disposal of long-lived assets, the Company does not consider the "held for sale" classification on the consolidated balance sheet until it is expected to qualify for recognition as a completed sale within one year and the other requisite criteria for such classification have been met. The Company does not depreciate assets so long as they are classified as held for sale. Upon designation as held for sale and quarterly thereafter, the Company reviews the realizability of the carrying value, less costs to sell, in accordance with the guidance. Any such adjustment to the carrying value is recorded as an impairment loss.
F-24
The Company assesses the carrying value of its investments in hotel properties whenever events or changes in circumstances indicate that the carrying amounts may not be recoverable. The recoverability is measured by comparing the carrying amount to the estimated undiscounted future cash flows expected to be generated from the operations and the eventual disposition of the hotel properties over the estimated hold period, which take into account current market conditions and the Company’s intent with respect to holding or disposing of the hotel properties. If the Company’s analysis indicates that the carrying value is not recoverable on an undiscounted cash flow basis, the Company will recognize an impairment loss for the amount by which the carrying value exceeds the fair value. The fair value is determined through various valuation techniques, including internally developed discounted cash flow models, comparable market transactions, third-party appraisals, the net sales proceeds from pending offers, or the net sales proceeds from transactions that closed subsequent to the end of the reporting period. The use of projected future cash flows is based on assumptions that are consistent with a market participant’s future expectations for the travel industry and the economy in general, including discount rates, terminal capitalization rates, average daily rates, occupancy rates, operating expenses and capital expenditures, and the Company's intent with respect to holding or disposing of the underlying hotel properties. Fair value may also be based on assumptions including, but not limited to, room revenue multiples and comparable sales adjusted for capital expenditures, if necessary.
Investment in Unconsolidated Joint Ventures
If the Company determines that it does not have a controlling financial interest in a joint venture, either through a controlling financial interest in a variable interest entity or through the Company's voting interest in a voting interest entity, but the Company exercises significant influence over the operating and financial policies of the joint venture, the Company accounts for the joint venture using the equity method of accounting. Under the equity method of accounting, the Company's investment is adjusted each reporting period to recognize the Company's share of the net earnings or losses of the joint venture, plus any contributions to the joint venture, less any distributions received from the joint venture and any adjustment for impairment. In addition, the Company's share of the net earnings or losses of the joint venture is adjusted for the straight-line depreciation of the difference between the Company's basis in the investment in the unconsolidated joint venture as compared to the historical basis of the underlying net assets in the joint venture at the date of acquisition.
The Company assesses the carrying value of its investment in unconsolidated joint ventures whenever events or changes in circumstances may indicate that the carrying value of the investment exceeds its fair value on an other-than-temporary basis. When an impairment indicator is present, the Company will estimate the fair value of the investment, which will be determined by using internally developed discounted cash flow models, comparable market transactions, third-party appraisals, the net sales proceeds from pending offers, or the net sales proceeds from transactions that closed subsequent to the end of the reporting period. If the estimated fair value is less than the carrying value, and management determines that the decline in value is considered to be other-than-temporary, the Company will recognize an impairment loss on its investment in the joint venture.
The Company evaluates the nature of the distributions from each of its unconsolidated joint ventures in order to classify the distributions as either operating activities or investing activities in the consolidated statements of cash flows. Any cash distribution that is considered to be a distribution of the earnings of the unconsolidated joint venture is presented as an operating activity in the consolidated statements of cash flows. Any cash distribution that is considered to be a return of capital from the unconsolidated joint venture is presented as an investing activity in the consolidated statements of cash flows.
Intangible Assets
In a business combination, the Company may acquire intangible assets related to in-place leases, management agreements, franchise agreements, advanced bookings, and other intangible assets. The Company recognizes each of the intangible assets at fair value. The Company estimates the fair value of the intangible assets by using market data and independent appraisals, and by making numerous estimates and assumptions. The below market lease intangible assets are amortized over the remaining terms of the respective leases as adjustments to rental expense in property tax, insurance and other in the consolidated statements of operations and comprehensive income. The advanced bookings intangible assets are amortized over the duration of the hotel room and guest event reservations period at the respective hotel property to depreciation and amortization in the consolidated statements of operations and comprehensive income. The other intangible assets are amortized over the remaining non-cancelable term of the related agreement, or the useful life of the respective intangible asset, to depreciation and amortization in the consolidated statements of operations and comprehensive income.
The Company assesses the carrying value of the intangible assets whenever events or changes in circumstances indicate that the carrying amounts may not be recoverable. The recoverability is measured by comparing the carrying amount to the estimated undiscounted future cash flows, which take into account current market conditions and the Company’s intent with
F-25
respect to holding or disposing of the hotel properties. If the Company’s analysis indicates that the carrying value is not recoverable on an undiscounted cash flow basis, the Company will recognize an impairment loss for the amount by which the carrying value exceeds the fair value. The fair value is determined through various valuation techniques, including internally developed discounted cash flow models or third-party appraisals. The use of projected future cash flows is based on assumptions that are consistent with a market participant's future expectations for the travel industry and the economy in general, including discount rates, market rent, and the Company's intent with respect to holding or disposing of the underlying hotel properties.
Cash and Cash Equivalents
Cash and cash equivalents include all cash and highly liquid investments that mature three months or less when they are purchased. The Company maintains its cash at domestic banks, which, at times, may exceed the limits of the amounts insured by the Federal Deposit Insurance Corporation.
Restricted Cash Reserves
Restricted cash reserves consist of all cash that is required to be maintained in a reserve escrow account by a management agreement, franchise agreement and/or a mortgage loan agreement for the replacement of FF&E and the funding of real estate taxes and insurance.
Deferred Financing Costs
Deferred financing costs are the costs incurred to obtain long-term financing. The deferred financing costs are recorded at cost and are amortized using the straight-line method, which approximates the effective interest method, over the respective term of the financing agreement and are included as a component of interest expense in the consolidated statements of operations and comprehensive income. The Company expenses unamortized deferred financing costs when the associated financing agreement is refinanced or repaid before the maturity date, unless certain criteria are met that would allow for the carryover of such costs to the refinanced agreement. The Company presents the deferred financing costs for its mortgage loans on the balance sheet as a direct deduction from the carrying amount of the respective debt liability, which is included in debt, net in the accompanying consolidated balance sheets.
For the years ended December 31, 2019 and 2018, approximately $0.1 million and $0.2 million, respectively, of amortization expense was recorded as a component of interest expense in the consolidated statements of operations and comprehensive income (loss). For the Successor period of September 1, 2017 through December 31, 2017, the amortization expense recorded as a component of interest expense in the consolidated statements of operations and comprehensive income (loss) was de minimis. For the Predecessor period of January 1, 2017 through August 31, 2017, approximately $2.8 million of amortization expense was recorded as a component of interest expense in the consolidated statements of operations and comprehensive income (loss).
Transaction Costs
The Company incurs costs during the review of potential hotel property acquisitions and dispositions, including legal fees and other professional service fees. In addition, if the Company completes a hotel property acquisition, the Company may incur transfer taxes and integration costs, including professional fees and employee-related costs. If the Company completes a hotel property acquisition that is considered to be an asset acquisition, the transaction costs are capitalized on the consolidated balance sheets. If the Company completes a hotel property acquisition that is considered to be a business combination, the transaction costs are expensed as incurred in the consolidated statements of operations and comprehensive income.
Leases
In February 2016, the FASB issued ASU 2016-02, Leases (Topic 842), which provides the principles for the recognition, measurement, presentation and disclosure of leases for both parties to a contract (i.e. lessees and lessors). The Company adopted this standard on January 1, 2019 using the modified retrospective transition approach. There are two methods of applying the modified retrospective transition approach and the Company elected to not adjust the comparative periods in the consolidated financial statements and footnotes. The comparative historical periods will be presented in accordance with ASC 840, Leases.
F-26
Lessors
As a lessor in a lease contract, the Company classifies its leases as either an operating lease, direct financing lease, or a sales-type lease. The Company's hotel properties are leased through intercompany lease contracts between the Lessors and the Lessees. As a result of the distribution of the equity interests in FelCor TRS to RLJ LP, the Lessees' lease payments pursuant to the leases are no longer eliminated in consolidation. The Company classifies these lease contracts as operating leases, so the Company will continue to recognize the underlying leased asset as an investment in hotel properties on the consolidated balance sheets. Base lease revenue is recognized on a straight-line basis over the lease term. Percentage lease revenue is recognized over the lease term when it is earned and becomes receivable from the Lessees, according to the provisions of the respective lease contracts. The Company only capitalizes the incremental direct costs of leasing, so any indirect costs of leasing will be expensed as incurred. The Lessees are in compliance with their rental obligations under their respective lease agreements.
Lessees
As a lessee in a lease contract, the Company recognizes a lease right-of-use asset and a lease liability on the consolidated balance sheet. The Company is a lessee in a variety of lease contracts, such as ground leases, parking leases, office leases and equipment leases. The Company classifies its leases as either an operating lease or a finance lease based on the principle of whether or not the lease is effectively a financed purchase of the leased asset. For operating leases, the Company recognizes lease expense on a straight-line basis over the term of the lease. For finance leases, the Company recognizes lease expense on the effective interest method, which results in the interest component of each lease payment being recognized as interest expense and the lease right-of-use asset being amortized into amortization expense using the straight-line method over the term of the lease. For leases with an initial term of 12 months or less, the Company will not recognize a lease right-of-use asset and a lease liability on the consolidated balance sheet and lease expense will be recognized on a straight-line basis over the lease term.
At the lease commencement date, the Company determines the lease term by incorporating the fixed, non-cancelable lease term plus any lease extension option terms that are reasonably certain of being exercised. The ability to extend the lease term is at the Company's sole discretion. The Company calculates the present value of the future lease payments over the lease term in order to determine the lease liability and the related lease right-of-use asset that is recognized on the consolidated balance sheet.
Certain lease contracts may include an option to purchase the leased property, which is at the Company's sole discretion. The Company's lease contracts do not contain any material residual value guarantees or material restrictive covenants.
The Company's leases include a base lease payment, which is recognized as lease expense on a straight-line basis over the lease term. In addition, certain of the Company's leases may include an additional lease payment that is based on either (i) a percentage of the respective hotel property's financial results or (ii) the frequency to which the leased asset is used; all of which are recognized as variable lease expense, when incurred, in the consolidated statements of operations and comprehensive income. The variable lease expense incurred by the Company was not based on an index or rate.
The Company will use the implicit rate in a lease contract in order to determine the present value of the future lease payments over the lease term. If the implicit rate in the lease contract is not available, then the Company will use its incremental borrowing rate at the lease commencement date. The Company determined its incremental borrowing rate for each lease contract by using the U.S. Treasury interest rates yield curve, and then making adjustments for the lease term, the Company’s credit spread, the Company’s ability to borrow on a secured basis, the quality and condition of the leased asset and the current economic environment. For purposes of adopting ASC 842, the Company used its incremental borrowing rate on January 1, 2019 for the operating leases that commenced prior to that date.
The Company elected the following practical expedients in adopting the new standard:
• | The Company elected the package of practical expedients that allows the Company to not reassess: |
(i) | whether any expired or existing contracts meet the definition of a lease; |
(ii) | the lease classification for any expired or existing leases; and |
(iii) | the initial direct costs for any existing leases. |
• | The Company elected a practical expedient to make an accounting policy election to not recognize a right-of-use asset and a lease liability for leases with an initial term of 12 months or less. |
F-27
• | The Company elected a practical expedient to allow the Company to not reassess whether an existing land easement not previously accounted for as a lease under ASC 840 would now be considered to be a lease under ASC 842. |
• | The Company elected a practical expedient whereby lessors, by class of underlying asset, are not required to separate the nonlease components from the lease components, if certain conditions are met. |
Upon adoption of this standard on January 1, 2019, the Company recognized lease liabilities and the related lease right-of-use assets on the consolidated balance sheet for its ground leases, parking leases and office leases. In addition to recognizing the lease liabilities and the related lease right-of-use assets on the date of adoption, the Company reclassified its below market ground lease intangible assets from intangible assets, net on the consolidated balance sheet to the lease right-of-use assets. In addition, the Company reclassified its above market ground lease liabilities and deferred rent liabilities from accounts payable and other liabilities on the consolidated balance sheet to the lease right-of-use assets.
The following table summarizes the impact of adopting this guidance on the consolidated balance sheet (in thousands):
January 1, 2019 | |||||||||||
As Previously Reported | Impact of the Adoption of ASC 842 | As Adjusted | |||||||||
Lease right-of-use assets | $ | — | $ | 84,913 | $ | 84,913 | |||||
Intangible assets, net | $ | 46,260 | $ | (46,260 | ) | $ | — | ||||
Accounts payable and other liabilities | $ | 43,389 | $ | (11,048 | ) | $ | 32,341 | ||||
Lease liabilities | $ | — | $ | 49,701 | $ | 49,701 | |||||
There was no impact to the Company’s consolidated statements of operations and comprehensive income (loss) and the consolidated statements of cash flows. Refer to Note 11, Commitments and Contingencies, for the Company's disclosures about its lease contracts.
Noncontrolling Interests
The consolidated financial statements include all subsidiaries controlled by the Company. For the controlled subsidiaries that are not wholly-owned, the third-party ownership interest represents a noncontrolling interest, which is presented separately in the consolidated financial statements.
As of December 31, 2019 and 2018, Rangers owned 99.0% of the partnership interests in FelCor LP. Rangers consolidates FelCor LP for financial reporting purposes as a result of its controlling financial interest. Rangers GP's 1.0% partnership interest in FelCor LP is recognized as a noncontrolling interest in FelCor LP in the equity section of the consolidated balance sheets of Rangers. The portion of the income and losses associated with Rangers GP's partnership interest are included in the noncontrolling interest in FelCor LP in the consolidated statements of operations and comprehensive income.
As of December 31, 2019 and 2018, the Company consolidated the joint venture that owns The Knickerbocker hotel property; this joint venture has a 5% third-party ownership interest in the joint venture. The third-party ownership interest is included in the noncontrolling interest in consolidated joint ventures in the equity section of the consolidated balance sheets. The income and losses associated with the third-party ownership interest are included in the noncontrolling interest in consolidated joint ventures in the consolidated statements of operations and comprehensive income.
For the Predecessor period, the redeemable noncontrolling interests in FelCor LP represent the FelCor LP units that were not owned by FelCor. FelCor allocated the income and loss to the redeemable noncontrolling interests in FelCor LP based on the weighted-average percentage ownership throughout the year. FelCor characterized the redeemable noncontrolling interests in FelCor LP in the mezzanine section (between liabilities and equity) on the consolidated balance sheets as a result of the redemption feature of the units. The units were redeemable at the option of the holder for a like number of shares of FelCor's common stock or, at FelCor's option, the cash equivalent thereof. FelCor adjusted the redeemable noncontrolling interests in FelCor LP (or redeemable units) each reporting period to reflect the greater of its carrying value based on the accumulation of historical cost or its redemption value.
F-28
Income Taxes
The Company is considered to be a partnership for income tax purposes, and is not subject to federal, state, or local income taxes. Any taxable income or loss will be recognized by the partners. Accordingly, no federal, state, or local income taxes have been reflected in the accompanying consolidated financial statements. Significant differences may exist between the results of operations reported in these consolidated financial statements and those determined for income tax purposes primarily due to the use of different asset valuation methods for tax purposes.
The partnership files tax returns as prescribed by the tax laws of the United States of America, the jurisdiction in which it operates. In the normal course of business, the partnership is subject to examination by federal, state, and local jurisdictions, where applicable.
The Company performs an annual review for any uncertain tax positions and, if necessary, will record the expected future tax consequences of uncertain tax positions in the consolidated financial statements.
For the Predecessor period, FelCor elected to be taxed as a REIT under Sections 856 through 860 of the Internal Revenue Code of 1986, as amended. To qualify as a REIT, FelCor was required to meet a number of organizational and operational requirements, including a requirement that it distribute at least 90% of its REIT taxable income, subject to certain adjustments and excluding any net capital gain, to shareholders.
As a REIT, FelCor generally was not subject to U.S. federal corporate income tax on the portion of taxable income that is distributed to shareholders. If FelCor failed to qualify for taxation as a REIT in any taxable year, it would be subject to U.S. federal income taxes at regular corporate rates (including any applicable alternative minimum tax) and it may not be able to qualify as a REIT for four subsequent taxable years. Even if FelCor qualified for taxation as a REIT, it could have been subject to certain state and local taxes on its income and property, and to U.S. federal income and excise taxes on its undistributed taxable income. Taxable income from non-REIT activities managed through taxable REIT subsidiaries is subject to U.S. federal, state and local income taxes at the applicable rates.
FelCor accounted for income taxes using the asset and liability method. Under this method, deferred tax assets and liabilities are recognized for the estimated future tax consequences attributable to the differences between the financial statement carrying amounts of existing assets and liabilities and their respective income tax bases, and for net operating loss, capital loss and tax credit carryforwards. The deferred tax assets and liabilities are measured using the enacted income tax rates in effect for the year in which those temporary differences are expected to be realized or settled. The effect on the deferred tax assets and liabilities from a change in tax rates is recognized in earnings in the period when the new rate is enacted. However, deferred tax assets are recognized only to the extent that it is more likely than not that they will be realized based on consideration of all available evidence, including the future reversals of existing taxable temporary differences, future projected taxable income and tax planning strategies. Valuation allowances are provided if, based upon the weight of the available evidence, it is more likely than not that some or all of the deferred tax assets will not be realized.
FelCor performed an annual review for any uncertain tax positions and, as required, recorded the expected future tax consequences of uncertain tax positions in the consolidated financial statements.
Earnings Per Common Share/Unit
RLJ LP, through direct and indirect wholly-owned subsidiaries, owns 100% of the ownership interests and is the sole member and partner of Rangers and FelCor LP, respectively.
For the Predecessor period, basic earnings (loss) per common share/unit was calculated by dividing net income (loss) attributable to common shareholders (unitholders) by the weighted-average number of common shares (units) outstanding during the period excluding the weighted-average number of unvested restricted shares (units) outstanding during the period. Diluted earnings (loss) per common share/unit was calculated by dividing net income attributable to common shareholders (unitholders) by the weighted-average number of common shares (units) outstanding during the period, plus any shares (units) that could potentially be outstanding during the period. The potential shares (units) consist of unvested share/unit-based awards, calculated using the treasury stock method. Any anti-dilutive shares (units) were excluded from the diluted earnings (loss) per common share/unit calculation.
Share-based Compensation
As a result of the Mergers, the Company does not have an equity incentive plan.
F-29
For the Predecessor period, FelCor issued share-based awards as compensation to executive officers and employees. The share-based awards vest over a period of time as determined at the date of grant. FelCor accounted for the share-based compensation using the fair value based method of accounting. FelCor classified the share-based payment awards granted in exchange for employee services as either equity awards or liability awards. The equity classified awards were measured based on the fair value on the date of grant. The liability classified awards were remeasured to fair value each reporting period. The share-based awards that were settled in cash (i.e. phantom stock) were classified as liability awards. FelCor recognized compensation expense for the share-based awards on a straight-line basis over the requisite service period during which an employee was required to provide services in exchange for the award. No share-based compensation expense was recognized for the awards when the employees did not render the requisite services.
Recently Issued Accounting Pronouncements
In August 2018, the SEC issued SEC Final Rule 33-10532, Disclosure Update and Simplification. The amendments simplify or eliminate duplicative, overlapping, or outdated disclosure requirements. The amendments also add certain disclosure requirements, such as requiring entities to disclose the current and comparative quarter and year-to-date changes in shareholders' equity for interim periods. The amended rules are effective for reports filed on or after November 5, 2018. However, the SEC issued Compliance & Disclosure Interpretation 105.09 that allows entities to defer the adoption of the new disclosure requirement relating to changes in shareholders' equity for interim periods until the Form 10-Q for the quarterly period that begins after November 5, 2018. The Company adopted the new disclosure requirement relating to changes in shareholders' equity for interim periods on January 1, 2019. Based on the Company's assessment, the adoption of the new disclosures did not have a material impact on the Company's consolidated financial statements.
In August 2018, the FASB issued ASU 2018-13, Fair Value Measurement (Topic 820): Disclosure Framework - Changes to the Disclosure Requirements for Fair Value Measurement. The guidance modifies the disclosure requirements for fair value measurements by removing or modifying some of the disclosures, while also adding new disclosures. The guidance is effective for annual reporting periods beginning after December 15, 2019, and the interim periods within those annual periods, with early adoption permitted. The Company will adopt this new standard on January 1, 2020. Based on the Company's assessment, the adoption of this standard is not expected to have a material impact on the Company's consolidated financial statements.
4. Investment in Hotel Properties
Investment in hotel properties consisted of the following (in thousands):
December 31, 2019 | December 31, 2018 | ||||||
Land and improvements | $ | 500,618 | $ | 532,490 | |||
Buildings and improvements | 1,461,525 | 1,555,132 | |||||
Furniture, fixtures and equipment | 135,400 | 125,207 | |||||
2,097,543 | 2,212,829 | ||||||
Accumulated depreciation | (150,717 | ) | (89,406 | ) | |||
Investment in hotel properties, net | $ | 1,946,826 | $ | 2,123,423 | |||
For the years ended December 31, 2019 and, 2018, the Company recognized depreciation expense related to its investment in hotel properties of approximately $71.9 million and $77.9 million, respectively. For the Successor period of September 1, 2017 through December 31, 2017, the Company recognized depreciation expense related to its investment in hotel properties of approximately $28.7 million. For the Predecessor period of January 1, 2017 through August 31, 2017, the Company recognized depreciation expense related to its investment in hotel properties of approximately $73.1 million.
Impairment
The Company determined that there were no impairments of any assets for the years ended December 31, 2019 and 2018 or for the Successor period of September 1, 2017 through December 31, 2017.
During the Predecessor period of January 1, 2017 through August 31, 2017, the Company recorded a total impairment loss of $35.1 million related to two hotel properties. In March 2017, the Company recorded a $24.8 million impairment loss on one hotel property based on third-party offers to purchase the hotel property and observable market data on a price per room basis from transactions involving hotel properties in similar locations (a Level 2 input in the fair value hierarchy). In June 2017, two hotel properties, including the hotel property that was previously impaired in March 2017, were classified as held for sale on
F-30
the consolidated balance sheet. The basis for these hotel properties had previously been written down to the respective fair values of the hotel properties based on third-party offers to purchase the hotel properties and observable market data on a price per room basis from transactions involving hotel properties in similar locations (a Level 2 input in the fair value hierarchy). The Company recorded an additional impairment loss of $10.3 million on these two hotel properties in order to reflect the contractual sale prices, less the estimated costs to sell.
5. Investment in Unconsolidated Joint Ventures
As of December 31, 2019 and 2018, the Company owned 50% interests in joint ventures that owned two hotel properties. For the Predecessor period, FelCor also owned 50% interests in joint ventures that owned real estate and a condominium management business that was associated with two of its resort hotel properties. The Company accounts for the investments in these unconsolidated joint ventures under the equity method of accounting. The Company makes adjustments to the equity in income from unconsolidated joint ventures related to the difference between the Company's basis in the investment in the unconsolidated joint ventures as compared to the historical basis of the assets and liabilities of the joint ventures. As of December 31, 2019 and 2018, the unconsolidated entities' debt consisted entirely of non-recourse mortgage debt.
The following table summarizes the components of the Company's investments in unconsolidated joint ventures (in thousands):
December 31, 2019 | December 31, 2018 | ||||||
Equity basis of the joint venture investments | $ | (4,236 | ) | $ | (4,810 | ) | |
Cost of the joint venture investments in excess of the joint venture book value | 19,407 | 20,526 | |||||
Investment in unconsolidated joint ventures | $ | 15,171 | $ | 15,716 | |||
The following table summarizes the components of the Company's equity in income from unconsolidated joint ventures (in thousands):
Successor | Predecessor | ||||||||||||||||
For the year ended December 31, | September 1 through December 31, | January 1 through August 31, | |||||||||||||||
2019 | 2018 | 2017 | 2017 | ||||||||||||||
Unconsolidated joint ventures net income attributable to the Company | $ | 1,935 | $ | 2,514 | $ | 1,034 | $ | 1,332 | |||||||||
Depreciation of cost in excess of book value | (1,119 | ) | (1,119 | ) | (373 | ) | (258 | ) | |||||||||
Equity in income from unconsolidated joint ventures | $ | 816 | $ | 1,395 | $ | 661 | $ | 1,074 | |||||||||
6. Intangible Assets
The Company's intangible assets consisted of the following (in thousands):
December 31, 2018 | ||||||||||||
Gross Carrying Amount | Accumulated Amortization | Net Carrying Amount | ||||||||||
Below market ground leases (1) | $ | 49,708 | $ | (3,447 | ) | $ | 46,260 | |||||
Intangible assets, net | $ | 49,708 | $ | (3,447 | ) | $ | 46,260 | |||||
(1) | As mentioned in Note 3 Summary of Significant Accounting Policies, the Company adopted ASU 2016-02, Leases (Topic 842) on January 1, 2019. Upon adoption of this standard, the Company reclassified its below market ground lease intangible assets from |
intangible assets, net, on the consolidated balance sheet to the lease right-of-use assets.
For the year ended December 31, 2019, the Company did not carry any intangible assets and did not recognize any amortization expense related to intangible assets. For the year ended December 31, 2018, the Company recognized amortization expense related to its intangible assets of approximately $3.2 million. For the Successor period of September 1, 2017 through December 31, 2017, the Company recognized amortization expense related to its intangible assets of approximately $1.2 million.
F-31
7. Sale of Hotel Properties
During the year ended December 31, 2019, the Company sold two hotel properties in one transaction for a total
sale price of approximately $147.4 million. In connection with this transaction, the Company recorded a $21.4 million loss on
sale, which is included in (loss) gain on sale of hotel properties, net, in the accompanying consolidated statement of operations
and comprehensive income (loss). The loss on sale included approximately $0.7 million in lease termination fees as a result of early termination of the TRS Leases with the lessees at these hotel properties.
The following table discloses the hotel properties that were sold during the year ended December 31, 2019:
Hotel Property Name | Location | Sale Date | Rooms | ||||
Embassy Suites Myrtle Beach - Oceanfront Resort | Myrtle Beach, SC | June 27, 2019 | 255 | ||||
Hilton Myrtle Beach Resort | Myrtle Beach, SC | June 27, 2019 | 385 | ||||
Total | 640 | ||||||
During the year ended December 31, 2018, the Company sold six hotel properties for a total sale price of approximately $516.5 million. In connection with these transactions, the Company recorded an aggregate $18.3 million net gain on sales, which is included in (loss) gain on sale of hotel properties, net, in the accompanying consolidated statement of operations and comprehensive income (loss). The gain on sale is net of approximately $9.8 million in lease termination fees as a result of early termination of the TRS Leases with the lessees at these hotel properties.
The following table discloses the hotel properties that were sold during the year ended December 31, 2018:
Hotel Property Name | Location | Sale Date | Rooms | ||||
Embassy Suites Boston Marlborough | Marlborough, MA | February 21, 2018 | 229 | ||||
Sheraton Philadelphia Society Hill Hotel | Philadelphia, PA | March 27, 2018 | 364 | ||||
Embassy Suites Napa Valley | Napa, CA | July 13, 2018 | 205 | ||||
The Vinoy Renaissance St. Petersburg Resort & Golf Club | St. Petersburg, FL | August 28, 2018 | 362 | ||||
DoubleTree by Hilton Burlington Vermont | Burlington, VT | September 27, 2018 | 309 | ||||
Holiday Inn San Francisco - Fisherman's Wharf (1) | San Francisco, CA | October 15, 2018 | 585 | ||||
Total | 2,054 | ||||||
(1) | The Company's interests in the Holiday Inn San Francisco - Fisherman's Wharf consisted of two separate buildings, the 342-room Columbus Street building and the 243-room Annex building. On October 31, 2018, the ground lease under the Columbus Street building expired and the building was transferred to the lessor in accordance with the ground lease. On October 15, 2018, the Company separately sold the remaining 243-room Annex building for $75.3 million. In connection with the sale, the Company transferred its purchase option on the land underlying the Annex building ground lease to the buyer. The proceeds to the Company as a result of the sale were approximately $30.4 million. |
During the Successor period of September 1, 2017 through December 31, 2017, the Company sold one hotel property for a sale price of approximately $170.0 million. In conjunction with this transaction, the Company recorded a $6.6 million loss on sale, which is included in (loss) gain on sale of hotel properties, net, in the accompanying consolidated statement of operations and comprehensive income (loss). The loss on sale was due to a $7.7 million lease termination fee as a result of early termination of the TRS Lease with the lessee at the hotel property.
The following table discloses the hotel property that was sold during the Successor period of September 1, 2017 through December 31, 2017:
Hotel Property Name | Location | Sale Date | Rooms | ||||
The Fairmont Copley Plaza | Boston, MA | December 14, 2017 | 383 | ||||
Total | 383 | ||||||
F-32
During the Predecessor period of January 1, 2017 through August 31, 2017, the Company sold two hotel properties in two separate transactions for a total sale price of approximately $92.0 million. In conjunction with these transactions, the Company recorded a $1.6 million loss on sale, which is included in (loss) gain on sale of hotel properties, net, in the accompanying consolidated statement of operations and comprehensive income (loss).
The following table discloses the hotel properties that were sold during the Predecessor period of January 1, 2017 through August 31, 2017:
Hotel Property Name | Location | Sale Date | Rooms | ||||
Morgans New York | New York, NY | July 17, 2017 | 117 | ||||
Royalton New York | New York, NY | August 1, 2017 | 168 | ||||
Total | 285 | ||||||
The following table includes the condensed financial information primarily related to the two hotel properties that were sold during the Predecessor period of January 1, 2017 through August 31, 2017 included in continuing operations (in thousands):
Predecessor | |||
January 1 through August 31, | |||
2017 | |||
Total revenues | $ | 14,159 | |
Operating expenses (1) | (53,930 | ) | |
Operating loss | (39,771 | ) | |
Loss on sale of hotel properties | (1,764 | ) | |
Net loss | (41,535 | ) | |
Net loss attributable to redeemable noncontrolling interests in FelCor LP | 179 | ||
Net loss attributable to FelCor | $ | (41,356 | ) |
(1) | Operating expenses include an impairment loss of $35.1 million. |
8. Debt
The Company's debt consisted of the following (in thousands):
Outstanding Borrowings at | |||||||||||||
Number of Assets Encumbered | Interest Rate | Maturity Date | December 31, 2019 | December 31, 2018 | |||||||||
Senior notes (1)(2)(3) | — | 6.00% | June 2025 | $ | 500,484 | $ | 505,322 | ||||||
Mortgage loan (4) | 3 | 4.95% | October 2022 | 89,299 | 91,737 | ||||||||
Mortgage loan (5) | 1 | 4.94% | October 2022 | 28,785 | 29,569 | ||||||||
Mortgage loan (1)(6) | 3 | 3.36% | April 2024 | (7) | 96,000 | — | |||||||
7 | 714,568 | 626,628 | |||||||||||
Deferred financing costs, net | (841 | ) | — | ||||||||||
Debt, net | $ | 713,727 | $ | 626,628 | |||||||||
(1) | Requires payments of interest only through maturity. |
(2) | The Senior Notes (as defined below) include $25.6 million and $30.3 million at December 31, 2019 and 2018, respectively, related to fair value adjustments that RLJ pushed down to the Company's consolidated financial statements as a result of the Mergers. |
(3) | The Company has the option to redeem the Senior Notes beginning June 1, 2020 at a price of 103.0% of face value. |
(4) | Includes $1.4 million and $1.9 million at December 31, 2019 and 2018, respectively, related to fair value adjustments on the mortgage loans that RLJ pushed down to the Company's consolidated financial statements as a result of the Mergers. |
(5) | Includes $0.4 million and $0.6 million at December 31, 2019 and 2018, respectively, related to a fair value adjustment on the mortgage loan that RLJ pushed down to the Company's consolidated financial statements as a result of the Mergers. |
(6) | The hotels encumbered by the mortgage loan are cross-collateralized. |
F-33
(7) | In April 2019, the Company entered into a new mortgage loan that bears interest at LIBOR + 1.60% and provides two one year extension options. |
The 6.000% Senior Notes due 2025 (the "Senior Notes") contain certain financial covenants relating to the Company's total leverage ratio, secured leverage ratio, and interest coverage ratio. If an event of default exists, the Company is not permitted to (i) incur additional indebtedness, except to refinance maturing debt with replacement debt, as defined under our indentures; (ii) pay dividends in excess of the minimum distributions required to qualify as a REIT; (iii) repurchase capital stock; or (iv) merge. As of December 31, 2019 and 2018, the Company was in compliance with all financial covenants.
Certain mortgage agreements are subject to customary financial covenants. The Company was in compliance with all financial covenants at December 31, 2019 and 2018.
Interest Expense
During the years ended December 31, 2019 and 2018, the Company recognized $31.9 million and $37.9 million of interest expense, respectively.
During the Successor period of September 1, 2017 through December 31, 2017, the Company recognized $19.3 million of interest expense. During the Predecessor period of January 1, 2017 through August 31, 2017, the Company recognized $51.7 million of interest expense, which is net of capitalized interest of $1.1 million.
Future Minimum Principal Payments
As of December 31, 2019, the future minimum principal payments were as follows (in thousands):
2020 | $ | 2,461 | |
2021 | 2,824 | ||
2022 | 110,997 | ||
2023 | — | ||
2024 | 96,000 | ||
Thereafter | 474,888 | ||
Total (1) | $ | 687,170 | |
(1) | Excludes a total of $27.4 million related to fair value adjustments on debt. |
9. Related Party Debt
In November 2018, the Company's consolidated joint venture entered into an $85.0 million related party mortgage loan with RLJ LP, which is included in related party debt in the accompanying consolidated balance sheets. The related party
mortgage loan has an interest rate of LIBOR + 3.00% and a maturity date of November 9, 2023. The related party mortgage
loan requires payments of interest only through maturity. The hotel property owned by the Company's consolidated joint
venture is encumbered by the related party mortgage loan.
During the years ended December 31, 2019 and 2018, the Company recognized $4.5 million and $0.7 million of
interest expense, respectively, related to its related party loan with RLJ LP.
10. Fair Value
Fair Value Measurement
Fair value is defined as the price that would be received upon the sale of an asset or paid to transfer a liability in an orderly transaction between market participants at the measurement date in the principal or most advantageous market. The fair value hierarchy has three levels of inputs, both observable and unobservable:
• | Level 1 — Inputs include quoted market prices in an active market for identical assets or liabilities. |
F-34
• | Level 2 — Inputs are market data, other than Level 1, that are observable either directly or indirectly. Level 2 inputs include quoted market prices for similar assets or liabilities, quoted market prices in an inactive market, and other observable information that can be corroborated by market data. |
• | Level 3 — Inputs are unobservable and corroborated by little or no market data. |
Fair Value of Financial Instruments
The Company used the following market assumptions and/or estimation methods:
• | Cash and cash equivalents, restricted cash reserves, accounts payable and other liabilities — The carrying amounts reported in the consolidated balance sheets for these financial instruments approximate fair value because of their short term maturities. |
• | Debt — The Senior Notes had an estimated fair value of approximately $497.8 million and $492.6 million at December 31, 2019 and 2018, respectively. The Company estimated the fair value of the Senior Notes by using publicly available trading prices, market interest rates, and spreads for the Senior Notes, which are Level 2 and Level 3 inputs in the fair value hierarchy. The mortgage loans had an estimated fair value of approximately $216.5 million and $121.1 million at December 31, 2019 and 2018, respectively. The Company estimated the fair value of the mortgage loans by using a discounted cash flow model and incorporating various inputs and assumptions for the effective borrowing rates for debt with similar terms and the loan to estimated fair value of the collateral, which are Level 3 inputs in the fair value hierarchy. The total estimated fair value of the Company's debt was $714.3 million and $613.7 million at December 31, 2019 and 2018, respectively. The total carrying value of the Company's debt was $713.7 million and $626.6 million at December 31, 2019 and 2018, respectively. |
• | Related Party Debt — The Company's related party mortgage loan with RLJ LP had an estimated fair value of approximately $86.9 million and $84.1 million at December 31, 2019 and 2018, respectively. The Company estimated the fair value of the mortgage loan by using a discounted cash flow model and incorporating various inputs and assumptions for the effective borrowing rates for debt with similar terms and the loan to estimated fair value of the collateral, which are Level 3 inputs in the fair value hierarchy. The total carrying value of the Company's related party debt was $85.0 million at both December 31, 2019 and 2018. |
11. Commitments and Contingencies
Operating Leases
Lessors
As a lessor, the Company will receive lease revenue from the Lessees under its lease contracts. The lease contracts contain a specific base rent amount or a percentage rent amount, which is calculated based on a percentage of room revenues, food and beverage revenues, and other revenues at the hotel properties. The lease contracts expired on December 31, 2019 for 19 hotels. These 19 lease contracts were renewed effective January 1, 2020 for a three-year term expiring December 31, 2022. The remaining lease contracts will expire in 2021 for one hotel, 2022 for five hotels and thereafter for one hotel.
The lease revenue recognized during the year ended December 31, 2019 consisted of the following:
For the year ended December 31, 2019 | |||
Lease revenue relating to lease payments | $ | 56,796 | |
Lease revenue relating to variable lease payments | 139,899 | ||
Total related party lease revenue | $ | 196,695 | |
In 2020, the lease terms for the in-place lease agreements will be reset to market-based rental terms. At that time, the future lease payments to the Company under the noncancelable operating leases will be determined.
F-35
Lessees
As a lessee, as of December 31, 2019, six of the Company's hotel properties were subject to ground leases that cover the land underlying the respective hotels. The ground leases are classified as operating leases. The total ground lease expense was $10.2 million for the year ended December 31, 2019, which consisted of $6.6 million of fixed lease expense and $3.6 million of variable lease expense. The total ground lease expense was $16.6 million for the year ended December 31, 2018. The total ground lease expense was $5.6 million for the Successor period of September 1, 2017 through December 31, 2017. The total ground lease expense was $9.9 million for the Predecessor period of January 1, 2017 through August 31, 2017. The total ground lease expense is included in property tax, insurance and other in the accompanying consolidated statements of operations and comprehensive income (loss).
The Company's ground leases consisted of the following (in millions):
Ground Lease Expense | ||||||||||||||||||||||
Successor | Predecessor | |||||||||||||||||||||
For the year ended December 31, | September 1 through December 31, | January 1 through August 31, | ||||||||||||||||||||
Hotel Property Name | Initial Term Expiration | Extension Term(s) Expiration | 2019 | 2018 | 2017 | 2017 | ||||||||||||||||
Holiday Inn San Francisco Fisherman's Wharf (1)(2) | 2018 | — | $ | — | $ | 4.6 | $ | 1.6 | $ | 3.8 | ||||||||||||
Wyndham Boston Beacon Hill | 2028 | — | 0.9 | 0.9 | 0.3 | 0.4 | ||||||||||||||||
Wyndham San Diego Bayside | 2029 | — | 4.8 | 4.8 | 1.5 | 2.1 | ||||||||||||||||
DoubleTree Suites by Hilton Orlando Lake Buena Vista | 2032 | 2057 | 0.9 | 0.8 | 0.2 | 0.6 | ||||||||||||||||
Wyndham Pittsburgh University Center | 2038 | 2083 | 0.7 | 0.8 | 0.1 | 0.3 | ||||||||||||||||
DoubleTree by Hilton Burlington Vermont (3) | 2051 | — | — | — | 0.1 | 0.1 | ||||||||||||||||
Embassy Suites San Francisco Airport Waterfront | 2059 | — | 2.4 | 2.3 | 0.7 | 1.0 | ||||||||||||||||
Wyndham New Orleans French Quarter | 2065 | — | 0.5 | 0.5 | 0.1 | 0.4 | ||||||||||||||||
The Vinoy Renaissance St. Petersburg Resort & Golf Club (4) | 2090 | — | — | 1.9 | 1.0 | 1.2 | ||||||||||||||||
$ | 10.2 | $ | 16.6 | $ | 5.6 | $ | 9.9 | |||||||||||||||
(1) This hotel property was sold on October 15, 2018.
(2) This lease covered only a portion of the hotel property site.
(3) This hotel property was sold on September 27, 2018.
(4) This hotel property was sold on August 28, 2018.
F-36
The future lease payments for the Company's operating leases are as follows (in thousands):
December 31, 2019 | |||
2020 | $ | 4,884 | |
2021 | 4,909 | ||
2022 | 4,968 | ||
2023 | 4,990 | ||
2024 | 5,011 | ||
Thereafter | 114,008 | ||
Total future lease payments | 138,770 | ||
Imputed interest | (90,570 | ) | |
Lease liabilities | $ | 48,200 | |
The following table presents certain information related to the Company's operating leases as of December 31, 2019:
Weighted average remaining lease term | 32 years | |
Weighted average discount rate (1) | 6.85 | % |
(1) | Upon adoption of the new lease accounting standard, the discount rates used for the Company's operating leases were determined at January 1, 2019. |
Restricted Cash Reserves
The Company is obligated to maintain cash reserve funds for future capital expenditures at the hotels (including the periodic replacement or refurbishment of FF&E) as determined pursuant to the management agreements, franchise agreements and/or mortgage loan documents. The management agreements, franchise agreements and/or mortgage loan documents require the Company to reserve cash ranging typically from 4.0% to 5.0% of the individual hotel’s revenues. Any unexpended amounts will remain the property of the Company upon termination of the management agreements, franchise agreements or mortgage loan documents. As of December 31, 2019 and 2018, approximately $4.1 million and $3.2 million, respectively, was available in the restricted cash reserves for future capital expenditures, real estate taxes and insurance.
Litigation
Other than the legal proceeding mentioned below, neither the Company nor any of its subsidiaries is currently involved in any regulatory or legal proceedings that management believes will have a material and adverse effect on the Company's financial position, results of operations or cash flows.
Prior to the Mergers, an affiliate of InterContinental Hotels Group PLC ("IHG"), which previously managed three of the Company’s hotels, notified the Company that National Retirement Fund had assessed an employee withdrawal liability of $8.3 million, with required quarterly payments including interest, in connection with the termination of IHG’s management of those
hotels. The Company’s management agreements with IHG stated that it may be obligated to indemnify and hold IHG harmless
for some or all of any amount ultimately paid to National Retirement Fund with respect to the claim.
The Company plans to vigorously defend the underlying claims and, if appropriate, IHG’s demand for indemnification.
Management Agreements
As discussed in Note 2, Merger with RLJ, the Company distributed its equity interests in FelCor TRS to RLJ LP immediately after consummation of the Mergers. As a result of the distribution of its equity interests in FelCor TRS, the Company's consolidated financial statements do not include the financial information related to the Lessees' management agreements.
During the Predecessor comparative period, the Company's hotel properties were operated pursuant to long-term management agreements with initial terms ranging from 5 to 20 years. Certain hotel properties also received the benefits of a franchise agreement pursuant to management agreements with Hilton, Wyndham, Marriott and other hotel brands. The management agreements, including those that include the benefits of a franchise agreement, had a base management fee
F-37
between 2.0% and 5.0% of hotel revenues. The management companies are also eligible to receive an incentive management fee if hotel operating income, as defined in the management agreements, exceeds certain thresholds. The incentive management fee is generally calculated as a percentage of hotel operating income after the Company has received a priority return on its investment in the hotel. Management fees are included in management and franchise fee expense in the accompanying consolidated statements of operations and comprehensive income (loss). For the Predecessor period of January 1, 2017 through August 31, 2017, the Company recognized management fee expense of approximately $19.1 million.
The Wyndham management agreements guaranteed minimum levels of annual net operating income at each of the Wyndham-managed hotels for each year of the initial 10-year term to December 31, 2022, subject to an aggregate $100.0 million limit over the term and an annual $21.5 million limit. For the Predecessor period of January 1, 2017 through August 31, 2017, the Company recorded $3.8 million for the pro-rata portion of the projected aggregate full-year guarantee. The Company recognized these amounts as a reduction of Wyndham's contractual management and other fees.
Franchise Agreements
As discussed in Note 2, Merger with RLJ, the Company distributed its equity interests in FelCor TRS to RLJ LP immediately after consummation of the Mergers. As a result of the distribution of its equity interests in FelCor TRS, the Company's consolidated financial statements do not include the financial information related to the Lessees' franchise agreements.
During the Predecessor comparative period, certain of the Company’s hotel properties were operated under franchise agreements with initial terms of 15 years. These franchise agreements exclude certain hotel properties that received the benefits of a franchise agreement pursuant to management agreements with Hilton, Wyndham, Marriott and other hotel brands. In addition, The Knickerbocker is not operated with a hotel brand so the hotel did not have a franchise agreement. Franchise agreements allow the hotel properties to operate under the respective brands. Pursuant to the franchise agreements, the Company pays a royalty fee of 5.5% of room revenue, plus additional fees for marketing, central reservation systems and other franchisor costs of 4.0% of room revenue. Franchise fees are included in management and franchise fee expense in the accompanying consolidated statements of operations and comprehensive income (loss). For the Predecessor period of January 1, 2017 through August 31, 2017, the Company recognized franchise fee expense of approximately $0.8 million.
12. Equity
Successor Period
Rangers Ownership Interests/FelCor LP Partnership Interests
As of December 31, 2019, RLJ LP owned 100% of the ownership interests and was the sole managing member of Rangers. In addition, Rangers owned, through indirect interests, 99.0% of the partnership interests in FelCor LP. Rangers consolidates FelCor LP for financial reporting purposes as a result of its controlling financial interest. Rangers GP's 1.0% partnership interest in FelCor LP is recognized as a noncontrolling interest in FelCor LP on the consolidated balance sheets of Rangers.
Noncontrolling Interest in Consolidated Joint Ventures
The Company consolidates the joint venture that owns The Knickerbocker, which has a third-party partner that owns a noncontrolling 5% ownership interest in the joint venture. The third-party ownership interest is included in the noncontrolling interest in consolidated joint ventures on the consolidated balance sheets.
Consolidated Joint Venture Preferred Equity
The Company's joint venture that redeveloped The Knickerbocker raised $45.0 million ($44.4 million net of issuance costs) through the sale of redeemable preferred equity under the EB-5 Immigrant Investor Program. The purchasers received a 3.25% annual return, plus a 0.25% non-compounding annual return that was paid upon redemption. The joint venture received $0.7 million in gross proceeds during the Predecessor period of January 1, 2017 through August 31, 2017. The preferred equity raised by the joint venture is included in preferred equity in a consolidated joint venture on the consolidated balance sheets. On February 15, 2019, the Company redeemed the preferred equity in full.
F-38
Predecessor Period
Common Stock
Upon completion of the REIT Merger, on August 31, 2017, each issued and outstanding share of Common Stock was converted into the right to receive 0.362 common shares of RLJ. Accordingly, for the Successor period, FelCor no longer has any issued, outstanding, or authorized shares of Common Stock.
During the Predecessor period of January 1, 2017 through August 31, 2017, the Company declared a cash dividend (distribution) of $0.16 per share of Common Stock (unit).
Preferred Stock/Units
FelCor's Board of Directors authorized the issuance of up to 20 million shares of preferred stock in one or more series. FelCor's $1.95 Series A cumulative convertible preferred stock, par value $0.01 per share (the "Series A Preferred Stock") (units), had an annual cumulative dividend (distribution) that was payable in arrears equal to the greater of $1.95 per share (unit) or the cash distributions declared or paid for the corresponding period on the number of shares of Common Stock (units) into which the Series A Preferred Stock (units) is then convertible. Each share of Series A Preferred Stock (unit) was convertible at the holder's option to 0.7752 shares of Common Stock (units), subject to certain adjustments.
Upon completion of the REIT Merger, each issued and outstanding share of Series A Preferred Stock was converted into the right to receive one $1.95 Series A Cumulative Convertible Preferred Share, par value $0.01 per share, of RLJ. Accordingly, for the Successor period, FelCor no longer has any issued, outstanding, or authorized shares of Series A Preferred Stock.
During the Predecessor period of January 1, 2017 through August 31, 2017, the Company declared a cash dividend (distribution) of $1.30 on each share of Series A Preferred Stock (unit).
13. Equity Incentive Plan
Successor Period
As a result of the Mergers, the Company does not have an equity incentive plan.
Predecessor Period
FelCor sponsored a restricted stock and stock option plan, whereby FelCor was authorized to issue up to 6,100,000 shares of Common Stock in the form of incentive stock options, non-qualified stock options, restricted stock and restricted stock units. The stock-based grants were subject to time-based or performance-based vesting.
Restricted Stock and Restricted Stock Units
A summary of the unvested shares of restricted stock and restricted stock units is as follows:
January 1 through August 31, | ||||||
2017 | ||||||
Number of Shares | Weighted-Average Grant Date Fair Value | |||||
Unvested at the beginning of the period | 1,870,393 | $ | 6.21 | |||
Granted | 1,398,705 | 5.53 | ||||
Vested | (2,241,683 | ) | 6.52 | |||
Forfeited | (1,027,415 | ) | 4.61 | |||
Unvested at the end of the period | — | $ | — | |||
F-39
On August 15, 2017, FelCor's common stockholders approved the Mergers with RLJ. In accordance with the change-in-control provision included in the employees' restricted stock and restricted stock unit agreements, 596,560 unvested shares of restricted stock and 1,363,293 shares of unvested restricted stock units were accelerated and immediately vested on August 15, 2017. In connection with the acceleration of the unvested stock awards, FelCor recognized $8.4 million in share-based compensation expense, which is included in transaction costs in the consolidated statement of operations and comprehensive income (loss) for the Predecessor period of January 1, 2017 through August 31, 2017.
Prior to the Mergers with RLJ, FelCor's executive officers were granted market-based restricted stock units that allowed them the potential to earn common shares based on the total stockholder return relative to a peer group. The market-based awards granted in 2017 and 2016 cliff vested in three years, and the market-based awards granted in 2015 vested in three increments over four years. The fair value of the market-based awards was determined using a Monte Carlo simulation with the following assumptions:
2017 | 2016 | 2015 | |||||||||
Volatility (1) | 43.92 | % | 45.92 | % | 48.11 | % | |||||
Dividend rate (2) | $ | 0.06 | $ | 0.05 | $ | 0.04 | |||||
Risk-free interest rate | 1.51 | % | 0.93 | % | 1.32 | % | |||||
(1) | Based on the share price history. |
(2) | Based on the dividend rate at the time of the award. |
Prior to the Mergers with RLJ, FelCor's executive officers were granted time-based restricted stock unit awards in 2017 and 2016 that vested in three equal increments over three years. Other employees were granted time-based restricted stock awards that vested in equal increments over three to five years.
Prior to the Mergers with RLJ, FelCor's executive officers also received financial performance-based restricted stock unit awards in 2017 and 2016; however, the three-year performance requirement for vesting was not established at the time the award was issued. Accordingly, these awards did not have a grant date and no share-based compensation expense was recorded in the consolidated financial statements prior to the Mergers with RLJ. In accordance with the change-in-control provisions included in the restricted stock unit agreements, the financial performance shares were issued to the executive officers when the Mergers with RLJ were approved and it was included in the share-based compensation expense related to the acceleration of the unvested stock awards noted previously.
Prior to the acceleration of the unvested stock awards noted above, for the Predecessor period of January 1, 2017 through August 31, 2017, FelCor recognized approximately $2.7 million of share-based compensation expense related to the market-based and time-based restricted stock and restricted stock unit awards. The share-based compensation expense was included in general and administrative expense in the consolidated statements of operations and comprehensive income (loss). As a result of the Mergers with RLJ, there were no unvested restricted shares or units as of August 31, 2017.
The restricted stock unit grant allowed that to the extent any of FelCor's executive officers earned more shares than allowed under the share-based award plan upon the vesting of the award, the excess would be settled in cash. To the extent the excess would likely be settled in cash, these awards were accounted for as liability-based awards, and the fair value was measured at the end of each reporting period. FelCor paid $1.1 million in 2017 for the excess cash settlements for the vested awards. There was no amortization expense for the variable share-based compensation during the Predecessor period of January 1, 2017 through August 31, 2017, as FelCor's executive officers did not earn more shares than allowed under the share-based award plan.
14. Loss per Common Share/Unit
Successor Period
For the Successor period, RLJ LP, through direct and indirect wholly-owned subsidiaries, owns 100% of the ownership interests and is the sole member and partner of Rangers and FelCor LP, respectively.
Predecessor Period
Basic earnings (loss) per common share/unit is calculated by dividing net income (loss) attributable to common shareholders (unitholders) by the weighted-average number of common shares (units) outstanding during the period excluding
F-40
the weighted-average number of unvested restricted shares (units) outstanding during the period. Diluted earnings per common share/unit is calculated by dividing net income attributable to common shareholders (unitholders) by the weighted-average number of common shares (units) outstanding during the period, plus any shares (units) that could potentially be outstanding during the period. The potential shares (units) consist of the unvested restricted share (unit) grants and unvested performance units, calculated using the treasury stock method. Any anti-dilutive shares (units) have been excluded from the diluted earnings (loss) per share (unit) calculation.
Unvested share-based payment awards that contain non-forfeitable rights to dividends (distributions) or dividend (distribution) equivalents (whether paid or unpaid) are participating shares (units) and are considered in the computation of earnings (loss) per share (unit) pursuant to the two-class method. If there were any undistributed earnings allocable to the participating shares (units), they would be deducted from net income (loss) attributable to common shareholders (unitholders) used in the basic and diluted earnings (loss) per share (unit) calculations.
The limited partners’ outstanding limited partnership units in FelCor LP (which may be redeemed for common shares of beneficial interest under certain circumstances) have been excluded from the diluted earnings (loss) per share (unit) calculation as there was no effect on the per share (unit) amounts, since the limited partners’ share of income would also be added back to net income (loss) attributable to common shareholders.
The computation of basic and diluted earnings (loss) per common share (unit) is as follows (in thousands, except share/unit and per share/unit data):
Rangers Loss Per Common Share
Predecessor | |||
January 1 through August 31, | |||
2017 | |||
Numerator: | |||
Net loss attributable to Rangers | $ | (96,845 | ) |
Discontinued operations attributable to Rangers | 3,400 | ||
Loss from continuing operations attributable to Rangers | (93,445 | ) | |
Less: Preferred dividends | (16,744 | ) | |
Less: Dividends paid on unvested restricted stock | (73 | ) | |
Numerator for the loss from continuing operations attributable to Rangers common stockholders | (110,262 | ) | |
Numerator for the discontinued operations attributable to Rangers common stockholders | (3,400 | ) | |
Numerator for the loss attributable to Rangers common stockholders excluding amounts attributable to unvested restricted stock | $ | (113,662 | ) |
Denominator: | |||
Weighted-average number of common shares - basic | 137,331,743 | ||
Unvested restricted stock units | — | ||
Weighted-average number of common shares - diluted | 137,331,743 | ||
Basic and diluted loss per share: | |||
Loss from continuing operations | $ | (0.80 | ) |
Discontinued operations | $ | (0.02 | ) |
Net loss | $ | (0.83 | ) |
F-41
FelCor LP Loss Per Common Unit
Predecessor | |||
January 1 through August 31, | |||
2017 | |||
Numerator: | |||
Net loss attributable to FelCor LP | $ | (97,340 | ) |
Discontinued operations attributable to FelCor LP | 3,415 | ||
Loss from continuing operations attributable to FelCor LP | (93,925 | ) | |
Less: Preferred distributions | (16,744 | ) | |
Less: Distributions paid on FelCor unvested restricted stock | (73 | ) | |
Numerator for the loss from continuing operations attributable to FelCor LP common unitholders | (110,742 | ) | |
Numerator for the discontinued operations attributable to FelCor LP common unitholders | (3,415 | ) | |
Numerator for the net loss attributable to FelCor LP common unitholders excluding amounts attributable to FelCor unvested restricted stock | $ | (114,157 | ) |
Denominator: | |||
Weighted-average number of common units - basic | 137,941,926 | ||
Unvested restricted stock units | — | ||
Weighted-average number of common units - diluted | 137,941,926 | ||
Basic and diluted loss per unit: | |||
Loss from continuing operations | $ | (0.80 | ) |
Discontinued operations | $ | (0.02 | ) |
Net loss | $ | (0.83 | ) |
15. Income Taxes
Successor Period
The Company is considered to be a partnership for income tax purposes, and is not subject to federal, state, or local income taxes. Any taxable income or loss will be recognized by the partners. Accordingly, no federal, state, or local income taxes have been reflected in the accompanying consolidated financial statements with respect to the Company.
The Company retains an ownership of one taxable REIT subsidiary related to one hotel property (the "TRS Sub") which is treated as a C-corporation for income tax purposes. The TRS Sub pays federal, state and local income taxes on its net taxable income, and its after-tax net income will be available for distribution to the Company but it is not required to be distributed.
The Company uses the asset and liability method of accounting for income taxes of the TRS Sub. Under this method, deferred tax assets and liabilities are recognized for the estimated future tax consequences attributable to the differences between the financial statement carrying amounts of existing assets and liabilities and their respective income tax bases, and for net operating loss, capital loss and tax credit carryforwards. The deferred tax assets and liabilities are measured using the enacted income tax rates in effect for the year in which those temporary differences are expected to be realized or settled. The effect on the deferred tax assets and liabilities from a change in tax rates is recognized in earnings in the period when the net rate is enacted.
F-42
The provision for income taxes of the TRS Sub is different from the amount of income tax expense that is determined by applying the applicable U.S. statutory federal income tax rate to pretax income from continuing operations as a result of the following differences (in thousands):
For the year ended December 31, | September 1 through December 31, | ||||||||||
2019 | 2018 | 2017 | |||||||||
Expected TRS Sub federal tax expense at statutory rate | $ | 5,207 | $ | 15,746 | $ | 1,627 | |||||
Tax impact of REIT election | (4,049 | ) | (14,805 | ) | (560 | ) | |||||
Expected TRS Sub tax expense | 1,158 | 941 | 1,067 | ||||||||
Change in valuation allowance | (1,085 | ) | (363 | ) | (879 | ) | |||||
Impact of rate change | — | — | (188 | ) | |||||||
Permanent items | — | 85 | — | ||||||||
Impact of provision to return | (73 | ) | (663 | ) | — | ||||||
TRS Sub income tax expense | $ | — | $ | — | $ | — | |||||
The TRS Sub's deferred income taxes represent the tax effect of the differences between the book and tax basis of the assets and liabilities. The deferred tax assets (liabilities) of the TRS Sub include the following (in thousands):
December 31, 2019 | December 31, 2018 | ||||||
Deferred tax liabilities: | |||||||
Partnership basis | $ | (3,125 | ) | $ | (2,210 | ) | |
Prepaid expenses | — | (28 | ) | ||||
Deferred tax liabilities | $ | (3,125 | ) | $ | (2,238 | ) | |
Deferred tax assets: | |||||||
Property and equipment | $ | 8,436 | $ | 8,963 | |||
Net operating loss carryforwards | 7,517 | 7,220 | |||||
Federal historic tax credits | 631 | 631 | |||||
Other deferred tax assets | 160 | 128 | |||||
Valuation allowance | (13,619 | ) | (14,704 | ) | |||
Deferred tax assets | $ | 3,125 | $ | 2,238 | |||
Deferred tax assets are recognized only to the extent that it is more likely than not that they will be realized based on the consideration of all available evidence, including the future reversals of existing taxable temporary differences, future projected taxable income, and tax planning strategies. Valuation allowances are provided if, based upon the weight of the available evidence, it is more likely than not that some or all of the deferred tax assets will not be realized. The Company records a valuation allowance to reduce its deferred tax assets to the amount that is most likely to be utilized in future periods to offset taxable income. As of December 31, 2019 and 2018, the Company had a valuation allowance of approximately $13.6 million and $14.7 million, respectively, related to net operating loss ("NOL") carryforwards, historic tax credits, and other deferred tax assets of the TRS Sub. The Company considered all available evidence, both positive and negative, including cumulative income in recent years and its current forecast of future income in its analysis. The Company recognized a 100% valuation allowance related to the TRS Sub's net deferred tax asset because the Company believed it is more likely than not that the deferred tax assets of the TRS Sub will not be fully realized. The realization of the deferred tax assets associated with the TRS Sub's NOLs and historic tax credits was dependent on projections of future taxable income, for which there was uncertainty when considering the TRS Sub's historic results and the cyclical nature of the lodging industry. Accordingly, no provision or benefit for deferred income taxes is reflected in the accompanying consolidated statements of operations and comprehensive income (loss).
The TRS Sub's NOLs and historic tax credits begin to expire in 2036. Additionally, the annual utilization of these NOLs and historic tax credits is limited pursuant to Sections 382 and 383 of the Internal Revenue Code.
F-43
The Company is subject to examination by the U.S. Internal Revenue Service ("IRS") and various state and local jurisdictions. The tax years subject to examination vary by jurisdiction. With few exceptions, as of December 31, 2019, the Company is no longer subject to U.S. federal or state and local tax examinations by tax authorities for the tax years of 2015 and before.
The Company had no accruals for tax uncertainties as of December 31, 2019 and 2018.
Predecessor Period
For the Predecessor period, FelCor LP was a partnership for federal income tax purposes and was not subject to federal income tax. However, under its partnership agreement, FelCor LP was required to reimburse FelCor for any tax payments FelCor was required to make relative to its taxable income or loss. Accordingly, the tax information herein represents the disclosures regarding FelCor and its taxable subsidiaries.
FelCor elected to be treated as a REIT under the federal income tax laws. As a REIT, FelCor generally was not subject to federal income taxation at the corporate level on taxable income that was distributed to its stockholders. FelCor was, however, subject to certain state and local taxes on its income and property and to federal income and excise taxes on its undistributed taxable income. FelCor’s taxable REIT subsidiaries, or TRSs, formed to lease its hotel properties were subject to federal, state and local income taxes. A REIT is subject to a number of organizational and operational requirements, including a requirement that it currently distributes at least 90% of its annual taxable income to its stockholders. If FelCor fails to qualify as a REIT in any taxable year for which the statute of limitations remains open, it will be subject to federal income taxes at regular corporate rates (including any applicable alternative minimum tax) for such taxable year and may not qualify as a REIT for four subsequent years. In connection with FelCor’s election to be treated as a REIT, its charter imposed restrictions on the ownership and transfer of shares of its common stock. It was FelCor LP's intention to make distributions on its units sufficient to enable FelCor to meet its distribution obligations as a REIT.
FelCor accounted for income taxes using the asset and liability method, under which deferred tax assets and liabilities are recognized for the future tax consequences attributable to differences between the financial statement carrying amounts of existing assets and liabilities and their respective tax bases.
The following table reconciles FelCor's TRSs’ GAAP net loss to federal taxable income (in thousands):
January 1 through August 31, | |||
2017 | |||
GAAP consolidated net loss attributable to FelCor LP | $ | (97,340 | ) |
Loss allocated to FelCor LP unitholders | 495 | ||
GAAP consolidated loss attributable to FelCor | (96,845 | ) | |
GAAP net loss from REIT operations | 105,888 | ||
GAAP net income of taxable subsidiaries | 9,043 | ||
Depreciation and amortization (1) | 1,571 | ||
Employee benefits not deductible for tax | 1,531 | ||
Other book/tax differences | 5,480 | ||
Federal tax income of taxable subsidiaries before utilization of net operating losses | 17,625 | ||
Utilization of net operating loss | (17,625 | ) | |
Net federal tax income of taxable subsidiaries | $ | — | |
(1) | The book/tax differences in depreciation and amortization principally result from book and tax basis differences, differences in depreciable lives and accelerated depreciation methods. |
FelCor's state income taxes of $0.5 million are included in income tax expense in the consolidated statements of operations and comprehensive income (loss) for the period of January 1, 2017 through August 31, 2017.
F-44
The following table reconciles the REIT's GAAP net loss to taxable loss (in thousands):
January 1 through August 31, | |||
2017 | |||
GAAP net loss from REIT operations | $ | (105,888 | ) |
Book/tax differences, net: | |||
Dividend income from TRS | 17,794 | ||
Depreciation and amortization (1) | 12,908 | ||
Noncontrolling interests | (495 | ) | |
Gain/loss differences from dispositions | (46,054 | ) | |
Impairment loss not deductible for tax | 35,109 | ||
Conversion costs | (2,155 | ) | |
Compensation | 20,402 | ||
Other | 10,035 | ||
Taxable loss (2) | $ | (58,344 | ) |
(1) | The book/tax differences in depreciation and amortization primarily result from the differences in depreciable lives and accelerated depreciation methods. |
(2) | The dividend distribution requirement is 90% of any taxable income (net of capital gains). For 2017, FelCor's distributions were in excess of 100% of taxable income. |
For income tax purposes, the dividends paid consist of ordinary income, capital gains, return of capital or a combination thereof. The dividends paid per share were characterized, in accordance with the requirements under the Internal Revenue Code, as follows:
January 1 through August 31, | |||||
2017 | |||||
Amount (3) | % | ||||
Preferred Stock – Series A | |||||
Capital gains | $ | 0.9750 | 3.26 | ||
Cash liquidating distributions (1) | 0.4875 | 1.62 | |||
Non-cash liquidating distributions (2) | 28.49 | 95.12 | |||
$ | 29.9525 | 100.00 | |||
Common Stock | |||||
Capital gains | $ | 0.12 | 1.59 | ||
Cash liquidating distributions (1) | 0.10 | 1.33 | |||
Non-cash liquidating distributions (2) | 7.31 | 97.08 | |||
$ | 7.53 | 100.00 | |||
(1) | All cash dividends declared after the execution of the Merger Agreement in April 2017 were characterized as cash liquidating distributions for tax purposes. |
(2) | Represents the value per share of the RLJ shares received by FelCor shareholders upon consummation of the Mergers on August 31, 2017. |
(3) | The fourth quarter 2016 preferred and common stock distributions were paid on January 31, 2017, so they were treated as 2017 distributions for tax purposes. All 2017 cash dividends declared prior to the execution of the Merger Agreement in April 2017 were designated by FelCor as capital gains dividends. |
16. Segment Information
The Company separately evaluates the performance of each of its hotel properties. However, because each of the hotels has similar economic characteristics, facilities, and services, the hotel properties have been aggregated into a single operating segment.
17. Redeemable Noncontrolling Interests/Units in FelCor LP
In the Predecessor period, FelCor recorded the redeemable noncontrolling interests in FelCor LP, and FelCor LP recorded the redeemable units, in the mezzanine section (between liabilities and equity/partners' capital) of the consolidated balance sheets because of the redemption feature of the units. The redeemable noncontrolling interests/redeemable units held by the limited partners were redeemable for shares of Common Stock, or at the option of FelCor, for cash. Additionally, FelCor's consolidated statements of operations and comprehensive income (loss) separately present earnings attributable to the redeemable noncontrolling interests. FelCor adjusted the redeemable noncontrolling interests in FelCor LP (or redeemable units) each reporting period to reflect the greater of the carrying value based on the accumulation of historical costs or the redemption value. FelCor based the historical cost on the proportionate relationship between the carrying value of the equity associated with FelCor's common stockholders relative to that of FelCor LP's unitholders. FelCor based the redemption value on the closing price of the Common Stock at the end of the reporting period. FelCor allocated the net income (loss) to FelCor LP's noncontrolling limited partners based on their weighted average ownership percentage during the period.
At August 31, 2017, FelCor carried 610,183 outstanding limited partnership units at $4.5 million. FelCor based the value of the outstanding limited partnership units on the closing price of the Common Stock at August 31, 2017 ($7.30 per share).
F-45
The following table summarizes the changes in the redeemable noncontrolling interests (or redeemable units) (in thousands):
Predecessor | |||
January 1 through August 31, | |||
2017 | |||
Balance at beginning of the period | $ | 4,888 | |
Redemption value allocation | 196 | ||
Distributions paid to unitholders | (134 | ) | |
Net loss | (495 | ) | |
Balance at end of the period | $ | 4,455 | |
Upon completion of the Partnership Merger, each outstanding FelCor LP Common Unit was converted into 0.362 common units of limited partnership interest in RLJ LP, unless the respective limited partner of FelCor LP elected to redeem his or her FelCor LP Common Units and receive 0.362 common shares of RLJ. Accordingly, for the Successor period, the Company no longer recognizes a redeemable noncontrolling interest (or redeemable units) in FelCor LP on the consolidated balance sheets.
18. Severance
During the Predecessor period of January 1, 2017 through August 31, 2017, FelCor recognized severance charges of approximately $34.5 million (including $8.4 million of equity-based charges) related to the Mergers with RLJ. The severance charges are included in transaction costs in the consolidated statements of operations and comprehensive income (loss).
F-46
19. Supplemental Information to the Statements of Cash Flows
The following supplemental information to the Statements of Cash Flows is for both Rangers and FelCor LP (in thousands):
Successor | Predecessor | ||||||||||||||||
For the year ended December 31, | September 1 through December 31, | January 1 through August 31, | |||||||||||||||
2019 | 2018 | 2017 | 2017 | ||||||||||||||
Reconciliation of cash, cash equivalents, and restricted cash reserves | |||||||||||||||||
Cash and cash equivalents | $ | 19,572 | $ | 21,351 | $ | 14,728 | $ | 47,396 | |||||||||
Restricted cash reserves | 4,147 | 3,211 | 3,303 | 17,038 | |||||||||||||
Cash, cash equivalents, and restricted cash reserves | $ | 23,719 | $ | 24,562 | $ | 18,031 | $ | 64,434 | |||||||||
Interest paid, net of capitalized interest | $ | 37,163 | $ | 54,298 | $ | 33,410 | $ | 38,677 | |||||||||
Interest paid to a related party | $ | 4,159 | $ | 887 | $ | — | $ | — | |||||||||
Income taxes (refunded) paid | $ | — | $ | (1,770 | ) | $ | (85 | ) | $ | 1,346 | |||||||
Operating cash flow lease payments for operating leases | $ | 8,401 | |||||||||||||||
Supplemental investing and financing transactions | |||||||||||||||||
In conjunction with the sale of hotel properties, the Company recorded the following: | |||||||||||||||||
Sale of hotel properties | $ | 147,377 | $ | 516,450 | $ | 170,000 | $ | 92,000 | |||||||||
Purchase option for land subject to a ground lease | — | (44,831 | ) | — | — | ||||||||||||
Transaction costs | (2,394 | ) | (26,400 | ) | (4,107 | ) | (18,584 | ) | |||||||||
Operating prorations | (536 | ) | 68 | — | — | ||||||||||||
Proceeds from the sale of hotel properties, net | $ | 144,447 | $ | 445,287 | $ | 165,893 | $ | 73,416 | |||||||||
Supplemental non-cash transactions | |||||||||||||||||
Accrued capital expenditures | $ | 5,257 | $ | 5,345 | $ | 8,587 | $ | 3,640 | |||||||||
FelCor TRS Distribution (1) | $ | — | $ | — | $ | 51,267 | $ | — | |||||||||
(1) Refer to Note 2 for the non-cash assets and liabilities associated with the FelCor TRS distribution.
20. Selected Quarterly Financial Data (unaudited)
The tables below set forth the Company's unaudited condensed consolidated quarterly financial data for the years ended December 31, 2019 and 2018 (in thousands, except share and per share data). In the opinion of management, all adjustments (consisting of normal recurring accruals) necessary for a fair presentation of quarterly results have been reflected in the data. It is also management's opinion, however, that quarterly financial data for the hotel properties are not indicative of the financial results to be achieved in succeeding years or quarters. In order to obtain a more accurate indication of performance, there should be a review of the financial and operating results, changes in shareholders' equity and cash flows for a period of several years.
F-47
Rangers
For the year ended December 31, 2019 | |||||||||||||||
First Quarter | Second Quarter | Third Quarter | Fourth Quarter | ||||||||||||
Total revenues | $ | 49,921 | $ | 56,221 | $ | 46,392 | $ | 44,161 | |||||||
Net income (loss) and comprehensive income (loss) | $ | 12,291 | $ | (3,098 | ) | $ | 8,673 | $ | 7,257 | ||||||
Net income (loss) and comprehensive income (loss) attributable to Rangers | $ | 10,945 | $ | (3,166 | ) | $ | 8,506 | $ | 7,016 | ||||||
For the year ended December 31, 2018 | |||||||||||||||
First Quarter | Second Quarter | Third Quarter | Fourth Quarter | ||||||||||||
Total revenues | $ | 53,550 | $ | 60,650 | $ | 57,811 | $ | 45,586 | |||||||
Net income and comprehensive income | $ | 6,441 | $ | 17,111 | $ | 39,362 | $ | 12,066 | |||||||
Net income and comprehensive income attributable to Rangers | $ | 6,089 | $ | 16,533 | $ | 38,547 | $ | 11,436 | |||||||
FelCor LP
For the year ended December 31, 2019 | |||||||||||||||
First Quarter | Second Quarter | Third Quarter | Fourth Quarter | ||||||||||||
Total revenues | $ | 49,921 | $ | 56,221 | $ | 46,392 | $ | 44,161 | |||||||
Net income (loss) and comprehensive income (loss) | $ | 12,291 | $ | (3,098 | ) | $ | 8,673 | $ | 7,257 | ||||||
Net income (loss) and comprehensive income (loss) attributable to FelCor LP | $ | 11,056 | $ | (3,198 | ) | $ | 8,591 | $ | 7,087 | ||||||
For the year ended December 31, 2018 | |||||||||||||||
First Quarter | Second Quarter | Third Quarter | Fourth Quarter | ||||||||||||
Total revenues | $ | 53,550 | $ | 60,650 | $ | 57,811 | $ | 45,586 | |||||||
Net income and comprehensive income | $ | 6,441 | $ | 17,111 | $ | 39,362 | $ | 12,066 | |||||||
Net income and comprehensive income attributable to FelCor LP | $ | 6,151 | $ | 16,700 | $ | 38,936 | $ | 11,551 | |||||||
21. FelCor LP's Consolidating Financial Information
Certain of FelCor LP's 100% owned subsidiaries (FCH/PSH, L.P.; FelCor/CMB Buckhead Hotel, L.L.C.; FelCor/CMB Marlborough Hotel, L.L.C.; FelCor/CMB Orsouth Holdings, L.P.; FelCor/CMB SSF Holdings, L.P.; FelCor/CSS Holdings, L.P.; FelCor Dallas Love Field Owner, L.L.C.; FelCor Milpitas Owner, L.L.C.; FelCor TRS Borrower 4, L.L.C.; FelCor Hotel Asset Company, L.L.C.; FelCor St. Pete (SPE), L.L.C.; FelCor Esmeralda (SPE), L.L.C.; FelCor S-4 Hotels (SPE), L.L.C.;
F-48
Madison 237 Hotel, L.L.C.; Myrtle Beach Owner, L.L.C.; and Royalton 44 Hotel, L.L.C., collectively the “Subsidiary Guarantors”), together with Rangers, guaranty, fully and unconditionally, except where subject to customary release provisions as described below, and jointly and severally, our senior notes debt.
The guaranties by the Subsidiary Guarantors may be automatically and unconditionally released upon (i) the sale or other disposition of all of the capital stock of the Subsidiary Guarantor or the sale or disposition of all or substantially all of the assets of the Subsidiary Guarantor, if, in each case, as a result of such sale or disposition, such Subsidiary Guarantor ceases to be a subsidiary of FelCor LP, (ii) the consolidation or merger of any such Subsidiary Guarantor with any person other than FelCor LP, or a subsidiary of FelCor LP, if, as a result of such consolidation or merger, such Subsidiary Guarantor ceases to be a subsidiary of the Operating Partnership, (iii) a legal defeasance or covenant defeasance of the indenture, (iv) the unconditional and complete release of such Subsidiary Guarantor in accordance with the modification and waiver provisions of the indenture, or (v) the designation of a restricted subsidiary that is a Subsidiary Guarantor as an unrestricted subsidiary under and in compliance with the indenture.
For the Predecessor period, FelCor TRS was a subsidiary guarantor in the condensed consolidating balance sheet, the condensed consolidating statements of operations and comprehensive income, and the condensed consolidating statements of cash flows. Pursuant to the terms of each of the indentures governing the Senior Notes, upon completion of the distribution of the equity interests in FelCor TRS, FelCor TRS' guarantee of the Senior Notes was automatically released and FelCor TRS Holdings, L.L.C. ceased being a subsidiary guarantor of the Senior Notes. Accordingly, FelCor TRS is not a subsidiary guarantor in the FelCor LP consolidating financial information for the Company.
The following tables present the consolidating financial information for the Subsidiary Guarantors:
F-49
FelCor Lodging Limited Partnership
Condensed Consolidating Balance Sheet
December 31, 2019
(in thousands)
FelCor LP | Subsidiary Guarantors | Non-Guarantor Subsidiaries | Eliminations | Total Consolidated | |||||||||||||||
Equity investment in consolidated entities | $ | 1,722,133 | $ | — | $ | — | $ | (1,722,133 | ) | $ | — | ||||||||
Investment in hotel properties, net | — | 571,769 | 1,375,057 | — | 1,946,826 | ||||||||||||||
Investment in unconsolidated joint ventures | 15,171 | — | — | — | 15,171 | ||||||||||||||
Cash and cash equivalents | 1,985 | — | 17,587 | — | 19,572 | ||||||||||||||
Restricted cash reserves | 447 | — | 3,700 | — | 4,147 | ||||||||||||||
Related party receivable | 1,360 | 15,217 | 32,604 | — | 49,181 | ||||||||||||||
Lease right-of-use assets | 4,444 | 66,571 | 9,620 | — | 80,635 | ||||||||||||||
Prepaid expense and other assets | 1,748 | 1,888 | 3,907 | — | 7,543 | ||||||||||||||
Total assets | $ | 1,747,288 | $ | 655,445 | $ | 1,442,475 | $ | (1,722,133 | ) | $ | 2,123,075 | ||||||||
Debt, net | $ | 500,484 | $ | 24,711 | $ | 221,241 | $ | (32,709 | ) | $ | 713,727 | ||||||||
Related party debt | — | — | 85,000 | — | 85,000 | ||||||||||||||
Accounts payable and other liabilities | 7,449 | 15,017 | 10,210 | — | 32,676 | ||||||||||||||
Lease liabilities | 4,661 | 25,571 | 17,968 | — | 48,200 | ||||||||||||||
Accrued interest | 2,463 | — | — | — | 2,463 | ||||||||||||||
Related party accrued interest | — | — | 190 | — | 190 | ||||||||||||||
Total liabilities | 515,057 | 65,299 | 334,609 | (32,709 | ) | 882,256 | |||||||||||||
Partnership interests | 1,232,231 | 590,146 | 1,099,278 | (1,689,424 | ) | 1,232,231 | |||||||||||||
Total partners' capital, excluding noncontrolling interest | 1,232,231 | 590,146 | 1,099,278 | (1,689,424 | ) | 1,232,231 | |||||||||||||
Noncontrolling interest in consolidated joint ventures | — | — | 8,588 | — | 8,588 | ||||||||||||||
Total partners’ capital | 1,232,231 | 590,146 | 1,107,866 | (1,689,424 | ) | 1,240,819 | |||||||||||||
Total liabilities and partners’ capital | $ | 1,747,288 | $ | 655,445 | $ | 1,442,475 | $ | (1,722,133 | ) | $ | 2,123,075 | ||||||||
F-50
FelCor Lodging Limited Partnership
Condensed Consolidating Balance Sheet
December 31, 2018
(in thousands)
FelCor LP | Subsidiary Guarantors | Non-Guarantor Subsidiaries | Eliminations | Total Consolidated | |||||||||||||||
Equity investment in consolidated entities | $ | 1,913,418 | $ | — | $ | — | $ | (1,913,418 | ) | $ | — | ||||||||
Investment in hotel properties, net | — | 656,570 | 1,466,853 | — | 2,123,423 | ||||||||||||||
Investment in unconsolidated joint ventures | 15,716 | — | — | — | 15,716 | ||||||||||||||
Cash and cash equivalents | 10,778 | — | 10,573 | — | 21,351 | ||||||||||||||
Restricted cash reserves | 441 | — | 2,770 | — | 3,211 | ||||||||||||||
Related party receivable | — | 3,666 | 12,835 | — | 16,501 | ||||||||||||||
Intangible assets, net | — | 46,260 | — | — | 46,260 | ||||||||||||||
Prepaid expense and other assets | 1,819 | 1,297 | 3,436 | — | 6,552 | ||||||||||||||
Related party prepaid interest | — | — | 180 | — | 180 | ||||||||||||||
Total assets | $ | 1,942,172 | $ | 707,793 | $ | 1,496,647 | $ | (1,913,418 | ) | $ | 2,233,194 | ||||||||
Debt, net | $ | 505,322 | $ | — | $ | 154,015 | $ | (32,709 | ) | $ | 626,628 | ||||||||
Related party debt | — | — | 85,000 | — | 85,000 | ||||||||||||||
Accounts payable and other liabilities | 9,288 | 14,376 | 19,725 | — | 43,389 | ||||||||||||||
Accrued interest | 2,463 | — | — | — | 2,463 | ||||||||||||||
Distributions payable | — | — | 126 | — | 126 | ||||||||||||||
Total liabilities | 517,073 | 14,376 | 258,866 | (32,709 | ) | 757,606 | |||||||||||||
Partnership interests | 1,425,099 | 693,417 | 1,187,292 | (1,880,709 | ) | 1,425,099 | |||||||||||||
Total partners' capital, excluding noncontrolling interest | 1,425,099 | 693,417 | 1,187,292 | (1,880,709 | ) | 1,425,099 | |||||||||||||
Noncontrolling interest in consolidated joint ventures | — | — | 6,059 | — | 6,059 | ||||||||||||||
Preferred capital in a consolidated joint venture | — | — | 44,430 | — | 44,430 | ||||||||||||||
Total partners’ capital | 1,425,099 | 693,417 | 1,237,781 | (1,880,709 | ) | 1,475,588 | |||||||||||||
Total liabilities and partners’ capital | $ | 1,942,172 | $ | 707,793 | $ | 1,496,647 | $ | (1,913,418 | ) | $ | 2,233,194 | ||||||||
F-51
FelCor Lodging Limited Partnership
Condensed Consolidating Statement of Operations and Comprehensive Income
For the Year Ended December 31, 2019 (Successor)
(in thousands)
FelCor LP | Subsidiary Guarantors | Non-Guarantor Subsidiaries | Eliminations | Total Consolidated | |||||||||||||||
Revenues | |||||||||||||||||||
Related party lease revenue | $ | — | $ | 74,621 | $ | 122,074 | $ | — | $ | 196,695 | |||||||||
Total revenues | — | 74,621 | 122,074 | — | 196,695 | ||||||||||||||
Expenses | |||||||||||||||||||
Depreciation and amortization | 512 | 26,832 | 45,045 | — | 72,389 | ||||||||||||||
Property tax, insurance and other | (24 | ) | 19,367 | 21,622 | — | 40,965 | |||||||||||||
General and administrative | 1,066 | 159 | 64 | — | 1,289 | ||||||||||||||
Transaction costs | 164 | — | 77 | — | 241 | ||||||||||||||
Total operating expenses | 1,718 | 46,358 | 66,808 | — | 114,884 | ||||||||||||||
Other income | 39 | 10 | 10 | — | 59 | ||||||||||||||
Interest income | 898 | — | 232 | (783 | ) | 347 | |||||||||||||
Interest expense | (23,793 | ) | (765 | ) | (8,155 | ) | 783 | (31,930 | ) | ||||||||||
Related party interest expense | — | — | (4,529 | ) | — | (4,529 | ) | ||||||||||||
Loss on sale of hotel properties, net | — | (10,638 | ) | (10,813 | ) | — | (21,451 | ) | |||||||||||
Income before equity in income from unconsolidated joint ventures | (24,574 | ) | 16,870 | 32,011 | — | 24,307 | |||||||||||||
Equity in income from consolidated entities | 47,294 | — | — | (47,294 | ) | — | |||||||||||||
Equity in income from unconsolidated joint ventures | 816 | — | — | — | 816 | ||||||||||||||
Net income and comprehensive income | 23,536 | 16,870 | 32,011 | (47,294 | ) | 25,123 | |||||||||||||
Noncontrolling interest in consolidated joint ventures | — | — | (248 | ) | — | (248 | ) | ||||||||||||
Preferred distributions - consolidated joint venture | — | — | (186 | ) | — | (186 | ) | ||||||||||||
Redemption of preferred capital - consolidated joint venture | — | — | (1,153 | ) | — | (1,153 | ) | ||||||||||||
Net income and comprehensive income attributable to FelCor LP | $ | 23,536 | $ | 16,870 | $ | 30,424 | $ | (47,294 | ) | $ | 23,536 | ||||||||
F-52
FelCor Lodging Limited Partnership
Condensed Consolidating Statement of Operations and Comprehensive Income
For the Year Ended December 31, 2018 (Successor)
(in thousands)
FelCor LP | Subsidiary Guarantors | Non-Guarantor Subsidiaries | Eliminations | Total Consolidated | |||||||||||||||
Revenues | |||||||||||||||||||
Related party lease revenue | $ | — | $ | 87,898 | $ | 129,699 | $ | — | $ | 217,597 | |||||||||
Total revenues | — | 87,898 | 129,699 | — | 217,597 | ||||||||||||||
Expenses | |||||||||||||||||||
Depreciation and amortization | 458 | 31,806 | 46,227 | — | 78,491 | ||||||||||||||
Property tax, insurance and other | 134 | 27,948 | 25,672 | — | 53,754 | ||||||||||||||
General and administrative | 840 | 117 | 99 | — | 1,056 | ||||||||||||||
Transaction costs | 2,039 | 8 | 139 | — | 2,186 | ||||||||||||||
Total operating expenses | 3,471 | 59,879 | 72,137 | — | 135,487 | ||||||||||||||
Other income | 10 | — | 103 | — | 113 | ||||||||||||||
Interest income | 805 | — | 84 | (578 | ) | 311 | |||||||||||||
Interest expense | (28,428 | ) | — | (10,080 | ) | 578 | (37,930 | ) | |||||||||||
Related party interest expense | — | — | (708 | ) | — | (708 | ) | ||||||||||||
Gain on sale of hotel properties, net | — | (15,763 | ) | 34,186 | — | 18,423 | |||||||||||||
Gain on extinguishment of indebtedness, net | 12,931 | — | (1,665 | ) | — | 11,266 | |||||||||||||
Income before equity in income from unconsolidated joint ventures | (18,153 | ) | 12,256 | 79,482 | — | 73,585 | |||||||||||||
Equity in income from consolidated entities | 90,096 | — | — | (90,096 | ) | — | |||||||||||||
Equity in income from unconsolidated joint ventures | 1,395 | — | — | — | 1,395 | ||||||||||||||
Net income and comprehensive income | 73,338 | 12,256 | 79,482 | (90,096 | ) | 74,980 | |||||||||||||
Noncontrolling interest in consolidated joint ventures | — | — | (159 | ) | — | (159 | ) | ||||||||||||
Preferred distributions - consolidated joint venture | — | — | (1,483 | ) | — | (1,483 | ) | ||||||||||||
Net income and comprehensive income attributable to FelCor LP | $ | 73,338 | $ | 12,256 | $ | 77,840 | $ | (90,096 | ) | $ | 73,338 | ||||||||
F-53
FelCor Lodging Limited Partnership
Condensed Consolidating Statement of Operations and Comprehensive Income
For the Period of September 1, 2017 through December 31, 2017 (Successor)
(in thousands)
FelCor LP | Subsidiary Guarantors | Non-Guarantor Subsidiaries | Eliminations | Total Consolidated | |||||||||||||||
Revenues | |||||||||||||||||||
Related party lease revenue | $ | — | $ | 32,572 | $ | 48,687 | $ | — | $ | 81,259 | |||||||||
Total revenues | — | 32,572 | 48,687 | — | 81,259 | ||||||||||||||
Expenses | |||||||||||||||||||
Depreciation and amortization | 151 | 12,164 | 16,650 | — | 28,965 | ||||||||||||||
Property tax, insurance and other | 25 | 8,800 | 8,237 | — | 17,062 | ||||||||||||||
General and administrative | 904 | 59 | 56 | — | 1,019 | ||||||||||||||
Transaction costs | 4,079 | 105 | 9 | — | 4,193 | ||||||||||||||
Total operating expenses | 5,159 | 21,128 | 24,952 | — | 51,239 | ||||||||||||||
Interest income | 113 | — | 1 | (104 | ) | 10 | |||||||||||||
Interest expense | (15,918 | ) | — | (3,456 | ) | 104 | (19,270 | ) | |||||||||||
Loss on sale of hotel properties | — | — | (6,637 | ) | — | (6,637 | ) | ||||||||||||
Income before equity in income from unconsolidated joint ventures | (20,964 | ) | 11,444 | 13,643 | — | 4,123 | |||||||||||||
Equity in income from consolidated entities | 24,434 | — | — | (24,434 | ) | — | |||||||||||||
Equity in income from unconsolidated joint ventures | 661 | — | — | — | 661 | ||||||||||||||
Net income and comprehensive income | 4,131 | 11,444 | 13,643 | (24,434 | ) | 4,784 | |||||||||||||
Noncontrolling interest in consolidated joint ventures | — | — | (157 | ) | — | (157 | ) | ||||||||||||
Preferred distributions - consolidated joint venture | — | — | (496 | ) | — | (496 | ) | ||||||||||||
Net income and comprehensive income attributable to FelCor LP | $ | 4,131 | $ | 11,444 | $ | 12,990 | $ | (24,434 | ) | $ | 4,131 | ||||||||
F-54
FelCor Lodging Limited Partnership
Condensed Consolidating Statement of Operations and Comprehensive Loss
For the Period of January 1, 2017 through August 31, 2017 (Predecessor)
(in thousands)
FelCor LP | Subsidiary Guarantors | Non-Guarantor Subsidiaries | Eliminations | Total Consolidated | |||||||||||||||
Revenues | |||||||||||||||||||
Room revenue | $ | — | $ | 425,682 | $ | — | $ | — | $ | 425,682 | |||||||||
Food and beverage revenue | — | 90,572 | — | — | 90,572 | ||||||||||||||
Related party lease revenue | — | — | 84,509 | (84,509 | ) | — | |||||||||||||
Other revenue | 41 | 34,883 | 337 | — | 35,261 | ||||||||||||||
Total revenues | 41 | 551,137 | 84,846 | (84,509 | ) | 551,515 | |||||||||||||
Expenses | |||||||||||||||||||
Room expense | — | 112,813 | — | — | 112,813 | ||||||||||||||
Food and beverage expense | — | 71,828 | — | — | 71,828 | ||||||||||||||
Management and franchise fee expense | — | 19,901 | — | — | 19,901 | ||||||||||||||
Other operating expense | — | 147,827 | — | — | 147,827 | ||||||||||||||
Total property operating expenses | — | 352,369 | — | — | 352,369 | ||||||||||||||
Depreciation and amortization | 309 | 28,064 | 44,692 | — | 73,065 | ||||||||||||||
Impairment loss | — | 35,109 | — | — | 35,109 | ||||||||||||||
Property tax, insurance and other | 921 | 111,020 | 16,846 | (84,509 | ) | 44,278 | |||||||||||||
General and administrative | — | 8,914 | 7,092 | — | 16,006 | ||||||||||||||
Transaction costs | 68,248 | — | — | — | 68,248 | ||||||||||||||
Total operating expenses | 69,478 | 535,476 | 68,630 | (84,509 | ) | 589,075 | |||||||||||||
Other income | — | — | 100 | — | 100 | ||||||||||||||
Intercompany interest income (expense) | 241 | — | (241 | ) | — | — | |||||||||||||
Interest income | 66 | 59 | 1 | — | 126 | ||||||||||||||
Interest expense | (38,722 | ) | — | (12,968 | ) | — | (51,690 | ) | |||||||||||
Loss on sale of hotel properties, net | 2 | (1,565 | ) | (201 | ) | — | (1,764 | ) | |||||||||||
Loss on extinguishment of indebtedness | — | — | (3,278 | ) | — | (3,278 | ) | ||||||||||||
Loss before equity in income from unconsolidated joint ventures | (107,850 | ) | 14,155 | (371 | ) | — | (94,066 | ) | |||||||||||
Equity in income from consolidated entities | 12,779 | — | — | (12,779 | ) | — | |||||||||||||
Equity in income from unconsolidated joint ventures | 1,181 | (77 | ) | (30 | ) | — | 1,074 | ||||||||||||
Loss before income tax expense | (93,890 | ) | 14,078 | (401 | ) | (12,779 | ) | (92,992 | ) | ||||||||||
Income tax expense | (35 | ) | (464 | ) | — | — | (499 | ) | |||||||||||
Loss from continuing operations | (93,925 | ) | 13,614 | (401 | ) | (12,779 | ) | (93,491 | ) | ||||||||||
Loss from discontinued operations | (3,415 | ) | — | — | — | (3,415 | ) | ||||||||||||
Net loss and comprehensive loss | (97,340 | ) | 13,614 | (401 | ) | (12,779 | ) | (96,906 | ) | ||||||||||
Noncontrolling interest in consolidated joint ventures | — | 336 | 209 | — | 545 | ||||||||||||||
Preferred distributions - consolidated joint venture | — | — | (979 | ) | — | (979 | ) | ||||||||||||
Net loss and comprehensive loss attributable to FelCor LP | (97,340 | ) | 13,950 | (1,171 | ) | (12,779 | ) | (97,340 | ) | ||||||||||
Preferred distributions | (16,744 | ) | — | — | — | (16,744 | ) | ||||||||||||
Net loss and comprehensive loss attributable to FelCor LP common unitholders | $ | (114,084 | ) | $ | 13,950 | $ | (1,171 | ) | $ | (12,779 | ) | $ | (114,084 | ) | |||||
F-55
FelCor Lodging Limited Partnership
Condensed Consolidating Statement of Cash Flows
For the Year Ended December 31, 2019 (Successor)
(in thousands)
FelCor LP | Subsidiary Guarantors | Non-Guarantor Subsidiaries | Eliminations | Total Consolidated | |||||||||||||||
Operating activities: | |||||||||||||||||||
Cash flows from operating activities | $ | (30,086 | ) | $ | 46,685 | $ | 68,415 | $ | — | $ | 85,014 | ||||||||
Investing activities: | |||||||||||||||||||
Proceeds from the sale of hotel properties, net | — | 81,943 | 62,504 | — | 144,447 | ||||||||||||||
Improvements and additions to hotel properties | (162 | ) | (33,146 | ) | (28,707 | ) | — | (62,015 | ) | ||||||||||
Contributions to unconsolidated joint ventures | (603 | ) | — | — | — | (603 | ) | ||||||||||||
Intercompany financing | 238,580 | — | — | (238,580 | ) | — | |||||||||||||
Cash flows from investing activities | 237,815 | 48,797 | 33,797 | (238,580 | ) | 81,829 | |||||||||||||
Financing activities: | |||||||||||||||||||
Proceeds from borrowings | — | 25,000 | 71,000 | — | 96,000 | ||||||||||||||
Repayments of borrowings | (112 | ) | — | (2,566 | ) | — | (2,678 | ) | |||||||||||
Contributions from partners | 188,318 | — | — | — | 188,318 | ||||||||||||||
Distributions to partners | (404,722 | ) | — | — | — | (404,722 | ) | ||||||||||||
Payments of deferred financing costs | — | (340 | ) | (650 | ) | — | (990 | ) | |||||||||||
Contributions from consolidated joint venture partners | — | — | 2,281 | — | 2,281 | ||||||||||||||
Preferred distributions - consolidated joint venture | — | — | (312 | ) | — | (312 | ) | ||||||||||||
Redemption of preferred capital - consolidated joint venture | — | — | (45,583 | ) | — | (45,583 | ) | ||||||||||||
Intercompany financing | — | (120,142 | ) | (118,438 | ) | 238,580 | — | ||||||||||||
Cash flows from financing activities | (216,516 | ) | (95,482 | ) | (94,268 | ) | 238,580 | (167,686 | ) | ||||||||||
Net change in cash, cash equivalents, and restricted cash reserves | (8,787 | ) | — | 7,944 | — | (843 | ) | ||||||||||||
Cash, cash equivalents, and restricted cash reserves, beginning of year | 11,219 | — | 13,343 | — | 24,562 | ||||||||||||||
Cash, cash equivalents, and restricted cash reserves, end of year | $ | 2,432 | $ | — | $ | 21,287 | $ | — | $ | 23,719 | |||||||||
F-56
FelCor Lodging Limited Partnership
Condensed Consolidating Statement of Cash Flows
For the Year Ended December 31, 2018 (Successor)
(in thousands)
FelCor LP | Subsidiary Guarantors | Non-Guarantor Subsidiaries | Eliminations | Total Consolidated | |||||||||||||||
Operating activities: | |||||||||||||||||||
Cash flows from operating activities | $ | (53,388 | ) | $ | 93,671 | $ | 132,962 | $ | — | $ | 173,245 | ||||||||
Investing activities: | |||||||||||||||||||
Proceeds from the sale of hotel properties, net | — | 178,170 | 267,117 | — | 445,287 | ||||||||||||||
Improvements and additions to hotel properties | (4 | ) | (27,530 | ) | (46,850 | ) | — | (74,384 | ) | ||||||||||
Intercompany financing | 560,256 | — | — | (560,256 | ) | — | |||||||||||||
Cash flows from investing activities | 560,252 | 150,640 | 220,267 | (560,256 | ) | 370,903 | |||||||||||||
Financing activities: | |||||||||||||||||||
Proceeds from borrowings - related party | — | — | 85,000 | — | 85,000 | ||||||||||||||
Repayments of borrowings | (538,814 | ) | — | (115,842 | ) | — | (654,656 | ) | |||||||||||
Contributions from partners | 732,319 | — | — | — | 732,319 | ||||||||||||||
Distributions to partners | (698,787 | ) | — | — | — | (698,787 | ) | ||||||||||||
Payment of deferred financing costs | — | — | (10 | ) | — | (10 | ) | ||||||||||||
Preferred distributions - consolidated joint venture | — | — | (1,483 | ) | — | (1,483 | ) | ||||||||||||
Intercompany financing | — | (244,311 | ) | (315,945 | ) | 560,256 | — | ||||||||||||
Cash flows from financing activities | (505,282 | ) | (244,311 | ) | (348,280 | ) | 560,256 | (537,617 | ) | ||||||||||
Net change in cash, cash equivalents, and restricted cash reserves | 1,582 | — | 4,949 | — | 6,531 | ||||||||||||||
Cash, cash equivalents, and restricted cash reserves, beginning of year | 9,637 | — | 8,394 | — | 18,031 | ||||||||||||||
Cash, cash equivalents, and restricted cash reserves, end of year | $ | 11,219 | $ | — | $ | 13,343 | $ | — | $ | 24,562 | |||||||||
F-57
FelCor Lodging Limited Partnership
Condensed Consolidating Statement of Cash Flows
For the Period of September 1, 2017 through December 31, 2017 (Successor)
(in thousands)
FelCor LP | Subsidiary Guarantors | Non-Guarantor Subsidiaries | Eliminations | Total Consolidated | |||||||||||||||
Operating activities: | |||||||||||||||||||
Cash flows from operating activities | $ | (44,202 | ) | $ | (11,078 | ) | $ | (16,872 | ) | $ | — | $ | (72,152 | ) | |||||
Investing activities: | |||||||||||||||||||
Proceeds from the sale of hotel properties, net | — | — | 165,893 | — | 165,893 | ||||||||||||||
Improvements and additions to hotel properties | — | (5,704 | ) | (17,933 | ) | — | (23,637 | ) | |||||||||||
Intercompany financing | 108,590 | — | — | (108,590 | ) | — | |||||||||||||
Cash flows from investing activities | 108,590 | (5,704 | ) | 147,960 | (108,590 | ) | 142,256 | ||||||||||||
Financing activities: | |||||||||||||||||||
Repayments of borrowings | (990 | ) | — | (1,174 | ) | — | (2,164 | ) | |||||||||||
Contributions from partners | 130,076 | — | — | — | 130,076 | ||||||||||||||
Distributions to partners | (187,616 | ) | — | — | — | (187,616 | ) | ||||||||||||
Distribution of FelCor TRS | — | (51,867 | ) | — | — | (51,867 | ) | ||||||||||||
Distributions to preferred unitholders | (4,186 | ) | — | — | — | (4,186 | ) | ||||||||||||
Payment of deferred financing costs | — | — | (254 | ) | — | (254 | ) | ||||||||||||
Preferred distributions - consolidated joint venture | — | — | (496 | ) | — | (496 | ) | ||||||||||||
Intercompany financing | — | 20,142 | (128,732 | ) | 108,590 | — | |||||||||||||
Cash flows from financing activities | (62,716 | ) | (31,725 | ) | (130,656 | ) | 108,590 | (116,507 | ) | ||||||||||
Net change in cash, cash equivalents, and restricted cash reserves | 1,672 | (48,507 | ) | 432 | — | (46,403 | ) | ||||||||||||
Cash, cash equivalents, and restricted cash reserves, beginning of period | 7,965 | 48,507 | 7,962 | — | 64,434 | ||||||||||||||
Cash, cash equivalents, and restricted cash reserves, end of period | $ | 9,637 | $ | — | $ | 8,394 | $ | — | $ | 18,031 | |||||||||
F-58
FelCor Lodging Limited Partnership
Condensed Consolidating Statement of Cash Flows
For the Period of January 1, 2017 through August 31, 2017 (Predecessor)
(in thousands)
FelCor LP | Subsidiary Guarantors | Non-Guarantor Subsidiaries | Eliminations | Total Consolidated | |||||||||||||||
Operating activities: | |||||||||||||||||||
Cash flows from operating activities | $ | (40,773 | ) | $ | 85,899 | $ | 54,214 | $ | — | $ | 99,340 | ||||||||
Investing activities: | |||||||||||||||||||
Proceeds from the sale of hotel properties, net | (696 | ) | 74,281 | (169 | ) | — | 73,416 | ||||||||||||
Improvements and additions to hotel properties | 1 | (16,727 | ) | (47,076 | ) | — | (63,802 | ) | |||||||||||
Distributions from unconsolidated joint ventures in excess of earnings | 840 | — | — | — | 840 | ||||||||||||||
Intercompany financing | 91,391 | — | — | (91,391 | ) | — | |||||||||||||
Cash flows from investing activities | 91,536 | 57,554 | (47,245 | ) | (91,391 | ) | 10,454 | ||||||||||||
Financing activities: | |||||||||||||||||||
Proceeds from borrowings | — | — | 66,000 | — | 66,000 | ||||||||||||||
Repayment of borrowings | — | — | (121,691 | ) | — | (121,691 | ) | ||||||||||||
Distributions to preferred unitholders | (18,836 | ) | — | — | — | (18,836 | ) | ||||||||||||
Distributions to common unitholders | (30,926 | ) | — | — | — | (30,926 | ) | ||||||||||||
Distributions to consolidated joint venture partners | — | — | (150 | ) | — | (150 | ) | ||||||||||||
Contributions from consolidated joint venture partners | — | 333 | — | — | 333 | ||||||||||||||
Net proceeds from the issuance of preferred capital in a consolidated joint venture | — | — | 647 | — | 647 | ||||||||||||||
Intercompany financing | — | (140,853 | ) | 49,462 | 91,391 | — | |||||||||||||
Other | (6,568 | ) | — | (977 | ) | — | (7,545 | ) | |||||||||||
Cash flows from financing activities | (56,330 | ) | (140,520 | ) | (6,709 | ) | 91,391 | (112,168 | ) | ||||||||||
Net change in cash, cash equivalents, and restricted cash reserves | (5,567 | ) | 2,933 | 260 | — | (2,374 | ) | ||||||||||||
Cash, cash equivalents, and restricted cash reserves, beginning of period | 13,532 | 45,574 | 7,702 | — | 66,808 | ||||||||||||||
Cash, cash equivalents, and restricted cash reserves, end of period | $ | 7,965 | $ | 48,507 | $ | 7,962 | $ | — | $ | 64,434 | |||||||||
F-59
Rangers Sub I, LLC and FelCor Lodging Limited Partnership
Schedule III - Real Estate and Accumulated Depreciation
December 31, 2019
(amounts in thousands)
Initial Costs | Costs Capitalized Subsequent to Acquisition | Gross Amount at December 31, 2019 | ||||||||||||||||||||||||||||||||||
Description | Debt | Land & Improvements | Building & Improvements | Land, Building & Improvements | Land & Improvements | Buildings & Improvements | Total (1) | Accumulated Depreciation | Date Acquired | Depreciation Life | ||||||||||||||||||||||||||
DoubleTree Suites by Hilton Austin | — | 7,072 | 50,827 | 827 | 7,155 | 51,571 | 58,726 | 3,031 | 2017 | 15 - 40 years | ||||||||||||||||||||||||||
DoubleTree Suites by Hilton Orlando - Lake Buena Vista | — | 896 | 44,508 | 752 | 904 | 45,252 | 46,156 | 2,781 | 2017 | 15 - 40 years | ||||||||||||||||||||||||||
Embassy Suites Atlanta - Buckhead | — | 31,279 | 46,015 | 5,256 | 31,451 | 51,099 | 82,550 | 2,895 | 2017 | 15 - 40 years | ||||||||||||||||||||||||||
Embassy Suites Birmingham | 21,744 | 10,495 | 33,568 | 499 | 10,495 | 34,067 | 44,562 | 2,097 | 2017 | 15 - 40 years | ||||||||||||||||||||||||||
Embassy Suites Dallas - Love Field | 25,000 | 6,408 | 34,694 | 1,306 | 6,413 | 35,995 | 42,408 | 2,140 | 2017 | 15 - 40 years | ||||||||||||||||||||||||||
Embassy Suites Deerfield Beach - Resort & Spa | 28,785 | 7,527 | 56,128 | 3,231 | 7,682 | 59,204 | 66,886 | 3,502 | 2017 | 15 - 40 years | ||||||||||||||||||||||||||
Embassy Suites Fort Lauderdale 17th Street | 32,594 | 30,933 | 54,592 | 3,068 | 31,160 | 57,433 | 88,593 | 3,575 | 2017 | 15 - 40 years | ||||||||||||||||||||||||||
Embassy Suites Los Angeles - International Airport South | 50,000 | 13,110 | 94,733 | 1,625 | 13,168 | 96,300 | 109,468 | 5,691 | 2017 | 15 - 40 years | ||||||||||||||||||||||||||
Embassy Suites Mandalay Beach - Hotel & Resort | — | 35,769 | 53,280 | 1,897 | 35,833 | 55,113 | 90,946 | 3,414 | 2017 | 15 - 40 years | ||||||||||||||||||||||||||
Embassy Suites Miami - International Airport | — | 14,765 | 18,099 | 3,186 | 15,057 | 20,993 | 36,050 | 1,454 | 2017 | 15 - 40 years | ||||||||||||||||||||||||||
Embassy Suites Milpitas Silicon Valley | — | 43,157 | 26,399 | 9,914 | 43,369 | 36,101 | 79,470 | 2,280 | 2017 | 15 - 40 years | ||||||||||||||||||||||||||
Embassy Suites Minneapolis - Airport | 34,961 | 7,248 | 41,202 | 15,930 | 9,673 | 54,707 | 64,380 | 3,767 | 2017 | 15 - 40 years | ||||||||||||||||||||||||||
Embassy Suites Orlando - International Drive South/Convention Center | — | 4,743 | 37,687 | 1,351 | 4,833 | 38,948 | 43,781 | 2,356 | 2017 | 15 - 40 years | ||||||||||||||||||||||||||
Embassy Suites Phoenix - Biltmore | 21,000 | 24,680 | 24,487 | 2,413 | 24,719 | 26,861 | 51,580 | 1,694 | 2017 | 15 - 40 years | ||||||||||||||||||||||||||
Embassy Suites San Francisco Airport - South San Francisco | — | 39,616 | 55,163 | 7,488 | 39,654 | 62,613 | 102,267 | 3,866 | 2017 | 15 - 40 years | ||||||||||||||||||||||||||
Embassy Suites San Francisco Airport - Waterfront | — | 3,698 | 85,270 | 3,791 | 3,961 | 88,798 | 92,759 | 5,720 | 2017 | 15 - 40 years | ||||||||||||||||||||||||||
San Francisco Marriott Union Square | — | 46,773 | 107,841 | 12,948 | 46,876 | 120,686 | 167,562 | 7,417 | 2017 | 15 - 40 years | ||||||||||||||||||||||||||
The Knickerbocker New York (2) | 85,000 | 113,613 | 119,453 | 1,613 | 113,622 | 121,057 | 234,679 | 7,056 | 2017 | 15 - 40 years | ||||||||||||||||||||||||||
The Mills House Wyndham Grand Hotel | — | 9,599 | 68,932 | 664 | 9,601 | 69,594 | 79,195 | 4,093 | 2017 | 15 - 40 years | ||||||||||||||||||||||||||
Wyndham Boston Beacon Hill | — | 174 | 51,934 | 1,507 | 178 | 53,437 | 53,615 | 11,142 | 2017 | 10 years | ||||||||||||||||||||||||||
Wyndham Houston - Medical Center Hotel & Suites | — | 7,776 | 43,475 | 237 | 7,793 | 43,695 | 51,488 | 2,601 | 2017 | 15 - 40 years | ||||||||||||||||||||||||||
Wyndham New Orleans - French Quarter | — | 300 | 72,711 | 670 | 300 | 73,381 | 73,681 | 4,348 | 2017 | 15 - 40 years | ||||||||||||||||||||||||||
F-60
Initial Costs | Costs Capitalized Subsequent to Acquisition | Gross Amount at December 31, 2019 | ||||||||||||||||||||||||||||||||||
Description | Debt | Land & Improvements | Building & Improvements | Land, Building & Improvements | Land & Improvements | Buildings & Improvements | Total (1) | Accumulated Depreciation | Date Acquired | Depreciation Life | ||||||||||||||||||||||||||
Wyndham Philadelphia Historic District | — | 8,367 | 51,914 | 666 | 8,403 | 52,544 | 60,947 | 3,099 | 2017 | 15 - 40 years | ||||||||||||||||||||||||||
Wyndham Pittsburgh University Center | — | 154 | 31,625 | 286 | 158 | 31,907 | 32,065 | 1,880 | 2017 | 15 - 40 years | ||||||||||||||||||||||||||
Wyndham San Diego Bayside | — | 989 | 29,440 | 4,364 | 1,079 | 33,714 | 34,793 | 6,088 | 2017 | 11 years | ||||||||||||||||||||||||||
Wyndham Santa Monica At The Pier | — | 27,054 | 45,866 | 616 | 27,081 | 46,455 | 73,536 | 2,767 | 2017 | 15 - 40 years | ||||||||||||||||||||||||||
$ | 299,084 | $ | 496,195 | $ | 1,379,843 | $ | 86,105 | $ | 500,618 | $ | 1,461,525 | $ | 1,962,143 | $ | 100,754 | |||||||||||||||||||||
(1) The aggregate cost of real estate for federal income tax purposes was approximately $1.9 billion at December 31, 2019.
(2) In November 2018, the Company's consolidated joint venture entered into an $85.0 million related party mortgage loan with RLJ LP.
F-61
The change in the total cost of the hotel properties is as follows:
Successor | Predecessor | ||||||||||||||||
2019 | 2018 | September 1 through December 31, 2017 | January 1 through August 31, 2017 | ||||||||||||||
Reconciliation of Land and Buildings and Improvements | |||||||||||||||||
Balance at the beginning of the period (1) | $ | 2,087,622 | $ | 2,398,753 | $ | 2,537,854 | $ | 2,108,117 | |||||||||
Add: Improvements | 38,256 | 45,726 | 22,305 | 30,403 | |||||||||||||
Less: Sale of hotel properties | (163,735 | ) | (356,857 | ) | (161,406 | ) | (133,922 | ) | |||||||||
Balance at the end of the period before impairment charges (1) | $ | 1,962,143 | $ | 2,087,622 | $ | 2,398,753 | $ | 2,004,598 | |||||||||
Cumulative impairment charges on the real estate assets owned at the end of the period | — | — | — | (55,145 | ) | ||||||||||||
Balance at the end of the period after impairment charges | $ | 1,962,143 | $ | 2,087,622 | $ | 2,398,753 | $ | 1,949,453 | |||||||||
(1) | The balance at the end of the Predecessor period of January 1, 2017 through August 31, 2017 does not equal the balance at the beginning of the Successor period of September 1, 2017 through December 31, 2017 due to the impact of RLJ electing to apply pushdown accounting to the Company's consolidated financial statements in order to reflect the new basis of accounting established by RLJ for the individual assets acquired in the Mergers on August 31, 2017. |
The change in the accumulated depreciation of the real estate assets is as follows:
Successor | Predecessor | ||||||||||||||||
2019 | 2018 | September 1 through December 31, 2017 | January 1 through August 31, 2017 | ||||||||||||||
Reconciliation of Accumulated Depreciation | |||||||||||||||||
Balance at the beginning of the period (1) | $ | (60,867 | ) | $ | (18,533 | ) | $ | — | $ | (716,376 | ) | ||||||
Add: Depreciation for the period | (46,012 | ) | (51,387 | ) | (19,518 | ) | (37,966 | ) | |||||||||
Less: Sale of hotel properties | 6,125 | 9,053 | 985 | 13,838 | |||||||||||||
Balance at the end of the period (1) | $ | (100,754 | ) | $ | (60,867 | ) | $ | (18,533 | ) | $ | (740,504 | ) | |||||
(1) | The balance at the end of the Predecessor period of January 1, 2017 through August 31, 2017 does not equal the balance at the beginning of the Successor period of September 1, 2017 through December 31, 2017 due to the impact of RLJ electing to apply pushdown accounting to the Company's consolidated financial statements in order to reflect the new basis of accounting established by RLJ for the individual assets acquired in the Mergers on August 31, 2017. |
F-62