Attached files
| file | filename |
|---|---|
| EX-99.1 - EXHIBIT 99.1 - Fossil Group, Inc. | tm209726d1_ex99-1.htm |
| EX-10.1 - EXHIBIT 10.1 - Fossil Group, Inc. | tm209726d1_ex10-1.htm |
| 8-K - FORM 8-K - Fossil Group, Inc. | tm209726-1_8k.htm |
Exhibit 99.2
 |
Preliminary Draft - Confidential A m e n d m e n t D i s c u s s i o nM a t e r i a l s F e b r u a r y2 0 2 0 |
 |
Preliminary Draft - Confidential This presentation has been prepared solely for informational purposes only and the exclusive use of the party to whom the presentation has been delivered (such party, together with its subsidiaries and affiliates, the “Recipient”). This presentation does not purport to be all-inclusive or to contain all of the information that the Recipient may require. Fossil Group, Inc. (the “Company”) does not make any representation or warranty, either express or implied, as to the accuracy, completeness or reliability of the information contained in this presentation. Any estimates or projections contained in this presentation as to events that may occur in the future (including projections of future financial performance and forward-looking statements) are based upon assumptions and analysis that the Company believes, as of the date hereof, provided reasonable basis thereof. The presentation may include certain forward-looking statements and projections provided by the Company. Any such statements and projections reflect various estimates and assumptions by the Company concerning anticipated results. No representations or warranties are made by the Company as to the accuracy of any such statements or projections. Whether or not any such forward-looking statements or projections are in fact achieved will depend upon future events, some of which are not within the control of the Company. Accordingly, actual results may vary from the projected results and such variations may be material. Among the factors that could cause actual results to differ materially include the risks and uncertainties set forth in the Company’s most recent Annual Report on Form 10-K and subsequent Quarterly Reports on Form 10-Q filed with the Securities and Exchange Commission. The Recipient should consider these factors in evaluating, and are cautioned not to place undue reliance on, the forward-looking statements contained herein. Statements contained herein describing documents and agreements are summaries only and such summaries are qualified in their entirety by such documents and agreements. Nothing contained herein is, or shall be relied upon as, a promise or representation as to the past or future. The Company expressly disclaims any and all liability relating to or resulting from the use of this presentation. In addition, the information contained in this presentation is (1) as of the date hereof in the case of information about the Company and (2) as the date of such information from persons other than the Company. The Company has no obligation, and takes no duty, to update such information, including in the event that such information becomes inaccurate. This presentation includes certain non-GAAP financial measures, including Adjusted EBITDA and Free Cash Flow. While the Company believes Adjusted EBITDA and Free Cash Flow are useful measures for investors, they are not presented in accordance with GAAP. You should not consider non-GAAP measures in isolation or as a substitute for items calculated in accordance with GAAP. In addition, Adjusted EBITDA has inherent material limitations as a performance measure because it adds back certain expenses to net income, resulting in those expenses not being taken into account in the applicable financial measure. Because not all companies use identical calculations, the presentation herein of non-GAAP financial measures may not be comparable to other similarly titled measures of other companies. This presentation also includes references to constant currency financial information, which is a non-GAAP financial measure. To calculate amounts on a constant currency basis, amounts for the current year for entities reporting in currencies other than the U.S. dollar are translated into U.S. dollars at the average rates during the comparable period of the prior fiscal year. We present constant currency information to provide investors with a basis to evaluate how our underlying business performed excluding the effects of foreign currency exchange rate fluctuations. The constant currency financial information presented herein should not be considered a substitute for, or superior to, the measures of financial performance prepared in accordance with GAAP. The Recipient acknowledges that the Company considers this presentation and all information contained herein to include confidential, sensitive and proprietary information. The Recipient agrees that the information in this presentation is Confidential Information within the meaning of that certain Confidentiality Agreement, dated as of February 3, 2020, by and between the Recipient and the Company (the “Confidentiality Agreement”) and is subject to the limitations on use and disclosure and other terms and conditions of the Confidentiality Agreement. |
 |
Preliminary Draft - Confidential Table of Contents I. Executive Summary II. Q4 2019 Update III. 2020 Budget IV. Overview of Amendment V. Appendix |
 |
Preliminary Draft - Confidential Executive Summary |
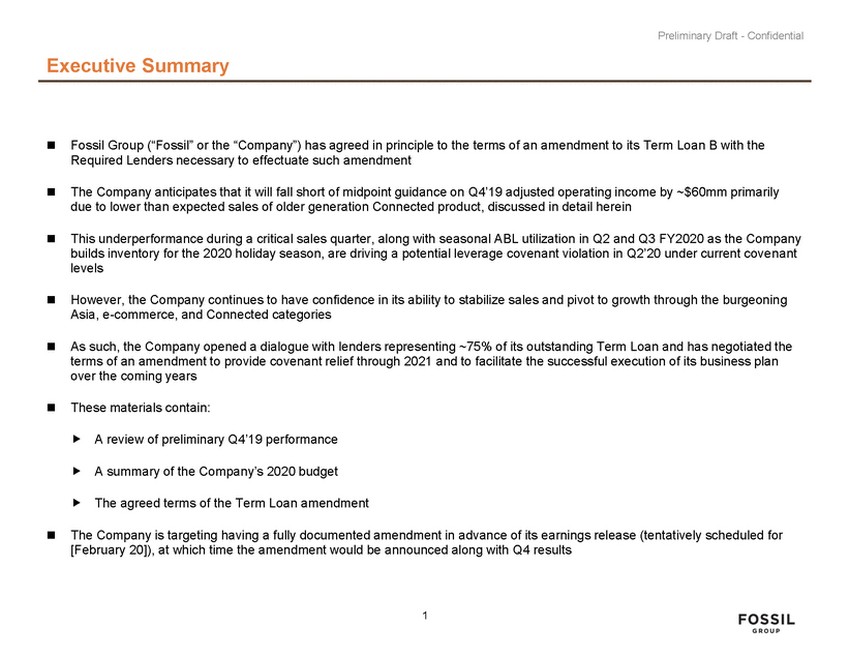 |
Preliminary Draft - Confidential Executive Summary Fossil Group (Fossil or the Company) has agreed in principle to the terms of an amendment to its Term Loan B with the Required Lenders necessary to effectuate such amendment The Company anticipates that it will fall short of midpoint guidance on Q419 adjusted operating income by ~$60mm primarily due to lower than expected sales of older generation Connected product, discussed in detail herein This underperformance during a critical sales quarter, along with seasonal ABL utilization in Q2 and Q3 FY2020 as the Company builds inventory for the 2020 holiday season, are driving a potential leverage covenant violation in Q220 under current covenant levels However, the Company continues to have confidence in its ability to stabilize sales and pivot to growth through the burgeoning Asia, e-commerce, and Connected categories As such, the Company opened a dialogue with lenders representing ~75% of its outstanding Term Loan and has negotiated the terms of an amendment to provide covenant relief through 2021 and to facilitate the successful execution of its business plan over the coming years These materials contain: A review of preliminary Q419 performance A summary of the Companys 2020 budget The agreed terms of the Term Loan amendment The Company is targeting having a fully documented amendment in advance of its earnings release (tentatively scheduled for [February 20]), at which time the amendment would be announced along with Q4 results 1 |
 |
Preliminary Draft - Confidential Q4 2019 Update |
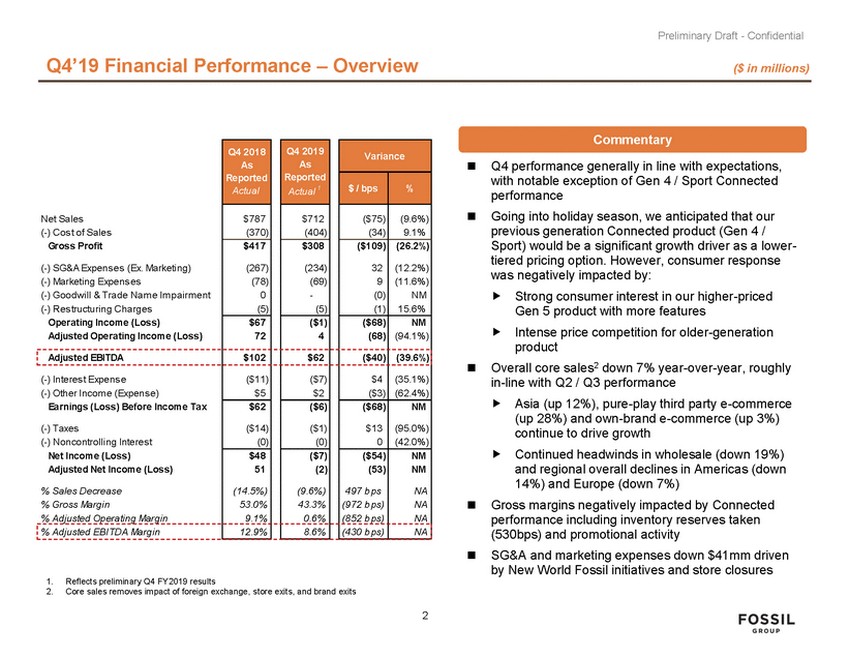 |
Preliminary Draft - Confidential Q419 Financial Performance – Overview ($ in millions) Commentary Q4 performance generally in line with expectations, with notable exception of Gen 4 / Sport Connected performance Going into holiday season, we anticipated that our previous generation Connected product (Gen 4 / Sport) would be a significant growth driver as a lower-tiered pricing option. However, consumer response was negatively impacted by: Strong consumer interest in our higher-priced Gen 5 product with more features Intense price competition for older-generation product Overall core sales2 down 7% year-over-year, roughly in-line with Q2 / Q3 performance Asia (up 12%), pure-play third party e-commerce (up 28%) and own-brand e-commerce (up 3%) continue to drive growth Continued headwinds in wholesale (down 19%) and regional overall declines in Americas (down 14%) and Europe (down 7%) Gross margins negatively impacted by Connected performance including inventory reserves taken (530bps) and promotional activity SG&A and marketing expenses down $41mm driven by New World Fossil initiatives and store closures 1.Reflects preliminary Q4 FY2019 results 2.Core sales removes impact of foreign exchange, store exits, and brand exits 2 Net Sales (-) Cos t of Sales Gross Profit (-) SG&A Expens es (Ex. Marketing) (-) Marketing Expens es (-) Goodwill & Trade Nam e Im pairm ent (-) Res tructuring Charges Operating Income (Loss) Adjusted Operating Income (Loss) Q4 2018 As Reported Actual Q4 2019 As Reported Actual 1 Variance $ / bps % $787 (370) $712 (404) ($75) (34) (9.6%) 9.1% $417 (267) (78) 0 (5) $308 (234) (69) - (5) ($109) 32 9 (0) (1) (26.2%) (12.2%) (11.6%) NM 15.6% $67 72 ($1) 4 ($68) (68) NM (94.1%) Adjusted EBITDA $102 $62 ($40) (39.6%) (-) Interes t Expens e (-) Other Incom e (Expens e) Earnings (Loss) Before Income Tax (-) Taxes (-) Noncontrolling Interes t Net Income (Loss) Adjusted Net Income (Loss) % Sales Decrease % Gross Margin % Adjusted Operating Margin ($11) $5 ($7) $2 $4 ($3) (35.1%) (62.4%) $62 ($14) (0) ($6) ($1) (0) ($68) $13 0 NM (95.0%) (42.0%) $48 51 (14.5%) 53.0% 9.1% ($7) (2) (9.6%) 43.3% 0.6% ($54) (53) 497 b ps (972 b ps) (852 b ps) NM NM NA NA NA % Adjusted EBITDA Margin 12.9% 8.6% (430 b ps) NA |
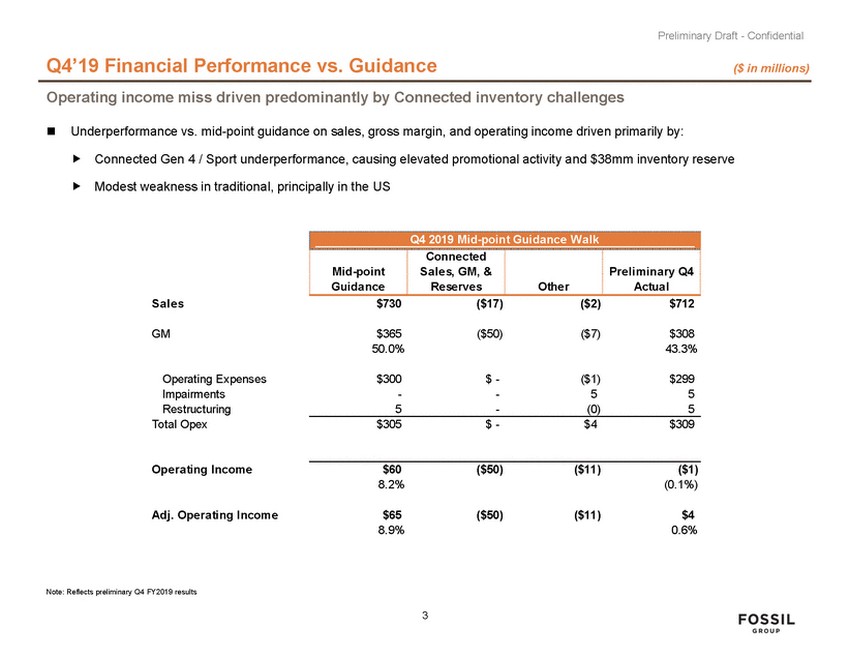 |
Preliminary Draft - Confidential Q419 Financial Performance vs. Guidance ($ in millions) Operating income miss driven predominantly by Connected inventory challenges Underperformance vs. mid-point guidance on sales, gross margin, and operating income driven primarily by: Connected Gen 4 / Sport underperformance, causing elevated promotional activity and $38mm inventory reserve Modest weakness in traditional, principally in the US Sales $730 ($17) ($2) $712 GM $365 50.0% ($50) ($7) $308 43.3% Operating Expenses Impairments Restructuring Total Opex $300 - $ - - ($1) 5 $299 5 5 - (0) 5 $305 $ - $4 $309 Operating Income $60 8.2% ($50) ($11) ($1) (0.1%) Adj. Operating Income $65 8.9% ($50) ($11) $4 0.6% Note: Reflects preliminary Q4 FY2019 results 3 Q4 2019 Mid-point Guida nce Wa lk Mid-point Guidance Connected Sales, GM, & Reserves Other Preliminary Q4 Actual |
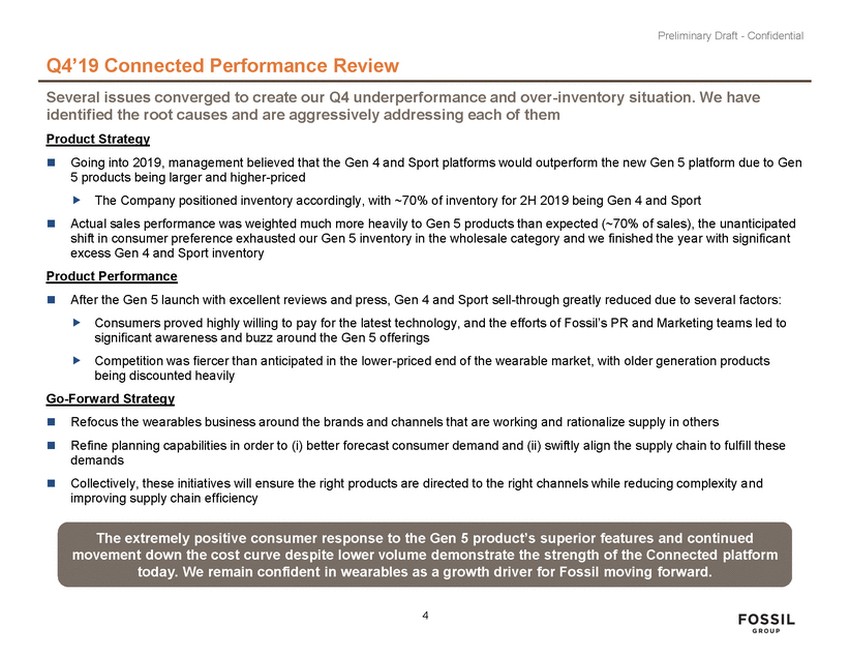 |
Preliminary Draft - Confidential Q419 Connected Performance Review Several issues converged to create our Q4 underperformance and over-inventory situation. We have identified the root causes and are aggressively addressing each of them Product Strategy Going into 2019, management believed that the Gen 4 and Sport platforms would outperform the new Gen 5 platform due to Gen 5 products being larger and higher-priced The Company positioned inventory accordingly, with ~70% of inventory for 2H 2019 being Gen 4 and Sport Actual sales performance was weighted much more heavily to Gen 5 products than expected (~70% of sales), the unanticipated shift in consumer preference exhausted our Gen 5 inventory in the wholesale category and we finished the year with significant excess Gen 4 and Sport inventory Product Performance After the Gen 5 launch with excellent reviews and press, Gen 4 and Sport sell-through greatly reduced due to several factors: Consumers proved highly willing to pay for the latest technology, and the efforts of Fossils PR and Marketing teams led to significant awareness and buzz around the Gen 5 offerings Competition was fiercer than anticipated in the lower-priced end of the wearable market, with older generation products being discounted heavily Go-Forward Strategy Refocus the wearables business around the brands and channels that are working and rationalize supply in others Refine planning capabilities in order to (i) better forecast consumer demand and (ii) swiftly align the supply chain to fulfill these demands Collectively, these initiatives will ensure the right products are directed to the right channels while reducing complexity and improving supply chain efficiency The extremely positive consumer response to the Gen 5 products superior features and continued movement down the cost curve despite lower volume demonstrate the strength of the Connected platform today. We remain confident in wearables as a growth driver for Fossil moving forward. 4 |
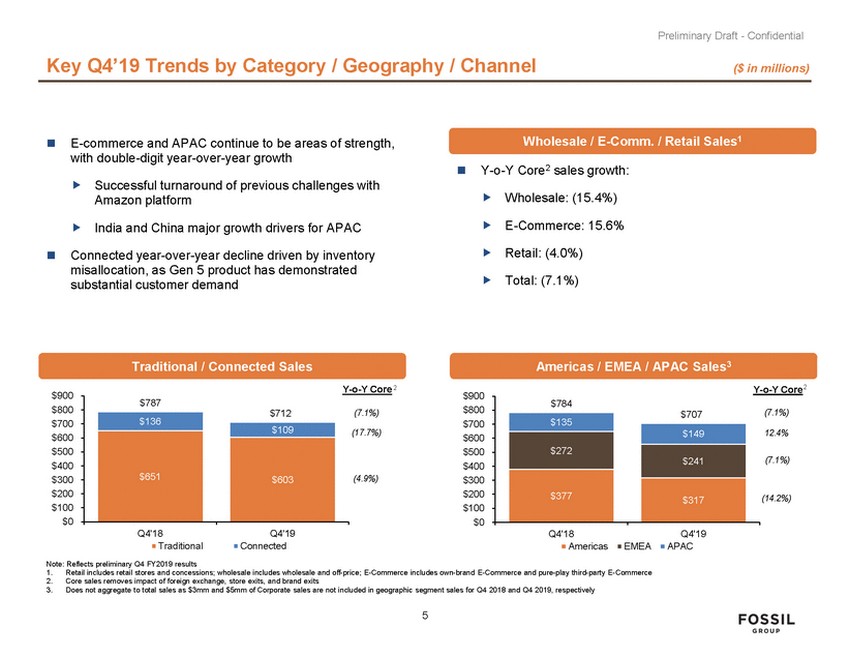 |
Preliminary Draft - Confidential Key Q419 Trends by Category / Geography / Channel ($ in millions) Wholesale / E-Comm. / Retail Sales1 E-commerce and APAC continue to be areas of strength, with double-digit year-over-year growth Y-o-Y Core2 sales growth: Successful turnaround of previous challenges with Amazon platform Wholesale: (15.4%) E-Commerce: 15.6% India and China major growth drivers for APAC Retail: (4.0%) Connected year-over-year decline driven by inventory misallocation, as Gen 5 product has demonstrated substantial customer demand Total: (7.1%) Americas / EMEA / APAC Sales3 Traditional / Connected Sales 2 2 Y-o-Y Core Y-o-Y Core $900 $800 $700 $600 $500 $400 $300 $200 $100 $0 $900 $800 $700 $600 $500 $400 $300 $200 $100 $0 (7.1%) (7.1%) (17.7%) 12.4% (7.1%) (4.9%) (14.2%) Q4'18 Q4'19 Connected Q4'18 Q4'19 APAC Traditional Americas EMEA Note: Reflects preliminary Q4 FY2019 results 1. 2. 3. Retail includes retail stores and concessions; wholesale includes wholesale and off-price; E-Commerce includes own-brand E-Commerce and pure-play third-party E-Commerce Core sales removes impact of foreign exchange, store exits, and brand exits Does not aggregate to total sales as $3mm and $5mm of Corporate sales are not included in geographic segment sales for Q4 2018 and Q4 2019, respectively 5 $787 $136 $712 $109 $651 $603 $784 $135 $707 $149 $272 $241 $377 $317 |
 |
Preliminary Draft - Confidential 2020 Budget |
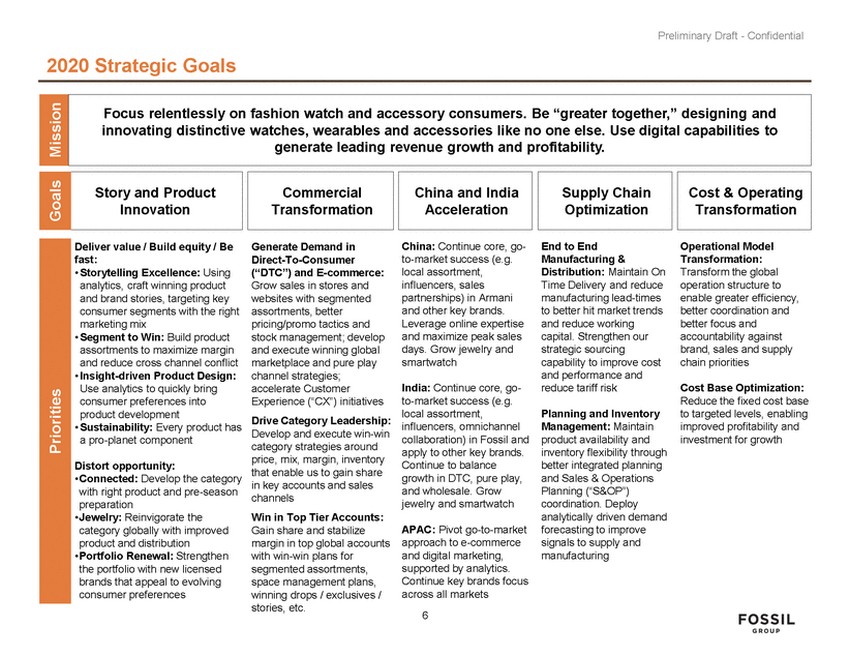 |
Preliminary Draft - Confidential 2020 Strategic Goals Deliver value / Build equity / Be fast: • Storytelling Excellence: Using analytics, craft winning product and brand stories, targeting key consumer segments with the right marketing mix • Segment to Win: Build product assortments to maximize margin and reduce cross channel conflict • Insight-driven Product Design: Use analytics to quickly bring consumer preferences into product development • Sustainability: Every product has a pro-planet component Generate Demand in Direct-To-Consumer (DTC) and E-commerce: Grow sales in stores and websites with segmented assortments, better pricing/promo tactics and stock management; develop and execute winning global marketplace and pure play channel strategies; accelerate Customer Experience (CX) initiatives Drive Category Leadership: Develop and execute win-win category strategies around price, mix, margin, inventory that enable us to gain share in key accounts and sales channels Win in Top Tier Accounts: Gain share and stabilize margin in top global accounts with win-win plans for segmented assortments, space management plans, winning drops / exclusives / stories, etc. China: Continue core, go-to-market success (e.g. local assortment, influencers, sales partnerships) in Armani and other key brands. Leverage online expertise and maximize peak sales days. Grow jewelry and smartwatch End to End Manufacturing & Distribution: Maintain On Time Delivery and reduce manufacturing lead-times to better hit market trends and reduce working capital. Strengthen our strategic sourcing capability to improve cost and performance and reduce tariff risk Operational Model Transformation: Transform the global operation structure to enable greater efficiency, better coordination and better focus and accountability against brand, sales and supply chain priorities India: Continue core, go-to-market success (e.g. local assortment, influencers, omnichannel collaboration) in Fossil and apply to other key brands. Continue to balance growth in DTC, pure play, and wholesale. Grow jewelry and smartwatch Cost Base Optimization: Reduce the fixed cost base to targeted levels, enabling improved profitability and investment for growth Planning and Inventory Management: Maintain product availability and inventory flexibility through better integrated planning and Sales & Operations Planning (S&OP) coordination. Deploy analytically driven demand forecasting to improve signals to supply and manufacturing Distort opportunity: • Connected: Develop the category with right product and pre-season preparation • Jewelry: Reinvigorate the category globally with improved product and distribution • Portfolio Renewal: Strengthen the portfolio with new licensed brands that appeal to evolving consumer preferences APAC: Pivot go-to-market approach to e-commerce and digital marketing, supported by analytics. Continue key brands focus across all markets 6 Priorities Mission Cost & Operating Transformation Supply Chain Optimization China and India Acceleration Commercial Transformation Goals Story and Product Innovation [ ] Focus relentlessly on fashion watch and accessory consumers. Be greater together, designing and innovating distinctive watches, wearables and accessories like no one else. Use digital capabilities to generate leading revenue growth and profitability. |
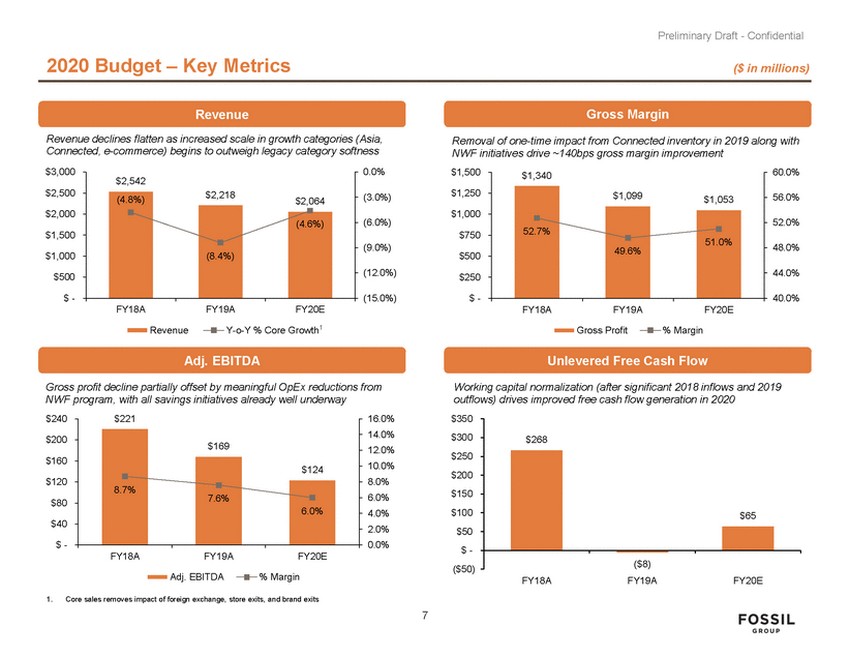 |
Preliminary Draft - Confidential 2020 Budget – Key Metrics ($ in millions) Revenue Revenue declines flatten as increased scale in growth categories (Asia, Connected, e-commerce) begins to outweigh legacy category softness Gross Margin Removal of one-time impact from Connected inventory in 2019 along with NWF initiatives drive ~140bps gross margin improvement $3,000 0.0% $1,500 60.0% $2,500 $1,250 (3.0%) 56.0% $1,053 $2,000 $1,000 (6.0%) 52.0% $1,500 $750 (9.0%) 48.0% $1,000 $500 (12.0%) 44.0% $500 $250 $ - (15.0%) $ - 40.0% FY18A FY19A FY20E FY18A FY19A FY20E Y-o-Y % Core Growth1 Revenue Gross Profit % Margin Adj. EBITDA Unlevered Free Cash Flow Gross profit decline partially offset by meaningful OpEx reductions from NWF program, with all savings initiatives already well underway Working capital normalization (after significant 2018 inflows and 2019 outflows) drives improved free cash flow generation in 2020 $240 $221 16.0% 14.0% 12.0% 10.0% 8.0% 6.0% 4.0% 2.0% 0.0% $350 $300 $250 $200 $150 $100 $50 $ - ($50) $200 $160 $120 $80 $40 $ - FY18A FY19A FY20E Adj. EBITDA % Margin FY18A FY19A FY20E 1. Core sales removes impact of foreign exchange, store exits, and brand exits 7 $268 $65 ($8) 8.7% $169 7.6% $124 6.0% $1,340 52.7% $1,099 49.6% 51.0% $2,542 (4.8%) $2,218 $2,064 (8.4%) (4.6%) |
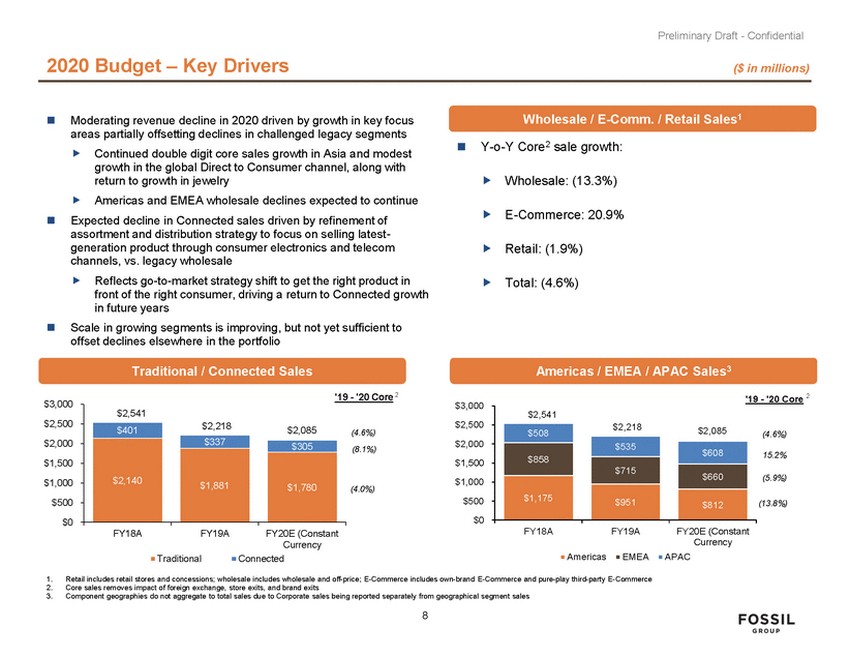 |
Preliminary Draft - Confidential 2020 Budget – Key Drivers ($ in millions) Wholesale / E-Comm. / Retail Sales1 Moderating revenue decline in 2020 driven by growth in key focus areas partially offsetting declines in challenged legacy segments Y-o-Y Core2 sale growth: Continued double digit core sales growth in Asia and modest growth in the global Direct to Consumer channel, along with return to growth in jewelry Americas and EMEA wholesale declines expected to continue Wholesale: (13.3%) E-Commerce: 20.9% Expected decline in Connected sales driven by refinement of assortment and distribution strategy to focus on selling latest-generation product through consumer electronics and telecom channels, vs. legacy wholesale Retail: (1.9%) Reflects go-to-market strategy shift to get the right product in front of the right consumer, driving a return to Connected growth in future years Total: (4.6%) Scale in growing segments is improving, but not yet sufficient to offset declines elsewhere in the portfolio Traditional / Connected Sales Americas / EMEA / APAC Sales3 '19 - '20 Core 2 '19 - '20 Core 2 $3,000 $3,000 $2,500 $2,500 $2,000 $1,500 $1,000 (4.6%) (8.1%) (4.6%) $2,000 $1,500 15.2% (5.9%) $1,000 (4.0%) $500 $0 $500 $0 (13.8%) FY18A FY19A FY20E (Constant Currency APAC FY18A FY19A FY20E (Constant Currency Connected Americas EMEA Traditional 1. 2. 3. Retail includes retail stores and concessions; wholesale includes wholesale and off-price; E-Commerce includes own-brand E-Commerce and pure-play third-party E-Commerce Core sales removes impact of foreign exchange, store exits, and brand exits Component geographies do not aggregate to total sales due to Corporate sales being reported separately from geographical segment sales 8 $2,541 $401 $2,218$2,085 $2,140 $337 $305 $1,881 $1,780 $2,541 $508 $2,218 $2,085 $535 $608 $858 $715 $660 $1,175 $951 $812 |
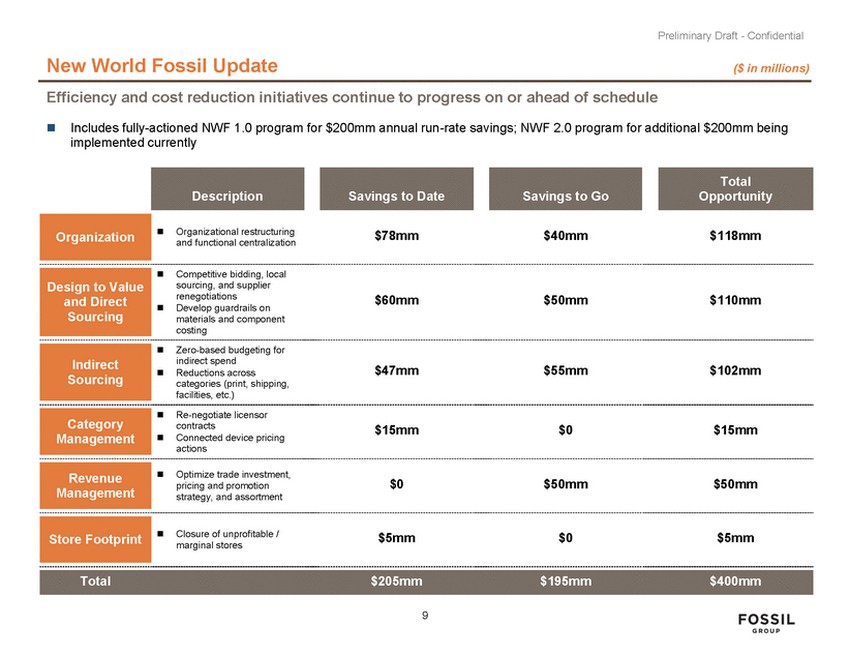 |
Preliminary Draft - Confidential New World Fossil Update ($ in millions) Efficiency and cost reduction initiatives continue to progress on or ahead of schedule Includes fully-actioned NWF 1.0 program for $200mm annual run-rate savings; NWF 2.0 program for additional $200mm being implemented currently Organizational restructuring and functional centralization $78mm $40mm $118mm Competitive bidding, local sourcing, and supplier renegotiations Develop guardrails on materials and component costing $60mm $50mm $110mm Zero-based budgeting for indirect spend Reductions across categories (print, shipping, facilities, etc.) $47mm $55mm $102mm Re-negotiate licensor contracts Connected device pricing actions $15mm $0 $15mm Optimize trade investment, pricing and promotion strategy, and assortment $0 $50mm $50mm Closure of unprofitable / marginal stores $5mm $0 $5mm 9 Total$205mm$195mm$400mm Store Footprint Revenue Management Category Management Indirect Sourcing Design to Value and Direct Sourcing Organization Savings to Go Savings to Date Description Total Opportunity |
 |
Preliminary Draft - Confidential Overview of Amendment |
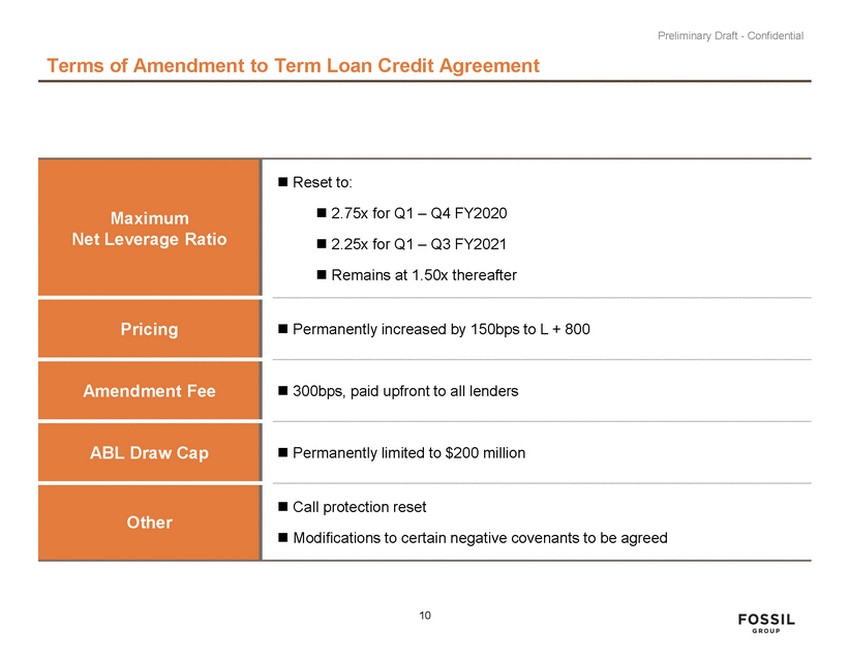 |
Preliminary Draft - Confidential Terms of Amendment to Term Loan Credit Agreement 10 Maximum Net Leverage Ratio Reset to: 2.75x for Q1 – Q4 FY2020 2.25x for Q1 – Q3 FY2021 Remains at 1.50x thereafter Pricing Permanently increased by 150bps to L + 800 Amendment Fee 300bps, paid upfront to all lenders ABL Draw Cap Permanently limited to $200 million Other Call protection reset Modifications to certain negative covenants to be agreed |
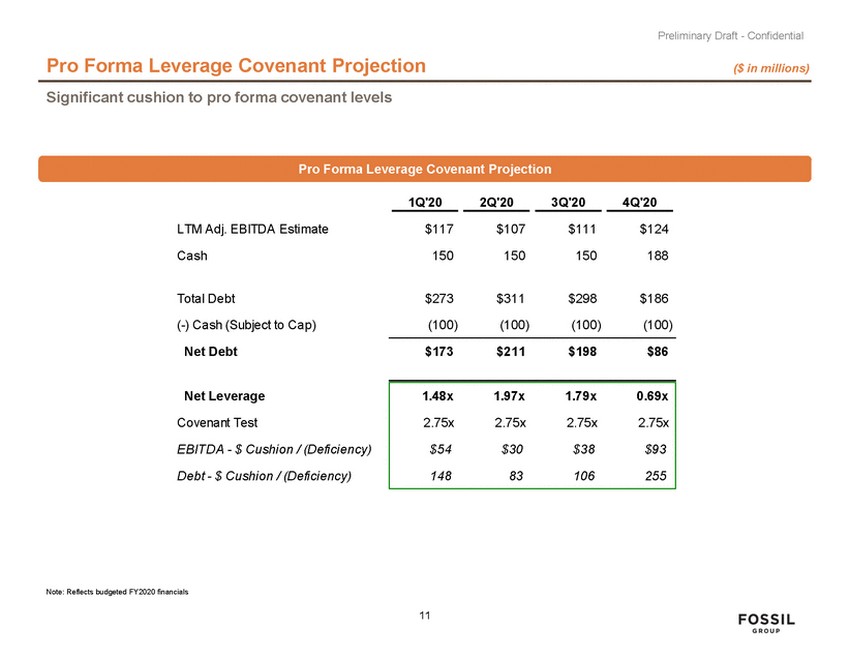 |
Preliminary Draft - Confidential Pro Forma Leverage Covenant Projection ($ in millions) Significant cushion to pro forma covenant levels Pro Forma Leverage Covenant Projection 1Q'20 2Q'20 3Q'20 4Q'20 LTM Adj. EBITDA Estimate $117 $107 $111 $124 Cash 150 150 150 188 Total Debt $273 $311 $298 $186 (-) Cash (Subject to Cap) (100) (100) (100) (100) Net Debt $173 $211 $198 $86 Net Leverage Covenant Test EBITDA - $ Cushion / (Deficiency) Debt - $ Cushion / (Deficiency) Note: Reflects budgeted FY2020 financials 11 1.48x1.97x1.79x0.69x 2.75x2.75x2.75x2.75x $54$30$38$93 14883106255 |
 |
Preliminary Draft - Confidential Appendix |
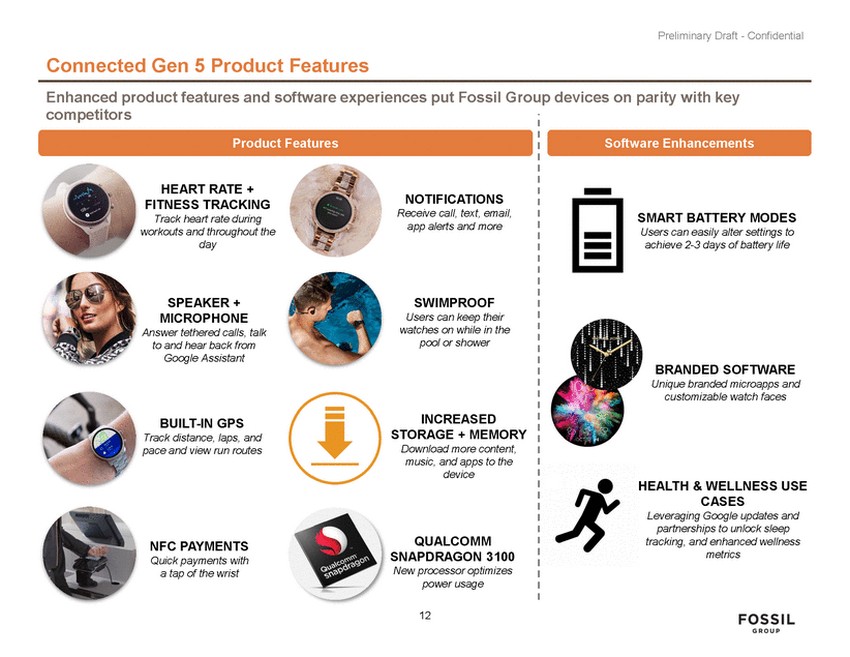 |
Preliminary Draft - Confidential Connected Gen 5 Product Features Enhanced product features and software experiences put Fossil Group devices on parity with key competitors Product Features Software Enhancements HEART RATE + FITNESS TRACKING Track heart rate during workouts and throughout the day NOTIFICATIONS Receive call, text, email, app alerts and more SMART BATTERY MODES Users can easily alter settings to achieve 2-3 days of battery life SPEAKER + MICROPHONE Answer tethered calls, talk to and hear back from Google Assistant SWIMPROOF Users can keep their watches on while in the pool or shower BRANDED SOFTWARE Unique branded microapps and customizable watch faces INCREASED STORAGE + MEMORY Download more content, music, and apps to the device BUILT-IN GPS Track distance, laps, and pace and view run routes HEALTH & WELLNESS USE CASES Leveraging Google updates and partnerships to unlock sleep tracking, and enhanced wellness metrics QUALCOMM SNAPDRAGON 3100 New processor optimizes power usage NFC PAYMENTS Quick payments with a tap of the wrist 12 |
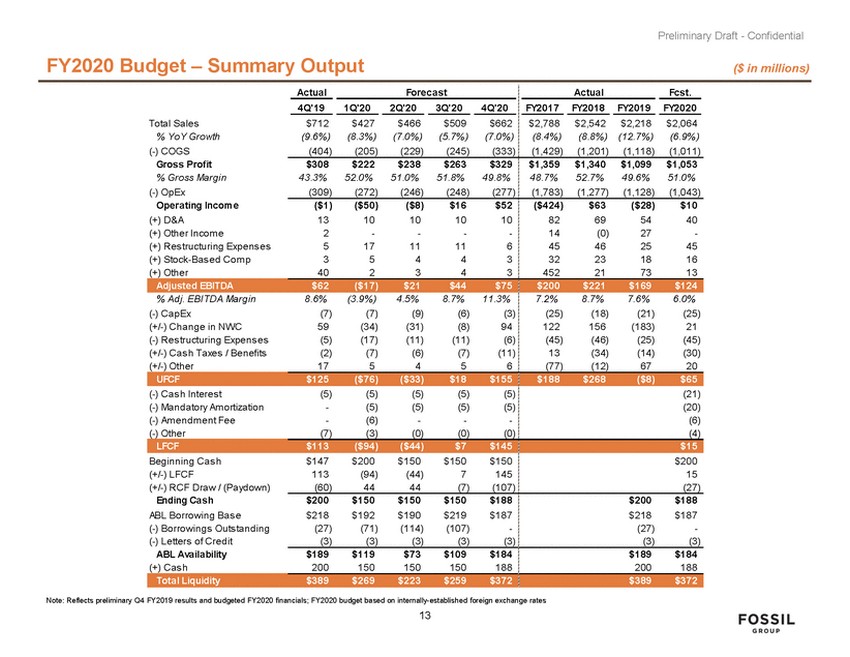 |
Preliminary Draft - Confidential FY2020 Budget – Summary Output ($ in millions) Actual Forecast Actual Fcst. 4Q'19 1Q'20 2Q'20 3Q'20 4Q'20 FY2017 FY2018 FY2019 FY2020 Total Sales % YoY Growth (-) COGS Gross Profit % Gross Margin (-) OpEx Operating Income (+) D&A (+) Other Incom e (+) Res tructuring Expens es (+) Stock-Bas ed Com p (+) Other $712 (9.6%) (404) $427 (8.3%) (205) $466 (7.0%) (229) $509 (5.7%) (245) $662 (7.0%) (333) $2,788 (8.4%) (1,429) $2,542 (8.8%) (1,201) $2,218 (12.7%) (1,118) $2,064 (6.9%) (1,011) $308 43.3% (309) $222 52.0% (272) $238 51.0% (246) $263 51.8% (248) $329 49.8% (277) $1,359 48.7% (1,783) $1,340 52.7% (1,277) $1,099 49.6% (1,128) $1,053 51.0% (1,043) ($1) 13 2 5 3 40 ($50) 10 - 17 5 2 ($8) 10 - 11 4 3 $16 10 - 11 4 4 $52 10 - 6 3 3 ($424) 82 14 45 32 452 $63 69 (0) 46 23 21 ($28) 54 27 25 18 73 $10 40 - 45 16 13 % Adj. EBITDA Margin (-) CapEx (+/-) Change in NWC (-) Res tructuring Expens es (+/-) Cas h Taxes / Benefits (+/-) Other 8.6% (7) 59 (5) (2) 17 (3.9%) (7) (34) (17) (7) 5 4.5% (9) (31) (11) (6) 4 8.7% (6) (8) (11) (7) 5 11.3% (3) 94 (6) (11) 6 7.2% (25) 122 (45) 13 (77) 8.7% (18) 156 (46) (34) (12) 7.6% (21) (183) (25) (14) 67 6.0% (25) 21 (45) (30) 20 (-) Cas h Interes t (-) Mandatory Am ortization (-) Am endm ent Fee (-) Other (5) - - (7) (5) (5) (6) (3) (5) (5) - (0) (5) (5) - (0) (5) (5) - (0) (21) (20) (6) (4) Beginning Cas h (+/-) LFCF (+/-) RCF Draw / (Paydown) Ending Cash ABL Borrowing Bas e (-) Borrowings Outs tanding (-) Letters of Credit ABL Availability (+) Cas h $147 113 (60) $200 (94) 44 $150 (44) 44 $150 7 (7) $150 145 (107) $200 15 (27) $200 $218 (27) (3) $150 $192 (71) (3) $150 $190 (114) (3) $150 $219 (107) (3) $188 $187 - (3) $200 $218 (27) (3) $188 $187 - (3) $189 200 $119 150 $73 150 $109 150 $184 188 $189 200 $184 188 Note: Reflects preliminary Q4 FY2019 results and budgeted FY2020 financials; FY2020 budget based on internally-established foreign exchange rates 13 Total Liquidity $389 $269 $223 $259 $372 $389 $372 LFCF $113 ($94) ($44) $7 $145 $15 UFCF $125 ($76) ($33) $18 $155 $188 $268 ($8) $65 Adjusted EBITDA $62 ($17) $21 $44 $75 $200 $221 $169 $124 |
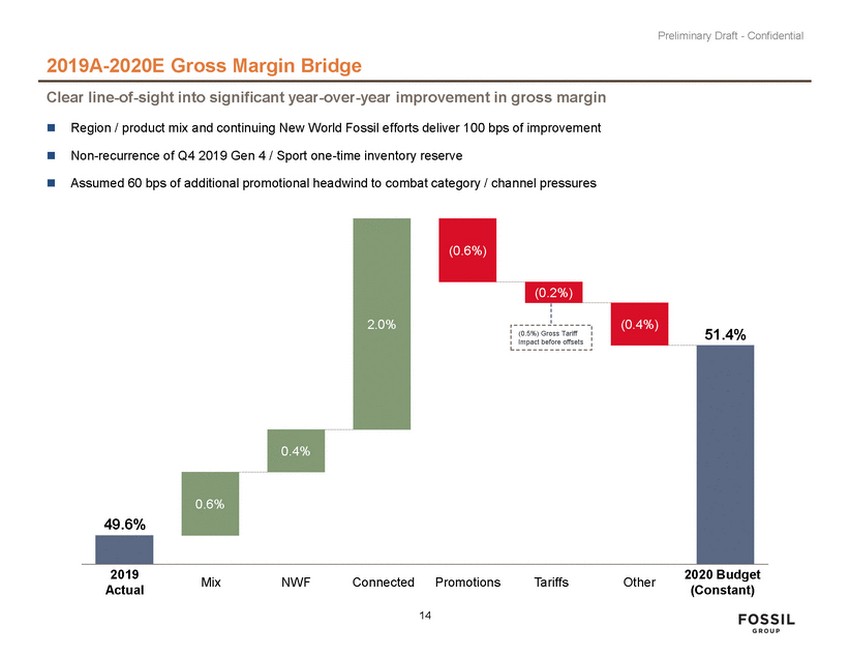 |
Preliminary Draft - Confidential 2019A-2020E Gross Margin Bridge Clear line-of-sight into significant year-over-year improvement in gross margin Region / product mix and continuing New World Fossil efforts deliver 100 bps of improvement Non-recurrence of Q4 2019 Gen 4 / Sport one-time inventory reserve Assumed 60 bps of additional promotional headwind to combat category / channel pressures Impact before offsets 2019 Actual 2020 Budget (Constant) Mix NWF Connected Promotions Tariffs Other 14 (0.6%) (0.2%) (0.4%) 51.4% (0.5%) Gross Tariff 49.6% 2.0% 0.4% 0.6% |
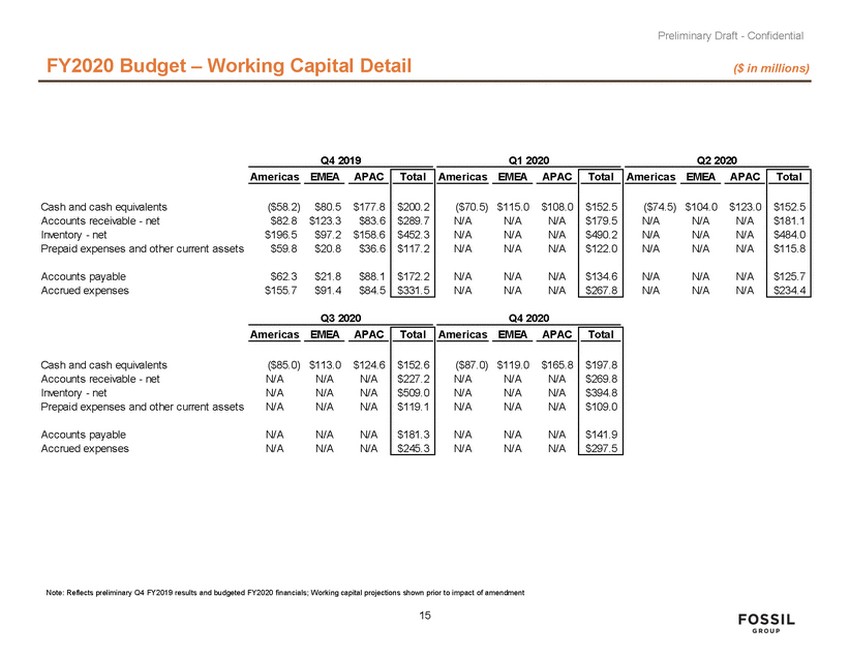 |
Preliminary Draft - Confidential FY2020 Budget – Working Capital Detail ($ in millions) Q4 2019 Q1 2020 Q2 2020 Cash and cash equivalents Accounts receivable - net Inventory - net Prepaid expenses and other current assets Accounts payable Accrued expenses Q3 2020 Q4 2020 Ame rica s EMEA APAC Ame rica s EMEA APAC Cash and cash equivalents Accounts receivable - net Inventory - net Prepaid expenses and other current assets ($85.0) N/A N/A N/A $113.0 N/A N/A N/A $124.6 N/A N/A N/A ($87.0) N/A N/A N/A $119.0 N/A N/A N/A $165.8 N/A N/A N/A Accounts payable Accrued expenses N/A N/A N/A N/A N/A N/A N/A N/A N/A N/A N/A N/A Note: Reflects preliminary Q4 FY2019 results and budgeted FY2020 financials; Working capital projections shown prior to impact of amendment 15 Tota l $197.8 $269.8 $394.8 $109.0 $141.9 $297.5 Tota l $152.6 $227.2 $509.0 $119.1 $181.3 $245.3 Americas EMEAAPAC Total Americas EMEAAPAC Total Americas EMEAAPAC Total ($58.2)$80.5$177.8 $82.8$123.3$83.6 $196.5$97.2$158.6 $59.8$20.8$36.6 $62.3$21.8$88.1 $155.7$91.4$84.5 $200.2 $289.7 $452.3 $117.2 $172.2 $331.5 ($70.5) $115.0 $108.0 N/A N/A N/A N/A N/A N/A N/A N/A N/A N/A N/A N/A N/A N/A N/A $152.5 $179.5 $490.2 $122.0 $134.6 $267.8 ($74.5) $104.0 $123.0 N/A N/A N/A N/A N/A N/A N/A N/A N/A N/A N/A N/A N/A N/A N/A $152.5 $181.1 $484.0 $115.8 $125.7 $234.4 |