Attached files
| file | filename |
|---|---|
| EX-32.2 - EXHIBIT 32.2 - Fossil Group, Inc. | fosl-20161231xex322.htm |
| EX-32.1 - EXHIBIT 32.1 - Fossil Group, Inc. | fosl-20161231xex321.htm |
| EX-31.2 - EXHIBIT 31.2 - Fossil Group, Inc. | fosl-20161231xex312.htm |
| EX-31.1 - EXHIBIT 31.1 - Fossil Group, Inc. | fosl-20161231xex311.htm |
| EX-23.1 - EXHIBIT 23.1 - Fossil Group, Inc. | fosl-20161231xex231.htm |
| EX-21.1 - EXHIBIT 21.1 - Fossil Group, Inc. | fosl-20161231xex211.htm |
| EX-10.27 - EXHIBIT 10.27 - Fossil Group, Inc. | fosl-20161231xex1027.htm |
| EX-10.26 - EXHIBIT 10.26 - Fossil Group, Inc. | fosl-20161231xex1026.htm |
UNITED STATES
SECURITIES AND EXCHANGE COMMISSION
WASHINGTON, D.C. 20549
_________________________________________
FORM 10-K
(Mark One) | ||
x | ANNUAL REPORT PURSUANT TO SECTION 13 OR 15(d) OF THE SECURITIES EXCHANGE ACT OF 1934 | |
For the Fiscal Year Ended December 31, 2016 | ||
OR | ||
¨ | TRANSITION REPORT PURSUANT TO SECTION 13 OR 15(d) OF THE SECURITIES EXCHANGE ACT OF 1934 | |
For the transition period from to | ||
Commission File Number 0-19848
_________________________________________
FOSSIL GROUP, INC.
(Exact name of registrant as specified in its charter)
Delaware (State or other jurisdiction of incorporation or organization) | 75-2018505 (I.R.S. Employer Identification No.) | |
901 S. Central Expressway Richardson, Texas (Address of principal executive offices) | 75080 (Zip Code) | |
Registrant's telephone number, including area code: (972) 234-2525
Securities registered pursuant to Section 12(b) of the Act:
Title of each class | Name of each exchange on which registered | |
Common Stock, $0.01 par value | NASDAQ Global Select Market | |
Securities registered pursuant to Section 12(g) of the Act: None
_________________________________________
Indicate by check mark if the registrant is a well-known seasoned issuer, as defined in Rule 405 of the Securities Act. Yes x No ¨
Indicate by check mark if the registrant is not required to file reports pursuant to Section 13 or Section 15(d) of the Act. Yes ¨ No x
Indicate by check mark whether the registrant (1) has filed all reports required to be filed by Section 13 or 15(d) of the Securities Exchange Act of 1934 during the preceding 12 months (or for such shorter period that the registrant was required to file such reports), and (2) has been subject to such filing requirements for the past 90 days. Yes x No o
Indicate by check mark whether the registrant has submitted electronically and posted on its corporate Web site, if any, every Interactive Data File required to be submitted and posted pursuant to Rule 405 of Regulation S-T (§232.405 of this chapter) during the preceding 12 months (or for such shorter period that the registrant was required to submit and post such files). Yes x No o
Indicate by check mark if disclosure of delinquent filers pursuant to Item 405 of Regulation S-K (§229.405 of this chapter) is not contained herein, and will not be contained, to the best of registrant's knowledge, in definitive proxy or information statements incorporated by reference in Part III of this Form 10-K or any amendment to this Form 10-K. o
Indicate by check mark whether the registrant is a large accelerated filer, an accelerated filer, a non-accelerated filer, or a smaller reporting company. See the definitions of "large accelerated filer," "accelerated filer" and "smaller reporting company" in Rule 12b-2 of the Exchange Act.
Large accelerated filer x | Accelerated filer ¨ | Non-accelerated filer ¨ (Do not check if a smaller reporting company) | Smaller reporting company ¨ | |||
Indicate by check mark whether the registrant is a shell company (as defined in Rule 12b-2 of the Exchange Act). Yes ¨ No x
The aggregate market value of Common Stock, $0.01 par value per share (the "Common Stock"), held by non-affiliates of the registrant, based on the last sale price of the Common Stock as reported by the NASDAQ Global Select Market on July 2, 2016 was $911.7 million.
As of February 20, 2017, 48,270,134 shares of Common Stock were outstanding.
_________________________________________
DOCUMENTS INCORPORATED BY REFERENCE
Portions of the registrant's proxy statement to be furnished to shareholders in connection with its 2017 Annual Meeting of Stockholders are incorporated by reference in Part III, Items 10-14 of this Annual Report on Form 10-K.
FOSSIL GROUP, INC.
FORM 10-K
FOR THE FISCAL YEAR ENDED DECEMBER 31, 2016
INDEX
Page | ||
In this Form 10-K, references to "we," "our," and the "Company" refer to Fossil Group, Inc. and its subsidiaries on a consolidated basis.
PART I
Item 1. Business
General
We are a global design, marketing and distribution company that specializes in consumer fashion accessories. Our principal offerings include an extensive line of men's and women's fashion watches and jewelry, handbags, small leather goods, belts, sunglasses and soft accessories. In the watch and jewelry product categories, we have a diverse portfolio of globally recognized owned and licensed brand names under which our products are marketed. Our products are distributed globally through various distribution channels, including wholesale in countries where we have a physical presence, direct to the consumer through our retail stores and commercial websites and through third-party distributors in countries where we do not maintain a physical presence. Our products are offered at varying price points to meet the needs of our customers, whether they are value-conscious or luxury oriented. Based on our extensive range of accessory products, brands, distribution channels and price points, we are able to target style-conscious consumers across a wide age spectrum on a global basis.
Domestically, we sell our products through a diversified distribution network that includes department stores, specialty retail locations, specialty watch and jewelry stores, Company-owned retail and outlet stores, mass market stores and through our FOSSIL® website. Our wholesale customer base includes, among others, Amazon, Best Buy, Dillard's, JCPenney, Kohl's, Macy's, Neiman Marcus, Nordstrom, Saks Fifth Avenue, Target and Wal-Mart. In the United States ("U.S."), our network of Company-owned stores included 94 retail stores located in premier retail sites and 129 outlet stores located in major outlet malls as of December 31, 2016. In addition, we offer an extensive collection of our FOSSIL brand products through our website at www.fossil.com, as well as proprietary and licensed watch and jewelry brands through other managed and affiliate websites.
Internationally, our products are sold to department stores, specialty retail stores, and specialty watch and jewelry stores in approximately 150 countries worldwide through 23 Company-owned foreign sales subsidiaries and through a network of approximately 80 independent distributors. Our products are offered on airlines and cruise ships and in international Company-owned retail stores. Internationally, our network of Company-owned stores included 230 retail stores and 132 outlet stores as of December 31, 2016. Our products are also sold through licensed and franchised FOSSIL retail stores, retail concessions operated by us and kiosks in certain international markets, as well as our websites in certain countries.
We are a Delaware corporation formed in 1991 and are the successor to a Texas corporation formed in 1984. In 1993, we completed an initial public offering of 13,972,500 shares of our common stock. Domestically, we conduct a majority of our operations through Fossil Partners, L.P., a Texas limited partnership formed in 1994 of which we are the sole general partner. We also conduct operations domestically and in certain international markets through various owned subsidiaries. Our principal executive offices are located at 901 S. Central Expressway, Richardson, Texas 75080, and our telephone number at that address is (972) 234-2525. Our European headquarters is located in Basel, Switzerland, and our Asian headquarters is located in Hong Kong. Our common stock is traded on the NASDAQ Global Select Market under the trading symbol FOSL. We make available free of charge through our website at www.fossilgroup.com our annual reports on Form 10-K, quarterly reports on Form 10-Q, current reports on Form 8-K and amendments to these reports filed or furnished pursuant to Section 13(a) or 15(a) of the Securities Exchange Act of 1934 as soon as reasonably practicable after such materials are electronically filed with, or furnished to, the U.S. Securities and Exchange Commission ("SEC"). You may also obtain any materials we file with, or furnish to, the SEC on its website at www.sec.gov.
Business segments
Our operations and financial reporting are primarily divided into three distinct geographic segments: (i) Americas; (ii) Europe; and (iii) Asia. Each segment includes wholesale, retail, e-commerce and catalog activities based on the geographic location of those activities. Except to the extent that differences between operating segments are material to an understanding of our business taken as a whole, the description of our business in this report is presented on a consolidated basis. Corporate expenses include certain administrative, legal, accounting, technology support costs, equity compensation costs, payroll costs attributable to executive management, brand management, product development, art, creative/product design, marketing, strategy, compliance and back office supply chain expenses. For financial information about our operating segments and geographic areas, refer to Management's Discussion and Analysis of Financial Condition and Results of Operations set forth in Part II, Item 7 and Note 18—Major Customer, Segment and Geographic Information to our consolidated financial statements set forth in Part II, Item 8 of this Annual Report on Form 10-K.
1
Business strengths
We believe that we have several business strengths which allow us to differentiate ourselves and achieve our key operating and financial goals. These business strengths include:
Brand strength. We believe a brand's image, individuality, consistency and connection with its customers is paramount in building and sustaining the brand. We believe that our FOSSIL brand name is recognized on a global basis as an American vintage-inspired aspirational lifestyle brand with a focus on fashion accessories. The FOSSIL brand has developed from its origin as a watch brand to encompass other accessory categories, including handbags, belts, small leather goods, jewelry and sunglasses. We believe the FOSSIL brand is one of our most valuable assets, serves as a foundational piece of our business and remains very marketable across product lines, geographic areas and distribution channels. We have continued to develop, acquire or license other nationally or internationally recognized brand names, such as ADIDAS®, ARMANI EXCHANGE®, BURBERRY®, CHAPS BY RALPH LAUREN®, DIESEL®, DKNY®, EMPORIO ARMANI®, KARL LAGERFELD®, KATE SPADE NEW YORK®, MARC BY MARC JACOBS™, MICHAEL KORS®, MICHELE®, MISFIT®, RELIC®, SKAGEN®, TORY BURCH® and ZODIAC®, in order to appeal to a wide range of consumers. Our industry is highly competitive and subject to changing preferences in style, taste and price points. The success of our business model depends upon offering a wide range of branded products that appeal to the various tastes and fashion preferences of our customers. We must also maintain the relevance of these products by continually anticipating customer needs and desires as they relate to both the brands and categories of products we offer. We have teams of designers and brand specialists assigned to each of our brands. The objectives of these designers and brand specialists are to immerse themselves in their assigned brand and product area, identify their customers' preferences, interpret global fashion trends and develop style-right offerings to generate volume purchasing. By owning the vast majority of our global distribution, we are also able to create and execute consistent pricing strategies and brand image presentations that protect and enhance our proprietary brands and those of our licensors.
Licensing strength. Since 1997, we have attracted highly recognized and respected brand names to license within our watch and jewelry portfolios. We believe we attract such quality brands due to our ability to provide them with access to our global design, production, distribution and marketing infrastructure. As a result of our vertical integration, we, unlike many of our competitors, can offer an integrated solution to launch or increase an accessory category presence on a worldwide basis in a consistent, timely and focused manner. All of our major licensing relationships are exclusive to us and the licensors, which substantially minimizes risks to the licensor associated with dealing with multiple licensees in different geographic regions. Additionally, in order to develop a broader relationship and maintain brand consistency across the accessory categories, we have broadened our infrastructure, which allows us to expand our licensing activities to products beyond the watch category, such as our DIESEL, EMPORIO ARMANI, KATE SPADE NEW YORK and MICHAEL KORS jewelry product lines.
Breadth of brands and retail price points. Through the multiple brands we distribute, we have developed a broad spectrum of retail price points. Within our watch collections, core retail price points vary from approximately $7 in the mass market channel up to retail price points of $3,795 in the luxury distribution channel, although the majority of our collections focus on price points ranging from $85 to $600. The breadth of our brands allows us to anchor a brand to a given price point range and distribution channel, thereby maintaining a consistent brand image while focusing on the quality/value relationship important to the customer and not diluting the brand through overlapping distribution channels. The breadth of price points allows us to cater to various age and income groups while continuing to participate in sales consistently, regardless of a shift in income or the price/value preferences of our customers.
Wearable Technology. As a result of our acquisition of Misfit, Inc. ("Misfit"), we are leveraging the Misfit technology platform across our portfolio of brands to add incremental functionality to our fashion accessories including activity tracking, sleep monitoring and notifications through uniquely branded software applications. Also, mainly through this acquisition, we've established an in-house engineering team to keep us on the leading edge of technology, while building a scalable, cost efficient infrastructure to support our growing connected accessory line of products.
International penetration. Since our initial public offering in 1993, we have continued to extend our reach beyond the U.S. by forming and acquiring internationally-based subsidiaries, licensing and developing internationally recognized brands and investing in the growth of our business within many major countries of the world. Net sales generated outside the U.S. were 55.4%, 53.8% and 54.7% for fiscal years 2016, 2015 and 2014, respectively.
Breadth of distribution channels. Our products are sold through multiple distribution channels including department stores, specialty retail stores, specialty watch and jewelry stores, mass market stores, consumer electronics stores, cruise ships, airlines, Company-owned retail stores, licensed and franchised FOSSIL stores, retail concessions operated by us and e-commerce sites. As we expand our presence in existing distribution channels and add new distribution channels, as well as develop new product lines and expand our geographic reach, our revenues have become less dependent on any one distribution channel or geographic region. Our Company-owned retail stores, websites and catalog venues allow us to enhance the related
2
brand image by offering a targeted message to the customer, showcasing the array of product availability, influencing the merchandising and presentation of the products and testing new product introductions.
In-house creative team. Since our inception, we have developed a talented pool of creative individuals who design our retail stores, websites, products, packaging, graphics, presentation displays and marketing materials, allowing us to deliver a unique and cohesive style and image for each of our brands. We believe our emphasis on constant innovation and distinctive design has made us a leader in the branded accessory category. The breadth of talent and vertical integration of our design teams allows us to minimize the need for, and associated expense of, outside creative talent and advertising agencies.
International sourcing. The vast majority of our products are sourced internationally. Most watch product sourcing from Asia is coordinated through our Hong Kong subsidiary, Fossil (East) Limited ("Fossil East"). During fiscal year 2016, approximately 47% of our non-Swiss made watch production was assembled through wholly or majority owned factories. This vertical integration of our business allows for better flow of communication, consistent quality, product design protection and improved supply chain speed, while still allowing us to utilize non-owned production facilities for their unique capabilities and to cover production needs over internal capacities. Establishing our watch assembly facilities near the component manufacturers also allows us to operate a more efficient supply chain. We have also been successful in leveraging our jewelry production needs through our watch assembly factory infrastructure. Our other accessory products are purchased from many third-party manufacturers with whom we have long-standing relationships and, in the case of our leathers business, we typically represent a meaningful portion of their businesses.
Operating cash flow. Our business model has historically generated strong operating cash flows, including $210.1 million in fiscal year 2016, and $1.0 billion and $1.8 billion over the past three fiscal years and five fiscal years, respectively. This strong cash flow has allowed us to fund capital expenditures, Company-owned retail stores, product line expansions, common stock repurchase programs and acquisitions.
Information systems. Operating and managing a global company requires sophisticated and reliable management information systems to assist in the planning, order processing, production and distribution functions and accounting of each relevant business. We mainly operate an SAP Enterprise Resource Planning system ("ERP") in the U.S. and most of Europe. For our subsidiaries in Asia, we operate Microsoft's Dynamics Navision Enterprise Resource Planning System ("Navision"). Our e-commerce platform is based on IBM's WebSphere Commerce platform and Adobe's Experience Manager platform. We continue to invest in other feature/functions and e-commerce infrastructure, which will allow us to provide a branded and omni-channel web experience in key markets. We operate SAP's IS Retail platform combined with the WINCOR point-of-sale and the SAP point-of-sale systems to improve our ability to manage our Company-owned retail stores globally and will begin upgrading that store technology in 2017. Our products are principally distributed from three primary warehouses, one located in Texas near our headquarters, one located in southern Germany and the other located in Hong Kong. Our facilities in Texas and Germany utilize sophisticated automated material handling equipment and software designed to improve accuracy, speed and quality in our warehousing operations.
For financial reporting, we use software solutions from Oracle Corporation: Hyperion Financial Management, Essbase and Hyperion Planning. This software was implemented in 2014 to increase the overall efficiency of our consolidation and financial reporting process, provide an analytical application to view and interpret data, and to improve predictability in the budgeting and forecasting process.
Growth strategy
In order to expand our global market share in a profitable manner, we continually establish and implement business initiatives that we believe will build brand equity, increase revenues and improve profitability across three distinct areas of our business: FOSSIL, SKAGEN and our multi-brand portfolio. Our strategy for growing the business includes the following:
FOSSIL. Realizing the full potential of this vintage American lifestyle brand is a key element of our long-term growth strategy. Our goal is to continue to grow the brand through innovation and increasing global awareness.
SKAGEN. Growing SKAGEN into a multi-category lifestyle brand by leveraging the Fossil Group infrastructure, proving a unique brand experience and delivering great Danish-inspired product is an important element of our long-term growth strategy.
Portfolio. Our multi-brand portfolio is a powerful tool enabling us to gain share in the global watch market. Our innovation, design, supply chain and global distribution network provide us the opportunity to work with lifestyle brands around the world and position them across a broad spectrum of market segments. Our goal is to employ all of our strategic advantages to realize the full potential of our brands while also looking for additional brands to potentially integrate into our business model. As we continue to develop additional products, acquire or license additional brands and seek additional
3
businesses to complement our existing offerings, we believe we will be able to leverage our design, marketing, assembly and distribution infrastructure and continue to increase the efficiency of our operations over the long-term.
Extend product categories of existing brands. We frequently introduce new accessory product categories within our existing proprietary and licensed brands to further leverage our branded portfolio. For example, we introduced jewelry collections under the DIESEL, EMPORIO ARMANI, FOSSIL, KATE SPADE NEW YORK, MICHAEL KORS and SKAGEN brands after first establishing a market for the brands in watches. Wearable technology is an opportunity to extend the reach of our brands and offer customers new functionality in their fashion accessories, through display smart watches, hybrid smart watches and activity trackers. As consumer demand in the category drives the trend, we are adapting quickly to offer uniquely branded technology experiences through hardware and software created from our in-house engineering team acquired from Misfit. We acquired Misfit in 2015 for its scalable technology platform, which we are integrating across our multi-brand portfolio and pipeline of innovative products. Misfit’s position in the wearable technology space combined with their software and hardware engineering teams has enabled us to expand our addressable market with new distribution channels, products, brands and enterprise partnerships. Additionally, the acquisition of Misfit has further enhanced our capabilities to innovate and drive growth in the watch market, bringing fashion and branding to technology in a very unique way.
Global diversification. International expansion and gaining market share are key elements in expanding the distribution of our brands. We have continued to increase our penetration of the international market by building brand name recognition, broadening the selection of merchandise through existing distribution channels by introducing new products or brands, extending product categories under our existing portfolio of brands, purchasing former distributors to gain increased control over international businesses, establishing owned, franchised or licensed retail stores, expanding into retail concessions operated by us and entering new geographic markets through owned subsidiary or third-party distributor relationships.
Introduce new brands. We have introduced new brands through the development or acquisition of proprietary brands and licensing agreements related to recognizable global fashion lifestyle brands to attract a wide range of consumers with differing tastes and lifestyles. Our current portfolio of proprietary and licensed watch brands allows us to compete for market share from the luxury branded market to the mass market level. In April 2012, we completed the acquisition of Skagen Designs, Ltd. ("Skagen Designs") and certain of its international subsidiaries. At the time of acquisition, Skagen Designs was an international company offering contemporary Danish design accessories including watches, jewelry, sunglasses and clocks. In February 2013 and February 2015, we announced an exclusive global licensing agreement with Tory Burch and Kate Spade & Company, respectively, for watches under the TORY BURCH and KATE SPADE NEW YORK labels. In 2015, we also announced a global licensing agreement with Ralph Lauren® to design, develop and distribute watches under the CHAPS label, which launched in 2016. In December of 2015, we completed the acquisition of Misfit, which is a wearable technology company offering smart watches, fitness trackers and accessories focusing on fashion, wellness and intelligence.
Invest in direct-to-consumer and omni-channel capabilities. Throughout our history, distribution through our Company-owned retail stores has allowed us to raise awareness of the FOSSIL brand and showcase a broad assortment of FOSSIL branded products in a warm and inviting atmosphere. Our FOSSIL retail stores, combined with our FOSSIL branded catalogs and websites, have continued to build brand equity, present a consistent brand image, influence the merchandising and presentation of our products at other retailers and have allowed us to test new product categories and designs. With consumers shopping preferences continuing to evolve beyond traditional retail stores, we are investing in other direct-to-consumer channels, including e-commerce and omni-channel initiatives, including mobile. Of the 585 Company-owned retail stores open as of December 31, 2016, 470 of these stores are FOSSIL branded stores. We also sell certain of our proprietary and licensed watch products, as well as upscale watch brands of other companies, such as Citizen and Swiss Army, at our Company-owned Watch Station International full-price retail and outlet stores. As of December 31, 2016, we operated 91 Watch Station International stores. We plan to open approximately 15 additional stores in fiscal year 2017, depending upon available retail locations and lease terms that meet our requirements, the majority of which will be our FOSSIL full-price accessory or outlet concepts. During fiscal year 2017, we also expect to close approximately 40 stores.
Operating strategy
Fashion orientation and design innovation. We are able to market our products to consumers with differing tastes and lifestyles by offering a wide range of brands and product categories at varying price points. We attempt to stay abreast of emerging fashion and lifestyle trends, and we respond to these trends by making adjustments in our product lines several times each year. We differentiate our products from those of our competitors principally through innovations in fashion details, including variations in both the materials and treatments used for dials, crystals, cases, straps and bracelets for our watches, and innovative treatments and details in our other accessories.
Coordinated product promotion. We internally coordinate product design, packaging, advertising, websites, catalogs and in-store presentations to effectively communicate to our target markets the themes and images associated with our brands. For
4
example, many of our watch products and certain of our accessory products are packaged in metal tins decorated with designs consistent with our marketing strategy and product image. In certain parts of the world, we market our non-watch fashion accessory lines through the same distribution channels as our watch lines, using similar in-store presentations, graphics and packaging.
Captive suppliers. A substantial percentage of our watches and jewelry products are assembled or manufactured by entities that are majority owned by us. In addition, although we do not have long-term contracts with our unrelated watch and accessory manufacturers, we maintain long-term relationships with several manufacturers. These relationships developed due to the significant length of time we have conducted business with the same manufacturers. We believe that we are able to exert significant operational control with regard to our principal watch assemblers because of our level of ownership and long standing relationships. In addition, we believe that the relative size of our business with non-owned watch manufacturers gives us priority within their production schedules. Furthermore, the manufacturers understand our quality standards, which allow us to produce quality products and reduce the delivery time to market, improving overall operating margins. We have also added new facilities and relationships for manufacturing our wearable technology products as well as enhanced our own factories to enable assembly and production of hybrid smart watches. Increased volume in the wearables category would allow us to further reduce costs through improved volume pricing and enable our suppliers to continue to invest in automation.
Actively manage retail sales. We manage the retail sales process with some of our wholesale customers by monitoring consumer purchases and retail inventory levels by product category and style, primarily through electronic data interchange, and by assisting some of our wholesale customers in the conception, development and implementation of their marketing programs. We employ staff in key markets who work with specific retailers to ensure that they are trained on our products and that our products are displayed in accordance with our visual standards. As a result, we believe we enjoy close relationships with some of our principal wholesale customers, often allowing us to influence the mix, quantity and timing of their purchasing decisions.
Centralized distribution. We distribute substantially all of our products sold in North America from our warehouse and distribution centers located in Texas. In Europe, we distribute our products primarily through our warehouse and distribution center located in Germany. In Asia, we primarily distribute our products through our distribution warehouse located in Hong Kong and through smaller distribution warehouses in those countries where we maintain a physical presence. We believe our centralized distribution capabilities in the U.S. and Europe enable us to reduce inventory risk, increase flexibility in achieving delivery requirements of our customers and maintain cost advantages as compared to our competitors.
Industry overview
Traditional watches
We believe that the current traditional watch market can generally be divided into four segments. One segment of the market consists of fine watches characterized by internationally known brand names such as Audemars Piguet, Cartier, Omega, Patek Philippe, Piaget and Rolex. Watches offered in this segment are usually made of precious metals or stainless steel and may be set with precious gems. These watches are almost exclusively manufactured in Switzerland and are sold by trade jewelers and in the fine jewelry departments of select department stores and other purveyors of luxury goods at retail prices ranging from $4,000 to in excess of $20,000. Selected limited editions of our BURBERRY and MICHELE lines compete in this market. A second segment of the traditional watch market consists of fine premium branded and designer watches produced in Switzerland and Asia such as Gucci, Movado, Raymond Weil, Seiko, TAG Heuer and Tissot. These watches are sold at retail prices generally ranging from $495 to $4,000. Our BURBERRY, EMPORIO ARMANI, EMPORIO ARMANI Swiss, FOSSIL Swiss, MICHELE, TORY BURCH and ZODIAC lines generally compete in this market segment. A third segment of the traditional watch market consists of watches sold by mass marketers, which typically consist of digital and analog watches manufactured in Asia. Well-known brands in this segment include Armitron, Casio and Timex. Retail prices in this segment range from $7 to $60. We compete in this segment through the design and production of private label watch products for Kmart, Target and Wal-Mart.
The fourth segment of the traditional watch market consists of moderately priced watches characterized by contemporary fashion and well-known fashion brand names. Moderately priced watches are typically produced in China or Hong Kong and are sold by department stores and specialty stores at retail prices ranging from $60 to $1,000. We target this market segment with our FOSSIL, RELIC and SKAGEN lines, along with our principal competitors, including the companies that market watches under the Anne Klein II, Guess?, Kenneth Cole and Swatch brand names, whose products attempt to reflect emerging fashion trends in accessories and clothing. Our ARMANI EXCHANGE, DIESEL, DKNY, KARL LAGERFELD, MARC BY MARC JACOBS, KATE SPADE NEW YORK and MICHAEL KORS lines generally compete in this segment as well. We compete in the sports specialty area of this segment with our ADIDAS line of women's and men's sport timepieces. We believe
5
that a number of consumers regard branded fashion watches not only as timepieces, but also as fashion accessories, and that has historically resulted in consumers owning multiple watches that may differ significantly in terms of style, features and cost.
Traditional watches typically utilize either a mechanical or quartz-analog movement to maintain their time keeping function. Mechanical watches utilize intricate arrangements of wheels, jewels and winding and regulating mechanisms to keep time, while quartz-analog watches are precisely calibrated to the regular frequency of the vibration of a quartz crystal powered by a battery. Although quartz-analog movements typically maintain their time keeping functions more precisely than mechanical movements, mechanical movements are prized for their craftsmanship and are generally associated with high-end luxury.
Wearable technology / connected accessories
Wearable technology has quickly emerged as a meaningful segment within accessories as consumers continue to be drawn to technology enabled products that complement their connected lifestyles. We believe there is a major opportunity to combine fashion and technology, important attributes to consumers wearing these devices. With the acquisition of Misfit in December 2015, we believe we are in position to lead this convergence of fashion and technology by bringing leading-edge technology across our world-class portfolio of brands through our global distribution.
We believe the wearables market is broken up into four distinct segments. The first segment is touchscreen smart watches which includes highly visible products such as the Apple Watch and Samsung Gear S3. We have partnered closely with Google to release Android Wear watches under both the FOSSIL and MICHAEL KORS brand names in 2016. These products are highly competitive serving both iPhone and Android phone users across more than 40 countries globally. The second segment is hybrid smart watches. Hybrid smart watches combine the attractive aesthetics of a traditional analog watch with embedded technology to enhance a consumer’s life without detracting from his or her sense of style. This is an emerging market that has a limited number of brands competing, including technology companies like Withings and Samsung, as well as, traditional watch brands like Movado. In the hybrid category, we launched products under seven brands in 2016, including SKAGEN, MISFIT, MICHAEL KORS, EMPORIO ARMANI, DIESEL, KATE SPADE NEW YORK and CHAPS.
The third segment is fitness trackers. Fitness tracker brands are focused on delivering performance products primarily for consumers to track their activity. Fitbit, Samsung and Jawbone are among the brands participating in this segment, along with our MISFIT brand. The fourth and final segment is what we call hybrid jewelry. This segment focuses on infusing technology into traditional looking jewelry pieces. This is a nascent category with growing brand engagement. Early brands in this segment include Ringly and MISFIT. In 2016, we launched hybrid jewelry across five of our other brands: FOSSIL, SKAGEN, MICHAEL KORS, KATE SPADE NEW YORK, AND DIESEL, as well as new MISFIT products.
Fashion accessories
In addition to watches, the fashion accessories market also includes an array of products such as small leather goods, handbags, belts, sunglasses and jewelry. We believe that a number of consumers view accessories as fashion statements, and as a result, purchase brand name, quality items that complement other fashion items. These fashion accessory products are generally marketed through department stores, specialty retailers and mass merchandisers, depending upon price and quality. Higher price point items include products offered by fashion names such as Louis Vuitton and Prada.
Moderately priced fashion accessories are typically marketed in department stores and are characterized by contemporary fashion and well-known brand names at reasonable price points, such as our FOSSIL and RELIC brands. We currently offer small leather goods, handbags, belts and sunglasses for both men and women through department stores and specialty retailers in the moderate to upper-moderate price ranges. Our competitors in this market include companies such as Coach, Guess?, Kenneth Cole, Liz Claiborne and Nine West. In addition, we currently offer fashion jewelry sold under the DIESEL, EMPORIO ARMANI, FOSSIL, KATE SPADE NEW YORK, MICHAEL KORS, MISFIT and SKAGEN brands.
6
Our products
We design, develop, market and distribute fashion accessories, including handbags, jewelry, wearable technology, belts, small leather goods, sunglasses and watches under proprietary and licensed brand names. Additionally, we manufacture or distribute private label brands as well as branded products we purchase for resale in certain of our non-FOSSIL branded retail stores. The following table sets forth certain information with respect to the breakdown of our net sales and percentage of growth between proprietary, licensed and other brands for the fiscal years indicated (in millions, except for percentage data).
Fiscal Year | |||||||||||||||||
2016 | 2015 | 2014 | |||||||||||||||
Dollars | % Growth | Dollars | % Growth | Dollars | |||||||||||||
Net sales | |||||||||||||||||
Proprietary | $ | 1,479.0 | 1.4 | % | $ | 1,458.6 | (3.8 | )% | $ | 1,516.7 | |||||||
Licensed | 1,449.6 | (12.1 | ) | 1,648.7 | (12.1 | ) | 1,876.7 | ||||||||||
Other | 113.8 | (6.3 | ) | 121.5 | 4.5 | 116.3 | |||||||||||
Total | $ | 3,042.4 | (5.8 | )% | $ | 3,228.8 | (8.0 | )% | $ | 3,509.7 | |||||||
Traditional and connected watch products
We offer an extensive line of branded lifestyle watches under our proprietary brands and, pursuant to license agreements, under some of the most prestigious brands in the world. Sales of watches for fiscal years 2016, 2015 and 2014 accounted for approximately 76.6%, 76.7% and 78.0%, respectively, of our consolidated net sales.
Proprietary brands. The following table sets forth information about our primary proprietary brand watches:
Brand | Suggested Retail Price Point Range | Primary Distribution Channels | |
FOSSIL | $75 - 495 | U.S. department stores (Belk, Dillard's, Macy's and Nordstrom), U.S. consumer electronics retailers (Best Buy), U.S. specialty retailers (The Buckle), better European department stores (Debenhams, El Corte Ingles, Galeries Lafayette, Harrod's, House of Fraser, Karstadt, Kaufhof and Printemps), better European specialty stores (Christ, Ernest Jones, Goldsmith, H. Samuel, Histoire d'Or as, and Louis Pion), Canadian department stores (Hudson Bay), Australian department stores (Myers), Chinese department stores (Sogo), independently-owned watch and jewelry stores worldwide, www.amazon.com, www.fossil.com, www.watchstation.com and Fossil stores worldwide | |
MICHELE | $295 - 3,795 | U.S. department stores (Bloomingdales, Neiman Marcus, Nordstrom and Saks Fifth Avenue), watch specialty stores, jewelry stores, www.michele.com and www.watchstation.com | |
MISFIT | $60 - 200 | Consumer electronics retailers (Best Buy, Target, and Dixons), department stores (Macy's, Kohl's, and John Lewis), specialty retailers (Apple retail), independently-owned watch and jewelry stores, www.amazon.com and www.misfit.com | |
RELIC | $45 - 150 | U.S. department stores (JCPenney, Kohl's, and Sears) and www.amazon.com | |
SKAGEN | $95 - 245 | U.S. department stores (Belk, Bloomingdales, Bon Ton, Dillard's, Lord and Taylor, Macy's, Nordstrom and Von Maur), U.S. specialty and independent retailers, U.S. military, better European department stores (Galeries Lafayette, House of Fraser, Karstadt and Kaufhof), European specialty stores (Christ) and independent retailers, Asian specialty stores (City Chain, On Time and Tic Tac) and independent retailers, Company-owned stores (Skagen, Watch Station International retail stores and outlets), www.watchstation.com and www.skagen.com | |
ZODIAC | $1,095 - 3,495 | Watch specialty jewelry stores worldwide and www.watchstation.com | |
7
Licensed brands. We have entered into multi-year, worldwide exclusive license agreements for the manufacture, distribution and sale of watches bearing the brand names of certain globally recognized fashion companies. The following table sets forth information with respect to our primary licensed watch products:
Brand | Suggested Retail Price Point Range | Expiration Date | Primary Distribution Channels | ||
ADIDAS | $50 - 195 | 3/31/2017 | Department stores, major sports stores, specialty retailers, adidas outlets, adidas boutiques worldwide and www.watchstation.com | ||
ARMANI EXCHANGE | $100 - 295 | 12/31/2023 | Department stores, specialty retailers, duty free stores worldwide, Armani Exchange boutiques worldwide, www.armaniexchange.com and www.watchstation.com | ||
BURBERRY | $395 - 3,995 | 12/31/2017 | Department stores, specialty retailers, Burberry boutiques worldwide and www.watchstation.com | ||
CHAPS | $95 - 200 | 12/31/2020 | Department stores, specialty retailers, Chaps boutiques worldwide and www.watchstation.com | ||
DIESEL | $100 - 495 | 12/31/2025 | Department stores, specialty retailers, Diesel boutiques worldwide, www.diesel.com and www.watchstation.com | ||
DKNY | $95 - 275 | 12/31/2019 | Department stores, jewelry stores, specialty retailers, DKNY boutiques worldwide and www.watchstation.com | ||
EMPORIO ARMANI | $175 - 2,995 | 12/31/2023 | Department stores, specialty retailers, major jewelry and watch stores, Emporio Armani boutiques worldwide, duty free stores worldwide, www.emporioarmaniwatches.com and www.watchstation.com | ||
KARL LAGERFELD | $125 - 300 | 12/31/2017 | Department stores, Karl Lagerfeld boutiques, watch and jewelry specialty stores, and www.watchstation.com | ||
KATE SPADE NEW YORK | $150 - 350 | 12/31/2025 | Department stores, consumer electronics retailers (Best Buy and AT&T), specialty retailers, major jewelry and watch stores, Kate Spade boutiques worldwide, duty free stores worldwide, www.katespade.com and www.watchstation.com | ||
MARC JACOBS | $150 - 300 | 12/31/2020 | Department stores, specialty retailers, Marc Jacobs boutiques worldwide, www.watchstation.com, and www.marcjacobs.com | ||
MICHAEL KORS | $195 - 550 | 12/31/2024 | Department stores, consumer electronics retailers (Best Buy), specialty retailers, jewelry stores, duty free stores, retail websites, Michael Kors boutiques worldwide and www.watchstation.com | ||
TORY BURCH | $295 - 895 | 12/31/2018 | Department stores, specialty retailers, jewelry stores, duty free stores, retail websites, Tory Burch boutiques worldwide. | ||
Sales of our licensed watch products accounted for 43.4% of our consolidated net sales for fiscal year 2016. Our MICHAEL KORS product sales, including jewelry, accounted for 22.7% of our consolidated net sales for fiscal year 2016. The licensing agreements with ADIDAS and BURBERRY will not be renewed upon their expiration in the first quarter of fiscal year 2017 and the fourth quarter of fiscal year 2017, respectively.
Private label and other. We design, market and source manufacturing of certain retailers' private label and owned brand watches or as premium and incentive items for use in various corporate events. Under these arrangements, we perform design and product development functions, as well as act as a sourcing agent for our customers by contracting for and managing the manufacturing process, purchasing and inspecting the finished product and arranging for shipment. Participation in the private label and premium businesses provides us with certain advantages, including increased assembly volume, which may reduce the costs of assembling our other products, and the strengthening of business relationships with our manufacturing sources.
8
Fashion accessories
In order to leverage our design and marketing expertise and our close relationships with our principal retail customers, primarily in the U.S. and Europe, we have developed a line of fashion accessories for both men and women, including belts, handbags, jewelry, small leather goods and sunglasses. Our handbags are made of a variety of fine leathers and other materials that emphasize classic styles and incorporate a variety of creative designs. Our small leather goods are typically made of fine leathers or other man-made materials and include items such as coin purses, cosmetic bags, mini-bags and wallets. Our jewelry lines include bracelets, cufflinks, earrings, necklaces and rings marketed under the DIESEL, EMPORIO ARMANI, FOSSIL, KATE SPADE NEW YORK, MICHAEL KORS, MISFIT and SKAGEN brands and typically include materials such as base metals, stainless steel, semi-precious stones and sterling silver. We offer 100% UV protected fashion sunglasses under our FOSSIL brand. We currently sell our fashion accessories through a number of our existing major department store and specialty retail store customers, as well as through our Company-owned retail stores, www.fossil.com and other internationally-owned e-commerce sites. In the U.S. and certain international markets, we generally market our fashion accessory lines through the same distribution channels as our watches using similar in-store presentations, graphics and packaging. These fashion accessories are typically sold in locations adjacent to watch departments, which may lead to purchases by persons who are familiar with our watch brands. Sales of our accessory lines accounted for 21.6% of our consolidated net sales in both fiscal years 2016 and 2015, and 20.2% of our consolidated net sales in fiscal year 2014.
9
The following table sets forth information about our fashion accessories:
Brand | Accessory Category | Suggested Retail Price Point Range | Primary Distribution Channel | ||
DIESEL | Jewelry | $75 - 150 | Department stores, domestic and international specialty retailers and Diesel retail stores worldwide | ||
EMPORIO ARMANI | Jewelry | $65 - 295 | Department stores, specialty retailers, major jewelry stores, Emporio Armani boutiques worldwide, duty free stores worldwide and www.emporioarmani.com | ||
FOSSIL | Bags Small Leather Goods Belts Gifts Eyewear Jewelry | $88 - 448 $12 - 148 $24 - 58 $24 - 178 $55 - 135 $18 - 128 | U.S. department stores (Belk, Dillard's, Macy's and Nordstrom), specialty retailers (The Buckle), better European specialty and department stores (Christ, Debenhams, Galeries Lafayette, House of Fraser, Karstadt and Kaufhof), www.amazon.com, Company-owned stores, our catalogs and www.fossil.com | ||
KATE SPADE NEW YORK | Jewelry | $98 - 158 | Department stores, consumer electronics retailers, specialty retailers, major jewelry and watch stores, Kate Spade boutiques worldwide, duty free stores worldwide, www.katespade.com and www.watchstation.com | ||
MICHAEL KORS | Jewelry | $45 - 595 | Department stores, specialty retailers, jewelry stores, duty free stores, retail websites, Michael Kors boutiques worldwide and www.watchstation.com | ||
MISFIT | Jewelry | $15 - 60 | Consumer electronics retailers (Best Buy, Target, and Dixons), department stores (Macy's, Kohl's, and John Lewis), specialty retailers (Apple retail), independently-owned watch and jewelry stores, www.amazon.com and www.misfit.com | ||
RELIC | Handbags Small Leather Goods Belts | $40 - 78 $22 - 40 $22 - 32 | U.S. department stores (JCPenney and Kohl's) | ||
SKAGEN | Handbags Small Leather Goods Jewelry | $165 - 595 $35 - 175 $35 - 90 | U.S. department stores (Macy's, Nordstrom, Dillard's, Hudson Bay), U.S. specialty and independent retailers, better European department stores (Galeries Lafayette, House of Fraser, Karstadt and Kaufhof), European specialty stores (Christ) and independent retailers, Asian independent retailers, Company-owned stores (Skagen, Watch Station International retail stores and outlets), and www.skagen.com | ||
Licensed eyewear
In January 2014, we entered into a license agreement with the Safilo Group for both FOSSIL branded sunglasses and optical frames worldwide. The license agreement provides for royalties to be paid to us based on a percentage of net sales and includes certain guaranteed minimum royalties. Sales of licensed eyewear for fiscal years 2016, 2015 and 2014 accounted for approximately 0.4%, 0.5% and 0.4%, respectively, of our consolidated net sales.
10
Design and development
We believe one of our key strengths is our internal creative team. Our watch and accessory products are created and developed by our in-house design staff primarily located in the U.S., Germany, Hong Kong and Switzerland. When developing products under our various licensed brands, we often coordinate our efforts with our licensors' design teams to provide for a more fluid design approval process and to fully incorporate the image of the respective brand into the product. Product design ideas are drawn from various sources and are reviewed and modified by our design staff to ensure consistency with our existing product offerings and the themes and images associated with our brands. Senior management is actively involved in the design process.
In order to respond effectively to changing consumer preferences, we attempt to stay abreast of emerging lifestyle and fashion trends impacting our product categories. In addition, we attempt to take advantage of the constant flow of information from our customers and our retail stores and e-commerce sites regarding the retail performance of our products. We review weekly sales reports provided by a substantial number of our customers, as well as daily sales reports generated from our Company-owned retail stores and e-commerce sites, containing information with respect to sales and inventories by product category and style. Once a trend in the retail performance of a product category or style has been identified, our design and marketing staffs review their product design decisions to ensure that key features of successful products are incorporated into future designs. Other factors having an influence on the design process include the availability of components, the capabilities of the factories that will manufacture the products for us and the anticipated retail prices and profit margins for the products. Our creative teams have access to our product design archives and are regularly updated on all the various new components, hardware and materials that become available. Over the last few years, our focus has been on transforming our approach in design and development from an assortment-rich offering to an iconic platform presentation. This has enhanced our ability to develop and share compelling stories within the platforms through a narrower range of product offerings, thereby reducing inventory risk and improving lead times. We initially developed this approach in our watch business, and we are now in the early stages of applying a similar approach to our leather and jewelry businesses.
We differentiate our products from those of our competitors principally by incorporating into our product designs innovations in fashion details, including variations in the materials and treatments used for dials, crystals, cases, straps and bracelets for our watches, and innovative details and treatments in our other accessories. We also incorporate certain proprietary technology or integrate our suppliers' technologies in certain of our wearables products. In some instances, we believe that such innovations have allowed us to achieve significant improvements in consumer acceptance of our product offerings. We believe that the substantial experience of our design staff will assist us in maintaining our current leadership position in the watch category, continuing to enhance our handbag offering and expanding the scope of our product offerings.
Marketing and promotion
Our marketing strategy for each of our proprietary brands is to deliver a coordinated and consistent brand image to the consumer regardless of where the consumer comes into contact with the brand. This includes point-of-sale merchandise displays, print and media advertising, our websites, catalogs, retail stores, and product packaging. We have been investing in our omni-channel initiatives to further develop a consistent brand image and message across all of the channels we serve. We have created a global Customer Relationship Management ("CRM") database to encourage on-going communication with our customers in an effort to foster brand loyalty and facilitate customer engagement and repeat purchases. For our proprietary brands, we identify our advertising themes and coordinate our packaging, advertising and point-of-sale material around these themes. These themes are carefully coordinated in order to convey classic, American styling and the aspirational viewpoint that we associate with our products. Our vintage-inspired tin packaging concept for many of our watch products and certain of our accessories is an example of these marketing themes. While our marketing themes typically change each year, the core image of the brand is designed to endure, only changing slightly to keep it fresh and relevant to our targeted consumer. For our licensed brands, we incorporate many of the same concepts, but derive the themes generally from the licensors.
We participate in cooperative advertising programs with our major retail customers, whereby we share the cost of certain of their advertising and promotional expenses. An important aspect of the marketing process involves the use of in-store visual support and other merchandising materials, including packages, signs, posters and fixtures. Through the use of these materials, we attempt to differentiate the space used to sell our products from other areas of our customers' stores. We also promote the use of our shop-in-shop concept for watches, jewelry, handbags and small leather goods and, primarily in Asia and Europe, watch and jewelry concessions. Our shop-in-shop concept involves the use of dedicated space within a customer's store to create a brand "shop" featuring our products and visual displays. The concessions we run allow us to essentially operate all or a portion of the watch and jewelry department within our customers' stores, thereby permitting us to control merchandising, inventory levels, build-out and branding decisions and, more importantly, the interaction with the end consumer. We also provide our customers with a large number of preprinted customized advertising inserts and from time to time stage promotional events designed to focus public attention on our products.
11
Our in-house art department designs, develops and implements all of the packaging, advertising, marketing and other promotional aspects of our products. The art staff uses graphic design techniques to generate the images presented on product packaging and other advertising materials. Senior management is involved in monitoring our advertising and promotional activities to ensure that themes and ideas are communicated in a cohesive manner to our target audience.
Sales and customers
General. Domestically, we sell our products in retail locations in the U.S. through a diversified distribution network that includes department stores, specialty retail locations, specialty watch and jewelry stores and mass market stores. For our FOSSIL, MICHELE and licensed branded products, our primary department store customers include Bloomingdales, Dillard's, Macy's, Neiman Marcus, Nordstrom and Saks Fifth Avenue. For our RELIC brand, our primary customers include JCPenney and Kohl's. For our SKAGEN brand, our primary customers include Dillard's, Macy's and Nordstrom. Many of our licensed branded products are also sold through each respective licensor's boutique stores and websites. We maintain sales offices in several major cities across the U.S. staffed with sales associates to assist in managing our department and specialty store accounts and employ a staff of merchandise coordinators in key markets who work with the stores to ensure they are trained on our products and visual display requirements. We also sell certain of our FOSSIL branded products at Company-owned FOSSIL retail stores and outlet stores located throughout the U.S., and through our website at www.fossil.com. In addition, we sell certain of our proprietary and licensed watch products, as well as upscale watch brands of other companies, such as Citizen and Swiss Army, at our Company-owned Watch Station International retail stores in the U.S. and through our website at www.watchstation.com.
We maintain subsidiary offices in Australia, Austria, Belgium, Canada, China, Denmark, France, Germany, Hong Kong, India, Italy, Japan, Macau, Malaysia, Mexico, the Netherlands, Norway, Poland, Singapore, South Africa, South Korea, Spain, Sweden, Switzerland, Taiwan, the United Kingdom and Vietnam. Our European headquarters is located in Basel, Switzerland, and our Asian headquarters is located in Hong Kong.
Internationally, our products are sold to department stores and specialty retail stores in approximately 150 countries worldwide through 23 Company-owned foreign subsidiaries, a network of approximately 80 independent distributors, Company-owned retail stores and websites and licensed or franchised FOSSIL retail stores, retail concessions operated by us and kiosks. Foreign distributors generally purchase products from us at prices established by us for international sales and resell them to department stores and specialty retail stores. We generally receive payment from our foreign distributors in U.S. dollars. We generally do not have long-term contracts with any of our retail customers. All transactions between us and our retail customers are conducted on the basis of purchase orders, which generally require payment of amounts due to us on a net 30 day basis for most of our U.S.-based customers and up to 120 days for certain international customers. No customer accounted for 10% or more of our consolidated net sales in fiscal years 2016, 2015 or 2014. Net sales for geographic segments are based on the location of the selling entity. For more information on our geographic segments, see Note 18—Major Customer, Segment and Geographic Information to our consolidated financial statements set forth in Part II, Item 8 of this Annual Report on Form 10-K.
United States sales. For fiscal years 2016, 2015 and 2014, U.S. sales accounted for 44.6%, 46.2% and 45.3% of our consolidated net sales, respectively, and the aggregate sales to our 10 largest U.S. customers represented approximately 21.0%, 21.3% and 18.9% of consolidated net sales, respectively.
International sales. For fiscal years 2016, 2015 and 2014, Europe sales accounted for 32.9%, 33.1% and 34.1% of consolidated net sales, respectively, Asia sales accounted for 16.9%, 15.4% and 16.1% of consolidated net sales, respectively, and other international sales accounted for 5.6%, 5.3% and 4.5% of consolidated net sales, respectively. Net sales from Germany accounted for more than 10% of our consolidated net sales and were approximately $467.7 million, $505.4 million and $612.5 million in fiscal years 2016, 2015 and 2014, respectively.
Company-owned stores
Our various retail store formats focus on creating emotional connections with our customers through an intense branding experience and personalized customer service. We strive to provide an inviting and welcoming environment for our customers that enhances our brand image and seek brand loyalty by continually delivering innovative vintage-inspired products that meet our customers' tastes. Our goal is to provide the customer with a consistent brand experience and message across the various channels we serve, including our retail stores, wholesale partners and e-commerce channels. Our on-going investments in our omni-channel initiatives help facilitate this goal and are critical components of our growth strategy going forward.
12
The following table sets forth the number of stores by concept as of December 31, 2016 and January 2, 2016:
December 31, 2016 | January 2, 2016 | ||||||||||||||||||||||
Americas | Europe | Asia | Total | Americas | Europe | Asia | Total | ||||||||||||||||
Full price | 122 | 119 | 63 | 304 | 128 | 126 | 68 | 322 | |||||||||||||||
Outlets | 143 | 73 | 45 | 261 | 153 | 71 | 46 | 270 | |||||||||||||||
Full priced multi-brand | — | 8 | 12 | 20 | — | 7 | 20 | 27 | |||||||||||||||
Total stores | 265 | 200 | 120 | 585 | 281 | 204 | 134 | 619 | |||||||||||||||
Accessory stores
We operate full-price FOSSIL and SKAGEN accessory retail stores ("Accessory Stores") in order to broaden the recognition of our brand names. Accessory Stores carry a full assortment of FOSSIL or SKAGEN watches and other accessories that are generally sold at the suggested retail price. At the end of fiscal year 2016, the average size of our Accessory Stores was 1,539 square feet, but each store can vary in size based on its geographic location. For example, our international-based stores are generally smaller in square footage than our U.S.-based stores due to smaller retail store configurations generally available in international markets. The table below sets forth information about our Accessory Stores for the last five fiscal years:
Fiscal Year | Open At Beginning of Period | Opened During Period | Closed During Period | Open at End of Period | Total Gross Square Footage (in thousands) | Percentage Increase (Decrease) in Square Footage | Average Gross Square Footage Per Retail Store | |||||||||||||
2012 | 245 | 25 | 10 | 260 | 363.4 | 7.6 | % | 1,398 | ||||||||||||
2013 | 260 | 30 | 14 | 276 | 402.3 | 10.7 | % | 1,458 | ||||||||||||
2014 | 276 | 29 | 16 | 289 | 432.2 | 7.4 | % | 1,496 | ||||||||||||
2015 | 289 | 45 | (1) | 13 | 321 | 496.4 | 14.9 | % | 1,546 | |||||||||||
2016 | 321 | 10 | 27 | 304 | 467.8 | (5.8 | )% | 1,539 | ||||||||||||
____________________________________________
(1) Includes stores added through our acquisition of the South Africa-based distributor S.Keren Watch Group ("SKWG").
Outlet stores
The majority of our outlet stores are FOSSIL branded and are located at select outlet malls throughout the U.S. and in certain international locations. We also operate outlets under the SKAGEN and Watch Station International names. Our outlets operating under the FOSSIL and SKAGEN names not only increase our brand awareness, but also enable us to liquidate excess inventory generally at significantly better prices than we would obtain through third-party liquidators. We generally discount products in our outlet stores from 25% to 75% off our suggested retail price. The table below sets forth information about our outlet stores during the last five fiscal years:
Fiscal Year | Open At Beginning of Period | Opened During Period | Closed During Period | Open at End of Period | Total Gross Square Footage (in thousands) | Percentage Increase (Decrease) in Square Footage | Average Gross Square Footage Per Retail Store | |||||||||||||
2012 | 104 | 59 | 1 | 162 | 356.3 | 49.5 | % | 2,199 | ||||||||||||
2013 | 162 | 46 | 2 | 206 | 427.9 | 20.1 | % | 2,077 | ||||||||||||
2014 | 206 | 41 | 4 | 243 | 497.4 | 16.2 | % | 2,047 | ||||||||||||
2015 | 243 | 29 | (1) | 2 | 270 | 543.0 | 9.2 | % | 2,011 | |||||||||||
2016 | 270 | 6 | 15 | 261 | 525.8 | (3.2 | )% | 2,015 | ||||||||||||
____________________________________________
(1) Includes stores added through our SKWG acquisition.
Other retail and e-commerce
We sell certain of our proprietary and licensed brand watches, as well as watches manufactured by other companies in our Watch Station International stores.
13
We have an agreement with the House of Fraser ("HOF"), a U.K.-based department store, which allows us to operate the watch department in certain HOF stores. Under this agreement, we own the inventory within the HOF store, provide the labor to operate the department and pay HOF a commission on the retail watch sales generated in the stores. As of December 31, 2016, we operated the watch department in 53 HOF stores and HOF Online, although we do not include the number of locations associated with this arrangement in our retail store count.
Internet sales. Our U.S. e-commerce website for FOSSIL branded products is www.fossil.com. We also operate e-commerce websites in Australia, France, Germany, Japan and the United Kingdom. In October 2012, we began shipping to Canada and Mexico through a third-party e-commerce website. Each website features a full selection of geographically specific FOSSIL branded products. Certain of our websites also provide customer service, company news and shareholder information. Our websites are continually updated to provide a fresh look and an easy-to-navigate interface that enhances our brand image, while allowing consumers a pleasing shopping experience or a preview of what they may find at their local store carrying the brand. Since its launch, the www.fossil.com website has been promoted consistently in support of online brand and direct sales goals. Our online marketing efforts include the following: search/keyword marketing programs through major search partners including Google, Bing and Yahoo!; regular e-mail communications sent using our e-mail service provider to over one million registered consumers; product and promotional banners presented on affiliate networks and display banner networks; and online brand initiatives through social networks such as Facebook, Twitter, Instagram, Pinterest, YouTube, WeChat and Weibo in support of viral and traditional brand initiatives. Through our Misfit acquisition in December 2015, we acquired the www.misfit.com website. We have leveraged our e-commerce infrastructure by opening websites to support our licensed and owned brands, including www.michele.com, www.skagen.com, and www.watchstation.com.
Facilitating our wholesale distribution
We utilize an in-house sales staff and, to a lesser extent, independent sales representatives to promote the sale of our products to retail accounts. Our in-house sales personnel receive a salary and, in some cases, a commission based on a percentage of sales attributable to specified accounts. Independent sales representatives generally do not sell competing product lines and are under contracts with us that are generally terminable by either party upon notice ranging from 15 days to six months. These independent contractors are primarily compensated on a commission basis.
We have developed an approach to managing the retail sales process that involves monitoring our customers' sales and inventories by product category and style, primarily through electronic data interchange. We review weekly selling and inventory information to ensure our products are properly stocked and replenished on a timely basis. We also assist many of our customers in the conception, development and implementation of their marketing programs. We also participate in cooperative advertising programs with our major retail customers. We believe that management of the retail sales process has resulted in close relationships with our principal wholesale customers, often allowing us to influence the mix, quantity and timing of their purchasing decisions.
We believe that our sales approach has historically accounted for high retail turnover in our products, which can result in attractive profit margins for our wholesale customers. We believe that the resulting profit margins for our wholesale customers encourage them to devote greater selling space to our products within their stores. We are also able to work closely with buyers for our wholesale customers in determining the mix of products a store should carry. In addition, we believe that the buyers' familiarity with our sales approach has facilitated, and should continue to facilitate, the introduction of new products through our existing distribution network.
We permit the return of damaged or defective products. In addition, although we have no obligation to do so, we accept limited amounts of product returns from our wholesale customers in other instances. Accordingly, we provide allowances for the estimated amount of product returns. The allowances for product returns as of the end of fiscal years 2016, 2015 and 2014 were $66.9 million, $68.7 million and $68.2 million, respectively. We have not historically experienced returns in excess of our aggregate allowances.
Backlog
It is the practice of a substantial number of our customers not to confirm orders by delivering a formal purchase order until a relatively short time prior to the shipment of goods. As a result, the amount of unfilled customer orders includes confirmed orders and orders that we believe will be confirmed by delivery of a formal purchase order. A majority of such amounts represent orders that have been confirmed. The remainder of such amounts represents orders that we believe, based on industry practice and prior experience, will be confirmed in the ordinary course of business. Our backlog at a particular time is affected by a number of factors, including seasonality and the scheduling of the manufacture and shipment of our products. Accordingly, a comparison of backlog from period to period is not necessarily meaningful and may not be indicative of eventual actual shipments. At the end of fiscal year 2016, we had unfilled customer orders of approximately $104.5 million, compared to $84.9 million and $185.1 million at the end of fiscal years 2015 and 2014, respectively.
14
Manufacturing
Watches and jewelry. During fiscal year 2016, approximately 47% of the watches we procured from Asia were assembled through our two majority-owned entities. The remaining watches we procured from Asia were assembled by approximately 38 unrelated factories located primarily in China and Hong Kong, which includes almost all the production and assembly of our digital and mass market watches. During fiscal year 2016, our Swiss-made watches were assembled primarily by two of our majority-owned entities and four third-party factories in Switzerland. During fiscal year 2016, approximately 59% of our jewelry products were manufactured by one of our majority-owned entities. The remaining 41% of our jewelry products were manufactured by approximately 20 factories located primarily in China. Although we have no ownership interest in these unrelated watch and jewelry factories, Fossil East maintains oversight and control of the supply chain from design through final delivery of the finished product as it does with our related factories. We believe substantial ownership of the assembly factories that produce a significant amount of our fashion watches and jewelry is critical to our operating model, as we believe this allows us to keep our designs proprietary, control the size of our production runs and vertically manage our supply chain.
The principal components used in the assembly of our watches are cases, crystals, dials, movements, hands, bracelets and straps. These components are obtained from a large number of suppliers located principally in China, Hong Kong, India, Italy, Japan, South Korea, Switzerland and Thailand. The majority of the movements, cases, dials, bracelets and hands used in the assembly of our watches are supplied by ten principal vendors. During fiscal years 2016, 2015 and 2014, one vendor was responsible for supplying approximately 37%, 43% and 41% of our case and bracelet components, respectively. Additionally, three vendors were responsible for supplying approximately 76%, 73% and 87% of our movements in fiscal years 2016, 2015 and 2014, respectively. The principal materials used in the manufacture of our jewelry products are base metals, stainless steel, semi-precious stones or silver jewelry with 18K gold plating on top. These components are primarily obtained from the same factories that we use for our watches. Except for the one case and bracelet vendor and the three movement vendors noted above, we do not believe that our business is materially dependent on any single component supplier.
We believe that we have established and maintain close relationships with a number of component manufacturers and assembly factories primarily located in China, Hong Kong and Switzerland. The loss of any one of these manufacturers could temporarily disrupt shipments of certain of our watch and jewelry products. In addition, we believe that losing one or more of the component vendors, watch assembly factories or jewelry manufacturers could have a material impact on our ability to source these products and meet our sales plans. Our future success will generally depend upon our ability to maintain close relationships with, or ownership of, our current watch assembly and jewelry manufacturing factories and to develop long-term relationships with other vendors and manufacturers that satisfy our requirements for price, quality and production flexibility.
Other Accessories. During fiscal year 2016, all of the manufacturing of our handbags, small leather goods and belts was outsourced. We believe that our policy of outsourcing the production of these product categories allows us flexibility in selecting our suppliers while avoiding significant capital expenditures, build-ups of work-in-process inventory and the costs of managing a substantial production work force.
General. We have a Code of Conduct for Manufacturers ("Manufacturer Code") that sets forth the corporate responsibility requirements for our suppliers, including compliance with international labor and human rights standards and environmental laws and regulations. Before supplying products to us, our manufacturers sign an agreement that includes a commitment to abide by our Manufacturer Code. For more information on our Manufacturer Code, see "Code of Conduct for Manufacturers."
Our products are assembled or manufactured according to plans that reflect management's estimates of product performance based on recent sales results, current economic conditions and prior experience with manufacturing sources. The average lead time from the commitment to purchase products through the production and shipment thereof ranges from two to four months for our watches, leather goods, and jewelry. We believe that the close relationships, including ownership interests in some cases, we have established and maintain with our principal assembly or manufacturing sources constitute a significant competitive advantage and allow us to quickly and efficiently introduce innovative product designs and alter production in response to the retail performance of our products.
Code of Conduct for Manufacturers
We are committed to ethical and responsible conduct in all of our operations and respect for the rights of all individuals. We strive to ensure that human rights are upheld for all workers involved in our supply chain, and that individuals experience safe, fair and non-discriminatory working conditions. In addition, we are committed to compliance with applicable environmental requirements and are committed to seeing that all of our products are manufactured and distributed in compliance with applicable environmental laws and regulations. We expect that our business partners will share these commitments, which we enforce through our Manufacturer Code.
15
Our Manufacturer Code specifically requires our manufacturers to not use child, forced or involuntary labor and to comply with applicable environmental laws and regulations. We provide training to our factories related to our Manufacturer Code and the applicable laws in the country in which the factory is located. The training provides the factories with a more in-depth explanation of our Manufacturer Code.
In addition to the contractual obligation, we evaluate our suppliers' compliance with our Manufacturer Code through audits conducted both by our employees and third-party compliance auditing firms. In most cases, the audits are announced. If we believe that a supplier is failing to live up to the standards of our Manufacturer Code, we may terminate the supplier or provide the supplier with an opportunity to remedy the non-compliance through the implementation of a corrective action plan. For those suppliers on a corrective action plan, we will work with the supplier as necessary to help them understand the non-compliance and provide advice on how to remedy the non-compliance. We conduct a follow-up audit to confirm compliance after the implementation of the corrective action plan. Should the supplier continue to fail to meet our standards, we may seek to eliminate such supplier from our supply chain.
Quality control
Our quality control program attempts to ensure that our products meet the standards established by our product development staff. Samples of products are inspected by us prior to placing orders with factories to ensure compliance with our technical design specifications. We also typically inspect "top of production" prototypes of each product before commencing production. The operations of our Hong Kong and Chinese factories are monitored on a periodic basis by Fossil East, and the operations of our Swiss factories are monitored on a periodic basis by Montres Antima SA, one of our foreign operating subsidiaries. Substantially all of our watches, jewelry and certain of our other accessories are inspected by personnel of Fossil East or by the assembly/manufacturing facility prior to shipment to our distribution centers. Final inspections, on a sampling basis, occur when the products are received in our distribution centers. We believe that our policy of inspecting our products at the assembly/manufacturing facility, upon receipt at our distribution facilities and prior to shipment to our customers is important to maintain the quality, consistency and reputation of our products.
Distribution
Upon completion of assembly/manufacturing, the majority of our products are shipped to one of our warehousing and distribution centers in Texas, Germany or Hong Kong, from which they are shipped to subsidiary warehouses or directly to customers in selected markets. Our centralized warehouse and distribution facilities allow us to maximize our inventory management and distribution capabilities and more readily meet the varying distribution requirements placed on us by our customers at a lower cost. Our facilities in Texas and Germany are equipped with automated material handling equipment operated by software from SAP and Manhattan Associates. The automated equipment and operating systems, in conjunction with the continual sampling of our outgoing orders prior to shipment, are important in maintaining the quality, accuracy, speed and reputation of our products and distribution service.
Our warehouse and distribution facilities in Texas operate in a special purpose sub-zone established by the U.S. Department of Commerce Foreign Trade Zone Board. This sub-zone provides the following economic and operational advantages to us: (i) we do not have to pay duty on imported merchandise until it leaves the sub-zone and enters the U.S. market, (ii) we do not have to pay any U.S. duty on merchandise if the imported merchandise is subsequently shipped to locations outside the U.S. and (iii) we do not have to pay local property tax on inventory located within the sub-zone.
Information technology systems
General. We believe that automation, reliable and scalable systems, accurate reporting and rapid flow of communication is essential to maintain our competitive position and support our key operating and financial goals. Therefore, we continue to invest in computer hardware, system applications and telecommunication networks. Our information technology systems consist of a wide spectrum of financial, distribution, human resources, merchandising, planning, point-of-sale, supply chain and other solutions. Where possible and cost effective, we leverage our various systems on a global basis, which enhances the accuracy, timeliness and accessibility of the relevant data.
Inventory control. We maintain inventory control systems at our facilities that enable us to track each product from the time it is shipped from our factory through shipment to our customers, or consumer in the case of our retail stores, concessions and websites. To facilitate this tracking, a significant number of products sold by us are pre-ticketed and bar coded. Our inventory control systems report shipping, sales and individual stock keeping unit level inventory information. We manage the retail sales process by monitoring customer sales and inventory levels of our products by product category and style, primarily through electronic data interchange. We believe that our distribution capabilities enable us to reduce inventory risk and increase flexibility in responding to the delivery requirements of our customers. Our management believes that our electronic data interchange efforts will continue to grow in the future as customers focus further on increasing operating efficiencies. In
16
addition, we maintain systems that are designed to track inventory movement through our Company-owned stores. We monitor store inventory movement through review of detailed sales transaction records which are accumulated on each store’s point-of-sale system.
Enterprise resource planning. We have implemented SAP ERP in our U.S. operations and throughout most of Europe. This software is installed on a single site platform located in our U.S. headquarters facility. The software currently supports the human resources, sales and distribution, inventory planning, retail merchandising and operational and financial reporting systems of our U.S. businesses and most subsidiary operations in Europe. It also supports manufacturing operations in India and Europe. Additionally, we have implemented other non-SAP systems for the purpose of merchandise planning and product lifecycle management.
We continue to monitor the growth of our subsidiary sales operations in Asia and will migrate these operations at the appropriate time to effectively benefit from our global SAP platform. However, we do operate SAP human resource, financial planning and warehouse management modules in Hong Kong to provide efficiencies to further support our regional warehouse in Hong Kong and the related supply chain associated with our local country operations, including our Company-owned retail stores throughout Asia. We have implemented Navision as our standard system throughout most of our Asia distribution and manufacturing subsidiary operations. The Navision system supports many of the same functions as our SAP system on a local country level.
Enterprise performance management systems. We have implemented customized Hyperion financial reporting software from Oracle Corporation. The software increases the efficiency of our consolidation and reporting process, and provides a more dynamic way to view and analyze data. The Hyperion planning tool also provides more dynamic and robust budgeting and forecasting capabilities.
Product lifecycle management. We have implemented Dassault Systemes Enovia in our product development function. This system enables our global product development process across our multiple brands and product categories. In addition to aligning this process, the platform enables a global solution for collaboration, sample management, design tool integration, and calendar management.
Cyber/Data security. Our business involves the receipt and storage of personal information about customers and employees, the protection of which is critical to us. If we experience a significant breach of customer, employee, and/or company data it could attract a substantial amount of media attention, damage our customer relationships and reputation and result in lost sales, fines, or lawsuits. Our Board of Directors and/or our Audit Committee reviews our data security risks and strategy on a regular basis, and we have obtained insurance liability coverage for certain data security or privacy breaches.
IT support services. Our global IT support operations are managed by us within a managed service model with a global IT service provider in order to gain long-term IT operational maturity, resource flexibility and improved financial leverage of our IT support costs related to: service desk, application support, administration and infrastructure administration.
Warranty and repair
Our watch products are covered by limited warranties against defects in materials or workmanship. Historically, our FOSSIL and RELIC watch products sold in the U.S. have been covered for warranty periods of 11 years and 12 years, respectively, and our SKAGEN branded watches have been covered by a lifetime warranty. Beginning in 2017, these brands will be moving to a two year warranty. Generally, all other products sold in the U.S. and internationally are covered by a comparable one to two year warranty. The majority of our defective watch products returned by consumers in the Americas are processed at our repair facilities in Texas while defective watch products returned by consumers in Europe are processed at our repair facilities in France. We also maintain repair facilities at a majority of our subsidiaries, as well as through our network of third-party distributors to handle repairs which are minor in nature or are not convenient to one of our centralized repair facilities. In most cases, defective products under warranty are repaired by our personnel or third-party distributors. We attempt to retain adequate levels of component parts to facilitate after-sales service of our watches, even after specific styles are discontinued. We have a component parts system that tracks the inventory of our various component replacement parts that can be utilized by our repair facilities for identifying stock levels and availability for procurement. Watch and non-watch products under warranty that cannot be repaired in a cost-effective manner are replaced by us at no cost to the customer. Our warranty liability at the end of fiscal years 2016, 2015 and 2014 was $15.4 million, $13.7 million and $13.5 million, respectively. Repair services accounted for approximately 1.2% of our consolidated net sales in fiscal year 2016, 1.1% in fiscal year 2015 and 1.0 % in fiscal year 2014.
17
Governmental regulations
Imports and import restrictions. Most of our products are assembled or manufactured overseas. As a result, the U.S. and countries in which our products are sourced or sold may from time to time modify existing or impose new quotas, duties (including antidumping or countervailing duties), tariffs or other restrictions in a manner that adversely affects us. For example, our products imported to the U.S. are subject to U.S. customs duties and, in the ordinary course of our business, we may from time to time be subject to claims by the U.S. Customs Service for duties and other charges. Factors that may influence the modification or imposition of these restrictions include the determination by the U.S. Trade Representative that a country has denied adequate intellectual property rights or fair and equitable market access to U.S. firms that rely on intellectual property, trade disputes between the U.S. and a country that leads to withdrawal of "most favored nation" status for that country and economic and political changes within a country that are viewed unfavorably by the U.S. government. We cannot predict the effect these events would have on our operations, if any, especially in light of the concentration of our assembly and manufacturing operations in Hong Kong and China.
General. We are subject to laws regarding customs, tax, employment, privacy, truth-in-advertising, consumer product safety, zoning and occupancy and other laws and regulations that regulate and/or govern the importation, promotion and sale of consumer products and our corporate, retail and distribution operations.
Intellectual property
Trademarks. We use our FOSSIL, MICHELE, MISFIT, RELIC, SKAGEN and ZODIAC trademarks, as well as other trademarks, on certain of our watches, activity trackers, leather goods and other fashion accessories in the U.S. and in a significant number of foreign countries. We also use FOSSIL, SKAGEN, WATCH STATION INTERNATIONAL®, and WSI® as trademarks on retail stores and FOSSIL, SKAGEN, WATCH STATION INTERNATIONAL, WSI, MISFIT and MICHELE as trademarks on online e-commerce sites. We have taken steps to establish or provide additional protection for our trademarks by registering or applying to register our trademarks for relevant classes of products in each country where our products are sold in addition to certain foreign countries where it is our intent to market our products in the future. Each registered trademark may be renewable indefinitely, so long as we continue to use the mark in the applicable jurisdiction and make the appropriate filings when required. We aggressively protect our trademarks and trade dress and pursue infringement both domestically and internationally. We also pursue counterfeiters both domestically and internationally through third party on-line monitoring and through leads generated internally, as well as through our business partners worldwide.
Patents. We continue to explore innovations in the design and assembly of our watch products. As a result, we have been granted, and have pending, various U.S. and international design and utility patents related to certain of our product designs, features, and technologies. As of December 31, 2016, none of our patents were material to our business.
License agreements. A significant portion of our sales and net income is, and is expected to continue to be, derived from the sales of products produced under licensing agreements with third-parties. Under these license agreements, we generally have the right to produce, market and distribute certain products utilizing the brand names of other companies. Our significant license agreements have various expiration dates between 2017 and 2025.
Other. We rely upon unpatented trade secrets, know-how, and continuing technological innovation to develop and maintain our competitive position, particularly in the wearable technology space. We strive to protect our trade secrets and other proprietary information through agreements with current and prospective product development partners, confidentiality agreements with employees, consultants and others that may have access to our proprietary information and through the use of other security measures.
Seasonality
Although the majority of our products are not seasonal, our business is seasonal by nature. A significant portion of our net sales and operating income is generated during the third and fourth quarters of our fiscal year, which includes the "back to school" and Christmas seasons. Additionally, as our retail and e-commerce sales continue to maintain a significant percentage of our sales mix, they will benefit our sales and profitability in our fiscal fourth quarter, generally at the expense of our fiscal first and second quarters when it is more difficult to leverage our retail and e-commerce expenses against the related sales. The amount of net sales and operating income generated during our fiscal fourth quarter also depends upon the anticipated level of retail sales during the Christmas season, as well as general economic conditions and other factors beyond our control. In addition, the amount of net sales and operating income generated during our fiscal first quarter depends in part upon the actual level of retail sales during the Christmas season. For example, lower levels of inventory held by our wholesale customers at the end of the Christmas season may result in higher levels of restocking orders placed by them during our fiscal first quarter.
18
Competition
The businesses in which we compete are highly competitive and fragmented. We believe that the current market for traditional watches can be divided into four segments, ranging from lower price point watches that are typically distributed through mass market channels to luxury watches at higher price points that are typically distributed through fine watch departments of upscale department stores or upscale specialty watch and fine jewelry stores. Our watch business generally competes in these segments with a number of established manufacturers, importers and distributors, including Armitron, Citizen, Gucci, Guess?, Kenneth Cole, LVMH Group, Movado, Raymond Weil, Seiko, Swatch, Swiss Army, TAG Heuer and Timex. In addition, our leather goods, sunglasses, and jewelry businesses compete with a large number of established companies that have significant experience developing, marketing and distributing such products. In all of our businesses, we compete with numerous manufacturers, importers and distributors who may have significantly greater financial, distribution, advertising and marketing resources than us. Our competitors include distributors that import watches and accessories from abroad, U.S. companies that have established foreign manufacturing relationships and companies that produce accessories domestically.
Although the level and nature of competition varies among our product categories and geographic regions, we believe that we compete on the basis of style, price, value, quality, brand name, advertising, marketing, distribution and customer service. We believe that our ability to identify and respond to changing fashion trends and consumer preferences (including wearable technology), to maintain existing relationships and develop new relationships with manufacturing sources, to deliver quality merchandise in a timely manner, to manage the retail sales process, and integrate Misfit’s technology platform into our business model are important factors in our ability to compete. We also believe that our distinctive business model of owning the distribution in many key markets and offering a globally recognized portfolio of proprietary and licensed products allows for many competitive advantages over smaller, regional or local competitors. This "ownership of the market" allows us to bypass the local distributor's cost structure in certain countries, resulting in more competitively priced products while also generating higher product and operating margins.
We believe the risk of significant new competitors is mitigated to some extent by barriers to entry such as high startup costs and the development of long-term relationships with customers and manufacturing sources. However, in the expanding wearable technology industry we face relatively new competition from technology brands such as Apple and Samsung, from fitness brands such as Fitbit, as well as from many established traditional watch manufacturers as they enter into the wearable technology category. As this segment evolves and grows, there will likely be increased competition as well. However, we believe our design, branding, significant scale and distribution are strong competitive advantages.
Employees
As of December 31, 2016, we employed approximately 14,500 persons, including approximately 8,500 persons employed by our foreign operating subsidiaries.
None of our domestic or foreign-based employees are represented by a trade union. However, certain European-based employees are represented by work councils, which include certain of our current employees who negotiate with management on behalf of all the employees. We have never experienced a work stoppage and consider our working relationship with our employees and work councils to be good.
19
Item 1A. Risk Factors
The statements contained in this Annual Report on Form 10-K that are not historical facts, including, but not limited to, statements regarding our expected financial position, results of operations, business and financing plans found in Item 1. Business and Item 7. Management's Discussion and Analysis of Financial Condition and Results of Operations, constitute forward-looking statements within the meaning of the Securities Litigation Reform Act of 1995 and involve a number of risks and uncertainties. The words "may", "believes", "expects", "plans", "intends", "anticipates" and similar expressions identify forward-looking statements. These forward-looking statements are based on our current expectations and beliefs concerning future developments and their potential effect on us. While management believes that these forward-looking statements are reasonable as and when made, there can be no assurance that future developments affecting us will be those that we anticipate. The actual results of the future events described in such forward-looking statements could differ materially from those stated in such forward-looking statements.
Our actual results may differ materially due to the risks and uncertainties discussed in this Annual Report on Form 10-K, including those discussed below. Accordingly, readers of this Annual Report on Form 10-K should consider these factors in evaluating, and are cautioned not to place undue reliance on, the forward-looking statements contained herein. We undertake no obligation to update or revise publicly any forward-looking statements, whether as a result of new information, future events or otherwise, except as required by law.
Risk Factors Relating to Our Business
Our success depends upon our ability to anticipate and respond to changing fashion and product trends.
Our success depends upon our ability to anticipate and respond to changing fashion and product trends and consumer preferences in a timely manner. The purchasing decisions of consumers are highly subjective and can be influenced by many factors, such as brand image, marketing programs and product design. Our success depends, in part, on our ability to anticipate, gauge and respond to these changing consumer preferences in a timely manner while preserving the authenticity and the quality of our brands. Although we attempt to stay abreast of emerging lifestyle and fashion trends, and now, technology advances affecting accessories, any failure by us to identify and respond to such trends could adversely affect consumer acceptance of our existing brand names and product lines, which in turn could adversely affect sales of our products. If we misjudge the market for our products, we may be faced with a significant amount of unsold finished goods inventory, which could adversely affect our results of operations.
Our success depends upon our ability to continue to develop innovative products, including wearable technology.
Our success depends upon our ability to continue to develop innovative products in the respective markets in which we compete. Wearable technology is a growing category of fashion that offers customers new functionality with accessories, including jewelry and smart watches. Our ability to respond to consumer preferences for wearable technology will depend in part on establishing successful partnerships with or acquiring companies that are involved in developing wearable technology. If we are unable to establish such partnerships or make meaningful acquisitions, this could negatively impact our ability to meet customer demands for wearable technology. Additionally, we may be unable to enhance and develop our products to satisfy consumer demands for wearable technology or we may fail to do so in a timely manner or at competitive prices. The process of developing new products is complex and uncertain, and involves time, substantial costs and risks, which are further magnified when the development process involves a transition to a new technology platform. Our inability or the inability of our partners, for technological or other reasons, some of which may be beyond our or our partners' control, to enhance, develop, and monetize wearable technology products in a timely manner, or at all, in response to changing consumer preferences for wearable technology, could have a material adverse effect on our business, results of operations and financial condition or could result in our products not achieving market acceptance or becoming obsolete. If we are unable to successfully introduce new products, or if our competitors introduce new or superior products, customers may purchase increasing amounts of products from our competitors, which could adversely affect our sales and results of operations.
Any deterioration in the global economic environment, and any resulting declines in consumer confidence and spending, could have an adverse effect on our operating results and financial condition.
Uncertainty in global markets, slowing economic growth, high levels of unemployment and eroding consumer confidence can negatively impact the level of consumer spending for discretionary items. This can affect our business as it is dependent on consumer demand for our products. Global economic conditions remain uncertain, and the possibility remains that domestic or global economies, or certain industry sectors of those economies that are key to our sales, may slow or deteriorate, which could
20
result in a corresponding decrease in demand for our products and negatively impact our results of operations and financial condition.
We have recently expanded and intend to further expand the scope of our product offerings, and new products introduced by us may not achieve consumer acceptance comparable to that of our existing product lines.
We have recently expanded and intend to further expand the scope of our product offerings, particularly in the wearable technology space. As is typical with new products, market acceptance of new designs and products is subject to uncertainty. In addition, we generally make decisions regarding product designs and technology development several months in advance of the time when consumer acceptance can be measured. If trends shift away from our products, if our wearable technology becomes outdated or if we misjudge the market for our product lines, we may be faced with significant amounts of unsold inventory or other conditions which could have a material adverse effect on our financial condition and results of operations.
The failure of new product designs or new product lines to gain market acceptance could also adversely affect our business and the image of our brands. Achieving market acceptance for new products or technology may also require substantial marketing efforts and expenditures to generate consumer demand. These requirements could strain our management, financial and operational resources. If we do not continue to develop innovative products that provide better design, technology and performance attributes than the products of our competitors and that are accepted by consumers, or if our future product lines misjudge consumer demands, we may lose consumer loyalty, which could result in a decline in our sales and market share.
The effects of economic cycles, terrorism, acts of war and retail industry conditions may adversely affect our business.
Our business is subject to economic cycles and retail industry conditions. Purchases of discretionary fashion accessories, such as our watches, handbags, sunglasses and other products, tend to decline during recessionary periods when disposable income is low and consumers are hesitant to use available credit. In addition, acts of terrorism, acts of war and military action both in the U.S. and abroad can have a significant effect on economic conditions and may negatively affect our ability to procure our products from manufacturers for sale to our customers. Any significant declines in general economic conditions, public safety concerns or uncertainties regarding future economic prospects that affect consumer spending habits could have a material adverse effect on consumer purchases of our products.
The loss of any of our license agreements, pursuant to which a number of our products are produced, may result in the loss of significant revenues and may adversely affect our business.
A significant portion of our sales and net income is, and is expected to continue to be, derived from the sales of products produced under license agreements with third parties. Under these license agreements, we generally have the right to produce, market and distribute certain products utilizing the brand names of other companies. We sell products under certain licensed brands, including, but not limited to, ADIDAS, ARMANI EXCHANGE, BURBERRY, CHAPS, DIESEL, DKNY, EMPORIO ARMANI, KARL LAGERFELD, KATE SPADE NEW YORK, MARC BY MARC JACOBS, MICHAEL KORS, and TORY BURCH. Sales of our licensed products amounted to approximately 47.6% of our consolidated net sales for fiscal year 2016, including MICHAEL KORS product sales, which accounted for approximately 22.7% of our consolidated net sales. Our significant license agreements have various expiration dates between 2017 and 2025. In addition, certain license agreements may require us to make minimum royalty payments, subject us to restrictive covenants or require us to comply with certain other obligations and may be terminated by the licensor if these or other conditions are not met or upon certain events. We may not be able to continue to meet our obligations or fulfill the conditions under these agreements in the future. In addition, we may be unable to renew our existing license agreements beyond the current term or obtain new license agreements to replace any lost license agreements on similar economic terms or at all. In 2016, it was announced the licensing agreement with ADIDAS will not be renewed upon its expiration in the first quarter of fiscal year 2017 and the licensing agreement with BURBERRY will not be renewed upon its expiration in the fourth quarter of fiscal year 2017. The failure by us to maintain or renew one or more of our existing license agreements could result in a significant decrease in our sales and have a material adverse effect on our results of operations.
Our restructuring program may not be successful or we may not fully realize the expected cost savings and/or operating efficiencies from our restructuring plans.
As we announced in the fourth quarter of 2016, we have implemented, and plan to continue to implement, a restructuring plan to reinvent the Company, strengthen the foundation of the Company for the future and support long-term sales growth and profitability objectives. The program is intended to touch all aspects of the business, enhance operating capabilities, create greater efficiencies and take advantage of the Company's considerable scale. We estimate our total restructuring charges will be approximately $150.0 million, which will be recorded predominately during fiscal years 2017 and 2018. Restructuring plans present significant potential risks that may impair our ability to achieve anticipated operating enhancements and/or cost
21
reductions, or otherwise harm our business, including higher than anticipated costs in implementing our restructuring plan, management distraction and employee attrition in excess of headcount reductions.
Our inability to effectively manage our retail store operations could adversely affect our results of operations.
During fiscal year 2016, our global comparable store sales decreased 4.5%. During fiscal year 2017, we intend to open approximately 15 new stores globally and close approximately 40 stores. The success of our retail business depends, in part, on our ability to open new profitable stores, close low performing stores and renew our existing store leases on terms that meet our financial targets. Our ability to open new stores on schedule or at all, to close low performing stores and to renew existing store leases on favorable terms or to operate them on a profitable basis will depend on various factors, including our ability to:
• | identify suitable markets for new stores and available store locations; |
• | negotiate acceptable lease terms for new locations or renewal terms for existing locations; |
• | manage and expand our infrastructure to accommodate growth; |
• | hire and train qualified sales associates; |
• | develop new merchandise and manage inventory effectively to meet the needs of new and existing stores on a timely basis; |
• | maintain favorable relationships with major developers and other landlords; and |
• | avoid construction delays and cost overruns in connection with the build-out of new stores. |
Our plans to manage our store base may not be successful and the opening of new stores may not result in an increase in our net sales even though they increase our costs. Our inability to effectively manage our retail store base could have a material adverse effect on the amount of net sales we generate and on our financial condition and results of operations.
New technologies could render our wearable technology obsolete.
New developments in technology may negatively affect the development or sale of our wearable technology or make such products obsolete. Our inability to enhance our existing wearable technology in a timely manner or to develop and introduce new products that incorporate new technologies and achieve market acceptance in a timely manner could negatively impact our competitive position, which could have a material adverse effect on our business or results of operations.
Increased competition from online only retailers and a highly promotional retail environment may increase pressure on our margins.
The increase in e-commerce competitors for retail sales and slowing mall traffic has resulted in significant pricing pressure and a highly promotional retail environment. In addition, the traditional watch market has declined in recent years. These factors may cause us to reduce our sales prices to retailers and consumers, which could cause our gross margin to decline if we are unable to appropriately manage inventory levels and/or otherwise offset price reductions with comparable reductions in our costs. If our sales prices decline and we fail to sufficiently reduce our product costs or operating expenses, our profitability will decline. This could have a material adverse effect on our business, results of operations, and financial condition.
Certain key components in our products come from limited sources of supply, which exposes us to potential supply shortages that could disrupt the manufacture and sale of our products.
We and our contract manufacturers currently purchase a number of key components used to manufacture our products from limited sources of supply for which alternative sources may not be readily available. Any interruption or delay in the supply of any of these components could significantly harm our ability to meet scheduled product deliveries to our customers and cause us to lose sales. Interruptions or delays in supply may be caused by a number of factors that are outside of our and our contract or manufacturers' control. In addition, the purchase of these components on a limited source basis subjects us to risks of price increases and potential quality assurance problems. An increase in the cost of components could make our products less competitive and result in lower gross margins. In the event that we can no longer obtain materials from these limited sources of supply, we might not be able to qualify or identify alternative suppliers in a timely fashion. Any extended interruption in the supply of any of the key components currently obtained from a limited source or delay in transitioning to a replacement supplier could disrupt our operations and significantly harm our business in any given period. If our supply of certain components is disrupted, our lead times are extended or the cost of our components increases, our business, operating results and financial condition could be materially affected.
22
The loss of key senior management personnel could negatively affect our business.
We depend on our senior management and other key personnel, particularly Kosta N. Kartsotis, our CEO and Chairman. We do not have "key person" life insurance policies for any of our personnel. The loss of any of our executive officers or other key employees could harm our business.
A data security or privacy breach could damage our reputation, harm our customer relationships, expose us to litigation or government actions, and result in a material adverse effect to our business, financial condition and results of operations.
We depend on information technology systems, the Internet and computer networks for a substantial portion of our retail and e-commerce businesses, including credit card transaction authorization and processing. We also receive and store personal information about our customers and employees, the protection of which is critical to us. In the normal course of our business, we collect, retain, and transmit certain sensitive and confidential customer information, including credit card information, over public networks. Our customers have a high expectation that we will adequately protect their personal information. In addition, personal information is highly regulated at the international, federal and state level.
Despite the security measures we currently have in place, our facilities and systems and those of our third-party service providers may be vulnerable to theft of physical information, security breaches, hacking attempts, computer viruses and malware, lost data and programming and/or human errors. Any electronic or physical security breach involving the misappropriation, loss, or other unauthorized disclosure of confidential or personally identifiable information, including penetration of our network security or those of our third-party service providers, could disrupt our business, severely damage our reputation and our customer relationships, expose us to litigation and liability, subject us to governmental investigations, fines and enforcement actions, result in negative media coverage and distraction to management and result in a material adverse effect to our business, financial condition, and results of operations. In addition, as a result of security breaches at a number of prominent retailers and other companies, the media and public scrutiny of information security and privacy has become more intense and the regulatory environment related thereto has become more uncertain. As a result, we may incur significant costs in complying with new and existing state, federal, and foreign laws regarding protection of, and unauthorized disclosure of, personal information.
We are subject to laws and regulations in the U.S. and the many countries in which we operate. Violations of laws and regulations, or changes to existing laws or regulations, could have a material adverse effect on our financial condition or results of operations.
Our operations are subject to domestic and international laws and regulations in a number of areas, including, but not limited to, labor, advertising, consumer protection, real estate, product safety, e-commerce, promotions, intellectual property, tax, import and export, anti-corruption, anti-bribery, foreign exchange controls and cash repatriation, data privacy, anti-competition, environmental, health and safety. Compliance with these numerous laws and regulations is complicated, time consuming and expensive, and the laws and regulations may be inconsistent from jurisdiction to jurisdiction, further increasing the difficulty and cost to comply with them. New laws and regulations, or changes to existing laws and regulations, could individually or in the aggregate make our products more costly to produce, delay the introduction of new products in one or more regions, cause us to change or limit our business practices, or affect our financial condition and results of operations. We have implemented policies and procedures designed to ensure compliance with the numerous laws and regulations affecting our business, but there can be no assurance that our employees, contractors, or agents will not violate such laws, regulations or our policies related thereto. Any such violations could have a material adverse effect on our financial condition or operating results.
Reduced lending by banks could have a negative impact on our customers, suppliers and business partners, which in turn could materially and adversely affect our financial condition, results of operations and liquidity.
Any reduction in lending by banks may have a significant negative impact on businesses around the world. Although we believe that our cash provided by operations and available borrowing capacity under our U.S. credit facility currently provide us with sufficient liquidity, the impact of reduced lending on our customers, business partners and suppliers cannot be predicted and may be quite severe. A disruption in the ability of our significant customers or distributors to access liquidity could cause serious disruptions or an overall deterioration of their businesses, which could lead to a significant reduction in their future orders of our products and the inability or failure on their part to meet their payment obligations to us, any of which could have a material adverse effect on our financial condition, results of operations and liquidity.
Seasonality of our business may adversely affect our net sales and operating income.
Our quarterly results of operations have fluctuated in the past and may continue to fluctuate as a result of a number of factors, including seasonal cycles, timing of new product introductions, timing of orders by our customers and mix of product sales demand. Our business is seasonal by nature. A significant portion of our net sales and operating income are generated
23
during the third and fourth quarters of our fiscal year, which includes the "back to school" and Christmas seasons. The amount of net sales and operating income generated during our fiscal fourth quarter depends upon the anticipated level of retail sales during the Christmas season, as well as general economic conditions and other factors beyond our control. In addition, the amount of net sales and operating income generated during our fiscal first quarter depends in part upon the actual level of retail sales during the Christmas season. The seasonality of our business may adversely affect our net sales and operating income during the first and fourth quarters of our fiscal year.
The amount of traffic to our retail stores depends primarily on the success of the shopping malls and retail centers in which our stores are located.
There has been a significant decrease in traffic in many of the shopping malls and retail centers in which our stores are located, which has resulted in decreased traffic to our stores. The resulting decrease in customers for our retail stores has had an adverse effect on our results of operations. Additionally, several national department store anchors have closed or will be closing a number of their locations in shopping malls, which is likely to further decrease traffic and put increasing financial strain on the operators of those shopping mall locations. The loss of an anchor or other significant tenant in a shopping mall in which we have a store, or the closure of a significant number of shopping malls in which we have stores, may have a material adverse effect on our results of operations.
We have key facilities in the U.S. and overseas, the loss or shut down of any of which could harm our business.
Our administrative, information technology and distribution operations in the U.S. are conducted primarily from two separate facilities located in the Dallas, Texas area. Our operations internationally are conducted from various administrative, distribution and assembly facilities outside of the U.S., particularly in China, Germany, Hong Kong, Vietnam and Switzerland. The complete or temporary loss of use of all or part of these facilities could have a material adverse effect on our business.
Our warehouse and distribution facilities in the Dallas, Texas area are operated in a special purpose sub-zone established by the U.S. Department of Commerce Foreign Trade Zone Board. Although the sub-zone allows us certain tax advantages, the sub-zone is highly regulated by the U.S. Customs Service. This level of regulation may cause disruptions or delays in the distribution of our products out of these facilities. Under some circumstances, the U.S. Customs Service has the right to shut down the entire sub-zone and, therefore, our entire warehouse and distribution facilities. During the time that the sub-zone is shut down, we may be unable to adequately meet the supply requests of our customers and our Company-owned retail stores, which could have an adverse effect on our sales, relationships with our customers, and results of operations, especially if the shutdown were to occur during our third or fourth quarter.
Our ability to grow our sales is dependent upon the implementation of our business strategy, which we may not be able to achieve.
Our ability to grow our sales is dependent on the successful implementation of our business strategy. This includes diversification of our product offerings, continuing to develop wearable technology, improving our omni channel capabilities and strategic acquisitions. If we are not successful in the expansion or development of our product offerings or our new products are not profitable or do not generate sales comparable to those of our existing businesses, our results of operations could be negatively impacted.
We also operate FOSSIL brand stores and other non-FOSSIL branded stores globally to further strengthen our brand image. As of December 31, 2016, we operated 585 stores worldwide. The costs associated with leasehold improvements to current stores and the costs associated with opening new stores and closing low performing stores could materially increase our costs of operation.
Our business could be harmed if we fail to maintain proper inventory levels.
We maintain an inventory of selected products that we anticipate will be in high demand. We may be unable to sell the products we have ordered in advance from manufacturers or that we have in our inventory. Inventory levels in excess of customer demand may result in inventory write-downs or the sale of excess inventory at prices below our standard levels. These events could significantly harm our operating results and impair the image of our brands. Conversely, if we underestimate consumer demand for our products or if our manufacturers fail to supply quality products in a timely manner, we may experience inventory shortages, which might result in unfilled orders, negatively impact customer relationships, diminish brand loyalty and result in lost revenues, any of which could harm our business.
Our license agreements may require minimum royalty commitments regardless of the level of product sales under these agreements.
24
Under our license agreements, we have in the past experienced, and could again in the future experience, instances where our minimum royalty commitments exceeded the royalties payable based upon our sales of the licensed products. Payments of minimum royalties in excess of the royalties based on our sales of the licensed products reduce our margins and could adversely affect our results of operations.
Fluctuations in the price, availability and quality of raw materials could cause delays and increase costs.
Fluctuations in the price, availability and quality of the raw materials used in our products could have a material adverse effect on our cost of sales or ability to meet our customers' demands. The price and availability of such raw materials may fluctuate significantly, depending on many factors, including natural resources, increased freight costs, increased labor costs, especially in China, and weather conditions. In the future, we may not be able to pass on all, or a portion of, such higher raw materials prices to our customers.
We rely on third-party assembly factories and manufacturers and problems with, or loss of, our assembly factories or manufacturing sources could harm our business and results of operations.
A substantial percentage of our watch and jewelry products are currently assembled or manufactured to our specifications by our majority-owned entities in China, with the remainder assembled or manufactured by independent entities. All of our handbags, small leather goods, belts and soft accessories are produced by independent manufacturers. We have no long-term contracts with these independent assembly factories or manufacturers and compete with other companies for production facilities. All transactions between us and our independent assembly factories or manufacturers are conducted on the basis of purchase orders. We face the risk that these independent assembly factories or manufacturers may not produce and deliver our products on a timely basis, or at all. As a result, we cannot be certain that these assembly factories or manufacturers will continue to assemble or manufacture products for us or that we will not experience operational difficulties with our manufacturers, such as reductions in the availability of production capacity, errors in complying with product specifications, insufficient quality control, shortages of raw materials, failures to meet production deadlines or increases in manufacturing costs. Our future success will depend upon our ability to maintain close relationships with, or ownership of, our current assembly factories and manufacturers and to develop long-term relationships with other manufacturers that satisfy our requirements for price, quality and production flexibility. Our ability to establish new manufacturing relationships involves numerous uncertainties, including those relating to payment terms, costs of manufacturing, adequacy of manufacturing capacity, quality control and timeliness of delivery. Any failure by us to maintain long-term relationships with, or ownership of, our current assembly factories and manufacturers or to develop relationships with other manufacturers could have a material adverse effect on our ability to manufacture and distribute our products.
If an independent manufacturer or license partner of ours fails to use acceptable labor practices or otherwise comply with laws, our business could suffer.
While we have a code of conduct for our manufacturing partners, we have no control over the ultimate actions or labor practices of our independent manufacturers. The violation of labor or other laws by one of our independent manufacturers, or by one of our license partners, or the divergence of an independent manufacturer's or license partner's labor practices from those generally accepted as ethical in the U.S. or other countries in which the violation or divergence occurred, could interrupt or otherwise disrupt the shipment of finished products to us or damage our reputation. Any of these, in turn, could have a material adverse effect on our financial condition and results of operations. As a result, should one of our independent manufacturers or licensors be found in violation of state or international laws, we could suffer financial or other unforeseen consequences.
We extend unsecured credit to our customers and are therefore vulnerable to any financial difficulties they may face.
We sell our merchandise primarily to department stores, specialty retail stores and distributors worldwide. We extend credit based on an evaluation of each customer's financial condition, usually without requiring collateral. Should any of our larger customers experience financial difficulties, we could curtail business with such customers or assume more credit risk relating to such customers' receivables. Our inability to collect on our trade accounts receivable relating to such customers could have a material adverse effect on our operating cash flows, financial condition and results of operations.
We do not maintain long-term contracts with our customers and are unable to control their purchasing decisions.
We do not maintain long-term purchasing contracts with our customers and therefore have no contractual leverage over their purchasing decisions. A decision by a major department store or other significant customer to decrease the amount of merchandise purchased from us or to cease carrying our products could have a material adverse effect on our net sales and operating strategy.
25
We face intense competition in the specialty retail and e-commerce industries and the size and resources of some of our competitors are substantially greater than ours, which may allow them to compete more effectively.
We face intense competition in the specialty retail and e-commerce industry where we compete primarily with specialty retailers, department stores and Internet businesses that engage in the retail sale of watches and accessories. We believe that the principal basis upon which we compete is the quality and design of merchandise and the quality of customer service. We also believe that price is an important factor in our customers' decision-making processes. Many of our competitors are, and many of our potential competitors may be, larger and have greater financial, marketing and other resources than we have and therefore may be able to adapt to changes in customer requirements more quickly, devote greater resources to the marketing and sale of their products and generate greater national brand recognition than we can, especially in the developing area of omni-channel retailing. Omni-channel retailing may include retail stores, e-commerce sites, mobile channels and other direct-to-consumer points of contact that enhance the consumer’s ability to interact with a retailer in the research, purchase, returning and serving of products . The intense competition and greater size and resources of some of our competitors could have a material adverse effect on the amount of net sales we generate and on our results of operations.
We could be negatively impacted if we fail to successfully integrate businesses we may acquire.
As part of our growth strategy, we have made, and may consider in the future, certain acquisitions, domestically and internationally, including acquisitions of certain watch brands and acquisitions of independent distributors of our products. The integration of future acquisitions may not be successful or generate sales increases. When we have acquired businesses, such as Misfit in December 2015, we have acquired businesses that we believe could enhance our business opportunities and our growth prospects. The acquisition of Misfit or any future acquisitions involve risks that could materially affect our business, financial condition and operating results. These risks include:
• | distraction of management from our business operations; |
• | loss of key personnel and other employees; |
• | costs, delays, and inefficiencies associated with integrating acquired operations and personnel; |
• | the impairment of acquired assets and goodwill; and |
• | acquiring the contingent and other liabilities of the businesses we acquire. |
In addition, Misfit or any future acquired businesses may not provide us with increased business opportunities or result in the growth that we anticipate. Furthermore, integrating acquired operations is a complex, time-consuming and expensive process. Combining acquired operations with our current operations may result in lower overall operating margins, greater stock price volatility and quarterly earnings fluctuations. Cultural incompatibilities, career uncertainties and other factors associated with such acquisitions may also result in the loss of employees. Failure to acquire and successfully integrate complementary practices, or failure to achieve the business synergies or other anticipated benefits, could materially adversely affect our business, financial condition and results of operations.
We face competition from traditional competitors as well as new competitors in the wearable technology category.
There is intense competition in each of the businesses in which we compete. In all of our businesses, we compete with numerous manufacturers, importers and distributors who may have significantly greater financial, distribution, advertising and marketing resources than us. Our competitors include distributors that import watches and accessories from abroad, U.S. companies that have established foreign manufacturing relationships and companies that produce accessories domestically. In addition, we face growing competition from technology companies that have or are launching smart watch products and other wearable technology. These new competitors have not historically competed with us, and many have significantly greater financial, distribution, advertising and marketing resources than us. The impact of the introduction of smart watch products and other wearable technology on sales of our traditional product lines, and watches in particular, is uncertain, but could be materially adverse. Our results of operations and market position may be adversely affected by our competitors and their competitive pressures in the watch, wearable technology and fashion accessory industries.
Any material disruption of our information systems could disrupt our business and reduce our sales.
We are increasingly dependent on information systems to operate our websites, process transactions, manage inventory, monitor sales and purchase, sell and ship goods on a timely basis. We also utilize SAP ERP in our U.S. operations and throughout most of our European operations to support our human resources, sales and distribution, inventory planning, retail merchandising and operational and financial reporting systems of our business, and Navision in our Asian operations to support many of the same functions on a local country level. We may experience operational problems with our information systems as
26
a result of system failures, viruses, computer "hackers" or other causes. Any material disruption or slowdown of our systems could cause information, including data related to customer orders, to be lost or delayed which could result in delays in the delivery of merchandise to our stores and customers or lost sales, which could reduce demand for our merchandise and cause our sales to decline. Moreover, the failure to maintain, or a disruption in, financial and management control systems could have a material adverse effect on our ability to respond to trends in our target markets, market our products and meet our customers' requirements.
In addition, we have e-commerce and other websites in the U.S. and internationally. In addition to changing consumer preferences and buying trends relating to Internet usage, we are vulnerable to certain additional risks and uncertainties associated with the Internet, including changes in required technology interfaces, website downtime and other technical failures, security breaches, and consumer privacy concerns. Our failure to successfully respond to these risks and uncertainties could reduce Internet sales, increase costs and damage the reputation of our brands.
Changes in the mix of product sales demand could negatively impact our gross profit margins.
Our gross profit margins are impacted by our sales mix as follows:
Sales channel mix: sales from our direct retail and e-commerce channels typically provide gross margins in excess of our historical consolidated gross profit margins, while sales from our distributor, mass market and off-price channels typically provide gross margins below our historical consolidated gross profit margins.
Product mix: traditional watch and jewelry sales typically provide gross margins in excess of historical consolidated gross profit margins, while leather goods and private label products typically provide gross margins below our historical consolidated gross profit margins. In addition, sales of our recently launched wearable technology products have produced gross profit margins below our historical consolidated gross profit margins, which we anticipate continuing in fiscal 2017.
Geographic mix: international sales typically produce gross margins in excess of our historical consolidated gross profit margins, while domestic sales typically provide gross margins below our historical consolidated gross profit margins.
If future sales from our higher gross margin businesses do not increase at a faster rate than our lower gross margin businesses, our gross profit margins may grow at a slower pace, cease to grow, or decrease relative to our historical consolidated gross profit margin.
Our industry is subject to pricing pressures that may adversely impact our financial performance.
We assemble or source many of our products offshore because they generally cost less to make overseas, due primarily to lower labor costs. Many of our competitors also source their product requirements offshore to achieve lower costs, possibly in locations with lower costs than our offshore operations, and those competitors may use these cost savings to reduce prices. To remain competitive, we must adjust our prices from time to time in response to these industry-wide pricing pressures. Our financial performance may be negatively affected by these pricing pressures if we are forced to reduce our prices and we cannot reduce our production costs or our production costs increase and we cannot increase our prices.
The loss of our intellectual property rights may harm our business.
Our trademarks, patents and other intellectual property rights are important to our success and competitive position. We are devoted to the establishment and protection of our trademarks, patents and other intellectual property rights in those countries where we believe it is important to our ability to sell our products. However, we cannot be certain that the actions we have taken will result in enforceable rights, will be adequate to protect our products in every country where we may want to sell our products, will be adequate to prevent imitation of our products by others or will be adequate to prevent others from seeking to prevent sales of our products as a violation of the trademarks, patents or other intellectual property rights of others. Additionally, we rely on the patent, trademark and other intellectual property laws of the U.S. and other countries to protect our proprietary rights. Even if we are successful in obtaining appropriate trademark, patent and other intellectual property rights, we may be unable to prevent third parties from using our intellectual property without our authorization, particularly in those countries where the laws do not protect our proprietary rights as fully as in the U.S. Because we sell our products internationally and are dependent on foreign manufacturing in China, we are significantly dependent on foreign countries to protect our intellectual property rights. The use of our intellectual property or similar intellectual property by others could reduce or eliminate any competitive advantage we have developed, causing us to lose sales or otherwise harm our business. Further, if it became necessary for us to resort to litigation to protect our intellectual property rights, any proceedings could be
27
burdensome and costly and we may not prevail. The failure to obtain or maintain trademark, patent or other intellectual property rights could materially harm our business.
Our products may infringe the intellectual property rights of others, which may cause us to incur unexpected costs or prevent us from selling certain of our products.
We cannot be certain that our products do not and will not infringe upon the intellectual property rights of others. The wearable technology space is rapidly developing with new innovation, which will likely result in a significant number of domestic and international patent filings for new technology. As a result, wearable technology companies may be subject to an increasing number of claims that their products infringe the intellectual property rights of competitors or non-practicing entities. As we increase our wearable technology and other product offerings, we may be subject to legal proceedings, including claims of alleged infringement of the intellectual property rights of third parties by our customers in connection with their marketing and sale of our products. Any such claims, whether or not meritorious, could result in costly litigation and divert the efforts of our personnel. Moreover, should we be found liable for infringement, we may be required to enter into agreements (if available on acceptable terms or at all) or to pay damages and cease making or selling certain products. Moreover, we may need to redesign or rename some of our products to avoid future infringement liability. Any of the foregoing could cause us to incur significant costs and prevent us from manufacturing or selling certain of our products.
An increase in product returns could negatively impact our operating results.
We accept limited returns and will request that a customer return a product if we feel the customer has an excess of any style that we have identified as being a poor performer for that customer or geographic location. We continually monitor returns and maintain a provision for estimated returns based upon historical experience and any specific issues identified. However, as we increase our wearable technology product offerings, we do not have the same level of historical experience estimating returns as we have with our other more mature products, which could result in us underestimating the level of returns. In addition, consumer acceptance of wearable technology products and the inherent outdating of technology over time may result in an increase in the amount of returns we accept from our customers. While returns have historically been within our expectations and the provisions established, future return rates may differ from those experienced in the past. In the event that our products are performing poorly in the retail market and/or we experience product damages or defects at a rate significantly higher than our historical rate, the resulting credit returns could have an adverse impact on our operating results for the period or periods in which such returns occur.
There are inherent limitations in all control systems, and misstatements due to error or fraud may occur and not be detected.
We are subject to the ongoing internal control provisions of Section 404 of the Sarbanes-Oxley Act of 2002. These provisions provide for the identification of material weaknesses in internal control over financial reporting, which is a process to provide reasonable assurance regarding the reliability of financial reporting for external purposes in accordance with accounting principles generally accepted in the United States of America. Our management, including our Chief Executive Officer and Chief Financial Officer, does not expect that our internal controls and disclosure controls will prevent all errors and all fraud. A control system, no matter how well conceived and operated, can provide only reasonable, not absolute, assurance that the objectives of the control system are met. In addition, the design of a control system must reflect the fact that there are resource constraints and the benefit of controls must be relative to their costs. Because of the inherent limitations in all control systems, no evaluation of controls can provide absolute assurance that all control issues and instances of fraud, if any, in our company have been detected. These inherent limitations include the realities that judgments in decision-making can be faulty and that breakdowns can occur because of simple errors or mistakes. Further, controls can be circumvented by individual acts of some persons, by collusion of two or more persons, or by management override of the controls. The design of any system of controls is also based in part upon certain assumptions about the likelihood of future events, and there can be no assurance that any design will succeed in achieving its stated goals under all potential future conditions. Over time, a control may be inadequate because of changes in conditions, such as growth of the Company or increased transaction volume, or the degree of compliance with the policies or procedures may deteriorate. Because of inherent limitations in a cost-effective control system, misstatements due to error or fraud may occur and not be detected.
In addition, discovery and disclosure of a material weakness, by definition, could have a material adverse impact on our financial statements. Such an occurrence could discourage certain customers or suppliers from doing business with us, result in higher borrowing costs and affect how our stock trades. This could in turn negatively affect our ability to access public debt or equity markets for capital.
Risk Factors Relating to Our International Operations
Factors affecting international commerce and our international operations may seriously harm our financial condition.
28
During fiscal year 2016, we generated 55.4% of our net sales from outside of the U.S., and we anticipate that revenue from our international operations could account for an increasingly larger portion of our net sales in the future. Our international operations are directly related to, and dependent on, the volume of international trade and foreign market conditions. International commerce and our international operations are subject to many risks, some of which are discussed in more detail below, including:
• | recessions in foreign economies; |
• | the adoption and expansion of trade restrictions or the occurrence of trade wars; |
• | limitations on repatriation of earnings; |
• | difficulties in protecting our intellectual property or enforcing our intellectual property rights under the laws of other countries; |
• | longer receivables collection periods and greater difficulty in collecting accounts receivable; |
• | difficulties in managing foreign operations; |
• | social, political and economic instability; |
• | political tensions between the U.S. and foreign countries; |
• | compliance with, changes in or adoption of current, new or expanded regulatory requirements, particularly in the wearable technology space; |
• | our ability to finance foreign operations; |
• | tariffs and other trade barriers; and |
• | U.S. government licensing requirements for exports. |
The occurrence or consequences of any of these risks may restrict our ability to operate in the affected regions and decrease the profitability of our international operations, which may seriously harm our financial condition.
Foreign currency fluctuations could adversely impact our financial condition.
We generally purchase our products in U.S. dollars. However, we source a significant amount of our products overseas and, as such, the cost of these products may be affected by changes in the value of the currencies of these countries, including the Australian dollar, British pound, Canadian dollar, Chilean peso, Chinese yuan, Danish krone, euro, Hong Kong dollar, Indian rupee, Japanese yen, South Korean won, Malaysian ringgit, Mexican peso, Norwegian kroner, Singapore dollar, Swedish krona, Swiss franc and Taiwanese dollar. Due to our dependence on manufacturing operations in China, changes in the value of the Chinese yuan may have a material impact on our supply channels and manufacturing costs, including component and assembly costs.
In addition, changes in currency exchange rates may also affect the prices at which we sell products in foreign markets. For fiscal years 2016, 2015 and 2014, 55.4%, 53.8% and 54.7% of our consolidated net sales were generated outside of the U.S. In general, our overall financial results are affected positively by a weaker U.S. dollar and are affected negatively by a stronger U.S. dollar as compared to the foreign currencies in which we conduct our business. For example, due to a generally stronger U.S. dollar in fiscal year 2016, the translation of foreign based net sales into U.S. dollars reduced our reported net sales by approximately $45.4 million. If the value of the U.S. dollar remains at its current levels or strengthens further against foreign currencies, particularly against the euro, British pound, Canadian dollar, Japanese yen, Mexican peso, Australian dollar and U.S. dollar, our financial condition and results of operations could be materially and adversely impacted. Although we utilize forward contracts to help mitigate foreign currency risks (mostly relating to the euro, British pound, Canadian dollar, Japanese yen, Mexican peso, Australian dollar and U.S. dollar), foreign currency fluctuations may have a material adverse impact on our financial condition and results of operations.
The European economic uncertainty and any further debt crisis could adversely impact our financial condition.
The European economic situation, particularly with the planned withdrawal by the United Kingdom from the European Union, has contributed to instability in certain international credit markets. During fiscal year 2016, the value of the euro fell approximately 3% against the U.S. dollar and the British pound fell 17% and both may deteriorate further in the future. During fiscal year 2016, we generated 32.9% of our consolidated net sales from our Europe segment. If global economic and market
29
conditions, or economic conditions in Europe remain uncertain or deteriorate, the value of the euro could further decline. Any additional financial instability in stressed European countries could have a contagion effect on the region and contribute to the general instability and uncertainty in the European Union. If this were to occur or if the value of the euro were to further weaken against the U.S. dollar, our financial condition and results of operations could be materially and adversely impacted.
We depend on independent distributors to sell our products in certain international markets.
Our products are sold in certain international markets through independent distributors. If a distributor fails to meet annual sales goals or breaches the terms of our distribution agreement, it may be difficult and costly to locate an acceptable substitute distributor. If a change in our distributors becomes necessary, we may experience increased costs, as well as a substantial disruption in, and a resulting loss of, sales and profits.
Because we depend on foreign manufacturing, we are vulnerable to changes in economic and social conditions in Asia, particularly China, and disruptions in international travel and shipping.
Because a substantial portion of our watches and jewelry and certain of our handbags, sunglasses and other products are assembled or manufactured in China, our success will depend to a significant extent upon future economic and social conditions existing in China. If the factories in China were disrupted for any reason, we would need to arrange for the manufacture and shipment of products by alternative sources. Because the establishment of new manufacturing relationships involves numerous uncertainties, including those relating to payment terms, costs of manufacturing, adequacy of manufacturing capacity, quality control and timeliness of delivery, we are unable to predict whether such new relationships would be on terms that we regard as satisfactory. Any significant disruption in our relationships with our manufacturing sources located in China would have a material adverse effect on our ability to manufacture and distribute our products. In addition, restrictions on travel to and from this and other regions, and any delays or cancellations of customer orders or the manufacture or shipment of our products could have a material adverse effect on our ability to meet customer deadlines and timely distribute our products in order to match consumer tastes.
We face risks associated with increased political uncertainty.
In the U.S., the recent change in the U.S. government administration has resulted in uncertainty regarding potential changes in regulations, fiscal policy, social programs, domestic and foreign relations and international trade policies. For example, the new U.S. administration recently signaled a potential change in U.S. relations with Russia and China, and signed an Executive Order to withdraw from the Trans-Pacific Partnership.
Potential changes in relationships among the U.S., China, Russia and other countries could have significant impacts on global trade and regional economic conditions, among other things. In addition, changes in the relationships between the U.S. and its neighbors, such as Mexico, can have significant, potentially negative, impacts on commerce. Further, anti-American sentiment could harm the reputation and success of U.S. companies doing business abroad.
In Europe, the populist movement has resulted in the Brexit vote, and recent election results are signaling increasing populist demands and rises in nationalism, which could have a negative impact on economic policy and consequently pose a potential threat to the unity of the European Union.
Our business is dependent upon its international operations, particularly in Asia and Europe. During fiscal years 2016, 2015 and 2014, we generated 55.4%, 53.8% and 54.7%, respectively, of our net sales outside the U.S. In addition, we source the vast majority of our products from outside the U.S.
Our ability to respond to these developments or comply with any resulting new legal or regulatory requirements, including those involving economic and trade sanctions, could reduce our sales, increase our costs of doing business, reduce our financial flexibility and otherwise have a material adverse effect on our business, financial condition and results of our operations.
Risks associated with foreign government regulations and U.S. trade policy may affect our foreign operations and sourcing.
Our businesses are subject to risks generally associated with doing business abroad, such as foreign governmental regulation in the countries in which our manufacturing sources are located, primarily China. While we have not experienced any material issues with foreign governmental regulations that would impact our arrangements with our foreign manufacturing sources, we believe that this issue is of particular concern with regard to China due to the less mature nature of the Chinese market economy and the historical involvement of the Chinese government in industry. If regulations were to render the conduct of business in a particular country undesirable or impracticable, or if our current foreign manufacturing sources were
30
for any other reason to cease doing business with us, such a development could have a material adverse effect on our product sales and on our supply, manufacturing and distribution channels.
Our business is also subject to risks associated with U.S. and foreign legislation and regulations relating to imports, including quotas, duties, tariffs or taxes, and other charges or restrictions on imports, which could adversely affect our operations and our ability to import products at current or increased levels. We cannot predict whether additional U.S. and foreign customs quotas, duties (including antidumping or countervailing duties), tariffs, taxes or other charges or restrictions, requirements as to where raw materials must be purchased, additional workplace regulations or other restrictions on our imports will be imposed upon the importation of our products in the future or adversely modified, or what effect such actions would have on our costs of operations. For example, our products imported to the U.S. are subject to U.S. customs duties and, in the ordinary course of our business, we may from time to time be subject to claims by the U.S. Customs Service for duties and other charges. Factors that may influence the modification or imposition of these restrictions include the determination by the U.S. Trade Representative that a country has denied adequate intellectual property rights or fair and equitable market access to U.S. firms that rely on intellectual property, trade disputes between the U.S. and a country that leads to withdrawal of "most favored nation" status for that country and economic and political changes within a country that are viewed unfavorably by the U.S. government. Future quotas, duties or tariffs may have a material adverse effect on our business, financial condition and results of operations. Future trade agreements could also provide our competitors with an advantage over us, or increase our costs, either of which could have a material adverse effect on our business, financial condition and results of operations and financial condition. Substantially all of our import operations are subject to customs duties imposed by the governments where our production facilities are located on imported products, including raw materials.
Risk Factors Relating to Our Common Stock
Many factors may cause our net sales, operating results and cash flows to fluctuate and possibly decline, which may result in declines in our stock price.
Our net sales, operating results and cash flows may fluctuate significantly because of a number of factors, many of which are outside of our control. These factors may include, but may not be limited to, the following:
• | fluctuations in market demand for our products; |
• | increased competition and pricing pressures; |
• | our ability to anticipate changing customer demands and preferences; |
• | our ability to compete in the wearable technology space; |
• | growth in our international operations; |
• | our failure to efficiently manage our inventory levels; |
• | our inability to manage and maintain our debt obligations; |
• | seasonality in our business; |
• | changes in our, and our competitors', business strategy or pricing; |
• | the successful management of our Company-owned retail store operations; |
• | the timing of certain selling, general and administrative expenses; |
• | completing acquisitions and the costs of integrating acquired operations; |
• | international currency fluctuations, operating challenges and trade regulations; |
• | acts of terrorism or acts of war; and |
• | government regulation. |
One or more of the foregoing factors, as well as any other risk factors discussed in this Annual Report on Form 10-K, may cause our operating expenses to be unexpectedly high or result in a decrease in our net sales during any given period. If these or any other variables or unknowns were to cause a shortfall in revenues or earnings, an increase in our operating costs or otherwise cause a failure to meet public market expectations, our stock price may decline and our business could be adversely affected.
31
Our CEO owns approximately 13% of our outstanding common stock.
Mr. Kosta Kartsotis owns approximately 13% of our common stock as of December 31, 2016. As a result, he is in a position to influence the outcome of elections of our directors, the adoption, amendment or repeal of our bylaws and any other actions requiring the vote or consent of our stockholders, and to otherwise influence our affairs.
Because the interests of Mr. Kartsotis may not coincide with the interests of other stockholders, Mr. Kartsotis may influence the Company to enter into transactions or agreements that other stockholders would not approve or make decisions with which other stockholders may disagree.
Our organizational documents contain anti-takeover provisions that could discourage a proposal for a takeover.
Our certificate of incorporation and bylaws, as well as the General Corporation Law of the State of Delaware, contain provisions that may have the effect of discouraging a proposal for a takeover. These include a provision in our certificate of incorporation authorizing the issuance of "blank check" preferred stock and provisions in our bylaws establishing advance notice procedures with respect to certain stockholder proposals. Our bylaws may be amended by a vote of 80% of the Board of Directors, subject to repeal by a vote of 80% of the stockholders. In addition, Delaware law limits the ability of a Delaware corporation to engage in certain business combinations with interested stockholders. Finally, Mr. Kartsotis has the ability, by virtue of his stock ownership, to influence a vote regarding a change in control.
Future sales of our common stock in the public market could adversely affect our stock price.
The shares of our common stock beneficially owned by Mr. Kartsotis may be sold in the open market in the future, subject to any volume restrictions and other limitations under the Securities Act of 1933 and Rule 144 thereunder. We may also decide to file a registration statement enabling Mr. Kartsotis to sell additional shares. Any sales by Mr. Kartsotis of substantial amounts of our common stock in the open market, or the availability of his shares for sale, could adversely affect the price of our common stock. The market price of our common stock could decline as a result of sales of substantial amounts of our common stock in the public market, or the perception that those sales could occur. These sales or the possibility that they may occur also could make it more difficult for us to raise funds in any equity offering in the future at a time and price that we deem appropriate.
Item 1B. Unresolved Staff Comments
None.
Item 2. Properties
Company facilities. As of the end of fiscal year 2016, we owned or leased the following material facilities in connection with our U.S. and international operations:
Location | Use | Approximate Square Footage | Owned / Leased | ||||
Eggstätt, Germany | Office, warehouse and distribution | 383,000 | Owned | ||||
Grabenstätt, Germany | Office | 92,000 | Owned | ||||
Richardson, Texas | Corporate headquarters | 536,000 | Lease expiring in 2021 | ||||
Dallas, Texas | Office, warehouse and distribution | 518,000 | Lease expiring in 2026 | ||||
Hong Kong | Warehouse and distribution | 205,000 | Lease expiring in 2023 | ||||
Garland, Texas | Warehouse | 154,000 | Lease expiring in 2022 | ||||
Basel, Switzerland | Europe headquarters | 140,000 | Lease expiring in 2036 | ||||
Shenzhen, China | Manufacturing | 110,000 | Lease expiring in 2018 | ||||
Hong Kong | Asia headquarters | 42,000 | Lease expiring in 2019 | ||||
New York, New York | General office and showroom | 27,000 | Lease expiring in 2027 | ||||
We also lease certain other manufacturing and/or office, warehouse and/or distribution facilities in Burlingame, California; Chicago, Illinois; Los Angeles, California; Miami, Florida; Australia; Austria; Canada; China; Denmark; France; Germany; Hong Kong; India; Italy; Japan; Malaysia; Mexico; the Netherlands; New Zealand; Poland; Portugal; Singapore; South Africa; South Korea; Spain; Sweden; Switzerland; Taiwan, the United Kingdom and Vietnam.
32
Retail store facilities. As of the end of fiscal year 2016, we had 602 lease agreements for retail space for the sale of our products. The leases, including renewal options, expire at various times from 2017 to 2029. The leases provide for minimum annual rentals and, in certain cases, for the payment of additional rent when sales exceed specified net sales amounts. We are also generally required to pay our pro rata share of common area maintenance costs, real estate taxes, insurance, maintenance expenses and utilities.
We believe that our material existing facilities are well maintained, in good operating condition, and are adequate for our needs.
Item 3. Legal Proceedings
The Company is occasionally subject to litigation or other legal proceedings in the normal course of its business. The Company does not believe that the outcome of any currently pending legal matters, individually or collectively, will have a material effect on the business or financial condition of the Company.
Item 4. Mine Safety Disclosures
Not applicable.
33
PART II
Item 5. Market for Registrant's Common Equity, Related Stockholder Matters and Issuer Purchases of Equity Securities
General. Our common stock is listed on the NASDAQ Global Select Market under the symbol "FOSL." The following table sets forth the range of quarterly high and low sales prices per share of our common stock on the NASDAQ Global Select Market for the fiscal years ended December 31, 2016 and January 2, 2016.
High | Low | ||||||
Fiscal year ended December 31, 2016: | |||||||
First quarter | $ | 51.93 | $ | 28.26 | |||
Second quarter | $ | 43.79 | $ | 26.03 | |||
Third quarter | $ | 33.05 | $ | 26.30 | |||
Fourth quarter | $ | 36.87 | $ | 23.10 | |||
Fiscal year ended January 2, 2016: | |||||||
First quarter | $ | 110.05 | $ | 79.50 | |||
Second quarter | $ | 86.50 | $ | 68.55 | |||
Third quarter | $ | 71.98 | $ | 53.05 | |||
Fourth quarter | $ | 58.18 | $ | 30.65 | |||
As of February 20, 2017, there were 168 holders of record of our shares of common stock (including nominee holders such as banks and brokerage firms who hold shares for beneficial owners), although we believe that the number of beneficial owners is much higher.
Cash Dividend Policy. We did not pay any cash dividends in fiscal years 2016, 2015 or 2014. We expect that for the foreseeable future, we will retain all available earnings generated by our operations for the development and growth of our business. Any future determination as to a cash dividend policy will be made at the discretion of our Board of Directors and will depend on a number of factors, including our future earnings, capital requirements, stock repurchase plans, financial condition, future prospects, restrictive covenants and such other factors as our Board of Directors may deem relevant.
Pledging of Company Securities. We have an insider trading policy that applies to all directors, officers and employees of the Company and its subsidiaries. Under this policy, directors and executive officers may not pledge, hypothecate, or otherwise encumber Company securities as collateral for indebtedness or hold Company securities in a margin account; provided, however, that our Lead Independent Director and General Counsel, acting together, may grant an exception to this prohibition on a case-by-case basis.
In February 2017, we granted an exception to this prohibition to our Chairman and Chief Executive Officer, permitting him to pledge up to 3,832,870 shares as collateral for a loan. In deciding to grant this exception, we considered the following factors:
• | Mr. Kartsotis is one of the Company’s founders and one of its largest stockholders. |
• | None of the pledged shares were acquired by Mr. Kartsotis through a Company compensation plan. In fact, Mr. Kartsotis has never received any equity compensation from us and has not received any cash compensation since 2004 for serving as a director or executive officer. |
• | The pledged shares are not used to shift or hedge any economic risk in owning Company shares, and the loan is for personal purposes. |
• | If Mr. Kartsotis had not been able to pledge the shares, he would have been forced to sell shares of common stock in order to obtain the necessary funds. |
• | The pledged shares represent 8.0% of our outstanding common stock as of February 20, 2017, and therefore, do not present any appreciable risk for investors or the Company. |
34
• | In the unlikely event the pledged shares needed to be sold, they would represent approximately two days of the Company’s 30-day average trading volume as of February 27, 2017. |
Common Stock Performance Graph
The following performance graph compares the cumulative return of our shares of common stock over the preceding five year periods with that of the broad market Standard & Poor's 500 Stock Index ("S&P 500 Index") and the NASDAQ Retail Trades Group. Each index assumes $100 invested at December 31, 2011 and is calculated assuming quarterly reinvestment of dividends and quarterly weighting by market capitalization.
2016 COMPARATIVE TOTAL RETURNS
Fossil Group, Inc.,
NASDAQ Retail Trades and S&P 500 Index
(Performance Results through 12/31/2016)
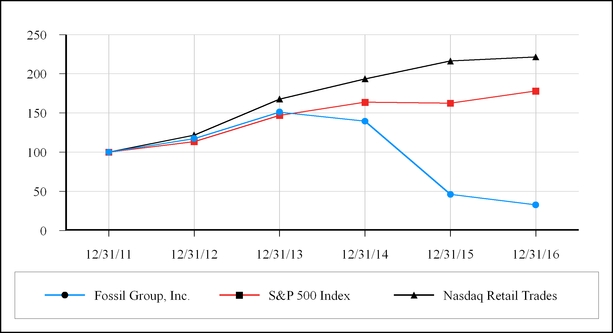
12/31/2011 | 12/31/2012 | 12/31/2013 | 12/31/2014 | 12/31/2015 | 12/31/2016 | ||||||||||||||||||
Fossil Group, Inc. | $ | 100.00 | $ | 117.31 | $ | 151.13 | $ | 139.54 | $ | 46.07 | $ | 32.59 | |||||||||||
S&P 500 Index | $ | 100.00 | $ | 113.41 | $ | 146.97 | $ | 163.72 | $ | 162.53 | $ | 178.02 | |||||||||||
Nasdaq Retail Trades | $ | 100.00 | $ | 121.76 | $ | 167.78 | $ | 193.57 | $ | 216.34 | $ | 221.51 | |||||||||||
Purchases of Equity Securities by the Issuer and Affiliated Purchasers
In August 2010, our Board of Directors approved a common stock repurchase program pursuant to which up to $30 million could be used to repurchase outstanding shares of our common stock. The $30 million repurchase program has no termination date and, as of December 31, 2016, no shares had been repurchased under it. In December 2012, our Board of Directors approved a common stock repurchase program pursuant to which up to $1.0 billion could be used to repurchase outstanding shares of our common stock. We completed the $1.0 billion repurchase program during the first quarter of fiscal year 2015, under which we repurchased approximately 281,000 shares. On November 10, 2014, the Company’s Board of Directors authorized a new $1.0 billion share repurchase program with an expiration date of December 31, 2018. As of December 31, 2016, we have repurchased approximately 2.6 million shares at a cost of $205.8 million under that plan. These repurchase programs are conducted pursuant to Rule 10b-18 of the Securities Exchange Act of 1934.
Common stock repurchases acquired from grantees in connection with income tax withholding obligations arising from vesting of restricted stock grants were 6,763 shares, 11,175 shares and 13,572 shares for fiscal years 2016, 2015 and 2014, respectively.
35
The following table shows our common stock repurchases based on the settlement date for the quarter ended December 31, 2016:
Period | Total Number of Shares Purchased | Average Price Paid per Share | Total Number of Shares Purchased as Part of Publicly Announced Plan | Approximate Dollar Value of Shares that May Yet Be Purchased Under the Plans | |||||||||
October 2, 2016 - October 29, 2016 | 98 | $ | 28.43 | — | $ | 824,158,481 | |||||||
October 30, 2016 - November 26, 2016 | — | $ | — | — | $ | 824,158,481 | |||||||
November 27, 2016 - December 31, 2016 | — | $ | — | — | $ | 824,158,481 | |||||||
Total | 98 | — | |||||||||||
Item 6. Selected Financial Data
The following information should be read in conjunction with our consolidated financial statements and notes thereto contained in Item 8. Consolidated Financial Statements and Supplementary Data of this Annual Report on Form 10-K (in thousands, except for per share data).
Fiscal Year | 2016 | 2015 | 2014 | 2013 | 2012 | ||||||||||||||
Net sales | $ | 3,042,371 | $ | 3,228,836 | $ | 3,509,691 | $ | 3,259,971 | $ | 2,857,508 | |||||||||
Gross profit | 1,578,186 | 1,753,467 | 2,001,172 | 1,861,686 | 1,606,543 | ||||||||||||||
Operating income | 127,146 | 291,234 | 566,536 | 561,596 | 488,840 | ||||||||||||||
Net income | 85,603 | 229,902 | 386,611 | 388,048 | 354,259 | ||||||||||||||
Net income attributable to Fossil Group, Inc. | 78,868 | 220,637 | 376,707 | 378,152 | 343,401 | ||||||||||||||
Earnings per share: | |||||||||||||||||||
Basic | 1.64 | 4.52 | 7.12 | 6.59 | 5.63 | ||||||||||||||
Diluted | 1.63 | 4.51 | 7.10 | 6.56 | 5.59 | ||||||||||||||
Weighted average common shares and common equivalent shares outstanding: | |||||||||||||||||||
Basic | 48,136 | 48,800 | 52,882 | 57,401 | 60,959 | ||||||||||||||
Diluted | 48,323 | 48,924 | 53,080 | 57,676 | 61,400 | ||||||||||||||
Working capital | $ | 932,705 | $ | 953,141 | $ | 1,008,264 | $ | 939,573 | $ | 702,776 | |||||||||
Total assets | 2,186,897 | 2,355,661 | 2,177,460 | 2,186,251 | 1,820,304 | ||||||||||||||
Total long-term liabilities | 756,874 | 933,589 | 747,351 | 618,978 | 173,062 | ||||||||||||||
Stockholders' equity attributable to Fossil Group, Inc. | 1,006,236 | 921,388 | 977,860 | 1,068,677 | 1,233,535 | ||||||||||||||
Return on average stockholders' equity attributable to Fossil Group, Inc.(1) | 8.2 | % | 24.7 | % | 37.5 | % | 33.1 | % | 29.9 | % | |||||||||
_______________________________________________
(1) | Calculated by dividing net income attributable to Fossil Group, Inc. by five quarter average stockholders' equity attributable to Fossil Group, Inc. |
36
Item 7. Management's Discussion and Analysis of Financial Condition and Results of Operations
Summary
We are a global design, marketing and distribution company that specializes in consumer fashion accessories. Our principal offerings include an extensive line of men's and women's fashion watches and jewelry, handbags, small leather goods, belts, and sunglasses. In the watch and jewelry product categories, we have a diverse portfolio of globally recognized owned and licensed brand names under which our products are marketed. Our products are distributed globally through various distribution channels including wholesale in countries where we have a physical presence, direct to the consumer through our retail stores and commercial websites and through third-party distributors in countries where we do not maintain a physical presence. Our products are offered at varying price points to meet the needs of our customers, whether they are value-conscious or luxury oriented. Based on our extensive range of accessory products, brands, distribution channels and price points, we are able to target style-conscious consumers across a wide age spectrum on a global basis.
Domestically, we sell our products through a diversified distribution network that includes department stores, specialty retail locations, specialty watch and jewelry stores, Company-owned retail and outlet stores, mass market stores and through our FOSSIL website. Our wholesale customer base includes, among others, Amazon, Best Buy, Dillard's, JCPenney, Kohl's, Macy's, Neiman Marcus, Nordstrom, Saks Fifth Avenue, Target and Wal-Mart. In the U.S., our network of Company-owned stores included 94 retail stores located in premier retail sites and 129 outlet stores located in major outlet malls as of December 31, 2016. In addition, we offer an extensive collection of our FOSSIL brand products on our website, www.fossil.com, as well as proprietary and licensed watch and jewelry brands through other managed and affiliated websites.
Internationally, our products are sold to department stores, specialty retail stores and specialty watch and jewelry stores in approximately 150 countries worldwide through 23 Company-owned foreign sales subsidiaries and through a network of approximately 80 independent distributors. Internationally, our network of Company-owned stores included 230 retail stores and 132 outlet stores as of December 31, 2016. Our products are also sold through licensed and franchised FOSSIL retail stores, retail concessions operated by us and kiosks in certain international markets. In addition, we offer an extensive collection of our FOSSIL brand products on our websites in certain countries.
Our consolidated gross profit margin is impacted by our diversified business model that includes but is not limited to: (i) a significant number of product categories we distribute, (ii) the multiple brands we offer within several product categories, (iii) the geographical presence of our businesses and (iv) the different distribution channels we sell to or through. The components of this diversified business model produce varying ranges of gross profit margin. Generally, on a historical basis, our fashion branded watch and jewelry offerings produce higher gross profit margins than our leather goods offerings. In addition, in most product categories that we offer, brands with higher retail price points generally produce higher gross profit margins compared to those of lower retail priced brands. Gross profit margins related to sales in our Europe and Asia businesses are historically higher than our Americas business primarily due to the following factors: (i) premiums charged in comparison to retail prices on products sold in the U.S.; (ii) the product sales mix in our international businesses, in comparison to our Americas business, is comprised more predominantly of watches and jewelry that generally produce higher gross profit margins than leather goods; and (iii) the watch sales mix in our Europe and Asia businesses, in comparison to our Americas business, are comprised more predominantly of higher priced licensed brands.
Our business is subject to the risks inherent in global sourcing supply. Certain key components in our products come from limited sources of supply, which exposes us to potential supply shortages that could disrupt the manufacture and sale of our products. Any interruption or delay in the supply of key components could significantly harm our ability to meet scheduled product deliveries to our customers and cause us to lose sales. Interruptions or delays in supply may be caused by a number of factors that are outside of our and our contractor manufacturers' control.
This discussion should be read in conjunction with our consolidated financial statements and the related notes included therewith.
37
Critical Accounting Policies and Estimates
The preparation of the consolidated financial statements in conformity with accounting principles generally accepted in the U.S. of America requires us to make estimates and assumptions that affect the reported amounts of assets and liabilities and the disclosure of contingent assets and liabilities at the date of the consolidated financial statements and the reported amounts of revenues and expenses during the reporting period. On an ongoing basis, we evaluate our estimates and judgments, including those related to product returns, bad debt, inventories, long-lived asset impairment, impairment of goodwill and trade names, income taxes, warranty costs, hedge accounting, litigation liabilities and stock-based compensation. We base our estimates and judgments on historical experience and on various other factors that we believe to be reasonable under the circumstances. Our estimates form the basis for making judgments about the carrying values of assets and liabilities that are not readily apparent from other sources. Actual results may differ from these estimates under different assumptions or conditions. We believe the following critical accounting policies require the most significant estimates and judgments.
Product Returns. We accept limited returns and may request that a customer return a product if we feel the customer has an excess of any style that we have identified as being a poor performer for that customer or geographic location. We monitor returns and maintain a provision for estimated returns based upon historical experience and any specific issues identified. While returns have historically been within our expectations and the provisions established, future return rates may differ from those experienced in the past. In the event that our products are performing poorly in the retail market and/or we experience product damages or defects at a rate significantly higher than our historical rate, the resulting returns could have an adverse impact on the operating results for the period or periods in which such returns occur. If our allowance for product returns were to change by 10%, the result would have been an approximate $2.6 million change to net income, net of taxes.
Inventories. Inventories are stated at the lower of market or average cost, including any applicable duty and freight charges. We account for estimated obsolescence or unmarketable inventory equal to the difference between the average cost of inventory and the estimated market value based upon assumptions about future demand, market conditions and available liquidation channels. If actual future demand or market conditions are less favorable than those projected by management, or if liquidation channels are not readily available, additional inventory valuation reductions may be required. We assess our off-price sales on an ongoing basis and update our estimates accordingly. Revenue from sales of our products that are subject to inventory consignment agreements is recognized when title and risk of loss transfers, delivery has occurred, the price to the buyer is determinable and collectability is reasonably assured.
Long-lived Asset Impairment. We test for asset impairment of property, plant and equipment and other long-lived assets whenever events or conditions indicate that the carrying value of an asset might not be recoverable based on expected undiscounted cash flows related to the asset. In evaluating long-lived assets for recoverability, we calculate fair value using our best estimate of future cash flows expected to result from the use of the asset and its eventual disposition. When undiscounted cash flows estimated to be generated through the operations of our Company-owned retail stores are less than the carrying value of the underlying assets, the assets are impaired. If it is determined that assets are impaired, an impairment loss is recognized for the amount the asset's book value exceeds its fair value. Should actual results or market conditions differ from those anticipated, additional losses may be recorded. We recorded impairment losses in selling, general, and administrative expenses of approximately $2.8 million, $7.7 million and $9.3 million in fiscal years 2016, 2015 and 2014, respectively. We recorded impairment losses in restructuring charges of approximately $13.5 million and $3.4 million in fiscal years 2016 and 2015. An increase of 100 basis points to the discount rate used in our impairment testing would not have resulted in additional impairment expense. A 10% decrease in future expected cash flows would have increased impairment expense by $0.2 million. We recorded non-impairment restructuring charges related to the write off of property, plant and equipment of approximately $1.5 million in fiscal year 2016.
Impairment of Goodwill and Trade Names. We evaluate goodwill for impairment annually as of the end of the fiscal year by comparing the fair value of the reporting unit to its recorded value. Additionally, if events or conditions were to indicate the carrying value of a reporting unit may not be recoverable, we would evaluate goodwill for impairment at that time. We have three reporting units for which we evaluate goodwill for impairment: Americas, Europe and Asia. The fair value of each reporting unit is estimated using market comparable information and discounted cash flows. If the estimated fair value of a reporting unit exceeds its carrying value, no impairment charge is recorded. As of December 31, 2016, the fair value of each of these reporting units exceeded their carrying value by over 25%.
We evaluate indefinite-lived trade names by comparing the fair value of the asset to its recorded value annually as of the end of the fiscal year and whenever events or conditions indicate that the carrying value of the trade name may not be recoverable. The fair value of the asset is estimated using discounted cash flow methodologies. The MICHELE trade name represented approximately 21% of our total trade name balances at the end of fiscal year 2016, 19% at the end of fiscal year 2015 and 22% at the end of fiscal year 2014. The SKAGEN trade name represented approximately 63% of our total trade name balance at the end of fiscal year 2016, 65% at the end of fiscal year 2015 and 77% at the end of fiscal year 2014. We performed
38
the required annual impairment test and recorded no impairment charges in fiscal year 2016 related to the SKAGEN or MICHELE trade names. In fiscal year 2015, $9.1 million in impairment charges were recorded related to the SKAGEN trade name, and no impairment charges were recorded related to the MICHELE trade name. No trade name impairment charges were recorded in fiscal year 2014. As of December 31, 2016, the fair value of the MICHELE trade name approximated its carrying value, and the fair value of the SKAGEN trade name exceeded its carrying value by approximately 5%.
We acquired the MISFIT trade name on December 22, 2015. The MISFIT trade name represented approximately 15% of our total trade name balance at the end of fiscal year 2016 and 17% at the end of fiscal year 2015. The MISFIT trade name is being amortized over its remaining useful life of 6 years. We monitor finite-lived trade names for events or conditions that indicate the carrying value of an asset might not be recoverable.
Due to the inherent uncertainties involved in making the estimates and assumptions used in the fair value analysis, actual results may differ, which could alter the fair value of the trade names and possibly cause impairment charges to occur in future periods.
Judgments and assumptions are inherent in our estimate of future cash flows used to determine the estimate of the reporting unit's fair value. The most significant assumptions associated with the fair value calculations include net sales growth rates and discount rates. If the actual future sales results do not meet the assumed growth rates, future impairments of goodwill and trade names may be incurred.
Income Taxes. We record valuation allowances against our deferred tax assets, when necessary, in accordance with ASC 740, Income Taxes ("ASC 740"). Realization of deferred tax assets is dependent on future taxable earnings and is therefore uncertain. At least quarterly, we assess the likelihood that our deferred tax asset balance will be recovered from future taxable income. To the extent we believe that recovery is not likely, we establish a valuation allowance against our deferred tax asset, increasing our income tax expense in the period such determination is made. In addition, we have not recorded U.S. income tax expense for foreign earnings that we have determined to be indefinitely reinvested outside the U.S.
Our continuing practice is to recognize interest and penalties related to income tax matters in income tax expense. We accrue an amount for our estimate of additional income tax liability which we believe we are more likely than not to incur as a result of the ultimate resolution of tax audits ("uncertain tax positions"). We review and update the estimates used in the accrual for uncertain tax positions as more definitive information becomes available from taxing authorities, upon completion of tax audits, upon expiration of statutes of limitation, or upon occurrence of other events. The results of operations and financial position for future periods could be impacted by changes in assumptions or resolutions of tax audits.
Warranty Costs. Our watch products are covered by limited warranties against defects in materials or workmanship. Historically, our FOSSIL and RELIC watch products sold in the U.S. have been covered for warranty periods of 11 years and 12 years, respectively, and our SKAGEN branded watches have been covered by a lifetime warranty. Beginning in 2017, these brands will be moving to a two year warranty. Generally, all other products sold in the U.S. and internationally are covered by a comparable one to two year warranty. We determine our warranty liability using historical warranty repair experience. As changes occur in sales volumes and warranty experience, the warranty accrual is adjusted as necessary. The year-end warranty liability for fiscal years 2016, 2015 and 2014 was $15.4 million, $13.7 million and $13.5 million, respectively.
Hedge Accounting. The Company is exposed to certain market risks relating to foreign exchange rates and interest rates. The Company actively monitors and attempts to manage these exposures using derivative instruments including foreign exchange forward contracts ("forward contracts") and interest rate swaps. The Company’s main objective is to hedge the variability in forecasted cash flows due to the foreign currency risks primarily associated with certain anticipated inventory purchases. Changes in the fair value of forward contracts designated as cash flow hedges are recorded in the cumulative translation adjustment component of accumulated other comprehensive income (loss) within stockholders' equity, and are recognized in other income (expense) - net in the period which the intercompany cash payment for inventory is made. Additionally, to the extent that any of these contracts are not considered to be perfectly effective in offsetting the change in the value of the cash flows being hedged, any changes in fair value relating to the ineffective portion of these contracts would be recognized in other income (expense) - net on the Company's consolidated statements of income and comprehensive income. Also, the Company has entered into interest rate swap agreements to effectively convert portions of its variable rate debt obligations to fixed rates. Changes in the fair value of the interest rate swaps are recorded as a component of accumulated other comprehensive income (loss) within stockholders' equity, and are recognized in interest expense in the period in which the payment is settled. To reduce exposure to changes in currency exchange rates adversely affecting the Company’s investment in foreign currency-denominated subsidiaries, the Company periodically enters into forward contracts designated as net investment hedges. Both realized and unrealized gains and losses from net investment hedges are recognized in the cumulative translation adjustment component of other comprehensive income (loss), and will be reclassified into earnings in the event the Company's underlying investments are liquidated or disposed. The Company does not hold or issue derivative financial
39
instruments for trading or speculative purposes. The Company has elected to apply the hedge accounting rules as required by ASC 815, Derivatives and Hedging, for these hedges.
Stock-Based Compensation. We utilize the Black-Scholes model to determine the fair value of stock options and stock appreciation rights on the date of grant. The model requires us to make assumptions concerning (i) the length of time employees will retain their vested stock options and stock appreciation rights before exercising them ("expected term"), (ii) the volatility of our common stock price over the expected term and (iii) the number of stock options and stock appreciation rights that will be forfeited. Changes in these assumptions can materially affect the estimate of fair value of stock-based compensation and, consequently, the related expense amounts recognized on our consolidated statements of income and comprehensive income. If the fair value of our stock-based compensation were to change by 10%, the result would have been a $2.3 million change to net income.
Results of Operations
Executive Summary
During fiscal year 2016, net sales decreased 6% (4% in constant currency) as compared to the prior fiscal year as we continued to face headwinds, particularly in the traditional watch market. During fiscal 2016, net sales in the Americas and Europe segments declined while Asia grew. However, sales trends improved sequentially during the year in all segments, mainly driven by the wearables category. Despite a challenging backdrop and persistent volatility for much of the retail industry, our team remained focused on our strategic priorities and advanced many of the initiatives that we believe will enable us to drive growth and improve our financial performance in the future. We were able to deliver constant currency growth in fiscal 2016 in our own brands, FOSSIL and SKAGEN, despite the challenging retail environment. Fiscal 2016 was a year that Fossil Group demonstrated its ability to move at a rapid pace to adjust to consumer demands. In one short year, we acquired Misfit, integrated their team into the organization and leveraged their technology platform across our portfolio of brands, launching over 100 SKUs of wearables in 8 brands, 40 countries and 20 different languages. Across display smart watches, hybrid smart watches and activity trackers, we were able to give the customer the new functionality in beautiful, stylish, and branded products and these products had a strong positive impact on our business.
During fiscal year 2016, FOSSIL branded products were flat (increased 2% in constant currency), including modest growth in watches offset by sales declines in all other product categories. In addition, our SKAGEN branded products increased 8% (9% in constant currency), representing growth across all three major product categories and driven by watches. Our FOSSIL and SKAGEN watch performance was favorably impacted by wearables, including the expansion of Fossil Q product and the launch of Skagen Connected styles. We remain committed to further growing these brands and believe such growth is a key component to our long-term goal of creating a healthy balance between owned and licensed brands. Developing and growing brands today means doing so in a digital-age across e-commerce platforms, mobile platforms and social media channels. Having invested in our omni-channel capabilities over the last several years, launching new branded websites and improving the customer experience on our e-commerce platforms, these investments are supporting our growth initiatives. FOSSIL and SKAGEN are succeeding by offering compelling products with unique functionality supported by clearly communicated brand stories that we can bring to the customer, wherever they choose to shop.
The following table presents as reported and constant currency net sales percentage change information by brand for the fiscal year 2016 as compared to the fiscal year 2015:
Growth Percentage | ||||||
Brand | As Reported | Constant Currency | ||||
FOSSIL | 0.1 | % | 1.5 | % | ||
SKAGEN | 8.0 | 8.8 | ||||
40
Our multi-brand global watch portfolio decreased 6% (4% in constant currency) during fiscal year 2016. We experienced strong sales growth in TORY BURCH and KATE SPADE NEW YORK watches, which was offset by sales declines in most other licensed brands in our multi-brand watch portfolio. The wholesale channel continues to be challenging, particularly in the traditional watch market, although we are always in the pursuit of ways to grow our core business. Today, we believe that trend is technology and having added a technology platform to our competitive strengths, we believe we are in a position to continue to attract the best brands to our portfolio as well as grow our existing brands beyond their current levels. During fiscal year 2016, the watch portfolio benefited from the launch of MICHAEL KORS ACCESS, a new line of wearables which was supported by a strong marketing campaign from the brand. Although MICHAEL KORS watches declined for fiscal year 2016, we experienced marked improvement with the launch of their smart watches in the third quarter of fiscal year 2016. Considering both our positive FOSSIL and MICHAEL KORS connected sales results and the improved sell through rates for these brands, we believe evidence supports our theory that technology can be the catalyst to drive growth in the watch category.
During fiscal 2016, global comparable store sales declined 5% year-over-year. Positive comparable store sales results in Asia were offset by a modest decline in the Americas while Europe was flat.
During fiscal year 2016, we began working on a new multi-year restructuring plan, focused on our growth opportunities, including connected accessories, and improving overall profitability. While it is early in the process, we envision a comprehensive plan that will evolve our model and the way we work, the way we develop product and the way we bring our products to market. We expect the program will touch all aspects of our business as we enhance our operational capabilities, gain greater efficiencies and take optimal advantage of our considerable scale. Our scale should enable us to improve our product costs in wearables and fine tune our price points to be ultra-competitive in the category. We will review and adjust our overall structure with the goal of streamlining the way we work to respond to the changing needs and demands of our customers. We believe the new operating structure will create opportunities to leverage as we drive growth. In fiscal year 2016, we started examining and adjusting our store fleet to reflect the evolving shopping habits of today’s consumer and will continue to do so. Our goal is to, over time, improve our financial performance and build an improved operating platform that is nimble and responsive and will be in a position to drive long term shareholder value.
During fiscal year 2016, gross profit decreased as compared to fiscal year 2015 primarily resulting from decreased sales and a lower gross margin rate driven by increased promotional activity in the outlet channel, an increased mix of lower margin product and an increased mix of off-price sales. Additionally, the gross margin rate included an unfavorable currency impact of approximately 70 basis points. Partially offsetting these margin headwinds were our margin improvement initiatives.
Our operating margin contracted during fiscal year 2016, primarily due to lower sales and gross margin rate. During fiscal year 2016, operating expenses decreased due to lower store and core infrastructure costs and the favorable impact of changes in foreign currency, partially offset by an increase in expenses associated with wearables infrastructure and the Misfit acquisition. During fiscal year 2016, our financial performance, including the unfavorable impacts of currencies, resulted in earnings of $1.63 per diluted share.
Constant Currency Financial Information
As a multinational enterprise, we are exposed to changes in foreign currency exchange rates. The translation of the operations of our foreign-based entities from their local currencies into U.S. dollars is sensitive to changes in foreign currency exchange rates and can have a significant impact on our reported financial results. In general, our overall financial results are affected positively by a weaker U.S. dollar and are affected negatively by a stronger U.S. dollar as compared to the foreign currencies in which we conduct our business.
As a result, in addition to presenting financial measures in accordance with accounting principles generally accepted in the United States of America (“GAAP”), our discussion contains references to constant currency financial information, which is a non-GAAP financial measure. To calculate net sales on a constant currency basis, net sales for the current year for entities reporting in currencies other than the U.S. dollar are translated into U.S. dollars at the average rates during the comparable period of the prior fiscal year. We present constant currency information to provide investors with a basis to evaluate how our underlying business performed excluding the effects of foreign currency exchange rate fluctuations. The constant currency financial information presented herein should not be considered a substitute for, or superior to, the measures of financial performance prepared in accordance with GAAP. Reconciliations between constant currency financial information and the most directly comparable GAAP measure are included where applicable.
41
Fiscal Year 2016 Compared to Fiscal Year 2015
Consolidated Net Sales. Net sales decreased $186.4 million or 5.8%, (4.4% in constant currency ) for fiscal year 2016 as compared to fiscal year 2015. Global watch sales decreased $145.5 million or 5.9% (4.5% in constant currency) as a result of increases in our owned brands FOSSIL and SKAGEN and licensed brands KATE SPADE NEW YORK and TORY BURCH, being more than offset by declines in most other brands in our portfolio. Our leathers business decreased $15.6 million or 3.8% (2.5% in constant currency). Our jewelry category decreased $20.7 million or 7.6% (5.9% in constant currency), mostly as a result of a decrease in sales of MICHAEL KORS and FOSSIL branded products during fiscal year 2016 as compared to fiscal year 2015.
Net sales information by product category is summarized on a reported and constant currency basis as follows (dollars in millions):
Fiscal Year | |||||||||||||||||||||||
2016 | 2015 | Growth (Decline) | |||||||||||||||||||||
Percentage of Total | Percentage of Total | Percentage as Reported | Percentage Constant Currency | ||||||||||||||||||||
Amounts | Amounts | Dollars | |||||||||||||||||||||
Watches | $ | 2,330.3 | 76.6 | % | $ | 2,475.8 | 76.7 | % | $ | (145.5 | ) | (5.9 | )% | (4.5 | )% | ||||||||
Leathers | 393.8 | 12.9 | 409.4 | 12.7 | (15.6 | ) | (3.8 | ) | (2.5 | ) | |||||||||||||
Jewelry | 251.4 | 8.3 | 272.1 | 8.4 | (20.7 | ) | (7.6 | ) | (5.9 | ) | |||||||||||||
Other | 66.9 | 2.2 | 71.5 | 2.2 | (4.6 | ) | (6.4 | ) | (5.6 | ) | |||||||||||||
Total net sales | $ | 3,042.4 | 100.0 | % | $ | 3,228.8 | 100.0 | % | $ | (186.4 | ) | (5.8 | )% | (4.4 | )% | ||||||||
The following table sets forth consolidated net sales by segment on a reported and constant currency basis (dollars in millions):
Fiscal Year | |||||||||||||||||||||||
2016 | 2015 | Growth (Decline) | |||||||||||||||||||||
Percentage of Total | Percentage of Total | Percentage as Reported | Percentage Constant Currency | ||||||||||||||||||||
Amounts | Amounts | Dollars | |||||||||||||||||||||
Americas | $ | 1,524.9 | 50.1 | % | $ | 1,661.9 | 51.5 | % | $ | (137.0 | ) | (8.2 | )% | (7.5 | )% | ||||||||
Europe | 1,002.1 | 32.9 | 1,069.8 | 33.1 | (67.7 | ) | (6.3 | ) | (3.5 | ) | |||||||||||||
Asia | 515.4 | 17.0 | 497.1 | 15.4 | 18.3 | 3.7 | 4.0 | ||||||||||||||||
Total net sales | $ | 3,042.4 | 100.0 | % | $ | 3,228.8 | 100.0 | % | $ | (186.4 | ) | (5.8 | )% | (4.4 | )% | ||||||||
Americas Net Sales. During fiscal year 2016, we experienced the most significant retail headwinds in the Americas segment. Americas net sales decreased $137.0 million or 8.2% (7.5% in constant currency), driven by watches but with jewelry and leathers contributing to the declines as well. During fiscal year 2016, our multi-brand watch portfolio decreased $100.6 million or 8.0% (7.1% in constant currency) and our leathers category decreased $21.9 million or 8.1% (7.7% in constant currency). Our Americas watch sales decline during fiscal year 2016 was primarily driven by MICHAEL KORS and partially offset by increases in KATE SPADE NEW YORK and TORY BURCH. Our jewelry business decreased $8.1 million or 8.1% (7.7% in constant currency) in fiscal year 2016 as compared to the prior fiscal year primarily driven by declines in MICHAEL KORS jewelry partially offset by increases from the MISFIT brand. Within the region, sales declined in the U.S. and were slightly offset by growth in Mexico and Canada on a constant currency basis. Comparable retail store sales decreased modestly in our owned retail stores, most notably in our outlets.
42
The following table sets forth product net sales for the Americas segment on a reported and constant currency basis by fiscal year (dollars in millions):
Net Sales | |||||||||||||||||
Fiscal Year | Growth (Decline) | ||||||||||||||||
Percentage as Reported | Percentage Constant Currency | ||||||||||||||||
2016 | 2015 | Dollars | |||||||||||||||
Watches | $ | 1,162.3 | $ | 1,262.9 | $ | (100.6 | ) | (8.0 | )% | (7.1 | )% | ||||||
Leathers | 247.7 | 269.6 | (21.9 | ) | (8.1 | ) | (7.7 | ) | |||||||||
Jewelry | 91.7 | 99.8 | (8.1 | ) | (8.1 | ) | (7.7 | ) | |||||||||
Other | 23.2 | 29.6 | (6.4 | ) | (21.6 | ) | (20.9 | ) | |||||||||
Total | $ | 1,524.9 | $ | 1,661.9 | $ | (137.0 | ) | (8.2 | )% | (7.5 | )% | ||||||
Europe Net Sales. During fiscal year 2016, Europe net sales decreased $67.7 million or 6.3% (3.5% in constant currency). We experienced declines in most countries, with the most significant sales declines in the United Kingdom and our distributor markets. Our multi-brand watch portfolio decreased $49.8 million or 6.3% (3.4% in constant currency) while our jewelry category decreased $18.0 million or 10.9% (8.5% in constant currency) and our leathers business remained flat (increased 3.7% in constant currency) in fiscal year 2016 as compared to the prior fiscal year. Comparable retail store sales in our owned retail stores in the European region remained flat, with increases in our outlets and watch categories offset by decreases in our full-priced stores and other product categories.
The following table sets forth product net sales for the Europe segment on a reported and constant currency basis by fiscal year (dollars in millions):
Net Sales | |||||||||||||||||
Fiscal Year | Growth (Decline) | ||||||||||||||||
Percentage as Reported | Percentage Constant Currency | ||||||||||||||||
2016 | 2015 | Dollars | |||||||||||||||
Watches | $ | 739.9 | $ | 789.7 | $ | (49.8 | ) | (6.3 | )% | (3.4 | )% | ||||||
Leathers | 84.4 | 84.4 | — | — | 3.7 | ||||||||||||
Jewelry | 147.1 | 165.1 | (18.0 | ) | (10.9 | ) | (8.5 | ) | |||||||||
Other | 30.7 | 30.6 | 0.1 | 0.3 | 2.9 | ||||||||||||
Total | $ | 1,002.1 | $ | 1,069.8 | $ | (67.7 | ) | (6.3 | )% | (3.5 | )% | ||||||
Asia Net Sales. In fiscal year 2016, Asia net sales increased $18.3 million or 3.7% (4.0% in constant currency). Sales growth was led by India, our distributor markets, Korea, Australia and China and was partially offset by decreases in Hong Kong, Taiwan and Macau on a constant currency basis. Our watch category increased $4.9 million or 1.2% (1.4% in constant currency), while our leathers products increased $6.4 million or 11.6% (13.2% in constant currency). Our jewelry business increased $5.4 million or 75.0% (76.4% in constant currency). Comparable retail store sales in our owned retail stores in the Asia region increased slightly with modest comparable store sale increases in our full-priced and outlet FOSSIL branded stores partially offset by declines in our other store concepts.
The following table sets forth product net sales for the Asia segment on a reported and constant currency basis by fiscal year (dollars in millions):
Net Sales | |||||||||||||||||
Fiscal Year | Growth (Decline) | ||||||||||||||||
Percentage as Reported | Percentage Constant Currency | ||||||||||||||||
2016 | 2015 | Dollars | |||||||||||||||
Watches | $ | 428.1 | $ | 423.2 | $ | 4.9 | 1.2 | % | 1.4 | % | |||||||
Leathers | 61.7 | 55.3 | 6.4 | 11.6 | 13.2 | ||||||||||||
Jewelry | 12.6 | 7.2 | 5.4 | 75.0 | 76.4 | ||||||||||||
Other | 13.0 | 11.4 | 1.6 | 14.0 | 10.5 | ||||||||||||
Total | $ | 515.4 | $ | 497.1 | $ | 18.3 | 3.7 | % | 4.0 | % | |||||||
43
Stores. The following table sets forth the number of stores by concept for the fiscal years ended below:
December 31, 2016 | January 2, 2016 | ||||||||||||||||||||||
Americas | Europe | Asia | Total | Americas | Europe | Asia | Total | ||||||||||||||||
Full price | 122 | 119 | 63 | 304 | 128 | 126 | 68 | 322 | |||||||||||||||
Outlets | 143 | 73 | 45 | 261 | 153 | 71 | 46 | 270 | |||||||||||||||
Full priced multi-brand | — | 8 | 12 | 20 | — | 7 | 20 | 27 | |||||||||||||||
Total stores | 265 | 200 | 120 | 585 | 281 | 204 | 134 | 619 | |||||||||||||||
During fiscal year 2016, we opened 18 new stores and closed 52 stores. During fiscal year 2017, we anticipate opening approximately 15 additional retail stores and closing approximately 40 stores globally.
A store is included in comparable store sales in the thirteenth month of operation. Stores that experience a gross square footage increase of 10% or more due to an expansion and/or relocation are removed from the comparable store sales base, but are included in total sales. These stores are returned to the comparable store sales base in the thirteenth month following the expansion and/or relocation. Comparable store sales also exclude the effects of foreign currency fluctuations.
Gross Profit. Gross profit of $1.6 billion in fiscal year 2016 decreased 10.0% in comparison to $1.8 billion in fiscal year 2015 mainly as a result of decreased sales. Gross profit margin decreased 240 basis points to 51.9% in fiscal year 2016 compared to 54.3% in the prior fiscal year. The gross margin rate decreased as compared to fiscal year 2015 primarily due to increased promotional activity in our outlet stores and an increased mix of connected product sales. Additionally, our wholesale channel was burdened by an increased mix of off-price sales at lower margin rates and the impacts of currency decreased our gross profit margin rate by 70 basis points. Partially offsetting these headwinds were the favorable impacts of our margin improvement initiatives.
Operating Expenses. For fiscal year 2016, total operating expenses decreased by $11.2 million and as a percentage of net sales, increased to 47.7% compared to 45.3% in fiscal year 2015. Operating expenses decreased due to lower store and core infrastructure costs, a $14.9 million favorable impact from changes in foreign currency, the non-recurrence of both the SKAGEN trade name impairment and Misfit acquisition-related professional services recorded in fiscal year 2015, partially offset by an increase in expenses associated with wearables infrastructure and Misfit intangible amortization.
Consolidated Operating Income. Operating income decreased by $164.1 million, or 56.4%, in fiscal year 2016 as compared to the prior fiscal year mainly driven by decreased sales and gross margin rate and included a $31.7 million unfavorable impact from changes in foreign currencies. As a percentage of net sales, operating income decreased to 4.2% in fiscal year 2016 as compared to 9.0% in fiscal year 2015 and was negatively impacted by approximately 90 basis points due to changes in foreign currencies.
Sales and gross profit margins were negatively impacted by currencies in all regional segments in fiscal year 2016 as compared to the prior fiscal year, although not as extensively as in fiscal year 2015 compared to fiscal year 2014. On a constant currency basis, sales and gross profit margins decreased in the Americas and Europe and increased in Asia while the gross profit margin rate decreased across all segments. The gross margin rate declined primarily as a result of promotional activity in our outlet stores and an increased mix of connected product sales in all geographies. Additionally, the Americas gross profit margin rate was unfavorably impacted by an increased mix of sales in the wholesale off-price channel to manage inventory levels. These unfavorable impacts to the gross profit margin rate were partially offset by a favorable impact from our margin improvement initiatives in all segments. In fiscal year 2016, total operating expenses decreased compared to fiscal year 2015 as reduced store expenses and lower core infrastructure costs were partially offset by corporate cost increases in wearables infrastructure and Misfit purchase accounting related costs. Our operating expenses in fiscal year 2016 also benefited from real estate sales in the Americas and Europe. During fiscal year 2016 as compared to fiscal 2015, operating expense leverage was relatively flat in Europe and improved in Asia while weakening in the Americas largely due to fixed expenses on lower sales and increased restructuring costs related to store closures.
44
Operating income by operating segment is summarized as follows (dollars in millions):
Fiscal Year | Growth (Decline) | Operating Margin % | ||||||||||||||||||
2016 | 2015 | Dollars | Percentage | 2016 | 2015 | |||||||||||||||
Americas | $ | 241.1 | $ | 354.3 | $ | (113.2 | ) | (32.0 | )% | 15.8 | % | 21.3 | % | |||||||
Europe | 174.2 | 210.5 | (36.3 | ) | (17.2 | ) | 17.4 | 19.7 | ||||||||||||
Asia | 77.6 | 71.7 | 5.9 | 8.2 | 15.1 | 14.4 | ||||||||||||||
Corporate | (365.8 | ) | (345.3 | ) | (20.5 | ) | 5.9 | |||||||||||||
Total operating income | $ | 127.1 | $ | 291.2 | $ | (164.1 | ) | (56.4 | )% | 4.2 | % | 9.0 | % | |||||||
Interest Expense. Interest expense increased by $6.9 million in fiscal year 2016 as a result of increased interest rates in comparison to the prior fiscal year.
Other Income (Expense)—Net. During fiscal year 2016, other income (expense) - net decreased by approximately $26.4 million, largely driven by decreased net foreign currency gains resulting from cash flow hedging and other transactional activities as compared to fiscal year 2015. Additionally, the fiscal year 2015 other income (expense) - net amount included a $5.2 million gain related to an interest rate hedge settlement related to a potential debt issuance which did not occur. Fiscal year 2016 includes a gain of $3.5 million for the liquidation of some non-operating Misfit assets, which partially offset our unfavorable other income (expense) - net change.
Provision for Income Taxes. Income tax expense for fiscal year 2016 was $28.7 million, resulting in an effective tax rate of 25.1%, compared to 26.2% in fiscal year 2015. The lower effective tax rate for fiscal year 2016 as compared to fiscal year 2015 was mostly attributable to lower U.S. taxable income taxed at higher effective tax rates.
Net Income Attributable to Fossil Group, Inc. Fiscal year 2016 net income attributable to Fossil Group, Inc. was $1.63 per diluted share in comparison to $4.51 per diluted share in the prior fiscal year, mainly driven by the sales decline and reduced margin rate. Diluted earnings per share decreased $0.87 due to the translation impact of a stronger U.S. dollar and less net foreign currency gains resulting from cash flow hedging and other transactional activities. Diluted earnings per share was also unfavorably impacted by a $0.37 per diluted share decrease due to the amortization of acquired Misfit intangible assets and of related contingent equity grants. An increase in interest expense negatively impacted our diluted earnings per share by $0.11 due to increased interest rates. Partially offsetting these decreases were a $0.16 favorable impact to diluted earnings per share due to the sale of real estate.
Fiscal Year 2015 Compared to Fiscal Year 2014
The Company's fiscal year periodically results in a 53-week year instead of a normal 52-week year. Fiscal year 2014 was a 53-week year, with the additional week included in the first quarter of the fiscal year. Accordingly, the information presented herein includes 53 weeks of operations for fiscal year 2014 as compared to 52 weeks in fiscal year 2015. In the following discussion, certain amounts are presented on a comparable calendar basis by removing an estimated week of activity from fiscal year 2014.
Consolidated Net Sales. Net sales decreased $280.9 million or 8.0% (0.8% in constant currency and comparable calendar) for fiscal year 2015 as compared to fiscal year 2014. Global watch sales decreased $260.7 million or 9.5% (2.7% in constant currency and comparable calendar) while our leathers business decreased $10.0 million or 2.4% (increased 4.8% in constant currency and comparable calendar). Our jewelry category decreased $4.4 million or 1.6% (increased 8.9% in constant currency and comparable calendar), as a result of a decrease in sales of FOSSIL branded products, partially offset by a modest increase in sales of licensed jewelry during fiscal year 2015 as compared to fiscal year 2014.
45
Net sales information by product category is summarized as follows (dollars in millions):
Fiscal Year | |||||||||||||||||||||||
2015 | 2014 | Growth (Decline) | |||||||||||||||||||||
Percentage of Total | Percentage of Total | Percentage as Reported | Percentage Constant Currency and Comparable Calendar | ||||||||||||||||||||
Amounts | Amounts | Dollars | |||||||||||||||||||||
Watches | $ | 2,475.8 | 76.7 | % | $ | 2,736.5 | 78.0 | % | $ | (260.7 | ) | (9.5 | )% | (2.7 | )% | ||||||||
Leathers | 409.4 | 12.7 | 419.4 | 11.9 | (10.0 | ) | (2.4 | ) | 4.8 | ||||||||||||||
Jewelry | 272.1 | 8.4 | 276.5 | 7.9 | (4.4 | ) | (1.6 | ) | 8.9 | ||||||||||||||
Other | 71.5 | 2.2 | 77.3 | 2.2 | (5.8 | ) | (7.5 | ) | 0.4 | ||||||||||||||
Total net sales | $ | 3,228.8 | 100.0 | % | $ | 3,509.7 | 100.0 | % | $ | (280.9 | ) | (8.0 | )% | (0.8 | )% | ||||||||
In fiscal year 2015, the translation of foreign-based net sales into U.S. dollars reduced reported net sales, compared to fiscal year 2014, by approximately $207.5 million, including unfavorable impacts of $137.5 million, $40.8 million and $29.2 million in our Europe, Asia and Americas segments, respectively.
The following table sets forth consolidated net sales by segment on a reported and constant currency and comparable calendar basis (dollars in millions):
Fiscal Year | |||||||||||||||||||||||
2015 | 2014 | Growth (Decline) | |||||||||||||||||||||
Percentage as Reported | Percentage Constant Currency and Comparable Calendar | ||||||||||||||||||||||
Percentage of Total | Percentage of Total | ||||||||||||||||||||||
Amounts | Amounts | Dollars | |||||||||||||||||||||
Americas | $ | 1,661.9 | 51.5 | % | $ | 1,747.5 | 49.8 | % | $ | (85.6 | ) | (4.9 | )% | (2.0 | )% | ||||||||
Europe | 1,069.8 | 33.1 | 1,195.9 | 34.1 | (126.1 | ) | (10.5 | ) | 2.2 | ||||||||||||||
Asia | 497.1 | 15.4 | 566.3 | 16.1 | (69.2 | ) | (12.2 | ) | (3.7 | ) | |||||||||||||
Total net sales | $ | 3,228.8 | 100.0 | % | $ | 3,509.7 | 100.0 | % | $ | (280.9 | ) | (8.0 | ) | (0.8 | )% | ||||||||
Americas Net Sales. Americas net sales decreased $85.6 million or 4.9% (2.0% in constant currency and comparable calendar), during fiscal year 2015, driven by watches partially offset by increases in jewelry and leathers on a constant currency and comparable calendar basis. During fiscal year 2015 our multi-brand watch portfolio decreased $89.3 million or 6.6% (3.8% in constant currency and comparable calendar) and our leathers category decreased $0.4 million or 0.1% (increased 3.0% in constant currency and comparable calendar). Excluding MICHAEL KORS, our Americas watch sales increased during fiscal year 2015 primarily due to the benefit from the addition of KATE SPADE NEW YORK to our licensed brands in the first half of fiscal year 2015. Our jewelry business increased $8.3 million or 9.1% (12.4% in constant currency and comparable calendar) in fiscal year 2015 as compared to the prior fiscal year driven by increased licensed jewelry sales. Within the region, growth in Canada across the retail and wholesale channels and in our Mexico wholesale business was more than offset by declines in both the wholesale and retail channels in the U.S. Our U.S. wholesale business declined largely driven by a weaker performance in U.S. department stores where traffic continues to be a challenge and softer trends in the business persist. Comparable retail store sales increased slightly in our owned retail stores (normalized for the 53-week calendar) as improved conversion rates offset a decline in traffic.
46
The following table sets forth product net sales for the Americas segment on a reported and constant currency and comparable calendar basis by fiscal year (dollars in millions):
Net Sales | |||||||||||||||||
Fiscal Year | Growth (Decline) | ||||||||||||||||
Percentage as Reported | Percentage Constant Currency and Comparable Calendar | ||||||||||||||||
2015 | 2014 | Dollars | |||||||||||||||
Watches | $ | 1,262.9 | $ | 1,352.2 | $ | (89.3 | ) | (6.6 | )% | (3.8 | )% | ||||||
Leathers | 269.6 | 270.0 | (0.4 | ) | (0.1 | ) | 3.0 | ||||||||||
Jewelry | 99.8 | 91.5 | 8.3 | 9.1 | 12.4 | ||||||||||||
Other | 29.6 | 33.8 | (4.2 | ) | (12.4 | ) | (10.4 | ) | |||||||||
Total | $ | 1,661.9 | $ | 1,747.5 | $ | (85.6 | ) | (4.9 | )% | (2.0 | )% | ||||||
Europe Net Sales. During fiscal year 2015, Europe net sales decreased $126.1 million or 10.5% (increased 2.2% in constant currency and comparable calendar). On a constant currency and comparable calendar basis, France and Italy delivered the strongest performances offset by declines in the United Kingdom, distributor and Germany markets. Our multi-brand watch portfolio decreased $104.3 million or 11.7% (increased 0.6% in constant currency and comparable calendar) while our jewelry category decreased $11.8 million or 6.7% (increased 7.6% in constant currency and comparable calendar). Our leathers business decreased $8.7 million or 9.3% (increased 5.9% in constant currency and comparable calendar) in fiscal year 2015 as compared to the prior fiscal year. Comparable retail store sales in our owned retail stores in the European region increased modestly (normalized for the 53-week calendar) as our marketing investments gained traction. Our e-commerce business also contributed favorably to fiscal year 2015 with double-digit growth on a constant dollar and comparable calendar basis.
The following table sets forth product net sales for the Europe segment on a reported and constant currency and comparable calendar basis by fiscal year (dollars in millions):
Net Sales | |||||||||||||||||
Fiscal Year | Growth (Decline) | ||||||||||||||||
Percentage as Reported | Percentage Constant Currency and Comparable Calendar | ||||||||||||||||
2015 | 2014 | Dollars | |||||||||||||||
Watches | $ | 789.7 | $ | 894.0 | $ | (104.3 | ) | (11.7 | )% | 0.6 | % | ||||||
Leathers | 84.4 | 93.1 | (8.7 | ) | (9.3 | ) | 5.9 | ||||||||||
Jewelry | 165.1 | 176.9 | (11.8 | ) | (6.7 | ) | 7.6 | ||||||||||
Other | 30.6 | 31.9 | (1.3 | ) | (4.1 | ) | 8.5 | ||||||||||
Total | $ | 1,069.8 | $ | 1,195.9 | $ | (126.1 | ) | (10.5 | )% | 2.2 | % | ||||||
Asia Net Sales. In fiscal year 2015, Asia net sales decreased $69.2 million or 12.2% (3.7% in constant currency and comparable calendar). Sales growth in India, Australia and Japan was offset by decreases in most other markets including South Korea, Hong Kong and China where general economic sluggishness and macro uncertainty has continued to impact our business although we saw some improvement in the South Korea performance during the last quarter of fiscal year 2015. Our watch category decreased $67.1 million or 13.7% (5.8% in constant currency and comparable calendar), while our leathers products decreased $1.0 million or 1.7% (increased 11.5% in constant currency and comparable calendar). Our jewelry business decreased $0.9 million or 11.1% (0.8% in constant currency and comparable calendar). Comparable retail store sales in our owned retail stores in the Asia region decreased modestly (normalized for the 53-week calendar) while total retail channel sales increased on a constant currency and comparable calendar basis as a result of new doors.
The following table sets forth product net sales for the Asia segment on a reported and constant currency and comparable calendar basis by fiscal year (dollars in millions):
47
Net Sales | |||||||||||||||||
Fiscal Year | Growth (Decline) | ||||||||||||||||
Percentage as Reported | Percentage Constant Currency and Comparable Calendar | ||||||||||||||||
2015 | 2014 | Dollars | |||||||||||||||
Watches | $ | 423.2 | $ | 490.3 | $ | (67.1 | ) | (13.7 | )% | (5.8 | )% | ||||||
Leathers | 55.3 | 56.3 | (1.0 | ) | (1.7 | ) | 11.5 | ||||||||||
Jewelry | 7.2 | 8.1 | (0.9 | ) | (11.1 | ) | (0.8 | ) | |||||||||
Other | 11.4 | 11.6 | (0.2 | ) | (1.7 | ) | 10.1 | ||||||||||
Total | $ | 497.1 | $ | 566.3 | $ | (69.2 | ) | (12.2 | )% | (3.7 | )% | ||||||
Constant Currency and Comparable Calendar Financial Information. The following table presents our business segment and product net sales on a constant currency and comparable calendar basis. To calculate net sales on a constant currency basis, net sales for fiscal year 2015 for entities reporting in currencies other than the U.S. dollar are translated into U.S. dollars at the average rates during fiscal year 2014. To calculate net sales on a comparable calendar basis, we have estimated the impact on net sales of the extra week in fiscal year 2014. Our presentations of net sales on a constant currency and comparable calendar basis are non-GAAP financial measures. We present net sales on a constant currency and comparable calendar basis because we believe that such information is useful to certain investors as a measure of our results of operations year-over-year without the effects of foreign currency fluctuations and the extra week in fiscal year 2014.
Net Sales | Net Sales | ||||||||||||||||||||||
Fiscal Year 2015 | Fiscal Year 2014 | ||||||||||||||||||||||
As Reported | Impact of Foreign Currency Exchange Rates | Constant Currency | As Reported | Estimated Impact of Extra Week | Estimated Comparable Calendar | ||||||||||||||||||
(in millions) | |||||||||||||||||||||||
Watches | $ | 2,475.8 | $ | (153.0 | ) | $ | 2,628.8 | $ | 2,736.5 | $ | 34.5 | $ | 2,702.0 | ||||||||||
Leathers | 409.4 | (23.9 | ) | 433.3 | 419.4 | 5.8 | 413.6 | ||||||||||||||||
Jewelry | 272.1 | (25.6 | ) | 297.7 | 276.5 | 3.2 | 273.3 | ||||||||||||||||
Other | 71.5 | (5.0 | ) | 76.5 | 77.3 | 1.1 | 76.2 | ||||||||||||||||
Total net sales | $ | 3,228.8 | $ | (207.5 | ) | $ | 3,436.3 | $ | 3,509.7 | $ | 44.6 | $ | 3,465.1 | ||||||||||
Net Sales | Net Sales | ||||||||||||||||||||||
Fiscal Year 2015 | Fiscal Year 2014 | ||||||||||||||||||||||
As Reported | Impact of Foreign Currency Exchange Rates | Constant Currency | As Reported | Estimated Impact of Extra Week | Estimated Comparable Calendar | ||||||||||||||||||
(in millions) | |||||||||||||||||||||||
Americas | $ | 1,661.9 | $ | (29.2 | ) | $ | 1,691.1 | $ | 1,747.5 | $ | 21.8 | $ | 1,725.7 | ||||||||||
Europe | 1,069.8 | (137.5 | ) | 1,207.3 | 1,195.9 | 15.1 | 1,180.8 | ||||||||||||||||
Asia | 497.1 | (40.8 | ) | 537.9 | 566.3 | 7.7 | 558.6 | ||||||||||||||||
Total net sales | $ | 3,228.8 | $ | (207.5 | ) | $ | 3,436.3 | $ | 3,509.7 | $ | 44.6 | $ | 3,465.1 | ||||||||||
Stores. The following table sets forth the number of stores by concept for the fiscal years ended below:
January 2, 2016 | January 3, 2015 | ||||||||||||||||||||||
Americas | Europe | Asia | Total | Americas | Europe | Asia | Total | ||||||||||||||||
Full price | 128 | 126 | 68 | 322 | 147 | 113 | 59 | 319 | |||||||||||||||
Outlets | 153 | 71 | 46 | 270 | 143 | 58 | 42 | 243 | |||||||||||||||
Full priced multi-brand | — | 7 | 20 | 27 | 6 | 3 | 22 | 31 | |||||||||||||||
Total stores | 281 | 204 | 134 | 619 | 296 | 174 | 123 | 593 | |||||||||||||||
48
Gross Profit. Gross profit of $1.8 billion in fiscal year 2015 decreased 12.4% in comparison to $2.0 billion in fiscal year 2014 as a result of decreased sales and changes in foreign currencies. Gross profit margin decreased 270 basis points to 54.3% in fiscal year 2015 compared to 57.0% in the prior fiscal year. The gross margin rate decreased as compared to fiscal year 2014 primarily driven by changes in foreign currencies, which unfavorably impacted gross profit margin by approximately 290 basis points. Excluding the impacts of currency, the gross margin rate expanded mainly due to the favorable impacts of our pricing initiatives, lower product costs and our regional distribution mix given the growth in international markets which more than offset the impact of higher markdowns, increased effectiveness of promotional activity in our retail channel, primarily in our outlet stores and clearance activities including increased levels of off-price sales.
Operating Expenses. For fiscal year 2015, operating expenses as a percentage of net sales increased to 45.3% in fiscal year 2015 compared to 40.9% in fiscal year 2014 and included a $96.0 million favorable impact from the translation of foreign-based expenses into U.S. dollars. On a constant currency basis, operating expenses for fiscal year 2015 increased by $123.6 million primarily as a result of our increased marketing and strategic investments, increased store expenses, restructuring charges and increased incentive compensation, partially offset by the additional week of operations included in the prior year. Additionally fiscal year 2015 included a $9.1 million non-cash impairment charge to write down the carrying value of our SKAGEN trade name, largely driven by changes in foreign currency exchange rates and fewer planned store openings as compared to original valuation assumptions, and $8.4 million in costs related to the Misfit acquisition.
Consolidated Operating Income. Operating income decreased by $275.3 million, or 48.6%, in fiscal year 2015 as compared to the prior fiscal year and included a $115.8 million unfavorable impact from changes in foreign currencies. As a percentage of net sales, operating income decreased to 9.0% in fiscal year 2015 as compared to 16.1% in fiscal year 2014 and was negatively impacted by approximately 280 basis points due to changes in foreign currencies, as well as continued investments in our strategic initiatives to drive future growth. During fiscal year 2015, sales and gross profit margins were negatively impacted by currencies in all regional segments as compared to the prior fiscal year. On a constant currency and comparable calendar basis, sales grew in Europe and decreased in the Americas and Asia, while gross profit margin grew in both Europe and Asia and decreased in the Americas. During fiscal year 2015, gross profit margin in all regions was negatively impacted by clearance activities and the Americas gross profit margin was further impacted by an increased mix of sales in the off-price channel. These unfavorable impacts to gross profit margin were partially offset by favorable impacts from our pricing initiatives in all regions and an increased sales mix of higher margin products within the watch category in the Asia segment. During fiscal year 2015, operating expenses deleveraged in all regions largely due to fixed expenses on lower sales. Additionally, the Americas and Europe segments included restructuring charges and increased marketing and customer engagement costs. Corporate operating expenses in fiscal year 2015 increased compared to fiscal year 2014, largely driven by investments in advertising and strategic initiatives, restructuring charges, a noncash impairment charge, closing costs associated with the Misfit acquisition and increased incentive compensation.
Operating income by operating segment is summarized as follows (dollars in millions):
Fiscal Year | Growth (Decline) | Operating Margin % | ||||||||||||||||||
2015 | 2014 | Dollars | Percentage | 2015 | 2014 | |||||||||||||||
Americas | $ | 354.3 | $ | 463.2 | $ | (108.9 | ) | (23.5 | )% | 21.3 | % | 26.5 | % | |||||||
Europe | 210.5 | 288.0 | (77.5 | ) | (26.9 | ) | 19.7 | 24.1 | ||||||||||||
Asia | 71.7 | 116.3 | (44.6 | ) | (38.3 | ) | 14.4 | 20.5 | ||||||||||||
Corporate | (345.3 | ) | (301.0 | ) | (44.3 | ) | 14.7 | |||||||||||||
Total operating income | $ | 291.2 | $ | 566.5 | $ | (275.3 | ) | (48.6 | )% | 9.0 | % | 16.1 | % | |||||||
Interest Expense. Interest expense increased by $4.1 million in fiscal year 2015 as a result of increased debt levels in comparison to the prior fiscal year.
Other Income (Expense)—Net. During fiscal year 2015, other income (expense) - net increased by approximately $33.0 million, largely driven by increased net foreign currency gains resulting from mark-to-market hedging and other transactional activities as compared to fiscal year 2014. Additionally, the fiscal year 2015 other income (expense) - net amount included a $5.2 million gain related to an interest rate hedge settlement while the fiscal year 2014 other income (expense) - net amount included an arbitration judgment gain of $6.0 million related to the purchase price for Skagen Designs.
Income Taxes. Income tax expense for fiscal year 2015 was $81.8 million, resulting in an effective tax rate of 26.2%, compared to 30.7% in fiscal year 2014. The lower effective tax rate for fiscal year 2015 as compared to fiscal year 2014 was
49
attributable to foreign tax credits generated from the repatriation of foreign earnings, favorable adjustments to the prior year income tax accruals, and the recognition of income tax benefits due to the settlement of audits.
Net Income Attributable to Fossil Group, Inc. Fiscal year 2015 net income attributable to Fossil Group, Inc. was $4.51 per diluted share in comparison to $7.10 per diluted share in the prior fiscal year and included a $1.12 per diluted share decrease related to foreign currency changes. Excluding currency impacts, diluted earnings per share included a $0.35 per diluted share decrease related to restructuring charges, a $0.13 per diluted share decrease from a non-cash impairment charge and a $0.12 per diluted share decrease for Misfit transaction costs, offset by a $0.35 per diluted share benefit from a reduction in average shares outstanding and a $0.28 per diluted share increase associated with lower taxes. Net income attributable to Fossil Group, Inc. decreased 41.4% to $220.6 million for fiscal year 2015 in comparison to $376.7 million in the prior year.
50
Liquidity and Capital Resources
Historically, our business operations have not required substantial cash during the first several months of our fiscal year. Generally, starting in the third quarter, our cash needs begin to increase, typically reaching a peak in the September-November time frame as we increase inventory levels in advance of the holiday season. Our quarterly cash requirements are also impacted by the number of new stores we open, other capital expenditures and strategic investments such as acquisitions. Our cash and cash equivalents balance at the end of fiscal year 2016 was $297.3 million, including $283.6 million held by foreign subsidiaries outside the U.S., in comparison to $289.3 million at the end of fiscal year 2015.
For fiscal year 2016, we generated operating cash flow of $210.1 million. This operating cash flow combined with cash on hand and funds generated from real estate sales was utilized to fund $171.4 million in net repayments on our credit facilities and $65.7 million in capital expenditures. During fiscal year 2016, net cash provided by operating activities consisted primarily of net income of $85.6 million adjusted by non-cash activities of $107.2 million and a net decrease of $17.3 million in working capital items.
Accounts receivable increased by 1.3% to $375.5 million during fiscal year 2016 compared to $370.8 million at the end of the prior fiscal year. Average days sales outstanding for our wholesale business for fiscal year 2016 remained relatively flat at 50 days compared to 49 days in the prior fiscal year.
Inventory at the end of fiscal year 2016 was $542.5 million, representing a decrease of 13.2% from the prior fiscal year inventory balance of $625.3 million.
The following tables reflect our common stock repurchase activity under our repurchase programs for the periods indicated (in millions):
For the 2016 Fiscal Year | For the 2015 Fiscal Year | ||||||||||||||||||
Fiscal Year Authorized | Dollar Value Authorized | Termination Date | Number of Shares Repurchased | Dollar Value Repurchased | Number of Shares Repurchased | Dollar Value Repurchased | |||||||||||||
2014 | $ | 1,000.0 | December 2018 | 0.1 | $ | 5.2 | 2.4 | $ | 200.7 | ||||||||||
2012 | $ | 1,000.0 | December 2016 (1) | — | $ | — | 0.3 | $ | 28.8 | ||||||||||
2010 | $ | 30.0 | None | — | $ | — | — | $ | — | ||||||||||
____________________________________________
(1) In the first quarter of fiscal year 2015, the Company completed this repurchase plan.
We effectively retired 0.1 million shares of repurchased common stock under our repurchase programs during fiscal year 2016. We account for the retirements by allocating the repurchase price, which is based upon the equity contribution associated with historical issuances, to common stock, additional paid-in capital and retained earnings. The effective retirement of common stock repurchased during fiscal year 2016 decreased common stock by $1,100, additional paid-in capital by $0.2 million, retained earnings by $5.0 million and treasury stock by $5.2 million. The effective retirement of common stock repurchased during the 2015 fiscal year decreased common stock by $27,300, additional paid-in capital by $0.7 million, retained earnings by $228.8 million and treasury stock by $229.5 million. At January 2, 2016 and December 31, 2016, all treasury stock had been effectively retired. We are currently prohibited by the terms of our Revolving Credit Facility (as defined below) from repurchasing additional shares of common stock.
At the end of the fiscal year 2016, we had working capital of $932.7 million compared to working capital of $953.1 million at the end of the prior fiscal year. Additionally, at the end of the fiscal year 2016, we had approximately $26.4 million of outstanding short-term borrowings and $610.0 million in long-term debt.
On March 9, 2015, we entered into an Amended and Restated Credit Agreement (as amended, the “Credit Agreement”). The Credit Agreement provides for (i) revolving credit loans in the amount of $1.05 billion (the “Revolving Credit Facility”), with an up to $20.0 million subfacility for swingline loans (the “Swingline Loan”), and an up to $10.0 million subfacility for letters of credit, and (ii) a term loan in the amount of $231.3 million (the “Term Loan”). The Credit Agreement expires and is due and payable on May 17, 2018. The Credit Agreement amended and restated that certain credit agreement, dated as of May 17, 2013, as amended (the “Prior Agreement”).
On August 8, 2016, we entered into the First Amendment. The First Amendment adds two new levels to the applicable margin pricing grid used to calculate the interest rate that is applicable to base rate loans and LIBOR rate loans under the credit facility and increases the applicable margin at each pricing level for LIBOR rate loans by 25 basis points and for base rate loans by 25 basis points. Additionally, the First Amendment provides for the net cash proceeds from certain debt issuances in excess of $25.0 million to be applied, first, to prepay the term loans under our credit facility and, for the excess, if any, to prepay the
51
revolving credit loans under our credit facility with a corresponding reduction in the revolving credit commitment by the amount of such excess proceeds. Furthermore, the First Amendment changes the consolidated total leverage ratio that we must comply with for fiscal quarters ending on or after June 30, 2016 from 2.50:1.00 to 3.25:1.00.
In connection with the First Amendment, we, along with certain of our material domestic subsidiaries, entered into a Collateral Agreement in favor of Wells Fargo Bank, National Association, as administrative agent, pursuant to which, together with such subsidiaries, we granted liens on all or substantially all of their assets in order to secure our obligations under the Credit Agreement and the other loan documents (the “Obligations”). Additionally, certain of our domestic subsidiaries entered into a Guaranty Agreement in favor of Wells Fargo Bank, National Association, as administrative agent, pursuant to which such subsidiaries guarantee the payment and performance of the Obligations.
As of August 8, 2016, amounts outstanding under the Revolving Credit Facility and the Term Loan under the Credit Agreement bear interest, at our option, at (i) the base rate (defined as the highest of (a) the prime rate publicly announced by Wells Fargo, (b) the federal funds rate plus 0.5% and (c) London Interbank Offer Rate ("LIBOR") for an interest period of one month plus 1.0%) plus the base rate applicable margin (which varies, based upon our consolidated total leverage ratio, from 0.50%, if the consolidated total leverage ratio is less than 1.00 to 1.00, to 1.75%, if the consolidated total leverage ratio is greater than or equal to 3.00 to 1.00) or (ii) the LIBOR rate (defined as the quotient obtained by dividing (a) LIBOR by (b) 1.00 minus the Eurodollar reserve percentage) plus the LIBOR rate applicable margin (which varies, based upon the consolidated total leverage ratio, from 1.50%, if the consolidated total leverage ratio is less than 1.00 to 1.00, to 2.75%, if the consolidated total leverage ratio is greater than or equal to 3.00 to 1.00).
Amounts outstanding under the Swingline Loan under the Credit Agreement or upon any drawing under a letter of credit bear interest at the base rate plus the applicable margin. Interest based upon the base rate is payable quarterly in arrears. Interest based upon the LIBOR rate is payable on the last day of the applicable interest period.
Financial covenants in the Credit Agreement require us to maintain (i) a consolidated total leverage ratio no greater than 3.25 to 1.00, and (ii) a consolidated interest coverage ratio no less than 3.50 to 1.00.
During fiscal year 2016, we made net principal payments of $21.9 million under the Term Loan. During fiscal year 2016, we had net principal payments of $148.0 million under the Revolving Credit Facility at an average interest rate of 2.33%. As of December 31, 2016, we had $189.9 million and $441.0 million outstanding under the Term Loan and the Revolving Credit Facility, respectively. The outstanding balance under the Term Loan is net of unamortized debt issuance costs of $3.8 million at December 31, 2016. In addition, we had $0.9 million of outstanding standby letters of credit at December 31, 2016. Amounts available under the Revolving Credit Facility are reduced by any amounts outstanding under standby letters of credit. As of December 31, 2016, we had $303.9 million available for borrowing under the Revolving Credit Facility, which was favorably impacted by a $200.0 million international cash balance. Borrowings under the Revolving Credit Facility were mainly used to fund capital expenditures, normal operating expenses and historical common stock repurchases. At December 31, 2016, we were in compliance with all debt covenants related to all our credit facilities.
As of December 31, 2016, we do not consider $310.2 million of undistributed earnings of our foreign subsidiaries to be indefinitely reinvested. As such, we have accrued taxes on these amounts net of applicable foreign tax credits. We have not provided for U.S. federal and state income taxes on the remaining $959.0 million of undistributed earnings of our foreign subsidiaries because we consider such earnings to be indefinitely reinvested outside the U.S. The determination of the amount of incremental tax that would be due in the event these earnings are repatriated in the future is not practicable. However, our intent is to keep these funds indefinitely reinvested outside of the U.S., and our current plans do not indicate a need to repatriate them to fund our U.S. operations.
For the fiscal year ending December 30, 2017, we expect total capital expenditures to be approximately $70 million. Of this amount, we expect approximately 70% will be for strategic growth, including investments in omni-channel, global concessions and technology, approximately 15% will be for retail store expansion and renovation and approximately 15% will be for technology and facilities maintenance. Our capital expenditure budget and allocation of it to the foregoing investments are estimates and are subject to change. We believe that cash flows from operations combined with existing cash on hand and amounts available under the Revolving Credit Facility will be sufficient to fund our working capital needs and planned capital expenditures for the next twelve months.
52
Contractual Obligations
The following table identifies our contractual obligations as of December 31, 2016 (in thousands):
Total | Less than 1 Year | 1 - 3 Years | 3 - 5 Years | More than 5 Years | |||||||||||||||
Debt obligations (1) | $ | 634,750 | $ | 25,000 | $ | 609,750 | $ | — | $ | — | |||||||||
Interest payments on debt (2) | 31,771 | 21,453 | 10,318 | — | — | ||||||||||||||
Minimum royalty payments (3) | 239,251 | 160,577 | 76,174 | 2,500 | — | ||||||||||||||
Capital lease obligations (4) | 5,577 | 1,435 | 2,072 | 1,840 | 230 | ||||||||||||||
Operating lease obligations | 799,857 | 149,364 | 241,790 | 175,019 | 233,684 | ||||||||||||||
Purchase obligations (5) | 442,452 | 385,069 | 54,084 | 2,965 | 334 | ||||||||||||||
Uncertain tax positions (6) | 3,393 | 3,393 | — | — | — | ||||||||||||||
Total contractual obligations (7) | $ | 2,157,051 | $ | 746,291 | $ | 994,188 | $ | 182,324 | $ | 234,248 | |||||||||
____________________________________________
(1) | Consists of borrowings in the U.S., excluding contractual interest payments and unamortized debt issuance costs of $3.8 million. |
(2) | Consists of estimated interest payments under the Term Loan and Revolving Credit Facility. |
(3) | Consists primarily of minimum royalty commitments under exclusive licenses to manufacture watches and jewelry under trademarks not owned by us. However these minimum royalty commitments do not include amounts owed pursuant to various license and design service agreements under which we are obligated to pay the licensors a percentage of our net sales of these licensed products. |
(4) | Payments shown include interest. |
(5) | Consists primarily of open non-cancelable purchase orders and outstanding letters of credit, which represent inventory purchase commitments that typically mature in one to eight months. |
(6) | Management has only included its current ASC 740 liability in the table above. Long-term amounts of $20.0 million have been excluded because the payment timing cannot be reasonably estimated. |
(7) | Pension obligations of $13.0 million have been excluded because the payment timing cannot be reasonably estimated. |
Off Balance Sheet Arrangements
We are the guarantor for a 6.0 million Swiss franc credit facility agreement entered into by Swiss Technology Components Ltd. ("STC"), our equity method investee. We are obligated to pay up to 6.6 million Swiss francs in the event of default by STC.
There are no other off balance sheet arrangements other than those disclosed in Note 13—Commitments and Contingencies to our consolidated financial statements set forth in Part II, Item 8 of this Annual Report on Form 10-K.
53
Selected Quarterly Consolidated Financial Data
The table below sets forth selected quarterly consolidated financial information. The information is derived from our unaudited consolidated financial statements and includes all normal and recurring adjustments that management considers necessary for a fair statement of results for such periods. The operating results for any quarter are not necessarily indicative of results for any future period. Certain line items presented in the tables below, when aggregated, may not agree with the corresponding line items on our consolidated statements of income and comprehensive income for fiscal years 2016 and 2015 due to rounding (in thousands, except percentage and per share data).
Fiscal Year 2016 | 1st Qtr | 2nd Qtr | 3rd Qtr | 4th Qtr | |||||||||||
Net sales | $ | 659,847 | $ | 685,368 | $ | 737,990 | $ | 959,166 | |||||||
Gross profit | 348,337 | 355,750 | 385,080 | 489,019 | |||||||||||
Net income | 7,396 | 8,072 | 19,348 | 50,786 | |||||||||||
Net income attributable to noncontrolling interest | 1,603 | 2,051 | 1,992 | 1,088 | |||||||||||
Net income attributable to Fossil Group, Inc. | $ | 5,793 | $ | 6,021 | $ | 17,356 | $ | 49,698 | |||||||
Earnings per share: | |||||||||||||||
Basic | $ | 0.12 | $ | 0.13 | $ | 0.36 | $ | 1.03 | |||||||
Diluted | $ | 0.12 | $ | 0.12 | $ | 0.36 | $ | 1.03 | |||||||
Gross profit as a percentage of net sales | 52.8 | % | 51.9 | % | 52.2 | % | 51.0 | % | |||||||
Fiscal Year 2015 | 1st Qtr | 2nd Qtr | 3rd Qtr | 4th Qtr | |||||||||||
Net sales | $ | 725,085 | $ | 739,975 | $ | 771,303 | $ | 992,473 | |||||||
Gross profit | 400,724 | 409,465 | 417,734 | 525,543 | |||||||||||
Net income | 40,638 | 56,820 | 60,129 | 72,315 | |||||||||||
Net income attributable to noncontrolling interest | 2,568 | 2,172 | 2,595 | 1,930 | |||||||||||
Net income attributable to Fossil Group, Inc. | $ | 38,070 | $ | 54,648 | $ | 57,534 | $ | 70,385 | |||||||
Earnings per share: | |||||||||||||||
Basic | $ | 0.76 | $ | 1.12 | $ | 1.19 | $ | 1.46 | |||||||
Diluted | $ | 0.75 | $ | 1.12 | $ | 1.19 | $ | 1.46 | |||||||
Gross profit as a percentage of net sales | 55.3 | % | 55.3 | % | 54.2 | % | 53.0 | % | |||||||
While the majority of our products are not seasonal in nature, a significant portion of our net sales and operating income is generally derived in the second half of the fiscal year. Our third and fourth quarters, which include the "back to school" and Christmas seasons, have historically generated a significant portion of our annual operating income. The amount of net sales and operating income generated during the first quarter is affected by the levels of inventory held by retailers at the end of the Christmas season, as well as general economic conditions and other factors beyond our control. In general, lower levels of inventory held by retailers at the end of the Christmas season may have a positive impact on our net sales and operating income in the first quarter of the following fiscal year as a result of higher levels of restocking orders placed by retailers.
As we expand our e-commerce business and improve productivity in our retail store base, sales from the direct to consumer distribution channel may increase as a percentage of the total sales mix. Based upon the historical seasonality of direct to consumer sales, we believe this expansion could result in higher levels of profitability in the fourth quarter and lower levels of profitability in the first and second quarters when, due to seasonality, it is more difficult to leverage retail store four wall operating costs and back office expenses against a lower level of sales productivity. In addition, new product launches would generally augment the sales and operating expense levels in the quarter the product launch takes place. The results of operations for a particular quarter may also vary due to a number of factors, including retail, economic and monetary conditions, timing of orders or holidays, the timing of investments and the mix of products sold by us.
Item 7A. Quantitative and Qualitative Disclosures about Market Risk
Foreign Currency Exchange Rate Risk
As a multinational enterprise, we are exposed to changes in foreign currency exchange rates. Our most significant foreign currency risk relates to the euro and, to a lesser extent, the British pound, Canadian dollar, Japanese yen, Mexican peso and
54
Australian dollar as compared to the U.S. dollar. Due to our vertical nature whereby a significant portion of goods are sourced from our owned entities, the foreign currency risks relate primarily to the necessary current settlement of intercompany inventory transactions. We employ a variety of operating practices to manage these market risks relative to foreign currency exchange rate changes and, where deemed appropriate, utilize forward contracts. These operating practices include, among others, our ability to convert foreign currency into U.S. dollars at spot rates and to maintain U.S. dollar pricing relative to sales of our products to certain distributors located outside the U.S. The use of forward contracts allows us to offset exposure to rate fluctuations because the gains or losses incurred on the derivative instruments will offset, in whole or in part, losses or gains on the underlying foreign currency exposure. We use derivative instruments only for risk management purposes and do not use them for speculation or for trading. There were no significant changes in how we managed foreign currency transactional exposure in fiscal year 2016 and management does not anticipate any significant changes in such exposures or in the strategies we employ to manage such exposure in the near future.
We are exposed to risk that adverse changes in foreign currency exchange rates could impact our net investment in foreign operations. To manage this risk, during the first quarter of fiscal year 2016, we entered into a forward contract designated as a net investment hedge to reduce exposure to changes in currency exchange rates on 45.0 million euros of our total investment in a euro-denominated foreign subsidiary. The hedge was settled during the second quarter of fiscal year 2016 resulting in a net gain of $0.5 million net of taxes that was recognized in the currency translation component of accumulated other comprehensive income (loss).
The following table shows our outstanding forward contracts designated as cash flow hedges for intercompany inventory transactions (in millions) at December 31, 2016 and their expiration dates.
Functional Currency | Contract Currency | |||||||
Type | Amount | Type | Amount | Expiring Through | ||||
Euro | 264.4 | U.S. dollar | 296.8 | November 2018 | ||||
British pound | 53.3 | U.S. dollar | 74.8 | December 2018 | ||||
Canadian dollar | 86.9 | U.S. dollar | 66.0 | December 2018 | ||||
Japanese yen | 4,554.3 | U.S. dollar | 41.3 | December 2018 | ||||
Mexican peso | 442.9 | U.S. dollar | 22.6 | September 2017 | ||||
Australian dollar | 20.5 | U.S. dollar | 15.4 | September 2017 | ||||
U.S. Dollar | 33.4 | Japanese Yen | 3,415.0 | November 2017 | ||||
If we were to settle our euro, British pound, Canadian dollar, Japanese yen, Mexican peso, Australian dollar and U.S. dollar based forward contracts hedging intercompany inventory transactions as of December 31, 2016, the net result would have been a net gain of approximately $15.0 million, net of taxes. As of December 31, 2016, a 10% unfavorable change in the U.S. dollar strengthening against foreign currencies to which we have balance sheet transactional exposures would have decreased net pre-tax income by $10.9 million. The translation of the balance sheets of our foreign-based operations from their local currencies into U.S. dollars is also sensitive to changes in foreign currency exchange rates. As of December 31, 2016, a 10% unfavorable change in the exchange rate of the U.S. dollar strengthening against the foreign currencies to which we have exposure would have reduced consolidated stockholders' equity by approximately $61.8 million.
Interest Rate Risk
We are subject to interest rate volatility with regard to debt borrowings. Effective July 26, 2013, we entered into an interest rate swap agreement with a term of approximately five years to manage our exposure to interest rate fluctuations on our Term Loan. We will continue to evaluate our interest rate exposure and the use of interest rate swaps in future periods to mitigate our risk associated with adverse fluctuations in interest rates.
Based on our variable-rate debt outstanding as of December 31, 2016, excluding the $189.9 million outstanding under our Term Loan hedged with an interest rate swap agreement, a 100 basis point increase in interest rates would increase annual interest expense by approximately $4.5 million.
55
Item 8. Consolidated Financial Statements and Supplementary Data
REPORT OF INDEPENDENT REGISTERED PUBLIC ACCOUNTING FIRM
To the Board of Directors and Stockholders of
Fossil Group, Inc.
Richardson, Texas
We have audited the accompanying consolidated balance sheets of Fossil Group, Inc. and subsidiaries (the "Company") as of December 31, 2016 and January 2, 2016, and the related consolidated statements of income and comprehensive income, stockholders' equity, and cash flows for each of the three years in the period ended December 31, 2016. Our audits also included the financial statement schedule listed in the Index at Item 15. These financial statements and financial statement schedule are the responsibility of the Company's management. Our responsibility is to express an opinion on the consolidated financial statements and consolidated financial statement schedule based on our audits.
We conducted our audits in accordance with the standards of the Public Company Accounting Oversight Board (United States). Those standards require that we plan and perform the audit to obtain reasonable assurance about whether the financial statements are free of material misstatement. An audit includes examining, on a test basis, evidence supporting the amounts and disclosures in the financial statements. An audit also includes assessing the accounting principles used and significant estimates made by management, as well as evaluating the overall financial statement presentation. We believe that our audits provide a reasonable basis for our opinion.
In our opinion, such consolidated financial statements present fairly, in all material respects, the financial position of Fossil Group, Inc. and subsidiaries as of December 31, 2016 and January 2, 2016, and the results of their operations and their cash flows for each of the three years in the period ended December 31, 2016, in conformity with accounting principles generally accepted in the United States of America. Also, in our opinion, such financial statement schedule, when considered in relation to the basic consolidated financial statements taken as a whole, present fairly, in all material respects, the information set forth therein.
We have also audited, in accordance with the standards of the Public Company Accounting Oversight Board (United States), the Company's internal control over financial reporting as of December 31, 2016, based on the criteria established in Internal Control — Integrated Framework (2013) issued by the Committee of Sponsoring Organizations of the Treadway Commission and our report dated March 1, 2017 expressed an unqualified opinion on the Company's internal control over financial reporting.
/s/ Deloitte & Touche LLP
Dallas, Texas
March 1, 2017
56
FOSSIL GROUP, INC.
CONSOLIDATED BALANCE SHEETS
IN THOUSANDS
December 31, 2016 | January 2, 2016 | ||||||
Assets | |||||||
Current assets: | |||||||
Cash and cash equivalents | $ | 297,330 | $ | 289,275 | |||
Accounts receivable-net | 375,520 | 370,761 | |||||
Inventories | 542,487 | 625,344 | |||||
Prepaid expenses and other current assets | 131,953 | 157,290 | |||||
Total current assets | 1,347,290 | 1,442,670 | |||||
Property, plant and equipment-net | 273,851 | 326,370 | |||||
Goodwill | 355,263 | 359,394 | |||||
Intangible and other assets-net | 210,493 | 227,227 | |||||
Total long-term assets | 839,607 | 912,991 | |||||
Total assets | $ | 2,186,897 | $ | 2,355,661 | |||
Liabilities and Stockholders' Equity | |||||||
Current liabilities: | |||||||
Accounts payable | $ | 163,644 | $ | 208,083 | |||
Short-term and current portion of long-term debt | 26,368 | 23,159 | |||||
Accrued expenses: | |||||||
Compensation | 52,993 | 61,496 | |||||
Royalties | 30,062 | 38,359 | |||||
Co-op advertising | 29,111 | 28,918 | |||||
Transaction taxes | 26,743 | 44,425 | |||||
Other | 69,565 | 76,592 | |||||
Income taxes payable | 16,099 | 8,497 | |||||
Total current liabilities | 414,585 | 489,529 | |||||
Long-term income taxes payable | 18,584 | 20,634 | |||||
Deferred income tax liabilities | 55,877 | 75,165 | |||||
Long-term debt | 609,961 | 785,076 | |||||
Other long-term liabilities | 72,452 | 52,714 | |||||
Total long-term liabilities | 756,874 | 933,589 | |||||
Commitments and contingencies (Note 13) | |||||||
Stockholders' equity: | |||||||
Common stock, 48,269 and 48,125 shares issued and outstanding at December 31, 2016 and January 2, 2016, respectively | 483 | 481 | |||||
Additional paid-in capital | 213,352 | 187,456 | |||||
Retained earnings | 887,825 | 813,957 | |||||
Accumulated other comprehensive income (loss) | (95,424 | ) | (80,506 | ) | |||
Total Fossil Group, Inc. stockholders' equity | 1,006,236 | 921,388 | |||||
Noncontrolling interest | 9,202 | 11,155 | |||||
Total stockholders' equity | 1,015,438 | 932,543 | |||||
Total liabilities and stockholders' equity | $ | 2,186,897 | $ | 2,355,661 | |||
See notes to the consolidated financial statements.
57
FOSSIL GROUP, INC.
CONSOLIDATED STATEMENTS OF INCOME AND COMPREHENSIVE INCOME
IN THOUSANDS, EXCEPT PER SHARE DATA
Fiscal Year | 2016 | 2015 | 2014 | ||||||||
Net sales | $ | 3,042,371 | $ | 3,228,836 | $ | 3,509,691 | |||||
Cost of sales | 1,464,185 | 1,475,369 | 1,508,519 | ||||||||
Gross profit | 1,578,186 | 1,753,467 | 2,001,172 | ||||||||
Operating expenses: | |||||||||||
Selling, general and administrative expenses | 1,423,262 | 1,437,833 | 1,434,636 | ||||||||
Restructuring charges | 27,778 | 24,400 | — | ||||||||
Total operating expenses | 1,451,040 | 1,462,233 | 1,434,636 | ||||||||
Operating income | 127,146 | 291,234 | 566,536 | ||||||||
Interest expense | 26,894 | 20,018 | 15,898 | ||||||||
Other income (expense) - net | 14,056 | 40,443 | 7,440 | ||||||||
Income before income taxes | 114,308 | 311,659 | 558,078 | ||||||||
Provision for income taxes | 28,705 | 81,757 | 171,467 | ||||||||
Net income | 85,603 | 229,902 | 386,611 | ||||||||
Less: Net income attributable to noncontrolling interest | 6,735 | 9,265 | 9,904 | ||||||||
Net income attributable to Fossil Group, Inc. | $ | 78,868 | $ | 220,637 | $ | 376,707 | |||||
Other comprehensive income (loss), net of taxes: | |||||||||||
Currency translation adjustment | $ | (20,160 | ) | $ | (54,466 | ) | $ | (65,393 | ) | ||
Cash flow hedges - net change | 2,929 | (7,057 | ) | 16,675 | |||||||
Pension plan activity | 2,313 | (2,573 | ) | (4,383 | ) | ||||||
Total other comprehensive income (loss) | (14,918 | ) | (64,096 | ) | (53,101 | ) | |||||
Total comprehensive income | 70,685 | 165,806 | 333,510 | ||||||||
Less: Comprehensive income attributable to noncontrolling interest | 6,735 | 9,265 | 9,904 | ||||||||
Comprehensive income attributable to Fossil Group, Inc. | $ | 63,950 | $ | 156,541 | $ | 323,606 | |||||
Earnings per share: | |||||||||||
Basic | $ | 1.64 | $ | 4.52 | $ | 7.12 | |||||
Diluted | $ | 1.63 | $ | 4.51 | $ | 7.10 | |||||
Weighted average common shares outstanding: | |||||||||||
Basic | 48,136 | 48,800 | 52,882 | ||||||||
Diluted | 48,323 | 48,924 | 53,080 | ||||||||
See notes to the consolidated financial statements.
58
FOSSIL GROUP, INC.
CONSOLIDATED STATEMENTS OF STOCKHOLDERS' EQUITY
AMOUNTS IN THOUSANDS
Common stock | Additional paid-in capital | Treasury stock | Retained earnings | Accumulated other comprehensive income (loss) | Stockholders' equity attributable to Fossil Group, Inc. | Noncontrolling interest | Total stockholders' equity | |||||||||||||||||||||||||||
Shares | Par value | |||||||||||||||||||||||||||||||||
Balance, December 29, 2013 | 54,708 | $ | 547 | $ | 154,376 | $ | — | $ | 877,063 | $ | 36,691 | $ | 1,068,677 | $ | 6,690 | $ | 1,075,367 | |||||||||||||||||
Common stock issued upon exercise of stock options and stock appreciation rights | 88 | 1 | 3,234 | — | — | — | 3,235 | — | 3,235 | |||||||||||||||||||||||||
Tax benefit derived from stock-based compensation | — | — | 1,430 | — | — | — | 1,430 | — | 1,430 | |||||||||||||||||||||||||
Acquisition of common stock | — | — | 800 | (438,711 | ) | — | — | (437,911 | ) | — | (437,911 | ) | ||||||||||||||||||||||
Retirement of common stock | (4,144 | ) | (41 | ) | (6,993 | ) | 438,711 | (431,677 | ) | — | — | — | — | |||||||||||||||||||||
Restricted stock issued in connection with stock-based compensation plan | 119 | 1 | (1 | ) | — | — | — | — | — | — | ||||||||||||||||||||||||
Stock-based compensation | — | — | 18,823 | — | — | — | 18,823 | — | 18,823 | |||||||||||||||||||||||||
Net income | — | — | — | — | 376,707 | — | 376,707 | 9,904 | 386,611 | |||||||||||||||||||||||||
Other comprehensive income (loss) | — | — | — | — | — | (53,101 | ) | (53,101 | ) | — | (53,101 | ) | ||||||||||||||||||||||
Distribution of noncontrolling interest earnings and other | — | — | — | — | — | — | — | (10,317 | ) | (10,317 | ) | |||||||||||||||||||||||
Purchase of noncontrolling interest shares | — | — | — | — | — | — | — | (336 | ) | (336 | ) | |||||||||||||||||||||||
Balance, January 3, 2015 | 50,771 | $ | 508 | $ | 171,669 | $ | — | $ | 822,093 | $ | (16,410 | ) | $ | 977,860 | $ | 5,941 | $ | 983,801 | ||||||||||||||||
Common stock issued upon exercise of stock options and stock appreciation rights | 113 | 1 | 769 | — | — | — | 770 | — | 770 | |||||||||||||||||||||||||
Tax expense derived from stock-based compensation | — | — | (1,128 | ) | — | — | — | (1,128 | ) | — | (1,128 | ) | ||||||||||||||||||||||
Acquisition of common stock | — | — | 887 | (232,169 | ) | — | — | (231,282 | ) | — | (231,282 | ) | ||||||||||||||||||||||
Retirement of common stock | (2,759 | ) | (28 | ) | (3,368 | ) | 232,169 | (228,773 | ) | — | — | — | — | |||||||||||||||||||||
Stock-based compensation | — | — | 18,627 | — | — | — | 18,627 | — | 18,627 | |||||||||||||||||||||||||
Net income | — | — | — | — | 220,637 | — | 220,637 | 9,265 | 229,902 | |||||||||||||||||||||||||
Other comprehensive income (loss) | — | — | — | — | — | (64,096 | ) | (64,096 | ) | — | (64,096 | ) | ||||||||||||||||||||||
Distribution of noncontrolling interest earnings and other | — | — | — | — | — | — | — | (9,883 | ) | (9,883 | ) | |||||||||||||||||||||||
Purchase of noncontrolling interest shares | — | — | — | — | — | — | — | 5,832 | 5,832 | |||||||||||||||||||||||||
Balance, January 2, 2016 | 48,125 | $ | 481 | $ | 187,456 | $ | — | $ | 813,957 | $ | (80,506 | ) | $ | 921,388 | $ | 11,155 | $ | 932,543 | ||||||||||||||||
Common stock issued upon exercise of stock options, stock appreciation rights and restricted stock units | 310 | 3 | 93 | — | — | — | 96 | — | 96 | |||||||||||||||||||||||||
Tax expense derived from stock-based compensation | — | — | (2,995 | ) | — | — | — | (2,995 | ) | — | (2,995 | ) | ||||||||||||||||||||||
Acquisition of common stock | — | — | 247 | (7,484 | ) | — | — | (7,237 | ) | — | (7,237 | ) | ||||||||||||||||||||||
Retirement of common stock | (166 | ) | (1 | ) | (2,483 | ) | 7,484 | (5,000 | ) | — | — | — | — | |||||||||||||||||||||
Stock-based compensation | — | — | 31,034 | — | — | — | 31,034 | — | 31,034 | |||||||||||||||||||||||||
Net income | — | — | — | — | 78,868 | — | 78,868 | 6,735 | 85,603 | |||||||||||||||||||||||||
Other comprehensive income (loss) | — | — | — | — | — | (14,918 | ) | (14,918 | ) | — | (14,918 | ) | ||||||||||||||||||||||
Distribution of noncontrolling interest earnings and other | — | — | — | — | — | — | — | (8,688 | ) | (8,688 | ) | |||||||||||||||||||||||
Balance, December 31, 2016 | 48,269 | $ | 483 | $ | 213,352 | $ | — | $ | 887,825 | $ | (95,424 | ) | $ | 1,006,236 | $ | 9,202 | $ | 1,015,438 | ||||||||||||||||
See notes to consolidated financial statements.
59
FOSSIL GROUP, INC.
CONSOLIDATED STATEMENTS OF CASH FLOWS
AMOUNTS IN THOUSANDS
Fiscal Year | 2016 | 2015 | 2014 | ||||||||
Operating Activities: | |||||||||||
Net income | $ | 85,603 | $ | 229,902 | $ | 386,611 | |||||
Adjustments to reconcile net income to net cash provided by operating activities: | |||||||||||
Depreciation, amortization and accretion | 94,592 | 87,662 | 95,931 | ||||||||
Stock-based compensation | 31,034 | 18,627 | 18,823 | ||||||||
(Decrease) increase in allowance for returns-net of inventory in transit | (3,600 | ) | (1,282 | ) | 3,701 | ||||||
(Gain) loss on disposal of assets | (9,851 | ) | 1,913 | 465 | |||||||
Impairment losses | 2,828 | 16,804 | 9,266 | ||||||||
Non-cash restructuring charges | 15,745 | 3,962 | — | ||||||||
Equity method investment losses | 1,321 | — | — | ||||||||
(Decrease) increase in allowance for doubtful accounts | (2,819 | ) | 2,384 | 550 | |||||||
Excess tax benefits from stock-based compensation | (5 | ) | (177 | ) | (1,430 | ) | |||||
Deferred income taxes and other | (18,561 | ) | 929 | 2,708 | |||||||
Gain on business divestiture | (3,500 | ) | — | — | |||||||
Contingent consideration remeasurement | — | — | 1,112 | ||||||||
Changes in operating assets and liabilities, net of effect of acquisitions: | |||||||||||
Accounts receivable | (12,900 | ) | 42,912 | (8,495 | ) | ||||||
Inventories | 64,827 | (43,082 | ) | (60,746 | ) | ||||||
Prepaid expenses and other current assets | 26,098 | (36,902 | ) | (52,726 | ) | ||||||
Accounts payable | (43,020 | ) | 41,843 | 2,477 | |||||||
Accrued expenses | (20,116 | ) | 12,545 | (13,315 | ) | ||||||
Income taxes payable | 2,451 | (17,269 | ) | 2,951 | |||||||
Net cash provided by operating activities | 210,127 | 360,771 | 387,883 | ||||||||
Investing Activities: | |||||||||||
Additions to property, plant and equipment | (65,674 | ) | (79,767 | ) | (94,763 | ) | |||||
Decrease (increase) in intangible and other assets | 771 | (3,730 | ) | (9,419 | ) | ||||||
Skagen Designs arbitration settlement | — | 5,968 | — | ||||||||
Proceeds from the sale of property, plant, equipment and other | 44,908 | 179 | 612 | ||||||||
Misfit escrow receipts | 3,341 | — | — | ||||||||
Business acquisitions-net of cash acquired | — | (220,189 | ) | — | |||||||
Net investment hedge settlement | 752 | 3,709 | 410 | ||||||||
Business divestiture | 3,500 | — | — | ||||||||
Net cash used in investing activities | (12,402 | ) | (293,830 | ) | (103,160 | ) | |||||
Financing Activities: | |||||||||||
Acquisition of common stock | (7,237 | ) | (231,282 | ) | (437,911 | ) | |||||
Distribution of noncontrolling interest earnings and other | (8,688 | ) | (9,883 | ) | (10,317 | ) | |||||
Debt borrowings | 1,035,838 | 2,548,650 | 961,000 | ||||||||
Debt payments | (1,207,205 | ) | (2,368,408 | ) | (838,684 | ) | |||||
Payment for shares of Fossil, S.L. | (8,657 | ) | — | — | |||||||
Other financing activities | (2,545 | ) | (3,104 | ) | 731 | ||||||
Net cash used in financing activities | (198,494 | ) | (64,027 | ) | (325,181 | ) | |||||
Effect of exchange rate changes on cash and cash equivalents | 8,824 | 10,100 | (3,760 | ) | |||||||
Net increase (decrease) in cash and cash equivalents | 8,055 | 13,014 | (44,218 | ) | |||||||
Cash and cash equivalents: | |||||||||||
Beginning of year | 289,275 | 276,261 | 320,479 | ||||||||
End of year | $ | 297,330 | $ | 289,275 | $ | 276,261 | |||||
See notes to the consolidated financial statements.
60
FOSSIL GROUP, INC.
NOTES TO CONSOLIDATED FINANCIAL STATEMENTS
1. Significant Accounting Policies
Consolidated Financial Statements include the accounts of Fossil Group, Inc., a Delaware corporation, and its subsidiaries (the "Company"). The Company is a leader in the design, development, marketing and distribution of contemporary, high quality fashion accessories on a global basis. The Company's products are sold primarily through department stores, specialty retailers and Company-owned retail stores worldwide. The Company reports on a fiscal year reflecting the retail-based calendar (containing 4-4-5 week calendar quarters). References to fiscal years 2016, 2015 and 2014 are for the fiscal years ended December 31, 2016, January 2, 2016 and January 3, 2015, respectively. The Company's fiscal year periodically results in a 53-week year instead of a normal 52-week year. The fiscal year ended January 3, 2015 was a 53-week year, with the additional week included in the first quarter of the fiscal year. Accordingly, the information presented herein includes 53 weeks of operations for fiscal year 2014 as compared to 52 weeks in fiscal years 2016 and 2015. All intercompany balances and transactions are eliminated in consolidation.
Use of Estimates is required in the preparation of the consolidated financial statements in conformity with accounting principles generally accepted in the United States of America. Management makes estimates and assumptions that affect the reported amounts of assets and liabilities, the disclosure of contingent assets and liabilities at the date of the consolidated financial statements and the reported amounts of revenues and expenses during the reporting period. On an ongoing basis, management evaluates its estimates and judgments, including those related to product returns, inventories, long-lived assets, goodwill and trade names, income taxes, warranty costs, hedge accounting and stock-based compensation. Management bases its estimates and judgments on historical experience and on various other factors that it believes are reasonable under the circumstances. Management estimates form the basis for making judgments about the carrying value of the assets and liabilities that are not readily apparent from other sources. Actual results could differ from those estimates under different assumptions or conditions.
Concentration of Risk involves financial instruments that potentially expose the Company to concentration of credit risk and consist primarily of cash investments and accounts receivable. The Company places its cash investments with high-credit quality financial institutions and currently invests primarily in corporate debt securities and money market funds with major banks and financial institutions. Accounts receivable are generally diversified due to the number of entities comprising the Company's customer base and their dispersion across many geographic regions. The Company believes no significant concentration of credit risk exists with respect to these cash investments and accounts receivable.
A significant portion of sales of the Company's products are supplied by manufacturers located outside of the U.S., primarily in Asia. While the Company is not dependent on any single manufacturer outside the U.S., the Company could be adversely affected by political or economic disruptions affecting the business or operations of third-party manufacturers located outside of the U.S. In fiscal year 2016, two of the Company's majority-owned assembly factories accounted for approximately 47% of the Company's non-Swiss watch assembly and one of the Company's majority-owned assembly factories accounted for approximately 59% of the Company's jewelry production.
The Company has entered into multi-year, worldwide exclusive license agreements for the manufacture, distribution and sale of products bearing the brand names of certain globally recognized fashion companies. Sales of the Company's licensed products amounted to 47.6% of the consolidated net sales for fiscal year 2016, of which MICHAEL KORS® product sales accounted for 22.7% of the consolidated net sales for fiscal year 2016.
Cash Equivalents are considered all highly liquid investments with original maturities of three months or less.
Accounts Receivable at the end of fiscal years 2016 and 2015 are stated net of allowances of approximately $66.9 million and $68.7 million for estimated customer returns, respectively, and net of doubtful accounts of approximately $12.8 million and $15.8 million, respectively. The Company's policy is to maintain allowances for bankruptcies until the bankruptcies are actually settled. The total amount charged to cost and expenses during fiscal year 2016 relating to the Company's doubtful accounts receivable was $4.5 million.
Inventories are stated at the lower of market or average cost, including any applicable duty and freight charges. Inventory held at consignment locations is included in the Company's finished goods inventory, and at the end of fiscal years 2016 and 2015, was $51.1 million and $43.5 million, respectively.
Investments in which the Company has significant influence over the investee are accounted for utilizing the equity method. At the end of fiscal year 2016, the Company had an equity method investment of $1.3 million recorded in Other long-
61
term liabilities due to Company's participation in the accumulated losses of the investee. If the Company does not have significant influence over the investee, the cost method is utilized. The Company's cost method investments at the end of fiscal years 2016 and 2015 were $2.0 million and $2.4 million, respectively.
Property, Plant and Equipment and Other is stated at cost less accumulated depreciation and amortization. Depreciation is calculated using the straight-line method over the estimated useful lives of the assets of 30 years for buildings, generally five years for machinery and equipment and furniture and fixtures and two to seven years for computer equipment and software. Leasehold improvements are amortized over the shorter of the lease term or the asset's estimated useful life.
Property, plant and equipment and other long-lived assets are evaluated for impairment whenever events or conditions indicate that the carrying value of an asset may not be recoverable based on expected undiscounted cash flows related to the asset. Property, plant and equipment and other long-lived asset losses of underperforming Company-owned retail stores of approximately $13.5 million and $3.4 million were recorded in restructuring charges in fiscal years 2016 and 2015, respectively and losses of approximately $2.8 million, $7.7 million and $9.3 million were recorded in selling, general, and administrative ("SG&A") in fiscal years 2016, 2015 and 2014, respectively. Additionally, in fiscal year 2016, the Company recorded non-impairment losses related to the write off of property, plant and equipment of $1.5 million included in restructuring charges in the Company’s consolidated statements of income and comprehensive income.
Goodwill and Other Intangible Assets include the acquisition cost in excess of net assets acquired (goodwill), trademarks, trade names, developed technology, customer lists and patents. Trademarks, trade names with finite lives, developed technology, customer lists and patents are amortized using the straight-line method over their estimated useful lives, which are generally three to 20 years. Goodwill and other indefinite-lived intangible assets, such as indefinite-lived trade names, are evaluated for impairment annually as of the end of the fiscal year. Additionally, if events or conditions were to indicate the carrying value of a reporting unit or an indefinite-lived intangible asset may not be recoverable, the Company would evaluate the asset for impairment at that time. Impairment testing compares the carrying amount of the reporting unit or other intangible assets with its fair value. When the carrying amount of the reporting unit or other intangible assets exceeds its fair value, an impairment charge is recorded.
The Company has three reporting units for which it evaluates goodwill for impairment. These reporting units are (i) Americas, (ii) Europe and (iii) Asia. The fair value of each reporting unit is estimated using market comparable information and an income approach. If the estimated fair value of a reporting unit exceeds its carrying value, no impairment charge is recorded. As of December 31, 2016, the fair value of each of these reporting units exceeded its carrying value.
Judgments and assumptions are inherent in the Company's estimate of future cash flows used to determine the estimate of the reporting unit's fair value. The most significant assumptions associated with the fair value calculations include estimated future cash flows. The Company's estimated future cash flows are dependent on estimated future growth rates, discount rates and operating margins. If actual results differ, the estimated future cash flows may not be realized, and future impairments of goodwill may be incurred.
The Company estimates the fair value of its trade names using discounted cash flow methodologies. Due to the inherent uncertainties involved in making the estimates and assumptions used in the fair value analysis, actual results may differ, which could alter the fair value of the trade names and possibly result in impairment charges in future periods. The Company has completed the required annual impairment testing for trade names for fiscal years 2016, 2015 and 2014. No impairment charges were recorded in fiscal years 2016 or 2014. In fiscal year 2015, impairment charges were recorded related to the SKAGEN® trade name of $9.1 million.
Accrued Expenses Other includes liabilities relating to warranties, duty, deferred compensation, gift cards, foreign exchange forward contracts ("forward contracts"), deferred rent, and other liabilities which are current in nature.
Other Long-Term Liabilities includes obligations relating to asset retirements, deferred rent, forward contracts and defined benefits relating to certain international employees that are not current in nature.
Cumulative Translation Adjustment is included as a component of accumulated other comprehensive income (loss) and reflects the adjustments resulting from translating the financial statements of foreign subsidiaries into U.S. dollars. The functional currency of the Company's foreign subsidiaries is the currency of the primary economic environment in which the entity operates, which is generally the local currency of the country. Accordingly, assets and liabilities of the foreign
62
subsidiaries are translated to U.S. dollars at fiscal year-end exchange rates. Income and expense items are translated at average monthly exchange rates. Cumulative translation adjustments remain in accumulated other comprehensive income (loss) and are reclassified into earnings in the event the related foreign subsidiary is sold or liquidated.
Foreign Transaction Gains and Losses are those changes in exchange rates that affect cash flows and the related receivables or payables. The Company incurred net foreign currency transaction gains, including gains and losses associated with the settlement of forward contracts, of approximately $8.7 million, $32.6 million and $20,000 for fiscal years 2016, 2015 and 2014, respectively. These net gains have been included in other income (expense)—net in the Company's consolidated statements of income and comprehensive income.
Hedging Instruments The Company is exposed to certain market risks relating to foreign exchange rates and interest rates. The Company actively monitors and attempts to mitigate but does not eliminate these exposures using derivative instruments including forward contracts and interest rate swaps. The Company’s foreign subsidiaries periodically enter into forward contracts to hedge the future payment of intercompany inventory transactions denominated in U.S. dollars. Additionally, during the first quarter of fiscal year 2016, the Company entered into forward contracts to manage fluctuations in Japanese yen exchange rates that will be used to settle future third-party inventory component purchases by a U.S. dollar functional currency subsidiary. If the Company was to settle its euro, British pound, Canadian dollar, Japanese yen, Mexican peso, Australian dollar and U.S. dollar forward contracts as of December 31, 2016, the result would have been a net gain of approximately $15.0 million, net of taxes. This unrealized gain is recognized in other comprehensive income (loss), net of taxes on the Company's consolidated statements of income and comprehensive income. Additionally, to the extent that any of these contracts are not considered to be perfectly effective in offsetting the change in the value of the cash flows being hedged, any changes in fair value relating to the ineffective portion of these contracts would be recognized in other income (expense)-net on the Company's consolidated statements of income and comprehensive income. Also, the Company has entered into an interest rate swap agreement to effectively convert portions of its variable rate debt obligations to a fixed rate. Changes in the fair value of the interest rate swap is recorded as a component of accumulated other comprehensive income (loss) within stockholders' equity, and is recognized in interest expense in the period in which the payment is settled. To reduce exposure to changes in currency exchange rates adversely affecting the Company’s investment in foreign currency-denominated subsidiaries, the Company periodically enters into forward contracts designated as net investment hedges. Both realized and unrealized gains and losses from net investment hedges are recognized in the cumulative translation adjustment component of other comprehensive income (loss), and will be reclassified into earnings in the event the Company's underlying investments are liquidated or disposed. The Company does not hold or issue derivative financial instruments for trading or speculative purposes. See Note 8—Derivatives and Risk Management for additional disclosures about the Company's use of derivatives.
Litigation Liabilities are estimated amounts for claims that are probable and can be reasonably estimated and are recorded as liabilities in the Company's consolidated balance sheets. The likelihood of a material change in these estimated liabilities would be dependent on new claims that may arise, changes in the circumstances used to estimate amounts for prior period claims and favorable or unfavorable final settlements of prior period claims. As additional information becomes available, the Company assesses the potential liability related to new claims and existing claims and revises estimates as appropriate. As new claims arise or circumstances change relative to prior claim assessments, revisions in estimates of the potential liability could materially impact the Company's consolidated results of operations and financial position.
Stock-Based Compensation is recognized as expense related to the fair value of employee stock based awards. The Company utilizes the Black-Scholes model to determine the fair value of stock options and stock appreciation rights on the date of grant. The model requires the Company to make assumptions concerning (i) the length of time employees will retain their vested stock options and stock appreciation rights before exercising them ("expected term"), (ii) the volatility of the Company's common stock price over the expected term and (iii) the number of stock options and stock appreciation rights that will be forfeited. Changes in these assumptions can materially affect the estimate of fair value of stock-based compensation and, consequently, the related expense amounts recognized on the Company's consolidated statements of income and comprehensive income.
Revenues from sales of the Company's products including those that are subject to inventory consignment agreements are recognized when title and risk of loss transfers, delivery has occurred, the price to the buyer is determinable and collectability is reasonably assured. The Company accepts limited returns and may request that a customer return a product if the customer has an excess of any style that the Company has identified as being a poor performer for that customer or geographic location. The Company continually monitors returns and maintains a provision for estimated returns based upon historical experience and any
63
specific issues identified. Product returns are accounted for as reductions to revenue, cost of sales, accounts receivable and an increase in inventory to the extent the returned product is resalable. While returns have historically been within management's expectations and the provisions established, future return rates may differ from those experienced in the past. In the event that the Company's products are performing poorly in the retail market and/or it experiences product damages or defects at a rate significantly higher than the historical rate, the resulting returns could have an adverse impact on the operating results for the period or periods in which such returns occur. Taxes imposed by governmental authorities on the Company's revenue-producing activities with customers, such as sales taxes and value added taxes, are excluded from net sales.
Cost of Sales includes raw material costs, assembly labor, assembly overhead including depreciation expense, assembly warehousing costs and shipping and handling costs related to the movement of finished goods from assembly locations to sales distribution centers and from sales distribution centers to customer locations. Additionally, cost of sales includes customs duties, product packaging cost, royalty cost associated with sales of licensed products, the cost of molding and tooling and inventory shrinkage and damages.
Operating Expenses include SG&A and restructuring charges. SG&A expenses include selling and distribution expenses primarily consisting of sales and distribution labor costs, sales distribution center and warehouse facility costs, depreciation expense related to sales distribution and warehouse facilities, the four-wall operating costs of the Company's retail stores, point-of-sale expenses, advertising expenses and art, design and product development labor costs. SG&A also includes general and administrative expenses primarily consisting of administrative support labor and "back office" or support costs such as treasury, legal, information services, accounting, internal audit, human resources, executive management costs and costs associated with stock-based compensation. Restructuring charges include costs to reorganize, refine and optimize the Company’s infrastructure and store closures. See Note 19—Restructuring for additional information on the Company’s restructuring plan.
Advertising Costs for in-store and media advertising as well as co-op advertising, catalog costs, product displays, show/exhibit costs, advertising royalties related to the sales of licensed brands, internet costs associated with affiliation fees, printing, sample costs and promotional allowances are expensed as incurred within SG&A. Advertising costs were approximately $238.4 million, $241.3 million and $232.7 million for fiscal years 2016, 2015 and 2014, respectively.
Warranty Costs are included in SG&A. The Company records an estimate for future warranty costs based on historical repair costs and adjusts the liability as required. Warranty costs have historically been within the Company's expectations and the provisions established. If such costs were to substantially exceed estimates, this could have an adverse effect on the Company's operating results. See Note 4—Warranty Liabilities, for more information regarding warranties.
Research and Development Costs are incurred primarily through the Company's in-house engineering team and also through some outside consulting and labor and consist primarily of personnel-related expenses, tooling and prototype materials and overhead costs. The Company’s research and development expenses are related to designing and developing new products and features and improving existing products. The Company's research and development expenses are recorded in SG&A and consisted of $38.6 million, $5.2 million and $0.6 million in fiscal years 2016, 2015 and 2014, respectively.
Noncontrolling Interest is recognized as equity in the Company's consolidated balance sheets, is reflected in net income attributable to noncontrolling interest in the consolidated statements of income and comprehensive income and is captured within the summary of changes in equity attributable to controlling and noncontrolling interests. Noncontrolling interests represent ownership interests in the Company's subsidiaries held by third parties.
Other Comprehensive Income (Loss) which is reported in the consolidated statements of income and comprehensive income and consolidated statements of equity, consists of net income and other gains and losses affecting equity that are excluded from net income. The components of other comprehensive income (loss) primarily consist of foreign currency translation gains and losses and net realized and unrealized gains and losses on the following: (i) securities available for sale; (ii) derivatives designated as cash flow hedges; and (iii) the Company's defined benefit plans.
Earnings Per Share ("EPS") is based on the weighted average number of common shares outstanding during each period. Diluted EPS adjusts basic EPS for the effects of dilutive common stock equivalents outstanding during each period using the treasury stock method.
64
The following table reconciles the numerators and denominators used in the computations of both basic and diluted EPS (in thousands except per share data):
Fiscal Year | 2016 | 2015 | 2014 | ||||||||
Numerator: | |||||||||||
Net income attributable to Fossil Group, Inc. | $ | 78,868 | $ | 220,637 | $ | 376,707 | |||||
Denominator: | |||||||||||
Basic EPS computation: | |||||||||||
Basic weighted average common shares outstanding | 48,136 | 48,800 | 52,882 | ||||||||
Basic EPS | $ | 1.64 | $ | 4.52 | $ | 7.12 | |||||
Diluted EPS computation: | |||||||||||
Basic weighted average common shares outstanding | 48,136 | 48,800 | 52,882 | ||||||||
Stock options, stock appreciation rights and restricted stock units | 187 | 124 | 198 | ||||||||
Diluted weighted average common shares outstanding | 48,323 | 48,924 | 53,080 | ||||||||
Diluted EPS | $ | 1.63 | $ | 4.51 | $ | 7.10 | |||||
Approximately 2.3 million, 0.6 million and 0.3 million weighted average shares issuable under stock-based awards were not included in the diluted EPS calculation in fiscal years 2016, 2015 and 2014, respectively, because they were antidilutive. In fiscal year 2016, approximately 0.3 million weighted average performance shares were not included in the diluted EPS calculation as the performance targets were not met. Performance shares were not issued prior to fiscal year 2015.
Income Taxes are provided for under the asset and liability method for temporary differences in the recognition of assets and liabilities recognized for income tax and financial reporting purposes. Deferred tax assets are periodically assessed for the likelihood of whether they are more likely than not to be realized. Tax benefits associated with uncertain tax positions are recognized in the period in which one of the following conditions is satisfied: (i) the more likely than not recognition threshold is satisfied; (ii) the position is ultimately settled through negotiation or litigation; or (iii) the statute of limitations for the taxing authority to examine and challenge the position has expired. Tax benefits associated with an uncertain tax position are derecognized in the period in which the more likely than not recognition threshold is no longer satisfied.
Recently Issued Accounting Standards
In January 2017, the Financial Accounting Standards Board ("FASB") issued Accounting Standards Update ("ASU") 2017-04, Intangibles - Goodwill and Other (Topic 350): Simplifying the Test for Goodwill Impairment ("ASU 2017-04"). Under ASU 2017-04, goodwill impairment testing is done by comparing the fair value of the reporting unit to its carrying value. If the carrying amount exceeds the fair value, the Company would recognize an impairment charge for the amount that the reporting unit's carrying value exceeds the fair value, not to exceed the total amount of goodwill allocated to that reporting unit. ASU 2017-04 eliminates the requirement to determine the fair value of individual assets and liabilities of a reporting unit to measure goodwill impairment. ASU 2017-04 is effective for annual or any interim goodwill impairment tests for annual periods beginning after December 15, 2019. Early adoption is permitted for interim or annual goodwill impairment tests after January 1, 2017. This standard will not have a material impact on the Company’s consolidated results of operations or financial position.
In January 2017, the FASB issued ASU 2017-01, Business Combinations (Topic 805): Clarifying the Definition of a Business ("ASU 2017-01"). ASU 2017-01 clarifies the definition of a business with the objective of adding guidance to assist entities with evaluating whether transactions should be accounted for as acquisitions (or disposals) of assets or businesses. The guidance is effective for annual periods beginning after December 15, 2017, including interim periods within those periods. This standard will not have a material impact on the Company’s consolidated results of operations or financial position.
In November 2016, the FASB issued ASU 2016-18, Statement of Cash Flows (Topic 230): Restricted Cash ("ASU 2016-18"). ASU 2016-18 requires that a statement of cash flows explain the change during the period in total cash, cash equivalents, and amounts generally described as restricted cash or restricted cash equivalents. Therefore, amounts generally described as restricted cash and restricted cash equivalents should be included with cash and cash equivalents when reconciling the beginning-of-period and end-of-period total amounts shown on the statement of cash flows. ASU 2016-18 is effective for
65
annual periods, and interim periods within those years, beginning after December 15, 2017. Early adoption is permitted. This standard will not have a material impact on the Company’s consolidated results of operations or financial position.
In October 2016, the FASB issued ASU 2016-16, Income Taxes (Topic 740): Intra-Entity Transfers of Assets Other Than Inventory (“ASU 2016-16”). ASU 2016-16 requires an entity to recognize the income tax consequences of an intra-entity transfer of an asset other than inventory when the transfer occurs. ASU 2016-16 is effective for fiscal years, and interim periods within those fiscal years, beginning after December 15, 2017. Early adoption is permitted. The Company is still evaluating the effect of adopting ASU 2016-16.
In August 2016, the FASB issued ASU 2016-15, Statement of Cash Flows (Topic 230): Classification of Certain Cash Receipts and Cash Payments (“ASU 2016-15”). ASU 2016-15 provides guidance on how certain cash receipts and cash payments should be presented and classified in the statement of cash flows with the objective of reducing existing diversity in practice with respect to these items. ASU 2016-15 is effective for annual periods, and interim periods within those years, beginning after December 15, 2017. Early adoption is permitted. This standard will not have a material impact on the Company’s consolidated results of operations or financial position.
In March 2016, the FASB issued ASU 2016-09, Compensation - Stock Compensation (Topic 718): Improvements to Employee Share-Based Payment Accounting (“ASU 2016-09”). ASU 2016-09 is intended to simplify several areas of accounting for share-based compensation arrangements, including the income tax impact, classification on the statement of cash flows and forfeitures. ASU 2016-09 is effective for the Company beginning January 1, 2017. The Company is still evaluating the effect of adopting ASU 2016-09, but the adoption may create volatility in the Company's effective tax rate. Upon adoption, all tax-related cash flows resulting from share-based payments will be reported as operating activities on the statements of cash flows, a change from the current presentation of presenting tax benefits as an inflow from financing activities and an outflow from operating activities. The Company plans to continue applying expected forfeiture rates to estimate expected forfeitures.
In March 2016, the FASB issued ASU 2016-04, Liabilities—Extinguishments of Liabilities (Subtopic 405-20)- Recognition of Breakage for Certain Prepaid Stored-Value Products (“ASU 2016-04”). ASU 2016-04 entitles a company to derecognize amounts related to expected breakage to the extent that it is probable a significant reversal of the recognized breakage amount will not subsequently occur. ASU 2016-04 is effective for annual periods, and interim periods within those years, beginning after December 15, 2017. Early adoption is permitted. The Company is still evaluating the effect of adopting ASU 2016-04.
In February 2016, the FASB issued ASU 2016-02, Leases (Topic 842): Amendments to the FASB Accounting Standards Codification® (“ASU 2016-02”), which supersedes the existing guidance for lease accounting, Leases (Topic 840). ASU 2016-02 requires lessees to recognize leases on their balance sheets, and modifies accounting, presentation and disclosure for both lessors and lessees. ASU 2016-02 requires a modified retrospective approach for all leases existing at, or entered into after, the date of initial application, with an option to elect to use certain transition relief. ASU 2016-02 is effective for annual periods, and interim periods within those years, beginning after December 15, 2018. Early adoption is permitted. Many of the Company’s leases are considered operating leases and are not capitalized under ASC 840. Under ASC 842 the majority of these leases will qualify for capitalization and will result in the recognition of lease assets and lease liabilities once the new standard is adopted. The Company is in the process of reviewing lease contracts to determine the impact of adopting ASU 2016-02.
In July 2015, the FASB issued ASU 2015-11, Inventory (Topic 330): Simplifying the Measurement of Inventory (“ASU 2015-11”). ASU 2015-11 affects reporting entities that measure inventory using first-in, first-out or average cost. Specifically, ASU 2015-11 requires that inventory be measured at the lower of cost and net realizable value. Net realizable value is the estimated selling prices in the ordinary course of business, less reasonably predictable costs of completion, disposal, and transportation. ASU 2015-11 is effective for the Company beginning January 1, 2017. This standard will not have a material impact on the Company’s consolidated results of operations or financial position.
In May 2014, the FASB issued ASU 2014-09, Revenue from Contracts with Customers (Topic 606) (“ASU 2014-09”). ASU 2014-09 affects any entity that either enters into contracts with customers to transfer goods or services or enters into contracts for the transfer of nonfinancial assets, unless those contracts are within the scope of other standards (for example, insurance contracts or lease contracts). The core principle of the guidance is that an entity should recognize revenue to depict the transfer of promised goods or services to customers in an amount that reflects the consideration to which the entity expects to be entitled in exchange for those goods or services. In August 2015, the FASB issued ASU 2015-14, Revenue from Contracts with Customers (Topic 606): Deferral of the Effective Date (“ASU 2015-14”), deferring the effective date of ASU 2014-09. The
66
new revenue standard is effective for fiscal years, and interim periods within those years, beginning after December 15, 2017 and allows either a full retrospective adoption to all periods presented or a modified retrospective adoption approach with the cumulative effect of initial application of the revised guidance recognized at the date of initial application. In March 2016, the FASB issued ASU 2016-08, Revenue from Contracts with Customers (Topic 606): Principal versus Agent Considerations (Reporting Revenue Gross versus Net) (“ASU 2016-08”). ASU 2016-08 is intended to improve the operability and understandability of the implementation guidance on principal versus agent considerations. In April 2016, the FASB issued ASU 2016-10, Revenue from Contracts with Customers (Topic 606): Identifying Performance Obligations and Licensing (“ASU 2016-10”). ASU 2016-10 clarifies the implementation guidance on identifying performance obligations. Early adoption is permitted for periods beginning after December 15, 2016. In May 2016, the FASB issued ASU 2016-12, Revenue from Contracts with Customers (Topic 606): Narrow-Scope Improvements and Practical Expedients (“ASU 2016-12”). ASU 2016-12 clarifies three aspects of Topic 606, including the objective of the collectability criterion, the measurement date for noncash consideration and the requirements for a completed contract. ASU 2016-12 also includes a practical expedient for contract modifications. Additionally, the amendments allow an entity to exclude all sales taxes collected from customers from the transaction price. In December 2016, the FASB issued ASU 2016-20, Technical Corrections and Improvements to Topic 606, Revenue from Contracts with Customers ("ASU 2016-20"). ASU 2016-20 makes minor corrections or minor improvements to ASU 2014-09. The Company expects to identify similar performance obligations under ASC 606 as compared to current guidance under ASC 605. As a result, the Company expects the timing of revenue recognition to remain substantially unchanged.
Recently Adopted Accounting Standards
In accordance with U.S. GAAP, the following provisions, which had no material impact on the Company's financial position, results of operations or cash flows, were adopted effective fiscal year 2016:
• | ASU 2015-02, Consolidation (Topic 810): Amendments to the Consolidation Analysis; |
• | ASU 2014-15, Presentation of Financial Statements-Going Concern (Subtopic 205-40): Disclosure of Uncertainties about an Entity’s Ability to Continue as a Going Concern; and |
• | ASU 2014-12, Accounting for Share-Based Payments When the Terms of an Award Provide That a Performance Target Could Be Achieved after the Requisite Service Period. |
2. Acquisitions, Divestiture and Goodwill
Skagen Designs, Ltd. Acquisition. On April 2, 2012, the Company acquired Skagen Designs, Ltd. and certain of its international affiliates ("Skagen Designs"). The purchase price was $231.7 million in cash and 150,000 shares of the Company's common stock valued at $19.9 million. In addition, subject to the purchase agreement, the sellers could receive up to 100,000 additional shares of the Company's common stock if the Company's net sales of SKAGEN branded products exceed certain thresholds over a defined period of time (the "Earnout"). The Company recorded the Earnout as a $9.9 million contingent consideration liability in accrued expenses—other in the Company's consolidated balance sheets as of the acquisition date. The Earnout criteria was not met and the contingent consideration liability was remeasured to zero in fiscal year 2012.
During the fourth quarter of fiscal year 2014, the Company's arbitration proceedings with Skagen Designs resulted in a $6.0 million reduction of the original purchase amount. The Company recognized the amount in other income (expense) - net in the Company's consolidated statements of income and comprehensive income for the fiscal year 2014.
Fossil Spain Acquisition. On August 10, 2012, the Company’s joint venture company, Fossil, S.L. (“Fossil Spain”), entered into a Framework Agreement (the “Framework Agreement”) with several related and unrelated parties, including General De Relojeria, S.A. (“General De Relojeria”), the Company’s joint venture partner. Pursuant to the Framework Agreement, Fossil Spain was granted the right to acquire the outstanding 50% of its shares owned by General De Relojeria upon the expiration of the joint venture agreement on December 31, 2015. As of January 1, 2013, pursuant to the Framework Agreement, the Company assumed control over the board of directors and the day-to-day management of Fossil Spain, and began consolidating Fossil Spain, instead of treating it as an equity method investment. The Company completed the acquisition of these shares in the second quarter of fiscal year 2016, at which time Fossil Spain became a wholly-owned subsidiary of the Company. During the second quarter of fiscal year 2016, the fixed and previously remaining variable
67
components of the purchase price were settled in the amounts of 4.3 million euros (approximately $4.8 million as of the settlement date) and 3.5 million euros (approximately $3.9 million as of the settlement date), respectively.
Misfit, Inc. Acquisition. On December 22, 2015, the Company acquired Misfit, Inc. ("Misfit"), an innovator and distributor of wearable technology and stylish connected devices. Misfit was a U.S.-based, privately held company. The primary purpose of the acquisition was to acquire a scalable technology platform that can be integrated across the Company's multi-brand portfolio, a native wearable technology brand and a pipeline of innovative products. Misfit’s position in the wearable technology space combined with their software and hardware engineering teams enabled the Company to expand its addressable market with new distribution channels, products, brands and enterprise partnerships.
The purchase price was $215.4 million in cash, net of cash acquired and subject to working capital adjustments, and $1.7 million in replacement awards attributable to precombination service. At closing, $12.5 million of the cash payment was placed into an escrow fund for the Company for working capital adjustments and indemnification obligations of the seller incurred within 12 months from the closing date. The Company received $3.3 million from the escrow during fiscal year 2016 for claims incurred and as a working capital settlement and has recorded a receivable for additional claims incurred. To fund the cash purchase price, the Company utilized cash on hand and approximately $60 million of availability under its $1.05 billion revolving line of credit. The results of Misfit's operations have been included in the Company’s consolidated financial statements since December 22, 2015.
Assets acquired and liabilities assumed in the transaction were recorded at their acquisition date fair values, while transaction costs of $8.4 million associated with the acquisition were expensed as incurred during the fourth quarter of fiscal year 2015. Because the total purchase price exceeded the fair values of the tangible and intangible assets acquired, goodwill was recorded equal to the difference. The element of goodwill that is not separable into identifiable intangible assets represents expected synergies. The following table summarizes the allocation of the purchase price to the preliminary estimated fair value of the assets acquired and the liabilities assumed as of December 22, 2015, the effective date of the acquisition (in thousands):
Cash paid, net of cash acquired | $ | 215,370 | ||
Replacement awards attributable to precombination service | 1,709 | |||
Working capital and other adjustments | (7,920 | ) | ||
Total transaction consideration | $ | 209,159 | ||
Inventories | 7,011 | |||
Prepaid expenses and other current assets | 25 | |||
Property, plant and equipment and other long-term assets | 1,237 | |||
Goodwill | 162,234 | |||
Amortizing Intangibles: | Useful Lives | |||
Trade name | 6 yrs. | 15,700 | ||
Customer lists | 5 yrs. | 10,800 | ||
Developed technology | 7 yrs. | 36,100 | ||
Noncompete agreements | 3 yrs. | 700 | ||
Current liabilities | (17,019 | ) | ||
Long-term liabilities | (7,629 | ) | ||
Total net assets acquired | $ | 209,159 | ||
Purchase accounting adjustments during fiscal year 2016 include a $7.9 million reduction to total transaction consideration, $5.9 million reduction to inventories, $5.4 million reduction to long-term liabilities, $4.1 million increase to current liabilities, $2.2 million decrease to goodwill, $1.2 million reduction to accounts receivable and a $47,000 increase to
68
property, plant and equipment and other long-term assets. The goodwill recognized from the acquisition has an indefinite useful life and was included in the Company’s annual impairment testing.
Divestiture. On December 30, 2016, the Company completed the sale of its machine vision operations, a part of Misfit. In connection with the transaction, the Company received a cash payment of $3.5 million and recognized a corresponding pre-tax gain in other income (expense) - net, in the consolidated statements of income and comprehensive income. Additionally, another $3.5 million was placed into escrow and may be released to the Company upon the one and two year anniversary of the closing date, if certain conditions are met.
Goodwill. The changes in the carrying amount of goodwill were as follows (in thousands):
Americas | Europe | Asia | Total | ||||||||||||
Balance at January 3, 2015 | $ | 119,438 | $ | 66,433 | $ | 11,857 | $ | 197,728 | |||||||
Acquisitions | 164,405 | 4,487 | — | 168,892 | |||||||||||
Foreign currency changes | (245 | ) | (6,939 | ) | (42 | ) | (7,226 | ) | |||||||
Balance at January 2, 2016 | $ | 283,598 | $ | 63,981 | $ | 11,815 | $ | 359,394 | |||||||
Segment allocation and acquisition adjustments (1) | (81,166 | ) | 48,046 | 30,949 | (2,171 | ) | |||||||||
Foreign currency changes | (245 | ) | (1,736 | ) | 21 | (1,960 | ) | ||||||||
Balance at December 31, 2016 | $ | 202,187 | $ | 110,291 | $ | 42,785 | $ | 355,263 | |||||||
___________________________________________
(1) All goodwill resulting from the Misfit acquisition was recorded in the Americas segment as of January 2, 2016, on a preliminary basis. This line item includes an allocation of the goodwill across reporting segments and also purchase accounting adjustments made during fiscal year 2016.
69
3. Inventories
Inventories consisted of the following (in thousands):
At Fiscal Year End | 2016 | 2015 | |||||
Components and parts | $ | 49,438 | $ | 49,539 | |||
Work-in-process | 12,345 | 12,213 | |||||
Finished goods | 480,704 | 563,592 | |||||
Inventories | $ | 542,487 | $ | 625,344 | |||
4. Warranty Liabilities
The Company's warranty liabilities are primarily related to watch products and are included in accrued expenses—other in the consolidated balance sheets. The Company's watch products are covered by limited warranties against defects in materials or workmanship. Historically, the Company's FOSSIL® and RELIC® watch products sold in the U.S. have been covered for warranty periods of 11 years and 12 years, respectively, and SKAGEN brand watches have been covered by a lifetime warranty. Beginning in 2017, these brands will be covered by a two year warranty. Generally, all other products sold in the U.S. and internationally are covered by a comparable one to two year warranty. The Company's warranty liability is estimated using historical warranty repair expense. As changes in warranty costs are experienced, the warranty accrual is adjusted as necessary. Warranty liability activity consisted of the following (in thousands):
Fiscal Year | 2016 | 2015 | 2014 | ||||||||
Beginning balance | $ | 13,669 | $ | 13,500 | $ | 15,658 | |||||
Settlements in cash or kind | (9,616 | ) | (9,310 | ) | (12,313 | ) | |||||
Warranties issued and adjustments to preexisting warranties(1) | 11,368 | 9,435 | 10,155 | ||||||||
Liabilities assumed in acquisition | — | 44 | — | ||||||||
Ending balance | $ | 15,421 | $ | 13,669 | $ | 13,500 | |||||
____________________________________________
(1) | Changes in cost estimates related to preexisting warranties are aggregated with accruals for new standard warranties issued and foreign currency changes. |
5. Prepaid Expenses and Other Current Assets
Prepaid expenses and other current assets consisted of the following (in thousands):
At Fiscal Year End | 2016 | 2015 | |||||
Prepaid royalties | $ | 26,298 | $ | 30,776 | |||
Prepaid taxes and tax receivables | 43,102 | 36,889 | |||||
Other receivables | 12,396 | 50,374 | |||||
Forward contracts | 23,288 | 13,351 | |||||
Prepaid rent | 9,875 | 10,909 | |||||
Short term deposits | 2,363 | — | |||||
Other | 14,631 | 14,991 | |||||
Prepaid expenses and other current assets | $ | 131,953 | $ | 157,290 | |||
70
6. Property, Plant and Equipment
Property, plant and equipment—net consisted of the following (in thousands):
At Fiscal Year End | 2016 | 2015 | |||||
Land | $ | 7,795 | $ | 13,710 | |||
Buildings | 39,031 | 67,205 | |||||
Machinery and equipment | 38,756 | 38,455 | |||||
Furniture and fixtures | 112,145 | 111,740 | |||||
Computer equipment and software | 241,160 | 227,988 | |||||
Leasehold improvements | 233,566 | 237,761 | |||||
Construction in progress | 16,159 | 27,579 | |||||
688,612 | 724,438 | ||||||
Less accumulated depreciation and amortization | 414,761 | 398,068 | |||||
Property, plant and equipment-net | $ | 273,851 | $ | 326,370 | |||
7. Intangible and Other Assets
Intangible and other assets-net consisted of the following (in thousands):
2016 | 2015 | ||||||||||||||||
At Fiscal Year End | Useful Lives | Gross Amount | Accumulated Amortization | Gross Amount | Accumulated Amortization | ||||||||||||
Intangibles-subject to amortization: | |||||||||||||||||
Trademarks | 10 yrs. | $ | 4,310 | $ | 3,443 | $ | 4,175 | $ | 3,195 | ||||||||
Customer lists | 5 - 10 yrs. | 53,625 | 26,986 | 53,825 | 21,001 | ||||||||||||
Patents | 3 - 20 yrs. | 2,325 | 2,099 | 2,273 | 2,064 | ||||||||||||
Noncompete agreement | 3 - 6 yrs. | 2,505 | 1,662 | 2,515 | 1,134 | ||||||||||||
Developed technology | 7 yrs. | 36,100 | 5,157 | 36,100 | — | ||||||||||||
Trade name | 6 yrs. | 15,700 | 2,617 | 15,700 | — | ||||||||||||
Other | 7 - 20 yrs. | 253 | 215 | 256 | 206 | ||||||||||||
Total intangibles-subject to amortization | 114,818 | 42,179 | 114,844 | 27,600 | |||||||||||||
Intangibles-not subject to amortization: | |||||||||||||||||
Trade names | 74,485 | 74,493 | |||||||||||||||
Other assets: | |||||||||||||||||
Key money deposits | 26,948 | 22,038 | 29,357 | 19,805 | |||||||||||||
Other deposits | 19,344 | 21,684 | |||||||||||||||
Deferred compensation plan assets | 2,385 | 2,406 | |||||||||||||||
Deferred tax asset-net | 23,061 | 18,602 | |||||||||||||||
Restricted cash | 500 | 512 | |||||||||||||||
Shop-in-shop | 8,807 | 8,019 | 9,985 | 8,262 | |||||||||||||
Interest rate swap | 73 | 311 | |||||||||||||||
Forward contracts | 5,648 | 2,785 | |||||||||||||||
Investments | 2,078 | 2,396 | |||||||||||||||
Other | 4,582 | 5,519 | |||||||||||||||
Total other assets | 93,426 | 30,057 | 93,557 | 28,067 | |||||||||||||
Total intangible and other assets | $ | 282,729 | $ | 72,236 | $ | 282,894 | $ | 55,667 | |||||||||
Total intangible and other assets-net | $ | 210,493 | $ | 227,227 | |||||||||||||
71
Key money is the amount of funds paid to a landlord or tenant to acquire the rights of tenancy under a commercial property lease for a certain property. Key money represents the "right to lease" with an automatic right of renewal. This right can be subsequently sold by the Company or can be recovered should the landlord refuse to allow the automatic right of renewal to be exercised. Key money is amortized over the initial lease term, which ranges from approximately four to 18 years.
Amortization expense for intangible assets was approximately $15.0 million, $4.9 million and $5.1 million for fiscal years 2016, 2015 and 2014, respectively. Estimated aggregate future amortization expense by fiscal year for intangible assets is as follows (in thousands):
Fiscal Year | Amortization Expense | ||
2017 | $ | 14,696 | |
2018 | 14,343 | ||
2019 | 14,015 | ||
2020 | 13,531 | ||
2021 | 9,714 | ||
8. Derivatives and Risk Management
Cash Flow Hedges. The primary risks managed by using derivative instruments are the fluctuations in global currencies that will ultimately be used by non-U.S. dollar functional currency subsidiaries to settle future payments of intercompany inventory transactions denominated in U.S. dollars. Specifically, the Company projects future intercompany purchases by its non-U.S. dollar functional currency subsidiaries generally over a period of up to 24 months. The Company enters into forward contracts generally for up to 85% of the forecasted purchases to manage fluctuations in global currencies that will ultimately be used to settle such U.S. dollar denominated inventory purchases. Additionally, during the first quarter of fiscal year 2016, the Company entered into forward contracts to manage fluctuations in Japanese yen exchange rates that will be used to settle future third-party inventory component purchases by a U.S. dollar functional currency subsidiary. Forward contracts represent agreements to exchange the currency of one country for the currency of another country at an agreed-upon settlement date and exchange rate. These forward contracts are designated as single cash flow hedges. Fluctuations in exchange rates will either increase or decrease the Company's U.S. dollar equivalent cash flows from these inventory transactions, which will affect the Company's U.S. dollar earnings. Gains or losses on the forward contracts are expected to offset these fluctuations to the extent the cash flows are hedged by the forward contracts.
These forward contracts meet the criteria for hedge accounting, which requires that they represent foreign-currency-denominated forecasted transactions in which (i) the operating unit that has the foreign currency exposure is a party to the hedging instrument and (ii) the hedged transaction is denominated in a currency other than the hedging unit's functional currency.
At the inception of each forward contract designated as a cash flow hedge, the hedging relationship is expected to be highly effective in achieving offsetting cash flows attributable to the hedged risk. The Company assesses hedge effectiveness under the critical terms matched method at inception and at least quarterly throughout the life of the hedging relationship. If the critical terms (i.e., amounts, currencies and settlement dates) of the forward contract match the terms of the forecasted transaction, the Company concludes that the hedge is effective.
For a derivative instrument that is designated and qualifies as a cash flow hedge, the effective portion of the gain or loss on the derivative is reported as a component of other comprehensive income (loss), net of taxes and reclassified into earnings in the same period or periods during which the hedged transaction affects earnings. Gains and losses on the derivative representing either hedge ineffectiveness or hedge components excluded from the assessment of effectiveness are recognized in current earnings. Due to the high degree of effectiveness between the hedging instruments and the underlying exposures being hedged, the Company's hedges resulted in no ineffectiveness in its consolidated statements of income and comprehensive income, and there were no components excluded from the assessment of hedge effectiveness for fiscal years 2016, 2015 and 2014.
All derivative instruments are recognized as either assets or liabilities at fair value in the consolidated balance sheets. Derivatives designated as cash flow hedges are recorded at fair value at each balance sheet date and the change in fair value is recorded to accumulated other comprehensive income (loss) within the equity section of the Company's consolidated balance
72
sheet until such derivative's gains or losses become realized or the cash flow hedge relationship is terminated. If the cash flow hedge relationship is terminated, the derivative's gains or losses that are recorded in accumulated other comprehensive income (loss) will be recognized in earnings when the hedged cash flows occur. However, for cash flow hedges that are terminated because the forecasted transaction is not expected to occur in the original specified time period, the derivative's gains or losses are immediately recognized in earnings. There were no gains or losses reclassified into earnings as a result of the discontinuance of cash flow hedges for fiscal years 2016, 2015 and 2014. Hedge accounting is discontinued if it is determined that the derivative is not highly effective. The Company records all forward contract hedge assets and liabilities on a gross basis as they do not meet the balance sheet netting criteria because the Company does not have master netting agreements established with the derivative counterparties that would allow for net settlement.
As of December 31, 2016, the Company had the following outstanding forward contracts designated as cash flow hedges that were entered into to hedge the future payments of intercompany inventory transactions (in millions):
Functional Currency | Contract Currency | |||||||
Type | Amount | Type | Amount | |||||
Euro | 264.4 | U.S. dollar | 296.8 | |||||
British pound | 53.3 | U.S. dollar | 74.8 | |||||
Canadian dollar | 86.9 | U.S. dollar | 66.0 | |||||
Japanese yen | 4,554.3 | U.S. dollar | 41.3 | |||||
Mexican peso | 442.9 | U.S. dollar | 22.6 | |||||
Australian dollar | 20.5 | U.S. dollar | 15.4 | |||||
U.S. dollar | 33.4 | Japanese Yen | 3,415.0 | |||||
The Company is also exposed to interest rate risk related to its outstanding debt. To manage the interest rate risk related to its U.S.-based term loan (as amended and restated on March 9, 2015, the "Term Loan"), the Company entered into an interest rate swap agreement on July 26, 2013 with a term of approximately five years. The objective of this hedge is to offset the variability of future payments associated with interest rates on the Term Loan. The interest rate swap agreement hedges the 1-month London Interbank Offer Rate ("LIBOR") based variable rate debt obligations under the Term Loan. Under the terms of the swap, the Company pays a fixed interest rate of 1.288% per annum to the swap counterparty plus the LIBOR rate applicable margin (which varies based upon the Company’s consolidated leverage ratio (the “Ratio”) from 1.50% if the Ratio is less than 1.00 to 1.00, to 2.75% if the Ratio is greater than or equal to 3.00 to 1.00). The notional amount amortizes over the remaining life of the Term Loan to coincide with repayments on the underlying loan. The Company receives interest from the swap counterparty at a variable rate based on 1-month LIBOR. This hedge is designated as a cash flow hedge.
Net Investment Hedges. The Company is also exposed to risk that adverse changes in foreign currency exchange rates could impact its net investment in foreign operations. During the first quarter of fiscal year 2016, the Company entered into a forward contract designated as a net investment hedge to reduce exposure to changes in currency exchange rates on 45.0 million euros of its total investment in a wholly-owned, euro-denominated foreign subsidiary. The hedge was settled during the second quarter of fiscal year 2016 resulting in a net gain of $0.5 million net of taxes that was recognized in the currency translation component of accumulated other comprehensive income (loss).
73
Non-designated Hedges. The Company also periodically enters into forward contracts to manage exchange rate risks associated with certain intercompany transactions and for which the Company does not elect hedge accounting treatment. As of December 31, 2016, the Company had non-designated forward contracts of approximately $1.2 million on 15.9 million rand associated with a South African rand-denominated foreign subsidiary. Changes in the fair value of derivatives not designated as hedging instruments are recognized in earnings when they occur.
The effective portion of gains and losses on cash flow hedges that were recognized in other comprehensive income (loss), net of taxes during fiscal years 2016, 2015 and 2014 are set forth below (in thousands):
For the Fiscal Year Ended December 31, 2016 | For the Fiscal Year Ended January 2, 2016 | For the Fiscal Year Ended January 3, 2015 | |||||||||
Cash flow hedges: | |||||||||||
Forward contracts | $ | 13,565 | $ | 22,763 | $ | 22,927 | |||||
Interest rate swaps | (730 | ) | 1,544 | (2,159 | ) | ||||||
Total gain (loss) recognized in other comprehensive income (loss), net of taxes | $ | 12,835 | $ | 24,307 | $ | 20,768 | |||||
The following table illustrates the effective portion of gains and losses on derivative instruments recorded in other comprehensive income (loss), net of taxes during the term of the hedging relationship and reclassified into earnings, and gains and losses on derivatives not designated as hedging instruments recorded directly to earnings during fiscal years 2016, 2015 and 2014 (in thousands):
Derivative Instruments | Consolidated Statements of Income and Comprehensive Income Location | Effect of Derivative Instruments | For the Fiscal Year Ended December 31, 2016 | For the Fiscal Year Ended January 2, 2016 | For the Fiscal Year Ended January 3, 2015 | |||||||||||
Forward contracts designated as cash flow hedging instruments | Other income (expense)-net | Total gain (loss) reclassified from other comprehensive income (loss) | $ | 10,986 | $ | 29,629 | $ | 5,856 | ||||||||
Forward contracts not designated as hedging instruments | Other income (expense)-net | Total gain (loss) recognized in income | $ | (82 | ) | $ | (210 | ) | $ | (148 | ) | |||||
Interest rate swap designated as a cash flow hedging instrument | Interest expense | Total gain (loss) reclassified from other comprehensive income (loss) | $ | (1,080 | ) | $ | (1,596 | ) | $ | (1,763 | ) | |||||
Interest rate swap designated as a cash flow hedging instrument | Other income (expense)-net | Total gain (loss) reclassified from other comprehensive income (loss) | $ | — | $ | 3,331 | $ | — | ||||||||
The following table discloses the fair value amounts for the Company's derivative instruments as separate asset and liability values, presents the fair value of derivative instruments on a gross basis, and identifies the line items in the consolidated balance sheets in which the fair value amounts for these categories of derivative instruments are included (in thousands):
74
Asset Derivatives | Liability Derivatives | ||||||||||||||||||||||
December 31, 2016 | January 2, 2016 | December 31, 2016 | January 2, 2016 | ||||||||||||||||||||
Consolidated Balance Sheets Location | Fair Value | Consolidated Balance Sheets Location | Fair Value | Consolidated Balance Sheets Location | Fair Value | Consolidated Balance Sheets Location | Fair Value | ||||||||||||||||
Forward contracts designated as cash flow hedging instruments | Prepaid expenses and other current assets | $ | 23,288 | Prepaid expenses and other current assets | $ | 13,184 | Accrued expenses-other | $ | 4,696 | Accrued expenses-other | $ | 477 | |||||||||||
Forward contracts not designated as cash flow hedging instruments | Prepaid expenses and other current assets | — | Prepaid expenses and other current assets | 167 | Accrued expenses-other | 2 | Accrued expenses-other | 71 | |||||||||||||||
Interest rate swap designated as a cash flow hedging instrument | Prepaid expenses and other current assets | — | Prepaid expenses and other current assets | — | Accrued expenses-other | 613 | Accrued expenses-other | 1,273 | |||||||||||||||
Forward contracts designated as cash flow hedging instruments | Intangible and other assets-net | 5,648 | Intangible and other assets-net | 2,785 | Other long-term liabilities | 268 | Other long-term liabilities | 250 | |||||||||||||||
Interest rate swap designated as a cash flow hedging instrument | Intangible and other assets-net | 73 | Intangible and other assets-net | 311 | Other long-term liabilities | — | Other long-term liabilities | 128 | |||||||||||||||
Total | $ | 29,009 | $ | 16,447 | $ | 5,579 | $ | 2,199 | |||||||||||||||
At the end of fiscal year 2016, the Company had forward contracts designated as cash flow hedges with maturities extending through December 2018. As of December 31, 2016, an estimated net gain of $11.5 million is expected to be reclassified into earnings within the next twelve months at prevailing foreign currency exchange rates. See Note 1—Significant Accounting Policies for additional disclosures on foreign currency hedging instruments.
9. Fair Value Measurements
The Company defines fair value as the price that would be received to sell an asset or paid to transfer a liability in the principal or most advantageous market for the asset or liability in an orderly transaction between market participants at the measurement date.
ASC 820, Fair Value Measurement and Disclosures ("ASC 820"), establishes a fair value hierarchy, which prioritizes the inputs used in measuring fair value into three broad levels as follows:
• | Level 1—Quoted prices in active markets for identical assets or liabilities. |
• | Level 2—Inputs, other than quoted prices in active markets, that are observable either directly or indirectly. |
• | Level 3—Unobservable inputs based on the Company's assumptions. |
ASC 820 requires the use of observable market data if such data is available without undue cost and effort.
75
The following table presents the fair value hierarchy for those assets and liabilities measured at fair value on a recurring basis as of December 31, 2016 (in thousands):
Fair Value at December 31, 2016 | |||||||||||||||
Level 1 | Level 2 | Level 3 | Total | ||||||||||||
Assets: | |||||||||||||||
Forward contracts | $ | — | $ | 28,936 | $ | — | $ | 28,936 | |||||||
Deferred compensation plan assets: | |||||||||||||||
Investment in publicly traded mutual funds | 2,385 | — | — | 2,385 | |||||||||||
Interest rate swap | — | 73 | — | 73 | |||||||||||
Total | $ | 2,385 | $ | 29,009 | $ | — | $ | 31,394 | |||||||
Liabilities: | |||||||||||||||
Forward contracts | — | 4,966 | — | 4,966 | |||||||||||
Interest rate swap | — | 613 | — | 613 | |||||||||||
Total | $ | — | $ | 5,579 | $ | — | $ | 5,579 | |||||||
The following table presents the fair value hierarchy for those assets and liabilities measured at fair value on a recurring basis as of January 2, 2016 (in thousands):
Fair Value at January 2, 2016 | |||||||||||||||
Level 1 | Level 2 | Level 3 | Total | ||||||||||||
Assets: | |||||||||||||||
Forward contracts | $ | — | $ | 16,136 | $ | — | $ | 16,136 | |||||||
Deferred compensation plan assets: | |||||||||||||||
Investment in publicly traded mutual funds | 2,406 | — | — | 2,406 | |||||||||||
Interest rate swaps | — | 311 | — | 311 | |||||||||||
Total | $ | 2,406 | $ | 16,447 | $ | — | $ | 18,853 | |||||||
Liabilities: | |||||||||||||||
Contingent consideration | $ | — | $ | — | $ | 3,643 | $ | 3,643 | |||||||
Forward contracts | — | 798 | — | 798 | |||||||||||
Interest rate swaps | — | 1,401 | — | 1,401 | |||||||||||
Total | $ | — | $ | 2,199 | $ | 3,643 | $ | 5,842 | |||||||
The fair values of the Company's deferred compensation plan assets are based on quoted prices. The deferred compensation plan assets are recorded in intangible and other assets—net in the Company's consolidated balance sheets. The fair values of the Company's forward contracts are based on published quotations of spot currency rates and forward points, which are converted into implied forward currency rates.
The Company estimates the fair value of its debt using Level 2 inputs, such as interest rates, related terms and maturities. The fair value of the Company's debt approximated its carrying amount as of December 31, 2016 and January 2, 2016.
The fair values of the interest rate swap asset and liability are determined using valuation models based on market observable inputs, including forward curves, mid-market price, foreign exchange spot or forward rates and volatility levels. See Note 8—Derivatives and Risk Management for additional disclosures about the interest rate swap.
Property, plant and equipment—net with a carrying amount of $15.0 million related to retail store leasehold improvements and fixturing was written down to a fair value of $0.7 million, and related key money in the amount of $2.0 million was deemed not recoverable, resulting in total impairment charges of $16.3 million for fiscal year 2016.
76
The fair values of assets related to Company-owned retail stores were determined using Level 3 inputs. Of the $16.3 million impairment expense, $11.0 million, $1.8 million and $0.7 million were recorded in restructuring charges in the Americas, Europe and Asia segments, respectively, and $2.5 million and $0.3 million were recorded in SG&A in the Europe and Americas segments, respectively.
In fiscal year 2015, property, plant and equipment—net with a carrying amount of $11.6 million related to retail store leasehold improvements and fixturing was written down to a fair value of $0.6 million, and related key money in the amount of $0.1 million was deemed not recoverable, resulting in total impairment charges of $11.1 million for fiscal year 2015.
In fiscal year 2015, the SKAGEN trade name with a carrying amount of $64.7 million was written down to its implied fair value of $55.6 million, resulting in an impairment charge of $9.1 million. The fair value of the asset was estimated using discounted cash flow methodologies. Changes in foreign currency exchange rates and fewer planned store openings negatively impacted future expected cash flows compared to original valuation assumptions. The impairment charge was recorded in SG&A in the Corporate cost area.
10. Debt
The Company's debt consisted of the following, excluding capital lease obligations, (in millions):
December 31, 2016 | January 2, 2016 | ||||||
U.S. revolving line of credit | $ | 441.0 | $ | 589.0 | |||
U.S. term loan (1) | 189.9 | 212.6 | |||||
Total debt | 630.9 | 801.6 | |||||
Less current portion | 25.0 | 21.9 | |||||
Long-term debt | $ | 605.9 | $ | 779.7 | |||
___________________________________________
(1) | Net of debt issuance costs of $3.8 million and $3.0 million at December 31, 2016 and January 2, 2016, respectively. |
U.S.-Based. On March 9, 2015, the Company entered into an Amended and Restated Credit Agreement (the “Credit Agreement”). The Credit Agreement provides for (i) revolving credit loans in the amount of $1.05 billion (the “Revolving Credit Facility”), with an up to $20.0 million subfacility for swingline loans (the “Swingline Loan”), and an up to $10.0 million subfacility for letters of credit, and (ii) the Term Loan in the amount of $231.3 million. The Credit Agreement expires and is due and payable on May 17, 2018. The Credit Agreement amended and restated that certain credit agreement, dated as of May 17, 2013, as amended (the “Prior Agreement”).
On August 8, 2016, the Company entered into the First Amendment to the Credit Agreement (the "First Amendment"). The First Amendment adds two new levels to the applicable margin pricing grid used to calculate the interest rate that is applicable to base rate loans and LIBOR rate loans under the Company’s Revolving Credit Facility and increases the applicable margin at each pricing level for LIBOR rate loans by 25 basis points and for base rate loans by 25 basis points. Additionally, the First Amendment provides for the net cash proceeds from certain debt issuances by the Company in excess of $25.0 million to be applied, first, to prepay the term loans under the Company’s Revolving Credit Facility and, for the excess, if any, to prepay the revolving credit loans under the Company’s Revolving Credit Facility with a corresponding reduction in the revolving credit commitment by the amount of such excess proceeds. The First Amendment also modifies the negative covenant on restricted payments set forth in the Revolving Credit Facility in such a manner as to prohibit the Company's ability to make open market repurchases of the Company's common stock. Furthermore, the First Amendment changes the consolidated total leverage ratio that the Company must comply with from 2.50:1.00 to 3.25:1.00. In connection with the First Amendment, the Company and certain of its material domestic subsidiaries entered into a Collateral Agreement in favor of Wells Fargo Bank, National Association, as administrative agent, pursuant to which the Company and such subsidiaries granted liens on all or substantially all of their assets in order to secure the Company’s obligations under the Credit Agreement and the other loan documents (the “Obligations”). Additionally, certain of the Company’s domestic subsidiaries entered into a Guaranty Agreement in favor of Wells Fargo Bank, National Association, as administrative agent, pursuant to which such subsidiaries guarantee the payment and performance of the Obligations.
77
Amounts outstanding under the Swingline Loan under the Credit Agreement or upon any drawing under a letter of credit bear interest at the base rate plus the applicable margin. Interest based upon the base rate is payable quarterly in arrears. Interest based upon the LIBOR rate is payable on the last day of the applicable interest period.
As of August 8, 2016, amounts outstanding under the Revolving Credit Facility and the Term Loan under the Credit Agreement bear interest, at the Company's option, at (i) the base rate (defined as the highest of (a) the prime rate publicly announced by Wells Fargo, (3.75% at fiscal year end 2016), (b) the federal funds rate plus 0.5% and (c) the London Interbank Offer Rate ("LIBOR") (0.69% at fiscal year end 2016) for an interest period of one month plus 1.0%) plus the base rate applicable margin (which varies, based upon the Company’s consolidated total leverage ratio, from 0.50% if the consolidated total leverage ratio is less than 1.00 to 1.00, to 1.75%, if the consolidated total leverage ratio is greater than or equal to 3.00 to 1.00) or (ii) the LIBOR rate (defined as the quotient obtained by dividing (a) LIBOR by (b) 1.00 minus the Eurodollar reserve percentage) plus the LIBOR rate applicable margin (which varies, based upon the consolidated total leverage ratio, from 1.50%, if the consolidated total leverage ratio is less than 1.00 to 1.00, to 2.75%, if the consolidated total leverage ratio is greater than or equal to 3.00 to 1.00). Amounts outstanding under the Swingline Loan under the Credit Agreement or upon any drawing under a letter of credit bear interest at the base rate plus the applicable margin. Interest based upon the base rate is payable quarterly in arrears. Interest based upon the LIBOR rate is payable on the last day of the applicable interest period. Financial covenants governing the Credit Agreement require the Company to maintain (i) a consolidated total leverage ratio no greater than 3.25 to 1.00 and (ii) a consolidated interest coverage ratio no less than 3.50 to 1.00.
The Company is required to pay a commitment fee on the unused amounts of the commitments under the Revolving Credit Facility under the Credit Agreement, payable quarterly in arrears, ranging from 0.20% to 0.45%, based on the consolidated total leverage ratio. In connection with any letter of credit, the Company is required to pay (i) a letter of credit commission, payable quarterly in arrears, in an amount equal to the daily amount available to be drawn under such letter of credit multiplied by the applicable margin with respect to revolving credit loans that are LIBOR rate loans, (ii) a fronting fee, payable quarterly in arrears, as set forth in the applicable letter of credit application or as otherwise separately agreed by the Company and the issuing lender and (iii) normal and customary costs and expenses incurred or charged by the issuing lender in issuing, effecting payment under, amending or otherwise administering the letter of credit.
Loans under the Credit Agreement may be prepaid, in whole or in part, at the option of the Company, in minimum principal amounts of (i) $2.0 million or increments of $1.0 million in excess thereof, with respect to a base rate loan under the Revolving Credit Facility, (ii) $5.0 million or increments of $1.0 million in excess thereof, with respect to a LIBOR rate loan under the Revolving Credit Facility, (iii) $5.0 million or increments of $1.0 million in excess thereof, with respect to the Term Loan and (iv) $0.1 million or increments of $0.1 million in excess thereof, with respect to a Swingline Loan. Loans under the Credit Agreement must be repaid with the net cash proceeds of certain asset sales or insurance and condemnation events. The Company may permanently reduce the revolving credit commitment at any time, in whole or in part, without premium or penalty, in a minimum aggregate principal amount of not less than $3.0 million or increments of $1.0 million in excess thereof.
The repayment obligation under the Credit Agreement can be accelerated upon the occurrence of an event of default, including the failure to pay principal or interest, a material inaccuracy of a representation or warranty, violation of covenants, cross-default, change in control, bankruptcy events, failure of a loan document provision, certain ERISA events and material judgments.
During fiscal year 2016, the Company made principal payments of $21.9 million under the Term Loan. Additionally, the Company had net principal payments of $148.0 million under the Revolving Credit Facility during fiscal year 2016. Borrowings under the Revolving Credit Facility were primarily used to fund capital expenditures, normal operating expenses and stock repurchases. Amounts available under the Revolving Credit Facility are reduced by any amounts outstanding under standby letters of credit. As of December 31, 2016, the Company had available borrowing capacity of approximately $303.9 million under the Revolving Credit Facility, which was favorably impacted by a $200.0 million international cash balance. The Company incurred approximately $6.7 million of interest expense under the Term Loan during fiscal year 2016, including the impact of the related interest rate swap. The Company incurred approximately $15.8 million of interest expense under the Revolving Credit Facility during fiscal year 2016.
78
The Company's debt as of December 31, 2016, excluding capital lease obligations, matures as follows (in millions):
Less than 1 Year | $ | 25.0 | |
Year 2 | 609.7 | ||
Year 3 | — | ||
Principal amounts repayable | 634.7 | ||
Debt issuance costs | (3.8 | ) | |
Total debt outstanding | $ | 630.9 | |
Letters of Credit. The Company's Letter of Credit Facility (the "LC Facility") allows for $80 million of commercial letters of credit. At the end of fiscal years 2016 and 2015, the Company had outstanding letters of credit under the LC Facility of approximately $54.3 million and $36.7 million, respectively. Letters of credit issued under the LC Facility are primarily used for the purchase of inventory.
Capital Lease Obligations. At the end of fiscal years 2016 and 2015, the Company had current capital lease obligations of $1.4 million and $1.3 million, respectively, and long-term capital lease obligations of $4.0 million and $5.4 million, respectively.
11. Other Income (Expense)—Net
Other income (expense)—net consisted of the following (in thousands):
Fiscal Year | 2016 | 2015 | 2014 | ||||||||
Interest income | $ | 2,156 | $ | 1,026 | $ | 799 | |||||
Gain on Skagen Designs arbitration settlement | — | — | 5,968 | ||||||||
Gain on interest rate swap settlement | — | 5,241 | — | ||||||||
Equity in losses of unconsolidated investment | (1,321 | ) | — | — | |||||||
Gain on machine vision divestiture | 3,500 | — | — | ||||||||
Currency gains | 8,729 | 32,611 | 20 | ||||||||
Other net gains | 992 | 1,565 | 653 | ||||||||
Other income (expense) - net | $ | 14,056 | $ | 40,443 | $ | 7,440 | |||||
79
12. Taxes
Income Taxes. Deferred income taxes reflect the net tax effects of temporary differences between the carrying amounts of assets and liabilities for financial reporting purposes and the amounts used for income tax purposes. Significant components of the consolidated deferred tax assets and liabilities were (in thousands):
Fiscal Year | 2016 | 2015 | |||||
Deferred income tax assets (liabilities): | |||||||
Bad debt allowance | $ | 3,936 | $ | 5,390 | |||
Returns allowance | 5,464 | 8,187 | |||||
Inventory | 15,243 | 14,575 | |||||
Warranty liabilities | 3,244 | 2,922 | |||||
Compensation | 19,286 | 16,213 | |||||
Accrued liabilities | 7,276 | 7,079 | |||||
Deferred rent | 17,518 | 10,161 | |||||
Unrealized exchange gains (losses) | (6,498 | ) | (2,486 | ) | |||
State income tax and interest on tax contingencies | 2,808 | 2,976 | |||||
Fixed assets | (49,044 | ) | (52,782 | ) | |||
Trade names and customer lists | (26,166 | ) | (26,502 | ) | |||
Undistributed earnings of certain foreign subsidiaries | (53,761 | ) | (53,761 | ) | |||
Foreign accruals | 8,503 | 4,832 | |||||
Loss carryforwards | 20,898 | 13,501 | |||||
Tax credit carryforwards | 17,363 | — | |||||
Valuation allowance | (19,415 | ) | (10,857 | ) | |||
Other | 529 | 3,989 | |||||
Net deferred income tax assets (liabilities) | $ | (32,816 | ) | $ | (56,563 | ) | |
Total deferred income tax assets | $ | 23,061 | $ | 18,602 | |||
Total deferred income tax liabilities | (55,877 | ) | (75,165 | ) | |||
Net deferred income tax assets (liabilities) | $ | (32,816 | ) | $ | (56,563 | ) | |
Operating Loss Carryforwards. The balance sheet includes $18.7 million of net deferred tax assets for operating losses of foreign subsidiaries and $2.2 million of deferred tax assets for net operating losses from an acquired U.S. subsidiary. Valuation allowances have been recorded to reflect the estimated amount of deferred tax assets that may not be realized on these losses. The amounts and the fiscal year of expiration of the loss carryforwards are (in thousands):
Expires 2017 through 2021 | $ | 33,413 | |
Expires 2022 through 2026 | 8,911 | ||
Expires 2027 through 2031 | 2,403 | ||
Expires 2032 through 2036 | 42,358 | ||
Indefinite | 13,450 | ||
Total loss carryforwards | $ | 100,535 | |
80
The following table identifies income before income taxes for the Company's U.S. and non-U.S. based operations for the fiscal years indicated (in thousands):
Fiscal Year | 2016 | 2015 | 2014 | ||||||||
U.S | $ | (72,249 | ) | $ | 24,864 | $ | 169,079 | ||||
Non-U.S | 186,557 | 286,795 | 388,999 | ||||||||
Total | $ | 114,308 | $ | 311,659 | $ | 558,078 | |||||
The Company's provision for income taxes consisted of the following for the fiscal years indicated (in thousands):
Fiscal Year | 2016 | 2015 | 2014 | ||||||||
Current provision: | |||||||||||
U.S. federal | $ | 2,111 | $ | 10,666 | $ | 84,669 | |||||
Non-U.S | 53,880 | 72,336 | 74,190 | ||||||||
State and local | (1,482 | ) | 1,180 | 10,582 | |||||||
Total current | 54,509 | 84,182 | 169,441 | ||||||||
Deferred provision (benefit): | |||||||||||
U.S. federal | (20,216 | ) | 1,798 | 5,124 | |||||||
Non-U.S | (5,584 | ) | (4,511 | ) | (3,622 | ) | |||||
State and local | (4 | ) | 288 | 524 | |||||||
Total deferred | (25,804 | ) | (2,425 | ) | 2,026 | ||||||
Provision for income taxes | $ | 28,705 | $ | 81,757 | $ | 171,467 | |||||
The expected cash payments for current U.S. income tax expense for fiscal years 2016, 2015 and 2014 were reduced by approximately $3.3 million, $2.4 million and $4.7 million, respectively, as a result of tax deductions related to the exercise of non-qualified stock options and stock appreciation rights and the vesting of restricted stock and restricted stock units. The expected cash payments for current foreign tax expense for fiscal years 2016, 2015 and 2014 were reduced by $0.2 million, $0.3 million and $0.4 million, respectively, as a result of tax deductions related to the exercise of stock options and the vesting of restricted stock granted to foreign employees. The income tax benefits resulting from these stock-based compensation plans have been recorded to additional paid-in capital in the Company's consolidated balance sheets. Total deferred income tax expense (benefit) of $(25.8) million, $(2.4) million and $2.0 million for fiscal years 2016, 2015 and 2014, respectively, are included in deferred income taxes on the Company's consolidated statements of cash flows.
A reconciliation of the U.S. federal statutory income tax rate of 35.0% to the Company's effective tax rate is as follows:
Fiscal Year | 2016 | 2015 | 2014 | |||||
Tax at statutory rate | 35.0 | % | 35.0 | % | 35.0 | % | ||
Non-deductible expenses | 5.3 | 0.7 | 0.4 | |||||
State, net of federal tax benefit | 0.6 | 0.5 | 0.9 | |||||
Foreign rate differential | (30.9 | ) | (15.6 | ) | (12.3 | ) | ||
U.S. tax on foreign income | 5.0 | 4.3 | 6.3 | |||||
Income tax contingencies | 0.3 | 0.9 | 0.7 | |||||
Valuation allowances | 8.1 | 1.4 | (0.3 | ) | ||||
Return to provision true-up | 1.7 | (1.6 | ) | (0.1 | ) | |||
Other | — | 0.6 | 0.1 | |||||
Provision for income taxes | 25.1 | % | 26.2 | % | 30.7 | % | ||
Deferred U.S. federal income taxes and foreign withholding taxes are not recorded on undistributed earnings of certain foreign subsidiaries where management plans to continue reinvesting these earnings outside the U.S. The amount of
81
undistributed earnings that would be subject to tax if distributed was approximately $959.0 million at December 31, 2016. Determining tax amounts that would be payable if these earnings were distributed to the U.S. parent company is not practicable.
The total amount of unrecognized tax benefits, excluding interest and penalties that would favorably impact the effective tax rate in future periods if recognized, was $20.6 million, $20.0 million and $12.8 million for fiscal years 2016, 2015 and 2014, respectively. The U.S. Internal Revenue Service has completed examinations of the Company's federal income tax returns through 2012. Fiscal years 2013-2016 remain open for federal income tax examination. The Company is also subject to examinations in various state and foreign jurisdictions for its 2010-2016 tax years, none of which the Company believes are significant, individually or in the aggregate. Tax audit outcomes and timing of tax audit settlements are subject to significant uncertainty.
The Company has classified uncertain tax positions as long-term income taxes payable unless such amounts are expected to be paid within twelve months from December 31, 2016. As of December 31, 2016, the Company had recorded $3.4 million of unrecognized tax benefits, excluding interest and penalties, for positions that could be settled within the next twelve months. Consistent with its past practice, the Company recognizes interest and/or penalties related to income tax overpayments and income tax underpayments in income tax expense and income taxes receivable/payable, respectively. The total amount of accrued income tax-related interest in the Company's consolidated balance sheets was $2.3 million and $2.2 million at December 31, 2016 and January 2, 2016, respectively. The total amount of accrued income tax-related penalties in the Company's consolidated balance sheets was $1.4 million and $1.8 million at December 31, 2016 and January 2, 2016, respectively. The Company accrued income tax-related interest expense of $0.1 million, $0.3 million and $0.7 million in fiscal years 2016, 2015 and 2014, respectively.
The following is a tabular reconciliation of the total amounts of unrecognized tax benefits for the fiscal years indicated (in thousands):
Fiscal Year | 2016 | 2015 | 2014 | ||||||||
Balance at beginning of year | $ | 23,022 | $ | 20,086 | $ | 14,314 | |||||
Gross increases tax positions in prior years | 918 | 1,800 | 4,234 | ||||||||
Gross decreases tax positions in prior years | (183 | ) | (9,282 | ) | (1,018 | ) | |||||
Gross increases—tax positions in current year | 974 | 11,909 | 3,508 | ||||||||
Settlements | (181 | ) | (583 | ) | (194 | ) | |||||
Lapse in statute of limitations | (1,106 | ) | (758 | ) | (617 | ) | |||||
Change due to currency revaluation | (45 | ) | (150 | ) | (141 | ) | |||||
Balance at end of year | $ | 23,399 | $ | 23,022 | $ | 20,086 | |||||
82
13. Commitments and Contingencies
License Agreements. The Company has various license agreements to market watches and jewelry bearing certain trademarks or patents owned by various third parties. In accordance with these agreements, the Company incurred royalty expense of approximately $206.1 million, $243.5 million and $258.6 million in fiscal years 2016, 2015 and 2014, respectively. These amounts are included in the Company's cost of sales or, if advertising related, in SG&A. These license agreements have expiration dates between fiscal years 2017 and 2025 which requires the Company to pay royalties ranging from 5% to 15% of defined net sales. The Company has future minimum royalty commitments through fiscal year 2020 under these license agreements as summarized below, by fiscal year (in thousands):
Fiscal Year | Minimum Royalty Commitments | ||
2017 | $ | 160,577 | |
2018 | 68,304 | ||
2019 | 7,870 | ||
2020 | 2,500 | ||
Total | $ | 239,251 | |
These minimum royalty commitments do not include amounts owed under these license agreements obligating the Company to pay the licensors a percentage of net sales of these licensed products.
Leases. The Company leases its retail and outlet store facilities as well as certain of its office and warehouse facilities and equipment under non-cancelable operating leases and capital leases. Most of the retail and outlet store leases provide for contingent rental payments based on operating results and require the payment of taxes, insurance and other costs applicable to the property. Generally, these leases include renewal options for various periods at stipulated rates. Total rent expense under these agreements was approximately $188.7 million, $186.1 million and $190.6 million for fiscal years 2016, 2015 and 2014, respectively. Included in the Company's total rent expense was contingent rent expense of approximately $10.5 million, $13.3 million and $14.1 million for fiscal years 2016, 2015 and 2014, respectively. Capital leases are included as a component of short-term and current portion of long-term debt and in long-term debt in the Company's consolidated balance sheets. Future minimum rental commitments under non-cancelable leases, by fiscal year, are as follows (in thousands):
Fiscal Year | Operating Leases | Capital Leases | |||||
2017 | $ | 149,364 | $ | 1,435 | |||
2018 | 130,990 | 1,146 | |||||
2019 | 110,800 | 926 | |||||
2020 | 94,532 | 923 | |||||
2021 | 80,487 | 917 | |||||
Thereafter | 233,684 | 230 | |||||
$ | 799,857 | $ | 5,577 | ||||
Less amounts representing interest at 3.0% to 10.8% | 159 | ||||||
Capital lease obligations | $ | 5,418 | |||||
Purchase Obligations. As of December 31, 2016, the Company had purchase obligations totaling $442.5 million that consisted primarily of outstanding letters of credit, which represent inventory purchase commitments that typically mature in one to eight months and open non-cancelable purchase orders.
Asset Retirement Obligations. ASC 410, Asset Retirement and Environmental Obligations requires (i) that the fair value of a liability for an asset retirement obligation be recognized in the period in which it is incurred if a reasonable estimate of fair value can be made and (ii) that the associated asset retirement costs be capitalized as part of the carrying amount of the long-lived asset. The Company's asset retirement obligations relate to costs associated with the retirement of leasehold improvements under office leases and retail store leases within the Americas, Europe and Asia segments.
83
The following table summarizes the changes in the Company's asset retirement obligations (in thousands):
Fiscal Year: | 2016 | 2015 | |||||
Beginning asset retirement obligation | $ | 8,894 | $ | 8,925 | |||
Liabilities incurred during the period | 4,331 | 509 | |||||
Liabilities settled during the period | (684 | ) | (534 | ) | |||
Accretion expense | 401 | 308 | |||||
Currency translation | (264 | ) | (314 | ) | |||
Ending asset retirement obligations | $ | 12,678 | $ | 8,894 | |||
Litigation. The Company is occasionally subject to litigation or other legal proceedings in the normal course of its business. The Company does not believe that the outcome of any currently pending legal matters, individually or collectively, will have a material effect on the business or financial condition of the Company.
Sale-leaseback. During fiscal year 2016, the Company entered into a sale-leaseback agreement for its approximately 518,000 square foot warehouse and distribution center in Dallas, Texas. The sales price was $33.0 million. The transaction resulted in a gain of $6.7 million net of taxes and fees and a deferred gain of $13.2 million to be amortized to rent expense over the initial lease term. The leaseback has a 10-year term with two 5-year renewal options and is classified as an operating lease.
14. Stockholders' Equity
Common and Preferred Stock. The Company has 100,000,000 shares of common stock, par value $0.01 per share, authorized, with 48,268,599, and 48,124,555 shares issued at fiscal year-end 2016 and 2015, respectively. The Company has 1,000,000 shares of preferred stock, par value $0.01 per share, authorized, with none issued or outstanding at fiscal year-end 2016 and 2015. Rights, preferences and other terms of preferred stock will be determined by the Board of Directors at the time of issuance.
Common Stock Repurchase Programs. Purchases of the Company's common stock are made from time to time pursuant to its repurchase programs, subject to market conditions and at prevailing market prices, through the open market. Repurchased shares of common stock are recorded at cost and become authorized but unissued shares which may be issued in the future for general corporate or other purposes. The Company may terminate or limit its stock repurchase program at any time. In the event the repurchased shares are cancelled, the Company accounts for retirements by allocating the repurchase price to common stock, additional paid‑in capital and retained earnings. The repurchase price allocation is based upon the equity contribution associated with historical issuances. The repurchase programs are conducted pursuant to Rule 10b‑18 of the Securities Exchange Act of 1934.
During the period from the announcement of the Company's buyback authorizations in December 2012 and December 2014 for $1.0 billion each, until the end of the fiscal year 2016, the Company has repurchased approximately $1.2 billion of its common stock, representing approximately 11.8 million shares. The Company has not repurchased any shares under the $30.0 million repurchase plan authorized in 2010.
During fiscal year 2016, the Company effectively retired 0.1 million shares of common stock repurchased under its repurchase programs. The effective retirement of repurchased common stock decreased common stock by $1,100, additional paid-in capital by $0.2 million, retained earnings by $5.0 million and treasury stock by $5.2 million. At December 31, 2016 and January 2, 2016, all treasury stock had been effectively retired. As of December 31, 2016, the Company had $824.2 million of repurchase authorizations remaining under the combined repurchase plans. However, under the First Amendment, the Company is restricted from making open market repurchases of its common stock. See Note 10—Debt for additional disclosures about the First Amendment.
84
The following table shows the Company's common stock repurchase activity for the periods indicated (in millions):
For the 2016 Fiscal Year | For the 2015 Fiscal Year | |||||||||||||||||||
Fiscal Year Authorized | Dollar Value Authorized | Termination Date | Number of Shares Repurchased | Dollar Value Repurchased | Number of Shares Repurchased | Dollar Value Repurchased | ||||||||||||||
2014 | $ | 1,000.0 | December 2018 | 0.1 | $ | 5.2 | 2.4 | $ | 200.7 | |||||||||||
2012 | $ | 1,000.0 | December 2016 (1) | — | $ | — | 0.3 | $ | 28.8 | |||||||||||
2010 | $ | 30.0 | None | — | $ | — | — | $ | — | |||||||||||
_______________________________________________________________________________
(1) | In the first quarter of fiscal year 2015, the Company completed this repurchase plan. |
15. Employee Benefit Plans
Deferred Compensation and Savings Plans. The Company has a defined contribution savings plan (the "401(k) Plan") for substantially all U.S.-based full-time employees of the Company, which includes a Roth 401(k) option. The Company's common stock is one of several investment alternatives available under the 401(k) Plan. The Company has a discretionary match for the 401(k) Plan. After 90 days of service (minimum of 250 hours worked), the Company matches 50% of employee contributions up to 6% of their compensation. Matching contributions made by the Company to the 401(k) Plan totaled approximately $2.9 million, $2.8 million and $3.0 million for fiscal years 2016, 2015 and 2014, respectively. The Company also has the right to make additional matching contributions not to exceed 15% of employee compensation. The Company did not make any additional matching contributions during fiscal years 2016, 2015 and 2014.
Under the Fossil Group, Inc. and Affiliates Deferred Compensation Plan (the "Deferred Plan") eligible participants may elect to defer up to 50% of their salary or up to 100% of any bonuses paid pursuant to the terms and conditions of the Deferred Plan. In addition, the Company may make employer contributions to participants under the Deferred Plan from time to time. The Company made no contributions to the Deferred Plan during fiscal years 2016, 2015 and 2014. In prior periods, the Company made payments pursuant to the Deferred Plan into a Rabbi Trust. The funds held in the Rabbi Trust are directed to certain investments available through life insurance products. As of December 31, 2016, the Company had an asset of $2.4 million related to the Company's invested balances recorded in intangible and other assets—net and a liability of $3.9 million related to the participants' invested balances recorded in accrued expenses—other, each on the Company's consolidated balance sheets.
Stock-Based Compensation Plans. The Company accounts for stock-based compensation using the Black-Scholes option pricing model to determine the fair value of stock options and stock appreciation rights at the date of grant. The Company’s grants under its current stock-based compensation plans generally include: (i) stock options, restricted stock units, and performance restricted stock units for its international employees, (ii) restricted stock units for its nonemployee directors, and (iii) stock appreciation rights, performance stock appreciation rights, restricted stock, restricted stock units, and performance restricted stock units for its U.S.-based employees. As of December 31, 2016, the Company had approximately $52.0 million of total unrecognized compensation cost related to non-vested share-based compensation arrangements granted under the Company's stock based compensation plans. This cost is expected to be recognized over a weighted-average period of approximately 1.5 years. All time based or performance based stock appreciation rights and restricted stock units are settled in shares of the Company's common stock with the exception of one international employee’s grants that were converted to cash settled awards.
Long-Term Incentive Plans. An aggregate of 3,000,000 shares of the Company's common stock were reserved for issuance pursuant to the Company's 2016 Long-Term Incentive Plan ("2016 LTIP"), adopted in March 2016. Under the 2016 LTIP, designated employees of the Company, including officers, certain contractors, and outside directors of the Company, are eligible to receive (i) stock options, (ii) stock appreciation rights, (iii) restricted or non-restricted stock awards, (iv) restricted stock units, (v) performance awards, (vi) cash awards, or (vii) any combination of the foregoing. The 2016 LTIP is administered by the Compensation Committee of the Company's Board of Directors (the "Compensation Committee"). Each award issued under the 2016 LTIP terminates at the time designated by the Compensation Committee, not to exceed ten years. The current outstanding stock options, stock appreciation rights, performance stock appreciation rights, restricted stock, restricted stock units and performance restricted stock units issued under the 2016 LTIP predominantly have original vesting periods of three
85
years. Time based or performance based stock appreciation rights and restricted stock units are predominately settled in shares of the Company's common stock. Each nonemployee director receives restricted stock units valued at $130,000 on the date of the Company's annual stockholders' meeting. These grants vest on the earlier of one year from the date of grant or the date of Company's next annual stockholders' meeting.
Prior to the Company establishing the 2016 LTIP, stock-based compensation awards were made to employees, certain contractors and nonemployee directors pursuant to the Company's 2008 Long-Term Incentive Plan (“2008 LTIP”) and, prior to the 2008 LTIP, pursuant to the Company’s initial Long-Term Incentive Plan ("LTIP") and Nonemployee Director Stock Option Plan ("Nonemployee Plan"), respectively. Each award issued under the 2008 LTIP and LTIP terminates at the time designated by the Compensation Committee, not to exceed ten years. The currently outstanding stock options, stock appreciation rights, performance stock appreciation rights, restricted stock, restricted stock units and performance restricted stock units issued under the 2008 LTIP predominantly have original vesting periods of three years. The currently outstanding stock options, stock appreciation rights, restricted stock and restricted stock units issued under the LTIP and Nonemployee Plan have vested. The exercise prices of stock options granted under the 2008 LTIP and Nonemployee Plan were not less than the fair market value of the Company's common stock at the date of grant. All time based or performance based stock appreciation rights and restricted stock units under the 2008 LTIP are settled in shares of the Company's common stock. In March 2016, the Company’s Board of Directors elected to terminate the 2008 LTIP, and in March 2008, the Company’s Board of Directors elected to terminate the LTIP and the Nonemployee Plan. The termination of the 2008 LTIP, LTIP and Nonemployee Plan did not impair outstanding awards under those plans representing 1,238,579 shares under the 2008 LTIP, 41,342 shares under the LTIP and 15,750 shares under the Nonemployee Plan of the Company's common stock at December 31, 2016, which continued in accordance with their original terms.
Stock Options and Stock Appreciation Rights. The fair value of stock options and stock appreciation rights granted under the Company's stock-based compensation plans was estimated on the date of grant using the Black-Scholes option pricing model. The table below outlines the weighted average assumptions for these award grants:
Fiscal Year | 2016 | 2015 | 2014 | ||||||||
Risk-free interest rate | 1.1 | % | 1.3 | % | 0.9 | % | |||||
Expected term (in years) | 3.0 | 3.2 | 3.4 | ||||||||
Expected volatility | 38.8 | % | 42.3 | % | 47.1 | % | |||||
Expected dividend yield | — | % | — | % | — | % | |||||
Estimated fair value per stock option/stock appreciation right granted | $ | 11.25 | $ | 12.74 | $ | 38.88 | |||||
The expected term of the stock options and stock appreciation rights represent the estimated period of time until exercise and is based on historical experience of similar awards. Expected stock price volatility is based on the historical volatility of the Company's common stock. The risk-free interest rate is based on the implied yield available on U.S. Treasury securities with an equivalent remaining term.
The Company generally receives a tax deduction when stock options or stock appreciation rights are exercised or when restricted stock or restricted stock units vest. Generally for stock options and stock appreciation rights, the tax deduction is related to the excess of the stock price at the time the stock options or stock appreciation rights are exercised over the exercise price of the stock options or stock appreciation rights. For restricted stock and restricted stock units, the tax deduction is equal to the fair market value of the Company's common stock on the date the restricted stock or restricted stock units vest multiplied by the number of shares of restricted stock or restricted stock units. Excess tax benefits from stock-based compensation on the Company's consolidated statements of cash flows for fiscal years 2016, 2015 and 2014 amounted to approximately $5,000, $0.2 million and $1.4 million, respectively.
86
The following table summarizes stock option and stock appreciation rights activity:
Stock Options and Stock Appreciation Rights | Shares | Weighted-Average Exercise Price | Weighted-Average Remaining Contractual Term (Years) | Aggregate Intrinsic Value | ||||||||
in thousands | in thousands | |||||||||||
Outstanding at December 28, 2013 | 678 | $ | 76.15 | 6.2 | $ | 31,794 | ||||||
Granted | 94 | 111.90 | ||||||||||
Exercised | (91 | ) | 39.20 | 6,391 | ||||||||
Forfeited or expired | (18 | ) | 120.77 | |||||||||
Outstanding at January 3, 2015 | 663 | 85.08 | 5.6 | 20,751 | ||||||||
Granted | 1,496 | 41.16 | ||||||||||
Exercised | (36 | ) | 31.04 | 1,544 | ||||||||
Forfeited or expired | (95 | ) | 102.86 | |||||||||
Outstanding at January 2, 2016 | 2,028 | 52.80 | 8.7 | 2,095 | ||||||||
Granted | 326 | 41.53 | ||||||||||
Exercised | (10 | ) | 26.93 | 186 | ||||||||
Forfeited or expired | (57 | ) | 81.93 | |||||||||
Outstanding at December 31, 2016 | 2,287 | 50.58 | 6.2 | 627 | ||||||||
Exercisable at December 31, 2016 | 988 | $ | 62.75 | 5.2 | $ | 627 | ||||||
The aggregate intrinsic value in the table above is before income taxes and is based on the exercise price for outstanding and exercisable options/rights at December 31, 2016 and based on the fair market value of the Company's common stock on the exercise date for options/rights that were exercised during the fiscal year.
Stock Options and Stock Appreciation Rights Outstanding and Exercisable. The following table summarizes information with respect to stock options and stock appreciation rights outstanding and exercisable at December 31, 2016:
Stock Options Outstanding | Stock Options Exercisable | ||||||||||||||
Range of Exercise Prices | Number of Shares | Weighted-Average Exercise Price | Weighted-Average Remaining Contractual Term (Years) | Number of Shares | Weighted- Average Exercise Price | ||||||||||
in thousands | in thousands | ||||||||||||||
$13.65 - $29.49 | 40 | $ | 14.40 | 2.2 | 40 | $ | 14.40 | ||||||||
$29.78 - $47.99 | 90 | 36.36 | 2.0 | 90 | 36.36 | ||||||||||
$55.04 - $83.83 | 92 | 80.80 | 4.3 | 92 | 80.80 | ||||||||||
$95.91 - $131.46 | 144 | 127.98 | 4.8 | 144 | 127.98 | ||||||||||
Total | 366 | $ | 81.12 | 3.7 | 366 | $ | 81.12 | ||||||||
87
Stock Appreciation Rights Outstanding | Stock Appreciation Rights Exercisable | ||||||||||||||
Range of Exercise Prices | Number of Shares | Weighted-Average Exercise Price | Weighted-Average Remaining Contractual Term (Years) | Number of Shares | Weighted- Average Exercise Price | ||||||||||
in thousands | in thousands | ||||||||||||||
$13.65 - $29.49 | 113 | $ | 27.72 | 6.7 | 13 | $ | 13.65 | ||||||||
$29.78 - $47.99 | 1,561 | 38.11 | 7.0 | 455 | 36.76 | ||||||||||
$55.04 - $83.83 | 138 | 79.00 | 5.5 | 65 | 79.50 | ||||||||||
$95.91 - $131.46 | 109 | 114.42 | 4.5 | 89 | 115.01 | ||||||||||
Total | 1,921 | $ | 44.75 | 6.7 | 622 | $ | 51.93 | ||||||||
Restricted Stock and Restricted Stock Units. The following table summarizes restricted stock and restricted stock unit activity:
Restricted Stock and Restricted Stock Units | Number of Shares | Weighted-Average Grant Date Fair Value Per Share | ||||
in thousands | ||||||
Nonvested at December 28, 2013 | 219 | $ | 99.27 | |||
Granted | 164 | 110.95 | ||||
Vested | (115 | ) | 90.66 | |||
Forfeited | (13 | ) | 108.76 | |||
Nonvested at January 3, 2015 | 255 | $ | 110.17 | |||
Granted | 1,131 | 49.16 | ||||
Vested | (115 | ) | 109.97 | |||
Forfeited | (63 | ) | 94.54 | |||
Nonvested at January 2, 2016 | 1,208 | $ | 53.87 | |||
Granted | 588 | 27.94 | ||||
Vested | (327 | ) | 64.51 | |||
Forfeited | (64 | ) | 56.29 | |||
Nonvested at December 31, 2016 | 1,405 | $ | 40.41 | |||
The total fair value of shares/units vested during fiscal years 2016, 2015 and 2014 was $12.3 million, $9.0 million and $12.6 million, respectively.
The Company maintains a defined benefit plan for its employees located in Switzerland. The plan is funded through payments to an insurance company. The payments are determined by periodic actuarial calculations. During fiscal years 2016, 2015 and 2014, the Company recorded pension gains (expenses) of ($2.2) million, ($1.5) million and $0.2 million, respectively, related to this plan. The liability for the Company's defined benefit plan was $11.3 million and $16.0 million at the end of fiscal years 2016 and 2015, respectively. This liability is recorded in other long-term liabilities on the Company's consolidated balance sheets.
Under French law, the Company is required to maintain a defined benefit plan for its employees located in France, which is referred to as a "retirement indemnity". The amount of the retirement indemnity is based on the employee's last salary and duration of employment with the Company. The employee's right to receive the retirement indemnity is subject to the employee remaining with the Company until retirement. During fiscal years 2016, 2015 and 2014 the Company recorded pension expenses of $0.2 million, $0.1 million and $0.3 million, respectively, for its retirement indemnity obligations. The liability for the Company's retirement indemnity was $1.7 million and $1.6 million at the end of fiscal years 2016 and 2015, respectively. This liability is recorded in other long-term liabilities on the Company's consolidated balance sheets.
88
16. Supplemental Cash Flow Information
The following table summarizes supplemental cash flow information (in thousands):
Fiscal Year | 2016 | 2015 | 2014 | ||||||||
Cash paid during the year for: | |||||||||||
Interest | $ | 26,867 | $ | 20,042 | $ | 15,924 | |||||
Income taxes, net of refunds | $ | 14,163 | $ | 131,838 | $ | 167,702 | |||||
Supplemental disclosures of non-cash investing and financing activities: | |||||||||||
Additions to property, plant and equipment included in accounts payable | $ | 4,762 | $ | 7,966 | $ | 5,030 | |||||
Additions to property, plant and equipment acquired under capital leases | $ | 432 | $ | 1,462 | $ | 1,180 | |||||
17. Supplemental Disclosure for Accumulated Other Comprehensive Income (Loss)
The following table illustrates changes in the balances of each component of accumulated other comprehensive income (loss), net of taxes (in thousands):
December 31, 2016 | |||||||||||||||||||
Cash Flow Hedges | |||||||||||||||||||
Currency Translation Adjustments | Forward Contracts | Interest Rate Swaps | Pension Plan | Total | |||||||||||||||
Beginning balance | $ | (81,707 | ) | $ | 8,114 | $ | (693 | ) | $ | (6,220 | ) | $ | (80,506 | ) | |||||
Other comprehensive income (loss) before reclassifications | (19,773 | ) | 22,638 | (1,149 | ) | 2,650 | 4,366 | ||||||||||||
Tax (expense) benefit | (283 | ) | (9,073 | ) | 419 | (337 | ) | (9,274 | ) | ||||||||||
Amounts reclassed from accumulated other comprehensive income (loss) | 104 | 16,143 | (1,699 | ) | — | 14,548 | |||||||||||||
Tax (expense) benefit | — | (5,157 | ) | 619 | — | (4,538 | ) | ||||||||||||
Total other comprehensive income (loss) | (20,160 | ) | 2,579 | 350 | 2,313 | (14,918 | ) | ||||||||||||
Ending balance | $ | (101,867 | ) | $ | 10,693 | $ | (343 | ) | $ | (3,907 | ) | $ | (95,424 | ) | |||||
January 2, 2016 | |||||||||||||||||||
Cash Flow Hedges | |||||||||||||||||||
Currency Translation Adjustments | Forward Contracts | Interest Rate Swaps | Pension Plan | Total | |||||||||||||||
Beginning balance | $ | (27,241 | ) | $ | 14,980 | $ | (502 | ) | $ | (3,647 | ) | $ | (16,410 | ) | |||||
Other comprehensive income (loss) before reclassifications | (54,466 | ) | 33,475 | 2,430 | (2,846 | ) | (21,407 | ) | |||||||||||
Tax (expense) benefit | — | (10,712 | ) | (886 | ) | 463 | (11,135 | ) | |||||||||||
Amounts reclassed from accumulated other comprehensive income (loss) | — | 44,859 | 2,730 | 210 | 47,799 | ||||||||||||||
Tax (expense) benefit | — | (15,230 | ) | (995 | ) | (20 | ) | (16,245 | ) | ||||||||||
Total other comprehensive income (loss) | (54,466 | ) | (6,866 | ) | (191 | ) | (2,573 | ) | (64,096 | ) | |||||||||
Ending balance | $ | (81,707 | ) | $ | 8,114 | $ | (693 | ) | $ | (6,220 | ) | $ | (80,506 | ) | |||||
89
January 3, 2015 | |||||||||||||||||||
Cash Flow Hedges | |||||||||||||||||||
Currency Translation Adjustments | Forward Contracts | Interest Rate Swaps | Pension Plan | Total | |||||||||||||||
Beginning balance | $ | 38,152 | $ | (2,091 | ) | $ | (106 | ) | $ | 736 | $ | 36,691 | |||||||
Other comprehensive income (loss) before reclassifications | (65,240 | ) | 37,182 | (3,397 | ) | (4,804 | ) | (36,259 | ) | ||||||||||
Tax (expense) benefit | (153 | ) | (14,255 | ) | 1,238 | 421 | (12,749 | ) | |||||||||||
Amounts reclassed from accumulated other comprehensive income (loss) | — | 8,893 | (2,774 | ) | — | 6,119 | |||||||||||||
Tax (expense) benefit | — | (3,037 | ) | 1,011 | — | (2,026 | ) | ||||||||||||
Total other comprehensive income (loss) | (65,393 | ) | 17,071 | (396 | ) | (4,383 | ) | (53,101 | ) | ||||||||||
Ending balance | $ | (27,241 | ) | $ | 14,980 | $ | (502 | ) | $ | (3,647 | ) | $ | (16,410 | ) | |||||
18. Major Customer, Segment and Geographic Information
Major Customer
Wholesale customers of the Company consist principally of major department stores and specialty retail stores located throughout the world. No individual customer accounts for 10% or more of the Company's net sales.
Segment Information
The Company reports segment information based on the "management approach". The management approach designates the internal reporting used by management for making decisions and assessing performance as the source of the Company's reportable segments.
The Company manages its business primarily on a geographic basis. The Company's reportable operating segments are comprised of (i) Americas, (ii) Europe and (iii) Asia. Each reportable operating segment includes sales to wholesale and distributor customers, and sales through Company-owned retail stores and e-commerce activities based on the location of the selling entity. The Americas segment primarily includes sales to customers based in Canada, Latin America and the United States. The Europe segment primarily includes sales to customers based in European countries, the Middle East and Africa. The Asia segment primarily includes sales to customers based in Australia, China, India, Indonesia, Japan, Malaysia, New Zealand, Singapore, South Korea, Taiwan and Thailand. Each reportable operating segment provides similar products and services.
The Company evaluates the performance of its reportable segments based on net sales and operating income. Net sales for geographic segments are based on the location of the selling entity. Operating income for each segment includes net sales to third parties, related cost of sales and operating expenses directly attributable to the segment. General corporate expenses, including certain administrative, legal, accounting, technology support costs, equity compensation costs, payroll costs attributable to executive management, brand management, product development, art, creative/product design, marketing, strategy, compliance and back office supply chain expenses are not allocated to the various segments because they are managed at the corporate level internally. The Company does not include intercompany transfers between segments for management reporting purposes.
Summary information by operating segment was as follows (in thousands):
Fiscal Year 2016 | |||||||||||||||||||
Net Sales | Operating Income | Depreciation and Amortization | Long-term Assets | Total Assets | |||||||||||||||
Americas | $ | 1,524,912 | $ | 241,118 | $ | 22,612 | $ | 313,437 | $ | 741,082 | |||||||||
Europe | 1,002,076 | 174,205 | 22,505 | 237,801 | 534,413 | ||||||||||||||
Asia | 515,383 | 77,626 | 12,676 | 81,434 | 237,695 | ||||||||||||||
Corporate | (365,803 | ) | 33,704 | 206,935 | 673,707 | ||||||||||||||
Consolidated | $ | 3,042,371 | $ | 127,146 | $ | 91,497 | $ | 839,607 | $ | 2,186,897 | |||||||||
90
Fiscal Year 2015 | |||||||||||||||||||
Net Sales | Operating Income | Depreciation and Amortization | Long-term Assets | Total Assets | |||||||||||||||
Americas | $ | 1,661,899 | $ | 354,295 | $ | 26,021 | $ | 427,026 | $ | 905,168 | |||||||||
Europe | 1,069,820 | 210,514 | 21,671 | 204,947 | 543,649 | ||||||||||||||
Asia | 497,117 | 71,684 | 13,073 | 57,754 | 203,304 | ||||||||||||||
Corporate | (345,259 | ) | 24,532 | 223,264 | 703,540 | ||||||||||||||
Consolidated | $ | 3,228,836 | $ | 291,234 | $ | 85,297 | $ | 912,991 | $ | 2,355,661 | |||||||||
Fiscal Year 2014 | |||||||||||||||||||
Net Sales | Operating Income | Depreciation and Amortization | Long-term Assets | Total Assets | |||||||||||||||
Americas | $ | 1,747,506 | $ | 463,246 | $ | 24,846 | $ | 261,992 | $ | 778,870 | |||||||||
Europe | 1,195,948 | 287,961 | 20,028 | 220,757 | 561,575 | ||||||||||||||
Asia | 566,237 | 116,288 | 12,676 | 64,175 | 233,884 | ||||||||||||||
Corporate | (300,959 | ) | 25,780 | 175,964 | 603,131 | ||||||||||||||
Consolidated | $ | 3,509,691 | $ | 566,536 | $ | 83,330 | $ | 722,888 | $ | 2,177,460 | |||||||||
The following table indicates revenue for each class of similar products for fiscal years 2016, 2015 and 2014 (in thousands):
Fiscal Year 2016 | Fiscal Year 2015 | Fiscal Year 2014 | ||||||||||||||||||
Net Sales | Percentage of Total | Net Sales | Percentage of Total | Net Sales | Percentage of Total | |||||||||||||||
Watches | $ | 2,330,275 | 76.6 | % | $ | 2,475,814 | 76.7 | % | $ | 2,736,511 | 78.0 | % | ||||||||
Leathers | 393,761 | 12.9 | 409,381 | 12.7 | 419,391 | 11.9 | ||||||||||||||
Jewelry | 251,391 | 8.3 | 272,146 | 8.4 | 276,485 | 7.9 | ||||||||||||||
Other | 66,944 | 2.2 | 71,495 | 2.2 | 77,304 | 2.2 | ||||||||||||||
Total | $ | 3,042,371 | 100.0 | % | $ | 3,228,836 | 100.0 | % | $ | 3,509,691 | 100.0 | % | ||||||||
Geographic Information
Net sales and long-lived assets related to the Company's operations in the U.S., Europe, Asia and all other international markets were as follows (in thousands):
Fiscal Year 2016 | |||||||
Net Sales(1) | Long-term Assets | ||||||
United States | $ | 1,355,586 | $ | 470,358 | |||
Europe | 1,002,077 | (2) | 260,277 | ||||
Asia | 515,383 | 93,111 | |||||
All other international | 169,325 | 15,861 | |||||
Consolidated | $ | 3,042,371 | $ | 839,607 | |||
91
Fiscal Year 2015 | |||||||
Net Sales(1) | Long-term Assets | ||||||
United States | $ | 1,491,638 | $ | 379,461 | |||
Europe | 1,069,820 | (2) | 224,018 | ||||
Asia | 497,117 | 66,140 | |||||
All other international | 170,261 | 243,372 | |||||
Consolidated | $ | 3,228,836 | $ | 912,991 | |||
Fiscal Year 2014 | |||||||
Net Sales(1) | Long-term Assets | ||||||
United States | $ | 1,588,566 | $ | 394,393 | |||
Europe | 1,195,948 | (2) | 236,278 | ||||
Asia | 566,237 | 74,468 | |||||
All other international | 158,940 | 17,749 | |||||
Consolidated | $ | 3,509,691 | $ | 722,888 | |||
_______________________________________________________________________________
(1) | Net sales are based on the location of the selling entity. |
(2) | Net sales from Germany accounted for more than 10% of the Company's consolidated net sales and were approximately $467.7 million, $505.4 million and $612.5 million in fiscal years 2016, 2015 and 2014, respectively. |
92
19. Restructuring
The Company implemented a multi-year restructuring program that began in fiscal year 2016 called New World Fossil ("NWF"). As part of NWF, the Company targets to improve operating profit and support sales growth through a leaner infrastructure and an enhanced business model. The Company is working to achieve greater efficiencies from production to distribution through activities such as organizational changes, reducing its overall product assortment, optimizing its base cost structure and consolidating facilities. The Company also intends to build a quicker and thereby more responsive operating platform. The Company is reducing its retail footprint to reflect the evolving shopping habits of today's consumer, which includes restructuring costs, such as store impairment, recorded lease obligations and termination fees and accelerated depreciation. The Company estimates total NWF restructuring charges of up to approximately $150 million will be recorded, predominantly during fiscal years 2017 and 2018 with some charges recognized in fiscal year 2016.
During fiscal year 2015, the Company completed a restructuring program to refine its operating structure and store locations. The costs associated with this plan included various charges, including severance and other employment-related costs, professional services and costs related to store closures.
The following tables show a rollforward of the liabilities incurred under the Company's restructuring plans (in thousands):
2016 | ||||||||||||||||||
Liabilities | Cash payments | Non-cash items | Liabilities | |||||||||||||||
January 2, 2016 | Charges | December 31, 2016 | ||||||||||||||||
Store closures | — | $ | 22,247 | $ | (3,430 | ) | $ | (14,271 | ) | $ | 4,546 | |||||||
Professional services | — | 4,057 | (3,263 | ) | — | 794 | ||||||||||||
Supply chain relocation | — | 1,474 | — | (1,474 | ) | — | ||||||||||||
Total | — | $ | 27,778 | $ | (6,693 | ) | $ | (15,745 | ) | $ | 5,340 | |||||||
2015 | ||||||||||||||||||
Liabilities | Cash payments | Non-cash items | Liabilities | |||||||||||||||
January 3, 2015 | Charges | January 2, 2016 | ||||||||||||||||
Store closures | — | $ | 8,715 | $ | (4,753 | ) | $ | (3,962 | ) | $ | — | |||||||
Professional services | — | 5,462 | (5,462 | ) | — | — | ||||||||||||
Severance and employee-related benefits | — | 10,223 | (10,223 | ) | — | — | ||||||||||||
Total | — | $ | 24,400 | $ | (20,438 | ) | $ | (3,962 | ) | $ | — | |||||||
Restructuring charges by operating segment were as follows by fiscal year (in thousands):
2016 | 2015 | ||||||
Americas | $ | 19,745 | $ | 8,715 | |||
Europe | 1,888 | 3,554 | |||||
Asia | 746 | 210 | |||||
Corporate | 5,399 | 11,921 | |||||
Consolidated | $ | 27,778 | $ | 24,400 | |||
93
Item 9. Changes in and Disagreements with Accountants on Accounting and Financial Disclosure
None.
Item 9A. Controls and Procedures
Evaluation of Disclosure Controls and Procedures
We conducted an evaluation of the effectiveness of our "disclosure controls and procedures" ("Disclosure Controls"), as defined by Rules 13a-15(e) and 15d-15(e) of the Securities Exchange Act of 1934, as amended (the "Exchange Act"), as of December 31, 2016, the end of the period covered by this Annual Report on Form 10-K. The Disclosure Controls evaluation was done under the supervision and with the participation of management, including our Chief Executive Officer ("CEO") and Chief Financial Officer ("CFO"). There are inherent limitations to the effectiveness of any system of disclosure controls and procedures. Accordingly, even effective disclosure controls and procedures can only provide reasonable assurance of achieving their control objectives.
Based upon this evaluation, our CEO and CFO have concluded that our Disclosure Controls were effective at the reasonable assurance level as of December 31, 2016.
Management's Report on Internal Control Over Financial Reporting
Management is responsible for establishing and maintaining adequate internal control over financial reporting, as defined in Rules 13a-15(f) and 15d-15(f) under the Exchange Act. The Company's internal control over financial reporting is designed to provide reasonable assurance regarding the reliability of financial reporting and the preparation of the consolidated financial statements for external reporting purposes in accordance with generally accepted accounting principles.
Because of its inherent limitations, internal control over financial reporting may not prevent or detect misstatements. Also, projections of any evaluation of effectiveness of internal control over financial reporting to future periods are subject to the risk that controls may become inadequate because of changes in conditions or that the degree of compliance with the policies or procedures may deteriorate over time.
Management, including our CEO and our CFO, assessed the effectiveness of the Company's internal control over financial reporting as of December 31, 2016. In making this assessment, management used the criteria set forth by the Committee of Sponsoring Organizations of the Treadway Commission in Internal Control—Integrated Framework (2013). Based on its assessment and those criteria, management has concluded that the Company maintained effective internal control over financial reporting as of December 31, 2016.
Deloitte & Touche LLP, the independent registered public accounting firm that audited the Company's consolidated financial statements included in this Annual Report on Form 10-K, has issued an attestation report on the Company's internal control over financial reporting, which is included herein.
Changes in Internal Control over Financial Reporting
There were no changes in our internal control over financial reporting during the fourth quarter ended December 31, 2016 that materially affected, or are reasonably likely to materially affect, our internal control over financial reporting.
94
REPORT OF INDEPENDENT REGISTERED PUBLIC ACCOUNTING FIRM
The Board of Directors and Stockholders of
Fossil Group, Inc.
Richardson, Texas
We have audited the internal control over financial reporting of Fossil Group, Inc. and subsidiaries (the "Company") as of December 31, 2016, based on criteria established in Internal Control — Integrated Framework (2013) issued by the Committee of Sponsoring Organizations of the Treadway Commission. The Company's management is responsible for maintaining effective internal control over financial reporting and for its assessment of the effectiveness of internal control over financial reporting, included in the accompanying Management’s Report on Internal Control over Financial Reporting. Our responsibility is to express an opinion on the Company's internal control over financial reporting based on our audit.
We conducted our audit in accordance with the standards of the Public Company Accounting Oversight Board (United States). Those standards require that we plan and perform the audit to obtain reasonable assurance about whether effective internal control over financial reporting was maintained in all material respects. Our audit included obtaining an understanding of internal control over financial reporting, assessing the risk that a material weakness exists, testing and evaluating the design and operating effectiveness of internal control based on the assessed risk, and performing such other procedures as we considered necessary in the circumstances. We believe that our audit provides a reasonable basis for our opinion.
A company's internal control over financial reporting is a process designed by, or under the supervision of, the company's principal executive and principal financial officers, or persons performing similar functions, and effected by the company's board of directors, management, and other personnel to provide reasonable assurance regarding the reliability of financial reporting and the preparation of financial statements for external purposes in accordance with generally accepted accounting principles. A company's internal control over financial reporting includes those policies and procedures that (1) pertain to the maintenance of records that, in reasonable detail, accurately and fairly reflect the transactions and dispositions of the assets of the company; (2) provide reasonable assurance that transactions are recorded as necessary to permit preparation of financial statements in accordance with generally accepted accounting principles, and that receipts and expenditures of the company are being made only in accordance with authorizations of management and directors of the company; and (3) provide reasonable assurance regarding prevention or timely detection of unauthorized acquisition, use, or disposition of the company's assets that could have a material effect on the financial statements.
Because of the inherent limitations of internal control over financial reporting, including the possibility of collusion or improper management override of controls, material misstatements due to error or fraud may not be prevented or detected on a timely basis. Also, projections of any evaluation of the effectiveness of the internal control over financial reporting to future periods are subject to the risk that the controls may become inadequate because of changes in conditions, or that the degree of compliance with the policies or procedures may deteriorate.
In our opinion, the Company maintained, in all material respects, effective internal control over financial reporting as of December 31, 2016, based on the criteria established in Internal Control — Integrated Framework (2013) issued by the Committee of Sponsoring Organizations of the Treadway Commission.
We have also audited, in accordance with the standards of the Public Company Accounting Oversight Board (United States), the consolidated financial statements and financial statement schedule as of and for the year ended December 31, 2016 of the Company and our report dated March 1, 2017 expressed an unqualified opinion on those consolidated financial statements and financial statement schedule.
/s/ Deloitte & Touche LLP
Dallas, Texas
March 1, 2017
95
Item 9B. Other Information
None.
PART III
Item 10. Directors, Executive Officers and Corporate Governance
The information under the headings "Directors and Nominees," "Executive Officers," "Section 16(a) Beneficial Ownership Reporting Compliance" and "Board Committees and Meetings" in our proxy statement to be filed with the SEC pursuant to Regulation 14A, not later than 120 days after the end of the fiscal year covered by this report, is incorporated herein by reference.
We have adopted a code of ethics that applies to all our directors and employees, including the principal executive officer, principal financial officer, principal accounting officer and controller. The full text of our Code of Conduct and Ethics is published on the Investors section of our website at www.fossilgroup.com. We intend to disclose any future amendments to certain provisions of the Code of Conduct and Ethics, or waivers of such provisions granted to executive officers and directors, on this website within five business days following the date of any such amendment or waiver.
Item 11. Executive Compensation
The information required in response to this Item is incorporated herein by reference to our proxy statement to be filed with the SEC pursuant to Regulation 14A, not later than 120 days after the end of the fiscal year covered by this report.
Item 12. Security Ownership of Certain Beneficial Owners and Management and Related Stockholder Matters
The information required in response to this Item is incorporated herein by reference to our proxy statement to be filed with the SEC pursuant to Regulation 14A, not later than 120 days after the end of the fiscal year covered by this report.
Item 13. Certain Relationships and Related Transactions, and Director Independence
The information required in response to this Item is incorporated herein by reference to our proxy statement to be filed with the SEC pursuant to Regulation 14A, not later than 120 days after the end of the fiscal year covered by this report.
Item 14. Principal Accountant Fees and Services
The information required in response to this Item is incorporated herein by reference to our proxy statement to be filed with the SEC pursuant to Regulation 14A, not later than 120 days after the end of the fiscal year covered by this report.
96
PART IV
Item 15. Exhibits and Consolidated Financial Statement Schedules
(a) | Documents filed as part of Report. |
Page | ||
The exhibits required to be filed by this Item 15 are set forth in the Exhibit Index accompanying this report.
97
SIGNATURES
Pursuant to the requirements of Section 13 or 15(d) of the Securities Exchange Act of 1934, the registrant has duly caused this report to be signed on its behalf by the undersigned, thereunto duly authorized.
March 1, 2017 | FOSSIL GROUP, INC. | |
/s/ KOSTA N. KARTSOTIS | ||
Kosta N. Kartsotis, Chairman of the Board of Directors and Chief Executive Officer | ||
________________________________________________________________________________________________________________________
Pursuant to the requirements of the Securities Exchange Act of 1934, this report has been signed below by the following persons on behalf of the registrant and in the capacities and on the dates indicated.
Signature | Capacity | Date | ||
/s/ KOSTA N. KARTSOTIS | Chairman of the Board of Directors and Chief Executive Officer (Principal Executive Officer) | March 1, 2017 | ||
Kosta N. Kartsotis | ||||
/s/ DENNIS R. SECOR | Executive Vice President, Chief Financial Officer and Treasurer (Principal Financial and Accounting Officer) | March 1, 2017 | ||
Dennis R. Secor | ||||
/s/ ELAINE AGATHER | Director | March 1, 2017 | ||
Elaine Agather | ||||
/s/ JEFFREY N. BOYER | Director | March 1, 2017 | ||
Jeffrey N. Boyer | ||||
/s/ WILLIAM B. CHIASSON | Director | March 1, 2017 | ||
William B. Chiasson | ||||
/s/ MAURIA A. FINLEY | Director | March 1, 2017 | ||
Mauria A. Finley | ||||
/s/ DIANE NEAL | Director | March 1, 2017 | ||
Diane Neal | ||||
/s/ THOMAS M. NEALON | Director | March 1, 2017 | ||
Thomas M. Nealon | ||||
/s/ MARK D. QUICK | Director | March 1, 2017 | ||
Mark D. Quick | ||||
/s/ ELYSIA HOLT RAGUSA | Director | March 1, 2017 | ||
Elysia Holt Ragusa | ||||
/s/ JAMES E. SKINNER | Director | March 1, 2017 | ||
James E. Skinner | ||||
/s/ JAMES M. ZIMMERMAN | Director | March 1, 2017 | ||
James M. Zimmerman | ||||
98
SCHEDULE II
FOSSIL GROUP, INC. AND SUBSIDIARIES
VALUATIONS AND QUALIFYING ACCOUNTS
Fiscal Years 2014, 2015 and 2016
(in thousands)
Additions | Deductions | ||||||||||||||
Classification | Balance at Beginning of Period | Charged (Credited) to Operations | Actual Returns or Writeoffs | Balance at End of Period | |||||||||||
Fiscal Year 2014: | |||||||||||||||
Account receivable allowances: | |||||||||||||||
Sales returns | $ | 63,070 | $ | 144,694 | $ | 139,557 | $ | 68,207 | |||||||
Bad debts | $ | 11,770 | $ | 3,257 | $ | 3,187 | $ | 11,840 | |||||||
Deferred tax asset valuation allowance | $ | 10,547 | $ | (820 | ) | $ | 2,906 | $ | 6,821 | ||||||
Fiscal Year 2015: | |||||||||||||||
Account receivable allowances: | |||||||||||||||
Sales returns | $ | 68,207 | $ | 136,067 | $ | 135,539 | $ | 68,735 | |||||||
Bad debts | $ | 11,840 | $ | 6,307 | $ | 2,324 | $ | 15,823 | |||||||
Deferred tax asset valuation allowance | $ | 6,821 | $ | 4,236 | $ | 200 | $ | 10,857 | |||||||
Fiscal Year 2016: | |||||||||||||||
Account receivable allowances: | |||||||||||||||
Sales returns | $ | 68,735 | $ | 122,018 | $ | 123,852 | $ | 66,901 | |||||||
Bad debts | $ | 15,823 | $ | 4,520 | $ | 7,538 | $ | 12,805 | |||||||
Deferred tax asset valuation allowance | $ | 10,857 | $ | 8,793 | $ | 235 | $ | 19,415 | |||||||
99
EXHIBIT INDEX
Exhibit Number | Description | ||
2.1 | Agreement and Plan of Merger, dated as of November 11, 2015, by and among Fossil Group, Inc., Charlie Acquisition Corp., Misfit, Inc., Fortis Advisors LLC, as securityholder representative, and, with respect to Article VIII, Article IX and Article X only, U.S. Bank National Association, as escrow agent (incorporated by reference to Exhibit 2.1 to the Company’s Current Report on Form 8-K filed on November 17, 2015)(Schedules have been omitted pursuant to Item 601(b)(2) of Regulation S-K. The Company undertakes to furnish supplementally copies of any of the omitted schedules upon request made by the Securities and Exchange Commission). | ||
3.1 | Third Amended and Restated Certificate of Incorporation of Fossil Group, Inc. (incorporated by reference to Exhibit 3.1 to the Company's Current Report on Form 8-K filed on May 25, 2010). | ||
3.2 | Certificate of Amendment of the Third Amended and Restated Certificate of Incorporation of Fossil, Inc. (incorporated by reference to Exhibit 3.1 to the Company's Current Report on Form 8-K filed on May 28, 2013). | ||
3.3 | Fourth Amended and Restated Bylaws of Fossil Group, Inc. (incorporated by reference to Exhibit 3.2 of the Company's Current Report on Form 8-K filed on May 28, 2013). | ||
3.4 | Amendment No. 1 to Fourth Amended and Restated Bylaws of Fossil Group, Inc. (incorporated by reference to Exhibit 3.1 to the Company's Current Report on Form 8-K filed on March 20, 2014). | ||
10.1 | (2) | Fossil Group, Inc. 1993 Non-Employee Director Stock Option Plan (incorporated by reference to the Company's Registration Statement on Form S-1, SEC File No. 33-45357). | |
10.2 | (2) | Fossil Group, Inc. 1993 Long-Term Incentive Plan (incorporated by reference to the Company's Registration Statement on Form S-1, SEC File No. 33-45357). | |
10.3 | (2) | Amendment Number Four to the 1993 Long-Term Incentive Plan of Fossil Group, Inc. (incorporated by reference to Exhibit 10.8 to the Company's Annual Report on Form 10-K filed on February 29, 2012). | |
10.4 | (2) | Fossil Group, Inc. 2008 Long-Term Incentive Plan (incorporated by reference to Exhibit 10.1 to the Company's Current Report on Form 8-K filed on May 23, 2008). | |
10.5 | (2) | Amendment Number One to the 2008 Long-Term Incentive Plan of Fossil Group, Inc. (incorporated by reference to Exhibit 10.23 to the Company's Annual Report on Form 10-K filed on February 29, 2012). | |
10.6 | (2) | Amendment Number Two to the 2008 Long-Term Incentive Plan of Fossil Group, Inc. (incorporated by reference to Exhibit 10.24 to the Company's Annual Report on Form 10-K filed on February 29, 2012). | |
10.7 | (2) | Amendment Number Three to the Fossil Group, Inc. 2008 Long-Term Incentive Plan (incorporated by reference to Exhibit 10.1 to the Company’s Quarterly Report on Form 10-Q filed on May 7, 2015). | |
10.8 | (2) | Form of Stock Option Award Agreement for Outside Directors under the Fossil Group, Inc. 2008 Long-Term Incentive Plan (incorporated by reference to Exhibit 10.1 to the Company's Current Report on Form 8-K filed on January 5, 2009). | |
10.9 | (2) | Form of Performance Restricted Stock Unit Award under the Fossil Group, Inc. 2008 Long-Term Incentive Plan (incorporated by reference to Exhibit 10.2 to the Company’s Quarterly Report on Form 10-Q filed on May 7, 2015). | |
10.10 | (2) | Third Amended and Restated Fossil Group, Inc. and Affiliates Deferred Compensation Plan (incorporated by reference to Exhibit 10.1 to the Company's Current Report on Form 8-K filed on December 21, 2010). | |
10.11 | Amended and Restated Credit Agreement, dated as of March 9, 2015, by and among Fossil Group, Inc., the lenders party thereto from time to time, Wells Fargo Bank, National Association, as administrative agent, swingline lender and issuing lender, Bank of America, N.A. and JPMorgan Chase Bank, N.A., as co-syndication agents, and HSBC Bank USA, National Association, Compass Bank and Fifth Third Bank, as co-documentation agents (incorporated by reference to Exhibit 10.1 to the Company’s Current Report on Form 8-K filed on March 10, 2015)(The exhibits and schedules to the Amended & Restated Credit Agreement have not been filed herewith and will be provided to the Securities and Exchange Commission supplementally upon request). | ||
10.12 | (2) | Fossil Group, Inc. 1993 Savings and Retirement Plan (incorporated by reference to the Company's Registration Statement on Form S-1, SEC File No. 33-45357). | |
10.13 | Master License Agreement dated as of August 30, 1994, by and between Fossil Group, Inc. and Fossil Partners, L.P. (incorporated by reference to Exhibit 10.6 to the Company's Annual Report on Form 10-K filed on March 2, 2011). | ||
10.14 | Agreement of Limited Partnership of Fossil Partners, L.P. (incorporated by reference to Exhibit 10.7 to the Company's Annual Report on Form 10-K filed on March 2, 2011). | ||
100
Exhibit Number | Description | ||
10.15 | (2) | Form of Restricted Stock Unit Award (2012) under the Fossil Group, Inc. 2008 Long-Term Incentive Plan (incorporated by reference to Exhibit 10.2 to the Company's Current Report on Form 8-K filed on March 14, 2012). | |
10.16 | (2) | Form of Stock Appreciation Rights Award (2012) under the Fossil Group, Inc. 2008 Long-Term Incentive Plan (incorporated by reference to Exhibit 10.3 to the Company's Current Report on Form 8-K filed on March 14, 2012). | |
10.17 | (2) | First Amendment to the Stock Appreciation Rights Award Under the 2004 Long-Term Incentive Plan of Fossil Group, Inc. for Mark Quick, dated as of October 26, 2012 (incorporated by reference to Exhibit 10.2 to the Company's Current Report on Form 8-K filed on November 1, 2012). | |
10.18 | (2) | Amendment to the Restricted Stock Unit Award Under the Fossil Group, Inc. 2008 Long-Term Incentive Plan (incorporated by reference to Exhibit 10.1 to the Company's Quarterly Report on Form 10-Q filed on August 11, 2016). | |
10.19 | (2) | Amendment to the Stock Appreciation Rights Award Under the Fossil Group, Inc. 2008 Long-Term Incentive Plan (incorporated by reference to Exhibit 10.2 to the Company's Quarterly Report on Form 10-Q filed on August 11, 2016). | |
10.20 | (2) | Amendment to the Restricted Stock Unit Award Under the Fossil Group, Inc. 2008 Long-Term Incentive Plan for Performance Grants (incorporated by reference to Exhibit 10.3 to the Company's Quarterly Report on Form 10-Q filed on August 11, 2016). | |
10.21 | (2) | Restricted Stock Unit Award Under the Fossil Group, Inc. 2016 Long-Term Incentive Plan (incorporated by reference to Exhibit 10.4 to the Company's Quarterly Report on Form 10-Q filed on August 11, 2016). | |
10.22 | (2) | Stock Appreciation Rights Award Under the Fossil Group, Inc. 2016 Long-Term Incentive Plan (incorporated by reference to Exhibit 10.5 to the Company's Quarterly Report on Form 10-Q filed on August 11, 2016). | |
10.23 | (2) | Restricted Stock Unit Award Under the Fossil Group, Inc. 2016 Long-Term Incentive Plan for Performance Grants (incorporated by reference to Exhibit 10.6 to the Company's Quarterly Report on Form 10-Q filed on August 11, 2016). | |
10.24 | (2) | Form of Executive Severance Agreement (incorporated by reference to Exhibit 10.1 to the Company's Current Report on Form 8-K filed on January 8, 2016). | |
10.25 | First Amendment to Amended and Restated Credit Agreement, dated as of August 8, 2016, by and among certain lenders party thereto, Wells Fargo Bank, National Association, as administrative agent, swingline lender and issuing lender, Bank of America, N.A. and JPMorgan Chase Bank, N.A., as syndication agents, HSBC Bank USA, National Association, Compass Bank and Fifth Third Bank, as documentation agents, and Wells Fargo Securities, LLC, Merrill Lynch, Pierce, Fenner & Smith Incorporated and JPMorgan Chase Bank, N.A., as joint lead arrangers and joint bookrunners and Fossil Group, Inc. | ||
10.26 | (1)(2) | Fossil Group, Inc. 2015 Cash Incentive Plan | |
10.27 | (1)(2) | Fossil Group, Inc. Long-Term Incentive Plan | |
21.1 | (1) | Subsidiaries of Fossil Group, Inc. | |
23.1 | (1) | Consent of Independent Registered Public Accounting Firm. | |
31.1 | (1) | Certification of Chief Executive Officer Pursuant to Section 302 of Sarbanes-Oxley Act of 2002. | |
31.2 | (1) | Certification of Chief Financial Officer Pursuant to Section 302 of Sarbanes-Oxley Act of 2002. | |
32.1 | (3) | Certification of Chief Executive Officer Pursuant to Section 18 U.S.C. Section 1350, as Adopted Pursuant to Section 906 of the Sarbanes-Oxley Act of 2002. | |
32.2 | (3) | Certification of Chief Financial Officer Pursuant to Section 18 U.S.C. Section 1350, as Adopted Pursuant to Section 906 of the Sarbanes-Oxley Act of 2002. | |
101.INS | (1) | XBRL Instance Document. | |
101.SCH | (1) | XBRL Taxonomy Extension Schema Document. | |
101.DEF | (1) | XBRL Taxonomy Extension Definition Link Document. | |
101.CAL | (1) | XBRL Taxonomy Extension Calculation Linkbase Document. | |
101.LAB | (1) | XBRL Taxonomy Extension Label Linkbase Document. | |
101.PRE | (1) | XBRL Taxonomy Extension Presentation Linkbase Document. | |
(1) | Filed herewith. |
(2) | Management contract or compensatory plan or arrangement. |
(3) | Furnished herewith. |
101