Attached files
| file | filename |
|---|---|
| EX-31.2 - EXHIBIT 31.2 - MARCUS CORP | tm205232d1_ex31-2.htm |
| EX-32 - EXHIBIT 32 - MARCUS CORP | tm205232d1_ex32.htm |
| EX-31.1 - EXHIBIT 31.1 - MARCUS CORP | tm205232d1_ex31-1.htm |
| EX-23 - EXHIBIT 23 - MARCUS CORP | tm205232d1_ex23.htm |
| EX-21 - EXHIBIT 21 - MARCUS CORP | tm205232d1_ex21.htm |
| EX-4.5 - EXHIBIT 4.5 - MARCUS CORP | tm205232d1_ex4-5.htm |
UNITED STATES
SECURITIES AND EXCHANGE COMMISSION
WASHINGTON, D.C. 20549
FORM 10-K
(Mark One)
| x | ANNUAL REPORT PURSUANT TO SECTION 13 OR 15(d) OF THE SECURITIES EXCHANGE ACT OF 1934 |
For the fiscal year ended December 26, 2019
| ¨ | TRANSITION REPORT PURSUANT TO SECTION 13 OR 15(d) OF THE SECURITIES EXCHANGE ACT OF 1934 |
For the transition period from ___________ to ___________
Commission File Number 1-12604
| THE MARCUS CORPORATION | ||
| (Exact name of registrant as specified in its charter) | ||
| Wisconsin | 39-1139844 | |
| (State or other jurisdiction of incorporation or organization) |
(I.R.S. Employer Identification No.) | |
| 100 East Wisconsin Avenue, Suite 1900 Milwaukee, Wisconsin |
53202-4125 | |
| (Address of principal executive offices) | (Zip Code) | |
| Registrant’s telephone number, including area code: (414) 905-1000 | ||
Securities registered pursuant to Section 12(b) of the Act:
| Title of Each Class Common stock, $1.00 par value |
Trading Symbol(s) MCS |
Name of Each Exchange on Which Registered New York Stock Exchange |
Securities registered pursuant to Section 12(g) of the Act:
None
Indicate by check mark if the registrant is a well-known seasoned issuer, as defined in Rule 405 of the Securities Act.
| Yes x | No ¨ |
Indicate by check mark if the registrant is not required to file reports pursuant to Section 13 or Section 15(d) of the Act.
| Yes ¨ | No x |
Indicate by check mark whether the registrant (1) has filed all reports required to be filed by Section 13 or 15(d) of the Securities Exchange Act of 1934 during the preceding 12 months (or for such shorter period that the registrant was required to file such reports), and (2) has been subject to filing requirements for the past 90 days.
| Yes x | No ¨ |
Indicate by check mark whether the registrant has submitted electronically every Interactive Data File required to be submitted pursuant to Rule 405 of Regulation S-T (§ 232.405 of this chapter) during the preceding 12 months (or for such shorter period that the registrant was required to submit such files).
| Yes x | No ¨ |
Indicate by check mark whether the registrant is a large accelerated filer, an accelerated filer, a non-accelerated filer, a smaller reporting company, or an emerging growth company. See the definitions of “large accelerated filer,” “accelerated filer,” “smaller reporting company” and “emerging growth company” in Rule 12b-2 of the Exchange Act.
| Large accelerated filer x | Accelerated filer ¨ | |
| Non-accelerated filer ¨ | Smaller reporting company ¨ | |
| Emerging growth company ¨ |
If an emerging growth company, indicate by check mark if the registrant has elected not to use the extended transition period for complying with any new or revised financial accounting standards provided pursuant to Section 13(a) of the Exchange Act. ¨
Indicate by check mark whether the registrant is a shell company (as defined in Rule 12b-2 of the Exchange Act).
| Yes ¨ | No x |
The aggregate market value of the registrant’s common equity held by non-affiliates as of June 27, 2019 was approximately $703,219,990. This value includes all shares of the registrant’s common stock, except for treasury shares and shares beneficially owned by the registrant’s directors and executive officers listed in Part I below.
Indicate the number of shares outstanding of each of the issuer’s classes of common stock, as of the latest practicable date.
Common stock outstanding at February 17, 2020 – 23,023,221
Class B common stock outstanding at February 17, 2020 – 7,925,504
Portions of the registrant’s definitive Proxy Statement for its 2020 annual meeting of shareholders, which will be filed with the Commission under Regulation 14A within 120 days after the end of our fiscal year, will be incorporated by reference into Part III to the extent indicated therein upon such filing.
PART I
Special Note Regarding Forward-Looking Statements
Certain matters discussed in this Annual Report on Form 10-K and the accompanying annual report to shareholders, particularly in the Shareholders’ Letter and Management’s Discussion and Analysis, are “forward-looking statements” intended to qualify for the safe harbors from liability established by the Private Securities Litigation Reform Act of 1995. These forward-looking statements may generally be identified as such because the context of such statements include words such as we “believe,” “anticipate,” “expect” or words of similar import. Similarly, statements that describe our future plans, objectives or goals are also forward-looking statements. Such forward-looking statements are subject to certain risks and uncertainties which may cause results to differ materially from those expected, including, but not limited to, the following: (1) the availability, in terms of both quantity and audience appeal, of motion pictures for our theatre division, as well as other industry dynamics such as the maintenance of a suitable window between the date such motion pictures are released in theatres and the date they are released to other distribution channels; (2) the effects of adverse economic conditions in our markets, particularly with respect to our hotels and resorts division; (3) the effects on our occupancy and room rates of the relative industry supply of available rooms at comparable lodging facilities in our markets; (4) the effects of competitive conditions in our markets; (5) our ability to achieve expected benefits and performance from our strategic initiatives and acquisitions; (6) the effects of increasing depreciation expenses, reduced operating profits during major property renovations, impairment losses, and preopening and start-up costs due to the capital intensive nature of our businesses; (7) the effects of weather conditions, particularly during the winter in the Midwest and in our other markets; (8) our ability to identify properties to acquire, develop and/or manage and the continuing availability of funds for such development; (9) the adverse impact on business and consumer spending on travel, leisure and entertainment resulting from terrorist attacks in the United States or other incidents of violence in public venues such as hotels and movie theatres; (10) a disruption in our business and reputational and economic risks associated with civil securities claims brought by shareholders; (11) our ability to timely and successfully integrate the Movie Tavern operations into our own circuit; and (12) our ability to achieve the additional revenues and operating income that we anticipate from our additional week of operations in fiscal 2020 and certain extraordinary events that will take place in or near Milwaukee during fiscal 2020, such as the Democratic National Convention and The Ryder Cup. Shareholders, potential investors and other readers are urged to consider these factors carefully in evaluating the forward-looking statements and are cautioned not to place undue reliance on such forward-looking statements. The forward-looking statements made herein are made only as of the date of this Form 10-K and we undertake no obligation to publicly update such forward-looking statements to reflect subsequent events or circumstances.
| Item 1. | Business. |
| General |
We are engaged primarily in two business segments: movie theatres and hotels and resorts.
As of December 26, 2019, our theatre operations included 91 movie theatres with 1,106 screens throughout 17 states (Wisconsin, Illinois, Iowa, Minnesota, Missouri, Nebraska, North Dakota, Ohio, Arkansas, Colorado, Georgia, Kentucky, Louisiana, New York, Pennsylvania, Texas and Virginia), including one movie theatre with 6 screens in Wisconsin owned by a third party and managed by us. We also operate a family entertainment center, Funset Boulevard, that is adjacent to one of our theatres in Appleton, Wisconsin, and own the Ronnie’s Plaza retail outlet in St. Louis, Missouri, an 84,000 square foot retail center featuring 21 shops and other businesses to which we lease retail space. As of the date of this Annual Report, we are the 4th largest theatre circuit in the United States.
As of December 26, 2019, our hotels and resorts operations included eight wholly-owned or majority-owned and operated hotels and resorts in Wisconsin, Illinois, Nebraska and Oklahoma. We also managed 12 hotels, resorts and other properties for third parties in Wisconsin, California, Minnesota, Nevada, Nebraska, Illinois and Texas. As of December 26, 2019, we owned or managed approximately 5,400 hotel and resort rooms.
Both of these business segments are discussed in detail below. For information regarding the revenues, operating income or loss, assets and certain other financial information of these segments for the last three full fiscal years, please see our Consolidated Financial Statements and the accompanying Note 14 in Part II below.
| 2 |
Strategic Plans
Please see our discussion under “Current Plans” in Item 7 – Management’s Discussion and Analysis of Financial Condition and Results of Operations.
Theatre Operations
At the end of fiscal 2019, we owned or operated 91 movie theatre locations with a total of 1,106 screens in Wisconsin, Illinois, Iowa, Minnesota, Missouri, Nebraska, North Dakota, Ohio, Arkansas, Colorado, Georgia, Kentucky, Louisiana, New York, Pennsylvania, Texas and Virginia. We averaged 12.2 screens per location at the end of fiscal 2019, compared to 13.1 screens per location at the end of fiscal 2018, compared to 13.0 screens at the end of fiscal 2017. Included in the fiscal 2019 and fiscal 2018 totals is one theatre with six screens that we manage for a third party and included in the fiscal 2017 total are two theatres with 11 screens that we managed for third parties. Our 90 company-owned facilities include 49 megaplex theatres (12 or more screens), representing approximately 67% of our total screens, 40 multiplex theatres (two to 11 screens) and one single-screen theatre. At the end of fiscal 2019, we operated 1,077 first-run screens, 6 of which we operated under management contracts, and 29 budget-oriented screens.
We invested over $350 million, excluding acquisitions, to further enhance the movie-going experience and amenities in new and existing theatres over the last six and one-half calendar years, with more investments planned for fiscal 2020. These investments include:
New theatres. In April 2017, we opened our new 10-screen Southbridge Crossing Cinema in Shakopee, Minnesota. This state-of-the-art theatre includes DreamLoungerSM recliner seating in all auditoriums, two UltraScreen DLX® auditoriums, as well as a Take FiveSM Lounge and Zaffiro’s® Express outlet. In June 2017, we opened our first stand-alone all in-theatre dining location, branded BistroPlex® located in Greendale, Wisconsin. This theatre features eight in-theatre dining auditoriums with DreamLounger recliners, including two SuperScreen DLX® auditoriums, plus a separate full-service Take Five Lounge. In October 2019, we opened our new eight-screen Movie Tavern® by Marcus theatre in Brookfield, Wisconsin. This new theatre became the first Movie Tavern by Marcus in Wisconsin. It includes eight auditoriums, each with laser projection and comfortable DreamLounger recliner seating, a full-service bar and food and drink center, and a new delivery-to-seat service model that also allows guests to order food and beverage via our mobile phone application or in-theatre kiosk. Another new nine-screen theatre is currently under construction in Tacoma, Washington, with an expected opening date during our fiscal 2020 fourth quarter. In addition, we will consider additional sites for potential new theatre locations in both new and existing markets.
Theatre acquisitions. In addition to building new theatres, we believe acquisitions of existing theatres or theatre circuits is also a viable growth strategy for us. On February 1, 2019, we acquired the assets of Movie Tavern, a New Orleans-based industry leading circuit known for its in-theatre dining concept featuring chef-driven menus, premium quality food and drink and luxury seating. Now branded Movie Tavern by Marcus, the acquired circuit consisted of 208 screens at 22 locations in nine states – Arkansas, Colorado, Georgia, Kentucky, Louisiana, New York, Pennsylvania, Texas and Virginia. The purchase price consisted of $30 million in cash, subject to certain adjustments, and 2,450,000 shares of our common stock (157,056 of which have been placed in escrow to secure certain post-closing indemnification obligations of the seller under the asset purchase agreement), for a total purchase price of approximately $139.3 million, based upon our closing share price on January 31, 2019. The acquisition of the Movie Tavern circuit increased our total number of screens by an additional 23%. The movie theatre industry is very fragmented, with approximately 50% of United States screens owned by the three largest theatre circuits and the other 50% owned by an estimated 800 smaller operators, making it very difficult to predict when acquisition opportunities may arise. We do not believe that we are geographically constrained, and we believe that we may be able to add value to certain theatres through our various proprietary amenities and operating expertise.
| 3 |
DreamLounger recliner additions. These luxurious, state-of-the-art recliners allow guests to go from upright to a full-recline position in seconds. These seat changes require full auditorium remodels to accommodate the necessary 84 inches of legroom, resulting in the loss of approximately 50% of the existing traditional seats in an average auditorium. To date, the addition of DreamLoungers has increased attendance at each of our applicable theatres, outperforming nearby competitive theatres and growing the overall market attendance in most cases. Initially, 12 of the 22 acquired Movie Tavern theatres had recliner seating. We added DreamLounger recliner seats to four additional existing Movie Tavern theatres during fiscal 2019, as well as one Marcus Wehrenberg® theatre and one newly built Movie Tavern theatre. As of December 26, 2019, we offered all DreamLounger recliner seating in 63 theatres, representing approximately 72% of our company-owned, first-run theatres. Including our premium, large format (PLF) auditoriums with recliner seating, as of December 26, 2019, we offered our DreamLounger recliner seating in approximately 77% of our company-owned, first-run screens, a percentage we believe to be the highest among the largest theatre chains in the nation. We completed the addition of DreamLounger recliner seats to another Movie Tavern location during the first quarter of fiscal 2020, and we are currently evaluating opportunities to add our DreamLounger premium seating to several additional theatres during the second half of fiscal 2020.
UltraScreen DLX and SuperScreen DLX (DreamLounger eXperience) conversions. We introduced one of the first PLF presentations to the industry when we rolled out our proprietary UltraScreen® concept approximately 20 years ago. We later introduced our UltraScreen DLX concept by combining our premium, large-format presentation with DreamLounger recliner seating and Dolby® Atmos™ immersive sound to elevate the movie-going experience for our guests. More recently, we began including heated DreamLounger recliner seating in our DLX auditoriums. During fiscal 2019, we opened one new UltraScreen DLX at an existing Marcus Wehrenberg theatre and converted one existing screen into an UltraScreen DLX auditorium at a Movie Tavern by Marcus theatre. During fiscal 2019, we also converted 26 existing screens at 13 Movie Tavern by Marcus theatres and two existing screens at one Marcus Wehrenberg theatre to SuperScreen DLX auditoriums and opened one new SuperScreen DLX auditorium at a newly built Movie Tavern by Marcus theatre. Most of our PLF screens now include the added feature of heated DreamLounger recliner seats. As of December 26, 2019, we had 31 UltraScreen DLX auditoriums, one traditional UltraScreen auditorium, 80 SuperScreen DLX auditoriums (a slightly smaller screen than an UltraScreen but with the same DreamLounger seating and Dolby Atmos sound) and three IMAX® PLF screens at 63 of our theatre locations. As of December 26, 2019, we offered at least one PLF screen in approximately 72% of our first-run, company-owned theatres – once again a percentage we believe to be the highest percentage among the largest theatre chains in the nation. Our PLF screens generally have higher per-screen revenues and draw customers from a larger geographic region compared to our standard screens, and we charge a premium price to our guests for this experience. We are currently evaluating opportunities to convert several additional existing screens to SuperScreen DLX auditoriums in fiscal 2020. In addition, our new theatre under construction in Tacoma, Washington will include one PLF auditorium.
Signature cocktail and dining concepts. We have continued to further enhance our food and beverage offerings within our existing theatres. We believe our 50-plus years of food and beverage experience in the hotel and restaurant businesses provides us with a unique advantage and expertise that we can leverage to further grow revenues in our theatres. The concepts we are expanding include:
| i | Take Five Lounge, Take Five Express and The Tavern – these full-service bars offer an inviting atmosphere and a chef-inspired dining menu, along with a complete selection of cocktails, locally-brewed beers and wines. We also offer full liquor service through the concession stand at two theatres. We acquired 22 new bars, known as The Tavern, in conjunction with our Movie Tavern acquisition and opened a new Tavern at our new Brookfield, Wisconsin Movie Tavern by Marcus theatre in fiscal 2019. As of December 26, 2019, we offered bars at 51 theatres, representing approximately 59% of our company-owned, first-run theatres. We are currently evaluating opportunities to add bar service to up to three additional theatres during fiscal 2020, including our new theatre in Tacoma, Washington. |
| i | Zaffiro’s Express – these outlets offer lobby dining that includes appetizers, sandwiches, salads, desserts and our signature Zaffiro’s THINCREDIBLE® handmade thin-crust pizza. In select locations without a Take Five Lounge outlet, we offer beer and wine at the Zaffiro’s Express outlet. We opened one new Zaffiro’s Express outlet during fiscal 2019 at our new Movie Tavern by Marcus location in Brookfield, Wisconsin, increasing our number of theatres with this concept to 29 as of December 26, 2019, representing approximately 45% of our company-owned, first-run theatres (excluding our in-theatre dining Movie Tavern theatres). We also operate three Zaffiro’s Pizzeria and Bar full-service restaurants. |
| 4 |
| i | Reel Sizzle® – this signature dining concept serves menu items inspired by classic Hollywood and the iconic diners of the 1950s. We offer Americana fare like burgers and chicken sandwiches prepared on a griddle behind the counter, along with chicken tenders, crinkle-cut fries, ice cream and signature shakes. Our new Movie Tavern by Marcus in Brookfield, Wisconsin includes a Real Sizzle. As of December 26, 2019, we operated eight Reel Sizzle outlets, and we expect to add one Reel Sizzle outlet to the new theatre currently under construction in Tacoma, Washington. |
| i | Other in-lobby dining – We also operate one Hollywood Café at an existing theatre, and four of the Marcus Wehrenberg theatres offer in-lobby dining concepts, operating under names such as Fred’s Drive-In or Five Star. In addition, we are currently testing a Mexican food concept at one theatre, and we are considering expanding this new concept during fiscal 2020. Including these additional concepts, as of December 26, 2019, we offered one or more in-lobby dining concepts in 40 theatres, representing approximately 62% of our company-owned, first-run theatres (excluding our in-theatre dining Movie Tavern theatres). |
| i | In-theatre dining – As of December 26, 2019, we offered full-service, in-theatre dining with a complete menu of drinks and chef-prepared salads, sandwiches, entrées and desserts at 32 theatres and a total of 248 auditoriums, operating under the names Big Screen BistroSM, Big Screen Bistro ExpressSM, BistroPlex and Movie Tavern by Marcus, representing approximately 37% of our company-owned, first-run theatres. |
We offer a “$5 Tuesday” promotion at every theatre in our circuit that includes a free complimentary-size popcorn to our loyalty program members. We have seen our Tuesday attendance increase dramatically since the introduction of the $5 Tuesday promotion. We believe this promotion has increased movie-going frequency and reached a customer who may have stopped going to the movies because of price, creating another “weekend” day for us without adversely impacting the movie-going habits of our regular weekend customers. We introduced our $5 Tuesday promotion with the free popcorn for loyalty members at our Marcus Wehrenberg theatres immediately upon acquisition in December 2016 and did the same thing in February 2019 with our newly acquired Movie Tavern theatres. We experienced an increase in Tuesday performance at the Marcus Wehrenberg theatres and have seen a similar response from customers at our Movie Tavern theatres. We also offer a “$6 Student Thursday” promotion at all of our locations that has been well received by that particular customer segment. In addition, we offer a $6 “Young-at-Heart” program for seniors on Friday afternoons that was also introduced to our Movie Tavern locations during our fiscal 2019 first quarter.
We offer what we believe to be a best-in-class customer loyalty program called Magical Movie RewardsSM. We currently have approximately 3.8 million members enrolled in the program. Approximately 42% of all transactions in our theatres during fiscal 2019 were completed by registered members of the loyalty program. The program allows members to earn points for each dollar spent and access special offers available only to members. The rewards are redeemable at the box office, concession stand or at the many Marcus Theatres® food and beverage venues. In addition, we have partnered with Movio, a global leader in data analysis for the cinema industry, to allow more targeted communication with our loyalty members. The software provides us with insight into customer preferences, attendance habits and general demographics, which we believe will help us deliver customized communication to our members. In turn, members of this program can enjoy and plan for a more personalized movie-going experience. The program also gives us the ability to cost effectively promote non-traditional programming and special events, particularly during non-peak time periods. We believe that this will result in increased movie-going frequency, more frequent visits to the concession stand, increased loyalty to Marcus Theatres and ultimately, improved operating results. The acquired Wehrenberg theatres offered a loyalty program to their customers that had approximately 200,000 members. We converted these members to our Magical Movie Rewards program during fiscal 2017. The acquired Movie Tavern theatres did not offer a loyalty program to their customers. We introduced our Magical Movie Rewards program to these theatres during the second quarter of fiscal 2019 after all necessary technology requirements were completed.
We have recently enhanced our mobile ticketing capabilities, our downloadable Marcus Theatres mobile application, and our marcustheatres.com website. We also recently added food and beverage ordering capabilities to our mobile application at select theatres, including our recently opened Movie Tavern location in Brookfield, Wisconsin. We will continue to install additional theatre-level technology, such as new ticketing kiosks, digital menu boards and concession advertising monitors. Each of these enhancements is designed to improve customer interactions, both at the theatre and through mobile platforms and other electronic devices.
| 5 |
The addition of digital technology throughout our circuit (we offer digital cinema projection on 100% of our first-run screens) has provided us with additional opportunities to obtain non-motion picture programming from other new and existing content providers, including live and pre-recorded performances of the Metropolitan Opera, as well as sports, music and other events, at many of our locations. We offer weekday and weekend alternate programming at many of our theatres across our circuit. The special programming includes classic movies, live performances, comedy shows and children’s performances. We believe this type of programming is more impactful when presented on the big screen and provides an opportunity to continue to expand our audience base beyond traditional moviegoers.
Revenues for the theatre business, and the motion picture industry in general, are heavily dependent on the general audience appeal of available films, together with studio marketing, advertising and support campaigns, factors over which we have no control. Consistent with prior periods in which blockbusters accounted for a significant portion of our total admission revenues, our top 15 performing films accounted for 48% of our fiscal 2019 total admission revenues and 42% of our fiscal 2018 total admission revenues. The following five fiscal 2019 films accounted for nearly 26% of our total admission revenues for our circuit: Avengers: Endgame, The Lion King, Frozen 2, Toy Story 4 and Captain Marvel.
We obtain our films from several national motion picture production and distribution companies, and we are not dependent on any single motion picture supplier. Our booking, advertising, concession purchases and promotional activities are handled centrally by our administrative staff.
We strive to provide our movie patrons with high-quality picture and sound presentation in clean, comfortable, attractive and contemporary theatre environments. All of our movie theatre complexes feature digital cinema technology; either digital sound, Dolby or other stereo sound systems; acoustical ceilings; side wall insulation; engineered drapery folds to eliminate sound imbalance, reverberation and distortion; tiled floors; cup-holder chair-arms; and computer-controlled heating, air conditioning and ventilation. We offer stadium seating, a tiered seating system that permits unobstructed viewing, at substantially all of our first-run screens. Computerized box offices permit all of our movie theatres to sell tickets in advance and all of our theatres offer reserved seating. Our theatres are accessible to persons with disabilities and provide wireless headphones for hearing-impaired moviegoers. Other amenities at certain theatres include touch-screen, computerized, self-service ticket kiosks, which simplify advance ticket purchases. We have an agreement to allow moviegoers to buy tickets on Fandango, the largest online ticket-seller.
We have a master license agreement with a subsidiary of Cinedigm Digital Cinema Corp. to deploy digital cinema systems in the majority of our company-owned theatre locations. Under the terms of the agreement, Cinedigm’s subsidiary purchased the digital projection systems and licensed them to us under a long-term arrangement. The costs to deploy this new technology are being covered primarily through the payment of virtual print fees from studios to our selected implementation company, Cinedigm. Our goals from digital cinema included delivering an improved film presentation to our guests, increasing scheduling flexibility, providing a platform for additional 3D presentations as needed, as well as maximizing the opportunities for alternate programming that may be available with this technology. As of December 26, 2019, we had the ability to offer digital 3D presentations in 386, or approximately 36%, of our first-run screens, including the vast majority of our UltraScreens. We have the ability to increase the number of digital 3D capable screens we offer to our guests in the future as needed, based on the number of digital 3D films anticipated to be released during future periods and our customers’ response to these 3D releases.
We sell food and beverage concessions in all of our movie theatres. We believe that a wide variety of food and beverage items, properly merchandised, increases concession revenue per patron. Although popcorn and soda remain the traditional favorites with moviegoers, we continue to upgrade our available concessions by offering varied choices. For example, some of our theatres offer hot dogs, pizza, ice cream, pretzel bites, frozen yogurt, coffee, mineral water and juices. We have also added self-serve soft drink dispensers and grab-and-go candy, frozen treat and bottled drink kiosks to many of our theatres. In recent years, we have added signature cocktail and dining concepts as described above. The response to our new food and beverage offerings has been positive, and we have plans to expand these food and beverage concepts at additional locations in the future.
| 6 |
We have a variety of ancillary revenue sources in our theatres, with the largest related to the sale of pre-show and lobby advertising (through our current advertising providers, Screenvision and National CineMedia). We also obtain ancillary revenues from corporate and group meeting sales, sponsorships, internet surcharge fees and alternate auditorium uses. We continue to pursue additional strategies to increase our ancillary revenue sources.
We also own a family entertainment center, Funset Boulevard, adjacent to our 14-screen movie theatre in Appleton, Wisconsin. Funset Boulevard features a 40,000 square foot Hollywood-themed indoor amusement facility that includes a restaurant, party room, laser tag center, virtual reality games, arcade, outdoor miniature golf course and batting cages.
We also own and operate the Ronnie’s Plaza retail outlet in St. Louis, Missouri, an 84,000 square foot retail center featuring 21 shops and other businesses to which we lease retail space.
Hotels and Resorts Operations
Owned and Operated Hotels and Resorts
The Pfister® Hotel
We own and operate The Pfister Hotel, which is located in downtown Milwaukee, Wisconsin. The Pfister Hotel is a full-service luxury hotel and has 307 guest rooms (including 71 luxury suites), the exclusive Pfister VIP Club Lounge, two restaurants (including our signature restaurant, Mason Street Grill), three cocktail lounges, a state-of-the-art WELL Spa® + Salon, a high-tech executive boardroom, high-end retail space leased to tenants and a 275-car parking ramp. The Pfister also has 25,000 square feet of banquet and convention facilities, including one of the largest ballrooms in the Milwaukee metropolitan area. In 2018, we celebrated The Pfister Hotel’s 125th anniversary. In 2019, The Pfister Hotel earned its 43rd consecutive AAA Four Diamond Award from the American Automobile Association, which represents every year the award has been in existence. Also in 2019, The Pfister was recognized as a top hotel in the Midwest in Condé Nast Traveler’s Readers’ Choice Awards and the number one downtown Milwaukee hotel by U.S. News & World Report. The Pfister currently holds the TripAdvisor® Certificate of Excellence distinction and is a member of Preferred Hotels and Resorts, an organization of independent luxury hotels and resorts, and Historic Hotels of America.
The Hilton Milwaukee City Center
We own and operate the 729-room Hilton Milwaukee City Center. The hotel has two cocktail lounges, three restaurants (including our first Miller Time® Pub & Grill), and an 870-car parking ramp. Directly connected to the Wisconsin Center convention facility by skywalk, the hotel offers more than 30,000 square feet of meeting and event spaces with state-of-the-art technologies. In 2019, the Hilton Milwaukee City Center earned its eighth consecutive AAA Four Diamond Award from the American Automobile Association and was recognized by Meetings Today as the Best of MidAmerica winner.
Hilton Madison Monona Terrace
We own and operate the 240-room Hilton Madison Monona Terrace in Madison, Wisconsin. The Hilton Madison Monona Terrace is connected by skywalk to the Monona Terrace Community and Convention Center and has five meeting rooms totaling 4,200 square feet, an indoor swimming pool, a fitness center, a lounge and a restaurant. The Hilton Madison Monona Terrace currently holds the TripAdvisor® Certificate of Excellence distinction. A major renovation of this hotel was completed in 2019, including common areas and guestrooms.
The Grand Geneva® Resort & Spa
We own and operate the Grand Geneva Resort & Spa in Lake Geneva, Wisconsin. This destination resort is located on 1,300 acres and includes 355 guest rooms, 29 new two and three bedroom villas, the exclusive Geneva Club Lounge, over 60,000 square feet of banquet, meeting and exhibit space, over 13,000 square feet of ballroom space, three specialty restaurants, two cocktail lounges, two championship golf courses, a ski hill, indoor and outdoor tennis courts, three swimming pools, a state-of-the-art WELL Spa® + Salon and fitness complex, horse stables and an on-site airport. In 2019, the Grand Geneva Resort & Spa earned its 21st consecutive AAA Four Diamond Award from the American Automobile Association. The resort was also recognized as one of the top five resorts in the Midwest in Condé Nast Traveler’s Readers’ Choice Awards and named among the top two Best Resorts in Wisconsin by U.S. News & World Report for 2019. The resort currently holds the TripAdvisor® Certificate of Excellence distinction and was named to the TripAdvisor® Award of Excellence Hall of Fame.
| 7 |
The Skirvin Hilton
We are the principal equity partner and operator of The Skirvin Hilton hotel in Oklahoma City, Oklahoma, the oldest hotel in Oklahoma. This historic hotel has 225 rooms, including 20 one-bedroom suites and one Presidential Suite. The Skirvin Hilton has a restaurant, lounge, fitness center, indoor swimming pool, business center and approximately 18,500 square feet of meeting space. In 2019, The Skirvin Hilton earned its 12th consecutive AAA Four Diamond Award from the American Automobile Association and was named among the top three Best Hotels in Oklahoma City by U.S. News & World Report. The hotel currently holds the TripAdvisor® Certificate of Excellence distinction. In 2016, we completed a major renovation project at The Skirvin Hilton Hotel, which included renovations of all guestrooms and the lobby and bar areas. Our equity interest in this hotel was 60% as of December 26, 2019.
AC Hotel Chicago Downtown
Pursuant to a long-term lease, we operate the AC Hotel Chicago Downtown, a 226-room hotel in Chicago, Illinois. Located in the heart of Chicago’s shopping, dining and entertainment district, the AC Hotel by Marriott lifestyle brand targets the millennial traveler searching for a design-led hotel in a vibrant location with high-quality service. The AC Hotel Chicago Downtown features urban, simplistic and clean designs with European aesthetics and elegance, the latest technology and communal function spaces. Amenities include the AC Lounge, a bar area with cocktails, craft beers, wine and tapas, and the AC Kitchen, serving a European-inspired breakfast menu. The AC Hotel Chicago Downtown also features an indoor swimming pool, fitness room, 3,000 square feet of meeting space and an on-site parking facility. The hotel currently holds the TripAdvisor® Certificate of Excellence distinction. Our SafeHouse® Chicago is in space connected to this hotel and the hotel has additional space leased to an area restaurant.
The Lincoln Marriott Cornhusker Hotel
We own and operate The Lincoln Marriott Cornhusker Hotel in downtown Lincoln, Nebraska. The Lincoln Marriott Cornhusker Hotel is a 297-room, full-service hotel with 45,600 square feet of meeting space and a Miller Time Pub & Grill. We also own the Cornhusker Office Plaza, which is a seven-story building with a total of 85,592 square feet of net leasable office space connected to the hotel by a three-story atrium that is used for local events and exhibits.
Saint Kate®–The Arts Hotel
In January 2019, we closed for renovation one of our owned hotels, the InterContinental Milwaukee hotel, and reopened it in June 2019 as Saint Kate–The Arts Hotel. Located in the heart of Milwaukee’s theatre and entertainment district, the 219-room hotel features art-inspired guestrooms, 13,000 square feet of flexible meeting space, 11 event rooms and three restaurants, as well as two bars and lounge areas. The hotel also includes a theatre that features plays, lectures, classes and musical and dance performances, a world-class gallery space, and other event spaces that host rotating exhibitions, screenings, workshops and more. Saint Kate–The Arts Hotel was named as a Best New Hotel of 2019 in the USA Today 10Best Readers’ Choice Awards.
Managed Hotels, Resorts and Other Properties
We also manage hotels, resorts and other properties for third parties, typically under long-term management agreements. Revenues from these management contracts may include both base management fees, often in the form of a fixed percentage of defined revenues, and incentive management fees, typically calculated based upon defined profit performance. We may also earn fees for technical and preopening services before a property opens, as well as for ongoing accounting and technology services.
In April 2019, we assumed management of the Hyatt Regency Schaumburg in Schaumburg, Illinois. The newly renovated Hyatt Regency Schaumburg is conveniently located approximately 15 miles from Chicago O’Hare International Airport and 30 miles from downtown Chicago and is near some of Chicagoland’s most popular attractions and energetic business hubs. This 468-room hotel has more than 30,000 square feet of indoor and outdoor meeting and event space and versatile venues such as a 3,100 square foot terrace. The hotel and its event venues feature the latest audiovisual and state-of-the-art technology, innovative on-site catering and complimentary parking for guests.
| 8 |
We manage the Murieta Inn and Spa in Rancho Murieta, California. Located near wine country and within the development containing the renowned Murieta Equestrian Center, the largest equestrian facility in California, the 83-room hotel features The Gate, a one-of-a-kind restaurant and bar that offers fresh, seasonal menus using ingredients from the hotel’s five-acre farm and state-of-the-art greenhouse. The hotel has a resort-style outdoor pool and a luxury salon and day spa. The Murieta Inn and Spa also offers up to 15,000 square feet of indoor and outdoor meeting and event space with the latest audio visual and state-of the-art technology. The hotel currently holds the TripAdvisor® Certificate of Excellence distinction.
We manage the DoubleTree by Hilton El Paso Downtown in El Paso, Texas. Situated in El Paso’s Museum District, near the city’s prominent convention and performing arts center, the 200-room DoubleTree by Hilton El Paso Downtown features a rooftop pool and sun deck, along with 8,500 square feet of meeting space.
We manage the Courtyard by Marriott El Paso Downtown/Convention Center, which opened in August 2018. The Courtyard by Marriott El Paso Downtown/Convention Center has 151 guest rooms, two meeting rooms and an outdoor terrace-top pool.
We manage the Crowne Plaza-Northstar Hotel in Minneapolis, Minnesota. The Crowne Plaza-Northstar Hotel is located in downtown Minneapolis and has 222 guest rooms, 10,000 square feet of meeting space, an outdoor Skygarden for group events, a restaurant, a cocktail lounge and an exercise facility.
We manage The Garland hotel in North Hollywood, California. The Garland hotel has 257 recently renovated guest rooms, including 12 suites, over 23,000 square feet of meeting and event space, including an amphitheater, a ballroom and an outdoor event venue ideal for weddings, a restaurant, well-equipped fitness center and an outdoor swimming pool with two hot tubs. The mission-style hotel is located on seven acres near Universal Studios Hollywood. The hotel currently holds the TripAdvisor® Certificate of Excellence distinction. In 2019, The Garland was recognized as a top hotel in Los Angeles in Condé Nast Traveler’s Readers’ Choice Awards for the fifth year in a row. Additionally, The Garland was recognized as a Top 10 hotel in greater Los Angeles as ranked by the 2019 Travel + Leisure World’s Best Awards.
We manage the Hilton Garden Inn Houston NW/Willowbrook in Houston, Texas. The Hilton Garden Inn Houston NW/Willowbrook has 171 guest rooms, a ballroom, a restaurant, a fitness center, a convenience mart and a swimming pool. The hotel currently holds the TripAdvisor® Certificate of Excellence distinction.
We manage the Hilton Minneapolis/Bloomington in Bloomington, Minnesota. This hotel offers 257 rooms, 9,200 square feet of meeting space, an indoor swimming pool and a fitness center. The hotel currently holds the TripAdvisor® Certificate of Excellence distinction.
We manage and own a 10% minority equity interest in the Omaha Marriott Downtown at The Capitol District hotel. The 333-room, 12-story full service hotel serves as an anchor for the Capitol District, an upscale urban destination dining and entertainment community in downtown Omaha, Nebraska. The development also includes 218 luxury residential apartments, office space, a parking garage and retail space for restaurants, shops and entertainment. It also features a plaza for events and concerts. The hotel currently holds the TripAdvisor® Certificate of Excellence distinction.
We formerly managed the Heidel House Resort & Spa in Green Lake, Wisconsin. On May 20, 2019, the owners of this resort closed this property permanently.
We formerly managed the Sheraton Chapel Hill Hotel in Chapel Hill, North Carolina. In August 2019, the owners sold the hotel, and as a result our contract to manage the hotel was terminated.
| 9 |
We also provide hospitality management services, including check-in, housekeeping and maintenance, for a vacation ownership development adjacent to the Grand Geneva Resort & Spa branded as the Holiday Inn Club Vacations at Lake Geneva Resort. The development includes 68 two-room timeshare units (136 rooms) and a timeshare sales center.
We also manage two condominium hotels under long-term management contracts. Revenues from these management contracts are larger than typical management contracts because, under an agreed-upon rental pool arrangement, room revenues are shared at a defined percentage with individual condominium owners. In addition, we own all of the common areas of these facilities, including all restaurants, lounges, spas and gift shops, and retain all of the revenues from these outlets.
We manage the Timber Ridge Lodge, an indoor/outdoor water park and condominium hotel complex in Lake Geneva, Wisconsin. The Timber Ridge Lodge is a 225-unit condominium hotel on the same campus as the Grand Geneva Resort & Spa. The Timber Ridge Lodge has meeting rooms totaling 3,640 square feet, a general store, a restaurant-cafe, a snack bar and lounge, a fitness center and an entertainment arcade. The hotel currently holds the TripAdvisor® Certificate of Excellence distinction.
We manage the Platinum Hotel & Spa, a condominium hotel in Las Vegas, Nevada just off the Las Vegas Strip, and own the hotel’s public space. The Platinum Hotel & Spa has 255 one and two-bedroom suites. This non-gaming, non-smoking hotel also has an on-site restaurant, lounge, a WELL Spa® + Salon and 14,897 square feet of meeting space, including 6,336 square feet of outdoor space. The hotel currently holds the TripAdvisor® Certificate of Excellence distinction. We own 16 previously unsold condominium units at the Platinum Hotel & Spa.
We own a 0.49% minority interest in The Hotel Zamora and Castile Restaurant in St. Pete Beach, Florida. We have agreed to sell this interest to the majority owner during the next several years.
We own the SafeHouse in Milwaukee, Wisconsin after purchasing it in 2015. The SafeHouse is an iconic, spy-themed restaurant and bar that has operated in Milwaukee for over 50 years. We opened a new SafeHouse location in Chicago, Illinois in 2017 and also opened the EscapeHouse Chicago, a complimentary business capitalizing on the popularity of cooperative team escape games.
Our Wisconsin Hospitality Linen Service (WHLS) business unit provides commercial laundry services for our hotel and resort properties in Wisconsin and for other unaffiliated hotels in the Midwest. WHLS currently processes nearly 16 million pounds of linen each year. WHLS has been a leader in commercial laundry services for the hospitality industry in the Midwest for over 20 years.
We have taken our highly-regarded web development team and created a new business unit managed by the hotels and resorts division called Graydient Creative. Graydient focuses on website design and development, branding and print design, social media management and new software and application development for both our own properties and third party clients.
We operate many award winning restaurants and lounges within our hotel portfolio that have earned distinctions such as the TripAdvisor® Certificate of Excellence and the Wine Spectator Award of Excellence.
In 2017, we were awarded the Service Excellence Award by Governor Scott Walker at the Wisconsin Governor’s Conference on Tourism. The Service Excellence Award honors a Wisconsin business that has achieved significant success and growth by providing exceptional service to its customers and a strong charitable involvement in its community. Marcus® Hotels & Resorts received the award for its ongoing commitment to supporting Wisconsin charities and tourism-driven initiatives. In 2019, we were one of ten nationwide recipients of the Americans for the Arts’ Arts and Business Partnership Award, which recognizes businesses for their exceptional involvement with the arts that enriches the workplace, enhances education and transforms communities.
| 10 |
| Competition |
Both of our businesses experience intense competition from national, regional and local chain and franchise operations, some of which have substantially greater financial and marketing resources than we have. Most of our facilities are located in close proximity to competing facilities.
Our movie theatres compete with large national movie theatre operators, such as AMC Entertainment, Cinemark and Regal Cinemas, as well as with a wide array of smaller first-run exhibitors. Movie exhibitors also face competition from a number of other movie exhibition delivery systems, such as streaming services, digital downloads, video-on-demand, pay-per-view television, DVDs and network and syndicated television. We also face competition from other forms of entertainment competing for the public’s leisure time and disposable income.
Our hotels and resorts compete with the hotels and resorts operated and/or franchised by Hyatt Corporation, Marriott Corporation, Hilton Worldwide and others, along with other regional and local hotels and resorts. Increasingly, we also face competition from new channels of distribution in the travel industry, such as peer-to-peer inventory sources that allow travelers to book stays on websites that facilitate short-term rental of homes and apartments from owners, thereby providing an alternative to hotel rooms, such as Airbnb, Vrbo and HomeAway. We compete for hotel management agreements with a wide variety of national, regional and local management companies based upon many factors, including the value and quality of our management services, our reputation, our ability and willingness to invest our capital in joint venture projects, the level of our management fees and our relationships with property owners and investors.
We believe that the principal factors of competition in both of our businesses, in varying degrees, are the price and quality of the product, quality and location of our facilities and customer service. We believe that we are well positioned to compete on the basis of these factors.
| Seasonality |
Our first fiscal quarter typically produces the weakest operating results in our hotels and resorts division due primarily to the effects of reduced travel during the winter months. Our second and third fiscal quarters often produce our strongest operating results because these periods coincide with the typical summer seasonality of the movie theatre industry and the summer strength of the lodging business. Due to the fact that the week between Christmas and New Year’s Eve is historically one of the strongest weeks of the year for our theatre division, the specific timing of the last Thursday in December has an impact on the results of our fiscal first and fourth quarters in that division, particularly when we have a 53-week year.
Environmental Regulation
Federal, state and local environmental legislation has not had a material effect on our capital expenditures, earnings or competitive position. However, our activities in acquiring and selling real estate for business development purposes have been complicated by the continued emphasis that our personnel must place on properly analyzing real estate sites for potential environmental problems. This circumstance has resulted in, and is expected to continue to result in, greater time and increased costs involved in acquiring and selling properties associated with our various businesses.
| Employees |
As of December 26, 2019, we had approximately 10,500 employees, approximately 67% of whom were employed on a variable or part-time basis. A number of our (1) hotel employees at the Crowne Plaza Northstar in Minneapolis, Minnesota are covered by a collective bargaining agreement that expires on October 31, 2020; (2) operating engineers at The Pfister Hotel and the Hilton Milwaukee City Center are covered by collective bargaining agreements that expire on April 30, 2020 and December 31, 2019, respectively; (3) hotel employees at the Hilton Milwaukee City Center and The Pfister Hotel are covered by a collective bargaining agreement that expires on February 14, 2022; (4) painters in the Hilton Milwaukee City Center and The Pfister Hotel are covered by a collective bargaining agreement that expires on May 31, 2022; and (5) operating engineers at the Hyatt Regency Schaumburg are covered by a collective bargaining agreement that expires on February 29, 2020.
As of the end of fiscal 2019, approximately 6% of our employees were covered by a collective bargaining agreement, of which approximately 16% were covered by an agreement that will expire within one year.
| 11 |
Website Information and Other Access to Corporate Documents
Our corporate website is www.marcuscorp.com. All of our Form 10-Ks, Form 10-Qs and Form 8-Ks, and amendments thereto, are available on this website as soon as practicable after they have been filed with the SEC. We are not including the information contained on our website as part of, or incorporating it by reference into, this Annual Report. In addition, our corporate governance guidelines and the charters for our Audit Committee, Compensation Committee and Corporate Governance and Nominating Committee are available on our website. If you would like us to mail you a copy of our corporate governance guidelines or a committee charter, please contact Thomas F. Kissinger, Senior Executive Vice President, General Counsel and Secretary, The Marcus Corporation, 100 East Wisconsin Avenue, Suite 1900, Milwaukee, Wisconsin 53202-4125.
| Item 1A. | Risk Factors. |
The following risk factors and other information included in this Annual Report on Form 10-K should be carefully considered. The risks and uncertainties described below are not the only ones we face. Additional risks and uncertainties not presently known to us or that we currently deem immaterial also may impair our business operations. If any of the following risks occur, our business, financial condition, operating results, and cash flows could be materially adversely affected.
The Lack of Both the Quantity and Audience Appeal of Motion Pictures May Adversely Affect Our Financial Results.
The financial results of our movie theatre business and the motion picture industry in general are heavily dependent on the general audience appeal of available films, together with studio marketing, advertising and support campaigns, factors over which we have no control. The relative success of our movie theatre business will continue to be largely dependent upon the quantity and audience appeal of films made available by the movie studios and other producers. Poor performance of films, a disruption in the production of films due to events such as a strike by actors, writers or directors, or a reduction in the marketing efforts of the film distributors to promote their films could have an adverse impact on our business and results of operations. Also, our quarterly results of operations are significantly dependent on the quantity and audience appeal of films that we exhibit during each quarter. As a result, our quarterly results may be unpredictable and somewhat volatile.
Our Financial Results May be Adversely Impacted by Unique Factors Affecting the Theatre Exhibition Industry, Such as the Shrinking Video Release Window, the Increasing Piracy of Feature Films and the Increasing Use of Alternative Film Distribution Channels and Other Competing Forms of Entertainment.
Over the last decade, the average video release window, which represents the time that elapses from the date of a film’s theatrical release to the date a film is released to other channels, including streaming services, video on-demand (VOD) and DVD, has decreased from approximately six months to, in some cases, less than three months. In the past, more than one studio has discussed their interest in creating a new, shorter premium VOD window. We can provide no assurance that these release windows, which are determined by the film studios, will not shrink further, which could have an adverse impact on our movie theatre business and results of operations.
Piracy of motion pictures is prevalent in many parts of the world. Technological advances allowing the unauthorized dissemination of motion pictures increase the threat of piracy by making it easier to create, transmit and distribute high quality unauthorized copies of such motion pictures. The proliferation of unauthorized copies and piracy of motion pictures may have an adverse effect on our movie theatre business and results of operations.
We face competition for movie theatre patrons from a number of alternative motion picture distribution channels, such as DVD, network, cable and satellite television, video on-demand, pay-per-view television, digital downloads and streaming services. The number of streaming services has been increasing and, in some cases, streaming services are producing theatrical-quality original content that is bypassing the theatrical release window entirely. Periodically, internet ticketing intermediaries introduce services and products with the stated intention of increasing movie-going frequency. The actual impact these services and products may have on our relationship with the customer and our results of operations is unknown at this time. We also compete with other forms of entertainment competing for our patrons’ leisure time and disposable income such as concerts, amusement parks, sporting events, home entertainment systems, video games and portable entertainment devices such as MP3 players, tablet computers and smart phones. An increase in popularity of these alternative film distribution channels and competing forms of entertainment may have an adverse effect on our movie theatre business and results of operations.
| 12 |
A Deterioration in Relationships with Film Distributors Could Adversely Affect Our Ability to Obtain Commercially Successful Films or Increase Our Costs to Obtain Such Films.
We rely on the film distributors for the motion pictures shown in our theatres. Our business depends to a significant degree on maintaining good relationships with these distributors. Deterioration in our relationships with any of the major film distributors could adversely affect our access to commercially successful films or increase our costs to obtain such films and adversely affect our business and results of operations. Because the distribution of motion pictures is in large part regulated by federal and state antitrust laws and has been the subject of numerous antitrust cases and consent decrees, we cannot ensure a supply of motion pictures by entering into long-term arrangements with major distributors. Rather, we must compete for licenses on a film-by-film and theatre-by-theatre basis and are required to negotiate licenses for each film and for each theatre individually. We are periodically subject to audits on behalf of the film distributors to ensure that we are complying with the applicable license agreements.
The Relative Industry Supply of Available Rooms at Comparable Lodging Facilities May Adversely Affect Our Financial Results.
Historically, a material increase in the supply of new hotel rooms in a market can destabilize that market and cause existing hotels to experience decreasing occupancy, room rates and profitability. If such over-supply occurs in one or more of our major markets, we may experience an adverse effect on our hotels and resorts business and results of operations.
Adverse Economic Conditions in Our Markets May Adversely Affect Our Financial Results.
Downturns or adverse economic conditions affecting the United States economy generally, and particularly downturns or adverse economic conditions in the Midwest and in our other markets, adversely affect our results of operations, particularly with respect to our hotels and resorts division. Poor economic conditions can significantly adversely affect the business and group travel customers, which are the largest customer segments for our hotels and resorts division. Specific economic conditions that may directly impact travel, including financial instability of air carriers and increases in gas and other fuel prices, may adversely affect our results of operations. Additionally, although our theatre business has historically performed well during economic downturns as consumers seek less expensive forms of out-of-home entertainment, a significant reduction in consumer confidence or disposable income in general may temporarily affect the demand for motion pictures or severely impact the motion picture production industry, which, in turn, may adversely affect our results of operations.
If the Amount of Sales Made Through Third-Party Internet Travel Intermediaries Increases Significantly, Consumer Loyalty to Our Hotels Could Decrease and Our Revenues Could Fall.
We expect to derive most of our business from traditional channels of distribution. However, consumers now use internet travel intermediaries regularly. Some of these intermediaries are attempting to increase the importance of price and general indicators of quality (such as “four-star downtown hotel”) at the expense of brand/hotel identification. These agencies hope that consumers will eventually develop brand loyalties to their reservation system rather than to our hotels. If the amount of sales made through internet travel intermediaries increases significantly and consumers develop stronger loyalties to these intermediaries rather than to our hotels, we may experience an adverse effect on our hotels and resorts business and results of operations.
Each of Our Business Segments and Properties Experience Ongoing Intense Competition.
In each of our businesses we experience intense competition from national, regional and local chain and franchise operations, some of which have substantially greater financial and marketing resources than we have. Most of our facilities are located in close proximity to other facilities which compete directly with ours. The motion picture exhibition industry is fragmented and highly competitive with no significant barriers to entry. Theatres operated by national and regional circuits and by small independent exhibitors compete with our theatres, particularly with respect to film licensing, attracting patrons and developing new theatre sites. Moviegoers are generally not brand conscious and often choose a theatre based on its location, its selection of films and its amenities. With respect to our hotels and resorts division, our ability to remain competitive and to attract and retain business and leisure travelers depends on our success in distinguishing the quality, value and efficiency of our lodging products and services from those offered by others. If we are unable to compete successfully in either of our divisions, this could adversely affect our results of operations.
| 13 |
We May Not Achieve the Expected Benefits and Performance of Our Strategic Initiatives and Acquisitions.
Our key strategic initiatives in our theatre and hotels and resorts divisions often require significant capital expenditures to implement. We expect to benefit from revenue enhancements and/or cost savings as a result of these initiatives. However, there can be no assurance that we will be able to generate sufficient cash flow from these initiatives to provide the return on investment we anticipated from the required capital expenditures.
There also can be no assurance that we will be able to generate sufficient cash flow to realize anticipated benefits from any strategic acquisitions that we may enter into, including our acquisition of the Movie Tavern business. Although we have a history of successfully integrating acquisitions into our existing theatre and hotels and resorts businesses, any acquisition may involve operating risks, such as (1) the difficulty of assimilating and integrating the acquired operations and personnel into our current business; (2) the potential disruption of our ongoing business; (3) the diversion of management’s attention and other resources; (4) the possible inability of management to maintain uniform standards, controls, policies and procedures; (5) the risks of entering markets in which we have little or no expertise; (6) the potential impairment of relationships with employees; (7) the possibility that any liabilities we may incur or assume may prove to be more burdensome than anticipated; and (8) the possibility the acquired property or properties do not perform as expected.
Our Businesses are Heavily Capital Intensive and Preopening and Start-Up Costs, Increasing Depreciation Expenses and Impairment Charges May Adversely Affect Our Financial Results.
Both our movie theatre and hotels and resorts businesses are heavily capital intensive. Purchasing properties and buildings, constructing buildings, renovating and remodeling buildings and investing in joint venture projects all require substantial upfront cash investments before these properties, facilities and joint ventures can generate sufficient revenues to pay for the upfront costs and positively contribute to our profitability. In addition, many growth opportunities, particularly for our hotels and resorts division, require lengthy development periods during which significant capital is committed and preopening costs and early start-up losses are incurred. We expense these preopening and start-up costs currently. As a result, our results of operations may be adversely affected by our significant levels of capital investments. Additionally, to the extent we capitalize our capital expenditures, our depreciation expenses may increase, thereby adversely affecting our results of operations.
We periodically consider whether indicators of impairment of long-lived assets held for use are present. Demographic changes, economic conditions and competitive pressures may cause some of our properties to become unprofitable. Deterioration in the performance of our properties could require us to recognize impairment losses, thereby adversely affecting our results of operations.
Our Ability to Identify Suitable Properties to Acquire, Develop and Manage Will Directly Impact Our Ability to Achieve Certain of Our Growth Objectives.
A portion of our ability to successfully achieve our growth objectives in both our theatre and hotels and resorts divisions is dependent upon our ability to successfully identify suitable properties to acquire, develop and manage. Failure to successfully identify, acquire and develop suitable and successful locations for new lodging properties and theatres will substantially limit our ability to achieve these important growth objectives.
| 14 |
Our Ability to Identify Suitable Joint Venture Partners or Raise Equity Funds to Acquire, Develop and Manage Hotels and Resorts Will Directly Impact Our Ability to Achieve Certain of Our Growth Objectives.
In addition to acquiring or developing hotels and resorts or entering into management contracts to operate hotels and resorts for other owners, we have from time to time invested, and expect to continue to invest, as a joint venture partner. We have also indicated that we may act as an investment fund sponsor in order to acquire additional hotel properties. A portion of our ability to successfully achieve our growth objectives in our hotels and resorts division is dependent upon our ability to successfully identify suitable joint venture partners or raise equity funds to acquire, develop and manage hotels and resorts. Failure to successfully identify suitable joint venture partners or raise equity for an investment fund will substantially limit our ability to achieve these important growth objectives.
Adverse Economic Conditions, Including Disruptions in the Financial Markets, May Adversely Affect Our Ability to Obtain Financing on Reasonable and Acceptable Terms, if at All, and Impact Our Ability to Achieve Certain of Our Growth Objectives.
We expect that we will require additional financing over time, the amount of which will depend upon a number of factors, including the number of theatres and hotels and resorts we acquire and/or develop, the amount of capital required to refurbish and improve existing properties, the amount of existing indebtedness that requires repayment in a given year and the cash flow generated by our businesses. Downturns or adverse economic conditions affecting the United States economy generally, and the United States stock and credit markets specifically, may adversely impact our ability to obtain additional short-term and long-term financing on reasonable terms or at all, which would negatively impact our liquidity and financial condition. As a result, a prolonged downturn in the stock or credit markets would also limit our ability to achieve our growth objectives.
Investing Through Partnerships or Joint Ventures Decreases Our Ability to Manage Risk.
Joint venture partners may have shared control or disproportionate control over the operation of our joint venture assets. Therefore, our joint venture investments may involve risks such as the possibility that our joint venture partner in an investment might become bankrupt or not have the financial resources to meet its obligations, or have economic or business interests or goals that are inconsistent with our business interests or goals, or be in a position to take action contrary to our instructions or requests or contrary to our policies or objectives. Consequently, actions by our joint venture partners might subject hotels and resorts owned by the joint venture to additional risk. Further, we may be unable to take action without the approval of our joint venture partners. Alternatively, our joint venture partners could take actions binding on the joint venture without our consent.
Our Properties are Subject to Risks Relating to Acts of God, Terrorist Activity and War and Any Such Event May Adversely Affect Our Financial Results.
Acts of God, natural disasters, war (including the potential for war), terrorist activity (including threats of terrorist activity), incidents of violence in public venues such as hotels and movie theatres, epidemics (such as SARs, bird flu and swine flu), travel-related accidents, as well as political unrest and other forms of civil strife and geopolitical uncertainty may adversely affect the lodging and movie exhibition industries and our results of operations. Terrorism or other similar incidents may significantly impact business and leisure travel or consumer choices regarding out-of-home entertainment options and consequently demand for hotel rooms or movie theatre attendance may suffer. In addition, inadequate preparedness, contingency planning, insurance coverage or recovery capability in relation to a major incident or crisis may prevent operational continuity and consequently impact the reputation of our businesses.
We Rely on Our Information Systems to Conduct Our Business, and Any Failure to Protect Our Information Systems and Other Confidential Information Against Cyber Attacks or Other Information Security Breaches or Any Failure or Interruption to the Availability of Our Information Systems Could Have a Material Adverse Effect on Our Business.
The operation of our business depends on the efficient and uninterrupted operation of our information technology systems. Our information technology systems may become unavailable or may fail to perform as anticipated, for any reason, including cyber attacks, loss of power, or human error. Information security risks have generally increased in recent years because of the proliferation of new technologies and the increased sophistication and activities of perpetrators of cyber attacks. Any significant interruption in or failure of our information systems or any breach of our information systems or other confidential information could disrupt our business, result in the disclosure or misuse of confidential or proprietary information, damage our reputation, expose us to litigation, increase our costs or cause losses. As cyber and other information security threats continue to evolve, we may be required to expend additional resources to continue to enhance our information security measures or to investigate and remediate any information security vulnerabilities.
| 15 |
Recalls of Food Products and Associated Costs Could Adversely Affect Our Reputation and Financial Condition.
We may be found liable if the consumption of any of the food products we sell in our theatres or hotels causes illness or injury. We are also subject to recall by product manufacturers or if the food products become contaminated. Recalls could result in losses due to the cost of the recall, the destruction of the product and lost sales due to the unavailability of the product for a period of time.
We are Subject to Substantial Government Regulation, Which Could Entail Significant Cost.
We are subject to various federal, state and local laws, regulations and administrative practices affecting our business, and we must comply with provisions regulating health and sanitation standards, equal employment, environmental, and licensing for the sale of food and alcoholic beverages. Our properties must also comply with Title III of the Americans with Disabilities Act of 1990, or ADA. Compliance with the ADA requires that public accommodations “reasonably accommodate” individuals with disabilities and that new construction or alterations made to “commercial facilities” conform to accessibility guidelines unless “structurally impracticable” for new construction or technically infeasible for alterations. Non-compliance with the ADA could result in the imposition of injunctive relief, fines or an award of damages to private litigants or additional capital expenditures to remedy such noncompliance. Changes in existing laws or implementation of new laws, regulations and practices could also have a significant impact on our business. For example, a significant portion of our staff level employees are part time workers who are paid at or near the applicable minimum wage in the relevant jurisdiction. Increases in the minimum wage and implementation of reforms requiring the provision of additional benefits would increase our labor costs.
We are Subject to Complex Taxation and Could be Subject to Changes in Our Tax Rates, the Adoption of New Tax Legislation or Exposure to Additional Tax Liabilities.
We are subject to different forms of taxation at the federal, state and local jurisdictions where we operate. Current economic and political conditions make tax rates in any jurisdiction subject to significant change. A recent example includes the U.S. Tax Cuts and Jobs Act signed into law in December 2017. Our future effective tax rate could be affected by changes in the mix of earnings in jurisdictions with differing tax rates, changes in the valuation of deferred tax assets and liabilities, or changes in tax laws or their interpretation. In addition, the tax authorities may not agree with the determinations we have made and such disagreements could result in lengthy legal disputes and, ultimately, in the payment of additional amounts for tax, interest and penalties. If our effective tax rate were to increase, or if the ultimate determination of our taxes owed in the U.S. or any of our jurisdictions is for an amount in excess of amounts previously accrued, our operating results, cash flows and financial condition could be adversely affected.
Our Business and Operations Could be Negatively Affected if We Become Subject to Any Securities Litigation or Shareholder Activism, Which Could Cause Us to Incur Significant Expense, Hinder Execution of Investment Strategy and Impact Our Stock Price.
While we are currently not subject to any securities litigation or shareholder activism, due to the potential volatility of our stock price and for a variety of other reasons, we may in the future become the target of securities litigation or shareholder activism. Securities litigation and shareholder activism, including potential proxy contests, could result in substantial costs and divert the attention of our management and board of directors and resources from our business. Additionally, such securities litigation and shareholder activism could give rise to perceived uncertainties as to our future, adversely affect our relationships with service providers and make it more difficult to attract and retain qualified personnel. Also, we may be required to incur significant legal fees and other expenses related to any securities litigation or activist shareholder matters. Further, our stock price could be subject to significant fluctuation or otherwise be adversely affected by the events, risks and uncertainties of any securities litigation or shareholder activism.
| 16 |
Adverse Weather Conditions, Particularly During the Winter in the Midwest and in Our Other Markets, May Adversely Affect Our Financial Results.
Poor weather conditions adversely affect business and leisure travel plans, which directly impacts our hotels and resorts division. In addition, theatre attendance on any given day may be negatively impacted by adverse weather conditions. In particular, adverse weather during peak movie-going weekends or holiday periods may negatively affect our results of operations. Adverse winter weather conditions may also increase our snow removal and other maintenance costs in both of our divisions.
Our Results May be Seasonal, Resulting in Unpredictable and Varied Quarterly Results.
Our first fiscal quarter typically produces the weakest operating results in our hotels and resorts division due primarily to the effects of reduced travel during the winter months. Our second and third fiscal quarters often produce our strongest operating results because these periods coincide with the typical summer seasonality of the movie theatre industry and the summer strength of the lodging business. Due to the fact that the week between Christmas and New Year’s Eve is historically one of the strongest weeks of the year for our theatre division, the specific timing of the last Thursday in December has an impact on the results of our fiscal first and fourth quarters in that division, particularly when we have a 53-week year.
| Item 1B. | Unresolved Staff Comments. |
None.
| Item 2. | Properties. |
We own the real estate of a substantial portion of our facilities, including, as of December 26, 2019, The Pfister Hotel, the Hilton Milwaukee City Center, the Hilton Madison at Monona Terrace, the Grand Geneva Resort & Spa, Saint Kate–The Arts Hotel, The Lincoln Marriott Cornhusker Hotel, The Skirvin Hilton (majority ownership), and the majority of our theatres. We lease the remainder of our facilities. As of December 26, 2019, we also managed one hotel for a joint venture in which we have a minority interest and 12 hotels, resorts and other properties and one theatre that is owned by a third party. Additionally, we own properties acquired for the future construction and operation of new facilities. All of our properties are suitably maintained and adequately utilized to cover the respective business segment served.
| 17 |
Our owned, leased and managed properties are summarized, as of December 26, 2019, in the following table:
| Business Segment | Total Number of Facilities in Operation | Owned(1) | Leased
| Managed | Managed Parties(2) | |||||||||||||||
| Theatres: | ||||||||||||||||||||
| Movie Theatres | 91 | 50 | 40 | 0 | 1 | |||||||||||||||
| Family Entertainment Center | 1 | 1 | 0 | 0 | 0 | |||||||||||||||
| Other Properties(3) | 1 | 1 | 0 | 0 | 0 | |||||||||||||||
| Hotels and Resorts: | ||||||||||||||||||||
| Hotels | 18 | 6 | 1 | 1 | 10 | |||||||||||||||
| Resorts | 1 | 1 | 0 | 0 | 0 | |||||||||||||||
| Other Properties(4) | 3 | 0 | 2 | 0 | 1 | |||||||||||||||
| Total | 115 | 59 | 43 | 1 | 12 | |||||||||||||||
| (1) | Four of the movie theatres are on land leased from unrelated parties. One of the hotels is owned by a joint venture in which we are the principal equity partner (60% as of December 26, 2019). |
| (2) | The 40 theatres leased from unrelated parties have a total of 423 screens, and the one theatre managed for an unrelated party has a total of six screens. One UltraScreen adjacent to an owned theatre is leased from an unrelated party. |
| (3) | Includes an 84,000 square foot retail center managed by our theatre division. |
| (4) | Includes a vacation ownership development adjacent to the Grand Geneva Resort & Spa owned by Orange Lake Resort & Country Club of Orlando, Florida for which we provide hospitality management services and two SafeHouse restaurants located in Milwaukee, Wisconsin and Chicago, Illinois, both of which we lease from an unrelated party and which are managed by our hotels and resorts division. |
Certain of the individual properties or facilities identified above are subject to purchase money or construction mortgages or commercial lease financing arrangements, but we do not consider these encumbrances, individually or in the aggregate, to be material.
All of our operating property leases expire on various dates after the end of fiscal 2020 (assuming we exercise all of our renewal and extension options).
All 22 Movie Tavern theatres acquired in February 2019 are leased from unrelated parties.
| Item 3. | Legal Proceedings. |
None.
| Item 4. | Mine Safety Disclosures. |
Not applicable.
| 18 |
INFORMATION ABOUT OUR EXECUTIVE OFFICERS
Each of our executive officers is identified below together with information about each officer’s age, position and employment history for at least the past five years:
| Name | Position | Age |
| Stephen H. Marcus | Chairman of the Board | 84 |
| Gregory S. Marcus | President and Chief Executive Officer | 55 |
| Thomas F. Kissinger | Senior Executive Vice President, General Counsel and Secretary | 59 |
| Douglas A. Neis | Executive Vice President, Chief Financial Officer and Treasurer | 61 |
| Rolando B. Rodriguez | Executive Vice President of The Marcus Corporation and Chairman, President and Chief Executive Officer of Marcus Theatres Corporation | 60 |
Stephen H. Marcus has been our Chairman of the Board since December 1991. He served as our Chief Executive Officer from December 1988 to January 2009 and as our President from December 1988 until January 2008. Mr. Marcus has worked at our company for 58 years.
Gregory S. Marcus joined our company in March 1992 as Director of Property Management/Corporate Development. He was promoted in 1999 to our Senior Vice President – Corporate Development and became an executive officer in July 2005. He has served as our President since January 2008 and was elected our Chief Executive Officer in January 2009. He was elected to serve on our Board of Directors in October 2005. He is the son of Stephen H. Marcus, our Chairman of the Board.
Thomas F. Kissinger joined our company in August 1993 as our Secretary and Director of Legal Affairs. In August 1995, he was promoted to our General Counsel and Secretary and in October 2004, he was promoted to Vice President, General Counsel and Secretary. In August 2013, he was promoted to Senior Executive Vice President, General Counsel and Secretary. He also formerly served as interim President of Marcus Hotels & Resorts. Prior to August 1993, Mr. Kissinger was an associate with the law firm of Foley & Lardner LLP for five years.
Douglas A. Neis joined our company in February 1986 as Controller of the Marcus Theatres division and in November 1987, he was promoted to Controller of Marcus Restaurants. In July 1991, Mr. Neis was appointed Vice President of Planning and Administration for Marcus Restaurants. In September 1994, Mr. Neis was also named as our Director of Technology and in September 1995 he was elected as our Corporate Controller. In September 1996, Mr. Neis was promoted to Chief Financial Officer and Treasurer. In August 2018, Mr. Neis was promoted to Executive Vice President, Chief Financial Officer and Treasurer.
Rolando B. Rodriguez joined our company in August 2013 as our Executive Vice President and President and Chief Executive Officer of Marcus Theatres Corporation. Mr. Rodriguez served as Chief Executive Officer and President and as a board member of Rave Cinemas in Dallas, Texas for two years until its sale in May 2013. Prior to May 2011, he served in various positions with Wal-Mart for five years. He began his career in 1975 at AMC Theatres, serving for 30 years in various positions including senior vice president of North American field operations, senior vice president food & beverage group and executive vice president, North America operations service. In January 2017, Mr. Rodriguez was named Chairman of Marcus Theatres Corporation.
Our executive officers are generally elected annually by our Board of Directors after the annual meeting of shareholders. Each executive officer holds office until his successor has been duly qualified and elected or until his earlier death, resignation or removal.
| 19 |
PART II
| Item 5. | Market for the Company’s Common Equity, Related Shareholder Matters and Issuer Repurchases of Equity Securities. |
(a) Stock Performance Graph
The following information in this Item 5 of this Annual Report on Form 10-K is not deemed to be “soliciting material” or to be “filed” with the SEC or subject to Regulation 14A or 14C under the Securities Exchange Act of 1934 or to the liabilities of Section 18 of the Securities and Exchange Act of 1934 and will not be deemed to be incorporated by reference into any filing under the Securities Act of 1933 or the Securities Exchange Act of 1934, except to the extent we specifically incorporate it by reference into such a filing.
Set forth below is a graph comparing the annual percentage change during our last five full fiscal years and the transition period beginning on May 29, 2015 and ended December 31, 2015 in our cumulative total shareholder return (stock price appreciation on a dividend reinvested basis) of our Common Shares to the cumulative total return of: (1) a composite peer group index selected by us that we have used historically (the “old” composite peer group index), (2) the composite peer group index selected by us that we intend to use going forward (the “new” composite peer group index) and (3) companies included in the Russell 2000 Index. The old composite peer group index is comprised of the Dow Jones U.S. Hotels Index (weighted 35%) and a theatre index that we selected that includes Regal Entertainment Group and Cinemark Holdings, Inc. (weighted 65%). The results shown reflect the fact that Regal Entertainment Group ceased trading on February 28, 2018. The new composite index is comprised of the Dow Jones U.S. Hotels Index (weighted 35%) and a theatre index that we selected that includes Cinemark Holdings, Inc. and AMC Entertainment Holdings, Inc. (weighted 65%).
The indices within the composite peer group index are weighted to approximate the relative annual revenue contributions of each of our business segments to our total annual revenues over the past several fiscal years. The shareholder returns of the companies included in the Dow Jones U.S. Hotels Index and the theatre index that we selected are weighted based on each company’s relative market capitalization as of the beginning of the presented periods.
From May 29, 2014 to December 26, 2019
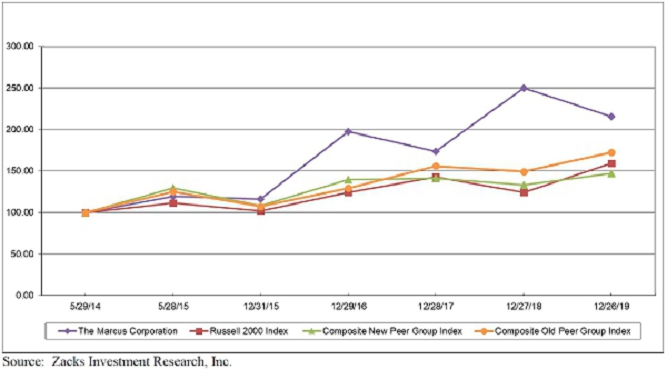
| 20 |
| 5/29/14 | 5/28/15 | 12/31/15 | 12/29/16 | 12/28/17 | 12/27/18 | 12/26/19 | ||||||||||||||||||||||
| The Marcus Corporation | $ | 100.00 | $ | 119.34 | $ | 116.45 | $ | 197.61 | $ | 173.36 | $ | 249.78 | $ | 215.31 | ||||||||||||||
| Russell 2000 Index | 100.00 | 111.36 | 101.84 | 124.09 | 142.86 | 124.39 | 158.98 | |||||||||||||||||||||
| Composite New Peer Group Index(1) | 100.00 | 129.30 | 108.43 | 139.61 | 141.04 | 133.33 | 147.12 | |||||||||||||||||||||
| Composite Old Peer Group Index(2) | 100.00 | 125.02 | 107.30 | 129.46 | 155.98 | 149.24 | 172.44 | |||||||||||||||||||||
| (1) | Weighted 35% for the Dow Jones U.S. Hotels Index and 65% for the old Company-selected Theatre Index. |
| (2) | Weighted 35% for the Dow Jones U.S. Hotels Index and 65% for the new Company-selected Theatre Index. |
| 21 |
| (b) | Market Information |
Our Common Stock, $1 par value, is listed and traded on the New York Stock Exchange under the ticker symbol “MCS.” Our Class B Common Stock, $1 par value, is neither listed nor traded on any exchange.
On February 17, 2020, there were 1,152 shareholders of record of our Common Stock and 37 shareholders of record of our Class B Common Stock.
| (c) | Stock Repurchases |
The following table sets forth information with respect to purchases made by us or on our behalf of our Common Stock during the period indicated.
| Period | Total Number of Shares Purchased | Average Price Paid per Share | Total Number of Shares Purchased as Part of Publicly Announced Programs(1) | Maximum Number of Shares that May Yet be Purchased Under the Plans or Programs(1) | ||||||||||||
| September 27 – October 31 | – | – | – | 2,756,561 | ||||||||||||
| November 1 – November 28 | – | – | – | 2,756,561 | ||||||||||||
| November 29 – December 26 | – | – | – | 2,756,561 | ||||||||||||
| Total | – | – | – | 2,756,561 | ||||||||||||
| (1) | Through December 26, 2019, our Board of Directors had authorized the repurchase of up to 11.7 million shares of our outstanding Common Stock. Under these authorizations, we may repurchase shares of our Common Stock from time to time in the open market, pursuant to privately negotiated transactions or otherwise. As of December 26, 2019, we had repurchased approximately 8.9 million shares of our Common Stock under these authorizations. The repurchased shares are held in our treasury pending potential future issuance in connection with employee benefit, option or stock ownership plans or other general corporate purposes. These authorizations do not have an expiration date. |
| 22 |
| Item 6. | Selected Financial Data. |
Five-Year Financial Summary
| F2019(1) | F2018(2) | F2017(3) | F2016 | 31 Weeks Ended December 31, 2015(4) | F2015(5) | |||||||||||||||||||
Operating Results (in thousands) | ||||||||||||||||||||||||
| Revenues | $ | 820,863 | 707,120 | 653,552 | 574,324 | 341,664 | 517,832 | |||||||||||||||||
| Net earnings attributable to The Marcus Corporation | $ | 42,017 | 53,391 | 64,996 | 37,902 | 23,565 | 23,995 | |||||||||||||||||
| Common Stock Data(6) | ||||||||||||||||||||||||
| Net earnings per common share | $ | 1.35 | 1.86 | 2.29 | 1.36 | .84 | .87 | |||||||||||||||||
| Cash dividends per common share | $ | .64 | .60 | .50 | .45 | .21 | .39 | |||||||||||||||||
| Weighted-average shares outstanding (in thousands) | 31,152 | 28,713 | 28,403 | 27,957 | 27,917 | 27,687 | ||||||||||||||||||
| Book value per share | $ | 20.08 | 17.28 | 15.98 | 14.10 | 13.13 | 12.48 | |||||||||||||||||
Financial Position (in thousands) | ||||||||||||||||||||||||
| Total assets | $ | 1,359,186 | 989,331 | 1,017,797 | 911,266 | 804,701 | 805,472 | |||||||||||||||||
| Long-term debt | $ | 206,432 | 228,863 | 289,813 | 271,343 | 207,376 | 229,096 | |||||||||||||||||
| Shareholders’ equity attributable to The Marcus Corporation | $ | 621,435 | 490,009 | 445,024 | 390,112 | 363,352 | 343,779 | |||||||||||||||||
| Capital expenditures and acquisitions | $ | 94,167 | 58,660 | 114,804 | 147,372 | 44,452 | 74,988 | |||||||||||||||||
| Financial Ratios | ||||||||||||||||||||||||
| Current ratio | .45 | .46 | .48 | .28 | .35 | .34 | ||||||||||||||||||
| Debt/capitalization ratio | .26 | .33 | .40 | .42 | .38 | .42 | ||||||||||||||||||
| Return on average shareholders’ equity | 7.6 | % | 11.4 | % | 15.6 | % | 10.1 | % | 6.7 | % | 7.2 | % | ||||||||||||
| (1) | Fiscal 2019 operating results were negatively impacted by preopening and acquisition expenses related to the Movie Tavern acquisition ($2,475, or $0.06 per diluted common share), preopening expenses and initial startup losses related to the closing of the InterContinental Milwaukee hotel for approximately five months and its subsequent reopening as an independent, arts-themed hotel, Saint Kate–The Arts Hotel ($6,830, or $0.16 per diluted common share) and an impairment charge ($1,874, or $0.04 per diluted common share). |
| (2) | Fiscal 2018 operating results were favorably impacted by a nonrecurring reduction in deferred income taxes related to a tax accounting method change ($1,947, or $0.07 per diluted common share) and unfavorably impacted by preopening and acquisition expenses related to the Movie Tavern acquisition ($1,674, or $0.04 per diluted common share) and preopening expenses and nonrecurring accelerated depreciation expense related to the closing of the InterContinental Milwaukee hotel for conversion into Saint Kate–The Arts Hotel ($4,259, or $0.11 per diluted common share). |
| (3) | Fiscal 2017 net earnings includes a one-time reduction in deferred income taxes of $21,240, or $0.75 per diluted common share, related to the Tax Cuts and Jobs Acts of 2017. |
| (4) | In October 2015, we changed our fiscal year end from the last Thursday in May to the last Thursday in December. This 31-week period represents the transition period from May 29, 2015 to December 31, 2015. |
| (5) | Fiscal 2015 refers to the period beginning on May 30, 2014 and ended on May 28, 2015. |
| (6) | All per share and shares outstanding data is on a diluted basis. Earnings per share data is calculated on our Common Stock using the two class method. |
| 23 |
| Item 7. | Management’s Discussion and Analysis of Financial Condition and Results of Operations. |
Results of Operations
| General |
We report our consolidated and individual segment results of operations on a 52- or 53-week fiscal year ending on the last Thursday in December. We divide our fiscal year into three 13-week quarters and a final quarter consisting of 13 or 14 weeks. Our primary operations are reported in two business segments: theatres, and hotels and resorts.
Fiscal 2017 was a 52-week year, beginning on December 30, 2016 and ending on December 28, 2017. Fiscal 2018 was a 52-week year, beginning on December 29, 2017 and ending on December 27, 2018. Fiscal 2019 was a 52-week year, beginning on December 28, 2018 and ending on December 26, 2019.
Fiscal 2020 will be a 53-week year, which began on December 27, 2019 and will end on December 31, 2020. We anticipate that our reported results for fiscal 2020 will benefit from the additional week of reported operations. In particular, the additional week of operations will most benefit our theatre division, as it includes the traditionally strong movie-going week between Christmas and New Year’s Day. The last time we had an additional week of operations was during our 31-week transition period ending on December 31, 2015 (the “Transition Period”). Our additional 31st week of operations that year benefited both of our operating divisions (particularly our theatre division due to a new Star Wars film) and contributed approximately $17.4 million in additional revenues and $6.2 million in additional operating income to our final five-week period and Transition Period results. After interest expense and income taxes, we estimate that the extra week of operations contributed approximately $3.6 million to our Transition Period net earnings, or approximately $0.13 per diluted common share. Although there can be no assurance that we will realize similar benefits in fiscal 2020, it is important to note that our theatre operations in 2015 did not include our two most recent acquisitions and we had a higher effective income tax rate.
Our first fiscal quarter typically produces the weakest operating results in our hotels and resorts division due primarily to the effects of reduced travel during the winter months. The quality of film product in any given quarter typically impacts the operating results in our theatre division. Our second and third fiscal quarters generally produce our strongest operating results because these periods coincide with the typical summer seasonality of the movie theatre industry and the summer strength of the lodging business. Due to the fact that the week between Christmas and New Year’s Eve is historically one of the strongest weeks of the year for our theatre division, the specific timing of the last Thursday in December impacts the results of our fiscal first and fourth quarters in that division, particularly when we have a 53-week year.
This Management’s Discussion and Analysis of Financial Condition and Results of Operations (“MD&A”) generally discusses fiscal 2019 and fiscal 2018 items and year-to-year comparisons between fiscal 2019 and fiscal 2018. Discussions of fiscal 2017 items and year-to-year comparisons between fiscal 2018 and fiscal 2017 that are not included in this MD&A can be found in “Management’s Discussion and Analysis of Financial Condition and Results of Operations” in Part II, Item 7 of the Company’s Annual Report on Form 10-K for the fiscal year ended December 27, 2018.
Implementation of New Accounting Standards
During fiscal 2019, we adopted Accounting Standards Update (“ASU”) No. 2016-02, Leases (Topic 842), intended to improve financial reporting related to leasing transactions. ASU No. 2016-02 requires a lessee to recognize a right-of-use (“ROU”) asset and a lease liability for most leases. The new guidance requires disclosures to help investors and other financial statement users better understand the amount, timing and uncertainty of cash flows arising from the leases. Leases are now classified as finance or operating, with classification affecting the pattern and classification of expense recognition in the consolidated statements of net earnings. ASU No. 2018-11, Leases (Topic 842): Targeted Improvements, amended ASU No. 2016-02 and allows entities the option to initially apply Topic 842 at the adoption date and recognize a cumulative-effect adjustment to the opening balance of retained earnings in the period of adoption. We adopted the new accounting standard as of the first day of fiscal 2019 using the modified retrospective approach, which results in the cumulative effect of adoption recognized at the date of application, rather than as of the earliest period presented. As a result, no adjustment was made to prior period financial information and disclosures.
| 24 |
In conjunction with the adoption of the new standard, companies were able to elect several practical expedients to aid in the transition to Topic 842. We elected the package of practical expedients which permits us to forego reassessment of our prior conclusions related to lease identification, lease classification and initial direct costs. Topic 842 also provides practical expedients for an entity’s ongoing accounting. We elected the practical expedient to not separate lease and non-lease components for all of our leases. We also made a policy election not to apply the lease recognition requirements for short-term leases. As a result, we did not recognize ROU assets or lease liabilities for short-term leases that qualify for the policy election (those with an initial term of 12 months or less which do not include a purchase or renewal option which is reasonably certain to be exercised), but instead will recognize these lease payments as lease costs on a straight-line basis over the lease term.
Adoption of this new standard resulted in a material impact related to the recognition of ROU assets and lease liabilities on the consolidated balance sheet for assets currently subject to operating leases. We recognized lease liabilities representing the present value of the remaining future minimum lease payments for all of our operating leases as of December 28, 2018 of $81.5 million. We recognized ROU assets for all assets subject to operating leases in an amount equal to the operating lease liabilities, adjusted for the balances of long-term prepaid rent, favorable lease intangible assets, deferred lease expense, unfavorable lease liabilities and deferred lease incentive liabilities as of December 28, 2018.
The adoption of the new standard did not have a material effect on our consolidated statements of net earnings.
During fiscal 2018, we adopted ASU No. 2014-09, Revenue from Contracts with Customers (ASU No. 2014-09), a comprehensive new revenue recognition model that requires a company to recognize revenue to depict the transfer of goods or services to customers in an amount that reflects the consideration to which the company expects to be entitled in exchange for those goods or services. We selected the modified retrospective method for adoption of ASU No. 2014-09 and its related ASU amendments. Under this method, we recognized the cumulative effect of the changes in retained earnings at the date of adoption and did not restate prior periods.
The adoption of the new standard primarily impacted our accounting for our loyalty programs and internet ticket fee revenue. Adopting this new standard during fiscal 2018 had the following impact on our financial statements:
| · | In accordance with the new guidance, the portion of theatre admission revenues, theatre concession revenues and food and beverage revenues attributable to loyalty points earned by customers is deferred as a reduction of these revenues until reward redemption. Through December 28, 2017, we recorded the estimated incremental cost of redeeming loyalty points at the time they were earned in advertising and marketing expense. Our adoption of the standard resulted in an immaterial reduction of theatre admission revenues and a corresponding immaterial increase in theatre concession revenues with an offsetting increase in other long-term liabilities based upon historical customer reward redemption patterns. |
| · | Prior to the adoption of the new standard, we recorded internet ticket fee revenues net of third-party commission or service fees. In accordance with ASU No. 2014-09, we believe that we are the principal (as opposed to agent) in the arrangement with third-party internet ticketing companies in regards to sale of internet tickets to customers, and therefore, we will now recognize ticket fee revenue based on a gross transaction price. This change had the effect of increasing other revenues and other operating expense but had no impact on net earnings or cash flows from operations. |
We recorded a one-time cumulative effect reduction to retained earnings, net of income taxes, of approximately $2.6 million during fiscal 2018 related to the adoption of ASU No. 2014-09.
| 25 |
Consolidated Financial Comparisons
The following table sets forth revenues, operating income, other income (expense), net earnings and net earnings per common share for the past three fiscal years (in millions, except for per share and percentage change data) :
| Change F19 v. F18 | Change F18 v. F17 | |||||||||||||||||||||||||||
| F2019 | F2018 | Amt. | Pct. | F2017 | Amt. | Pct. | ||||||||||||||||||||||
| Revenues | $ | 820.9 | $ | 707.1 | $ | 113.8 | 16.1 | % | $ | 653.6 | $ | 53.5 | 8.2 | % | ||||||||||||||
| Operating income | 68.2 | 83.2 | (15.0 | ) | -18.0 | % | 77.3 | 5.9 | 7.6 | % | ||||||||||||||||||
| Other income (expense) | (13.8 | ) | (16.6 | ) | 2.8 | 17.1 | % | (9.2 | ) | (7.4 | ) | -80.5 | % | |||||||||||||||
| Net earnings (loss) attributable to noncontrolling interests | 0.1 | 0.1 | - | - | % | (0.5 | ) | 0.6 | 114.5 | % | ||||||||||||||||||
| Net earnings attributable to The Marcus Corporation | $ | 42.0 | $ | 53.4 | $ | (11.4 | ) | -21.3 | % | $ | 65.0 | $ | (11.6 | ) | -17.9 | % | ||||||||||||
| Net earnings per common share - diluted | $ | 1.35 | $ | 1.86 | $ | (0.51 | ) | -27.4 | % | $ | 2.29 | $ | (0.43 | ) | -18.8 | % | ||||||||||||
Fiscal 2019 versus Fiscal 2018
Our revenues increased during fiscal 2019 compared to fiscal 2018 due primarily to increased revenues from our theatre division. Our operating income (earnings before other income/expense and income taxes) decreased during fiscal 2019 compared to fiscal 2018 due to a decrease in both theatre division and hotels and resorts division operating income and a small increase in corporate operating losses. Both of our operating divisions were negatively impacted by nonrecurring expenses during fiscal 2019. Net earnings attributable to The Marcus Corporation for fiscal 2019 decreased compared to fiscal 2018 due to decreased operating income, partially offset by increased investment income and decreased interest expense and income taxes.
On February 1, 2019, we acquired the assets of Movie Tavern® consisting of 22 dine-in theatres with 208 screens located in nine states. A detailed description of this acquisition is included below in the “Current Plans” section of this MD&A. The acquisition increased our total number of screens by 23%, resulting in increased revenues from our theatre division during fiscal 2019 compared to fiscal 2018. Excluding acquisition and preopening expenses, the acquisition did not have a material impact on operating income during fiscal 2019. Operating income from our theatre division during fiscal 2019 was unfavorably impacted by reduced attendance at our comparable theatres due to a weaker slate of movies during fiscal 2019 compared to fiscal 2018, partially offset by increased concession sales per person due to our expanded food and beverage offerings as well as an increase in our average ticket price and other revenues. Acquisition and preopening expenses related to the Movie Tavern acquisition and the opening of a newly built Movie Tavern theatre in Brookfield, Wisconsin negatively impacted our operating income by approximately $2.5 million, or $0.06 per diluted common share, during fiscal 2019 and by approximately $1.7 million, or $0.04 per diluted common share, during fiscal 2018. An impairment charge related to a specific theatre location negatively impacted our fiscal 2019 operating income by approximately $1.9 million, or $0.04 per diluted common share.
We closed the InterContinental Milwaukee hotel (the “InterContinental Milwaukee”) in early January 2019 and began a substantial renovation project that converted this hotel into an experiential arts hotel named Saint Kate®–The Arts Hotel (the “Saint Kate”). The newly renovated hotel reopened during the first week of June 2019 (although a portion of the rooms and food and beverage outlets didn’t fully open until later in the month). Revenues from our hotels and resorts division during fiscal 2019 compared to fiscal 2018 were unfavorably impacted by the closing of the hotel for nearly six months for renovation, the negative impact of comparing a newly opened independent hotel (i.e. the Saint Kate) to a stabilized branded hotel (i.e. the InterContinental Milwaukee) and the impact of a major renovation at our Hilton Madison hotel during the first half of fiscal 2019, offset by increased room revenues and food and beverage revenues from our other six owned hotels and increased cost reimbursements from managed hotels during fiscal 2019 compared to fiscal 2018. Decreased operating income from our hotels and resorts division during fiscal 2019 compared to fiscal 2018 was primarily due to preopening expenses and initial start-up losses related to the InterContinental Milwaukee closure and conversion to the Saint Kate. These costs totaled approximately $6.8 million, or $0.16 per diluted common share during fiscal 2019. Operating income from our hotels and resorts division during fiscal 2018 was unfavorably impacted by preopening expenses of approximately $500,000 and accelerated depreciation of approximately $3.7 million related to the fiscal 2019 conversion of the former InterContinental Milwaukee hotel into the Saint Kate. These non-recurring items negatively impacted our fiscal 2018 net earnings by approximately $0.11 per diluted common share.
Operating losses from our corporate items, which include amounts not allocable to the business segments, increased during fiscal 2019 compared to fiscal 2018 due in part to increased long-term incentive compensation expenses. In addition, our fiscal 2019 operating loss from our corporate items was negatively impacted by non-recurring items totaling approximately $550,000 related to a depreciation adjustment and a payroll tax audit settlement.
We recognized investment income of $1.4 million during fiscal 2019 compared to investment income of $208,000 during fiscal 2018. Investment income includes interest earned on cash and cash equivalents, as well as increases/decreases in the value of marketable securities and increases in the cash surrender value of a life insurance policy. Investment income increased during fiscal 2019 due to increases in the value of marketable securities. Investment income during fiscal 2020 may vary compared to fiscal 2019, primarily dependent upon changes in the value of marketable securities.
| 26 |
Interest expense totaled $11.8 million during fiscal 2019, a decrease of $1.3 million, or 9.8%, compared to interest expense of $13.1 million during fiscal 2018. The decrease in interest expense during fiscal 2019 was due to reduced borrowing levels compared to fiscal 2018. We currently do not expect a material change in interest expense during fiscal 2020. Changes in our borrowing levels due to variations in our operating results, capital expenditures, acquisition opportunities (or the lack thereof), share repurchases and asset sale proceeds, among other items, may impact, either favorably or unfavorably, our actual reported interest expense in future periods, as may changes in short-term interest rates.
We incurred other expense of $1.9 million during fiscal 2019, a decrease of approximately $100,000, or 3.2%, compared to other expense of $2.0 million during fiscal 2018. Other expense consists of the non-service cost components of our periodic pension costs. Based upon information from an actuarial report for our pension plans, we expect other expense to increase by approximately $400,000 during fiscal 2020 compared to fiscal 2019.
We reported net losses on disposition of property, equipment and other assets of $1.1 million during fiscal 2019, compared to net losses on disposition of property, equipment and other assets of $1.3 million during fiscal 2018. The net losses during fiscal 2019 and fiscal 2018 were due primarily to losses related to old theatre seats and other items disposed of in conjunction with theatre renovations. The timing of our periodic sales and disposals of property, equipment and other assets results in variations each year in the gains or losses that we report on dispositions of property, equipment and other assets. We anticipate the potential for additional disposition losses resulting from theatre renovations, as well as disposition gains or losses from periodic sales of property, equipment and other assets, during fiscal 2020 and beyond. As discussed in more detail in the “Current Plans” section of this MD&A, we may report gains in future years from the potential sale of existing hotel assets.
We reported a net equity loss from an unconsolidated joint venture of $274,000 and $399,000, respectively, during fiscal 2019 and fiscal 2018. The net equity losses during both fiscal years consisted of our pro-rata share of losses from the Omaha Marriott Downtown at The Capitol District hotel in Omaha, Nebraska (the “Omaha Marriott”) – a hotel we manage and in which we have a 10% minority ownership interest. The Omaha Marriott is actually performing well from an operational perspective, but is experiencing overall losses due to depreciation and interest expense. We currently do not expect significant variations in net equity losses from unconsolidated joint ventures during fiscal 2020 compared to fiscal 2019, unless we significantly increase the number of joint ventures in which we participate during fiscal 2020.
The operating results of one majority-owned hotel, The Skirvin Hilton, are included in the hotels and resorts division revenue and operating income during fiscal 2019 and fiscal 2018, and the after-tax net earnings or loss attributable to noncontrolling interests is deducted from or added to net earnings on the consolidated statements of earnings. We reported net earnings attributable to noncontrolling interest of $98,000 and $74,000, respectively, during fiscal 2019 and fiscal 2018.
We reported income tax expense during fiscal 2019 of $12.3 million, a decrease of approximately $800,000, or 6.1%, compared to income tax expense of $13.1 million during fiscal 2018. The decrease in income tax expense during fiscal 2019 was the result of the reduced earnings before income taxes, partially offset by an increased effective income tax rate. Our fiscal 2018 income tax expense and effective income tax rate were favorably impacted by a reduction in deferred tax liabilities of approximately $1.9 million related to tax accounting method changes we made subsequent to the signing of the Tax Cut and Jobs Act of 2017. Our fiscal 2019 effective income tax rate, after adjusting for earnings from noncontrolling interests that are not tax-effected because the entity involved is a tax pass-through entity, was 22.7% compared to our fiscal 2018 effective income tax rate of 19.7%, which benefited from the reduction in deferred income tax liabilities described above. Excluding the favorable adjustment to income tax expense for the reduction in deferred tax liabilities, our effective income tax rate during fiscal 2018 was also 22.7%. We currently anticipate that our fiscal 2020 effective income tax rate may increase to the 24-26% range, depending upon the amount of excess tax benefits on share-based compensation that we recognize and excluding any potential further changes in federal or state income tax rates or other one-time tax benefits.
| 27 |
Weighted-average shares outstanding were 31.2 million during fiscal 2019 and 28.7 million during fiscal 2018. All per share data in this MD&A is presented on a fully diluted basis.
Current Plans
Our aggregate cash capital expenditures, acquisitions and purchases of interests in, and contributions to, joint ventures were approximately $94 million during fiscal 2019, including approximately $30 million in cash consideration paid in conjunction with the Movie Tavern acquisition described below, compared to $59 million during fiscal 2018 and $115 million during fiscal 2017. We currently anticipate that our fiscal 2020 cash capital expenditures will be in the $65-$85 million range, excluding any presently unidentified acquisitions that may arise during the year. We will, however, continue to monitor our operating results and economic and industry conditions so that we may adjust our plans accordingly.
Our current strategic plans include the following goals and strategies:
Theatres
| i | Our current plans for growth in our theatre division include several opportunities for new theatres and screens. In October 2019, we opened our new eight-screen Movie Tavern® by Marcus theatre in Brookfield, Wisconsin. This new theatre became the first Movie Tavern by Marcus in Wisconsin. It includes eight auditoriums, each with laser projection and DreamLoungerSM recliner seating, a full-service bar and food and drink center, and a new delivery-to-seat service model that also allows guests to order food and beverage via our mobile phone application or in-theatre kiosk. Another new nine-screen theatre is currently under construction in Tacoma, Washington, with an expected opening date during our fiscal 2020 fourth quarter. In addition, we will consider additional sites for potential new theatre locations in both new and existing markets. |
| i | In addition to building new theatres, we believe acquisitions of existing theatres or theatre circuits is also a viable growth strategy for us. On February 1, 2019, we acquired the assets of Movie Tavern, a New Orleans-based industry leading circuit known for its in-theatre dining concept featuring chef-driven menus, premium quality food and drink and luxury seating. Now branded Movie Tavern by Marcus, the acquired circuit consists of 208 screens at 22 locations in nine states – Arkansas, Colorado, Georgia, Kentucky, Louisiana, New York, Pennsylvania, Texas and Virginia. The purchase price consisted of $30 million in cash, subject to certain adjustments, and 2,450,000 shares of our common stock (157,056 of which have been placed in escrow to secure certain post-closing indemnification obligations of the seller under the asset purchase agreement), for a total purchase price of approximately $139.3 million, based upon our closing share price on January 31, 2019. The acquisition of the Movie Tavern circuit increased our total number of screens by an additional 23%. |
Now branded Movie Tavern by Marcus, we have begun introducing new amenities to select Movie Tavern theatres, including our proprietary premium large format (PLF) screens and DreamLounger recliner seating, signature programming, such as $5 movies on Tuesdays with a free complimentary-size popcorn for loyalty members, and proven marketing, loyalty and pricing programs that will continue to benefit Movie Tavern guests in the future.
We believe selective, disciplined acquisitions create a compelling opportunity to expand into new growth markets and leverage our proven success. The movie theatre industry is very fragmented, with approximately 50% of United States screens owned by the three largest theatre circuits and the other 50% owned by an estimated 800 smaller operators, making it very difficult to predict when acquisition opportunities may arise. We do not believe that we are geographically constrained, and we believe that we may be able to add value to certain theatres through our various proprietary amenities and operating expertise. In addition, by using shares of our common stock as a significant component of the purchase consideration for the Movie Tavern acquisition, we believe our balance sheet remains positioned to consider additional acquisitions in the future.
| 28 |
| i | We have invested over $350 million to further enhance the movie-going experience and amenities in new and existing theatres over the last six and one-half calendar years, with more investments planned for fiscal 2020. These investments include: |
DreamLounger recliner additions. These luxurious, state-of-the-art recliners allow guests to go from upright to a full-recline position in seconds. These seat changes require full auditorium remodels to accommodate the necessary 84 inches of legroom, resulting in the loss of approximately 50% of the existing traditional seats in an average auditorium. To date, the addition of DreamLoungers has increased attendance at each of our applicable theatres, outperforming nearby competitive theatres and growing the overall market attendance in most cases. Initially, 12 of the 22 acquired Movie Tavern theatres had recliner seating. We added DreamLounger recliner seats to four additional acquired Movie Tavern theatres during fiscal 2019, as well as one Marcus Wehrenberg® theatre and one newly built Movie Tavern. As of December 26, 2019, we offered all DreamLounger recliner seating in 63 theatres, representing approximately 72% of our company-owned, first-run theatres. Including our PLF auditoriums with recliner seating, as of December 26, 2019, we offered our DreamLounger recliner seating in approximately 77% of our company-owned, first-run screens, a percentage we believe to be the highest among the largest theatre chains in the nation. We completed the addition of DreamLounger recliner seats to another Movie Tavern location during the first quarter of fiscal 2020, and we are currently evaluating opportunities to add our DreamLounger seating to several additional theatres during the second half of fiscal 2020.
UltraScreen DLX® and SuperScreen DLX® (DreamLounger eXperience) conversions. We introduced one of the first PLF presentations to the industry when we rolled out our proprietary UltraScreen® concept approximately 20 years ago. We later introduced our UltraScreen DLX concept by combining our premium large-format presentation with DreamLounger recliner seating and Dolby® Atmos™ immersive sound to elevate the movie-going experience for our guests. More recently, we began including heated DreamLounger recliner seating in our DLX auditoriums. During fiscal 2019, we opened one new UltraScreen DLX at an existing Marcus Wehrenberg theatre and converted one existing screen into an UltraScreen DLX auditorium at a Movie Tavern by Marcus theatre. During fiscal 2019, we also converted 26 existing screens at 13 Movie Tavern by Marcus theatres and two existing screens at one Marcus Wehrenberg theatre to SuperScreen DLX auditoriums (a slightly smaller screen than an UltraScreen but with the same DreamLounger seating and Dolby Atmos sound) and opened one new SuperScreen DLX auditorium at a newly built Movie Tavern by Marcus theatre. Most of our PLF screens now include the added feature of heated DreamLounger recliner seats. As of December 26, 2019, we had 31 UltraScreen DLX auditoriums, one traditional UltraScreen auditorium, 80 SuperScreen DLX auditoriums and three IMAX® PLF screens at 63 of our theatre locations. As of December 26, 2019, we offered at least one PLF screen in approximately 72% of our first-run, company-owned theatres – a percentage we believe to be the highest percentage among the largest theatre chains in the nation.
Our PLF screens generally have higher per-screen revenues and draw customers from a larger geographic region compared to our standard screens, and we charge a premium price to our guests for this experience. We are currently evaluating opportunities to convert several additional existing screens to SuperScreen DLX auditoriums during fiscal 2020. In addition, our new theatre currently under construction in Tacoma, Washington will include one PLF auditorium.
Signature cocktail and dining concepts. We have continued to further enhance our food and beverage offerings within our existing theatres. We believe our 50-plus years of food and beverage experience in the hotel and restaurant businesses provides us with a unique advantage and expertise that we can leverage to further grow revenues in our theatres. The concepts we are expanding include:
| 29 |
| · | Take FiveSM Lounge, Take Five Express and The Tavern – these full-service bars offer an inviting atmosphere and a chef-inspired dining menu, along with a complete selection of cocktails, locally-brewed beers and wines. We also offer full liquor service through the concession stand at two theatres. We acquired 22 new bars, known as The Tavern, in conjunction with our Movie Tavern acquisition and opened a new Tavern at our new Brookfield, Wisconsin Movie Tavern by Marcus theatre in fiscal 2019. As of December 26, 2019, we offered bars/full liquor service at 51 theatres, representing approximately 59% of our company-owned, first-run theatres. We are currently evaluating opportunities to add bar service to up to three additional theatres during fiscal 2020, including our new theatre under construction in Tacoma, Washington. |
| · | Zaffiro’s® Express – these outlets offer lobby dining that includes appetizers, sandwiches, salads, desserts and our signature Zaffiro’s THINCREDIBLE® handmade thin-crust pizza. In select locations without a Take Five Lounge outlet, we offer beer and wine at the Zaffiro’s Express outlet. We opened one new Zaffiro’s Express outlet during fiscal 2019 at our new Movie Tavern by Marcus location in Brookfield, Wisconsin, increasing our number of theatres with this concept to 29 as of December 26, 2019, representing approximately 45% of our company-owned, first-run theatres (excluding our acquired in-theatre dining Movie Tavern theatres). We also operate three Zaffiro’s® Pizzeria and Bar full-service restaurants. |
| · | Reel Sizzle® – this signature dining concept serves menu items inspired by classic Hollywood and the iconic diners of the 1950s. We offer Americana fare like burgers and chicken sandwiches prepared on a griddle behind the counter, along with chicken tenders, crinkle-cut fries, ice cream and signature shakes. Our new Movie Tavern by Marcus in Brookfield, Wisconsin includes a Real Sizzle. As of December 26, 2019, we operated eight Reel Sizzle outlets, and we expect to add one Reel Sizzle outlet to the new theatre currently under construction in Tacoma, Washington. |
| · | Other in-lobby dining – We also operate one Hollywood Café at an existing theatre, and four of the Marcus Wehrenberg theatres offer in-lobby dining concepts, operating under names such as Fred’s Drive-In or Five Star. In addition, we are currently testing a Mexican food concept at one theatre, and we are considering expanding this new concept during fiscal 2020. Including these additional concepts, as of December 26, 2019, we offered one or more in-lobby dining concepts in 40 theatres, representing approximately 62% of our company-owned, first-run theatres (excluding our in-theatre dining Movie Tavern theatres). |
| · | In-theatre dining – As of December 26, 2019, we offered full-service, in-theatre dining with a complete menu of drinks and chef-prepared salads, sandwiches, entrées and desserts at 32 theatres and a total of 248 auditoriums, operating under the names Big Screen BistroSM, Big Screen Bistro ExpressSM, BistroPlex® and Movie Tavern by Marcus, representing approximately 37% of our company-owned, first-run theatres. |
| i | With each of these strategies, our goal continues to be to introduce and create entertainment destinations that further define and enhance the customer value proposition for movie-going. We also expect to continue to maintain and enhance the value of our existing theatre assets by regularly upgrading and remodeling our theatres to keep them fresh. To accomplish the strategies noted above, we currently anticipate that our fiscal 2020 capital expenditures in this division will total approximately $45-$60 million. |
| 30 |
| i | In addition to the growth strategies described above, our theatre division continues to focus on multiple strategies designed to further increase revenues and improve the profitability of our existing theatres. These strategies include various cost control efforts, as well as plans to expand ancillary theatre revenues, such as pre-show advertising, lobby advertising, additional corporate and group sales, sponsorships, special film series and alternate auditorium uses. |
| i | We also have several customer-focused strategies designed to elevate our consumer knowledge, expectation and connection, and provide us with a competitive advantage and the ability to deliver improved financial performance. These strategies include the following: |
Marketing initiatives. We offer a “$5 Tuesday” promotion at every theatre in our circuit that includes a free complimentary-size popcorn to our loyalty program members. We have seen our Tuesday attendance increase dramatically since the introduction of the $5 Tuesday promotion. We believe this promotion has increased movie going frequency and reached a customer who may have stopped going to the movies because of price, creating another “weekend” day for us without adversely impacting the movie-going habits of our regular weekend customers. We introduced our $5 Tuesday promotion with the free popcorn for loyalty members at our Marcus Wehrenberg theatres immediately upon acquisition in December 2016 and did the same thing in February 2019 with our newly acquired Movie Tavern theatres. We experienced an increase in Tuesday performance at the Marcus Wehrenberg theatres and have seen a similar response from customers at our Movie Tavern theatres. We also offer a “$6 Student Thursday” promotion at all of our locations that has been well received by that particular customer segment. In addition, we offer a $6 “Young-at-Heart” program for seniors on Friday afternoons that was also introduced to our Movie Tavern locations during our fiscal 2019 first quarter.
Loyalty program. We offer what we believe to be a best-in-class customer loyalty program called Magical Movie RewardsSM. We currently have approximately 4.0 million members enrolled in the program. Approximately 42% of all transactions in our theatres during fiscal 2019 were completed by registered members of the loyalty program. The program allows members to earn points for each dollar spent and access special offers available only to members. The rewards are redeemable at the box office, concession stand or at the many Marcus Theatres® food and beverage venues. In addition, we have partnered with Movio, a global leader in data analysis for the cinema industry, to allow more targeted communication with our loyalty members. The software provides us with insight into customer preferences, attendance habits and general demographics, which we believe will help us deliver customized communication to our members. In turn, members of this program can enjoy and plan for a more personalized movie-going experience. The program also gives us the ability to cost effectively promote non-traditional programming and special events, particularly during non-peak time periods. We believe that this will result in increased movie-going frequency, more frequent visits to the concession stand, increased loyalty to Marcus Theatres and, ultimately, improved operating results. The acquired Wehrenberg theatres offered a loyalty program to their customers that had approximately 200,000 members. We converted these members to our Magical Movie Rewards program during fiscal 2017 and program membership at our Marcus Wehrenberg theatres has subsequently increased. The acquired Movie Tavern theatres did not offer a loyalty program to their customers. We introduced our Magical Movie Rewards program to these theatres during the second quarter of fiscal 2019 after all necessary technology requirements were completed.
Technology enhancements. We have recently enhanced our mobile ticketing capabilities, our downloadable Marcus Theatres mobile application, and our marcustheatres.com website. We also recently added food and beverage ordering capabilities to our mobile application at select theatres, including our recently opened Movie Tavern location in Brookfield, Wisconsin. We will continue to install additional theatre-level technology, such as new ticketing kiosks, digital menu boards and concession advertising monitors. Each of these enhancements is designed to improve customer interactions, both at the theatre and through mobile platforms and other electronic devices.
| 31 |
| i | The addition of digital technology throughout our circuit (we offer digital cinema projection on 100% of our first-run screens) has provided us with additional opportunities to obtain non-motion picture programming from other new and existing content providers, including live and pre-recorded performances of the Metropolitan Opera, as well as sports, music and other events, at many of our locations. We offer weekday and weekend alternate programming at many of our theatres across our circuit. The special programming includes classic movies, live performances, comedy shows and children’s performances. We believe this type of programming is more impactful when presented on the big screen and provides an opportunity to continue to expand our audience base beyond traditional moviegoers. |
| i | In addition, digital 3D presentation of films has continued to positively contribute to our box office receipts during the periods presented in this Annual Report on Form 10-K. As of December 26, 2019, we had the ability to offer digital 3D presentations in 386, or approximately 36%, of our first-run screens, including the vast majority of our UltraScreens. We have the ability to increase the number of digital 3D capable screens we offer to our guests in the future and will do so based on the number of digital 3D films released during future periods and our customers’ response to these 3D releases. |
Hotels and Resorts
| i | Our hotels and resorts division is actively seeking opportunities to invest in new hotels and increase the number of rooms under management. The goal of our hotel investment business, MCS Capital, is to seek opportunities where we may act as an investment fund sponsor, joint venture partner or sole investor in acquiring additional hotel properties. We continue to believe that opportunities to acquire high-quality hotels at reasonable valuations will be present in the future for well-capitalized companies, and we believe that there are partners available to work with us when the appropriate hotel assets are identified. We have a number of potential growth opportunities that we are evaluating. |
| i | We also continue to pursue additional management contracts for other owners, some of which may include small equity investments similar to the investments we have made in the past with strategic equity partners. Although total revenues from an individual hotel management contract are significantly less than from an owned hotel, the operating margins are generally significantly higher due to the fact that all direct costs of operating the property are typically borne by the owner of the property. Management contracts provide us with an opportunity to increase our total number of managed rooms without a significant investment, thereby increasing our returns on equity. In April 2019, we assumed management of the Hyatt Regency Schaumburg hotel in Schaumburg, Illinois. This 468-room hotel recently completed a $15 million renovation and offers upscale accommodations, robust amenities and more than 30,000 square feet of indoor and outdoor meeting and event space, including a 3,100 square foot starlit terrace. This is our first Hyatt-branded hotel under management. Conversely, in May 2019, we ceased managing the Heidel House Resort & Spa in Green Lake, Wisconsin, after the owners of this resort decided to close this property permanently. Early in our fiscal 2019 third quarter, the owners of the Sheraton Chapel Hill Hotel in Chapel Hill, North Carolina sold the hotel, and as a result, our contract to manage this hotel was terminated. |
| i | Unlike our theatre assets where the majority of our return on investment comes from the annual cash flow generated by operations, a portion of the return on our hotel investments is derived from effective portfolio management, which includes determining the proper branding strategy for a given asset along with the proper level of investment and upgrades, as well as identifying an effective divestiture strategy for the asset when appropriate. We closed the InterContinental Milwaukee in early January 2019 and undertook a substantial renovation project that converted this hotel into the unbranded experiential arts hotel, the Saint Kate. The newly renovated hotel reopened during the first week of June 2019 (although a portion of the rooms and food and beverage outlets didn’t fully open until later in the month). |
| 32 |
| i | We have been very opportunistic in our past hotel investments as we have, on many occasions, acquired assets at favorable terms and then improved the properties and operations to create value. We also will continue to periodically explore opportunities to monetize one or more owned hotels. We will consider many factors as we actively review opportunities to execute this strategy, including income tax considerations, the ability to retain management, pricing and individual market considerations. We evaluate strategies for our hotels on an asset-by-asset basis. We have not set a specific goal for the number of hotels that may be considered for this strategy, nor have we set a specific timetable. It is possible that we may sell a particular hotel or hotels during fiscal 2020 or beyond if we determine that such action is in the best interest of our shareholders. |
| i | Our fiscal 2020 plans for our hotels and resorts division also include continued reinvestment in our existing properties to maintain and enhance their value. Late in fiscal 2018 and carrying over into the first half of fiscal 2019, we made additional reinvestments in the Hilton Madison Monona Terrace. Late in fiscal 2020 and carrying over into fiscal 2021, we currently expect to make additional reinvestments in The Pfister® Hotel and Grand Geneva® Resort & Spa. Including possible growth opportunities currently being evaluated, we believe our total fiscal 2020 hotels and resorts capital expenditures will total approximately $20-$25 million, excluding any presently unidentified acquisitions. |
| i | In addition to the growth strategies described above, our hotels and resorts division continues to focus on several strategies that are intended to further grow the division’s revenues and profits. These include leveraging our food and beverage expertise for growth opportunities and growing our catering and events revenues. This also includes hotel food and beverage concepts developed by our Marcus Restaurant Group, featuring premier brands such as Mason Street Grill, ChopHouse®, Miller Time® Pub & Grill and SafeHouse® restaurants. Our current focus is on maximizing the contribution of our newest restaurant, SafeHouse Chicago, but we will consider exploring additional opportunities to expand this concept in the future. |
| i | We have also invested in sales, revenue management and internet marketing strategies in an effort to further increase our profitability, as well as human resource and cost improvement strategies designed to achieve operational excellence and improved operating margins. We are focused on developing our customer service delivery and technology enhancements to improve customer interactions through mobile platforms and other customer touch points. |
Corporate
| i | We periodically review opportunities to make investments in long-term growth opportunities that may not be entirely related to our two primary businesses (but typically have some connection to entertainment, food and beverage, hospitality, real estate, etc.). We are currently reviewing several such opportunities and we may incur capital expenditures during fiscal 2020 related to this strategy. |
| i | In addition to operational and growth strategies in our operating divisions, we continue to seek additional opportunities to enhance shareholder value, including strategies related to our dividend policy, share repurchases and asset divestitures. We increased our regular quarterly common stock cash dividend rate by 20.0% during the first quarter of fiscal 2018, 6.7% during the first quarter of fiscal 2019 and 6.3% during the first quarter of fiscal 2020. In prior years, we have periodically paid special dividends and repurchased shares of our common stock under our existing Board of Directors stock repurchase authorizations. We will also continue to evaluate opportunities to sell real estate when appropriate, allowing us to benefit from the underlying value of our real estate assets. When possible, we will attempt to avail ourselves of the provisions of Internal Revenue Code §1031 related to tax-deferred like-kind exchange transactions. |
| 33 |
The actual number, mix and timing of our potential future new facilities and expansions and/or divestitures will depend, in large part, on industry and economic conditions, our financial performance and available capital, the competitive environment, evolving customer needs and trends, and the availability of attractive acquisition and investment opportunities. It is likely that our growth goals and strategies will continue to evolve and change in response to these and other factors, and there can be no assurance that we will achieve our current goals. Each of our goals and strategies are subject to the various risk factors discussed above in this Annual Report on Form 10-K.
Theatres
Our oldest and most profitable division is our theatre division. The theatre division contributed 67.9% of our consolidated revenues and 88.4% of our consolidated operating income, excluding corporate items, during fiscal 2019, compared to 63.2% and 87.7%, respectively, during fiscal 2018 and 61.7% and 86.2%, respectively, during fiscal 2017. As of December 26, 2019, the theatre division operated motion picture theatres in Wisconsin, Illinois, Iowa, Minnesota, Missouri, Nebraska, North Dakota, Ohio, Arkansas, Colorado, Georgia, Kentucky, Louisiana, New York, Pennsylvania, Texas and Virginia, a family entertainment center in Wisconsin and a retail center in Missouri. The following tables set forth revenues, operating income, operating margin, screens and theatre locations for the last three fiscal years:
| Change F19 v. F18 | Change F18 v. F17 | |||||||||||||||||||||||||||
| F2019 | F2018 | Amt. | Pct. | F2017 | Amt. | Pct. | ||||||||||||||||||||||
| (in millions, except percentages) | ||||||||||||||||||||||||||||
| Revenues | $ | 557.1 | $ | 446.8 | $ | 110.3 | 24.7 | % | $ | 403.4 | $ | 43.4 | 10.8 | % | ||||||||||||||
| Operating income | $ | 76.9 | $ | 88.8 | $ | (11.9 | ) | -13.4 | % | $ | 80.4 | $ | 8.4 | 10.4 | % | |||||||||||||
| Operating margin | 13.8 | % | 19.9 | % | 19.9 | % | ||||||||||||||||||||||
| Number of screens and locations at period-end (1)(2) | F2019 | F2018 | F2017 | |||||||||
| Theatre screens | 1,106 | 889 | 885 | |||||||||
| Theatre locations | 91 | 68 | 69 | |||||||||
| Average screens per location | 12.2 | 13.1 | 13.0 | |||||||||
| (1) | Includes 6 screens at one location managed for another owner at the end of fiscal 2019 and fiscal 2018 and 11 screens at two locations managed for other owners at the end of fiscal 2017. |
| (2) | Includes 29 budget screens at three locations at the end of fiscal 2019, fiscal 2018 and fiscal 2017. Compared to first-run theatres, budget theatres generally have lower box office revenues and associated film costs, but higher concession sales as a percentage of box office revenues. |
The following table provides a further breakdown of the components of revenues for the theatre division for the last three fiscal years:
| Change F19 v. F18 | Change F18 v. F17 | |||||||||||||||||||||||||||
| F2019 | F2018 | Amt. | Pct. | F2017 | Amt. | Pct. | ||||||||||||||||||||||
| (in millions, except percentages) | ||||||||||||||||||||||||||||
| Admission revenues | $ | 284.2 | $ | 246.4 | $ | 37.8 | 15.3 | % | $ | 227.1 | $ | 19.3 | 8.5 | % | ||||||||||||||
| Concession revenues | 231.2 | 166.6 | 64.6 | 38.8 | % | 149.0 | 17.6 | 11.8 | % | |||||||||||||||||||
| Other revenues | 40.8 | 32.5 | 8.3 | 25.4 | % | 25.2 | 7.3 | 29.2 | % | |||||||||||||||||||
| 556.2 | 445.5 | 110.7 | 24.8 | % | 401.3 | 44.2 | 11.0 | % | ||||||||||||||||||||
| Cost reimbursements | 0.9 | 1.3 | (0.4 | ) | -32.1 | % | 2.1 | (0.8 | ) | -39.6 | % | |||||||||||||||||
| Total revenues | $ | 557.1 | $ | 446.8 | $ | 110.3 | 24.7 | % | $ | 403.4 | $ | 43.4 | 10.8 | % | ||||||||||||||
As described above in the “Current Plans” section of this MD&A, on February 1, 2019, we acquired the assets of Movie Tavern, a New Orleans-based industry leading circuit known for its in-theatre dining concept featuring chef-driven menus, premium quality food and drink and luxury seating. The acquired circuit consists of 208 screens at 22 locations in nine states – Arkansas, Colorado, Georgia, Kentucky, Louisiana, New York, Pennsylvania, Texas and Virginia. The purchase price consisted of $30 million in cash, subject to certain adjustments, and 2,450,000 shares of our common stock, for a total purchase price of approximately $139.3 million, based upon our closing share price on January 31, 2019. The acquisition of the Movie Tavern circuit increased our total number of screens by an additional 23%. The impact that the Movie Tavern acquisition has had on our key financial measures and metrics is described further in the discussion below.
| 34 |
Fiscal 2019 versus Fiscal 2018
Our theatre division fiscal 2019 revenues increased by 24.7% compared to fiscal 2018 due to the newly acquired Movie Tavern theatres, increased other revenues and increases in our average ticket price and average concession revenues per person at our comparable theatres, partially offset by the impact of decreased attendance at comparable theatres due to a weaker film slate during fiscal 2019. The 22 acquired Movie Tavern theatres contributed approximately $125.8 million to our theatre division revenues during the 47 weeks that we owned these theatres during fiscal 2019. We also opened a new eight-screen Movie Tavern by Marcus theatre in Brookfield, Wisconsin early in our fiscal 2019 fourth quarter that favorably impacted our admission revenues and concession revenues in fiscal 2019 compared to fiscal 2018.
Total theatre attendance increased 8.8% and total admission revenues increased 15.3% during fiscal 2019 compared to fiscal 2018. Excluding Movie Tavern and the newly opened theatre, fiscal 2019 attendance and admission revenues at our comparable theatres decreased approximately 8.6% and 5.5%, respectively, compared to the prior year. The following table sets forth our percentage change in comparable theatre attendance during each of the interim periods of fiscal 2019 compared to the same periods during fiscal 2018. In addition, the table compares the percentage change in our fiscal 2019 comparable theatre admission revenues to the corresponding percentage change in the United States box office revenues (excluding new builds for the top 10 theatre circuits) during the same periods (as compiled by us from data received from Comscore, a national box office reporting service for the theatre industry):
| Change F19 v. F18 | ||||||||||||||||||||
| 1st Qtr. | 2nd Qtr. | 3rd Qtr. | 4th Qtr. | Total | ||||||||||||||||
| Pct. change in Marcus theatre attendance | -16.6 | % | -7.2 | % | +0.2 | % | -9.9 | % | -8.6 | % | ||||||||||
| Pct. change in Marcus admission revenues | -17.8 | % | -3.7 | % | +6.3 | % | -5.1 | % | -5.5 | % | ||||||||||
| Pct. change in U.S. box office revenues | -16.5 | % | -4.5 | % | +3.0 | % | -5.5 | % | -6.0 | % | ||||||||||
| Marcus performance vs. U.S. | -1.3 | pts | +0.8 | pts | +3.3 | pts | +0.4 | pts | +0.5 | pts | ||||||||||
Our comparable theatres outperformed the industry during fiscal 2019 by 0.5 percentage points, and we have outperformed the industry during 19 of the last 24 quarters. In general, we believe our overall outperformance of the industry has been attributable to the investments we have made in new features and amenities in select theatres and our implementation of innovative operating and marketing strategies that have increased attendance, including our $5 Tuesday promotion and our customer loyalty program (all of which are described in the “Current Plans” section of this MD&A). Our goal is to continue our past pattern of outperforming the industry, but with the financial impact of the majority of our completed renovations for our legacy circuit now reflected in our current results, our ability to do so in any given quarter will likely be partially dependent upon film mix, weather, the competitive landscape in our markets and the impact of local sporting events.
We did not include the performance of our Movie Tavern theatres, which we acquired in February 2019, in the comparison to the industry because we did not own Movie Tavern during fiscal 2018. Based upon data available to us from the previous owner, however, we believe that our Movie Tavern theatres outperformed the industry by approximately seven percentage points during the 11 months that we owned them during fiscal 2019. We believe that this outperformance was once again attributable to investments we have made in new features and amenities in select theatres (all of which are described in the “Current Plans” section of this MD&A) and our implementation of innovative operating and marketing strategies that have increased attendance, including our $5 Tuesday promotion and our customer loyalty program.
| 35 |
Theatre attendance and corresponding box office revenues vary significantly from quarter to quarter due to a variety of factors. The third quarter of fiscal 2019 was a particularly good quarter for the industry and included strong performances from two of our top four films for fiscal 2019, The Lion King and Toy Story 4, as well as a strong horror film, It Chapter Two, which was released during the historically slower movie-going month of September. We believe that a favorable film mix during the third quarter of fiscal 2019 compared to the third quarter of fiscal 2018 may also have had a positive impact on our comparative performance versus the overall industry. We believe our theatres outperformed our normal share of the total box office on the films noted above, as family-oriented films and horror films represent genres that have historically performed very well in our legacy Midwestern markets.
Conversely, the first quarter of fiscal 2019 was a particularly weak quarter for the industry compared to the prior year. The first quarter of fiscal 2018 benefited from several strong 2017 holdover films, such as Star Wars: The Last Jedi, Jumanji: Welcome to the Jungle and The Greatest Showman. We did not have as many strong holdovers from 2018 to benefit the first quarter of fiscal 2019. The reductions in fiscal 2019 first quarter attendance and admission revenues were also due to the fact that our highest grossing film of fiscal 2018, Black Panther, was released during February 2018, and February 2019 film product could not match those results. We also believe that snowier and colder Midwestern weather and a less favorable film mix in the fiscal 2019 first quarter compared to last year may also have had a slight negative impact on our comparative performance versus the overall industry. We believe our Midwestern circuit outperformed our normal share of the total box office on all three of the above referenced 2017 holdover films last year, negatively impacting our relative performance to the U.S. box office during the first quarter of fiscal 2019.
Finally, while our fiscal 2019 second quarter and fourth quarter comparable theatre admission revenues decreased compared to the prior year, we once again outperformed the industry during these periods. Favorable weather conditions and a film mix that included films such as Avengers: Endgame, Frozen 2 and Star Wars: The Rise of Skywalker (film franchises which historically have performed very well in our legacy Midwestern markets) likely contributed to our second and fourth quarter outperformance.
Revenues for the theatre business and the motion picture industry in general are heavily dependent on the general audience appeal of available films, together with studio marketing, advertising and support campaigns and the maintenance of a reasonably lengthy “window” between the date a film is released in theatres and the date a film is released to other channels, including video on-demand (VOD), streaming services and DVD. These are factors over which we have no control. Many current films are now released to ancillary markets within 75-90 days, and more than one studio has periodically discussed its interest in creating a new, shorter window. We have expressed our concerns to the studios regarding the impact that a shortened release window may have on future box office receipts. We have also indicated that we would not play films that did not respect the current theatrical exclusivity window and would seek adjustments in the current financial arrangements we have with film studios in the event that the film studios implement shorter release windows.
We believe that the most significant factor contributing to variations in theatre attendance during fiscal 2019, as in other periods, was the quantity and quality of films released during the respective periods compared to the films released during the same periods of the prior year. Blockbusters (generally defined as films grossing more than $100 million nationally) accounted for an increased percentage of our total admission revenues during fiscal 2019 compared to fiscal 2018 - our top 15 performing films accounted for 48% of our total admission revenues during fiscal 2019 compared to 42% during fiscal 2018. The following five top performing fiscal 2019 films, all distributed by Disney, accounted for nearly 26% of the total admission revenues for our circuit: Avengers: Endgame, The Lion King, Frozen 2, Toy Story 4 and Captain Marvel. The top five performing films during fiscal 2018 accounted for approximately 23% of our total admission revenues.
| 36 |
The quantity of wide-release films shown in our theatres and number of wide-release films provided by the six major studios decreased during fiscal 2019 compared to fiscal 2018. A film is generally considered “wide release” if it is shown on over 600 screens nationally, and these films generally have the greatest impact on box office receipts. We played 117 wide-release films (including 29 digital 3D films) at our theatres during fiscal 2019 compared to 132 wide-release films (including 24 digital 3D films) during fiscal 2018. In total, we played 285 films and 190 alternate content attractions at our theatres during fiscal 2019 compared to 344 films and 216 alternate content attractions during fiscal 2018. Based upon projected film and alternate content availability, we currently estimate that we may show an increased number of films and alternate content events on our screens during fiscal 2020 compared to fiscal 2019.
Our average ticket price increased 8.0% during fiscal 2019 compared to fiscal 2018, due in part to the addition of Movie Tavern theatres in certain markets where competitive pricing is slightly higher than in our legacy Midwestern markets. Excluding Movie Tavern theatres, our average ticket price at comparable theatres increased 3.4% during fiscal 2019 compared to fiscal 2018. At the beginning of the second quarter of fiscal 2019, we implemented selected ticket price increases at certain locations in order to reflect the competitive market in which those theatres operate. In addition, we enacted a modest price increase for our proprietary PLF screens and converted our admission ticket pricing to a sales tax additive (or “tax-on-top”) model, consistent with the majority of our competitors. These modest ticket price increases likely had a favorable impact on our average ticket price during fiscal 2019. The fact that our top performing films during the fiscal 2019 performed particularly well in our PLF screens (with a corresponding price premium), and that we have more PLF screens this year than we did the prior year, also contributed to our increased average ticket price during fiscal 2019 compared to the prior year. Conversely, a strong line-up of Disney family-oriented films released during fiscal 2019, such as Dumbo, Aladdin, Toy Story 4, The Lion King and Frozen 2, likely had an unfavorable impact on our average ticket price during fiscal 2019, as films that generally appeal to a younger audience result in a higher percentage of lower-priced children’s tickets sold. The increase in our average ticket price contributed approximately $7.6 million to our comparable theatres admission revenues during fiscal 2019, partially offsetting the impact of reduced attendance on our overall decreased comparable theatre admission revenues during fiscal 2019 compared to fiscal 2018. We currently expect that our average ticket price may increase again at our comparable theatres during fiscal 2020, but film mix will likely once again impact our final result.
Total concession revenues increased 38.8% during fiscal 2019 compared to fiscal 2018. Excluding Movie Tavern theatres, concession revenues at our comparable theatres decreased approximately 2.4% compared to the prior year. Our average concession sales per person increased 27.6% during fiscal 2019 compared to fiscal 2018. Our Movie Tavern theatres had a significant favorable impact on our overall average concession sales per person, as the average concession sales per person at these dine-in theatres are on average more than double the average concession sales per person we generally achieve at our average theatre without a dine-in option. Excluding Movie Tavern, our average concession revenues per person at comparable theatres increased 6.9% during fiscal 2019 compared to fiscal 2018. The increase in our concession sales per person contributed approximately $10.6 million to our comparable theatres concession revenues during fiscal 2019, partially offsetting the impact of reduced attendance on our overall decreased comparable theatre concession revenues during fiscal 2019 compared to fiscal 2018. Pricing, concession/food and beverage product mix and film product mix are the three primary factors that impact our concession sales per person. A change in concession product mix, including increased sales of higher priced non-traditional food and beverage items from our increasing number of Take Five Lounges, Zaffiro’s Express, Reel Sizzle and in-theatre dining outlets, was the primary reason for our increased average concession sales per person during fiscal 2019. Conversely, we believe that the above-described change in film product mix during fiscal 2019 may have slightly reduced the growth of our overall average concession sales per person, as family-oriented and animated films such as the Disney films identified above tend not to contribute to sales of non-traditional food and beverage items as much as adult-oriented films. We currently expect to report an increase in our average concession sales per person at our comparable theatres during fiscal 2020 compared to fiscal 2019 due to our increased number of non-traditional food and beverage outlets, although as noted above, several factors may impact our actual results in this key metric.
| 37 |
Other revenues, which include management fees, pre-show advertising income, family entertainment center revenues, surcharge revenues, rental income and gift card breakage income, increased by $8.3 million during fiscal 2019 compared to fiscal 2018. This increase was primarily due to internet surcharge ticketing fees and preshow advertising income from our new Movie Tavern locations. We currently expect other revenues to continue to increase in fiscal 2020.
Our theatre division operating income and operating margin decreased during fiscal 2019 compared to fiscal 2018 due primarily to reduced attendance and revenues at comparable theatres as described above. Due to the significant investments we have made in our theatres over the last five years, we have higher fixed costs, such as rent, depreciation and amortization, and higher labor expenses, attributable in part to our increased number of new food and beverage outlets in our theatres. As a result, it is more difficult to remove costs when attendance declines as it did in several quarters during fiscal 2019, and operating margins are more likely to decline when that happens. Conversely, during periods with a strong film slate, operating margins potentially increase, as that same “leverage” should benefit our theatre division. Our fiscal 2019 operating margin was also negatively impacted by higher film costs, expressed as a percentage of admission revenues, compared to the prior year. Film cost percentage increased during fiscal 2019 primarily due to the increased percentage of our admission revenues that were derived from our top five blockbuster films during fiscal 2019 compared to fiscal 2018 (discussed above). Film costs, expressed as a percentage of admission revenues, are generally greater for the significant blockbuster films.
Due to the weaker 2019 film slate and anticipated ramp-up costs as we integrated the 22 acquired Movie Tavern theatres into our operating and marketing systems and programs, the Movie Tavern theatres, excluding acquisition and preopening expenses, did not have a significant impact on our theatre division operating income during fiscal 2019. Our theatre division operating margin also declined during fiscal 2019 compared to fiscal 2018 due to the impact of the Movie Tavern theatres. Our Movie Tavern theatres have a lower operating margin than our legacy theatres because all 22 acquired theatres are leased rather than owned (rent expense is generally significantly higher than depreciation expense). In addition, the fact that a larger portion of Movie Tavern revenues are derived from the sale of in-theatre food and beverage also results in lower operating margins, as food and labor costs are generally higher for those items compared to traditional concession items. Our operating income and operating margin were also negatively impacted during fiscal 2019 by approximately $2.5 million of acquisition and preopening expenses related to the Movie Tavern acquisition and the opening of a newly built Movie Tavern theatre in Brookfield, Wisconsin. Our operating income and operating margin were negatively impacted during fiscal 2018 by approximately $1.7 million of acquisition and preopening expenses related to the Movie Tavern acquisition.
In addition to the screens added due to the Movie Tavern acquisition, we opened one new UltraScreen DLX at an existing Marcus Wehrenberg theatre during the first quarter of fiscal 2019. We also opened a new eight-screen Movie Tavern by Marcus theatre in Brookfield, Wisconsin early in our fiscal 2019 fourth quarter and added four new screens to an existing Movie Tavern theatre during the first quarter of fiscal 2020. We did not add any new screens to existing theatres or open any new theatres during fiscal 2018. We ceased managing one five-screen theatre during the second quarter of fiscal 2018, and we lost one screen at a Marcus Wehrenberg theatre during the second quarter of fiscal 2018 in conjunction with a renovation that expanded the size of two adjacent auditoriums.
Admission revenues at comparable theatres during the first quarter of fiscal 2020 through the date of this report have increased compared to the prior year comparable period due primarily to a strong week between December 27 and New Year’s Day, and a stronger January and February film slate compared to the prior year. Snow and extreme cold in the Midwest during the first quarter of fiscal 2019 likely also had a negative impact on admission revenues last year. In addition to December holdover films such as Star Wars: The Rise of Skywalker and Jumanji: The Next Level, films such as 1917, Bad Boys For Life, Dolittle and Sonic the Hedgehog have contributed positively to our early fiscal 2020 results. Comparisons for the remainder of the quarter may be negatively impacted by the strong performance from Captain Marvel during March 2019.
| 38 |
The film slate for the remainder of fiscal 2020 is expected to include a higher quantity of films and will likely be less dependent on major blockbusters. Whether a more diverse slate of films from multiple studios, without an Avengers or Star Wars movie, can match the box office performance of the Disney-centric franchise film line-up we experienced in fiscal 2019 is yet to be determined. Films that have potential to perform very well during the remainder of fiscal 2020 include Onward, A Quiet Place Part II, Mulan, Peter Rabbit 2: The Runaway, No Time to Die, Black Widow, Trolls: World Tour, Scoob!, The Spongebob Movie: Sponge On The Run, Fast & Furious 9, Wonder Woman 1984, Soul, Top Gun Maverick, In The Heights, Minions: The Rise Of Gru, Free Guy, Ghostbusters: Afterlife, Tenet, Jungle Cruise, Morbius, Bill & Ted Face The Music, The King’s Man, Venom 2, Death On The Nile, The Eternals, Raya and The Last Dragon, Godzilla vs. Kong, Dune, Coming To America sequel, The Croods 2 and West Side Story. Generally, an increase in the quantity of films released, particularly from the six major studios, increases the potential for more blockbusters in any given year. Our goal is to continue to outperform the industry, but with the majority of our renovations now completed for our circuit, our ability to do so in any given quarter will likely be partially dependent upon film mix, weather, the competitive landscape in our markets and the impact of local sporting events.
As noted above, fiscal 2020 will be a 53-week year, which began on December 27, 2019 and will end on December 31, 2020. We anticipate that our reported results for fiscal 2020 will benefit from the additional week of reported operations. In particular, the additional week of operations will most benefit our theatre division, as it includes the traditionally strong movie-going week between Christmas and New Year’s Day. The last time we had an additional week of operations was during the Transition Period. Our additional 31st week of operations that year, which included a new Star Wars film, contributed approximately $14.4 million in additional revenues and $5.7 million in additional operating income to our final five-week period and Transition Period results for our theatre division. Although there can be no assurance that we will realize similar benefits in fiscal 2020, it is important to note that our theatre operations in 2015 did not include our two recent acquisitions.
Hotels and Resorts
The hotels and resorts division contributed 32.1% of our consolidated revenues and 11.6% of our consolidated operating income, excluding corporate items, during fiscal 2019, compared to 36.8% and 12.3%, respectively, during fiscal 2018 and 38.2% and 13.8%, respectively, during fiscal 2017. As of December 26, 2019, the hotels and resorts division owned and operated three full-service hotels in downtown Milwaukee, Wisconsin, a full-service destination resort in Lake Geneva, Wisconsin and full-service hotels in Madison, Wisconsin, Chicago, Illinois, Lincoln, Nebraska and Oklahoma City, Oklahoma (we have a majority-ownership position in the Oklahoma City, Oklahoma hotel). In addition, the hotels and resorts division managed 12 hotels, resorts and other properties for other owners. Included in the 12 managed properties is one hotel owned by a joint venture in which we have a minority interest and two condominium hotels in which we own some or all of the public space. The following tables set forth revenues, operating income, operating margin and rooms data for the hotels and resorts division for the past three fiscal years:
| Change F19 v. F18 | Change F18 v. F17 | |||||||||||||||||||||||||||
| F2019 | F2018 | Amt. | Pct. | F2017 | Amt. | Pct. | ||||||||||||||||||||||
| (in millions, except percentages) | ||||||||||||||||||||||||||||
| Revenues | $ | 263.4 | $ | 259.9 | $ | 3.5 | 1.3 | % | $ | 249.6 | $ | 10.3 | 4.1 | % | ||||||||||||||
| Operating income | $ | 10.1 | $ | 12.5 | $ | (2.4 | ) | -19.5 | % | $ | 12.9 | $ | (0.4 | ) | -3.2 | % | ||||||||||||
| Operating margin | 3.8 | % | 4.8 | % | 5.2 | % | ||||||||||||||||||||||
| Available rooms at period-end | F2019 | F2018 | F2017 | |||||||||
| Company-owned | 2,627 | 2,629 | 2,629 | |||||||||
| Management contracts with joint ventures | 333 | 333 | 333 | |||||||||
| Management contracts with condominium hotels | 480 | 480 | 480 | |||||||||
| Management contracts with other owners | 1,945 | 1,833 | 1,399 | |||||||||
| Total available rooms | 5,385 | 5,275 | 4,841 | |||||||||
| 39 |
The following table provides a further breakdown of the components of revenues for the hotels and resorts division for the last three fiscal years:
| Change F19 v. F18 | Change F18 v. F17 | |||||||||||||||||||||||||||
| F2019 | F2018 | Amt. | Pct. | F2017 | Amt. | Pct. | ||||||||||||||||||||||
| (in millions, except percentages) | ||||||||||||||||||||||||||||
| Room revenues | $ | 105.9 | $ | 108.8 | $ | (2.9 | ) | -2.7 | % | $ | 106.9 | $ | 1.9 | 1.8 | % | |||||||||||||
| Food/beverage revenues | 74.7 | 72.8 | 1.9 | 2.6 | % | 70.6 | 2.2 | 3.0 | % | |||||||||||||||||||
| Other revenues | 46.5 | 45.3 | 1.2 | 2.7 | % | 43.4 | 1.9 | 4.6 | % | |||||||||||||||||||
| 227.1 | 226.9 | 0.2 | 0.1 | % | 220.9 | 6.0 | 2.7 | % | ||||||||||||||||||||
| Cost reimbursements | 36.3 | 33.0 | 3.3 | 10.0 | % | 28.7 | 4.3 | 15.0 | % | |||||||||||||||||||
| Total revenues | $ | 263.4 | $ | 259.9 | $ | 3.5 | 1.3 | % | $ | 249.6 | $ | 10.3 | 4.1 | % | ||||||||||||||
Fiscal 2019 versus Fiscal 2018
Our hotels and resorts division revenues increased 1.3% during fiscal 2019 compared to fiscal 2018 due primarily to an increase in cost reimbursements, partially offset by the fact that the InterContinental Milwaukee was closed during the majority of the first six months of fiscal 2019 as it underwent a major renovation that converted this hotel into the Saint Kate. The newly renovated hotel reopened during the first week of June 2019 (although a portion of the rooms and food and beverage outlets did not fully open until later in the month). Excluding this hotel and cost reimbursements from managed properties, total revenues during fiscal 2019 increased by 2.6% compared to fiscal 2018, due primarily to increased room revenues and food and beverage revenues at our seven other owned hotels and resorts, as well as increased other revenues.
Room revenues decreased during fiscal 2019 compared to fiscal 2018 due entirely to the closing of the InterContinental Milwaukee and its reopening as the Saint Kate, partially offset by increased revenue per available room, or RevPAR, at our remaining seven company-owned hotels. Excluding the Saint Kate, room revenues during fiscal 2019 increased by 1.1% compared to fiscal 2018, despite the fact that our Hilton Madison hotel was undergoing a major renovation during the first half of fiscal 2019 that negatively impacted our overall room revenues. Food and beverage revenues increased during fiscal 2019 compared to fiscal 2018 despite having a closed hotel for most of the first half of fiscal 2019. Excluding the Saint Kate, food and beverage revenues during fiscal 2019 increased by 3.8% compared to fiscal 2018, due primarily to increased banquet and catering revenues, and despite the negative impact from our Hilton Madison hotel while it was under renovation. Other revenues increased during fiscal 2019 compared to fiscal 2018 due in part to increased management fees and revenues from our company-owned laundry facility. Cost reimbursements also increased during fiscal 2019 compared to fiscal 2018 due to an increase in the number of management contracts in this division.
Hotels and resorts division operating income and operating margin decreased by 19.5% and 1.0 percentage points (from 4.8% to 3.8%), respectively, during fiscal 2019 compared to fiscal 2018 due entirely to approximately $6.8 million of preopening expenses and initial startup losses related to the closing and conversion of the InterContinental Milwaukee into the Saint Kate. We also had approximately $1.1 million of additional depreciation and amortization attributable to this hotel during fiscal 2019 due to the new investment made at this property. Our operating income during fiscal 2018 was negatively impacted by preopening expenses of approximately $500,000 and accelerated depreciation expense of approximately $3.7 million also related to the Saint Kate conversion. Excluding this hotel from both years, our fiscal 2019 operating income would have improved by approximately $1.2 million, or 7.6% ($17.4 million in fiscal 2019 compared to $16.2 million in fiscal 2018). Again excluding this hotel, our operating margin was 6.8% during fiscal 2019 compared to 6.5% during fiscal 2018. This same-hotel improvement can be attributed to increased revenues and a continued focus on cost controls and operating efficiency and was achieved despite the fact that the renovation at the Hilton Madison hotel negatively impacted our operating results during fiscal 2019.
| 40 |
Initial guest and community reaction to the new Saint Kate hotel has been very favorable. As an independent hotel, we expected that it would take a period of time for this hotel to ramp up, particularly with group business, and as a result our fiscal 2019 second half comparisons of Saint Kate to a stabilized branded hotel during the prior year were unfavorable. The Saint Kate is achieving a higher average daily room rate than the hotel it replaced and its food and beverage revenues are exceeding the previous hotel as well. We believe that over time, the new hotel will ultimately outperform the previous hotel.
The following table sets forth certain operating statistics, including our average occupancy percentage (number of occupied rooms as a percentage of available rooms), our average daily room rate (“ADR”), and our total revenue per available room (“RevPAR”), for company-owned properties:
| Change F19 v. F18 | ||||||||||||||||
| Operating Statistics(1) | F2019 | F2018 | Amt. | Pct. | ||||||||||||
| Occupancy percentage | 73.6 | % | 74.0 | % | -0.4 | pts | -0.5 | % | ||||||||
| ADR | $ | 154.42 | $ | 151.98 | $ | 2.44 | 1.6 | % | ||||||||
| RevPAR | $ | 113.65 | $ | 112.51 | $ | 1.14 | 1.0 | % | ||||||||
| (1) | These operating statistics represent averages of our comparable seven distinct company-owned hotels and resorts, branded and unbranded, in different geographic markets with a wide range of individual hotel performance. The statistics are not necessarily representative of any particular hotel or resort. The statistics exclude the former InterContinental Milwaukee hotel (now the Saint Kate), as this hotel was closed for the majority of the first half of fiscal 2019 and was not comparable to the prior year stabilized branded hotel during the second half of fiscal 2019. |
RevPAR increased at five of our seven comparable company-owned properties during fiscal 2019 compared to fiscal 2018. As noted above, our Hilton Madison hotel underwent a major renovation during the first half of fiscal 2019, negatively impacting our overall operating statistics. Excluding the Hilton Madison, our remaining six comparable company-owned hotels experienced a RevPAR increase of 2.4% during fiscal 2019 compared to fiscal 2018. According to data received from Smith Travel Research and compiled by us in order to analyze our fiscal 2019 results, comparable “upper upscale” hotels throughout the United States experienced an increase in RevPAR of 1.0% during fiscal 2019. Data received from Smith Travel Research for our various “competitive sets” – hotels identified in our specific markets that we deem to be competitors to our hotels – indicates that these hotels experienced an increase in RevPAR of 2.7% during fiscal 2019. As a result, excluding the Hilton Madison, our RevPAR performance during fiscal 2019 exceeded the national averages and was in-line with our competitive sets.
The following table sets forth the change in our average occupancy percentage, ADR and RevPAR for each quarterly period of fiscal 2019 compared to fiscal 2018 (excluding the InterContinental Milwaukee, which is now the Saint Kate):
| Change F19 v. F18 | ||||||||||||||||
| 1st Qtr. | 2nd Qtr. | 3rd Qtr. | 4th Qtr. | |||||||||||||
| Occupancy percentage | -1.3 | pts | 0.4 | pts | -0.5 | pts | -0.3 | pts | ||||||||
| ADR | 0.1 | % | 2.9 | % | 1.2 | % | 1.7 | % | ||||||||
| RevPAR | -1.9 | % | 3.4 | % | 0.6 | % | 1.3 | % | ||||||||
As indicated in the table above, our RevPAR performance varied from quarter to quarter, driven primarily by variations in group business during each quarter. If the Hilton Madison hotel is excluded from the first two quarters due to the renovation underway during those periods, our first quarter and second quarter RevPAR for our remaining six comparable company-owned hotels increased 2.6% and 5.4%, respectively during those periods compared to the prior year same periods. Our company-owned hotels, and in particular our largest hotels, derive a significant portion of their revenues from group business, and as a result, we are more susceptible to variations in RevPAR from quarter to quarter depending upon the strength of the group business market during that particular quarter. Group business also tends to have an impact on our food and beverage revenues because groups are more likely to use our banquet and catering services during their stay. As indicated in the quarterly results above, reduced group business negatively impacted several of our hotels during the first quarter of fiscal 2019 and increased group business favorably impacted several of our hotels during the second, third and fourth quarters of fiscal 2019 compared to the same periods in fiscal 2018. According to data received from Smith Travel Research and compiled by us in order to analyze our fiscal 2019 quarterly results, we outperformed our competitive sets during the second and fourth quarters of fiscal 2019 and underperformed our competitive sets during the first and third quarters of fiscal 2019.
| 41 |
Our comparable hotel RevPAR growth of 1.0% during fiscal 2019 compared to fiscal 2018 was entirely the result of an increase in our comparable ADR. We experienced increases in our ADR during all four fiscal 2019 quarters and five of our seven comparable company-owned hotels (including the Hilton Madison, but excluding the Saint Kate) reported increased ADR during fiscal 2019 compared to fiscal 2018. Group business also has an impact on our ADR. Typically, when we have substantial blocks of rooms committed to group business, we are able to raise rates with non-group business. Our largest increase in ADR during fiscal 2019 – the second quarter – coincided with our largest increases in group business during the year. Conversely, leisure customers tend to be very loyal to online travel agencies, which is one of the reasons why we continue to experience some rate and margin pressure. While we have been selective in choosing the online portals to which we grant access to our inventory, such portals are part of the booking landscape today, and our goal is to use them in the most efficient way possible.
Nationally, the pace of RevPAR growth has been declining over the past several years and many published reports by those who closely follow the hotel industry suggest that the United States lodging industry will experience very limited overall growth in RevPAR in calendar 2020, with some markets possibly experiencing small declines. Whether the relatively positive trends in the lodging industry over the last several years will continue depends in large part on the economic environment, as hotel revenues have historically tracked very closely with traditional macroeconomic statistics such as the gross domestic product. We also continue to monitor hotel supply in our markets, as increased supply without a corresponding increase in demand may have a negative impact on our results.
We generally expect our future revenue trends to track the overall industry trends, particularly in our respective markets. We are encouraged by the fact that, as of the date of this Annual Report on Form 10-K, our group room revenue bookings for future periods in fiscal 2020 – something commonly referred to in the hotels and resorts industry as “group pace” – are ahead of our group room revenue bookings for future periods as of the same date last year. Banquet and catering revenue pace for fiscal 2020 is also currently ahead of where we were last year at this same time. Conversely, several of our markets, including Oklahoma City, Oklahoma, Chicago, Illinois and Milwaukee, Wisconsin, have experienced an increase in room supply over the past several years that may be an impediment to any substantial increases in ADR in the near term. Milwaukee will be hosting the Democratic National Convention in the summer of 2020, which we believe will not only favorably impact fiscal 2020 results (group pace is up significantly for 2020), but has the potential to have a positive long-term impact on the overall market. We also expect our Milwaukee hotels to benefit in September 2020 from the fact that a major golf tournament, The Ryder Cup, will be held one hour north of the city in Kohler, Wisconsin.
As discussed in the “Current Plans” section of this MD&A, we currently anticipate beginning major renovations at The Pfister Hotel and Grand Geneva Resort & Spa late in fiscal 2020, with the majority of the work likely to be performed during fiscal 2021. We do not currently expect these renovations to have any significant impact on fiscal 2020 operating results. We do expect favorable comparisons during fiscal 2020 (compared to fiscal 2019 results) at the Hilton Madison, now that renovations are complete, and the Saint Kate, as it will be open all year and should experience operating improvements as market awareness of this new hotel continues to increase. Additionally, as noted above, fiscal 2020 will be a 53-week year. The last time we had an additional week of operations was during our Transition Period. Our additional 31st week of operations that year contributed approximately $3.0 million in additional revenues and $700,000 in additional operating income to our final five-week period and Transition Period results for our hotels and resorts division. There can be no assurance that we will realize similar benefits in fiscal 2020.
| 42 |
Our hotels and resorts division operating results during fiscal 2019 benefited from three management contracts added during fiscal 2018 – the Murieta Inn and Spa in Rancho Murieta, California (added January 2018), along with the DoubleTree by Hilton Hotel El Paso Downtown (added April 2018) and Courtyard by Marriott El Paso Downtown/Convention Center (added August 2018), both in El Paso, Texas. In addition, on April 1, 2019, we assumed management of the Hyatt Regency Schaumburg hotel in Schaumburg, Illinois. Conversely, in May 2019, we ceased managing the Heidel House Resort & Spa in Green Lake, Wisconsin, after the owners of this resort decided to close this property permanently. Early in our fiscal 2019 third quarter, the owners of the Sheraton Chapel Hill Hotel in Chapel Hill, North Carolina sold the hotel, and as a result our contract to manage this hotel was terminated. The loss of these management contracts has partially offset the benefits of the new management contracts described above. As of the date of this filing, our current portfolio of hotels and resorts includes 20 owned and managed properties across the country.
As discussed in the “Current Plans” section of this MD&A, we are considering a number of potential growth opportunities that may impact fiscal 2020 operating results. In addition, if we were to sell one or more hotels during fiscal 2020, our fiscal 2020 operating results could be significantly impacted. The extent of any such impact will likely depend upon the timing and nature of the growth opportunity (pure management contract, management contract with equity, joint venture investment, or other opportunity) or divestiture (management retained, equity interest retained, etc.).
During our fiscal 2020 first quarter, Michael R. Evans joined us as the new president of Marcus Hotels & Resorts. Mr. Evans is a proven lodging industry executive with more than 20 years of experience in the hospitality industry with companies such as Marriott International, Inc. and MGM Resorts International. We believe that Mr. Evan’s proven development, operating and leadership experience and strong roots in the hospitality industry make him extremely qualified to build on our hotels and resorts division’s long history of success. Prior to Mr. Evans joining us, Greg Marcus, our president and chief executive officer, had assumed operational oversight of this division and served as acting-president of our hotels and resorts division during fiscal 2019, supported by a strong and experienced senior leadership team.
Liquidity and Capital Resources
Liquidity
Our theatre and hotels and resorts divisions each generate significant and relatively consistent daily amounts of cash, subject to seasonality described above, because each segment’s revenue is derived predominantly from consumer cash purchases. We believe that these relatively consistent and predictable cash sources, as well as the availability of $139 million of unused credit lines at the end of fiscal 2019, are adequate to support the ongoing operational liquidity needs of our businesses during fiscal 2020.
On January 9, 2020, we replaced our then existing $225 million credit agreement by entering into a new five-year credit agreement among us and several banks, including JPMorgan Chase Bank, N.A., as Administrative Agent, and U.S. Bank National Association, as Syndication Agent (the “Credit Agreement”), and we intend to use borrowings under the Credit Agreement for general corporate purposes. The Credit Agreement provides for a revolving credit facility that matures on January 9, 2025 with an initial maximum aggregate amount of availability of $225 million. We may request to increase the aggregate amount of availability under the Credit Agreement by an aggregate amount of up to $125 million by increasing the revolving credit facility or adding one or more tranches of term loans, subject to certain conditions, which include, among other things, the absence of any default or event of default or material adverse effect under the Credit Agreement.
| 43 |
Under the Credit Agreement, we have agreed to pay a facility fee, payable quarterly, equal to 0.125% to 0.250% of the total commitment, depending on our consolidated debt to capitalization ratio, as defined in the Credit Agreement. Certain borrowings, such as ABR borrowings, under the revolving credit facility bear interest, payable no less frequently than quarterly, at a rate equal to the alternate base rate, as defined in the Credit Agreement, plus the applicable rate, as defined in the Credit Agreement. Other borrowings, such as Eurodollar borrowings, under the revolving credit facility bear interest at a rate equal to the adjusted LIBO rate for the interest period, as defined in the Credit Agreement, plus the applicable rate.
The Credit Agreement contains various restrictions and covenants applicable to The Marcus Corporation and certain of our subsidiaries. Among other requirements, the Credit Agreement limits the amount of priority debt, as defined in the Credit Agreement, held by our restricted subsidiaries to no more than 20% of our consolidated total capitalization, as defined in the Credit Agreement, limits our permissible consolidated debt to total capitalization ratio to a maximum of 0.55 to 1.0 and requires us to maintain a minimum fixed charge coverage ratio (consolidated adjusted cash flow to consolidated interest and rental expense) of 3.0 to 1.0, as defined in the Credit Agreement.
The majority of our other long-term debt consists of senior notes and mortgages with annual maturities of $9.9 million and $11.0 million in fiscal 2020 and 2021, respectively.
The Credit Agreement and the senior notes impose various financial covenants applicable to The Marcus Corporation and certain of our subsidiaries. As of the date of this filing, we are in compliance with all of the financial covenants imposed by the Credit Agreement and the senior notes, and we expect to be able to meet such financial covenants during the remainder of fiscal 2020.
Financial Condition
Fiscal 2019 versus Fiscal 2018
Net cash provided by operating activities totaled $141.5 million during fiscal 2019 compared to $137.4 million during fiscal 2018, an increase of $4.1 million, or 3.0%. The increase in net cash provided by operating activities was due primarily to increased depreciation and amortization and deferred income taxes and the favorable timing in the payment of accounts payable in fiscal 2019, partially offset by reduced net earnings and the unfavorable timing in the collection of accounts receivable and payment of income taxes in fiscal 2019.
Net cash used in investing activities during fiscal 2019 totaled $93.9 million compared to $59.3 million during fiscal 2018, an increase of $34.6 million, or 58.5%. The increase in net cash used in investing activities was primarily the result of the $30.1 million cash consideration in the Movie Tavern acquisition and an increase in capital expenditures. We did not incur any acquisition-related capital expenditures during fiscal 2018.
Total cash capital expenditures (including normal continuing capital maintenance and renovation projects) totaled $64.1 million during fiscal 2019 compared to $58.7 million during fiscal 2018, an increase of $5.4 million, or 9.2%. We incurred capital expenditures of approximately $3.3 million and $600,000, respectively, during fiscal 2019 and fiscal 2018 related to development costs of one new theatre that opened during fiscal 2019. We did not incur any capital expenditures related to developing new hotels during either period. We incurred approximately $31.5 million and $43.6 million, respectively, of capital expenditures during fiscal 2019 and fiscal 2018 in our theatre division, including the aforementioned costs associated with constructing a new theatre, as well as costs associated with the addition of DreamLounger recliner seating, our Take Five Lounge and Zaffiro’s Express and food and beverage concepts, and UltraScreen DLX and SuperScreen DLX premium large format screens at selected theatres, each as described in the “Current Plans” section of this MD&A. We also incurred capital expenditures in our hotels and resorts division during fiscal 2019 of approximately $31.8 million, consisting primarily of costs associated with the conversion of the InterContinental Milwaukee into the Saint Kate and renovation of the Hilton Madison Monona Terrace, as well as normal maintenance capital projects at our other properties. We incurred approximately $14.9 million of capital expenditures in our hotels and resorts division during fiscal 2018, including costs associated with the renovation of the Hilton Madison and the conversion of the InterContinental Milwaukee into the Saint Kate, as well as other maintenance capital projects at our company-owned hotels and resorts. Our current estimated fiscal 2020 cash capital expenditures, which we anticipate may be in the $65-$85 million range, are described in greater detail in the “Current Plans” section of this MD&A.
| 44 |
Net cash used in financing activities during fiscal 2019 totaled $43.8 million compared to $76.9 million during fiscal 2018. The decrease in net cash used in financing activities of $33.1 million, or 43.0%, was due to a smaller reduction in our long term debt during fiscal 2019 compared to fiscal 2018, which primarily was the result of the use of cash for the Movie Tavern acquisition described above.
We used excess cash during fiscal 2019 and fiscal 2018 to reduce our borrowings under our revolving credit facility. As short-term borrowings became due, we replaced them as necessary with new short-term borrowings. As a result, we added $335.0 million of new short-term borrowings and we made $333.0 million of repayments on short-term borrowings during fiscal 2019 (net increase in borrowings on our credit facility of $2.0 million) compared to $203.0 million of new short-term borrowings and $254.0 million of repayments on short-term borrowings made during fiscal 2018 (net decrease in net borrowings on our credit facility of $51.0 million), accounting for the decrease in net cash used in financing activities during fiscal 2019.
We did not issue any new long-term debt during fiscal 2019 or fiscal 2018. Principal payments on long-term debt were $24.6 million during fiscal 2019 and included the repayment of a $14.6 million mortgage note on a hotel, compared to payments of $12.2 million during fiscal 2018.
Our debt-to-capitalization ratio (excluding our finance lease obligations) was 0.26 at December 26, 2019 compared to 0.33 at December 27, 2018. Based upon our current expectations for our fiscal 2020 capital expenditures and barring any currently unidentified acquisitions, we anticipate that our total long-term debt and debt-to-capitalization ratio will remain at our current relatively low levels during fiscal 2020. Our actual total long-term debt and debt-to-capitalization ratio at the end of fiscal 2020 are dependent upon, among other things, our actual operating results, capital expenditures, potential acquisitions, asset sales proceeds and potential equity transactions during the year.
We repurchased approximately 30,000 shares of our common stock for approximately $1.1 million and 83,000 shares of our common stock for approximately $2.9 million, respectively, during fiscal 2019 and fiscal 2018 in conjunction with the exercise of stock options. As of December 26, 2019, approximately 2.8 million shares of our common stock remained available for repurchase under prior Board of Directors repurchase authorizations. Under these authorizations, we may repurchase shares of our common stock from time to time in the open market, pursuant to privately-negotiated transactions or otherwise, depending upon a number of factors, including prevailing market conditions.
In conjunction with the Movie Tavern acquisition, we issued 2,450,000 shares of our common stock to the seller during the first quarter of fiscal 2019 (157,056 of which have been placed in escrow to secure certain post-closing indemnification obligations of the seller under the asset purchase agreement). This non-cash transaction reduced treasury stock and increased capital in excess of par by the value of the shares at closing of approximately $109.2 million.
We paid regular quarterly dividends totaling $19.3 million and $16.4 million, respectively, during fiscal 2019 and fiscal 2018. The increase in dividend payments was the result of an increased number of outstanding shares and a 6.7% increase in our regular quarterly dividend payment rate initiated in March 2019. During the first quarter of fiscal 2020, we increased our regular quarterly common stock cash dividend by an additional 6.3% to $0.17 per common share.
| 45 |
Contractual Obligations, Commercial Commitments and Off-Balance Sheet Arrangements
The following schedule details our contractual obligations at December 26, 2019 (in thousands):
| Payments Due by Period | ||||||||||||||||||||
| Total | Less Than 1 Year | 1-3 Years | 4-5 Years | After 5 Years | ||||||||||||||||
| Long-term debt | $ | 216,342 | $ | 9,910 | $ | 21,976 | $ | 22,185 | $ | 162,271 | ||||||||||
| Interest on fixed-rate long term debt(1) | 34,775 | 7,357 | 11,854 | 8,165 | 7,399 | |||||||||||||||
| Pension obligations | 43,824 | 1,400 | 3,247 | 3,323 | 35,854 | |||||||||||||||
| Operating lease obligations | 339,814 | 24,369 | 52,043 | 49,342 | 214,060 | |||||||||||||||
| Capital lease obligations | 29,345 | 3,606 | 5,947 | 5,699 | 14,093 | |||||||||||||||
| Construction commitments | 2,243 | 2,243 | - | - | - | |||||||||||||||
| Total contractual obligations | $ | 666,343 | $ | 48,885 | $ | 95,067 | $ | 88,714 | $ | 433,677 | ||||||||||
| (1) | Interest on variable-rate debt obligations is excluded due to significant variations that may occur in each year related to the amount of variable-rate debt and the accompanying interest rate. |
Additional detail describing our long-term debt is included in Note 7 to our consolidated financial statements.
As of December 26, 2019, we had no additional material purchase obligations other than those created in the ordinary course of business related to property and equipment, which generally have terms of less than 90 days. We had long-term obligations related to our employee benefit plans, which are discussed in detail in Note 10 to our consolidated financial statements. We have not included uncertain tax obligations in the table of contractual obligations set forth above due to uncertainty as to the timing of any potential payments.
As of December 26, 2019, we had approximately eleven months remaining on our office lease.
As of December 26, 2019, we had no debt or lease guarantee obligations.
Quantitative and Qualitative Disclosures About Market Risk
We are exposed to market risk related to changes in interest rates, and we manage our exposure to this market risk by monitoring available financing alternatives.
Variable interest rate debt outstanding as of December 26, 2019 totaled $81.0 million, carried an average interest rate of 2.7% and represented 37.4% of our total debt portfolio. After adjusting for outstanding swap agreements described below, variable interest rate debt outstanding as of December 26, 2019 totaled $31.0 million, carried an average interest rate of 2.7% and represented 14.3% of our total debt portfolio. Our earnings are affected by changes in short-term interest rates as a result of our borrowings under our revolving credit facility. Based upon the interest rates in effect on our variable rate debt outstanding as of December 26, 2019, a 100 basis point increase in market interest rates would increase our annual interest expense by approximately $310,000, taking our outstanding swap agreements into consideration.
Fixed interest rate debt totaled $135.7 million as of December 26, 2019, carried an average interest rate of 4.4% and represented 62.6% of our total debt portfolio. After adjusting for outstanding swap agreements described below, fixed interest rate debt totaled $185.7 million as of December 26, 2019, carried an average interest rate of 4.2% and represented 85.7% of our total debt portfolio. Fixed interest rate debt included the following: senior notes bearing interest semiannually at fixed rates ranging from 4.02% to 6.55%, maturing in fiscal 2020 through 2027; and fixed rate mortgages and other debt instruments bearing interest from 3.00% to 5.75%, maturing in fiscal 2025 and 2042. The fair value of our fixed interest rate debt is subject to interest rate risk. Generally, the fair market value of our fixed interest rate debt will increase as interest rates fall and decrease as interest rates rise. As of December 26, 2019, the fair value of our $109.0 million of senior notes was approximately $111.0 million. Based upon the respective rate and prepayment provisions of our remaining fixed interest rate mortgage and unsecured term note at December 26, 2019, the carrying amounts of such debt approximated fair value as of such date.
| 46 |
The variable interest rate debt and fixed interest rate debt outstanding as of December 26, 2019 matures as follows (in thousands):
| F2020 | F2021 | F2022 | F2023 | F2024 | Thereafter | Total | ||||||||||||||||||||||
| Variable interest rate | $ | - | $ | - | $ | - | $ | - | $ | - | $ | 81,000 | $ | 81,000 | ||||||||||||||
| Fixed interest rate | 9,965 | 11,015 | 11,065 | 11,118 | 11,171 | 81,330 | 135,664 | |||||||||||||||||||||
| Debt issuance costs | (55 | ) | (52 | ) | (52 | ) | (52 | ) | (52 | ) | (59 | ) | (322 | ) | ||||||||||||||
| Total debt | $ | 9,910 | $ | 10,963 | $ | 11,013 | $ | 11,066 | $ | 11,119 | $ | 162,271 | $ | 216,342 | ||||||||||||||
We periodically enter into interest rate swap agreements to manage our exposure to interest rate changes. These swaps involve the exchange of fixed and variable interest rate payments. Payments or receipts on the agreements are recorded as adjustments to interest expense. We had one outstanding interest rate swap agreement at December 28, 2017 covering $25.0 million that expired on January 22, 2018. Under this swap agreement, we paid a defined fixed rate while receiving a defined variable rate based on LIBOR, effectively converting $25.0 million of our borrowing under our prior credit agreement to a fixed rate. The swap agreement did not materially impact our fiscal 2018 or fiscal 2017 earnings.
On March 1, 2018, we entered into two interest rate swap agreements covering $50.0 million of floating rate debt which require us to pay interest at a defined fixed rate while receiving interest at a defined variable rate of one-month LIBOR. The first swap has a notional amount of $25.0 million, expires on March 1, 2021 and has a fixed rate of 2.559%. The second swap has a notional amount of $25.0 million, expires on March 1, 2023 and has a fixed rate of 2.687%. The interest rate swaps are considered effective for accounting purposes and qualify as cash flow hedges. These swap agreements did not materially impact our fiscal 2019 earnings and we do not expect the interest rate swaps to materially impact our fiscal 2020 earnings.
Critical Accounting Policies and Estimates
This MD&A is based upon our consolidated financial statements, which have been prepared in accordance with accounting principles generally accepted in the United States. The preparation of our financial statements requires us to make estimates and judgments that affect our reported amounts of assets, liabilities, revenues and expenses, and related disclosure of contingent assets and liabilities.
On an on-going basis, we evaluate our estimates associated with critical accounting policies. We base our estimates on historical experience and on various other assumptions that we believe to be reasonable under the circumstances, the results of which form the basis for making judgments about the carrying values of assets and liabilities that are not readily apparent from other sources. Actual results may differ from these estimates under different assumptions or conditions.
| 47 |
We believe the following critical accounting policies affect the most significant judgments and estimates used in the preparation of our consolidated financial statements.
| i | We review long-lived assets, including property and equipment and operating lease right-of-use assets, for impairment at least annually, or whenever events or changes in circumstances indicate that the carrying amount of any such asset may not be recoverable. Such review is primarily done at the individual theatre or hotel property level, which represents the lowest level for which identifiable cash flows are largely independent of the cash flows of other asset groups. We use judgment to determine whether indicators of impairment exist. The determination of the occurrence of a triggering event is based upon our knowledge of the theatre and hospitality industries, historical experience such as recent operating results, location of the property, market conditions, recent events or transactions, and property-specific information available at the time of the assessment. When a triggering event occurs, judgment is also required in determining the assumptions and estimates to use within the recoverability analysis and when calculating the fair value of the asset if it is determined that the long-lived asset is not recoverable. In performing these analyses, we must make assumptions regarding the estimated future cash flows and other factors that a market participant would make to determine the fair value of the respective assets. The estimate of cash flows is based upon, among other things, certain assumptions about expected future operating performance and anticipated sales prices. Our estimates of cash flows are sensitive to assumed revenue growth rates and may differ from actual cash flows due to factors such as economic conditions, changes to our business model or changes in our operating performance and anticipated sales prices. For long-lived assets other than goodwill, if the sum of the undiscounted estimated cash flows is less than the current carrying value, we then prepare a fair value analysis of the asset. If the carrying value of the asset exceeds the fair value of the asset, we recognize an impairment loss, measured as the amount by which the carrying value exceeds the fair value of the asset. During fiscal 2019, we recorded a before-tax impairment charge of $1.9 million related to a specific theatre location. We did not record any impairment losses during fiscal 2018 or fiscal 2017. |
| i | Periodically, we make acquisitions that may have a material impact on our consolidated financial position. Assets acquired and liabilities assumed in acquisitions are recorded at fair value as of the acquisition date. We use judgment to allocate the purchase price of the businesses acquired to the identifiable tangible and intangible assets acquired and liabilities assumed. In some cases, we may use an independent valuation firm to assist with our valuation, and our assumptions and estimates are based upon comparable market data and information obtained from our management and the management of the acquired businesses using acceptable valuation techniques. Generally, tangible assets acquired include property and equipment, finance lease right-of-use assets and operating lease right-of-use assets. Intangible assets acquired may include tradename intangibles, non-compete agreements or goodwill in a business combination. While we use our best estimates and assumptions to accurately value assets acquired and liabilities assumed at the acquisition date, our estimates are inherently uncertain and subject to refinement. As a result, during the measurement period, which may be up to one year following the acquisition date, we record adjustments to the assets acquired and liabilities assumed with the corresponding offset to goodwill. During fiscal 2019, we acquired the assets of Movie Tavern for a total purchase price of approximately $139.3 million. |
| i | Goodwill is tested for impairment at a reporting unit level, determined to be at an operating segment level. When reviewing goodwill for impairment, we consider the amount of excess fair value over the carrying value of the reporting unit, the period of time since the last quantitative test, and other factors to determine whether or not to first perform a qualitative test. When performing a qualitative test, we assess numerous factors to determine whether it is more likely than not that the fair value of our reporting unit is less than its carrying value. Examples of qualitative factors that we assess include our share price, our financial performance, market and competitive factors in our industry, and other events specific to the reporting unit. If we conclude that it is more likely than not that the fair value of our reporting unit is less than its carrying value, we perform a two-step quantitative test by comparing the carrying value of the reporting unit to the estimated fair value. Primarily all of our goodwill relates to our theatre segment. The fair value of our theatre reporting unit exceeded our carrying value for fiscal 2019, fiscal 2018 and fiscal 2017 by a substantial amount. |
| i | Depreciation expense is based on the estimated useful life of our assets. The life of the assets is based on a number of assumptions, including cost and timing of capital expenditures to maintain and refurbish the asset, as well as specific market and economic conditions. While management believes its estimates are reasonable, a change in the estimated lives could affect depreciation expense and net earnings or the gain or loss on the sale of any of the assets. During fiscal 2018, we changed the estimated lives of certain assets at our InterContinental Milwaukee due to our decision to convert this hotel into a new, art-themed hotel, the Saint Kate. As a result, we reported additional depreciation of approximately $3.7 million during fiscal 2018. |
| 48 |
Accounting Changes
In January 2017, the Financial Accounting Standard Board (FASB) issued Accounting Standard Update (ASU) No. 2017-04, Intangibles - Goodwill and Other (Topic 350) - Simplifying the Test for Goodwill Impairment, which eliminates Step 2 of the goodwill impairment test that had required a hypothetical purchase price allocation. Rather, entities should apply the same impairment assessment to all reporting units and recognize an impairment loss for the amount by which a reporting unit’s carrying amount exceeds its fair value, without exceeding the total amount of goodwill allocated to that reporting unit. Entities will continue to have the option to perform a qualitative assessment for a reporting unit to determine if the quantitative impairment test is necessary. ASU No. 2017-04 is effective for us in fiscal 2020 and must be applied prospectively. We do not believe the new standard will have a material effect on our consolidated financial statements.
In August 2018, the FASB issued ASU No. 2018-14, Compensation—Retirement Benefits—Defined Benefit Plans—General, designed to add, remove and clarify disclosure requirements related to defined benefit pension and other postretirement plans. ASU No. 2018-14 is effective for us in fiscal 2020 and early application is permitted. We do not believe the new standard will have a material effect on our consolidated financial statement disclosures.
In August 2018, the FASB issued ASU No. 2018-13, Fair Value Measurement (Topic 820): Disclosure Framework – Changes to the Disclosure Requirements for Fair Value Measurement. The purpose of ASU No. 2018-13 is to improve the disclosures related to fair value measurements in the financial statements. The improvements include the removal, modification and addition of certain disclosure requirements primarily related to Level 3 fair value measurements. ASU No. 2018-13 is effective for us in fiscal 2020. The amendments in ASU No. 2018-13 should be applied prospectively. We do not expect ASU No. 2018-13 to have a significant impact on our consolidated financial statements.
In December 2019, the FASB issued ASU No. 2019-12, Income Taxes (Topic 740): Simplifying the Accounting for Income Taxes. The amendments in ASU No. 2019-12 are designed to simplify the accounting for income taxes by removing certain exceptions to the general principles in Topic 740. The amendments also improve consistent application of and simplify generally accepted accounting principles for other areas of Topic 740 by clarifying and amending existing guidance. ASU No. 2019-12 is effective for us in fiscal 2021 and early application is permitted. We are currently evaluating the effect the new standard will have on our consolidated financial statements.
On December 28, 2018, we adopted ASU No. 2016-02, Leases (Topic 842), which is intended to improve financial reporting related to leasing transactions. ASC 842 requires a lessee to recognize on the balance sheet assets and liabilities for rights and obligations created by leased assets with lease terms of more than 12 months. The new guidance also requires disclosures to help investors and other financial statement users better understand the amount, timing and uncertainty of cash flows arising from the leases. See Note 8 for further discussion.
| Item 7A. | Quantitative and Qualitative Disclosures About Market Risk. |
The information required by this item is set forth in “Item 7. Management’s Discussion and Analysis of Financial Condition and Results of Operations – Quantitative and Qualitative Disclosures About Market Risk” above.
| 49 |
| Item 8. | Financial Statements and Supplementary Data. |
MANAGEMENT’S REPORT ON INTERNAL CONTROL OVER FINANCIAL REPORTING
Our management is responsible for establishing and maintaining adequate internal control over financial reporting, as such term is defined in Rule 13a-15(f) of the Exchange Act. Under the supervision and with the participation of our management, including our principal executive officer and principal financial officer, we conducted an evaluation of the effectiveness of our internal control over financial reporting based on the framework in Internal Control – Integrated Framework (2013) issued by the Committee of Sponsoring Organizations of the Treadway Commission. Based on our evaluation under the framework in Internal Control – Integrated Framework (2013), our management concluded that our internal control over financial reporting was effective as of December 26, 2019. The Company’s auditors, Deloitte & Touche LLP, have issued an attestation report on our internal control over financial reporting. That attestation report is set forth in this Item 8.
| Gregory S. Marcus President and Chief Executive Officer |
Douglas A. Neis Executive Vice President, Chief Financial Officer and Treasurer |
| 50 |
REPORT OF INDEPENDENT REGISTERED PUBLIC ACCOUNTING FIRM
To the shareholders and the Board of Directors of The Marcus Corporation
Opinion on the Financial Statements
We have audited the accompanying consolidated balance sheets of The Marcus Corporation and subsidiaries (the "Company") as of December 26, 2019 and December 27, 2018, and the related consolidated statements of earnings, comprehensive income, shareholders' equity, and cash flows, for each of the three years in the period ended December 26, 2019, and the related notes (collectively referred to as the "financial statements"). In our opinion, the financial statements present fairly, in all material respects, the financial position of the Company as of December 26, 2019 and December 27, 2018, and the results of its operations and its cash flows for each of the three years in the period ended December 26, 2019, in conformity with accounting principles generally accepted in the United States of America.
We have also audited, in accordance with the standards of the Public Company Accounting Oversight Board (United States) (PCAOB), the Company's internal control over financial reporting as of December 26, 2019, based on criteria established in Internal Control — Integrated Framework (2013) issued by the Committee of Sponsoring Organizations of the Treadway Commission and our report dated February 24, 2020, expressed an unqualified opinion on the Company's internal control over financial reporting.
Change in Accounting Principle
As discussed in Note 8 to the financial statements, the Company changed its method of accounting for leases in the year ended December 26, 2019 due to the adoption of Accounting Standards Update No. 2016-02, Leases (Topic 842), using the modified retrospective method.
Basis for Opinion
These financial statements are the responsibility of the Company's management. Our responsibility is to express an opinion on the Company's financial statements based on our audits. We are a public accounting firm registered with the PCAOB and are required to be independent with respect to the Company in accordance with the U.S. federal securities laws and the applicable rules and regulations of the Securities and Exchange Commission and the PCAOB.
We conducted our audits in accordance with the standards of the PCAOB. Those standards require that we plan and perform the audit to obtain reasonable assurance about whether the financial statements are free of material misstatement, whether due to error or fraud. Our audits included performing procedures to assess the risks of material misstatement of the financial statements, whether due to error or fraud, and performing procedures that respond to those risks. Such procedures included examining, on a test basis, evidence regarding the amounts and disclosures in the financial statements. Our audits also included evaluating the accounting principles used and significant estimates made by management, as well as evaluating the overall presentation of the financial statements. We believe that our audits provide a reasonable basis for our opinion.
Critical Audit Matters
The critical audit matters communicated below are matters arising from the current-period audit of the financial statements that were communicated or required to be communicated to the audit committee and that (1) relate to accounts or disclosures that are material to the financial statements and (2) involved our especially challenging, subjective, or complex judgments. The communication of critical audit matters does not alter in any way our opinion on the financial statements, taken as a whole, and we are not, by communicating the critical audit matters below, providing separate opinions on the critical audit matters or on the accounts or disclosures to which they relate.
| 51 |
| Movie Tavern Acquisition – Valuation of Assets Acquired – Refer to Note 1 and Note 4 to the financial statements |
|
Critical Audit Matter Description
On February 1, 2019, the Company completed the acquisition of 22 dine-in Movie Tavern branded movie theatres (“Movie Tavern”). The purchase price for the Movie Tavern acquisition consisted of $30 million in cash and 2,450,000 shares of the Company’s Common Stock, for an aggregate purchase price of approximately $139 million. The Company accounted for the acquisition under the acquisition method of accounting for business combinations in which the assets acquired and liabilities assumed are recorded at fair value. The assets acquired and liabilities assumed primarily consisted of approximately $95 million of property and equipment, $161 million of operating lease right-of-use assets, $32 million of goodwill, $10 million of a trade name intangible asset, and operating lease obligations of $160 million.
In determining the fair value of the assets acquired and liabilities assumed, management used judgment and estimation to determine certain key valuation and business assumptions, specifically when determining the estimated replacement cost used in valuing the property and equipment acquired, when determining the rent expense-to-revenue ratio and operating cash flow margin assumptions used in valuing the favorable and unfavorable lease amounts acquired, and when selecting the royalty rate assumption used in valuing the trade name intangible asset acquired.
We identified the valuation of the assets acquired as a critical audit matter as auditing the estimated replacement cost used in valuing the property and equipment, the rent expense-to-revenue and operating cash flow margin assumptions used in valuing the favorable and unfavorable lease amounts, and the royalty rate assumption used in valuing the trade name intangible asset involved especially subjective judgment and an increased extent of effort, including the need to involve our fair value specialists.
|
How the Critical Audit Matter Was Addressed in the Audit
Our audit procedures related to the valuation of the property and equipment, favorable and unfavorable lease amounts, and the trade name intangible asset included the following, among others:
| · | We tested the effectiveness of internal controls over the fair value determinations, including the controls related to the review of the replacement cost estimates used in valuing the property and equipment, the rent expense-to-revenue and operating cash flow margin assumptions used in valuing the favorable and unfavorable lease amounts, and the royalty rate assumption used in valuing the trade name intangible asset. |
| · | We read the purchase agreement and evaluated whether information in the purchase price allocation, including the identification of assets acquired and liabilities assumed, was consistent with the terms and conditions in the purchase agreement. |
| · | With the assistance of our fair value specialists, we evaluated the reasonableness of (1) the Company’s valuation methodologies, (2) the estimated replacement costs used in valuing the property and equipment, (3) the rent-to-revenue and operating cash flow margin assumptions used in valuing the favorable and unfavorable lease amounts, and (4) the royalty rate assumption used in valuing the trade name, including testing the source information underlying the determination of these estimates and assumptions, testing the mathematical accuracy of the calculations, and developing a range of independent estimates and assumptions and comparing those to the estimates and assumptions used in management’s determination of fair values. |
| Long-Lived Assets – Assessment of Impairment Indicators – Refer to Note 1 and Note 3 to the financial statements |
Critical Audit Matter Description
As of December 26, 2019, the Company had a significant amount of long-lived assets, including $923 million of net property and equipment, with the majority of this balance consisting of land, buildings and improvements at hotel and theatre properties, and $244 million of operating lease right-of-use assets, primarily related to hotel and theatre properties. The Company assesses long-lived assets for impairment at the individual hotel or theatre properties at least annually, or whenever events or changes in circumstances indicate the carrying amount of any such asset may not be recoverable. |
| 52 |
In assessing long-lived assets at hotel and theatre properties for indicators of potential impairment, Company management considered quantitative and qualitative factors, including evaluating the historical actual operating performance of the properties and assessing the potential impact of recent events and transactions impacting the properties. Company management evaluated these factors to determine whether any events or changes in circumstances indicated that the carrying amount of an asset may not be recoverable. Evaluating whether any of these quantitative and qualitative factors represented an indicator of potential impairment required significant judgment by management.
We identified the assessment of impairment indicators for long-lived assets as a critical audit matter because of the subjectivity used by management when determining whether events or changes in circumstances have occurred indicating that the carrying amounts of long-lived assets may not be recoverable. This required a high degree of auditor judgment when performing audit procedures to evaluate whether management appropriately identified impairment indicators, specifically in the evaluation of the appropriateness and completeness of the quantitative and qualitative factors used in management’s assessment of impairment indicators. |
How the Critical Audit Matter Was Addressed in the Audit
Our audit procedures related to management’s assessment of impairment indicators for long-lived assets included the following, among others:
| · | We tested the effectiveness of internal controls over management’s assessment of impairment indicators for long-lived assets. |
| · | We evaluated management’s assessment of long-lived asset impairment indicators by performing procedures to test the completeness and accuracy of the assessment, including: |
| (1) | We tested the accuracy of historical actual operating results used in management’s assessment for each hotel and theatre property. |
| (2) | We developed an independent estimate of the expected future recovery period for each hotel and theatre property by dividing the net book value of the long-lived assets by the annual operating cash flows of the property for the most recent period. We assessed whether the estimated future recovery period exceeded a reasonable remaining economic life for that applicable type of property. |
| (3) | We held discussions with management and read internal communications to management and the Board of Directors to consider consistency with information included in the assessment and to identify any recent events or transactions that may have a potential impact on the assessment of impairment indicators for the long-lived assets. |
| (4) | We considered whether quantitative and qualitative information in the assessment was consistent with information included in Company press releases, analyst and industry reports relevant to the Company, and evidence obtained in other areas of the audit. |
/s/ Deloitte & Touche LLP
Milwaukee, Wisconsin
February 24, 2020
We have served as the Company's auditor since 2008.
| 53 |
REPORT OF INDEPENDENT REGISTERED PUBLIC ACCOUNTING FIRM
To the shareholders and the Board of Directors of The Marcus Corporation
Opinion on Internal Control over Financial Reporting
We have audited the internal control over financial reporting of The Marcus Corporation and subsidiaries (the “Company”) as of December 26, 2019, based on criteria established in Internal Control — Integrated Framework (2013) issued by the Committee of Sponsoring Organizations of the Treadway Commission (COSO). In our opinion, the Company maintained, in all material respects, effective internal control over financial reporting as of December 26, 2019, based on criteria established in Internal Control — Integrated Framework (2013) issued by COSO.
We have also audited, in accordance with the standards of the Public Company Accounting Oversight Board (United States) (PCAOB), the consolidated financial statements as of and for the year ended December 26, 2019, of the Company and our report dated February 24, 2020, expressed an unqualified opinion on those financial statements and included an explanatory paragraph regarding the Company’s adoption of a new accounting standard.
Basis for Opinion
The Company’s management is responsible for maintaining effective internal control over financial reporting and for its assessment of the effectiveness of internal control over financial reporting, included in the accompanying Management's Report on Internal Control Over Financial Reporting. Our responsibility is to express an opinion on the Company’s internal control over financial reporting based on our audit. We are a public accounting firm registered with the PCAOB and are required to be independent with respect to the Company in accordance with the U.S. federal securities laws and the applicable rules and regulations of the Securities and Exchange Commission and the PCAOB.
We conducted our audit in accordance with the standards of the PCAOB. Those standards require that we plan and perform the audit to obtain reasonable assurance about whether effective internal control over financial reporting was maintained in all material respects. Our audit included obtaining an understanding of internal control over financial reporting, assessing the risk that a material weakness exists, testing and evaluating the design and operating effectiveness of internal control based on the assessed risk, and performing such other procedures as we considered necessary in the circumstances. We believe that our audit provides a reasonable basis for our opinion.
Definition and Limitations of Internal Control over Financial Reporting
A company’s internal control over financial reporting is a process designed to provide reasonable assurance regarding the reliability of financial reporting and the preparation of financial statements for external purposes in accordance with generally accepted accounting principles. A company’s internal control over financial reporting includes those policies and procedures that (1) pertain to the maintenance of records that, in reasonable detail, accurately and fairly reflect the transactions and dispositions of the assets of the company; (2) provide reasonable assurance that transactions are recorded as necessary to permit preparation of financial statements in accordance with generally accepted accounting principles, and that receipts and expenditures of the company are being made only in accordance with authorizations of management and directors of the company; and (3) provide reasonable assurance regarding prevention or timely detection of unauthorized acquisition, use, or disposition of the company’s assets that could have a material effect on the financial statements.
Because of its inherent limitations, internal control over financial reporting may not prevent or detect misstatements. Also, projections of any evaluation of effectiveness to future periods are subject to the risk that controls may become inadequate because of changes in conditions, or that the degree of compliance with the policies or procedures may deteriorate.
/s/ Deloitte & Touche LLP
Milwaukee, Wisconsin
February 24, 2020
| 54 |
THE MARCUS CORPORATION
CONSOLIDATED BALANCE SHEETS
(in thousands, except share and per share data)
| December 26, 2019 | December 27, 2018 | |||||||
| Assets | ||||||||
| Current assets: | ||||||||
| Cash and cash equivalents (Note 1) | $ | 20,862 | $ | 17,114 | ||||
| Restricted cash (Note 1) | 4,756 | 4,813 | ||||||
| Accounts receivable, net of reserves (Note 6) | 29,465 | 25,684 | ||||||
| Refundable income taxes | 5,916 | 5,983 | ||||||
| Other current assets (Note 1) | 18,265 | 15,355 | ||||||
| Total current assets | 79,264 | 68,949 | ||||||
| Property and equipment, NET (Note 6) | 923,254 | 840,043 | ||||||
| OPERATING LEASE RIGHT-OF-USE ASSETS (Note 8) | 243,855 | – | ||||||
| Other assets: | ||||||||
| Investments in joint ventures (Note 13) | 3,595 | 4,069 | ||||||
| Goodwill (Note 1) | 75,282 | 43,170 | ||||||
| Other (Note 6) | 33,936 | 33,100 | ||||||
| Total other assets | 112,813 | 80,339 | ||||||
| Total assets | $ | 1,359,186 | $ | 989,331 | ||||
| Liabilities and shareholders’ equity | ||||||||
| Current liabilities: | ||||||||
| Accounts payable | $ | 49,370 | $ | 37,452 | ||||
| Taxes other than income taxes | 20,613 | 18,743 | ||||||
| Accrued compensation | 18,055 | 17,547 | ||||||
| Other accrued liabilities (Note 1) | 61,134 | 59,645 | ||||||
| Current portion of finance lease obligations (Note 8) | 2,571 | 5,912 | ||||||
| Current portion of operating lease obligations (Note 8) | 13,335 | – | ||||||
| Current maturities of long-term debt (Note 7) | 9,910 | 9,957 | ||||||
| Total current liabilities | 174,988 | 149,256 | ||||||
| Finance LEASE OBLIGATIONS (Note 8) | 20,802 | 22,208 | ||||||
| operating lease obligations (Note 8) | 232,111 | – | ||||||
| Long-term debt (Note 7) | 206,432 | 228,863 | ||||||
| Deferred income taxes (Note 11) | 48,262 | 41,977 | ||||||
| Deferred compensation and other (Note 10) | 55,133 | 56,908 | ||||||
| commitments AND license rights (Note 12) | ||||||||
| equity (Note 9): | ||||||||
| Shareholders’ equity attributable to The Marcus Corporation | ||||||||
| Preferred Stock, $1 par; authorized 1,000,000 shares; none issued | – | – | ||||||
| Common Stock: | ||||||||
| Common Stock, $1 par; authorized 50,000,000 shares; issued 23,253,744 at December 26, 2019 and 22,843,096 shares at December 27, 2018 | 23,254 | 22,843 | ||||||
| Class B Common Stock, $1 par; authorized 33,000,000 shares; issued and outstanding 7,935,769 at December 26, 2019 and 8,346,417 at December 27, 2018 | 7,936 | 8,347 | ||||||
| Capital in excess of par | 145,549 | 63,830 | ||||||
| Retained earnings | 461,884 | 439,178 | ||||||
| Accumulated other comprehensive loss | (12,648 | ) | (6,758 | ) | ||||
| 625,975 | 527,440 | |||||||
| Less cost of Common Stock in treasury (242,853 shares at December 26, 2019 and 2,839,079 shares at December 27, 2018) | (4,540 | ) | (37,431 | ) | ||||
| Total shareholders’ equity attributable to The Marcus Corporation | 621,435 | 490,009 | ||||||
| Noncontrolling interests | 23 | 110 | ||||||
| Total equity | 621,458 | 490,119 | ||||||
| Total liabilities and shareholders’ equity | $ | 1,359,186 | $ | 989,331 | ||||
See accompanying notes.
| 55 |
The Marcus Corporation
Consolidated Statements of EARNINGS
(in thousands, except per share data)
| Year Ended | ||||||||||||
| December 26, | December 27, | December 28, | ||||||||||
| 2019 | 2018 | 2017 | ||||||||||
| Revenues: | ||||||||||||
| Theatre admissions | $ | 284,141 | $ | 246,385 | $ | 227,091 | ||||||
| Rooms | 105,857 | 108,786 | 106,876 | |||||||||
| Theatre concessions | 231,237 | 166,564 | 148,989 | |||||||||
| Food and beverage | 74,665 | 72,771 | 70,627 | |||||||||
| Other revenues | 87,805 | 78,329 | 69,131 | |||||||||
| 783,705 | 672,835 | 622,714 | ||||||||||
| Cost reimbursements | 37,158 | 34,285 | 30,838 | |||||||||
| Total revenues | 820,863 | 707,120 | 653,552 | |||||||||
| Costs and expenses: | ||||||||||||
| Theatre operations | 267,741 | 217,851 | 197,270 | |||||||||
| Rooms | 40,381 | 41,181 | 40,286 | |||||||||
| Theatre concessions | 85,289 | 47,522 | 43,634 | |||||||||
| Food and beverage | 60,812 | 58,662 | 59,375 | |||||||||
| Advertising and marketing | 24,583 | 23,775 | 23,960 | |||||||||
| Administrative | 73,522 | 72,116 | 66,954 | |||||||||
| Depreciation and amortization | 72,277 | 61,342 | 51,719 | |||||||||
| Rent (Note 8) | 26,099 | 11,267 | 11,869 | |||||||||
| Property taxes | 21,871 | 19,396 | 18,815 | |||||||||
| Other operating expenses | 41,065 | 36,534 | 31,525 | |||||||||
| Impairment charge (Note 3) | 1,874 | – | – | |||||||||
| Reimbursed costs | 37,158 | 34,285 | 30,838 | |||||||||
| Total costs and expenses | 752,672 | 623,931 | 576,245 | |||||||||
| OPERATING INCOME | 68,191 | 83,189 | 77,307 | |||||||||
| OTHER INCOME (EXPENSE): | ||||||||||||
| Investment income | 1,379 | 208 | 588 | |||||||||
| Interest expense | (11,791 | ) | (13,079 | ) | (12,100 | ) | ||||||
| Other expense | (1,921 | ) | (1,985 | ) | (1,712 | ) | ||||||
| Gain (loss) on disposition of property, equipment and other assets | (1,149 | ) | (1,342 | ) | 3,981 | |||||||
| Equity earnings (losses) from unconsolidated joint ventures, net (Note 13) | (274 | ) | (399 | ) | 46 | |||||||
| (13,756 | ) | (16,597 | ) | (9,197 | ) | |||||||
| Earnings before income taxes | 54,435 | 66,592 | 68,110 | |||||||||
| Income taxes (Note 11) | 12,320 | 13,127 | 3,625 | |||||||||
| NET EARNINGS | 42,115 | 53,465 | 64,485 | |||||||||
| NET EARNINGS (LOSS) ATTRIBUTABLE TO NONCONTROLLING INTERESTS | 98 | 74 | (511 | ) | ||||||||
| NET EARNINGS ATTRIBUTABLE TO THE MARCUS CORPORATION | $ | 42,017 | $ | 53,391 | $ | 64,996 | ||||||
| net earnings per share – BASIC: | ||||||||||||
| Common Stock | $ | 1.44 | $ | 1.96 | $ | 2.42 | ||||||
| Class B Common Stock | 1.25 | 1.75 | 2.17 | |||||||||
| net earnings per share – DILUTED: | ||||||||||||
| Common Stock | $ | 1.35 | $ | 1.86 | $ | 2.29 | ||||||
| Class B Common Stock | 1.24 | 1.72 | 2.13 | |||||||||
See accompanying notes.
| 56 |
The Marcus Corporation
Consolidated Statements of COMPREHENSIVE INCOME
(in thousands)
Year Ended | ||||||||||||
| December 26, | December 27, | December 28, | ||||||||||
| 2019 | 2018 | 2017 | ||||||||||
| NET EARNINGS | $ | 42,115 | $ | 53,465 | $ | 64,485 | ||||||
| OTHER COMPREHENSIVE INCOME (LOSS): | ||||||||||||
| Change in unrealized gain on available for sale investments, net of tax benefit of $0, $0 and $9, respectively | – | – | (14 | ) | ||||||||
| Pension gain (loss) arising during period, net of tax effect (benefit) of $(1,833), $708 and $(1,685), respectively | (5,484 | ) | 1,925 | (2,559 | ) | |||||||
| Amortization of the net actuarial loss and prior service credit related to the pension, net of tax effect of $109, $167 and $142, respectively | 327 | 454 | 214 | |||||||||
| Fair market value adjustment of interest rate swap, net of tax benefit of $300, $115 and $0, respectively (Note 7) | (853 | ) | (313 | ) | – | |||||||
| Reclassification adjustment on interest rate swap included in interest expense, net of tax effect of $44, $59 and $0, respectively (Note 7) | 120 | 164 | – | |||||||||
| Other comprehensive income (loss) | (5,890 | ) | 2,230 | (2,359 | ) | |||||||
| COMPREHENSIVE INCOME | 36,225 | 55,695 | 62,126 | |||||||||
| COMPREHENSIVE INCOME (LOSS) ATTRIBUTABLE TO NONCONTROLLING INTERESTS | 98 | 74 | (511 | ) | ||||||||
| COMPREHENSIVE INCOME ATTRIBUTABLE TO THE MARCUS CORPORATION | $ | 36,127 | $ | 55,621 | $ | 62,637 | ||||||
See accompanying notes.
| 57 |
THE MARCUS CORPORATION
CONSOLIDATED STATEMENTS OF SHAREHOLDERS’ EQUITY
(in thousands, except per share data)
| Common Stock | Class
B Common Stock | Capital of Par | Retained Earnings | Accumulated Other Comprehensive Income (Loss) | Treasury Stock | Shareholders’ Equity Attributable to The Marcus Corporation | Non- controlling Interests | Total Equity | ||||||||||||||||||||||||||||
| BALANCES AT DECEMBER 29, 2016 | $ | 22,490 | $ | 8,700 | $ | 58,584 | $ | 351,220 | $ | (5,066 | ) | $ | (45,816 | ) | $ | 390,112 | $ | 1,535 | $ | 391,647 | ||||||||||||||||
| Cash dividends: | ||||||||||||||||||||||||||||||||||||
| $.45 per share Class B Common Stock | – | – | – | (3,929 | ) | – | – | (3,929 | ) | – | (3,929 | ) | ||||||||||||||||||||||||
| $.50 per share Common Stock | – | – | – | (9,575 | ) | – | – | (9,575 | ) | – | (9,575 | ) | ||||||||||||||||||||||||
| Exercise of stock options | – | – | 105 | – | – | 2,166 | 2,271 | – | 2,271 | |||||||||||||||||||||||||||
| Purchase of treasury stock | – | – | – | – | – | (850 | ) | (850 | ) | – | (850 | ) | ||||||||||||||||||||||||
| Savings and profit-sharing contribution | – | – | 600 | – | – | 424 | 1,024 | – | 1,024 | |||||||||||||||||||||||||||
| Reissuance of treasury stock | – | – | 253 | – | – | 176 | 429 | – | 429 | |||||||||||||||||||||||||||
| Issuance of non-vested stock | – | – | (501 | ) | – | – | 501 | – | – | – | ||||||||||||||||||||||||||
| Share-based compensation | – | – | 2,411 | – | – | – | 2,411 | – | 2,411 | |||||||||||||||||||||||||||
| Purchase of noncontrolling interest | – | – | – | 494 | – | – | 494 | (904 | ) | (410 | ) | |||||||||||||||||||||||||
| Conversions of Class B Common Stock | 166 | (166 | ) | – | – | – | – | – | – | – | ||||||||||||||||||||||||||
| Distributions to noncontrolling interest | – | – | – | – | – | – | – | (20 | ) | (20 | ) | |||||||||||||||||||||||||
| Comprehensive income (loss) | – | – | – | 64,996 | (2,359 | ) | – | 62,637 | (511 | ) | 62,126 | |||||||||||||||||||||||||
| BALANCES AT DECEMBER 28, 2017 | 22,656 | 8,534 | 61,452 | 403,206 | (7,425 | ) | (43,399 | ) | 445,024 | 100 | 445,124 | |||||||||||||||||||||||||
| Amount reclassified to retained earnings on December 29, 2017 in connection with the adoption of ASU No. 2016-01 | - | - | - | (11 | ) | 11 | - | - | - | - | ||||||||||||||||||||||||||
| Amount reclassified to retained earnings on December 29, 2017 in connection with the adoption of ASU No. 2018-02 | - | - | - | 1,574 | (1,574 | ) | - | - | - | - | ||||||||||||||||||||||||||
| Amount reclassified to retained earnings on December 29, 2017 in connection with the adoption of ASU No. 2014-09 | - | - | - | (2,568 | ) | - | - | (2,568 | ) | - | (2,568 | ) | ||||||||||||||||||||||||
| BALANCES AT DECEMBER 29, 2017 | 22,656 | 8,534 | 61,452 | 402,201 | (8,988 | ) | (43,399 | ) | 442,456 | 100 | 442,556 | |||||||||||||||||||||||||
| Cash dividends: | ||||||||||||||||||||||||||||||||||||
| $.55 per share Class B Common Stock | - | - | - | (4,603 | ) | - | - | (4,603 | ) | - | (4,603 | ) | ||||||||||||||||||||||||
| $.60 per share Common Stock | - | - | - | (11,811 | ) | - | - | (11,811 | ) | - | (11,811 | ) | ||||||||||||||||||||||||
| Exercise of stock options | - | - | (736 | ) | - | - | 7,784 | 7,048 | - | 7,048 | ||||||||||||||||||||||||||
| Purchase of treasury stock | - | - | - | - | - | (2,898 | ) | (2,898 | ) | - | (2,898 | ) | ||||||||||||||||||||||||
| Savings and profit-sharing contribution | - | - | 651 | - | - | 479 | 1,130 | - | 1,130 | |||||||||||||||||||||||||||
| Reissuance of treasury stock | - | - | 231 | - | - | 144 | 375 | - | 375 | |||||||||||||||||||||||||||
| Issuance of non-vested stock | - | - | (459 | ) | - | - | 459 | - | - | - | ||||||||||||||||||||||||||
| Share-based compensation | - | - | 2,691 | - | - | - | 2,691 | - | 2,691 | |||||||||||||||||||||||||||
| Conversions of Class B Common Stock | 187 | (187 | ) | - | - | - | - | - | - | - | ||||||||||||||||||||||||||
| Distributions to noncontrolling interest | - | - | - | - | - | - | - | (64 | ) | (64 | ) | |||||||||||||||||||||||||
| Comprehensive income | - | - | - | 53,391 | 2,230 | - | 55,621 | 74 | 55,695 | |||||||||||||||||||||||||||
| BALANCES AT DECEMBER 27, 2018 | 22,843 | 8,347 | 63,830 | 439,178 | (6,758 | ) | (37,431 | ) | 490,009 | 110 | 490,119 | |||||||||||||||||||||||||
| Cash dividends: | ||||||||||||||||||||||||||||||||||||
| $.58 per share Class B Common Stock | - | - | - | (4,648 | ) | - | - | (4,648 | ) | - | (4,648 | ) | ||||||||||||||||||||||||
| $.64 per share Common Stock | - | - | - | (14,663 | ) | - | - | (14,663 | ) | - | (14,663 | ) | ||||||||||||||||||||||||
| Exercise of stock options | - | - | (205 | ) | - | - | 1,725 | 1,520 | - | 1,520 | ||||||||||||||||||||||||||
| Purchase of treasury stock | - | - | - | - | - | (1,119 | ) | (1,119 | ) | - | (1,119 | ) | ||||||||||||||||||||||||
| Savings and profit-sharing contribution | - | - | 810 | - | - | 371 | 1,181 | - | 1,181 | |||||||||||||||||||||||||||
| Reissuance of treasury stock | - | - | 267 | - | - | 150 | 417 | - | 417 | |||||||||||||||||||||||||||
| Issuance of non-vested stock | - | - | (527 | ) | - | - | 527 | - | - | - | ||||||||||||||||||||||||||
| Share-based compensation | - | - | 3,523 | - | - | - | 3,523 | - | 3,523 | |||||||||||||||||||||||||||
| Reissuance of treasury stock - acquisition | - | - | 77,960 | - | - | 31,237 | 109,197 | - | 109,197 | |||||||||||||||||||||||||||
| Other | - | - | (109 | ) | - | - | - | (109 | ) | - | (109 | ) | ||||||||||||||||||||||||
| Conversions of Class B Common Stock | 411 | (411 | ) | - | - | - | - | - | - | - | ||||||||||||||||||||||||||
| Distributions to noncontrolling interest | - | - | - | - | - | - | - | (185 | ) | (185 | ) | |||||||||||||||||||||||||
| Comprehensive income (loss) | - | - | - | 42,017 | (5,890 | ) | - | 36,127 | 98 | 36,225 | ||||||||||||||||||||||||||
| BALANCES AT DECEMBER 26, 2019 | $ | 23,254 | $ | 7,936 | $ | 145,549 | $ | 461,884 | $ | (12,648 | ) | $ | (4,540 | ) | $ | 621,435 | $ | 23 | $ | 621,458 | ||||||||||||||||
See accompanying notes.
| 58 |
The Marcus Corporation
Consolidated Statements of Cash Flows
(in thousands)
| Year Ended | ||||||||||||
| December 26, | December 27, | December 28, | ||||||||||
| 2019 | 2018 | 2017 | ||||||||||
| Operating activities | ||||||||||||
| Net earnings | $ | 42,115 | $ | 53,465 | $ | 64,485 | ||||||
| Adjustments to reconcile net earnings to net cash provided by operating activities: | ||||||||||||
| Losses (earnings) on investments in joint ventures | 274 | 399 | (46 | ) | ||||||||
| Distributions from joint ventures | 200 | 65 | 377 | |||||||||
| Loss (gain) on disposition of property, equipment and other assets | 1,149 | 1,342 | (3,981 | ) | ||||||||
| Impairment change | 1,874 | – | – | |||||||||
| Amortization of favorable lease right | – | 334 | 334 | |||||||||
| Depreciation and amortization | 72,277 | 61,342 | 51,719 | |||||||||
| Amortization of debt issuance costs | 285 | 287 | 308 | |||||||||
| Share-based compensation | 3,523 | 2,691 | 2,411 | |||||||||
| Deferred income taxes | 9,111 | 3,247 | (6,438 | ) | ||||||||
| Deferred compensation and other | 1,011 | 3,339 | 911 | |||||||||
| Contribution of the Company’s stock to savings and profit-sharing plan | 1,181 | 1,130 | 1,024 | |||||||||
| Changes in operating assets and liabilities: | ||||||||||||
| Accounts receivable | (3,781 | ) | 1,546 | (8,852 | ) | |||||||
| Other assets | 1,102 | (1,946 | ) | (2,268 | ) | |||||||
| Operating leases | (3,355 | ) | – | – | ||||||||
| Accounts payable | 9,733 | (4,232 | ) | 15,015 | ||||||||
| Income taxes | 67 | 10,297 | (13,663 | ) | ||||||||
| Taxes other than income taxes | 1,664 | (895 | ) | 2,377 | ||||||||
| Accrued compensation | 508 | 1,920 | (1,380 | ) | ||||||||
| Other accrued liabilities | 2,541 | 3,058 | 6,703 | |||||||||
| Total adjustments | 99,364 | 83,924 | 44,551 | |||||||||
| Net cash provided by operating activities | 141,479 | 137,389 | 109,036 | |||||||||
| Investing activities | ||||||||||||
| Capital expenditures | (64,086 | ) | (58,660 | ) | (114,804 | ) | ||||||
| Purchase of theatres, net of cash acquired and working capital assumed | (30,081 | ) | – | – | ||||||||
| Proceeds from disposals of property, equipment and other assets | 22 | 116 | 4,524 | |||||||||
| Other investing activities | 199 | (429 | ) | 911 | ||||||||
| Capital contribution in joint venture | – | (294 | ) | (111 | ) | |||||||
| Contribution received from local government | – | – | 1,545 | |||||||||
| Proceeds from sale of interests in joint ventures | – | – | 6,729 | |||||||||
| Net cash used in investing activities | (93,946 | ) | (59,267 | ) | (101,206 | ) | ||||||
| Financing activities | ||||||||||||
| Debt transactions: | ||||||||||||
| Proceeds from borrowings on revolving credit facility | 335,000 | 203,000 | 322,000 | |||||||||
| Repayment of borrowings on revolving credit facility | (333,000 | ) | (254,000 | ) | (332,000 | ) | ||||||
| Proceeds from issuance of long-term debt | – | – | 65,000 | |||||||||
| Principal payments on long-term debt | (24,620 | ) | (12,153 | ) | (36,300 | ) | ||||||
| Principal payments on finance lease obligations | (2,544 | ) | (1,836 | ) | (1,986 | ) | ||||||
| Debt issuance costs | – | – | (418 | ) | ||||||||
| Equity transactions: | ||||||||||||
| Treasury stock transactions, except for stock options | (702 | ) | (2,523 | ) | (421 | ) | ||||||
| Exercise of stock options | 1,520 | 7,048 | 2,271 | |||||||||
| Dividends paid | (19,311 | ) | (16,414 | ) | (13,504 | ) | ||||||
| Distributions to noncontrolling interest | (185 | ) | (64 | ) | (20 | ) | ||||||
| Purchase of noncontrolling interest | – | – | (410 | ) | ||||||||
| Net cash provided by (used in) financing activities | (43,842 | ) | (76,942 | ) | 4,212 | |||||||
| Net increase in cash, cash equivalents and restricted cash | 3,691 | 1,180 | 12,042 | |||||||||
| Cash, cash equivalents and restricted cash at beginning of year | 21,927 | 20,747 | 8,705 | |||||||||
| Cash, cash equivalents and restricted cash at end of year | $ | 25,618 | $ | 21,927 | $ | 20,747 | ||||||
| Supplemental Information: | ||||||||||||
| Change in accounts payable for additions to property and equipment | $ | 2,185 | $ | (9,857 | ) | $ | 5,320 | |||||
See accompanying notes.
| 59 |
The Marcus Corporation
Notes to Consolidated Financial Statements
1. Description of Business and Summary of Significant Accounting Policies
Description of Business - The Marcus Corporation and its subsidiaries (the “Company”) operate principally in two business segments:
Theatres: Operates multiscreen motion picture theatres in Wisconsin, Illinois, Iowa, Minnesota, Missouri, Nebraska, North Dakota, Ohio, Arkansas, Colorado, Georgia, Kentucky, Louisiana, New York, Pennsylvania, Texas and Virginia, a family entertainment center in Wisconsin and a retail center in Missouri.
Hotels and Resorts: Owns and operates full service hotels and resorts in Wisconsin, Illinois, Oklahoma and Nebraska and manages full service hotels, resorts and other properties in Wisconsin, Illinois, Minnesota, Texas, Nevada, California and Nebraska.
Principles of Consolidation - The consolidated financial statements include the accounts of The Marcus Corporation and all of its subsidiaries, including a 50% owned joint venture entity in which the Company has a controlling financial interest. The Company has ownership interests greater than 50% in one joint venture that is considered a Variable Interest Entity (VIE) that is also included in the accounts of the Company. The Company is the primary beneficiary of the VIE and the Company’s interest is considered a majority voting interest. The equity interest of outside owners in consolidated entities is recorded as noncontrolling interests in the consolidated balance sheets, and their share of earnings is recorded as net earnings (losses) attributable to noncontrolling interests in the consolidated statements of earnings in accordance with the partnership agreements. In fiscal 2017, the Company purchased the noncontrolling interest of a joint venture from its former partner.
Investments in affiliates which are 50% or less owned by the Company for which the Company exercises significant influence but does not have control are accounted for on the equity method. The Company has investments in equity investments without readily determinable fair values, which represents investments in entities where the Company does not have the ability to significantly influence the operations of the entities.
All intercompany accounts and transactions have been eliminated in consolidation.
Use of Estimates - The preparation of financial statements in conformity with U.S. generally accepted accounting principles requires management to make estimates and assumptions that affect the amounts reported in the financial statements and accompanying notes. Actual results could differ from those estimates.
| 60 |
The Marcus Corporation
Notes to Consolidated Financial Statements
1. Description of Business and Summary of Significant Accounting Policies (continued)
Change in Accounting Policies – The Company adopted Financial Accounting Standards Board (FASB) Accounting Standards Update (ASU) No. 2016-02, Leases, (Topic 842), on the first day of fiscal 2019. These lease policy updates were applied prospectively in the Company’s financial statements from December 28, 2018 forward. Reported financial information for the historical comparable periods was not revised and continues to be reported under the accounting standards in effect during the historical periods. See Note 8 for further discussion.
The Company adopted ASU No. 2014-09, Revenue from Contracts with Customers, on the first day of fiscal 2018. These revenue recognition policy updates were applied prospectively in the Company’s financial statements from December 29, 2017 forward. Reported financial information for the historical comparable period was not revised and continues to be reported under the accounting standards in effect during the historical period. See Note 2 for further discussion.
Cash Equivalents - The Company considers all highly liquid investments with maturities of three months or less when purchased to be cash equivalents. Cash equivalents are carried at cost, which approximates fair value.
Restricted Cash - Restricted cash consists of bank accounts related to capital expenditure reserve funds, sinking funds, operating reserves and replacement reserves and may include amounts held by a qualified intermediary agent to be used for tax-deferred, like-kind exchange transactions.
Fair Value Measurements - Certain financial assets and liabilities are recorded at fair value in the financial statements. Some are measured on a recurring basis while others are measured on a non-recurring basis. Financial assets and liabilities measured on a recurring basis are those that are adjusted to fair value each time a financial statement is prepared. Financial assets and liabilities measured on a non-recurring basis are those that are adjusted to fair value when a significant event occurs. A fair value measurement assumes that a transaction to sell an asset or transfer a liability occurs in the principal market for the asset or liability or, in the absence of a principal market, the most advantageous market for the asset or liability.
The Company’s assets and liabilities measured at fair value are classified in one of the following categories:
Level 1 - Assets or liabilities for which fair value is based on quoted prices in active markets for identical instruments as of the reporting date. At December 26, 2019 and December 27, 2018, respectively, the Company’s $5,825,000 and $5,302,000 of debt and equity securities classified as trading were valued using Level 1 pricing inputs and were included in other current assets.
Level 2 - Assets or liabilities for which fair value is based on valuation models for which pricing inputs were either directly or indirectly observable as of the reporting date. At December 26, 2019 and December 27, 2018, respectively, the $1,194,000 and $205,000 liability related to the Company’s interest rate hedge contracts were valued using Level 2 pricing inputs.
Level 3 - Assets or liabilities for which fair value is based on valuation models with significant unobservable pricing inputs and which result in the use of management estimates. At December 26, 2019 and December 27, 2018, none of the Company’s recorded assets or liabilities that are measured on a recurring basis at fair market value were valued using Level 3 pricing inputs. Assets and liabilities that are measured on a non-recurring basis are discussed in Note 3 and Note 4.
| 61 |
The Marcus Corporation
Notes to Consolidated Financial Statements
1. Description of Business and Summary of Significant Accounting Policies (continued)
The carrying value of the Company’s financial instruments (including cash and cash equivalents, restricted cash, accounts receivable and accounts payable) approximates fair value. The fair value of the Company’s $109,000,000 of senior notes, valued using Level 2 pricing inputs, is approximately $110,985,000 at December 26, 2019, determined based upon discounted cash flows using current market interest rates for financial instruments with a similar average remaining life. The carrying amounts of the Company’s remaining long-term debt approximate their fair values, determined using current rates for similar instruments, or Level 2 pricing inputs.
Accounts Receivable - The Company evaluates the collectibility of its accounts receivable based on a number of factors. For larger accounts, an allowance for doubtful accounts is recorded based on the applicable parties’ ability and likelihood to pay based on management’s review of the facts. For all other accounts, the Company recognizes an allowance based on length of time the receivable is past due based on historical experience and industry practice.
Inventory - Inventories, consisting of food and beverage and concession items, are stated at the lower of cost or market. Cost has been determined using the first-in, first-out method. Inventories of $5,673,000 and $4,138,000 as of December 26, 2019 and December 27, 2018, respectively, were included in other current assets.
Property and Equipment - The Company records property and equipment at cost. Major renewals and improvements are capitalized, while maintenance and repairs that do not improve or extend the lives of the respective assets are expensed currently. Included in property and equipment are assets related to finance leases. These assets are depreciated over the shorter of the estimated useful lives or related lease terms.
Depreciation and amortization of property and equipment are provided using the straight-line method over the shorter of the following estimated useful lives or any related lease terms:
| Years | ||||
| Land improvements | 10 - 20 | |||
| Buildings and improvements | 12 - 39 | |||
| Leasehold improvements | 3 - 40 | |||
| Furniture, fixtures and equipment | 3 - 20 | |||
| Finance lease right-of-use assets | 4 - 15 |
Depreciation expense totaled $72,244,000, $61,470,000 and $51,542,000 for fiscal 2019, fiscal 2018 and fiscal 2017, respectively.
Long-Lived Assets - The Company periodically considers whether indicators of impairment of long-lived assets held for use are present. This includes quantitative and qualitative factors, including evaluating the historical actual operating performance of the long-lived assets and assessing the potential impact of recent events and transactions impacting the long-lived assets. If such indicators are present, the Company determines if the long-lived assets are recoverable by assessing whether the sum of the estimated undiscounted future cash flows attributable to such assets is less than their carrying amounts. If the long-lived assets are not recoverable, the Company recognizes any impairment losses based on the excess of the carrying amount of the assets over their fair value. For the purpose of determining fair value, defined as the amount at which an asset or group of assets could be bought or sold in a current transaction between willing parties, the Company utilizes currently available market valuations of similar assets in its respective industries, often expressed as a given multiple of operating cash flow. The Company evaluated the value of its property and equipment during fiscal 2019, fiscal 2018 and fiscal 2017 and the value of its operating lease right-of-use assets during fiscal 2019 and determined that there was no impact on the Company’s results of operations, other than the impairment charge discussed in Note 3.
| 62 |
The Marcus Corporation
Notes to Consolidated Financial Statements
1. Description of Business and Summary of Significant Accounting Policies (continued)
Acquisition - The Company recognizes identifiable assets acquired, liabilities assumed and noncontrolling interests assumed in an acquisition at their fair values at the acquisition date based upon all information available to it, including third-party appraisals. Acquisition-related costs, such as due diligence and legal fees, are expensed as incurred. The excess of the acquisition cost over the fair value of the identifiable net assets is reported as goodwill.
Goodwill - The Company reviews goodwill for impairment annually or more frequently if certain indicators arise. The Company performs its annual impairment test on the last day of its fiscal year. The Company believes performing the test at the end of the fiscal year is preferable as the test is predicated on qualitative factors which are developed and finalized near fiscal year-end. Goodwill is tested for impairment at a reporting unit level, determined to be at an operating segment level. When reviewing goodwill for impairment, the Company considers the amount of excess fair value over the carrying value of the reporting unit, the period of time since its last quantitative test, and other factors to determine whether or not to first perform a qualitative test. When performing a qualitative test, the Company assesses numerous factors to determine whether it is more likely than not that the fair value of its reporting unit is less than its carrying value. Examples of qualitative factors that the Company assesses include its share price, its financial performance, market and competitive factors in its industry, and other events specific to the reporting unit. If the Company concludes that it is more likely than not that the fair value of its reporting unit is less than its carrying value, the Company performs a two-step quantitative impairment test by comparing the carrying value of the reporting unit to the estimated fair value. No impairment was identified as of December 26, 2019 or December 27, 2018. The Company has never recorded a goodwill impairment loss.
A summary of the Company’s goodwill activity is as follows:
| December 26, 2019 | December 27, 2018 | December 28, 2017 | ||||||||||
| (in thousands) | ||||||||||||
| Balance at beginning of period | $ | 43,170 | $ | 43,492 | $ | 43,735 | ||||||
| Acquisition | 32,205 | – | – | |||||||||
| Sale | – | – | (105 | ) | ||||||||
| Deferred tax adjustment | (93 | ) | (322 | ) | (138 | ) | ||||||
| Balance at end of period | $ | 75,282 | $ | 43,170 | $ | 43,492 | ||||||
Trade Name Intangible Asset – The Company acquired a trade name in conjunction with the Movie Tavern acquisition (see Note 4) that was determined to have an indefinite life. The Company will review its trade name intangible asset for impairment at least annually or whenever events or changes in circumstances indicate the carrying value may not be fully recoverable. The Company will perform its annual impairment test on the last day of its fiscal year. Under ASC Topic 350, the Company can elect to perform a qualitative or quantitative impairment assessment for its trade name intangible asset. The Company will first assess the qualitative factors to determine whether the existence of events and circumstances indicate that is it more likely than not that the fair value of the indefinite-lived asset is less than its carrying amount as a basis for determining whether it is necessary to perform the quantitative impairment test. No impairment was identified as of December 26, 2019.
Capitalization of Interest - The Company capitalizes interest during construction periods by adding such interest to the cost of constructed assets. Interest of approximately $53,000, $65,000 and $400,000 was capitalized in fiscal 2019, fiscal 2018 and fiscal 2017, respectively.
Debt Issuance Costs - The Company records debt issuance costs on long-term debt as a direct deduction from the related debt liability. Debt issuance costs related to the Company’s revolving credit facility are included in other long-term assets. Debt issuance costs are deferred and amortized over the term of the related debt agreements. Amortization of debt issuance costs totaled $285,000, $287,000 and $308,000 for fiscal 2019, fiscal 2018 and fiscal 2017, respectively, and were included in interest expense on the consolidated statements of earnings.
Leases – The Company adopted ASU No. 2016-02, Leases, on the first day of fiscal 2019. See Note 8 for further discussion.
| 63 |
The Marcus Corporation
Notes to Consolidated Financial Statements
1. Description of Business and Summary of Significant Accounting Policies (continued)
Investments – The Company has investments in debt and equity securities. These securities are stated at fair value based on listed market prices, where available, with the change in fair value recorded as investment income or loss within the consolidated statements of earnings. The cost of securities sold is based upon the specific identification method.
Revenue Recognition - The Company adopted ASU No. 2014-09, Revenue from Contracts with Customers, on the first day of fiscal 2018. See Note 2 for further discussion.
Advertising and Marketing Costs - The Company expenses all advertising and marketing costs as incurred.
Insurance Reserves - The Company uses a combination of insurance and self insurance mechanisms, including participation in captive insurance entities, to provide for the potential liabilities for certain risks, including workers’ compensation, healthcare benefits, general liability, property insurance, director and officers’ liability insurance, cyber liability, employment practices liability and business interruption. Liabilities associated with the risks that are retained by the company are not discounted and are estimated, in part, by considering historical claims experience, demographic factors and severity factors.
Income Taxes - The Company recognizes deferred tax assets and liabilities based on the differences between the financial statement carrying amounts and the tax basis of assets and liabilities. Deferred tax assets represent items to be used as a tax deduction or credit in the future tax returns for which the Company has already properly recorded the tax benefit in the income statement. The Company regularly assesses the probability that the deferred tax asset balance will be recovered against future taxable income, taking into account such factors as earnings history, carryback and carryforward periods, and tax strategies. When the indications are that recovery is not probable, a valuation allowance is established against the deferred tax asset, increasing income tax expense in the year that conclusion is made.
The Company assesses income tax positions and records tax benefits for all years subject to examination based upon management’s evaluation of the facts, circumstances and information available at the reporting dates. For those tax positions where it is more-likely-than-not that a tax benefit will be sustained, the Company records the largest amount of tax benefit with a greater than 50% likelihood of being realized upon ultimate settlement with a taxing authority that has full knowledge of all relevant information. For those income tax positions where it is not more-likely-than-not that a tax benefit will be sustained, no tax benefit is recognized in the financial statements. See Note 11 - Income Taxes.
Earnings Per Share - Net earnings per share (EPS) of Common Stock and Class B Common Stock is computed using the two class method. Basic net earnings per share is computed by dividing net earnings by the weighted-average number of common shares outstanding. Diluted net earnings per share is computed by dividing net earnings by the weighted-average number of common shares outstanding, adjusted for the effect of dilutive stock options using the treasury method. Convertible Class B Common Stock is reflected on an if-converted basis. The computation of the diluted net earnings per share of Common Stock assumes the conversion of Class B Common Stock, while the diluted net earnings per share of Class B Common Stock does not assume the conversion of those shares.
| 64 |
The Marcus Corporation
Notes to Consolidated Financial Statements
1. Description of Business and Summary of Significant Accounting Policies (continued)
Holders of Common Stock are entitled to cash dividends per share equal to 110% of all dividends declared and paid on each share of the Class B Common Stock. As such, the undistributed earnings for each year are allocated based on the proportionate share of entitled cash dividends. The computation of diluted net earnings per share of Common Stock assumes the conversion of Class B Common Stock and, as such, the undistributed earnings are equal to net earnings for that computation.
The following table illustrates the computation of Common Stock and Class B Common Stock basic and diluted net earnings per share and provides a reconciliation of the number of weighted-average basic and diluted shares outstanding:
| Year Ended | ||||||||||||
December
26, | December
27, | December 28, 2017 | ||||||||||
| (in thousands, except per share data) | ||||||||||||
| Numerator: | ||||||||||||
| Net earnings attributable to The Marcus Corporation | $ | 42,017 | $ | 53,391 | $ | 64,996 | ||||||
| Denominator: | ||||||||||||
| Denominator for basic EPS | 30,656 | 28,105 | 27,789 | |||||||||
| Effect of dilutive employee stock options | 496 | 608 | 614 | |||||||||
| Denominator for diluted EPS | 31,152 | 28,713 | 28,403 | |||||||||
| Net earnings per share – Basic: | ||||||||||||
| Common Stock | $ | 1.44 | $ | 1.96 | $ | 2.42 | ||||||
| Class B Common Stock | $ | 1.25 | $ | 1.75 | $ | 2.17 | ||||||
| Net earnings per share- Diluted: | ||||||||||||
| Common Stock | $ | 1.35 | $ | 1.86 | $ | 2.29 | ||||||
| Class B Common Stock | $ | 1.24 | $ | 1.72 | $ | 2.13 | ||||||
Options to purchase 324,000 shares, 16,000 shares and 250,000 shares of common stock at prices ranging from $38.51 to $41.90, $38.51 to $41.35 and $31.20 to $31.55 per share were outstanding at December 26, 2019, December 27, 2018 and December 28, 2017, respectively, but were not included in the computation of diluted EPS because the options’ exercise price was greater than the average market price of the common shares, and therefore, the effect would be antidilutive.
Accumulated Other Comprehensive Loss – Accumulated other comprehensive loss presented in the accompanying consolidated balance sheets consists of the following, all presented net of tax:
| December 26, 2019 | December 27, 2018 | |||||||
| (in thousands) | ||||||||
| Unrecognized loss on interest rate swap agreements | $ | (882 | ) | (149 | ) | |||
| Net unrecognized actuarial loss for pension obligation | (11,766 | ) | (6,609 | ) | ||||
| $ | (12,648 | ) | $ | (6,758 | ) | |||
| 65 |
The Marcus Corporation
Notes to Consolidated Financial Statements
1. Description of Business and Summary of Significant Accounting Policies (continued)
Concentration of Risk - As of December 26, 2019, 6% of the Company’s employees were covered by a collective bargaining agreement, of which 15% were covered by an agreement that will expire within one year. As of December 27, 2018, 7% of the Company’s employees were covered by a collective bargaining agreement, of which 96% were covered by an agreement that will expire within one year.
New Accounting Pronouncements – In January 2017, the Financial Accounting Standards Board (FASB) issued Accounting Standards Update (ASU) No. 2017-04, Intangibles - Goodwill and Other (Topic 350) - Simplifying the Test for Goodwill Impairment, which eliminates Step 2 of the goodwill impairment test that had required a hypothetical purchase price allocation. Rather, entities should apply the same impairment assessment to all reporting units and recognize an impairment loss for the amount by which a reporting unit’s carrying amount exceeds its fair value, without exceeding the total amount of goodwill allocated to that reporting unit. Entities will continue to have the option to perform a qualitative assessment for a reporting unit to determine if the quantitative impairment test is necessary. ASU No. 2017-04 is effective for the Company in fiscal 2020 and must be applied prospectively. The Company does not believe the new standard will have a material effect on its consolidated financial statements.
In August 2018, the FASB issued ASU No. 2018-14, Compensation—Retirement Benefits—Defined Benefit Plans—General, designed to add, remove and clarify disclosure requirements related to defined benefit pension and other postretirement plans. ASU No. 2018-14 is effective for the Company in fiscal 2020 and early application is permitted. The Company does not believe the new standard will have a material effect on its consolidated financial statement disclosures.
In August 2018, the FASB issued ASU No. 2018-13, Fair Value Measurement (Topic 820): Disclosure Framework – Changes to the Disclosure Requirements for Fair Value Measurement. The purpose of ASU No. 2018-13 is to improve the disclosures related to fair value measurements in the financial statements. The improvements include the removal, modification and addition of certain disclosure requirements primarily related to Level 3 fair value measurements. ASU No. 2018-13 is effective for the Company in fiscal 2020. The amendments in ASU No. 2018-13 should be applied prospectively. The Company does not expect ASU No. 2018-13 to have a significant impact on its consolidated financial statements.
In December 2019, the FASB issued ASU No. 2019-12, Income Taxes (Topic 740): Simplifying the Accounting for Income Taxes. The amendments in ASU No. 2019-12 are designed to simplify the accounting for income taxes by removing certain exceptions to the general principles in Topic 740. The amendments also improve consistent application of and simplify generally accepted accounting principles for other areas of Topic 740 by clarifying and amending existing guidance. ASU No. 2019-12 is effective for the Company in fiscal 2021 and early application is permitted. The Company is currently evaluating the effect the new standard will have on its consolidated financial statements.
On December 28, 2018, the Company adopted ASU No. 2016-02, Leases (Topic 842), which is intended to improve financial reporting related to leasing transactions. ASC 842 requires a lessee to recognize on the balance sheet assets and liabilities for rights and obligations created by leased assets with lease terms of more than 12 months. The new guidance also requires disclosures to help investors and other financial statement users better understand the amount, timing and uncertainty of cash flows arising from the leases. See Note 8 for further discussion.
| 66 |
The Marcus Corporation
Notes to Consolidated Financial Statements
2. Revenue Recognition
Revenue Recognition Policy
Revenue from contracts with customers is recognized when, or as, the Company satisfies its performance of obligations by transferring the promised services to the customer. A service is transferred to a customer when, or as, the customer obtains control of that service. A performance obligation may be satisfied over time or at a point in time. Revenue from a performance obligation satisfied over time is recognized by measuring the Company’s progress in satisfying the performance obligation in a manner that depicts the transfer of the services to the customer. Revenue from a performance obligation satisfied at a point in time is recognized at the point in time that the Company determines the customer obtains control over the promised service. The amount of revenue recognized reflects the consideration entitled to in exchange for those services.
The disaggregation of revenues by business segment for fiscal 2019 and fiscal 2018 is as follows (in thousands):
| Fiscal 2019 | ||||||||||||||||
| Reportable Segment | ||||||||||||||||
| Theatres | Hotels/ | Corporate | Total | |||||||||||||
| Theatre admissions | $ | 284,141 | $ | – | $ | – | $ | 284,141 | ||||||||
| Rooms | – | 105,857 | – | 105,857 | ||||||||||||
| Theatre concessions | 231,237 | – | – | 231,237 | ||||||||||||
| Food and beverage | – | 74,665 | – | 74,665 | ||||||||||||
| Other revenues(1) | 40,825 | 46,547 | 433 | 87,805 | ||||||||||||
| Cost reimbursements | 877 | 36,281 | – | 37,158 | ||||||||||||
| Total revenues | $ | 557,080 | $ | 263,350 | $ | 433 | $ | 820,863 | ||||||||
| Fiscal 2018 | ||||||||||||||||
| Reportable Segment | ||||||||||||||||
| Theatres | Hotels/ Resorts | Corporate | Total | |||||||||||||
| Theatre admissions | $ | 246,385 | $ | – | $ | – | $ | 246,385 | ||||||||
| Rooms | – | 108,786 | – | 108,786 | ||||||||||||
| Theatre concessions | 166,564 | – | – | 166,564 | ||||||||||||
| Food and beverage | – | 72,771 | – | 72,771 | ||||||||||||
| Other revenues(1) | 32,563 | 45,342 | 424 | 78,329 | ||||||||||||
| Cost reimbursements | 1,292 | 32,993 | – | 34,285 | ||||||||||||
| Total revenues | $ | 446,804 | $ | 259,892 | $ | 424 | $ | 707,120 | ||||||||
| (1) | Included in other revenues is an immaterial amount related to rental income that is not considered contract revenue from contracts with customers under ASC No. 2014-09. |
The Company recognizes revenue from its rooms as earned on the close of business each day. Revenue from theatre admissions, theatre concessions and food and beverage sales are recognized at the time of sale.
Revenues from advanced ticket and gift card sales are recorded as deferred revenue and are recognized when tickets or gift cards are redeemed. Gift card breakage income is recognized based upon historical redemption patterns and represents the balance of gift cards for which the Company believes the likelihood of redemption by the customer is remote. Gift card breakage income is recorded in other revenues in the consolidated statements of earnings. The adoption of ASU No. 2014-09 did not have an effect on how revenue is recognized for these arrangements.
| 67 |
The Marcus Corporation
Notes to Consolidated Financial Statements
2. Revenue Recognition (continued)
Other revenues include management fees for theatres and hotels under management agreements. The management fees are recognized as earned based on the terms of the agreements. The management fees include variable consideration that is recognized based on the Company’s right to invoice as the amount invoiced corresponds directly to the value transferred to the customer. Other revenues also include family entertainment center revenues and revenues from Hotels/Resorts outlets such as spa, ski, golf and parking, each of which are recognized at the time of sale. In addition, other revenues include pre-show advertising income in the Company’s theatres. Pre-show advertising revenue includes variable consideration, primarily based on attendance levels, that is allocated to distinct time periods that make up the overall performance obligation. The adoption of ASU No. 2014-09 did not have an effect on how revenue is recognized for these arrangements.
Cost reimbursements primarily consist of payroll and related expenses at managed properties where the Company is the employer and may include certain operational and administrative costs as provided for in the Company’s contracts with owners. These costs are reimbursed back to the Company. As these costs have no added markup, the revenue and related expense have no impact on operating income or net earnings. The adoption of ASU No. 2014-09 did not have an effect on how revenue is recognized for these arrangements.
The timing of the Company’s revenue recognition may differ from the timing of payment by customers. However, the Company typically receives payment within a very short period of time of when the revenue is recognized. The Company records a receivable when revenue is recognized prior to payment and it has an unconditional right to payment. Alternatively, when payment precedes the provision for the related services, deferred revenue is recorded until the performance obligation is satisfied.
Revenues do not include sales tax as the Company considers itself a pass-through conduit for collecting and remitting sales tax.
The Company had deferred revenue from contracts with customers of $43,200,000, $37,048,000 and $36,007,000 as of December 26, 2019, December 27, 2018 and December 28, 2017, respectively, which includes the one-time cumulative effect adjustment to the balance sheet on the first day of fiscal 2018. The Company had no contract assets as of December 26, 2019 and December 27, 2018. During fiscal 2019, the Company recognized revenue of $22,266,000 that was included in deferred revenues as of December 27, 2018. During fiscal 2018, the Company recognized revenue of $24,840,000 that was included in deferred revenues as of December 29, 2017. The majority of the Company’s deferred revenue relates to non-redeemed gift cards, advanced ticket sales and the Company’s loyalty program.
As of December 26, 2019, the amount of transaction price allocated to the remaining performance obligations under the Company’s advanced ticket sales was $5,117,000 and is reflected in the Company’s consolidated balance sheet as part of deferred revenues, which is included in other accrued liabilities. The Company recognizes revenue as the tickets are redeemed, which is expected to occur within the next two years.
As of December 26, 2019, the amount of transaction price allocated to the remaining performance obligations related to the amount of Hotels and Resorts non-redeemed gift cards was $2,929,000 and is reflected in the Company’s consolidated balance sheet as part of deferred revenues, which is included in other accrued liabilities. The Company recognizes revenue as the gift cards are redeemed, which is expected to occur within the next two years.
The majority of the Company’s revenue is recognized in less than one year from the original contract.
| 68 |
The Marcus Corporation
Notes to Consolidated Financial Statements
2. Revenue Recognition (continued)
Adoption of ASU No. 2014-09
Due to adoption of ASU No. 2014-09, on the first day of fiscal 2018, the Company recorded a one-time cumulative effect adjustment to the balance sheet as follows:
| Balance at December 28, 2017 | Cumulative Adjustment | Balance at December 29, 2017 | ||||||||||
| (in thousands) | ||||||||||||
| Refundable income taxes | $ | 15,335 | $ | 945 | $ | 16,280 | ||||||
| Other accrued liabilities | 53,291 | 3,296 | 56,587 | |||||||||
| Deferred compensation and other | 56,662 | 217 | 56,879 | |||||||||
| Retained earnings | 403,206 | (2,568 | ) | 400,638 | ||||||||
The one-time cumulative effect adjustment to the balance sheet is due to a change in accounting for the Company’s loyalty programs. The Company offers a customer loyalty program to its theatre customers called Magical Movie Rewards. The program allows members to earn points for each dollar spent and access special offers available only to members. The rewards are redeemable at any Marcus Theatre box office, concession stand or food and beverage venue. The Company also offers a customer loyalty program to its Hotels and Resorts customers which allows members to earn points for each dollar spent in its restaurants. The rewards are redeemable at any of the Company’s hotel outlets including spas, restaurants, and golf. Under ASU No. 2014-09, the portion of Theatre admission revenues, Theatre concession revenues and Food and beverage revenues attributable to loyalty points earned by customers are deferred as a reduction of these revenues until related reward redemption. Through December 28, 2017, the Company recorded the estimated incremental cost of redeeming loyalty points at the time they were earned in Advertising and marketing expense. The change had the effect of an immaterial reduction of theatre admission revenues and a corresponding immaterial increase in theatre concession revenues with an offsetting increase in other long-term liabilities based upon historical customer reward redemption patterns.
In accordance with ASU No. 2014-09, the Company has concluded that it is the principal (as opposed to agent) in the arrangement with third-party internet ticketing companies in regards to sale of internet tickets to customers, and therefore, recognizes ticket fee revenue based on a gross transaction price. As such, internet ticket fee revenue is deferred and recognized when the related film exhibition takes place on a gross transaction price basis. Through December 28, 2017, the Company recorded internet ticket fee revenues net of third-party commission or service fees. The change had the effect of increasing other revenues and other operating expense but had no impact on net earnings or cash flows from operations.
| 69 |
The Marcus Corporation
Notes to Consolidated Financial Statements
2. Revenue Recognition (continued)
The adoption of ASU No. 2014-09 had the following effect on our fiscal 2018 consolidated statement of earnings (in thousands):
| As Reported | ASU No. 2014-09 Impact | Adjusted (1) | ||||||||||
| Revenues: | ||||||||||||
| Theatre admissions | $ | 246,385 | $ | (1,805 | ) | $ | 248,190 | |||||
| Theatre concessions | 166,564 | 2,526 | 164,038 | |||||||||
| Food and beverage | 72,771 | 19 | 72,752 | |||||||||
| Other revenues | 78,329 | 4,997 | 73,332 | |||||||||
| Total revenues | 707,120 | 5,737 | 701,383 | |||||||||
| Costs and expenses: | ||||||||||||
| Theatre operations | 217,851 | 669 | 217,182 | |||||||||
| Theatre concessions | 47,522 | 634 | 46,888 | |||||||||
| Advertising and marketing | 23,775 | (1,076 | ) | 24,851 | ||||||||
| Other operating expenses | 36,534 | 4,878 | 31,656 | |||||||||
| Total costs and expenses | 623,931 | 5,105 | 618,826 | |||||||||
| Operating income | 83,189 | 632 | 82,557 | |||||||||
| Income taxes | 13,127 | 125 | 13,002 | |||||||||
| Net earnings attributable to The Marcus Corporation | 53,391 | 507 | 52,884 | |||||||||
| (1) | The amounts reflect each affected financial statement line item as they would have been reported under US GAAP prior to the adoption of ASU No. 2014-09. |
The adoption of ASU No. 2014-09 had the following effect on our consolidated balance sheet as of December 27, 2018 (in thousands):
| As Reported | ASU No. 2014-09 Impact | Adjusted (1) | ||||||||||
| Refundable income taxes | $ | 5,983 | $ | 820 | $ | 5,163 | ||||||
| Total current assets | 68,949 | 820 | 68,129 | |||||||||
| Total assets | 989,331 | 820 | 988,511 | |||||||||
| Other accrued liabilities | 59,645 | 2,782 | 56,863 | |||||||||
| Total current liabilities | 149,256 | 2,782 | 146,474 | |||||||||
| Deferred compensation and other | 56,908 | 99 | 56,809 | |||||||||
| Retained Earnings | 439,178 | (2,061 | ) | 441,239 | ||||||||
| Shareholders’ equity attributable to The Marcus Corporation | 490,009 | (2,061 | ) | 492,070 | ||||||||
| Total equity | 490,119 | (2,061 | ) | 492,180 | ||||||||
| Total liabilities and shareholders’ equity | 989,331 | 820 | 988,511 | |||||||||
| (1) | The amounts reflect each affected financial statement line item as they would have been reported under US GAAP prior to the adoption of ASU No. 2014-09. |
| 70 |
The Marcus Corporation
Notes to Consolidated Financial Statements
2. Revenue Recognition (continued)
As part of the Company’s adoption of ASU No. 2014-09, the Company elected to use the following practical expedients: (i) not to adjust the promised amount of consideration for the effects of a significant financing component when the Company expects, at contract inception, that the period between the Company’s transfer of a promised product or service to a customer and when the customer pays for that product or service will be one year or less; (ii) not to assess whether promised goods or services are performance obligations if they are immaterial in the context of the contract with the customer; (iii) to expense costs as incurred for costs to obtain contracts when the amortization period would have been one year or less, which mainly includes internal sales and development compensation; (iv) not to disclose remaining performance obligations when the remaining performance obligations have original expected durations of one year or less; and (v) not to disclose remaining performance obligations when variable consideration is allocated entirely to a wholly unsatisfied promise to transfer a service that forms a single performance obligation (which exists in the Company’s management fee contracts and its pre-show advertising contracts).
3. Impairment Charge
In fiscal 2019, the Company determined that indicators of impairment were evident at a specific theatre location and that the sum of the estimated undiscounted future cash flows attributable to this asset was less than its carrying amount. As such, the Company evaluated the ongoing value of this asset and determined that the fair value, measured using Level 3 pricing inputs (estimated cash flows including estimated sales proceeds), was less than its carrying value and recorded a $1,874,000 impairment loss. The fair value of the impaired asset was $808,000 as of December 26, 2019.
4. Acquisition
On February 1, 2019, the Company acquired 22 dine-in theatres with 208 screens located in nine Southern and Eastern states from VSS-Southern Theatres LLC (Movie Tavern) for a total purchase price of $139,310,000, consisting of $30,000,000 in cash, subject to certain adjustments, and 2,450,000 shares of the company’s Common Stock with a value of $109,197,000, based on the Company’s closing share price as of January 31, 2019. The acquisition was treated as a purchase in accordance with ASC No. 805, Business Combinations, which requires allocation of the purchase price to the estimated fair values of assets and liabilities acquired in the transaction. The Company obtained assistance from a third party valuation specialist in order to assist in the determination of fair value. The Company provided assumptions to the third party valuation firm based on information available to it at the acquisition date, including both quantitative and qualitative information about the specified assets or liabilities. The Company primarily utilized the third party to accumulate comparative data from multiple sources and assemble a report that summarized the information obtained. The Company then used the information to determine fair value. The third party valuation firm was supervised by Company personnel who are knowledgeable about valuations and fair values. The Company finalized the fair values for both tangible and intangible assets and the liabilities during the fourth quarter of fiscal 2019. The following is a summary of the allocation of the purchase price (in thousands):
| 71 |
The Marcus Corporation
Notes to Consolidated Financial Statements
4. Acquisition (continued)
| Other current assets | $ | 4,855 | ||
| Property and equipment(1) | 95,021 | |||
| Operating lease right-of-use assets | 160,567 | |||
| Deferred tax asset | 753 | |||
| Other (long-term assets)(2) | 9,710 | |||
| Goodwill(3) | 32,205 | |||
| Taxes other than income taxes | (206 | ) | ||
| Other accrued liabilities | (3,322 | ) | ||
| Operating lease obligations | (160,273 | ) | ||
| Total | $ | 139,310 |
| (1) | Amounts recorded for property and equipment include land, building, leasehold improvements and equipment. |
| (2) | Amounts recorded primarily relate to a trade name intangible asset of $9,500,000 which the Company has determined to have an indefinite life. |
| (3) | Amounts recorded for goodwill are expected to be deductible for tax purposes. |
The purchase price paid by the Company in the acquisition resulted in recognition of goodwill because it exceeded the estimated fair value of the assets acquired and liabilities assumed. The Company paid a price in excess of estimated fair value of the assets acquired and liabilities assumed because the acquisition of Movie Tavern created an opportunity for the Company to expand into new growth markets and leverage its proven success in the theatre industry. The Company also expects to realize synergy and cost savings related to the acquisition because of purchasing and procurement economies of scale.
The above fair values of assets acquired and liabilities assumed were determined using the income and cost approaches. In many cases, the determination of the fair values required estimates about discount rates, future estimated revenues and cash flows, and other assumptions that are judgmental. The fair value measurements were primarily based on significant inputs that are not observable in the market and thus represent Level 3 measurements within the fair value measurement hierarchy.
A summary of the significant valuation techniques and inputs used is as follows:
Property and equipment - When estimating the fair value of property and equipment, the cost approach, which estimates value by determining the current cost of replacing an asset with another of equivalent economic utility, was used. The cost to replace a given asset reflects the estimated reproduction or replacement cost for the property, less an allowance for loss in value due to depreciation and less any economic obsolescence adjustments.
Operating lease right-of-use assets and lease liabilities – When estimating the fair value of these lease-related balances, the Company first determined such balances under the requirement of ASC 842 (see Note 8 for further detail on accounting for leases). The operating lease right-of-use assets were then assessed for favorable and unfavorable lease terms, which were determined by comparing the rent expense-to-revenue ratio and operating cash flow margin of each lease to market comparable data. To the extent it was determined that such lease was at favorable or unfavorable terms, the adjustment to record the operating lease right-of-use assets to fair market value was determined through a discounted cash flow model and the significant assumptions include a 14% discount rate.
Trade name intangible asset – When estimating the fair value of the trade name intangible asset, the Company used an income approach, specifically the relief from royalty method. The significant assumptions used include the estimated annual revenue, the royalty rate (1%), and a discount rate (17%).
The acquired theatres contributed approximately $125,839,000 to revenue in fiscal 2019. Excluding the impact of acquisition costs, the acquired theatres did not have a material impact on the Company’s fiscal 2019 net earnings. Acquisition costs incurred as a result of the Movie Tavern acquisition were approximately $1,283,000 and $1,507,000 during fiscal 2019 and fiscal 2018, respectively, and were expensed as incurred and included in administrative expense in the consolidated statements of earnings.
Assuming the Movie Tavern acquisition occurred at the beginning of fiscal 2018, unaudited pro forma revenues for the Company during fiscal 2018 were $845,662,000. The Movie Tavern theatres would not have had a material impact on the Company’s fiscal 2018 net earnings. Unaudited pro forma revenues for the Company during fiscal 2019 would have been $832,349,000. The additional five weeks of Movie Tavern theatres operations would not have had a material impact on the Company’s fiscal 2019 net earnings.
5. Asset Sale
On October 20, 2017, the Company sold its 11% minority interest in The Westin® Atlanta Perimeter North in Atlanta, Georgia, and recorded a gain of $4,875,000 during the fiscal 2017 fourth quarter, which is included in Gain (loss) on disposition of property, equipment and other assets in the consolidated statement of earnings.
| 72 |
The Marcus Corporation
Notes to Consolidated Financial Statements
6. Additional Balance Sheet Information
The composition of accounts receivable is as follows:
| December 26, 2019 | December 27, 2018 | |||||||
| (in thousands) | ||||||||
| Trade receivables, net of allowances of $762 and $361, respectively | $ | 9,327 | $ | 8,538 | ||||
| Other receivables | 20,138 | 17,146 | ||||||
| $ | 29,465 | $ | 25,684 | |||||
The composition of property and equipment, which is stated at cost, is as follows:
| December 26, 2019 | December 27, 2018 | |||||||
| (in thousands) | ||||||||
| Land and improvements | $ | 152,434 | $ | 150,122 | ||||
| Buildings and improvements | 761,511 | 745,886 | ||||||
| Leasehold improvements | 164,083 | 98,885 | ||||||
| Furniture, fixtures and equipment | 377,404 | 314,875 | ||||||
| Finance lease right-of-use assets | 74,357 | 72,631 | ||||||
| Construction in progress | 4,043 | 12,513 | ||||||
| 1,533,832 | 1,394,912 | |||||||
| Less accumulated depreciation and amortization | 610,578 | 554,869 | ||||||
| $ | 923,254 | $ | 840,043 | |||||
The composition of other assets is as follows:
| December 26, 2019 | December 27, 2018 | |||||||
| (in thousands) | ||||||||
| Split dollar life insurance policies | $ | 11,411 | $ | 11,411 | ||||
| Intangible assets | 10,057 | 890 | ||||||
| Favorable lease right | – | 8,818 | ||||||
| Other assets | 12,468 | 11,981 | ||||||
| $ | 33,936 | $ | 33,100 | |||||
Included in intangible assets as of December 26, 2019 is a trade name valued at $9,500,000 that has an indefinite life.
As of December 28, 2018, in conjunction with the adoption of Topic 842, the Company’s favorable lease right is included in Operating lease right-of-use assets in the consolidated balance sheet. (See Note 8 for further detail.)
| 73 |
The Marcus Corporation
Notes to Consolidated Financial Statements
7. Long-Term Debt
Long-term debt is summarized as follows:
| December 26, 2019 | December 27, 2018 | |||||||
| (in thousands, except payment data) | ||||||||
| Mortgage notes | $ | 24,571 | $ | 39,852 | ||||
| Senior notes | 109,000 | 118,000 | ||||||
| Unsecured term note due February 2025, with monthly principal and interest payments of $39,110, bearing interest at 5.75% | 2,093 | 2,432 | ||||||
| Revolving credit agreement | 81,000 | 79,000 | ||||||
| Debt issuance costs | (322 | ) | (464 | ) | ||||
| 216,342 | 238,820 | |||||||
| Less current maturities, net of issuance costs | 9,910 | 9,957 | ||||||
| $ | 206,432 | $ | 228,863 | |||||
The mortgage notes, both fixed rate and adjustable, bear interest from 3.00% to 5.03%, have a weighted-average rate of 4.27% at December 26, 2019 and 4.66% at December 27, 2018, and mature in fiscal years 2025 through 2043. The mortgage notes are secured by the related land, buildings and equipment.
The $109,000,000 of senior notes maturing in 2020 through 2027 require annual principal payments in varying installments and bear interest payable semi-annually at fixed rates ranging from 4.02% to 6.55%, with a weighted-average fixed rate of 4.37% at December 26, 2019 and 4.53% at December 27, 2018.
At December 26, 2019, the Company had a revolving credit facility totaling $225,000,000 in place under an existing credit agreement that matures in June 2021. There were borrowings of $81,000,000 outstanding on the revolving credit facility at December 26, 2019, bearing interest at LIBOR plus a margin which adjusts based on the Company’s borrowing levels, effectively 2.70% at December 26, 2019 and 3.46% at December 27, 2018. The revolving credit facility requires an annual facility fee of 0.15% to 0.25% on the total commitment, based on the Company’s borrowing levels. Availability under the line at December 26, 2019 totaled $139,000,000.
On January 9, 2020, the Company replaced its then-existing credit agreement with a new five-year $225,000,000 credit facility that expires in January 2025. The terms of the new credit agreement did not change materially.
The Company’s loan agreements include, among other covenants, maintenance of certain financial ratios, including a debt-to-capitalization ratio and a fixed charge coverage ratio. The Company is in compliance with all financial debt covenants at December 26, 2019.
| 74 |
The Marcus Corporation
Notes to Consolidated Financial Statements
7. Long-Term Debt (continued)
Scheduled annual principal payments on long-term debt, net of amortization of debt issuance costs, for the years subsequent to December 26, 2019, are:
| Fiscal Year | (in thousands) | ||||
| 2020 | $ | 9,910 | |||
| 2021 | 10,963 | ||||
| 2022 | 11,013 | ||||
| 2023 | 11,066 | ||||
| 2024 | 11,119 | ||||
| Thereafter | 162,271 | ||||
| $ | 216,342 | ||||
Interest paid on long-term debt, net of amounts capitalized, for fiscal 2019, fiscal 2018 and fiscal 2017 totaled $10,281,000, $11,434,000 and $10,338,000, respectively.
The Company utilizes derivatives principally to manage market risks and reduce its exposure resulting from fluctuations in interest rates. The Company formally documents all relationships between hedging instruments and hedged items, as well as its risk-management objectives and strategies for undertaking various hedge transactions.
The Company entered into two interest rate swap agreements on March 1, 2018 covering $50,000,000 of floating rate debt. The first agreement has a notional amount of $25,000,000, expires March 1, 2021, and requires the Company to pay interest at a defined rate of 2.559% while receiving interest at a defined variable rate of one-month LIBOR (1.750% at December 26, 2019). The second agreement has a notional amount of $25,000,000, expires March 1, 2023, and requires the Company to pay interest at a defined rate of 2.687% while receiving interest at a defined variable rate of one-month LIBOR (1.750% at December 26, 2019). The Company recognizes derivatives as either assets or liabilities on the consolidated balance sheets at fair value. The accounting for changes in the fair value (i.e., gains or losses) of a derivative instrument depends on whether it has been designated and qualifies as part of a hedging relationship and on the type of hedging relationship. Derivatives that do not qualify for hedge accounting must be adjusted to fair value through earnings. For derivatives that are designated and qualify as a cash flow hedge, the effective portion of the gain or loss on the derivative is reported as a component of accumulated other comprehensive income (loss) and reclassified into earnings in the same period or periods during which the hedged transaction affects earnings. The Company’s interest rate swap agreements are considered effective and qualify as cash flow hedges. The Company assesses, both at the inception of each hedge and on an on-going basis, whether the derivatives that are used in its hedging transactions are highly effective in offsetting changes in cash flows of the hedged items. As of December 26, 2019, the interest rate swaps were considered highly effective. The fair value of the interest rate swaps on December 26, 2019 and December 27, 2018, respectively, was a liability of $1,194,000 and $205,000 and was included in deferred compensation and other in the consolidated balance sheets. The Company does not expect the interest rate swaps to have a material effect on earnings within the next 12 months.
The Company had an interest rate swap that expired in January 2018. The swap agreement covered $25,000,000 of floating rate debt that required the Company to pay interest at a defined fixed rate of 0.96% while receiving interest at a defined variable rate of one-month LIBOR. The Company’s interest rate swap agreement was considered effective and qualified as a cash flow hedge from inception through June 16, 2016, at which time the derivative was undesignated and the balance in accumulated other comprehensive loss was reclassified into interest expense. As of June 16, 2016, the swap was considered ineffective for accounting purposes and the change in fair value was recorded as an increase or decrease in interest expense. As such, the $13,000 decrease in fair value of the swap during fiscal 2018 was recorded to interest expense.
| 75 |
The Marcus Corporation
Notes to Consolidated Financial Statements
8. Leases
The Company determines if an arrangement is a lease at inception. The Company evaluates each lease for classification as either a finance lease or an operating lease according to accounting guidance ASU No. 2016-02, Leases (Topic 842). The Company performs this evaluation at the inception of the lease and when a modification is made to a lease. The Company leases real estate and equipment with lease terms of one year to 45 years, some of which include options to extend and/or terminate the lease. The exercise of lease renewal options is done at the Company’s sole discretion. When deemed reasonably certain of exercise, the renewal options are included in the determination of the lease term and related right-of-use asset and lease liability. The depreciable life of the asset is limited to the expected term. The Company’s lease agreements do not contain any residual value guarantees or any restrictions or covenants.
Right-of-use assets represent the Company’s right to use an underlying asset for the lease term and lease liabilities represent the obligation to make lease payments arising from the lease. Operating lease right-of-use assets and labilities are recognized at commencement date of the lease based on the present value of lease payments over the lease term. When readily determinable, the Company uses the implicit rate in the lease in determining the present value of lease payments. When the lease does not provide an implicit rate, the Company uses its incremental borrowing rate based on the information available at the lease commencement date, including the fixed rate the Company could borrow for a similar amount, over a similar lease term with similar collateral. The Company recognizes right-of-use assets for all assets subject to operating leases in an amount equal to the operating lease liabilities, adjusted for the balances of long-term prepaid rent, favorable lease intangible assets, deferred lease expense, unfavorable lease liabilities and deferred lease incentive liabilities. Lease expense for operating lease payments is recognized on a straight-line basis over the lease term.
The majority of the Company’s lease agreements include fixed rental payments. Variable lease payments that do not depend on an index or rate, including those that depend on the Company’s performance or use of the underlying asset, are expensed as incurred.
The Company adopted ASC 842 on the first day of fiscal 2019 using the modified retrospective approach. Under this method, the Company was allowed to initially apply the new lease standard at the adoption date and recognize the assets and liabilities in the period of adoption. As such, upon adoption, no adjustments were made to prior period financial information or disclosures and the new lease standard did not result in a cumulative effect adjustment to retained earnings. Finance lease accounting remained substantially unchanged. The adoption of ASC 842 had the following effect on the Company’s financial statements (all relating to operating lease right-of-use assets and obligations):
| Balance at December 27, 2018 | ASC 842 Adjustments | Balance at December 28, 2018 | ||||||||||
| (in thousands) | ||||||||||||
| Assets | ||||||||||||
| Other current assets | $ | 15,355 | $ | (690 | ) | $ | 14,665 | |||||
| Operating lease right-of-use assets | - | 76,178 | 76,178 | |||||||||
| Other assets (long term) | 33,100 | (8,868 | ) | 24,232 | ||||||||
| Liabilities | ||||||||||||
| Other accrued liabilities | 59,645 | (4,396 | ) | 55,249 | ||||||||
| Current portion of operating lease obligations | - | 5,909 | 5,909 | |||||||||
| Operating lease obligations | - | 75,608 | 75,608 | |||||||||
| Deferred compensation and other | 56,908 | (10,501 | ) | 46,407 | ||||||||
| 76 |
The Marcus Corporation
Notes to Consolidated Financial Statements
8. Leases (continued)
As part of the Company’s adoption of ASC 842, the Company elected the following practical expedients: i) to forego reassessment of its prior conclusion related to lease identification, lease classification and initial direct costs, ii) to not separate lease and non-lease components for all its leases, and iii) to make a policy election not to apply the lease recognition requirements for short-term leases. As a result, the Company does not recognize right-of use assets or lease liabilities for short-term leases that qualify for the policy election (those with an initial term of 12 months or less which do not include a purchase or renewal option which is reasonably certain to be exercised), but will recognize these lease payments as lease costs on a straight-line basis over the lease term.
Total lease cost consists of the following:
| Lease Cost | Classification | Fiscal 2019 | ||||
| (in thousands) | ||||||
| Finance lease costs: | ||||||
| Amortization of finance lease assets | Depreciation and amortization | $ | 3,507 | |||
| Interest on lease liabilities | Interest expense | 1,247 | ||||
| $ | 4,754 | |||||
| Operating lease costs: | ||||||
| Operating lease costs | Rent expense | $ | 24,302 | |||
| Variable lease cost | Rent expense | 1,560 | ||||
| Short-term lease cost | Rent expense | 237 | ||||
| $ | 26,099 | |||||
Additional information related to leases is as follows:
| Other Information | Fiscal 2019 | ||||
| (in thousands) | |||||
| Cash paid for amounts included in the measurement of lease liabilities: | |||||
| Financing cash flows from finance leases | $ | 2,544 | |||
| Operating cash flows from finance leases | 1,247 | ||||
| Operating cash flows from operating leases | 25,226 | ||||
| Right of use assets obtained in exchange for new lease obligations: | |||||
| Finance lease liabilities | 1,726 | ||||
| Operating lease liabilities, including from acquisitions | 180,103 | ||||
| December 26, 2019 | |||||
| (in thousands) | |||||
| Finance leases: | |||||
| Property and equipment – gross | $ | 74,357 | |||
| Accumulated depreciation and amortization | (52,869 | ) | |||
| Property and equipment - net | $ | 21,488 | |||
In fiscal 2017, the Company had the following non-cash transactions related to leases: 1) obtained $6,173,000 of new capital leases, and 2) exercised $3,675,000 in capital lease extensions.
| 77 |
The Marcus Corporation
Notes to Consolidated Financial Statements
8. Leases (continued)
Remaining lease terms and discount rates are as follows:
| Lease Term and Discount Rate | December 26, 2019 | |||
| Weighted-average remaining lease terms: | ||||
| Finance leases | 10 years | |||
| Operating leases | 15 years | |||
| Weighted-average discount rates: | ||||
| Finance leases | 4.67 | % | ||
| Operating leases | 4.56 | % | ||
Maturities of lease liabilities as of December 26, 2019 are as follows (in thousands):
| Fiscal Year | Operating Leases |
Finance Leases |
||||||
| 2020 | $ | 24,369 | $ | 3,606 | ||||
| 2021 | 25,730 | 2,997 | ||||||
| 2022 | 26,313 | 2,950 | ||||||
| 2023 | 24,808 | 2,840 | ||||||
| 2024 | 24,534 | 2,859 | ||||||
| Thereafter | 214,060 | 14,093 | ||||||
| Total lease payments | 339,814 | 29,345 | ||||||
| Less: amount representing interest | (94,368 | ) | (5,972 | ) | ||||
| Total lease liabilities | $ | 245,446 | $ | 23,373 | ||||
Aggregate minimum lease commitments as of December 27, 2018 under Accounting Standard Codification Topic 840 are as follows (in thousands):
| Fiscal Year | Operating Leases |
Capital Leases |
||||||
| 2019 | $ | 11,317 | $ | 3,073 | ||||
| 2020 | 10,169 | 2,978 | ||||||
| 2021 | 9,670 | 2,679 | ||||||
| 2022 | 9,910 | 2,718 | ||||||
| 2023 | 9,038 | 2,718 | ||||||
| 2024 and thereafter | 80,523 | 16,940 | ||||||
| Total minimum lease payments | $ | 130,627 | 31,106 | |||||
| Less: amount representing interest | (6,978 | ) | ||||||
| Total present value of minimum capital lease payments | $ | 24,128 | ||||||
As of December 26, 2019, the Company had a build-to-suit lease arrangement in which the Company is responsible for the construction of a new leased theatre and for paying construction costs during development. Construction costs will be reimbursed by the landlord up to an agreed upon amount. During construction, the Company is deemed to not have control of the assets or the leased premises and will record the development expenditures in other assets on the consolidated balance sheet. The lease commences when the Company has access to the right-of-use asset, which is expected to be upon project completion during fiscal 2020.
| 78 |
The Marcus Corporation
Notes to Consolidated Financial Statements
9. Shareholders’ Equity and Stock-Based Compensation
Shareholders may convert their shares of Class B Common Stock into shares of Common Stock at any time. Class B Common Stock shareholders are substantially restricted in their ability to transfer their Class B Common Stock. Holders of Common Stock are entitled to cash dividends per share equal to 110% of all dividends declared and paid on each share of the Class B Common Stock. Holders of Class B Common Stock are entitled to ten votes per share while holders of Common Stock are entitled to one vote per share on any matters brought before the shareholders of the Company. Liquidation rights are the same for both classes of stock.
Through December 26, 2019, the Company’s Board of Directors has approved the repurchase of up to 11,687,500 shares of Common Stock to be held in treasury. The Company intends to reissue these shares upon the exercise of stock options and for savings and profit-sharing plan contributions. The Company purchased 30,139, 82,722 and 28,898 shares pursuant to these authorizations during fiscal 2019, fiscal 2018 and fiscal 2017, respectively. At December 26, 2019, there were 2,756,561 shares available for repurchase under these authorizations.
The Company’s Board of Directors has authorized the issuance of up to 750,000 shares of Common Stock for The Marcus Corporation Dividend Reinvestment and Associate Stock Purchase Plan. At December 26, 2019, there were 430,582 shares available under this authorization.
Shareholders have approved the issuance of up to 4,937,500 shares of Common Stock under various equity incentive plans. Stock options granted under the plans to employees generally become exercisable either 40% after two years, 60% after three years, 80% after four years and 100% after five years of the date of grant, or 50% after two years, 75% after three years and 100% after four years of the date of grant, depending on the date of grant. The options generally expire ten years from the date of grant as long as the optionee is still employed with the Company.
Awarded shares of non-vested stock cumulatively vest either 25% after three years of the grant date, 50% after five years of the grant date, 75% after ten years of the grant date and 100% upon retirement, or 50% after three years of the grant date and 100% after five years of the grant date, or 50% after two years of the grant date and 100% after four years of the grant date, depending on the date of grant. The non-vested stock may not be sold, transferred, pledged or assigned, except as provided by the vesting schedule included in the Company’s equity incentive plan. During the period of restriction, the holder of the non-vested stock has voting rights and is entitled to receive all dividends and other distributions paid with respect to the stock. Non-vested stock awards and shares issued upon option exercises are issued from previously acquired treasury shares. At December 26, 2019, there were 588,834 shares available for grants of additional stock options, non-vested stock and other types of equity awards under the current plan.
Stock-based compensation, including stock options and non-vested stock awards, is expensed over the vesting period of the awards based on the grant date fair value.
The Company estimated the fair value of stock options using the Black-Scholes option pricing model with the following assumptions used for awards granted during fiscal 2019, fiscal 2018 and fiscal 2017:
Year Ended December 26, 2019 | Year Ended December 27, 2018 | Year Ended December 28, 2017 | ||||||||||
| Risk-free interest rate | 2.50 – 2.60% | 2.70 – 2.80% | 2.08 – 2.20% | |||||||||
| Dividend yield | 1.70% | 2.10% | 2.10% | |||||||||
| Volatility | 27 – 32% | 28 – 33% | 34 – 43% | |||||||||
| Expected life | 6 – 8 years | 6 – 8 years | 7 – 8 years | |||||||||
| 79 |
The Marcus Corporation
Notes to Consolidated Financial Statements
9. Shareholders’ Equity and Stock-Based Compensation (continued)
Total pre-tax stock-based compensation expense was $3,523,000, $2,691,000 and $2,411,000 in fiscal 2019, fiscal 2018 and fiscal 2017, respectively. The recognized tax benefit on stock-based compensation was $1,127,000, $2,617,000 and $1,227,000 in fiscal 2019, fiscal 2018 and fiscal 2017, respectively. The increase in the recognized tax benefit during fiscal 2018 was primarily due to an increase in stock options exercised where the market price was significantly greater than the grant date fair value of the stock options.
A summary of the Company’s stock option activity and related information follows:
| December 26, 2019 | December 27, 2018 | December 28, 2017 | ||||||||||||||||||||||
| Weighted- | Weighted- | Weighted- | ||||||||||||||||||||||
| Average | Average | Average | ||||||||||||||||||||||
| Exercise | Exercise | Exercise | ||||||||||||||||||||||
| Options | Price | Options | Price | Options | Price | |||||||||||||||||||
| (options in thousands) | ||||||||||||||||||||||||
| Outstanding at beginning of period | 1,450 | $ | 21.25 | 1,629 | $ | 18.08 | 1,563 | $ | 15.94 | |||||||||||||||
| Granted | 329 | 41.67 | 336 | 27.59 | 273 | 31.08 | ||||||||||||||||||
| Exercised | (97 | ) | 15.60 | (478 | ) | 14.74 | (133 | ) | 17.04 | |||||||||||||||
| Forfeited | (41 | ) | 30.58 | (37 | ) | 23.35 | (74 | ) | 22.37 | |||||||||||||||
| Outstanding at end of period | 1,641 | 25.46 | 1,450 | 21.25 | 1,629 | 18.08 | ||||||||||||||||||
| Exercisable at end of period | 802 | $ | 18.22 | 699 | $ | 15.87 | 988 | $ | 14.69 | |||||||||||||||
| Weighted-average fair value of options granted during the period | $ | 11.79 | $ | 7.87 | $ | 10.54 | ||||||||||||||||||
Exercise prices for options outstanding as of December 26, 2019 ranged from $10.00 to $41.90. The weighted-average remaining contractual life of those options is 6.4 years. The weighted-average remaining contractual life of options currently exercisable is 4.5 years. There were 1,587,000 options outstanding, vested and expected to vest as of December 26, 2019, with a weighted-average exercise price of $25.13 and an intrinsic value of $14,567,000. Additional information related to these options segregated by exercise price range is as follows:
| Exercise Price Range | ||||||||||||
$10.00 to $18.34 | $18.35 to $27.00 | $27.01 to $41.90 | ||||||||||
| (options in thousands) | ||||||||||||
| Options outstanding | 464 | 610 | 567 | |||||||||
| Weighted-average exercise price of options outstanding | $ | 14.03 | $ | 23.22 | $ | 37.22 | ||||||
| Weighted-average remaining contractual life of options outstanding | 3.1 | 7.0 | 8.4 | |||||||||
| Options exercisable | 464 | 218 | 120 | |||||||||
| Weighted-average exercise price of options exercisable | $ | 14.03 | $ | 19.80 | $ | 31.54 | ||||||
The intrinsic value of options outstanding at December 26, 2019 was $14,693,000 and the intrinsic value of options exercisable at December 26, 2019 was $11,579,000. The intrinsic value of options exercised was $2,135,000, $10,373,000 and $1,770,000 during fiscal 2019, fiscal 2018 and fiscal 2017, respectively. As of December 26, 2019, total remaining unearned compensation cost related to stock options was $5,314,000, which will be amortized to expense over the remaining weighted-average life of 2.7 years.
| 80 |
The Marcus Corporation
Notes to Consolidated Financial Statements
9. Shareholders’ Equity and Stock-Based Compensation (continued)
A summary of the Company’s non-vested stock activity and related information follows:
| December 26, 2019 | December 27, 2018 | December 28, 2017 | ||||||||||||||||||||||
| Weighted- | Weighted- | Weighted- | ||||||||||||||||||||||
| Average | Average | Average | ||||||||||||||||||||||
| Fair | Fair | Fair | ||||||||||||||||||||||
| Shares | Value | Shares | Value | Shares | Value | |||||||||||||||||||
| (options in thousands) | ||||||||||||||||||||||||
| Outstanding at beginning of period | 158 | $ | 18.98 | 137 | $ | 21.94 | 143 | $ | 19.30 | |||||||||||||||
| Granted | 39 | 38.24 | 52 | 29.02 | 37 | 29.12 | ||||||||||||||||||
| Vested | (23 | ) | 18.60 | (31 | ) | 16.41 | (36 | ) | 18.78 | |||||||||||||||
| Forfeited | – | – | – | – | (7 | ) | 22.86 | |||||||||||||||||
| Outstanding at end of period | 174 | $ | 29.16 | 158 | $ | 18.98 | 137 | $ | 21.94 | |||||||||||||||
The Company expenses awards of non-vested stock based on the fair value of the Company’s common stock at the date of grant. As of December 26, 2019, total remaining unearned compensation related to non-vested stock was $3,015,000, which will be amortized over the weighted-average remaining service period of 2.8 years.
10. Employee Benefit Plans
The Company has a qualified profit-sharing savings plan (401(k) plan) covering eligible employees. The 401(k) plan provides a matching contribution equal to 100% of the first 3% of compensation and 50% of the next 2% of compensation deposited by an employee into the 401(k) plan. Prior to fiscal 2017, the plan provided for a contribution of a minimum of 1% of defined compensation for all plan participants and matching of 25% of employee contributions up to 6% of defined compensation. In addition, the Company made additional discretionary contributions. During fiscal 2019 and fiscal 2018, the first 2% of the matching contribution was made with the Company’s common stock. During fiscal 2017, the 1% and discretionary contributions were made with the Company’s common stock.
The Company also sponsors unfunded, nonqualified, defined-benefit and deferred compensation plans. The Company’s unfunded, nonqualified retirement plan includes two components. The first component is a defined-benefit plan that applies to certain participants. The second component applies to all other participants and provides an account-based supplemental retirement benefit. Pension and profit-sharing expense for all plans was $5,065,000, $5,117,000 and $4,415,000 for fiscal 2019, fiscal 2018 and fiscal 2017, respectively.
The Company recognizes actuarial losses and prior service costs related to its defined benefit plan in the consolidated balance sheets and recognizes changes in these amounts in the year in which changes occur through comprehensive income.
| 81 |
The Marcus Corporation
Notes to Consolidated Financial Statements
10. Employee Benefit Plans (continued)
The status of the Company’s unfunded nonqualified, defined-benefit and account-based retirement plan based on the respective December 26, 2019 and December 27, 2018 measurement dates is as follows:
| December 26, | December 27, | |||||||
| 2019 | 2018 | |||||||
| (in thousands) | ||||||||
| Change in benefit obligation: | ||||||||
| Benefit obligation at beginning of period | $ | 35,640 | $ | 37,639 | ||||
| Service cost | 833 | 926 | ||||||
| Interest cost | 1,485 | 1,364 | ||||||
| Actuarial (gain) loss | 7,317 | (2,633 | ) | |||||
| Benefits paid | (1,451 | ) | (1,656 | ) | ||||
| Benefit obligation at end of year | $ | 43,824 | $ | 35,640 | ||||
| Amounts recognized in the statement of financial position consist of: | ||||||||
| Current accrued benefit liability (included in Other accrued liabilities) | $ | (1,400 | ) | $ | (1,378 | ) | ||
| Noncurrent accrued benefit liability (included in Deferred compensation and other) | (42,424 | ) | (34,262 | ) | ||||
| Total | $ | (43,824 | ) | $ | (35,640 | ) | ||
| Amounts recognized in accumulated other comprehensive loss consist of: | ||||||||
| Net actuarial loss | $ | 16,373 | $ | 9,556 | ||||
| Prior service credit | (451 | ) | (515 | ) | ||||
| Total | $ | 15,922 | $ | 9,041 | ||||
| Year Ended | ||||||||||||
| December 26, | December 27, | December 28, | ||||||||||
| 2019 | 2018 | 2017 | ||||||||||
| (in thousands) | ||||||||||||
| Net periodic pension cost: | ||||||||||||
| Service cost | $ | 833 | $ | 926 | $ | 765 | ||||||
| Interest cost | 1,485 | 1,364 | 1,356 | |||||||||
| Net amortization of prior service cost and actuarial loss | 436 | 621 | 356 | |||||||||
| $ | 2,754 | $ | 2,911 | $ | 2,477 | |||||||
The $11,766,000 loss, net of tax, included in accumulated other comprehensive loss at December 26, 2019, consists of the $12,100,000 net actuarial loss, net of tax, and the $334,000 unrecognized prior service credit, net of tax, which have not yet been recognized in the net periodic benefit cost. The $6,609,000 loss, net of tax, included in accumulated other comprehensive loss at December 27, 2018, consists of the $6,985,000 net actuarial loss, net of tax, and the $376,000 unrecognized prior service credit, net of tax, which have not yet been recognized in the net periodic benefit cost.
The accumulated benefit obligation was $37,474,000 and $30,576,000 as of December 26, 2019 and December 27, 2018, respectively.
| 82 |
The Marcus Corporation
Notes to Consolidated Financial Statements
10. Employee Benefit Plans (continued)
The pre-tax change in the benefit obligation recognized in other comprehensive loss was as follows:
| Year Ended | ||||||||
| December 26, 2019 | December 27, 2018 | |||||||
| (in thousands) | ||||||||
| Net actuarial loss (gain) | $ | 7,317 | (2,633 | ) | ||||
| Amortization of the net actuarial loss | (499 | ) | (685 | ) | ||||
| Amortization of the prior year service credit | 63 | 64 | ||||||
| Total | $ | 6,881 | (3,254 | ) | ||||
The estimated amount that will be amortized from accumulated other comprehensive loss into net periodic benefit cost in fiscal 2020 is $990,000, of which $1,054,000 relates to the actuarial loss and $64,000 relates to the prior service credit.
The weighted-average assumptions used to determine the benefit obligations as of the measurement dates were as follows:
| December 26, 2019 | December 27, 2018 | |||||||
| Discount rate | 3.10 | % | 4.15 | % | ||||
| Rate of compensation increase | 4.00 | % | 4.00 | % | ||||
The weighted-average assumptions used to determine net periodic benefit cost were as follows:
| Year Ended | ||||||||||||
| December 26, 2019 | December 27, 2018 | December 28, 2017 | ||||||||||
| Discount rate | 4.15 | % | 3.60 | % | 4.15 | % | ||||||
| Rate of compensation increase | 4.00 | % | 4.00 | % | 4.00 | % | ||||||
Benefit payments expected to be paid subsequent to December 26, 2019, are:
| Fiscal Year | (in thousands) | ||||
| 2020 | $ | 1,400 | |||
| 2021 | 1,709 | ||||
| 2022 | 1,538 | ||||
| 2023 | 1,532 | ||||
| 2024 | 1,791 | ||||
| Years 2025 – 2029 | 12,402 | ||||
| 83 |
The Marcus Corporation
Notes to Consolidated Financial Statements
11. Income Taxes
The components of the net deferred tax liability are as follows:
| December 26, 2019 | December 27, 2018 | |||||||
| (in thousands) | ||||||||
| Accrued employee benefits | $ | 15,145 | $ | 13,381 | ||||
| Depreciation and amortization | (69,100 | ) | (59,296 | ) | ||||
| Operating lease assets | (62,339 | ) | - | |||||
| Operating lease liabilities | 62,750 | - | ||||||
| Other | 5,282 | 3,938 | ||||||
| Net deferred tax liability | $ | (48,262 | ) | $ | (41,977 | ) | ||
Income tax expense consists of the following:
| Year Ended | |||||||||||||
| December 26, 2019 | December 27, 2018 | December 28, 2017 | |||||||||||
| (in thousands) | |||||||||||||
| Current: | |||||||||||||
| Federal | $ | 1,187 | $ | 7,022 | $ | 8,707 | |||||||
| State | 2,041 | 3,181 | 1,558 | ||||||||||
| Deferred: | |||||||||||||
| Federal | 9,228 | 2,815 | (7,155 | ) | |||||||||
| State | (136 | ) | 109 | 515 | |||||||||
| $ | 12,320 | $ | 13,127 | $ | 3,625 | ||||||||
A tax benefit of $1,947,000 is included in the fiscal 2018 current federal income tax amount and a tax benefit of $21,240,000 is included in the fiscal 2017 deferred federal income tax amount, both of which relate to the Tax Cuts and Jobs Act of 2017.
The Company’s effective income tax rate, adjusted for earnings from noncontrolling interests, was 22.7%, 19.7% and 5.3% for fiscal 2019, fiscal 2018 and fiscal 2017, respectively. During fiscal 2018, the Company recorded current tax benefits of $1,947,000 related to reductions in deferred tax liabilities related to tax accounting method changes that the Company made subsequent to the Tax Cuts and Jobs Act of 2017. During fiscal 2017, the Company recorded a deferred tax benefit of $21,240,000 related to the reduction of its net deferred tax liability resulting from the reduction in the corporate tax rate enacted in December 2017 under the Tax Cuts and Jobs Act of 2017. Excluding these favorable impacts, the Company’s effective income tax rates for fiscal 2018 and fiscal 2017 were 22.7% and 36.2%, respectively. The Company also recorded significant current tax benefits in fiscal 2018 related to excess tax benefits on share-based compensation. The Company has not included the income tax expense or benefit related to the net earnings or loss attributable to noncontrolling interests in its income tax expense as the entities are considered pass-through entities and, as such, the income tax expense or benefit is attributable to its owners.
| 84 |
The Marcus Corporation
Notes to Consolidated Financial Statements
11. Income Taxes (continued)
A reconciliation of the statutory federal tax rate to the effective tax rate on earnings attributable to The Marcus Corporation follows:
| Year Ended | ||||||||||||
| December 26, 2019 | December 27, 2018 | December 28, 2017 | ||||||||||
| Statutory federal tax rate | 21.0 | % | 21.0 | % | 35.0 | % | ||||||
| Tax benefit from Tax Cuts and Jobs Act of 2017 | – | (2.9 | ) | (30.9 | ) | |||||||
| State income taxes, net of federal income tax benefit | 5.5 | 6.1 | 4.8 | |||||||||
| Tax credits, net of federal income tax benefit | (2.7 | ) | (1.1 | ) | (0.8 | ) | ||||||
| Other | (1.1 | ) | (3.4 | ) | (2.8 | ) | ||||||
| 22.7 | % | 19.7 | % | 5.3 | % | |||||||
Net income taxes paid (refunded) in fiscal 2019, fiscal 2018 and fiscal 2017 were $3,062,000, $(218,000) and $23,691,000, respectively.
During fiscal 2017, the Company was able to make a reasonable estimate of the impact of the Tax Cuts and Jobs Act of 2017, including the reduction in the corporate tax rate and the provisions related to executive compensation and 100% bonus depreciation on qualifying property. Following the guidance of the U.S. Securities and Exchange Commission’s Staff Accounting Bulletin No. 118, any adjustments to the Company’s estimates within a one-year measurement period were reported as a component of income tax expense in fiscal 2018. The Company did not make any adjustments to the estimates recorded in fiscal 2017.
A reconciliation of the beginning and ending gross amounts of unrecognized tax benefit are as follows:
| Year Ended | ||||||||||||
December 26, 2019 | December 27, 2018 | December 28, 2017 | ||||||||||
| (in thousands) | ||||||||||||
| Balance at beginning of year | $ | – | $ | 102 | $ | 414 | ||||||
| Increases due to: | ||||||||||||
| Tax positions taken in prior years | – | – | – | |||||||||
| Tax positions taken in current year | – | – | – | |||||||||
| Decreases due to: | ||||||||||||
| Tax positions taken in prior years | – | – | – | |||||||||
| Settlements with taxing authorities | – | (102 | ) | – | ||||||||
| Lapse of applicable statute of limitations | – | – | (312 | ) | ||||||||
| Balance at end of year | $ | – | $ | – | $ | 102 | ||||||
| 85 |
The Marcus Corporation
Notes to Consolidated Financial Statements
11. Income Taxes (continued)
During fiscal 2018, the Company settled a dispute with a state taxing authority and no longer carries an unrecognized tax benefit as of December 27, 2018. The Company’s total unrecognized tax benefit that, if recognized, would affect the Company’s effective tax rate was $67,000 as of December 28, 2017. The Company had no accrued interest or penalties at December 26, 2019 or December 27, 2018. The Company classifies interest and penalties relating to income taxes as income tax expense. For the year ended December 26, 2019, $1,000 of interest income was recognized in the statement of earnings, compared to $68,000 of interest income for the year ended December 27, 2018, and $50,000 of interest expense for the year ended December 28, 2017.
During fiscal 2018, the Company settled, with no change, an examination by the Internal Revenue Service of its income tax return for the 31 weeks ended December 31, 2015. The Company’s federal income tax returns are no longer subject to examination prior to fiscal 2016. With certain exceptions, the Company’s state income tax returns are no longer subject to examination prior to fiscal 2016. At this time, the Company does not expect the results from any income tax audit or appeal to have a significant impact on the Company’s financial statements.
The Company does not expect its unrecognized tax benefits to change significantly over the next 12 months.
12. Commitments and License Rights
Commitments - The Company has commitments for the completion of construction at various properties totaling approximately $2,243,000 at December 26, 2019.
License Rights – As of December 26, 2019, the Company had license rights to operate three hotels using the Hilton trademark and two hotels using the Marriott trademark. Under the terms of the licenses, the Company is obligated to pay fees based on defined gross sales.
13. Joint Venture Transactions
At December 26, 2019 and December 27, 2018, the Company held investments with aggregate carrying values of $3,593,000 and $4,069,000, respectively, in several joint ventures, one of which is accounted for under the equity method, and two of which are investments in equity investments without readily determinable fair values.
| 86 |
The Marcus Corporation
Notes to Consolidated Financial Statements
14. Business Segment Information
The Company evaluates performance and allocates resources based on the operating income (loss) of each segment. The accounting policies of the reportable segments are the same as those described in the summary of significant accounting policies.
Following is a summary of business segment information for fiscal 2019, fiscal 2018 and fiscal 2017:
Theatres | Hotels/ Resorts | Corporate Items |
Total | |||||||||||||
| (in thousands) | ||||||||||||||||
| Fiscal 2019 | ||||||||||||||||
| Revenues | $ | 557,080 | $ | 263,350 | $ | 433 | $ | 820,863 | ||||||||
| Operating income (loss) | 76,903 | 10,050 | (18,762 | ) | 68,191 | |||||||||||
| Depreciation and amortization | 51,202 | 20,430 | 645 | 72,277 | ||||||||||||
| Assets | 953,299 | 337,206 | 68,681 | 1,359,186 | ||||||||||||
| Capital expenditures and acquisitions | 61,604 | 31,783 | 780 | 94,167 | ||||||||||||
| Fiscal 2018 | ||||||||||||||||
| Revenues | $ | 446,804 | $ | 259,892 | $ | 424 | $ | 707,120 | ||||||||
| Operating income (loss) | 88,790 | 12,480 | (18,081 | ) | 83,189 | |||||||||||
| Depreciation and amortization | 38,760 | 22,229 | 353 | 61,342 | ||||||||||||
| Assets | 624,512 | 306,162 | 58,657 | 989,331 | ||||||||||||
| Capital expenditures and acquisitions | 43,568 | 14,931 | 161 | 58,660 | ||||||||||||
| Fiscal 2017 | ||||||||||||||||
| Revenues | $ | 403,431 | $ | 249,564 | $ | 557 | $ | 653,552 | ||||||||
| Operating income (loss) | 80,447 | 12,895 | (16,035 | ) | 77,307 | |||||||||||
| Depreciation and amortization | 33,448 | 17,912 | 359 | 51,719 | ||||||||||||
| Assets | 637,723 | 313,942 | 66,132 | 1,017,797 | ||||||||||||
| Capital expenditures and acquisitions | 93,676 | 20,604 | 524 | 114,804 | ||||||||||||
Corporate items include amounts not allocable to the business segments. Corporate revenues consist principally of rent and the corporate operating loss includes general corporate expenses. Corporate information technology costs and accounting shared services costs are allocated to the business segments based upon several factors, including actual usage and segment revenues. Corporate assets primarily include cash and cash equivalents, furniture, fixtures and equipment, investments and land held for development.
| 87 |
The Marcus Corporation
Notes to Consolidated Financial Statements
15. Unaudited Quarterly Financial Information (in thousands, except per share data)
| 13 Weeks Ended | ||||||||||||||||
| Fiscal 2019 | March 28, 2019 | June 27, 2019 | September 26, 2019 | December 26, 2019 | ||||||||||||
| Revenues | $ | 170,039 | $ | 232,500 | $ | 211,462 | $ | 206,862 | ||||||||
| Operating income | 4,950 | 27,475 | 22,387 | 13,379 | ||||||||||||
| Net earnings attributable to The Marcus Corporation | 1,860 | 18,066 | 14,289 | 7,802 | ||||||||||||
| Net earnings per common share – diluted | $ | 0.06 | $ | 0.58 | $ | 0.46 | $ | 0.25 | ||||||||
| 13 Weeks Ended | ||||||||||||||||
| Fiscal 2018 | March 29, 2018 | June 28, 2018 | September 27, 2018 | December 27, 2018 | ||||||||||||
| Revenues | $ | 168,191 | $ | 193,298 | $ | 170,599 | $ | 175,032 | ||||||||
| Operating income | 17,016 | 29,107 | 22,413 | 14,653 | ||||||||||||
| Net earnings attributable to The Marcus Corporation | 9,821 | 18,619 | 16,231 | 8,720 | ||||||||||||
| Net earnings per common share – diluted | $ | 0.35 | $ | 0.65 | $ | 0.56 | $ | 0.30 | ||||||||
| 88 |
| Item 9. | Changes in and Disagreements With Accountants on Accounting and Financial Disclosure. |
None.
| Item 9A. | Controls and Procedures. |
(a) Evaluation of disclosure controls and procedures.
Based on their evaluations, as of the end of the period covered by this Annual Report on Form 10-K, our principal executive officer and principal financial officer have concluded that our disclosure controls and procedures (as defined in Rules 13a-15(e) and 15d-15(e) under the Securities Exchange Act of 1934 (the “Exchange Act”)) are effective to ensure that information required to be disclosed by us in reports that we file or furnish under the Exchange Act is accumulated and communicated to our management and recorded, processed, summarized and reported within the time periods specified in Securities and Exchange Commission rules and forms.
(b) Management’s report on internal control over financial reporting.
The report of management required under this Item 9A is contained in the section titled “Item 8 – Financial Statements and Supplementary Data” under the heading “Management’s Report on Internal Control over Financial Reporting.”
(c) Attestation Report of Independent Registered Public Accounting Firm.
The attestation report required under this Item 9A is contained in the section titled “Item 8 – Financial Statements and Supplementary Data” under the heading “Report of Independent Registered Public Accounting Firm on Internal Control over Financial Reporting.”
(d) Changes in internal control over financial reporting.
There were no changes in our internal control over financial reporting identified in connection with the evaluation required by Rule 13a-15(b) of the Exchange Act during the fourth quarter of our fiscal 2019 that has materially affected, or is reasonably likely to materially affect, our internal control over financial reporting.
PART III
| Item 10. | Directors, Executive Officers and Corporate Governance. |
The information required by Item 10 is incorporated herein by reference to the relevant information set forth under the captions “Election of Directors,” “Board of Directors and Corporate Governance” and “Delinquent Section 16(a) Reports” in the definitive Proxy Statement for our 2020 Annual Meeting of Shareholders scheduled to be held on May 6, 2020 (our “Proxy Statement”). Information regarding our executive officers may be found in Part I of this Form 10-K under the caption “Executive Officers of the Company.” Except as otherwise specifically incorporated by reference, our Proxy Statement is not deemed to be filed as part of this Form 10-K.
| Item 11. | Executive Compensation. |
The information required by Item 11 is incorporated herein by reference to the relevant information set forth under the caption “Compensation Discussion and Analysis” in our Proxy Statement.
| 89 |
| Item 12. | Security Ownership of Certain Beneficial Owners and Management and Related Shareholder Matters. |
The following table lists certain information about our two stock option plans, our 1995 Equity Incentive Plan and our 2004 Equity and Incentive Awards Plan, all of which were approved by our shareholders. We do not have any equity-based compensation plans that have not been approved by our shareholders.
| Number
of securities to be issued upon the exercise of outstanding options, warrants and rights | Weighted-average exercise price of outstanding options, warrants and rights | Number
of securities remaining available for future issuance under current equity compensation plan (excluding securities reflected in the first column) | ||||||||
| 1,641,000 | $25.46 | 589,000 | ||||||||
The other information required by Item 12 is incorporated herein by reference to the relevant information set forth under the caption “Stock Ownership of Management and Others” in our Proxy Statement.
| Item 13. | Certain Relationships and Related Transactions, and Director Independence. |
The information required by Item 13, to the extent applicable, is incorporated herein by reference to the relevant information set forth under the caption “Policies and Procedures Governing Related Person Transactions” in our Proxy Statement.
| Item 14. | Principal Accounting Fees and Services. |
The information required by Item 14 is incorporated by reference herein to the relevant information set forth under the caption “Other Matters” in our Proxy Statement.
PART IV
| Item 15. | Exhibits and Financial Statement Schedules. |
(a)(1) Financial Statements.
The information required by this item is set forth in “Item 8 – Financial Statements and Supplementary Data” above.
(a)(2) Financial Statement Schedules.
All schedules are omitted because they are inapplicable, not required under the instructions or the financial information is included in the consolidated financial statements or notes thereto.
(a)(3) Exhibits.
The exhibits filed herewith or incorporated by reference herein are set forth on the attached Exhibit Index. Exhibits to this Form 10-K will be furnished to shareholders upon advance payment of a fee of $0.25 per page, plus mailing expenses. Requests for copies should be addressed to Thomas F. Kissinger, Senior Executive Vice President, General Counsel and Secretary, The Marcus Corporation, 100 East Wisconsin Avenue, Suite 1900, Milwaukee, Wisconsin 53202-4125.
| 90 |
EXHIBIT INDEX
| 91 |
| 92 |
| 93 |
| 101 | The following materials from The Marcus Corporation’s Annual Report on Form 10-K for the fiscal year ended December 26, 2019 are filed herewith, formatted in XBRL (Extensible Business Reporting Language): (i) the Consolidated Balance Sheets, (ii) the Consolidated Statements of Earnings, (iii) the Consolidated Statements of Comprehensive Income, (iv) the Consolidated Statements of Cash Flows, and (v) Notes to Consolidated Financial Statements. |
* This exhibit is a management contract or compensatory plan, contract or arrangement in which a director or named executive officer of the Company participated.
| Item 16. | Form 10-K Summary. |
None.
| 94 |
SIGNATURES
Pursuant to the requirements of Section 13 of the Securities Exchange Act of 1934, the registrant has duly caused this report to be signed on its behalf by the undersigned, thereunto duly authorized.
THE MARCUS CORPORATION
| Date: February 24, 2020 | By: | /s/ Gregory S. Marcus |
| Gregory S. Marcus, | ||
| President and Chief Executive Officer | ||
Pursuant to the requirements of the Securities Exchange Act of 1934, this report has been signed below by the following persons on behalf of us and in the capacities as of the date indicated above.
| By: | /s/ Gregory S. Marcus | By: | /s/ Diane Marcus Gershowitz | |
| Gregory S. Marcus, President and Chief Executive Officer (Principal Executive Officer) and Director | Diane Marcus Gershowitz, Director | |||
| By: | /s/ Douglas A. Neis | By: | /s/ Timothy E. Hoeksema | |
Douglas A. Neis, Executive Vice President, Chief Financial Officer and Treasurer (Principal Financial Officer and Accounting Officer) |
Timothy E. Hoeksema, Director |
| By: | /s/ Stephen H. Marcus | By: | /s/ Allan H. Selig | |
| Stephen H. Marcus, Chairman and Director | Allan H. Selig, Director | |||
| By: | /s/ Philip L. Milstein | By: | /s/ Brian J. Stark | |
| Philip L. Milstein, Director | Brian J. Stark, Director | |||
| By: | /s/ Bruce J. Olson | By: | /s/ David M. Baum | |
| Bruce J. Olson, Director | David M. Baum, Director | |||
| By: | /s/ Katherine M. Gehl | |||
| Katherine M. Gehl, Director |
| S-1 |