Attached files
| file | filename |
|---|---|
| EX-32.1 - EXHIBIT 32.1 - CHANNELADVISOR CORP | ecom20191231ex321.htm |
| EX-31.2 - EXHIBIT 31.2 - CHANNELADVISOR CORP | ecom20191231ex312.htm |
| EX-31.1 - EXHIBIT 31.1 - CHANNELADVISOR CORP | ecom20191231ex311.htm |
| EX-23.1 - EXHIBIT 23.1 - CHANNELADVISOR CORP | ecom20191231ex231.htm |
| EX-21.1 - EXHIBIT 21.1 - CHANNELADVISOR CORP | ecom20191231ex211.htm |
| EX-10.18 - EXHIBIT 10.18 - CHANNELADVISOR CORP | ecom20191231ex1018.htm |
| EX-10.8 - EXHIBIT 10.8 - CHANNELADVISOR CORP | ecom20191231ex108.htm |
| EX-4.2 - EXHIBIT 4.2 - CHANNELADVISOR CORP | ecom20191231ex42.htm |
UNITED STATES
SECURITIES AND EXCHANGE COMMISSION
WASHINGTON, D.C. 20549
_____________________________________
FORM 10-K
(Mark one)
x | ANNUAL REPORT PURSUANT TO SECTION 13 OR 15(d) OF THE SECURITIES EXCHANGE ACT OF 1934 For the fiscal year ended December 31, 2019 |
or
☐ | TRANSITION REPORT PURSUANT TO SECTION 13 OR 15(d) OF THE SECURITIES EXCHANGE ACT OF 1934 For the transition period from ____ to ____ |
Commission file number 001-35940
CHANNELADVISOR CORPORATION
(Exact name of Registrant as specified in its charter)
Delaware | 56-2257867 | |
(State or other jurisdiction of incorporation or organization) | (IRS Employer Identification No.) | |
3025 Carrington Mill Boulevard Morrisville, NC | 27560 | |
(Address of principal executive offices) | (Zip Code) | |
Registrant's telephone number, including area code: (919) 228-4700
Securities registered pursuant to Section 12(b) of the Act:
Title of Each Class | Trading Symbol | Name of Each Exchange on which Registered |
Common Stock, $0.001 par value | ECOM | New York Stock Exchange |
Securities registered pursuant to Section 12(g) of the Act: None
_____________________________________
Indicate by check mark if the registrant is a well-known seasoned issuer, as defined in Rule 405 of the Securities Act. ☐ Yes x No
Indicate by check mark if the registrant is not required to file reports pursuant to Section 13 or Section 15(d) of the Act. ☐ Yes x No
Indicate by check mark whether the registrant (1) has filed all reports required to be filed by Section 13 or 15(d) of the Securities Exchange Act of 1934 during the preceding 12 months (or for such shorter period that the registrant was required to file such reports), and (2) has been subject to such filing requirements for the past 90 days. x Yes ☐ No
Indicate by check mark whether the registrant has submitted electronically every Interactive Data File required to be submitted pursuant to Rule 405 of Regulation S-T (§232.405 of this chapter) during the preceding 12 months (or for such shorter period that the registrant was required to submit such files). x Yes ☐ No
Indicate by check mark whether the registrant is a large accelerated filer, an accelerated filer, a non-accelerated filer, a smaller reporting company, or an emerging growth company. See definitions of "large accelerated filer," "accelerated filer," "smaller reporting company" and "emerging growth company" in Rule 12b-2 of the Exchange Act.
Large accelerated filer | ☐ | Accelerated filer | x | ||||
Non-accelerated filer | ☐ | Smaller reporting company | ☐ | ||||
Emerging growth company | ☐ | ||||||
If an emerging growth company, indicate by check mark if the registrant has elected not to use the extended transition period for complying with any new or revised financial accounting standards provided pursuant to Section 13(a) of the Exchange Act. ☐
Indicate by check mark whether the registrant is a shell company (as defined in Rule 12b-2 of the Exchange Act). ☐ Yes x No
The aggregate market value of ChannelAdvisor Corporation voting and non-voting common equity held by non-affiliates as of June 28, 2019 (the last business day of the registrant's most recently completed second fiscal quarter) based on the closing sale price of $8.76 as reported on the New York Stock Exchange on that date was $233,992,284.
At February 1, 2020, 28,082,503 shares of ChannelAdvisor Corporation Common Stock, $0.001 par value, were outstanding.
DOCUMENTS INCORPORATED BY REFERENCE
Portions of the Company's definitive proxy statement, to be filed pursuant to Regulation 14A under the Securities Exchange Act of 1934, for its 2020 Annual Meeting of Stockholders are incorporated by reference in Part III of this Form 10-K.
SPECIAL NOTE REGARDING FORWARD-LOOKING STATEMENTS
This Annual Report on Form 10-K (this "Annual Report") contains forward-looking statements within the meaning of Section 27A of the Securities Act of 1933, as amended, or the Securities Act, and Section 21E of the Securities Exchange Act of 1934, as amended, or the Exchange Act, that involve substantial risks and uncertainties. The forward-looking statements are contained principally in Part I, Item 1. "Business," Part I, Item 1A. "Risk Factors," and Part II, Item 7. "Management's Discussion and Analysis of Financial Condition and Results of Operations," but are also contained elsewhere in this Annual Report. In some cases, you can identify forward-looking statements by the words "may," "might," "will," "could," "would," "should," "expect," "intend," "plan," "objective," "anticipate," "believe," "estimate," "predict," "project," "potential," "continue" and "ongoing," or the negative of these terms, or other comparable terminology intended to identify statements about the future. These statements involve known and unknown risks, uncertainties and other factors that may cause our actual results, levels of activity, performance or achievements to be materially different from the information expressed or implied by these forward-looking statements. Although we believe that we have a reasonable basis for each forward-looking statement contained in this Annual Report, we caution you that these statements are based on a combination of facts and factors currently known by us and our expectations of the future, about which we cannot be certain. Forward-looking statements include statements about:
• | the growth of the e-commerce industry and the software-as-a-service, or SaaS, enterprise application software market in general and particularly in our markets; |
• | the expected growth of gross merchandise value, or GMV, sold on marketplaces and comparison shopping websites and advertising dollars spent on paid search; |
• | consumer adoption of mobile devices and usage for commerce; |
• | the growth of social networking and commerce applications; |
• | sellers' online sales strategies and fulfillment models; |
• | our growth strategy; and |
• | our beliefs about our capital expenditure requirements and that our capital resources will be sufficient to meet our anticipated cash requirements through at least the next 12 months. |
You should refer to Item 1A. "Risk Factors" section of this Annual Report for a discussion of important factors that may cause our actual results to differ materially from those expressed or implied by our forward-looking statements. As a result of these factors, we cannot assure you that the forward-looking statements in this Annual Report will prove to be accurate. Furthermore, if our forward-looking statements prove to be inaccurate, the inaccuracy may be material. In light of the significant uncertainties in these forward-looking statements, you should not regard these statements as a representation or warranty by us or any other person that we will achieve our objectives and plans in any specified time frame, or at all. We undertake no obligation to publicly update any forward-looking statements, whether as a result of new information, future events or otherwise, except as required by law. You should, therefore, not rely on these forward-looking statements as representing our views as of any date subsequent to the date of this Annual Report.
1
TABLE OF CONTENTS
Page | ||
2
PART I
ITEM 1. BUSINESS
OVERVIEW
Our mission is to connect and optimize the world's commerce. Our proprietary software-as-a-service, or SaaS, cloud platform helps brands and retailers worldwide improve their online performance by expanding sales channels, connecting with consumers around the world, optimizing their operations for peak performance and providing actionable analytics to improve competitiveness. More specifically, our suite of solutions allows our customers to manage their product listings, inventory availability, pricing optimization, search terms, orders and fulfillment, and other critical functions across these channels. Our customers utilize our platform to connect with new and existing sources of demand for their products through hundreds of channels, including Amazon, eBay, Facebook, Google and Walmart. Our fulfillment solution makes it easier for customers to connect to their supply chain, which could include distributors, manufacturers and third-party logistics providers. We also offer solutions that allow brands to send their web visitors or digital marketing audiences directly to authorized resellers and to gain insight into consumer behavior. Overall, our platform delivers significant breadth, scalability and flexibility and facilitates billions of dollars in e-commerce transactions annually across the globe.
We serve customers across a wide range of industries and geographies. Our customers include the online businesses of brands and retailers, as well as advertising agencies that use our solutions on behalf of their clients.
E-commerce has grown significantly over the last several years, as consumers have increasingly shifted their retail purchases from traditional brick-and-mortar stores to online stores and marketplaces. This growth has been due to a number of factors, including:
•availability of a broader selection of merchandise online;
•consumer convenience and ease of use;
•more competitive and transparent pricing;
•increased functionality and reliability of e-commerce websites;
•convenience and speed of order fulfillment;
•broad use of mobile connected devices for e-commerce; and
•proliferation of specialized websites and online distribution channels.
As a result of these factors, consumers today have more options than ever before to discover, research and purchase products online.
While these e-commerce growth drivers create significant opportunity for brands and retailers, they also create additional complexity and challenges. Brands and retailers seeking new avenues to expand their online sales must manage product data and transactions across hundreds of highly fragmented online channels where data attributes vary, requirements change frequently and the pace of innovation is rapid and increasing. Speed of order fulfillment is becoming increasingly strategic to winning consumers' business. There are a significant number of fulfillment service providers around the world, each with different technological capabilities and communication requirements.
We address these challenges by offering brands and retailers SaaS solutions that enable them to integrate, manage and optimize their merchandise sales across these disparate online channels. In addition, we facilitate improved collaboration between brands and their authorized resellers through solutions that deliver high value leads from brands to those resellers. We generate the majority of our revenue from our customers' usage of our SaaS solutions, which are organized into modules. Each module integrates with a particular type of channel, such as third-party marketplaces, digital marketing websites and authorized reseller websites. Using our solutions, customers can:
•connect with new channels and more easily integrate with channels they already use;
•access online sources of consumer demand, such as social networks and mobile devices;
3
•adapt to the frequently changing policies and requirements of each channel;
•manage real-time inventory allocation and availability across channels;
•implement dynamic pricing and promotion strategies across channels;
•efficiently manage, evaluate and optimize customer traffic to their own e-commerce websites;
•connect to fulfillment and logistics providers on a global scale;
•more easily sell into new geographic territories worldwide;
• | provide a seamless consumer journey from brand websites and digital marketing campaigns to the e-commerce sites and physical stores of authorized resellers; |
• | reduce dependence on in-house information technology staff and avoid significant up-front capital expenses; and |
• | access in real-time the latest product and software upgrades that we regularly release on our SaaS platform to keep up with the rapid pace of change and innovation in the market. |
We derive our revenue primarily from subscription fees paid to us by our customers for usage of our platform for a specified contract term, which is usually one year. The majority of our subscription fee is based on the amount of a customer's GMV processed on our platform. Our subscription fee may also be based on the amount of advertising spend processed on our platform. A portion of the GMV-based or advertising spend-based subscription fee is typically fixed and is based on a specified minimum amount of GMV or advertising spend that a customer expects to process through our platform. The remaining portion of GMV-based or advertising spend-based subscription fee is typically variable and is based on a specified percentage of GMV or advertising spend processed through our platform that exceeded the customer's specified minimum GMV or advertising spend amount. We believe that our pricing model aligns our interests with those of our customers. We also receive implementation fees, which may include fees for providing launch assistance and training.
INDUSTRY BACKGROUND
Increasing complexity and fragmentation for brands and retailers selling online
E-commerce is a large and global market that continues to expand as brands and retailers continue to increase their online sales. However, it is also an increasingly complex and fragmented market due to the hundreds of channels available to brands and retailers and the rapid pace of change and innovation across those channels. Historically, a brand or retailer might have simply established an online storefront and used a basic paid search program to drive traffic to its website. Today, in order to gain consumers' attention in a more crowded and competitive online marketplace, an increasing number of brands and many retailers sell their merchandise through multiple online channels, each with its own rules, requirements and specifications. In addition, brands and retailers often seek to sell their products in multiple countries, each with its own local consumer preferences and behaviors.
Several significant trends have contributed to this increasing complexity and fragmentation, including:
• | Emergence and growth of online third-party marketplaces. Third-party marketplaces, which are marketplaces that aggregate many sellers, are an increasingly important driver of growth for a number of large online retailers. Some of these marketplaces, such as Amazon, offer products from their own inventory, known as first-party products, as well as products sold by others, known as third-party products; other marketplaces, such as eBay, offer only third-party products. In addition, several of the largest traditional brick-and-mortar retailers, including Albertsons, Target, Urban Outfitters and Walmart, have incorporated third-party marketplaces into their online storefronts, allowing other brands and retailers to market their products to consumers they might not otherwise reach. |
• | Mainstream adoption of mobile devices for e-commerce. Smartphones enable new consumer shopping behaviors, such as in-store barcode scanning to find online promotions, better pricing or alternative products. While benefiting consumers by increasing the transparency and accessibility of e-commerce, the proliferation of mobile devices and mobile commerce requires brands and retailers to build additional device-specific optimization and functionality into their websites, increasing the complexity of managing their online presences. |
4
• | Growth of additional online consumer touch points. As consumers have moved more of their shopping and product discovery online, search engines, social networks and certain comparison shopping sites such as Google Shopping, as well as brand websites, have emerged as key influencers and important points of product research for consumers making purchase decisions. |
• | Changing e-commerce landscape. In an effort to stay relevant to consumers, the large e-commerce platforms are expanding their offerings. Third-party marketplaces are monetizing their significant online traffic through search advertising, while traditional search engines and social networks are adding marketplace capabilities. The result is that brands and retailers need to have additional skills, tools and competencies to compete in this increasingly complex world. |
• | Expansion of the global e-commerce ecosystem. The increasingly global e-commerce ecosystem presents opportunities for brands and retailers to extend their online presence through country or region specific marketplaces, such as Alibaba in Asia, Zalando in the European Union, MercadoLibre in Latin America and Catch in Australia. Conversely, the growth of marketplaces such as Amazon into new countries is driving selling opportunities for brands and retailers to sell to a broader, global audience. |
• | Widespread use of social networking and commerce applications. The rapid growth of social networking and commerce applications provides a valuable channel through which brands and retailers can connect to consumers. |
• | Increase in brands' participation in direct-to-consumer e-commerce. With the rise of Amazon and the struggles of some traditional retail partners, more brands are exploring or participating in direct-to-consumer online sales using their own websites and/or third-party marketplaces. The shift to direct-to-consumer online sales is forcing brands to enhance their logistics and fulfillment capabilities compared to the traditional brick-and-mortar retail model. However, because those traditional retail partners still represent a majority of revenue for brands, many brands desire solutions that allow collaboration with those partners in addition to direct-to-consumer solutions. |
Challenges with alternative e-commerce solutions
The fragmentation and increasing complexity of e-commerce channels are placing greater demands on brands and retailers that seek to grow their online sales. These brands and retailers require solutions that will enable them to easily integrate their product offerings and inventory across multiple online channels. Traditional solutions, however, typically suffer from several limitations, including the following:
• | In-house solutions are costly and may be slow to adapt to industry change and innovation. To maintain pace with the speed of change and innovation of online channels, brands and retailers that rely on in-house capabilities are required to invest in and maintain significant technological infrastructure, human resources and industry relationships. Successful in-house solutions may typically require longer periods of setup time, substantial up-front capital expenditures and significant ongoing maintenance expense. |
• | Point solutions are limited in functionality and channels supported. There are numerous narrowly tailored, or point, solutions available for brands and retailers to help them manage single online channels or a single category of channels, but these point solutions often do not address the needs of brands and retailers seeking to manage pricing and inventory across multiple channels through a single, unified platform. |
• | Solutions provided by the channels are not aligned with customers' broader online goals. Most online channels offer their own solutions that help brands and retailers connect with their specific channel and provide basic inventory control and data reporting functionality. By their very nature, however, these solutions are not channel independent and cannot help customers coordinate or optimize their online sales across the multiple online avenues available to them. As with point solutions, brands and retailers must work with disparate third-party providers to connect with a broad array of channels, which requires significant time and costs. |
• | Neither in-house nor point solutions adequately address fulfillment requirements, leading to error-prone processes. In-house and point solutions tend to focus on point-to-point connectivity from channels to enterprise resource planning, with separate resources focusing on enterprise resource planning to fulfillment. This design leads to a disconnected experience, decreasing speed of fulfillment and increasing risk of product being out of stock. Slower fulfillment and delayed shipments negatively impact customer satisfaction and online sales. |
5
SaaS solutions generally offer customers several distinct advantages over traditional in-house models, known as on-premises solutions, including lower upfront and ongoing costs, faster speed of implementation and less reliance on internal IT staff.
THE CHANNELADVISOR SOLUTION
Our suite of SaaS solutions allows our customers to more easily integrate, manage and optimize their online sales across hundreds of available channels through a single, integrated platform. Our suite of solutions includes a number of individual offerings, or modules. Each module integrates with a particular type of channel, such as third-party marketplaces, digital marketing websites or authorized reseller websites, or supports specific online functionality aimed at customers wanting to enhance the effectiveness of their existing online storefronts or employing rich media solutions on their websites.
Using our cloud-based platform, customers can connect to multiple, disparate channels through a single, user-friendly solution instead of separately integrating with each channel. We provide a single code base and multi-tenant architecture for our platform customers, which means that all platform customers operate on the same version of our software and we do not customize our products for individual platform customers. We provide our customers with access to new and existing online channels and new sources of demand for their products, which can ultimately lead to increased revenue for our customers.
We believe our suite of solutions offers the following key benefits for our customers:
• | Single, fully integrated solution. Through our SaaS platform, we provide our platform customers with a single web-based interface as the central location for them to control, analyze and manage their online sales across hundreds of available channels and multiple geographies. This unified view enables our customers to more cost-effectively manage product listings, inventory availability, pricing optimization, fulfillment, search terms, data analytics and other critical functions across channels based on the customer's specified rules and performance metrics in order to drive traffic and increase revenue. |
• | Reduced integration costs, time to market and dependence on in-house resources. Customers can more easily and quickly introduce their products, both to channels on which they already have a presence and to new channels, without the costs related to installing and maintaining their own hardware and software infrastructure. A customer's initial installation and integration of our solutions can often be completed in less than two months, with additional modules of our software generally available immediately without incurring significant additional resources to integrate. We manage and host our solutions on behalf of our customers, thereby reducing the customer's cost and dependency on dedicated IT staff or on-premises systems. |
• | Scalable technology platform. The scalability of our platform allows us to quickly and efficiently support an increasing number of product listings and transactions processed through our platform as we add new customers, integrate new channels and accommodate seasonal surges in consumer demand. |
• | Flexibility to adapt and instantaneous access to our most up-to-date capabilities. Channels frequently update their product information requirements, policies, merchandising strategies and integration specifications, requiring customers to frequently revise their product listings, attributes, business rules and possibly even their overall online business strategies. Without the ability to quickly adapt to these changes, customers risk suspension or removal from a marketplace and loss of revenue. Through our single code base and multi-tenant architecture, we provide platform customers the latest channel updates through regular product upgrades. When we develop and deploy new features, functions and capabilities, or make changes to keep up with the changing priorities and requirements of each channel, our customers simultaneously benefit from those new capabilities and changes. |
• | Data and reporting analytics. Through our data and reporting analytics, we provide our customers with insight into the latest channel and consumer trends and general product performance. Our dashboards highlight sales trends, top performing products, seller reputation and repricing activity, among other key performance indicators, and alert customers to issues and errors in product listings. These capabilities provide actionable insights that allow customers to evaluate and, if necessary, improve the efficiency of their business rules on existing or new channels. Additionally, our solution provides brands with insights about online assortment, product coverage gaps, pricing trends and adherence by their retailers to content guidelines. |
We offer our platform customers the choice of self-service accounts or managed-service accounts. Self-service customers operate our software themselves, while managed-service customers generally outsource most or all of the management of one or more channels to our professional services team, which then operates our software on the customer's behalf based on the customer's instructions.
6
OUR PRODUCTS
The ChannelAdvisor Platform
We automate the workflow through which brands and retailers manage their sales through online channels. Our suite of solutions includes the following key capabilities:
• | Product catalog, inventory and order management. We provide a platform for our customers to upload and modify their product catalog data, monitor inventory stock levels and create a single inventory feed that serves multiple available online channels. Managing inventory and order data is the foundation for much of the customer activity on our platform. We offer a variety of ways for customers to enter and modify product data, including through a sophisticated user interface, file exchange and application programming interfaces, or APIs. Our platform is capable of scaling to support thousands of customers during critical selling periods, such as the year-end holiday season. The flexibility of the system allows each customer to customize the product catalog data specific to its products, such as size, color, height and width, and to vary the format of the data to meet the specific requirements of each channel. Our platform provides various features that allow a customer to list products on multiple channels while mitigating the risk of overselling. These features include the ability to allocate inventory across channels, set buffer quantities to avoid overselling and receive automatic updates based on changes to the customer's inventory. |
• | Product matching. Once inventory is loaded into the platform, we provide features that improve our customer's ability to successfully list its products on the various channels. Depending on the needs of the particular channel, we are able to pre-validate the customer's data and formats before sending them to the channel, reducing errors caused by poor data quality and thus reducing the time it takes to list products on that channel. On some channels, we employ advanced product-matching algorithms that are designed to accurately place the customer's product offerings within the channel's product classification taxonomy. |
• | Business rules and templates. Our platform offers tools that enable a customer to develop and manage sophisticated business rules and product listing templates that automatically determine how a product will be displayed and when it will be available for purchase in each channel. Through a single interface, a platform customer can utilize these tools to customize product listing descriptions across various channels using different attributes, such as price, brand, category and shipping weight. Features such as these allow customers to automatically advertise millions of products on multiple channels while ensuring accuracy of product availability, optimizing price and managing to specific margin thresholds, all at an individual product level. |
• | Price optimization. Our platform provides customers the ability to dynamically price their products across some of our available channels based on a number of factors, such as prices of competitors, margin thresholds, historical product sales and current promotions. Prices can vary by channel and, using our sophisticated technology, a customer can automatically update pricing based on the competitive environment. The customer avoids the manual effort of monitoring the competition and changing prices, while preserving the ability to remain price competitive. Our Algorithmic Repricer offers predictive analytics and machine learning that may help our customers make more sales while maximizing margin. |
• | Advertising management. Our platform provides customers the ability to create, manage and evaluate advertising across multiple channels. Advertising formats, which can vary and often change, are associated with numerous channels including search engines, social networks and marketplaces. By providing a unified platform to manage advertising, our customers are able to manage advertisements across a large number of channels more efficiently. Additionally, features such as an automated bid manager provide automation that updates bids based on the customer's goals and performance. |
• | Fulfillment. Our platform supports fulfillment and logistics capabilities that automate order management for our customers by connecting online storefronts and marketplaces to distribution, fulfillment and logistics providers around the globe. Our fulfillment features include automated inventory updates, cost updates and shipment notifications, automated product mapping, the ability to optimize how an order is fulfilled based on the preferences of our customers and the availability of products at different fulfillment locations, and shipping label generation. Our platform also provides valuable analytics for fulfillment performance such as average fulfillment time by fulfillment vendor. Our fulfillment capabilities are enhanced by strategic partnerships with leading players in logistics and fulfillment, including DHL, FedEx, Pitney Bowes, ShipStation and UPS. These capabilities are available in a single, unified experience. |
7
• | Proprietary reporting and analytics. We provide proprietary reporting and analytics capabilities that allow our customers to view general product performance and trends affecting their consumer base across multiple channels and to obtain detailed performance data at a channel or stock-keeping unit level that can be used in a particular online sales campaign. Our dashboards highlight sales trends, top performing products, seller reputation and repricing activity, among other key performance indicators. The dashboards also alert customers to issues or errors, such as data that is in a form inconsistent with the requirements of a particular channel. These capabilities provide actionable insights that allow customers to revise their business rules and listings on a real-time basis with the goal of improving their sales and profitability. |
• | Developer ecosystem. We offer third-party developers of complementary e-commerce solutions access to our platform through APIs. These APIs enable these third-party developers to build connections to our platform that meet their specific needs without requiring us to offer customized software code to them. We currently provide APIs to hundreds of third-party developers who have integrated their solutions with ours. For example, our API integrates our platform with business software provided by NetSuite, a provider of SaaS enterprise resource planning, customer relationship management and e-commerce solutions, to further streamline our joint customers’ e-commerce operations. |
Individual Modules
We offer our software suite to customers through a series of modules. Generally, each of our modules is priced individually and is integrated with our platform's underlying inventory management system, templates, rules and reporting systems. The primary modules we offer are:
• | Marketplaces. Our Marketplaces module connects customers to third-party marketplaces including Amazon, eBay, Google, Newegg, Overstock.com, Rakuten, Target, TradeMe, Walmart and Zalando. Our standardized integration API, which we refer to as Access ChannelAdvisor, allows additional e-commerce channels to integrate with our platform requiring less support on launch, which we believe will result in a broader array of channels available to our customers. In addition, our platform provides our customers with access to advertising programs and advanced competitive features on major marketplaces to allow them to compete more effectively. |
• | Digital Marketing. Our Digital Marketing module connects customers to comparison shopping websites such as Google Shopping and Shopzilla, allows customers to advertise products on search engines such as Google and Microsoft's Bing, connects customers to social commerce sites such as Facebook, Instagram and Pinterest and supports advertising programs on some marketplaces such as Amazon and eBay. Our Digital Marketing module also allows customers to generate and send customized product data feeds to their partners, such as affiliate networks, retargeting vendors, personalization vendors and product review platforms. |
• | Where to Buy. Our Where to Buy solution allows brands to provide their web visitors or digital marketing audiences with up-to-date information about the authorized resellers that carry their products and the availability of those products online, as well as the ability to identify offline retailers that generally carry those products. This provides consumers with an easier path to purchase from an authorized reseller of their choice. The solution improves the consumer experience and helps brands gain a better understanding of consumer behavior through detailed data about the flow of traffic between the brand and retailer. |
• | Product Intelligence. Our Product Intelligence solution provides brands with insights about online assortment, product coverage gaps, pricing trends and adherence by their retailers to content guidelines. |
OUR CUSTOMERS
As of December 31, 2019, we had 2,603 customers worldwide, including brand and retail customers across many consumer product categories. For the year ended December 31, 2019, our ten largest customers in the aggregate accounted for 6.4% of our total revenue. No single customer accounted for more than 1.7% of our total revenue during the year ended December 31, 2019. We have seen an increasing proportion of our customer base and revenues come from brands customers as more brands seek to directly manage the advertising and selling of their products online. We generally categorize a customer as a brand if it primarily focuses on selling its own proprietary products. For the year ended December 31, 2019, brands customers represented approximately 26% of our total revenue compared to approximately 22% for year ended December 31, 2018. We believe this is a positive trend and continue to focus our efforts on serving this important customer segment. Our goal is to generate at least half of our revenues from brands by the end of 2022.
8
OUR TECHNOLOGY PLATFORM
We have developed our proprietary technology platform with a focus on delivering industry-leading breadth, scalability, reliability and flexibility. Our platform has always been cloud-based and SaaS, with a single code base and multi-tenant software architecture. Because of this, there is no need for our customers to download, install or upgrade software.
We develop our software using rapid iterations through small, incremental changes that are continuously integrated into our code base. Incremental improvements are generally released daily, with more significant enhancements and capabilities communicated approximately every 90 days. Through our single code base and multi-tenant software architecture, our customers benefit from our new capabilities as soon as they are made available.
Our platform uses a hybrid cloud architecture in which we utilize secure third-party data center facilities located in North America, as well as cloud-based infrastructure in North America and Europe. In the data center facilities, we deploy hardware we own and lease, including servers, networking systems and storage systems. We use virtualization to maximize the utilization we achieve from our hardware systems. The data center facilities are biometrically secured, environmentally controlled and redundantly powered. We employ system security, including firewalls, encryption technology and antivirus software, and we conduct regular system tests and vulnerability and intrusion assessments. In the event of failure, we have engineered our systems with backup and recovery capabilities designed to provide for business continuity. We also make use of additional third-party cloud-based systems, such as content delivery networks, to augment the capabilities of our platform.
RESEARCH AND DEVELOPMENT
Our research and development efforts are focused on enhancing the architecture of our technology platform, creating additional functionality for our customers, enhancing our external developer APIs and maintaining and extending the various points of integration we have to the online channels we support. We recorded research and development costs of $19.2 million, $22.4 million and $21.9 million during the years ended December 31, 2019, 2018 and 2017, respectively.
COMPETITION
The market for products that help brands and retailers reach online consumers is competitive. The competitive dynamics of our market are unpredictable because it is in an early stage of development, rapidly evolving, fragmented and subject to potential disruption by new technological innovations and the ability of channels to compete with us or make changes to which we need to rapidly adapt.
Several competitors provide solutions that compete with some of the capabilities of our platform, including those who provide software or services to connect brands and retailers with one or more online channels. We also compete with in-house solutions used by brands and retailers that elect to build and maintain their own proprietary integrations to online channels. In addition, we compete with the channels themselves, which typically offer software tools, often for free, allowing brands and retailers to connect to them.
We believe the principal competitive factors in our industry include:
•industry expertise and thought leadership;
•relationships with leading online channels;
•relationships with leading brands and retailers;
•channel independence;
•breadth of online channels supported;
•integration of capabilities;
•reporting and analytic capabilities;
•proven and scalable technology; and
•brand awareness and reputation.
We believe that we compete favorably with respect to all of these factors.
9
INTELLECTUAL PROPERTY
Our ability to protect our intellectual property, including our technology, is an important factor in the success and continued growth of our business. We protect our intellectual property through trade secrets law, patents, copyrights, trademarks and contracts. Some of our technology relies upon third-party licensed intellectual property.
We have received patent protection for some of our technologies in the United States and expect to apply for additional patents to protect our intellectual property as appropriate. We own trademark registrations in the U.S., the European Union, Australia, China, Hong Kong, Japan and Brazil for ChannelAdvisor and expect to apply for additional trademark registrations as appropriate.
In addition to the foregoing, we have established business procedures designed to maintain the confidentiality of our proprietary information, including the use of confidentiality agreements and assignment-of-inventions agreements with employees, independent contractors, consultants and companies with which we conduct business.
BACKLOG
Backlog represents the total committed subscription fees to be received under our customer contracts that have not yet been invoiced or recognized as revenue. As of December 31, 2019 and 2018, our backlog was approximately $77.6 million and $73.9 million, respectively.
Our customer contracts usually have a term of one year, and therefore the substantial majority of our backlog is expected to be recognized as revenue within the one-year contract term. Revenue for any period is a function of revenue recognized from deferred revenue, backlog under contracts in existence at the beginning of the period, as well as contract renewals and new customer contracts during the period. As a result, our backlog at the beginning of any period is not necessarily indicative of our future performance. Our presentation of backlog may differ from other companies in our industry.
GOVERNMENT REGULATION
The legal environment of the internet is evolving rapidly in the United States and elsewhere. The manner in which existing laws and regulations will be applied to the internet in general, and how they will relate to our business in particular, both in the United States and internationally, are often unclear. For example, we often cannot be certain how existing laws will apply in the e-commerce and online context, including with respect to such topics as privacy, pricing, credit card fraud, advertising, taxation, content regulation, quality of products and services and intellectual property ownership and infringement. Furthermore, it is not clear how existing laws governing issues such as sales and other taxes and personal privacy will apply to the internet, as many of these laws were adopted prior to the advent of the internet and do not contemplate or address the unique issues raised by the internet or e-commerce. It is also unclear how the laws that do reference the internet will be interpreted by courts, which may impact their applicability and scope. Compliance may be costly and may require us to modify our business practices and product offerings. In addition, it is possible that governments of one or more countries may seek to censor content available on the websites of our customers or may even attempt to completely block access to those websites. Noncompliance or perceived noncompliance could also subject us to significant penalties and negative publicity. Accordingly, adverse legal or regulatory developments could substantially harm our business.
Customers load product information and other content onto our platform, generally without any control or oversight by us, at which point we may legally be considered to be the distributor of that content. This presents legal challenges to our business and operations, such as rights of privacy or intellectual property rights related to the content loaded onto our platform. Both in the United States and internationally, we must monitor and comply with a host of legal concerns regarding the content loaded onto our platform. The scope of our liability for third-party content loaded to our platform for delivery to various online e-commerce channels may vary from jurisdiction to jurisdiction and may vary depending on the type of claim, such as privacy, infringement or defamation claims. Our ability to employ processes to quickly remove infringing or offending content from our platform, for example, is an important tool in protecting us from exposure for the potentially infringing activities of our users worldwide. We also incorporate protections in customer contracts that allow us to take steps, if needed, to limit our risk regarding much of the content loaded onto, and collected by, our platform and solutions.
Numerous laws and regulatory schemes have been adopted at the national and state level in the United States and internationally that have a direct impact on our business and operations. These laws include, but are not limited to, the following:
Copyright and trademark. The Copyright Act of 1976 and the statutes and regulations associated with copyrights and trademarks and enforced by the United States Patent and Trademark Office are intended to protect the rights of third parties from infringement. Using our automated service, customers can generally upload any content they designate for use with our
10
solutions. We maintain an active copyright and trademark infringement policy and respond to take-down requests by third-party intellectual property right owners that might result from content posted by our customers using our solutions. As our business expands to other countries, we must also respond to regional and country-specific intellectual property considerations, including take-down and cease and desist notices in foreign languages, and we must build infrastructure to support these processes. The Digital Millennium Copyright Act, or DMCA, also applies to our business. This statute provides relief for claims of circumvention of copyright-protected technologies but includes a safe harbor that is intended to reduce the liability of online service providers for listing or linking to third-party websites that include materials that infringe copyrights or other rights of others. Our copyright and trademark infringement policy is intended to satisfy the DMCA safe harbor in order to reduce our liability for customer-generated materials incorporated into our platform.
Data privacy and security. Data privacy and security with respect to the collection of personally identifiable information continues to be a focus of worldwide legislation and compliance review. Examples include statutes adopted by states that require online services to report breaches of the security of personal information, and to report to customers when their personal information might be disclosed to direct marketers. In addition, the California Consumer Privacy Act, or the CCPA, went into effect on January 1, 2020 and gives California residents expanded rights to access and delete their personal information, opt out of certain personal information sharing and receive detailed information about how their personal information is used by requiring companies to provide new disclosures to California consumers (as that term is broadly defined) and provide such consumers new ways to opt out of certain sales of personal information.
In Europe, the General Data Protection Regulation, or GDPR, went into effect in May 2018 with the intent of unifying data protection within the European Union under a single law, which may result in significantly greater compliance burdens and costs for companies with customers and operations in the European Union. The GDPR introduced a number of privacy-related changes for companies operating in the European Union, including greater control for data subjects (e.g., the "right to be forgotten"), increased data portability for European Union consumers, data breach notification requirements and increased fines. In particular, under the GDPR, fines of up to 20 million euros or up to 4% of the annual global revenue of the non-compliant company, whichever is greater, could be imposed for violations of certain of the GDPR's requirements. This government action is typically intended to protect the privacy of personal data that is collected, processed and transmitted in or from the European Union. These laws apply not only to third-party transactions, but also to transfers of information between us and our subsidiaries, including employee information. As part of our GDPR compliance, we have registered with the E.U.-U.S. Privacy Shield, which was approved by the European Commission on July 8, 2016 as a mechanism to comply with data protection requirements when transferring personal data from the European Union to the United States.
We will continue to follow developments and work to maintain conforming means of transferring data from Europe, including through the Privacy Shield, but despite our efforts to address continuing changes, we may be unsuccessful in establishing conforming means of transferring data from Europe.
We post on our website our privacy policies and practices concerning the use and disclosure of user data. Any failure by us to comply with our posted privacy policies, U.S. Federal Trade Commission, or FTC, requirements or guidance or other privacy-related laws and regulations could result in proceedings by governmental or regulatory bodies that could potentially harm our business, results of operations and financial condition.
In this regard, there are a large number of legislative proposals before the U.S. Congress and various state legislative bodies regarding privacy issues that could affect our business. It is not possible to predict whether or when such legislation may be adopted, and certain proposals, if adopted, could harm our business through a decrease in customers and revenue. These decreases could be caused by, among other possible provisions, the required use of disclaimers or other requirements before prospective buyers can interact with our customers. For example, we have had to work with our customers to comply with the Privacy and Electronic Communications (EC Directive) (Amendment) Regulations 2011 instituted by the United Kingdom, commonly referred to as the UK Cookie Law, which was designed to protect computer users from technologies identifying their computers and specified activities conducted on those computers without the users' consent. We use tracking technology to track purchases from our customers through our platform, in order to calculate variable subscription fees owed by our customers, among other things. Prohibiting or inhibiting such tracking could make it difficult or impossible to monitor our variable subscription fees. The interpretation and implementation of processes to comply with the UK Cookie Law continues to evolve, and we cannot predict how any new laws will apply to us or our business. Similar "do not track" legislative proposals have been considered in the United States at the federal level, although none have been enacted to date. If enacted, such legislative proposals could prohibit or restrict the use of certain technologies, including tracking technology.
Unsolicited e-mails and communications. The CAN-SPAM Act of 2003 and similar laws adopted by a number of states regulate unsolicited commercial e-mails, create criminal penalties for unmarked sexually-oriented material and e-mails containing fraudulent headers and control other abusive online marketing practices. Similarly, FTC guidelines impose responsibilities upon us and our customers for communications with consumers and impose fines and liability for any failure to
11
comply with rules relating to advertising or marketing practices that the FTC may deem misleading or deceptive. The European Union also maintains standards and regulations with respect to communications with consumers that we must comply with as we expand our marketing practices into those countries or with which our customers, utilizing our solutions, must comply. Some ways we seek to comply with these measures include requiring our customers to communicate with their consumers in order to comply with laws concerning spam and unsolicited emails and establishing processes to allow direct receivers of e-mail marketing communications from us to opt out of future communications.
Credit card protections. The Payment Card Industry Council, or PCI Council, established and maintains security standards for companies that transmit, store or process credit card data. The PCI Council has created the Payment Card Industry Data Security Standard, or PCI DSS. Though the PCI DSS is not law, merchants are required by contracts among various stakeholders in the credit card ecosystem to comply with the PCI DSS, with associated fines and penalties for non-compliance. Elements of the PCI DSS have begun to emerge as law in some states, however, and we expect the trend to continue as to further laws and restrictions in collecting and using credit card information. We do not receive, process, or store any credit card information, which we believe limits our exposure to liability under the PCI DSS. We utilize a third-party processor to collect credit card data in processing the fees paid to us by our customers. The third-party is certified as PCI DSS compliant for internet / e-commerce payment processing.
EMPLOYEES
As of December 31, 2019, we had 642 employees, most of whom are located in the United States. Certain of our employees in various countries outside of the United States are subject to laws providing representation rights. We consider our relationship with our employees to be good.
CORPORATE INFORMATION
We were incorporated under the laws of the State of Delaware in June 2001. Our principal executive offices are located at 3025 Carrington Mill Boulevard, Suite 500, Morrisville, North Carolina. Our telephone number is (919) 228-4700.
AVAILABLE INFORMATION
Our internet website address is www.channeladvisor.com. In addition to the information about us and our subsidiaries contained in this Annual Report, information about us can be found on our website. Our website and information included in or linked to our website are not part of this Annual Report.
Our annual reports on Form 10-K, quarterly reports on Form 10-Q, current reports on Form 8-K and amendments to those reports filed or furnished pursuant to Section 13(a) or 15(d) of the Exchange Act are available free of charge through our website as soon as reasonably practicable after they are electronically filed with or furnished to the Securities and Exchange Commission, or SEC. The SEC maintains an internet site that contains reports, proxy and information statements and other information that we file electronically with the SEC. The address of the SEC's website is www.sec.gov.
12
ITEM 1A. RISK FACTORS
Our business is subject to numerous risks. You should carefully consider the following risks, as well as general economic and business risks, and all of the other information contained in this Annual Report, together with any other documents we file with the SEC. Any of the following risks could have a material adverse effect on our business, operating results and financial condition and cause the trading price of our common stock to decline.
RISKS RELATED TO OUR BUSINESS
We have incurred significant net losses since inception, and even though we achieved net income for the most recent year, it is possible that our operating expenses will increase in the future and we may not be able to maintain profitability.
We had an accumulated deficit of $176.8 million as of December 31, 2019 due to net losses incurred in prior periods. Although we achieved net income of $3.5 million for the year ended December 31, 2019, it is possible that our operating expenses will increase in the future, which could negatively impact our prospects for achieving profitability in future periods. If we are not able to maintain profitability, the value of our company and our common stock could decline significantly.
A significant portion of our revenue is attributable to sales by our customers on the Amazon and eBay marketplaces and through advertisements on Google. Our inability to continue to integrate our solutions with these channels would make our solutions less appealing to existing and potential new customers and could significantly reduce our revenue.
A substantial majority of the GMV that our customers process through our platform is derived from merchandise sold on the Amazon and eBay marketplaces or advertised on Google, and a similar portion of our variable subscription fees is attributable to sales by our customers through these channels. These channels, and the other channels with which our solutions are integrated, have no obligation to do business with us or to allow us access to their systems, and they may decide at any time and for any reason to significantly curtail or inhibit our ability to integrate our solutions with their channels. Additionally, Amazon, eBay or Google may decide to make significant changes to their respective business models, policies, systems, plans or ownership, and those changes could impair or inhibit our customers' ability to use our solutions to sell their products on those channels, or may adversely affect the volume of GMV that our customers can sell on those channels or reduce the desirability of selling on those channels. Further, Amazon, eBay or Google could decide to compete with us more vigorously. Any of these results could cause our customers to reevaluate the value of our products and services and potentially terminate their relationships with us and significantly reduce our revenue.
We may not be able to respond to rapid changes in channel technologies or requirements, which could cause us to lose revenue and make it more difficult to maintain profitability.
The e-commerce market is characterized by rapid technological change and frequent changes in rules, specifications and other requirements for brands and retailers to be able to sell their merchandise on particular channels, as well as developments in technologies that can impede the display and tracking of advertisements. Our ability to retain existing customers and attract new customers depends in large part on our ability to enhance and improve our existing solutions and introduce new solutions that can adapt quickly to these technological changes. To achieve market acceptance for our solutions, we must effectively anticipate and offer solutions that meet frequently changing channel requirements in a timely manner. If our solutions fail to do so, our ability to renew our contracts with existing customers and our ability to create or increase demand for our solutions will be impaired.
If we are unable to retain our existing customers, our revenue and results of operations could be adversely affected.
We sell our solutions pursuant to contractual arrangements that generally have one-year terms. Therefore, our revenue growth depends to a significant degree upon subscription renewals. Our customers have no obligation to renew their subscriptions after the subscription term expires, and these subscriptions may not be renewed or, if renewed, may not be renewed on the same or more favorable terms for us. We may not be able to accurately predict future trends in customer renewals, and our customers' renewal rates may decline or fluctuate because of several factors, including their satisfaction or dissatisfaction with our solutions, the cost of our solutions, the cost of solutions offered by our competitors and reductions in our customers' spending levels. If our customers do not renew their subscriptions, renew on less favorable terms or for fewer modules, or do not purchase additional modules, our revenue may grow more slowly than expected or decline, and our ability to become profitable may be compromised.
13
As more of our sales efforts are targeted at larger customers, our sales cycle may become more time-consuming and expensive, and we may encounter pricing pressure, which could harm our business and operating results.
The cost and length of our sales cycle varies by customer. As we target more of our sales efforts at selling to larger customers, we may face greater costs, longer sales cycles and less predictability in completing some of our sales. These types of sales often require us to provide greater levels of education regarding our solutions. In addition, larger customers may demand more training and other professional services. As a result of these factors, these sales opportunities may require us to devote greater sales support and professional services resources to individual customers, driving up costs and time required to complete sales and diverting sales and professional services resources to a smaller number of larger transactions.
We may not be able to compete successfully against current and future competitors. If we do not compete successfully, we could experience lower sales volumes and pricing pressure, which could cause us to lose revenues, impair our ability to pursue our growth strategy and compromise our ability to achieve profitability.
We face intense competition in the market for online channel management solutions and services, and we expect competition to intensify in the future. We have competitors, including some of the channels themselves, with longer operating histories, larger customer bases and greater financial, technical, marketing and other resources than we do. Increased competition may result in reduced pricing for our solutions, longer sales cycles or a decrease in our market share, any of which could negatively affect our revenue and future operating results and our ability to grow our business.
A number of competitive factors could cause us to lose potential sales or to sell our solutions at lower prices or at reduced margins, including:
• | Potential customers may choose to continue using or to develop applications in-house, rather than pay for our solutions; |
• | The channels themselves, which typically offer software tools, often for free, that allow brands and retailers to connect to them, may decide to compete more vigorously with us; |
• | Competitors may adopt more aggressive pricing policies and offer more attractive sales terms, adapt more quickly to new technologies and changes in customer requirements, and devote greater resources to the promotion and sale of their products and services than we can; |
• | Current and potential competitors have established or may establish cooperative relationships among themselves or with third parties to enhance their products and expand their markets, and consolidation in our industry is likely to intensify. Accordingly, new competitors or alliances among competitors may emerge and rapidly acquire significant market share; |
• | Current and potential competitors may offer software that addresses one or more online channel management functions at a lower price point or with greater depth than our solutions and may be able to devote greater resources to those solutions than we can; and |
• | Software vendors could bundle channel management solutions with other solutions or offer such products at a lower price as part of a larger product sale. |
We may not be able to compete successfully against current and future competitors, including any channels that decide to compete against us more vigorously. In addition, competition may intensify as our competitors raise additional capital and as established companies in other market segments or geographic markets expand into our market segments or geographic markets. If we cannot compete successfully against our competitors, our business and our operating and financial results could be adversely affected.
If the e-commerce industry consolidates around a limited number of online channels, or if the complexities and challenges faced by brands and retailers seeking to sell online otherwise diminish, demand for our solutions could decline.
Our solutions enable brands and retailers to manage their merchandise sales through hundreds of disparate online channels. One of the key attractions of our solutions to brands and retailers is the ability to help address the complexity and fragmentation of selling online. Although the number and variety of online channels available to brands and retailers have been increasing, at the same time the share of online sales made through a small number of larger channels, particularly Amazon, has also been increasing. If the trend toward consolidation around a few large online channels accelerates, the difficulties faced by brands and retailers could decline, which might make our solutions less important to brands and retailers and could cause demand for our solutions to decline.
14
Our growth depends in part on the success of our strategic relationships with third parties.
We anticipate that we will continue to depend on our relationships with various third parties, including marketplaces and technology, content and logistics providers, in order to grow our business. Identifying, negotiating and documenting relationships with these third parties may require significant time and resources as does integrating their content and technology with our solutions. If the third-party content or technology integrated with our solutions is not well received by our customers, our brand and reputation could be negatively affected. Our agreements with third-party business partners are typically non-exclusive and do not prohibit them from working with our competitors or from offering competing services. If and to the extent that any of these third parties compete with us, it could hurt our growth prospects.
If the e-commerce market does not grow, or grows more slowly than we expect, particularly on the channels that our solutions support, demand for our online channel management solutions could be adversely affected.
For our existing customers and potential customers to be willing to subscribe to our solutions, the internet must continue to be accepted and widely used for selling merchandise. As e-commerce continues to evolve, regulation by federal, state or foreign agencies may increase. Any regulation imposing greater fees for internet use or restricting information exchanged over the internet could result in a decline in the use of the internet, which could harm our business.
In addition, if consumer utilization of our primary e-commerce channels, such as Amazon, eBay and Google, does not grow or grows more slowly than we expect, demand for our solutions would be adversely affected, our revenue would be negatively impacted and our ability to pursue our growth strategy and become profitable would be compromised.
Errors, defects or failures in our software, or human error, could cause our solutions to oversell our customers' inventory or misprice their offerings or could cause other errors, which would hurt our reputation and reduce customer demand.
Complex software applications such as ours may contain errors or defects, particularly when first introduced or when new versions or enhancements are released. Despite our testing and testing by our customers, our current and future products may contain defects. Our customers rely on our solutions to automate the allocation of their inventory simultaneously across multiple online channels, as well as to ensure that their sales comply with the policies of each channel and sometimes to dynamically determine product pricing at any given moment. Some customers subscribe to our solutions on a managed-service basis, in which case our personnel operate our solutions on behalf of the customer. In the event that our solutions do not function properly, or if there is human error on the part of our service staff, errors could occur, including that our customers might inadvertently sell more inventory than they actually have in stock, make sales that violate channel policies or underprice or overprice their offerings. Overselling their inventory could force our customers to cancel orders at rates that violate channel policies. Underpricing would result in lost revenue to our customers and overpricing could result in lost sales. In addition, our pricing policies with our customers are largely based upon our customers' expectations of the levels of their GMV that will be processed through our platform over the term of their agreement with us, and errors in our software or human error could cause transactions to be incorrectly processed that would cause GMV to exceed contractually agreed-upon thresholds, triggering imposition of variable fees on our customers, in which case our variable subscription fee-based revenue could be overstated. Any of these results or other errors could reduce demand for our solutions and hurt our business reputation. Customers could also seek recourse against us in these cases and, while our contractual arrangements with customers typically provide that we are not liable for damages such as these, it is possible that these provisions would not be sufficient to protect us.
If the use of "cookie" tracking technologies is restricted, regulated or otherwise blocked, or if changes in our industry cause cookies to become less reliable or acceptable as a means of tracking consumer behavior, the amount or accuracy of GMV processed on our platform, and our related revenue, could decrease.
Cookies are small data files that are sent by websites and stored locally on an internet user's computer or mobile device. Our customers enable cookies on their sites and monitor internet user activity, such as viewing pages and completing transactions. We collect data via cookies that we ultimately use to report GMV, which translates to revenue. However, internet users can easily disable, delete and block cookies directly through browser settings or through other software, browser extensions or hardware platforms that physically block cookies from being created and stored.
Third-party cookies are downloaded from domains not associated with the address currently being viewed in an internet user's browser. Cookies can be specifically blocked by browser settings; for example, the Safari internet browser blocks third-party cookies by default. Internet users can also download free or paid "ad blocking" software that prevents third-party cookies from being stored on a user's device. On the other hand, first-party cookies are downloaded directly from the address domain of an internet user, and are generally considered safer by privacy concerns. We currently collect data from both first-party and third-party cookie implementations. Our customers currently implementing our third-party cookie solution might be slow to migrate their sites to first-party cookie technologies, which could result in less cookie data that we can collect, and therefore less reported revenue data that we can store.
15
There have been efforts within our industry to replace cookies with alternative tracking technologies. To the extent these efforts are successful, we may have difficulty adapting to those new tracking technologies and we may become dependent on third parties for access to tracking data. Similarly, privacy regulations may extend to those tracking technologies and restrict how we can use such technologies.
Privacy regulations might also restrict how our customers deploy our cookies and other tracking technologies on their sites, and this could potentially increase the number of internet users that choose to proactively disable cookies and other tracking technologies on their systems. In the European Union, for example, the Directive on Privacy and Electronic Communications requires users to give their consent before cookie data can be stored on their local computer or mobile device. Users can decide to opt out of any cookie data creation, which could negatively impact the revenue we might recognize.
We may have to develop alternative systems to collect user revenue data if users block cookies or regulations introduce barriers to collecting cookie data. In addition, third parties may develop technology or policies to harvest user data including through next-generation web browsers or other means, which could subsequently prevent us from directly importing data to our systems. We may not be able to develop adequate alternatives to cookie data collection, which could negatively impact our ability to reliably measure GMV.
We rely on non-redundant data centers and cloud computing providers to deliver our SaaS solutions. Any disruption of service from these providers could harm our business.
We manage our platform and serve all of our customers from third-party data center facilities and cloud computing providers that are non-redundant, meaning that the data centers and providers are currently not configured as backup for each other. While we engineer and architect the actual computer and storage systems upon which our platform runs, we do not control the operation of the facilities at which they are deployed.
The owners of our data facilities have no obligation to renew their agreements with us on commercially reasonable terms, or at all. If we are unable to renew these agreements on commercially reasonable terms, we may be required to transfer to new data center facilities, and we may incur significant costs and possible service interruption in connection with doing so.
Any changes in third-party service levels at our data centers or any errors, defects, disruptions or other performance problems with our solutions could harm our reputation and damage our customers' businesses. Interruptions in our services could reduce our revenue, require us to issue credits to customers, subject us to potential liability, cause our existing customers to not renew their agreements or adversely affect our ability to attract new customers.
Our data centers and cloud computing providers are vulnerable to damage or interruption from human error, intentional bad acts, earthquakes, hurricanes, floods, fires, war, terrorist attacks, power losses, hardware failures, systems failures, telecommunications failures, cyber-attacks and similar events. The occurrence of a natural disaster or an act of terrorism, or vandalism or other misconduct, a decision to close the facilities without adequate notice or other unanticipated problems could result in lengthy interruptions in the availability of our SaaS solutions or impair their functionality. Our business, growth prospects and operating results would also be harmed if our customers and potential customers are not confident that our solutions are reliable.
We rely in part on a pricing model under which a variable portion of the subscription fees we receive from customers is based upon the amount of GMV or advertising spend that those customers process through our platform, and any change in the attractiveness of that model or any decline in our customers' sales could adversely affect our financial results.
We have adopted a pricing model under which a portion of the subscription fees we receive from most of our customers is variable, based on the amount of our customers' GMV or advertising spend processed through our platform that exceeds a specified amount established by contract, which we refer to as variable subscription fees. Most of our customer contracts include this variable subscription fee component. If sales or advertising spend by our customers processed through our platform were to decline, or if more of our customers require fully fixed pricing terms that do not provide for any variability based on their GMV or advertising spend processed through our platform, our revenue and margins could decline.
16
Our quarterly operating results have fluctuated in the past and may do so in the future, which could cause our stock price to decline.
Our operating results have historically fluctuated due to changes in our business, and our future operating results may vary significantly from quarter to quarter due to a variety of factors, many of which are beyond our control. You should not rely on period-to-period comparisons of our operating results as an indication of our future performance. Factors that may cause fluctuations in our quarterly operating results include, but are not limited to, the following:
• | seasonal patterns in consumer spending; |
• | the addition of new customers or the loss of existing customers; |
• | changes in demand for our software; |
• | the timing and amount of sales and marketing expenses; |
• | changes in the prospects of the economy generally, which could alter current or prospective customers' spending priorities, or could increase the time it takes us to close sales; |
• | changes in our pricing policies or the pricing policies of our competitors; |
• | costs necessary to improve and maintain our software platform; and |
• | costs related to acquisitions of other businesses. |
Our operating results may fall below the expectations of market analysts and investors in some future periods, which could cause the market price of our common stock to decline substantially.
The seasonality of our business creates significant variance in our quarterly revenue, which makes it difficult to compare our financial results on a sequential quarterly basis.
Our customers are brands and retailers that typically realize a significant portion of their online sales in the fourth quarter of each year during the holiday season. As a result of this seasonal variation, our subscription revenue fluctuates, with the variable portion of our subscription fees being higher in the fourth quarter than in other quarters and with revenue generally declining in the first quarter sequentially from the fourth quarter. Our business is therefore not necessarily comparable on a sequential quarter-over-quarter basis and you should not rely solely on quarterly comparisons to analyze our growth.
Failure to adequately manage our growth could impair our ability to deliver high-quality solutions to our customers, hurt our reputation and compromise our ability to maintain profitability.
We have experienced, and may experience in the future, significant growth in our business. If we do not effectively manage our growth, the quality of service of our solutions may suffer, which could negatively affect our reputation and demand for our solutions. Our growth has placed, and may place in the future, a significant strain on our managerial, operational and financial resources and our infrastructure. Our future success will depend, in part, upon the ability of our senior management to manage growth effectively. This will require us to, among other things:
• | hire additional personnel, both domestically and internationally; |
• | implement additional information management systems; |
• | maintain close coordination among our engineering, operations, legal, finance, sales and marketing and client service and support organizations; and |
• | further develop our operating, administrative, legal, financial and accounting systems and controls. |
Moreover, if our sales increase, we may be required to concurrently deploy our hosting infrastructure at multiple additional locations or provide increased levels of customer service. Failure to accomplish any of these requirements could impair our ability to continue to deliver our solutions in a timely fashion, fulfill existing customer commitments or attract and retain new customers.
17
If we do not retain our senior management team and key employees, or if we fail to attract and retain additional highly skilled sales talent, we may not be able to sustain our growth or achieve our business objectives.
Our future success is substantially dependent on the continued service of our senior management team. Our future success also depends on our ability to continue to attract, retain, integrate and motivate highly skilled technical, sales and administrative employees. Competition for these employees in our industry is intense. As a result, we may be unable to attract or retain these management and other key personnel that are critical to our success, resulting in harm to our key client relationships, loss of key information, expertise or know-how and unanticipated recruitment and training costs. The loss of the services of our senior management or other key employees could make it more difficult to successfully operate our business and pursue our business goals.
Our business and growth objectives also may be hindered if our efforts to expand our sales team do not generate a corresponding increase in revenue. In particular, if we are unable to hire, develop and retain talented sales personnel or if our new sales personnel are unable to achieve expected productivity levels in a reasonable period of time, we may not be able to significantly increase our revenue and grow our business.
If we pursue opportunistic acquisitions or investments they may be unsuccessful and/or divert our management's attention and consume significant resources.
Any acquisition or investment may require us to use significant amounts of cash, issue potentially dilutive equity securities or incur debt. In addition, acquisitions involve numerous risks, any of which could harm our business, including:
• | difficulties in integrating the operations, technologies, services and personnel of acquired businesses, especially if those businesses operate outside of our core competency of providing e-commerce software solutions; |
• | cultural challenges associated with integrating employees from acquired businesses into our organization; |
• | ineffectiveness or incompatibility of acquired technologies or services; |
• | failure to successfully further develop the acquired technology in order to recoup our investment; |
• | potential loss of key employees of acquired businesses; |
• | inability to maintain the key business relationships and the reputations of acquired businesses; |
• | diversion of management's attention from other business concerns; |
• | litigation for activities of acquired businesses, including claims from terminated employees, customers, former stockholders or other third parties; |
• | in the case of foreign acquisitions, the need to integrate operations across different cultures and languages and to address the particular economic, currency, political and regulatory risks associated with specific countries; |
• | costs necessary to establish and maintain effective internal controls for acquired businesses; and |
• | increased fixed costs. |
Following the U.S. Supreme Court's decision in South Dakota v. Wayfair, several states have enacted, and others may choose to enact in the future, new legislation and increase enforcement efforts of existing legislation requiring online retailers to collect and remit sales tax. If there is increased legislative or enforcement action, e-commerce in general could decline, and any additional taxes may increase the costs we and/or our customers will have to pay to sell their goods through our platform, thereby making our solutions less attractive and potentially resulting in a lower amount of GMV processed through our platform. As a result, our revenue could decline.
An increasing number of states have adopted laws that require out-of-state retailers to collect sales taxes on their behalf. The U.S. Supreme Court recently reversed its prior decision that prohibited states from requiring online retailers without a physical presence to collect and remit sales tax. In its decision, the Supreme Court upheld a South Dakota statute that imposed a sales tax collection obligation on remote sellers with sales exceeding specified thresholds. Many states require sales and use tax collection by remote vendors and/or by online marketplaces. The details and effective dates of these collection requirements vary from state to state. This is a rapidly evolving area and we cannot predict what legislative or enforcement action might be
18
taken by the states or Congress. Increased taxation of online sales could result in online shopping losing some of its current advantage over traditional retail models, which could diminish its appeal to consumers. This could cause e-commerce growth to slow, which would, in turn, hurt the business of our customers, potentially make our products less attractive and cause the amount of GMV processed through our platform, and ultimately our revenue, to decline.
In addition, it is possible that one or more states or the federal government or foreign countries may seek to impose a tax collection, reporting or record-keeping obligation on companies like us that facilitate e-commerce, even though we are not an online retailer. Similar issues exist outside of the United States, where the application of value-added tax or other indirect taxes on online retailers and companies like us that facilitate e-commerce is uncertain and evolving. A successful assertion by one or more states requiring us to collect taxes where we presently do not do so, or to collect more taxes in a jurisdiction in which we currently do collect some taxes, could result in substantial tax liabilities, including taxes on past sales, as well as penalties and interest. The imposition of sales tax collection obligations on out-of-state customers could also create additional administrative burdens for us, put us at a competitive disadvantage if they do not impose similar obligations on our competitors and decrease our future sales, which could have a material adverse impact on our business and operating results. In addition, the imposition of sales taxes on our customers who did not collect such taxes in the past could result in them charging higher rates for their products, potentially resulting in lower sales and a lower amount of GMV processed through our platform, which would negatively impact our revenue. Additionally, new legislation could require us to incur substantial costs in order to comply, including costs associated with tax calculation, collection, remittance and audit requirements, any of which could make our platform solutions less attractive.
We may be subject to additional obligations to collect and remit sales tax and other taxes, and we may be subject to tax liability for past sales, which could harm our business.
State, local and foreign jurisdictions have differing rules and regulations governing sales, use, value added and other taxes, and these rules and regulations are subject to varying interpretations that may change over time. In particular, the applicability of such taxes to our platform in various jurisdictions is unclear. Further, these jurisdictions' rules regarding tax nexus are complex and vary significantly. As a result, we could face the possibility of tax assessments and audits, and our liability for these taxes and associated penalties could exceed our original estimates. As described in this Annual Report on Form 10-K, we previously entered into voluntary disclosure agreements, or VDAs, with certain jurisdictions and recorded a $2.5 million one-time charge in general and administrative expense for the year ended December 31, 2017. Through December 31, 2018, we paid an aggregate of $2.5 million under the terms of completed VDAs and as a settlement with one jurisdiction that rejected our VDA application and conducted a sales tax audit. We do not currently have any unresolved VDA applications or ongoing sales tax audits, though any successful assertion that we should be collecting additional sales, use, value added or other taxes in those jurisdictions where we have not historically done so and do not accrue for such taxes could result in substantial tax liabilities and related penalties for past sales, discourage customers from purchasing our application or otherwise harm our business and operating results.
Changes to U.S. tax laws could adversely affect our business and financial condition.
On December 22, 2017, the Tax Cuts and Jobs Act, or the Tax Act, went into effect significantly revising the Internal Revenue Code of 1986, as amended. The Act, among other things, contains significant changes to corporate taxation, including reduction of the corporate tax rate from a top marginal rate of 35% to a flat rate of 21%, limitation of the tax deduction for interest expense to 30% of adjusted earnings (except for certain small businesses), limitation of the deduction for net operating losses to 80% of current year taxable income and elimination of net operating loss carrybacks, one time taxation of offshore earnings at reduced rates regardless of whether they are repatriated, elimination of U.S. tax on foreign earnings (subject to certain important exceptions), immediate deductions for certain new investments instead of deductions for depreciation expense over time, and modifying or repealing many business deductions and credits. Notwithstanding the reduction in the corporate income tax rate, the overall impact of the Tax Act is uncertain and our business and financial condition could be adversely affected. In addition, it is uncertain if and to what extent various states will conform to the Tax Act. The impact of this tax reform on holders of our common stock is also uncertain and could be adverse. We urge our stockholders to consult with their legal and tax advisors with respect to this legislation and the potential tax consequences of investing in or holding our common stock.
Our effective tax rate may fluctuate, and we may incur obligations in tax jurisdictions in excess of accrued amounts.
We are subject to taxation in numerous countries, states and local tax jurisdictions. As a result, our effective tax rate is derived from a combination of applicable tax rates in the various places that we operate. In preparing our financial statements, we estimate the amount of tax that will become payable in each of such places. Nevertheless, our effective tax rate may be different than experienced in the past due to numerous factors, including passage of the newly enacted federal income tax law, changes in the mix of our profitability from jurisdiction to jurisdiction, the results of examinations and audits of our tax filings,
19
our inability to secure or sustain acceptable agreements with tax authorities, changes in accounting for income taxes and changes in tax laws. Any of these factors could cause us to experience an effective tax rate significantly different from previous periods or our current expectations and may result in tax obligations in excess of amounts accrued in our financial statements.
Evolving domestic and international data privacy regulations may restrict our ability, and that of our customers, to solicit, collect, process, disclose and use personal information or may increase the costs of doing so, which could harm our business.
Federal, state and foreign governments and supervising authorities have enacted, and may in the future enact, laws and regulations concerning the solicitation, collection, processing, disclosure or use of consumers' personal information. Evolving regulations regarding personal data and personal information, in the European Union and elsewhere, especially relating to classification of IP addresses, machine identification, household data, location data and other information, may limit or inhibit our ability to operate or expand our business.
Such laws and regulations require or may in the future require us or our customers to implement privacy and security policies and practices; permit individuals to access, correct or delete personal information stored or maintained by us or our customers; inform individuals of security incidents that affect their personal information; and, in some cases, obtain consent to use personal information for specified purposes. Other proposed legislation could, if enacted, impose additional requirements and prohibit the use of specific technologies, such as those that track individuals' activities on web pages or record when individuals click on a link contained in an email message. Such laws and regulations could restrict our customers' ability to collect and use web browsing data and personal information, which may reduce our customers' demand for our solutions.
The laws in this area are complex and developing rapidly. In the United States, many state legislatures have adopted legislation that regulates how businesses operate online, including measures relating to privacy, data security and data breaches. Laws in all states require businesses to provide notice to customers whose personally identifiable information has been disclosed as a result of a data breach. The laws are not consistent, and compliance in the event of a widespread data breach is costly. Further, states are constantly adopting new laws or amending existing laws, requiring attention to frequently changing regulatory requirements. For example, California enacted the California Consumer Privacy Act, or the CCPA, on June 28, 2018, which went into effect on January 1, 2020 and has been dubbed the first "GDPR-like" law in the United States (referring to the EU’s General Data Protection Regulation, described below). The CCPA gives California residents expanded rights to access and delete their personal information, opt out of certain personal information sharing and receive detailed information about how their personal information is used by requiring covered companies to provide new disclosures to California consumers (as that term is broadly defined) and provide such consumers new ways to opt-out of certain sales of personal information. The CCPA provides for civil penalties for violations, as well as a private right of action for data breaches that is expected to increase data breach litigation. The CCPA may increase our compliance costs and potential liability. Some observers have noted that the CCPA could mark the beginning of a trend toward more stringent privacy legislation in the United States. Other states are beginning to pass similar laws.
The General Data Protection Regulation, or GDPR, went into effect in the European Union in May 2018, with the intent of unifying data protection within the European Union under a single law. The GDPR has resulted in significantly greater compliance burdens and costs for companies with customers or operations in the European Union. The GDPR creates a range of new compliance obligations and increases financial penalties for non-compliance, and extends the scope of the European Union data protection law to all companies processing personal data of European Union data subjects, regardless of the company's location. These laws apply not only to third-party transactions, but also to transfers of information between us and our subsidiaries, including employee information. We will continue to follow developments and work to maintain conforming means of transferring data from Europe, but despite our efforts to address the changes, we may be unsuccessful in establishing conforming means of transferring data from Europe. For example, there are various activities in the European Union that could lead to the invalidation of the use of the Privacy Shield or model clauses as accepted mechanisms for transferring personal data of European Union data subjects across borders, which could require us to implement costly substitutions for the date transfers we undertake in order to perform our services, or prevent such transfers entirely. There is significant uncertainty related to the manner in which data protection authorities will seek to enforce compliance with GDPR. For example, it is not clear if the authorities will conduct random audits of companies doing business in the European Union, or if the authorities will just continue to wait for complaints to be filed by individuals who claim their rights have been violated. Enforcement uncertainty and the costs associated with ensuring GDPR compliance could be onerous and adversely affect our business, financial condition, results of operations and prospects. While we do not currently believe that our compliance with the GDPR will have a material effect on our business, we will continue to monitor regulation and enforcement under this new law.
Changing industry standards and industry self-regulation regarding the collection, use and disclosure of data may have similar effects. Existing and future privacy and data protection laws and increasing sensitivity of consumers to unauthorized disclosures and use of personal information may also negatively affect the public's perception of our customers' sales practices.
20
If our solutions are perceived to cause, or are otherwise unfavorably associated with, invasions of privacy, whether or not illegal, we or our customers may be subject to public criticism. Public concerns regarding data collection, privacy and security may also cause some consumers to be less likely to visit our customers' websites or otherwise interact with our customers, which could limit the demand for our solutions and inhibit the growth of our business.
Any failure on our part to comply with applicable privacy and data protection laws, regulations, policies and standards or any inability to adequately address privacy or security concerns associated with our solutions, even if unfounded, could subject us to liability, damage our reputation, impair our sales and harm our business. Furthermore, the costs to our customers of compliance with, and other burdens imposed by, such laws, regulations, policies and standards may limit adoption of and demand for our solutions.
Cybersecurity incidents could harm our business and negatively impact our financial results.
Cybersecurity incidents could endanger the confidentiality, integrity and availability of our information resources and the information we collect, use, store and disclose. These incidents may be an intentional attack or an unintentional event, targeted at us or our third-party contractors or consultants, and could involve gaining unauthorized access to our information systems for purposes of misappropriating assets, stealing confidential information, corrupting data or causing operational disruption. Such disruptions may be caused by events such as computer hacking, phishing attacks, ransomware, dissemination of computer viruses, worms and other destructive or disruptive software, denial of service attacks, exploits by trusted insiders and other malicious activity, as well as power outages, natural disasters (including extreme weather), terrorist attacks, user error or other similar events. We believe that we take reasonable steps that are designed to protect the security, integrity and confidentiality of the information we collect, use, store, and disclose, but there is no guarantee that inadvertent or unauthorized data access will not occur despite our efforts. For example, our system redundancy may be ineffective or inadequate, or we could be impacted by software bugs or other technical malfunctions, as well as employee error or malfeasance. In addition, while we believe we have adequate insurance coverage to compensate for any losses associated with such events, the coverage may in fact not be adequate to cover all potential losses. The development and maintenance of these systems, controls and processes is costly and requires ongoing monitoring and updating as technologies change and efforts to overcome security measures become increasingly sophisticated. Any unauthorized access or use of information, virus or similar breach or disruption to our, our customers', or our partners' systems and security measures could result in disrupted operations, loss of information, damage to our reputation and customer relationships, early termination of our contracts and other business losses, indemnification of our customers, misstated or unreliable financial data, liability for stolen assets or information, increased cybersecurity protection and insurance costs, financial penalties, litigation, regulatory investigations, and other significant liabilities, any of which could materially harm our business.
Global economic conditions could materially adversely impact demand for our solutions.
Our operations and performance depend significantly on worldwide economic conditions. Uncertainty about global economic conditions could result in customers postponing purchases of our solutions in response to tighter credit, unemployment, negative financial news or declines in income or asset values and other macroeconomic factors, or the perception that any of these may occur, any of which could have a material negative effect on demand for our solutions and, accordingly, on our business, results of operations or financial condition. For example, the United States has recently imposed increased tariffs on certain imports from China and has expressed a willingness for further tariffs on goods imported from China and other countries. Any economic uncertainty caused by the United States tariffs imposed or expected to be imposed on goods from China or other countries, and any retaliatory counter-measures imposed by countries subject to such tariffs, could have a negative impact on consumer spending for discretionary items, which in turn could hurt our brand and retailer customers in a manner that might cause them to spend less on our solutions. Any such outcome could impair our revenues and results of operations.
RISKS RELATED TO THE SOFTWARE-AS-A-SERVICE (SAAS) MODEL
If we fail to manage and increase the capacity of our hosted infrastructure, our customers may be unable to process transactions through our platform, which could harm our reputation and demand for our solutions.
We have experienced significant growth in the number of users, transactions and data that our hosting infrastructure supports. We seek to maintain sufficient excess capacity in our hosted infrastructure to be sufficiently flexible and scalable to meet the needs of all of our customers. We also seek to maintain excess capacity to facilitate the rapid provision of new customer deployments and the expansion of existing customer deployments and to handle spikes in usage. However, the provision of new hosting infrastructure requires significant lead time. If we do not accurately predict our infrastructure capacity requirements, particularly in the fourth quarter when we typically experience significant increases in the volume of customer
21
transactions processed through our platform, our customers could experience service outages that may subject us to financial penalties or other liabilities, result in customer losses, harm our reputation and adversely affect our ability to grow our revenue.
We derive most of our revenue from annual subscription agreements, as a result of which a significant downturn in our business may not be immediately reflected in our operating results.
We derive most of our revenue from subscription agreements, which are typically one year in length. As a result, a significant portion of the revenue we report in each quarter is generated from customer agreements entered into during previous periods. Consequently, a decline in new or renewed subscriptions in any one quarter may not be reflected in our financial performance in that quarter but might negatively affect our revenue in future quarters. Accordingly, the effect of significant declines in sales and market acceptance of our solutions may not be reflected in our short-term results of operations.
Our business is substantially dependent upon the continued growth of the market for on-demand SaaS solutions. If this market does not continue to grow, demand for our solutions could decline, which in turn could cause our revenues to decline and impair our ability to become profitable.
We derive, and expect to continue to derive, substantially all of our revenue from the sale of our solutions, which are delivered under a SaaS model. As a result, widespread use and acceptance of this business model is critical to our future growth and success. Under the more traditional license model for software procurement, users of the software typically run the applications in-house on their own hardware. Because many companies are generally predisposed to maintaining control of their information technology systems and infrastructure, there may be resistance to the concept of accessing software functionality as a service provided by a third party. In addition, the market for SaaS solutions is still evolving, and existing and new market participants may introduce new types of solutions and different approaches to enable organizations to address their needs. If the market for SaaS solutions fails to grow or grows more slowly than we currently anticipate, demand for our solutions and our revenue, gross margin and other operating results could be negatively impacted.
RISKS RELATED TO OUR INTERNATIONAL OPERATIONS
Our international operations subject us to increased challenges and risks. If we do not successfully manage the risks associated with international operations, we could experience a variety of costs and liabilities and the attention of our management could be diverted.
We have international operations and may further expand internationally by opening offices in new countries and regions worldwide. However, our ability to manage our business and conduct our operations internationally requires considerable management attention and resources and is subject to the particular challenges of supporting a rapidly growing business in an environment of multiple languages, cultures, customs, taxation systems, alternative dispute systems, regulatory systems and commercial infrastructures. International expansion will require us to invest significant funds and other resources. Expanding internationally may subject us to new risks that we have not faced before or increase risks that we currently face, including risks associated with:
• | recruiting and retaining employees in foreign countries; |
• | increased competition from local providers; |
• | compliance with applicable foreign laws and regulations; |
• | compliance with changing foreign privacy, data protection and information security laws and regulations and the risks and costs of noncompliance; |
• | cross-border data transfers among us, our subsidiaries, and our customers, vendors, and business partners; |
• | longer sales or collection cycles in some countries; |
• | credit risk and higher levels of payment fraud; |
• | compliance with anti-bribery laws, such as the Foreign Corrupt Practices Act; |
• | currency exchange rate fluctuations; |
• | tariffs, customs, trade sanctions, trade embargoes and other barriers to importing or exporting materials and products in a cost-effective and timely manner, or changes in applicable tariffs or customs rules; |
• | foreign exchange controls that might prevent us from repatriating cash earned outside the United States; |
22
• | economic and political instability in some countries, including terrorist attacks and civil unrest; |
• | less protective intellectual property laws; |
• | compliance with the laws of numerous foreign taxing jurisdictions in which we conduct business, potential double taxation of our international earnings and potentially adverse tax consequences due to changes in applicable U.S. and foreign tax laws; |
• | increased costs to establish and maintain effective controls at foreign locations; and |
• | overall higher costs of doing business internationally. |
If our revenue from our international operations does not exceed the expense of establishing and maintaining these operations, our business and operating results will suffer and we may decide to make changes to our business in an effort to mitigate losses. For example, in the third quarter of 2019, as part of a strategic initiative to reduce our expenses and align our operations with evolving business needs, we discontinued our physical operations in China.
Our European operations could be disrupted due to the United Kingdom's exit from the European Union, commonly referred to as "Brexit."
Our European headquarters are located in England, and we have offices in Germany, Ireland and Spain supporting brands and retailers throughout Europe. The United Kingdom left the European Union January 31, 2020. Under the current withdrawal agreement between the United Kingdom and the European Union, the United Kingdom will be subject to a transition period until December 31, 2020, or the Transition Period, during which European Union rules will continue to apply. The relationship between the United Kingdom and the European Union after the Transition Period has not been determined yet. As a result, the impact of Brexit is not yet known and depends on any agreements the United Kingdom and European Union may make to retain access to each other's markets after the Transition Period. The measures or lack of any agreement could disrupt the markets we serve and may increase costs for European consumers and our customers, which may cause consumers to reduce spending on products that our solutions serve and may cause customers to reduce their spending on our solutions. In addition, Brexit could lead to legal uncertainly and potentially divergent national laws and regulations, including with respect to data privacy. A withdrawal from the European Union is unprecedented and it is unclear what financial, trade, legal and employment implications the withdrawal of the United Kingdom from the European Union will have following the Transition Period and how the withdrawal will affect us. Our operations in the United Kingdom as well as in other countries in the European Union and European Economic Area could be disrupted by Brexit, particularly if there is a change in the United Kingdom’s relationship to the single market. There may continue to be economic uncertainty surrounding the consequences of Brexit that could adversely impact customer confidence, resulting in customers reducing their spending budgets on our solutions. These and other adverse consequences such as reduced consumer spending, deterioration in economic conditions, loss of key international employees, volatility in exchange rates, and prohibitive laws and regulations could have a negative impact on our business, operating results and financial condition.
We are subject to governmental export and import controls that could impair our ability to compete in international markets due to licensing requirements and subject us to liability if we are not in full compliance with applicable laws.
Our solutions are subject to export controls, including the Commerce Department's Export Administration Regulations and various economic and trade sanctions regulations established by the Treasury Department's Office of Foreign Assets Controls, and exports of our solutions must be made in compliance with these laws. If we fail to comply with these U.S. export control laws and import laws, including U.S. Customs regulations, we could be subject to substantial civil or criminal penalties, including the possible loss of export or import privileges, fines, which may be imposed on us and responsible employees or managers, and, in extreme cases, the incarceration of responsible employees or managers. Obtaining the necessary authorizations, including any required license, for a particular sale may be time-consuming, is not guaranteed and may result in the delay or loss of sales opportunities.
Furthermore, the U.S. export control laws and economic sanctions laws prohibit the shipment or export of specified products and services to U.S. embargoed or sanctioned countries, governments and persons. Even though we take precautions to prevent our solutions from impermissibly being provided to U.S. sanctions targets, if our solutions and services were to impermissibly be exported to those prohibited countries despite such precautions, we could be subject to government investigations, penalties, reputational harm or other negative consequences.
Any change in export or import regulations, economic sanctions or related laws, shift in the enforcement or scope of existing regulations, or change in the countries, governments, persons or technologies targeted by such regulations, could result in decreased use of our solutions, or in our decreased ability to export or sell our solutions to existing or potential customers
23
with international operations. Additionally, changes in our solutions may be required in response to changes in export and import regulations, which could lead to delays in the introduction and sale of our solutions in international markets, prevent our customers with international operations from deploying our solutions or, in some cases, prevent the export or import of our solutions to some countries, governments or persons altogether. Any decreased use of our solutions or limitation on our ability to export our solutions or sell them in international markets would hurt our revenue and compromise our ability to pursue our growth strategy.
RISKS RELATED TO INTELLECTUAL PROPERTY
We operate in an industry with extensive intellectual property litigation. Claims of infringement against us may hurt our business.
Our success depends, in part, upon non-infringement of intellectual property rights owned by others and being able to resolve claims of intellectual property infringement without major financial expenditures or adverse consequences. The internet-related software field generally is characterized by extensive intellectual property litigation. Although our industry is rapidly evolving, many companies that own, or claim to own, intellectual property have aggressively asserted their rights. From time to time, we have been subject to legal proceedings and claims relating to the intellectual property rights of others, and we expect that third parties will continue to assert intellectual property claims against us, particularly as we expand the complexity and scope of our business. In addition, most of our subscription agreements require us to indemnify our customers and business partners against claims that our solutions infringe the intellectual property rights of third parties.
Future litigation may be necessary to defend ourselves or our customers and business partners by determining the scope, enforceability, and validity of third-party proprietary rights or to establish our proprietary rights. Some of our competitors have substantially greater resources than we do and are able to sustain the costs of complex intellectual property litigation to a greater degree and for longer periods of time than we could. In addition, patent holding companies that focus solely on extracting royalties and settlements by enforcing patent rights may target us. Regardless of whether claims that we are infringing patents or other intellectual property rights have any merit, these claims are time-consuming and costly to evaluate and defend and could:
•hurt our reputation;
•adversely affect our relationships with our current or future customers;
•cause delays or stoppages in providing our services;
•divert management's attention and resources;
•require technology changes to our software that would cause us to incur substantial cost;
•subject us to significant liabilities; and
•require us to cease some or all of our activities.
In addition to liability for monetary damages against us, which may be tripled and may include attorneys' fees under certain statutes, or, in some circumstances, damages against our customers, we may be prohibited from developing, commercializing or continuing to provide some or all of our software solutions unless we obtain licenses from, and pay royalties to, the holders of the patents or other intellectual property rights, or license or develop substitute solutions, which may not be available on commercially favorable terms, or at all.
Our failure to protect our intellectual property rights could diminish the value of our services, weaken our competitive position and reduce our revenue.
We regard the protection of our intellectual property, which includes trade secrets, copyrights, trademarks, domain names and patent applications, as critical to our success. We strive to protect our intellectual property rights by relying on federal, state and common law rights, as well as contractual restrictions. We enter into confidentiality and invention assignment agreements with our employees and contractors, and confidentiality agreements with parties with whom we conduct business in order to limit access to, and disclosure and use of, our proprietary information. However, these contractual arrangements and the other steps we have taken to protect our intellectual property may not prevent the misappropriation of our proprietary information or deter independent development of similar technologies by others.
We have received patent protection for some of our technologies and are seeking patent protection for other of our technologies but there can be no assurance that any patents will ultimately be issued. We have registered domain names,
24
trademarks and service marks in the United States and in jurisdictions outside the United States and are also pursuing additional registrations. Effective trade secret, copyright, trademark, domain name and patent protection is expensive to develop and maintain, both in terms of initial and ongoing registration requirements and the costs of defending our rights. We may be required to protect our intellectual property in an increasing number of jurisdictions, a process that is expensive and may not be successful or which we may not pursue in every location. We may, over time, increase our investment in protecting our intellectual property through additional patent filings that could be expensive and time-consuming.
We have licensed in the past, and expect to license in the future, some of our proprietary rights, such as trademarks or copyrighted material, to third parties. These licensees may take actions that diminish the value of our proprietary rights or harm our reputation.
Monitoring unauthorized use of our intellectual property is difficult and costly. Our efforts to protect our proprietary rights may not be adequate to prevent misappropriation of our intellectual property. Further, we may not be able to detect unauthorized use of, or take appropriate steps to enforce, our intellectual property rights. Our competitors may also independently develop similar technology. In addition, the laws of many countries, such as China and India, do not protect our proprietary rights to as great an extent as do the laws of European countries and the United States. Further, the laws in the United States and elsewhere change rapidly, and any future changes could adversely affect us and our intellectual property. Our failure to meaningfully protect our intellectual property could result in competitors offering services that incorporate our most technologically advanced features, which could seriously reduce demand for our software solutions. In addition, we may in the future need to initiate infringement claims or litigation. Litigation, whether we are a plaintiff or a defendant, can be expensive, time-consuming and may divert the efforts of our technical staff and managerial personnel, which could harm our business, whether or not such litigation results in a determination that is unfavorable to us. In addition, litigation is inherently uncertain, and thus we may not be able to stop our competitors from infringing upon our intellectual property rights.
Our use of "open source" software could negatively affect our ability to sell our solutions and subject us to possible litigation.
A portion of our technology platform and our solutions incorporates so-called "open source" software, and we may incorporate additional open source software in the future. Open source software is generally licensed by its authors or other third parties under open source licenses. If we fail to comply with these licenses, we may be subject to specified conditions, including requirements that we offer our solutions that incorporate the open source software for no cost, that we make available source code for modifications or derivative works we create based upon, incorporating or using the open source software and that we license such modifications or derivative works under the terms of the particular open source license. If an author or other third party that distributes open source software we use were to allege that we had not complied with the conditions of one or more of these licenses, we could be required to incur significant legal expenses defending against such allegations and could be subject to significant damages, including being enjoined from the sale of our solutions that contained the open source software and required to comply with the foregoing conditions, which could disrupt the sale of the affected solutions. In addition, there have been claims challenging the ownership of open source software against companies that incorporate open source software into their products. As a result, we could be subject to suits by parties claiming ownership of what we believe to be open source software. Litigation could be costly for us to defend, have a negative effect on our operating results and financial condition and require us to devote additional research and development resources to change our products.
RISKS RELATED TO OWNERSHIP OF OUR COMMON STOCK
An active trading market for our common stock may not continue to develop or be sustained.
Although our common stock is listed on the New York Stock Exchange, or NYSE, we cannot assure you that an active trading market for our shares will continue to develop or be sustained. If an active market for our common stock does not continue to develop or is not sustained, it may be difficult for investors in our common stock to sell shares without depressing the market price for the shares or to sell the shares at all.
The trading price of the shares of our common stock has been and is likely to continue to be volatile.
Our stock price has been volatile. The stock market in general and the market for technology companies in particular have experienced extreme volatility that has often been unrelated to the operating performance of particular companies. As a result of this volatility, investors may not be able to sell their common stock at or above the price paid for the shares. The market price for our common stock may be influenced by many factors, including:
• | actual or anticipated variations in our operating results; |
• | changes in financial estimates by us or by any securities analysts who might cover our stock; |
25
• | conditions or trends in our industry; |
• | stock market price and volume fluctuations of comparable companies and, in particular, those that operate in the software industry; |
• | announcements by us or our competitors of new product or service offerings, significant acquisitions, strategic partnerships or divestitures; |
• | announcements of investigations or regulatory scrutiny of our operations or lawsuits filed against us; |
• | capital commitments; |
• | investors' general perception of our company and our business; |
• | recruitment or departure of key personnel; and |
• | sales of our common stock, including sales by our directors and officers or specific stockholders. |
Stockholders may initiate class action lawsuits against us following periods of volatility in the market prices of our common stock. For example, in 2015, two purported class action complaints were filed against us, alleging violations of the federal securities laws. The cases were later dismissed by federal courts without any liability to us. New litigation, if instituted against us, could cause us to incur substantial costs and divert management's attention and resources from our business.
If equity research analysts do not publish research or reports, or publish unfavorable research or reports, about us, our business or our market, our stock price and trading volume could decline.
The trading market for our common stock is influenced by the research and reports that equity research analysts publish about us and our business, and we have limited research coverage by equity research analysts. Equity research analysts may elect not to initiate or continue to provide research coverage of our common stock, and such lack of research coverage may adversely affect the market price of our common stock. Even if we have equity research analyst coverage, we will not have any control over the analysts or the content and opinions included in their reports. The price of our stock could decline if one or more equity research analysts downgrade our stock or issue other unfavorable commentary or research. If one or more equity research analysts ceases coverage of our company or fails to publish reports on us regularly, demand for our stock could decrease, which in turn could cause our stock price or trading volume to decline.
The issuance of additional stock in connection with financings, acquisitions, investments, our stock incentive plans or otherwise will dilute all other stockholders.
Our certificate of incorporation authorizes us to issue up to 100,000,000 shares of common stock and up to 5,000,000 shares of preferred stock with such rights and preferences as may be determined by our board of directors. Subject to compliance with applicable rules and regulations, we may issue our shares of common stock or securities convertible into our common stock from time to time in connection with a financing, acquisition, investment, our stock incentive plans or otherwise. Any such issuance could result in substantial dilution to our existing stockholders and cause the trading price of our common stock to decline.
Provisions in our corporate charter documents and under Delaware law may prevent or frustrate attempts by our stockholders to change our management and hinder efforts to acquire a controlling interest in us, and the market price of our common stock may be lower as a result.
There are provisions in our certificate of incorporation and bylaws that may make it difficult for a third party to acquire, or attempt to acquire, control of our company, even if a change in control was considered favorable by some or all of our stockholders. For example, our board of directors has the authority to issue up to 5,000,000 shares of preferred stock. The board of directors can fix the price, rights, preferences, privileges and restrictions of the preferred stock without any further vote or action by our stockholders. The issuance of shares of preferred stock may delay or prevent a change in control transaction. As a result, the market price of our common stock and the voting and other rights of our stockholders may be adversely affected. An issuance of shares of preferred stock may result in the loss of voting control to other stockholders.
Our charter documents also contain other provisions that could have an anti-takeover effect, including:
• | only one of our three classes of directors is elected each year; |
• | stockholders are not entitled to remove directors other than by a 66 2/3% vote and only for cause; |
26
• | stockholders are not permitted to take actions by written consent; |
• | stockholders cannot call a special meeting of stockholders; and |
• | stockholders must give advance notice to nominate directors or submit proposals for consideration at stockholder meetings. |
In addition, we are subject to the anti-takeover provisions of Section 203 of the Delaware General Corporation Law, which regulates corporate acquisitions by prohibiting Delaware corporations from engaging in specified business combinations with particular stockholders of those companies. These provisions could discourage potential acquisition proposals and could delay or prevent a change in control transaction. They could also have the effect of discouraging others from making tender offers for our common stock, including transactions that may be in your best interests. These provisions may also prevent changes in our management or limit the price that investors are willing to pay for our stock.
If we fail to maintain proper and effective internal controls, our ability to produce accurate financial statements on a timely basis could be impaired.
We are subject to the reporting requirements of the Exchange Act, the Sarbanes-Oxley Act of 2002, the Dodd-Frank Wall Street Reform and Consumer Protection Act of 2010, and the rules and regulations of the NYSE. The Sarbanes-Oxley Act requires, among other things, that we maintain effective disclosure controls and procedures and internal control over financial reporting and perform system and process evaluation and testing of our internal control over financial reporting to allow management to report on the effectiveness of our internal control over financial reporting. This requires that we incur substantial professional fees and internal costs to maintain appropriate and necessary accounting and finance functions and that we expend significant management efforts.
We may discover weaknesses in our system of internal financial and accounting controls and procedures that could result in a material misstatement of our financial statements, and we may in the future discover additional weaknesses that require improvement. In addition, our internal control over financial reporting will not prevent or detect all errors and all fraud. A control system, no matter how well designed and operated, can provide only reasonable, not absolute, assurance that the control system's objectives will be met. Because of the inherent limitations in all control systems, no evaluation of controls can provide absolute assurance that misstatements due to error or fraud will not occur or that all control issues and instances of fraud will be detected.
If we are unable to maintain proper and effective internal controls, we may not be able to produce timely and accurate financial statements. If that were to happen, the market price of our stock could decline and we could be subject to sanctions or investigations by the NYSE, the SEC or other regulatory authorities.
We do not anticipate paying any cash dividends on our common stock in the foreseeable future and our stock may not appreciate in value.
We have not declared or paid cash dividends on our common stock to date. We currently intend to retain our future earnings, if any, to fund the development and growth of our business. In addition, the terms of any existing or future debt agreements may preclude us from paying dividends. There is no guarantee that shares of our common stock will appreciate in value or that the price at which our stockholders have purchased their shares will be able to be maintained.
We may need additional capital in the future to meet our financial obligations and to pursue our business objectives. Additional capital may not be available on favorable terms, or at all, which could compromise our ability to meet our financial obligations and grow our business.
While we anticipate that our existing cash, together with our cash flow from operations, will be sufficient to fund our operations for at least the next twelve months, we may need to raise additional capital to fund operations in the future or to meet various objectives, including developing future technologies and services, increasing working capital, acquiring businesses and responding to competitive pressures. If we seek to raise additional capital, it may not be available on favorable terms or may not be available at all. Lack of sufficient capital resources could significantly limit our ability to manage our business and to take advantage of business and strategic opportunities. Any additional capital raised through the sale of equity or debt securities with an equity component would dilute our stock ownership. If adequate additional funds are not available, we may be required to delay, reduce the scope of or eliminate material parts of our business strategy, including potential additional acquisitions or development of new technologies.
27
ITEM 1B. UNRESOLVED STAFF COMMENTS
None.
ITEM 2. PROPERTIES
Our principal offices occupy approximately 110,000 square feet of leased office space in Morrisville, North Carolina pursuant to a lease agreement that expires in October 2022.
We also maintain sales, service, support and research and development offices in various domestic and international locations. Please refer to our website www.channeladvisor.com for a complete list of our domestic and international office locations.
We believe that our current facilities are suitable and adequate to meet our current needs. We may add new facilities or expand existing facilities as we add employees, and we believe that suitable additional or substitute space will be available as needed to accommodate any such expansion of our operations.
ITEM 3. LEGAL PROCEEDINGS
The information required by this item is set forth under Note 6, "Commitments and Contingencies," in our consolidated financial statements included in Item 8 of this Annual Report, and is incorporated herein by reference.
ITEM 4. MINE SAFETY DISCLOSURES
Not applicable.
28
PART II
ITEM 5. MARKET FOR REGISTRANT'S COMMON EQUITY, RELATED STOCKHOLDER MATTERS AND ISSUER PURCHASES OF EQUITY SECURITIES
MARKET INFORMATION FOR COMMON STOCK
Our common stock is listed on the NYSE under the symbol "ECOM."
STOCK PERFORMANCE GRAPH
The graph set forth below compares the cumulative total stockholder return on an initial investment of $100 in our common stock from December 31, 2014 through December 31, 2019, with the comparative cumulative total return of such amount on (i) the Dow Jones Industrial Average Total Return and (ii) the Nasdaq Computer Index over the same period. We have not paid any cash dividends and, therefore, the cumulative total return calculation for us is based solely upon our stock price appreciation or depreciation and does not include any reinvestment of cash dividends.
The comparisons shown in the graph below are based upon historical data. We caution that the stock price performance shown in the graph below is not necessarily indicative of, nor is it intended to forecast, the potential future performance of our common stock.
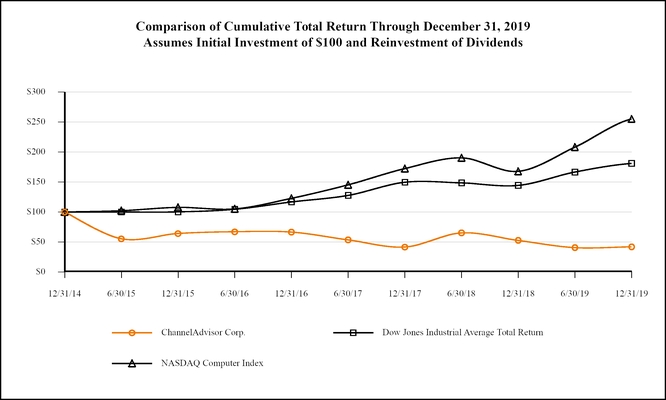
The information presented above in the stock performance graph shall not be deemed to be "soliciting material" or to be "filed" with the SEC or subject to Regulation 14A or 14C, except to the extent that we subsequently specifically request that such information be treated as soliciting material or specifically incorporate it by reference into a filing under the Securities Act or a filing under the Exchange Act.
STOCKHOLDERS
As of February 1, 2020, there were 65 holders of record of our common stock. The actual number of stockholders is greater than this number of record holders and includes stockholders who are beneficial owners but whose shares are held in street name by brokers and other nominees. This number of holders of record also does not include stockholders whose shares may be held in trust by other entities.
29
RECENT SALES OF UNREGISTERED SECURITIES
None.
PURCHASES OF EQUITY SECURITIES BY THE ISSUER AND AFFILIATED PARTIES
None.
30
ITEM 6. SELECTED FINANCIAL DATA
The following selected consolidated financial data as of and for the years ended December 31, 2019, 2018, 2017, 2016 and 2015 is derived from our audited consolidated financial statements. Our historical results are not necessarily indicative of the results to be expected in the future. The selected consolidated financial data should be read together with Item 7 "Management's Discussion and Analysis of Financial Condition and Results of Operations" and in conjunction with the consolidated financial statements, related notes, and other financial information included elsewhere in this Annual Report.
Year Ended December 31, | |||||||||||||||||||
2019 | 2018 | 2017 | 2016 | 2015 | |||||||||||||||
(in thousands, except share and per share data) | |||||||||||||||||||
Consolidated statements of operations data: | |||||||||||||||||||
Revenue | $ | 129,959 | $ | 131,218 | $ | 122,535 | $ | 113,200 | $ | 100,585 | |||||||||
Gross profit (1) | 100,951 | 101,717 | 93,433 | 82,130 | 71,695 | ||||||||||||||
Income (loss) from operations | 3,802 | (7,506 | ) | (16,578 | ) | (13,837 | ) | (21,193 | ) | ||||||||||
Net income (loss) | $ | 3,482 | $ | (7,601 | ) | $ | (16,557 | ) | $ | (8,007 | ) | $ | (20,951 | ) | |||||
Net income (loss) per share—basic | $ | 0.12 | $ | (0.28 | ) | $ | (0.63 | ) | $ | (0.31 | ) | $ | (0.84 | ) | |||||
Net income (loss) per share—diluted | $ | 0.12 | $ | (0.28 | ) | $ | (0.63 | ) | $ | (0.31 | ) | $ | (0.84 | ) | |||||
Weighted average shares of common stock outstanding used in computing net income (loss) per share—basic | 27,886,278 | 27,138,274 | 26,366,748 | 25,604,893 | 25,062,610 | ||||||||||||||
Weighted average shares of common stock outstanding used in computing net income (loss) per share—diluted | 28,816,977 | 27,138,274 | 26,366,748 | 25,604,893 | 25,062,610 | ||||||||||||||
Other financial data: | |||||||||||||||||||
Adjusted EBITDA (2) | $ | 20,158 | $ | 9,782 | $ | 4,569 | $ | 7,436 | $ | 1,443 | |||||||||
____________________________
(1) | Certain prior period amounts have been reclassified to conform to current period presentation. These reclassifications had no impact on reported income (loss) from operations or net income (loss) for the years ended December 31, 2017, 2016 and 2015. Refer to Note 2, "Significant Accounting Policies," for further detail. |
(2) | We define adjusted EBITDA as net income (loss) plus or (minus): income tax expense (benefit); interest (income) expense, net; depreciation and amortization; and stock-based compensation. For some periods, we have also excluded non-recurring costs, such as severance and related costs; a one-time charge for VDAs and settlement of an audit related to sales taxes; or headquarters relocation and related costs. Please see "—Adjusted EBITDA" below for more information and for a reconciliation of adjusted EBITDA to net income (loss), the most directly comparable financial measure calculated and presented in accordance with accounting principles generally accepted in the United States, or U.S. GAAP. |
As of December 31, | |||||||||||||||||||
2019 | 2018 | 2017 | 2016 | 2015 | |||||||||||||||
(in thousands) | |||||||||||||||||||
Consolidated balance sheets data: | |||||||||||||||||||
Cash and cash equivalents | $ | 51,785 | $ | 47,185 | $ | 53,422 | $ | 65,420 | $ | 60,474 | |||||||||
Accounts receivable, net | 22,126 | 23,436 | 27,452 | 19,445 | 18,949 | ||||||||||||||
Total assets | 146,867 | 134,269 | 140,511 | 139,158 | 130,956 | ||||||||||||||
Total liabilities | 47,218 | 44,631 | 58,600 | 52,161 | 47,032 | ||||||||||||||
Additional paid-in capital | 278,111 | 271,550 | 262,805 | 252,158 | 240,360 | ||||||||||||||
Total stockholders' equity | 99,649 | 89,638 | 81,911 | 86,997 | 83,924 | ||||||||||||||
ADJUSTED EBITDA
To provide investors with additional information regarding our financial results, we have provided within this Annual Report adjusted EBITDA, a non-GAAP financial measure. We have provided a reconciliation below of adjusted EBITDA to net income (loss), the most directly comparable GAAP financial measure.
We have included adjusted EBITDA in this Annual Report because it is a key measure used by our management and board of directors to understand and evaluate our operating performance and trends, to prepare and approve our annual budget
31
and to develop short- and long-term operational plans. In particular, the exclusion of some income and expenses in calculating adjusted EBITDA can provide a useful measure for period-to-period comparisons of our business. Accordingly, we believe that adjusted EBITDA provides useful information to investors in understanding and evaluating our operating results.
Our use of adjusted EBITDA has limitations as an analytical tool, and you should not consider it in isolation or as a substitute for analysis of our results as reported under GAAP. Some of these limitations are:
• | although depreciation and amortization are non-cash charges, the assets being depreciated and amortized may have to be replaced in the future, and adjusted EBITDA does not reflect cash capital expenditure requirements for such replacements or for new capital expenditure requirements; |
• | adjusted EBITDA does not reflect changes in, or cash requirements for, our working capital needs; |
• | adjusted EBITDA does not reflect the potentially dilutive impact of equity-based compensation; |
• | adjusted EBITDA does not reflect interest or income tax payments that may represent a reduction in cash available to us; and |
• | other companies, including companies in our industry, may calculate adjusted EBITDA differently, which reduces its usefulness as a comparative measure. |
Because of these and other limitations, you should consider adjusted EBITDA together with other GAAP-based financial performance measures, including various cash flow metrics, net income (loss) and our other GAAP results. The following table presents a reconciliation of net income (loss) to adjusted EBITDA for each of the periods indicated:
Year Ended December 31, | |||||||||||||||||||
2019 | 2018 | 2017 | 2016 | 2015 | |||||||||||||||
(in thousands) | |||||||||||||||||||
Net income (loss) | $ | 3,482 | $ | (7,601 | ) | $ | (16,557 | ) | $ | (8,007 | ) | $ | (20,951 | ) | |||||
Adjustments: | |||||||||||||||||||
Interest (income) expense, net | (754 | ) | (510 | ) | (222 | ) | 1 | 184 | |||||||||||
Income tax expense (benefit) | 689 | 614 | 284 | (5,658 | ) | (185 | ) | ||||||||||||
Depreciation and amortization expense | 6,336 | 6,094 | 6,578 | 7,838 | 8,793 | ||||||||||||||
Total adjustments, net | 6,271 | 6,198 | 6,640 | 2,181 | 8,792 | ||||||||||||||
EBITDA | 9,753 | (1,403 | ) | (9,917 | ) | (5,826 | ) | (12,159 | ) | ||||||||||
Stock-based compensation expense | 8,976 | 10,598 | 11,947 | 13,262 | 11,837 | ||||||||||||||
Non-recurring severance and related costs | 1,429 | 587 | — | — | 656 | ||||||||||||||
One-time charge for VDAs related to sales taxes | — | — | 2,539 | — | — | ||||||||||||||
Headquarters relocation and related costs | — | — | — | — | 1,109 | ||||||||||||||
Adjusted EBITDA | $ | 20,158 | $ | 9,782 | $ | 4,569 | $ | 7,436 | $ | 1,443 | |||||||||
32
ITEM 7. MANAGEMENT'S DISCUSSION AND ANALYSIS OF FINANCIAL CONDITION AND RESULTS OF OPERATIONS
You should read the following discussion and analysis of our financial condition and results of operations together with our consolidated financial statements and the related notes and other financial information included elsewhere in this Annual Report. Some of the information contained in this discussion and analysis or set forth elsewhere in this Annual Report, including information with respect to our plans and strategy for our business, includes forward-looking statements that involve risks and uncertainties. You should review Item 1A. "Risk Factors" and "Special Note Regarding Forward-Looking Statements" in this Annual Report for a discussion of important factors that could cause actual results to differ materially from the results described in or implied by the forward-looking statements contained in the following discussion and analysis.
EXECUTIVE OVERVIEW
FINANCIAL RESULTS
• | Total revenue of $130.0 million for the year ended December 31, 2019 decreased 1.0% from the prior year; |
• | Average revenue per customer of $47,891 for the year ended December 31, 2019 increased 3.5% compared with $46,286 for the prior year; |
• | Revenue was comprised of 79.6% and 20.4% fixed and variable subscription fees, respectively, for the year ended December 31, 2019 compared with 76.3% and 23.7% fixed and variable subscription fees, respectively, for the prior year; |
• | Revenue derived from customers located outside of the United States as a percentage of total revenue was 25.2% for the year ended December 31, 2019 compared with 23.9% for the prior year; |
• | Revenue from our brands customers represented 26.1% of total revenue for the year ended December 31, 2019, up from 21.7% for the year ended December 31, 2018; |
• | Gross margin of 77.7% for the year ended December 31, 2019 improved by 20 basis points compared with gross margin of 77.5% for the prior year; |
• | Operating margin of 2.9% for the year ended December 31, 2019 improved 860 basis points compared with operating margin of (5.7)% for the prior year; |
• | Net income was $3.5 million for the year ended December 31, 2019 compared with a net loss of $7.6 million for the prior year; |
• | Adjusted EBITDA, a non-GAAP measure, of $20.2 million for the year ended December 31, 2019 increased 106.1% compared with adjusted EBITDA of $9.8 million for the prior year; |
• | Cash and cash equivalents were $51.8 million at December 31, 2019 compared with $47.2 million at December 31, 2018; |
• | Operating cash flow was $13.0 million for the year ended December 31, 2019 compared with $1.2 million for the prior year; and |
• | Free cash flow, a non-GAAP measure, was $9.3 million for the year ended December 31, 2019 compared with $(1.7) million for the prior year. |
TRENDS IN OUR BUSINESS
The following trends have contributed to the results of our consolidated operations, and we anticipate that they will continue to impact our future results:
• | Growth in Online Shopping. Consumers continue to move more of their retail spending from offline to online retail. The continuing shift to online shopping and overall growth has contributed to our historical growth and we expect that this online shift will continue to benefit our business. |
• | Product Offering Expansion. As online shopping evolves, we continue to expand our product offerings to reflect the needs of companies seeking to attract consumers. We continue to enhance our product offerings by increasing online shopping channel integrations, including marketplace and first-party retail programs, and providing capabilities that allow brands and retailers to be more competitive. This includes support for advertising, advanced algorithmic repricing, machine learning-based demand forecasting, and improving our analytics capabilities, fulfillment features and user experience. |
33
• | Growth in Mobile Usage. We believe the shift toward mobile commerce will increasingly favor aggregators such as Amazon, eBay, Google and Walmart, all of which are focal points of our platform. These systems understand the identity of the buyer, helping to reduce friction in the mobile commerce process, while offering a wide selection of merchandise in a single location. The growth in mobile commerce may result in increased revenue for us. |
• | Shift to Larger Customers Through Our Direct Sales Channel. We believe that the growth in online shopping increasingly favors larger enterprises. This move impacts our business both in longer sales cycles as well as increased average revenue per customer. |
• | Evolving Fulfillment Landscape. Consumers have been conditioned to expect fast, efficient delivery of products. We believe that determining and executing on a strategy to more expeditiously receive, process and deliver online orders, which we refer to collectively as fulfillment, is critical to success for online sellers. Therefore, it will be increasingly important for us to facilitate and optimize fulfillment services on behalf of our customers, which in turn may result in additional research and development investment. |
• | Focus on Employees. We strive to provide competitive compensation and benefits programs to help attract and retain employees who are focused on facilitating the success of our customers. |
• | Seasonality. Our revenue fluctuates as a result of seasonal variations in our business, principally due to the peak consumer demand and related increased volume of our customers' GMV during the year-end holiday season. As a result, we have historically had higher revenue in our fourth quarter than other quarters due to increased GMV processed through our platform, resulting in higher variable subscription fees. |
OPPORTUNITIES AND RISKS
• | Dynamic E-commerce Landscape. We need to continue to innovate in the face of a rapidly changing e-commerce landscape if we are to remain competitive. |
• | Brands and Retailers. As consumer preferences potentially shift from smaller retailers to brands and large retailers, we need to continue to add brands and large retailers as profitable customers. Brands in particular tend to have longer customer life cycles, stronger financial stability and overall better unit economics. Brands also offer increased expansion opportunities to grow their e-commerce business through our platform. These customers generally pay a lower percentage of GMV as fees to us based on the relatively higher volume of their GMV processed through our platform. To help drive our future growth, we have made significant investments in our sales force and allocated resources focused on growing our customer base of brands and large retailers. We continue to focus our efforts on increasing value for our customers to support higher rates. |
• | Strategic Partnerships. Our business development team's mission is to expand our sales and market opportunities through strategic partner relationships. We plan to continue to invest in initiatives to expand our strategic partnership base to further enhance our offerings for brands and retailers and to help support our indirect sales channel efforts. The goal of these strategic partnerships is to further improve the value of our platform for our customers and, when possible, provide us opportunities for incremental revenue streams. |
• | Increasing Complexity of E-commerce. Although e-commerce continues to expand as brands and retailers continue to increase their online sales, it is also becoming more complex due to the hundreds of channels available to brands and retailers and the rapid pace of change and innovation across those channels. In order to gain consumers' attention in a more crowded and competitive online marketplace, an increasing number of brands and many retailers sell their merchandise through multiple online channels, each with its own rules, requirements and specifications. In particular, third-party marketplaces are an increasingly important driver of growth for a number of brands and large online retailers. As a result, we need to continue to support multiple channels in a variety of geographies in order to support our targeted revenue growth. |
• | Global Growth in E-commerce. We believe the growth in e-commerce globally presents an opportunity for brands and retailers to engage in international sales. However, country-specific marketplaces are often a market share leader in their regions, as is the case for Zalando in Europe. In order to help our customers capitalize on this potential market opportunity, and to address our customers' needs with respect to cross-border trade, we intend to continue to invest in our international operations. Doing business overseas involves substantial challenges, including management attention and resources needed to adapt to multiple languages, cultures, laws and commercial infrastructure, as further described in this report under the caption "Risks Related to our International Operations." |
34
Our senior management continuously focuses on these and other trends and challenges, and we believe that our culture of innovation and our history of growth and expansion will contribute to the success of our business. We cannot, however, assure you that we will be successful in addressing and managing the many challenges and risks that we face.
35
KEY FINANCIAL AND OPERATING METRICS
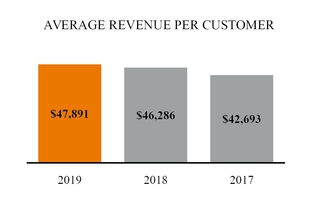
The average revenue generated per customer is a primary determinant of our revenue. We calculate this metric by dividing our revenue for a particular period by the average monthly number of customers during the period, which is calculated by taking the sum of the number of customers at the end of each month in the period and dividing by the number of months in the period. We typically calculate average revenue per customer in absolute dollars on a trailing twelve-month, or TTM, basis, but we may also calculate percentage changes in average revenue per customer on a quarterly basis in order to help us evaluate our period-over-period performance. For purposes of this metric and the number of customers metric described below, we include all customers who subscribe to at least one of our solutions, as well as strategic partners from which we receive revenue.
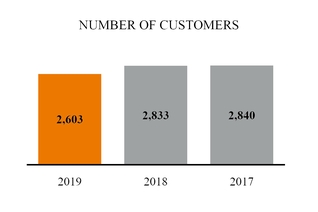
The number of customers has decreased during 2019, primarily due to a decline in the number of small retail customers as well as the anticipated decline in customers based in China following our office closure in this market in July 2019. We continue our focus on obtaining brands and large retailers as customers, which may represent a smaller number of total customers, but a potentially larger source of predictable or sustainable recurring revenue as well as higher average revenue per customer as presented above.
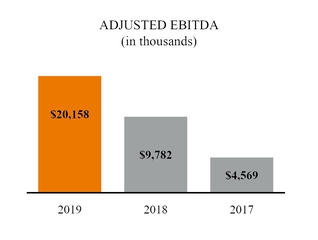
Adjusted EBITDA represents our earnings before interest (income) expense, income tax expense (benefit) and depreciation and amortization, adjusted to eliminate stock-based compensation expense, which is a non-cash item, as well as non-recurring severance and related costs for 2019 and 2018 (refer to Note 11, "Restructuring," to our consolidated financial statements included elsewhere in this Annual Report for additional information regarding non-recurring severance and related costs) and a one-time charge of $2.5 million in 2017 for VDAs and settlement of an audit related to sales taxes (refer to Note 6, "Commitments and Contingencies," to our consolidated financial statements included elsewhere in this Annual Report for additional information regarding this one-time charge). Adjusted EBITDA for the year ended December 31, 2018 was favorably impacted by our adoption of Accounting Standards Update No. 2014-09, Revenue from Contracts with Customers (Topic 606), or ASC 606, due to our capitalization of contract costs that had been expensed as incurred in periods prior to January 1, 2018. We believe that adjusted EBITDA provides useful information to management and others in understanding and evaluating our operating results. However, adjusted EBITDA is not a measure calculated in accordance with U.S. GAAP and should not be considered as an alternative to any measure of financial performance calculated and presented in accordance with U.S. GAAP. In addition, adjusted EBITDA may not be comparable to similarly titled measures of other companies because other companies may not calculate adjusted EBITDA in the same manner that we do. Please refer to Item 6. "Selected Financial Data—Adjusted EBITDA" in this Annual Report for a discussion of the limitations of adjusted EBITDA and a reconciliation of adjusted EBITDA to net income (loss), the most comparable U.S. GAAP measurement.
36
RESULTS OF OPERATIONS
The following tables set forth our consolidated statement of operations data and such data expressed as a percentage of revenues for each of the periods indicated.
Year Ended December 31, | Period-to-Period Change | ||||||||||||||||||||||
2019 | 2018 | 2017 | 2019 to 2018 | 2018 to 2017 | |||||||||||||||||||
(dollars in thousands) | |||||||||||||||||||||||
Revenue | $ | 129,959 | $ | 131,218 | $ | 122,535 | $ | (1,259 | ) | (1.0 | )% | $ | 8,683 | 7.1 | % | ||||||||
Cost of revenue | 29,008 | 29,501 | 29,102 | (493 | ) | (1.7 | ) | 399 | 1.4 | ||||||||||||||
Gross profit | 100,951 | 101,717 | 93,433 | (766 | ) | (0.8 | ) | 8,284 | 8.9 | ||||||||||||||
Operating expenses: | |||||||||||||||||||||||
Sales and marketing | 52,813 | 60,080 | 60,343 | (7,267 | ) | (12.1 | ) | (263 | ) | (0.4 | ) | ||||||||||||
Research and development | 19,200 | 22,359 | 21,868 | (3,159 | ) | (14.1 | ) | 491 | 2.2 | ||||||||||||||
General and administrative | 25,136 | 26,784 | 27,800 | (1,648 | ) | (6.2 | ) | (1,016 | ) | (3.7 | ) | ||||||||||||
Total operating expenses | 97,149 | 109,223 | 110,011 | (12,074 | ) | (11.1 | ) | (788 | ) | (0.7 | ) | ||||||||||||
Income (loss) from operations | 3,802 | (7,506 | ) | (16,578 | ) | 11,308 | 9,072 | ||||||||||||||||
Other income (expense): | |||||||||||||||||||||||
Interest income (expense), net | 754 | 510 | 222 | 244 | 47.8 | 288 | 129.7 | ||||||||||||||||
Other income (expense), net | (385 | ) | 9 | 83 | (394 | ) | * | (74 | ) | (89.2 | ) | ||||||||||||
Total other income (expense) | 369 | 519 | 305 | (150 | ) | (28.9 | ) | 214 | 70.2 | ||||||||||||||
Income (loss) before income taxes | 4,171 | (6,987 | ) | (16,273 | ) | 11,158 | 9,286 | ||||||||||||||||
Income tax expense | 689 | 614 | 284 | 75 | 12.2 | 330 | 116.2 | ||||||||||||||||
Net income (loss) | $ | 3,482 | $ | (7,601 | ) | $ | (16,557 | ) | $ | 11,083 | $ | 8,956 | |||||||||||
* Not meaningful.
Year Ended December 31, | ||||||||
2019 | 2018 | 2017 | ||||||
(as a percentage of revenue) | ||||||||
Revenue | 100.0 | % | 100.0 | % | 100.0 | % | ||
Cost of revenue | 22.3 | 22.5 | 23.7 | |||||
Gross profit | 77.7 | 77.5 | 76.3 | |||||
Operating expenses: | ||||||||
Sales and marketing | 40.6 | 45.8 | 49.2 | |||||
Research and development | 14.8 | 17.0 | 17.8 | |||||
General and administrative | 19.3 | 20.4 | 22.7 | |||||
Total operating expenses | 74.8 | 83.2 | 89.8 | |||||
Income (loss) from operations | 2.9 | (5.7 | ) | (13.5 | ) | |||
Other income (expense): | ||||||||
Interest income (expense), net | 0.6 | 0.4 | 0.2 | |||||
Other income (expense), net | (0.3 | ) | — | 0.1 | ||||
Total other income (expense) | 0.3 | 0.4 | 0.2 | |||||
Income (loss) before income taxes | 3.2 | (5.3 | ) | (13.3 | ) | |||
Income tax expense | 0.5 | 0.5 | 0.2 | |||||
Net income (loss) | 2.7 | (5.8 | ) | (13.5 | ) | |||
37
REVENUE
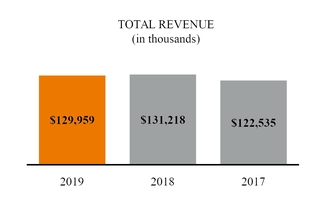
We derive the majority of our revenue from subscription fees paid to us by our customers for access to and usage of our SaaS solutions for a specified contract term, which is usually one year. A portion of the subscription fee is typically fixed and based on a specified minimum amount of GMV or advertising spend that a customer expects to process through our platform. The remaining portion of the subscription fee is variable and is based on a specified percentage of GMV or advertising spend processed through our platform in excess of the customer's specified minimum GMV or advertising spend amount. In most cases, the specified percentage of excess GMV or advertising spend on which the variable portion of the subscription is based is fixed and does not vary depending on the amount of the excess. We also receive implementation fees, which may include fees for providing launch assistance and training.
Because our customer contracts generally contain both fixed and variable pricing components, changes in GMV between periods do not translate directly or linearly into changes in our revenue. We use customized pricing structures for each of our customers depending upon the individual situation of the customer. For example, some customers may commit to a higher specified minimum GMV amount per month in exchange for a lower fixed percentage fee on that committed GMV. In addition, the percentage fee assessed on the variable GMV in excess of the committed minimum for each customer is typically higher than the fee on the fixed, committed portion. As a result, our overall revenue could increase or decrease even without any change in overall GMV between periods, depending on which customers generated the GMV. In addition, changes in GMV from month to month for any individual customer that are below the specified minimum amount would have no effect on our revenue from that customer, and each customer may alternate between being over the committed amount or under it from month to month. For these reasons, while GMV is an important qualitative and long-term directional indicator, we do not regard it as a useful quantitative measurement of our historic revenues or as a predictor of future revenues.
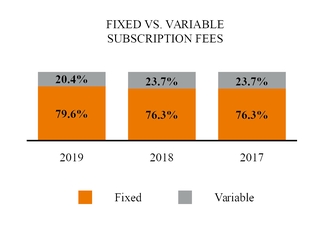
We recognize fixed subscription fees and implementation fees ratably over the contract period beginning on the date the customer has access to the software. In determining the amount of revenue to be recognized, we apply the following steps:
• | Identify the promised services in the contract; |
• | Determine whether the promised services are performance obligations, including whether they are distinct in the context of the contract; |
• | Determine the transaction price; |
• | Allocate the transaction price to the performance obligations based on estimated selling prices; and |
• | Recognize revenue as we satisfy each performance obligation. |
38
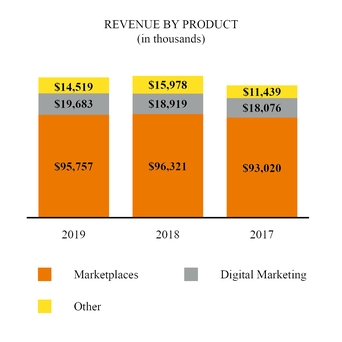
The primary products we offer are:
• | Marketplaces. Our Marketplaces module connects brands and retailers to third-party marketplaces such as Amazon, eBay, Google, Newegg, Overstock.com, Rakuten, Target, TradeMe, Walmart and Zalando. |
• | Digital Marketing. Our Digital Marketing module connects brands and retailers to comparison shopping websites, such as Google Shopping and Shopzilla, and social commerce sites, such as Facebook, Instagram and Pinterest, and supports advertising programs on some marketplaces, such as Amazon and eBay. |
• | Other. Other revenue is derived from channel integration agreements, as well as our Where to Buy and Product Intelligence solutions. We enter into integration agreements with certain marketplaces or channels under which the business partner engages us to integrate our platform with their marketplace or channel. Our Where to Buy solution allows customers to provide their web visitors or digital marketing audiences with up-to-date information about the authorized resellers that carry their products and the availability of those products. Our Product Intelligence solution provides customers with insights about online assortment, product coverage gaps, pricing trends and adherence by their retailers to content guidelines. |
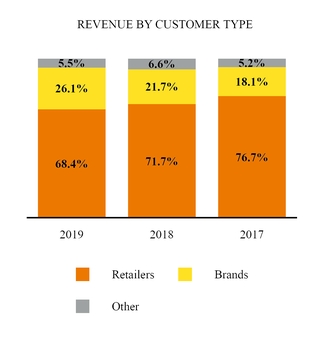
Our customers are categorized as follows:
• | Retailers. We generally categorize a customer as a retailer if it primarily focuses on selling third-party goods to consumers. |
• | Brands. We generally categorize a customer as a brand if it primarily focuses on designing, manufacturing and selling its own proprietary products. |
• | Other. Other is primarily comprised of agencies who use our solutions on behalf of their retail or brand customers. |
39
We generally invoice our customers for the fixed portion of the subscription fee in advance, in monthly, quarterly, semi-annual or annual installments. We invoice our customers for the implementation fee at the inception of the arrangement. Fixed subscription and implementation fees that have been invoiced are initially recorded as deferred revenue and are generally recognized ratably over the contract term.
In general, we invoice and recognize revenue from the variable portion of subscription fees in the period in which the related GMV or advertising spend is processed.
Comparison of 2019 to 2018
Revenue decreased by 1.0%, or $(1.3) million, to $130.0 million for the year ended December 31, 2019 compared with $131.2 million for the prior year. The change was primarily due to a $4.5 million decline in variable revenue, primarily due to a shift in our revenue mix from variable to fixed resulting from more customers moving to higher fixed fee tiers and some of our strategic partner agreements evolving to incorporate more fixed fees instead of purely variable revenues. This decrease was partially offset by a $3.3 million increase in fixed revenue primarily attributable to growth in our international operations, as well as continued revenue growth from our brands customers. For the year ended December 31, 2019, brands customers represented approximately 26% of our total revenue compared to approximately 22% for year ended December 31, 2018.
Average revenue per customer increased 3.5%, to $47,891 for the year ended December 31, 2019 compared with $46,286 for the year ended December 31, 2018. The increase in the average revenue per customer was primarily driven by our continued focus on obtaining brands and large retailers as customers, which may represent a smaller number of total customers, but a potentially larger source of predictable and sustainable recurring revenue.
Comparison of 2018 to 2017
Revenue increased by 7.1%, or $8.7 million, to $131.2 million for the year ended December 31, 2018 compared with $122.5 million for the prior year primarily due to an increase in the average revenue per customer.
Average revenue per customer increased 8.4% to $46,286 for the year ended December 31, 2018 compared with $42,693 for the year ended December 31, 2017. The increase in the average revenue per customer was primarily driven by the growth of revenue derived from our marketplaces solution. This growth was largely attributable to an overall increase in transaction volume. In addition, the increase in average revenue per customer was due in part to our established customers who have increased their revenue over time on our platform. In general, as customers mature they generate a higher amount of GMV from which we derive revenue and in some cases they may subscribe to additional modules on our platform, thereby increasing our subscription revenue.
In addition, other revenue increased by 39.7%, or $4.5 million, to $16.0 million for the year ended December 31, 2018 compared with $11.4 million for the prior year largely due to growth in revenue derived from our Where to Buy solution, attributable to both new and expanded contractual arrangements.
COST OF REVENUE
40
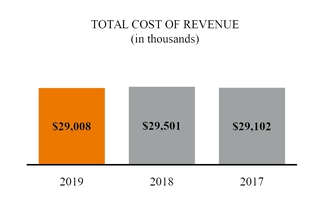
Cost of revenue primarily consists of:
• | Salaries and personnel-related costs for employees providing services to our customers and supporting our platform infrastructure, including benefits, bonuses and stock-based compensation; |
• | Co-location facility costs for our data centers; |
• | Infrastructure maintenance costs; and |
• | Fees we pay to credit card vendors in connection with our customers' payments to us. |
Comparison of 2019 to 2018
Cost of revenue decreased by 1.7%, or $0.5 million, to $29.0 million for the year ended December 31, 2019 compared with $29.5 million for the prior year. The change was comprised primarily of (decreases) increases of:
41
• | $(0.6) million in compensation and employee-related costs due to reductions in headcount, primarily as a result of the implementation of a plan, or the 2019 Actions, to reduce our expenses and align our operations with evolving business needs in the third quarter of 2019; partially offset by |
• | $0.2 million in non-recurring severance and related costs in connection with the 2019 Actions. |
Comparison of 2018 to 2017
Cost of revenue increased by 1.4%, or $0.4 million, to $29.5 million for the year ended December 31, 2018 compared with $29.1 million for the prior year. The change was comprised primarily of an increase in contractor costs to support our services team.
OPERATING EXPENSES
SALES AND MARKETING EXPENSE
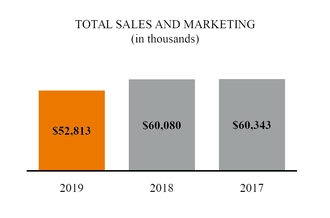
Sales and marketing expense consists primarily of:
• | Salaries and personnel-related costs for our sales and marketing and customer support employees, including benefits, bonuses and stock-based compensation; |
• | Amortization of capitalized sales commissions and related incentive payments over their expected term of benefit; |
• | Marketing, advertising and promotional event programs; and |
• | Corporate communications. |
Comparison of 2019 to 2018
Sales and marketing expense decreased by 12.1%, or $7.3 million, to $52.8 million for the year ended December 31, 2019 compared with $60.1 million for the prior year. The change was comprised primarily of (decreases) increases of:
• | $(5.5) million in compensation and employee-related costs, including stock-based compensation expense, due to reductions in headcount, primarily as a result of the 2019 Actions; and |
• | $(1.6) million in promotional event programs, marketing, advertising and travel, primarily due to reductions in costs associated with our annual e-commerce conference; partially offset by |
• | $0.4 million in non-recurring severance and related costs in connection with the 2019 Actions. |
Comparison of 2018 to 2017
Sales and marketing expense decreased by 0.4%, or $0.3 million, to $60.1 million for the year ended December 31, 2018 compared with $60.3 million for the prior year. The change was comprised primarily of (decreases) increases of:
• | $(6.8) million due to the deferral of sales commissions and a portion of other incentive compensation, referred to collectively as contract costs, which were expensed as incurred prior to our adoption of ASC 606 at the beginning of 2018; and |
• | $(0.3) million in professional fees, including consulting and contractor services; partially offset by |
• | $6.8 million in compensation and employee-related costs, mainly due to additional headcount to support our sales and marketing organization to continue to grow our business. |
RESEARCH AND DEVELOPMENT EXPENSE
42
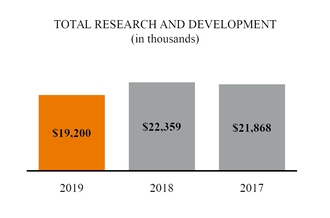
Research and development expense consists primarily of:
• | Salaries and personnel-related costs for our research and development employees, including benefits, bonuses and stock-based compensation; |
• | Costs related to the development, quality assurance and testing of new technology and enhancement of our existing platform technology; and |
• | Consulting expenses. |
Comparison of 2019 to 2018
Research and development expense decreased by 14.1%, or $3.2 million, to $19.2 million for the year ended December 31, 2019 compared with $22.4 million for the prior year. The change was comprised primarily of (decreases) increases of:
• | $(2.0) million in compensation and employee-related costs, mainly due to an increase in capitalized employee-related costs attributable to software development to support the enhancement of our product offerings; and |
• | $(0.7) million in compensation and employee-related costs due to shifting certain research and development to lower cost office locations. |
Comparison of 2018 to 2017
Research and development expense increased by 2.2%, or $0.5 million, to $22.4 million for the year ended December 31, 2018 compared with $21.9 million for the prior year. The change was comprised primarily of an increase in compensation and employee-related costs due to an increase in headcount to support our growth and the enhancement of our product offerings.
GENERAL AND ADMINISTRATIVE EXPENSE
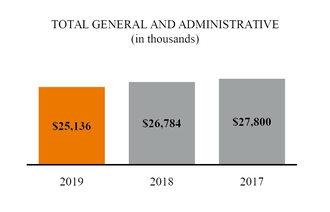
General and administrative expense consists primarily of:
• | Salaries and personnel-related costs for administrative, finance and accounting, information systems, legal and human resource employees, including benefits, bonuses and stock-based compensation; |
• | Consulting and professional fees; |
• | Insurance; |
• | One-time expense associated with VDAs and settlement of a sales tax audit; |
• | Bad debt expense; and |
• | Costs associated with SEC compliance, including with the Sarbanes-Oxley Act and other regulations governing public companies. |
Comparison of 2019 to 2018
General and administrative expense decreased by 6.2%, or $1.6 million, to $25.1 million for the year ended December 31, 2019 compared with $26.8 million for the prior year. The change was comprised primarily of (decreases) increases of:
• | $(1.2) million in compensation and employee-related costs, including stock-based compensation expense, due to reductions in headcount, primarily as a result of the 2019 Actions and changes in management; and |
• | $(0.8) million in professional fees in connection with the assessment by our independent auditors of the effectiveness of our internal control over financial reporting, which was required for the first time as part of our Annual Report on |
43
Form 10-K for fiscal 2018, and our implementation of the new revenue recognition standard in 2018; partially offset by
• | $0.7 million in severance and related costs in connection with the 2019 Actions and changes in management. |
Comparison of 2018 to 2017
General and administrative expense decreased by 3.7%, or $1.0 million, to $26.8 million for the year ended December 31, 2018 compared with $27.8 million for the prior year. The change was comprised primarily of (decreases) increases of:
• | $(2.5) million for the one-time charge during 2017 in connection with entering into VDAs related to sales taxes with certain jurisdictions and settlement of a sales tax audit; partially offset by |
• | $0.6 million in non-recurring severance and related costs due to the reorganization of our China operations; |
• | $0.5 million in professional fees, including placement and contractor services, to facilitate the support and growth of our operations, and accounting and advisory services in connection with our adoption of ASC 606 and first year obtaining an audit opinion on the effectiveness of our internal controls over financial reporting; and |
• | $0.4 million in compensation and employee-related costs, mainly due to additional headcount. |
GROSS AND OPERATING MARGINS
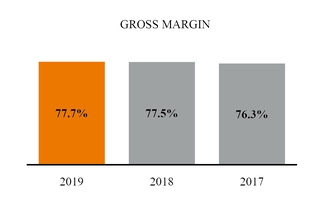
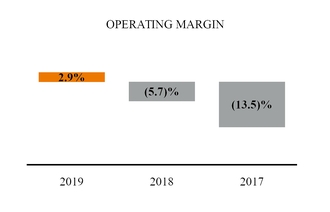
Comparison of 2019 to 2018
Gross margin improved by 20 basis points to 77.7% during the year ended December 31, 2019 compared with 77.5% for the prior year, primarily due to a decrease in cost of revenue resulting from our 2019 Actions, which exceeded the decrease in revenue, noted above.
Operating margin improved by 860 basis points to 2.9% during the year ended December 31, 2019 compared with (5.7)% for the prior year due to decreases in operating expenses and cost of revenue of 11.1% and 1.7%, respectively. Our improved operating margin was a result of the 2019 Actions and our continuing strategic efforts to scale our business operations while managing costs.
Comparison of 2018 to 2017
Gross margin improved by 120 basis points to 77.5% during the year ended December 31, 2018 compared with 76.3% for the prior year as a result of the increase in revenue at a greater rate of growth than cost of revenue. Our improved gross margin was a result of our continuing strategic efforts to scale our business operations while managing costs.
Operating margin improved by 780 basis points to (5.7)% during the year ended December 31, 2018 compared with (13.5)% for the prior year due to our increase in revenue and decrease in operating expenses of 7.1% and (0.7)%, respectively, which exceeded the growth in cost of revenue of 1.4%.
Operating margin for the year ended December 31, 2018 was also favorably impacted by our adoption of ASC 606 due to our capitalization of contract costs that had been expensed as incurred in periods prior to January 1, 2018. Operating margin for the year ended December 31, 2018 would have been (10.9)% had we not adopted ASC 606. Refer to Note 7, "Revenue from Contracts with Customers," for additional information regarding the impact of adoption and revenue recognition under ASC 606 on our consolidated financial statements.
TOTAL OTHER INCOME (EXPENSE)
Other income (expense) consists primarily of:
• | Interest received on our cash and cash equivalents; |
• | Interest expense on our finance leases; |
• | Other gains and losses; and |
• | The net effect of foreign currency revaluation gains and losses. |
Comparison of 2019 to 2018
Other income (expense) decreased by $0.2 million to $0.4 million for the year ended December 31, 2019 compared with $0.5 million for the prior year. The change was primarily due to a $0.4 million loss recorded due the closing of our China operations, partially offset by a $0.2 million increase in interest income driven by higher interest earned on our cash and cash equivalents.
Comparison of 2018 to 2017
Other income (expense) increased by $0.2 million to $0.5 million for the year ended December 31, 2018 compared with $0.3 million for the prior year. The change was primarily due to interest income driven by higher interest rates earned on our cash and cash equivalents.
INCOME TAX EXPENSE (BENEFIT)
Our provision for income taxes consists of provisions for federal, state, and foreign income taxes. We operate in an international environment with operations in various locations outside of the United States. Accordingly, our combined income tax rate is a composite rate reflecting our operating results in various locations and the applicable rates.
Comparison of 2019 to 2018
Income tax expense was $0.7 million for the year ended December 31, 2019 compared with $0.6 million for the prior year. The change was primarily due to a nonrecurring deferred tax benefit recorded in the United States in the year ended December 31, 2018 attributable to the enactment of the Tax Act.
Comparison of 2018 to 2017
Income tax expense was $0.6 million for the year ended December 31, 2018 compared with $0.3 million for the prior year. The change was primarily due to our adoption of ASC 606 which resulted in increased income from certain of our foreign subsidiaries.
LIQUIDITY AND CAPITAL RESOURCES
We derive our liquidity and operating capital primarily from cash flows from operations. Based on our current level of operations and anticipated growth, we believe our future cash flows from operating activities and our existing cash balances will be sufficient to meet our cash requirements for at least the next 12 months. During this period, we expect our capital expenditure requirements to approximate a range of $2.5 million to $4.5 million, which will primarily consist of computer hardware and purchased software.
WORKING CAPITAL
The following table summarizes our cash and cash equivalents, accounts receivable and working capital as of the end of each of the last three years:
December 31, | |||||||||||
2019 | 2018 | 2017 | |||||||||
(in thousands) | |||||||||||
Cash and cash equivalents | $ | 51,785 | $ | 47,185 | $ | 53,422 | |||||
Accounts receivable, net of allowance | 22,126 | 23,436 | 27,452 | ||||||||
Working capital | 47,946 | 41,139 | 45,862 | ||||||||
Our cash at December 31, 2019 was held for working capital purposes. We do not enter into investments for trading or speculative purposes. Our policy is to invest any cash in excess of our immediate requirements in investments designed to preserve the principal balance and provide on-demand immediate liquidity. Accordingly, our cash is invested primarily in demand deposit accounts and short-term money market accounts.
Of our total cash and cash equivalents, approximately 9.6% was held outside of the United States at December 31, 2019. Our international operations primarily consist of selling and marketing and research and development functions supported by our U.S. operations, and are dependent on our U.S. operations for international working capital needs. If our cash and cash equivalents held outside of the United States were ever needed for our operations inside the United States, we could be required to accrue and pay income and withholding taxes to repatriate these funds. We currently intend to permanently reinvest these foreign amounts outside the United States, and our current plans do not demonstrate a need to repatriate the foreign amounts to fund our U.S. operations.
44
CASH FLOWS
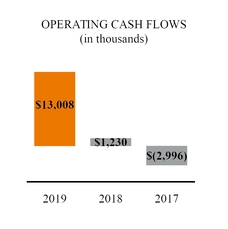
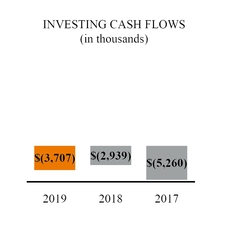
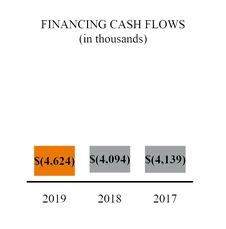
Free Cash Flow
We view free cash flow as an important financial metric as it demonstrates our ability to generate cash and can allow us to pursue opportunities that enhance shareholder value. Free cash flow is a non-GAAP financial measure that should be considered in addition to, not as a substitute for, measures of our financial performance prepared in accordance with GAAP. The following table presents a reconciliation of cash provided by (used in) operating activities, the most directly comparable GAAP measure, to free cash flow for each of the periods indicated:
Year Ended December 31, | |||||||||||
2019 | 2018 | 2017 | |||||||||
(in thousands) | |||||||||||
Cash and cash equivalents provided by (used in) operating activities | $ | 13,008 | $ | 1,230 | $ | (2,996 | ) | ||||
Less: Purchases of property and equipment | (986 | ) | (2,045 | ) | (2,790 | ) | |||||
Less: Payment of software development(1) costs | (2,721 | ) | (894 | ) | (293 | ) | |||||
Free cash flow | $ | 9,301 | $ | (1,709 | ) | $ | (6,079 | ) | |||
(1) Free cash flow for the years ended December 31, 2018 and 2017 has been updated to include payments of software development costs due to the change in materiality of these purchases in 2019.
Free cash flow increased by $11.0 million to $9.3 million for the year ended December 31, 2019 and increased $4.4 million to $(1.7) million for the year ended December 31, 2018. The increase in free cash flow for the year ended December 31, 2019 was a result of lower operating expenses, primarily related to the 2019 Actions, improved cash collections and changes in assets and liabilities, which are further described below. The increase in free cash flow for the year ended December 31, 2018 was primarily a result of revenue growth, improved cash collections and stable operating expenses, as well as a decrease in purchases of property and equipment due to completion of facilities projects initiated in 2017. Further analysis of the components of free cash flow is provided below.
Operating activities cash flows are largely driven by:
• | The amount of cash we invest in personnel and infrastructure to support the anticipated growth of our business; |
• | The amount and timing of customer payments; |
• | The seasonality of our business, as noted above, which results in variations in the timing of invoicing and the receipt of payments from our customers; |
• | In 2019, the amount paid in non-recurring severance and related costs in connection with the 2019 Actions and non-recurring severance and related costs due to our reorganization of our China operations in 2018; and |
• | In 2017, the amounts paid in connection with finalizing VDAs related to sales taxes, and in 2018, the amount we paid to settle a sales tax audit. |
Investing activities cash flows are largely driven by:
• | Capitalized expenditures to create internally developed software and implement software purchased for internal use; |
• | Purchases of property and equipment to support the expansion of our infrastructure and acquisitions; and |
• | Acquisitions, net of cash acquired. |
45
Financing activities cash flows are largely driven by:
• | Proceeds from the exercises of stock options; |
• | Payments on finance lease obligations; and |
• | Tax withholdings related to the net-share settlement of restricted stock units. |
2019
Operating Activities
Our cash provided by operating activities consisted of net income of $3.5 million adjusted for certain non-cash items totaling $17.1 million, which consisted of stock-based compensation expense, depreciation and amortization expense, bad debt expense and other non-cash items.
The net decrease in cash resulting from changes in assets and liabilities of $7.6 million primarily consisted of:
• | a $3.4 million decrease in deferred revenue as a result of the timing of revenue recognition for managed-service contracts; |
• | a $3.1 million increase in deferred contract costs consisting of sales commissions and a portion of other incentive compensation that is deferred and amortized to expense over the expected period of benefit; and |
• | a $2.3 million decrease in accounts payable and accrued expenses, driven by the timing of payments to our vendors during the period. These decreases in cash were partially offset by increases in cash due to: |
• | a $0.9 million decrease in prepaid expenses and other assets, primarily related to agency of record receipts (we record the amounts due from customers as a result of these arrangements as other receivables); and |
• | a $0.4 million decrease in accounts receivable as a result of increased cash collections during the period. |
Investing Activities
Our cash used in investing activities consisted of:
• | $2.7 million of capitalized software development costs; and |
• | $1.0 million of capital expenditures primarily related to the purchase of computer equipment. |
Financing Activities
Our cash used in financing activities consisted of:
• | $3.4 million used for the payment of taxes related to the net-share settlement of restricted stock units; and |
• | $2.2 million used for the repayment of finance leases; partially offset by |
• | $1.0 million in cash received upon the exercise of stock options. |
2018
Operating Activities
Our cash provided by operating activities consisted of a net loss of $(7.6) million adjusted for certain non-cash items totaling $17.3 million, which consisted of stock-based compensation expense, depreciation and amortization expense, bad debt expense and other non-cash items, principally the amortization of a lease incentive obligation related to our corporate headquarters.
The net decrease in cash resulting from changes in assets and liabilities of $8.5 million primarily consisted of:
• | a $10.9 million decrease in accounts payable and accrued expenses, driven by the timing of payments to our vendors, payments for certain customer arrangements for which we collect and remit monthly activity-based fees incurred for specific channels on behalf of our customers (referred to as "agency of record" activities) and a $1.0 million payment to settle a sales tax audit; |
• | a $6.7 million increase in deferred contract costs as a result of our adoption of ASC 606 (sales commissions and a portion of other incentive compensation that is deferred and amortized to expense over the expected period of benefit); and |
• | a $3.8 million net decrease in deferred revenue as a result of our adoption of ASC 606 and the timing of revenue recognition for managed-service contracts. These decreases in cash were partially offset by increases in cash due to |
• | a $10.3 million decrease in prepaid expenses and other assets, primarily related to agency of record receipts (we record the amounts due from customers as a result of these arrangements as other receivables); and |
46
• | a $2.6 million decrease in accounts receivable as a result of increased cash collections during the period. |
Investing Activities
Our cash used in investing activities consisted of:
• | $2.0 million of capital expenditures primarily related to the purchase of computer equipment; and |
• | $0.9 million of capitalized software development costs. |
Financing Activities
Our cash used in financing activities consisted of:
• | $3.0 million used for the payment of taxes related to the net-share settlement of restricted stock units; and |
• | $2.2 million used for the repayment of finance leases; partially offset by |
• | $1.1 million in cash received upon the exercise of stock options. |
CONTRACTUAL OBLIGATIONS
Our principal commitments consist of non-cancelable leases for our office space and computer equipment and purchase commitments for our co-location and other support services, as well as commitments related to our annual marketing events. The following table summarizes these contractual obligations at December 31, 2019. Future events could cause actual payments to differ from these estimates.
Payment due by period | |||||||||||||||||||
Total | Less than 1 year | 1-3 years | 3-5 years | More than 5 years | |||||||||||||||
(in thousands) | |||||||||||||||||||
Operating lease obligations | $ | 15,238 | $ | 4,840 | $ | 9,170 | $ | 1,228 | $ | — | |||||||||
Finance lease obligations | 1,551 | 1,523 | 28 | — | — | ||||||||||||||
Purchase commitments | 3,560 | 1,641 | 1,919 | — | — | ||||||||||||||
Total | $ | 20,349 | $ | 8,004 | $ | 11,117 | $ | 1,228 | $ | — | |||||||||
Operating lease obligations reflected above exclude future sublease income from certain space that we have subleased to a third party. We anticipate receiving $0.2 million in annual rental payments during the term of the sublease agreement, which is through August 2022.
Off-Balance Sheet Arrangements
As of December 31, 2019, we did not have any off-balance sheet arrangements, as defined in Item 303(a)(4)(ii) of SEC Regulation S-K, such as the use of unconsolidated subsidiaries, structured finance, special purpose entities or variable interest entities.
CRITICAL ACCOUNTING POLICIES
Our management's discussion and analysis of our financial condition and results of operations is based on our consolidated financial statements, which have been prepared in accordance with GAAP. The preparation of these consolidated
47
financial statements requires us to make estimates and assumptions that affect the reported amounts of assets and liabilities, disclosure of contingent assets and liabilities at the date of the consolidated financial statements and the reported amounts of revenue and expenses during the reported period. In accordance with GAAP, we base our estimates on historical experience and on various other assumptions that we believe are reasonable under the circumstances. Actual results may differ from these estimates under different assumptions or conditions, and to the extent that there are differences between our estimates and actual results, our future financial statement presentation, financial condition, results of operations and cash flows will be affected.
While our significant accounting policies are more fully described in Note 2, "Significant Accounting Policies," to our consolidated financial statements appearing elsewhere in this Annual Report, we believe the following accounting policies are critical to the process of making significant judgments and estimates in the preparation of our consolidated financial statements.
Revenue Recognition and Deferred Revenue
We derive the majority of our revenue from subscription fees paid to us by our customers for access to and usage of our SaaS solutions for a specified contract term, which is typically one year. A portion of the subscription fee is typically fixed and is based on a specified minimum amount of GMV or advertising spend that a customer expects to process through our platform over the contract term. The remaining portion of the subscription fee is variable and is based on a specified percentage of GMV or advertising spend processed through our platform in excess of the customer's specified minimum GMV or advertising spend amount. We also receive implementation fees, which may include fees for providing launch assistance and training. Customers do not have the contractual right to take possession of our software at any time.
We recognize fixed subscription fees and implementation fees ratably over the contract period beginning on the date the customer has access to the software. In general, we invoice and recognize revenue from the variable portion of subscription fees in the period in which the related GMV or advertising spend is processed.
Customers may elect to purchase a subscription to multiple modules, multiple modules with multiple service levels, or, for certain of our solutions, multiple brands or geographies. We evaluate such contracts to determine whether the services to be provided are distinct and accordingly should be accounted for as separate performance obligations. If we determine that a contract has multiple performance obligations, the transaction price, which is the total price of the contract, is allocated to each performance obligation based on a relative standalone selling price method. We estimate standalone selling price based on observable prices in past transactions for which the product offering subject to the performance obligation has been sold separately.
Deferred revenue represents the unearned portion of fixed subscription fees and implementation fees. Deferred amounts are generally recognized within one year. Amounts that are expected to be recognized beyond one year are recorded in other long-term liabilities.
Accounts Receivable and Allowances for Doubtful Accounts
Accounts receivable are stated at realizable value, net of an allowance for doubtful accounts that we maintain for estimated losses expected to result from the inability of some customers to make payments as they become due. Our estimate is based on historical collection experience and a review of the current status of accounts receivable. Historically, our actual collection experience has not varied significantly from our estimates, due primarily to our collection policies and the financial strength of our customers. However, adverse changes in general economic conditions could affect our allowance estimates, collectability of accounts receivable, cash flows and results of operations. At December 31, 2019, our allowance for doubtful accounts was 3.2% of our gross accounts receivable. A hypothetical 1% increase or decrease in the expected collectibility of our gross accounts receivable as of December 31, 2019 would have resulted in an increase or decrease of $0.2 million to our pre-tax net income for the year ended December 31, 2019. We plan to adopt ASU, 2016-13, Financial Instruments - Credit Losses (Topic 326), beginning in 2020. The adoption is not expected to have a material impact on our consolidated financial statements.
Goodwill
Goodwill arises from business combinations and is measured as the excess of the cost of the business acquired over the sum of the acquisition-date fair value of tangible and identifiable intangible assets acquired, less any liabilities assumed.
We test goodwill for impairment annually on October 1 or more frequently if events or changes in business circumstances indicate the asset might be impaired.
48
To perform our impairment testing, we first assess qualitative factors to determine whether it is more likely than not that the fair value of our single reporting unit is less than its carrying amount. The qualitative factors we consider include, but are not limited to, macroeconomic conditions, industry and market conditions, company-specific events, changes in circumstances and after-tax cash flows. If the qualitative factors indicate that the fair value of the reporting unit is greater than the carrying value of the net assets assigned to the reporting unit, then we do not consider the assigned goodwill to be impaired. We are only required to perform the two-step impairment test if the qualitative factors indicate that it is more likely than not that the fair value of the reporting unit is less than its carrying amount. We may elect to perform the two-step impairment test without considering such qualitative factors. As of December 31, 2019 and 2018, we concluded there was no impairment of goodwill.
Stock-Based Compensation
Stock-based compensation awards, which include stock options and restricted stock units, or RSUs, are measured at fair value at each grant date. We recognize stock-based compensation expense using the accelerated attribution method, net of estimated forfeitures, in which compensation cost for each vesting tranche in an award is recognized ratably from the service inception date to the vesting date for that tranche. Options and RSUs generally vest annually over a four-year period.
The determination of the fair value of stock options is affected by a number of variables, including estimates of the fair value of our common stock, expected stock price volatility, risk-free interest rate and the expected life of the award. We value stock options using the Black-Scholes option-pricing model, which was developed for use in estimating the fair value of traded options that are fully transferable and have no vesting restrictions. Black-Scholes and other option valuation models require the input of highly subjective assumptions, including the expected stock price volatility. Refer to Note 9, "Equity Incentive Plans and Stock-Based Compensation," to our consolidated financial statements appearing elsewhere in this Annual Report for the assumptions used for estimating the fair value of stock options granted to employees.
We have assumed no dividend yield because we do not expect to pay dividends in the future, which is consistent with our history of not paying dividends. The risk-free interest rate assumption is based on observed interest rates for constant maturity U.S. Treasury securities consistent with the expected life of our employee stock options. The expected life represents the period of time the stock options are expected to be outstanding and is based on the simplified method. Under the simplified method, the expected life of an option is presumed to be the midpoint between the vesting date and the end of the contractual term. We used the simplified method due to the lack of sufficient historical exercise data to provide a reasonable basis upon which to otherwise estimate the expected life of the stock options. Expected volatility is estimated based on the historical volatility of our stock. Prior to the fourth quarter of 2017, expected volatility was estimated based on volatilities of publicly traded stock for comparable companies over the estimated expected life of the stock options.
The fair value of our common stock, for purposes of determining the grant date fair value of option and RSU awards, has been determined by using the closing market price per share of our common stock as quoted on the New York Stock Exchange on the date of grant.
Our estimate of pre-vesting forfeitures, or forfeiture rate, is based on our historical experience and is reviewed on an annual basis, at a minimum. The estimated forfeiture rate is applied to the total estimated fair value of the awards to compute the stock-based compensation expense, net of pre-vesting forfeitures, to be recognized in our consolidated statements of operations. A hypothetical increase of 1% in our forfeiture rate assumption would have resulted in a $0.2 million decrease in stock-based compensation expense for the year ended December 31, 2019. A hypothetical decrease of 1% in our forfeiture rate assumption would have resulted in a $0.2 million increase in stock-based compensation expense for the year ended December 31, 2019.
Income Taxes
We account for income taxes under the asset and liability method. We recognize deferred tax assets and liabilities for the future tax consequences attributable to differences between the financial statement carrying amounts of existing assets and liabilities and their respective tax bases, as well as for operating loss and tax credit carryforwards. We measure deferred tax assets and liabilities using enacted tax rates expected to apply to taxable income in the years in which we expect to recover or settle those temporary differences. We recognize the effect of a change in tax rates on deferred tax assets and liabilities in the results of operations in the period that includes the enactment date. We reduce the measurement of a deferred tax asset, if necessary, by a valuation allowance if it is more likely than not that we will not realize some or all of the deferred tax asset.
We account for uncertain tax positions by recognizing the financial statement effects of a tax position only when, based upon technical merits, it is more likely than not that the position will be sustained upon examination. We recognize potential accrued interest and penalties associated with unrecognized tax positions within our global operations in income tax expense.
49
Significant judgment is required in determining our worldwide income tax provision. In the ordinary course of a global business, there are many transactions and calculations where the ultimate tax outcome is uncertain. Our judgments, assumptions and estimates relative to the provision for income taxes take into account current tax laws, our interpretation of current tax laws, and possible outcomes of future audits conducted by foreign and domestic tax authorities. Although we believe that our estimates are reasonable, the final tax outcome of matters could be different from that which is reflected in our historical income tax provision and accruals. Such differences, if identified in future periods, could have a material effect on the amounts recorded in our consolidated financial statements.
The Tax Cuts and Jobs Act, or Tax Act, which went into effect on December 22, 2017, significantly revises the Internal Revenue Code of 1986, as amended. The Tax Act contains, among other things, significant changes to corporate taxation, including reduction of the corporate tax rate from a top marginal rate of 35% to a flat rate of 21%, limitation of the tax deduction for interest expense to 30% of adjusted earnings (except for certain small businesses), limitation of the deduction for net operating losses to 80% of current year taxable income and elimination of net operating loss carrybacks, one time taxation of offshore earnings at reduced rates regardless of whether they are repatriated, elimination of U.S. tax on foreign earnings (subject to certain important exceptions), immediate deductions for certain new investments instead of deductions for depreciation expense over time and modifying or repealing many business deductions and credits. Please refer to Note 8, "Income Taxes," to our consolidated financial statements appearing elsewhere in this Annual Report for additional information regarding the Tax Act and its impact on our financial results as of and for the years ended December 31, 2019 and 2018.
Recent Accounting Pronouncements
Refer to Note 2, "Significant Accounting Policies," to our consolidated financial statements appearing elsewhere in this Annual Report for a full description of recent accounting pronouncements.
ITEM 7A. QUANTITATIVE AND QUALITATIVE DISCLOSURES ABOUT MARKET RISK
Market risk is the risk of loss to future earnings, values or future cash flows that may result from changes in the price of a financial instrument. The value of a financial instrument may change as a result of changes in interest rates, exchange rates, commodity prices, equity prices and other market changes. We are exposed to market risk related to changes in interest rates and foreign currency exchange rates. We do not use derivative financial instruments for speculative, hedging or trading purposes, although in the future we may enter into exchange rate hedging arrangements to manage the risks described below.
FOREIGN CURRENCY EXCHANGE RISK
With international operations, we face exposure to adverse movements in foreign currency exchange rates. These exposures may change over time as business practices evolve, and if our exposure increases, adverse movement in foreign currency exchange rates could have a material adverse impact on our financial results. Our primary exposures are related to non-U.S. dollar denominated revenue and operating expenses transacted in British pounds sterling, euros and Australian dollars. As a result, we would experience increased revenue and operating expenses at our non-U.S. operations if there were a decline in the value of the U.S. dollar relative to these foreign currencies. Conversely, we would experience decreased revenue and operating expenses at our non-U.S. operations if there were an increase in the value of the U.S. dollar relative to these foreign currencies. However, based on the size of our international operations and the amount of our revenue and expenses denominated in foreign currencies, a 10% change in foreign exchange rates would not have had a material impact on our results of operations for the year ended December 31, 2019.
INTEREST RATE RISK
We are only marginally exposed to interest rate risk through our portfolio of cash and cash equivalents. Interest rates that may affect these items in the future will depend on market conditions and may differ from the rates we have experienced in the past.
INFLATION RISK
We do not believe that inflation has had a material effect on our business, financial condition or results of operations. We continue to monitor the impact of inflation in order to minimize its effects through pricing strategies, productivity improvements and cost reductions. If our costs were to become subject to significant inflationary pressures, we may not be able to fully offset such higher costs through price increases. Our inability or failure to do so could harm our business, financial condition and results of operations.
50
ITEM 8. FINANCIAL STATEMENTS AND SUPPLEMENTARY DATA
INDEX TO CONSOLIDATED FINANCIAL STATEMENTS
51
Report of Independent Registered Public Accounting Firm
To the Shareholders and the Board of Directors of ChannelAdvisor Corporation and Subsidiaries
Opinion on the Financial Statements
We have audited the accompanying consolidated balance sheets of ChannelAdvisor Corporation and Subsidiaries (the Company) as of December 31, 2019 and 2018, the related consolidated statements of operations, comprehensive income (loss), changes in stockholders' equity and cash flows for each of the three years in the period ended December 31, 2019, and the related notes (collectively referred to as the “consolidated financial statements”). In our opinion, the consolidated financial statements present fairly, in all material respects, the financial position of the Company at December 31, 2019 and 2018, and the results of its operations and its cash flows for each of the three years in the period ended December 31, 2019, in conformity with U.S. generally accepted accounting principles.
We also have audited, in accordance with the standards of the Public Company Accounting Oversight Board (United States) (PCAOB), the Company's internal control over financial reporting as of December 31, 2019, based on criteria established in Internal Control-Integrated Framework issued by the Committee of Sponsoring Organizations of the Treadway Commission (2013 framework) and our report dated February 12, 2020 expressed an unqualified opinion thereon.
Adoption of ASU No. 2016-02
As discussed in Note 5 to the consolidated financial statements, the Company changed its method of accounting for leases in the year ended December 31, 2019 due to the adoption of ASU No. 2016-02, Leases (Topic 842)
Adoption of ASU No. 2014-09
As discussed in Note 7 to the consolidated financial statements, the Company changed its method of accounting for revenue and deferred contract costs in the year ended December 31, 2018 due to the adoption of ASU No. 2014-09, Revenue from Contracts with Customers (Topic 606).
Basis for Opinion
These financial statements are the responsibility of the Company's management. Our responsibility is to express an opinion on the Company’s financial statements based on our audits. We are a public accounting firm registered with the PCAOB and are required to be independent with respect to the Company in accordance with the U.S. federal securities laws and the applicable rules and regulations of the Securities and Exchange Commission and the PCAOB.
We conducted our audits in accordance with the standards of the PCAOB. Those standards require that we plan and perform the audit to obtain reasonable assurance about whether the financial statements are free of material misstatement, whether due to error or fraud. Our audits included performing procedures to assess the risks of material misstatement of the financial statements, whether due to error or fraud, and performing procedures that respond to those risks. Such procedures included examining, on a test basis, evidence regarding the amounts and disclosures in the financial statements. Our audits also included evaluating the accounting principles used and significant estimates made by management, as well as evaluating the overall presentation of the financial statements. We believe that our audits provide a reasonable basis for our opinion.
/s/ Ernst & Young LLP
We have served as the Company‘s auditor since 2001.
Raleigh, NC
February 12, 2020
52
Report of Independent Registered Public Accounting Firm
To the Shareholders and the Board of Directors of ChannelAdvisor Corporation and Subsidiaries
Opinion on Internal Control over Financial Reporting
We have audited ChannelAdvisor Corporation and Subsidiaries’ internal control over financial reporting as of December 31, 2019, based on criteria established in Internal Control-Integrated Framework issued by the Committee of Sponsoring Organizations of the Treadway Commission (2013 Framework) (the COSO criteria). In our opinion, ChannelAdvisor Corporation and Subsidiaries (the Company) maintained, in all material respects, effective internal control over financial reporting as of December 31, 2019, based on the COSO criteria.
We also have audited, in accordance with the standards of the Public Company Accounting Oversight Board (United States) (PCAOB), the consolidated balance sheets of the Company as of December 31, 2019 and 2018, the related consolidated statements of operations, comprehensive income (loss), changes in stockholders' equity and cash flows for each of the three years in the period ended December 31, 2019, and the related notes and our report dated February 12, 2020 expressed an unqualified opinion thereon.
Basis for Opinion
The Company’s management is responsible for maintaining effective internal control over financial reporting and for its assessment of the effectiveness of internal control over financial reporting included in the accompanying Management’s Annual Report on Internal Control Over Financial Reporting. Our responsibility is to express an opinion on the Company’s internal control over financial reporting based on our audit. We are a public accounting firm registered with the PCAOB and are required to be independent with respect to the Company in accordance with the U.S. federal securities laws and the applicable rules and regulations of the Securities and Exchange Commission and the PCAOB.
We conducted our audit in accordance with the standards of the PCAOB. Those standards require that we plan and perform the audit to obtain reasonable assurance about whether effective internal control over financial reporting was maintained in all material respects.
Our audit included obtaining an understanding of internal control over financial reporting, assessing the risk that a material weakness exists, testing and evaluating the design and operating effectiveness of internal control based on the assessed risk, and performing such other procedures as we considered necessary in the circumstances. We believe that our audit provides a reasonable basis for our opinion.
Definition and Limitations of Internal Control Over Financial Reporting
A company’s internal control over financial reporting is a process designed to provide reasonable assurance regarding the reliability of financial reporting and the preparation of financial statements for external purposes in accordance with generally accepted accounting principles. A company’s internal control over financial reporting includes those policies and procedures that (1) pertain to the maintenance of records that, in reasonable detail, accurately and fairly reflect the transactions and dispositions of the assets of the company; (2) provide reasonable assurance that transactions are recorded as necessary to permit preparation of financial statements in accordance with generally accepted accounting principles, and that receipts and expenditures of the company are being made only in accordance with authorizations of management and directors of the company; and (3) provide reasonable assurance regarding prevention or timely detection of unauthorized acquisition, use, or disposition of the company’s assets that could have a material effect on the financial statements.
Because of its inherent limitations, internal control over financial reporting may not prevent or detect misstatements. Also, projections of any evaluation of effectiveness to future periods are subject to the risk that controls may become inadequate because of changes in conditions, or that the degree of compliance with the policies or procedures may deteriorate.
/s/ Ernst & Young LLP
Raleigh, NC
February 12, 2020
53
CHANNELADVISOR CORPORATION AND SUBSIDIARIES
CONSOLIDATED BALANCE SHEETS
(in thousands, except share and per share data)
December 31, | |||||||
2019 | 2018 | ||||||
Assets | |||||||
Current assets: | |||||||
Cash and cash equivalents | $ | 51,785 | $ | 47,185 | |||
Accounts receivable, net of allowance of $733 and $652 as of December 31, 2019 and 2018, respectively | 22,126 | 23,436 | |||||
Prepaid expenses and other current assets | 10,452 | 9,248 | |||||
Total current assets | 84,363 | 79,869 | |||||
Operating lease right of use assets | 11,128 | — | |||||
Property and equipment, net | 9,597 | 12,007 | |||||
Goodwill | 23,486 | 23,486 | |||||
Intangible assets, net | 1,285 | 1,894 | |||||
Deferred contract costs, net of current portion | 12,810 | 11,336 | |||||
Long-term deferred tax assets, net | 3,584 | 4,162 | |||||
Other assets | 614 | 1,515 | |||||
Total assets | $ | 146,867 | $ | 134,269 | |||
Liabilities and stockholders' equity | |||||||
Current liabilities: | |||||||
Accounts payable | $ | 409 | $ | 1,598 | |||
Accrued expenses | 8,577 | 9,358 | |||||
Deferred revenue | 21,000 | 24,205 | |||||
Other current liabilities | 6,431 | 3,569 | |||||
Total current liabilities | 36,417 | 38,730 | |||||
Long-term operating leases, net of current portion | 9,767 | — | |||||
Long-term finance leases, net of current portion | 27 | 1,404 | |||||
Lease incentive obligation | — | 2,154 | |||||
Other long-term liabilities | 1,007 | 2,343 | |||||
Total liabilities | 47,218 | 44,631 | |||||
Commitments and contingencies (Note 6) | |||||||
Stockholders' equity: | |||||||
Preferred stock, $0.001 par value, 5,000,000 shares authorized, no shares issued and outstanding as of December 31, 2019 and 2018, respectively | — | — | |||||
Common stock, $0.001 par value, 100,000,000 shares authorized, 28,077,469 and 27,347,115 shares issued and outstanding as of December 31, 2019 and 2018, respectively | 28 | 27 | |||||
Additional paid-in capital | 278,111 | 271,550 | |||||
Accumulated other comprehensive loss | (1,740 | ) | (1,707 | ) | |||
Accumulated deficit | (176,750 | ) | (180,232 | ) | |||
Total stockholders' equity | 99,649 | 89,638 | |||||
Total liabilities and stockholders' equity | $ | 146,867 | $ | 134,269 | |||
The accompanying notes are an integral part of these consolidated financial statements.
54
CHANNELADVISOR CORPORATION AND SUBSIDIARIES
CONSOLIDATED STATEMENTS OF OPERATIONS
(in thousands, except share and per share data)
Year Ended December 31, | |||||||||||
2019 | 2018 | 2017 | |||||||||
Revenue | $ | 129,959 | $ | 131,218 | $ | 122,535 | |||||
Cost of revenue | 29,008 | 29,501 | 29,102 | ||||||||
Gross profit | 100,951 | 101,717 | 93,433 | ||||||||
Operating expenses: | |||||||||||
Sales and marketing | 52,813 | 60,080 | 60,343 | ||||||||
Research and development | 19,200 | 22,359 | 21,868 | ||||||||
General and administrative | 25,136 | 26,784 | 27,800 | ||||||||
Total operating expenses | 97,149 | 109,223 | 110,011 | ||||||||
Income (loss) from operations | 3,802 | (7,506 | ) | (16,578 | ) | ||||||
Other income (expense): | |||||||||||
Interest income (expense), net | 754 | 510 | 222 | ||||||||
Other (expense) income, net | (385 | ) | 9 | 83 | |||||||
Total other income (expense) | 369 | 519 | 305 | ||||||||
Income (loss) before income taxes | 4,171 | (6,987 | ) | (16,273 | ) | ||||||
Income tax expense | 689 | 614 | 284 | ||||||||
Net income (loss) | $ | 3,482 | $ | (7,601 | ) | $ | (16,557 | ) | |||
Net income (loss) per share: | |||||||||||
Basic | $ | 0.12 | $ | (0.28 | ) | $ | (0.63 | ) | |||
Diluted | $ | 0.12 | $ | (0.28 | ) | $ | (0.63 | ) | |||
Weighted average common shares outstanding: | |||||||||||
Basic | 27,886,278 | 27,138,274 | 26,366,748 | ||||||||
Diluted | 28,816,977 | 27,138,274 | 26,366,748 | ||||||||
The accompanying notes are an integral part of these consolidated financial statements.
55
CHANNELADVISOR CORPORATION AND SUBSIDIARIES
CONSOLIDATED STATEMENTS OF COMPREHENSIVE INCOME (LOSS)
(in thousands)
Year Ended December 31, | |||||||||||
2019 | 2018 | 2017 | |||||||||
Net income (loss) | $ | 3,482 | $ | (7,601 | ) | $ | (16,557 | ) | |||
Other comprehensive (loss) income: | |||||||||||
Foreign currency translation adjustments | (33 | ) | (918 | ) | 823 | ||||||
Total comprehensive income (loss) | $ | 3,449 | $ | (8,519 | ) | $ | (15,734 | ) | |||
The accompanying notes are an integral part of these consolidated financial statements.
56
CHANNELADVISOR CORPORATION AND SUBSIDIARIES
CONSOLIDATED STATEMENTS OF CHANGES IN STOCKHOLDERS' EQUITY
(in thousands, except share data)
Common Stock | Additional Paid-In Capital | Accumulated Other Comprehensive Loss | Accumulated Deficit | Total Stockholders' Equity | ||||||||||||||||||
Shares | Amount | |||||||||||||||||||||
Balance, December 31, 2016 | 25,955,759 | $ | 26 | $ | 252,158 | $ | (1,612 | ) | $ | (163,575 | ) | $ | 86,997 | |||||||||
Exercise of stock options and vesting of restricted stock units | 893,843 | 1 | 1,427 | — | — | 1,428 | ||||||||||||||||
Stock-based compensation expense | — | — | 11,947 | — | — | 11,947 | ||||||||||||||||
Statutory tax withholding related to net-share settlement of restricted stock units | (247,976 | ) | — | (2,727 | ) | — | — | (2,727 | ) | |||||||||||||
Net loss | — | — | — | — | (16,557 | ) | (16,557 | ) | ||||||||||||||
Foreign currency translation adjustments | — | — | — | 823 | — | 823 | ||||||||||||||||
Balance, December 31, 2017 | 26,601,626 | 27 | 262,805 | (789 | ) | (180,132 | ) | 81,911 | ||||||||||||||
Cumulative effect of accounting change (1) | — | — | — | — | 7,501 | 7,501 | ||||||||||||||||
Exercise of stock options and vesting of restricted stock units | 1,034,146 | — | 1,106 | — | — | 1,106 | ||||||||||||||||
Stock-based compensation expense | — | — | 10,598 | — | — | 10,598 | ||||||||||||||||
Statutory tax withholding related to net-share settlement of restricted stock units | (288,657 | ) | — | (2,959 | ) | — | — | (2,959 | ) | |||||||||||||
Net loss | — | — | — | — | (7,601 | ) | (7,601 | ) | ||||||||||||||
Foreign currency translation adjustments | — | — | — | (918 | ) | — | (918 | ) | ||||||||||||||
Balance, December 31, 2018 | 27,347,115 | 27 | 271,550 | (1,707 | ) | (180,232 | ) | 89,638 | ||||||||||||||
Exercise of stock options and vesting of restricted stock units | 1,021,730 | 1 | 974 | — | — | 975 | ||||||||||||||||
Stock-based compensation expense | — | — | 8,976 | — | — | 8,976 | ||||||||||||||||
Statutory tax withholding related to net-share settlement of restricted stock units | (291,376 | ) | — | (3,389 | ) | — | — | (3,389 | ) | |||||||||||||
Net income | — | — | — | — | 3,482 | 3,482 | ||||||||||||||||
Foreign currency translation adjustments | — | — | — | (33 | ) | — | (33 | ) | ||||||||||||||
Balance, December 31, 2019 | 28,077,469 | $ | 28 | $ | 278,111 | $ | (1,740 | ) | $ | (176,750 | ) | $ | 99,649 | |||||||||
(1) Refer to Note 7, "Revenue from Contracts with Customers," for additional information regarding the effect of the adoption of Accounting Standards Update No. 2014-09, Revenue from Contracts with Customers (Topic 606), or ASC 606, and adjustments to accumulated deficit upon adoption.
The accompanying notes are an integral part of these consolidated financial statements.
57
CHANNELADVISOR CORPORATION AND SUBSIDIARIES
CONSOLIDATED STATEMENTS OF CASH FLOWS
(in thousands)
Year Ended December 31, | |||||||||||
2019 | 2018 | 2017 | |||||||||
Cash flows from operating activities | |||||||||||
Net income (loss) | $ | 3,482 | $ | (7,601 | ) | $ | (16,557 | ) | |||
Adjustments to reconcile net income (loss) to cash and cash equivalents provided by (used in) operating activities: | |||||||||||
Depreciation and amortization | 6,336 | 6,094 | 6,578 | ||||||||
Bad debt expense | 1,147 | 991 | 727 | ||||||||
Stock-based compensation expense | 8,976 | 10,598 | 11,947 | ||||||||
Deferred income taxes | 531 | 493 | 130 | ||||||||
Other items, net | 118 | (851 | ) | (869 | ) | ||||||
Changes in assets and liabilities, net of effects from acquisition: | |||||||||||
Accounts receivable | 361 | 2,634 | (8,261 | ) | |||||||
Prepaid expenses and other assets | 892 | 10,303 | (5,514 | ) | |||||||
Deferred contract costs | (3,146 | ) | (6,730 | ) | — | ||||||
Accounts payable and accrued expenses | (2,306 | ) | (10,936 | ) | 5,242 | ||||||
Deferred revenue | (3,383 | ) | (3,765 | ) | 3,581 | ||||||
Cash and cash equivalents provided by (used in) operating activities | 13,008 | 1,230 | (2,996 | ) | |||||||
Cash flows from investing activities | |||||||||||
Purchases of property and equipment | (986 | ) | (2,045 | ) | (2,790 | ) | |||||
Payment of software development costs | (2,721 | ) | (894 | ) | (293 | ) | |||||
Acquisition, net of cash acquired | — | — | (2,177 | ) | |||||||
Cash and cash equivalents used in investing activities | (3,707 | ) | (2,939 | ) | (5,260 | ) | |||||
Cash flows from financing activities | |||||||||||
Repayment of finance leases | (2,209 | ) | (2,241 | ) | (2,840 | ) | |||||
Proceeds from exercise of stock options | 974 | 1,106 | 1,428 | ||||||||
Payment of statutory tax withholding related to net-share settlement of restricted stock units | (3,389 | ) | (2,959 | ) | (2,727 | ) | |||||
Cash and cash equivalents used in financing activities | (4,624 | ) | (4,094 | ) | (4,139 | ) | |||||
Effect of currency exchange rate changes on cash and cash equivalents | (77 | ) | (434 | ) | 397 | ||||||
Net increase (decrease) in cash and cash equivalents | 4,600 | (6,237 | ) | (11,998 | ) | ||||||
Cash and cash equivalents, beginning of year | 47,185 | 53,422 | 65,420 | ||||||||
Cash and cash equivalents, end of year | $ | 51,785 | $ | 47,185 | $ | 53,422 | |||||
Supplemental disclosure of cash flow information | |||||||||||
Cash paid for interest | $ | 215 | $ | 30 | $ | 111 | |||||
Cash paid for income taxes, net | $ | 62 | $ | 113 | $ | 196 | |||||
Supplemental disclosure of noncash investing and financing activities | |||||||||||
Accrued capital expenditures | $ | 15 | $ | 68 | $ | 80 | |||||
Finance lease obligations entered into for the purchase of fixed assets | $ | 46 | $ | 4,217 | $ | 567 | |||||
58
CHANNELADVISOR CORPORATION AND SUBSIDIARIES
NOTES TO CONSOLIDATED FINANCIAL STATEMENTS
1. DESCRIPTION OF THE BUSINESS
ChannelAdvisor Corporation ("ChannelAdvisor" or the "Company") was incorporated in the state of Delaware and capitalized in June 2001. The Company began operations in July 2001. ChannelAdvisor is a provider of software-as-a-service, or SaaS, solutions and its mission is to connect and optimize the world's commerce. ChannelAdvisor's SaaS cloud platform helps brands and retailers worldwide improve their online performance by expanding sales channels, connecting with consumers around the world, optimizing their operations for peak performance and providing actionable analytics to improve competitiveness. The Company is headquartered in Morrisville, North Carolina and maintains sales, service, support and research and development offices in various domestic and international locations.
2. SIGNIFICANT ACCOUNTING POLICIES
Principles of Consolidation
The accompanying consolidated financial statements include the accounts of the Company and its wholly owned subsidiaries. All intercompany accounts and transactions have been eliminated in consolidation.
Depreciation and Amortization
Depreciation and amortization expense is included in the following line items in the accompanying consolidated statements of operations for the years ended December 31, 2019, 2018 and 2017 (in thousands):
2019 | 2018 | 2017 | |||||||||
Cost of revenue | $ | 3,942 | $ | 3,610 | $ | 4,019 | |||||
Sales and marketing | 775 | 884 | 998 | ||||||||
Research and development | 353 | 371 | 424 | ||||||||
General and administrative | 1,266 | 1,229 | 1,137 | ||||||||
$ | 6,336 | $ | 6,094 | $ | 6,578 | ||||||
59
Recent Accounting Pronouncements
Standard | Description | Effect on the Financial Statements or Other Significant Matters |
Standards that the Company adopted effective January 1, 2020 | ||
Financial Instruments: | ||
Accounting Standards Update, or ASU, 2016-13, Financial Instruments - Credit Losses (Topic 326) Effective date: January 1, 2020 | The standard replaces the incurred loss impairment methodology in current U.S. GAAP (defined below) with a methodology that reflects expected credit losses. The update is intended to provide financial statement users with more useful information about expected credit losses. | The Company adopted this standard effective January 1, 2020. The adoption did not have a material impact on its consolidated financial statements. |
Intangibles: | ||
ASU 2018-15, Intangibles -Goodwill and Other - Internal-Use Software (Subtopic 350-40) Effective date: January 1, 2020 | This standard aligns the requirements for capitalizing implementation costs incurred in a hosting arrangement that is a service contract with the requirements for capitalizing implementation costs incurred to develop or obtain internal-use software. | The Company adopted this standard effective January 1, 2020. The adoption did not have a material impact on its consolidated financial statements. |
Standards that the Company adopted effective January 1, 2019 | ||
Leases: | ||
ASU 2016-02, Leases (Topic 842) | The standard requires that lessees recognize assets and liabilities for leases with lease terms greater than twelve months in the statement of financial position. The standard also requires improved disclosures to help users of financial statements better understand the amount, timing and uncertainty of cash flows arising from leases. | The Company adopted this standard effective January 1, 2019 using the alternate adoption method which allows for the initial application of the standard as of the adoption date. The reported results as of and for the year ended December 31, 2019 in the accompanying consolidated financial statements are presented under ASC 842, while prior period results have not been adjusted and are reported in accordance with historical accounting guidance in effect for those periods. The Company elected to use the package of three practical expedients, as well as the practical expedient to apply hindsight in determining lease terms. Refer to Note 5, "Leases," for additional information regarding the impact of adoption under ASC 842 on the Company's consolidated financial statements. |
The Company has reviewed other new accounting pronouncements that were issued as of December 31, 2019 and does not believe that these pronouncements are applicable to the Company, or that they will have a material impact on its financial position or results of operations.
Use of Estimates
The preparation of financial statements in conformity with United States generally accepted accounting principles, or U.S. GAAP, requires management to make estimates and assumptions that affect the amounts reported in the consolidated financial statements and accompanying notes. Actual results could differ from those estimates.
On an ongoing basis, the Company evaluates its estimates, including those related to the accounts receivable allowance, the useful lives of long-lived assets and other intangible assets, income taxes, assumptions used for purposes of determining stock-based compensation and revenue recognition, including standalone selling prices for contracts with multiple performance obligations and the expected period of benefit for deferred contract costs, among others. Estimates and assumptions are also required to value assets acquired and liabilities assumed in conjunction with business combinations. The Company bases its
60
estimates on historical experience and on various other assumptions that it believes to be reasonable, the results of which form the basis for making judgments about the carrying value of assets and liabilities.
Cash and Cash Equivalents
The Company considers all highly liquid investments maturing within ninety days or less at the time of purchase to be cash equivalents. Cash and cash equivalents are comprised of cash and money market funds. Due to the short-term nature and liquidity of these financial instruments, the carrying value of these assets approximates fair value.
Revenue Recognition
On January 1, 2018, the Company adopted ASC 606. Refer to Note 7, "Revenue from Contracts with Customers" for a detailed discussion of accounting policies related to revenue recognition, including deferred revenue and sales commissions.
Cost of Revenue
Cost of revenue primarily consists of personnel and related costs, including salaries, bonuses, payroll taxes and stock-based compensation, co-location facility costs for the Company's data centers, depreciation expense for computer equipment and amortization of capitalized software directly associated with generating revenue, credit card transaction fees and infrastructure maintenance costs. In addition, the Company allocates a portion of overhead, such as rent, additional depreciation and amortization and employee benefits costs, to cost of revenue based on headcount.
Fair Value of Financial Instruments
The Company uses a three-tier fair value hierarchy to classify and disclose all assets and liabilities measured at fair value on a recurring basis, as well as assets and liabilities measured at fair value on a non-recurring basis, in periods subsequent to their initial measurement. The hierarchy requires the Company to use observable inputs when available, and to minimize the use of unobservable inputs when determining fair value. The three tiers are defined as follows:
•Level 1. Observable inputs based on unadjusted quoted prices in active markets for identical assets or liabilities;
•Level 2. Inputs, other than quoted prices in active markets, that are observable either directly or indirectly; and
•Level 3. Unobservable inputs for which there is little or no market data, which require the Company to develop its own assumptions.
The carrying amounts of certain of the Company's financial instruments, including cash and cash equivalents, accounts receivable, accounts payable and accrued expenses approximate their respective fair values due to their short-term nature.
Concentration of Credit Risk
Financial instruments that subject the Company to significant concentrations of credit risk consist primarily of cash and cash equivalents and accounts receivable. All of the Company's cash and cash equivalents are held at financial institutions that management believes to be of high credit quality. The Company's cash and cash equivalents accounts exceed federally insured limits. The Company has not experienced any losses on its cash and cash equivalents accounts to date. To manage accounts receivable risk, the Company maintains an allowance for doubtful accounts.
The Company did not have any customers that individually comprised a significant concentration of its accounts receivable as of December 31, 2019 and 2018, or a significant concentration of its revenue for the years ended December 31, 2019, 2018 and 2017.
Accounts Receivable and Allowance for Doubtful Accounts
The Company extends credit to customers without requiring collateral. Accounts receivable are stated at realizable value, net of an allowance for doubtful accounts. The Company utilizes the allowance method to provide for doubtful accounts based on management's evaluation of the collectability of amounts due. The Company's estimate is based on historical collection experience and a review of the current status of accounts receivable. Historically, actual write-offs for uncollectible accounts have not significantly differed from the Company's estimates.
61
The following table presents the changes in the Company's allowance for doubtful accounts during the years ended December 31, 2019, 2018 and 2017 (in thousands):
Balance at Beginning of Period | Additions Charged To Expense | Deductions | Balance at End of Period | ||||||||||
Allowance for doubtful accounts: | |||||||||||||
Year ended December 31, 2019 | $ | 652 | 1,147 | (1,066 | ) | $ | 733 | ||||||
Year ended December 31, 2018 | $ | 609 | 991 | (948 | ) | $ | 652 | ||||||
Year ended December 31, 2017 | $ | 594 | 727 | (712 | ) | $ | 609 | ||||||
Property and Equipment
Property and equipment are recorded at cost. Expenditures for major additions and improvements are capitalized. Depreciation and amortization is provided over the estimated useful lives of the related assets using the straight-line method.
The estimated useful lives for significant property and equipment categories are generally as follows:
Purchased software, including capitalized software development costs | 3 years |
Computer hardware | 3 years |
Furniture and office equipment | 3 to 5 years |
Leasehold improvements | Lesser of remaining lease term or useful life |
Repairs and maintenance costs are expensed as incurred.
Software Development Costs
The Company capitalizes certain internal-use software development costs, consisting primarily of direct labor associated with creating the internally developed software and third-party consulting fees associated with implementing software purchased for internal use. Software development projects generally include three stages: the preliminary project stage (in which all costs are expensed as incurred), the application development stage (in which certain costs are capitalized) and the post-implementation/operation stage (in which all costs are expensed as incurred). The costs incurred during the application development stage primarily include the costs of designing the application, coding and testing of the system. Capitalized costs are amortized using the straight-line method over the estimated useful life of the software once it is ready for its intended use.
Software development costs of $3.0 million and $0.7 million related to creating internally developed software and implementing software purchased for internal use were capitalized during the years ended December 31, 2019 and 2018, respectively, and are included in property and equipment in the accompanying consolidated balance sheets. Amortization expense related to capitalized internally developed software was $0.8 million, $0.3 million and $0.2 million for the years ended December 31, 2019, 2018 and 2017, respectively, and is included in cost of revenue or general and administrative expense in the accompanying consolidated statements of operations, depending upon the nature of the software development project. The net book value of capitalized internally developed software was $2.9 million and $1.0 million at December 31, 2019 and 2018, respectively.
Identifiable Intangible Assets
The Company acquired intangible assets in connection with its business acquisitions. These assets were recorded at their estimated fair values at the acquisition date and are being amortized over their respective estimated useful lives using the straight-line method. The estimated useful lives and amortization methodology used in computing amortization are as follows:
Estimated Useful Lives | Amortization Methodology | |
Customer relationships | 7 years | Straight-line |
Acquired technology | 7 years | Straight-line |
62
Impairment of Long-Lived Assets
The Company reviews long-lived assets for impairment whenever events or changes in circumstances indicate the carrying amount of an asset may not be recoverable. Recoverability of the long-lived asset is measured by a comparison of the carrying amount of the asset or asset group to future undiscounted net cash flows expected to be generated by the asset or asset group. If such assets are not recoverable, the impairment to be recognized, if any, is measured by the amount by which the carrying amount of the assets exceeds the estimated fair value of the assets or asset group. Assets held for sale are reported at the lower of the carrying amount or fair value, less costs to sell. As of December 31, 2019 and 2018, management does not believe any long-lived assets are impaired and has not identified any assets as being held for sale.
Goodwill
Goodwill represents the excess of the aggregate of the fair value of consideration transferred in a business combination over the fair value of assets acquired, net of liabilities assumed. The Company recorded goodwill in connection with its business acquisitions. Goodwill is not amortized, but is subject to an annual impairment test, as described below.
The Company has determined that it has a single, entity-wide reporting unit. The Company first assessed qualitative factors to determine whether it was more likely than not that the fair value of its single reporting unit was less than its carrying amount as a basis for determining whether it is necessary to perform the two-step goodwill impairment test under ASU No. 2011-08, Goodwill and Other (Topic 350): Testing Goodwill for Impairment. If the qualitative factors had indicated that it was more likely than not that the fair value of the reporting unit was less than its carrying amount, the Company would have tested goodwill for impairment at the reporting unit level using a two-step approach. The first step is to compare the fair value of the reporting unit to the carrying value of the net assets assigned to the reporting unit. If the fair value of the reporting unit is greater than the carrying value of the net assets assigned to the reporting unit, the assigned goodwill is not considered impaired. If the fair value is less than the reporting unit's carrying value, step two is performed to measure the amount of the impairment, if any. In the second step, the fair value of goodwill is determined by deducting the fair value of the reporting unit's identifiable assets and liabilities from the fair value of the reporting unit as a whole, as if the reporting unit had just been acquired and the fair value was being initially allocated. If the carrying value of goodwill exceeds the implied fair value, an impairment charge would be recorded in the period the determination is made.
The Company performs its annual goodwill impairment analysis as of October 1, the first day of the fourth quarter. As a result of the Company's annual impairment analysis as of October 1, 2019 and 2018, goodwill was not considered impaired and, as such, no impairment charges were recorded.
Advertising Costs
The Company expenses advertising costs as incurred. The amount expensed during the years ended December 31, 2019, 2018 and 2017 was $4.2 million, $5.7 million and $5.3 million, respectively.
Income Taxes
Income taxes are accounted for under the asset and liability method of accounting. Deferred tax assets and liabilities are recognized for the future tax consequences attributable to differences between the financial statement carrying amounts of existing assets and liabilities and their respective tax bases, as well as for operating loss and tax credit carryforwards. Deferred tax assets and liabilities are measured using enacted tax rates expected to apply to taxable income in the years in which those temporary differences are expected to be recovered or settled. The effect on deferred tax assets and liabilities of a change in tax rates is recognized in the results of operations in the period that includes the enactment date. The measurement of a deferred tax asset is reduced, if necessary, by a valuation allowance if it is more likely than not that some portion or all of the deferred tax asset will not be realized.
The Company applies the accounting guidance for uncertainties in income taxes, which prescribes a recognition threshold and measurement process for recording uncertain tax positions taken, or expected to be taken, in a tax return in the financial statements. Additionally, the guidance also prescribes the treatment for the derecognition, classification, accounting in interim periods and disclosure requirements for uncertain tax positions. The Company accrues for the estimated amount of taxes for uncertain tax positions if it is more likely than not that the Company would be required to pay such additional taxes. An uncertain tax position will be recognized if it is more likely than not to be sustained. The Company did not have any accrued interest or penalties associated with unrecognized tax positions as of December 31, 2019 and 2018.
Foreign Currency Translation
The functional currency of the Company's non-U.S. operations is the local currency. Monetary assets and liabilities denominated in foreign currencies are translated into U.S. dollars at exchange rates prevailing at the balance sheet dates. Non-monetary assets and liabilities are translated at the historical rates in effect when the assets were acquired or obligations incurred. Revenue and expenses are translated into U.S. dollars using the average rates of exchange prevailing during the period. Translation gains or losses are included as a component of accumulated other comprehensive loss in stockholders' equity. Gains and losses resulting from foreign currency transactions are recognized as other income (expense).
Stock-Based Compensation
The Company accounts for stock-based compensation awards, which include stock options and restricted stock units, or RSUs, based on the fair value of the award as of the grant date. The Company recognizes stock-based compensation expense using the accelerated attribution method, net of estimated forfeitures, in which compensation cost for each vesting tranche in an award is recognized ratably from the service inception date to the vesting date for that tranche.
The Company uses the Black-Scholes option pricing model for estimating the fair value of stock options. The use of the option valuation model requires the input of the Company's stock price, as well as highly subjective assumptions, including the expected life of the option and the expected stock price volatility based on peer companies. Additionally, the recognition of expense requires the estimation of the number of awards that will ultimately vest and the number of awards that will ultimately be forfeited. The fair value of the Company's common stock, for purposes of determining the grant date fair value of option and RSU awards, has been determined by using the closing market price per share of common stock as quoted on the New York Stock Exchange on the date of grant.
Basic and Diluted Income (Loss) per Common Share
Basic net income (loss) per share is calculated by dividing net income (loss) by the weighted-average number of shares of common stock outstanding for the period. Diluted net income (loss) per share is calculated giving effect to all potentially dilutive shares of common stock, including stock options and RSUs. The dilutive effect of outstanding awards is reflected in diluted earnings per share by application of the treasury stock method.
3. PROPERTY AND EQUIPMENT
Property and equipment consisted of the following as of December 31, 2019 and 2018 (in thousands):
2019 | 2018 | ||||||
Purchased software, including capitalized software development costs | $ | 13,965 | $ | 16,239 | |||
Computer hardware | 8,975 | 12,292 | |||||
Furniture and office equipment | 2,369 | 2,518 | |||||
Leasehold improvements | 7,244 | 7,396 | |||||
Construction in process | 46 | 457 | |||||
32,599 | 38,902 | ||||||
Less: accumulated depreciation | (23,002 | ) | (26,895 | ) | |||
Property and equipment, net | $ | 9,597 | $ | 12,007 | |||
Depreciation expense for the years ended December 31, 2019, 2018 and 2017 was $5.7 million, $5.5 million and $6.0 million, respectively. During the year ended December 31, 2019, the Company disposed of purchased software, including capitalized software development costs, computer hardware, furniture and office equipment and leasehold improvements with a cost of $10.0 million and accumulated depreciation of $9.6 million resulting in a $0.4 million loss in the consolidated statements of operations for the year ended December 31, 2019 related to these disposals. During the year ended December 31, 2018, the Company disposed of computer hardware, furniture and office equipment and leasehold improvements with a cost of $4.9 million and accumulated depreciation of $4.9 million. The Company recognized a de minimis loss in the consolidated statements of operations for the year ended December 31, 2018 related to these disposals. As a result of an amendment to the Company's corporate headquarters lease agreement during the year ended December 31, 2018, the Company disposed of leasehold improvements with a cost of $0.8 million and accumulated depreciation of $0.3 million and recorded a $0.5 million reduction to its lease incentive obligation.
63
4. GOODWILL AND INTANGIBLE ASSETS
There were no changes to the Company's goodwill during the years ended December 31, 2019 and 2018.
Intangible assets consisted of the following as of December 31, 2019 and 2018 (in thousands):
December 31, 2019 | |||||||||||||
Gross Carrying Amount | Accumulated Amortization | Net Carrying Amount | Weighted Average Useful Life (in years) | ||||||||||
Customer relationships | $ | 2,230 | $ | (1,598 | ) | $ | 632 | 7.0 | |||||
Acquired technology | 2,030 | (1,377 | ) | 653 | 7.0 | ||||||||
Total | $ | 4,260 | $ | (2,975 | ) | $ | 1,285 | 7.0 | |||||
December 31, 2018 | |||||||||||||
Gross Carrying Amount | Accumulated Amortization | Net Carrying Amount | Weighted Average Useful Life (in years) | ||||||||||
Customer relationships | $ | 2,230 | $ | (1,279 | ) | $ | 951 | 7.0 | |||||
Acquired technology | 2,030 | (1,087 | ) | 943 | 7.0 | ||||||||
Total | $ | 4,260 | $ | (2,366 | ) | $ | 1,894 | 7.0 | |||||
Amortization expense was $0.6 million for each of the years ended December 31, 2019, 2018 and 2017. As of December 31, 2019, expected amortization expense over the remaining intangible asset lives is as follows (in thousands):
Year Ending December 31, | |||
2020 | $ | 609 | |
2021 | 518 | ||
2022 | 66 | ||
2023 | 66 | ||
2024 | 26 | ||
Total | $ | 1,285 | |
5. LEASES
Financial Statement Impact of Adopting ASC 842, "Leases"
On January 1, 2019, the Company adopted ASC 842. The most significant impact of this standard relates to the Company's recognition of right of use, or ROU, assets and lease liabilities for its operating leases. ROU assets represent the Company's right to use an underlying asset for the lease term and lease liabilities represent the Company's obligation to make lease payments arising from the lease. The Company's accounting for finance leases, classified as capital leases under historical accounting guidance, was unchanged.
64
The following table summarizes the financial statement line items impacted by the Company's adoption of ASC 842 at January 1, 2019 (in thousands):
Balance Sheet - select financial statement line items | Ending balance | Effect of the adoption of | Beginning balance | ||||||||
December 31, 2018 | ASC 842 | January 1, 2019 | |||||||||
Operating lease right of use assets | $ | — | $ | 15,099 | $ | 15,099 | |||||
Other assets | 1,515 | (504 | ) | (1) | 1,011 | ||||||
Total assets | 134,269 | 14,595 | 148,864 | ||||||||
Other current liabilities | 3,569 | 3,116 | (2) | 6,685 | |||||||
Total current liabilities | 38,730 | 3,116 | 41,846 | ||||||||
Long-term operating leases, net of current portion | — | 14,310 | 14,310 | ||||||||
Lease incentive obligation | 2,154 | (2,154 | ) | — | |||||||
Other long-term liabilities | 2,343 | (657 | ) | (3) | 1,686 | ||||||
Total liabilities | 44,631 | 14,615 | 59,246 | ||||||||
Accumulated other comprehensive loss | (1,707 | ) | (12 | ) | (1,719 | ) | |||||
Total stockholders' equity | 89,638 | (12 | ) | 89,626 | |||||||
Total liabilities and stockholders' equity | $ | 134,269 | $ | 14,595 | (4) | $ | 148,864 | ||||
(1) Derecognition of lease inception fees associated with certain leases previously amortized over the respective lives of those leases.
(2) Net effect of derecognizing the Company's current deferred rent and lease incentive obligations as of December 31, 2018 and recognizing current operating lease liabilities.
(3) Derecognition of the Company's long-term deferred rent as of December 31, 2018.
(4) The resulting incremental expense due to the Company's adoption of ASC 842 was not considered significant and is recorded as rent expense in General and administrative expense in the accompanying consolidated statement of operations for the year ended December 31, 2019.
Operating and Finance Lease Commitments
The Company leases office facilities and certain equipment under non-cancelable operating and finance leases. The Company determines if an arrangement is a lease and whether its classification is operating or finance at inception. Leases with an initial term of twelve months or less that are not expected to be renewed are not recorded on the balance sheet. For such leases, lease expense for minimum lease payments is recognized on a straight-line basis over the lease term. Certain operating leases include options to renew, with renewal terms extending up to 10 years, subject to certain conditions and notice obligations set forth in the lease agreements. The exercise of lease renewal options is at the Company's discretion.
Operating lease ROU assets and operating lease liabilities are recognized based on the present value of the future minimum lease payments over the lease term at commencement date. As the Company's leases do not provide an implicit rate, the Company uses its incremental borrowing rate based on the Company's best estimate of the collateralized borrowing rate over a similar term at the commencement date of the lease in determining the present value of future payments. The operating lease ROU assets also include any lease payments made and lease incentives and initial direct costs incurred. The lease terms may include options to extend the lease when it is reasonably certain that the Company will exercise that option.
65
The following table summarizes the Company's lease assets and liabilities as of December 31, 2019 (in thousands):
As of December 31, 2019 | |||
Assets | |||
Operating lease right of use assets | $ | 11,128 | |
Finance lease assets, included in Property and equipment, net (1) | 1,917 | ||
Total leased assets | $ | 13,045 | |
Liabilities | |||
Current | |||
Operating lease liabilities, included in Other current liabilities | $ | 4,177 | |
Finance lease liabilities, included in Other current liabilities | 1,418 | ||
Long-term | |||
Long-term operating leases, net of current portion | 9,767 | ||
Finance leases, net of current portion | $ | 27 | |
Total lease liabilities | $ | 15,389 | |
(1) Finance leases are presented net of accumulated amortization of $4.4 million as of December 31, 2019.
The following table summarizes the components of lease expense for the year ended December 31, 2019 (in thousands):
Year Ended December 31, 2019 | |||
Operating lease cost, included in General and administrative expense (1) | $ | 4,808 | |
Finance lease cost: | |||
Amortization of leased assets, included in General and administrative expense | 2,041 | ||
Interest on lease liabilities, included in Other income (expense), net | 140 | ||
Less: sublease income, reducing rent expense in General and administrative expense (2) | (168 | ) | |
Net lease cost | $ | 6,821 | |
(1) Excludes short-term lease costs of $0.4 million for the year ended December 31, 2019.
(2) The Company subleases space to a third party for which it anticipates receiving $0.2 million in annual rental payments during the term of the sublease agreement, which is through August 2022.
66
The following table summarizes other information related to leases for the year ended December 31, 2019 (in thousands):
Year Ended December 31, 2019 | |||
Supplemental cash flows information | |||
Cash paid for amounts included in the measurement of lease liabilities: | |||
Operating cash outflows from operating leases | $ | 4,852 | |
Operating cash outflows from finance leases | 216 | ||
Financing cash outflows from finance leases | 2,209 | ||
Weighted-average remaining lease term (years) | |||
Operating leases | 3.20 | ||
Finance leases | 1.37 | ||
Weighted-average discount rate | |||
Operating leases | 5.50 | % | |
Finance leases | 7.28 | % | |
The following table summarizes maturities of lease liabilities as of December 31, 2019 (in thousands):
Operating Leases | Finance Leases | ||||||
2020 | $ | 4,840 | $ | 1,523 | |||
2021 | 4,930 | 16 | |||||
2022 | 4,240 | 12 | |||||
2023 | 1,227 | — | |||||
2024 | — | — | |||||
Total lease payments | $ | 15,237 | $ | 1,551 | |||
Less: imputed interest | (1,294 | ) | (105 | ) | |||
Present value of lease liabilities | $ | 13,943 | $ | 1,446 | |||
As of December 31, 2019, the Company had no material operating or finance leases that had not yet commenced.
6. COMMITMENTS AND CONTINGENCIES
Litigation and Other Contingencies
From time to time, the Company is subject to litigation and claims arising in the ordinary course of business. It is not currently party to any material legal proceedings and it is not aware of any pending or threatened legal proceeding against the Company that it believes could have a material adverse effect on its business, operating results, cash flows or financial condition.
During the first quarter of 2017, the Company completed its analysis with regard to potential unpaid sales tax obligations. Based on the results of this analysis, the Company made the decision to enter into voluntary disclosure agreements, or VDAs, with certain jurisdictions to reduce the Company's potential sales tax liability. VDAs generally provide for a maximum look-back period, a waiver of penalties and, at times, interest as well as payment arrangements. The Company's estimated aggregate VDA liability of $2.5 million was recorded as a one-time charge in General and administrative expense in the accompanying consolidated statements of operations for the year ended December 31, 2017. This amount represented the
67
Company's estimate of its potential unpaid sales tax liability through the anticipated look-back periods including interest, where applicable, in all jurisdictions in which the Company had entered into VDAs. During the third quarter of 2017, one jurisdiction rejected the Company's VDA application and conducted a sales tax audit, which was completed in May 2018.
Through December 31, 2018, the Company paid an aggregate of $2.5 million under the terms of the VDAs and to settle the sales tax audit. The Company has no other unresolved VDA applications or ongoing sales tax audits as of December 31, 2019.
7. REVENUE FROM CONTRACTS WITH CUSTOMERS
Financial Statement Impact of Adopting ASC 606, "Revenue from Contracts with Customers"
On January 1, 2018, the Company adopted ASC 606 using the modified retrospective transition method and applied this method to all contracts that were not complete as of the date of adoption. The reported results as of December 31, 2019 and 2018 and for the years ended December 31, 2019 and 2018 in the accompanying consolidated financial statements are presented under ASC 606, while prior period results have not been adjusted and are reported in accordance with historical accounting guidance in effect for those periods.
The adoption of ASC 606 under the modified retrospective transition method resulted in a net adjustment reducing the accumulated deficit by $7.5 million at January 1, 2018. The adjustment consisted of $8.7 million related to the deferral of contract costs that were historically expensed as incurred, $(0.6) million related to the timing of revenue recognition for managed-service contracts, and $(0.6) million related to the tax impact of the contract costs and revenue adjustments.
Revenue Recognition
Revenue is recognized when a customer obtains control of promised services, in an amount that reflects the consideration the Company expects to be entitled to receive in exchange for those services. In determining the amount of revenue to be recognized, the Company performs the following steps: (i) identification of the contract with a customer; (ii) identification of the promised services in the contract and determination of whether the promised services are performance obligations, including whether they are distinct in the context of the contract; (iii) determination of the transaction price; (iv) allocation of the transaction price to the performance obligations based on estimated selling prices; and (v) recognition of revenue when (or as) the Company satisfies each performance obligation.
Disaggregation of Revenue
The Company derives the majority of its revenue from subscription fees paid for access to and usage of its SaaS solutions for a specified period of time. A portion of the subscription fee is typically fixed and is based on a specified minimum amount of gross merchandise value, or GMV, or advertising spend that a customer expects to process through the Company's platform over the contract term. The remaining portion of the subscription fee is variable and is based on a specified percentage of GMV or advertising spend processed through the Company's platform in excess of the customer's specified minimum GMV or advertising spend amount. In addition to subscription fees, contracts with customers may include implementation fees for launch assistance and training. Fixed subscription and implementation fees are billed in advance of the subscription term and are due in accordance with contract terms, which generally provide for payment within 30 days. Variable fees are subject to the same payment terms, although they are generally billed the month after they are incurred. The Company also generates revenue from its solutions that allow brands to direct potential consumers from their websites and digital marketing campaigns to authorized resellers. The majority of the Company's contracts have a one year term. The Company's contractual arrangements include performance, termination and cancellation provisions, but do not provide for refunds. Customers do not have the contractual right to take possession of the Company's software at any time. Sales taxes collected from customers and remitted to government authorities are excluded from revenue.
The following table summarizes revenue disaggregation by product for the years ended December 31, 2019, 2018 and 2017 (in thousands):
2019 | 2018 | 2017 (1) (2) | |||||||||
Marketplaces | $ | 95,757 | $ | 96,321 | $ | 93,020 | |||||
Digital Marketing | 19,683 | 18,919 | 18,076 | ||||||||
Other | 14,519 | 15,978 | 11,439 | ||||||||
$ | 129,959 | $ | 131,218 | $ | 122,535 | ||||||
68
(1) As noted above, prior periods have not been adjusted for the adoption of ASC 606 and are presented in accordance with historical accounting guidance in effect for those periods.
(2) Certain prior period amounts have been reclassified to conform to current period presentation. These reclassifications had no impact on the reported total revenue for the period.
Marketplaces and Digital Marketing - The Company's Marketplaces module connects customers to third-party e-commerce marketplaces and provides access to advertising programs and advanced competitive features on major marketplaces. The Company's Digital Marketing module allows customers to create and optimize advertisements on multiple online shopping channels. Customers may subscribe to each of these modules on a self-service or managed-service basis. Self-service subscriptions allow the customer to manage their own activity on the platform. Launch services are also available, although they are not required for the customer to access the platform. Revenue from self-service subscriptions, including fixed subscription fees and fees associated with any elected launch services, is recognized ratably over the subscription term, which is typically one year, beginning on the date the customer has access to the platform. Managed-service subscriptions offer the customer an outsourced, managed platform experience. Implementation services are included with managed-service subscriptions and are necessary to launch on the platform. Revenue from managed-service subscriptions, including fixed subscription fees and fees associated with implementation services, is recognized ratably over the subscription term, which is typically one year, beginning once implementation services are complete.
As noted above, customers incur variable fees when the GMV processed through Marketplaces, or the GMV or advertising spend processed through Digital Marketing, exceeds the GMV or advertising spend included in their subscriptions. In general, revenue from variable fees is recognized in the period in which the related GMV or advertising spend is processed through the platform.
Other - Other product offerings include the Company's Where to Buy and Product Intelligence solutions, which provide current information on resellers and product availability and insights on product assortment, gaps, and pricing trends. These solutions are only available on a managed-service basis and include implementation services. The Company also enters into integration agreements with certain marketplaces or channels under which the respective platforms of the Company and the business partner are integrated with each other. Revenue from these product offerings is recognized ratably over the subscription term beginning on the date the implementation or integration is complete.
Contracts with Multiple Performance Obligations
Customers may elect to purchase a subscription to multiple modules, multiple modules with multiple service levels, or, for certain of the Company's solutions, multiple brands or geographies. The Company evaluates such contracts to determine whether the services to be provided are distinct and accordingly should be accounted for as separate performance obligations. If the Company determines that a contract has multiple performance obligations, the transaction price, which is the total price of the contract, is allocated to each performance obligation based on a relative standalone selling price method. The Company estimates standalone selling price based on observable prices in past transactions for which the product offering subject to the performance obligation has been sold separately. As the performance obligations are satisfied, revenue is recognized as discussed above in the product descriptions.
Transaction Price Allocated to Future Performance Obligations
As the Company typically enters into contracts with customers for a twelve-month subscription term, substantially all of its performance obligations that have not yet been satisfied as of December 31, 2019 are part of a contract that has an original expected duration of one year or less. For contracts with an original expected duration of greater than one year, the aggregate transaction price allocated to the unsatisfied performance obligations was $26.3 million as of December 31, 2019, of which $16.1 million is expected to be recognized as revenue over the next twelve months.
Deferred Revenue
Deferred revenue represents the unearned portion of subscription and implementation fees. Deferred revenue is recorded when cash payments are received in advance of performance. Deferred amounts are generally recognized within one year. Deferred revenue is included in the accompanying consolidated balance sheets under "Total current liabilities," net of any long-term portion that is included in "Other long-term liabilities." The following table summarizes deferred revenue activity for the year ended December 31, 2019 (in thousands):
69
Balance, beginning of period | Net additions | Revenue recognized from deferred revenue | Balance, end of period | ||||||||||
Deferred revenue | $ | 24,708 | 100,271 | (103,520 | ) | $ | 21,459 | ||||||
Of the $130.0 million of revenue recognized in the year ended December 31, 2019, $22.4 million was included in deferred revenue at January 1, 2019.
Costs to Obtain Contracts
The Company capitalizes sales commissions and a portion of other incentive compensation costs that are directly related to obtaining customer contracts and that would not have been incurred if the contract had not been obtained. These costs are included in the accompanying consolidated balance sheets and are classified as "Prepaid expenses and other current assets," net of any long-term portion that is included in "Deferred contract costs, net of current portion." As of December 31, 2019, $5.6 million was included in "Prepaid expenses and other current assets." Deferred contract costs are amortized to sales and marketing expense over the expected period of benefit, which the Company has determined to be five years based on the estimated customer relationship period. The following table summarizes deferred contract cost activity for the year ended December 31, 2019 (in thousands):
Balance, beginning of period | Additions | Amortized costs (1) | Balance, end of period | ||||||||||
Deferred contract costs | $ | 15,209 | 7,858 | (4,653 | ) | $ | 18,414 | ||||||
(1) Includes contract costs amortized to sales and marketing expense during the period and the impact from foreign currency exchange rate fluctuations.
8. INCOME TAXES
The components of income (loss) before income taxes for the years ended December 31, 2019, 2018 and 2017 were as follows (in thousands):
2019 | 2018 | 2017 | |||||||||
Domestic | $ | 1,994 | $ | (10,552 | ) | $ | (11,089 | ) | |||
Foreign | 2,177 | 3,565 | (5,184 | ) | |||||||
Total income (loss) before income taxes | $ | 4,171 | $ | (6,987 | ) | $ | (16,273 | ) | |||
70
The provision for income tax expense included the following for the years ended December 31, 2019, 2018 and 2017 (in thousands):
2019 | 2018 | 2017 | |||||||||
Current: | |||||||||||
Federal | $ | (10 | ) | $ | (20 | ) | $ | (39 | ) | ||
Foreign | 168 | 141 | 193 | ||||||||
Total | 158 | 121 | 154 | ||||||||
Deferred: | |||||||||||
Federal | — | (211 | ) | (73 | ) | ||||||
State | (18 | ) | 12 | 15 | |||||||
Foreign | 549 | 692 | 188 | ||||||||
Total | 531 | 493 | 130 | ||||||||
Total tax expense | $ | 689 | $ | 614 | $ | 284 | |||||
Additionally, for the year ended December 31, 2019, the Company recorded $0.1 million of foreign current income tax expense in other comprehensive loss.
The Tax Cuts and Jobs Act, or Tax Act, which went into effect on December 22, 2017, significantly revised the Internal Revenue Code of 1986, as amended, or IRC. The Tax Act contains, among other things, significant changes to corporate taxation, including reduction of the corporate tax rate from a top marginal rate of 35% to a flat rate of 21%, limitation of the tax deduction for interest expense to 30% of adjusted earnings (except for certain small businesses), repeal of the alternative minimum tax, limitation of the deduction for net operating losses to 80% of current year taxable income, indefinite net operating loss carryforward period and elimination of net operating loss carrybacks, one time taxation of offshore earnings at reduced rates regardless of whether they are repatriated, elimination of U.S. tax on foreign earnings (subject to certain important exceptions), immediate deductions for certain new investments instead of deductions for depreciation expense over time, creation of the base erosion anti-abuse tax, the global intangible low taxed income inclusion, which the Company accounts for as a period cost, the foreign derived intangible income deduction and modifying or repealing many business deductions and credits.
As of December 31, 2019, the U.S Internal Revenue Service, or IRS, is still in the process of issuing guidance to taxpayers to address changes enacted in the Tax Act. The Company has prepared the income tax provision for years ended December 31, 2019 and 2018 based on available guidance. However, if final guidance is issued that modifies the existing temporary guidance issued by the IRS or if the final guidance contradicts positions taken by the Company in the absence of any IRS guidance, this could have a material impact on the Company's consolidated financial statements.
71
The components of the Company's net deferred tax assets as of December 31, 2019 and 2018 were as follows (in thousands):
2019 | 2018 | ||||||
Deferred tax assets: | |||||||
Domestic tax loss carryforwards | $ | 31,974 | $ | 31,904 | |||
Foreign tax loss carryforwards | 6,098 | 6,177 | |||||
Stock-based compensation | 3,129 | 3,707 | |||||
Tax credits | 3,860 | 3,037 | |||||
Operating lease liability | 3,121 | — | |||||
Lease incentive obligation | — | 790 | |||||
Other assets | 2,062 | 2,242 | |||||
Valuation allowance | (38,603 | ) | (39,040 | ) | |||
Total deferred tax assets | 11,641 | 8,817 | |||||
Deferred tax liabilities: | |||||||
Fixed assets | 821 | 460 | |||||
Intangible assets | 491 | 557 | |||||
Capitalized contract costs | 4,468 | 3,898 | |||||
Right of use assets | 2,478 | — | |||||
Other liabilities | 21 | — | |||||
Total deferred tax liabilities | 8,279 | 4,915 | |||||
Net deferred tax asset | $ | 3,362 | $ | 3,902 | |||
The Company adopted ASC 606 effective January 1, 2018. As a result of this adoption, the Company recorded $2.0 million of deferred tax liabilities, partially offset by a $1.4 million reduction to its valuation allowance. This adjustment was applied using a modified retrospective method with a cumulative-effect adjustment to the accumulated deficit. The recognition upon adoption resulted in a $0.6 million increase to accumulated deficit as of January 1, 2018.
At December 31, 2019 and 2018, the Company had federal net operating loss, or NOL, carryforwards of $128.7 million and $127.2 million, respectively, which expire beginning in 2022. At December 31, 2019 and 2018, the Company had state NOL carryforwards of $151.1 million and $154.5 million, respectively, which expire beginning in 2020. At December 31, 2019 and 2018, the Company had U.S. federal income tax credit carryforwards of $5.1 million and $4.0 million, respectively, which expire beginning in 2034. The utilization of the NOL and tax credit carryforwards may be subject to limitation under the rules regarding a change in stock ownership as determined by the Internal Revenue Code and state and foreign tax laws. Prior to the utilization of these tax attributes, the Company will assess any limitations, particularly related to NOL carryforwards from its acquired entities. For each of the periods ended December 31, 2019 and 2018, the Company also had foreign NOL carryforwards for use against future tax in those jurisdictions of $32.3 million and $32.6 million, respectively. The majority of the Company's foreign NOLs can be carried forward indefinitely.
A valuation allowance has been recognized to offset deferred tax assets, primarily attributable to NOL carryforwards that the Company has determined are not more likely than not to be realized. There was a net increase in the valuation allowance of $1.0 million during the year ended December 31, 2018, which was comprised of a net increase of $2.4 million that was allocable to operations, and a $1.4 million decrease resulting from the Company's adoption of ASC 606 that was allocable to accumulated deficit. There was a net decrease in the valuation allowance of $0.4 million during the year ended December 31, 2019 that was allocable to operations. The Company does not generally consider deferred tax liabilities on indefinite-lived assets as a source of future taxable income available to be able to realize deferred tax assets. However, the Company considers the deferred tax liability associated with an indefinite-lived intangible asset as a source of future taxable income available to be able to realize the deferred tax asset recorded for the U.S. federal alternative minimum tax credit and U.S. federal NOL carryforwards generated in years ending after December 31, 2017, which can be carried forward indefinitely. Since both the deferred tax liability and the deferred tax asset have indefinite lives, they offset each other to arrive at the net deferred tax asset, which is offset by a valuation allowance.
72
Generally, undistributed earnings of the Company's foreign subsidiaries are indefinitely reinvested offshore and, accordingly, no provision for U.S. federal, state or foreign income taxes has been provided thereon. In the year ended December 31, 2019, the Company determined that the undistributed earnings of its foreign subsidiary located in China are no longer permanently reinvested. Accordingly, the Company recorded a deferred tax liability for this temporary difference. The amount of the deferred tax liability is nominal. The cumulative amount of undistributed earnings of the Company's non-U.S. subsidiaries for the years ended December 31, 2019 and 2018 was nominal. The determination of the deferred tax liability, which requires complex analysis of international tax situations related to repatriation, is not practicable at this time. The Company is presently investing in international operations located in Europe, Australia and South America. The Company is funding the working capital needs of its foreign operations through its U.S. operations. In the future, the Company will utilize any foreign undistributed earnings, as well as continued funding from its U.S. operations, to support its continued investment in foreign growth.
A reconciliation of the difference between the effective income tax rate and the statutory federal income tax rate for the years ended December 31, 2019, 2018 and 2017 is as follows:
2019 | 2018 | 2017 | ||||||
U.S. statutory federal rate | 21.0 | % | 21.0 | % | 34.0 | % | ||
Increase (decrease) resulting from: | ||||||||
State taxes, net of federal benefit | 3.7 | 7.8 | 2.5 | |||||
Change in U.S. federal statutory rate | — | — | (102.2 | ) | ||||
Nondeductible expenses | 8.0 | (13.5 | ) | (10.5 | ) | |||
Effect of foreign tax rate differential | 2.3 | (0.5 | ) | (5.3 | ) | |||
Uncertain tax positions | 4.9 | (3.3 | ) | (1.6 | ) | |||
Research and development credit | (24.8 | ) | 15.1 | 5.6 | ||||
Change in valuation allowance | (12.0 | ) | (36.4 | ) | 77.1 | |||
Expiration of NOL | 4.0 | (1.0 | ) | (0.2 | ) | |||
Change in U.S. state statutory rate | 4.0 | 0.6 | (1.7 | ) | ||||
Other | 5.4 | 1.4 | 0.6 | |||||
Effective tax rate | 16.5 | % | (8.8 | )% | (1.7 | )% | ||
The Company's effective tax rates for the years ended December 31, 2019, 2018 and 2017 are lower than the U.S. federal statutory rates of 21%, 21% and 34%, respectively, primarily due to operating losses which are subject to a valuation allowance. The Company cannot recognize the tax benefit of operating loss carryforwards generated in certain jurisdictions due to uncertainties relating to future taxable income in those jurisdictions in terms of both its timing and its sufficiency, which would enable the Company to realize the benefits of those carryforwards. In 2017, the Company remeasured its U.S. net deferred tax assets to reflect the newly enacted U.S. statutory tax rate of 21% which resulted in tax expense of $16.6 million. This was offset by a corresponding reduction to the valuation allowance of $16.7 million. The net result from the change in the U.S. federal statutory tax rate was a tax benefit of $0.1 million. The increase in the effective tax rate impact from state taxes, net of federal benefit, research and development credits and foreign tax rate differential for the year ended December 31, 2018 compared to the year ended December 31, 2017, was primarily due to the decrease in the U.S. federal statutory tax rate. The increase in effective tax rate impact from nondeductible expenses, foreign tax rate differential, uncertain tax positions, and expiration of NOLs and the decrease in the effective tax rate impact from the tax effects of research and development credits for the year ended December 31, 2019 compared to the years ended December 31, 2018 and 2017 was primarily due to the shift from loss before tax for the years ended December 31, 2018 and 2017, to income before tax for the year ended December 31, 2019. The nondeductible expenses during the years ended December 31, 2019, 2018, and 2017 primarily related to stock-based compensation expense associated with nondeductible stock awards. The Company's foreign jurisdictions comprise a mix of income and loss making entities. In the years ended December 31, 2019 and 2018, foreign income exceeded foreign losses and in the year ended December 31, 2017, foreign losses exceeded foreign income.
The Company accounts for uncertain tax provisions in accordance with Accounting Standards Codification Topic 740-10, Income Taxes ("ASC 740-10"). This guidance provides a comprehensive model for the recognition, measurement and disclosure in financial statements of uncertain income tax positions that a company has taken or expects to take on a tax return.
73
The following table shows the changes in unrecognized tax benefits in accordance with ASC 740-10 for the years ended December 31, 2019, 2018 and 2017 (in thousands):
2019 | 2018 | 2017 | |||||||||
Balance as of January 1, | $ | 1,408 | $ | 1,282 | $ | 766 | |||||
Increases related to current tax positions | 183 | 217 | 199 | ||||||||
Increases related to prior year tax positions | 20 | 12 | 317 | ||||||||
Decreases related to prior year tax positions | (10 | ) | (103 | ) | — | ||||||
Balance as of December 31, | $ | 1,601 | $ | 1,408 | $ | 1,282 | |||||
Although the ultimate timing of the resolution and/or closure of audits is highly uncertain, the Company believes it is reasonably possible that a de minimis amount of unrecognized tax benefits could reverse in the next twelve months. If the total unrecognized tax benefit was recognized, there would be a de minimis impact on the effective tax rate. As of December 31, 2019 and 2018, the Company had no accrued interest or penalties related to the tax contingencies. The Company's policy for recording interest and penalties is to record them as a component of provision for income taxes.
The Company has analyzed its filing positions in all significant federal, state and foreign jurisdictions where it is required to file income tax returns, as well as open tax years in these jurisdictions. With few exceptions, the Company is no longer subject to U.S. federal and state and local tax examinations by tax authorities for tax periods 2015 and prior, although carryforward attributes that were generated prior to 2016 may still be adjusted upon examination by the Internal Revenue Service if they either have been or will be used in a future period. The Company is no longer subject to examination in foreign tax jurisdictions for tax periods 2014 and prior. No income tax returns are currently under examination by taxing authorities.
74
9. EQUITY INCENTIVE PLANS AND STOCK-BASED COMPENSATION
In May 2013, the Company's board of directors adopted, and the Company's stockholders approved, the 2013 Equity Incentive Plan, or the 2013 Plan, pursuant to which the Company initially reserved 1,250,000 shares of its common stock for issuance to its employees, directors and non-employee third parties. The 2013 Plan provides for the grant of incentive stock options to employees, and for the grant of nonqualified stock options, restricted stock awards, restricted stock unit awards, stock appreciation rights, performance stock awards and other forms of stock compensation to the Company's employees, directors, and non-employee third parties. The number of shares of common stock reserved for issuance under the 2013 Plan will automatically increase on January 1 each year, for a period of ten years, from January 1, 2014 through January 1, 2023, by 5% of the total number of shares of the Company's common stock outstanding on December 31 of the preceding calendar year, or a lesser number of shares as may be determined by the Company's board of directors. Accordingly, on January 1, 2020 the number of shares reserved for issuance under the 2013 Plan increased by 1,403,873 shares. As of December 31, 2019, 2,608,909 shares remained available for future grant under the 2013 Plan. As a result of the adoption of the 2013 Plan, no further grants may be made under the former 2001 Stock Plan.
Stock-based compensation expense is included in the following line items in the accompanying consolidated statements of operations for the years ended December 31, 2019, 2018 and 2017 (in thousands):
2019 | 2018 | 2017 | |||||||||
Cost of revenue | $ | 995 | $ | 911 | $ | 951 | |||||
Sales and marketing | 2,385 | 3,144 | 3,827 | ||||||||
Research and development | 1,898 | 2,152 | 2,260 | ||||||||
General and administrative | 3,698 | 4,391 | 4,909 | ||||||||
$ | 8,976 | $ | 10,598 | $ | 11,947 | ||||||
Stock Option Awards
The Company values stock options using the Black-Scholes option-pricing model, which requires the input of subjective assumptions, including the risk-free interest rate, expected life, expected stock price volatility and dividend yield. The risk-free interest rate assumption is based upon observed interest rates for constant maturity U.S. Treasury securities consistent with the expected term of the Company's employee stock options. The expected life represents the period of time the stock options are expected to be outstanding and is based on the "simplified method." Under the "simplified method," the expected life of an option is presumed to be the mid-point between the vesting date and the end of the contractual term. The Company used the "simplified method" due to the lack of sufficient historical exercise data to provide a reasonable basis upon which to otherwise estimate the expected life of the stock options. Expected volatility is estimated based on the historical volatility of the Company's stock. Prior to the fourth quarter of 2017, expected volatility was estimated based on volatilities of publicly traded stock for comparable companies over the estimated expected life of the stock options. The Company assumed no dividend yield because dividends are not expected to be paid in the near future, which is consistent with the Company's history of not paying dividends.
The following table summarizes the assumptions used for estimating the fair value of stock options granted for the years ended December 31, 2019, 2018 and 2017:
2019 | 2018 | 2017 | |||
Risk-free interest rate | 1.8% - 2.5% | 2.7% - 2.9% | 1.4% - 2.1% | ||
Expected term (years) | 6.25 | 6.25 | 6.25 | ||
Expected volatility | 37% - 41% | 43% | 45% - 51% | ||
Dividend yield | 0% | 0% | 0% | ||
75
The following is a summary of the option activity for the year ended December 31, 2019:
Number of Options | Weighted Average Exercise Price | Weighted Average Remaining Contractual Term | Aggregate Intrinsic Value | |||||||||
(in years) | (in thousands) | |||||||||||
Outstanding balance at December 31, 2018 | 2,208,141 | $ | 10.57 | |||||||||
Granted | 554,545 | 12.07 | ||||||||||
Exercised | (101,103 | ) | 9.63 | |||||||||
Forfeited | (363,401 | ) | 12.74 | |||||||||
Expired | (101,416 | ) | 13.99 | |||||||||
Outstanding balance at December 31, 2019 | 2,196,766 | $ | 10.47 | 6.28 | $ | 1,478 | ||||||
Exercisable at December 31, 2019 | 1,357,114 | $ | 9.63 | 4.95 | $ | 1,464 | ||||||
Vested and expected to vest at December 31, 2019 | 2,047,715 | $ | 10.38 | 6.13 | $ | 1,475 | ||||||
The weighted average grant date fair value for the Company's stock options granted during the years ended December 31, 2019, 2018, and 2017 was $4.51, $5.98 and $4.17 per share, respectively.
The total fair value of stock options vested during the years ended December 31, 2019, 2018 and 2017 was $1.8 million, $1.5 million and $1.2 million, respectively.
The total compensation cost related to nonvested stock options not yet recognized as of December 31, 2019 was $1.5 million and will be recognized over a weighted average period of approximately 1.8 years.
The aggregate intrinsic value of stock options exercised during the years ended December 31, 2019, 2018, and 2017 was $0.2 million, $0.6 million and $0.5 million, respectively.
Restricted Stock Units
The following table summarizes the RSU activity for the year ended December 31, 2019:
Number of RSUs | Weighted Average Grant-Date Fair Value | |||||
Unvested RSUs as of December 31, 2018 | 2,216,430 | $ | 11.87 | |||
Granted | 1,301,803 | 9.89 | ||||
Vested | (920,627 | ) | 11.11 | |||
Forfeited | (510,960 | ) | 11.94 | |||
Unvested RSUs as of December 31, 2019 | 2,086,646 | $ | 10.93 | |||
The total unrecognized compensation cost related to the unvested RSUs as of December 31, 2019 was $9.5 million and will be recognized over a weighted average period of approximately 1.9 years.
10. NET INCOME (LOSS) PER SHARE
For the years ended December 31, 2018 and 2017, the Company incurred net losses and, therefore, the effect of the Company's outstanding stock options and unvested RSUs were not included in the calculation of diluted net income (loss) per share as the effect would be anti-dilutive.
76
The following table summarizes the calculation of basic and diluted net income (loss) per share for the years ended December 31, 2019, 2018 and 2017 (in thousands, except share and per share data):
2019 | 2018 | 2017 | |||||||||
Basic: | |||||||||||
Net income (loss) | $ | 3,482 | $ | (7,601 | ) | $ | (16,557 | ) | |||
Weighted average common shares outstanding, basic | 27,886,278 | 27,138,274 | 26,366,748 | ||||||||
Basic net income (loss) per share | $ | 0.12 | $ | (0.28 | ) | $ | (0.63 | ) | |||
Diluted: | |||||||||||
Net income (loss) | $ | 3,482 | $ | (7,601 | ) | $ | (16,557 | ) | |||
Weighted average common shares outstanding, basic | 27,886,278 | 27,138,274 | 26,366,748 | ||||||||
Dilutive effect of: | |||||||||||
Stock options | 167,208 | — | — | ||||||||
Unvested RSUs | 763,491 | — | — | ||||||||
Diluted weighted average common shares outstanding | 28,816,977 | 27,138,274 | 26,366,748 | ||||||||
Diluted net income (loss) per share | $ | 0.12 | $ | (0.28 | ) | $ | (0.63 | ) | |||
The following equity instruments have been excluded from the calculation of diluted net income (loss) per share because the effect is anti-dilutive for the years ended December 31, 2019, 2018 and 2017:
2019 | 2018 | 2017 | ||||||
Stock options | 1,626,757 | 2,208,141 | 2,108,392 | |||||
RSUs | 278,937 | 2,216,430 | 2,481,037 | |||||
11. RESTRUCTURING
In the third quarter of 2019, the Company implemented a plan to reduce its expenses and align its operations with evolving business needs, or the 2019 Actions. As part of this strategic initiative, the Company reduced its global workforce by approximately 10% and discontinued its physical operations in China. As a result of the implementation of the 2019 Actions, the Company paid and recognized severance and related costs of $1.4 million during the year ended December 31, 2019. These costs are included in the following line items in the accompanying consolidated statements of operations (in thousands):
Year Ended December 31, 2019 | |||
Cost of revenue | $ | 238 | |
Sales and marketing | 369 | ||
Research and development | 142 | ||
General and administrative | 560 | ||
Other (expense) income, net | 120 | ||
$ | 1,429 | ||
77
12. SEGMENT AND GEOGRAPHIC INFORMATION
Operating segments are defined as components of an enterprise for which discrete financial information is available that is evaluated regularly by the chief operating decision maker, or CODM, for purposes of allocating resources and evaluating financial performance. The Company's CODM reviews financial information presented on a consolidated basis for purposes of allocating resources and evaluating financial performance. As such, the Company's operations constitute a single operating segment and one reportable segment.
Substantially all assets were held in the United States during the years ended December 31, 2019 and 2018. The following table summarizes revenue by geography for the years ended December 31, 2019, 2018 and 2017 (in thousands):
2019 | 2018 | 2017 | |||||||||
Revenue by geography: | |||||||||||
Domestic | $ | 97,162 | $ | 99,901 | $ | 95,722 | |||||
International | 32,797 | 31,317 | 26,813 | ||||||||
Total | $ | 129,959 | $ | 131,218 | $ | 122,535 | |||||
The Company's revenue from external customers based in the United Kingdom totaled $13.0 million, $12.3 million and $11.7 million for the years ended December 31, 2019, 2018 and 2017, respectively.
13. RETIREMENT PLANS
The Company provides retirement plans whereby participants may elect to contribute a portion of their annual compensation to the plans, after complying with certain requirements and subject to certain limitations. The Company contributed an aggregate of $1.7 million to the plans for each of the years ended December 31, 2019 and 2018, and $1.5 million for the year ended December 31, 2017.
14. SELECTED QUARTERLY INFORMATION (UNAUDITED)
The following tables summarize the Company's quarterly results of operations for the years ended December 31, 2019 and 2018 (in thousands, except per share amounts):
Three Months Ended, | |||||||||||||||
March 31, 2019 | June 30, 2019 | September 30, 2019 | December 31, 2019 | ||||||||||||
Revenue | $ | 31,574 | $ | 31,932 | $ | 31,678 | $ | 34,775 | |||||||
Gross profit | 24,045 | 24,836 | 24,427 | 27,643 | |||||||||||
(Loss) income from operations | (2,300 | ) | (1,414 | ) | 1,781 | 5,735 | |||||||||
Net (loss) income | (2,329 | ) | (1,338 | ) | 1,729 | 5,420 | |||||||||
Net (loss) income per share: | |||||||||||||||
Basic | $ | (0.08 | ) | $ | (0.05 | ) | $ | 0.06 | $ | 0.19 | |||||
Diluted | $ | (0.08 | ) | $ | (0.05 | ) | $ | 0.06 | $ | 0.19 | |||||
Three Months Ended, | |||||||||||||||
March 31, 2018 | June 30, 2018 | September 30, 2018 | December 31, 2018 | ||||||||||||
Revenue | $ | 31,445 | $ | 32,660 | $ | 32,324 | $ | 34,789 | |||||||
Gross profit | 24,092 | 25,685 | 24,718 | 27,222 | |||||||||||
(Loss) income from operations | (3,151 | ) | (2,734 | ) | (2,241 | ) | 620 | ||||||||
Net (loss) income | (3,157 | ) | (2,764 | ) | (2,287 | ) | 607 | ||||||||
Net (loss) income per share: | |||||||||||||||
Basic | $ | (0.12 | ) | $ | (0.10 | ) | $ | (0.08 | ) | $ | 0.02 | ||||
Diluted | $ | (0.12 | ) | $ | (0.10 | ) | $ | (0.08 | ) | $ | 0.02 | ||||
78
ITEM 9. CHANGES IN AND DISAGREEMENTS WITH ACCOUNTANTS ON ACCOUNTING AND FINANCIAL DISCLOSURE
None.
ITEM 9A. CONTROLS AND PROCEDURES
Evaluation of Disclosure Controls and Procedures
Under the supervision of and with the participation of our management, including our chief executive officer, who is our principal executive officer, and our chief financial officer, who is our principal financial officer, we conducted an evaluation of the effectiveness of our disclosure controls and procedures as of December 31, 2019, the end of the period covered by this Annual Report. The term "disclosure controls and procedures," as set forth in Rules 13a-15(e) and 15d-15(e) under the Exchange Act, means controls and other procedures of a company that are designed to provide reasonable assurance that information required to be disclosed by a company in the reports that it files or submits under the Exchange Act is recorded, processed, summarized and reported, within the time periods specified in the rules and forms promulgated by the Securities and Exchange Commission, or the SEC. Disclosure controls and procedures include, without limitation, controls and procedures designed to ensure that information required to be disclosed by a company in the reports that it files or submits under the Exchange Act is accumulated and communicated to the company's management, including its principal executive and principal financial officers, as appropriate to allow timely decisions regarding required disclosure. Management recognizes that any controls and procedures, no matter how well designed and operated, can provide only reasonable assurance of achieving their objectives, and management necessarily applies its judgment in evaluating the cost-benefit relationship of possible controls and procedures. Based on the evaluation of our disclosure controls and procedures as of December 31, 2019, our chief executive officer and chief financial officer concluded that, as of such date, our disclosure controls and procedures were effective at the reasonable assurance level.
Changes in Internal Control over Financial Reporting
There was no change in our internal control over financial reporting identified in connection with the evaluation required by Rule 13a-15(d) and 15d-15(d) of the Exchange Act that occurred during the quarter ended December 31, 2019 that has materially affected, or is reasonably likely to materially affect, our internal control over financial reporting.
Management's Report on Internal Control Over Financial Reporting and Report of Independent Registered Public Accounting Firm
Our management is responsible for establishing and maintaining adequate internal control over financial reporting. Under the supervision and with the participation of our management, including our principal executive officer and principal financial officer, we conducted an evaluation of the effectiveness of our internal control over financial reporting based on the framework in Internal Control - Integrated Framework (2013) issued by the Committee of Sponsoring Organizations of the Treadway Commission. Based on our evaluation under this framework, our management concluded that our internal control over financial reporting was effective as of December 31, 2019.
The effectiveness of our internal control over financial reporting as of December 31, 2019 has been audited by our independent registered public accounting firm, as stated in their attestation report, which is included in Part II, Item 8. of this Annual Report.
ITEM 9B. OTHER INFORMATION
Not applicable.
PART III
We will file a definitive Proxy Statement for our 2020 Annual Meeting of Stockholders, or the 2020 Proxy Statement, with the SEC, pursuant to Regulation 14A, not later than 120 days after the end of our fiscal year. Accordingly, certain information required by Part III has been omitted under General Instruction G(3) to Form 10-K. Only those sections of the 2020 Proxy Statement that specifically address the items set forth herein are incorporated by reference.
79
ITEM 10. DIRECTORS, EXECUTIVE OFFICERS AND CORPORATE GOVERNANCE
The information required by Item 10 is hereby incorporated by reference to the sections of the 2020 Proxy Statement under the captions "Information Regarding the Board of Directors and Corporate Governance," "Election of Directors," and "Executive Officers."
ITEM 11. EXECUTIVE COMPENSATION
The information required by Item 11 is hereby incorporated by reference to the sections of the 2020 Proxy Statement under the captions "Executive Compensation" and "Director Compensation."
ITEM 12. SECURITY OWNERSHIP OF CERTAIN BENEFICIAL OWNERS AND MANAGEMENT AND RELATED STOCKHOLDER MATTERS
The information required by Item 12 is hereby incorporated by reference to the sections of the 2020 Proxy Statement under the captions "Security Ownership of Certain Beneficial Owners and Management" and "Securities Authorized for Issuance under Equity Compensation Plans."
ITEM 13. CERTAIN RELATIONSHIPS AND RELATED TRANSACTIONS, AND DIRECTOR INDEPENDENCE
The information required by Item 13 is hereby incorporated by reference to the sections of the 2020 Proxy Statement under the captions "Transactions with Related Persons" and "Independence of the Board of Directors."
ITEM 14. PRINCIPAL ACCOUNTING FEES AND SERVICES
The information required by Item 14 is hereby incorporated by reference to the sections of the 2020 Proxy Statement under the caption "Ratification of Selection of Independent Auditors."
PART IV
ITEM 15. EXHIBITS, FINANCIAL STATEMENT SCHEDULES
(a) Exhibits
Exhibit Number | Description of Document |
Amended and Restated Certificate of Incorporation (incorporated herein by reference to Exhibit 3.1 to the Registrant's Current Report on Form 8-K (File No. 001-35940), filed with the Securities and Exchange Commission on May 29, 2013). | |
Amended and Restated Bylaws (incorporated herein by reference to Exhibit 3.2 to the Registrant's Current Report on Form 8-K (File No. 001-35940), filed with the Securities and Exchange Commission on May 29, 2013). | |
Specimen stock certificate evidencing shares of Common Stock (incorporated herein by reference to Exhibit 4.2 to Amendment No. 2 to the Registrant's Registration Statement on Form S-1 (File No. 333-187865), filed with the Securities and Exchange Commission on May 9, 2013). | |
Description of Certain of Registrant's Securities. | |
2001 Stock Plan, as amended (incorporated herein by reference to Exhibit 10.12 to the Registrant's Registration Statement on Form S-1 (File No. 333-187865), filed with the Securities and Exchange Commission on April 11, 2013). | |
80
Form of Incentive Stock Option Agreement under 2001 Stock Plan (incorporated herein by reference to Exhibit 10.13 to the Registrant's Registration Statement on Form S-1 (File No. 333-187865), filed with the Securities and Exchange Commission on April 11, 2013). | |
2013 Equity Incentive Plan (incorporated herein by reference to Exhibit 4.6 to the Registrant's Registration Statement on Form S-8 (File No. 333-188988), filed with the Securities and Exchange Commission on May 31, 2013). | |
Form of Stock Option Grant Notice and Stock Option Agreement under 2013 Equity Incentive Plan (incorporated herein by reference to Exhibit 10.15 to Amendment No. 1 to the Registrant's Registration Statement on Form S-1 (File No. 333-187865), filed with the Securities and Exchange Commission on April 26, 2013). | |
Form of Restricted Stock Unit Grant Notice and Restricted Stock Unit Agreement under 2013 Equity Incentive Plan (incorporated herein by reference to Exhibit 10.17 to Amendment No. 1 to the Registrant's Registration Statement on Form S-1 (File No. 333-187865), filed with the Securities and Exchange Commission on April 26, 2013). | |
Form of Indemnification Agreement with non-employee directors (incorporated herein by reference to Exhibit 10.19 to the Registrant's Registration Statement on Form S-1 (File No. 333-187865), filed with the Securities and Exchange Commission on April 11, 2013). | |
Amended and Restated Executive Severance and Change in Control Letter Agreement, dated as of December 17, 2014, by and between the Registrant and David J. Spitz (incorporated herein by reference to Exhibit 10.17 to the Registrant's Annual Report on Form 10-K (File No. 001-35940), filed with the Securities and Exchange Commission on February 26, 2015). | |
Schedule of Compensation for Non-Employee Directors, adopted effective as of January 21, 2020. | |
Office lease, dated as of August 15, 2014, by and between the Registrant and Raleigh 1 LP (as successor in interest to Duke Realty Limited Partnership) (incorporated herein by reference to Exhibit 10.2 to the Registrant's Quarterly Report on Form 10-Q (File No. 001-35940), filed with the Securities and Exchange Commission on November 6, 2014). | |
Executive Severance and Change in Control Letter Agreement, dated as of December 17, 2014, by and between the Registrant and Diana S. Allen (incorporated herein by reference to Exhibit 10.24 to the Registrant's Annual Report on Form 10-K (File No. 001-35940), filed with the Securities and Exchange Commission on February 26, 2015). | |
First Amendment to Office Lease, dated as of December 10, 2015, by and between the Registrant and Raleigh 1 LP (as successor in interest to Duke Realty Limited Partnership) (incorporated herein by reference to Exhibit 10.22 to the Registrant's Annual Report on Form 10-K (File No. 001-35940), filed with the SEC on February 25, 2016). | |
Second Amendment to Office Lease, dated as of August 25, 2017, by and between the Registrant and Raleigh 1 LP (as successor in interest to Duke Realty Limited Partnership) (incorporated herein by reference to Exhibit 10.13 to the Registrant's Annual Report on Form 10-K (File No. 001-35940), filed with the SEC on February 13, 2018). | |
Third Amendment to Office Lease, dated as of April 5, 2018, by and between the Registrant and Raleigh 1 LP (as successor in interest to Duke Realty Limited Partnership). (incorporated herein by reference to Exhibit 10.1 to the Registrant's Quarterly Report on Form 10-Q (File No. 001-35940), filed with the Securities and Exchange Commission on August 9, 2018). | |
Amendment to Executive Severance and Change in Control Letter Agreement, dated as of December 31, 2018, by and between the Registrant and David J. Spitz. (incorporated herein by reference to Exhibit 10.15 to the Registrant's Annual Report on Form 10-K (File No. 001-35940), filed with the Securities and Exchange Commission on February 13, 2019). | |
Amendment to Executive Severance and Change in Control Letter Agreement, dated as of December 31, 2018, by and between the Registrant and Diana S. Allen. (incorporated herein by reference to Exhibit 10.17 to the Registrant's Annual Report on Form 10-K (File No. 001-35940), filed with the Securities and Exchange Commission on February 13, 2019). | |
Executive Severance and Change in Control Letter Agreement, dated as of November 5, 2015, by and between the Registrant and Richard Cornetta, as amended on December 31, 2018 (incorporated herein by reference to Exhibit 10.1 to the Registrant’s Quarterly Report on Form 10-Q (File No. 001-35940), filed with the Securities and Exchange Commission on November 7, 2019). | |
81
Amended and Restated Executive Severance and Change in Control Letter Agreement, dated as of August 8, 2019, by and between the Registrant and Elizabeth Segovia (incorporated herein by reference to Exhibit 10.2 to the Registrant's Quarterly Report on Form 10-Q (File No. 001-35940), filed with the Securities and Exchange Commission on November 7, 2019). | |
Second Amendment to Executive Severance and Change in Control Letter Agreement, dated as of November 11, 2019, by and between the Registrant and David J. Spitz. | |
Subsidiaries of the Registrant. | |
Consent of Ernst & Young LLP, independent registered public accounting firm. | |
Power of Attorney (contained on signature page hereto). | |
Certification of Principal Executive Officer under Section 302 of the Sarbanes-Oxley Act. | |
Certification of Principal Financial Officer under Section 302 of the Sarbanes-Oxley Act. | |
Certifications of Principal Executive Officer and Principal Financial Officer under Section 906 of the Sarbanes-Oxley Act. | |
101.INS | XBRL Instance Document |
101.SCH | XBRL Taxonomy Extension Schema Document |
101.CAL | XBRL Taxonomy Extension Calculation Linkbase Document |
101.DEF | XBRL Taxonomy Extension Definition Linkbase Document |
101.LAB | XBRL Taxonomy Extension Label Linkbase Document |
101.PRE | XBRL Taxonomy Extension Presentation Linkbase Document |
_____________________________
^ | These certifications are being furnished solely to accompany this Annual Report pursuant to 18 U.S.C. Section 1350, and are not being filed for purposes of Section 18 of the Securities Exchange Act of 1934, as amended, and are not to be incorporated by reference into any filing of the registrant, whether made before or after the date hereof, regardless of any general incorporation language in such filing. |
+ | Indicates management contract or compensatory plan. |
(b) Financial Statement Schedules
All schedules are omitted as information required is inapplicable or the information is presented in the consolidated financial statements and the related notes.
82
ITEM 16. FORM 10-K SUMMARY
None.
83
SIGNATURES
Pursuant to the requirements of Section 13 or 15(d) of the Securities Exchange Act of 1934, as amended, the registrant has duly caused this report to be signed on its behalf by the undersigned, thereunto duly authorized.
CHANNELADVISOR CORPORATION | ||
By: | /s/ David J. Spitz | |
February 12, 2020 | David J. Spitz Chief Executive Officer | |
KNOW ALL PERSONS BY THESE PRESENTS, that each person whose signature appears below constitutes and appoints Richard F. Cornetta and Diana S. Allen, jointly and severally, as his or her true and lawful attorneys-in-fact and agents, with full power of substitution and resubstitution, for him or her and in his or her name, place and stead, in any and all capacities, to sign this Annual Report on Form 10-K of ChannelAdvisor Corporation, and any or all amendments thereto, and to file the same, with all exhibits thereto, and other documents in connection therewith, with the Securities and Exchange Commission, granting unto said attorneys-in-fact and agents full power and authority to do and perform each and every act and thing requisite or necessary to be done in and about the premises hereby ratifying and confirming all that said attorneys-in-fact and agents, or his, her or their substitute or substitutes, may lawfully do or cause to be done by virtue hereof.
Pursuant to the requirements of the Securities Exchange Act of 1934, as amended, this report has been signed below by the following persons on behalf of the registrant and in the capacities and on the dates indicated.
Signature | Title | Date | ||
/s/ David J. Spitz | Chief Executive Officer and Director (Principal Executive Officer) | February 12, 2020 | ||
David J. Spitz | ||||
/s/ Richard F. Cornetta | Chief Financial Officer (Principal Financial Officer and Principal Accounting Officer) | February 12, 2020 | ||
Richard F. Cornetta | ||||
/s/ Timothy J. Buckley | Director | February 12, 2020 | ||
Timothy J. Buckley | ||||
/s/ Joseph L. Cowan | Director | February 12, 2020 | ||
Joseph L. Cowan | ||||
/s/ Janet R. Cowell | Director | February 12, 2020 | ||
Janet R. Cowell | ||||
/s/ Marshall A. Heinberg | Director | February 12, 2020 | ||
Marshall A. Heinberg | ||||
/s/ Marc E. Huffman | Director | February 12, 2020 | ||
Marc E. Huffman | ||||
/s/ Timothy V. Williams | Director | February 12, 2020 | ||
Timothy V. Williams | ||||
/s/ M. Scot Wingo | Director | February 12, 2020 | ||
M. Scot Wingo | ||||
84