Attached files
| file | filename |
|---|---|
| 8-K - 8-K - Daseke, Inc. | f8-k.htm |
Exhibit 99.1
| Investor Presentation February 2020 |

| Important Disclaimers Forward-Looking Statements This presentation contains “forward-looking statements” within the meaning of the Private Securities Litigation Reform Act of 1995. Forward-looking statements may be identified by the use of words such as “may,” “will,” “expect,” “anticipate,” “continue,” “estimate,” “project,” “believe,” “plan,” “should,” “could,” “would,” “forecast,” “seek,” “target,” “predict,” and “potential,” the negative of these terms, or other comparable terminology. Projected financial information, including our guidance outlook, are forward-looking statements. Forward-looking statements may also include statements about the Company’s goals; the Company’s financial strategy, liquidity and capital required for its business strategy and plans; the Company’s competition and government regulations; general economic conditions; and the Company’s future operating results. These forward-looking statements are based on information available as of the date of this presentation, and current expectations, forecasts and assumptions. While management believes that these forward-looking statements are reasonable as and when made, there can be no assurance that future developments affecting us will be those that the Company anticipates. Accordingly, forward-looking statements should not be relied upon as representing the Company’s views as of any subsequent date, and the Company does not undertake any obligation to update forward-looking statements to reflect events or circumstances after the date they were made, whether as a result of new information, future events or otherwise, except as may be required under applicable securities laws. Accordingly, readers are cautioned not to place undue reliance on the forward-looking statements. Forward-looking statements are subject to risks and uncertainties (many of which are beyond our control) that could cause actual results or outcomes to differ materially from those indicated by such forward-looking statements. These factors include, but are not limited to, general economic and business risks, driver shortages and increases in driver compensation or owner-operator contracted rates, loss of senior management or key operating personnel, our ability to identify and execute future acquisitions successfully, seasonality and the impact of weather and other catastrophic events, fluctuations in the price or availability of diesel fuel, increased prices for, or decreases in the availability of, new revenue equipment and decreases in the value of used revenue equipment, the failure of any restructuring actions and cost reduction initiatives that the Company undertakes to meet the expected results, the Company’s ability to generate sufficient cash to service all of the Company’s indebtedness, restrictions in its existing and future debt agreements, increases in interest rates, changes in existing laws or regulations, including environmental and worker health safety laws and regulations and those relating to tax rates or taxes in general, the impact of governmental regulations and other governmental actions related to the Company and its operations, litigation and governmental proceedings, and insurance and claims expenses. You should not place undue reliance on these forward‐looking statements. For additional information regarding known material factors that could cause our actual results to differ from those expressed in forward‐looking statements, please see Daseke’s filings with the Securities and Exchange Commission, available at www.sec.gov, including Daseke’s most recent annual report on Form 10-K, particularly the section titled “Risk Factors”. Non-GAAP Financial Measures This presentation includes non-GAAP financial measures for the Company and its operating segments, including Adjusted Net Income (Loss), Adjusted EBITDA and Adjusted Operating Ratio. You can find the reconciliations of these measures to the nearest comparable GAAP measure in the Appendix of this presentation. Daseke defines Adjusted Net Income (Loss) as net income (loss) adjusted for acquisition related transaction expenses, business transformation costs, non-cash impairments, amortization of intangible assets, the net impact of step-up in basis of acquired assets and unusual or non-regularly recurring expenses or recoveries. Daseke defines Adjusted EBITDA as net income (loss) plus (i) depreciation and amortization, (ii) interest expense, and other fees and charges associated with financings, net of interest income, (iii) income taxes, (iv) acquisition-related transaction expenses (including due diligence costs, legal, accounting and other advisory fees and costs, retention and severance payments and financing fees and expenses), (v) business transformation costs, (vi) non-cash impairment, (vii) restructuring charges, and (viii) non-cash stock and equity- compensation expense. Daseke defines Adjusted Operating Ratio as (a) total operating expenses (i) less, acquisition-related transaction expenses, non-cash impairment charges, unusual or non-regularly recurring expenses or recoveries, (ii) less, business transformation costs, and (iii) further adjusted for the net impact of the step-up in basis (such as increased depreciation and amortization expense) and amortization of identifiable intangible assets resulting from acquisitions, as a percentage of (b) total revenue. The Company believes its presentation of Non-GAAP financial measures is useful because it provides investors and industry analysts the same information that the Company uses internally for purposes of assessing its core operating performance. Please note that these non-GAAP measures are not a substitute for, or more meaningful than, net income (loss), cash flows from operating activities, operating income or any other measure prescribed by GAAP, and there are limitations to using non-GAAP measures. Certain items excluded from these non-GAAP measures are significant components in understanding and assessing a company’s financial performance, such as a company’s cost of capital, tax structure and the historic costs of depreciable assets. The Company’s non- GAAP financial measures may not provide information that is directly comparable to that provided by other companies in our industry because they may calculate non-GAAP financial results differently. Because of these limitations, these non-GAAP measures should not be considered a measure of the income generated by the Company’s business or discretionary cash available to it to invest in the growth of its business. The Company’s management compensates for these limitations by relying primarily on the Company’s GAAP results and using these non-GAAP measures supplementally. See the Appendix for directly comparable GAAP measures. Industry and Market Data This presentation includes market data and other statistical information from third party sources, including independent industry publications, government publications and other published independent sources. Although Daseke believes these third-party sources are reliable as of their respective dates, Daseke has not independently verified the accuracy or completeness of this information. 2 |
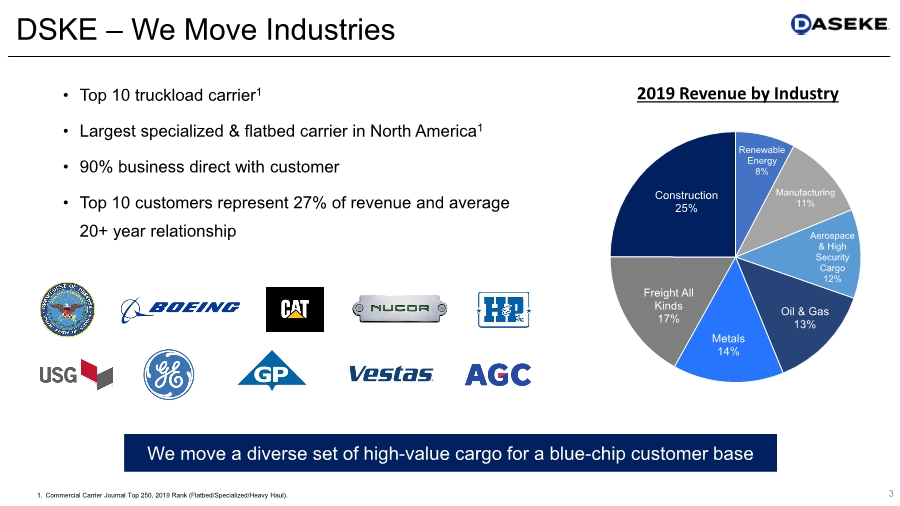
| • Top 10 truckload carrier1 • Largest specialized & flatbed carrier in North America1 • 90% business direct with customer • Top 10 customers represent 27% of revenue and average 20+ year relationship 3 1. Commercial Carrier Journal Top 250, 2019 Rank (Flatbed/Specialized/Heavy Haul). DSKE – We Move Industries We move a diverse set of high-value cargo for a blue-chip customer base Renewable Energy 8% Manufacturing 11% Aerospace & High Security Cargo 12% Oil & Gas 13% Metals 14% Freight All Kinds 17% Construction 25% 2019 Revenue by Industry |
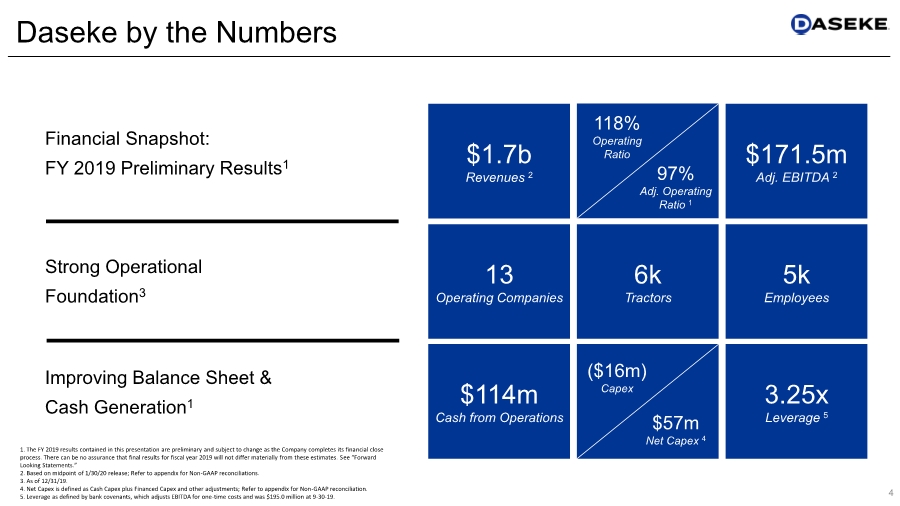
| Daseke by the Numbers Financial Snapshot: FY 2019 Preliminary Results1 $1.7b Revenues 2 $171.5m Adj. EBITDA 2 13 Operating Companies 6k Tractors 5k Employees $114m Cash from Operations 3.25x Leverage 5 Strong Operational Foundation3 Improving Balance Sheet & Cash Generation1 4 1. The FY 2019 results contained in this presentation are preliminary and subject to change as the Company completes its financial close process. There can be no assurance that final results for fiscal year 2019 will not differ materially from these estimates. See “Forward Looking Statements.” 2. Based on midpoint of 1/30/20 release; Refer to appendix for Non-GAAP reconciliations. 3. As of 12/31/19. 4. Net Capex is defined as Cash Capex plus Financed Capex and other adjustments; Refer to appendix for Non-GAAP reconciliation. 5. Leverage as defined by bank covenants, which adjusts EBITDA for one-time costs and was $195.0 million at 9-30-19. 117% Operating Ratio 97% Adj. Operating Ratio 1 118% Operating Ratio ($16m) Capex $57m Net Capex 4 |
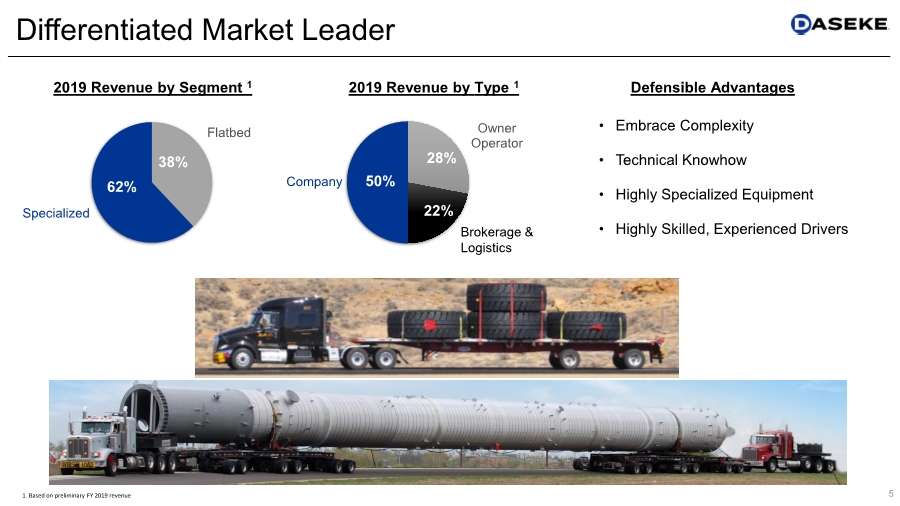
| • Embrace Complexity • Technical Knowhow • Highly Specialized Equipment • Highly Skilled, Experienced Drivers 5 Differentiated Market Leader 50% 28% 22% 2019 Revenue by Segment 1 Flatbed Specialized 38% 62% Company Brokerage & Logistics 2019 Revenue by Type 1 Defensible Advantages Owner Operator 1. Based on preliminary FY 2019 revenue |
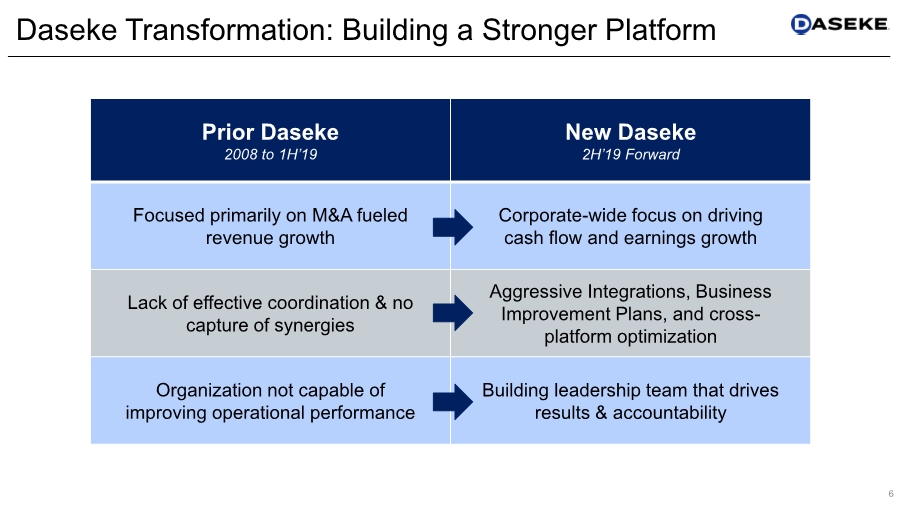
| Prior Daseke 2008 to 1H’19 New Daseke 2H’19 Forward Focused primarily on M&A fueled revenue growth Corporate-wide focus on driving cash flow and earnings growth Lack of effective coordination & no capture of synergies Aggressive Integrations, Business Improvement Plans, and cross- platform optimization Organization not capable of improving operational performance Building leadership team that drives results & accountability 6 Daseke Transformation: Building a Stronger Platform |
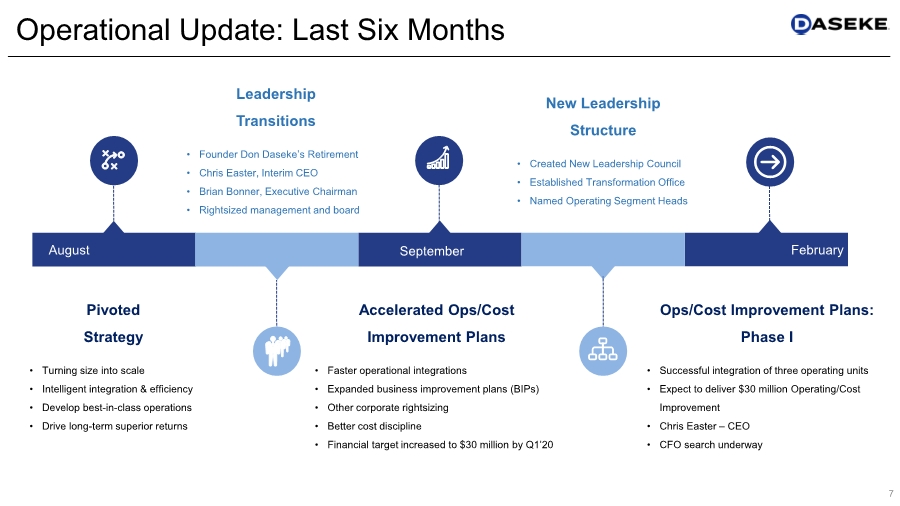
| Pivoted Strategy • Turning size into scale • Intelligent integration & efficiency • Develop best-in-class operations • Drive long-term superior returns Accelerated Ops/Cost Improvement Plans • Faster operational integrations • Expanded business improvement plans (BIPs) • Other corporate rightsizing • Better cost discipline • Financial target increased to $30 million by Q1’20 August February Leadership Transitions • Founder Don Daseke’s Retirement • Chris Easter, Interim CEO • Brian Bonner, Executive Chairman • Rightsized management and board New Leadership Structure • Created New Leadership Council • Established Transformation Office • Named Operating Segment Heads Ops/Cost Improvement Plans: Phase I • Successful integration of three operating units • Expect to deliver $30 million Operating/Cost Improvement • Chris Easter – CEO • CFO search underway September Operational Update: Last Six Months 7 |
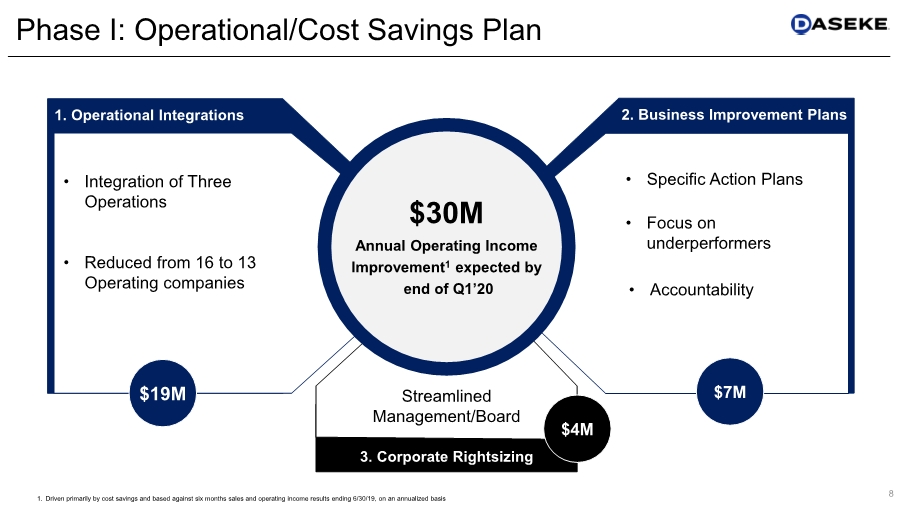
| • Specific Action Plans • Focus on underperformers • Timing • Accountability 1. Operational Integrations 3. Corporate Rightsizing 2. Business Improvement Plans $30M Annual Operating Income Improvement1 by Q1’20 $19M $4M $7M $30M Annual Operating Income Improvement1 expected by end of Q1’20 Streamlined Management/Board • Specific Action Plans • Focus on underperformers • Accountability Phase I: Operational/Cost Savings Plan • Integration of Three Operations • Reduced from 16 to 13 Operating companies 8 1. Driven primarily by cost savings and based against six months sales and operating income results ending 6/30/19, on an annualized basis |
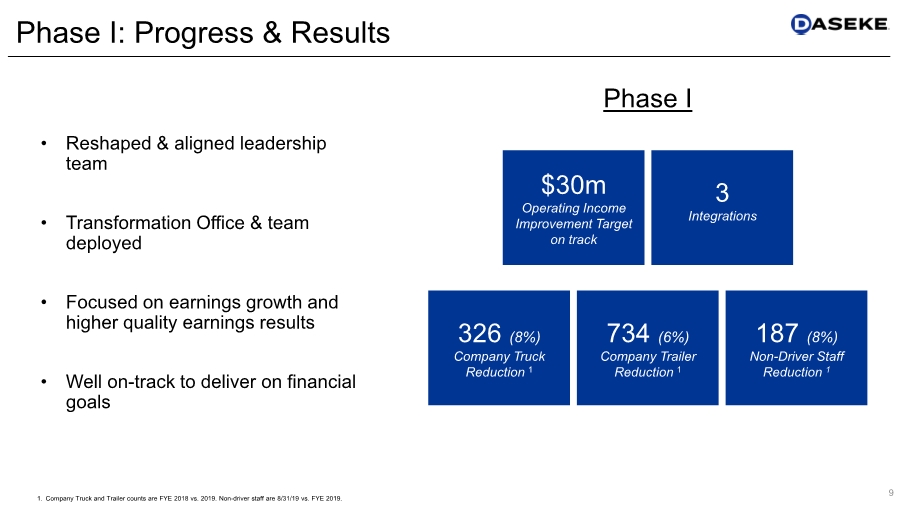
| • Reshaped & aligned leadership team • Transformation Office & team deployed • Focused on earnings growth and higher quality earnings results • Well on-track to deliver on financial goals $30m Operating Income Improvement Target on track 3 Integrations 326 (8%) Company Truck Reduction 1 734 (6%) Company Trailer Reduction 1 187 (8%) Non-Driver Staff Reduction 1 9 Phase I: Progress & Results Phase I 1. Company Truck and Trailer counts are FYE 2018 vs. 2019. Non-driver staff are 8/31/19 vs. FYE 2019. |
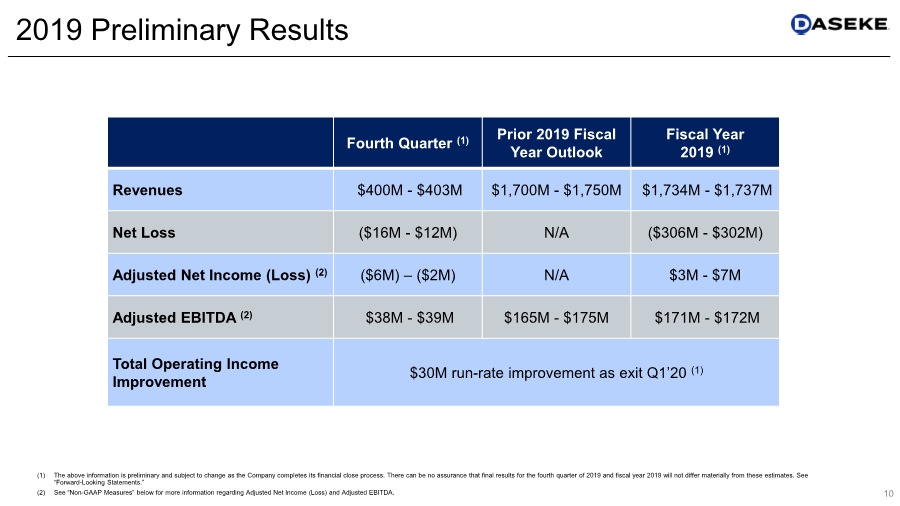
| 10 (1) The above information is preliminary and subject to change as the Company completes its financial close process. There can be no assurance that final results for the fourth quarter of 2019 and fiscal year 2019 will not differ materially from these estimates. See “Forward-Looking Statements.” (2) See “Non-GAAP Measures” below for more information regarding Adjusted Net Income (Loss) and Adjusted EBITDA. Fourth Quarter (1) Prior 2019 Fiscal Year Outlook Fiscal Year 2019 (1) Revenues $400M - $403M $1,700M - $1,750M $1,734M - $1,737M Net Loss ($16M - $12M) N/A ($306M - $302M) Adjusted Net Income (Loss) (2) ($6M) –($2M) N/A $3M - $7M Adjusted EBITDA (2) $38M - $39M $165M - $175M $171M - $172M Total Operating Income Improvement $30M run-rate improvement as exit Q1’20 (1) 2019 Preliminary Results |
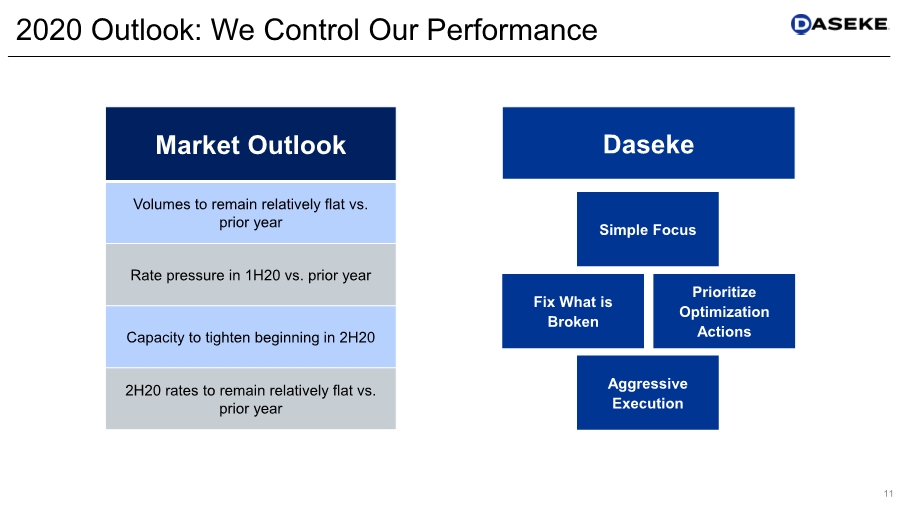
| 11 2020 Outlook: We Control Our Performance Market Outlook Volumes to remain relatively flat vs. prior year Rate pressure in 1H20 vs. prior year Capacity to tighten beginning in 2H20 2H20 rates to remain relatively flat vs. prior year Simple Focus Prioritize Optimization Actions Aggressive Execution Fix What is Broken Daseke |
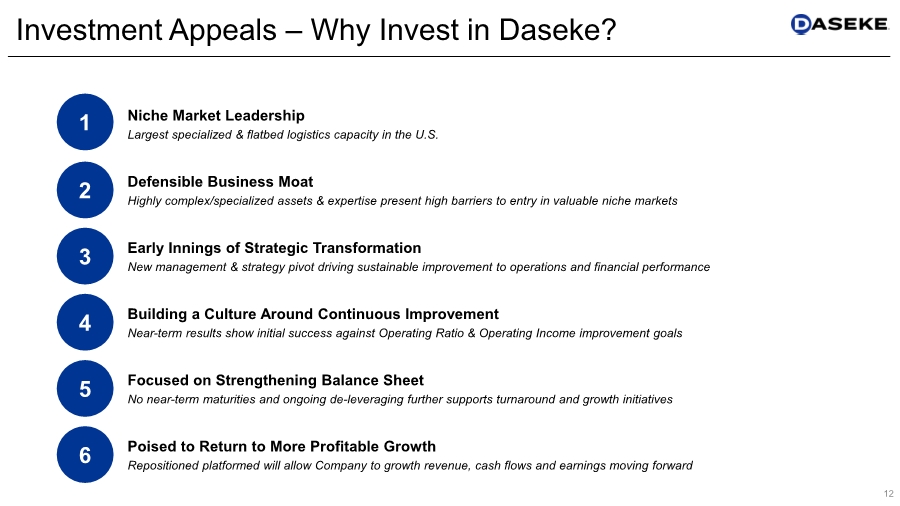
| 12 Investment Appeals – Why Invest in Daseke? Niche Market Leadership Largest specialized & flatbed logistics capacity in the U.S. 1 Defensible Business Moat Highly complex/specialized assets & expertise present high barriers to entry in valuable niche markets 2 Early Innings of Strategic Transformation New management & strategy pivot driving sustainable improvement to operations and financial performance 3 Building a Culture Around Continuous Improvement Near-term results show initial success against Operating Ratio & Operating Income improvement goals 4 Focused on Strengthening Balance Sheet No near-term maturities and ongoing de-leveraging further supports turnaround and growth initiatives 5 Poised to Return to More Profitable Growth Repositioned platformed will allow Company to growth revenue, cash flows and earnings moving forward 6 |
| Daseke, Inc. 15455 Dallas Parkway, Ste 550 Addison, TX 75001 www.Daseke.com Investor Relations Joe Caminiti / Chris Hodges, Alpha IR 312-445-2870 DSKE@alpha-ir.com 13 Contact Information |

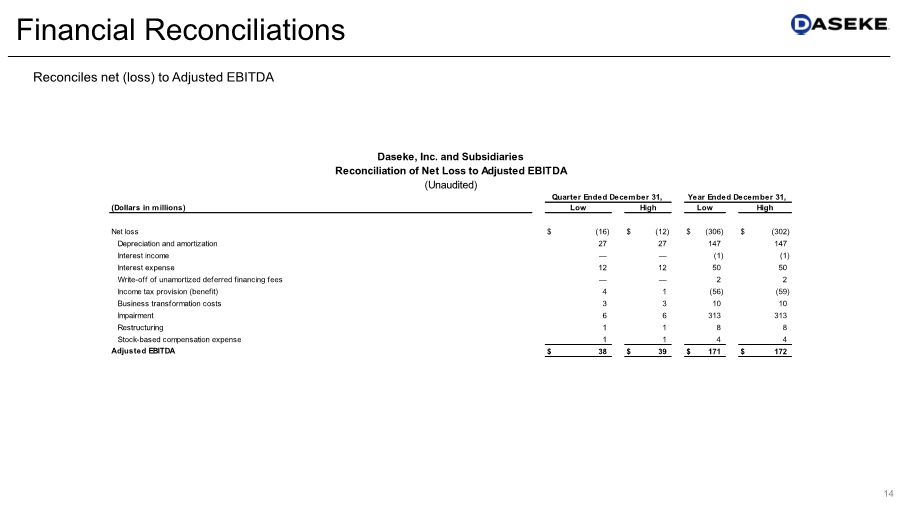
| 14 Financial Reconciliations Reconciles net (loss) to Adjusted EBITDA (Dollars in millions) Net loss $ (16) $ (12) $ (306) $ (302) Depreciation and amortization 27 27 147 147 Interest income — — (1) (1) Interest expense 12 12 50 50 Write-off of unamortized deferred financing fees — — 2 2 Income tax provision (benefit) 4 1 (56) (59) Business transformation costs 3 3 10 10 Impairment 6 6 313 313 Restructuring 1 1 8 8 Stock-based compensation expense 1 1 4 4 Adjusted EBITDA $ 38 $ 39 $ 171 $ 172 Daseke, Inc. and Subsidiaries (Unaudited) High Quarter Ended December 31, Low High Low Year Ended December 31, Reconciliation of Net Loss to Adjusted EBITDA |
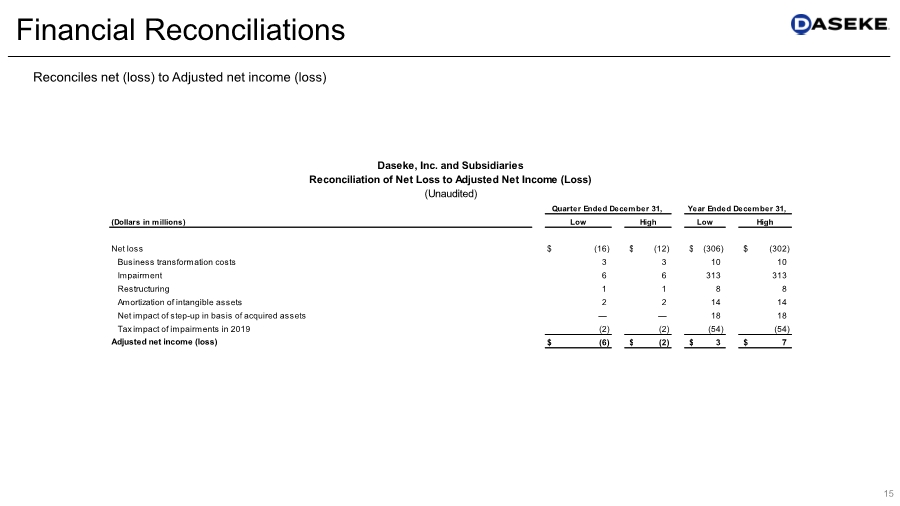
| 15 Financial Reconciliations Reconciles net (loss) to Adjusted net income (loss) (Dollars in millions) Net loss $ (16) $ (12) $ (306) $ (302) Business transformation costs 3 3 10 10 Impairment 6 6 313 313 Restructuring 1 1 8 8 Amortization of intangible assets 2 2 14 14 Net impact of step-up in basis of acquired assets — — 18 18 Tax impact of impairments in 2019 (2) (2) (54) (54) Adjusted net income (loss) $ (6) $ (2) $ 3 $ 7 Daseke, Inc. and Subsidiaries Reconciliation of Net Loss to Adjusted Net Income (Loss) Low Quarter Ended December 31, High Year Ended December 31, Low High (Unaudited) |
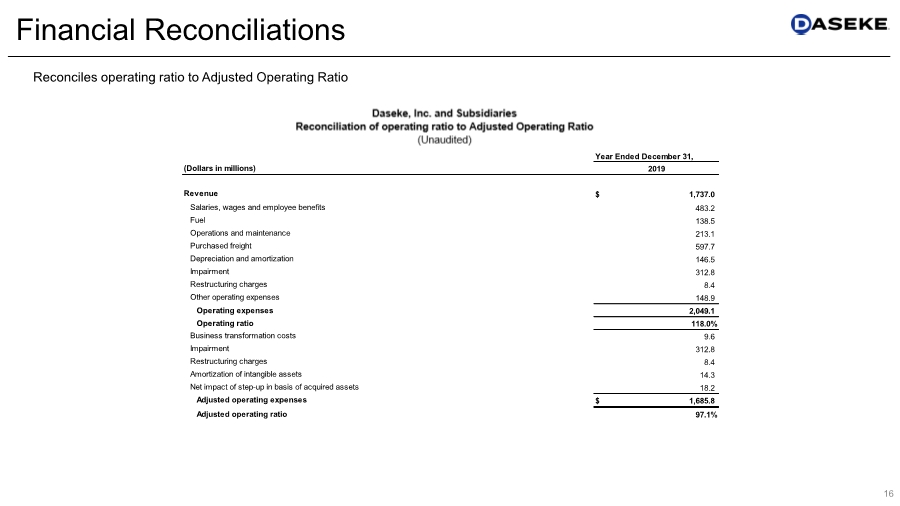
| 16 Financial Reconciliations Reconciles operating ratio to Adjusted Operating Ratio Year Ended December 31, (Dollars in millions) Revenue $ 1,737.0 Salaries, wages and employee benefits 483.2 Fuel 138.5 Operations and maintenance 213.1 Purchased freight 597.7 Depreciation and amortization 146.5 Impairment 312.8 Restructuring charges 8.4 Other operating expenses 148.9 Operating expenses 2,049.1 Operating ratio 118.0% Business transformation costs 9.6 Impairment 312.8 Restructuring charges 8.4 Amortization of intangible assets 14.3 Net impact of step-up in basis of acquired assets 18.2 Adjusted operating expenses $ 1,685.8 Adjusted operating ratio 97.1% 2019 |
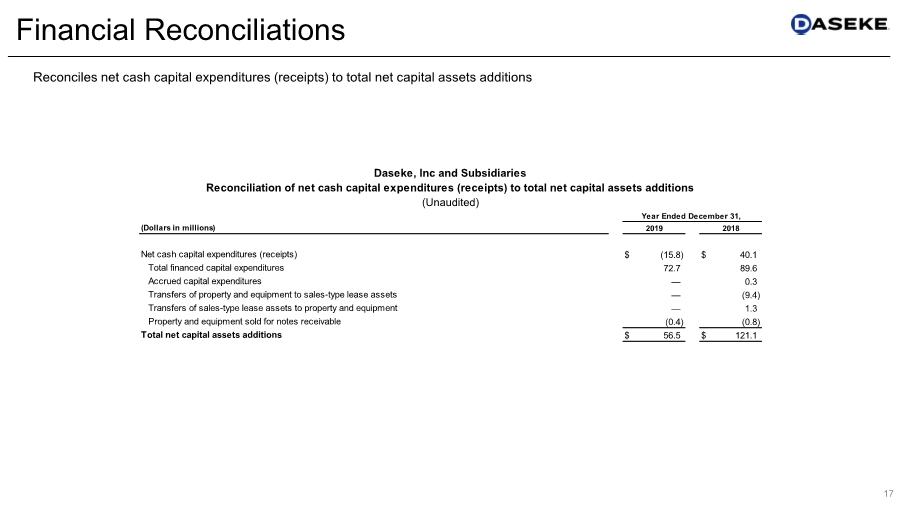
| 17 Financial Reconciliations Reconciles net cash capital expenditures (receipts) to total net capital assets additions (Dollars in millions) Net cash capital expenditures (receipts) $ (15.8) $ 40.1 Total financed capital expenditures 72.7 89.6 Accrued capital expenditures — 0.3 Transfers of property and equipment to sales-type lease assets — (9.4) Transfers of sales-type lease assets to property and equipment — 1.3 Property and equipment sold for notes receivable (0.4) (0.8) Total net capital assets additions $ 56.5 $ 121.1 Year Ended December 31, 2019 2018 (Unaudited) Reconciliation of net cash capital expenditures (receipts) to total net capital assets additions Daseke, Inc and Subsidiaries |