Attached files
| file | filename |
|---|---|
| 8-K - 8-K - FRANKLIN FINANCIAL SERVICES CORP /PA/ | fraf-20200128x8k.htm |

Investor Presentation January 2020 Franklin Financial Services Corporation F&M Trust
Forward Looking Statements Certain statements appearing herein which are not historical in nature are forward-looking statements within the meaning of the Private Securities Litigation Reform Act of 1995. Such forward-looking statements refer to a future period or periods, reflecting management’s current views as to likely future developments, and use words “may,” “will,” “expect,” “believe,” “estimate,” “anticipate,” or similar terms. Because forward-looking statements involve certain risks, uncertainties and other factors over which Franklin Financial Services Corporation has no direct control, actual results could differ materially from those contemplated in such statements. These factors include (but are not limited to) the following: general economic conditions, changes in interest rates, changes in the Corporation’s cost of funds, changes in government monetary policy, changes in government regulation and taxation of financial institutions, changes in the rate of inflation, changes in technology, the intensification of competition within the Corporation’s market area, and other similar factors. We caution readers not to place undue reliance on these forward-looking statements. They only reflect management’s analysis as of this date. The Corporation does not revise or update these forward-looking statements to reflect events or changed circumstances. Please carefully review the risk factors described in other documents the Corporation files from time to time with the SEC, including the Annual Reports on Form 10-K, Quarterly Reports on Form 10-Q, and any Current Reports on Form 8-K. Franklin Financial Services Corporation F&M Trust 2
Overview of Franklin Financial F&M Trust founded in 1906 Franklin Financial formed in 1983 Headquartered in Chambersburg, PA 22 offices throughout Cumberland, Franklin, Fulton and Huntingdon Counties, PA Total assets of the Company were $1.3 billion as of December 31, 2019 As of December 31, 2019 Franklin Financial reported $918.9 million in brokerage and trust assets under management Trading on the Nasdaq Stock Market (NASDAQ: FRAF) Franklin Financial Services Corporation F&M Trust 3
The Foundation for Success: Our Beliefs Mission Statement Delivering the right financial solutions … from people you know and trust. Vision Statement We are committed to remaining independent by growing our bank to meet the increasing needs of our customers, communities and shareholders. We will be the financial services leader in the markets we serve. Core Values We, the employees, officers and directors, are committed to the core values of integrity, teamwork, excellence, accountability, and a concern for our customers and the communities we serve. Franklin Financial Services Corporation F&M Trust 4
Why Franklin Financial? A market share leader in core deposit, loan and asset management segments in economically strong and growing markets Deep management team with extensive banking industry experience mixed with local market knowledge Consistently strong core operating fundamentals with a diverse revenue mix Strong capital position, sound risk management and neutral to slightly asset sensitive balance sheet Commitment to enhancing value for our key stakeholder groups Franklin Financial Services Corporation F&M Trust 5
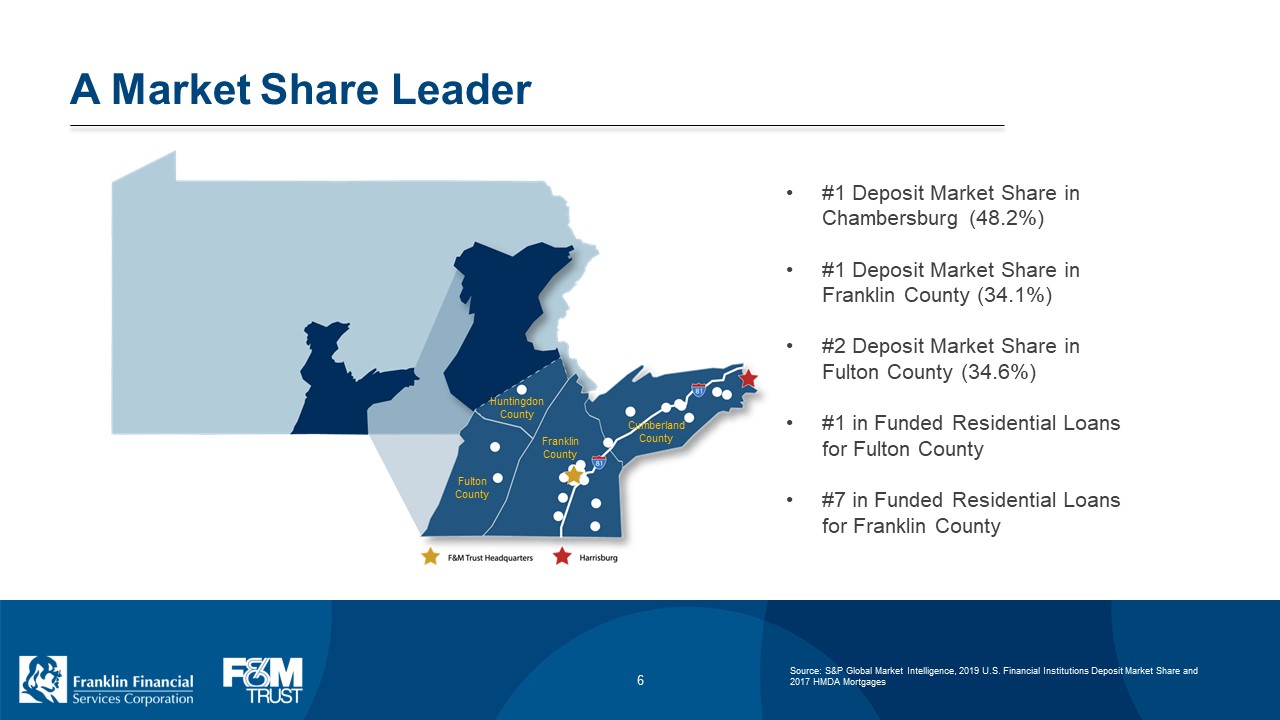
A Market Share Leader #1 Deposit Market Share in Chambersburg (48.2%) #1 Deposit Market Share in Franklin County (34.1%) #2 Deposit Market Share in Fulton County (34.6%) #1 in Funded Residential Loans for Fulton County #7 in Funded Residential Loans for Franklin County Franklin Financial Services Corporation F&M Trust 6 Source: S&P Global Market Intelligence, 2019 U.S. Financial Institutions Deposit Market Share and 2017 HMDA Mortgages
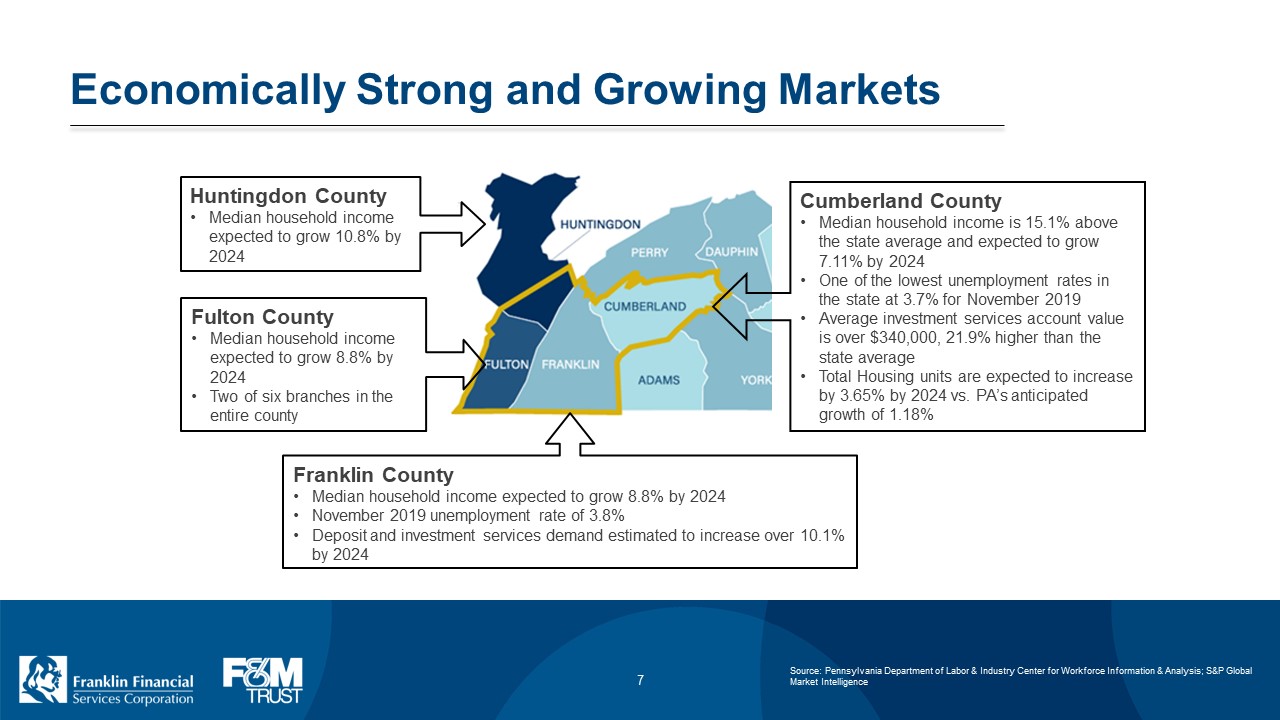
Economically Strong and Growing Markets Huntingdon County Median household income expected to grow 10.8% by 2024 Fulton County Median household income expected to grow 8.8% by 2024 Two of six branches in the entire county Franklin County Median household income expected to grow 8.8% by 2024 November 2019 unemployment rate of 3.8% Deposit and investment services demand estimated to increase over 10.1% by 2024 Cumberland County Median household income is 15.1% above the state average and expected to grow 7.11% by 2024 One of the lowest unemployment rates in the state at 3.7% for November 2019 Average investment services account value is over $340,000, 21.9% higher than the state average Total Housing units are expected to increase by 3.65% by 2024 vs. PA’s anticipated growth of 1.18% Franklin Financial Services Corporation F&M Trust 7 Source: Pennsylvania Department of Labor & Industry Center for Workforce Information & Analysis; S&P Global Market Intelligence

A Deep and Cohesive Management Team Timothy G. Henry President & CEO Mark R. Hollar CFO & Treasurer Lorie Heckman Risk Management Steven D. Butz Commercial Services Susan L. Rosenberg Investment & Trust Services Patricia A. Hanks Retail Services Ronald L. Cekovich Information & Operations Karen K. Carmack Human Resources Matthew D. Weaver Marketing & Communications Franklin Financial Services Corporation F&M Trust 8
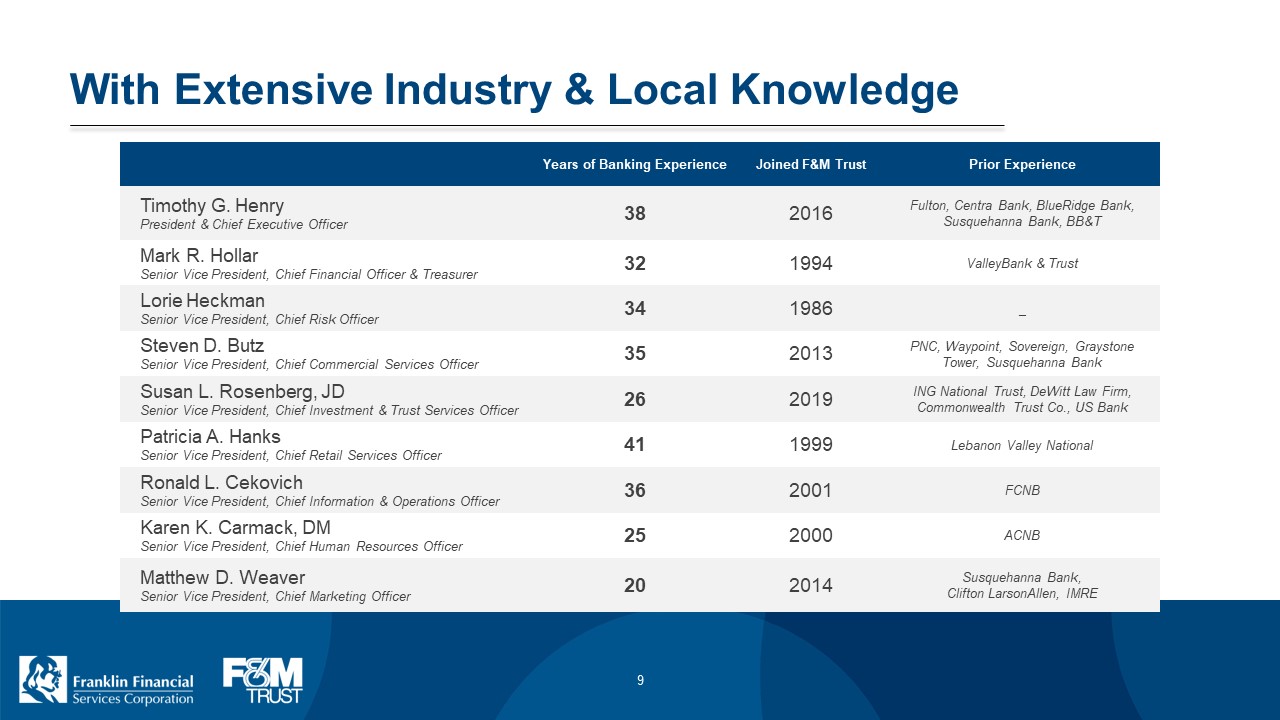
With Extensive Industry & Local Knowledge Years of Banking Experience Joined F&M Trust Prior Experience Timothy G. Henry President & Chief Executive Officer 38 2016 Fulton, Centra Bank, BlueRidge Bank, Susquehanna Bank, BB&T Mark R. Hollar Senior Vice President, Chief Financial Officer & Treasurer 32 1994 ValleyBank & Trust Lorie Heckman Senior Vice President, Chief Risk Officer 34 1986 Steven D. Butz Senior Vice President, Chief Commercial Services Officer 35 2013 PNC, Waypoint, Sovereign, Graystone Tower, Susquehanna Bank Susan L. Rosenberg, JD Senior Vice President, Chief Investment & Trust Services Officer 26 2019 ING National Trust, DeWitt Law Firm, Commonwealth Trust Co., US Bank Patricia A. Hanks Senior Vice President, Chief Retail Services Officer 41 1999 Lebanon Valley National Ronald L. Cekovich Senior Vice President, Chief Information & Operations Officer 36 2001 FCNB Karen K. Carmack, DM Senior Vice President, Chief Human Resources Officer 25 2000 ACNB Matthew D. Weaver Senior Vice President, Chief Marketing Officer 20 2014 Susquehanna Bank, Clifton LarsonAllen, IMRE Franklin Financial Services Corporation F&M Trust 9
Financial Performance Based On… Balanced revenue business model Stable, low cost funding mix and strong liquidity position A well diversified loan portfolio with an increasing emphasis on small business relationships without reliance on participation loans Strong credit quality metrics Operating efficiencies from ongoing investments in technology and people Franklin Financial Services Corporation F&M Trust 10
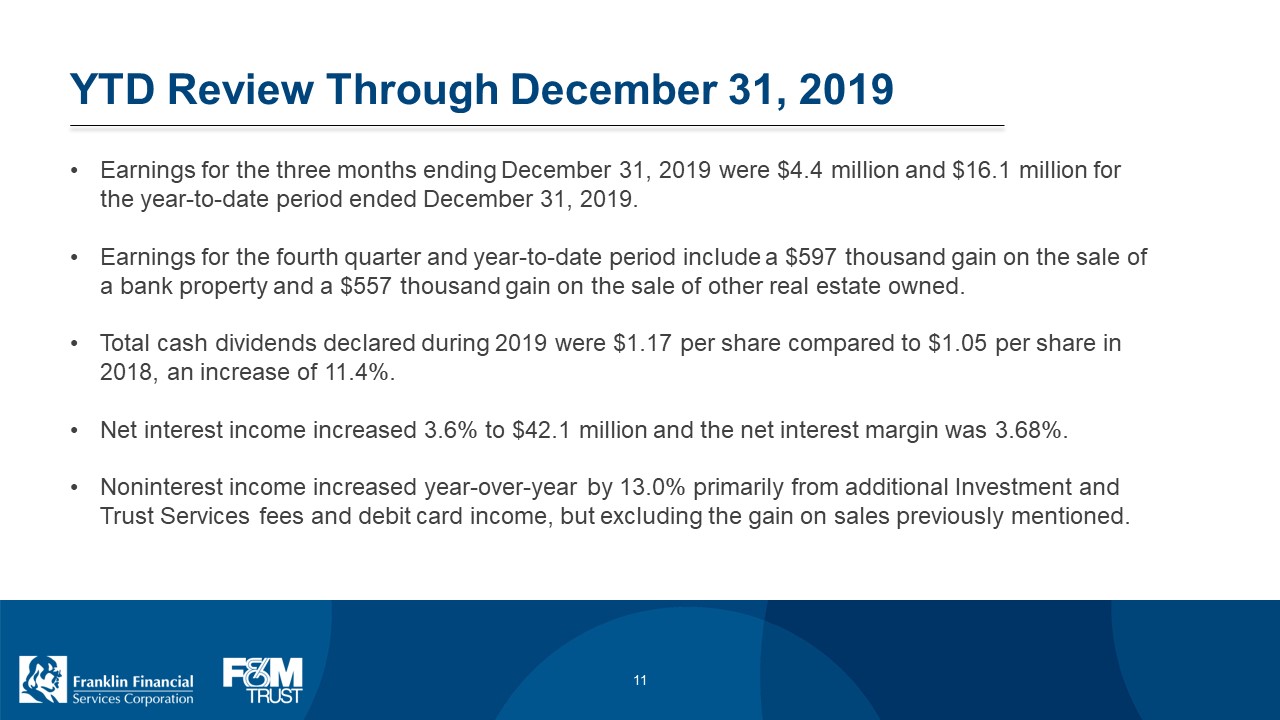
YTD Review Through December 31, 2019 Earnings for the three months ending December 31, 2019 were $4.4 million and $16.1 million for the year-to-date period ended December 31, 2019. Earnings for the fourth quarter and year-to-date period include a $597 thousand gain on the sale of a bank property and a $557 thousand gain on the sale of other real estate owned. Total cash dividends declared during 2019 were $1.17 per share compared to $1.05 per share in 2018, an increase of 11.4%. Net interest income increased 3.6% to $42.1 million and the net interest margin was 3.68%. Noninterest income increased year-over-year by 13.0% primarily from additional Investment and Trust Services fees and debit card income, but excluding the gain on sales previously mentioned. Franklin Financial Services Corporation F&M Trust 11
YTD Review Through December 31, 2019 The Company and Bank remained well-capitalized with a total risk-based capital ratio of approximately 16.0% as of December 31, 2019. Commenced listing of common stock on the Nasdaq Stock Market on May 1, 2019 and entered the Russell 2000 Index on July 1, 2019. Franklin Financial Services Corporation F&M Trust 12
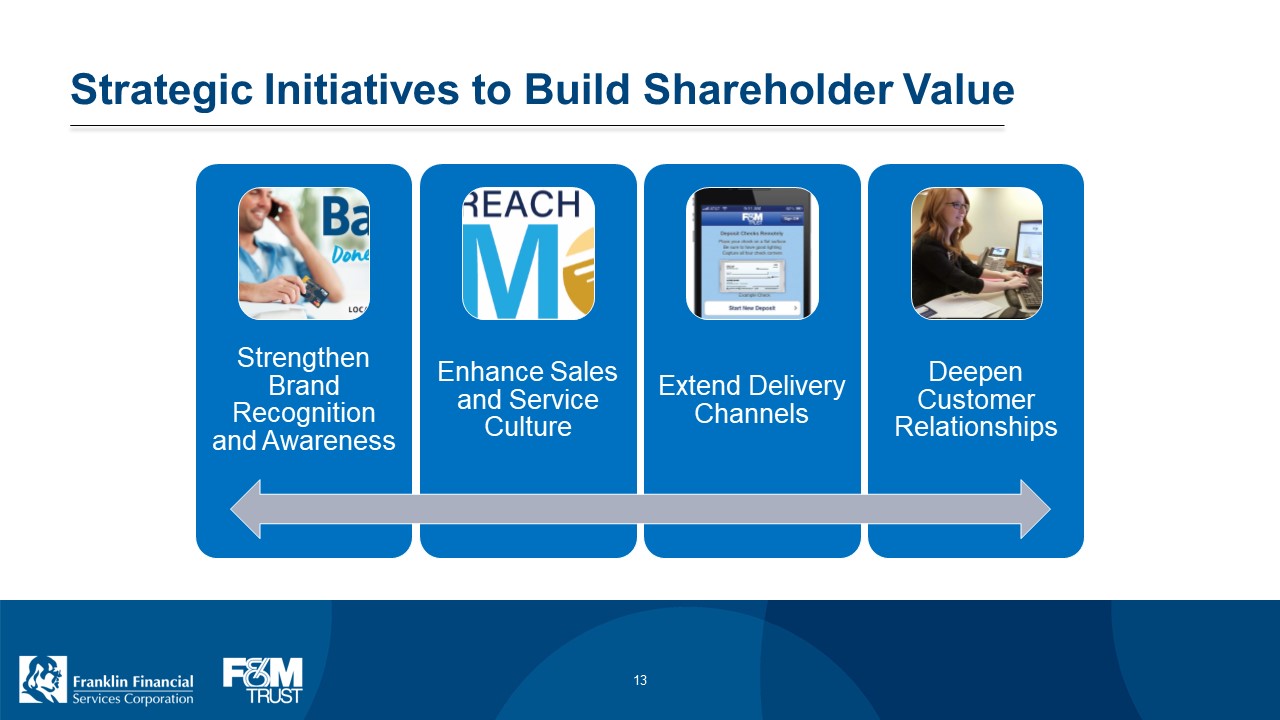
Strategic Initiatives to Build Shareholder Value Strengthen Brand Recognition and Awareness Enhance Sales and Service Culture Extend Delivery Channels Deepen Customer Relationships Franklin Financial Services Corporation F&M Trust 13

Strengthen Brand Recognition and Awareness Advance “Banking Done Your Way” concept and messaging Feature the bank’s diverse financial services and tools that allow customers to do their banking wherever and whenever they want Build on the awareness of the F&M Trust brand created in Cumberland County and the Greater Harrisburg / Capital Region Introduce new digital, social and mobile strategies to engage audiences Banking Done Your Way fmtrust.bank F&M Trust Franklin Financial Services Corporation F&M Trust 14
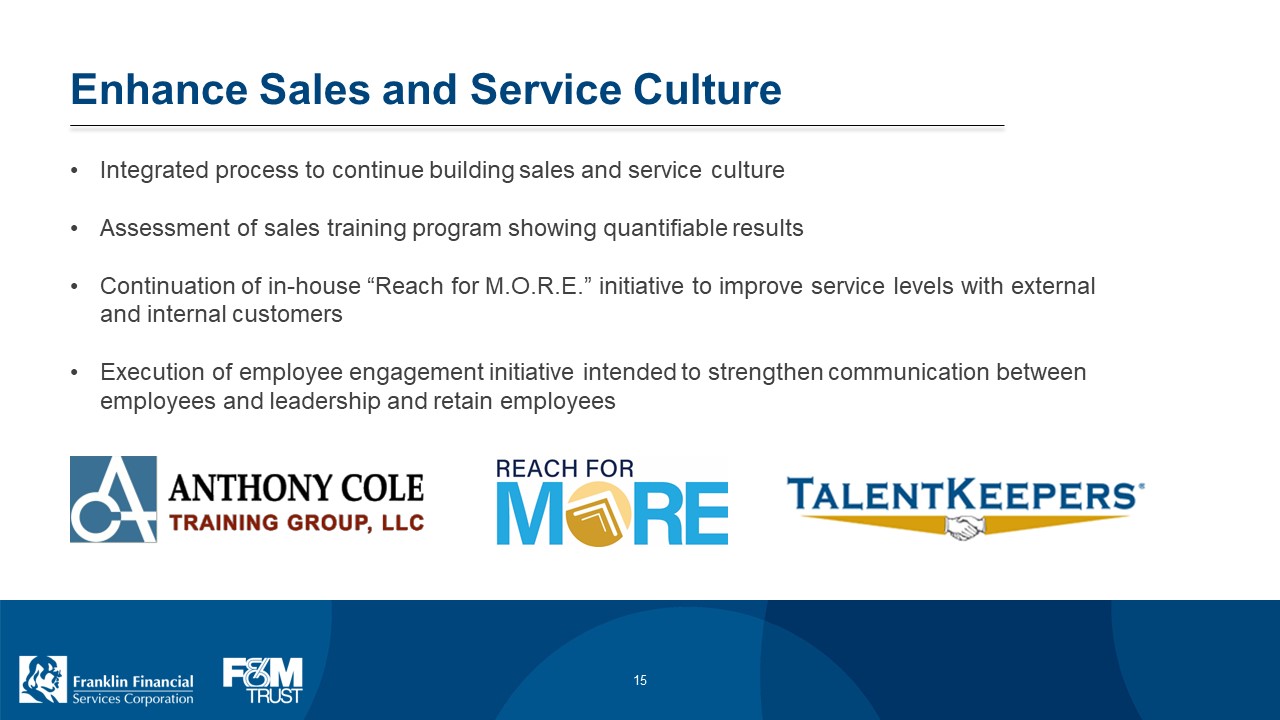
Enhance Sales and Service Culture Integrated process to continue building sales and service culture Assessment of sales training program showing quantifiable results Continuation of in-house “Reach for M.O.R.E.” initiative to improve service levels with external and internal customers Execution of employee engagement initiative intended to strengthen communication between employees and leadership and retain employees ANTHONY COLE TRAINING GROUP, LLC REACH FOR MORE TALENTKEEPERS Franklin Financial Services Corporation F&M Trust 15
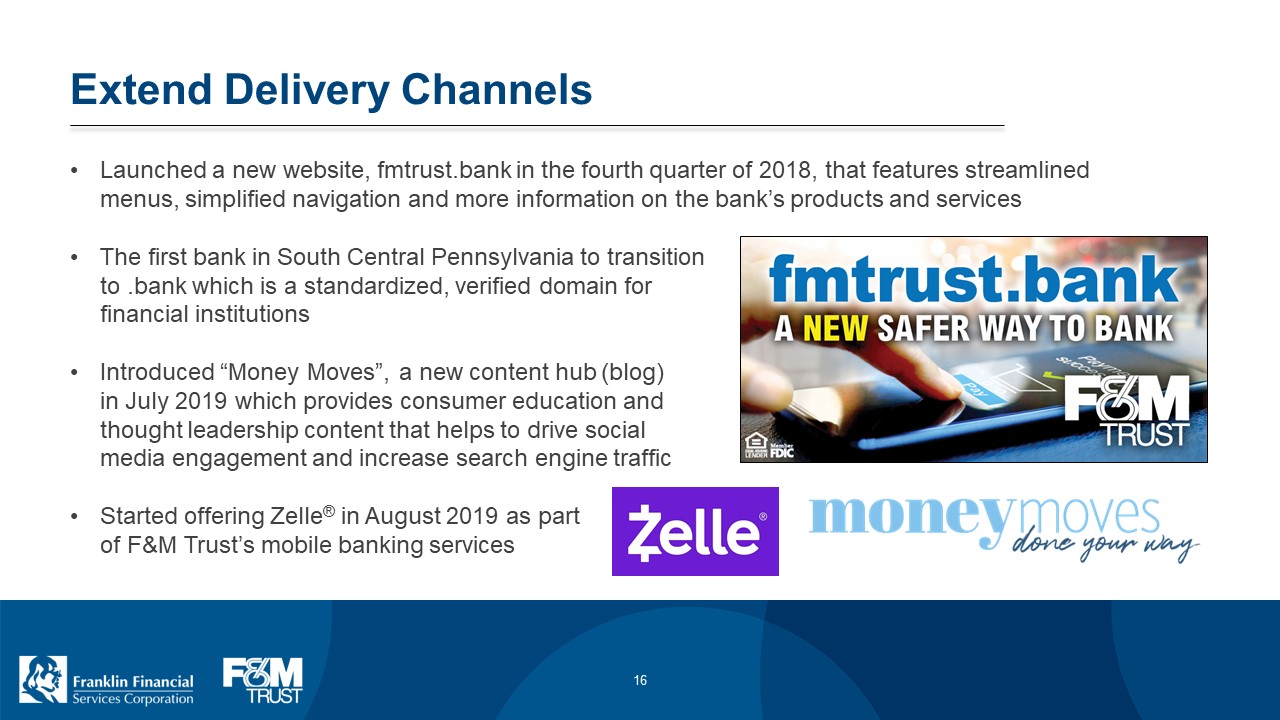
Extend Delivery Channels Launched a new website, fmtrust.bank in the fourth quarter of 2018, that features streamlined menus, simplified navigation and more information on the bank’s products and services The first bank in South Central Pennsylvania to transition to .bank which is a standardized, verified domain for financial institutions Introduced “Money Moves”, a new content hub (blog) in July 2019 which provides consumer education and thought leadership content that helps to drive social media engagement and increase search engine traffic Started offering Zelle® in August 2019 as part of F&M Trust’s mobile banking services fmtrust.bank A NEW SAFER WAY TO BANK F&M TRUST Zelle moneymoves done your way. Franklin Financial Services Corporation F&M Trust 16
Deepen Customer Relationships Additional resources across all markets to focus on client support and relationship expansion Introduction of Deposit Product Officer position reporting to President / CEO intended to coordinate and drive efforts to grow low-cost core deposits across all business lines Restructured Residential Mortgage and Consumer Lending department with new leadership and increased emphasis on originations to deepen relationships in our core markets and increase fee income from sold mortgages Enhancing customer experience through office transformations and call center including after business hours support Successful introduction of Bank@Work program for participating business clients to offer banking services to their employees Franklin Financial Services Corporation F&M Trust 17
Results Through December 31, 2019 Total deposits increased 4.0% over 2018 to $1.1 billion 241 new mortgage originations for $43.9 million, an increase of 115.3% from 2018 Investment & Trust Services revenue increased 8.3% to $6.1 million 1,316 new Mobile Checking accounts with $1,716,142 in deposits 2,506 Zelle® customers since the service was introduced in August 2019 3,844 customer calls handled through third-party call center Social media engagement reached 17.5%, as compared to Facebook’s average of 3.6%1 Franklin Financial Services Corporation F&M Trust 18 1Average social media engagement rate is based on the number of engagement actions (e.g., likes, shares, comments) a post receives relative to the Bank’s total number of followers on Facebook; Hootsuite & We Are Social (2019), “Digital 2019 Global Digital Overview”
Outlook for 2020 Anticipating a challenging environment for deposits as the market adjusts to changing rate environment; the Bank will remain focused on core deposit growth Moderate loan demand through 2020 and strong competition to meet that demand Growth in non-interest income driven by increased fee income from residential mortgages and Investment and Trust Services Reorganization of Investment and Trust Services to more effectively align departmental functions and realize efficiencies Strong capital levels and capital adequacy ratios will permit the Company to continue focusing on building shareholder value Franklin Financial Services Corporation F&M Trust 19
Outlook for 2020 Continued investment in infrastructure and people to grow the franchise – new positions include: Commercial Services Market Manager for the Cumberland County / Capital Region Commercial Loan Review Officer Deposit Product Officer Retirement Plan Services Relationship Manager Mortgage Loan Originators in the Carlisle and Capital Region markets Comprehensive, performance-based equity compensation program for Senior Management and the Board of Directors intended to aid in the attainment of desired operating results Focus on growth of the franchise through strategic acquisitions Franklin Financial Services Corporation F&M Trust 20
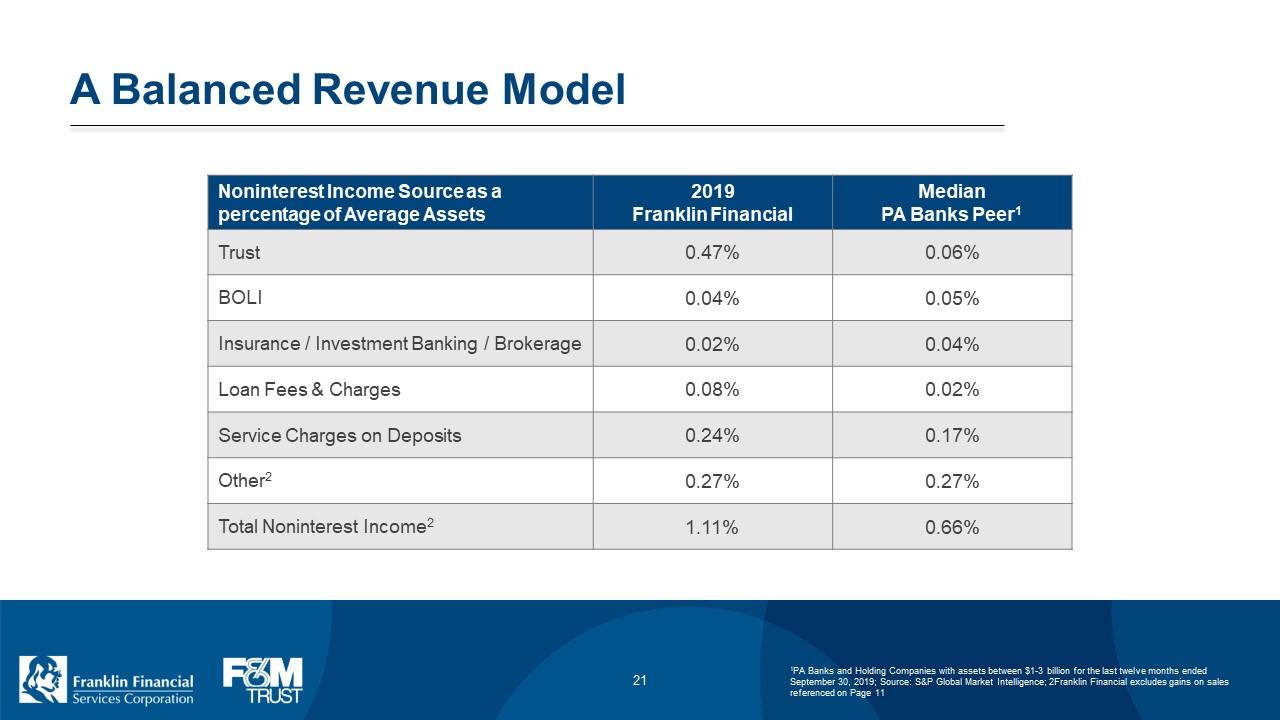
A Balanced Revenue Model Noninterest Income Source as a percentage of Average Assets 2019 Franklin Financial Median PA Banks Peer1 Trust 0.47% 0.06% BOLI 0.04% 0.05% Insurance / Investment Banking / Brokerage 0.02% 0.04% Loan Fees & Charges 0.08% 0.02% Service Charges on Deposits 0.24% 0.17% Other2 0.27% 0.27% Total Noninterest Income2 1.11% 0.66% Franklin Financial Services Corporation F&M Trust 21 1PA Banks and Holding Companies with assets between $1-3 billion for the last twelve months ended September 30, 2019; Source: S&P Global Market Intelligence; 2 Franklin Financial excludes gains on sales referenced on Page 11
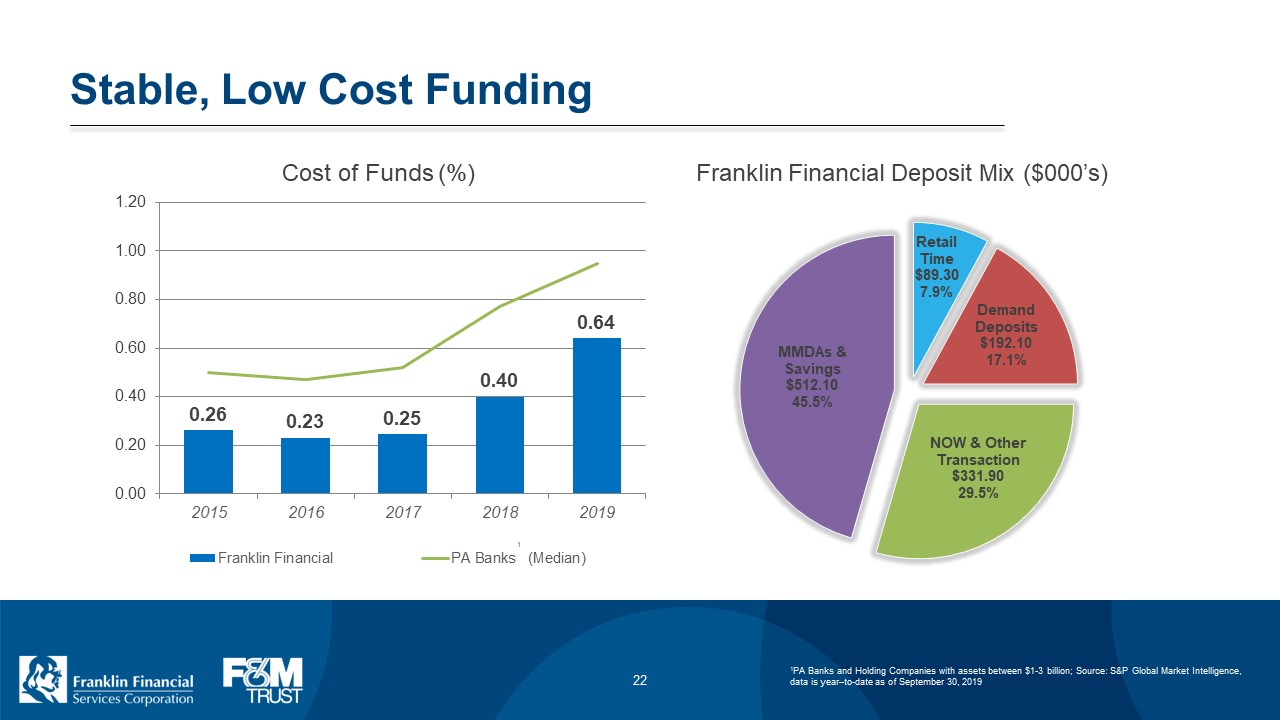
Stable, Low Cost Funding Cost of Funds (%) 1.20 1.00 0.80 0.60 0.40 0.20 0.00 2015 0.26 2016 0.23 2017 0.25 2018 0.40 2019 0.64 Franklin Financial PA Banks (Median) Franklin Financial Deposit Mix ($000’s) MMDAs & Savings $512.10 45.5% Retail Time $89.30 7.9% Demand Deposits $192.10 17.1% NOW & Other Transaction $331.90 29.5% Franklin Financial Services Corporation F&M Trust 22 1PA Banks and Holding Companies with assets between $1-3 billion; Source: S&P Global Market Intelligence, data is year–to-date as of September 30, 2019
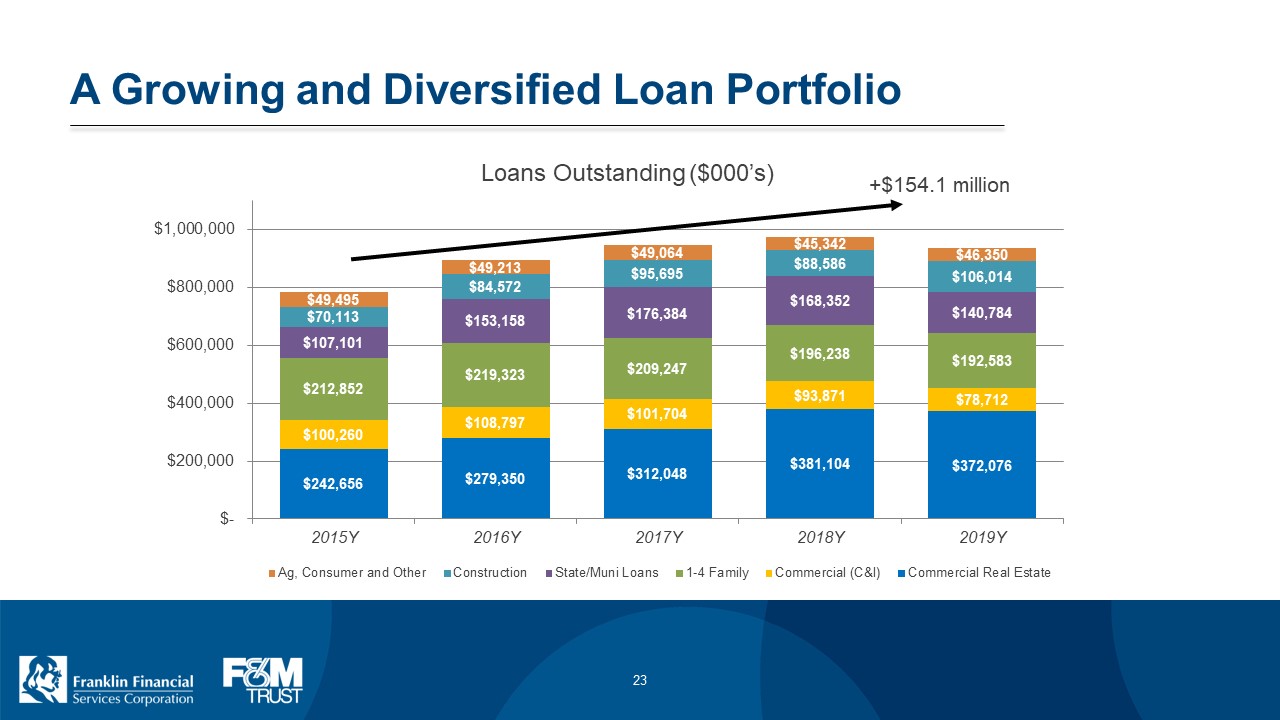
A Growing and Diversified Loan Portfolio Loans Outstanding ($000’s) $1,000,000 $800,000 $600,000 $400,000 $200,000 $ 2015Y $242,656 $100,260 $212,852 $107,101 $70,113 $49,495 2016Y $279,350 $108,797 $219,323 $153,158 $84,572 $49,213 2017Y $312,048 $101,704 $209,247 $176,384 $95,695 $49,064 2018Y $381,104 $93,871 $196,238 $168,352 $88,586 $45,342 +$154.1 million Ag. Consumer and Other Construction State/Muni Loans 1-4 Family Commercial (C&I) Commercial Real Estate Franklin Financial Services Corporation F&M Trust 23
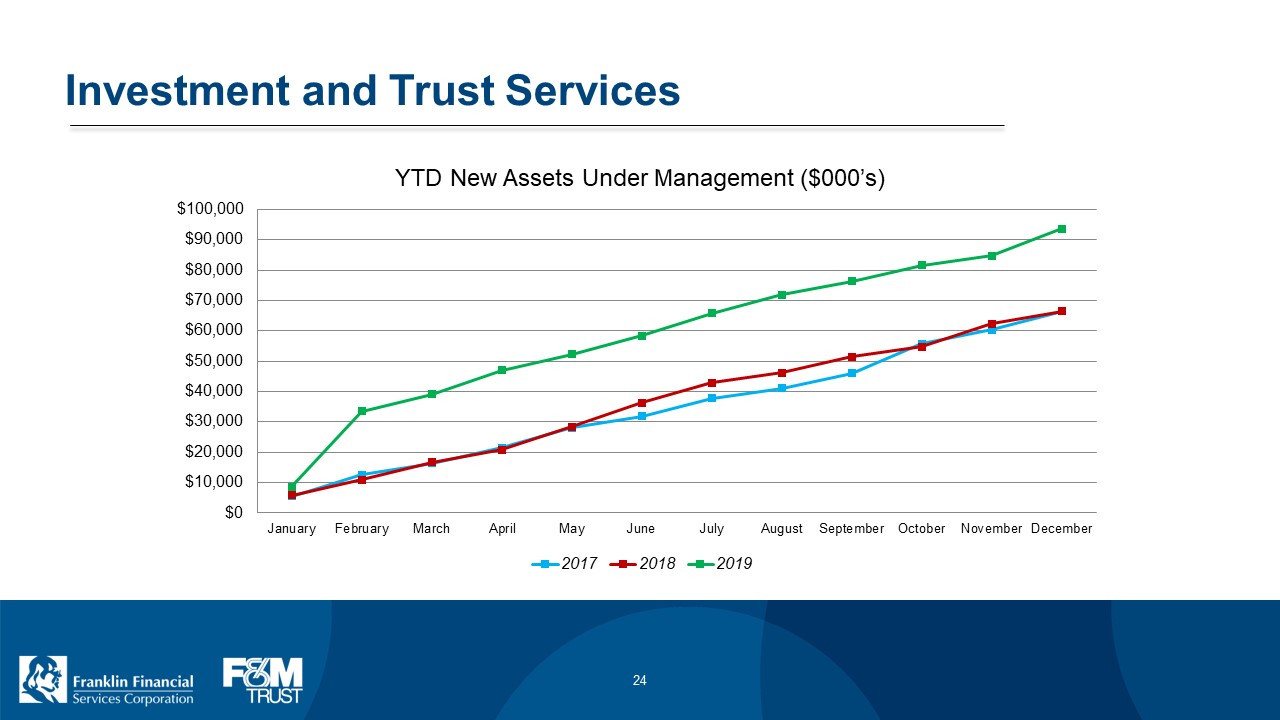
Investment and Trust Services YTD New Assets Under Management ($000’s) $100,000 $90,000 $80,000 $70,000 $60,000 $50,000 $40,000 $30,000 $20,000 $10,000 $0 January February March April May June July August September October November December 2017 2018 2019 Franklin Financial Services Corporation F&M Trust 24
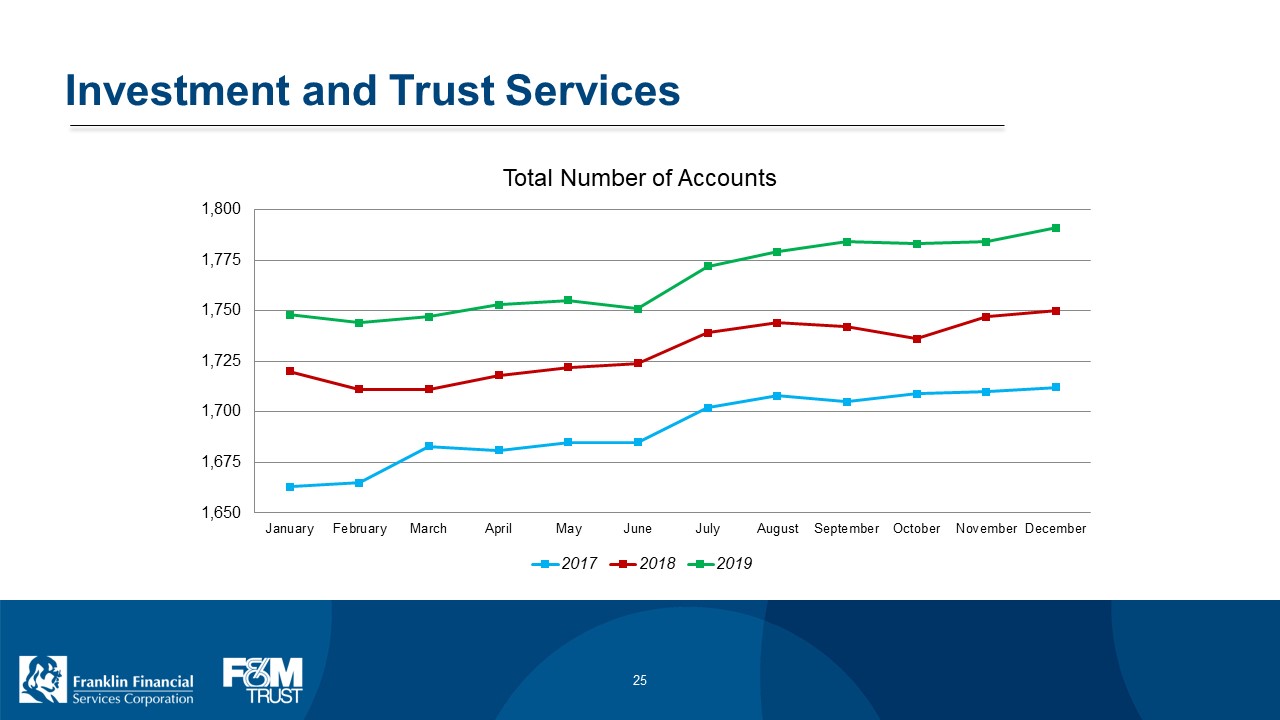
Investment and Trust Services Total Number of Accounts 1,800 1,775 1,750 1,725 1,700 1,675 1,650 January February March April May June July August September October November December 2017 2018 2019 Franklin Financial Services Corporation F&M Trust 25
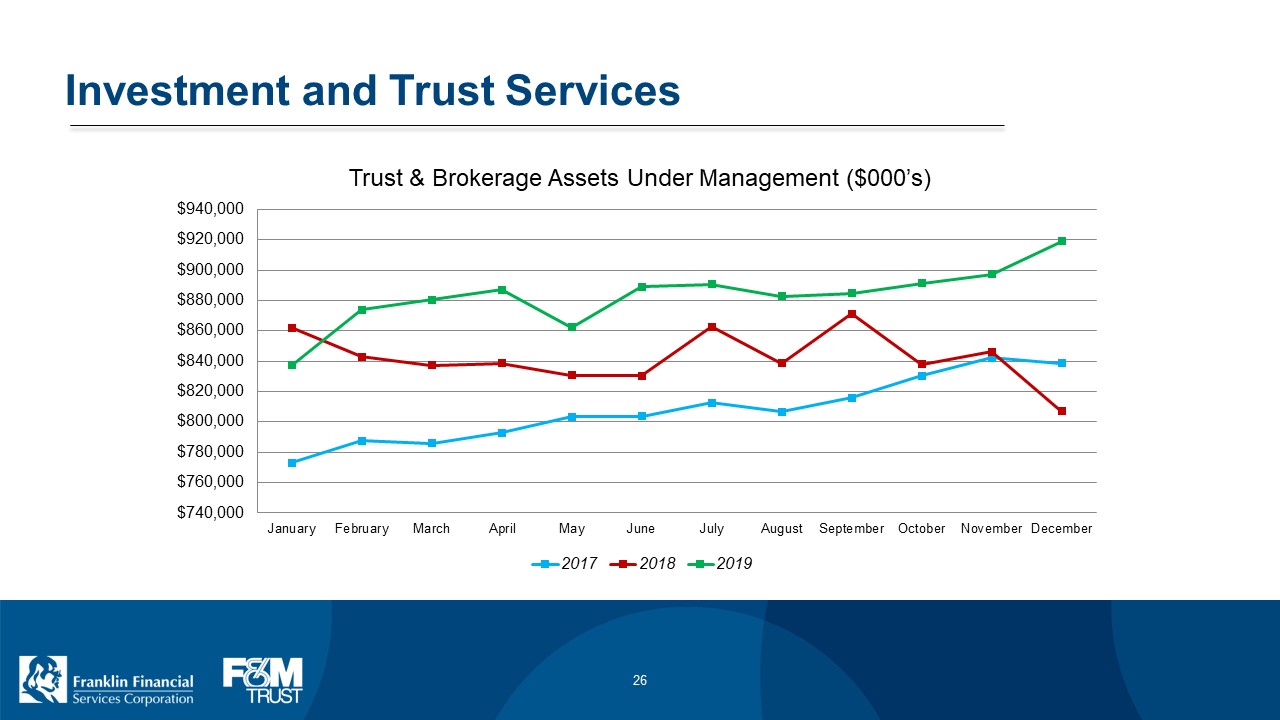
Investment and Trust Services Trust & Brokerage Assets Under Management ($000’s) $940,000 $920,000 $900,000 $880,000 $860,000 $840,000 $820,000 $800,000 $780,000 $760,000 $740,000 January February March April May June July August September October November December 2017 2018 2019 Franklin Financial Services Corporation F&M Trust 26
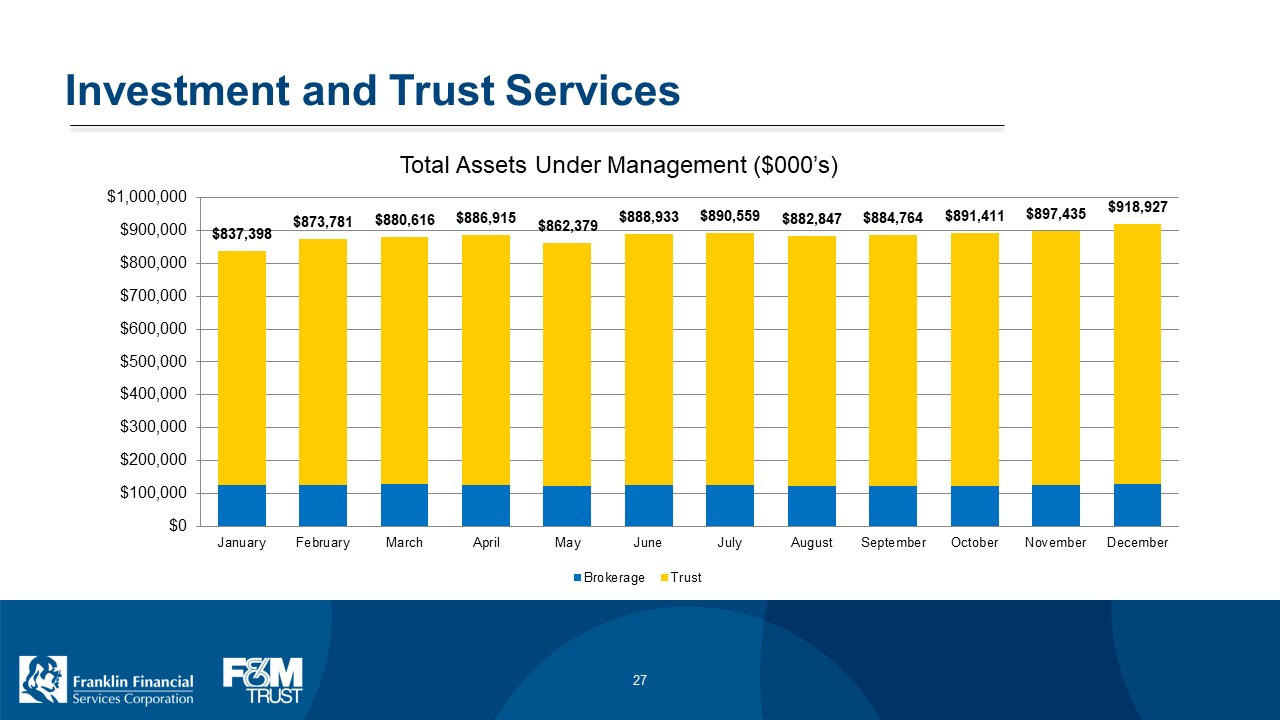
Investment and Trust Services Total Assets Under Management ($000’s) $1,000,000 $900,000 $800,000 $700,000 $600,000 $500,000 $400,000 $200,000 $100,000 $0 $837,398 $873,781 $880,616 $886,915 $862,379 $888,933 $890,559 $882,847 $884,764 $891,411 $891,411 $918,927 January February March April May June July August September October November December Brokerage Trust Franklin Financial Services Corporation F&M Trust 27
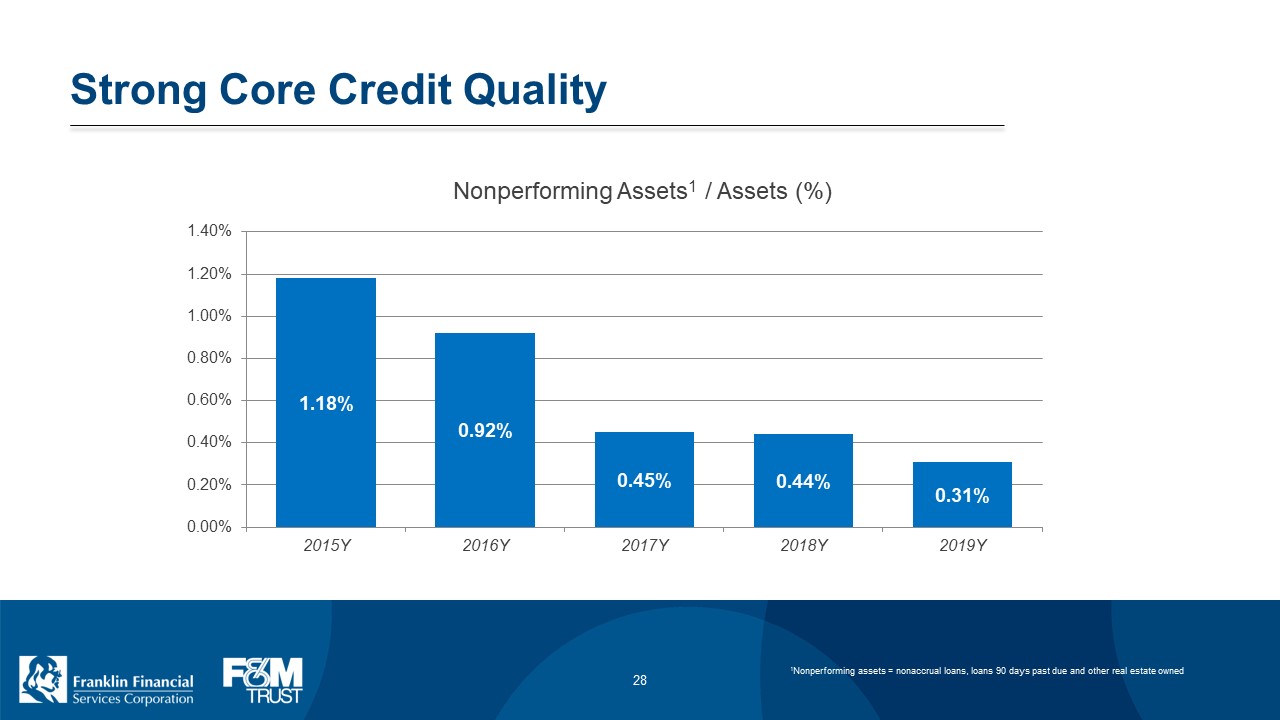
Strong Core Credit Quality Nonperforming Assets1 / Assets (%) 1.40% 1.20% 1.00% 0.80% 0.60% 0.40% 0.20% 0.00% 1.18% 0.92% 0.45% 0.44% 0.31% 2015Y 2016Y 2017Y 2018Y 2019Y Franklin Financial Services Corporation F&M Trust 28 1 Nonperforming assets = nonaccrual loans, loans 90 days past due and other real estate owned
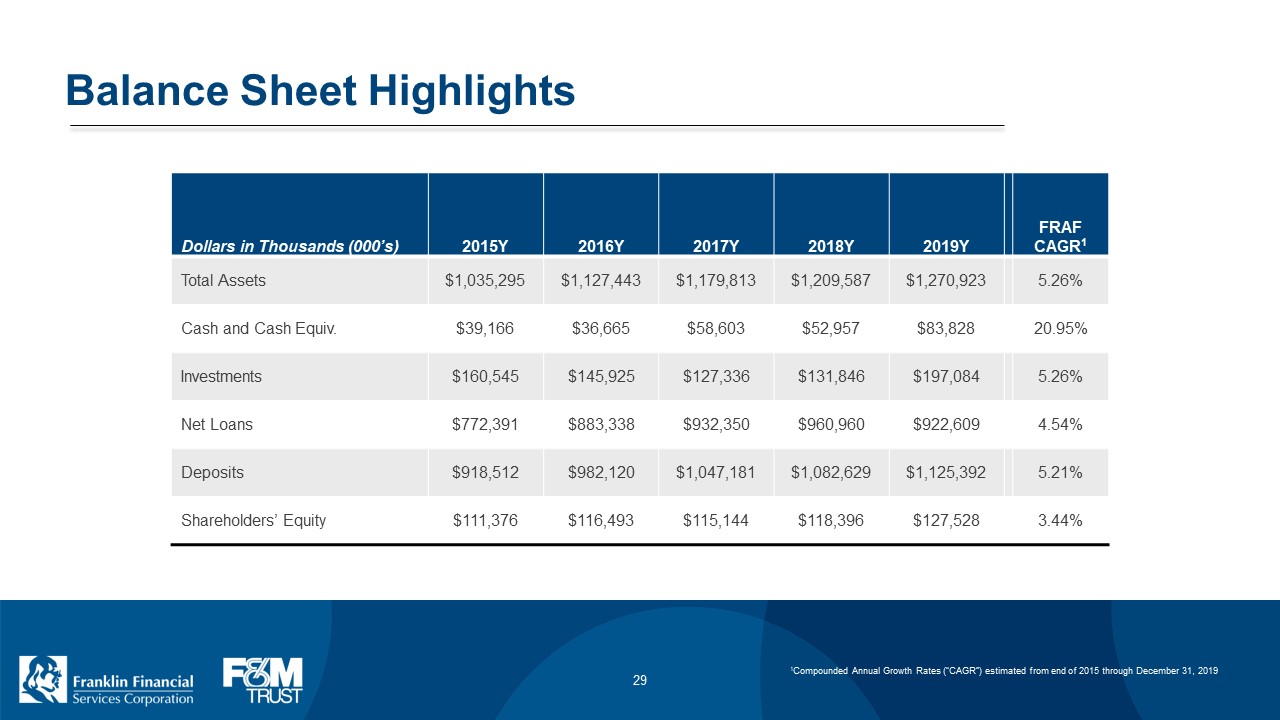
Balance Sheet Highlights Dollars in Thousands (000’s) 2015Y 2016Y 2017Y 2018Y 2019Y FRAF CAGR1 Total Assets $1,035,295 $1,127,443 $1,179,813 $1,209,587 $1,270,923 5.26% Cash and Cash Equiv. $39,166 $36,665 $58,603 $52,957 $83,828 20.95% Investments $160,545 $145,925 $127,336 $131,846 $197,084 5.26%
Net Loans $772,391 $883,338 $932,350 $960,960 $922,609 4.54% Deposits $918,512 $982,120 $1,047,181 $1,082,629 $1,125,392 5.21% Shareholders’ Equity $111,376 $116,493 $115,144 $118,396 $127,528 3.44% Franklin Financial Services Corporation F&M Trust 29 1Compounded Annual Growth Rates (“CAGR”) estimated from end of 2015 through December 31, 2019
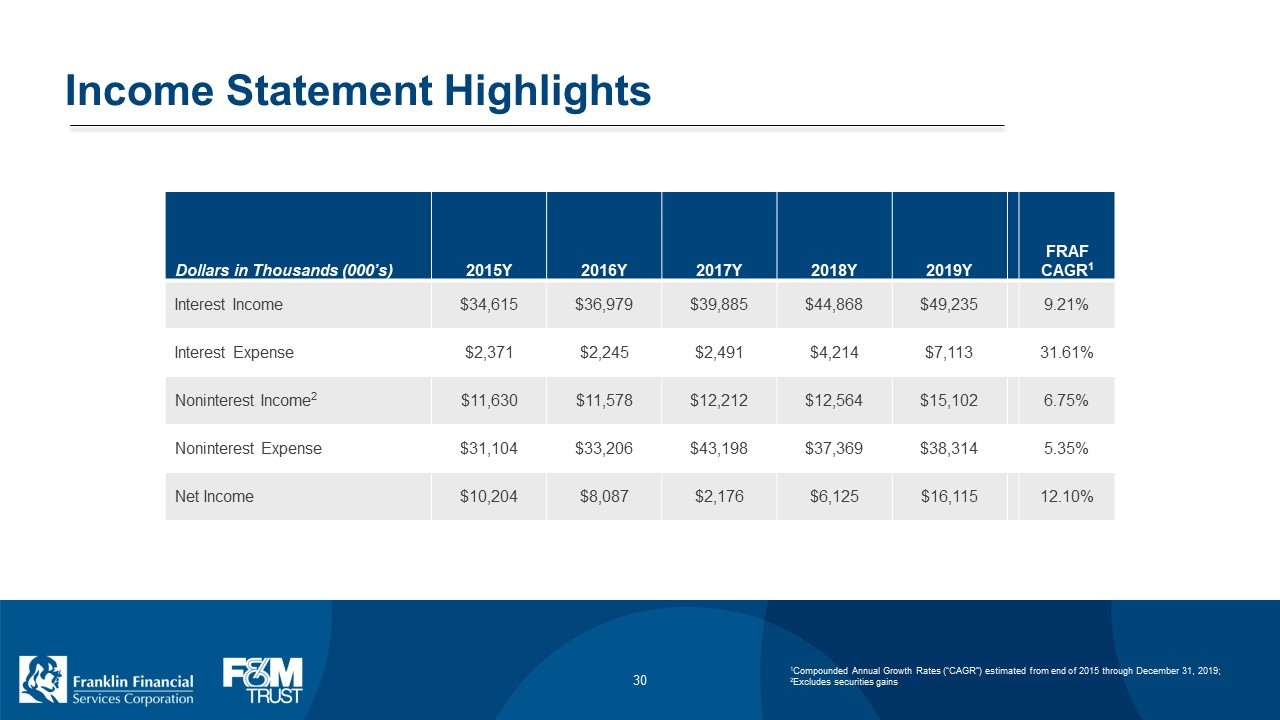
Income Statement Highlights Dollars in Thousands (000’s) 2015Y 2016Y 2017Y 2018Y 2019Y FRAF CAGR1 Interest Income $34,615 $36,979 $39,885 $44,868 $49,235 9.21% Interest Expense $2,371 $2,245 $2,491 $4,214 $7,113 31.61% Noninterest Income2 $11,630 $11,578 $12,212 $12,564 $15,102 6.75% Noninterest Expense $31,104 $33,206 $43,198 $37,369 $38,314 5.35% Net Income $10,204 $8,087 $2,176 $6,125 $16,115 12.10% Franklin Financial Services Corporation F&M Trust 30 1Compounded Annual Growth Rates (“CAGR”) estimated from end of 2015 through December 31, 2019; 2Excludes securities gains
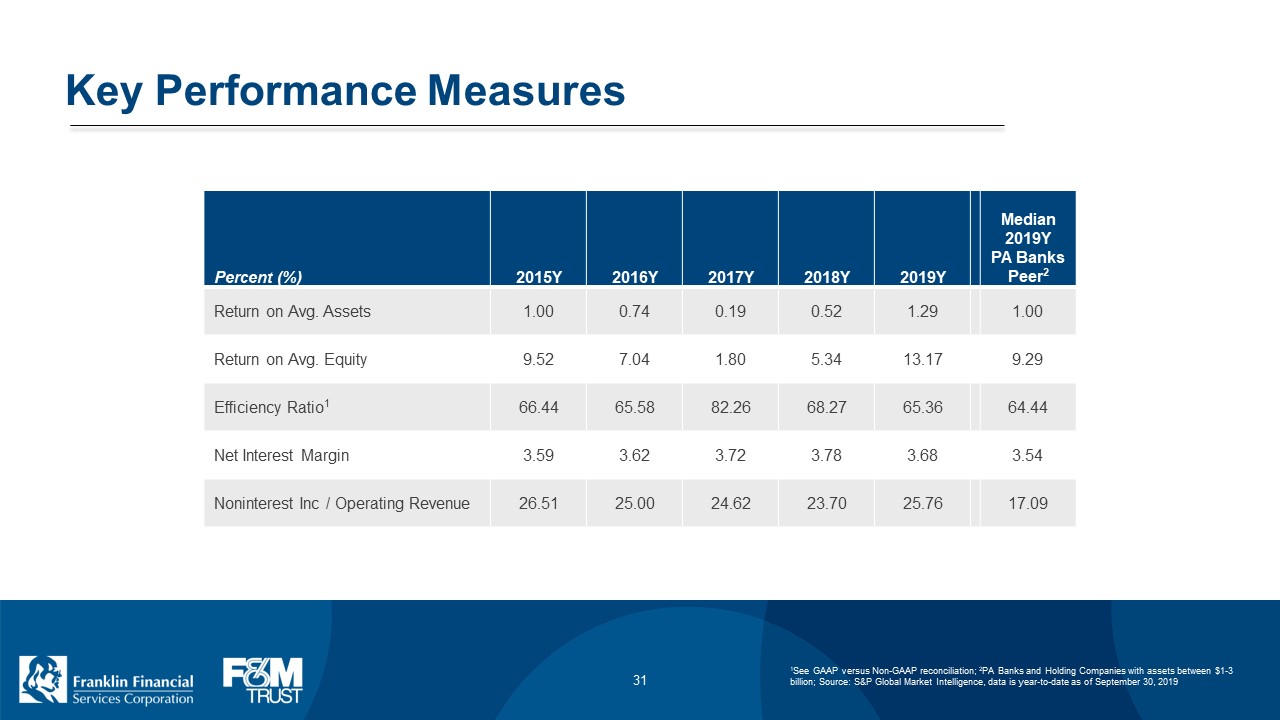
Key Performance Measures Percent (%) 2015Y 2016Y 2017Y 2018Y 2019Y Median 2019Y PA Banks Peer2 Return on Avg. Assets 1.00 0.74 0.19 0.52 1.29 1.00 Return on Avg. Equity 9.52 7.04 1.80 5.34 13.17 9.29 Efficiency Ratio1 66.44 65.58 82.26 68.27 65.36 64.44 Net Interest Margin 3.59 3.62 3.72 3.78 3.68 3.54 Noninterest Inc / Operating Revenue 26.51 25.00 24.62 23.70 25.76 17.09 Franklin Financial Services Corporation F&M Trust 31 1See GAAP versus Non-GAAP reconciliation; 2PA Banks and Holding Companies with assets between $1-3 billion; Source: S&P Global Market Intelligence, data is year-to-date as of September 30, 2019
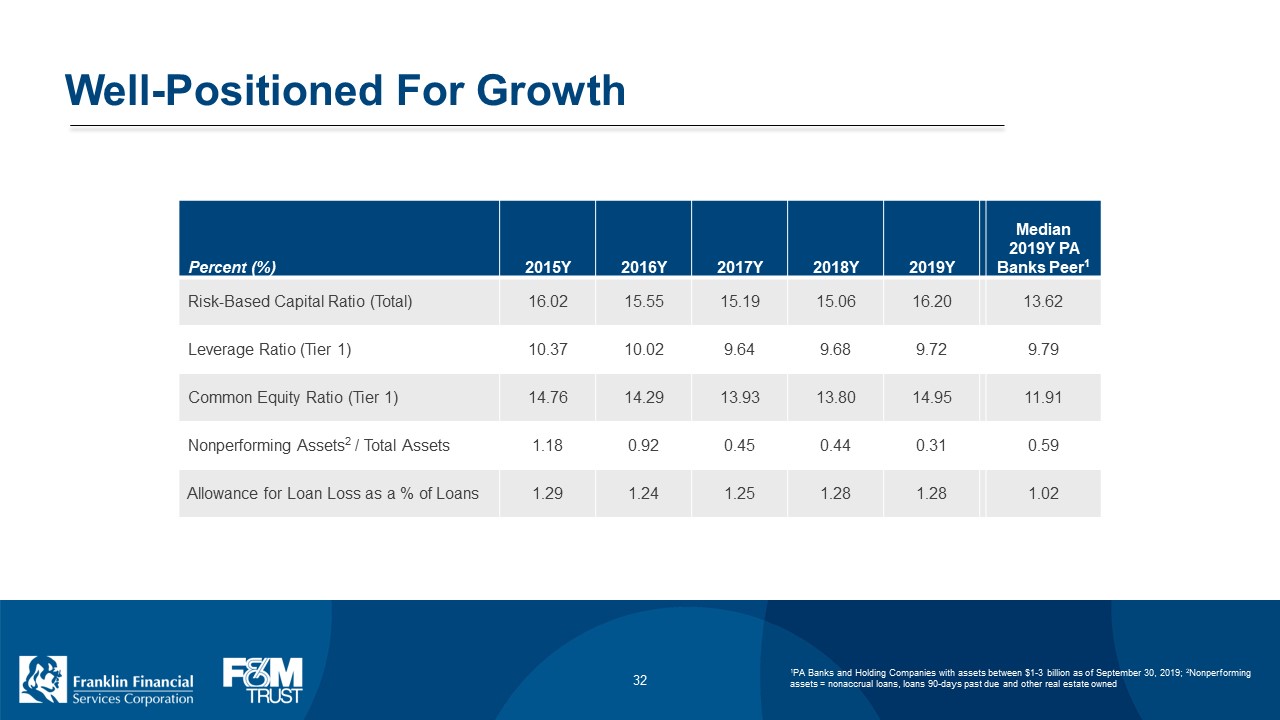
Well-Positioned For Growth Percent (%) 2015Y 2016Y 2017Y 2018Y 2019Y Median 2019Y PA Banks Peer1 Risk-Based Capital Ratio (Total) 16.02 15.55 15.19 15.06 16.20 13.62 Leverage Ratio (Tier 1) 10.37 10.02 9.64 9.68 9.72 9.79 Common Equity Ratio (Tier 1) 14.76 14.29 13.93 13.80 14.95 11.91 Nonperforming Assets2 / Total Assets 1.18 0.92 0.45 0.44 0.31 0.59 Allowance for Loan Loss as a % of Loans 1.29 1.24 1.25 1.28 1.28 1.02 Franklin Financial Services Corporation F&M Trust 32 1PA Banks and Holding Companies with assets between $1-3 billion as of September 30, 2019; 2Nonperforming assets = nonaccrual loans, loans 90-days past due and other real estate owned
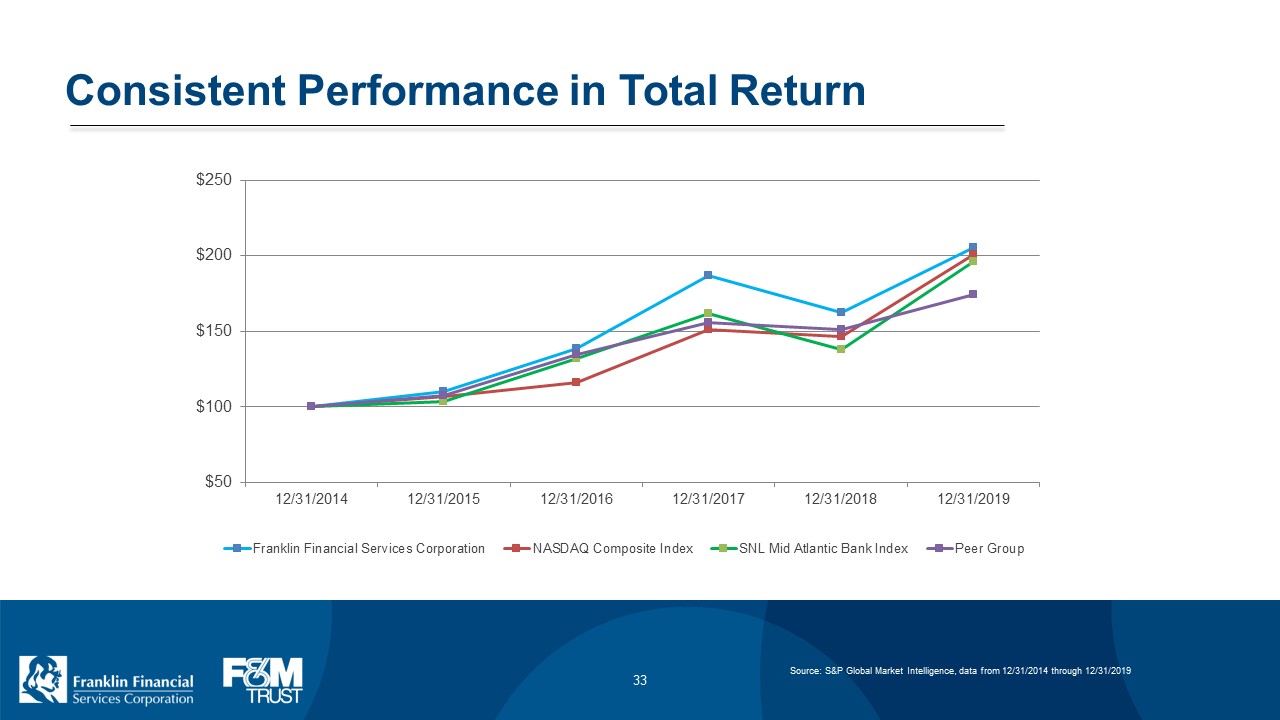
Consistent Performance in Total Return $250 $200 $150 $100 $50 12/31/2014 12/31/2015 12/31/2016 12/31/2017 12/31/2018 12/31/2019 Franklin Financial Services Corporation NASDAQ Composite Index SNL Mid Atlantic Bank Index Peer Group Franklin Financial Services Corporation F&M Trust 33 Source: S&P Global Market Intelligence, data from 12/31/2014 through 12/31/2019
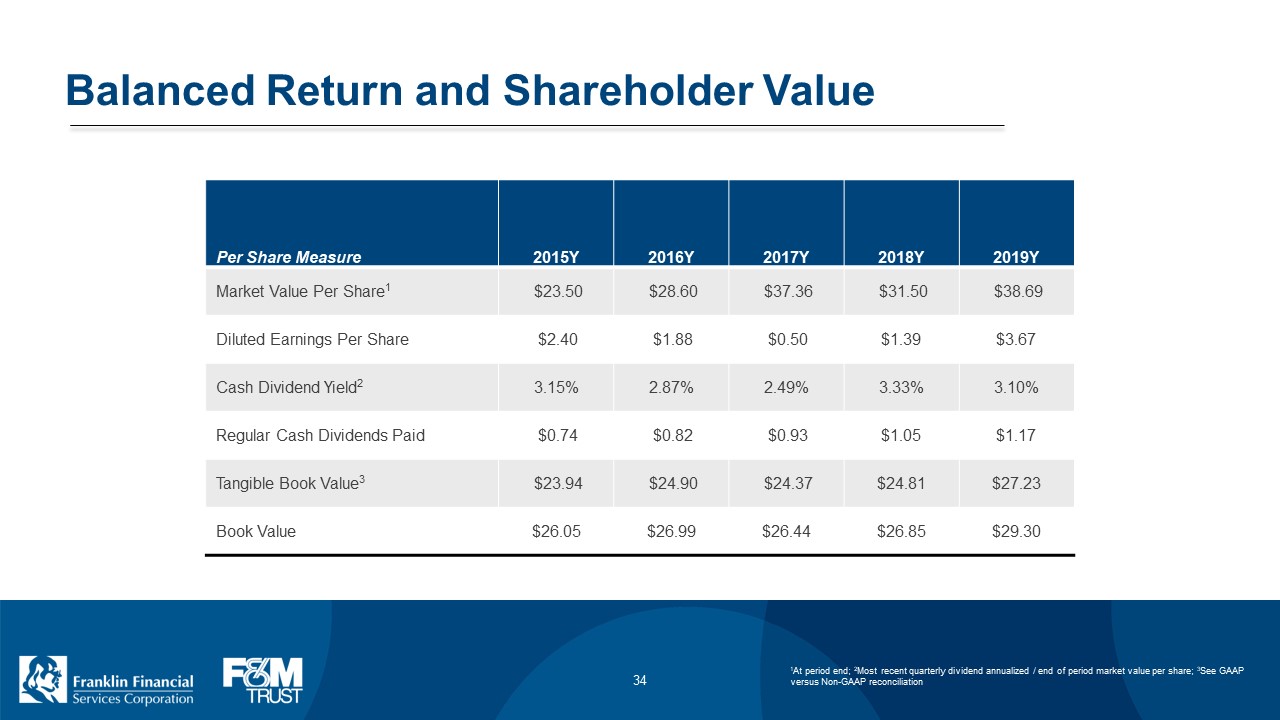
Balanced Return and Shareholder Value Per Share Measure 2015Y 2016Y 2017Y 2018Y 2019Y Market Value Per Share1 $23.50 $28.60 $37.36 $31.50 $38.69 Diluted Earnings Per Share $2.40 $1.88 $0.50 $1.39 $3.67 Cash Dividend Yield2 3.15% 2.87% 2.49% 3.33% 3.10% Regular Cash Dividends Paid $0.74 $0.82 $0.93 $1.05 $1.17 Tangible Book Value3 $23.94 $24.90 $24.37 $24.81 $27.23 Book Value $26.05 $26.99 $26.44 $26.85 $29.30 Franklin Financial Services Corporation F&M Trust 34 1At period end; 2Most recent quarterly dividend annualized / end of period market value per share; 3See GAAP versus Non-GAAP reconciliation
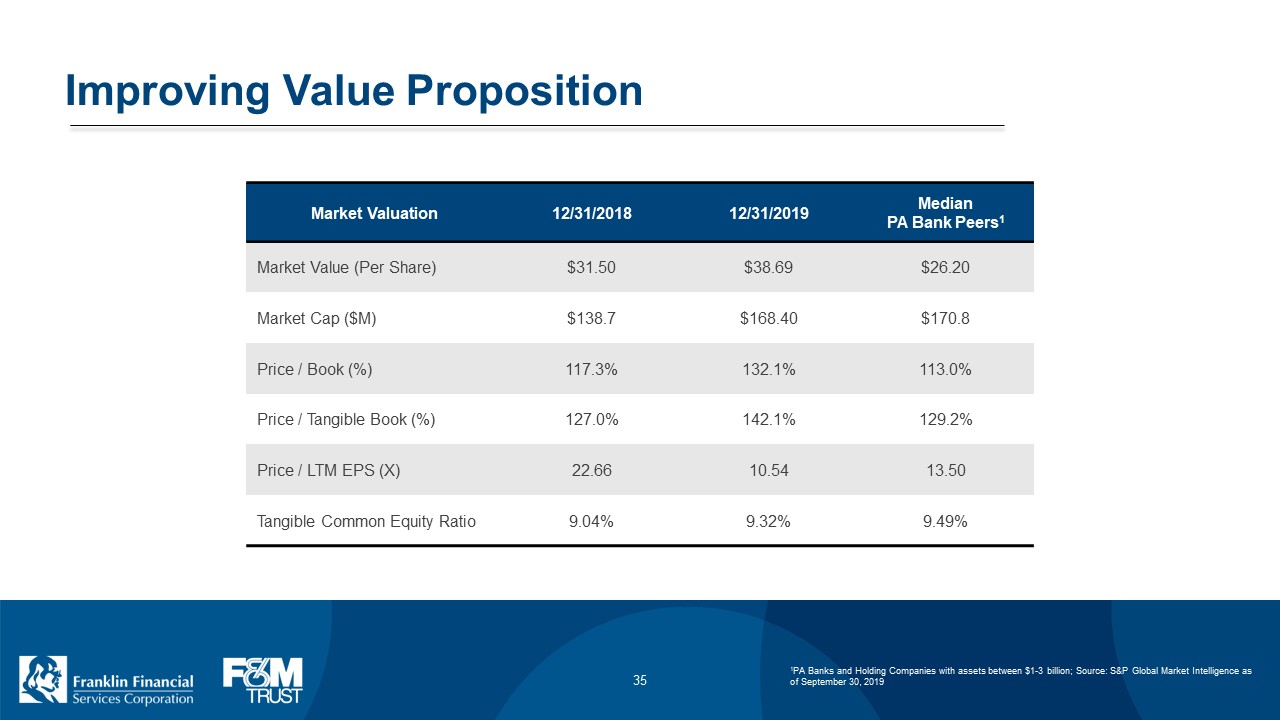
Improving Value Proposition Market Valuation 12/31/2018 12/31/2019 Median PA Bank Peers1 Market Value (Per Share) $31.50 $38.69 $26.20 Market Cap ($M) $138.7 $168.40 $170.8 Price / Book (%) 117.3% 132.1% 113.0% Price / Tangible Book (%) 127.0% 142.1% 129.2% Price / LTM EPS (X) 22.66 10.54 13.50 Tangible Common Equity Ratio 9.04% 9.32% 9.49% Franklin Financial Services Corporation F&M Trust 35 1PA Banks and Holding Companies with assets between $1-3 billion; Source: S&P Global Market Intelligence as of September 30, 2019
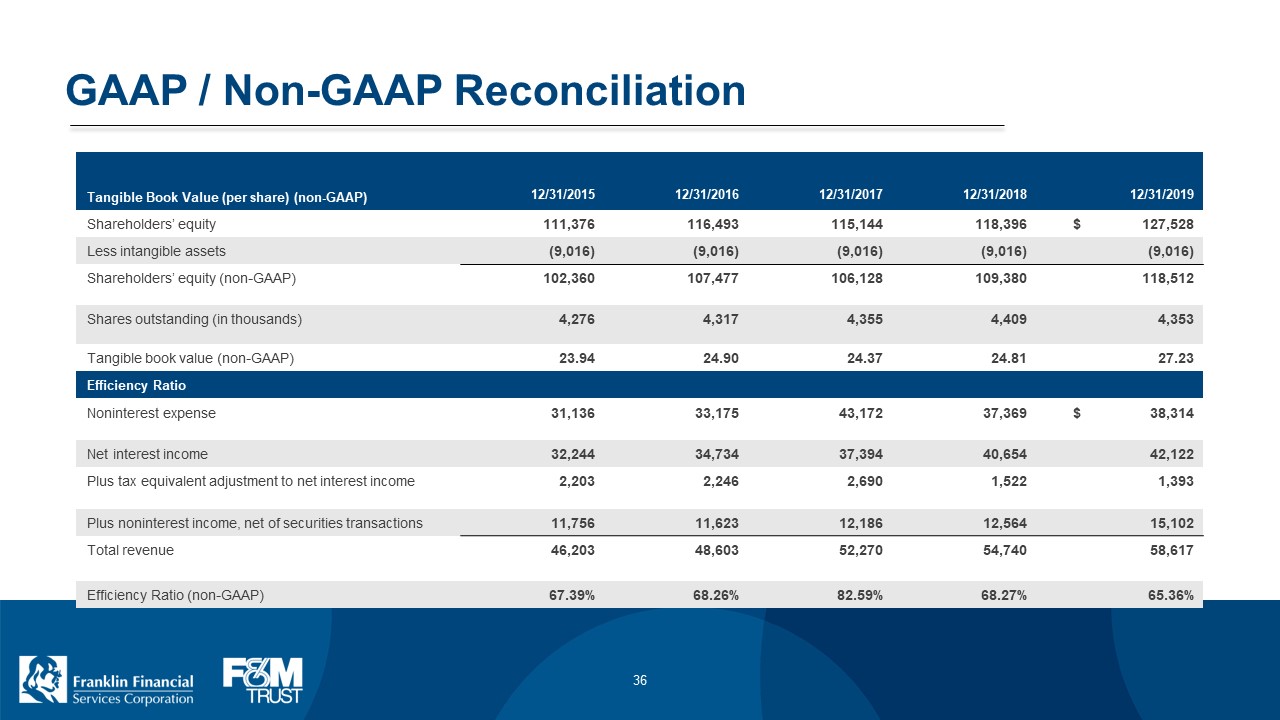
GAAP / Non-GAAP Reconciliation Tangible Book Value (per share) (non-GAAP) 12/31/2015 12/31/2016 12/31/2017 12/31/2018 12/31/2019 Shareholders’ equity 111,376 116,493 115,144 118,396 $ 127,528 Less intangible assets (9,016) (9,016) (9,016) (9,016) (9,016) Shareholders’ equity (non-GAAP) 102,360 107,477 106,128 109,380 118,512 Shares outstanding (in thousands) 4,276 4,317 4,355 4,409 4,353 Tangible book value (non-GAAP) 23.94 24.90 24.37 24.81 27.23 Efficiency Ratio Noninterest expense 31,136 33,175 43,172 37,369 $ 38,314 Net interest income 32,244 34,734 37,394 40,654 42,122 Plus tax equivalent adjustment to net interest income 2,203 2,246 2,690 1,522 1,393 Plus noninterest income, net of securities transactions 11,756 11,623 12,186 12,564 15,102 Total revenue 46,203 48,603 52,270 54,740 58,617 Efficiency Ratio (non-GAAP) 67.39% 68.26% 82.59% 68.27% 65.36% Franklin Financial Services Corporation F&M Trust 36
Thank You Stock Symbol: FRAF (Nasdaq) www.franklinfin.com www.fmtrust.bank Franklin Financial Services Corporation F&M Trust 37