Attached files
| file | filename |
|---|---|
| EX-99.2 - EXHIBIT 99.2 - SYNOVUS FINANCIAL CORP | snvexhibit992123120198.htm |
| EX-99.1 - EXHIBIT 99.1 - SYNOVUS FINANCIAL CORP | snvexhibit991123120198.htm |
| 8-K - 8-K - SYNOVUS FINANCIAL CORP | snv123120198kcoverpage.htm |

Exhibit 99.3 Fourth Quarter 2019 Results January 24, 2020

Forward Looking Statements This slide presentation and certain of our other filings with the Securities and Exchange Commission contain statements that constitute "forward-looking statements" within the meaning of, and subject to the protections of, Section 27A of the Securities Act of 1933, as amended, and Section 21E of the Securities Exchange Act of 1934, as amended. All statements other than statements of historical fact are forward- looking statements. You can identify these forward-looking statements through Synovus' use of words such as "believes," "anticipates," "expects," "may," "will," "assumes," "predicts," "could," "should," "would," "intends," "targets," "estimates," "projects," "plans," "potential" and other similar words and expressions of the future or otherwise regarding the outlook for Synovus' future business and financial performance and/or the performance of the banking industry and economy in general. These forward-looking statements include, among others, statements on (1) our future operating and financial performance, including our outlook and long-term goals for future growth; (2) our expectations regarding balance sheet and revenue growth; (3) our expectations regarding net interest margin; (4) our expectations regarding non-interest expense and effective tax rate; (5) future credit quality and capital position; (6) our strategy and initiatives for future growth, expense management, capital management, tax savings, talent acquisition, and strategic transactions; (7) our expectations as to certain technology enhancements and product launches; (8) future impact of purchase accounting adjustments; (9) future impact of CECL; (10) our expectations regarding economic conditions in our footprint; and (11) our assumptions underlying these conditions. Prospective investors are cautioned that any such forward-looking statements are not guarantees of future performance and involve known and unknown risks and uncertainties which may cause the actual results, performance or achievements of Synovus to be materially different from the future results, performance or achievements expressed or implied by such forward-looking statements. Forward-looking statements are based on the information known to, and current beliefs and expectations of, Synovus' management and are subject to significant risks and uncertainties. Actual results may differ materially from those contemplated by such forward-looking statements. A number of factors could cause actual results to differ materially from those contemplated by the forward-looking statements in this presentation. Many of these factors are beyond Synovus' ability to control or predict. These forward-looking statements are based upon information presently known to Synovus' management and are inherently subjective, uncertain and subject to change due to any number of risks and uncertainties, including, without limitation, the risks and other factors set forth in Synovus' filings with the Securities and Exchange Commission, including its Annual Report on Form 10-K for the year ended December 31, 2018 under the captions "Cautionary Notice Regarding Forward-Looking Statements" and "Risk Factors" and in Synovus' quarterly reports on Form 10-Q and current reports on Form 8-K. We believe these forward-looking statements are reasonable; however, undue reliance should not be placed on any forward-looking statements, which are based on current expectations and speak only as of the date that they are made. We do not assume any obligation to update any forward-looking statements as a result of new information, future developments or otherwise, except as otherwise may be required by law. Use of Non-GAAP Financial Measures This slide presentation contains certain non-GAAP financial measures determined by methods other than in accordance with generally accepted accounting principles. Such non-GAAP financial measures include the following: adjusted diluted earnings per share; adjusted return on average assets; return on average tangible common equity; adjusted return on average tangible common equity; adjusted net income available to common shareholders; adjusted non-interest income; adjusted non-interest expense; adjusted tangible non-interest expense; adjusted tangible efficiency ratio; and tangible common equity ratio. The most comparable GAAP measures to these measures are diluted earnings per share; return on average assets; return on average common equity; net income; total non-interest income; total non-interest expense; efficiency ratio; and total shareholders' equity to total assets ratio, respectively. Management uses these non-GAAP financial measures to assess the performance of Synovus' business and the strength of its capital position. Management believes that these non-GAAP financial measures provide meaningful additional information about Synovus to assist management, investors, and bank regulators in evaluating Synovus' operating results, financial strength, the performance of its business and the strength of its capital position. However, these non-GAAP financial measures have inherent limitations as analytical tools and should not be considered in isolation or as a substitute for analyses of operating results or capital position as reported under GAAP. The non-GAAP financial measures should be considered as additional views of the way our financial measures are affected by significant items and other factors, and since they are not required to be uniformly applied, they may not be comparable to other similarly titled measures at other companies. Adjusted diluted earnings per share, adjusted net income available to common shareholders, and adjusted return on average assets are measures used by management to evaluate operating results exclusive of items that are not indicative of ongoing operations and impact period-to-period comparisons. Return on average tangible common equity and adjusted return on average tangible common equity are measures used by management to compare Synovus' performance with other financial institutions because it calculates the return available to common shareholders without the impact of intangible assets and their amortization, thereby allowing management to evaluate the performance of the business consistently. Adjusted non-interest income is a measure used by management to evaluate non-interest income exclusive of net investment securities gains (losses) and net changes in the fair value of private equity investments. Adjusted non-interest expense, adjusted tangible non-interest expense, and the adjusted tangible efficiency ratio are measures utilized by management to measure the success of expense management initiatives focused on reducing recurring controllable operating costs. The tangible common equity ratio is used by management and bank regulators to assess the strength of our capital position. The computations of the non-GAAP financial measures used in this slide presentation are set forth in the Appendix to this slide presentation. 2

Fourth Quarter 2019 Highlights Adjusted Reported Reported Adjusted Adjusted 4Q19 vs. 4Q19 4Q18 4Q19(1) 4Q18(1) 4Q18(1) Earnings per Share $0.97 $0.87 $0.94 $0.91 3.1 % Return on Average Assets 1.27% 1.29% 1.24% 1.36% 12 bps Return on Average Tangible 15.18% 14.63% 14.84% 15.36% 52 bps Common Equity(1) Efficiency Ratio 53.44% 57.34% 53.20% 55.98% 278 bps ▪ Diluted EPS of $0.97 and adjusted diluted EPS(1) of $0.94, up 3.1% year over year ▪ Period-end loan growth of $745 million or 8.1%(2) vs. 3Q19 on total funded loan production of $3.6 billion ▪ Total core transaction deposits(3) increased $373 million or 6.2%(2) sequentially, while total deposit cost decreased 13 bps with continued strategic remix of deposits replacing higher cost CDs ▪ Non-interest income growth of $9 million led by capital markets, fiduciary activities, and impacts from fair value adjustments ▪ Net interest margin, excluding purchase accounting adjustments (PAA), of 3.40% declined 2 bps vs. 3Q19 ▪ Favorable credit metrics with NPAs and NCOs declining 5 bps to 0.37% and 12 bps to 0.10%, respectively ▪ QTD share repurchases of $37 million or 1 million shares, completing the $725 million authorization (1) Non-GAAP financial measure; see appendix for applicable reconciliation 3 (2) Annualized (3) Core transaction deposits consist of non-interest bearing, NOW/savings, and money market deposits excluding public funds and brokered

Loans Period-end (in billions) $37.2(1) $36.4(1) ▪ Diversified sequential quarter period-end growth of $745 million or 8.1%(2)vs. 3Q19 on total funded production of $3.6 billion 45.1% 45.2% ▪ CRE up $167 million $26.0(1) ▪ Growth in 7 of 10 asset classes 49.3% ▪ C&I up $364 million 26.7% 26.7% ▪ Broad-based across industries and geographies 25.5% ▪ Consumer up $215 million ▪ Growth in all asset classes 28.2% 28.2% 25.3% ▪ Total average loan growth of $307 million or 3.4%(2) vs. 3Q19 ▪ Back-end weighted growth provides momentum for next quarter's net interest income Amounts may not total due to rounding (1) Total loans are net of deferred fees, costs, discounts/premiums (2) Annualized 4

Deposits Period-end (in billions) ▪ 4Q19 total period-end deposits increased $972 million or 10.3%(1) vs. 3Q19 ▪ (2) $38.4 Core transaction deposits up $373 $37.4 million 9.0% 8.5% ▪ Public funds increased $827 million ▪ 10.1% 12.0% Brokered deposits up $234 million ▪ CDs, excl. public funds, down $462 million $26.7 17.8% 16.1% 5.8% 8.9% ▪ 4Q19 total average deposits increased $165 (1) 13.8% million or 1.7% vs. 3Q19 ▪ Total deposit costs have declined 13 bps sequentially 63.6% 62.9% (3) 71.5% (3) (3) Amounts may not total due to rounding (1) Annualized 5 (2) Core transaction deposits consist of non-interest bearing, NOW/savings, and money market deposits excluding public funds and brokered (3) Excluding PAA

Net Interest Income ▪ Net interest income of $399 million (dollars in millions) decreased $3 million or 0.7% vs. 3Q19 and increased $101 million or 34.0% vs. 4Q18, largely due to the FCB merger ▪ Net interest margin of 3.65% declined 4 bps vs. 3Q19; includes $26 million of PAA vs. $29 million in 3Q19 ▪ The sequential decrease in NIM (excl. PAA) was driven by the decline in short term rates during the quarter 3Q19 4Q19 Metric GAAP Excl. PAA(1) GAAP Excl. PAA(1) Loan yield 5.13% 4.93% 4.93% 4.75% Earning assets 4.78% 4.60% 4.60% 4.45% yield (1) Effective cost 1.09% 1.18% 0.95% 1.05% of funds Net Interest 3.69% 3.42% 3.65% 3.40% Margin 6 (1) PAA are primarily comprised of loan accretion and deposit premium amortization of $15 million and $11 million in 4Q 2019 and $16 million and $11 million in 3Q 2019

Non-Interest Income ▪ 4Q19 non-interest income of $98 million (in millions) increased $9 million vs. 3Q19 and $30 million vs. 4Q18 ▪ 4Q19 adjusted non-interest income(1) of $92 million increased $0.7 million or 0.8% $98 vs. 3Q19 and $22 million or 31.3% vs. $89 4Q18 ▪ Fiduciary/asset management, brokerage, $68 and insurance revenues of $28 million $1 increased $2 million or 6.1% vs. 3Q19 $2 ▪ Assets under management of $17.0 billion increased 4.9% vs. 3Q19 and 21.2% vs. 4Q18 (3) ($ in billions) $47.5 $47.2 $46.7 $45.8 (2) 0.70% (3) Amounts may not total due to rounding (1) Non-GAAP financial measure; see appendix for applicable reconciliation 7 (2) Include service charges on deposit accounts, card fees, letter of credit fees, ATM fee income, line of credit non-usage fees, gains from sales of government guaranteed loans, and miscellaneous other service charges (3) Annualized

Non-Interest Expense ▪ (dollars in millions) 4Q19 non-interest expense of $266 million increased $10 million or 3.7% vs. 3Q19 and $56 million or 26.8% vs. 4Q18 (1) $262 ▪ 4Q19 adjusted non-interest expense of $256 $265 million increased $6 million or 2.4% $206 vs. 3Q19 and $58 million or 28.2% vs. 4Q18 ▪ Employment expense up $3 million primarily due to salaries and commissions on higher fee income production ▪ Additional servicing expense of $2 million following the renegotiation of a third party consumer lending partnership (more than offset with additional net interest income) 4Q18 3Q19 4Q19 ▪ FDIC expense increased $3 million Efficiency Ratio 57.34% 56.20% 53.44% from reclassification of certain loan categories over the past 4 years Adjusted Tangible Efficiency 55.98% 51.71% 53.20% Ratio(1) 8 (1) Non-GAAP financial measure; see appendix for applicable reconciliation

Credit Quality (dollars in millions) 0. ( 29 0. 2 % ) 0.33% 24 % 0.24% 0.2 9% $13 $17 $12 $20 $9 (1) 0.1 9% % $281 $28 $265 $25 $251 $257 $257 $24 $2 $12 7. $12 7 (2) (3) (1) Excludes impaired loans held for sale. Effective January 1, 2019, non-performing loans exclude acquired loans accounted for under ASC 310-30 that are currently accruing income 9 (2) Excludes impaired loans held for sale and FCB acquired NPLs that carry no reserve. Effective January 1, 2019, non-performing loans exclude acquired loans accounted for under ASC 310-30 that are currently accruing income (3) Excludes impaired loans with no reserves and FCB acquired NPLs that carry no reserve. Effective January 1, 2019, non-performing loans exclude acquired loans accounted for under ASC 310-30 that are currently accruing income

Capital Ratios 4Q18 3Q19 4Q19 (1) Common equity Tier 1 ratio 9.95 8.96 8.95 (1) Tier 1 capital ratio 10.61 10.27 10.24 (1) Total risk-based capital ratio 12.37 12.30 12.25 (1) Leverage ratio 9.60 9.02 9.16 Tangible common equity ratio(2) 8.81 8.04 8.08 ▪ Completed the $725 million share repurchase authorization in 2019 resulting in a 10.9% reduction of total share count from January 1, 2019 ▪ Repurchased $37 million (1 million shares) in common stock during the quarter ▪ The Board of Directors approved a 10% increase in the quarterly common stock dividend to $0.33 per share effective with the April dividend (1) Preliminary (2) Non-GAAP financial measure; see appendix for applicable reconciliation 10

2019 Highlights Adjusted Reported Reported Adjusted Adjusted 2019 vs. 2019 2018 2019(1) 2018(1) 2018(1) Earnings per Share $3.47 $3.47 $3.90 $3.64 7.3 % Return on Average Assets 1.20% 1.35% 1.35% 1.40% 5 bps Return on Average Tangible 14.34% 14.94% 16.10% 15.66% 44 bps Common Equity(1) Efficiency Ratio 56.22% 58.04% 51.82% 56.33% 451 bps ▪ Successfully integrated FCB and introduced new teams and products to our South Florida markets ▪ Legacy FCB wholesale loan growth of $350 million and deposit account growth of 8% ▪ Legacy FCB branch sales per month at 51.2, higher than legacy Synovus ▪ Announced Kevin Blair as President and reorganized our operating model to better serve our customers ▪ Enhancement of Treasury & Payments Solutions team drove a 29% increase in implementations vs. 2018 ▪ 58 net new revenue-producing team members ▪ Strong gains in banker productivity with $11.1 billion in funded loan production ▪ Broad-based loan, deposit, and fee-based revenue growth with an emphasis on organic production and teamwork across all business lines ▪ Returned $893 million to common shareholders during the year with repurchases of $725 million in common stock and $168 million in common dividends (1) Non-GAAP financial measure; see appendix for applicable reconciliation 11

2020 Outlook and Long-term Goals Long-term Goals Positive operating Diversified balance Top quartile for key leverage sheet growth profitability metrics (excl. PAA) > National Real GDP % (1) Assumes current forward curve (2) PAA are primarily comprised of loan accretion and deposit premium amortization of $95 million in 2019; Synovus estimates PAA for 2020 of $8.0 million (3) Non-GAAP financial measure; see appendix for applicable reconciliation 12

Appendix
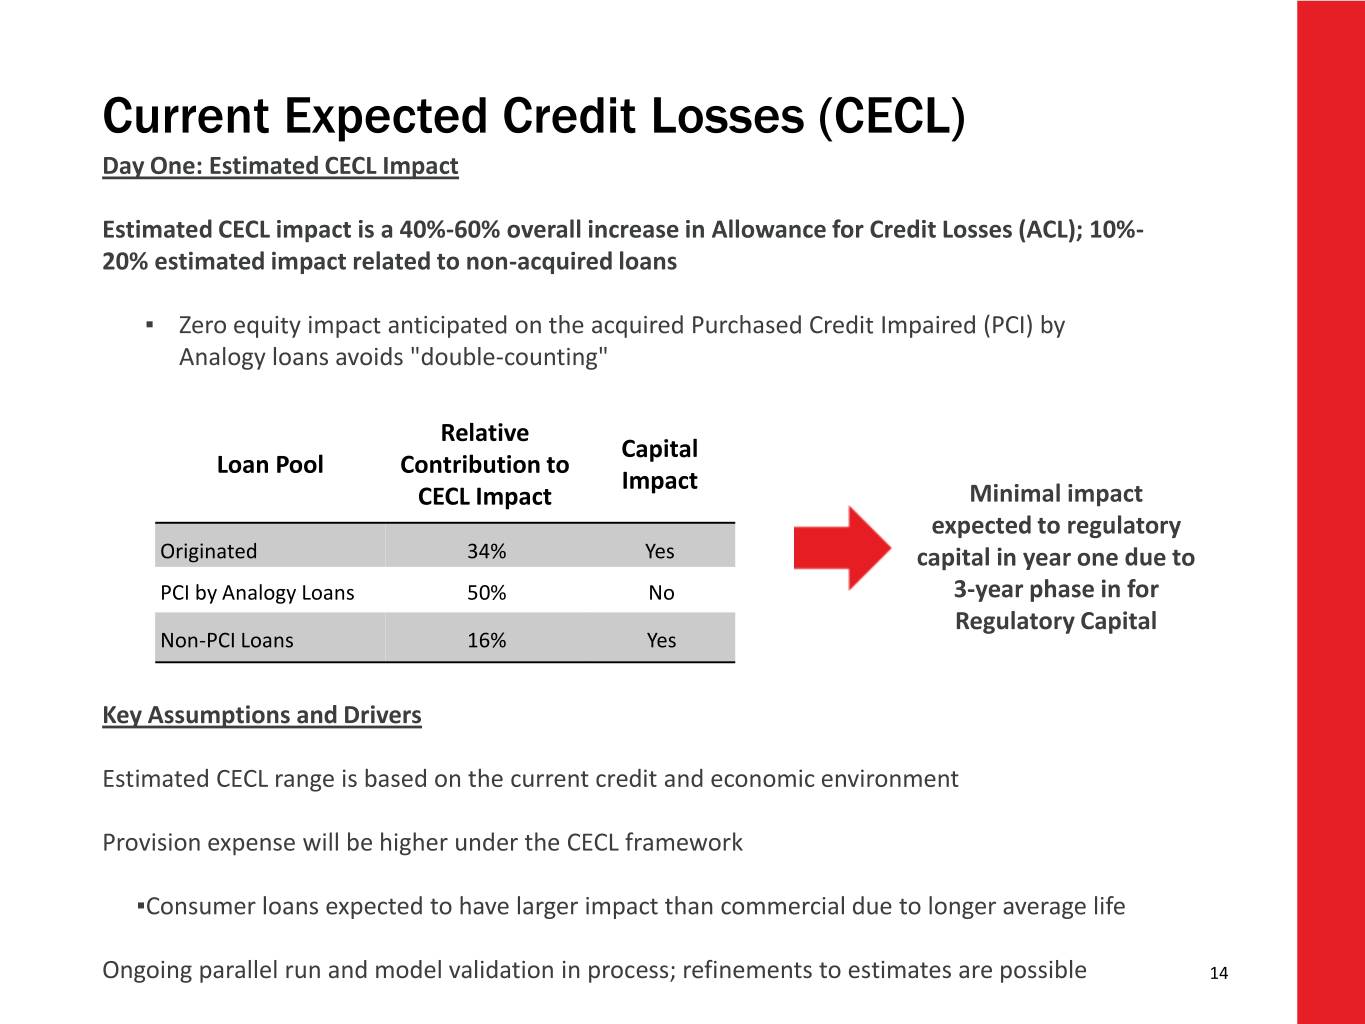
Current Expected Credit Losses (CECL) Day One: Estimated CECL Impact Estimated CECL impact is a 40%-60% overall increase in Allowance for Credit Losses (ACL); 10%- 20% estimated impact related to non-acquired loans ▪ Zero equity impact anticipated on the acquired Purchased Credit Impaired (PCI) by Analogy loans avoids "double-counting" Relative Capital Loan Pool Contribution to Impact CECL Impact Minimal impact expected to regulatory Originated 34% Yes capital in year one due to PCI by Analogy Loans 50% No 3-year phase in for Regulatory Capital Non-PCI Loans 16% Yes Key Assumptions and Drivers Estimated CECL range is based on the current credit and economic environment Provision expense will be higher under the CECL framework ▪Consumer loans expected to have larger impact than commercial due to longer average life Ongoing parallel run and model validation in process; refinements to estimates are possible 14

Quarterly Highlights Trend 4Q18 1Q19 2Q19 3Q19 4Q19 Diluted EPS 0.87 0.72 0.96 0.83 0.97 Net interest margin 3.92 3.78 3.69 3.69 3.65 Efficiency ratio 57.34 61.28 54.14 56.20 53.44 Financial Performance Adjusted tangible efficiency ratio(1) 55.98 50.24 52.08 51.71 53.20 ROA(2) 1.29 1.06 1.34 1.14 1.27 Adjusted ROA(1)(2) 1.36 1.45 1.39 1.33 1.24 Total loans 5.7 37.3 5.7 3.1 8.1 Balance Sheet % (3) Growth Total average deposits 8.0 40.5 0.8 (1.9) 1.7 NPA ratio 0.44 0.44 0.39 0.42 0.37 Credit Quality NCO ratio(2) 0.20 0.19 0.13 0.22 0.10 (5) Common shares outstanding(4) 115,866 157,454 156,872 147,594 147,158 Capital CET1 ratio 9.95 9.52 9.61 8.96 8.95 Tangible common equity ratio(1) 8.81 8.34 8.56 8.04 8.08 15 (1) Non-GAAP financial measure; see applicable reconciliation (2) Annualized (3) Sequential quarter growth, annualized except for 1Q19 (4) In thousands (5) Preliminary
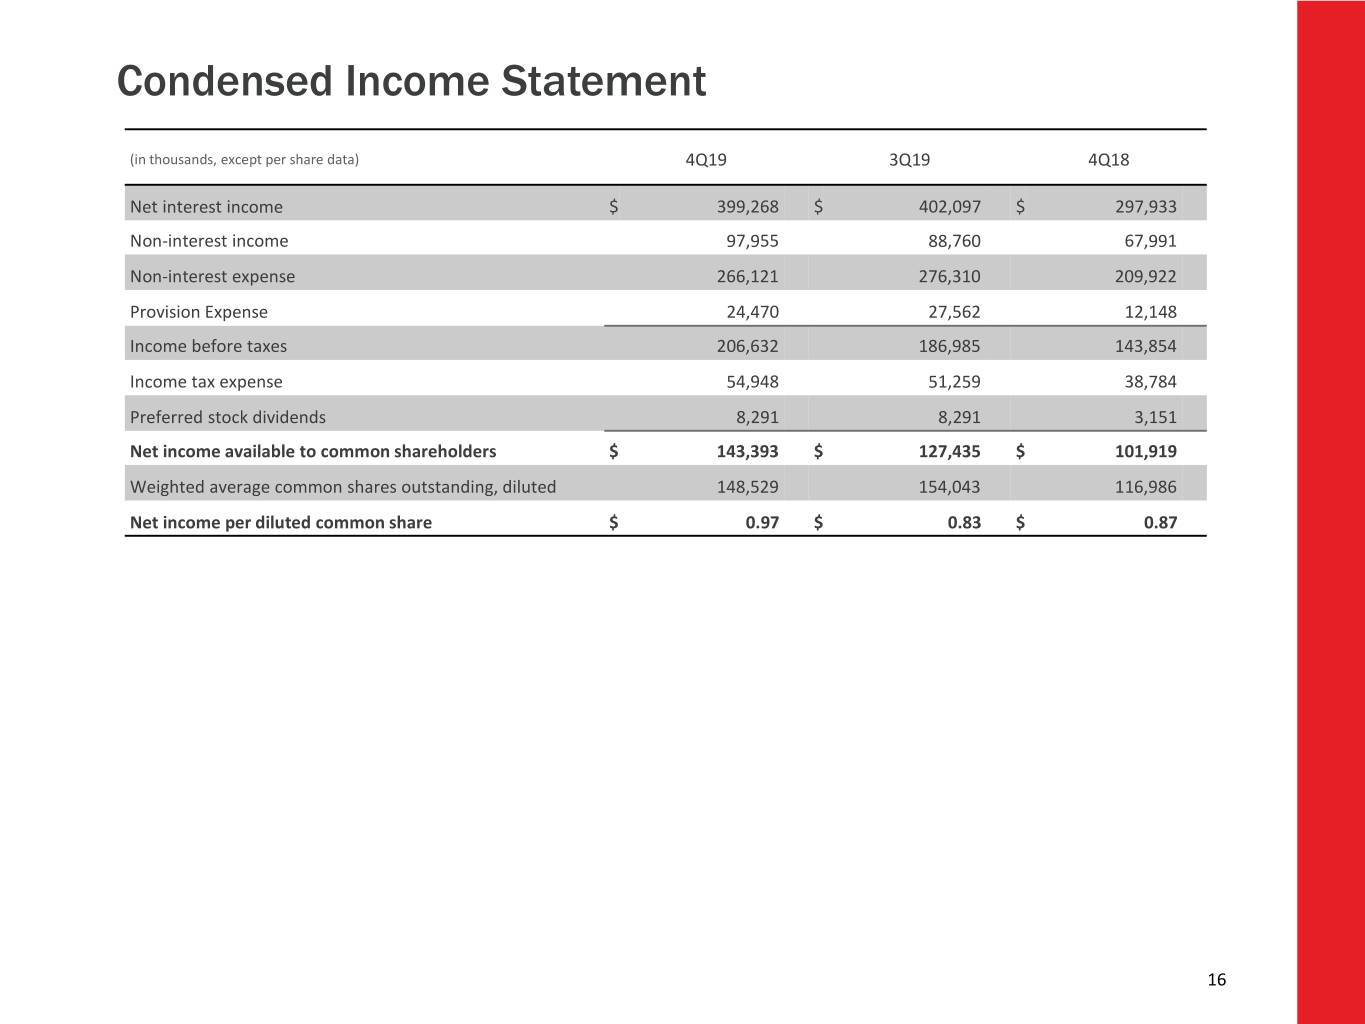
Condensed Income Statement (in thousands, except per share data) 4Q19 3Q19 4Q18 Net interest income $ 399,268 $ 402,097 $ 297,933 Non-interest income 97,955 88,760 67,991 Non-interest expense 266,121 276,310 209,922 Provision Expense 24,470 27,562 12,148 Income before taxes 206,632 186,985 143,854 Income tax expense 54,948 51,259 38,784 Preferred stock dividends 8,291 8,291 3,151 Net income available to common shareholders $ 143,393 $ 127,435 $ 101,919 Weighted average common shares outstanding, diluted 148,529 154,043 116,986 Net income per diluted common share $ 0.97 $ 0.83 $ 0.87 16

Non-Interest Income 4Q19 vs. 3Q19 4Q19 vs. 4Q18 (in thousands) 4Q19 3Q19 4Q18 % Change % Change Service charges on deposit accounts $ 22,385 $ 22,952 $ 20,320 (2.5) 10.2 Fiduciary and asset management fees 15,645 14,686 13,805 6.5 13.3 Brokerage revenue 11,106 11,071 9,241 0.3 20.2 Mortgage banking income 9,287 10,351 3,781 (10.3) 145.6 Card fees 11,325 12,297 10,862 (7.9) 4.3 Capital markets income 8,972 7,396 1,977 21.3 nm Income from bank-owned life insurance 5,620 5,139 3,682 9.4 52.6 Other non-interest income 7,672 7,405 6,407 3.6 19.7 Adjusted non-interest income $ 92,012 $ 91,297 $ 70,075 0.8 31.3 Gain on sale and increase/(decrease) in fair value of private equity investments, net 8,100 1,194 (2,084) nm nm Investment securities (losses), net (2,157) (3,731) — nm nm Total non-interest income $ 97,955 $ 88,760 $ 67,991 10.4 44.1 nm = not meaningful 17
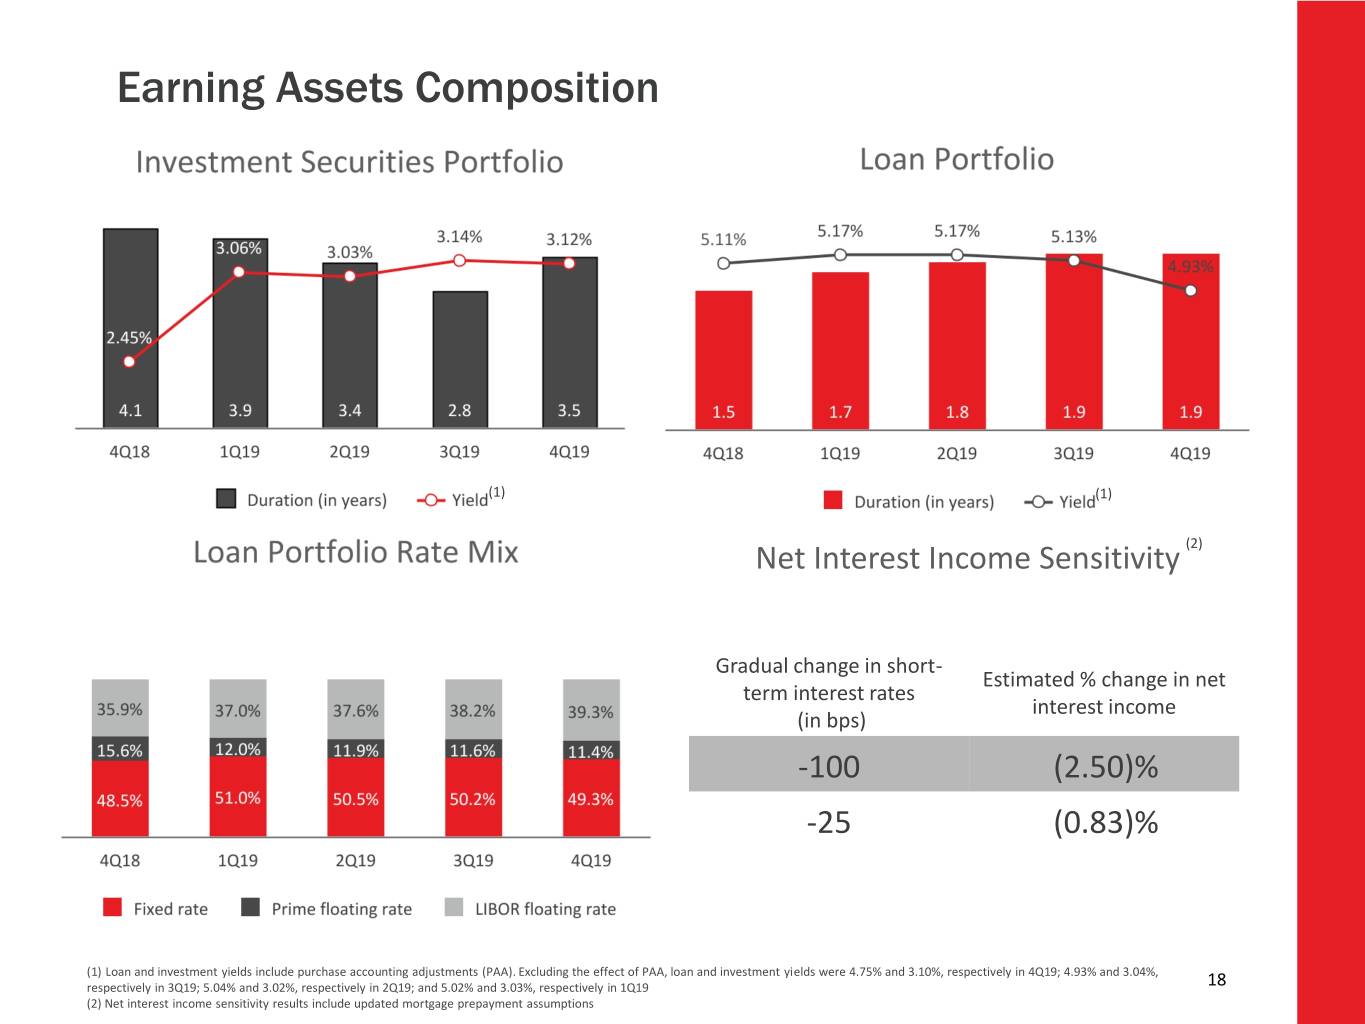
Earning Assets Composition ( 2 ) (1) (1) Net Interest Income Sensitivity (2) Gradual change in short- Estimated % change in net term interest rates interest income (in bps) -100 (2.50)% -25 (0.83)% (1) Loan and investment yields include purchase accounting adjustments (PAA). Excluding the effect of PAA, loan and investment yields were 4.75% and 3.10%, respectively in 4Q19; 4.93% and 3.04%, respectively in 3Q19; 5.04% and 3.02%, respectively in 2Q19; and 5.02% and 3.03%, respectively in 1Q19 18 (2) Net interest income sensitivity results include updated mortgage prepayment assumptions

Loan Portfolio by Category Consumer Portfolio - $9.9 Billion CRE Portfolio - $10.5 Billion ▪ High quality Consumer Real Estate book ▪ 86% are income-producing ▪ Weighted average credit score of 787 and 778 ▪ Residential C&D and Land < 3% of total loans for HELOC and Mortgage, respectively ▪ No CRE loan > $63 million ▪ Average LTV ~75% ▪ Average loan size of $11.2 million Resi. Constr,Consumer Dev, ▪ Diversity among property types and geographies Land CRE 2.2% 26.5% 28.6% Consumer C&I Portfolio - $16.8 Billion Consumer Non-R/E Other CRE 7.3% Prop. Types CRE ▪ Primarily direct middle market and commercial 6.3% clients Multi-Family Consumer R/E 5.4% ▪ Syndications ~7% of total loans Related C&I ▪ C&I specialty lending includes Senior Housing and 19.5% Office Bldg.45.0% Premium Finance 6.1% ▪ C&I industry mix aligned with economic and Shopping Centers demographic drivers 4.6% ▪ Limited energy and leverage loan exposure (< 3%) Hotel C&I Specialty 3.5% Lending Quality by Category 14.6% (1) Direct Middle Market & Loan Type NPL % NCO % 30+ DPD % Commercial Banking 30.6% C&I 0.39% 0.20% 0.40% CRE 0.05% (0.18)% 0.05% Consumer 0.31% 0.21% 0.53% Total 0.27% 0.10% 0.33% C&I 19 (1) Year to date annualized

Loan Composition and Growth ($ in millions) Composition Growth 3Q19 vs. 4Q19 Annualized 3Q19 4Q19 Investment Properties $8,882 24.4% $9,043 24.3% $161 7.2% Residential Properties $806 2.2% $780 2.1% $(26) (12.7)% Land Acquisition & Development $625 1.7% $658 1.8% $33 20.9% Total CRE $10,313 28.3% $10,481 28.2% $168 6.5% C&I $16,418 45.1% $16,783 45.2% $365 8.8% Retail $9,709 26.6% $9,925 26.6% $216 8.8% Total $36,418 100.0% $37,162 100.0% $744 8.1% Amounts may not total due to rounding *Totals include net deferred fees/cost by category which are not displayed on this slide 20

Commercial Real Estate Composition of 4Q19 Commercial Real Estate Portfolio ▪ Investment Properties portfolio represents Total Portfolio $10.5 billion 86% of total CRE portfolio ▪ The portfolio is well diversified among the property types ▪ Credit quality in Investment Properties portfolio remains excellent ▪ As of 4Q19, Residential C&D and Land Acquisition Portfolios represent only 3.7% of total performing loans ▪ No single CRE loan above $63 million ▪ Average CRE loan size is $11 million Credit Indicator 4Q19 NPL Ratio 0.05% Net Charge-off Ratio (annualized) (0.18)% 30+ Days Past Due Ratio 0.05% 90+ Days Past Due Ratio 0.01% 21

C&I Portfolio Diverse Industry Exposure Total Portfolio $16.8 billion ▪ Wholesale Bank (includes Large Corporate, Middle Market, and Specialty Lines) represents 57.5% of C&I Balances ▪ Community/Retail Bank represents 42.5% of C&I balances Credit Indicator 4Q19 NPL Ratio 0.39% Net Charge-off Ratio (annualized) 0.20% 30+ Days Past Due Ratio 0.40% 90+ Days Past Due Ratio 0.02% 22
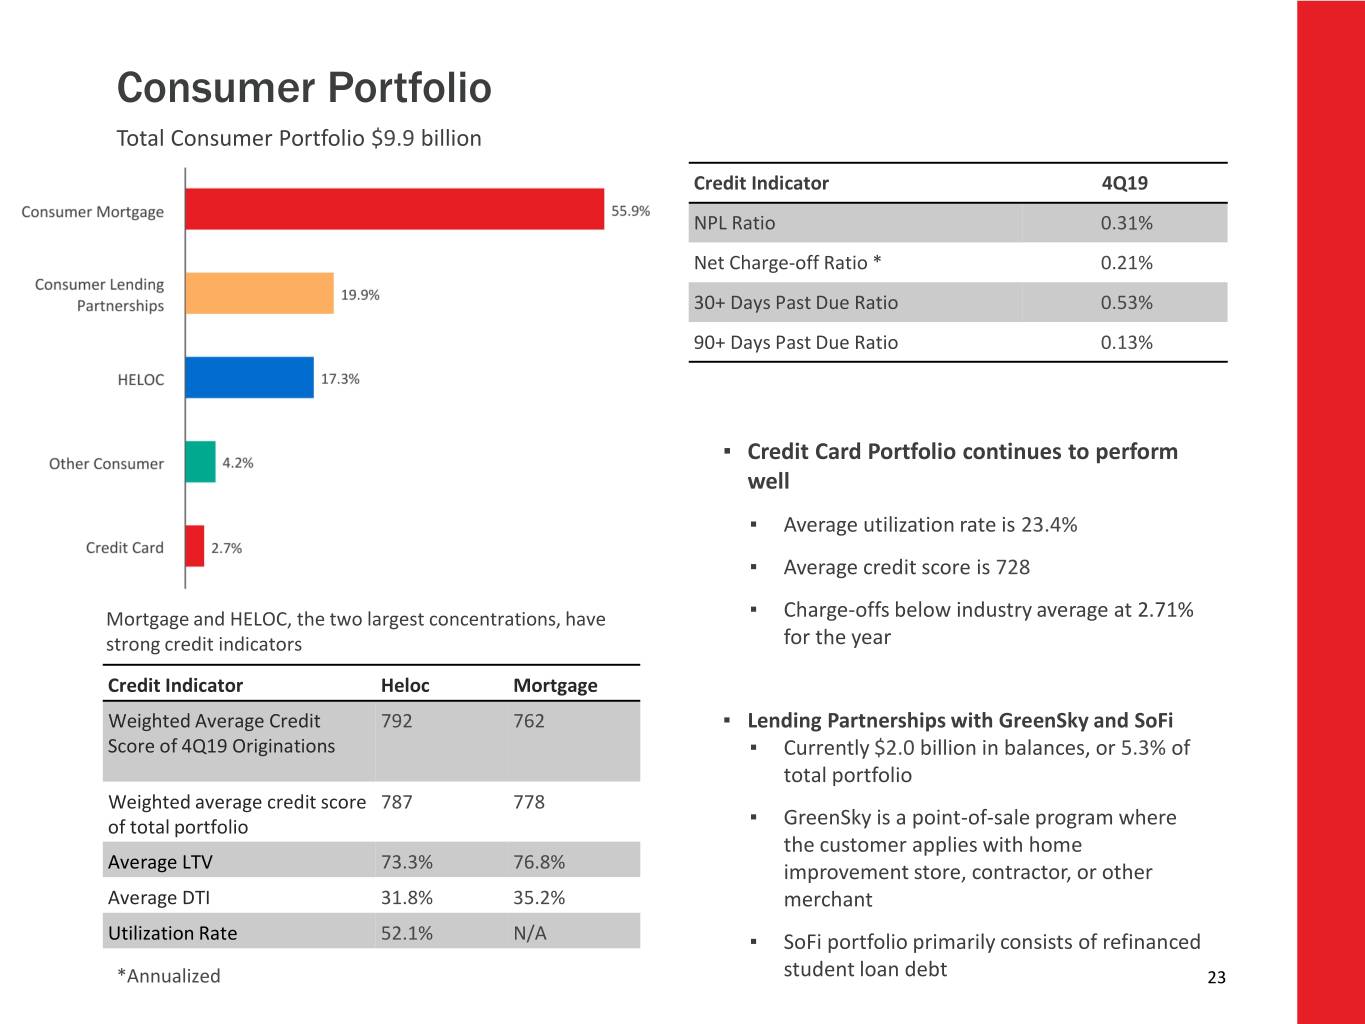
Consumer Portfolio Total Consumer Portfolio $9.9 billion Credit Indicator 4Q19 NPL Ratio 0.31% Net Charge-off Ratio * 0.21% 30+ Days Past Due Ratio 0.53% 90+ Days Past Due Ratio 0.13% ▪ Credit Card Portfolio continues to perform well ▪ Average utilization rate is 23.4% ▪ Average credit score is 728 Mortgage and HELOC, the two largest concentrations, have ▪ Charge-offs below industry average at 2.71% strong credit indicators for the year Credit Indicator Heloc Mortgage Weighted Average Credit 792 762 ▪ Lending Partnerships with GreenSky and SoFi Score of 4Q19 Originations ▪ Currently $2.0 billion in balances, or 5.3% of total portfolio Weighted average credit score 787 778 of total portfolio ▪ GreenSky is a point-of-sale program where the customer applies with home Average LTV 73.3% 76.8% improvement store, contractor, or other Average DTI 31.8% 35.2% merchant Utilization* Annualized Rate 52.1% N/A ▪ SoFi portfolio primarily consists of refinanced *Annualized student loan debt 23
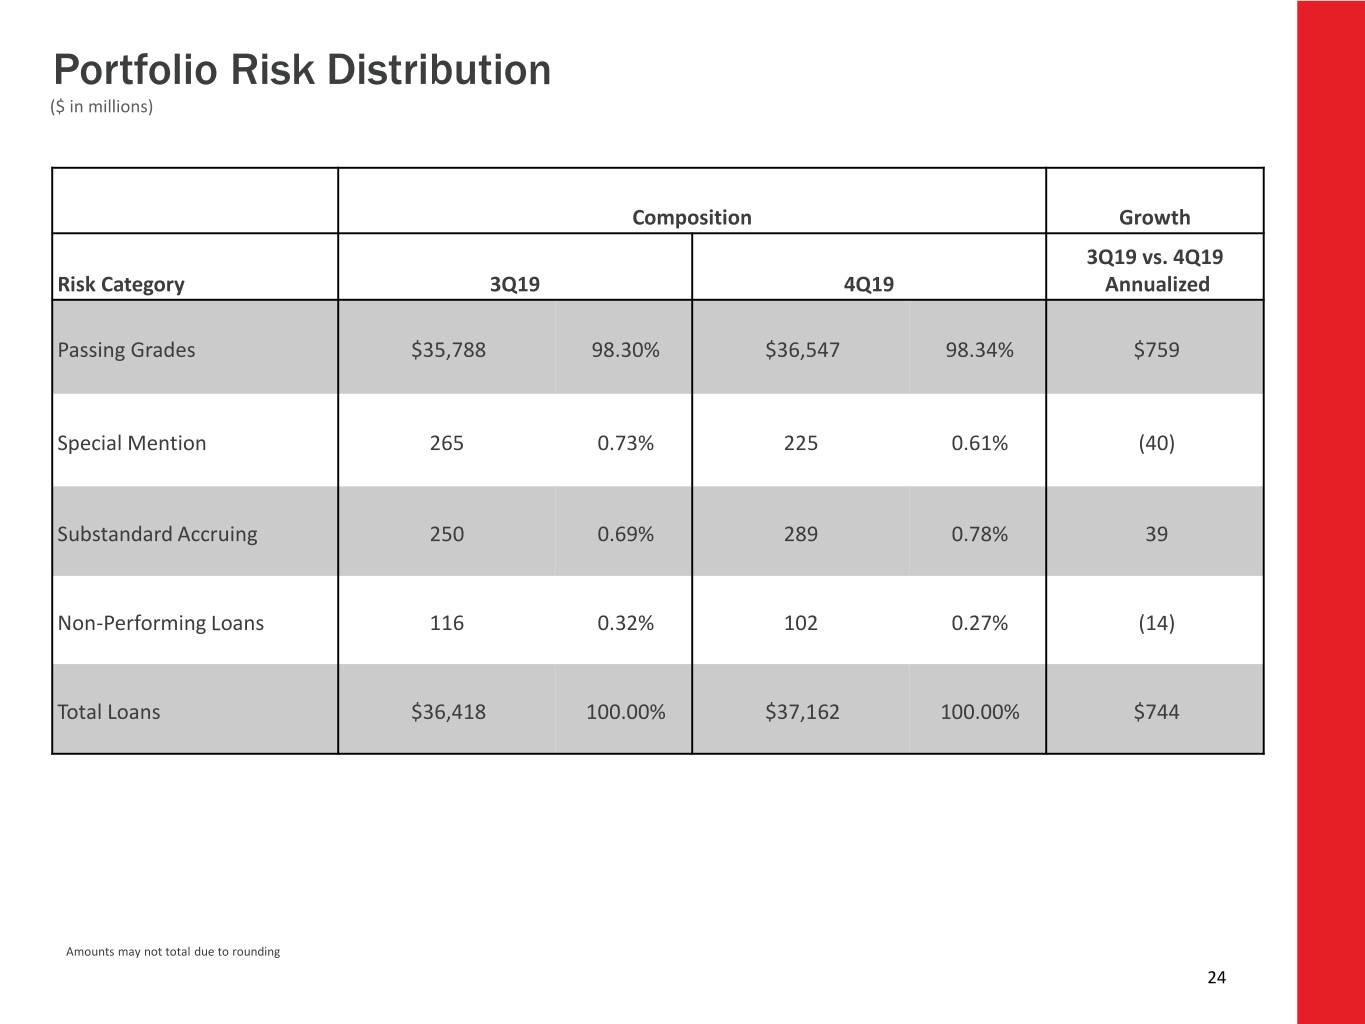
Portfolio Risk Distribution ($ in millions) Composition Growth 3Q19 vs. 4Q19 Risk Category 3Q19 4Q19 Annualized Passing Grades $35,788 98.30% $36,547 98.34% $759 Special Mention 265 0.73% 225 0.61% (40) Substandard Accruing 250 0.69% 289 0.78% 39 Non-Performing Loans 116 0.32% 102 0.27% (14) Total Loans $36,418 100.00% $37,162 100.00% $744 Amounts may not total due to rounding 24

Non-GAAP Financial Measures (dollars in thousands) 4Q19 3Q19 4Q18 2019 2018 Net income available to common shareholders $ 143,393 127,435 101,919 540,899 410,478 Add/subtract: Income tax expense (benefit), net related to State Tax Reform and SAB 118 — 4,402 — 4,402 (9,148) Add: Preferred stock redemption charge — — — — 4,020 Add: Earnout liability adjustments — 10,457 — 10,457 11,652 Subtract/add: Merger-related expense (913) 353 3,381 56,580 10,065 Subtract: Litigation settlement/contingency expense — — — — (4,026) Add/subtract: Restructuring charges, net 1,259 (66) 140 1,230 (51) Add: Valuation adjustment to Visa derivative 1,111 2,500 — 3,611 2,328 Add: Loss on early extinguishment of debt, net — 4,592 — 4,592 — Add: Investment securities losses, net 2,157 3,731 — 7,659 1,296 Subtract/add: Gain on sale and fair value (increase) decrease of private equity investments (8,100) (1,194) 2,084 (11,607) 4,743 Add/subtract: Tax effect of adjustments 1,162 (2,478) (523) (9,343) (1,008) Adjusted net income available to common shareholders $ 140,069 149,732 107,001 608,480 430,349 Weighted average common shares outstanding, diluted 148,529 154,043 116,986 156,058 118,378 Net income per common share, diluted $ 0.97 $ 0.83 $ 0.87 $ 3.47 $ 3.47 Adjusted net income per common share, diluted $ 0.94 $ 0.97 $ 0.91 $ 3.90 $ 3.64 25

Non-GAAP Financial Measures, continued (dollars in thousands) 4Q19 3Q19 2Q19 1Q19 4Q18 Net income $ 151,684 135,726 156,184 120,186 105,070 Add: Income tax expense, net related to State Tax Reform — 4,402 — — — Add: Earnout liability adjustments — 10,457 — — — Subtract/add: Merger-related expense (913) 353 7,401 49,738 3,381 Add/subtract: Restructuring charges, net 1,259 (66) 18 19 140 Add: Valuation adjustment to Visa derivative 1,111 2,500 — — — Add: Loss on early extinguishment of debt, net — 4,592 — — — Add/subtract: Investment securities losses (gains), net 2,157 3,731 1,845 (75) — Subtract/add: Gain on sale and (increase) decrease in fair value of private equity investments, net (8,100) (1,194) (1,455) (858) 2,084 Add/subtract: Tax effects of adjustments 1,162 (2,478) (1,951) (5,705) (523) Adjusted net income $ 148,360 158,023 162,042 163,305 110,152 Net income annualized $ 601,790 538,478 626,452 487,421 416,854 Adjusted net income annualized $ 588,602 626,939 649,949 662,293 437,016 Total average assets $47,459,405 47,211,026 46,679,769 45,794,621 32,190,303 Return on average assets 1.27 % 1.14 % 1.34 % 1.06 % 1.29 % Adjusted return on average assets 1.24 % 1.33 % 1.39 % 1.45 % 1.36 % 26

Non-GAAP Financial Measures, continued (dollars in thousands) 2019 2018 Net income $ 563,780 428,476 Add/subtract: Income tax expense (benefit), net related to State Tax Reform and SAB 118 4,402 (9,148) Add: Earnout liability adjustments 10,457 11,652 Add: Merger-related expense 56,580 10,065 Subtract: Litigation settlement/contingency expense — (4,026) Add/subtract: Restructuring charges, net 1,230 (51) Add: Valuation adjustment to Visa derivative 3,611 2,328 Add: Loss on early extinguishment of debt, net 4,592 — Add: Investment securities losses, net 7,659 1,296 Subtract/add: Gain on sale and (increase) decrease in fair value of private equity investments, net (11,607) 4,743 Subtract: Tax effects of adjustments (9,343) (1,008) Adjusted net income 631,361 444,327 Total average assets $ 46,791,930 31,668,847 Return on average assets 1.20 % 1.35 % Adjusted return on average assets 1.35 % 1.40 % 27
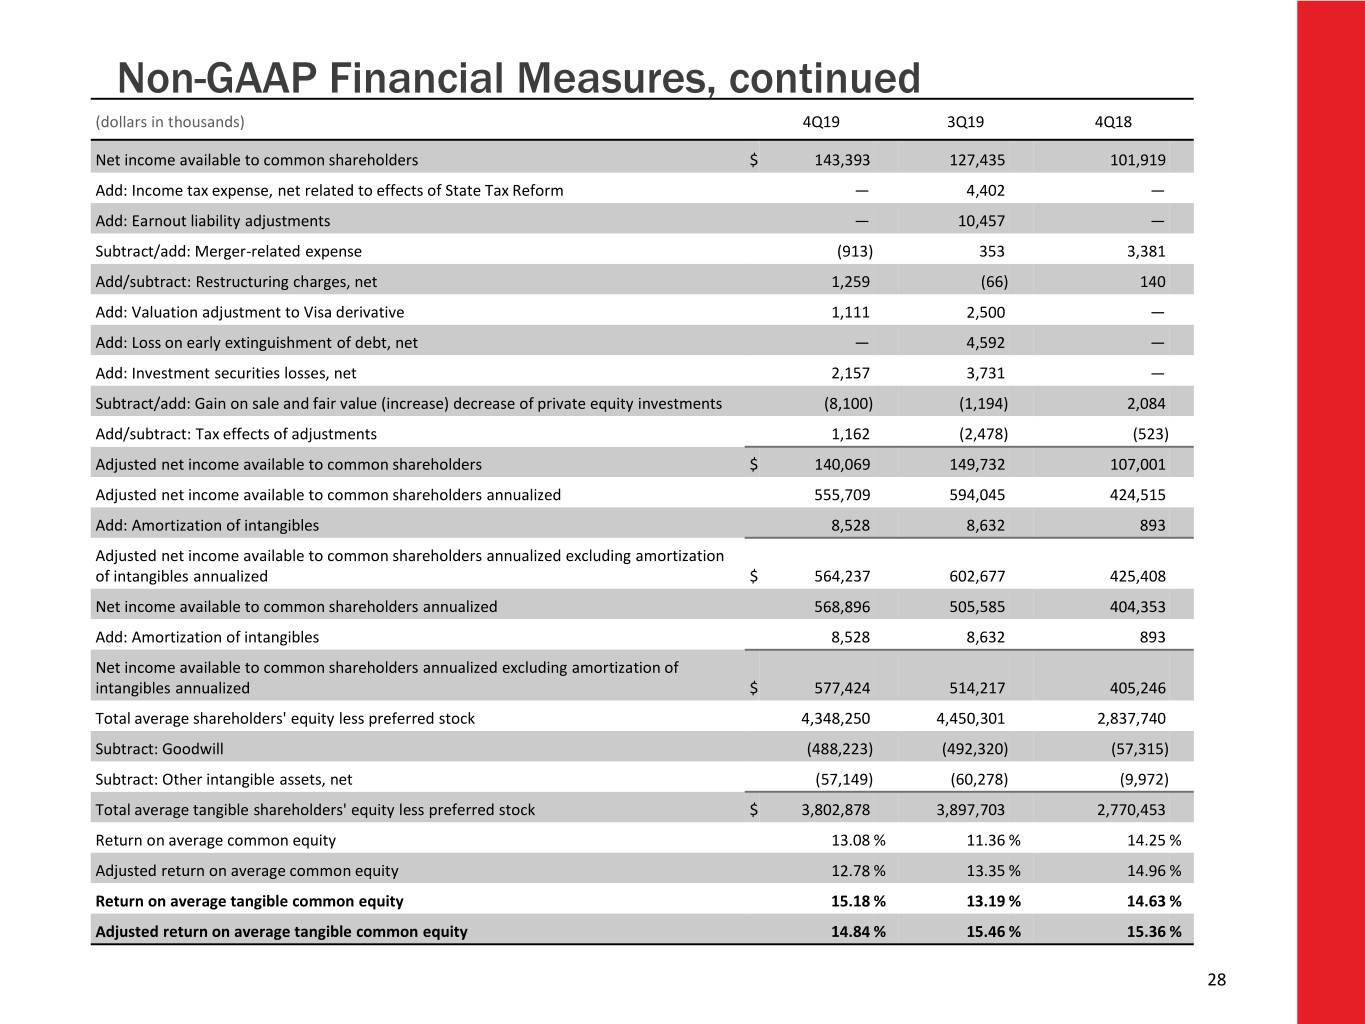
Non-GAAP Financial Measures, continued (dollars in thousands) 4Q19 3Q19 4Q18 Net income available to common shareholders $ 143,393 127,435 101,919 Add: Income tax expense, net related to effects of State Tax Reform — 4,402 — Add: Earnout liability adjustments — 10,457 — Subtract/add: Merger-related expense (913) 353 3,381 Add/subtract: Restructuring charges, net 1,259 (66) 140 Add: Valuation adjustment to Visa derivative 1,111 2,500 — Add: Loss on early extinguishment of debt, net — 4,592 — Add: Investment securities losses, net 2,157 3,731 — Subtract/add: Gain on sale and fair value (increase) decrease of private equity investments (8,100) (1,194) 2,084 Add/subtract: Tax effects of adjustments 1,162 (2,478) (523) Adjusted net income available to common shareholders $ 140,069 149,732 107,001 Adjusted net income available to common shareholders annualized 555,709 594,045 424,515 Add: Amortization of intangibles 8,528 8,632 893 Adjusted net income available to common shareholders annualized excluding amortization of intangibles annualized $ 564,237 602,677 425,408 Net income available to common shareholders annualized 568,896 505,585 404,353 Add: Amortization of intangibles 8,528 8,632 893 Net income available to common shareholders annualized excluding amortization of intangibles annualized $ 577,424 514,217 405,246 Total average shareholders' equity less preferred stock 4,348,250 4,450,301 2,837,740 Subtract: Goodwill (488,223) (492,320) (57,315) Subtract: Other intangible assets, net (57,149) (60,278) (9,972) Total average tangible shareholders' equity less preferred stock $ 3,802,878 3,897,703 2,770,453 Return on average common equity 13.08 % 11.36 % 14.25 % Adjusted return on average common equity 12.78 % 13.35 % 14.96 % Return on average tangible common equity 15.18 % 13.19 % 14.63 % Adjusted return on average tangible common equity 14.84 % 15.46 % 15.36 % 28

Non-GAAP Financial Measures, continued (dollars in thousands) 2019 2018 Net income available to common shareholders $ 540,899 410,478 Add/subtract: Income tax expense (benefit), net related to effects of State Tax Reform and SAB 118 4,402 (9,148) Add: Preferred stock redemption charge — 4,020 Add: Earnout liability adjustments 10,457 11,652 Add: Merger-related expense 56,580 10,065 Subtract: Litigation settlement/contingency expense — (4,026) Add/subtract: Restructuring charges, net 1,230 (51) Add: Valuation adjustment to Visa derivative 3,611 2,328 Add: Loss on early extinguishment of debt, net 4,592 — Add: Investment securities losses, net 7,659 1,296 Subtract/add: Gain on sale and fair value (increase) decrease of private equity investments (11,607) 4,743 Subtract: Tax effects of adjustments (9,343) (1,008) Adjusted net income available to common shareholders $ 608,480 430,349 Add: Amortization of intangibles 8,598 893 Adjusted net income available to common shareholders annualized excluding amortization of intangibles $ 617,078 431,242 Net income available to common shareholders 540,899 410,478 Add: Amortization of intangibles 8,598 893 Net income available to common shareholders annualized excluding amortization of intangibles $ 549,497 411,371 Total average shareholders' equity less preferred stock 4,384,458 2,821,311 Subtract: Goodwill (487,126) (57,315) Subtract: Other intangible assets, net (65,553) (10,424) Total average tangible shareholders' equity less preferred stock $ 3,831,779 2,753,572 Return on average common equity 12.34 % 14.55 % Adjusted return on average common equity 13.88 % 15.25 % Return on average tangible common equity 14.34 % 14.94 % Adjusted return on average tangible common equity 16.10 % 15.66 % 29

Non-GAAP Financial Measures, continued (dollars in thousands) 4Q19 3Q19 4Q18 Total non-interest income $ 97,955 88,760 67,991 Add: Investment securities losses, net 2,157 3,731 — Subtract/add: Gain on sale and fair value (increase) decrease of private equity investments (8,100) (1,194) 2,084 Adjusted non-interest income $ 92,012 91,297 70,075 (dollars in thousands) 4Q19 3Q19 2Q19 1Q19 4Q18 Total non-interest expense $ 266,121 276,310 264,126 292,410 209,922 Subtract: Earnout liability adjustments — (10,457) — — — Add/subtract: Merger-related expense 913 (353) (7,401) (49,738) (3,381) Subtract/add: Restructuring charges, net (1,259) 66 (18) (19) (140) Subtract: Valuation adjustment to Visa derivative (1,111) (2,500) — — — Subtract: Loss on early extinguishment of debt, net — (4,592) — — — Adjusted non-interest expense $ 264,664 258,474 256,707 242,653 206,401 (dollars in thousands) 4Q19 3Q19 2Q19 1Q19 4Q18 Adjusted non-interest expense $ 264,664 258,474 256,707 242,653 206,401 Subtract: Amortization of intangibles (2,901) (2,901) (2,410) (3,392) (292) Adjusted tangible non-interest expense $ 261,763 255,573 254,297 239,261 206,109 Net interest income 399,268 402,097 397,262 397,175 297,933 Add: Tax equivalent adjustment 769 819 811 630 181 Add: Total non-interest income 97,955 88,760 89,807 79,378 67,991 Total FTE revenues 497,992 491,676 487,880 477,183 366,105 Add/subtract: Investment securities losses (gains), net 2,157 3,731 1,845 (75) — Subtract/add: Gain on sale and (increase) decrease in fair value of private equity investments, net (8,100) (1,194) (1,455) (858) 2,084 Adjusted total revenues $ 492,049 494,213 488,270 476,250 368,189 Efficiency Ratio 53.44 % 56.20 % 54.14 % 61.28 % 57.34 % Adjusted tangible efficiency ratio 53.20 % 51.71 % 52.08 % 50.24 % 55.98 % 30

Non-GAAP Financial Measures, continued (dollars in thousands) 2019 2018 Total non-interest income $ 355,900 280,093 Add: Investment securities losses, net 7,659 1,296 Subtract/add: Gain on sale and fair value (increase) decrease of private equity investments (11,607) 4,743 Adjusted non-interest income $ 351,952 286,132 (dollars in thousands) 2019 2018 Total non-interest expense $ 1,098,968 829,455 Subtract: Earnout liability adjustments (10,457) (11,652) Subtract: Merger-related expense (56,580) (10,065) Add: Litigation settlement/contingency expense — 4,026 Subtract/add: Restructuring charges, net (1,230) 51 Subtract: Valuation adjustment to Visa derivative (3,611) (2,328) Subtract: Loss on early extinguishment of debt, net (4,592) — Adjusted non-interest expense $ 1,022,498 809,487 (dollars in thousands) 2019 2018 Adjusted non-interest expense $ 1,022,498 809,487 Subtract: Amortization of intangibles (11,603) (1,167) Adjusted tangible non-interest expense $ 1,010,895 808,320 Net interest income 1,595,803 1,148,413 Add: Tax equivalent adjustment 3,025 553 Add: Total non-interest income 355,900 280,093 Total FTE revenues 1,954,728 1,429,059 Add/subtract: Investment securities losses (gains), net 7,659 1,296 Subtract/add: Gain on sale and (increase) decrease in fair value of private equity investments, net (11,607) 4,743 Adjusted total revenues $ 1,950,780 1,435,098 Efficiency Ratio 56.22 % 58.04 % Adjusted tangible efficiency ratio 51.82 % 56.33 % 31

Non-GAAP Financial Measures, continued December 31, September 30, June 30, March 31, December 31, (dollars in thousands) 2019 2019 2019 2019 2018 Total assets $ 48,203,282 47,661,182 47,318,203 46,630,025 32,669,192 Subtract: Goodwill (497,267) (487,865) (492,390) (485,000) (57,315) Subtract: Other intangible assets, net (55,671) (58,572) (61,473) (74,683) (9,875) Tangible assets $ 47,650,344 47,114,745 46,764,340 46,070,342 32,602,002 Total shareholders' equity 4,941,690 4,868,838 4,753,816 4,597,753 3,133,602 Subtract: Goodwill (497,267) (487,865) (492,390) (485,000) (57,315) Subtract: Other intangible assets, net (55,671) (58,572) (61,473) (74,683) (9,875) Subtract: Preferred Stock, no par value (537,145) (536,550) (195,140) (195,140) (195,140) Tangible common equity $ 3,851,607 3,785,851 4,004,813 3,842,930 2,871,272 Total shareholders' equity to total assets ratio 10.25 % 10.22 % 10.05 % 9.86 % 9.59 % Tangible common equity ratio 8.08 % 8.04 % 8.56 % 8.34 % 8.81 % 32
