Attached files
| file | filename |
|---|---|
| 8-K - FORM 8-K - GTY Technology Holdings Inc. | tm203337d1_8k.htm |
Exhibit 99.1

GTY Technology The preeminent SaaS Solution Provider to the North American Public Sector Steve Rohleder, Chairman and CEO John Curran, CFO Needham Growth Conference January 14, 2020
Forward Looking Statements This presentation includes “forward - looking statements” within the meaning of the “safe harbor” provisions of the Private Securi ties Litigation Reform Act of 1995. The company’s actual results may differ from its expectations, estimates and projections and, con sequently, you should not rely on these forward - looking statements as predictions of future events. Words such as “expect,” “estimate,” “pr oject,” “budget,” “forecast,” “anticipate,” “intend,” “plan,” “may,” “will,” “could,” “should,” “believes,” “predicts,” “potential,” “co ntinue,” and similar expressions are intended to identify such forward - looking statements. These forward - looking statements include, without limitation, the company’s expectations with respect to future performance and anticipated impacts of the business combination . T hese forward - looking statements involve significant risks and uncertainties that could cause the actual results to differ materially from the expected results. Most of these factors are outside of the company’s control and are difficult to predict. Factors that may c aus e such differences include, but are not limited to: (1) the risk that the business combination disrupts current plans and operations ; ( 2) the ability to recognize the anticipated benefits of the business combination, which may be affected by, among other things, competition, th e a bility of the company to grow and manage growth profitably and retain its key employees; (3) costs related to the business combination; (4 ) the outcome of the New York and California lawsuits among the company, OpenGov , Inc. and the other parties thereto, as well as any other legal proceedings that may be instituted against the company in connection with the business combination; (5) changes in appl ica ble laws or regulations; (6) the possibility that the company may be adversely affected by other economic, business, and/or competitiv e f actors; (7) any government shutdown which impacts the ability of the company’s customers to purchase its products and services; and (8) o the r risks and uncertainties included in the company’s prospectus on Form 424B4 filed with the SEC on June 6, 2019, including those unde r “ Risk Factors” therein, and in the company’s other filings with the SEC. We caution you that the foregoing list of factors is not e xcl usive, and readers should not place undue reliance upon any forward - looking statements, which speak only as of the date made. We do not und ertake or accept any obligation or undertaking to release publicly any updates or revisions to any forward - looking statements to reflec t any change in our expectations or any change in events, conditions or circumstances on which any such statement is based. 2

OPPORTUNITY: DIGITIZING STATE & LOCAL GOVERNMENT Drivers of Change: 1. Citizen demand for a modern, user - friendly, digital experience. 2. Demographics of a retiring workforce replaced by the digital native workforce. 3. Availability of technical solutions and business models that are friendly to the public sector. State & Local Market Metrics: • Nearly 10% of US GDP • $3.25 Trillion in annual spending • 20 million employees • Over 90,000 distinct entities Source: e.Republic GovTech Navigator 3

The Problem: Government Software Today A local government operates like dozens of separate businesses. Each agency has its own technology and means of engaging the public. Lost Funding Opportunities and Isolated Purchasing Decisions Multiple citizen engagement points = poor customer satisfaction, high costs and lost revenue Siloed Budgeting and poor transparency … ? 4

Who is GTY Technology • Native SaaS/Cloud software company targeting North American State & Local Governments • High growth, highly recurring revenue business model • Serving a large, highly fragmented and underpenetrated market from a position of trust • Best of breed product solutions complimenting the existing ecosystem 5
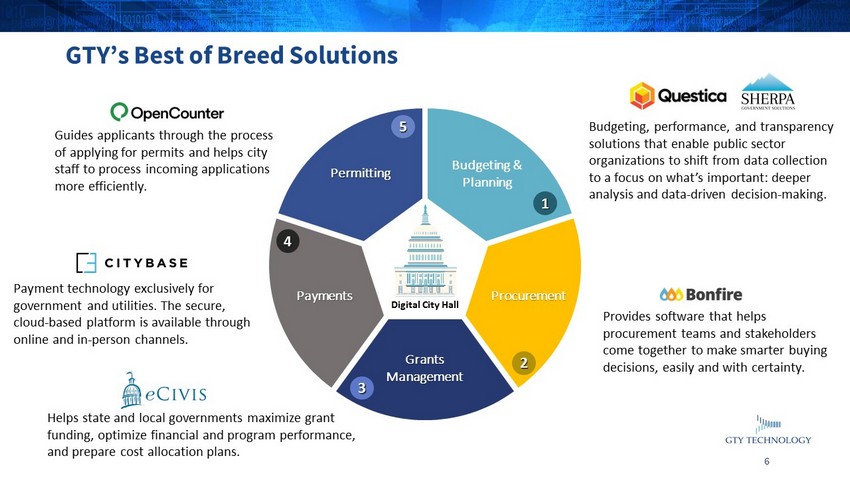
Staff 1 2 3 4 5 Permitting Grants Management Budgeting & Planning Payments Procurement Guides applicants through the process of applying for permits and helps city staff to process incoming applications more efficiently. Payment technology exclusively for government and utilities. The secure, cloud - based platform is available through online and in - person channels. Helps state and local governments maximize grant funding, optimize financial and program performance, and prepare cost allocation plans. GTY’s Best of Breed Solutions Budgeting, performance, and transparency solutions that enable public sector organizations to shift from data collection to a focus on what’s important: deeper analysis and data - driven decision - making. Provides software that helps procurement teams and stakeholders come together to make smarter buying decisions, easily and with certainty. Digital City Hall 6

Direct Sales Force • Enterprise • Mid - Market MARKETING AND SALES STRATEGY $18B Applications and vertical specific software (1) (1) Source: Gartner – Local & Regional Government and Primary & Secondary Education spending on applications and vertical specific software Partner Ecosystem • Technology Providers • Consulting Firms • Channel Partners 7

GTY Technology Leadership Team Corry Flatt Procurement Public Sector Experience: 10 Years Michael Duffy Payments Public Sector Experience: 6 Years James Ha Grants Management Public Sector Experience: 10 Years TJ Parass Budgeting & Transparency Public Sector Experience: 17 Years David Farrell Budgeting & Transparency Public Sector Experience: 20 Years Joel Mahoney Permitting Public Sector Experience: 8 Years Executive Leadership with Deep Operating and Financial Experience Operating and Product Leadership with Decades of Public Sector Experience John Curran Chief Financial Officer Experience: 24 years in high growth technology companies Suzanne Barth Chief Human Resource Officer Experience: over 20 years in Human Resources Andrew Kopans General Counsel Experience: 16 years as an attorney John Albanese EVP of Sales Experience: 25 Years In Technology Sales Leadership Stephen Rohleder Chairman and CEO Experience: 23 Years as Accenture Operating Partner 8
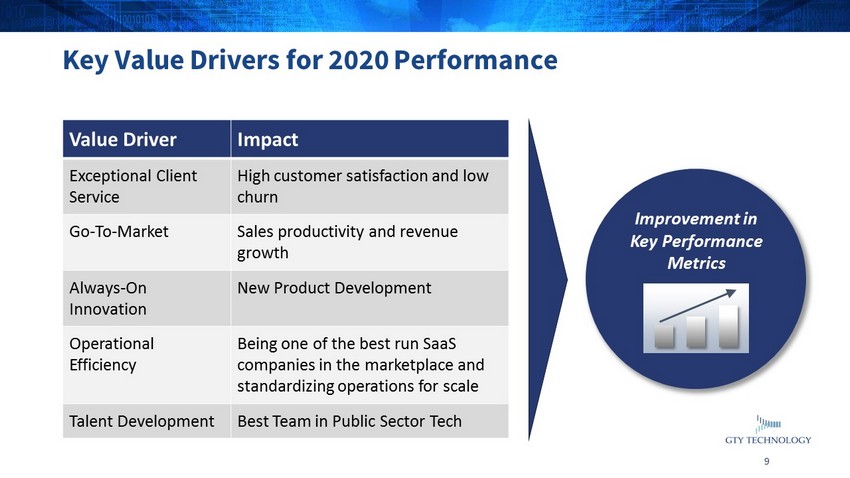
Key Value Drivers for 2020 Performance Improvement in Key Performance Metrics Value Driver Impact Exceptional Client Service High customer satisfaction and low churn Go - To - Market Sales productivity and revenue growth Always - On Innovation N ew Product Development Operational Efficiency Being one of the best run SaaS companies in the marketplace and standardizing operations for scale Talent Development Best Team in Public Sector Tech 9
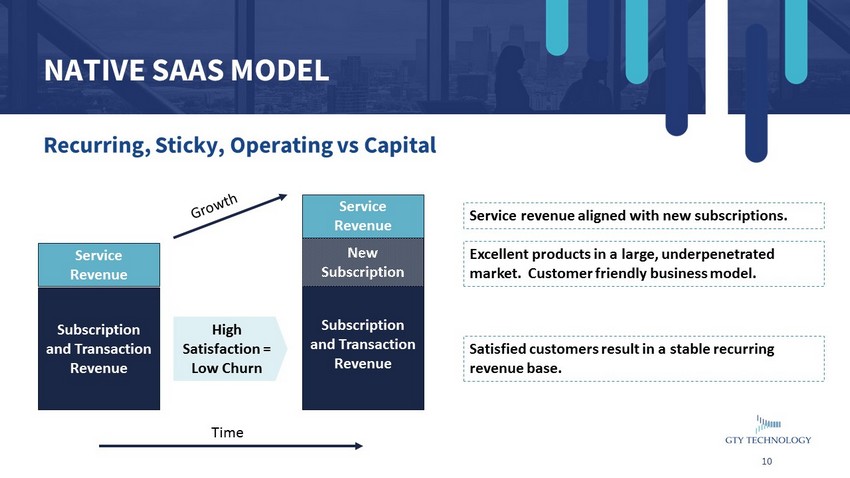
Recurring, Sticky, Operating vs Capital NATIVE SAAS MODEL Satisfied customers result in a stable recurring revenue base. Subscription and Transaction Revenue Service Revenue Subscription and Transaction Revenue Service Revenue New Subscription Time High Satisfaction = Low Churn Excellent products in a large, underpenetrated market. Customer friendly business model. Service revenue aligned with new subscriptions. 10

Track Record of Growth $6.8 $6.6 $7.6 $8.7 $8.8 $9.9 $9.8 $0.0 $2.0 $4.0 $6.0 $8.0 $10.0 $12.0 Q1 2018 (P) Q2 2018 (P) Q3 2018 (P) Q4 2018 (P) Q1 2019 (P) Q2 2019 Q3 2019 Millions Non - GAAP Revenue (1) Revenue for the first 9 months of 2019 grew by 36% when compared to the first 9 months of 2018 (1) See appendix for GAAP to non - GAAP reconciliation (P) See appendix for presentation of predecessor and successor revenue results 11

2020 Outlook Major Headlines • Non - GAAP revenues to be between $57M and $63M (1) • Growing subscription base with ARR growing faster than revenue • Operating leverage as we scale • Improving EBITDA and Free Cash Flow performance (1) 2020 values are based on Company estimates. See appendix for GAAP to non - GAAP reconciliation 12

Year in Review THE STORIES GTY Momentum Strong Customer Demand • Enterprise wins in budget space • Market momentum with FundMax #6 Read the Full Story -https://www.govtech.com/biz/GTY-Completes-6-Company-Gov-Tech-Merger-Trades-on-Nasdaq.html Expansion of Partner Ecosystem • Strong interest from both Professional Service and Technology partners Customer Satisfaction and Retention • Low churn rates and positive net dollar churn • High net promoter scores and willing references Market Recognition • GovTech 100 13

• Demand growing for Digitization of the North America Public Sector market • Trusted partner providing best of breed point solutions using a native SaaS model • Multi - Channel Go - To - Market Strategy 14

Appendix 15

Presentation of Predecessor and Successor Revenue Results As a result of the business combination on February 18, 2019, GTY is the acquirer for accounting purposes and Bonfire, CityBase , eCivis , Open Counter, Questica , and Sherpa are the acquirees and accounting predecessor. The company’s financial statement presentation distinguishes the company’s presentations into two distinct periods, the period up to the closing date (labeled “Predecessor”) and the period including and after that date (labeled “Successor”). The merger was accounted for as a business combination using the acquisition method of accounting, and the Successor financial statements reflect a new basis of accounting that is based on the fair value of the net assets acquired. Non - GAAP Revenues . Non - GAAP revenues are defined as GAAP revenues adjusted for the impact of purchase accounting resulting from its business combination which reduced its acquired contract liabilities to fair value. The company believes that presenting non - GAAP revenues is useful to investors as it eliminates the impact of the purchase accounting adjustments to revenues to allow for a direct comparison between periods. 16

GAAP and non - GAAP Historical Revenues by Quarter Q1 2018 Q2 2018 Q3 2018 Q4 2018 Q1 2019 Q2 2019 Q3 2019 Revenues – Predecessor Period $6.8 $6.6 $7.6 $8.7 $4.9 - - Revenues – Successor Period - - - - $3.0 $8.2 $8.8 Pro forma as Adjusted Revenues $6.8 $6.6 $7.6 $8.7 $7.9 $8.2 $8.8 Purchase accounting adjustment to revenue - - - - $0.9 $1.7 $1.0 Non - GAAP Pro forma as adjusted revenue $6.8 $6.6 $7.6 $8.7 $8.8 $9.9 $9.8 17
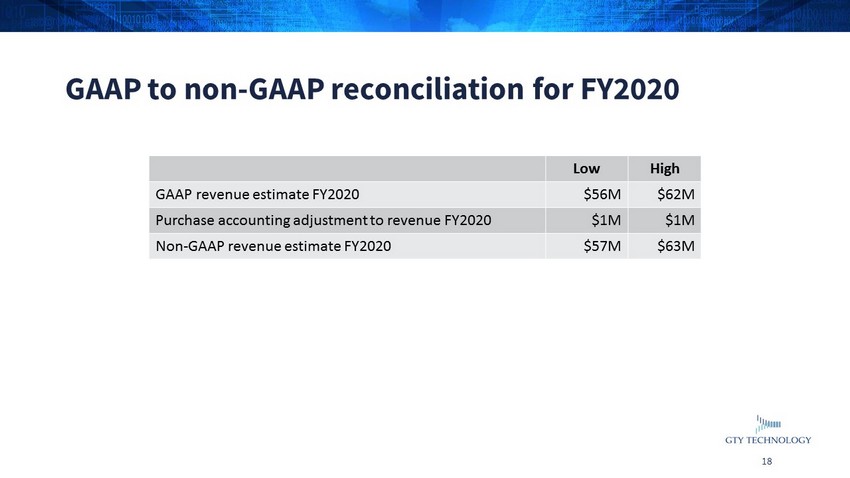
GAAP to non - GAAP reconciliation for FY2020 Low High GAAP revenue estimate FY2020 $56M $62M Purchase accounting adjustment to revenue FY2020 $1M $1M Non - GAAP revenue estimate FY2020 $57M $63M 18