Attached files
| file | filename |
|---|---|
| 8-K - 8-K - Riley Exploration Permian, Inc. | form8k.htm |
Exhibit 99.1

Annual Shareholders MeetingDecember 13, 2019 TENGASCO, INC. 1
Annual Shareholders Meeting – December 13, 2019Outline of Presentation Directors and OfficersForward
Looking StatementsSignificant Activities Since The Last Shareholders MeetingCapital Spending and Drilling ResultsOil PricesProductionFinancial ReviewNine months ended September 30, 2019 and 2018Year ended December 31, 2018 and 2017Results of
VotingShareholder Questions 2

Annual Shareholders Meeting – December 11, 2018Directors and Officers Peter SalasDirector, Chairman of
the BoardElected to the Board in 2002 and as Chairman of the Board in 2004Matt BehrentDirector, Chairman of the Audit Committee, member of the Compensation CommitteeElected to the Board in 2007Rich ThonDirector, Chairman of the Compensation
Committee, member of the Audit Committee, Elected to the Board in 2013Mike RugenCFO since 2009 and Interim CEO since 2013Cary SorensenVP, General Counsel, and Corporate Secretary since 1999 3

Forward Looking StatementsExcept for the historical information contained in this review, the matters
discussed in this presentation are forward-looking statements within the meaning of applicable securities laws, that are based upon current expectations. Important factors that could cause actual results to differ materially from those in the
forward-looking statements include risks inherent in drilling activities, the timing and extent of changes in commodity prices, unforeseen engineering and mechanical or technological difficulties in drilling wells, availability of drilling rigs
and other services, land issues, federal and state regulatory developments and other risks more fully described in the Company’s filings with the U.S. Securities and Exchange Commission (SEC). 4

Annual Shareholders Meeting – December 13, 2019Significant Activities Since The Last Shareholders
Meeting Continued to evaluate opportunities (primarily in Kansas, Oklahoma, New Mexico, and Texas)Current inventoryCorporateAcquisition of producing propertiesAcreageNon-operated opportunitiesDrilled one well – in the process of being
completed as a producerParticipated in acquisition of acreage (960 gross, 240 net)Operated opportunitiesDrilled two wells – one dry, one in the process of being completed as a producerAlthough we continue evaluating several opportunities, no
agreements have been entered into by the Company to move forward with any of the opportunities currently under evaluationCash position and credit facilityApproximately $3.1 million cash balance at 12/13/2019Borrowing Base: $3.0 million
(12/11/2018); $4.0 million (7/22/2019)Credit Limit based on EBITDA covenant: $2.74 million (12/11/2018); $3.8 million (7/22/2019); $1.97 million (11/20/2019)$0 drawn at 12/13/2019 5
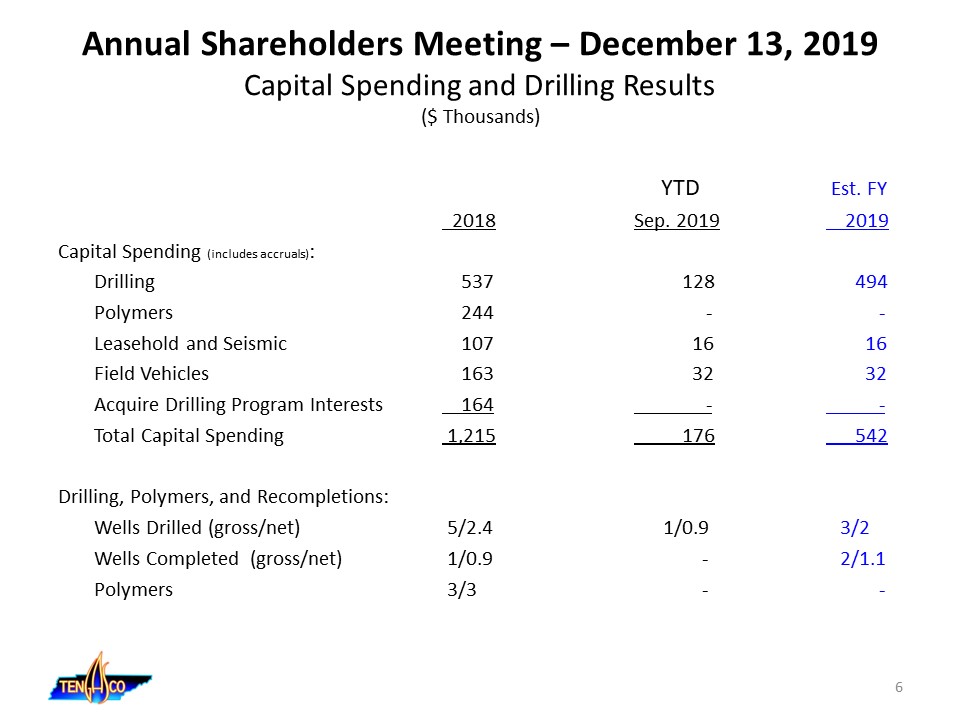
Annual Shareholders Meeting – December 13, 2019Capital Spending and Drilling Results($ Thousands) YTD
Est. FY 2018 Sep. 2019 2019Capital Spending (includes accruals): Drilling 537 128 494 Polymers 244 - - Leasehold and Seismic 107 16 16 Field Vehicles 163 32 32 Acquire Drilling Program Interests 164 - - Total Capital Spending 1,215 176
542Drilling, Polymers, and Recompletions: Wells Drilled (gross/net) 5/2.4 1/0.9 3/2 Wells Completed (gross/net) 1/0.9 - 2/1.1 Polymers 3/3 - - 6
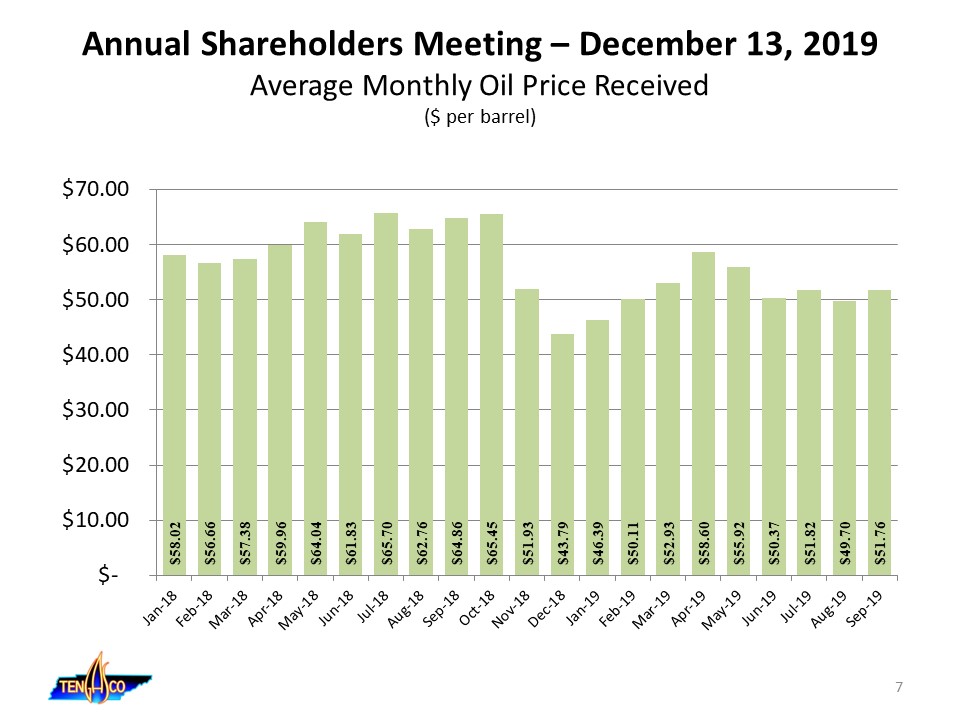
Annual Shareholders Meeting – December 13, 2019Average Monthly Oil Price Received($ per barrel) 7

Annual Shareholders Meeting – December 13, 2019Average Daily Gross Operated Production For Selected
Months(Barrels of Oil Per Day) 8

Annual Shareholders Meeting – December 13, 2019Financial Summary – Continuing Operations($ Thousands,
except per share data, sales volumes, and price per barrel) 9 Months Ended September 30, * 2019 2018 Change Percent Revenues 3,777 4,497 (720) (16.0)%Production cost and taxes (2,604) (2,502) (102) (4.1)%DD&A (566) (599) 33 5.5%General
& administrative (913) (896) (17) (1.9)%Net income from operations (306) 500 (806) (161.2)%Interest expense (8) (4) (4) 100.0%Gain on sale of assets 45 34 11 32.4%Tax expense - - - 0.0%Net income (loss) (269) 530 (799) (150.8)%Net income
(loss) per share – Basic and Diluted $ (0.03) $ 0.05 $ (0.08) (160.0)%Net Sales Volumes (MBbl) 72.1 73.0 (0.9) (1.2)%Oil Price ($/Bbl) $ 52.09 $ 61.27 $ (9.18) (15.0)%Production cost and taxes ($/Bbl – using net sales volumes) $ (32.94) $
(34.28) $ 1.34 3.9%* Operating results for the nine months ended September 30, 2019 are not necessarily indicative of the results that may be expected for the year ended December 31, 2019. 9

Annual Shareholders Meeting – December 13, 2019Financial Summary – Continuing Operations($ Thousands,
except per share data, sales volumes, and price per barrel) Year Ended December 31, 2018 2017 Change PercentRevenues 5,871 4,683 1,188 25.4%Production cost and taxes (3,591) (3,444) (147) (4.2)%DD&A (795) (862) 67 7.8%General &
administrative (1,245) (1,171) (74) (6.3)%Net income from operations 240 (794) 1,034 130.2%Interest expense (5) (53) 48 90.6%Gain on sale of assets 33 2 31 1,550.0%Other income 157 - 157 N/ATax benefit (expense) 17 242 (225) (93.0)%Net income
(loss) 442 (603) 1,045 173.3% Net income (loss) per share – Basic and Diluted $ 0.04 $ (0.06) $ 0.10 166.7% Net Sales Volumes (MBbl) 98.2 102.4 (4.2) (4.1)%Oil Price ($/Bbl) $ 59.48 $ 45.43 $ 14.05 30.9% 10
Annual Shareholders Meeting – December 13, 2019 The Company’s management and Board of Directors thank
all our employees and their families for their dedication and contribution to Tengasco. We also thank the shareholders for your continued support. We hope to see you again next year at our Shareholder Meeting in 2020 11

Annual Shareholders Meeting – December 13, 2019 Results of Voting 12
Annual Shareholders Meeting – December 13, 2019 Shareholder Questions to ManagementPlease state your
name, confirm you are a shareholder of the Company, and direct your questions to Mike Rugen. 13