Attached files
| file | filename |
|---|---|
| EX-32 - Coda Octopus Group, Inc. | ex32.htm |
| EX-31.1 - Coda Octopus Group, Inc. | ex31-1.htm |
UNITED STATES
SECURITIES AND EXCHANGE COMMISSION
WASHINGTON, D.C. 20549
FORM 10-K
[X] ANNUAL REPORT UNDER SECTION 13 OR 15(d) OF THE SECURITIES EXCHANGE ACT OF 1934
For the fiscal year ended October 31, 2018
[ ] TRANSITION REPORT UNDER SECTION 13 OR 15(d) OF THE SECURITIES EXCHANGE ACT OF 1934
Commission file number: 001-38154
CODA OCTOPUS GROUP, INC.
(Exact name of registrant as specified in its charter)
| Delaware | 34-200-8348 | |
| (State or other jurisdiction of | (I.R.S. Employer | |
| incorporation or organization) | Identification Number) |
9100 Conroy Windermere Road, Suite 200, Windermere, Florida, 34786
(Address, Including Zip Code of Principal Executive Offices)
(801) 456-8684
(Issuer’s telephone number)
Securities registered under Section 12(b) of the Exchange Act:
COMMON STOCK, $0.001 PAR VALUE PER SHARE
Securities registered under Section 12(g) of the Exchange Act:
NONE
| ● | Indicate by check mark if the registrant is a well-known seasoned issuer, as defined in Rule 405 of the Securities Act. Yes [ ] No [X] |
| ● | Indicate by check mark if the registrant is not required to file reports pursuant to Section 13 or Section 15(d) of the Act. Yes [ ] No [X] |
| ● | Indicate by check mark whether the registrant (1) has filed all reports required to be filed by Section 13 or 15(d) of the Exchange Act during the past 12 months (or for such shorter period that the registrant was required to file such reports), and (2) has been subject to such filing requirements for the past 90 days. Yes [X] No [ ] |
| ● | Indicate by check mark if disclosure of delinquent filers pursuant to Item 405 of Regulation S-K (229.405 of this chapter) is not contained herein, and will not be contained, to the best of registrant’s knowledge, in definitive proxy or information statements incorporated by reference in Part III of this Form 10-K or any amendment to this Form 10-K. [ ] |
| ● | Indicate by check mark whether the registrant is a large accelerated filer, an accelerated filer, or a non-accelerated filer or a smaller reporting company. |
| Large accelerated filer [ ] | Accelerated filer [ ] | |
| Non-accelerated filer [ ] | Smaller reporting company [X] |
| ● | Indicate by check mark whether the registrant is a shell company (as defined in Rule 12b-2 of the Act). Yes [ ] No [X] |
| ● | State issuer’s revenues for its most recent fiscal year: $18,019,429 |
| ● | State the aggregate market value of the voting and non-voting common equity held by non-affiliates computed by reference to the price at which the common equity was last sold, or the average bid and asked price of such common equity, as of April 30, 2018, representing the last business day of the registrant’s most recently completed second fiscal quarter: approximately $12,973,000. |
| ● | State the number of shares outstanding of each of the issuer’s classes of common equity, as of the latest practicable date: 10,664,381 as of February 1, 2019. |
TABLE OF CONTENTS
| 2 |
FORWARD-LOOKING STATEMENTS
This Form 10-K includes forward-looking statements within the meaning of Section 27A of the Securities Act of 1933, as amended, which we refer to in this annual report as the Securities Act, and Section 21E of the Securities Exchange Act of 1934, as amended, which we refer to in this annual report as the Exchange Act. Forward-looking statements are not statements of historical fact but rather reflect our current expectations, estimates and predictions about future results and events. These statements may use words such as “anticipate,” “believe,” “estimate,” “expect,” “intend,” “predict,” “project” and similar expressions as they relate to us or our management. When we make forward-looking statements, we are basing them on our management’s beliefs and assumptions, using information currently available to us. These forward-looking statements are subject to risks, uncertainties and assumptions, including but not limited to, risks, uncertainties and assumptions discussed in this annual report. Factors that can cause or contribute to these differences include those described under the heading “Management’s Discussion and Analysis of Financial Condition and Results of Operations.”
If one or more of these or other risks or uncertainties materialize, or if our underlying assumptions prove to be incorrect, actual results may vary materially from what we projected. Any forward-looking statement you read in this annual report reflects our current views with respect to future events and is subject to these and other risks, uncertainties and assumptions relating to our operations, results of operations, growth strategy and liquidity. All subsequent written and oral forward-looking statements attributable to us, or individuals acting on our behalf are expressly qualified in their entirety by this paragraph. You should specifically consider the factors identified in this annual report, which would cause actual results to differ before making an investment decision. We are under no duty to update any of the forward-looking statements after the date of this annual report or to conform these statements to actual results.
| 3 |
Overview
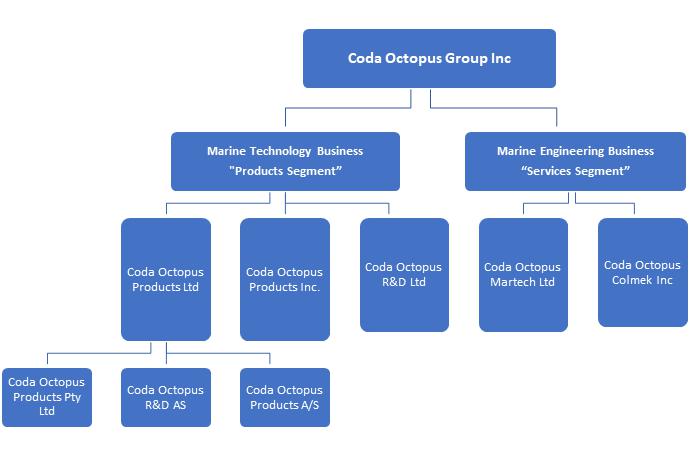
Coda Octopus Group, Inc. (“Coda,” “the Company,” or “we”) designs, and manufactures products for the subsea market including its patented flagship range of real time 3D sonar solutions (“Products Segment”). The Company also supplies engineering services. A significant part of the customer base for our engineering services comprise prime defense contractors (“Services Segment” or “Marine Engineering Business”).
The Products Segment has been designing, manufacturing and selling products to the subsea market for close to 25 years. These products are used primarily in the underwater construction market, the offshore wind energy industry, oil and gas exploration, complex dredging, port and harbor security, defense, mining of gems and deep-sea minerals and marine sciences sectors. Our customers include service providers to major oil and gas companies, law enforcement agencies, government bodies (including maritime and navy organizations), ports, mining companies, underwater construction companies, defense companies and bodies, universities and research institutions. Our sales are conducted primarily in the US and the UK directly through our wholly owned subsidiaries and through our global network of independent agents and/or distributors. The Product Segments also includes a rental model under which it rents or leases its products with or without specialist engineering services, depending on our customers’ requirements.
The Services Segment supplies engineering services primarily to prime defense contractors. The parts engineered and supplied to these customers form part of broader mission critical integrated defense systems, such as the Close-In-Weapons System (CIWS). The Services Segment established its business in 1977 and has been supporting a number of significant defense programs for over 30 years, including Raytheon’s CIWS and Northrop Grumman’s Mine Hunting Systems Program. The Services Segment’s business model entails designing small runs of prototypes for defense programs which typically lead to contracts for the manufacture, repair and upgrade of these parts. This business model ensures recurring and long tail revenues since we supply parts to these programs typically for the life of the program. The Services Segment operates through our wholly owned subsidiaries, Coda Octopus Colmek, Inc. (“Colmek”) based in Salt Lake City, Utah, and Coda Octopus Martech Limited (“Martech”) based in the United Kingdom
Our corporate structure is as follows:
Corporate History
The Company began as Coda Technologies Limited. This company now operates under the name Coda Octopus Products Limited, a United Kingdom corporation formed in 1994 as a start-up company with its origins as a research group at Herriot-Watt University, Edinburgh, Scotland. Initially, its operations consisted primarily of developing software for subsea mapping and visualization using sidescan sonar (a technology widely used in commercial offshore geophysical survey and naval mine-hunting to detect objects on, and textures of, the surface of the seabed).
| 4 |
In June 2002, we acquired Octopus Marine Systems Ltd, a UK corporation, and changed our name to Coda Octopus Limited. At the time of its acquisition, Octopus Marine Systems was producing geophysical products broadly similar to those of Coda, but targeted at the less sophisticated, easy-to-use, “work-horse” market. The Octopus Marine Systems acquisition led to the introduction of the Motion product (F180® series) into the Products Segment.
In December 2002, Coda Octopus Ltd acquired OmniTech AS, a Norwegian company, which became a wholly owned subsidiary of the Company. This company now operates under the name Coda Octopus R&D AS. OmniTech owned the patents to a “method for producing a 3-D Image”. At the time of acquisition, this company had been engaged for over ten years in developing a revolutionary imaging and visualization sonar technology capable of producing real time three-dimensional (“3D”) underwater images for use in subsea activities. Coda Octopus Products Limited (Edinburgh) then developed the visualization software to control and display the images from the real time 3D sonar. This patented technology is now marketed by us under the name “Echoscope®”. We believe that this technology is superior to the other imaging sonars in the market as it generates real time 3D images of the underwater environment irrespective of low or zero visibility conditions and, unlike conventional sonars, can image a volume (as opposed to a slice of data) including moving objects subsea. This technology is covered by patents in a number of jurisdictions, including the USA. Currently, a substantial part of our R&D efforts is focused on further innovation and development of this technology. Some of the discriminators of this technology can be found in the table set out in the section below titled “Real Time 3D Sonar”. Coda Octopus R&D AS is now a dormant entity and all of its business activities (research and manufacturing) have been transferred to our Edinburgh based subsidiary (Coda Octopus Products Limited).
The acquisition of OmniTech AS allowed the Company to expand its business activities to include the high-end sonar imaging and hydrographic survey markets. At the inception of the Marine Technology Business our revenues were generated solely from our geophysical software product. We subsequently added our motion sensors product (F180® series) in 2002 and our revenues were split over these two products. Revenues from our Products Segment are now mainly generated from our real time 3D sonar products including accessories and associated services.
On July 13, 2004, the Company effected a reverse merger pursuant to the terms of a share exchange agreement between The Panda Project, Inc. (“Panda”), a Florida corporation, and a now defunct entity affiliated with Coda Octopus Ltd. (“Coda Parent”). Panda acquired the shares of Coda Octopus Limited, a UK corporation and wholly-owned subsidiary of Coda Parent, in consideration for the issuance of a total of 1,432,143 shares of common stock to Coda Parent and other shareholders of Coda Octopus Limited. The shares issued represented approximately 90.9% of the issued and outstanding shares of Panda. The share exchange was accounted for as a reverse acquisition of Panda by Coda. Subsequently, Panda was reincorporated in Delaware and changed its name to Coda Octopus Group, Inc.
In June 2006, we acquired a UK design and engineering company, Martech Systems (Weymouth) Ltd (“Martech”), an English corporation established in 1988, which provides bespoke engineering solutions in the fields of electronic data acquisition, transmission and recording. Martech are suppliers to prime defense contractors, among others. It also supports some of the engineering and development requirements of the Products Segment. Martech changed its name to Coda Octopus Martech Limited in December 2008. This company is part of our Services Segment.
In April 2007, we acquired Colmek (then Miller & Hilton Inc. d/b/a Colmek), a Utah corporation established in 1977 and which is custom engineering service provider of mission critical integrated systems to defense engineering prime contractors where a high level of reliability and quality is required. Colmek has been supporting a number of defense programs since the early 1990’s. Specifically, it supplies proprietary parts including providing upgrades to such parts to address either obsolescence issues or advancement in technology. This entity changed its name to Coda Octopus Colmek Inc. in December 2008. This company is part of our Services Segment.
Both Martech and Colmek have the same business model, provide similar engineering services and sells to similar customer base (one is UK focused and the other is US focused).
In January 2017, we effectuated a one for fourteen reverse split of our issued and outstanding common stock. Throughout this document, all share numbers have been adjusted for the reverse stock split and represented on this basis.
Coda Octopus Group, Inc., is organized under the laws of the State of Delaware as a holding company that conducts its business through subsidiaries, several of which are organized under the laws of foreign jurisdictions, including England, Scotland, Norway, Denmark and Australia. This may have an adverse impact on the ability of U.S. investors to enforce a judgment obtained in U.S. courts against these entities, or to effect service of process on the officers and directors managing the foreign subsidiaries.
| 5 |
Marine Technology Business (“Products Segment”)
Our Marine Technology Business sells and rents proprietary marine products into various sectors including:
| ● | Commercial marine geophysical survey | |
| ● | Marine and port Construction | |
| ● | Offshore energy and renewables | |
| ● | Defense | |
| ● | Oil & gas | |
| ● | Security and law enforcement | |
| ● | Environmental applications (for example mammal research, natural gas seeps, habitat assessment, and fisheries) | |
| ● | Salvaging and decommissioning applications |
In the commercial marine geophysical survey sector, our products include geophysical data acquisition systems, analysis software and motion detection equipment that are used primarily by survey companies, research institutions and salvage companies.
We believe we possess an important and unique patented sonar technology based upon more than 20 years of research and development. This gives us a significant advantage over our competitors in the subsea imaging sonar market sectors. We believe that our real time 3D sonar products are revolutionizing the sonar market due to its unique capabilities, especially in the following areas:
| (A) | Real time three-dimensional visualization; | |
| (B) | Imaging of moving objects (such as blocks, mattresses, subsea structures or installations being placed or landed on the seabed, subsea vehicles, diver support or other objects); | |
| (C) | Imaging of complex subsea structures (imaging a volume as opposed to a slice of data); | |
| (D) | Providing situational awareness in real time to divers in low or zero visibility conditions; | |
| (E) | Real time threat identification and navigation and obstacle avoidance; | |
| (F) | Simultaneous mapping and imaging of moving objects using a single sensor; | |
| (G) | Imaging or visualizing subsea environments in low or zero visibility conditions; and | |
| (H) | Single sensor for multiple applications. |
Our product range includes equipment based on our patented Echoscope® technology and a range of complementary 3D accessories in combination with our proprietary software which also includes patented techniques for rendering and tracking.
Over the years, we have significantly advanced our research and development with respect to both hardware and software components of our real time 3D sonar technology and have filed further significant patents and have increased our market share for imaging sonars. Our third generation of products include the Echoscope® and other derivatives such as CodaOctopus® Underwater Inspection System (UIS), our forward-looking sonar, Dimension® and our Echoscope® C500 and more recently our Echoscope® XD variant.
At present we are focusing on developing our fourth generation (“4G”) and fifth generation (5G) real time 3D sonar solutions for various market applications and varying price points. Our 4G/5G products will be aimed at expanding our market share by introducing more applications-focused products. In respect of our 4G/5G of products, we are pursuing an 18 months’ roll out plan. In this connection, on January 16, 2018 we launched the first product within our 4G series of real time 3D sonars. This first product is approximately 50% lighter, 40% smaller and requires 30% less power than the 3G generation of products. This product is now marketed under the name of Echoscope4G® Surface and is a shallow water system (for deployments and applications not exceeding 20 meters water depth) and is more competitively priced. We believe this is a significant achievement as it potentially paves the way for more market applications for the technology and potentially increases our market share of imaging sonars. We are launching the deep-water variants within our 4G series in the first quarter of fiscal year 2019 and in second and third quarters we intend to launch the algorithm and software enhancements to our 4G/5G series and our new processing capability which is far superior to our 3G processing engine. This will be marketed under the name CodaOctopus® PIPE (Parallel Intelligent Processing Engine).
| 6 |
We believe that the development strategy and investments we are making in advancing our technology will help to standardize real time 3D solutions in the subsea market and grow the number of applications for this technology, particularly for defense applications. However, these are complex products and we can give no assurance that we will be successful in realizing commercially viable products or that we will not encounter technical glitches which may involve significant costs or other consequences or that our goals of increasing our market share will be realized.
We believe that our patented technology is superior to the current sonars on the market including the multibeam which is the standard technology, as it can generate real time 3D volumetric imaging data of underwater environments (including real time threat identification) and image moving objects in the water column even in the most challenging water conditions. This unique and superior capability provides unparalleled underwater scene awareness in high frame rates similar to cameras. The resultant scene data can be used for multiple tasks simultaneously including object detection and avoidance in true 3D, complex scene mapping and augmented reality 3D workspace imaging combining the real time 3D data with 3D models. This enables real time assessment and decision making. This technology is changing the work flow processes for a number of applications and delivering significant productivity gains and health and safety improvements, particularly in applications requiring imaging moving objects (either their placement or removal from the sea bed), conducting subsea operations in low or zero visibility conditions. This therefore prevents downtime (and the associated costs for such downtime) in these projects and providing real time 3D measurements. Some of our customers are reporting productivity gains of as much as 5000% in block placements for breakwater and other types of projects. Furthermore, our claims that our technology is superior to other sonar technology on the market were validated in a recent study done by the US Department of Transportation’s Federal Highway Administration under which our real time 3D sonar technology was assessed as best in its class for bridge inspections.
The Echoscope® has a wide range of applications including:
| ● | inspection of harbor walls; | |
| ● | inspection of ship hulls; | |
| ● | bridge inspections; | |
| ● | block placements (in the context of breakwater construction); | |
| ● | subsea asset placements including landings; | |
| ● | deep sea mineral mining and shallow water gem mining; | |
| ● | cable laying and cable pull in operations in offshore wind energy applications; | |
| ● | inspection of offshore installations such as gas and oil rigs and wind turbines; | |
| ● | obstacle avoidance including for Remotely Operated Vehicles; | |
| ● | Autonomous Underwater Vehicle (AUV) navigation and target recognition (obstacle avoidance); |
| 7 |
| ● | construction - pipeline touchdown placement and inspection; | |
| ● | bathymetry (measurement of water depth to create 3D terrain models); | |
| ● | managing underwater construction tasks; | |
| ● | underwater intruder detection; | |
| ● | contraband detection; | |
| ● | locating and identifying objects located underwater including mines; | |
| ● | detection and study of individual species in real time 3D (fish, whales etc.); | |
| ● | oil and gas leak detection; | |
| ● | fish school detection and analysis; | |
| ● | diver tracking and guidance; | |
| ● | underwater archaeological and salvage site mapping; | |
| ● | salvaging and decommissioning; | |
| ● | harbor construction – concrete armoring; and | |
| ● | unexploded ordinances survey and intervention. |
The technology enables real time 3D visualization of static scenes or moving objects from either a static location or a dynamically moving platform vessel (Autonomous Underwater Vehicle (“AUV”), Remotely Operated Vehicle (“ROV”)) or a surface vessel. Conventional sonars are capable of producing maps of static scenes only without the ability to image moving objects. A significant part of subsea activities consists of identifying moving objects including whether they may pose a threat.
The Echoscope® technology is protected by patents, including a number of complementary patents such as a patent which covers our visualization methodology and our rendering of real time 3D images. For example, one of our recently awarded patents provides for a new method of using multiple sonar images to produce in real time 3D a highly detailed image with sharply defined edges while intelligently discarding “noise” in the image produced by passing fish or floating debris. One of our main patents, “a method of producing a 3D image”, will expire June 1, 2019. However, in 2018 we filed a number of regular and also provisional patent applications, that, if granted, will afford significant protection around our products. Furthermore, despite the aforementioned method patent expiring we still have a number of significant patents around our real time 3D sonar series including our “volume rendering of 3D sonar data” and our “method of rendering volume representation of sonar images” and our recently granted patent “object tracking using sonar imaging” which sits at the heart of our method for generating a real time representative 3D image. Our technology is complex and is protected at both the hardware, algorithm and software level.
Sales and Marketing
We market the Echoscope® both as a stand-alone sonar device and as a fully integrated system. The fully integrated system is our premium product and is marketed under the name “CodaOctopus® UIS (Underwater Inspection System)”. This latter system is specifically aimed at the port security market and has been adopted by a significant number of ports in the United States. Since 2015 we built upon our success in selling in excess of 30 Underwater Inspection Systems to ports in the USA by selling a number of systems to an East Asian government agency for use in salvage operations and port and harbor inspection. Our 4G sonar products which is based on our new technology advancements are smaller, lighter, with less power requirements presents a new opportunity to introduce a new UIS with a lower price point, thus presenting the opportunity to increase the number of ports investing in this equipment.
| 8 |
We also lease our technology with associated services. Leased equipment is typically supplied with our expert engineers who either operate the equipment or train our customers. The rental option represents an increasingly important market and also provides access to the technology by a broader range of end users who typically prefer leasing over purchasing such as large oil and gas companies.
We have an internal sales and marketing team which is engaged in marketing and selling our products including our real time 3D sonar technology. We also have a network of independent global sales agents.
Products
Our products are marketed under the “CodaOctopus®” brand and consist of three main product lines:
| Data Acquisition Products includes integrated hardware acquisition devices which includes feature rich post-processing software for all levels of geophysical survey work, with which we commenced our operations in 1994. This device is typically used for the initial phase of oil and gas exploration. Our recently launched Survey Engine Automatic Object Detection (based on Artificial Intelligence techniques) is complementary to this product set. | |
| Motion Sensing Products consists of a range of GPS-aided precision attitude and positioning systems and software for all types of marine survey and positioning work and is also integrated with our premium product on the sonar side (CodaOctopus® Underwater Inspection System). | |
| Real Time 3D Sonar includes our unique and patented real time 3D imaging sonars (Echoscope®) and cutting-edge software (including patented methods for rendering and tracking) that we believe is shaping the future of subsea operations both within the commercial and defense sectors. We have a number of real time 3D sonar within our range of products which are sold for different applications and operated at different water depth levels. |
Real Time 3D Sonar
Our real time 3D imaging sonar technology generates most of the revenues for our Products Segment and we believe that it represents the Company’s most promising area for growth in the medium term. Some of the key differentiators of our technology compared to other imaging sonar technologies on the market are:
| No. | Description of Differentiator | |
| 1. | Real time 3D imaging sonar providing true first-person perspective visualization subsea; | |
| 2. | Real time 3D volumetric images of the underwater environment being imaged; | |
| 3. | Real time 3D volumetric images irrespective of low or zero visibility conditions prevailing at sea; | |
| 4. | Due to the shape of our beams which has width and height capability we can have almost 100% coverage of a subsea object/target with a single pass of the object/target being imaged. Current sonars in the market require multiple passes to be able to create a comprehensive image of the object or target – making this costly and inefficient; | |
| 5. | Real time 3D images of both moving objects and static volumetric scenes in the water. Conventional sonars, such as the multibeam, can only produce static images (mapping); | |
| 6. | No requirement for post-processing images generated by our technology (since it is a real time 3D imaging sonar) thus reducing the costs associated with these activities; | |
| 7. | Real time identification of threats including small target detection and visualizing moving projectiles and their targets in the water column. We can also accurately and repeatedly guide projectiles onto targets; | |
| 8. | Real time automated and manual 3D measurements of subsea objects and targets; | |
| 9. | Crisp and easy to interpret eidetic images of subsea target thereby deskilling many areas of work in the subsea environment by enabling persons without a hydrographic background to perform subsea tasks (such as law enforcement officers and crane operators); | |
| 10. | Real time image in any orientation including forward looking for obstacle and collision avoidance at sea; |
| 9 |
| 11. | Map complex underwater environments and structures with very high coverage confidence in a fast and efficient manner. Conventional sonars suffer from significant shadows when imaging complex structures; and | |
| 12. | Discern with greater degree of confidence real subsea targets versus subsea noise and other moving objects, such as fish, bubbles, gas etc. |
Our current third-generation product line consists of five products within the real time 3D sonar series:
| ● | Echoscope® rated at 300m, 600m, 3000m and 4000m; | |
| ● | Echoscope® C500 (launched in 2014); | |
| ● | Echoscope® XD (launched in January 2017); | |
| ● | Dimension® (launched in 2013); and | |
| ● | CodaOctopus® Underwater Inspection Systems (“UIS”). |
Our fourth-generation/fifth generation of products consist:
| ● | Echoscope4G® rated at 300m, 600m, 3000m and 4000m (these will be in the new form factor (smaller, lighter and require less power to operate)); | |
| ● | Echoscope4G®Surface rated at 20m; | |
| ● | Echoscope4G® C500 (300m, 3000m, and 4000m) | |
| ● | Echoscope4G® XD | |
| ● | Echoscope4G®C500 Surface (for autonomous surface vehicles) rated at 20m; and | |
| ● | CodaOctopus® Underwater Inspection Systems (“UIS”). |
Our products are used either by mounting on a surface vessel, cranes, excavators, underwater vessels such as remotely operated vehicles (ROV) or autonomous underwater vehicles (AUV), mining crawlers and the like or Autonomous Surface Vehicles (ASV). A brief description of our main line of products is set forth below. We offer many other similar products in various sizes with diverse capabilities.
Our 4G/5G of products are based on our new technological advancements and are smaller, lighter and have less power requirements. Once we launch our new algorithms and new software platform for our 4G/5G products, our 4G/5G products will also have better performance and capabilities.
Software Products
Our Software development capability is an important part of our success and forms an important part of our strategy to maintain our lead in designing, manufacturing and selling state-of-the-art real time 3D solutions.
Our software products are sold through a perpetual software license in combination with our real time 3D sonar solutions. During the first 12 months after purchase, the customer benefits from our technical support services. After the first year, ongoing technical support services may be purchased as an annual subscription service which entitles the customer to 24x7x365 telephone, email and remote dial in support and minor software upgrades. In addition, where we issue major releases of our software (as opposed to minor releases (maintenance release)), this is a chargeable option for our customers.
| 10 |
Our software packages are feature rich and include patented techniques in a number of our modules. In general, our software package contains significant capabilities that are designed to address specific subsea challenges by application particularly in the context of a dynamic subsea setting (as opposed to a static mapping of the seabed as is typical for conventional sonar technology). Some of our unique features include:
| Feature Description | Functionality | |
| Real Time Measurements | important for many types of subsea operations such as block or asset placements or aiding diving operations; | |
| Models + Software Module | allows the user to import existing models and engineering drawings into the real time subsea environment; | |
| Edge Detection Algorithm | allows the user to superimpose an edge to easily identify a subsea target; | |
| Rendering a Noise Free Image | allows for a crisp, clear and high-resolution photo-like image without any processing (which would be required for conventional sonars); and | |
| Tracking Algorithm | Algorithm is used to track known objects within the real time 3D Data. This is currently utilized in our Construction Monitoring Software Package (see below) |
The Echoscope® and Construction Monitoring Software (CMS) have important applications for breakwater construction. Our CMS package has been recently updated to include patented algorithms for tracking and placement of single layer armor blocks used in breakwater construction.
We believe that our technology is becoming the preferred solution for subsea block placements in breakwater solutions because it allows crane operators to visualize in real time the moving blocks and tracking these into their placement position accurately. We believe that our solution has significantly simplified and made safer this area of the workflow process in breakwater construction. It has also increased significantly the lay-rate for blocks being placed with customers reporting up to 5000% increase in productivity.
We are not aware of competing technologies that offer real time 3D visualization and monitoring of subsea construction sites including previously laid blocks. In addition, the feature rich software package (CMS) which allows the complete workflow for breakwater construction to be planned within the software, greatly reduces project risks and timing while improving the quality of the projects. Furthermore, the patented tracking algorithms that have recently been enhanced and strengthened to provide opportunity for additional applications involving placing objects or structures underwater.
We generate around 87% of our revenues in the Products Segments from our real time 3D sonar products (hardware and software). We anticipate our revenues from this line to increase.
Fourth and Fifth Generation (4G and 5G) Real Time 3D Sonar Products
During the last 30 months, we have invested a significant part of our research and development resources on developing our 4G/5G real time 3D solutions for various market applications and varying price points.
| 11 |
On January 16, 2018 we launched the first product within our 4G series of real time 3D sonars, the Echoscope4G® Surface. This first product within our 4G range is 50% lighter, 40% smaller and requires 30% less power than our third generation of products and is more competitively priced. This allows us to compete more effectively against other conventional sonars within this price bracket and applications where size, weight and price are key factors. This product is suitable for shallow water applications only and is now available for customer trials, rental, licensing or outright purchase. Introduction of this product potentially paves the way for more market applications for the technology and potentially increases our market share of imaging sonars. In fiscal year 2018, most of our sonar sales were around this new product, Echoscope4G® Surface.
In calendar year 2019, we expect to roll out the new iteration of our 4G/5G products to include:
| ● | Standard deepwater version of our Echoscope in the new form factor of the Surface which was launched in January 2018. | |
| ● | Our new surface Sonar Echoscope®4G C500 Surface for Autonomous Surface Vehicles (“commonly referred to as “ASV). | |
| ● | Our new capability to generate full time series sonar data, our new processing engine which will increase the capability of the hardware to capture and process more data with a much higher level of accuracy. |
In 2019 we anticipate that all our sonar technology will migrate to our 4G/5G Platform which benefits from both the revised form factor on the hardware side and the smart algorithm on the software side (allowing for vastly improved performance) and capability to address the emerging autonomous underwater vehicle including sea drones.
Data Acquisition
We started our business in 1994 designing and developing the CodaOctopus® GeoSurvey software package for acquisition and processing of sidescan sonar data. For over two decades, our GeoSurvey has been an industry leading software package on the market for data acquisition and interpretation and provides feature rich solutions and productivity enhancing tools for the most exacting survey requirements. Designed specifically for sidescan and sub-bottom data acquisition, CodaOctopus® GeoSurvey has been purchased by numerous leading survey companies throughout the world. This product range includes:
CodaOctopus® GeoSurvey Acquisition Products
These consist of a range of hardware and software solutions for field acquisition of sidescan sonar and sub-bottom profiler, which includes analogue and digital interfaces compatible with all geophysical survey systems.
CodaOctopus® GeoSurvey Productivity Suite
This consists of an integrated suite of software that automates the tasks of analyzing, annotating and mosaicing complex data sets, thus ensuring faster and more precise results.
We continue to advance this range of product and in 2018 we launched our first product based on Artificial Intelligence Techniques which allows us to automatically identify boulders on the sea bed (“Survey Engine Automatic Object Detection”). This new product presents a real opportunity to radically change work flow process for post-processing and analyzing side scan sonar data to assess, amongst other things, the suitability of an area for exploration and construction activities (O&G installations, pipeline and cable laying activities). This is in its early stage of roll out but has sparked significant interest. Furthermore, this technology is extensible and we intend to develop our Mine Detecting capability. This is an area where we are investing our research and development efforts.
CodaOctopus® Instruments
These consist of simple, solid and robust solutions for sidescan sonar and sub-bottom profilers. Used throughout the world by leading survey companies, navies and academics, CodaOctopus instruments are ideal where minimal training and simple installation and set-up is paramount. Coupled with intuitive but powerful post processing software, the Octopus range meets the requirements of survey applications from the smallest inshore survey, rapid deployment naval reconnaissance to large scale site investigations.
CodaOctopus® DA4G is the 4th generation of our successful DA series and is built on twenty years of knowledge, experience and innovation in supplying unparalleled products and service to the worldwide geophysical survey sector. These purpose-built, turn-key, systems incorporate the very latest hardware specifications and are designed and delivered to meet the demanding nature of offshore survey work.
The CodaOctopus® DA4G range consists of a number of options and is backed (like all our products) with global service and support.
We generate around 5% of our revenues from the Products Segments from this range of products. With the launch of the new products we would anticipate our revenues from this line to increase over time.
| 12 |
Motion Sensing Products
Our F180® (and the more recently introduced CodaOctopus® F170 families) has been developed for the marine environment and is based on technology originally developed for the extreme world of motor racing. Modifications and enhancements have resulted in a simple-to-use, off-the-shelf product that brings accurate positioning and motion data into extreme offshore conditions for precision marine survey applications worldwide. Variants within the F180® series include the F190, exclusively configured for use ‘inland’, e.g. within ports and harbors, and the F185, with enhanced precision positioning to 2 cm accuracy (<1”). Octopus iHeave, an intelligent software product for dealing with long period ocean swell compensation, is fully integrated within the F180® series.
The F170 family is designed with ease of use in mind. They are compact, simple to install and produce accurate position and motion data for the marine industry. The F175 allows integration of third-party GNSS systems thus enhancing the accuracy of the outputs and improving the robustness of the solution.
Our Motion Sensing Products are sold alone or in conjunction with our real time 3D sonars. We are currently expending a significant amount of our resources in developing the next generation of our motion sensors.
We are aiming to launch our fourth-generation of Motion Sensing Products (F280®) in March 2019. The new hardware motion sensing products will be based on more advanced technology and new software. It is also highly complemented to our real time 3D sonar series and they are packaged together to provide a more comprehensive solution to our customers.
We generate around 8% of our revenues from the Products Segments from our Motion Sensing Products. With the launch of the new products we anticipate our revenues from this line to increase over time.
Coda Octopus Products Limited has the requisite accreditation for its business including LRQ accredited to ISO 9001:2015.
Marine Engineering Businesses (“Service Segment”)
Our Marine Engineering Businesses comprise Colmek based in Salt Lake City and Martech based in the United Kingdom.
These two operating entities supply parts that form part of mission critical integrated defense systems, test equipment, instrumentation and the like, primarily to the defense sector where high levels of reliability and quality are essential pre-requisites for securing and maintaining these agreements with their customers. Typically, in the first instance we prototype products for these customers and after going through various acceptance tests, including first article inspection approvals, we are given the production contracts. Many of these production contracts have repeat orders profile which typically follows the life cycle of the defense program that is using the production part.
These arrangements often give us long term preferred/sole supplier status, technology refresh and obsolescence management for such customers and we generally use these long-standing relationships to win more contracts with these customers.
In addition, we are increasingly combining our engineering capabilities with our product offerings. This enables us to offer systems which are complete with installation and support to maximize the utilization of our collective expertise to advance our real time 3D technology.
Coda Octopus Martech Limited (“Martech”)
Martech operates in the specialized niche of bespoke design and manufacturing services mainly to the United Kingdom defense and subsea industries. Its services are provided on a custom sub-contract basis where high quality and high integrity devices are required in small quantities. Martech has the requisite accreditation for its business including LRQ accredited to ISO 9001:2015.
An example of Martech’s design and engineering services is the development of a ruggedized display unit in military vehicles capable of displaying variables such as wind speed, air temperature and humidity independent of the vehicle’s computer.
In late 2010 Martech was awarded a significant contract to design and build two pre-production chemical decontamination units the successors of which have been designated as part of the ground equipment for a major international military aircraft program. The Company has since started production of these units which form part of the standard ground equipment for this military aircraft. Since the inception of this program, Martech has sold units having a total contract value of $2.4m.
| 13 |
Martech is one of the first suppliers bringing to the market controllers for fire sprinkler systems which periodically test the associated pumps. Sprinkler systems are now required to be introduced in certain larger domestic buildings under UK legislation and since the major fire incident “Grenfell Tower Disaster” it has increased its lead in this market. Its FireSafe Products are increasingly becoming a significant part of its business.
The Company enjoys pre-approvals to allow it to be short-listed for certain types of government contracts. Much of the more significant business secured by Martech is through the formal government or government contractor tendering process. Government contracts may be terminated at any time at the discretion of the government. If the government does terminate a contract, the Company is allowed to recover the costs incurred up to the date of termination. During the last few years, only one non-material government contract was terminated for convenience.
Martech is a key supplier of various parts to our marine products business and has been assisting in the further development of a number of those products.
Coda Octopus Colmek, Inc. (“Colmek”)
Colmek is a service provider of defense engineering solutions, particularly in the fields of data acquisition, storage, transmission and display. It has grown and diversified since beginning its operations in 1977 and now provides services and products to a wide range of defense, research and exploration organizations in the United States.
Colmek has the requisite accreditation for its business including LRQ accredited to ISO 9001:2015.
Colmek designs, manufactures and supports systems that are reliable and effective in multiple military and commercial applications where ruggedness and reliability under extreme operational conditions are paramount and where lives depend on accurate and precise information.
Colmek has long standing relationships with a number of prime defense contractors and has been supporting a number of defense programs for over 30 years including the Close in Weapons Support Program (CIWS) for which it supplies proprietary parts and services and technical refresh programs. As a result, Colmek has repeat revenues from these long-standing programs. Colmek continues to expand the number of established programs into which it supplies proprietary parts.
During fiscal year 2018, Colmek continued to increase the number of new significant defense programs and was awarded two development contracts. Once the prototype phase is completed, we expect to become long term manufacturing contracts for Colmek.
In June 2014 Colmek completed the acquisition of the Thermite® which is a rugged visual mission computer line and the Sentiris® AV1 XMC video card for $1,100,000 in cash. Colmek also acquired hardware, Thermite stock, and other intellectual property rights (such as software code and trademarks pertaining to these products).
The Thermite® Product fits within established programs with Department of Defense (“DoD”) prime contractors and benefits from being a single source product under this program. Customers for this item include the US Army, Benchmark, and Endeavor Robotics Defense and Security Division. Since acquiring these two products in 2014, we have received orders in excess of $2,700,000.
Thermite ® Rugged Visual Computers
| ● | Rugged, graphics-based PCs designed to perform in the most brutal environmental conditions; | |
| ● | Focus on graphics-based high-performance computing with integrated accelerated video capture capability; | |
| ● | Lightweight, power efficient and conduction-cooled; | |
| ● | Three models, optimized for man-wearable, vehicle, and airborne platforms; and | |
| ● | Programs include dismounted soldier training, mission rehearsal, real time imaging, robotic control, weapon system control, sensor processing and display. |
| 14 |
We have now designed and developed our next generation of the Thermite® “Octal”. The new Octal is in trials with a number of new customers who fit the profile of large quantity purchasers with repeat and long-term requirements for this product.
Sentiris® AV1 XMC
| ● | FPGA-based PCI Express Mezzanine Card designed for video and graphics processing applications; and | |
| ● | Targeted platforms include MH-47G helicopters, MH-60M Blackhawk helicopters, MC-130H Combat Talon II and CV-22 Tilt-Rotor aircraft. |
Since acquiring the Sentiris® (as part of the Thermite acquisition), we have successfully completed the first article inspection (“FAI”) approval phase and are now in the production phase. We have received orders for approximately $1,200,000 since completion of the FAI process.
This is expected to be a significant new product as this program is funded and there will be ongoing demand for this product over the life of the program.
Other products offered by Colmek include subsea telemetry and data acquisition systems, rugged workstations, analog-to-digital converters and rugged LCD displays.
Competition
In our Products Segment, we are exposed to the following competitive challenges:
Data Acquisition Products
The sonar equipment industry is fragmented with several companies occupying niche areas, and we face competition from different companies with respect to our different products. In the field of geophysical products, Triton Imaging Inc., a US-based company, now part of the ECA Group (Toulon, France), Chesapeake, a US-based company, and Oceanic Imaging Consultants, Hawaii, USA, dominate the market with an estimated 25% each of world sales, while we believe that we control approximately 5% of world-wide sales.
| 15 |
Motion Sensing Products
In the field of motion sensing equipment, where our product addresses a small part of the overall market, we believe that we have four principal competitors: TSS (International) Ltd in Watford, England which is focused on the mid-performance segments with about 25% of the world market; Ixsea, a French company which covers all segments, with about 20% of the market; Kongsberg Seatex, a Norwegian company (part of Kongsberg Gruppen) which has products across all segments, with about 15% of the market; and Applanix, a Canadian company, now part of Trimble which has one major product focused on the high end of the market, with about 20% of the market. We believe that our market share in the field of motion sensing equipment is only about 5%. This market is fiercely competitive and with the advancement of technology, there are new entrants to the market such as SBG Systems (a French based manufacturer of motion sensors). Due to the price pressure in this market, we are selling our products more in conjunction with our real time 3D sonars than on a standalone basis.
Real Time 3D Sonar
In the field of Real Time 3D imaging, we are unaware of other companies offering a similar product. The entry into this market is dependent upon specialized marine electronics, acoustic and software development skills. The learning curve, which has resulted in the advancement of our real time 3D sonar device, is the culmination of two decades of research and development into this field. We are aware of a number of high profile and substantial competitors’ real time 3D projects that have failed. Over the last several years there have been lower grade sonars entering the market for 3D imaging. Companies such as Tritech International Ltd., United Kingdom, BlueView Technologies Inc., USA (now a part of Teledyne Technologies Incorporated), and Norbit Group AS Norway are examples, but none of these sonar offerings are directly comparable or competitors in respect of our real time 3D solutions. Specifically, we believe that they do not have the same capabilities as our patented Echoscope® technology in terms of generating real time 3D images of submerged objects and environments in low or zero visibility conditions. However, Teledyne has in the last four years acquired a significant number of subsea companies (examples are Reson and BlueView). Teledyne has much greater resources and liquidity than the Company. We therefore can give no assurance that companies such as these will not enter this market.
We seek to compete on the basis of producing high quality products employing cutting edge technology that is easy to use by operators without specialized skills in sonar technology. We intend to continue our research and development activities to continually improve our products, seek new applications for our existing products and to develop new innovative products.
In our Services Segment, we are exposed to the following competitive challenges:
Marine Engineering Businesses
Through our marine engineering operations, Coda Octopus Colmek, Inc. and Coda Octopus Martech Limited, we are involved in custom engineering for the defense industry in the United States and in the United Kingdom. Martech competes with larger contractors in the defense industry. Typical among these are Ultra Electronics, BAE Systems, and Thales, all of whom are also partners on various projects. In addition, the strongest competitors are often the clients themselves. Because of their size, they often have the option to proceed with a project in-house instead of outsourcing to a sub-contractor like Martech or Colmek.
Intellectual Property
Our product portfolio and technologies are protected by intellectual property rights including trademarks, copyrights and patents. We have a number of fundamental patents around our sonar products including a patent covering combining two or more acoustic images to produce a composite image. This covers the real time acoustic image generation element of what we do, and we believe it provides us with a competitive advantage. One of our main patents, “Method of Producing a 3-D Image”, will expire in June 2019. We have in fiscal year 2018 filed further regular and provisional patent applications around our 4G/5G of technology which, if granted, will afford significant patent protection. In the mean-time even with the expiration of our Method Patent in June 2019, we have other significant patents around our technology. Furthermore, our technology is a combination of hardware, algorithm, software – for which we have patents and trade secrets covering.
Patents
Our patented inventions along with our strategy to enhance these inventions are at the heart of the Company’s strategy for growth and development.
| 16 |
Our patent portfolio consists of the following:
| Patent Number | Description | Expiration Date | ||
| US Patent No. 6,438,071 | Concerns the “Method for Producing a 3-D Image” and is also recorded in the European Patents Register #EP 1097393 B1; Australia #55375/99 and Norway #307014. This patent relates to the method for producing a 3D image of a submerged object, e.g. a shipwreck or the sea bottom. | June 1, 2019 | ||
| US Patent No. 6,532,192 | Concerns “Subsea Positioning System and Apparatus” | July 1, 2019 | ||
| US Patent No. 7,466,628 | Concerns a “Method of constructing mathematical representations of objects from reflected sonar signals.” | August 15, 2026 | ||
| US Patent No. 7,489, 592 | Concerns a “Method of automatically performing a patch test for a sonar system, where data from a plurality of overlapping 3D sonar scans of a surface, as the platform is moved, are used to compensate for biases in mounting the sonar system on the platform”. | January 19, 2027 | ||
| US Patent No. 7,898,902 | Concerns a “method of representation of sonar images” allowing sonar three-dimensional (3D) data to be represented by a two dimensional image. | June 13, 2028 | ||
| US Patent No. 8,059,486 | Concerns a method of rendering volume representation of sonar images. | April 16, 2028 | ||
| US Patent No. 8,854,920 | Concerns a method of volumetric rendering of three dimensional sonar data sets | September 5, 2032 | ||
| US Patent No. 9,019,795 | Method of object tracking using sonar imaging | September 5, 2032 | ||
| US Patent No. 10,088,566 | Object Tracking using sonar imaging | October 30, 2035 |
Trademarks
We own the following registered trademarks: Coda®, Octopus®, CodaOctopus®, Octopus & Design®, F180®, F180 4G Series®, F280®, Echoscope®, Echoscope 4G®, Survey Engine®, Dimension®, DAseries®, CodaOctopus® Vantage; CodaOctopus® UIS; CodaOctopus® USE, Sentiris® and Thermite®.
We also use the following trademarks: CodaOctopus®F170, CodaOctopus®F175, CodaOctopus®F190, CodaOctopus® UIS CodaOctopus® TEAM and CodaOctopus® TLS.
In addition, we have registered a number of internet domain names including www.codaoctopus.com; www.codaoctopusgroup.com; www.colmek.com and www.martechsystems.co.uk.
Research and Development
During the fiscal years ended 2018 and 2017, we spent approximately $2.6 million and $1.4 million, respectively, on mainly developing our real time 3D sonar technology (our Products Segment), our new Motion Sensor F280®, our Artificial Intelligence Algorithm (Automatic Boulder Detection) and Thermite ® refresh (our Services Segment).
Our products are complex and therefore we can give no assurance that we will be successful in the above-stated objective. Furthermore, even following launch we may not succeed. Moreover, we may incur significant research expenditures without realizing viable products.
| 17 |
Government Regulation
Because of the nature of some of our products, they may be subject to United States and other jurisdictions’ export control regimes and may be exported outside these jurisdictions only with the required level of export license or through an export license exception or general export authorization/license.
In addition, as a provider for the US Government, we may be subject to numerous laws and regulations relating to the award, administration and performance of US Government contracts, including the False Claims Act. Non-compliance found by any one agency could result in fines, penalties, debarment, or suspension from receiving additional contracts with all US Government agencies. Given our dependence on US Government business, suspension or debarment could have a material adverse effect on our business and results of operations.
Employees
As of the date hereof, we employ worldwide approximately 115 people, of which 11 hold management positions. A large majority of our employees have a background in science, technology and engineering, with a substantial part being educated to degree and PhD level. None of our employees are employed under a collective agreement and we have not experienced any organized labor difficulties in the past.
Not required for smaller reporting companies.
ITEM 1B. UNRESOLVED STAFF COMMENTS.
None.
| 18 |
Orlando, Florida
Our corporate offices are co-located with our subsidiary Coda Octopus Products, Inc. in Orlando where we lease premises on a month to month basis at $5,176 per month.
In addition, Coda Octopus Products, Inc., owns a property which it acquired in February 2016. This property is being used by staff who are assigned or seconded from other parts of our Organization to our Florida Office to assist with R&D projects and/or to provide training or demonstration of our products from time to time.
Salt Lake City, Utah, USA
Coda Octopus Colmek operates from its premises which comprises 16,000 square feet and includes production, R&D Facilities and office space. These premises are owned by Coda Octopus Colmek.
Edinburgh, Scotland, UK
Current Premises
Coda Octopus Products Limited (Edinburgh based) operates from its premises comprising 12,070 square feet of internal space and includes production, R&D Facilities and office space. These premises are owned by Coda Octopus Products Limited.
Offices which we will surrender on or around February 28, 2019
Our wholly owned United Kingdom subsidiary, Coda Octopus Products Ltd, leases office space comprising 4,099 square feet in Edinburgh, United Kingdom. These premises were used as offices and we are actively seeking to sub-let these premises for the remainder of its term. The annual rent is fixed for the duration of the lease at the British Pounds equivalent of $54,130 (the rent is stated in British Pounds and is therefore subject to exchange rate fluctuations). We have now completed the agreed schedule of agreed repair and reinstatement work with the existing landlords and intend to surrender the said premises on or around February 28, 2019. All rents and rates will cease thereafter.
Portland, Dorset, UK
Martech leases premises from Coda Octopus Products Limited. These premises are located in the Marine Center in Portland, Dorset, United Kingdom, are owned by Coda Octopus Products Ltd and comprise 9,890 square feet. The building comprises both office space and manufacturing and testing facilities. The lease, which is for a period of 5 years, provides for an annual rent of the equivalent of $51,000 (the rent increases by 3% annually and is stated in British Pounds and is therefore subject to exchange rate fluctuations). These premises give easy access to marine facilities such as testing vessels etc. The lease expires on or around December 31, 2018 and by mutual agreement was extended for a further 2 years. It was agreed between the parties that Martech will be allowed a rent-free period of 2 years.
| 19 |
All non-US Dollar denominated rents are stated according to prevailing exchange rates as of the date of each respective lease agreement.
From time to time, we may become involved in various lawsuits and legal proceedings which arise in the ordinary course of business. However, litigation is subject to inherent uncertainties, and an adverse result in these or other matters may arise from time to time that may harm our business. We are currently not aware of any such legal proceedings that we believe will have, individually or in the aggregate, a material adverse effect on our business, financial condition or operating results.
ITEM 4. MINE SAFETY DISCLOSURES.
Not Applicable.
| 20 |
ITEM 5. MARKET FOR REGISTRANT’S COMMON EQUITY, RELATED STOCKHOLDER MATTERS AND ISSUER PURCHASES OF EQUITY SECURITIES
Our common stock has been traded on the Nasdaq Capital Market under the symbol “CODA” since July 19, 2017. Prior thereto, it had been quoted on the OTCQX since February 8, 2017 under the symbol COGI, and prior thereto, on the OTC Pink under the symbol CDOC. The following table sets forth the range of high and low bid prices of our common stock as reported and summarized on the Nasdaq, OTCQX or OTC Pink, as applicable, for the periods indicated. These prices are based on inter-dealer bid and asked prices, without markup, markdown, commissions, or adjustments and may not represent actual transactions.
On January 11, 2017, we effected a one for fourteen (1 for 14) reverse stock split of our issued and outstanding common stock. All share prices below have been adjusted retroactively to account for the reverse stock split.
| Year Ended October 31, 2018 | HIGH | LOW | ||||||
| First Quarter | $ | 6.10 | $ | 4.65 | ||||
| Second Quarter | $ | 5.43 | $ | 3.31 | ||||
| Third Quarter | $ | 6.15 | $ | 3.65 | ||||
| Fourth Quarter | $ | 6.52 | $ | 4.12 | ||||
| Year Ended October 31, 2017 | HIGH | LOW | ||||||
| First Quarter | $ | 4.70 | $ | 1.40 | ||||
| Second Quarter | $ | 6.74 | $ | 4.25 | ||||
| Third Quarter | $ | 4.93 | $ | 4.13 | ||||
| Fourth Quarter | $ | 4.98 | $ | 3.91 | ||||
We have not declared or paid any cash dividends on our common stock, and we currently intend to retain future earnings, if any, to finance the expansion of our business, and we do not expect to pay any cash dividends in the foreseeable future. The decision whether to pay cash dividends on our common stock will be made by our board of directors, in their discretion, and will depend on our financial condition, operating results, capital requirements and other factors that the board of directors considers significant.
Recent sales of unregistered securities
On or around November 16, 2018, pursuant to the terms of a private placement consummated on January 29, 2018, the Company issued 23,965 shares of common stock for a purchase price of $105,446 (or $4.40 per share) representing the exercise of certain pro-rata rights by the said investors of the private placement which were triggered by the exercise of the conversion rights by the Series C Preferred Stock holders on or around October 31, 2018.
On October 31, 2018, the Company issued an aggregate of 200,000 shares of common stock (based on a conversion price of $5.00 per share) to holders of shares of the Company’s Series C Convertible Preferred Stock in connection with the conversion and retirement of such preferred stock. No cash was paid in this transaction.
All securities were issued pursuant to an exemption from the registration requirements of the Securities Act of 1933, as amended, under Section 4(2) thereunder as they were issued in reliance on the recipients’ representation that they were accredited (as such term is defined in Regulation D), without general solicitation and represented by certificates that were imprinted with a restrictive legend. In addition, all recipients were provided with sufficient access to Company information.
ITEM 6. SELECTED FINANCIAL DATA
Not applicable.
| 21 |
ITEM 7. MANAGEMENT’S DISCUSSION AND ANALYSIS OF FINANCIAL CONDITION AND RESULTS OPERATIONS
Forward-Looking Statements
The information herein contains forward-looking statements. All statements other than statements of historical fact made herein are forward looking. In particular, the statements herein regarding industry prospects and future results of operations or financial position are forward-looking statements. These forward-looking statements can be identified by the use of words such as “believes,” “estimates,” “could,” “possibly,” “probably,” anticipates,” “projects,” “expects,” “may,” “will,” or “should” or other variations or similar words. No assurances can be given that the future results anticipated by the forward-looking statements will be achieved. Forward-looking statements reflect management’s current expectations and are inherently uncertain. Our actual results may differ significantly from management’s expectations.
The following discussion and analysis should be read in conjunction with our financial statements, included herewith. This discussion should not be construed to imply that the results discussed herein will necessarily continue into the future, or that any conclusion reached herein will necessarily be indicative of actual operating results in the future. Such discussion represents only the best present assessment of our management.
General Overview
We operate two distinct business segments: Products Segment and Services Segment
Our Products Segment designs and manufactures products for the subsea market including our range of flagship patented real time 3D sonar solutions (“Products Segment”). These products are used primarily in the underwater construction market, offshore oil and gas, offshore wind energy industry, and in the complex dredging, port security, mining and marine sciences sectors. Our customers include service providers to major Oil and Gas (“O&G”) companies, law enforcement agencies, ports, mining companies, defense bodies, research institutes and universities.
Our Services Segment supplies engineering services to prime defense contractors (“Services Segment”) such as Raytheon and Northrop Grumman. We have long-standing relationships with prime defense contractors and we use these credentials to secure more business. We support some significant defense programs by supplying and maintaining proprietary parts (or parts which we are preferred suppliers of) through obsolescence management programs. These services provide recurring stream of revenues for our Services segment.
In recent years, the Products and Services Segment have each generated 50% of our revenues. As a general rule, however, the Product Segment yields a higher Gross Profit Margin than the Services Segment. In both 2017 and 2018 fiscal years the Services Segment revenues and Net Income were substantially down and off plan due to the failure of new US Administration to pass a defense budget. This impact continued in 2018 on the Services Segment. In 2018 fiscal year therefore, Products Segment generated 64% of the Company’s consolidated revenues and the Services Segment generated 36%. We consider this to be atypical and would anticipate in 2019 fiscal year Services Segment revenues will be more in line with 50% of our overall revenues.
The Services Segment has now started to receive the backlog orders that were due in both fiscal years 2017 and 2018 and have now contracted a backlog of $2,504,380 (for the 2017/2018 orders) and we expect the further outstanding backlog to be contracted in the first half of 2019. Our biggest risks for the 2019 fiscal year for this Segment is that of timely execution of its mounting backlog of orders. The current level of this Segment’s order book is approximately $7.2m.
Although our Products Segment continues to be affected by the contraction in expenditures in Offshore O&G activities, we have continued to find new markets for our subsea products, mainly our real time 3D sonar series and the launch of our Echoscope4G® Surface saw an increase in the number of units sold. We also continue to become a key sensor in Offshore Wind Energy where our technology is used for real time 3D visualization of the cable pull in points and cable touch down point. Our increased efforts including expenditures in research and development is designed to capture new markets in the subsea defense space where new technologies such as underwater drones present new challenges for governments. We continue to believe that our real time 3D sonar technology is significant for the subsea defense market which is worth billions annually. Our unique and patented real time 3D solutions are a significant advancement on the current technology available in the subsea sonar imaging market due to its real time capability providing real time volumetric data of underwater targets – both static and moving - in low or zero visibility conditions.
| 22 |
Since introducing this product, we have made progress in getting our core real time 3D technology, the Echoscope®, adopted by a significant number of ports in the USA (the CodaOctopus® Underwater Inspection System where it is used for port and harbor security. In 2015 we secured the first sale of our Underwater Inspection System to a foreign government body in East Asia and in 2016 we sold two additional full system to this body.
We have also made progress in expanding the markets (and applications) for our real time 3D sonars. Recently, we have sold a number of systems to mining companies. Increasingly, our customers involved in offshore wind energy and renewables are adopting the technology as the primary tool for scour management, subsea cable installation and associated cable protection tasks.
In addition, in recent years we have started to rent our real time 3D solutions with engineering services. Given the contraction in capital expenditures budget in the O&G market, rentals are increasingly becoming an important part of the composition of the Company’s revenues and these O&G operators are more prepared to utilize operational budgets. Furthermore, our rental offering generally yields a higher gross margin for the Company.
Our business is affected by a number of factors including those set out below:
| A. | United Kingdom’s withdrawal from the European Union (“Brexit”) including the possibility that such withdrawal will take place without a deal on their future relationship (“No Deal Brexit Issue”)
We derive a significant portion of our net operating revenues from our UK operations (both Coda Octopus Products Limited and Coda Octopus Martech).
Following a national referendum, the United Kingdom Government has served notice to leave the European Union under Article 50 of the Lisbon Treaty. The date of the UK leaving the European Union and the deadline for concluding a deal is currently March 29, 2019. Failing to conclude a deal could result in a No Deal Brexit or the UK Parliament intervening and seeking an extension on the March 29, 2019 date.
A No Deal Brexit could affect our UK operations which represents a significant part of our earnings (Coda Octopus Products Limited (Edinburgh-based) and Coda Octopus Martech Limited (Portland, England-based).
The ongoing uncertainty also impacts the British Pound (which is the trading currency of our UK operations). This has adverse impact on revenues reported (due to depreciation of the British Pound against other major currencies including the US Dollar) and devaluation of our consolidated balance sheet assets.
Because there is no precedent for a European Union member state leaving the Union, the full implications for the Company are not clear. The outcome is dependent on the type of future relationship that is struck between the United Kingdom and the European Union. In a worst-case scenario, where no deal on the future of the UK relationship with European Union is struck, it is widely believed that the World Trade Organization (WTO) rules will apply. Operating on this basis would have far-reaching implications for our Company particularly in the area of costs associated with import/export arrangements for our products including custom duties on purchases and sales and delays and increased compliance costs in the supply chain (both purchasing and selling). We currently benefit from mutual recognition rules in a number of areas including export control requirements and quality standards which allow us to distribute our products freely in European Union. If these are removed it is likely to involve new qualifications requirements that we would need to meet with the attendant costs and delays involved. Furthermore, if free movement is restricted this will also limit our ability to utilize our trained engineers and experts on customer projects in the European Union.
Furthermore, if the UK were to have an unplanned withdrawal this would compound the issues for our Company further as it is commonly believed that there would be resulting chaos and uncertainty, which would adversely affect the Company.
It is also widely believed that in a worst-case scenario, the British Pound will be exposed to extreme exchange rate fluctuations between the major currencies including US Dollar and Euro.
Many companies are seeking to mitigate the impact by seeking certain trading licenses in European Union member state countries.
In anticipation of a No Deal Brexit, we are taking steps to mitigate this and have established a company, Coda Octopus Products A/S, in Denmark to maintain a presence in the European Union and to address the foreseeable issues. However, we can give no assurance that this in itself would be sufficient to address the impact of both a No Deal Brexit and an unplanned No Deal Brexit (i.e. crashing out of the European Union). | |
| B. | Currency Risks:
The Company’s operations are split between the United States, United Kingdom, Australia, and Denmark. A large proportion of our revenues (approximately 58%) and costs are incurred outside of the USA with a significant part (56% of our total revenues) of that in the United Kingdom (“UK”). In addition, a significant part of our assets (both current and fixed) are held in British Pounds by our foreign subsidiaries. The depreciation of the British Pound against major currencies adversely impacts our revenues as a whole which are reported in U.S. Dollars. Furthermore, a large part of our assets is held in British Pounds while the majority of our liabilities (which comprise our senior secured debentures – see Note 8 of the audited Consolidated Financial Statements) are maintained in U.S. Dollars. In the 2018 period as compared to the same 2017 period, we realized a consolidated balance sheet loss on our assets due to the weakening of the British Pound against the US Dollar prevailing at October 31, 2018. In fiscal year 2018 compared to the 2017 period, we incurred a loss on our exchange rate translations in respect of our comprehensive income and loss account. See Note 2, paragraph n, of the audited Consolidated Financial Statements October 31, 2018 and 2017 regarding our Foreign Currency Translation policy.
This currency risk is further exacerbated by the uncertainty around Brexit. | |
| C. | Trade Disputes:
The costs of our raw materials could become a serious concern due to inter-country trade disputes. Our US Services Segment has suffered increased cost of raw materials sourced within the United States due to ongoing trade dispute between the USA, China and Canada. | |
| D. | Price of Commodities:
The price of commodities, in particular O&G. The decline in O&G prices since 2014 with a partial recovery since 2016 has resulted in large scale reductions in capital and operational expenditures, which directly impact on the Products Segment by reducing the quantity of sales and rentals into O&G and related markets. O&G has remained very competitive and customers are increasingly seeking significant discounts to place orders. |
| E. | Government Spending for Defense:
The allocation of funds to defense procurement by governments in the United States and the United Kingdom | |
| F. | Political Landscape:
Global-political uncertainties affecting the markets into which we sell our goods and services.
Global trends which make certain geographical regions more competitive in providing engineering solutions because of lower labor costs (e.g. India and China) are likely to affect our Services Segments (which provides engineering services). | |
| G. | Resourcing Levels
Being a small technology company, we are unable to compete for certain specialized electronic engineering skills as our remuneration package is not as competitive as those offered by bigger companies. |
| 23 |
| H. | Investments:
We lack the financial resources to advance our flagship technology at the commercially appropriate pace required to capture new markets and increase our sales which could facilitate new entrants to the market. For example, Teledyne Technologies Incorporated, a multi-billion company, has recently acquired a number of subsea companies that may speed up their entry into our market.
The Company has limited external sources of capital available, and as such is reliant upon its ability to sell its products and services to provide sufficient working capital for its operations and obligations. | |
| I. | Technological Advancement:
A significant part of our growth strategy is predicated on our patented real time 3D sonar technology. The technology space is inherently uncertain due to the fast pace of innovations and therefore we can give no assurance that we can maintain our leading position in the real time 3D imaging sonar market or that innovations in other areas may not surpass our unique capability that we currently supply to subsea market. |
Critical Accounting Policies
This discussion and analysis of our financial condition and results of operations is based on our consolidated financial statements that have been prepared under accounting principles generally accepted in the United States of America (“GAAP”). The preparation of financial statements in conformity with US GAAP requires our management to make estimates and assumptions that affect the reported values of assets and liabilities and the disclosure of contingent assets and liabilities at the date of the financial statements and the reported levels of revenue and expenses during the reporting period. Actual results could materially differ from those estimates.
Below is a discussion of accounting policies that we consider critical to an understanding of our financial condition and operating results and that may require complex judgment in their application or require estimates about matters which are inherently uncertain. A discussion of our significant accounting policies, including further discussion of the accounting policies described below, can be found in Note 2, “Summary of Accounting Policies” of our Consolidated Financial Statements.
Revenue Recognition
Our revenue is derived from sales of underwater technologies and equipment for imaging, mapping, defense and survey applications and from the engineering services which we provide. Revenue is recognized when evidence of a contractual arrangement exists, delivery has occurred or services have been rendered, the contract price is fixed or determinable, and collectability is reasonably assured. No right of return privileges are granted to customers after delivery.
For arrangements with multiple deliverables, we recognize revenue by allocating the total consideration to each deliverable based on the relative fair value of each deliverable. Revenue from equipment and software sales are recognized when delivered, and revenue for installation and other services are recognized as they are performed.
| 24 |
Our contracts sometimes require customer payments in advance of revenue recognition. These amounts are reflected as liabilities and recognized as revenue when the Company has fulfilled its obligations under the respective contracts.
For software license sales for which any services rendered are not considered essential to the functionality of the software, we recognize revenue upon delivery of the software, provided (1) there is evidence of a contractual arrangement for this, (2) collection of our fee is considered probable and (3) the fee is fixed and determinable.
For arrangements that are generated from time and material contracts where there is a signed agreement and approved purchase order in place that specifies the fixed hourly rate and other reimbursable costs to be billed based on material and direct labor hours incurred, revenue is recognized on these contracts based on material and direct labor hours incurred. Revenues from fixed-price contracts are recognized on the percentage-of-completion method, measured by the percentage of costs incurred (materials and direct labor hours) to date to estimated total services (materials and direct labor hours) for each contract. This method is used as expenditures for direct materials and labor hours are considered to be the best available measure of progress on these contracts. Losses on fixed-price contracts are recognized during the period in which the loss first becomes apparent based upon costs incurred to date and the estimated costs to complete as determined by experience from similar contracts. Variations from estimated contract performance could result in adjustments to operating results.
Rental revenue is recognized monthly over the term of the rental period.
On November 1, 2018 the Company will adopt Accounting Standards Codification ASC 606, Revenue From Contracts with Customers (ASC 606). While terminology and requirements change in ASC 606, we believe that our existing revenue accounting is compliant with ASC 606 and that our accounting for revenue will not change. Accordingly, our disclosures about our revenue in accordance with ASC 606 will expand to comply with the new requirements, including expansion of quarterly revenue reporting requirements.
We defer costs on projects for service revenue. Deferred costs consist primarily of direct and incremental costs to customize and install systems, as defined in individual customer contracts, including costs to acquire hardware and software from third parties and payroll costs for our employees and other third parties.
We recognize such costs in accordance with our revenue recognition policy by contract. For revenue recognized under the completed contract method, costs are deferred until the products are delivered, or upon completion of services or, where applicable, customer acceptance. For revenue recognized under the percentage of completion method, costs are recognized as products are delivered or services are provided in accordance with the percentage of completion calculation. For revenue recognized ratably over the term of the contract, costs are recognized ratably over the term of the contract, commencing on the date of revenue recognition. At each balance sheet date, we review deferred costs, to ensure they are ultimately recoverable. Any anticipated losses on uncompleted contracts are recognized when evidence indicates the estimated total cost of a contract exceeds its estimated total revenue.
Stock Based Compensation
We recognize the expense related to the fair value of stock based compensation awards within the consolidated statements of income and comprehensive income. We use the fair value method for equity instruments granted to non-employees and use the Black-Scholes model for measuring the fair value. The stock based fair value compensation is determined as of the date of the grant or the date at which the performance of the services is completed (measurement date) and is recognized over the periods in which the related services are rendered.
Income Taxes
The Company accounts for income taxes in accordance with Accounting Standards Codification Topic 740, Income Taxes (ASC 740). Under ASC 740, deferred income tax assets and liabilities are recorded for the income tax effects of differences between the bases of assets and liabilities for financial reporting purposes and their bases for income tax reporting. The Company’s differences arise principally from the use of various accelerated and modified accelerated cost recovery system for income tax purposes versus straight line depreciation used for book purposes and from the utilization of net operating loss carry-forwards.
Deferred tax assets and liabilities are the amounts by which the Company’s future income taxes are expected to be impacted by these differences as they reverse. Deferred tax assets are based on differences that are expected to decrease future income taxes as they reverse. Correspondingly, deferred tax liabilities are based on differences that are expected to increase future income taxes as they reverse. Note 7 to the Consolidated Financial Statements discusses the amounts of deferred tax assets and liabilities, and also presents the impact of significant differences between financial reporting income and taxable income.
| 25 |
For income tax purposes, the Company uses the percentage of completion method of recognizing revenues on long-term contracts which is consistent with the Company’s financial reporting under U.S. GAAP.
Intangible Assets
Intangible assets consist principally of the excess of cost over the fair value of net assets acquired (or goodwill), customer relationships, non-compete agreements and licenses. Goodwill was allocated to our reporting units based on the original purchase price allocation. Goodwill is not amortized and is evaluated for impairment annually or more often if circumstances indicate impairment may exist. Customer relationships, non-compete agreements, patents and licenses are being amortized on a straight-line basis over periods of 2 to 15 years. The Company amortizes its limited lived intangible assets using the straight-line method over their estimated period of benefit. We periodically evaluate the recoverability of intangible assets and take into account events or circumstances that warrant revised estimates of useful lives or that indicate that impairment exists.
The first step of the goodwill impairment test, used to identify potential impairment, compares the fair value of the reporting unit with its’ carrying amount, including goodwill. If the fair value, which is based on future cash flows, exceeds the carrying amount, goodwill is not considered impaired. If the carrying amount exceeds the fair value, the second step must be performed to measure the amount of the impairment loss, if any. The Company will early adopt Accounting Standards Codification 2017 – 04, Simplifying the Test for Goodwill Impairment, which permits the Company to impair the difference between carrying amount in excess of the fair value of the reporting unit as the reduction in goodwill. ASC 2017-04 eliminates the requirement in previous GAAP to perform Step 2 of the goodwill impairment test.
At the end of each year, we evaluate goodwill on a separate reporting unit basis to assess recoverability, and impairments, if any, are recognized in earnings. An impairment loss would be recognized in an amount equal to the excess of the carrying amount of the goodwill over the fair value of the reporting unit.
Fiscal Year 2018 Consolidated Results of Operations
We operate two distinct business segments. Our Marine Technology Business designs, manufactures, sells and rents patented real time 3D sonar solutions and other leading products to the subsea market (“Products Segment”). Our Marine Engineering Business supplies engineering services (from design, prototyping to manufacturing) to mainly prime defense contractors (“Services Segment”).
Our products and associated services are sold and/or rented to the offshore wind energy, dredging and marine construction, marine and port security, mining including deep sea mining, marine sciences sector and O&G sector. During the fiscal years ended October 31, 2018 and 2017, respectively, the Product Segment generated 64% and 61% of our total revenues.
Our Services Segment designs and supplies engineering services largely for prime and sub-prime defense contractors.
During the fiscal years ended October 31, 2018 and 2017, respectively, the Services Segment generated 36% and 39% of our total revenues.
Comparison of fiscal year ended October 31, 2018 (“2018 period”) to fiscal year ended October 31, 2017 (“2017 period”)
See Segment information below for a full breakout of the financial performance of each Segment for the 2018 and 2017 periods, respectively.
The information provided below pertains to the consolidated analysis of both segments (Products and Services) operating in our Group.
| 26 |
Revenue:
| Year Ended October 31, 2018 | Year Ended October 31, 2017 | Percentage Change | ||||||
| $ | 18,019,429 | $ | 18,025,173 | Decrease of 0.03% | ||||
We suffered a small decrease in revenues in the 2018 period compared to the 2017 period. This is largely due to the Services Segment not achieving its revenue plan for fiscal year 2018 because of the delay in securing anticipated annual defense contracts resulting from the delay in the US Administration approving its defense budget. During the fiscal year ended 2018, the Products Segment generated revenues of $11,499,416 and Services Segment $6,570,013. During the 2018 period the Products Segment revenues grew by 4.2% over the 2017 period and the Services Segment revenues declined by 6.7% over the said period.
The Services Segment has now contracted backlog orders in the amount of $2,504,380 in respect of 2017 and 2018 and we expect the further outstanding backlog to be contracted in the first half of 2019. This Segment currently has an order book of $7.2m.
During the 2018 period, the Company had one customer from whom it generated sales greater than 10% of net revenues. Revenue from this customer was $2,882,761 or 16% of net revenues during the period. Total accounts receivable from this customer at October 31, 2018 was $24,993 or 1% of accounts receivable.
Gross Margin:
| Year Ended October 31, 2018 | Year Ended October 31, 2017 | Percentage Change | ||||||
| $ | 70.3 | % | $ | 66.4 | % | Increase of 3.9 percentage points | ||
| (gross profit of $12,662,362) | (gross profit of $11,967,725) | |||||||
The increase in gross margin reflects the different mix of consolidated sales in the 2018 period. In particular, the Products Segment, which generally yields a higher gross profit margin generated more revenues than the Services Segment. Furthermore, the Products Segment’s gross profit margin is affected by the mix of outrights sales versus rentals. Rentals also yield a greater gross profit margin than outright sales. Within the mix of sales for the Products Segments there is an increase percentage relating to rentals and sale of newly launched 4G Products.
Research and Development (R&D):
| Year Ended October 31, 2018 | Year Ended October 31, 2017 | Percentage Change | ||||||
| $ | 2,571,714 | $ | 1,380,381 | Increase of 86.3% | ||||
The increase in our R&D expenditure in the 2018 period mainly reflects an increase in our R&D expenditure in the Products Segment.
R&D expenditures in the Products Segment increased by 122.7% from $919,863 in the 2017 period to $2,048,285 in the 2018 period. This increase is in line with our budgetary plans and is a reflection of the increased activities in developing our 4G/5G of products.
Our goal will be to bring more competitively priced and technologically advanced products to the market under a 12-18 months roll out plan. The first of our series of products in our 4G of products was launched in January, 2018, and we expect to launch further products within our 4G/5G series of sonar throughout 2019.
R&D expenditures in the Services Segment were $523,429 in the 2018 period compared to $460,518 in the 2017 period, an increase of 13.7%. These expenditures are in line with our budgetary plans as we are investing significantly in the refreshing the Thermite® range of products which is a significant part of our growth strategy (Services Segment). The Thermite® is a product which we acquired from Quantum 3D in 2014 and it has a prestigious customer base. We believe that the technically refreshed Thermite presents a substantial opportunity to grow this part of our business and we have now completed the first development of the new Thermite® Octal and have received the first orders from 2 significant customers for trial versions. Thermite® enjoys a prestigious existing customer base which we intend to re-engage with this new Thermite® Octal.
In general, we expect R&D expenditures to continue to increase in the 2019 period for the reasons explained above. Notwithstanding this increase, it is the Company’s current belief that it can fund these activities from its operating income.
Our products are complex and, despite the increase in our R&D expenditures, we can give no assurance that we will realize our stated goals. We may incur significant R&D expenditures without realizing any commercially viable products or there may be glitches with our product launch.
Selling, General and Administrative Expenses (SG&A):
| Year Ended October 31, 2018 | Year Ended October 31, 2017 | Percentage Change | ||||||
| $ | 6,779,881 | $ | 6,769,327 | Increase of 0.2% | ||||
The increase in our SG&A expenditures in the 2018 period is broadly attributed to the increased costs associated with legal and transaction costs pertaining to a private placement consummated in January 2018. In fiscal year 2019, we do not anticipate this category of expenditure to increase as in fiscal year 2018 we incurred non-recurring one-off costs associated with re-organization of our Company to finance our R&D efforts. Approximately $586,436 of the increased amount in our SG&A expenditures constitutes non-recurring costs attributed to employees’ separation payments and a further $90,000 associated with surrendering leased business property in Edinburgh.
Key Areas of SG&A Expenditure across the Group for the year ended October 31, 2018 compared to the year ended October 31, 2017
| Expenditure | October 31, 2018 | October 31, 2017 | Percentage Change | |||||||
| Wages and Salaries | $ | 3,070,548 | $ | 4,010,778 | Decrease of 23.4% | |||||
| Legal and Professional Fees (including accounting, audit and investment banking services) | $ | 1,054,379 | $ | 934,937 | Increase of 12.8% | |||||
| Rent for our various locations | $ | 84,462 | $ | 101,728 | Decrease of 17% | |||||
| Marketing | $ | 125,411 | $ | 222,589 | Decrease of 43.7 | |||||
Although there is a modest decrease in Wages and Salaries category of expenditures, we would expect that in the 2019 fiscal year this category will increase to reflect the investments we are making in our business including in the area of sales and marketing and quality control.
The increase in our Legal and Professional Fees in the 2018 period is attributed to the increased costs associated with becoming a SEC reporting company and our listing on the NASDAQ.
Upon surrender of our leased properties in Edinburgh in February 2019, we anticipate that the category of expenditures constituting “Rent” will decrease significantly.
We also expect that the category Marketing expenditures in the fiscal year 2019 will increase to reflect increased marketing efforts on our new generation of products both in the Products and Services Segment.
| 27 |
Operating Income:
| Year Ended October 31, 2018 | Year Ended October 31, 2017 | Percentage Change | ||||||
| $ | 3,310,767 | $ | 3,818,017 | Decrease of 13.3% | ||||
The decrease in Operating Income in the 2018 period compared to the 2017 period is attributed to the increase of our R&D expenditures by 86.3% ($2,571,714 in the 2018 period compared to $1,380,381) for the reasons discussed earlier in conjunction with revenues remaining flat.
Interest Expense:
| Year Ended October 31, 2018 | Year Ended October 31, 2017 | Percentage Change | ||||||
| $ | 249,090 | $ | 597,011 | Decrease of 58.3% | ||||
This category of expenditures includes interest on the various loans described below.
In the 2017 period, we had a Senior Secured Convertible Debenture which attracted 8.5% in interest. In the 2017 period we repaid this Senior Debenture in full and in the said period paid approximately six months interest payments.
In the 2018 period, interest is attributed to the HSBC Loan and a loan made by our CEO to one of our subsidiaries.
On or around April 28, 2017, we entered into a new Senior Secured Debenture with HSBC NA where we borrowed $8,000,000, the proceeds of which were used to repay the Senior Secured Convertible described above. This new HSBC Debenture attracts a more favorable interest rate of 4.56% per annum. In addition, on March 28, 2018 the Company repaid a portion of the new HSBC Debenture thus reducing the principal outstanding amount under this agreement to $1,917,602 at that date. As at October 31, 2018, the amount outstanding under the HSBC Debenture is $1,524,239. The amortization schedule for this loan is set out in Note 8 of the audited Consolidated Financial Statements of October 31, 2018 and 2017.
Our Interest Expense Category also includes interest payable on a loan by our Group CEO to one of our subsidiaries, Coda Octopus Colmek, Inc.
On a going forward basis, we expect the category of Interest Expense to decrease as on December 2018 we repaid in full the loan to our CEO and the principal amount outstanding on the HSBC Debenture is reducing.
Other Income:
| Year Ended October 31, 2018 | Year Ended October 31, 2017 | Percentage Change | ||||||
| $ | 41,222 | $ | 121,278 | Decrease of 66.0% | ||||
The make-up of this category is UK Value Added Tax rebates from purchases made outside of the European Union by our UK operations and is subject to fluctuations as it usually reflects Value Added Tax rebates (equivalent of the US Sales Tax) from purchases made outside of the European Union by our UK operations and changes according to the level of purchases we make outside of the European Union in the period.
Net Income before Income taxes for the year ended October 31, 2018 compared to the year ended October 31, 2017
| Year Ended October 31, 2018 | Year Ended October 31, 2017 | Percentage Change | ||||||
| $ | 3,102,899 | $ | 3,342,284 | Decrease of 7.2% | ||||
Net Income before Income taxes fell largely because revenues remained flat (due to the delays in the Services Segment contracting certain defense contracts) and our increased expenditures in research and development, which increased by 86.3% (from $1,380,381 in the 2017 period to $2,571,714 in the 2018 period).
Net Income after Income taxes for the year ended October 31, 2018 compared to the year ended October 31, 2017
| Year Ended October 31, 2018 | Year Ended October 31, 2017 | Percentage Change | ||||||
| $ | 4,988,531 | $ | 3,339,663 | Increase of 49.4% | ||||
Net Income after Income taxes increased because the Company has recognized and recorded in the 2018 period the full deferred tax asset of $1,754,169 due to management judgement that based on the Company’s performance the likelihood of utilizing the Company’s Net operating loss (“NOLs”) carry forwards has materially increased and therefore the NOLs are realizable in the future.
Comprehensive Income for the year ended October 31, 2018 compared to the year ended October 31, 2017
| Year Ended October 31, 2018 | Year Ended October 31, 2017 | Percentage Change | ||||||
| $ | 4,798,299 | $ | 3,638,669 | Increase of 31.9% | ||||
Comprehensive Income increased in the 2018 period compared to the 2017 period due to the recognition of deferred tax asset (NOLs) in the amount of $1,754,169. Without this inclusion Comprehensive Income fell by 16.3% in the 2018 period compared to the 2017 period.
There are a number of reasons for the decline of our Comprehensive Income. In addition to loss of $190,232 in foreign currency translation (as compared to a gain of $299,006 in the 2017 period), Net Income fell by 32% in the 2018 period largely because revenues remained flat while Research and Development expenditures increased significantly in the 2018 period.
Since the UK decided to leave the European Union the British pound has been falling significantly against the US dollar (see Note 2 paragraph n of Notes to the audited Consolidated Financial Statements for October 31, 2018 and 2017 for fuller information regarding our Foreign Currency Translation policy).
Segment Analysis
We are operating in two reportable segments, which are managed separately based upon fundamental differences in their operations. Segment operating income is total segment revenue reduced by operating expenses identifiable with the business segment. Overhead includes general corporate administrative costs.
| 28 |
The Company evaluates performance and allocates resources based upon operating income. The accounting policies of the reportable segments are the same as those described in the summary of accounting policies.
There are inter-segment sales in the table below which have been eliminated from our financial statements. However, for the purpose of segment reporting, these are included in the table below only.
The following tables summarize certain balance sheet and statement of operations information by reportable segment for the financial years ending October 31, 2018 and 2017, respectively.
| Year Ended October 31, 2018 | Marine Technology Business (Products) |
Marine
Engineering Business (Services) |
Overhead | Total | ||||||||||||
| Revenues from External Customers | $ | 11,449,416 | $ | 6,570,013 | $ | - | $ | 18,019,429 | ||||||||
| Cost of Revenues | 1,894,808 | 3,462,259 | - | 5,357,067 | ||||||||||||
| Gross Profit | 9,554,608 | 3,107,754 | - | 12,662,362 | ||||||||||||
| Research & Development | 2,048,285 | 523,429 | - | 2,571,714 | ||||||||||||
| Selling, General & Administrative | 2,882,049 | 2,366,226 | 1,531,606 | 6,779,881 | ||||||||||||
| Total Operating Expenses | 4,930,334 | 2,889,655 | 1,531,606 | 9,351,595 | ||||||||||||
| Income (Loss) from Operations | 4,624,274 | 218,099 | (1,531,606 | ) | 3,310,767 | |||||||||||
| Other Income (Expense) | ||||||||||||||||
| Other Income | 39,122 | 2,100 | - | 41,222 | ||||||||||||
| Interest (Expense) Income | (12,154 | ) | (59,599 | ) | (177,337 | ) | (249,090 | ) | ||||||||
| Total Other Income (Expense) | 26,968 | (57,499 | ) | (177,337 | ) | (207,868 | ) | |||||||||
| Net Income (Loss) before income taxes | 4,651,242 | 160,600 | (1,708,943 | ) | 3,102,899 | |||||||||||
| Income refund (expense) | 133,419 |
- | (1,956 | ) | 131,463 |
|||||||||||
| Deferred tax benefit | - | - | 1,754,169 |
1,754,169 |
||||||||||||
| Income benefit (expense) | 133,419 |
- | 1,752,213 |
1,885,632 |
||||||||||||
| Net Income (Loss) | $ | 4,784,661 |
$ | 160,600 | $ | 43,270 | $ | 4,988,531 | ||||||||
| Supplemental Disclosures | ||||||||||||||||
| Total Assets | $ | 15,061,693 | $ | 11,674,640 | $ | 2,000,278 | $ | 28,736,611 |
||||||||
| Total Liabilities | $ | 1,142,661 | $ | 1,498,828 | $ | 1,708,172 | $ | 4,349,661 | ||||||||
| Revenues from Intercompany Sales - eliminated from sales above | $ | 1,176,438 | $ | 437,387 | $ | 3,100,000 | $ | 4,713,825 | ||||||||
| Depreciation and Amortization | $ | 461,429 | $ | 282,836 | $ | 14,143 | $ | 758,408 | ||||||||
| Purchases of Long-lived Assets | $ | 499,262 | $ | 61,329 | $ | 76,561 | $ | 637,152 | ||||||||
| 29 |
| Marine
Technology Business (Products) | Marine
Engineering Business (Services) | Overhead | Total | |||||||||||||
| Fiscal Year Ended October 31, 2017 | ||||||||||||||||
| Revenues from External Customers | $ | 10,986,268 | $ | 7,038,905 | $ | - | $ | 18,025,173 | ||||||||
| Cost of Revenues | 2,246,881 | 3,810,567 | - | 6,057,448 | ||||||||||||
| Gross Profit | 8,739,387 | 3,228,338 | - | 11,967,725 | ||||||||||||
| Research & Development | 919,863 | 460,518 | - | 1,380,381 | ||||||||||||
| Selling, General & Administrative | 3,220,635 | 2,714,054 | 834,638 | 6,769,327 | ||||||||||||
| Total Operating Expenses | 4,140,498 | 3,174,572 | 834,638 | 8,149,708 | ||||||||||||
| Operating Income (Loss) | 4,598,889 | 53,766 | (834,638 | ) | 3,818,017 | |||||||||||
| Other Income (Expense) | ||||||||||||||||
| Other Income | 117,106 | 4,172 | - | 121,278 | ||||||||||||
| Interest (Expense) Income | (709,763 | ) | (56,697 | ) | 169,449 | (597,011 | ) | |||||||||
| Total other income (expense) | (592,657 | ) | (52,525 | ) | 169,449 | (475,733 | ) | |||||||||
| Income (Loss) before income taxes | 4,006,232 | 1,241 | (665,189 | ) | 3,342,284 | |||||||||||
| Income tax benefit (expense) | 22,578 | - | (25,199 | ) | (2,621 | ) | ||||||||||
| Net Income | $ | 4,028,810 | $ | 1,241 | $ | (690,388 | ) | $ | 3,339,663 | |||||||
| Supplemental Disclosures | ||||||||||||||||
| Total Assets | $ | 12,374,214 | $ | 11,479,953 | $ | 205,906 | $ | 24,060,073 | ||||||||
| Total Liabilities | 1,109,003 | 1,475,442 | 7,648,208 | 10,232,653 | ||||||||||||
| Revenues from Intercompany Sales - eliminated from sales above | 1,895,015 | 387,142 | 1,797,775 | 4,079,932 | ||||||||||||
| Depreciation and Amortization | 528,667 | 412,220 | 12,739 | 953,626 | ||||||||||||
| Purchases of Long-lived Assets | 2,419,092 | 129,989 | 12,470 | 2,561,551 | ||||||||||||
| 30 |
The Company’s reportable business segments operate in three geographic locations: the United States, Europe and Australia.
Information concerning principal geographic areas is presented below according to the area where the activity is taking place for the years ended October 31, 2018 and 2017 respectively:
| External Revenues by Geographic Locations | USA | Europe | Australia | Total | ||||||||||||
| Year ended October 31, 2018 | $ | 7,617,891 | $ | 10,029,806 | $ | 371,732 | $ | 18,019,429 | ||||||||
| Year ended October 31, 2017 | $ | 7,499,900 | $ | 9,056,589 | $ | 1,468,684 | $ | 18,025,173 | ||||||||
The reason for the decline in our Australia revenues is because we restructured our Australian operations in January 2018, whereby most of the sales in this territory are now done by our UK Edinburgh operations. This was done to reduce our overheads associated with sales.
Liquidity and Capital Resources
At October 31, 2018, the Company had an accumulated deficit of $33,748,575, working capital of $14,881,096 and stockholders’ equity of $22,632,781. For the period then ended, the Company generated cash flow from operations of $2,430,649.
We believe that our current level of cash and cash generation will be sufficient to meet our short- and medium-term liquidity needs. At October 31, 2018, we had cash on hand of approximately $7.5 million and both billed and unbilled receivables of approximately $6.3 million. Our current cash balance represents approximately one-year of Selling, General and Administrative Expenses. The Company continues to critically evaluate the level of expenses that we incur and reduce those expenses as appropriate.
Our main liquidity issues are: funding our research and development program (“R&D”) which requires significant expenditures in attracting engineering skills and incurring non-recoverable and non-recurring costs for researching, developing and prototyping products; managing our currency exposure; and servicing our senior secured debentures.
Our Colmek subsidiary received on or around October 24, 2016 a $1 million loan from the CEO of Coda to fund the purchase of long lead-time inventory (which are typically subject to a lead time of 12-32 weeks) in order to be able to comply with delivery dates for contracts when they are secured. Subsequent to the year end, this loan and associated interest were repaid in full and all obligations under this loan have now been extinguished.
Substantially all our properties are owned by the Company and there are no mortgage obligations on those properties.
We have a significant concern about adverse currency fluctuations and the effect that those currency fluctuations have on our operations and profitability. As mentioned previously, Brexit has had a significant negative effect on the value of the British pound versus the U. S. dollar. A significant portion of our business is in the United Kingdom and the substantial decrease in the value of the British pound is reflected in lower revenues for our product sales. In addition, all our loans are denominated in U. S. dollars, which means that the dollar value of those loans has effectively gone up since these are partially serviced with British Pounds. While we have chosen not to hedge any of our currency exposure, we continue to evaluate the need to do so and will consider a hedging strategy if and when appropriate.
Operating Activities
Net cash generated from operating activities for the year ended October 31, 2018 was $4,988,531. We recorded net income for the period of $3,234,362. Other items in uses and sources of funds from operations included non-cash charges related to depreciation and amortization and stock-based compensation, which collectively totaled $1,206,907. Changes in operating assets decreased net cash from operating activities by $3,557,023 and changes in current liabilities increased net cash from operating activities by $372,122.
| 31 |
Investing Activities
Net cash used by investing activities for the year ended October 31, 2018 was $637,152 due to the sale and purchase of fixed assets.
Financing Activities
Net cash used in financing activities for the year ended October 31, 2018 was $942,382 as a result of paying down the debt of the Company and issuing stock for cash.
Secured Promissory Note
On April 28, 2017, Coda Octopus Group, Inc. (the “Company”) together with its wholly owned US subsidiaries, Coda Octopus Products, Inc. and Coda Octopus Colmek, Inc. (together, the “Subsidiaries”), entered into a loan agreement with HSBC Bank NA (the “Lender”) for a loan in the principal amount of $8,000,000 (the “Loan”). The annual interest rate is fixed at 4.56%. Commencing on May 28, 2017 and continuing on the 28th day of each month thereafter, the Company was required to make monthly principal and interest payments of $149,350 until April 28, 2022 (making our annual payments under this Note $1,792,200). In addition, within 30 days after the delivery to the Lender of the Company’s annual audited consolidated financial statements, the Company was required to make an annual principal payment of $700,000 during the term of the Loan. Such annual payments will reduce the balance of the principal outstanding. As a result, it was expected that the Loan will be repaid within a period of approximately 45 months. The Loan may be prepaid in whole or in part at any time subject to a break funding charge as detailed in the promissory note evidencing the Loan.
The obligations in connection with the repayment of the Loan are secured by all assets of the Company and its Subsidiaries. In addition, the repayment of the Loan is guaranteed by three of the Company’s overseas subsidiaries.
On or around March 28, 2018, with the consent of the lender, HSBC NA, we reduced our indebtedness under the loan to HSBC significantly (including the annual amounts of $700,000 which was required under the loan) and as of October 31, 2018, the Company is indebted to this lender in the amount of $1,524,239. We did not incur any penalty or costs for the early pre-payments of these amounts. See Note 8 to the audited Consolidated Financial Statements For the Years Ended October 31, 2018 and 2017. We now anticipate that the remaining balance (principal and interest) will be repaid within 41 months from date of loan.
Private Placement
On January 29, 2018 (“Transaction Date”), the Company consummated the sale and issuance of 1,125,950 shares of its common stock in a private placement of shares of common stock at $4.40 per share (the “Offering”). Total gross proceeds from the Offering were $4,954,180. The purchase price per share was based on a 10% discount of the volume weighted average price of the common stock on the Nasdaq Capital Market for the 30-consecutive trading-day period ending on January 22, 2018. For a period of 36 months from the Transaction Date, the investors also have the right to purchase, based on their pro-rata ownership of common stock, shares (or securities convertible into shares) offered in subsequent offerings, subject to certain limited exceptions.
Foreign Currency
The Company maintains its books in local currency: US Dollars for its US operations, Pounds Sterling for its United Kingdom operations, Norwegian and Danish Kroner for its Norwegian and Danish operations respectively and Australian Dollars for its Australian operations.
For the fiscal year ended 2018, 42% of the Company’s operations were conducted inside the United States and 58% outside the United States through its wholly owned subsidiaries. As a result, fluctuations in currency exchange rates may significantly affect the Company’s sales, profitability, balance sheet valuations and financial position when the foreign currencies of its international operations are translated into U.S. dollars for financial reporting. In addition, we are also subject to currency fluctuation risks with respect to certain foreign currency denominated receivables and payables. Although the Company cannot predict the extent to which currency fluctuations may affect the Company’s business and financial position, there is a risk that such fluctuations will have an adverse impact on the Company’s sales, profits, balance sheet valuations and financial position. Because differing portions of our revenues and costs are denominated in foreign currency, movements could impact our margins by, for example, decreasing our foreign revenues when the dollar strengthens and not correspondingly decreasing our expenses. The Company does not currently hedge its currency exposure. In the future, we may engage in hedging transactions to mitigate foreign exchange risk.
| 32 |
The translation of the Company’s UK operations’ British Pound denominated balance sheets and results of operations into US dollars was affected by changes in the average value of the US dollar against the British Pound. The average exchange rate during the 2018 period was $1.3420 USD to the GBP against $1.2829 during the 2017 period – an appreciation of the value of the GBP against the USD of 4.6%.
The translation of the Company’s Australian operations’ Australian Dollar denominated balance sheets and results of operations into US dollars was affected by changes in the average value of the US dollar against the Australian Dollar. The average exchange rate during the 2018 period was $0.7534 USD to the AUD against $0.7626 during the 2017 period – a depreciation of the value of the AUD against the USD of 1.2%.
The translation of the Company’s Danish operation’s Danish Kroner (DKK) denominated balance sheets and results of operations into US dollars has been affected by the currency fluctuations of the US dollar against the DKK from an average rate of $0.1535 during the period from March to October 2017, to $0.1590 during the 2018 period - an appreciation of the value of the DKK against the USD of 3.6%.
The Company’s Norwegian subsidiary is now dormant and the limited activities in that subsidiary is not material for the understanding of the impact of exchange rate fluctuations on Company’s results. The Norwegian operations are therefore not included in the below table.
These are the values that have been used in the calculations below.
The impact of these currency fluctuations on the 2018 period is shown below:
| British Pounds | Australian Dollar | Danish Kroner | US Dollar | |||||||||||||||||||||||||
| Actual | Constant | Actual | Constant | Actual | Constant | Total | ||||||||||||||||||||||
| Results | Rates | Results | Rates | Results | Rates | Effect | ||||||||||||||||||||||
| Revenues | 10,071,499 | 9,627,844 | 369,878 | 374,421 | 0 | 0 | 439,112 | |||||||||||||||||||||
| Costs | (7,317,789 | ) | (6,995,437 | ) | (251,606 | ) | (254,696 | ) | (6,268 | ) | (6,052 | ) | (319,478 | ) | ||||||||||||||
| Net profit (losses) | 2,753,710 | 2,632,407 | 118,272 | 119,725 | (6,268 | ) | (6,052 | ) | 119,634 | |||||||||||||||||||
| Assets | 14,343,504 | 14,886,646 | 229,085 | 247,541 | 13,225 | 13,631 | (562,004 | ) | ||||||||||||||||||||
| Liabilities | (1,266,940 | ) | (1,314,915 | ) | (771 | ) | (833 | ) | 437 | 450 | 48,024 | |||||||||||||||||
| Net assets | 13,076,564 | 13,571,731 | 228,314 | 246,708 | 13,662 | 14,081 | (513,980 | ) | ||||||||||||||||||||
This table shows that the effect of constant exchange rates, versus the actual exchange rate fluctuations, increased net income for the year by $119,634 and decreased net assets by $513,980. All of these amounts are material to our overall financial results.
As a result of Brexit, we expect economic uncertainty to increase until the negotiations for the British exit have been completed and the future relationship between the UK and the EU is fully clarified. This uncertainty will most likely continue to have a profound effect on the value of the British Pound. Since approximately 56% of our revenues are transacted and generated in that British Pound, we expect our revenues to continue to be impacted by the adverse movement of the British Pound against the US Dollar. We also expect our direct costs of sales for components sourced outside of the UK for our UK operations to increase. Furthermore, our balance sheet will be affected since a significant part of our assets (fixed and current) are held in British Pounds by our UK subsidiaries.
Off-Balance Sheet Arrangements
We do not have any off balance sheet arrangements.
Inflation
The effect of inflation on the Company’s operating results was not significant during the 2018 period.
| 33 |
Seasonality
Results of operations for our Products Segment are impacted by the offshore drilling season. During the winter months, when less offshore drilling takes place, demand for our oil and gas related technology is typically at its lowest.
ITEM 8. FINANCIAL STATEMENTS AND SUPPLEMENTARY DATA
Reference is made to the Index of Financial statements following Part III of this Report for a listing of the Company’s Consolidated Financial Statements and Notes thereto.
ITEM 9. CHANGES IN AND DISAGREEMENTS WITH ACCOUNTANTS ON ACCOUNTING AND FINANCIAL DISCLOSURE
None.
ITEM 9A. CONTROLS AND PROCEDURES
Evaluation of Disclosure Controls and Procedures
Disclosure controls and procedures are controls and other procedures that are designed to ensure that information required to be disclosed by us in the reports that we file or submit under the Securities Exchange Act of 1934, as amended (the “Exchange Act”) is recorded, processed, summarized and reported, within the time periods specified in the Securities and Exchange Commission’s rules and forms. Disclosure controls and procedures include, without limitation, controls and procedures designed to ensure that information required to be disclosed by us in the reports that we file under the Exchange Act is accumulated and communicated to our management, including our principal executive and financial officers, as appropriate to allow timely decisions regarding required disclosure.
The Company’s management, under the supervision and with the participation of the Company’s Chief Executive Officer and Chief Financial (and principal accounting) Officer, carried out an evaluation of the effectiveness of the design and operation of the Company’s disclosure controls and procedures (as defined in Rule 13a-15(e) and 15d-15(e) of the Exchange Act) as of October 31, 2018. Based upon that evaluation the Chief Executive Officer and Chief Financial Officer concluded that the Company’s disclosure controls and procedures were effective as of the end of the period covered by this report.
Management’s Report on Internal Control over Financial Reporting
A company’s internal control over financial reporting is a process designed by, or under the supervision of, a public company’s principal executive and principal financial officers, or persons performing similar functions, and effected by the board of directors, management and other personnel, to provide reasonable assurance regarding the reliability of financial reporting and the preparation of financial statements for external purposes in accordance with generally accepted accounting principles (“GAAP”) including those policies and procedures that: (i) pertain to the maintenance of records that in reasonable detail accurately and fairly reflect the transactions and dispositions of the assets of the company, (ii) provide reasonable assurance that transactions are recorded as necessary to permit preparation of financial statements in accordance with GAAP, and that receipts and expenditures are being made only in accordance with authorizations of management and directors of the company, and (iii) provide reasonable assurance regarding prevention or timely detection of unauthorized acquisition, use or disposition of the company’s assets that could have a material effect on the financial statements.
Management is responsible for establishing and maintaining adequate internal control over financial reporting. Our management, with the participation of our Chief Executive Officer and Group Financial Officer, has assessed the effectiveness of our internal control over financial reporting as of October 31, 2018. In making this assessment, our management used the criteria established in Internal Control—Integrated Framework issued by the Committee of Sponsoring Organizations of the Treadway Commission (COSO).
We identified material weaknesses which are indicative of many small companies with limited staffing levels resulting in inadequate review procedures. We have taken remedial actions by implementing new controls over our review procedures involved in posting and review of our financial transactions.
We are constantly seeking ways of remediating the identified weaknesses and have started the process of introducing some controls in the area we have identified as a material weakness within the Company.
This annual report does not include an attestation report of the Company’s independent registered public accounting firm regarding internal control over financial reporting. Management’s report was not subject to attestation by the Company’s independent registered public accounting firm pursuant to rules of the SEC that permit the Company to provide only management’s report in this annual report.
Changes in Internal Control over Financial Reporting
There was no change in our internal control over financial reporting, as defined in Rules 13a-15(f) under the Exchange Act, that occurred during the fiscal year ended October 31, 2018 that has materially affected, or is reasonably likely to materially affect, our internal control over financial reporting.
| 34 |
ITEM 10. DIRECTORS, EXECUTIVE OFFICERS, AND CORPORATE GOVERNANCE
Directors and Executive Officers
The following persons are the executive officers and directors as of the date hereof:
| Name | Age | Position | ||
| Annmarie Gayle | 53 | Chief Executive Officer and Chairman | ||
| Michael Midgley | 66 | Chief Financial Officer, Chief Executive Officer of Coda Octopus Colmek, Inc. | ||
| Blair Cunningham | 49 | President of Technology | ||
| Michael Hamilton | 71 | Director | ||
| Per Wimmer | 50 | Director | ||
| Mary Losty | 59 | Director | ||
| Tyler G. Runnels | 62 | Director |
Annmarie Gayle has been our Chief Executive Officer and a member of the Board of Directors since 2011 and our Chairman since March 2017. She is also our Chief Executive Officer for our flagship products business, Coda Octopus Products, Limited (UK) since 2013. Prior thereto, she spent two years assisting with the restructuring of our Company. She previously served with the Company as Senior Vice President of Legal Affairs between 2006 and 2007. Earlier in her career she worked for a major London law practice, the United Nations and the European Union. Ms. Gayle has a strong background in restructuring and has spent more than 12 years in a number of countries where she has been the lead adviser to a number of transitional administrations on privatizing banks and reforming state-owned assets in the Central Eastern European countries including banking, infrastructure, mining and telecommunications assets. Ms. Gayle has also managed a number of large European Union funded projects. Ms. Gayle holds a Law degree gained at the University of London and a Masters of Law degree in International Commercial Law from Cambridge University. She is qualified to practice as a solicitor in England & Wales. Because of her wealth of experience in corporate governance, large scale project management, restructuring, strategy, structuring and managing corporate transactions, we believe that she is highly qualified to act as our Chief Executive Officer.
Michael Midgley has been our Chief Financial Officer since December 2017 and our acting Chief Financial Officer since 2013. He has also been Chief Executive Officer of Colmek since 2010, which he joined in 2008. He is a qualified CPA and has had his own practice as well as working for regional accounting firms, specializing in SEC and Tax practice areas. Mr. Midgley attended the University of Utah where he obtained a BA in Accounting. Due to Mr. Midgley’s expertise in financial reporting, we believe that he is highly qualified to serve as the Company’s Chief Financial Officer.
Blair Cunningham has been with the Company since July 2004 and has had a number of roles including President of Technology and CEO of Coda Octopus Products, Inc. (current positions), Chief Technology Officer since 2005 and Technical Manager of Coda Octopus Products Ltd between July 2004 and July 2005. Mr. Cunningham received an HND in Computer Science in 1989 from Moray College of Further Education, Elgin, Scotland. Because of Mr. Cunningham’s expertise in technology, systems software development and project management, the Company believes that he is highly qualified to serve in his current roles.
Michael Hamilton was our Chairman of the Board between June 2010 and March 2017. He is currently serving as an independent director of our Board. Since 2014, Mr. Hamilton has provided accounting and valuation services for a varied list of clients. He was Senior Vice President of Powerlink Transmission Company from 2011 through 2014. From 1988 to 2003, he was an audit partner at PricewaterhouseCoopers. He holds a Bachelor of Science in Accounting from St. Frances College and is a certified public accountant and is accredited in business valuation. Because of Mr. Hamilton’s background in auditing, strategic corporate finance solutions, financial management and financial reporting, we believe that he is highly qualified to be a member of our Board of Directors.
Tyler G Runnels was elected as a director at the 2018 annual meeting to fill a vacancy. Mr. Runnels has nearly 30 years of investment banking experience including debt and equity financings, private placements, mergers and acquisitions, initial public offerings, bridge financings, and financial restructurings. Since 2003 Mr. Runnels has been the Chairman and Chief Executive Officer of T.R. Winston & Company, LLC, an investment bank and member of FINRA, where he began working in 1990. Mr. Runnels was an early stage investor in our company and T.R. Winston & Company, LLC has served as our exclusive placement agent in one of our private placements raising early rounds of capital for our company. Mr. Runnels has successfully completed and advised on numerous transactions for clients in a variety of industries, including healthcare, oil and gas, business services, manufacturing, and technology. Mr. Runnels is also responsible for working with high net worth clients seeking to diversify their portfolios to include real estate products through established relationships with real estate brokers, accountants, attorneys, qualified intermediaries and financial advisors. Prior to joining T.R. Winston & Co., LLC, Mr. Runnels held the position of Senior Vice President of Corporate Finance for H.J. Meyers & Company, a regional investment bank. Mr. Runnels is a member of the board of directors of Lilis Energy, Inc. (NYSE American: LLEX) and Level Brands, Inc. (NYSE American: LEVB) and serves on the Pepperdine University President’s Campaign Cabinet. Mr. Runnels received a B.S. and MBA from Pepperdine University. Mr. Runnels holds FINRA Series 7, 24, 55, 63 and 79 licenses.
| 35 |
Per Wimmer has been a director since May 2017. Since 2011, Mr. Wimmer has been the Chief Executive Officer of Wimmer Family Office, a London based private investment firm founded by him. In 2007, he founded Wimmer Financial, a merchant bank/corporate advisory firm specializing in natural resources, real estate, infrastructure, aviation, shipping and project debt financing. Prior thereto, he was active in the institutional sales area at Goldman Sachs & Co.’s New York and London offices where he focused his attention primarily on advising Scandinavian financial institutions. Mr. Wimmer holds law degrees from the University of Copenhagen and the University of London. He also earned a Master of Public Administration from Harvard University with concentrations in business, finance and international relations. Mr. Wimmer is the author of a number of books including “Wall Street” that discusses bubbles in the financial markets, and “The Green Bubble”, that promotes the argument that for green energy to be truly sustainable, it must be commercially sustainable. His interests are wide ranging and include space travel and exploration. He has completed space training and has been working closely with Richard Branson to develop Virgin Galactic’s space program. The Company’s board of directors believes that Mr. Wimmer’s extensive experience in global finance and cross border investments makes him highly qualified to be a member of our Board of Directors.
Mary Losty has been a director since July 2017. She is a private investor in both US equities and real estate. She currently serves as Commissioner on both Dorchester County and the City of Cambridge, Maryland’s Planning and Zoning Commissions. She also serves as a Committeeman for the Eastern Shore Land Conservancy as well as the Pine Street Committee of Cambridge, MD. She served as a member of the Board of Procera Networks, Inc. from March 2007 until that company was successfully sold in June 2015 to a private equity firm. She was a member of that company’s Audit Committee and the former Chairman of the Nominating and Governance Committee. Ms. Losty was a director of Blue Earth, Inc. (formerly Genesis Fluid Solutions Holdings, Inc.) from 2009 to 2011. Ms. Losty retired in 2010 as the General Partner at Cornwall Asset Management, LLC, a portfolio management firm located in Baltimore, Maryland, where she was responsible for the firm’s investment in numerous companies since 1998. Ms. Losty’s prior experience includes working as a portfolio manager at Duggan & Associates from 1992 to 1998 and as an equity research analyst at M. Kimelman & Company from 1990 to 1992. Prior to that, she worked as an investment banker at Morgan Stanley and Co., and for several years prior to that she was the top aide to James R. Schlesinger, a five-time U.S. cabinet secretary. Ms. Losty received both her BS and JD from Georgetown University, the latter with magna cum laude distinction. We believe that Ms. Losty’s extensive dealings with the investment community makes her highly qualified to be a member of our Board of Directors.
Family Relationships
None of our Directors are related by blood, marriage, or adoption to any other Director, executive officer, or other key employees.
| 36 |
Board Leadership Structure
The Board of Directors is currently chaired by the Chief Executive Officer of the Company, Annmarie Gayle. The Company believes that combining the positions of Chief Executive Officer and Chairman of the Board of Directors helps to ensure that the Board of Directors and management act with a common purpose. Integrating the positions of Chief Executive Officer and Chairman can provide a clear chain of command to execute the Company’s strategic initiatives. The Company also believes that it is advantageous to have a Chairman with an extensive history with and knowledge of the Company. Notwithstanding the combined role of Chief Executive Officer and Chairman, key strategic initiatives and decisions involving the Company are discussed and approved by the entire Board of Directors. The Company believes that the current leadership structure and processes maintains an effective oversight of management and independence of the Board of Directors as a whole without separate designation of a lead independent director. However, the Board of Directors will continue to monitor its functioning and will consider appropriate changes to ensure the effective independent function of the Board of Directors in its oversight responsibilities.
Independence of the Board of Directors and its Committees
After review of all relevant transactions or relationships between each director, or any of his or her family members, and the Company, its senior management and its Independent Registered Public Accounting Firm, the Board of Directors has determined that all of the Company’s directors are independent within the meaning of the applicable NASDAQ listing standards, except Ms. Gayle, the Company’s Chairman and Chief Executive Officer. The Board of Directors met four times and acted by unanimous written consent four times during the fiscal year ended October 31, 2018. Each member of the Board of Directors attended all meetings of the Board of Directors held in the last fiscal year during the period for which he or she was a director and of the meetings of the committees on which he or she served held in the last fiscal year during the period for which he or she was a committee member.
The Board of Directors has three committees: the Audit Committee, the Compensation Committee and the Nominating Committee. Below is a description of each committee of the Board of Directors. The Board of Directors has determined that each member of each committee meets the applicable rules and regulations regarding “independence” and that each member is free of any relationship that would interfere with his individual exercise of independent judgment with regard to the Company.
Audit Committee
The Audit Committee of the Board of Directors oversees the Company’s corporate accounting and financial reporting process. For this purpose, the Audit Committee performs several functions. The Audit Committee, among other things: evaluates the performance, and assesses the qualifications, of the Independent Registered Public Accounting Firm; determines and pre-approves the engagement of the Independent Registered Public Accounting Firm to perform all proposed audit, review and attest services; reviews and pre-approves the retention of the Independent Registered Public Accounting Firm to perform any proposed, permissible non-audit services; determines whether to retain or terminate the existing Independent Registered Public Accounting Firm or to appoint and engage a new independent registered Public Accounting Firm for the ensuing year; confers with management and the Independent Registered Public Accounting Firm regarding the effectiveness of internal controls over financial reporting; establishes procedures as required under applicable law, for the receipt, retention and treatment of complaints received by the Company regarding accounting, internal accounting controls or auditing matters and the confidential and anonymous submission by employees of concerns regarding questionable accounting or auditing matters; reviews the financial statements to be included in the Company’s Annual Report on Form 10-K and recommends whether or not such financial statements should be so included; and discusses with management and the Independent Registered Public Accounting Firm the results of the annual audit and review of the Company’s quarterly financial statements.
The Audit Committee is currently composed of three outside directors: Michael Hamilton (Chairman), Per Wimmer and Mary Losty. The Audit Committee met four times during the fiscal year ended October 31, 2018. The Audit Committee Charter is available on the Company’s website, www.codaoctopusgroup.com.
| 37 |
The Board of Directors periodically reviews the NASDAQ listing standards’ definition of independence for Audit Committee members and has determined that all members of the Company’s Audit Committee are independent (as independence is currently defined in Rule 5605(c)(2)(A) of the NASDAQ listing standards and Rule 10A-3(b)(1) of the Securities Exchange Act of 1934, as amended). The Board of Directors has determined that Michael Hamilton qualifies as an “audit committee financial expert,” as defined in applicable SEC rules. The Board of Directors made a qualitative assessment of Mr. Hamilton’s level of knowledge and experience based on a number of factors, including his formal education and his service in executive capacities having financial oversight responsibilities.
Compensation Committee
The Compensation Committee of the Board of Directors reviews, modifies and approves the overall compensation strategy and policies for the Company. The Compensation Committee, among other things: reviews and approves corporate performance goals and objectives relevant to the compensation of the Company’s officers; determines and approves the compensation and other terms of employment of the Company’s Chief Executive Officer; determines and approves the compensation and other terms of employment of the other officers of the Company; and administers the Company’s stock option and purchase plans, pension and profit sharing plans and other similar programs.
The Compensation Committee is composed of three outside directors: Per Wimmer (Chair), Michael Hamilton and G. Tyler Runnels. All members of the Compensation Committee are independent (as independence is currently defined in Rule 5605(a)(2) of the NASDAQ listing standards). The Compensation Committee met three times during the fiscal year ended October 31, 2018. The Compensation Committee Charter is available on the Company’s website, www.codaoctopusgroup.com.
Compensation Committee Interlocks and Insider Participation
No member of our compensation committee has at any time been an employee of ours. None of our executive officers serves as a member of the board of directors or compensation committee of any entity that has one or more executive officers serving as a member of our board of directors or compensation committee.
Nominating Committee
The Nominating Committee of the Board of Directors is responsible for, among other things: identifying, reviewing and evaluating candidates to serve as directors of the Company; reviewing, evaluating and considering incumbent directors; recommending to the Board of Directors for selection candidates for election to the Board of Directors; making recommendations to the Board of Directors regarding the membership of the committees of the Board of Directors; and assessing the performance of the Board of Directors.
The Nominating and Governance Committee is currently composed of three outside directors: Mary Losty (Chair), Michael Hamilton and Per Wimmer. All members of the Nominating Committee are independent (as independence is currently defined in Rule 5605(a)(2) of the NASDAQ listing standards). The Nominating Committee met two times during the fiscal year ended October 31, 2018. The Nominating Committee Charter is available on the Company’s website, www.codaoctopusgroup.com.
The Nominating Committee has not established any specific minimum qualifications that must be met for recommendation for a position on the Board of Directors. Instead, in considering candidates for director the Nominating Committee will generally consider all relevant factors, including among others the candidate’s applicable education, expertise and demonstrated excellence in his or her field, the usefulness of the expertise to the Company, the availability of the candidate to devote sufficient time and attention to the affairs of the Company, the candidate’s reputation for personal integrity and ethics and the candidate’s ability to exercise sound business judgment. Other relevant factors, including diversity, experience and skills, will also be considered. Candidates for director are reviewed in the context of the existing membership of the Board of Directors (including the qualities and skills of the existing directors), the operating requirements of the Company and the long-term interests of its stockholders.
| 38 |
The Nominating Committee considers each director’s executive experience and his or her familiarity and experience with the various operational, scientific and/or financial aspects of managing companies in our industry.
With respect to diversity, the Nominating Committee seeks a diverse group of individuals who have executive leadership experience and a complementary mix of backgrounds and skills necessary to provide meaningful oversight of the Company’s activities. The Nominating Committee annually reviews the Board’s composition in light of the Company’s changing requirements. The Nominating Committee uses the Board of Director’s network of contacts when compiling a list of potential director candidates and may also engage outside consultants. Pursuant to its charter, the Nominating Committee will consider, but not necessarily recommend to the Board of Directors, potential director candidates recommended by stockholders. All potential director candidates are evaluated based on the factors set forth above, and the Nominating Committee has established no special procedure for the consideration of director candidates recommended by stockholders.
Employment Agreements
Annmarie Gayle
Pursuant to the terms of an employment agreement dated March 16, 2017, the Company employs Ms. Gayle as its Chief Executive Officer on a full-time basis and a member of its Board of Directors. The annual salary is $230,000 payable on a monthly basis. Ms. Gayle is also entitled to an annual performance bonus of up to $100,000, upon achieving certain targets that are to be defined on an annual basis. The agreement provides for 30 days of paid vacation in addition to public holidays observed in Scotland.
The agreement has no definitive term and may be terminated only upon twelve months’ prior written notice by Ms. Gayle. In the event that the Company terminates her at any time without cause, she is entitled to a payment equal to her annual salary as well as a separation bonus of $150,000. The Company may terminate the agreement for cause, immediately and without notice. Among others, “for cause” includes gross misconduct, a serious or repeated breach of the agreement and negligence and incompetence as reasonably determined by the Company’s Board. The agreement includes a 12-month non-compete and non-solicitation provision.
Blair Cunningham
Under the terms of an employment contract dated January 1, 2013, our wholly owned subsidiary Coda Octopus Products, Inc. employs Blair Cunningham as its Chief Executive Officer and President of Technology. He is being paid an annual base salary of $175,000 with effect from January 1, 2018, subject to review by the Company’s Chief Executive Officer. Mr. Cunningham is entitled to 25 vacation days in addition to any public holiday.
The agreement may be terminated only upon twelve-month prior written notice without cause. The Company may terminate the agreement for cause, immediately and without notice. Among others, “for cause” includes gross misconduct, a serious or repeated breach of the agreement and negligence and incompetence as reasonably determined by the Company’s Board. The agreement includes a 18-month non-compete and non-solicitation provision.
Michael Midgley
Pursuant to the terms of an employment agreement dated June 1, 2011, Mike Midgley was appointed the Chief Executive Officer of our wholly owned subsidiary Coda Octopus Colmek, Inc and our Chief Financial Officer. He is being paid an annual salary of $200,000 subject to an annual review by Colmek’s Board of Directors and the Company’s Chief Executive Officer. Mr. Midgley is entitled to 20 vacation days in addition to any public holiday.
The agreement may be terminated at any time upon 4 months prior written notice. The Company may terminate the agreement for cause, immediately and without notice. Among others, “for cause” includes gross misconduct, a serious or repeated breach of the agreement and negligence and incompetence as reasonably determined by the Company’s Board. The agreement includes a 12-month non-compete and non-solicitation provision. On December 6, 2017, the board of directors of the Company appointed Mr. Midgley to be the Company’s Chief Financial Officer. In connection with this appointment, all rights and obligations under Mr. Midgley’s employment agreement with Colmek were transferred to and have been assumed by the Company.
Code of Ethics
We have adopted a code of ethics for all our employees, including our chief executive officer, principal financial officer and principal accounting officer or controller, and/or persons performing similar functions, which is available on our website, under the link entitled “Code of Ethics”.
| 39 |
ITEM 11. EXECUTIVE COMPENSATION
The Summary Compensation Table shows certain compensation information for services rendered for the fiscal years ended October 31, 2018 and 2017 by our executive officers. The following information includes the dollar value of base salaries, bonus awards, stock options grants and certain other compensation, if any, whether paid or deferred.
| Name
and Principal Position |
Year | Salary | Bonus | Restricted Stock Awards | Option Awards | * All Other Compensation | Total | |||||||||||||||||||||
| ($) | ($) | ($) | ($) | ($) | ($) | |||||||||||||||||||||||
| Annmarie Gayle, | 2018 | 230,000 | -0- | -0 | - | -0- | -0- | 230,000 | ||||||||||||||||||||
| Chief Executive Officer | 2017 | 230,000 | -0- | -0 | - | -0- | -0- | 230,000 | ||||||||||||||||||||
| Michael Midgley | 2018 | 200,000 | -0- | -0 | - | -0- | 11,558 | 211,558 | ||||||||||||||||||||
| Chief Financial Officer | 2017 | 200,000 | -0- | -0 | - | -0- | 13,332 | 213,332 | ||||||||||||||||||||
| Blair Cunningham | 2018 | 172,000 | -0- | -0 | - | -0- | 18,085 | 190,085 | ||||||||||||||||||||
| President of Technology | 2017 | 160,000 | -0- | -0 | - | -0- | 17,393 | 177,393 | ||||||||||||||||||||
*The amounts described in the category of “All Other Compensation” comprise Health, Dental, Vision, Short Term Disability, Long Term Disability and Accidental Death and Dismemberment insurance premiums which the Company contributed to the officers’ identified plan.
DIRECTOR COMPENSATION
The following table sets forth the compensation paid to each of our directors (who are not also officers of the Company) for the fiscal year ended October 31, 2018, in connection with their services to the company. In accordance with the Commission’s rules, the table omits columns showing items that are not applicable. Except as set forth in the table, no persons were paid any compensation for director services.
| Name | Fees Earned or Paid in Cash ($) | Stock Awards ($) | Total
($) |
|||||||||
| Michael Hamilton | 26,667 | 26,667 | ||||||||||
| *Francis (Chuck) Rogers | 10,000 | 10,000 | ||||||||||
| Per Wimmer | 10,000 | 10,000 | ||||||||||
| *Nina Hoque | 8,967 | 8,967 | ||||||||||
| Mary Losty | 10,000 | 10,000 | ||||||||||
| Tyler G Runnels | 2,500 | 2,500 | ||||||||||
*Both have since retired from our Board of Directors
2017 Stock Incentive Plan
On December 6, 2017, the Board of Directors adopted the 2017 Stock Incentive Plan (the “Plan”). The purpose of the Plan is to advance the interests of the Company and its stockholders by enabling the Company and its subsidiaries to attract and retain qualified individuals through opportunities for equity participation in the Company, and to reward those individuals who contribute to the Company’s achievement of its economic objectives. The Plan was adopted subject to stockholders’ approval. This Plan was approved by Stockholders at its meeting held on or around July 24, 2018.
The maximum number of shares of Common Stock that will be available for issuance under the Plan will be 913,612. The shares available for issuance under the Plan may, at the election of the Committee, be either treasury shares or shares authorized but unissued, and, if treasury shares are used, all references in the Plan to the issuance of shares will, for corporate law purposes, be deemed to mean the transfer of shares from treasury.
The Plan is administered by the Compensation Committee of the Board of Directors which has the authority to determine all provisions of Incentive Awards as the Committee may deem necessary or desirable and as consistent with the terms of the Plan, including, without limitation, the following: (i) eligible recipients; (ii) the nature and extent of the Incentive Awards to be made to each Participant; (iii) the time or times when Incentive Awards will be granted; (iv) the duration of each Incentive Award; and (v) the restrictions and other conditions to which the payment or vesting of Incentive Awards may be subject.
No awards have been made under the Plan to date.
Section 16(a) Beneficial Ownership Reporting Compliance
Under the Exchange Act, our directors, our executive officers, and any persons holding more than 10% of our common stock are required to report their ownership of the common stock and any changes in that ownership to the Securities and Exchange Commission. To our knowledge, based solely on our review of the copies of such reports received or written representations from certain reporting persons that no other reports were required, except as set forth below, we believe that during our fiscal year ended October 31, 2018, no reports relating to our securities required to be filed by current reporting persons were filed late.
Bryan Ezralow and the Bryan Ezralow 1994 Trust were late in their filing of a Form 4 relating to a transaction that took place on October 31, 2018.
We will continue monitoring Section 16 compliance by each of our directors and executive officers and will assist them where possible in their filing obligations.
| 40 |
ITEM 12. SECURITY OWNERSHIP OF CERTAIN BENEFICIAL OWNERS AND MANAGEMENT AND RELATED STOCKHOLDER MATTERS
The following table sets forth information as of February 1, 2019, regarding the beneficial ownership of our Common Stock, based on information provided by (i) each of our executive officers and directors; (ii) all executive officers and directors as a group; and (iii) each person who is known by us to beneficially own more than 5% of the outstanding shares of our Common Stock. The percentage ownership in this table is based on 10,664,381 shares issued and outstanding as of February 1, 2019.
Unless otherwise indicated, we believe that all persons named in the following table have sole voting and investment power with respect to all shares of Common Stock that they beneficially own.
| Name and Address of Beneficial Owner (1) | Amount
and Nature of Beneficial Ownership of Common Stock | Percent
of Common Stock | ||||||
| Michael Hamilton | 7,143 | * | ||||||
| Annmarie Gayle (2) | 13,037 | * | ||||||
| Michael Midgley | 7,143 | * | ||||||
| Blair Cunningham | 24,297 | * | ||||||
| Per Wimmer | 7,143 | * | ||||||
| Mary Losty | 82,143 | * | ||||||
| Niels
Sondergaard Carit Etlars Vej 17A 8700 Horsens Denmark | 2,317,486 | 21.7 | % | |||||
G. Tyler Runnels (3) 2049 Century Park East, Suite 320 Los Angeles, CA 90067 | 1,284,752 | 12.0 | % | |||||
J. Steven Emerson (4) 1522 Ensley Avenue Los Angeles, CA 90024 | 1,117,425 | 10.5 | % | |||||
Bryan Ezralow (5) 23622 Calabasas Rd. Suite 200 Calabasas, CA 91302 | 1,189,610 | 11.2 | % | |||||
Sandy Hills B.V. (6) Albert Hahnplantsoen 23 Amsterdam The Netherlands | 1,274,972 | 12.0 | % | |||||
| All Directors and Executive Officers as a Group (Seven persons): | 1,451,852 | 13.6 | % | |||||
*) Less than 1%.
| 1) | Unless otherwise indicated, the address of all individuals and entities listed below is c/o Coda Octopus Group, Inc. 9100 Conroy Windermere Road, Suite #200, Windermere, FL 34786. |
| 2) | Does not include 2,317,486 shares beneficially owned by Ms. Gayle’s domestic partner. Ms. Gayle disclaims any beneficial ownership in those shares. |
| 41 |
| 3) | Includes 1,032,052 shares held by the G. Tyler Runnels and Jasmine Niklas Runnels TTEES of The Runnels Family Trust DTD 1-11-2000 of which Mr. Runnels is a trustee; 252,700 shares held by T.R. Winston; 25,140 shares held by High Tide LLC; 24,368 shares held by TRW Capital Growth Fund, Ltd.; and 14,286 shares held by Pangaea Partners. The Company has been advised that Mr. Runnels has voting and dispositive power with respect to all of these shares. |
| 4) | Includes the following: 138,776 held by J.Steven Emerson IRA R/O II; 126,685 shares held by J Steven Emerson Roth IRA; 49,328 shares held by the Brian Emerson IRA; 344,169 shares held by Emerson Partners; 8,286 shares held by the Alleghany Meadows IRA; and 8,286 shares held by the Jill Meadows IRA. The Company has been advised that Mr. Emerson has voting and dispositive power with respect to all of these shares. |
| 5) | Consists of 1,012,569 shares held by the Bryan Ezralow 1994 Trust u/t/d 12/22/1994; and 177,041 shares held by EZ MM&B Holdings, LLC. The Company has been advised that Mr. Ezralow has voting and dispositive power with respect to these shares. |
| 6) | According to filings made with the Securities and Exchange Commission, Malabar Hill NV, statutory director of Sandy Hills BV has voting and dispositive power over the shares held by this entity. Mr. F.H. Fentener van Vlissingen is statutory director of Malabar Hill NV. |
ITEM 13. CERTAIN RELATIONSHIPS AND RELATED TRANSACTIONS, AND DIRECTOR INDEPENDENCE
On October 24, 2016, our CEO provided a loan of $1,000,000 to our subsidiary Coda Octopus Colmek. The loan provided for 4.5% interest and a repayment date of November 30, 2018. On or around October 31, 2018 the Company repaid $500,000 plus $87,500 representing interest on the $1,000,000 for the entire loan period. On December 24, 2018, the Company repaid the remaining $500,000 and interest to our CEO (for full details see Note 8 of our Consolidated Financial Statements for year ended October 31, 2018 and 2017). No further amounts are payable to our CEO under the loan agreement.
ITEM 14. PRINCIPAL ACCOUNTANT FEES AND SERVICES
Audit Fees. The aggregate fees billed by Frazier & Deeter, LLC, our principal accountants, for professional services rendered for the audit of the Company’s annual financial statements for the last two fiscal years and for the reviews of the financial statements included in the Company’s Quarterly reports on Form 10-Q during the last two fiscal years 2018 and 2017 were $173,470 and $151,506, respectively.
Audit-Related Fees. The aggregate fees billed by Frazier & Deeter, LLC, our principal accountants, for professional services rendered in connection with the audits of acquired businesses, the review of and consent to the filing of registration statements, and assistance in responding to comment letters issued by the Securities & Exchange Commission during the last two fiscal years 2018 and 2017 were $0 and $0, respectively.
Tax Fees. The aggregate fees billed by the Company’s principal accountants for tax compliance, tax advice and tax planning services rendered to the Company during the last two fiscal years 2018 and 2017 were $0 and $0, respectively.
All Other Fees. The Company did not engage its principal accountants to render services to the Company during the last two fiscal years, other than as reported above.
Prior to the Company’s engagement of its independent auditor, such engagement is approved by the Company’s audit committee. The services provided under this engagement may include audit services, audit-related services, tax services and other services. Pre-approval is generally provided for up to one year and any pre-approval is detailed as to the particular service or category of services and is generally subject to a specific budget. Pursuant to the Company’s Audit Committee Charter, the independent auditors and management are required to report to the Company’s audit committee at least quarterly regarding the extent of services provided by the independent auditors in accordance with this pre-approval, and the fees for the services performed to date. The audit committee may also pre-approve particular services on a case-by-case basis. All audit-related fees, tax fees and other fees incurred by the Company for the year ended October 31, 2018, were approved by the Company’s audit committee.
| 42 |
ITEM 15. EXHIBITS, FINANCIAL STATEMENT SCHEDULES
| * | Incorporated by reference to the Company’s Registration Statement on Form SB-2 (SEC File No.143144) | |
| ** | Incorporated by reference to the Company’s Registration Statement on Form 10. | |
| *** | Incorporated by reference to the Company’s Annual Report on Form 10-KSB for the year ended October 31, 2007 | |
| **** | Incorporated by reference to the Company’s Annual Report on Form 10-KSB for the year ended October 31, 2010 | |
| ***** | Incorporated by reference to the Company’s Registration Statement on Form 10/A filed March 29,2017 | |
| ****** | Incorporated by reference to the Company’s Current Report on Form 8-K filed May 2, 2017 | |
| ******* | Incorporated by reference to the Company’s Annual Report on Form 10 for the year ended October 31, 2017 |
| 43 |
Pursuant to the requirements of Section 13 or 15(d) of the Securities Exchange Act of 1934, as amended, the Registrant has duly caused this report to be signed on its behalf by the undersigned thereunto duly authorized.
| DATE: February 1, 2019 | CODA OCTOPUS GROUP, INC. |
| /s/ Annmarie Gayle | |
| Chief Executive Officer |
POWER OF ATTORNEY
Each person whose signature appears below constitutes and appoints Annmarie Gayle, his or her true and lawful attorney-in-fact and agent, with full power of substitution and re-substitution, severally, for him or her and in his or her name, place and stead, in any and all capacities, to sign any and all amendments to this annual report on Form 10-K, and to file the same, with all exhibits thereto and other documents in connection therewith, with the Securities and Exchange Commission, granting unto said attorneys-in-fact and agents, and each of them, full power and authority to do and perform each and every act and thing requisite and necessary to be done in and about the premises, as fully to all intents and purposes as he might or could do in person, hereby ratifying and confirming all that said attorneys-in-fact and agents, or any of them or their or his or her substitute or substitutes, may lawfully do or cause to be done by virtue hereof. This power of attorney may be executed in counterparts.
Pursuant to the requirements of the Securities Exchange Act of 1934, this report has been signed below by the following persons on behalf of the registrant and in the capacities and on the dates indicated.
| Signature | Title | Date | ||
| /s/ Annmarie Gayle | Chief Executive Officer and Chairman | February 1, 2019 | ||
| Annmarie Gayle | (Principal Executive Officer) | |||
| /s/ Michael Midgley | Chief Financial Officer | February 1, 2019 | ||
| Michael Midgley | (Principal Financial and Accounting Officer) | |||
| /s/ Michael Hamilton | Director | February 1, 2019 | ||
| Michael Hamilton | ||||
| /s/ Per Wimmer | Director | February 1, 2019 | ||
| Per Wimmer | ||||
| /s/ Mary Losty | Director | February 1, 2019 | ||
| Mary Losty | ||||
| /s/ G. Tyler Runnels | Director | February 1, 2019 |
| 44 |
![]()
Consolidated Financial Statements
For the Years Ended October 31, 2018 and 2017
CODA OCTOPUS GROUP, INC.
INDEX TO CONSOLIDATED FINANCIAL STATEMENTS

REPORT OF INDEPENDENT REGISTERED PUBLIC ACCOUNTING FIRM
To the Board of Directors and Stockholders of Coda Octopus Group, Inc.
Opinion on the Consolidated Financial Statements
We have audited the accompanying consolidated balance sheets of Coda Octopus Group, Inc. and subsidiaries (the “Company”) as of October 31, 2018 and 2017, and the related consolidated statements of income and comprehensive income, changes in stockholders’ equity, and cash flows for the years ended October 31, 2018 and 2017, and the related notes (collectively referred to as the consolidated financial statements). In our opinion, the consolidated financial statements present fairly, in all material respects, the financial position of the Company as of October 31, 2018 and 2017, and the results of their operations and cash flows for the years then ended in conformity with accounting principles generally accepted in the United States of America.
Basis for Opinion
These consolidated financial statements are the responsibility of the Company’s management. Our responsibility is to express an opinion on the Company’s consolidated financial statements based on our audits. We are a public accounting firm registered with the Public Company Accounting Oversight Board (United States) (“PCAOB”) and are required to be independent with respect to the Company in accordance with the U.S. federal securities laws and the applicable rules and regulations of the Securities and Exchange Commission and the PCAOB.
We conducted our audits in accordance with the standards of the PCAOB. Those standards require that we plan and perform the audit to obtain reasonable assurance about whether the consolidated financial statements are free of material misstatement, whether due to error or fraud. The Company is not required to have, nor were we engaged to perform, an audit of its internal control over financial reporting. As part of our audits we are required to obtain an understanding of internal control over financial reporting but not for the purpose of expressing an opinion on the effectiveness of the Company’s internal control over financial reporting. Accordingly, we express no such opinion.
Our audits included performing procedures to assess the risks of material misstatement of the consolidated financial statements, whether due to error or fraud, and performing procedures that respond to those risks. Such procedures included examining, on a test basis, evidence regarding the amounts and disclosures in the consolidated financial statements. Our audits also included evaluating the accounting principles used and significant estimates made by management, as well as evaluating the overall presentation of the consolidated financial statements. We believe that our audits provide a reasonable basis for our opinion.
We have served as the Company’s auditor since 2014.

Tampa, Florida
January 31, 2019

| F-1 |
CODA OCTOPUS GROUP, INC.
October 31, 2018 and 2017
| 2018 | 2017 | |||||||
| ASSETS | ||||||||
| CURRENT ASSETS | ||||||||
| Cash and Cash Equivalents | $ | 7,512,422 | $ | 6,851,539 | ||||
| Accounts Receivable, Net | 3,326,623 | 1,418,114 | ||||||
| Inventory | 3,823,243 | 3,652,249 | ||||||
| Unbilled Receivables | 3,013,116 | 2,723,172 | ||||||
| Other Current Assets | 219,424 | 320,814 | ||||||
| Prepaid Expenses | 227,479 | 291,623 | ||||||
| Total Current Assets | 18,122,307 | 15,257,511 | ||||||
| FIXED ASSETS | ||||||||
| Property and Equipment, net | 5,246,183 | 5,213,281 | ||||||
| OTHER ASSETS | ||||||||
| Goodwill and Other Intangibles, net | 3,613,952 | 3,589,281 | ||||||
| Deferred Tax Asset | 1,754,169 | - | ||||||
| Total other assets | 5,368,121 | 3,589,281 | ||||||
| Total Assets | $ | 28,736,611 | $ | 24,060,073 | ||||
The accompanying notes are an integral part of these consolidated financial statements
| F-2 |
CODA OCTOPUS GROUP, INC.
Consolidated Balance Sheets (Continued)
October 31, 2018 and 2017
| 2018 | 2017 | |||||||
| LIABILITIES AND STOCKHOLDERS’ EQUITY | ||||||||
| CURRENT LIABILITIES | ||||||||
| Accounts Payable | $ | 988,148 | $ | 981,994 | ||||
| Accrued Expenses and Other Current Liabilities | 685,454 | 519,208 | ||||||
| Loans and Note Payable, current | 964,695 | 2,212,951 | ||||||
| Deferred Revenue, Current | 602,914 | 402,955 | ||||||
| Total Current Liabilities | 3,241,211 | 4,117,108 | ||||||
| LONG TERM LIABILITIES | ||||||||
| Deferred Revenue, long term | 48,906 | 49,143 | ||||||
| Loans and Note Payable, long term | 1,059,544 | 6,066,402 | ||||||
| Total Long Term Liabilities | 1,108,450 | 6,115,545 | ||||||
| Total Liabilities | 4,349,661 | 10,232,653 | ||||||
| STOCKHOLDERS’ EQUITY | ||||||||
| Preferred stock, Series C, $.001 par value; 5,000,000 shares authorized 0 and 1,000 shares issued and outstanding as of October 31, 2018 and 2017, respectively | - | 1 | ||||||
| Common stock, $.001 par value; 150,000,000 shares authorized, 10,640,416 and 9,136,121 shares issued and outstanding as of October 31, 2018 and 2017, respectively | 10,641 | 9,136 | ||||||
| Additional paid-in capital | 58,599,378 | 52,839,651 | ||||||
| Accumulated other comprehensive loss | (2,228,663 | ) | (2,038,431 | ) | ||||
| Accumulated deficit | (31,994,406 | ) | (36,982,937 | ) | ||||
| Total Stockholders’ Equity | 24,386,950 | 13,827,420 | ||||||
| Total Liabilities and Stockholders’ Equity | $ | 28,736,611 | $ | 24,060,073 | ||||
The accompanying notes are an integral part of these consolidated financial statements
| F-3 |
CODA OCTOPUS GROUP, INC.
Consolidated Statements of Income and Comprehensive Income
For the Years Ended October 31, 2018 and 2017
| Year Ended | ||||||||
| October 31, 2018 | October 31, 2017 | |||||||
| Net Revenues | $ | 18,019,429 | $ | 18,025,173 | ||||
| Cost of Revenues | 5,357,067 | 6,057,448 | ||||||
| Gross Profit | 12,662,362 | 11,967,725 | ||||||
| OPERATING EXPENSES | ||||||||
| Research & Development | 2,571,714 | 1,380,381 | ||||||
| Selling, General & Administrative | 6,779,881 | 6,769,327 | ||||||
| Total Operating Expenses | 9,351,595 | 8,149,708 | ||||||
| INCOME FROM OPERATIONS | 3,310,767 | 3,818,017 | ||||||
| OTHER INCOME (EXPENSE) | ||||||||
| Other Income | 41,222 | 121,278 | ||||||
| Interest Expense | (249,090 | ) | (597,011 | ) | ||||
| Total Other Income (Expense) | (207,868 | ) | (475,733 | ) | ||||
| NET INCOME BEFORE INCOME TAXES | 3,102,899 | 3,342,284 | ||||||
| INCOME TAX BENEFIT (EXPENSE) | ||||||||
| Current tax benefit (expense) | 131,463 | (2,621 | ) | |||||
| Deferred tax benefit | 1,754,169 | - | ||||||
Total Income Tax Benefit (Expense) | 1,885,632 | (2,621 | ) | |||||
| NET INCOME | $ | 4,988,531 | $ | 3,339,663 | ||||
| NET INCOME PER SHARE: | ||||||||
| Basic | $ | 0.49 | $ | 0.37 | ||||
| Diluted | $ | 0.49 | $ | 0.36 | ||||
| WEIGHTED AVERAGE SHARES: | ||||||||
| Basic | 10,093,538 | 9,111,356 | ||||||
| Diluted | 10,093,538 | 9,311,356 | ||||||
| NET INCOME | $ | 4,988,531 | $ | 3,339,663 | ||||
| Other Comprehensive Income | ||||||||
| Foreign currency translation adjustment | (190,232 | ) | 299,006 | |||||
| Total Other Comprehensive (Loss) Income | (190,232 | ) | 299,006 | |||||
| COMPREHENSIVE INCOME | $ | 4,798,299 | $ | 3,638,669 | ||||
The accompanying notes are an integral part of these consolidated financial statements
| F-4 |
CODA OCTOPUS GROUP, INC.
Consolidated Statements of Changes in Stockholders’ Equity
For the Years Ended October 31, 2018 and 2017
| Accumulated | ||||||||||||||||||||||||||||||||
| Preferred Stock Series C | Common Stock | Additional Paid-in |
Other Comprehensive |
Accumulated | ||||||||||||||||||||||||||||
| Shares | Amount | Shares | Amount | Capital | Income (Loss) | Deficit | Total | |||||||||||||||||||||||||
| Balance, October 31, 2016 | 1,100 | $ | 1 | 9,094,156 | $ | 9,094 | $ | 52,805,455 | $ | (2,337,437 | ) | $ | (40,322,600 | ) | $ | 10,154,513 | ||||||||||||||||
| Stock Issued to Board of Directors | - | - | 21,429 | 21 | 93,717 | - | - | 93,738 | ||||||||||||||||||||||||
| Stock Issued to Consultants | - | - | 20,536 | 21 | 40,479 | - | - | 40,500 | ||||||||||||||||||||||||
| Redemption of Series C Preferred Stock | (1,100 | ) | (1 | ) | - | - | (1,099,999 | ) | (1,100,000 | ) | ||||||||||||||||||||||
| Issuance of Series C Preferred Stock in lieu of interest obligations | 1,000 | 1 | - | - | 999,999 | 1,000,000 | ||||||||||||||||||||||||||
| Foreign currency translation adjustment | - | - | - | - | - | 299,006 | - | 299,006 | ||||||||||||||||||||||||
| Net Income | - | - | - | - | - | - | 3,339,663 | 3,339,663 | ||||||||||||||||||||||||
| Balance, October 31, 2017 | 1,000 | $ | 1 | 9,136,121 | $ | 9,136 | $ | 52,839,651 | $ | (2,038,431 | ) | $ | (36,982,937 | ) | $ | 13,827,420 | ||||||||||||||||
| Stock Issued to Investors | - | - | 1,203,727 | 1,204 | 5,311,528 | - | - | 5,312,732 | ||||||||||||||||||||||||
| Stock Issued to Consultants | - | - | 37,500 | 38 | 170,962 | - | - | 171,000 | ||||||||||||||||||||||||
| Stock Issued to Former Officer | - | - | 63,068 | 63 | 277,436 | 277,499 | ||||||||||||||||||||||||||
| Redemption of the Series C Preferred Stock | (1,000 | ) | (1 | ) | - | - | (999,999 | ) | (1,000,000 | ) | ||||||||||||||||||||||
| Issuance of Stock to Redeem Series C Preferred Stock | - | - | 200,000 | 200 | 999,800 | 1,000,000 | ||||||||||||||||||||||||||
| Foreign currency translation adjustment | - | - | - | - | - | (190,232 | ) | - | (190,232 | ) | ||||||||||||||||||||||
| Net Income | - | - | - | - | - | - | 4,988,531 | 4,988,531 | ||||||||||||||||||||||||
| Balance, October 31, 2018 | - | $ | - | 10,640,416 | $ | 10,641 | $ | 58,599,378 | $ | (2,228,663 | ) | $ | (31,994,406 | ) | $ | 24,386,950 | ||||||||||||||||
The accompanying notes are an integral part of these consolidated financial statements
| F-5 |
CODA OCTOPUS GROUP, INC.
Consolidated Statements of Cash Flows
For the Years Ended October 31, 2018 and 2017
| Year Ended | ||||||||
| October 31, 2018 | October 31, 2017 | |||||||
| CASH FLOWS FROM OPERATING ACTIVITIES | ||||||||
| Net income | $ | 4,988,531 |
$ | 3,339,663 | ||||
| Adjustments to reconcile net income to net cash provided by operating activities: | ||||||||
| Depreciation and amortization | 758,408 | 953,626 | ||||||
| Stock compensation | 448,499 | 134,238 | ||||||
| Realized gain on the sale of fixed assets | - | (109,413 | ) | |||||
| (Increase) decrease in operating assets: | ||||||||
| Accounts receivable | (1,908,509 | ) | 1,856,090 | |||||
| Inventory | (349,823 | ) | (1,053,324 | ) | ||||
| Unbilled receivables | 289,944 | 683,521 | ||||||
| Other current assets | 101,390 |
(179,860 | ) | |||||
| Prepaid expenses | 64,144 | (178,739 | ) | |||||
| Deferred tax assets | (1,754,169 | ) | 96,374 | |||||
| Increase (decrease) in operating liabilities: | ||||||||
| Accounts payable and other current liabilities | 172,400 | (689,341 | ) | |||||
| Deferred revenues | 199,722 | (12,443 | ) | |||||
| Net Cash provided by Operating Activities | 2,430,649 | 4,840,392 | ||||||
| CASH FLOWS FROM INVESTING ACTIVITIES | ||||||||
| Purchases of property and equipment | (637,152 | ) | (2,561,551 | ) | ||||
| Proceeds from the sale of fixed assets | - | 504,802 | ||||||
| Restricted cash | - | 13,694 | ||||||
| Net Cash used in Investing Activities | (637,152 | ) | (2,043,055 | ) | ||||
| CASH FLOWS FROM FINANCING ACTIVITIES | ||||||||
| Repayments - loans and notes payable | (6,255,114 | ) | (746,571 | ) | ||||
| Issuance of stock for cash | 5,312,732 | - | ||||||
| Redemption of Series C preferred stock | - | (1,100,000 | ) | |||||
| Net Cash used in Financing Activities | (942,382 | ) | (1,846,571 | ) | ||||
| EFFECT OF CURRENCY EXCHANGE RATE ON CHANGES | ||||||||
| IN CASH | (190,232 | ) | 299,006 | |||||
| NET INCREASE IN CASH | 660,883 | 1,249,772 | ||||||
| CASH AT THE BEGINNING OF THE PERIOD | 6,851,539 | 5,601,767 | ||||||
| CASH AT THE END OF THE PERIOD | $ | 7,512,422 | $ | 6,851,539 | ||||
| SUPPLEMENTAL CASH FLOW INFORMATION | ||||||||
| Cash paid for interest | $ | 291,802 | $ | 697,877 | ||||
| Cash paid for taxes | $ | 27,192 |
$ | 64,993 | ||||
| Non-cash transactions | ||||||||
| Preferred stock issued for accrued interest | $ | - | $ | 1,000,000 | ||||
| Transfer of Demo assets from inventory to property and equipment | $ | 178,829 | $ | - | ||||
| Common stock issued for Series C preferred stock | $ | 1,000,000 | $ | 0 | ||||
| Payment of secured debt directly with proceeds of note payable | $ | - | $ | 8,000,000 | ||||
The accompanying notes are an integral part of these consolidated financial statements
| F-6 |
CODA OCTOPUS GROUP, INC.
Notes to the Consolidated Financial Statements
October 31, 2018 and 2017
NOTE 1 – ORGANIZATION AND DESCRIPTION OF BUSINESS
Coda Octopus Group, Inc. (“Coda,” “the Company,” or “we”) operates two distinct business segments: Products Segment and Services Segment. The Product Segment develops, manufactures and distributes subsea products including its flagship patented real time 3D sonar technology (referred to as “Product Segment”) which it supplies to companies operating in the subsea/marine sector. The Services segment supplies proprietary engineering parts to defense and subsea companies.
The consolidated financial statements include the accounts of Coda Octopus Group, Inc. and our domestic and foreign subsidiaries. All significant intercompany transactions and balances have been eliminated in the consolidated financial statements.
NOTE 2 - SUMMARY OF ACCOUNTING POLICIES
a. Basis of Presentation
The Company has adopted the Financial Accounting Standards Board (FASB) Codification (Codification). The Codification is the single official source of authoritative accounting principles generally accepted in the United States of America (U.S. GAAP) recognized by the FASB to be applied by nongovernmental entities, and all of the Codification’s content carries the same level of authority.
b. Cash and Cash Equivalents
The Company considers all highly liquid investments with a maturity of three months or less at the time of purchase to be cash equivalents. At times such investments may be in excess of federal deposit insurance limits.
c. Trade Accounts Receivable
Trade accounts receivable are recorded net of the allowance for doubtful accounts. The Company provides for an allowance for doubtful collections that is based upon a review of outstanding receivables, historical collection information, and existing economic conditions. Balances still outstanding after the Company has used reasonable collection efforts are written off through a charge to the valuation allowance and a credit to trade accounts receivable. The allowance for doubtful accounts was $47,807 and $36,553 as of October 31, 2018 and 2017 respectively.
d. Property and Equipment
Property and equipment are stated at cost less accumulated depreciation. Expenditures for minor replacements, maintenance and repairs which do not increase the useful lives of the property and equipment are charged to operations as incurred. Major additions and improvements are capitalized. Depreciation and amortization are computed using the straight-line method over their estimated useful lives which is typically three to five years for equipment and 30 years for buildings.
e. Advertising
Coda follows the policy of charging the costs of advertising to expense as incurred, which aggregated $0 for the years ended October, 31 2018 and 2017.
| F-7 |
CODA OCTOPUS GROUP, INC.
Notes to the Consolidated Financial Statements
October 31, 2018 and 2017
NOTE 2 - SUMMARY OF ACCOUNTING POLICIES (Continued)
f. Inventory
Inventory is stated at the lower of cost (weighted average method) or net realizable value. Inventory consisted of the following components:
| October 31, 2018 | October 31, 2017 | |||||||
| Raw materials and parts | $ | 2,887,505 | $ | 2,651,511 | ||||
| Work in progress | 472,204 | 501,692 | ||||||
| Demo goods | - | 349,480 | ||||||
| Finished goods | 463,534 | 149,566 | ||||||
| Total Inventory | $ | 3,823,243 | $ | 3,652,249 | ||||
g. Estimates
The preparation of consolidated financial statements in conformity with U.S. GAAP requires management to make estimates and assumptions that affect the reported amounts of assets and liabilities and disclosure of contingent assets and liabilities at the date of the financial statements and the reported amounts of revenues including unbilled and deferred revenues and expenses during the reporting period. Actual results could differ from those estimates. Significant estimates include estimates related to the percentage of completion method used to account for contracts including costs and earnings in excess of billings, billings in excess of costs and estimated earnings and the valuation of goodwill.
h. Revenue Recognition
Our revenue is derived from sales of underwater technologies and equipment for imaging, mapping, defense and survey applications and from the engineering services which we provide. Revenue is recognized when evidence of a contractual arrangement exists, delivery has occurred or services have been rendered, the contract price is fixed or determinable, and collectability is reasonably assured. No rights of return privileges are granted to customers after delivery.
For arrangements with multiple deliverables, we recognize product revenue by allocating the revenue to each deliverable based on the relative fair value of each deliverable, and recognize revenue when equipment is delivered, and for installation and other services as they are performed.
Our contracts sometimes require customer payments in advance of revenue recognition. These amounts are reflected as liabilities and recognized as revenue when the Company has fulfilled its obligations under the respective contracts.
| F-8 |
CODA OCTOPUS GROUP, INC.
Notes to the Consolidated Financial Statements
October 31, 2018 and 2017
NOTE 2 - SUMMARY OF ACCOUNTING POLICIES (Continued)
h. Revenue Recognition (continued)
For software license sales for which any services rendered are not considered essential to the functionality of the software, we recognize revenue upon delivery of the software, provided (1) there is evidence of a contractual arrangement for this, (2) collection of our fee is considered probable and (3) the fee is fixed and determinable.
For arrangements that are generated from time and material contracts where there is a signed agreement and approved purchase order in place that specifies the fixed hourly rate and other reimbursable costs to be billed based on material and direct labor hours incurred, revenue is recognized based on material and direct labor hours incurred. Revenues from fixed-price contracts are recognized on the percentage-of-completion method, measured by the percentage of costs incurred (materials and direct labor hours) to date to estimated total services (materials and direct labor hours) for each contract. This method is used as expenditures for direct materials and labor hours are considered to be the best available measure of progress on these contracts. Losses on fixed-price contracts are recognized during the period in which the loss first becomes apparent based upon costs incurred to date and the estimated costs to complete as determined by experience from similar contracts. Variations from estimated contract performance could result in adjustments to operating results.
Rental revenue is recognized monthly over the term of the rental period.
On November 1, 2018 the Company adopted Accounting Standards Codification ASC 606, entitled Revenue From Contracts with Customers. While terminology and requirements change in ASC 606, we believe that our existing revenue accounting is compliant with ASC 606 and that our accounting for revenue will not change. Accordingly, our disclosures about our revenue in accordance with ASC 606 will expand to comply with the new requirements, including expansion of quarterly revenue reporting requirements.
i. Concentrations of Risk
Credit losses, if any, have been provided for in the consolidated financial statements and are based on management’s expectations. The Company’s accounts receivable are subject to potential concentrations of credit risk, since a significant part of the Company’s sales are to a small number of companies and, even though these are generally established businesses, market fluctuations such as the price of oil may affect our customers’ ability to meet their obligations to us.
The Company’s bank deposits are held with financial institutions both in and out of the USA. At times, such amounts may be in excess of applicable government mandated insurance limits. The Company has not experienced any losses in such accounts or lack of access to its cash, and believes it is not exposed to significant risk of loss with respect to cash.
j. Contracts in Progress (Unbilled Receivables and Deferred Revenue)
Costs and estimated earnings in excess of billings on uncompleted contracts represent accumulated project expenses and fees which have not been invoiced to customers as of the date of the balance sheet. These amounts are stated on the consolidated balance sheets as Unbilled Receivables of $3,013,116 and $2,723,172 as of October 31, 2018 and 2017, respectively.
Our Deferred Revenue of $602,914 and $402,955 as of October 31, 2018 and 2017, respectively, consists of billings in excess of costs and revenues received as part of our warranty obligations upon completing a sale – elaborated further in the last paragraph of this note.
| F-9 |
CODA OCTOPUS GROUP, INC.
Notes to the Consolidated Financial Statements
October 31, 2018 and 2017
NOTE 2 - SUMMARY OF ACCOUNTING POLICIES (Continued)
j. Contracts in Progress (Unbilled Receivables and Deferred Revenue) (Continued)
Revenue received as part of sales of equipment includes a provision for warranty and is treated as deferred revenue, along with extended warranty sales, with these amounts amortized over 12 months, our stated warranty period, from the date of sale. These amounts are stated on the balance sheets as a component of Deferred Revenue of $335,646 and $452,098 as of October 31, 2018 and 2017, respectively.
k. Income Taxes
The Company accounts for income taxes in accordance with Accounting Standards Codification 740, Income Taxes (ASC 740). Under ASC 740, deferred income tax assets and liabilities are recorded for the income tax effects of differences between the bases of assets and liabilities for financial reporting purposes and their bases for income tax reporting. The Company’s differences arise principally from the use of various accelerated and modified accelerated cost recovery systems for income tax purposes versus straight line depreciation used for book purposes and from the utilization of net operating loss carry-forwards.
Deferred tax assets and liabilities are the amounts by which the Company’s future income taxes are expected to be impacted by these differences as they reverse. Deferred tax assets are based on differences that are expected to decrease future income taxes as they reverse. Correspondingly, deferred tax liabilities are based on differences that are expected to increase future income taxes as they reverse. Note 7 below discusses the amounts of deferred tax assets and liabilities, and also presents the impact of significant differences between financial reporting income and taxable income.
For income tax purposes, the Company uses the percentage of completion method of recognizing revenues on long-term contracts which is consistent with the Company’s financial reporting under U.S. generally accepted accounting principles.
l. Intangible Assets
Intangible assets consist principally of the excess of cost over the fair value of net assets acquired (or goodwill), customer relationships, non-compete agreements and licenses. Goodwill was allocated to our reporting units based on the original purchase price allocation. Goodwill is not amortized and is evaluated for impairment annually or more often if circumstances indicate impairment may exist. Customer relationships, non-compete agreements, patents and licenses are being amortized on a straight-line basis over periods of 2 to 15 years. The Company amortizes its limited lived intangible assets using the straight-line method over their estimated period of benefit. We periodically evaluate the recoverability of intangible assets and take into account events or circumstances that warrant revised estimates of useful lives or that indicate that impairment exists.
| F-10 |
CODA OCTOPUS GROUP, INC.
Notes to the Consolidated Financial Statements
October 31, 2018 and 2017
NOTE 2 - SUMMARY OF ACCOUNTING POLICIES (Continued)
l. Intangible Assets (Continued)
The first step of the goodwill impairment test used to identify potential impairment, compares the fair value of the reporting unit with its carrying amount, including goodwill. If the fair value, which is based on future cash flows, exceeds the carrying amount, goodwill is not considered impaired. If the carrying amount exceeds the fair value, the second step must be performed to measure the amount of the impairment loss, if any. The Company will early adopt Accounting Standards Codification 2017 – 04, Simplifying the Test for Goodwill Impairment, which permits the Company to impair the difference between carrying amount in excess of the fair value of the reporting unit as the reduction in goodwill. ASC 2017-04 eliminates the requirement in previous US GAAP to perform Step 2 of the goodwill impairment test.
At the end of each year, we evaluate goodwill on a separate reporting unit basis to assess recoverability, and impairments, if any, are recognized in earnings. An impairment loss would be recognized in an amount equal to the excess of the carrying amount of the goodwill over the fair value of the reporting unit.
There were no impairment charges recognized during the years ended October 31, 2018 and 2017.
m. Fair Value of Financial Instruments
The Company’s financial instruments include cash and cash equivalents, accounts receivable, accounts payable, accrued expenses and notes payable. The carrying amounts of cash and cash equivalents, accounts receivable, accounts payable and accrued expenses approximate fair values because of the short-term nature of these instruments. The aggregate carrying amount of the notes payable approximates fair value as they bear interest at a market interest rate based on their term and maturity. The fair value of the Company’s long-term debt approximates its carrying amount based on the fact that the Company believes it could obtain similar terms and conditions for similar debt.
n. Foreign Currency Translation
Assets and liabilities are translated at the prevailing exchange rates at the balance sheet dates, related revenue and expenses are translated at weighted average exchange rates in effect during the period and stockholders’ equity, fixed assets and long-term investments are recorded at historical exchange rates. Resulting translation adjustments are recorded as a separate component in stockholders’ equity as part of accumulated other comprehensive income or (loss) as may be appropriate. Foreign currency transaction gains and losses are included in the consolidated statements of income and comprehensive income.
o. Long-Lived Assets
Long-lived assets to be held and used are reviewed for impairment whenever events or changes in circumstances indicate that the carrying amount of an asset may not be recoverable. The carrying amount of a long-lived asset is not recoverable if it exceeds the sum of the undiscounted cash flows expected to result from the use and eventual disposal of the asset. Long-lived assets to be disposed of are reported at the lower of the carrying amount or fair value less cost to sell. No impairment loss was recognized during the years ended October 31, 2018 and 2017, respectively.
p. Research and Development
Research and development costs consist of expenditures for the development of present and future patents and technology, which are not capitalizable. Under current legislation, we are eligible for UK tax credits related to our qualified research and development expenditures.
| F-11 |
CODA OCTOPUS GROUP, INC.
Notes to the Consolidated Financial Statements
October 31, 2018 and 2017
NOTE 2 - SUMMARY OF ACCOUNTING POLICIES (Continued)
p. Research and Development (Continued)
Tax credits are classified as a reduction of research and development expense. During the years ended October 31, 2018 and 2017, we had $140,015 and $416,624 respectively.
q. Stock Based Compensation
We recognize the expense related to the fair value of stock based compensation awards within the consolidated statements of income and comprehensive income. We use the fair value method for equity instruments granted to non-employees and use the Black Scholes model for measuring the fair value. The stock based fair value compensation is determined as of the date of the grant or the date at which the performance of the services is completed (measurement date) and is recognized over the periods in which the related services are rendered.
r. Comprehensive Income
Comprehensive income is defined to include all changes in equity except those resulting from investments by owners and distributions to owners. Comprehensive income includes gains and losses on foreign currency translation adjustments and is included as a component of stockholders’ equity.
s. Earnings per Share
We compute basic earnings per share by dividing the income attributable to common shareholders by the weighted average number of common shares outstanding. Diluted earnings per share include the dilutive effect, if any, from the potential exercise of stock options and warrants.
Following is a reconciliation of earnings from continuing operations and weighted average common shares outstanding for purposes of calculating basic and diluted earnings per share:
| Year Ended | Year Ended | |||||||
| Fiscal Period | October 31, 2018 | October 31, 2017 | ||||||
| Numerator: | ||||||||
| Net Income | $ | 4,988,531 | $ | 3,339,663 | ||||
| Denominator: | ||||||||
| Basic weighted average common shares outstanding | 10,093,538 | 9,111,356 | ||||||
| Conversion of Series C Preferred Stock | - | 200,000 | ||||||
| Diluted outstanding shares | 10,093,538 | 9,311,356 | ||||||
| Earnings from continuing operations | ||||||||
| Basic | $ | 0.49 | $ | 0.37 | ||||
| Diluted | $ | 0.49 | $ | 0.36 | ||||
| F-12 |
CODA OCTOPUS GROUP, INC.
Notes to the Consolidated Financial Statements
October 31, 2018 and 2017
NOTE 2 - SUMMARY OF ACCOUNTING POLICIES (Continued)
t. Recent Accounting Pronouncements
There have been no new accounting pronouncements made effective during fiscal 2018 that have significance, or potential significance, to our Consolidated Financial Statements.
Recent Accounting Pronouncements Not Yet Effective
On May 28, 2014, the FASB issued ASU No. 2014-09, Revenue from Contracts with Customers, requiring an entity to recognize the amount of revenue to which it expects to be entitled for the transfer of promised goods or services to customers. The updated standard will replace most existing revenue recognition guidance in U.S. GAAP when it becomes effective and permits the use of either the retrospective or cumulative effect transition method. In August 2015, the FASB issued ASU No. 2015-14, Revenue from Contracts with Customers: Deferral of the Effective Date, which deferred the effective date of the new revenue standard for periods beginning after December 15, 2016 to December 15, 2017, with early adoption permitted but not earlier than the original effective date. We have evaluated the effects of this updated standard and determined that it will not have a significant impact on our consolidated financial statements but will expand the related disclosures, particularly for quarterly reporting purposes.
On February 24, 2016, the FASB issued ASU No. 2016-02, Leases, requiring lessees to recognize a right-of-use asset and a lease liability on the balance sheet for all leases with the exception of short-term leases. For lessees, leases will continue to be classified as either operating or finance leases in the balance sheet. Lessor accounting is similar to the current model but updated to align with certain changes to the lessee model. Lessors will continue to classify leases as operating, direct financing or sales-type leases. The effective date of the new standard for public companies is for fiscal years beginning after December 15, 2018 and interim periods within those fiscal years. Early adoption is permitted. The new standard must be adopted using a modified retrospective transition and requires application of the new guidance at the beginning of the earliest comparative period presented. We own substantially all of our facilities and rental asset and the effect of adopting this standard was immaterial.
On March 30, 2016, the FASB issued ASU No. 2016-09, Improvements to Employee Share-Based Payment Accounting, which simplifies various aspects related to the accounting and presentation of share-based payments. The amendments require entities to record all tax effects related to share-based payments at settlement or expiration through the income statement and the windfall tax benefit to be recorded when it arises, subject to normal valuation allowance considerations. All tax-related cash flows resulting from share-based payments are required to be reported as operating activities in the statement of cash flows. The updates relating to the income tax effects of the share-based payments including the cash flow presentation must be adopted either prospectively or retrospectively. Further, the amendments allow the entities to make an accounting policy election to either estimate forfeitures or recognize forfeitures as they occur. If an election is made, the change to recognize forfeitures as they occur must be adopted using a modified retrospective approach with a cumulative effect adjustment recorded to opening retained earnings. The effective date of the new standard for public companies is for fiscal years beginning after December 15, 2016 and interim periods within those fiscal years. Early adoption is permitted. We have evaluated this standard and determined that it did not have a significant impact on our consolidated financial statements and related disclosures.
With the exception of the updated standards discussed above, there have been no new accounting pronouncements not yet effective that have significance, or potential significance, to our Consolidated Financial Statements.
u. Liquidity
At October 31, 2018, we had cash on hand of approximately $7.5 million and both billed and unbilled receivables of approximately $6.3 million. Our current cash balance represents approximately one-year of Selling, General and Administrative Expenses. The Company continues to critically evaluate the level of expenses that we incur and reduce those expenses as appropriate.
| F-13 |
CODA OCTOPUS GROUP, INC.
Notes to the Consolidated Financial Statements
October 31, 2018 and 2017
NOTE 3 - INTANGIBLE ASSETS AND GOODWILL
Goodwill and Other Intangible Assets are evaluated on an annual basis. If there is reason to believe that their values have been diminished or impaired, write-downs will be included in results from operations.
The identifiable intangible assets acquired and their carrying value as of October 31, 2018 and 2017, are as follows:
Amortization of patents, customer relationships, non-compete agreements and licenses included as a charge to income amounted to $47,190 and $163,519 for the years ended October 31, 2018 and 2017, respectively. Goodwill is not being amortized.
| October 31, 2018 | October 31, 2017 | |||||||
| Customer relationships (weighted average life of 10 years) | $ | 896,624 | $ | 896,624 | ||||
| Non-compete agreements (weighted average life of 3 years) | 198,911 | 198,911 | ||||||
| Patents and other (weighted average life of 10 years) | 366,036 | 294,175 | ||||||
| Total identifiable intangible assets - gross carrying value | 1,461,571 | 1,389,710 | ||||||
| Less: accumulated amortization | (1,229,727 | ) | (1,182,537 | ) | ||||
| Total intangible assets, net | $ | 231,844 | $ | 207,173 | ||||
Future estimated annual amortization expenses as of October 31, 2018 as follows:
| Years Ending October 31, | Amount | |||
| 2019 | 46,318 | |||
| 2020 | 39,121 | |||
| 2021 | 34,620 | |||
| 2022 | 34,297 | |||
| 2023 | 30,831 | |||
| Thereafter | 46,657 | |||
| Totals | $ | 231,844 | ||
| F-14 |
CODA OCTOPUS GROUP, INC.
Notes to the Consolidated Financial Statements
October 31, 2018 and 2017
NOTE 3 - INTANGIBLE ASSETS AND GOODWILL (Continued)
As a result of the acquisitions of Coda Octopus Martech, Ltd., Coda Octopus Colmek, Inc. and Coda Octopus Products, Ltd. the Company has goodwill in the amount of $3,382,108 as of October 31, 2018 and 2017, respectively. The carrying amount of goodwill as of October 31, 2018 and 2017, respectively, are recorded below:
| October 31, 2018 | October 31, 2017 | |||||||
| Breakout of Goodwill: | ||||||||
| Coda Octopus Colmek, Inc. | $ | 2,038,669 | $ | 2,038,669 | ||||
| Coda Octopus Products, Ltd | 62,315 | 62,315 | ||||||
| Coda Octopus Martech, Ltd | 1,281,124 | 1,281,124 | ||||||
| Total Goodwill | $ | 3,382,108 | $ | 3,382,108 | ||||
Considerable management judgment is necessary to estimate fair value of goodwill. We enlisted the assistance of an independent valuation consultant to determine the values of our intangible assets and goodwill at the dates of acquisition and by management for the dates thereafter.
Based on various market factors and projections used by management, actual results could vary significantly from management’s estimates.
The Company’s policy is to test its goodwill balances for impairment on an annual basis, in the fourth quarter of each year, or more frequently if events or changes in circumstances indicate that the asset might be impaired.
The goodwill assets of the Company arise chiefly from the acquisition of two wholly owned subsidiaries that comprise the Company’s Services Segment – Coda Octopus Colmek and Coda Octopus Martech. The goodwill impairment evaluation was conducted at the end of the financial year 2018 and management’s opinion is that the carrying values are reasonable.
Based on these evaluations, the fair value of goodwill exceeds its carrying value. As such no impairment was recorded by management.
| F-15 |
CODA OCTOPUS GROUP, INC.
Notes to the Consolidated Financial Statements
October 31, 2018 and 2017
NOTE 4 – PROPERTY AND EQUIPMENT
Property and equipment consisted of the following as of:
| October 31, 2018 | October 31, 2017 | |||||||
| Buildings | $ | 3,996,860 | $ | 4,082,346 | ||||
| Land | 200,000 | 200,000 | ||||||
| Office machinery and equipment | 2,875,443 | 2,064,449 | ||||||
| Furniture, fixtures and improvements | 1,109,225 | 1,165,897 | ||||||
| Totals | 8,181,528 | 7,512,692 | ||||||
| Less: accumulated depreciation | (2,935,345 | ) | (2,299,411 | ) | ||||
Property and Equipment – Net | $ | 5,246,183 | $ | 5,213,281 | ||||
Depreciation expense for the years ended October 31, 2018 and 2017 was $711,218 and $790,107, respectively.
NOTE 5 - OTHER CURRENT ASSETS
Other current assets consisted of the following at:
| October 31, 2018 | October 31, 2017 | |||||||
| Deposits | $ | 21,007 | $ | 11,255 | ||||
| Other receivables | 141,294 | 73,600 | ||||||
| Prepaid Tax | 57,123 | 235,959 | ||||||
| Total Other Current Assets | $ | 219,424 | $ | 320,814 | ||||
NOTE 6 – CAPITAL STOCK
Common Stock
On or around January 11, 2017, the Company effected a one for fourteen (1 for 14) reverse stock split of our issued and outstanding common stock. All historical share numbers in this document have been adjusted retroactively to account for the reverse stock split. Effecting the reverse stock split reduced the number of issued and outstanding shares of common stock as of January 11, 2017 to 9,102,192.
| F-16 |
CODA OCTOPUS GROUP, INC.
Notes to the Consolidated Financial Statements
October 31, 2018 and 2017
NOTE 6 – CAPITAL STOCK (Continued)
Common Stock (Continued)
The Company is authorized to issue 150,000,000 shares of common stock with a par value of $0.001 per share.
On November 8, 2016, the Company issued 8,036 shares to two individuals for services rendered. These were valued at $10,500 which was charged to operations.
On June 23, 2017, the Company issued 6,250 shares to two individuals for services rendered. These were valued at $15,000 which was charged to operations.
In June and August 2017, the Company issued 21,429 shares to three of our newly appointed directors for services rendered at a value of $93,738 which was charged to operations.
On October 13, 2017, the Company issued 6,250 shares to two individuals for services rendered. These were valued at $15,000 which was charged to operations.
On January 29, 2018, the Company issued 1,125,950 shares to two investors pursuant to the terms of a private placement for a total purchase price of $4,954,180.
On February 5, 2018, the Company issued to one of its directors pursuant to the terms of the private placement 75,000 shares for a purchase price of $345,750.
On February 12, 2018, the Company issued 2,777 shares to one investor pursuant to their pre-emption rights under the terms of the private placement effected on or around January 29, 2018 for a purchase price of $12,802.
On February 22, 2018 and March 6, 2018, the Company issued a total of 12,500 shares to two individuals for services rendered. These were valued at $57,250, which was charged to operations.
On April 19, 2018 the Company issued 63,068 shares of common stock to a former officer pursuant to the terms of a settlement entered into on or around January 14, 2011. These were valued at $277,499, which was charged to operations.
On August 12, 2018, the Company issued 25,000 shares of common stock to consultants for services rendered. These were valued $113,750, which was charged to operations.
On October 31, 2018, the Company issued 200,000 shares of common stock to the holders of the Series C Preferred Stock for a value of $1,000,000 pursuant to the terms of Certificate of Designation for the Series C Preferred Stock issued and outstanding which provided for a conversion price of $5.00 per share.
As of October 31, 2018, the Company had 10,640,416 shares of common stock issued and outstanding.
| F-17 |
CODA OCTOPUS GROUP, INC.
Notes to the Consolidated Financial Statements
October 31, 2018 and 2017
NOTE 6 – CAPITAL STOCK (Continued)
Preferred Stock
Series A and Series C Preferred Stock
The Company is also authorized to issue 5,000,000 shares of preferred stock with a par value of $0.001 per share. We have designated 50,000 preferred shares as Series A preferred stock and 50,000 preferred shares as Series C preferred stock. The remaining 4,900,000 shares of preferred stock are not designated.
On or around April 28, 2017, pursuant to the terms of an Exchange Agreement between the Company and the Holder, the Company issued 1,000 units of Series C Preferred Stock, each unit having a stated value equal to $1,000. Series C Preferred Stock is convertible by the Holder or the Company subject to the Conversion Conditions being met at a Conversion Price of $5.00 per share and, if not converted, are redeemable at a fixed price of $1,000,000. The Holder is entitled to receive value prior to holders of common stock in case of liquidating the Company. There are no Series C Preferred currently outstanding.
On or around October 31, 2018 the holders of the Series C Preferred Stock referred to in the preceding paragraph, elected to convert all 1,000 units of Series C Preferred Stock into the Company’s Common Stock.
As of October 31, 2018, there are no Series A or Series C Preferred Stock issued or outstanding.
NOTE 7 - INCOME TAXES
The Company files federal income tax returns in the U.S. and state income tax returns in the applicable states on a consolidated basis. The Company’s subsidiaries also file in the appropriate foreign jurisdictions as applicable, most notably the United Kingdom.
The Company is required to determine whether it is more likely than not that a tax position will be sustained upon examination based upon the technical merits of the position. If the more-likely-than-not threshold is met, a company must measure the tax position to determine the amount to recognize in the financial statements. The Company has no significant unrecognized tax benefit during the year ended October 31, 2018.
There are no material tax positions included in the accompanying consolidated financial statements at October 31, 2018 and 2017 for which the ultimate deductibility is highly certain but for which there is uncertainty about the timing of such deductibility. Because of the impact of deferred tax accounting, other than interest and penalties, the disallowance of the shorter deductibility period would not affect the annual effective tax rate but would accelerate the payment of cash to the taxing authority to an earlier period.
The Company uses an asset and liability approach to financial accounting and reporting for income taxes. The difference between the financial statement and tax bases of assets and liabilities is determined annually. Deferred income tax assets and liabilities are computed for those differences that have future tax consequences using the currently enacted tax laws and rates that apply to the periods in which they are expected to affect taxable income. Valuation allowances are established, if necessary, to reduce the deferred tax asset to the amount that will more likely than not be realized. Income tax expense is the current income tax payable or refundable for the period plus or minus the net change in the deferred tax assets and liabilities.
| F-18 |
CODA OCTOPUS GROUP, INC.
Notes to the Consolidated Financial Statements
October 31, 2018 and 2017
NOTE 7 - INCOME TAXES (Continued)
For income tax reporting purposes, the Company’s aggregate U.S. unused net operating losses approximate $8,353,000 and $10,698,000 as of October 31, 2018 and 2017 respectively, which expire beginning in 2028 through 2029, subject to limitations of Section 382 of the Internal Revenue Code, as amended.
The Company has had sustained taxable income in recent years supporting the Company’s judgement that the benefit of the U.S. Net operating loss carry forwards is more likely than not to be realizable in the future periods. As a result the Company has recorded the full deferred tax asset in fiscal year 2018.
The deferred tax asset related to the U.S. tax carry-forward is $1,754,169 and $4,172,200 as October 31, 2018 and 2017 respectively. The Company has recognized a deferred tax asset and deferred tax benefit of $1,754,169 for the year ended October 31, 2018 and provided a valuation reserve against the full amount of the net operating loss benefit of $4,172,200 for the year ended October 31, 2017. For the years ended October 31, 2018 and 2017, the Company had an Alternative Minimum Tax of $7,840 and $27,192 due.
For income tax reporting purposes, the Company’s UK unused net operating losses approximate $525,308 with no expiration. The deferred tax asset related to the UK and Norway tax carry-forwards is approximately $110,314. The Company has provided a valuation reserve against a portion of the net operating loss benefit, because in the opinion of management which is based upon the earning history of the Company, it is more likely than not that the benefits allowed will not be fully realized. Those remaining and not allowed are recorded by the Company and are expected to be used in the near future.
Components of deferred tax assets as of October 31, 2018 and 2017 are as follows:
| October 31, 2018 | October 31, 2017 | |||||||
| Net operating loss carry-forward benefit | $ | 1,754,169 | $ | 4,172,200 | ||||
| Valuation allowance | (4,172,200 | ) | ||||||
| Net deferred tax (liability) asset | $ | 1,754,169 | $ | - | ||||
The Company did not incur any regular income tax but did incur an Alternative Minimum Tax expense in the US. For financial purposes in its U.S. entities and other foreign entities not included above, as we have been able to use net operating loss carry-forwards and other timing differences during the current and prior year to offset any tax liabilities in the various tax jurisdictions. The use of these income tax benefits in the current and prior year have been adjusted for and offset by a valuation allowance as noted above. The Company believes the future use and benefit of these tax assets is still uncertain and may not be realized.
The Company’s income tax returns are subject to audit by taxing authorities for the years beginning November 1, 2015.
On December 22, 2017, the US Congress passed the Tax Cuts and Jobs Act, which reduced the corporate tax rate from 35% to 21%. This change would reduce the deferred tax asset described in Note 7, from $4,172,200 to $2,246,718. The Company had provided full valuation allowance against the deferred tax asset for the year ended October 31, 2017. There was not an impact on the October 31, 2017 consolidated financial statements because of this tax law change.
A reconciliation between the amounts of income tax benefit determined by applying applicable U.S. statutory tax rate to pre-tax income is as follows:
| October 31, 2018 | October 31, 2017 | |||||||
| Federal statutory rate of 21% as of October 31, 2018 and 35% as of October 31, 2017 | $ | 651,609 | $ | 1,169,799 | ||||
| Alternative Minimum Tax | 7,840 | 27,192 | ||||||
| Foreign tax expense (benefit) | (139,303 | ) | (24,571 | ) | ||||
| Recognition of deferred tax benefit | (1,754,169 | ) | - | |||||
| Use of NOL losses on consolidated tax returns | (651,609 | ) | (1,169,799 | ) | ||||
| Total income tax expense (benefit) | $ | (1,885,632 | ) | $ | 2,621 | |||
| F-19 |
CODA OCTOPUS GROUP, INC.
Notes to the Consolidated Financial Statements
October 31, 2018 and 2017
NOTE 8 - LOANS AND NOTES PAYABLE
Loans and notes payable consisted of the following at:
| October 31, 2018 | October 31, 2017 | |||||||
| Secured
note payable to HSBC NA with interest payable on the 28th day of each month at 4.56% per annum. On March 28, 2018 the
Company prepaid a portion of the principal and thereby reducing the principal outstanding under this loan to $1,917,602 resulting
in the repayment obligations (principal and interest payments) being reduced to $43,777 per month. There was no prepayment
penalty associated with the reduction of the principal. It is now expected that the Loan will be repaid within 41
months. | $ | 1,524,239 | $ | 7,279,353 | ||||
One of the subsidiaries has an unsecured working capital loan from the CEO of the Company. The note is due on November 30, 2018 and carries an interest rate of 4.5%. The loan was paid in full on December 24, 2018 and all obligations under this agreement have now been extinguished. | 500,000 | 1,000,000 | ||||||
| Total | 2,024,239 | 8,279,353 | ||||||
| Less: current portion | (964,695 | ) | (2,212,951 | ) | ||||
| Total Long-Term Loans and Notes Payable | $ | 1,059,544 | $ | 6,066,402 | ||||
The HSBC loan is secured by a blanket lien on all of the Company’s US subsidiaries. The foreign subsidiaries are guarantor of the obligations undertaken in the loan agreement.
We have an unused line of credit for up to $455,000 with HSBC UK to use specifically for performance bonds and bank guarantees. As of October 31, 2018, the balance is $0.
This table shows the principal maturities on the HSBC NA Senior Note as of October 31, 2018:
| Years Ending October 31, | Amount | |||
| 2019 | $ | 464,695 | ||
| 2020 | 486,624 | |||
| 2021 | 509,588 | |||
| 2022 | 63,332 | |||
| Totals | $ | 1,524,239 | ||
| F-20 |
CODA OCTOPUS GROUP, INC.
Notes to the Consolidated Financial Statements
October 31, 2018 and 2017
NOTE 9 - ACCUMULATED OTHER COMPREHENSIVE INCOME (LOSS)
Other comprehensive income (loss) consists of foreign currency translation adjustments. Total other comprehensive (loss) income was $(190,232) and $299,006 for the years ended October 31, 2018 and 2017, respectively.
A reconciliation of the other comprehensive income (loss) in the stockholders’ equity section of the consolidated balance sheets is as follows:
| October 31, 2018 | October 31, 2017 | |||||||
| Balance, beginning of year | $ | (2,038,431 | ) | $ | (2,337,437 | ) | ||
| Total other comprehensive income for the year - foreign currency translation adjustment | (190,232 | ) | 299,006 | |||||
| Balance, end of period | $ | (2,228,663 | ) | $ | (2,038,431 | ) | ||
NOTE 10 - CONCENTRATIONS
Significant Customers
During the year ended October 31, 2018, the Company had one customer from whom it generated sales greater than 10% of net revenues. Revenue from this customer was $2,882,761, or 16% of net revenues during the period. Total accounts receivable from this customer at October 31, 2018 was $24,993 or 1% of accounts receivable.
During the year ended October 31, 2017, the Company had one customer from whom it generated sales greater than 10% of net revenues. Revenues from this customer was $4,036,591, or 22% of net revenues during the year. Total accounts receivable from this customer at October 31, 2017 was $289,571 or 21% of accounts receivable.
NOTE 11 - EMPLOYEE BENEFIT PLANS
The Company’s U.S. subsidiaries maintain a matching 401(k) retirement plan. The plan allows the Company to make matching contributions of 10 cents per dollar of employee contributions, up to a maximum of $1,850. U.S. employees who have at least nine months of service with the Company are eligible. In addition, the Company’s UK subsidiaries operate pension schemes which provide for the payment of the full contribution by the Company. These schemes in the UK operate on a defined contribution money purchase basis and the contributions are charged to operations as they arise. Finally, the Company is obligated to provide pension funding according to Norwegian legislation for its subsidiary located in Norway. The Company has an arrangement that fulfills this requirement. Employee benefit costs for the above-noted plans for the years ended October 31, 2018 and 2017 were $51,693 and $53,498, respectively.
| F-21 |
CODA OCTOPUS GROUP, INC.
Notes to the Consolidated Financial Statements
October 31, 2018 and 2017
NOTE 12 - OPERATING LEASES
The Company occupies various office and warehouse facilities pursuant to both term and month-to-month leases. The leases expire at various times through February 28, 2019. The following schedule summarized the future minimum lease payments on the term operating leases:
| Years Ending October 31, | Amount | |||
| 2019 | $ | 35,373 | ||
| Totals | $ | 35,373 | ||
Rent expense for the years ended October 31, 2018 and 2017, was $93,773 and $93,797, respectively.
NOTE 13 -SEGMENT ANALYSIS
We are operating in two reportable segments, which are managed separately based upon fundamental differences in their operations. Coda Octopus Martech and Coda Octopus Colmek operate as contractors (“Services Segment), and the balance of our operations are comprised of product sales (“Products Segment”).
Segment operating income is total segment revenue reduced by operating expenses identifiable with the business segment. Corporate includes general corporate administrative costs.
The Company evaluates performance and allocates resources based upon operating income. The accounting policies of the reportable segments are the same as those described in the summary of accounting policies.
There are inter-segment sales which have been eliminated in our financial statements but are disclosed in the tables below for information purposes.
The following table summarizes segment asset and operating balances by reportable segment for the years ended October 31, 2018 and 2017 respectively.
The Company’s reportable business segments operate in three geographic locations. Those geographic locations are:
* United States
* Europe
* Australia
The Company evaluates performance and allocates resources based upon operating income. The accounting policies of the reportable segments are the same as those described in the summary of accounting policies. There are inter-segment sales which have been removed upon consolidation and for the purposes of the information shown below.
| F-22 |
CODA OCTOPUS GROUP, INC.
Notes to the Consolidated Financial Statements
October 31, 2018 and 2017
Information concerning principal geographic areas is presented below according to the area where the activity has taken place for the years ended October 31, 2018 and 2017 respectively:
NOTE 13 -SEGMENT ANALYSIS (Continued)
| Marine Technology Business (Products) | Marine Engineering Business (Services) | Overhead | Total | |||||||||||||
| Year Ended October 31, 2018 | ||||||||||||||||
| Revenues from External Customers | $ | 11,449,416 | $ | 6,570,013 | $ | - | $ | 18,019,429 | ||||||||
| Cost of Revenues | 1,894,808 | 3,462,259 | - | 5,357,067 | ||||||||||||
| Gross Profit | 9,554,608 | 3,107,754 | - | 12,662,362 | ||||||||||||
| Research & Development | 2,048,285 | 523,429 | - | 2,571,714 | ||||||||||||
| Selling, General & Administrative | 2,882,049 | 2,366,226 | 1,531,606 | 6,779,881 | ||||||||||||
| Total Operating Expenses | 4,930,334 | 2,889,655 | 1,531,606 | 9,351,595 | ||||||||||||
| Income (Loss) from Operations | 4,624,274 | 218,099 | (1,531,606 | ) | 3,310,767 | |||||||||||
| Other Income (Expense) | ||||||||||||||||
| Other Income | 39,122 | 2,100 | - | 41,222 | ||||||||||||
| Interest (Expense) Income | (12,154 | ) | (59,599 | ) | (177,337 | ) | (249,090 | ) | ||||||||
| Total Other Income (Expense) | 26,968 | (57,499 | ) | (177,337 | ) | (207,868 | ) | |||||||||
| Net Income (Loss) before income taxes | 4,651,242 | 160,600 | (1,708,943 | ) | 3,102,899 | |||||||||||
| Current income benefit (expense) | 133,419 | - | (1,956 | ) | (131,463 | ) | ||||||||||
| Deferred tax benefit | - | - | 1,754,169 | 1,754,169 | ||||||||||||
| Income benefit (expense) | 133,419 | - | 1,752,213 | 1,885,632 | ||||||||||||
| Net Income (Loss) | $ | 4,784,661 | $ | 160,600 | $ | 43,270 | $ | 4,988,531 | ||||||||
| Supplemental Disclosures | ||||||||||||||||
| Total Assets | $ | 15,061,693 | $ | 11,674,640 | $ | 2,000,278 | $ | 28,736,611 | ||||||||
| Total Liabilities | $ | 1,142,661 | $ | 1,498,828 | $ | 1,708,172 | $ | 4,349,661 | ||||||||
| Revenues from Intercompany Sales - eliminated from sales above | $ | 1,176,438 | $ | 437,387 | $ | 3,100,000 | $ | 4,713,825 | ||||||||
| Depreciation and Amortization | $ | 461,429 | $ | 282,836 | $ | 14,143 | $ | 758,408 | ||||||||
| Purchases of Long-lived Assets | $ | 499,262 | $ | 61,329 | $ | 76,561 | $ | 637,152 | ||||||||
| F-23 |
CODA OCTOPUS GROUP, INC.
Notes to the Consolidated Financial Statements
October 31, 2018 and 2017
NOTE 13 -SEGMENT ANALYSIS (Continued)
| Marine Technology Business (Products) | Marine Engineering Business (Services) | Overhead | Total | |||||||||||||
| Year Ended October 31, 2017 | ||||||||||||||||
| Revenues from External Customers | $ | 10,986,268 | $ | 7,038,905 | $ | - | $ | 18,025,173 | ||||||||
| Cost of Revenues | 2,246,881 | 3,810,567 | - | 6,057,448 | ||||||||||||
| Gross Profit | 8,739,387 | 3,228,338 | - | 11,967,725 | ||||||||||||
| Research & Development | 919,863 | 460,518 | - | 1,380,381 | ||||||||||||
| Selling, General & Administrative | 3,220,635 | 2,714,054 | 834,638 | 6,769,327 | ||||||||||||
| Total Operating Expenses | 4,140,498 | 3,174,572 | 834,638 | 8,149,708 | ||||||||||||
| Income (Loss) from Operations | 4,598,889 | 53,766 | (834,638 | ) | 3,818,017 | |||||||||||
| Other Income (Expense) | ||||||||||||||||
| Other Income | 117,106 | 4,172 | - | 121,278 | ||||||||||||
| Interest Expense | (709,763 | ) | (56,697 | ) | 169,449 | (597,011 | ) | |||||||||
| Total Other Income (Expense) | (592,657 | ) | (52,525 | ) | 169,449 | (475,733 | ) | |||||||||
| Net Income (Loss) before income taxes | 4,006,233 | 1,241 | (665,189 | ) | 3,342,284 | |||||||||||
| Income refund (expense) | 22,578 | - | (25,199 | ) | (2,621 | ) | ||||||||||
| Net Income | $ | 4,028,810 | $ | 1,241 | $ | (690,388 | ) | $ | 3,339,663 | |||||||
| Supplemental Disclosures | ||||||||||||||||
| Total Assets | $ | 12,374,214 | $ | 11,479,953 | $ | 205,906 | $ | 24,060,073 | ||||||||
| Total Liabilities | $ | 1,109,003 | $ | 1,475,442 | $ | 7,648,208 | $ | 10,232,653 | ||||||||
| Revenues from Intercompany Sales - eliminated from sales above | $ | 1,895,015 | $ | 387,142 | $ | 1,797,775 | $ | 4,079,932 | ||||||||
| Depreciation and Amortization | $ | 528,667 | $ | 412,220 | $ | 12,739 | $ | 953,626 | ||||||||
| Purchases of Long-lived Assets | $ | 2,419,092 | $ | 129,989 | $ | 12,470 | $ | 2,561,551 | ||||||||
| F-24 |
CODA OCTOPUS GROUP, INC.
Notes to the Consolidated Financial Statements
October 31, 2018 and 2017
NOTE 13 -SEGMENT ANALYSIS (Continued)
| USA | Europe | Australia | Total | |||||||||||||
| External Revenues by Geographic Locations | ||||||||||||||||
| Year Ended October 31, 2018 | $ | 7,617,891 | $ | 10,029,806 | $ | 371,732 | $ | 18,019,429 | ||||||||
| Year Ended October 31, 2017 | $ | 7,499,900 | $ | 9,056,589 | $ | 1,468,684 | $ | 18,025,173 | ||||||||
NOTE 14 – COMMITMENTS
Leases
Orlando, Florida
Our corporate offices are co-located with our subsidiary Coda Octopus Products, Inc. in Orlando where we lease premises on a month to month basis at $5,176 per month.
Edinburgh, Scotland (Lease will come to an end on February 28, 2019)
Our wholly owned United Kingdom subsidiary, Coda Octopus Products Ltd, leases office space comprising 4,099 square feet in Edinburgh, United Kingdom. The annual rent is fixed for the duration of the lease at the British Pounds equivalent of $54,130 (the rent is stated in British Pounds and is therefore subject to exchange rate fluctuations). We have now agreed the schedule of works to reinstate the premises to is original conditions (ordinary wear and tear excluded) with the landlord and these premises will be surrendered on February 28, 2019. Following surrender the Company will have no further obligations (either for rent or rates) for these premises.
| F-25 |
CODA OCTOPUS GROUP, INC.
Notes to the Consolidated Financial Statements
October 31, 2018 and 2017
NOTE 14 – COMMITMENTS (Continued)
Employment Agreements
Annmarie Gayle
Pursuant to the terms of an employment agreement dated March 16, 2017, the Company employs Ms. Gayle as its Chief Executive Officer on a full-time basis and a member of its Board of Directors. The annual salary is $230,000 payable on a monthly basis. Ms. Gayle is also entitled to an annual performance bonus of up to $100,000, upon achieving certain targets that are to be defined on an annual basis. The agreement provides for 30 days of paid holidays in addition to public holidays observed in Scotland.
The agreement has no definitive term and may be terminated only upon twelve months’ prior written notice by Ms. Gayle. In the event that the Company terminates her at any time without cause, she is entitled to a payment equal to her annual salary as well as a separation bonus of $150,000. The Company may terminate the agreement for cause, immediately and without notice. Among others, “for cause” includes gross misconduct, a serious or repeated breach of the agreement and negligence and incompetence as reasonably determined by the Company’s Board. The agreement includes a 12-month non-compete and non-solicitation provision.
Blair Cunningham
Under the terms of an employment contract dated January 1, 2013, our wholly owned subsidiary Coda Octopus Products, Inc. employs Blair Cunningham as its Chief Executive Officer and President of Technology. He is being paid an annual base salary of $175,000 with effect from January 1, 2018, subject to review by the Company’s Chief Executive Officer. Mr. Cunningham is entitled to 25 vacation days in addition to any public holiday.
The agreement may be terminated only upon twelve-month prior written notice without cause. The Company may terminate the agreement for cause, immediately and without notice. Among others, “for cause” includes gross misconduct, a serious or repeated breach of the agreement and negligence and incompetence as reasonably determined by the Company’s Board. The agreement includes a 18-month non-compete and non-solicitation provision.
Michael Midgley
Pursuant to the terms of an employment agreement dated June 1, 2011, Mike Midgley was appointed the Chief Executive Officer of our wholly owned subsidiary Coda Octopus Colmek, Inc. and our Chief Financial Officer. He is being paid an annual salary of $200,000 subject to an annual review by Colmek’s Board of Directors and the Company’s Chief Executive Officer. Mr. Midgley is entitled to 20 vacation days in addition to any public holiday.
The agreement may be terminated at any time upon 4-month prior written notice. The Company may terminate the agreement for cause, immediately and without notice. Among others, “for cause” includes gross misconduct, a serious or repeated breach of the agreement and negligence and incompetence as reasonably determined by the Company’s Board. The agreement includes a 12-month non-compete and non-solicitation provision. On December 6, 2017, the board of directors of the Company appointed Mr. Midgley to be the Company’s Chief Financial Officer. In connection with this appointment, all rights and obligations under Mr. Midgley’s employment agreement with Colmek were transferred to and have been assumed by the Company.
| F-26 |
CODA OCTOPUS GROUP, INC.
Notes to the Consolidated Financial Statements
October 31, 2018 and 2017
NOTE 15 -SUBSEQUENT EVENTS
On or around November 16, 2018, Coda Octopus Products Limited (UK) purchased property for its business requirements for a purchase price of £521,400 (an equivalent of $669,350 at the exchange rate of $1.2837).
On or around November 16, 2018, the Company issued 23,965 shares of common stock for a purchase price of $105,446 to one investor pursuant to the terms of a private placement which was effected January 31 2018, under which certain pro-rata rights were triggered upon the conversion of the Series C Preferred Stock by the holders, on or around October 31, 2018.
On December 24, 2018, the Company repaid $500,000 plus interest to our CEO representing loan outstanding (for full details see Note 8 of our Consolidated Financial Statements for year ended October 31, 2018 and 2017). The loan was paid in full and no further amounts are payable to our CEO for this loan. All obligations under this loan agreement are now extinguished.
| F-27 |