Attached files
| file | filename |
|---|---|
| EX-99.1 - EXHIBIT 99.1 - ANI PHARMACEUTICALS INC | tv509968_ex99-1.htm |
| 8-K - FORM 8-K - ANI PHARMACEUTICALS INC | tv509968_8k.htm |
Exhibit 99.2
A Specialty Pharmaceutical Company NASDAQ: ANIP GENERIC AND BRANDED PRESCRIPTION DRUG PRODUCTS Corporate Presentation December 2018
Forward - Looking Statements To the extent any statements made in this presentation deal with information that is not historical, these are forward - looking statements within the meaning of the Private Securities Litigation Reform Act of 1995. Such statements include, but are not limited to, statements about price increases, the Company’s future operations, products, financial position, operating results and prospects, the Company’s pipeline or potential markets therefore, statements regarding the Company’s use of proceeds of the Company’s credit facility in the manner currently anticipated, including the refinancing of the Convertible Notes, and other statements that are not historical in nature, particularly those that utilize terminology such as “anticipates,” “will,” “expects,” “plans,” “potential,” “future,” “believes,” “intends,” “continue,” other words of similar meaning, derivations of such words and the use of future dates. Uncertainties and risks may cause the Company’s actual results to be materially different than those expressed in or implied by such forward - looking statements. Uncertainties and risks include, but are not limited to, the Company’s ability to meet its outstanding debt obligations; levels of indebtedness and restrictions on the Company’s operations and activities imposed by the agreements governing the Company’s outstanding indebtedness; the Company’s sources of liquidity; changes in market conditions, including market factors affecting the price of debt and equity securities; the existence of alternative uses for the Company’s cash; the risk that the Company may face with respect to importing raw materials; increased competition; acquisitions; contract manufacturing arrangements; delays or failure in obtaining product approval from the U.S. Food and Drug Administration; general business and economic conditions; market trends; products development; regulatory and other approvals and marketing. More detailed information on these and additional factors that could affect the Company’s actual results are described in the Company’s filings with the Securities and Exchange Commission, including its most recent annual report on Form 10 - K and quarterly reports on Form 10 - Q, as well as its proxy statement. All forward - looking statements in this presentation speak only as of the date of this presentation and are based on the Company’s current beliefs, assumptions, and expectations. The Company undertakes no obligation to update or revise any forward - looking statement, whether as a result of new information, future events or otherwise. 2
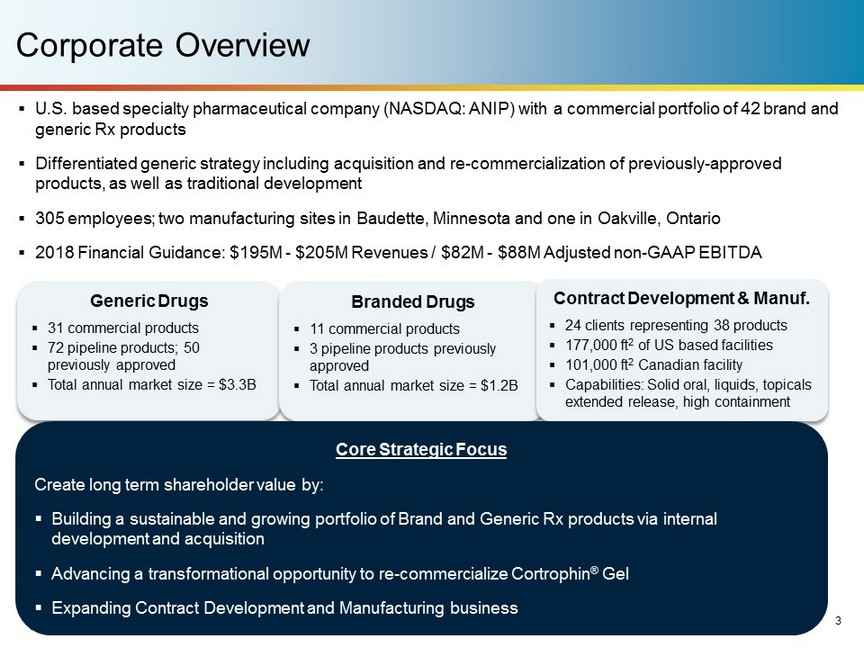
Corporate Overview Generic Drugs ▪ 31 commercial products ▪ 72 pipeline products; 50 previously approved ▪ Total annual market size = $3.3B Branded Drugs ▪ 11 commercial products ▪ 3 pipeline products previously approved ▪ Total annual market size = $1.2B Contract Development & Manuf. ▪ 24 clients representing 38 products ▪ 177,000 ft 2 of US based facilities ▪ 101,000 ft 2 Canadian facility ▪ Capabilities: Solid oral, liquids, topicals extended release, high containment ▪ U.S. based specialty pharmaceutical company (NASDAQ: ANIP) with a commercial portfolio of 42 brand and generic Rx products ▪ Differentiated generic strategy including acquisition and re - commercialization of previously - approved products, as well as traditional development ▪ 305 employees; two manufacturing sites in Baudette, Minnesota and one in Oakville, Ontario ▪ 2018 Financial Guidance: $195M - $205M Revenues / $82M - $88M Adjusted non - GAAP EBITDA Core Strategic Focus Create long term shareholder value by: ▪ Building a sustainable and growing portfolio of Brand and Generic Rx products via internal development and acquisition ▪ Advancing a transformational opportunity to re - commercialize Cortrophin ® Gel ▪ Expanding Contract Development and Manufacturing business 3
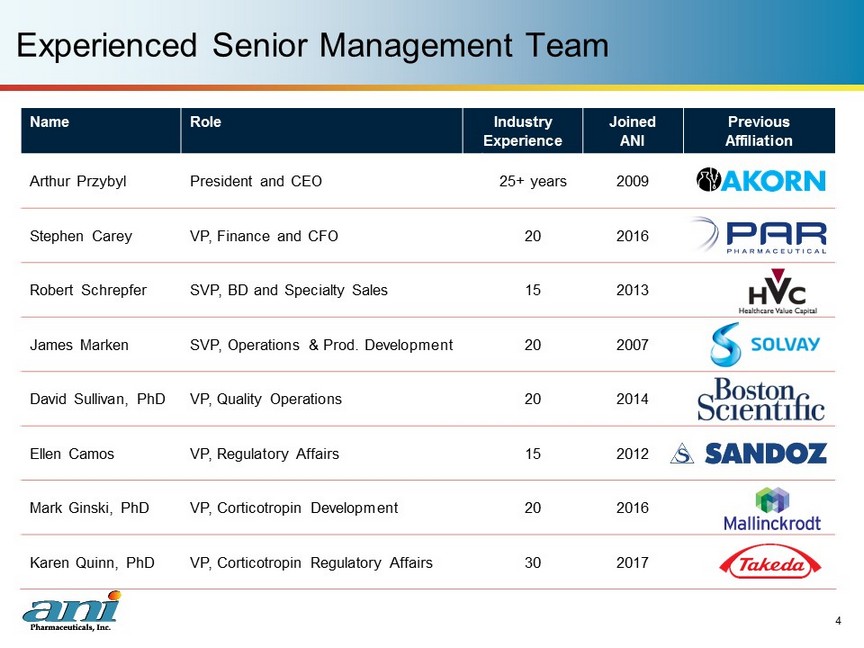
Name Role Industry Experience Joined ANI Previous Affiliation Arthur Przybyl President and CEO 25+ years 2009 Stephen Carey VP, Finance and CFO 20 2016 Robert Schrepfer SVP, BD and Specialty Sales 15 2013 James Marken SVP, Operations & Prod. Development 20 2007 David Sullivan, PhD VP, Quality Operations 20 2014 Ellen Camos VP, Regulatory Affairs 15 2012 Mark Ginski, PhD VP, Corticotropin Development 20 2016 Karen Quinn, PhD VP, Corticotropin Regulatory Affairs 30 2017 Experienced Senior Management Team 4
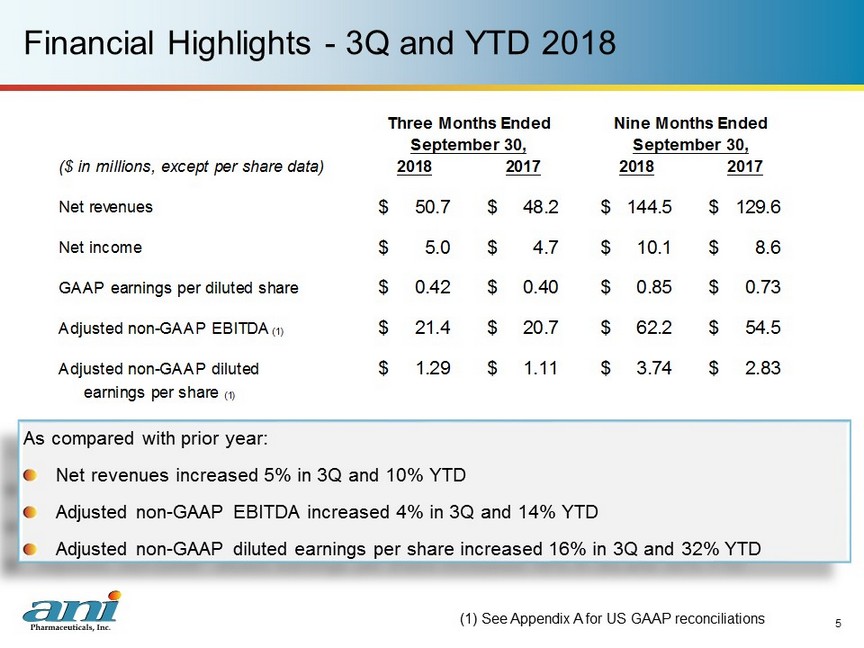
Financial Highlights - 3Q and YTD 2018 As compared with prior year: Net revenues increased 5% in 3Q and 10% YTD Adjusted non - GAAP EBITDA increased 4% in 3Q and 14% YTD Adjusted non - GAAP diluted earnings per share increased 16% in 3Q and 32% YTD (1) See Appendix A for US GAAP reconciliations 5 ($ in millions, except per share data) 2018 2017 2018 2017 Net revenues 50.7$ 48.2$ 144.5$ 129.6$ Net income 5.0$ 4.7$ 10.1$ 8.6$ GAAP earnings per diluted share 0.42$ 0.40$ 0.85$ 0.73$ Adjusted non-GAAP EBITDA (1) 21.4$ 20.7$ 62.2$ 54.5$ Adjusted non-GAAP diluted 1.29$ 1.11$ 3.74$ 2.83$ earnings per share (1) Three Months Ended Nine Months Ended September 30, September 30,
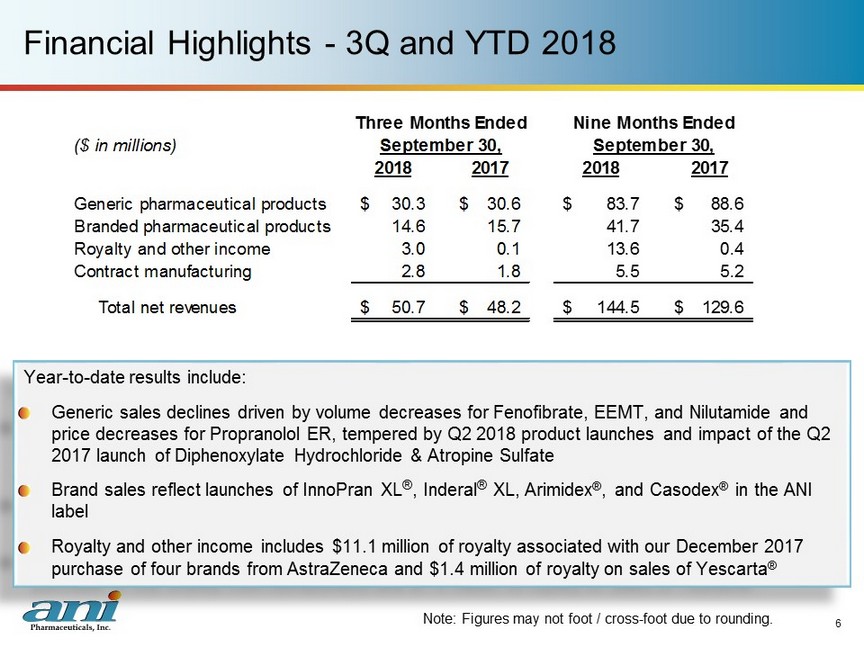
Financial Highlights - 3Q and YTD 2018 Year - to - date results include: Generic sales declines driven by volume decreases for Fenofibrate, EEMT, and Nilutamide and price decreases for Propranolol ER, tempered by Q2 2018 product launches and impact of the Q2 2017 launch of Diphenoxylate Hydrochloride & Atropine Sulfate Brand sales reflect launches of InnoPran XL ® , Inderal ® XL, Arimidex ® , and Casodex ® in the ANI label Royalty and other income includes $11.1 million of royalty associated with our December 2017 purchase of four brands from AstraZeneca and $1.4 million of royalty on sales of Yescarta ® 6 Note: Figures may not foot / cross - foot due to rounding. ($ in millions) 2018 2017 2018 2017 Generic pharmaceutical products 30.3$ 30.6$ 83.7$ 88.6$ Branded pharmaceutical products 14.6 15.7 41.7 35.4 Royalty and other income 3.0 0.1 13.6 0.4 Contract manufacturing 2.8 1.8 5.5 5.2 Total net revenues 50.7$ 48.2$ 144.5$ 129.6$ Three Months Ended Nine Months Ended September 30, September 30,
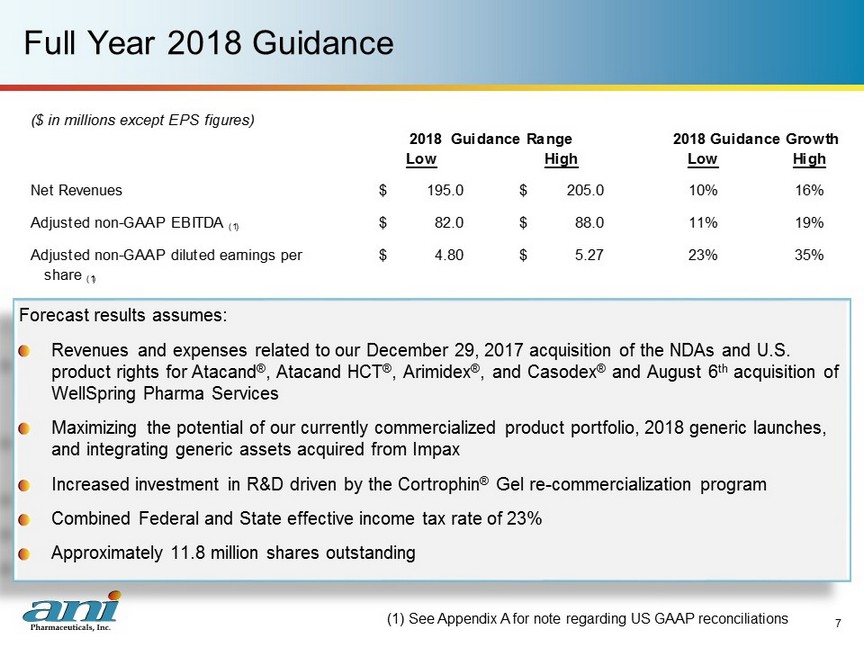
Full Year 2018 Guidance Forecast results assumes: Revenues and expenses related to our December 29, 2017 acquisition of the NDAs and U.S. product rights for Atacand ® , Atacand HCT ® , Arimidex ® , and Casodex ® and August 6 th acquisition of WellSpring Pharma Services Maximizing the potential of our currently commercialized product portfolio, 2018 generic launches, and integrating generic assets acquired from Impax Increased investment in R&D driven by the Cortrophin ® Gel re - commercialization program Combined Federal and State effective income tax rate of 23% Approximately 11.8 million shares outstanding (1) See Appendix A for note regarding US GAAP reconciliations 7 ($ in millions except EPS figures) Low High Low High Net Revenues 195.0$ 205.0$ 10% 16% Adjusted non-GAAP EBITDA (1) 82.0$ 88.0$ 11% 19% Adjusted non-GAAP diluted earnings per 4.80$ 5.27$ 23% 35% share (1) 2018 Guidance Range 2018 Guidance Growth
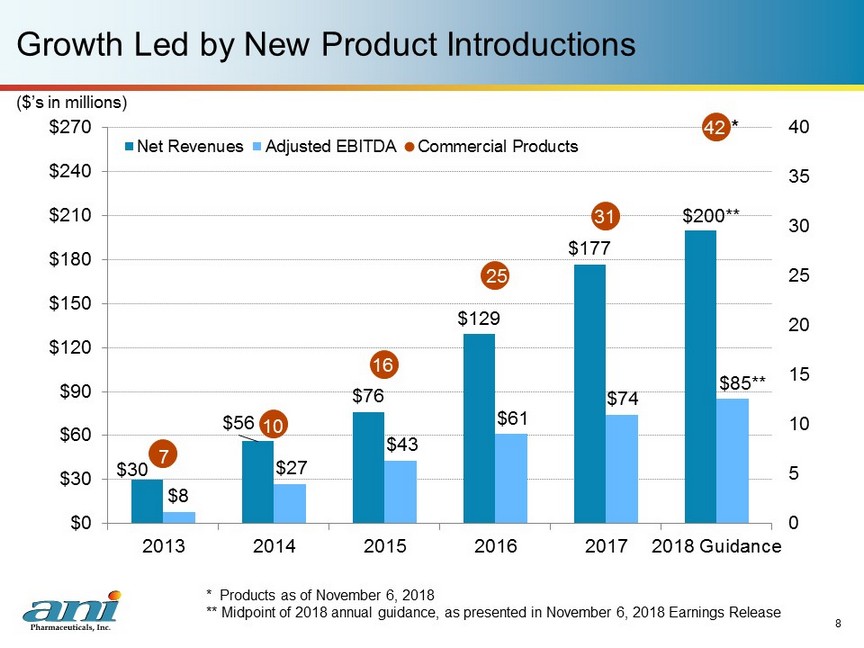
$30 $56 $76 $129 $177 $200 ** $8 $27 $43 $61 $74 $85 ** 7 10 16 25 31 42 0 5 10 15 20 25 30 35 40 $0 $30 $60 $90 $120 $150 $180 $210 $240 $270 2013 2014 2015 2016 2017 2018 Guidance Net Revenues Adjusted EBITDA Commercial Products * Growth Led by New Product Introductions 8 ($’s in millions) * Products as of November 6, 2018 ** Midpoint of 2018 annual guidance, as presented in November 6, 2018 Earnings Release
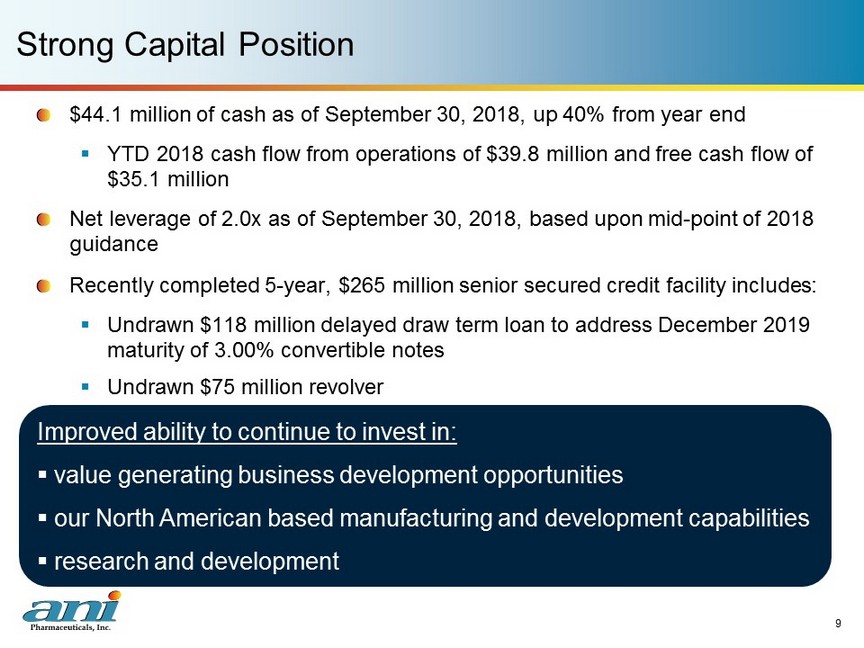
Strong Capital Position 9 $44.1 million of cash as of September 30, 2018, up 40% from year end ▪ YTD 2018 cash flow from operations of $39.8 million and free cash flow of $35.1 million Net leverage of 2.0x as of September 30, 2018, based upon mid - point of 2018 guidance Recently completed 5 - year, $265 million senior secured credit facility includes: ▪ Undrawn $118 million delayed draw term loan to address December 2019 maturity of 3.00% convertible notes ▪ Undrawn $75 million revolver Improved ability to continue to invest in: ▪ value generating business development opportunities ▪ our North American based manufacturing and development capabilities ▪ research and development
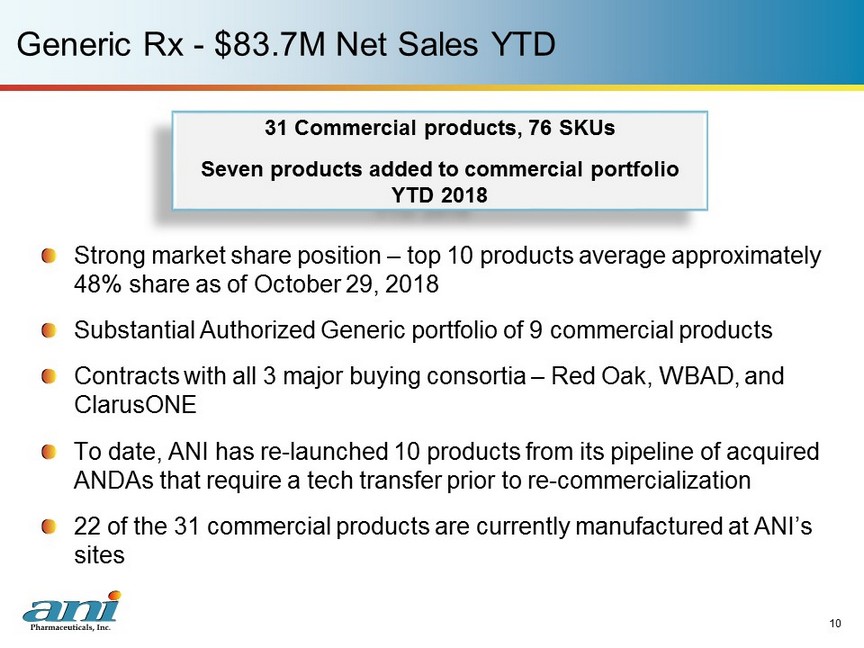
Generic Rx - $83.7M Net Sales YTD Strong market share position – top 10 products average approximately 48% share as of October 29, 2018 Substantial Authorized Generic portfolio of 9 commercial products Contracts with all 3 major buying consortia – Red Oak, WBAD, and ClarusONE To date, ANI has re - launched 10 products from its pipeline of acquired ANDAs that require a tech transfer prior to re - commercialization 22 of the 31 commercial products are currently manufactured at ANI’s sites 10 31 Commercial products, 76 SKUs Seven products added to commercial portfolio YTD 2018
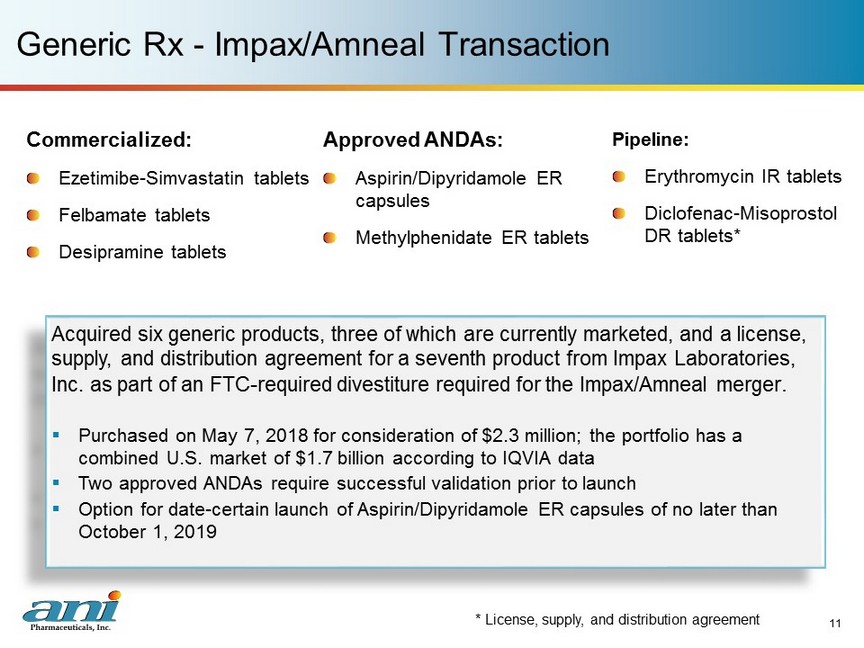
Pipeline: Erythromycin IR tablets Diclofenac - Misoprostol DR tablets* Generic Rx - Impax/Amneal Transaction Commercialized: Ezetimibe - Simvastatin tablets Felbamate tablets Desipramine tablets Approved ANDAs: Aspirin/Dipyridamole ER capsules Methylphenidate ER tablets 11 Acquired six generic products, three of which are currently marketed, and a license, supply, and distribution agreement for a seventh product from Impax Laboratories, Inc. as part of an FTC - required divestiture required for the Impax/Amneal merger . ▪ Purchased on May 7, 2018 for consideration of $2.3 million; the portfolio has a combined U.S. market of $1.7 billion according to IQVIA data ▪ Two approved ANDAs require successful validation prior to launch ▪ Option for date - certain launch of Aspirin/Dipyridamole ER capsules of no later than October 1, 2019 * License , supply, and distribution agreement
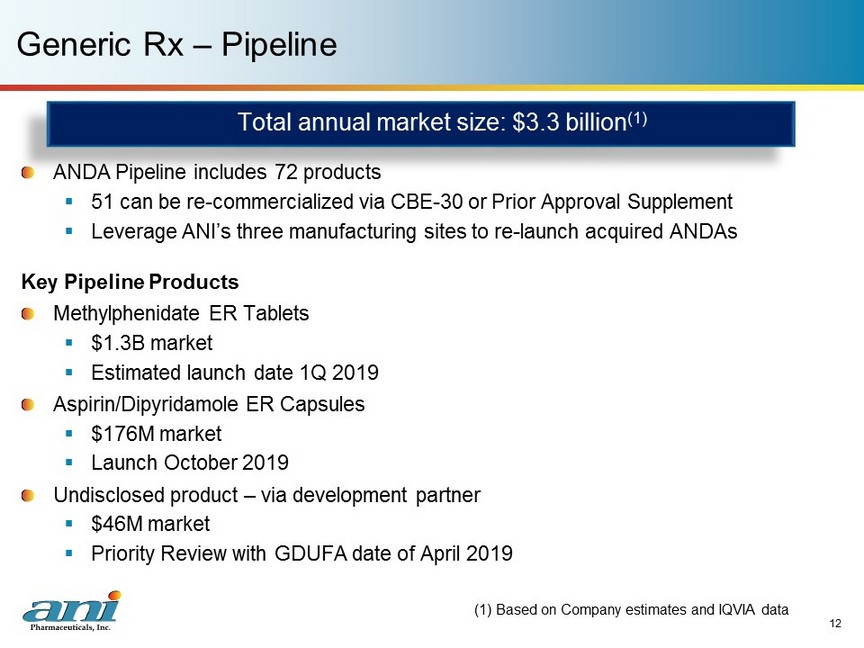
12 Generic Rx – Pipeline ANDA Pipeline includes 72 products ▪ 51 can be re - commercialized via CBE - 30 or Prior Approval Supplement ▪ Leverage ANI’s three manufacturing sites to re - launch acquired ANDAs Key Pipeline Products Methylphenidate ER Tablets ▪ $1.3B market ▪ Estimated launch date 1Q 2019 Aspirin/Dipyridamole ER Capsules ▪ $176M market ▪ Launch October 2019 Undisclosed product – via development partner ▪ $46M market ▪ Priority Review with GDUFA date of April 2019 (1) Based on Company estimates and IQVIA data Total annual market size: $3.3 billion (1)
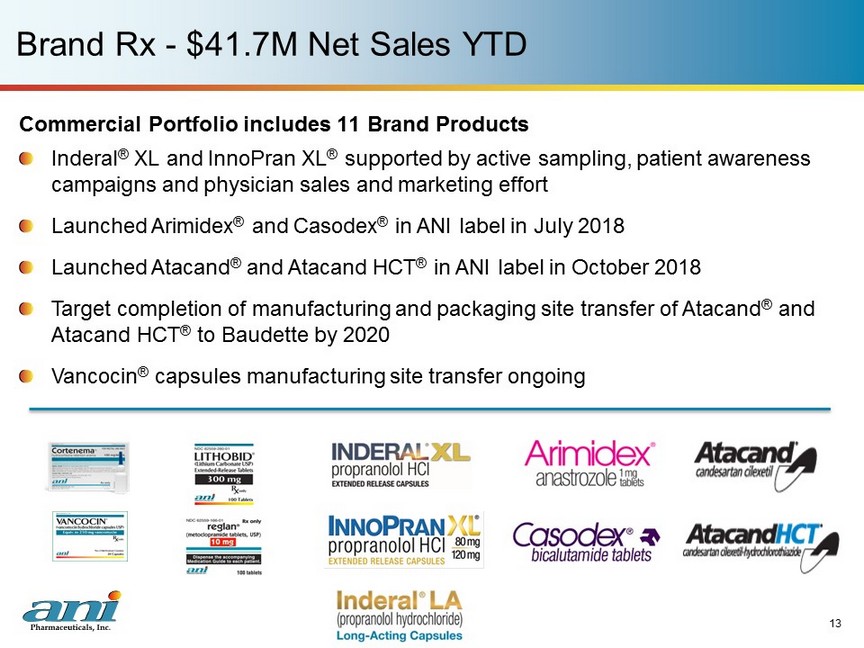
Brand Rx - $41.7M Net Sales YTD 13 Commercial Portfolio includes 11 Brand Products Inderal ® XL and InnoPran XL ® supported by active sampling, patient awareness campaigns and physician sales and marketing effort Launched Arimidex ® and Casodex ® in ANI label in July 2018 Launched Atacand ® and Atacand HCT ® in ANI label in October 2018 Target completion of manufacturing and packaging site transfer of Atacand ® and Atacand HCT ® to Baudette by 2020 Vancocin ® capsules manufacturing site transfer ongoing
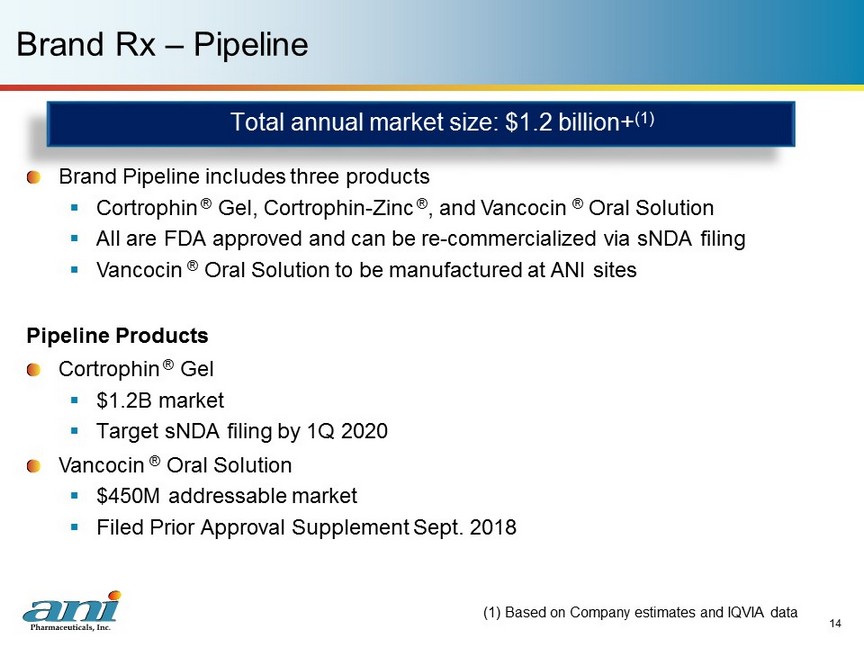
14 Brand Rx – Pipeline (1) Based on Company estimates and IQVIA data Total annual market size: $1.2 billion+ (1) Brand Pipeline includes three products ▪ Cortrophin ® Gel, Cortrophin - Zinc ® , and Vancocin ® Oral Solution ▪ All are FDA approved and can be re - commercialized via sNDA filing ▪ Vancocin ® Oral Solution to be manufactured at ANI sites Pipeline Products Cortrophin ® Gel ▪ $1.2B market ▪ Target sNDA filing by 1Q 2020 Vancocin ® Oral Solution ▪ $450M addressable market ▪ Filed Prior Approval Supplement Sept. 2018
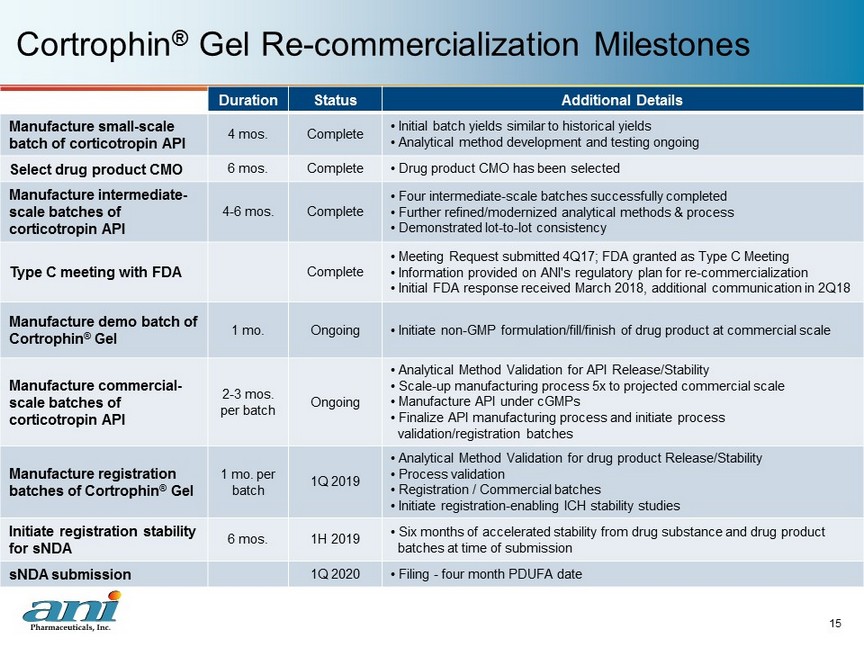
Cortrophin ® Gel Re - commercialization Milestones 15 Duration Status Additional Details Manufacture small - scale batch of corticotropin API 4 mos. Complete • Initial batch yields similar to historical yields • Analytical method development and testing ongoing Select drug product CMO 6 mos. Complete • Drug product CMO has been selected Manufacture intermediate - scale batches of corticotropin API 4 - 6 mos. Complete • Four intermediate - scale batches successfully completed • Further refined/modernized analytical methods & process • Demonstrated lot - to - lot consistency Type C meeting with FDA Complete • Meeting Request submitted 4Q17; FDA granted as Type C Meeting • Information provided on ANI's regulatory plan for re - commercialization • Initial FDA response received March 2018, additional communication in 2Q18 Manufacture demo batch of Cortrophin ® Gel 1 mo. Ongoing • Initiate non - GMP formulation/fill/finish of drug product at commercial scale Manufacture commercial - scale batches of corticotropin API 2 - 3 mos. per batch Ongoing • Analytical Method Validation for API Release/Stability • Scale - up manufacturing process 5x to projected commercial scale • Manufacture API under cGMPs • Finalize API manufacturing process and initiate process validation/registration batches Manufacture registration batches of Cortrophin ® Gel 1 mo. per batch 1Q 2019 • Analytical Method Validation for drug product Release/Stability • Process validation • Registration / Commercial batches • Initiate registration - enabling ICH stability studies Initiate registration stability for sNDA 6 mos. 1H 2019 • Six months of accelerated stability from drug substance and drug product batches at time of submission sNDA submission 1Q 2020 • Filing - four month PDUFA date
Contract Manufacturing - $5.5M Net Sales YTD 16 Contract manufacturing ▪ Four customers – Seven products and seventeen SKUs – Contract manufacturing and contract packaging Recently acquired WellSpring Pharma Services - CDMO ▪ Currently generating approximately $11M in annual revenues ▪ 20 customers – 17 commercial products – 14 products in development – Contract development, manufacturing and packaging
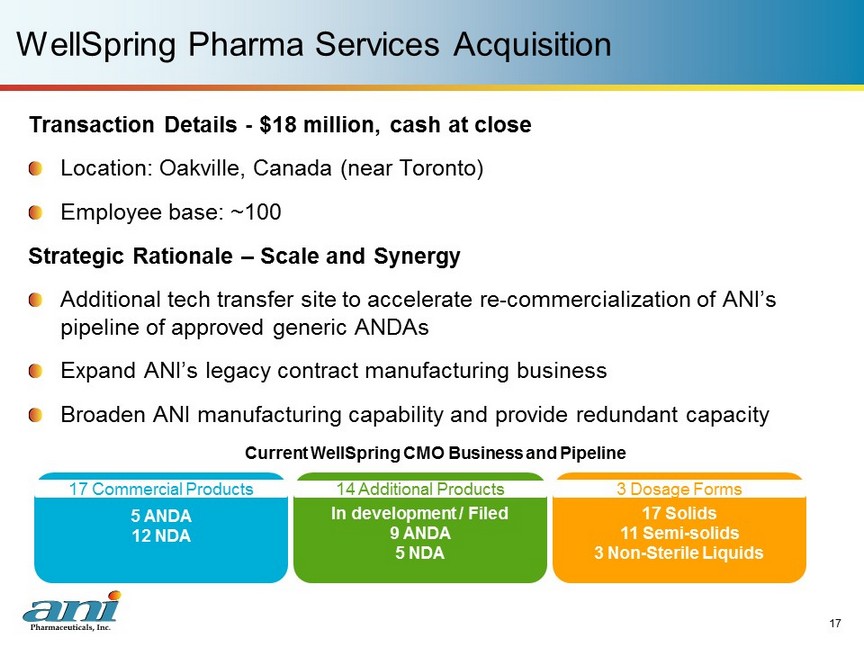
WellSpring Pharma Services Acquisition 17 Transaction Details - $18 million, cash at close Location: Oakville, Canada (near Toronto) Employee base: ~100 Strategic Rationale – Scale and Synergy Additional tech transfer site to accelerate re - commercialization of ANI’s pipeline of approved generic ANDAs Expand ANI’s legacy contract manufacturing business Broaden ANI manufacturing capability and provide redundant capacity 5 ANDA 12 NDA In development / Filed 9 ANDA 5 NDA 17 Solids 11 Semi - solids 3 Non - Sterile Liquids 17 Commercial Products 14 Additional Products 3 Dosage Forms Current WellSpring CMO Business and Pipeline
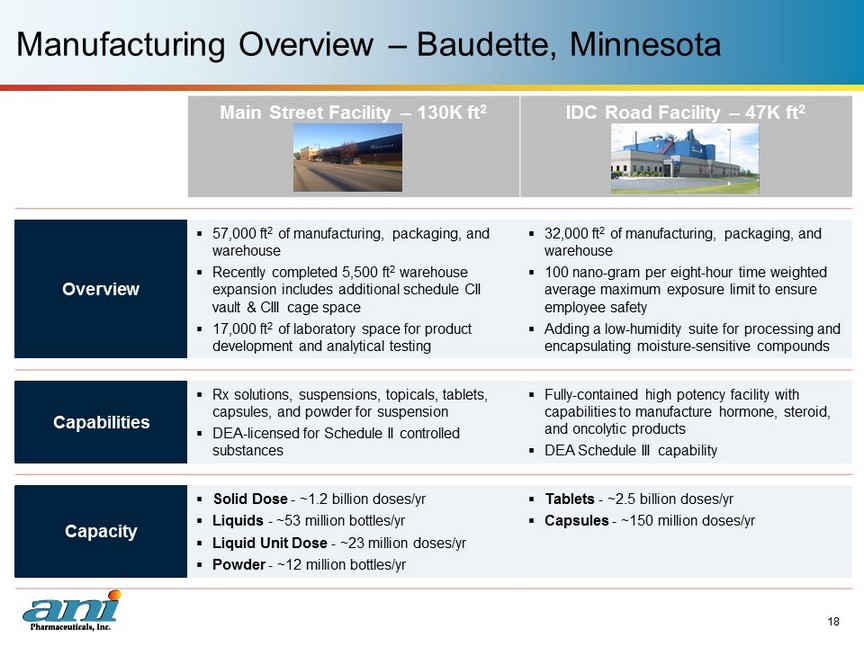
Main Street Facility – 130K ft 2 IDC Road Facility – 47K ft 2 Overview ▪ 57,000 ft 2 of manufacturing, packaging, and warehouse ▪ Recently completed 5,500 ft 2 warehouse expansion includes additional schedule CII vault & CIII cage space ▪ 17,000 ft 2 of laboratory space for product development and analytical testing ▪ 32,000 ft 2 of manufacturing, packaging, and warehouse ▪ 100 nano - gram per eight - hour time weighted average maximum exposure limit to ensure employee safety ▪ Adding a low - humidity suite for processing and encapsulating moisture - sensitive compounds Capabilities ▪ Rx solutions, suspensions, topicals, tablets, capsules, and powder for suspension ▪ DEA - licensed for Schedule II controlled substances ▪ Fully - contained high potency facility with capabilities to manufacture hormone, steroid, and oncolytic products ▪ DEA Schedule III capability Capacity ▪ Solid Dose - ~ 1.2 billion doses/yr ▪ Liquids - ~ 53 million bottles/yr ▪ Liquid Unit Dose - ~ 23 million doses/yr ▪ Powder - ~ 12 million bottles/yr ▪ Tablets - ~2.5 billion doses/yr ▪ Capsules - ~150 million doses/yr Manufacturing Overview – Baudette, Minnesota 18
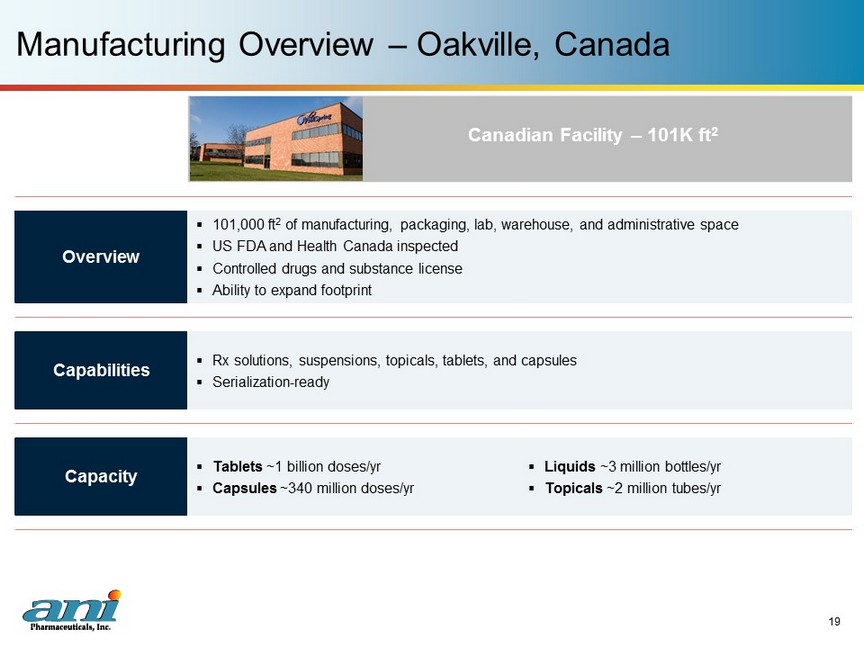
Canadian Facility – 101K ft 2 Overview ▪ 101,000 ft 2 of manufacturing, packaging, lab, warehouse, and administrative space ▪ US FDA and Health Canada inspected ▪ Controlled drugs and substance license ▪ Ability to expand footprint Capabilities ▪ Rx solutions, suspensions, topicals, tablets, and capsules ▪ Serialization - ready Capacity ▪ Tablets ~ 1 billion doses/yr ▪ Capsules ~340 million doses/yr ▪ Liquids ~3 million bottles/yr ▪ Topicals ~2 million tubes/yr Manufacturing Overview – Oakville, Canada 19
ANI Royalty Income - $13.6M Net Revenues YTD 20 YTD Royalty income primarily reflects: ▪ $11.1 million on sales of Atacand ® , Atacand HCT ® , Arimidex ® , and Casodex ® ▪ $1.4 million for sales and milestones on Yescarta ® Yescarta ® Royalty ▪ YTD 2018, ANI recognized $1.4 million in royalties and milestones ▪ Originates from assets acquired in BioSante transaction ▪ Entitled to percentage of global Yescarta ® net sales and certain milestones ▪ In June 2018 European Medicines Agency’s Committee for Medicinal Products for Human Use (CHMP) issued a positive opinion on the Marketing Authorization Application (MAA) for Yescarta ®
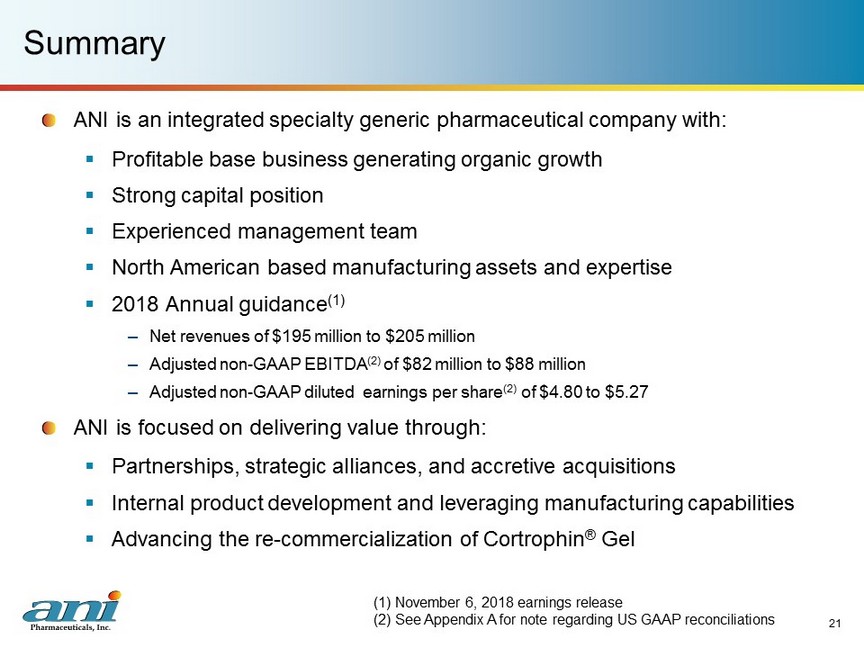
Summary ANI is an integrated specialty generic pharmaceutical company with: ▪ Profitable base business generating organic growth ▪ Strong capital position ▪ Experienced management team ▪ North American based manufacturing assets and expertise ▪ 2018 Annual guidance (1) – Net revenues of $195 million to $205 million – Adjusted non - GAAP EBITDA (2) of $82 million to $88 million – Adjusted non - GAAP diluted earnings per share (2) of $4.80 to $5.27 ANI is focused on delivering value through: ▪ Partnerships, strategic alliances, and accretive acquisitions ▪ Internal product development and leveraging manufacturing capabilities ▪ Advancing the re - commercialization of Cortrophin ® Gel 21 (1) November 6, 2018 earnings release (2) See Appendix A for note regarding US GAAP reconciliations
22 Appendix A
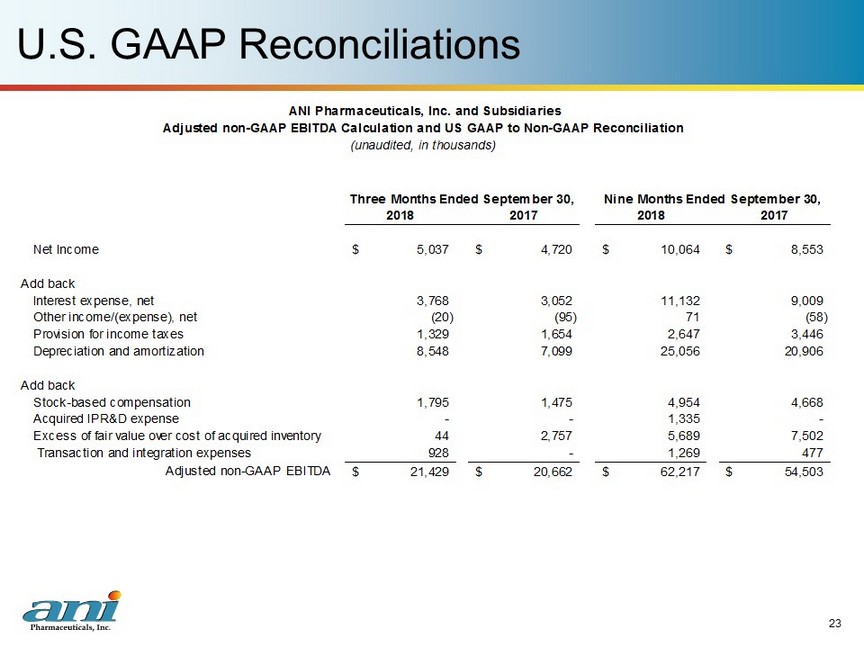
U.S. GAAP Reconciliations 23 2018 2017 2018 2017 Net Income 5,037$ 4,720$ 10,064$ 8,553$ Add back Interest expense, net 3,768 3,052 11,132 9,009 Other income/(expense), net (20) (95) 71 (58) Provision for income taxes 1,329 1,654 2,647 3,446 Depreciation and amortization 8,548 7,099 25,056 20,906 Add back Stock-based compensation 1,795 1,475 4,954 4,668 Acquired IPR&D expense - - 1,335 - Excess of fair value over cost of acquired inventory 44 2,757 5,689 7,502 Transaction and integration expenses 928 - 1,269 477 Adjusted non-GAAP EBITDA 21,429$ 20,662$ 62,217$ 54,503$ ANI Pharmaceuticals, Inc. and Subsidiaries Adjusted non-GAAP EBITDA Calculation and US GAAP to Non-GAAP Reconciliation (unaudited, in thousands) Three Months Ended September 30, Nine Months Ended September 30,
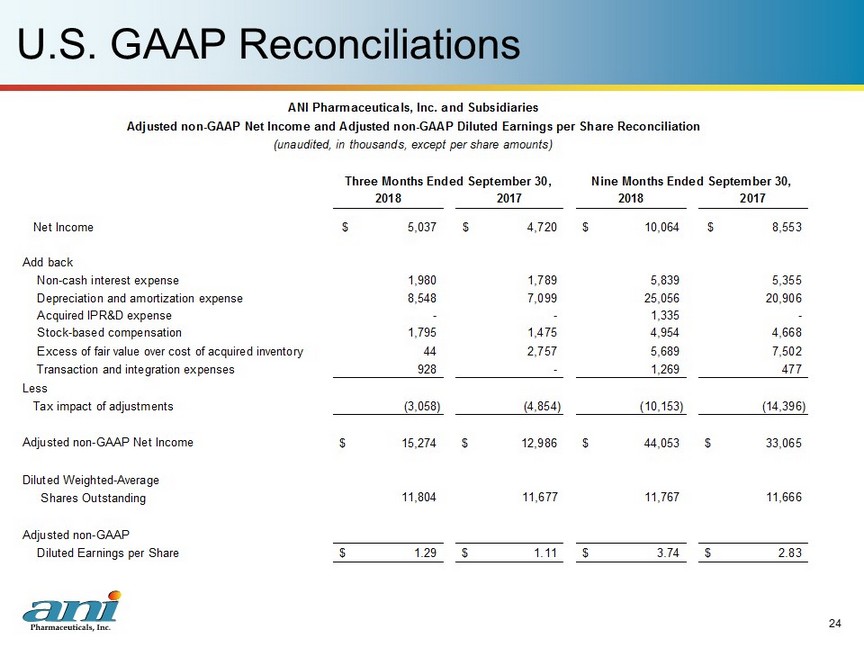
U.S. GAAP Reconciliations 24 2018 2017 2018 2017 Net Income 5,037$ 4,720$ 10,064$ 8,553$ Add back Non-cash interest expense 1,980 1,789 5,839 5,355 Depreciation and amortization expense 8,548 7,099 25,056 20,906 Acquired IPR&D expense - - 1,335 - Stock-based compensation 1,795 1,475 4,954 4,668 Excess of fair value over cost of acquired inventory 44 2,757 5,689 7,502 Transaction and integration expenses 928 - 1,269 477 Less Tax impact of adjustments (3,058) (4,854) (10,153) (14,396) Adjusted non-GAAP Net Income 15,274$ 12,986$ 44,053$ 33,065$ Diluted Weighted-Average Shares Outstanding 11,804 11,677 11,767 11,666 Adjusted non-GAAP Diluted Earnings per Share 1.29$ 1.11$ 3.74$ 2.83$ ANI Pharmaceuticals, Inc. and Subsidiaries Adjusted non-GAAP Net Income and Adjusted non-GAAP Diluted Earnings per Share Reconciliation (unaudited, in thousands, except per share amounts) Three Months Ended September 30, Nine Months Ended September 30,
U.S. GAAP Reconciliations 25 Non - GAAP Financial Measures included in 2018 Guidance The Company's fiscal 2018 guidance for adjusted non - GAAP EBITDA and adjusted non - GAAP diluted earnings per share is not reconciled to the most comparable GAAP measure. This is due to the inherent difficulty of forecasting the timing or amount of items that would be included in a reconciliation to the most directly comparable forward - looking GAAP financial measures. Because a reconciliation is not available without unreasonable effort, it is not included in this presentation.