Attached files
| file | filename |
|---|---|
| 8-K - 8-K - PROASSURANCE CORP | a18-41137_18k.htm |
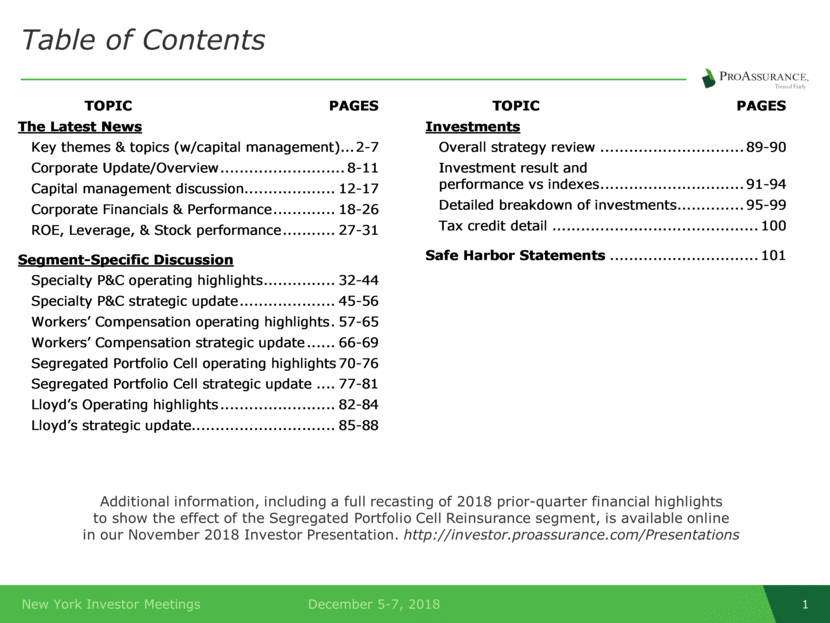
Table of Contents Additional information, including a full recasting of 2018 prior-quarter financial highlights to show the effect of the Segregated Portfolio Cell Reinsurance segment, is available online in our November 2018 Investor Presentation. http://investor.proassurance.com/Presentations TOPIC PAGES The Latest News Key themes & topics (w/ capital management ) ... 2 - 7 Corporate Update/Overview .......................... 8 - 1 1 Capital management discussion ................... 1 2 - 1 7 Corporate Financials & Performance ............. 1 8 - 2 6 ROE, Leverage , & Stock performance ........... 2 7 - 3 1 Segment - Specific Discussion Specialty P&C operating highlights ............... 32 - 4 4 Specialty P&C strategic update .................... 4 5 - 56 Workers’ Compensation operating highlights . 5 7 - 6 5 Workers’ Compensation strategic update ...... 6 6 - 69 Segregated Portfolio Cell operating highlights 70 - 76 Segregated Portfolio Cell strategic update .... 7 7 - 81 Lloyd’s Operating highlights ........................ 82 - 84 Lloyd’s strategic update .............................. 85 - 88 TOPIC PAGES Investments Overall strategy review .............................. 8 9 - 90 Investment result and performance vs indexes .............................. 91 - 94 Detailed breakdown of investments .............. 9 5 - 99 Tax credit detail ................................ ........... 100 Safe Harbor Statement s ............................... 101
Key Themes and Topics of Importance December 2018

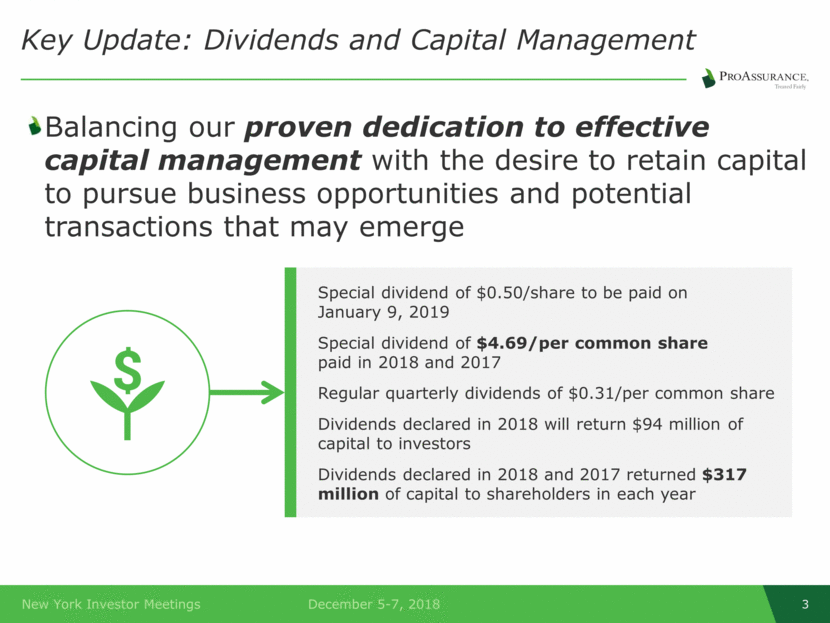
Key Update: Dividends and Capital Management Special dividend of $0.50/share to be paid on January 9, 2019 Special dividend of $4.69/per common share paid in 2018 and 2017 Regular quarterly dividends of $0.31/per common share Dividends declared in 2018 will return $94 million of capital to investors Dividends declared in 2018 and 2017 returned $317 million of capital to shareholders in each year Balancing our proven dedication to effective capital management with the desire to retain capital to pursue business opportunities and potential transactions that may emerge
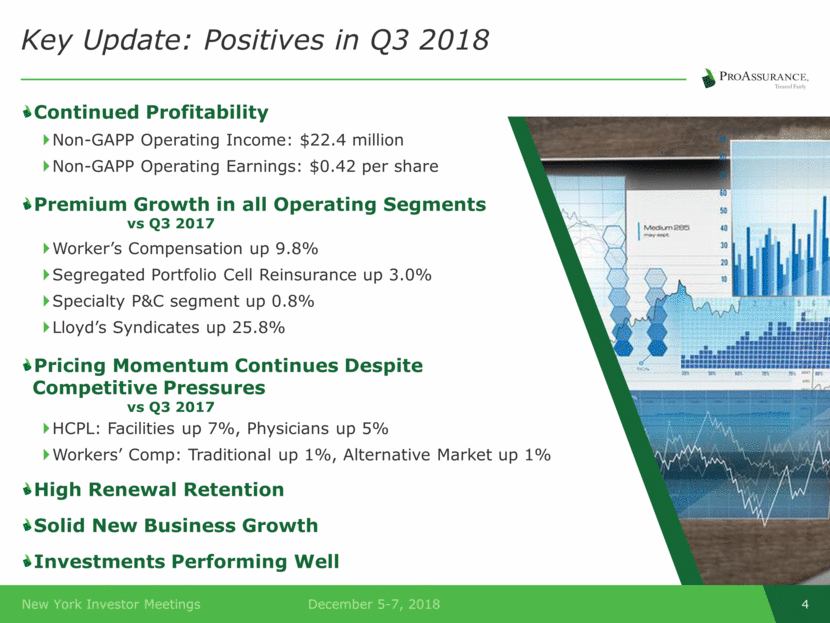
Key Update: Positives in Q3 2018 Continued Profitability Non-GAPP Operating Income: $22.4 million Non-GAPP Operating Earnings: $0.42 per share Premium Growth in all Operating Segments vs Q3 2017 Worker’s Compensation up 9.8% Segregated Portfolio Cell Reinsurance up 3.0% Specialty P&C segment up 0.8% Lloyd’s Syndicates up 25.8% Pricing Momentum Continues Despite Competitive Pressures vs Q3 2017 HCPL: Facilities up 7%, Physicians up 5% Workers’ Comp: Traditional up 1%, Alternative Market up 1% High Renewal Retention Solid New Business Growth Investments Performing Well
Key Update: Confronting the Challenges Ahead Profitable growth Increasing market discipline allows us to add new HCPL business at higher rates Specialization is profitable markets and businesses provides an avenue for growth in Workers’ Compensation Maintaining caution as loss trends worsen in HCPL Trends are not yet evident in our paid losses, but prompted by the general industry outlook Increasing current accident year loss picks to protect insureds, investors and our balance sheet for the long-term Taking steps to improve returns in our Lloyd’s Syndicates segment Improving profitability through expense management and ongoing changes in the business written by the Syndicates Balancing competing capital needs Emerging business opportunities could allow us to deploy capital profitably in the markets Developing loss trends could require us to hold more capital
Key Update: The Current State of the Markets We Serve Healthcare Professional Liability: Signs of increasing severity and greater scrutiny from regulators and rating agencies should bring rationality back to the market Likely to provide new growth opportunities as weakness among smaller, less capable/experienced competitors produces a flight to quality Demonstrated value to our insureds and distribution partners Workers’ Compensation: Expending economy and specialization fueling business gains and offsetting business lost to price competition The successful Great Falls transaction is generating new business in New England alongside solid renewal retention Eastern Specialty Risk expansion Lloyd’s Syndicate: Volcano and storms losses expected to produce a pre-tax loss of $3.2 million in the upcoming quarter The value creation thesis remains intact and fits our long-term vision for expansion and profitable operations although we recognize and are addresses expense and profitability concerns
Key Themes Long Term Success Consistent & disciplined focus on profitability Demonstrated track record of value creation for shareholders Proven Strategy World class knowledge & expertise Superior brand identity and reputation in the market Broad range of coverages address every significant need in our target markets Strong claims advocacy continues to differentiate Forward Thinking Successfully adapting to serve evolving risks through new distribution partners Coverages that span the broad spectrum of healthcare and related risks Dedicated to creating future value
Corporate Update December 2018

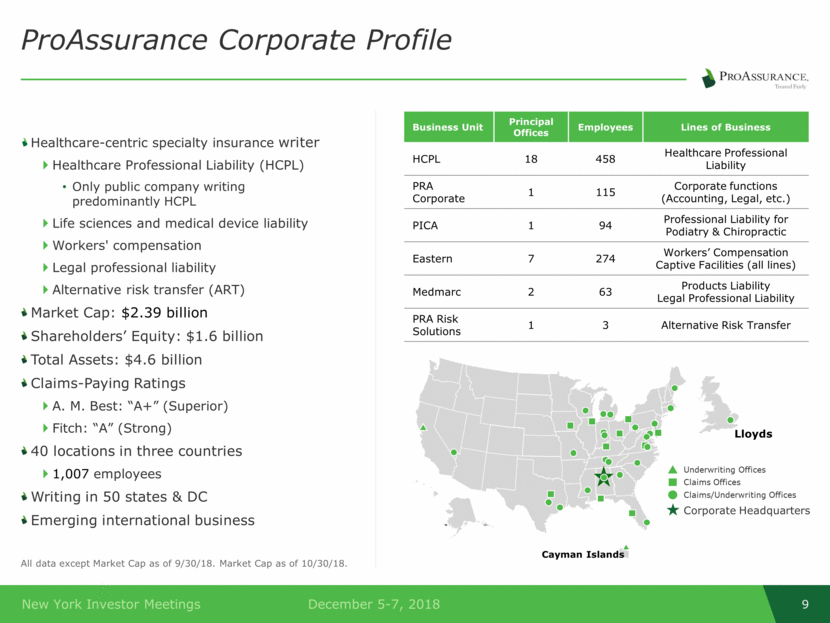
ProAssurance Corporate Profile Healthcare-centric specialty insurance writer Healthcare Professional Liability (HCPL) Only public company writing predominantly HCPL Life sciences and medical device liability Workers' compensation Legal professional liability Alternative risk transfer (ART) Market Cap: $2.39 billion Shareholders’ Equity: $1.6 billion Total Assets: $4.6 billion Claims-Paying Ratings A. M. Best: “A+” (Superior) Fitch: “A” (Strong) 40 locations in three countries 1,007 employees Writing in 50 states & DC Emerging international business Business Unit Principal Offices Employees Lines of Business HCPL 18 458 Healthcare Professional Liability PRA Corporate 1 115 Corporate functions (Accounting, Legal, etc.) PICA 1 94 Professional Liability for Podiatry & Chiropractic Eastern 7 274 Workers’ Compensation Captive Facilities (all lines) Medmarc 2 63 Products Liability Legal Professional Liability PRA Risk Solutions 1 3 Alternative Risk Transfer Corporate Headquarters Claims Offices Claims/Underwriting Offices Underwriting Offices Cayman Islands Lloyds All data except Market Cap as of 9/30/18. Market Cap as of 10/30/18.
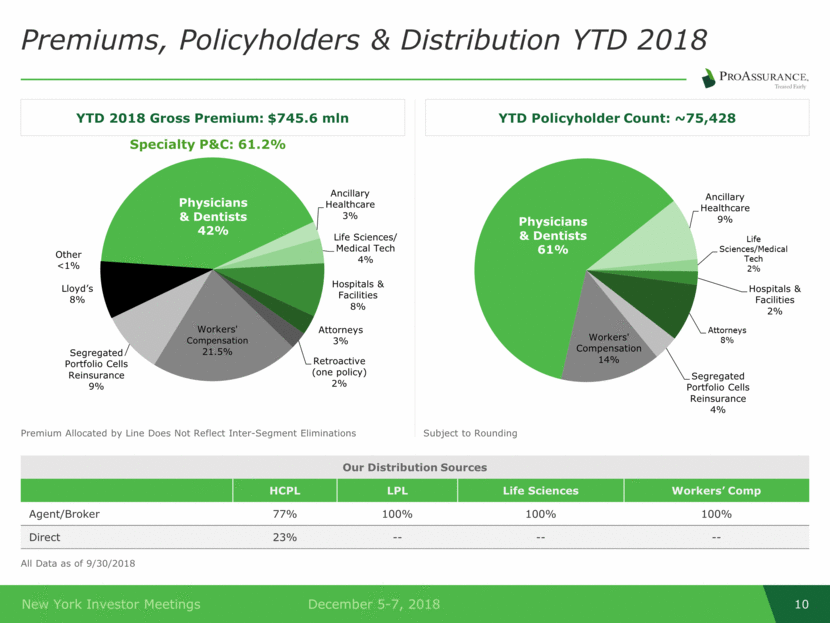
Premiums, Policyholders & Distribution YTD 2018 All Data as of 9/30/2018 YTD Policyholder Count: ~75,428 YTD 2018 Gross Premium: $745.6 mln Premium Allocated by Line Does Not Reflect Inter-Segment Eliminations Subject to Rounding Our Distribution Sources HCPL LPL Life Sciences Workers’ Comp Agent/Broker 77% 100% 100% 100% Direct 23% -- -- -- Physicians & Dentists 61% Ancillary Healthcare 9% Life Sciences/Medical Tech 2% Hospitals & Facilities 2% Attorneys 8% Segregated Portfolio Cells Reinsurance 4% Workers' Compensation 14% Physicians & Dentists 42% Ancillary Healthcare 3% Life Sciences/ Medical Tech 4% Hospitals & Facilities 8% Attorneys 3% Retroactive (one policy) 2 % Workers' Compensation 21.5% Segregated Portfolio Cells Reinsurance 9% Lloyd’s 8% Other <1% Specialty P&C: 61.2%
ProAssurance Brand Profile Specialty P&C Healthcare Professional Liability Workers’ Comp Alternative Risk Transfer Medical Technology & Life Sciences Products Liability Legal Professional Liability
Additional Capital Management Discussion Points December 2018

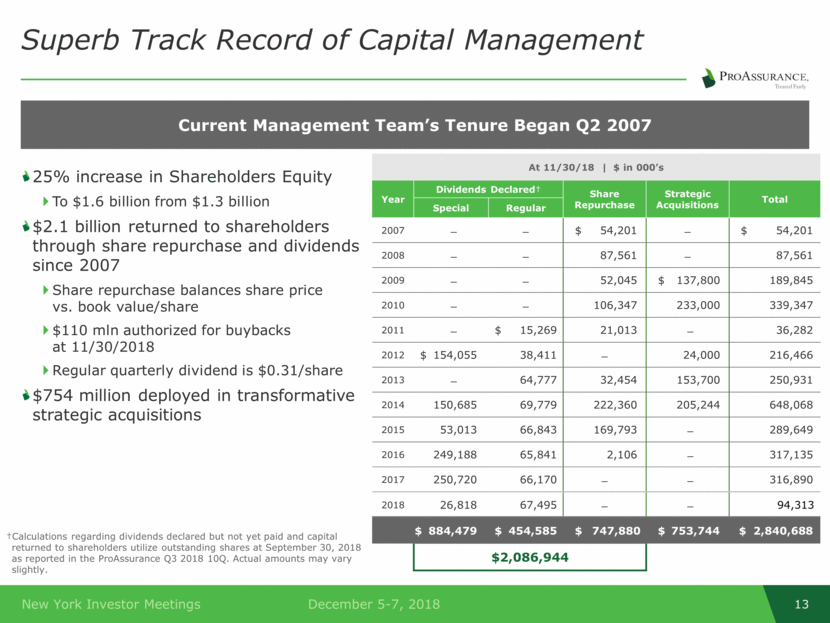
Superb Track Record of Capital Management Current Management Team’s Tenure Began Q2 2007 At 11/30/18 $ in 000’s Year Dividends Declared† Share Repurchase Strategic Acquisitions Total Special Regular 2007 ̶ ̶ $ 54,201 ̶ $ 54,201 2008 ̶ ̶ 87,561 ̶ 87,561 2009 ̶ ̶ 52,045 $ 137,800 189,845 2010 ̶ ̶ 106,347 233,000 339,347 2011 ̶ $ 15,269 21,013 ̶ 36,282 2012 $ 154,055 38,411 ̶ 24,000 216,466 2013 ̶ 64,777 32,454 153,700 250,931 2014 150,685 69,779 222,360 205,244 648,068 2015 53,013 66,843 169,793 ̶ 289,649 2016 249,188 65,841 2,106 ̶ 317,135 2017 250,720 66,170 ̶ ̶ 316,890 2018 26,818 67,495 ̶ ̶ 94,313 $ 884,479 $ 454,585 $ 747,880 $ 753,744 $ 2,840,688 $2,086,944 25% increase in Shareholders Equity To $1.6 billion from $1.3 billion $2.1 billion returned to shareholders through share repurchase and dividends since 2007 Share repurchase balances share price vs. book value/share $110 mln authorized for buybacks at 11/30/2018 Regular quarterly dividend is $0.31/share $754 million deployed in transformative strategic acquisitions †Calculations regarding dividends declared but not yet paid and capital returned to shareholders utilize outstanding shares at September 30, 2018 as reported in the ProAssurance Q3 2018 10Q. Actual amounts may vary slightly.
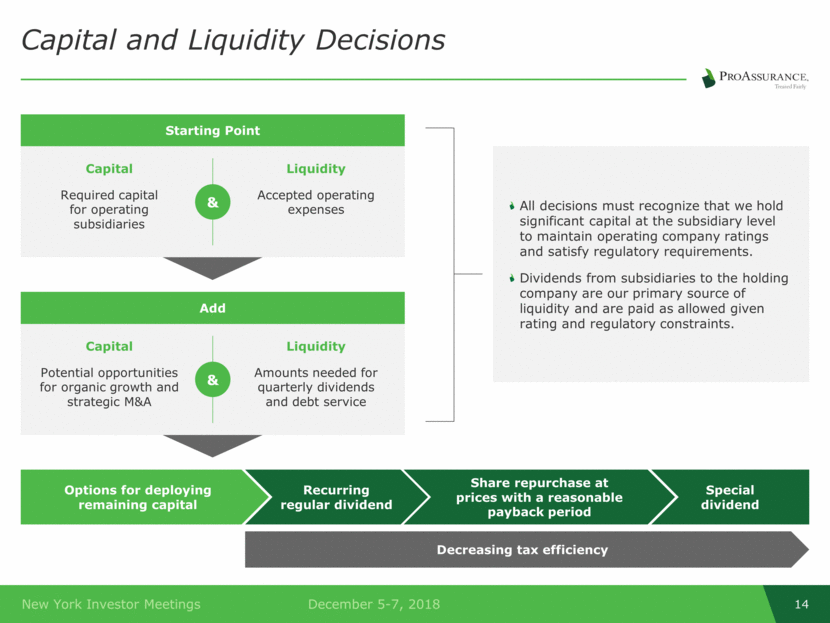
Capital and Liquidity Decisions All decisions must recognize that we hold significant capital at the subsidiary level to maintain operating company ratings and satisfy regulatory requirements. Dividends from subsidiaries to the holding company are our primary source of liquidity and are paid as allowed given rating and regulatory constraints. Starting Point & Capital Required capital for operating subsidiaries Liquidity Accepted operating expenses Add & Capital Potential opportunities for organic growth and strategic M&A Liquidity Amounts needed for quarterly dividends and debt service Share repurchase at prices with a reasonable payback period Special dividend Decreasing tax efficiency Options for deploying remaining capital Recurring regular dividend
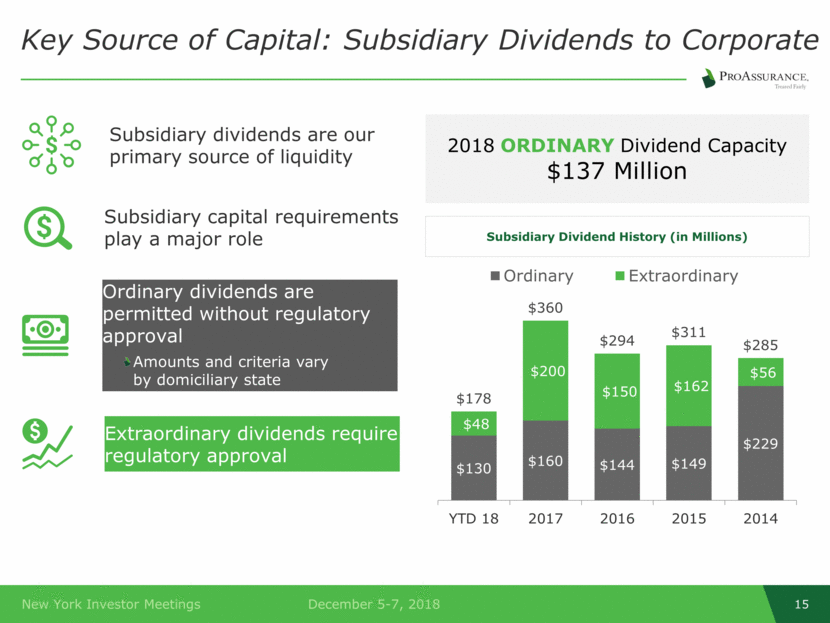
Key Source of Capital: Subsidiary Dividends to Corporate Subsidiary Dividend History (in Millions) 2018 ORDINARY Dividend Capacity $137 Million Ordinary dividends are permitted without regulatory approval Amounts and criteria vary by domiciliary state Extraordinary dividends require regulatory approval Subsidiary capital requirements play a major role Subsidiary dividends are our primary source of liquidity $130 $160 $144 $149 $229 $48 $200 $150 $162 $56 $178 $360 $294 $311 $285 YTD 18 2017 2016 2015 2014 Ordinary Extraordinary
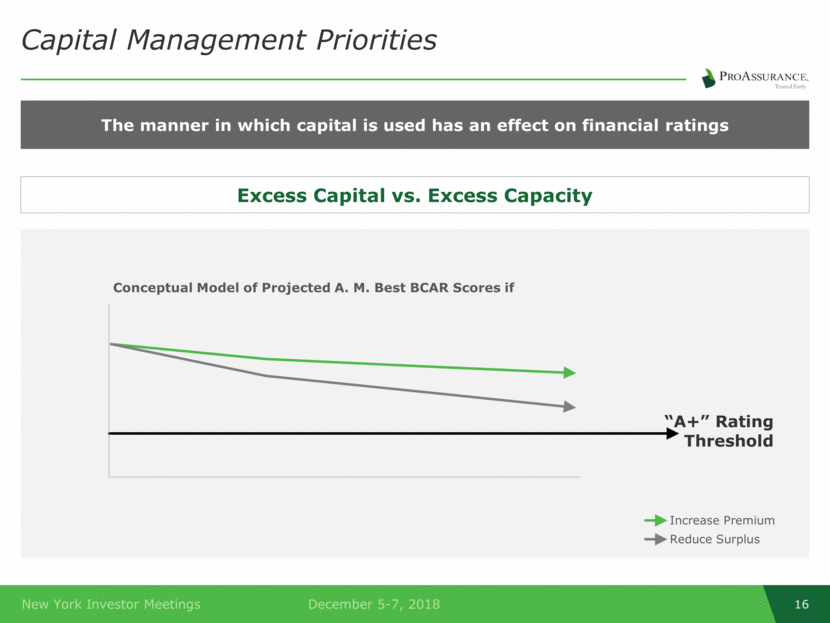
Capital Management Priorities “A+” Rating Threshold The manner in which capital is used has an effect on financial ratings Excess Capital vs. Excess Capacity Conceptual Model of Projected A. M. Best BCAR Scores if Increase Premium Reduce Surplus
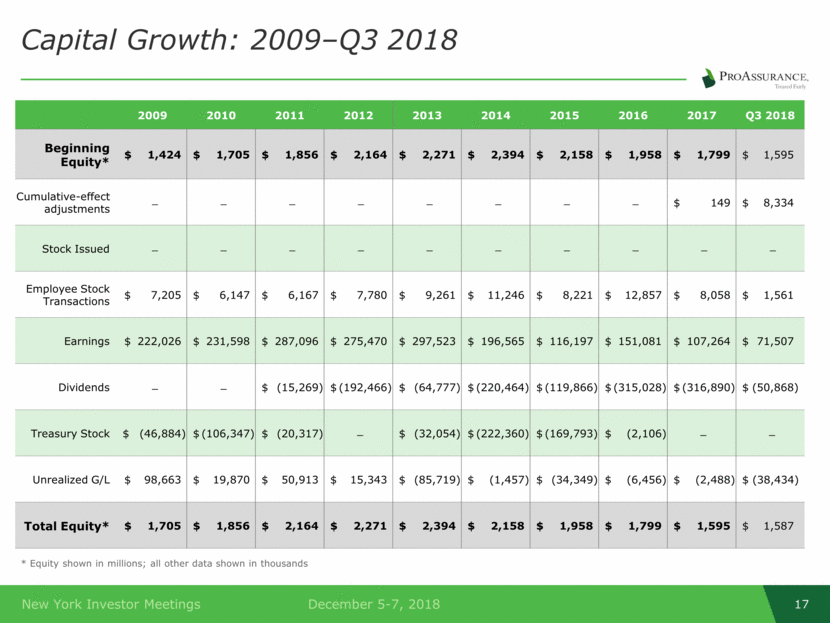
Capital Growth: 2009 Q3 2018 2009 2010 2011 2012 2013 2014 2015 2016 2017 Q3 2018 Beginning Equity* $ 1,424 $ 1,705 $ 1,856 $ 2,164 $ 2,271 $ 2,394 $ 2,158 $ 1,958 $ 1,799 $ 1,595 Cumulative-effect adjustments $ 149 $ 8,334 Stock Issued Employee Stock Transactions $ 7,205 $ 6,147 $ 6,167 $ 7,780 $ 9,261 $ 11,246 $ 8,221 $ 12,857 $ 8,058 $ 1,561 Earnings $ 222,026 $ 231,598 $ 287,096 $ 275,470 $ 297,523 $ 196,565 $ 116,197 $ 151,081 $ 107,264 $ 71,507 Dividends $ (15,269) $ (192,466) $ (64,777) $ (220,464) $ (119,866) $ (315,028) $ (316,890) $ (50,868) Treasury Stock $ (46,884) $ (106,347) $ (20,317) ̶ $ (32,054) $ (222,360) $ (169,793) $ (2,106) Unrealized G/L $ 98,663 $ 19,870 $ 50,913 $ 15,343 $ (85,719) $ (1,457) $ (34,349) $ (6,456) $ (2,488) $ (38,434) Total Equity* $ 1,705 $ 1,856 $ 2,164 $ 2,271 $ 2,394 $ 2,158 $ 1,958 $ 1,799 $ 1,595 $ 1,587 * Equity shown in millions; all other data shown in thousands
Financial / Operating Performance December 2018

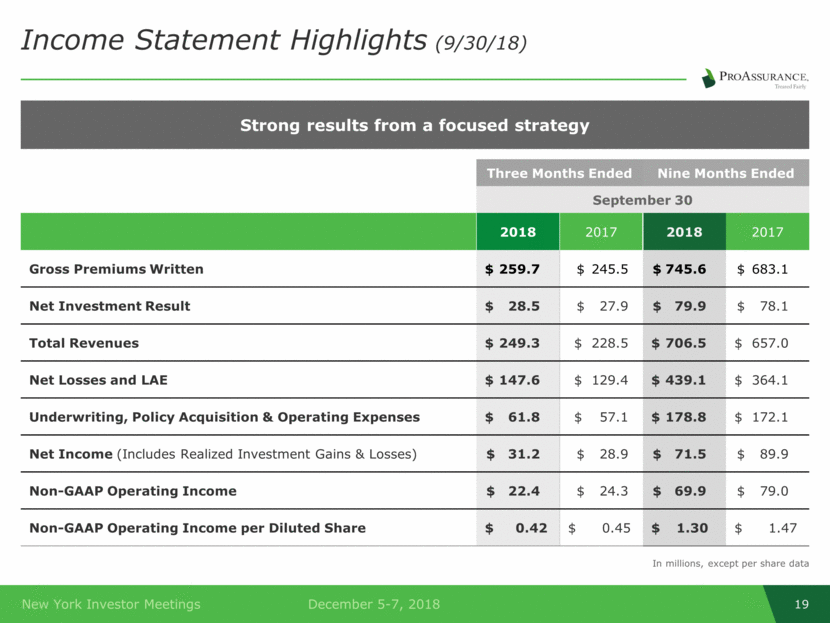
Income Statement Highlights (9/30/18) Strong results from a focused strategy Three Months Ended Nine Months Ended September 30 2018 2017 2018 2017 Gross Premiums Written $ 259.7 $ 245.5 $ 745.6 $ 683.1 Net Investment Result $ 28.5 $ 27.9 $ 79.9 $ 78.1 Total Revenues $ 249.3 $ 228.5 $ 706.5 $ 657.0 Net Losses and LAE $ 147.6 $ 129.4 $ 439.1 $ 364.1 Underwriting, Policy Acquisition & Operating Expenses $ 61.8 $ 57.1 $ 178.8 $ 172.1 Net Income (Includes Realized Investment Gains & Losses) $ 31.2 $ 28.9 $ 71.5 $ 89.9 Non-GAAP Operating Income $ 22.4 $ 24.3 $ 69.9 $ 79.0 Non-GAAP Operating Income per Diluted Share $ 0.42 $ 0.45 $ 1.30 $ 1.47 In millions, except per share data
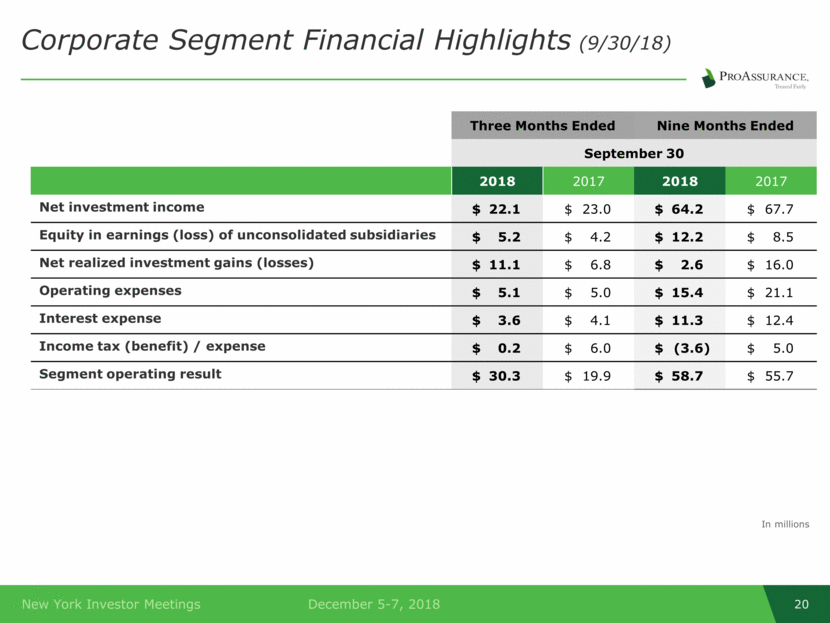
Corporate Segment Financial Highlights (9/30/18) Three Months Ended Nine Months Ended September 30 2018 2017 2018 2017 Net investment income $ 22.1 $ 23.0 $ 64.2 $ 67.7 Equity in earnings (loss) of unconsolidated subsidiaries $ 5.2 $ 4.2 $ 12.2 $ 8.5 Net realized investment gains (losses) $ 11.1 $ 6.8 $ 2.6 $ 16.0 Operating expenses $ 5.1 $ 5.0 $ 15.4 $ 21.1 Interest expense $ 3.6 $ 4.1 $ 11.3 $ 12.4 Income tax (benefit) / expense $ 0.2 $ 6.0 $ (3.6) $ 5.0 Segment operating result $ 30.3 $ 19.9 $ 58.7 $ 55.7 In millions
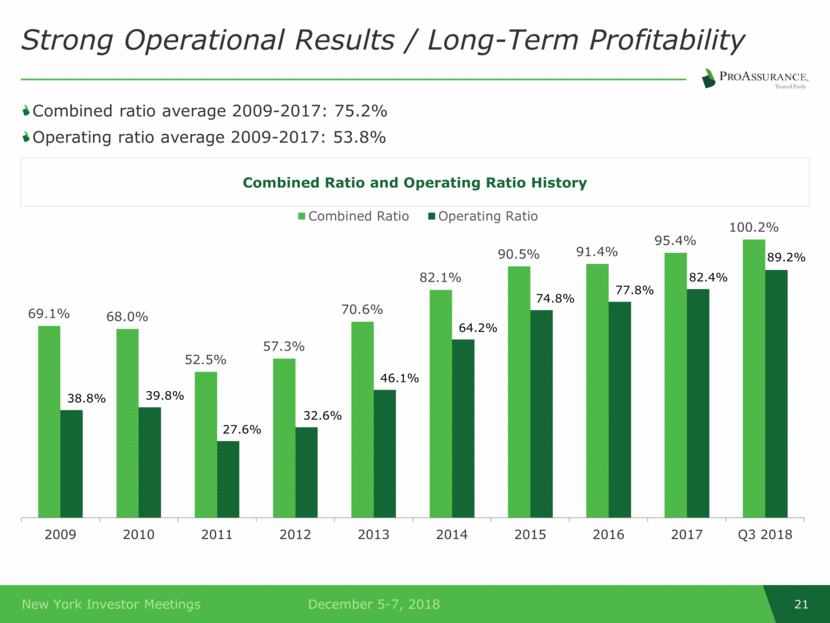
Strong Operational Results / Long-Term Profitability Combined ratio average 2009-2017: 75.2% Operating ratio average 2009-2017: 53.8% Combined Ratio and Operating Ratio History 69.1% 68.0% 52.5% 57.3% 70.6% 82.1% 90.5% 91.4% 95.4% 100.2% 38.8% 39.8% 27.6% 32.6% 46.1% 64.2% 74.8% 77.8% 82.4% 89.2% 2009 2010 2011 2012 2013 2014 2015 2016 2017 Q3 2018 Combined Ratio Operating Ratio
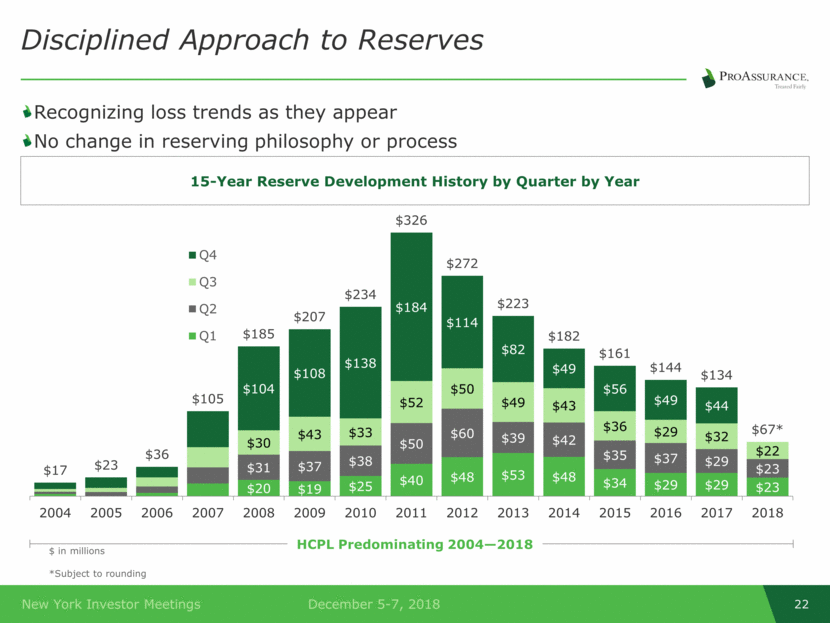
Recognizing loss trends as they appear No change in reserving philosophy or process Disciplined Approach to Reserves $ in millions *Subject to rounding 15-Year Reserve Development History by Quarter by Year HCPL Predominating 2004—2018 $20 $19 $25 $40 $48 $53 $48 $34 $29 $29 $23 $31 $37 $38 $50 $60 $39 $42 $35 $37 $29 $23 $30 $43 $33 $52 $50 $49 $43 $36 $29 $32 $22 $104 $108 $138 $184 $114 $82 $49 $56 $49 $44 $17 $23 $36 $105 $185 $207 $234 $326 $272 $223 $182 $161 $144 $134 $ 67* 2004 2005 2006 2007 2008 2009 2010 2011 2012 2013 2014 2015 2016 2017 2018 Q4 Q3 Q2 Q1
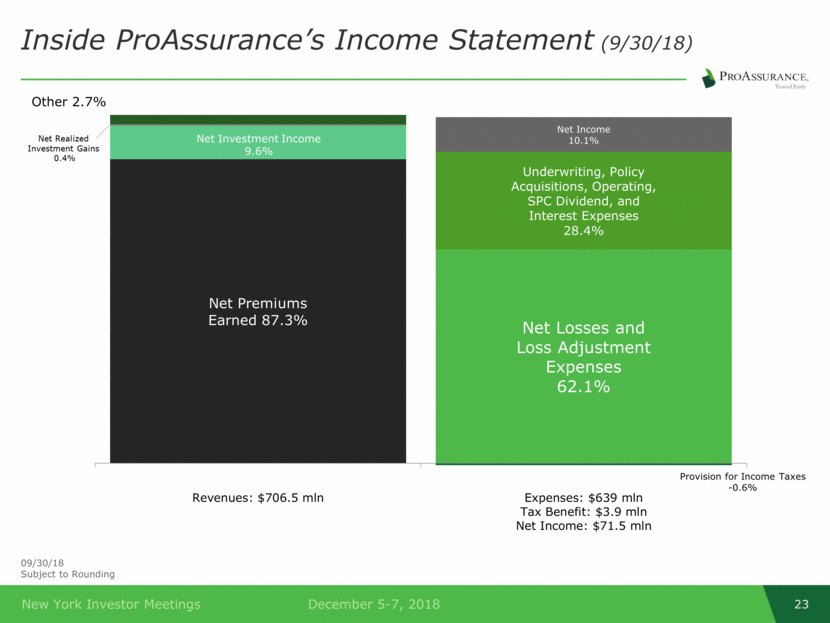
Inside ProAssurance’s Income Statement (9/30/18) 09/30/18 Subject to Rounding Net Premiums Earned 87.3% Net Investment Income 9.6% Net Realized Investment Gains 0.4% Other 2.7% Net Losses and Loss Adjustment Expenses 62.1% Underwriting, Policy Acquisitions, Operating, SPC Dividend, and Interest Expenses 28.4% Net Income 10.1% Provision for Income Taxes - 0.6% Revenues: $706.5 mln Expenses: $639 mln Tax Benefit: $3.9 mln Net Income: $71.5 mln
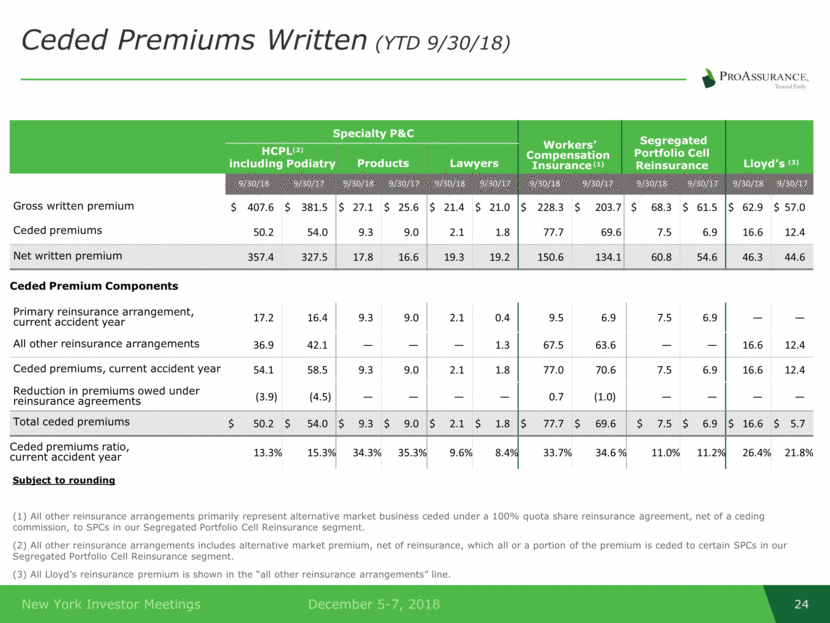
Ceded Premiums Written (YTD 9/30/18) Specialty P&C Workers’ Compensation Insurance (1) Segregated Portfolio Cell Reinsurance Lloyd’s (3) HCPL(2) including Podiatry Products Lawyers 9/30/18 9/30/17 9/30/18 9/30/17 9/30/18 9/30/17 9/30/18 9/30/17 9/30/18 9/30/17 9/30/18 9/30/17 Gross written premium $ 407.6 $ 381.5 $ 27.1 $ 25.6 $ 21.4 $ 21.0 $ 228.3 $ 203.7 $ 68.3 $ 61.5 $ 62.9 $ 57.0 Ceded premiums 50.2 54.0 9.3 9.0 2.1 1.8 77.7 69.6 7.5 6.9 16.6 12.4 Net written premium 357.4 327.5 17.8 16.6 19.3 19.2 150.6 134.1 60.8 54.6 46.3 44.6 Ceded Premium Components Primary reinsurance arrangement, current accident year 17.2 16.4 9.3 9.0 2.1 0.4 9.5 6.9 7.5 6.9 — — All other reinsurance arrangements 36.9 42.1 — — — 1.3 67.5 63.6 — — 16.6 12.4 Ceded premiums, current accident year 54.1 58.5 9.3 9.0 2.1 1.8 77.0 70.6 7.5 6.9 16.6 12.4 Reduction in premiums owed under reinsurance agreements (3.9 ) (4.5 ) — — — — 0.7 (1.0) — — — — Total ceded premiums $ 50.2 $ 54.0 $ 9.3 $ 9.0 $ 2.1 $ 1.8 $ 77.7 $ 69.6 $ 7.5 $ 6.9 $ 16.6 $ 5.7 Ceded premiums ratio, current accident year 13.3 % 15.3 % 34.3 % 35.3% n/a 9.6% n/a 8.4 % 33.7 % 34.6 % 11.0 % 11.2 % 26.4 % 21.8 % Subject to rounding (1) All other reinsurance arrangements primarily represent alternative market business ceded under a 100% quota share reinsurance agreement, net of a ceding commission, to SPCs in our Segregated Portfolio Cell Reinsurance segment. (2) All other reinsurance arrangements includes alternative market premium, net of reinsurance, which all or a portion of the premium is ceded to certain SPCs in our Segregated Portfolio Cell Reinsurance segment. (3) All Lloyd’s reinsurance premium is shown in the “all other reinsurance arrangements” line.
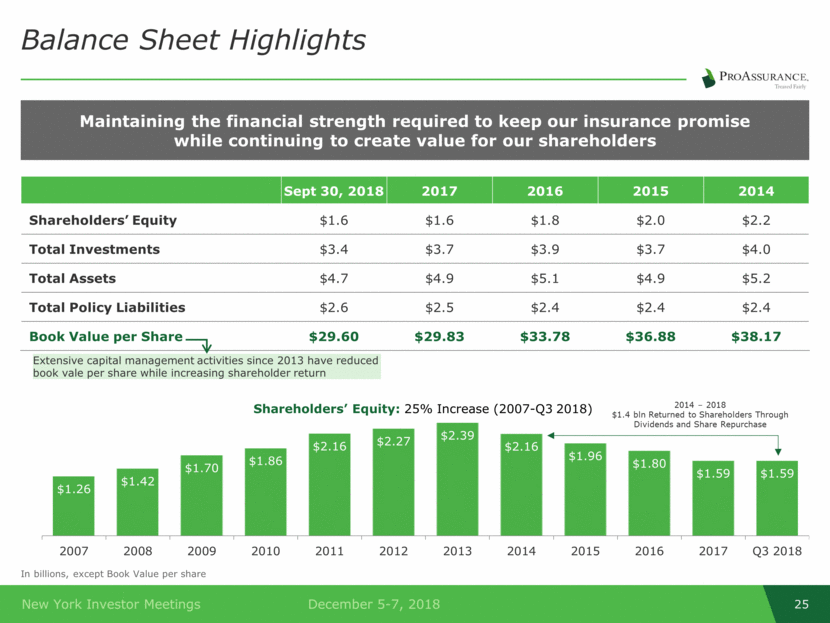
Balance Sheet Highlights Maintaining the financial strength required to keep our insurance promise while continuing to create value for our shareholders Sept 30, 2018 2017 2016 2015 2014 Shareholders’ Equity $1.6 $1.6 $1.8 $2.0 $2.2 Total Investments $3.4 $3.7 $3.9 $3.7 $4.0 Total Assets $4.7 $4.9 $5.1 $4.9 $5.2 Total Policy Liabilities $2.6 $2.5 $2.4 $2.4 $2.4 Book Value per Share $29.60 $29.83 $33.78 $36.88 $38.17 In billions, except Book Value per share 2014 – 2018 $1.4 bln Returned to Shareholders Through Dividends and Share Repurchase Extensive capital management activities since 2013 have reduced book vale per share while increasing shareholder return Shareholders’ Equity: 25% Increase (2007-Q3 2018) $1.26 $1.42 $1.70 $1.86 $2.16 $2.27 $2.39 $2.16 $1.96 $1.80 $1.59 $1.59 2007 2008 2009 2010 2011 2012 2013 2014 2015 2016 2017 Q3 2018
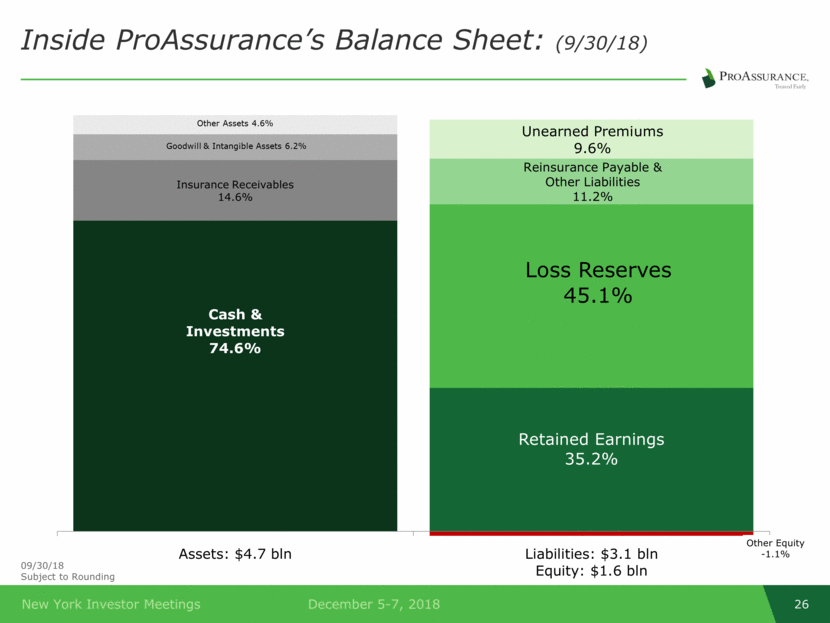
Inside ProAssurance’s Balance Sheet: (9/30/18) Cash & Investments 74.6% Insurance Receivables 14.6% Goodwill & Intangible Assets 6.2% Other Assets 4.6% Retained Earnings 35.2% Loss Reserves 45.1% Reinsurance Payable & Other Liabilities 11.2% Unearned Premiums 9.6% Other Equity - 1.1% Assets: $4.7 bln Liabilities: $3.1 bln Equity: $1.6 bln 09/30/18 Subject to Rounding
Shareholder Return & ROE December 2018

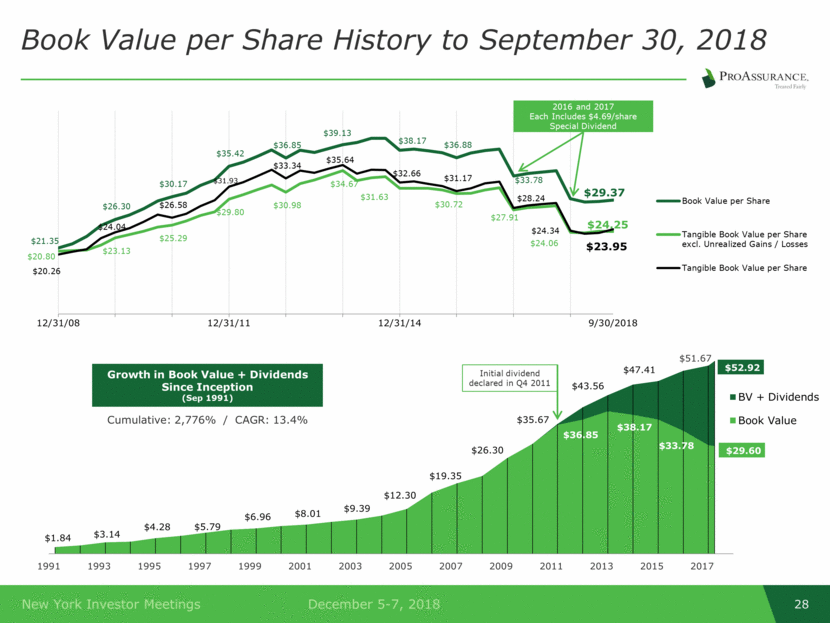
Book Value per Share History to September 30, 2018 Growth in Book Value + Dividends Since Inception (Sep 1991) Cumulative: 2,776% / CAGR: 13.4% Initial dividend declared in Q4 2011 $51.67 $21.35 $26.30 $30.17 $35.42 $36.85 $39.13 $38.17 $36.88 $33.78 $29.37 $20.80 $23.13 $25.29 $29.80 $30.98 $34.67 $31.63 $30.72 $27.91 $24.06 $ 24.25 $20.26 $24.04 $26.58 $31.93 $33.34 $35.64 $32.66 $31.17 $28.24 $24.34 $ 23.95 12/31/08 12/31/11 12/31/14 9/30/2018 Book Value per Share Tangible Book Value per Share excl. Unrealized Gains / Losses Tangible Book Value per Share 2016 and 2017 Each Includes $4.69/share Special Dividend $1.84 $3.14 $4.28 $5.79 $6.96 $8.01 $9.39 $12.30 $19.35 $26.30 $35.67 $43.56 $47.41 $ 52.92 $36.85 $38.17 $33.78 $29.60 1991 1993 1995 1997 1999 2001 2003 2005 2007 2009 2011 2013 2015 2017 BV + Dividends Book Value
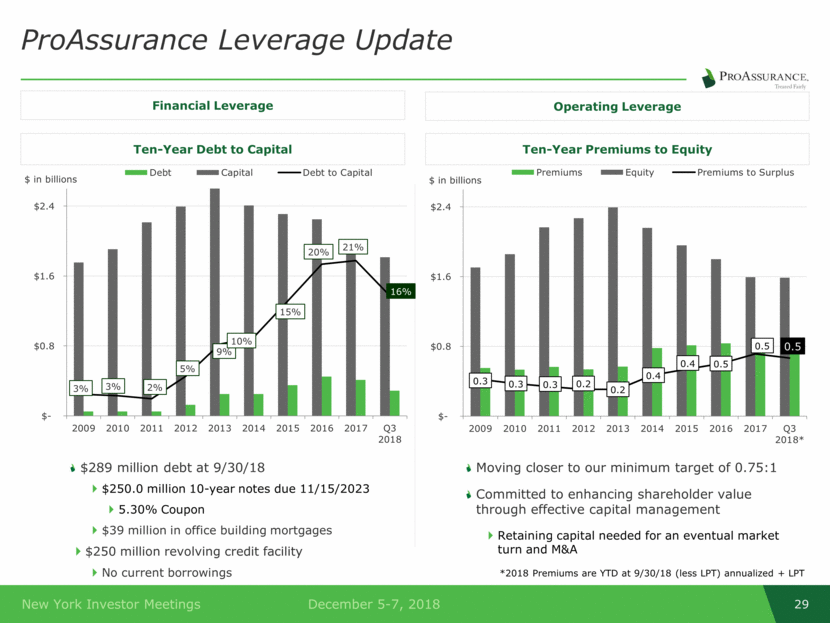
$289 million debt at 9/30/18 $250.0 million 10-year notes due 11/15/2023 5.30% Coupon $39 million in office building mortgages $250 million revolving credit facility No current borrowings ProAssurance Leverage Update Ten-Year Premiums to Equity Ten-Year Debt to Capital Moving closer to our minimum target of 0.75:1 Committed to enhancing shareholder value through effective capital management Retaining capital needed for an eventual market turn and M&A *2018 Premiums are YTD at 9/30/18 (less LPT) annualized + LPT Financial Leverage Operating Leverage 3% 3% 2% 5% 9% 10% 15% 20% 21% 16% $- $0.8 $1.6 $2.4 Q3 2018 2017 2016 2015 2014 2013 2012 2011 2010 2009 $ in billions Debt Capital Debt to Capital 0.3 0.3 0.3 0.2 0.2 0.4 0.4 0.5 0.5 0.5 $- $0.8 $1.6 $2.4 Q3 2018* 2017 2016 2015 2014 2013 2012 2011 2010 2009 $ in billions Premiums Equity Premiums to Surplus
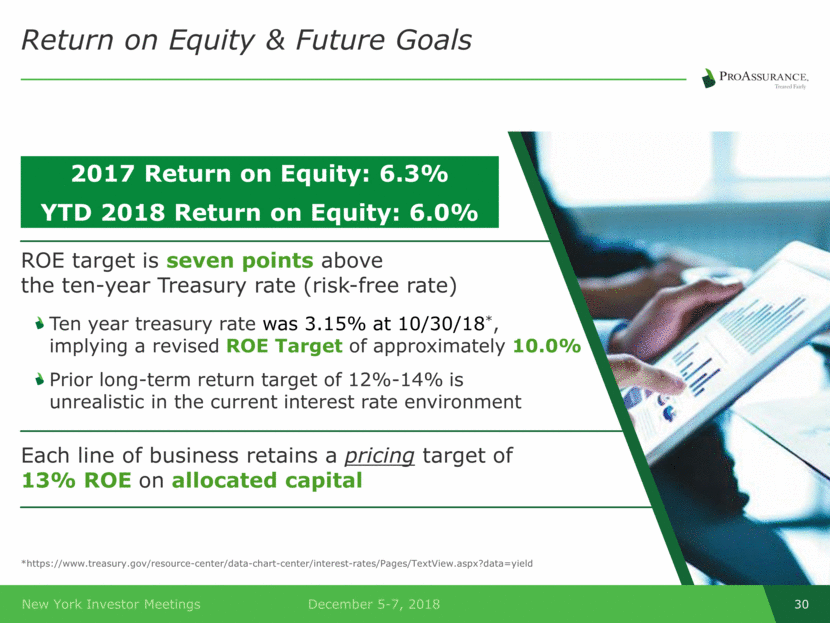
Return on Equity & Future Goals ROE target is seven points above the ten-year Treasury rate (risk-free rate) Ten year treasury rate was 3.15% at 10/30/18*, implying a revised ROE Target of approximately 10.0% Prior long-term return target of 12%-14% is unrealistic in the current interest rate environment Each line of business retains a pricing target of 13% ROE on allocated capital 2017 Return on Equity: 6.3% YTD 2018 Return on Equity: 6.0% *https://www.treasury.gov/resource-center/data-chart-center/interest-rates/Pages/TextView.aspx?data=yield
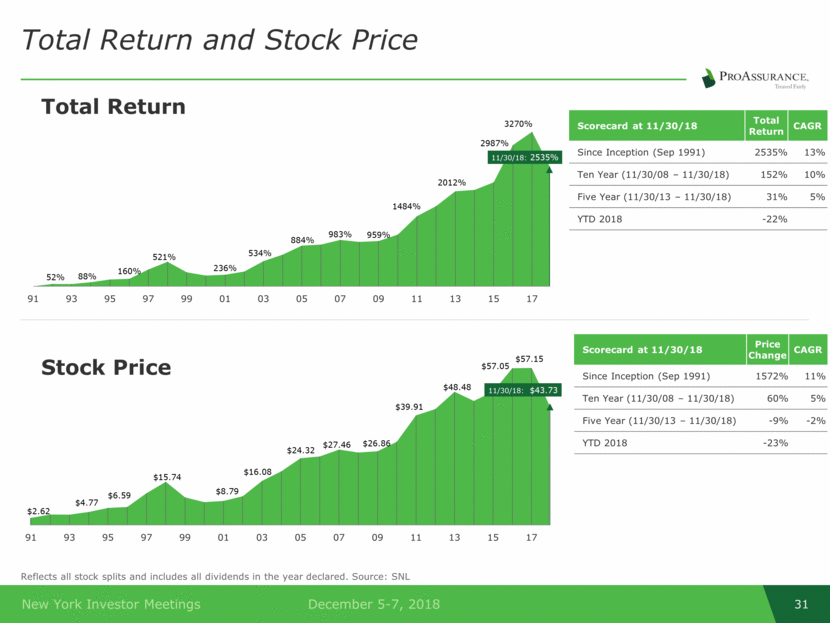
Total Return and Stock Price Reflects all stock splits and includes all dividends in the year declared. Source: SNL Scorecard at 11/30/18 Total Return CAGR Since Inception (Sep 1991) 2535% 13% Ten Year (11/30/08 – 11/30/18) 152% 10% Five Year (11/30/13 – 11/30/18) 31% 5% YTD 2018 -22% Stock Price Total Return Scorecard at 11/30/18 Price Change CAGR Since Inception (Sep 1991) 1572% 11% Ten Year (11/30/08 – 11/30/18) 60% 5% Five Year (11/30/13 – 11/30/18) -9% -2% YTD 2018 -23% $2.62 $4.77 $6.59 $15.74 $8.79 $16.08 $24.32 $27.46 $26.86 $39.91 $48.48 $57.05 $57.15 11/30/18: $43.73 91 93 95 97 99 01 03 05 07 09 11 13 15 17 52% 88% 160% 521% 236% 534% 884% 983% 959% 1484% 2012% 2987% 3270% 11/30/18: 2535% 91 93 95 97 99 01 03 05 07 09 11 13 15 17
Segment Highlights Specialty P & C, November 2018

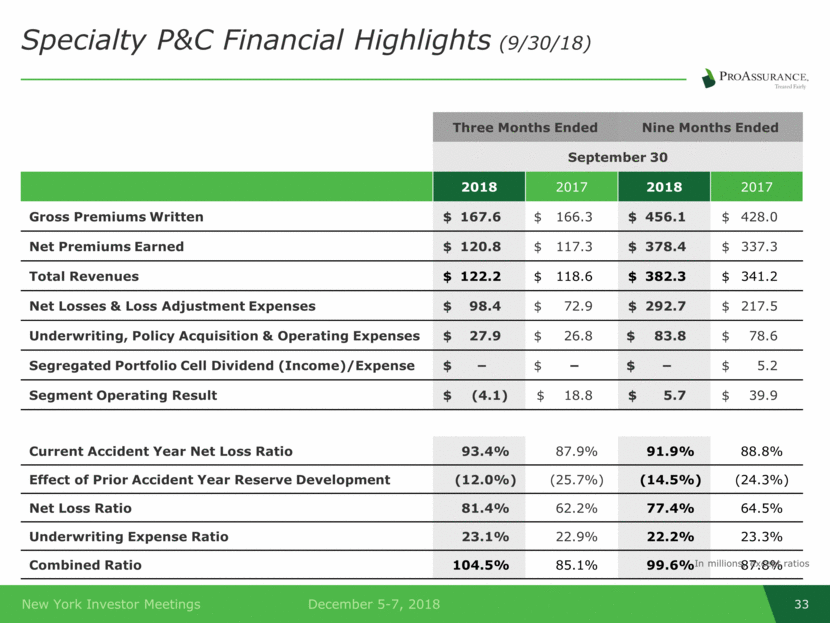
Specialty P&C Financial Highlights (9/30/18) Three Months Ended Nine Months Ended September 30 2018 2017 2018 2017 Gross Premiums Written $ 167.6 $ 166.3 $ 456.1 $ 428.0 Net Premiums Earned $ 120.8 $ 117.3 $ 378.4 $ 337.3 Total Revenues $ 122.2 $ 118.6 $ 382.3 $ 341.2 Net Losses & Loss Adjustment Expenses $ 98.4 $ 72.9 $ 292.7 $ 217.5 Underwriting, Policy Acquisition & Operating Expenses $ 27.9 $ 26.8 $ 83.8 $ 78.6 Segregated Portfolio Cell Dividend (Income)/Expense $ - $ - $ - $ 5.2 Segment Operating Result $ (4.1) $ 18.8 $ 5.7 $ 39.9 Current Accident Year Net Loss Ratio 93.4% 87.9% 91.9% 88.8% Effect of Prior Accident Year Reserve Development (12.0%) (25.7%) (14.5%) (24.3%) Net Loss Ratio 81.4% 62.2% 77.4% 64.5% Underwriting Expense Ratio 23.1% 22.9% 22.2% 23.3% Combined Ratio 104.5% 85.1% 99.6% 87.8% In millions, except ratios
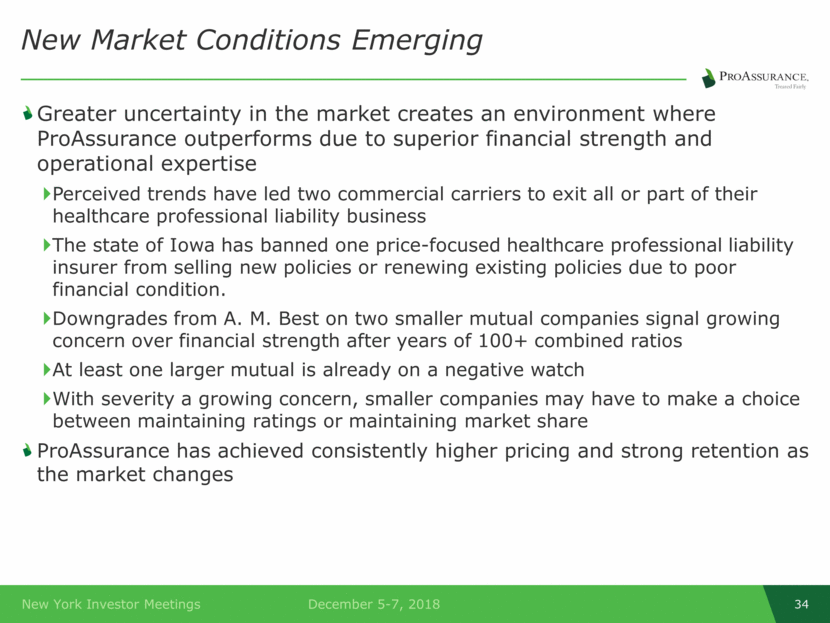
New Market Conditions Emerging Greater uncertainty in the market creates an environment where ProAssurance outperforms due to superior financial strength and operational expertise Perceived trends have led two commercial carriers to exit all or part of their healthcare professional liability business The state of Iowa has banned one price-focused healthcare professional liability insurer from selling new policies or renewing existing policies due to poor financial condition. Downgrades from A. M. Best on two smaller mutual companies signal growing concern over financial strength after years of 100+ combined ratios At least one larger mutual is already on a negative watch With severity a growing concern, smaller companies may have to make a choice between maintaining ratings or maintaining market share ProAssurance has achieved consistently higher pricing and strong retention as the market changes
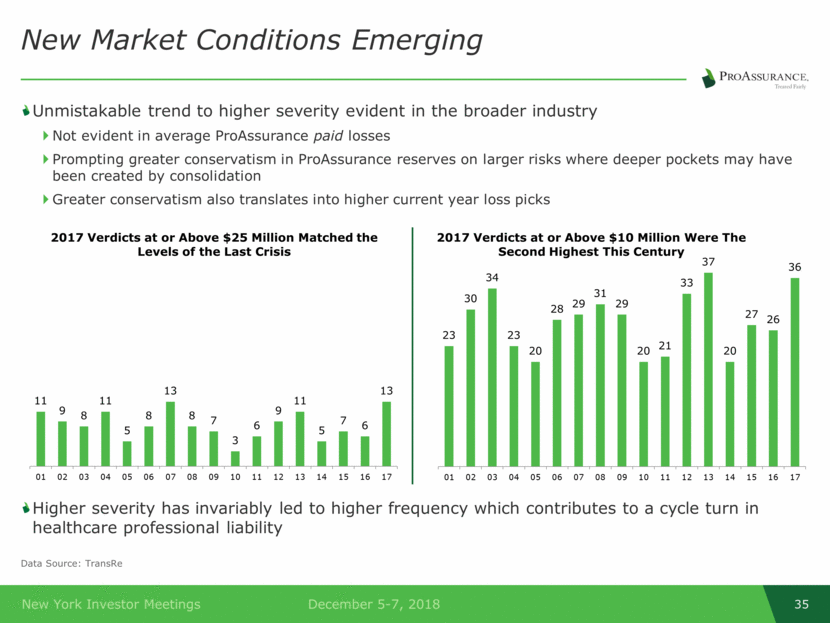
New Market Conditions Emerging Data Source: TransRe Unmistakable trend to higher severity evident in the broader industry Not evident in average ProAssurance paid losses Prompting greater conservatism in ProAssurance reserves on larger risks where deeper pockets may have been created by consolidation Greater conservatism also translates into higher current year loss picks Higher severity has invariably led to higher frequency which contributes to a cycle turn in healthcare professional liability 11 9 8 11 5 8 13 8 7 3 6 9 11 5 7 6 13 01 02 03 04 05 06 07 08 09 10 11 12 13 14 15 16 17 2017 Verdicts at or Above $25 Million Matched the Levels of the Last Crisis 23 30 34 23 20 28 29 31 29 20 21 33 37 20 27 26 36 01 02 03 04 05 06 07 08 09 10 11 12 13 14 15 16 17 2017 Verdicts at or Above $10 Million Were The Second Highest This Century
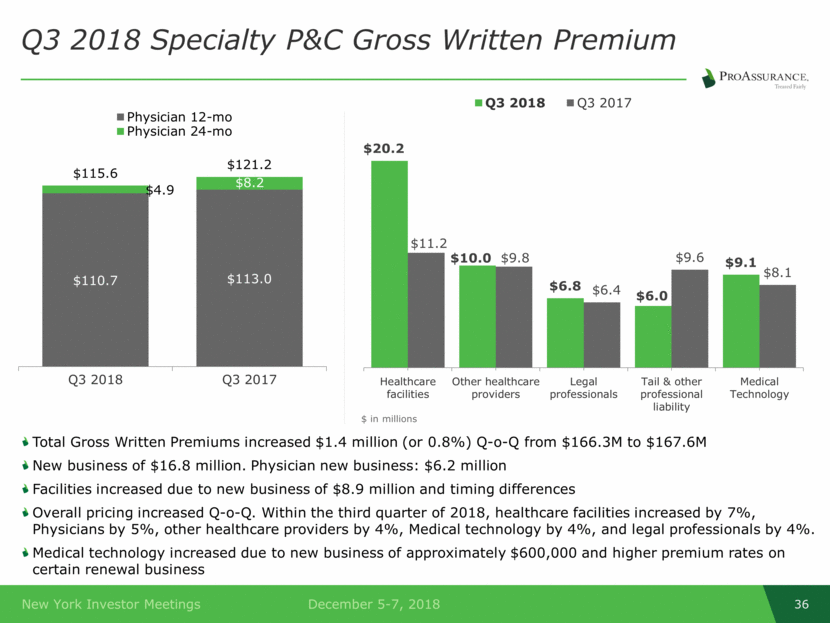
Total Gross Written Premiums increased $1.4 million (or 0.8%) Q-o-Q from $166.3M to $167.6M New business of $16.8 million. Physician new business: $6.2 million Facilities increased due to new business of $8.9 million and timing differences Overall pricing increased Q-o-Q. Within the third quarter of 2018, healthcare facilities increased by 7%, Physicians by 5%, other healthcare providers by 4%, Medical technology by 4%, and legal professionals by 4%. Medical technology increased due to new business of approximately $600,000 and higher premium rates on certain renewal business Q3 2018 Specialty P&C Gross Written Premium $ in millions $20.2 $10.0 $6.8 $6.0 $9.1 $11.2 $9.8 $6.4 $9.6 $8.1 Healthcare facilities Other healthcare providers Legal professionals Tail & other professional liability Medical Technology Q3 2018 Q3 2017 $110.7 $113.0 $4.9 $8.2 $115.6 $121.2 Q3 2018 Q3 2017 Physician 12-mo Physician 24-mo Total
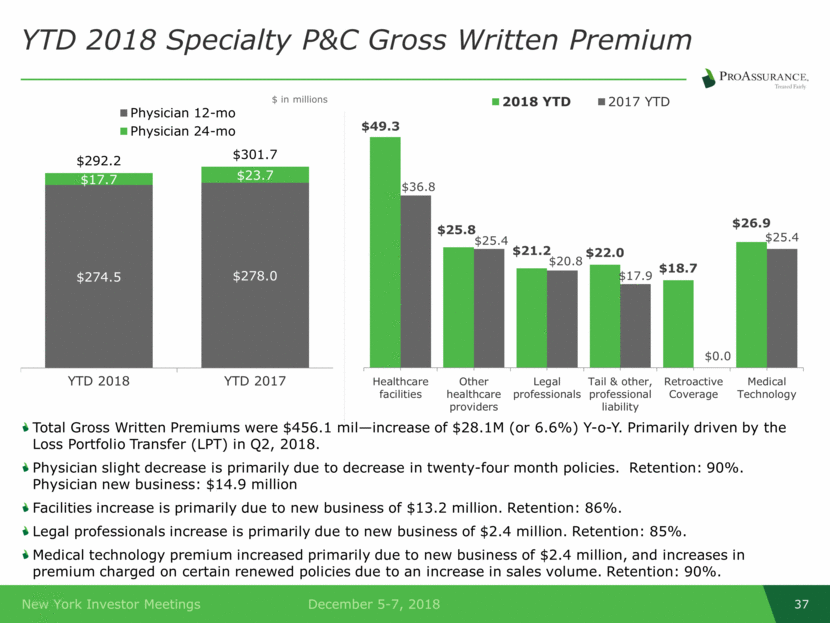
Total Gross Written Premiums were $456.1 mil increase of $28.1M (or 6.6%) Y-o-Y. Primarily driven by the Loss Portfolio Transfer (LPT) in Q2, 2018. Physician slight decrease is primarily due to decrease in twenty-four month policies. Retention: 90%. Physician new business: $14.9 million Facilities increase is primarily due to new business of $13.2 million. Retention: 86%. Legal professionals increase is primarily due to new business of $2.4 million. Retention: 85%. Medical technology premium increased primarily due to new business of $2.4 million, and increases in premium charged on certain renewed policies due to an increase in sales volume. Retention: 90%. YTD 2018 Specialty P&C Gross Written Premium $ in millions $274.5 $278.0 $17.7 $23.7 $292.2 $301.7 YTD 2018 YTD 2017 Physician 12-mo Physician 24-mo $49.3 $25.8 $21.2 $22.0 $18.7 $26.9 $36.8 $25.4 $20.8 $17.9 $0.0 $25.4 Healthcare facilities Other healthcare providers Legal professionals Tail & other, professional liability Retroactive Coverage Medical Technology 2018 YTD 2017 YTD
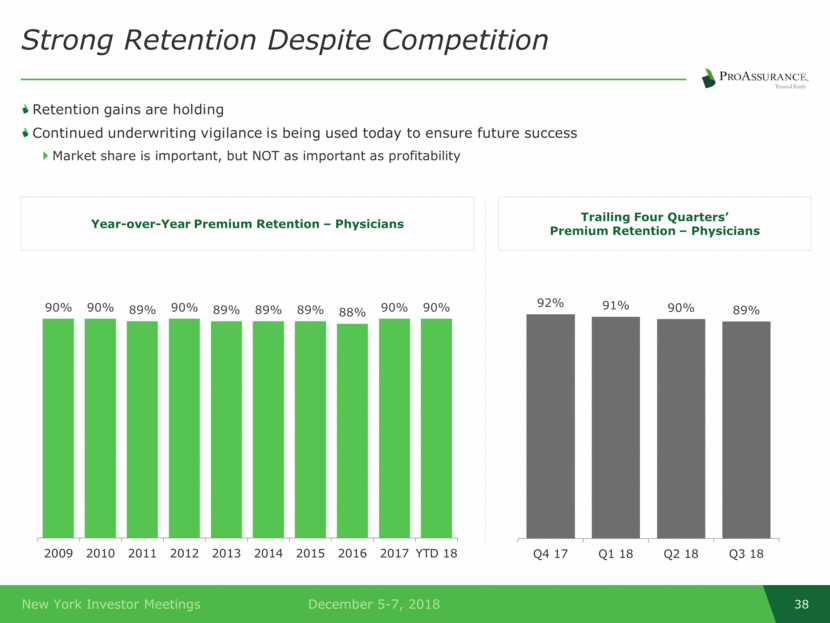
Retention gains are holding Continued underwriting vigilance is being used today to ensure future success Market share is important, but NOT as important as profitability Strong Retention Despite Competition Year-over-Year Premium Retention – Physicians Trailing Four Quarters’ Premium Retention – Physicians 90% 90% 89% 90% 89% 89% 89% 88% 90% 90% 2009 2010 2011 2012 2013 2014 2015 2016 2017 YTD 18 92% 91% 90% 89% Q4 17 Q1 18 Q2 18 Q3 18
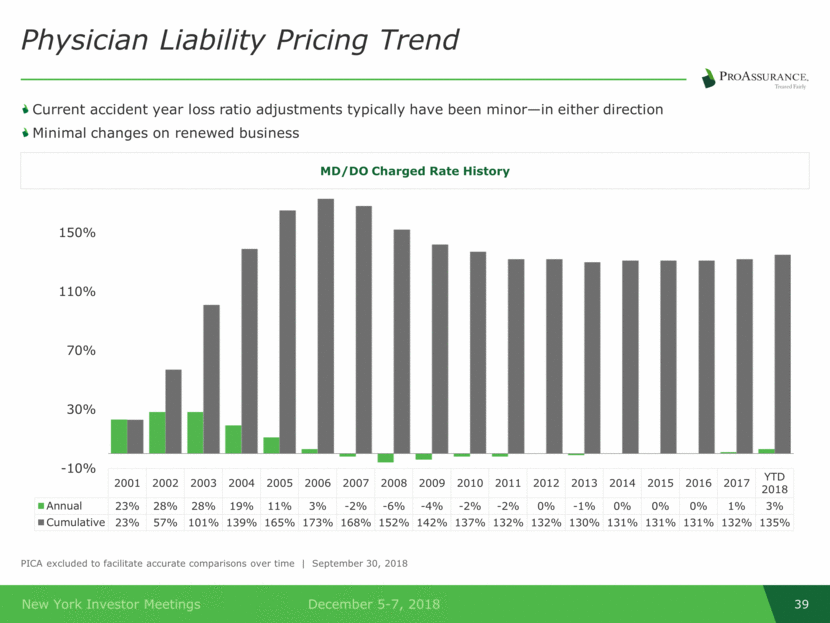
Physician Liability Pricing Trend PICA excluded to facilitate accurate comparisons over time September 30, 2018 Current accident year loss ratio adjustments typically have been minor—in either direction Minimal changes on renewed business MD/DO Charged Rate History 2001 2002 2003 2004 2005 2006 2007 2008 2009 2010 2011 2012 2013 2014 2015 2016 2017 YTD 2018 Annual 23% 28% 28% 19% 11% 3% -2% -6% -4% -2% -2% 0% -1% 0% 0% 0% 1% 3% Cumulative 23% 57% 101% 139% 165% 173% 168% 152% 142% 137% 132% 132% 130% 131% 131% 131% 132% 135% -10% 30% 70% 110% 150%
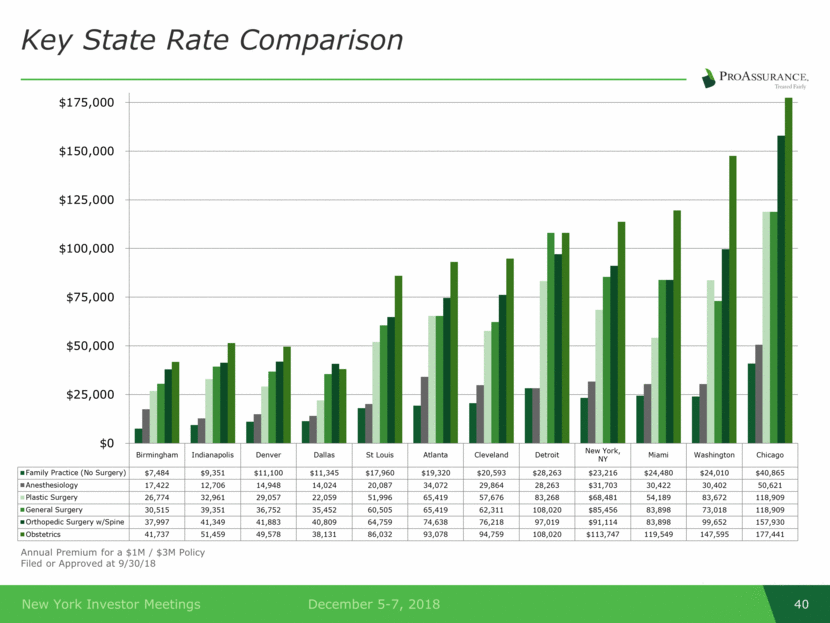
Annual Premium for a $1M / $3M Policy Filed or Approved at 9/30/18 Key State Rate Comparison Birmingham Indianapolis Denver Dallas St Louis Atlanta Cleveland Detroit New York, NY Miami Washington Chicago Family Practice (No Surgery) $7,484 $9,351 $11,100 $11,345 $17,960 $19,320 $20,593 $28,263 $23,216 $24,480 $24,010 $40,865 Anesthesiology 17,422 12,706 14,948 14,024 20,087 34,072 29,864 28,263 $31,703 30,422 30,402 50,621 Plastic Surgery 26,774 32,961 29,057 22,059 51,996 65,419 57,676 83,268 $68,481 54,189 83,672 118,909 General Surgery 30,515 39,351 36,752 35,452 60,505 65,419 62,311 108,020 $85,456 83,898 73,018 118,909 Orthopedic Surgery w/Spine 37,997 41,349 41,883 40,809 64,759 74,638 76,218 97,019 $91,114 83,898 99,652 157,930 Obstetrics 41,737 51,459 49,578 38,131 86,032 93,078 94,759 108,020 $113,747 119,549 147,595 177,441 $0 $25,000 $50,000 $75,000 $100,000 $125,000 $150,000 $175,000
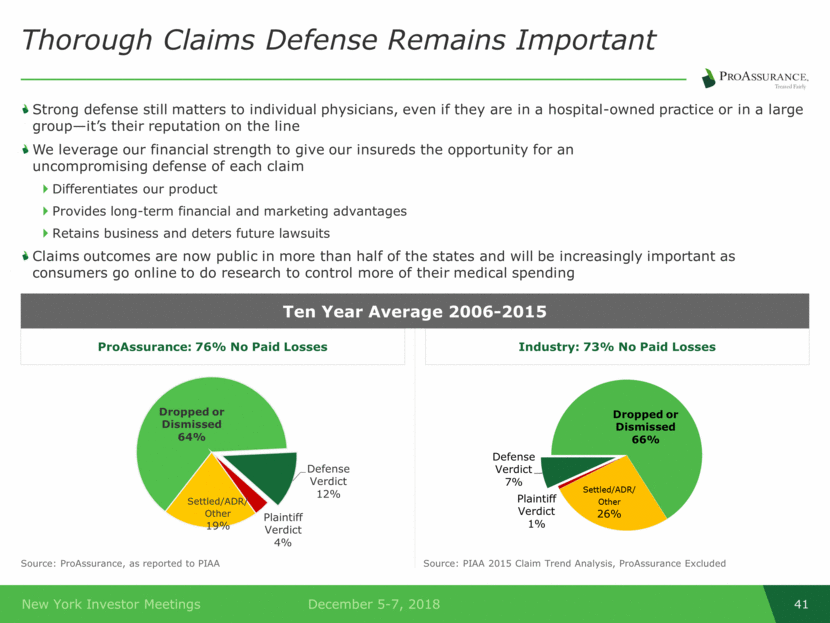
Strong defense still matters to individual physicians, even if they are in a hospital-owned practice or in a large group—it’s their reputation on the line We leverage our financial strength to give our insureds the opportunity for an uncompromising defense of each claim Differentiates our product Provides long-term financial and marketing advantages Retains business and deters future lawsuits Claims outcomes are now public in more than half of the states and will be increasingly important as consumers go online to do research to control more of their medical spending Thorough Claims Defense Remains Important Industry: 73% No Paid Losses ProAssurance: 76% No Paid Losses Source: ProAssurance, as reported to PIAA Source: PIAA 2015 Claim Trend Analysis, ProAssurance Excluded Ten Year Average 2006-2015 Dropped or Dismissed 64% Defense Verdict 12% Plaintiff Verdict 4% Settled/ADR/ Other 19% Dropped or Dismissed 66% Settled/ADR / Other 26% Plaintiff Verdict 1% Defense Verdict 7%
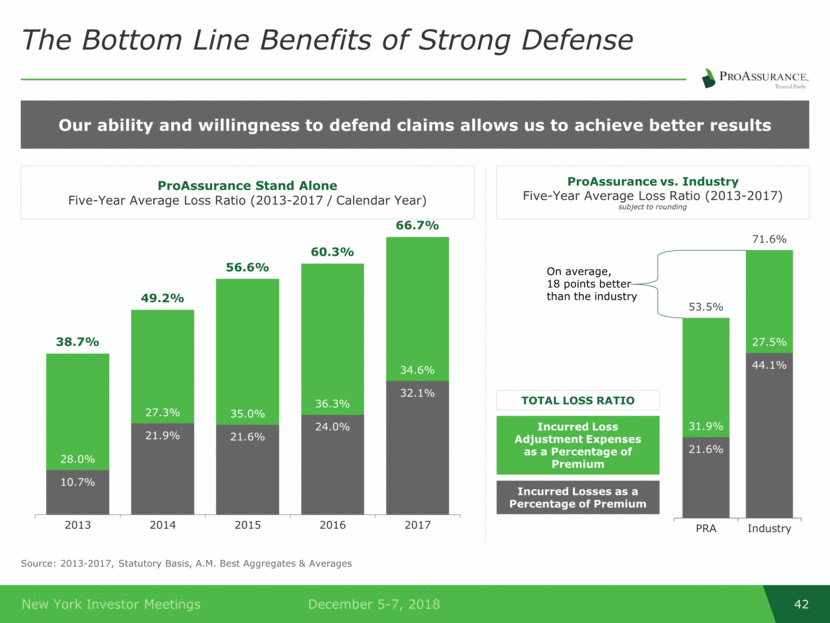
Source: 2013-2017, Statutory Basis, A.M. Best Aggregates & Averages The Bottom Line Benefits of Strong Defense Our ability and willingness to defend claims allows us to achieve better results ProAssurance Stand Alone Five-Year Average Loss Ratio (2013-2017 / Calendar Year) ProAssurance vs. Industry Five-Year Average Loss Ratio (2013-2017) subject to rounding On average, 18 points better than the industry TOTAL LOSS RATIO Incurred Loss Adjustment Expenses as a Percentage of Premium Incurred Losses as a Percentage of Premium 10.7% 21.9% 21.6% 24.0% 32.1% 28.0% 27.3% 35.0% 36.3% 34.6% 38.7% 49.2% 56.6% 60.3% 66.7% 2013 2014 2015 2016 2017 21.6% 44.1% 31.9% 27.5% 53.5% 71.6% PRA Industry
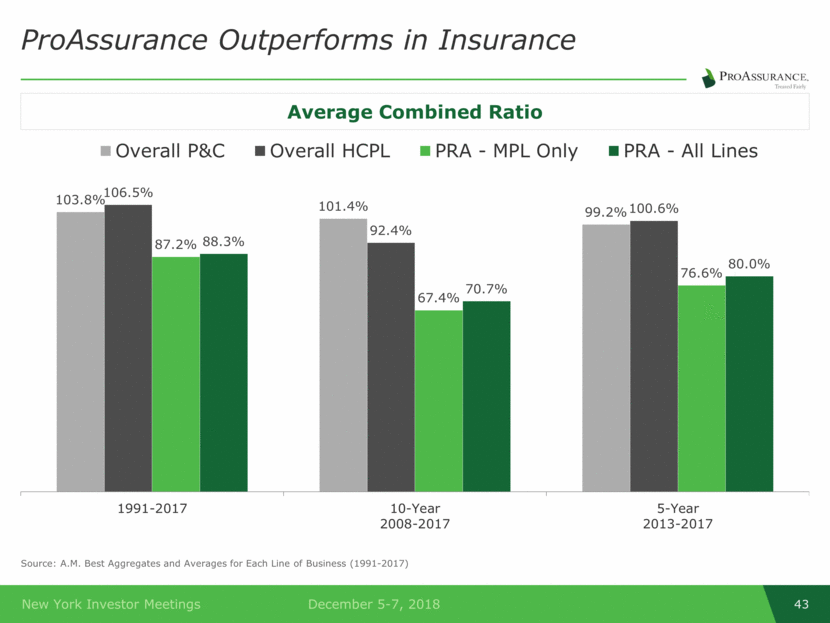
Source: A.M. Best Aggregates and Averages for Each Line of Business (1991-2017) ProAssurance Outperforms in Insurance Average Combined Ratio 103.8% 101.4% 99.2% 106.5% 92.4% 100.6% 87.2% 67.4% 76.6% 88.3% 70.7% 80.0% 1991-2017 10-Year 2008-2017 5-Year 2013-2017 Overall P&C Overall HCPL PRA - MPL Only PRA - All Lines
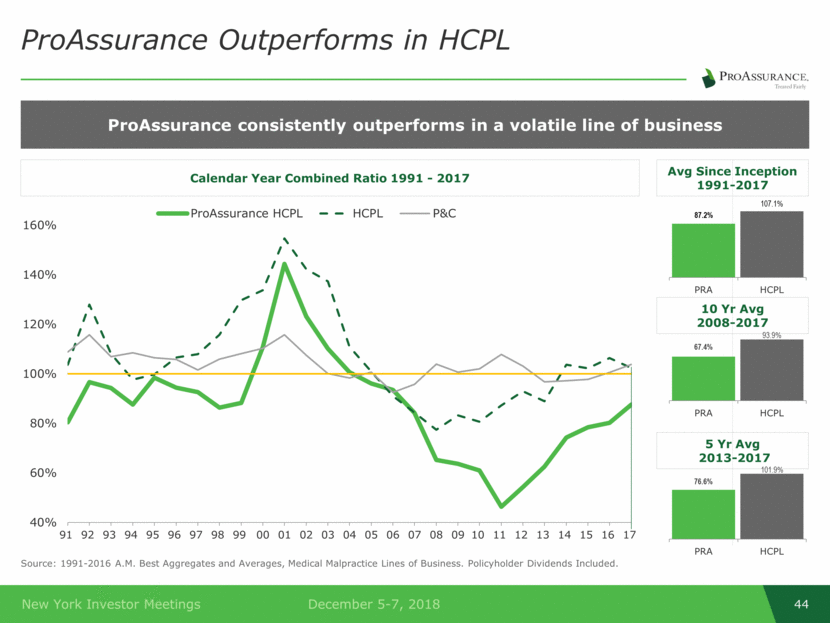
Source: 1991-2016 A.M. Best Aggregates and Averages, Medical Malpractice Lines of Business. Policyholder Dividends Included. ProAssurance Outperforms in HCPL ProAssurance consistently outperforms in a volatile line of business Calendar Year Combined Ratio 1991 - 2017 Avg Since Inception 1991-2017 10 Yr Avg 2008-2017 5 Yr Avg 2013-2017 40% 60% 80% 100% 120% 140% 160% 91 92 93 94 95 96 97 98 99 00 01 02 03 04 05 06 07 08 09 10 11 12 13 14 15 16 17 ProAssurance HCPL HCPL P&C 87.2% 107.1% PRA HCPL 76.6% 101.9% PRA HCPL 67.4% 93.9% PRA HCPL
Segment Strategic Review Specialty P & C, November 2018

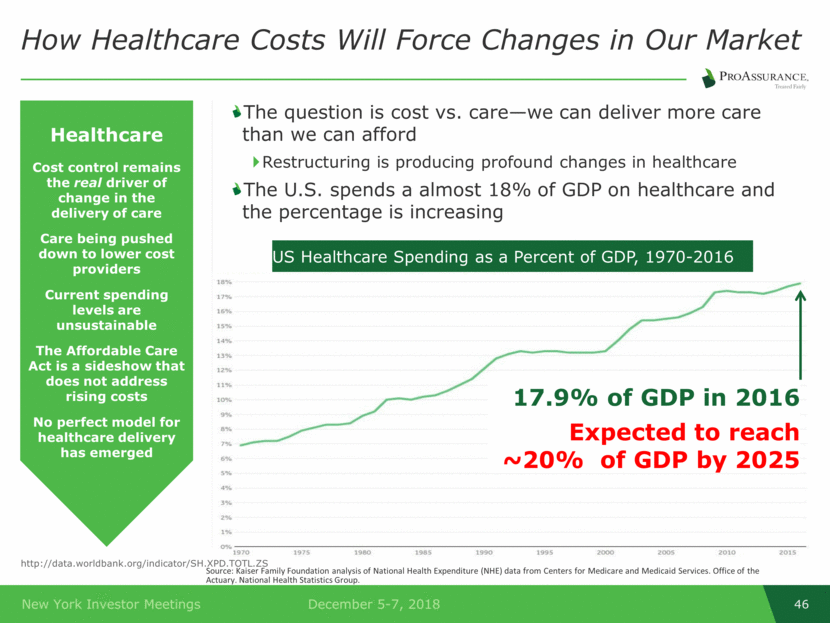
The question is cost vs. care—we can deliver more care than we can afford Restructuring is producing profound changes in healthcare The U.S. spends a almost 18% of GDP on healthcare and the percentage is increasing How Healthcare Costs Will Force Changes in Our Market Healthcare Cost control remains the real driver of change in the delivery of care Care being pushed down to lower cost providers Current spending levels are unsustainable The Affordable Care Act is a sideshow that does not address rising costs No perfect model for healthcare delivery has emerged http://data.worldbank.org/indicator/SH.XPD.TOTL.ZS Source: Kaiser Family Foundation analysis of National Health Expenditure (NHE) data from Centers for Medicare and Medicaid Services. Office of the Actuary. National Health Statistics Group. US Healthcare Spending as a Percent of GDP, 1970-2016 17.9% of GDP in 2016 Expected to reach ~20% of GDP by 2025
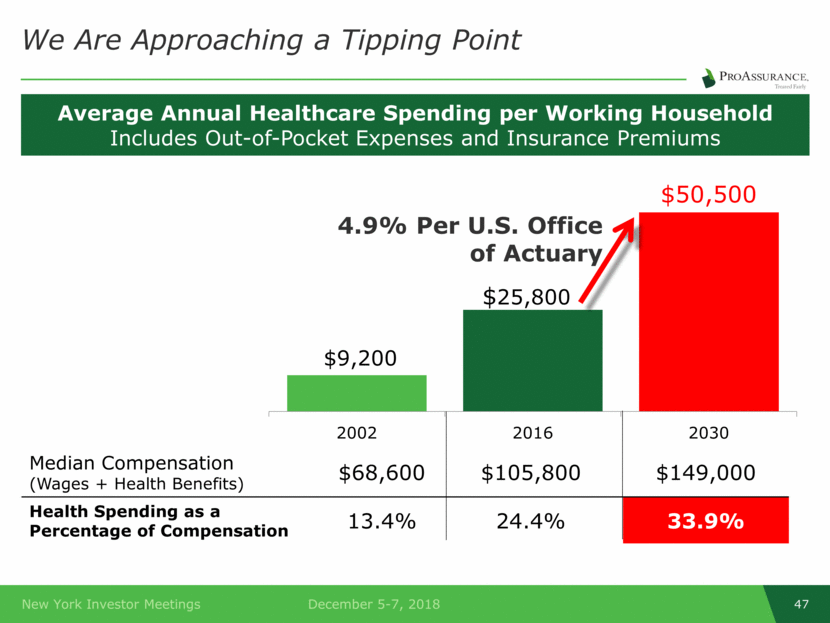
We Are Approaching a Tipping Point Average Annual Healthcare Spending per Working Household Includes Out-of-Pocket Expenses and Insurance Premiums Median Compensation (Wages + Health Benefits) $68,600 $105,800 $149,000 Health Spending as a Percentage of Compensation 13.4% 24.4% 33.9% $9,200 $ 25,800 $50,500 2002 2016 2030 4.9% Per U.S. Office of Actuary
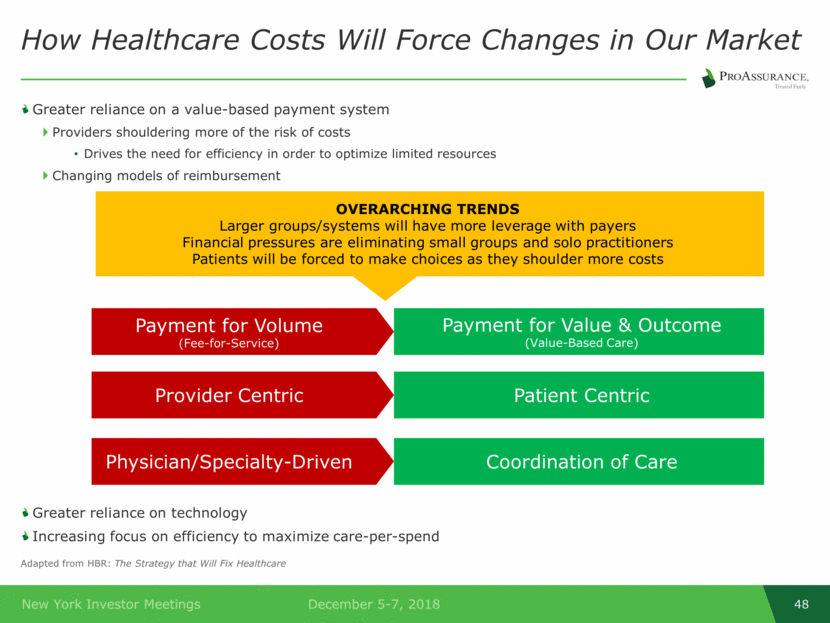
How Healthcare Costs Will Force Changes in Our Market Adapted from HBR: The Strategy that Will Fix Healthcare Greater reliance on a value-based payment system Providers shouldering more of the risk of costs Drives the need for efficiency in order to optimize limited resources Changing models of reimbursement Greater reliance on technology Increasing focus on efficiency to maximize care-per-spend OVERARCHING TRENDS Larger groups/systems will have more leverage with payers Financial pressures are eliminating small groups and solo practitioners Patients will be forced to make choices as they shoulder more costs Payment for Volume (Fee-for-Service) Payment for Value & Outcome (Value-Based Care) Provider Centric Patient Centric Physician/Specialty-Driven Coordination of Care
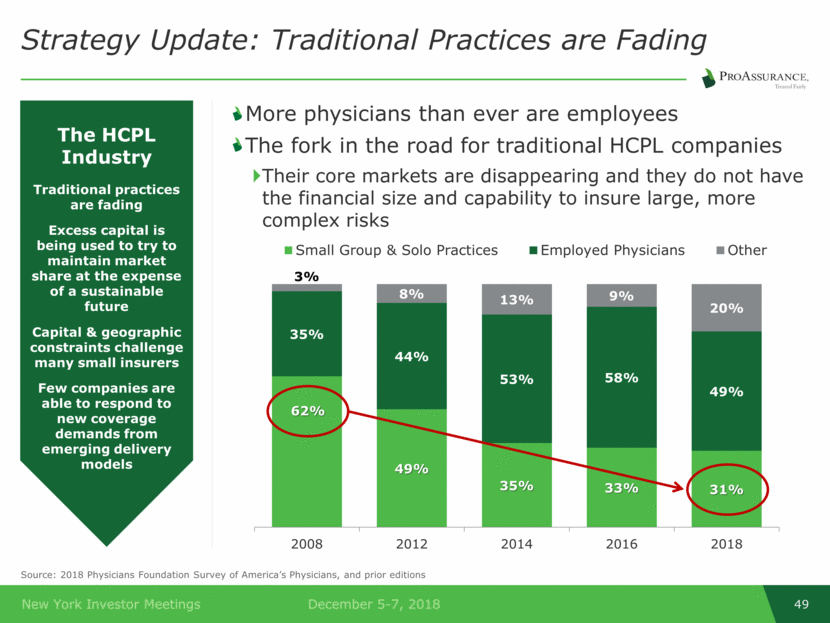
More physicians than ever are employees The fork in the road for traditional HCPL companies Their core markets are disappearing and they do not have the financial size and capability to insure large, more complex risks Strategy Update: Traditional Practices are Fading Source: 2018 Physicians Foundation Survey of America’s Physicians, and prior editions The HCPL Industry Traditional practices are fading Excess capital is being used to try to maintain market share at the expense of a sustainable future Capital & geographic constraints challenge many small insurers Few companies are able to respond to new coverage demands from emerging delivery models 62% 49% 35% 33% 31% 35% 44% 53% 58% 49% 3% 8% 13% 9% 20% 2008 2012 2014 2016 2018 Small Group & Solo Practices Employed Physicians Other
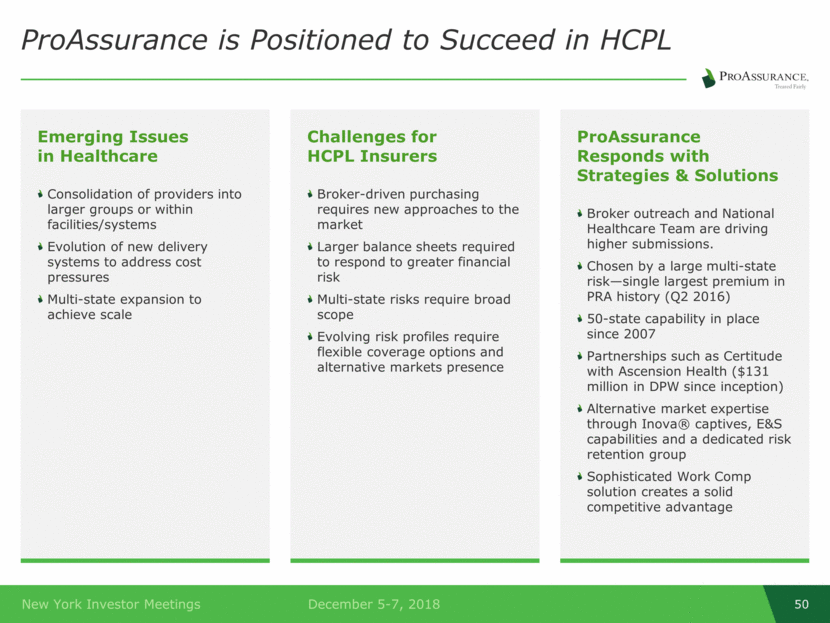
Emerging Issues in Healthcare Consolidation of providers into larger groups or within facilities/systems Evolution of new delivery systems to address cost pressures Multi-state expansion to achieve scale Challenges for HCPL Insurers Broker-driven purchasing requires new approaches to the market Larger balance sheets required to respond to greater financial risk Multi-state risks require broad scope Evolving risk profiles require flexible coverage options and alternative markets presence ProAssurance Responds with Strategies & Solutions Broker outreach and National Healthcare Team are driving higher submissions. Chosen by a large multi-state risk—single largest premium in PRA history (Q2 2016) 50-state capability in place since 2007 Partnerships such as Certitude with Ascension Health ($131 million in DPW since inception) Alternative market expertise through Inova® captives, E&S capabilities and a dedicated risk retention group Sophisticated Work Comp solution creates a solid competitive advantage ProAssurance is Positioned to Succeed in HCPL
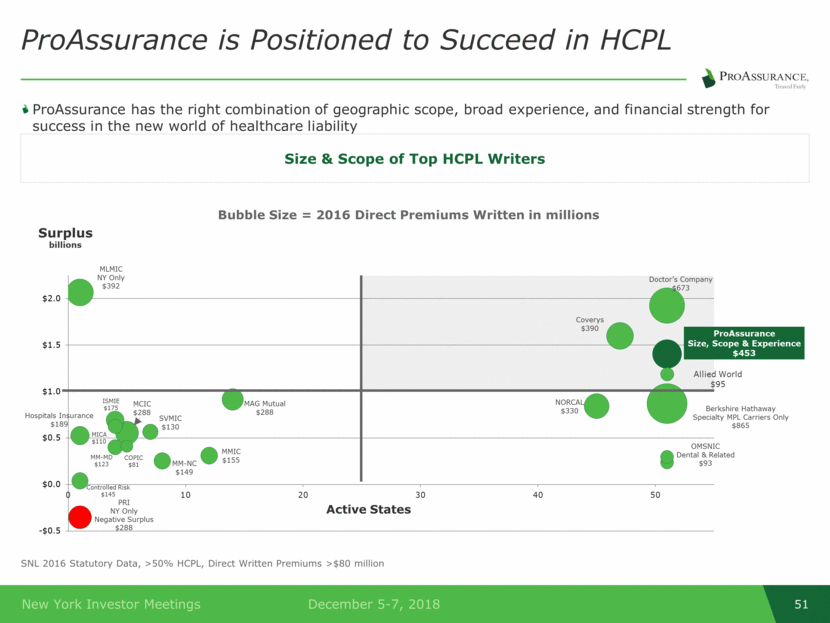
ProAssurance has the right combination of geographic scope, broad experience, and financial strength for success in the new world of healthcare liability ProAssurance is Positioned to Succeed in HCPL Size & Scope of Top HCPL Writers SNL 2016 Statutory Data, >50% HCPL, Direct Written Premiums >$80 million
ProAssurance is Positioned to Succeed in HCPL Our long-term focus on financial strength is central to our overall strategy and success We have proven our ability to thrive across insurance cycles We have an unmatched combination of financial strength and deep experience ProAssurance has always evolved ahead of the curve We have built the platform that allows us to serve the broad spectrum of healthcare Prudently leveraging our success and experience with the addition of specialized expertise Broad capabilities to meet evolving demands Eastern, Medmarc, PICA & Mid-Continent Traditional HCPL companies deepen our capabilities
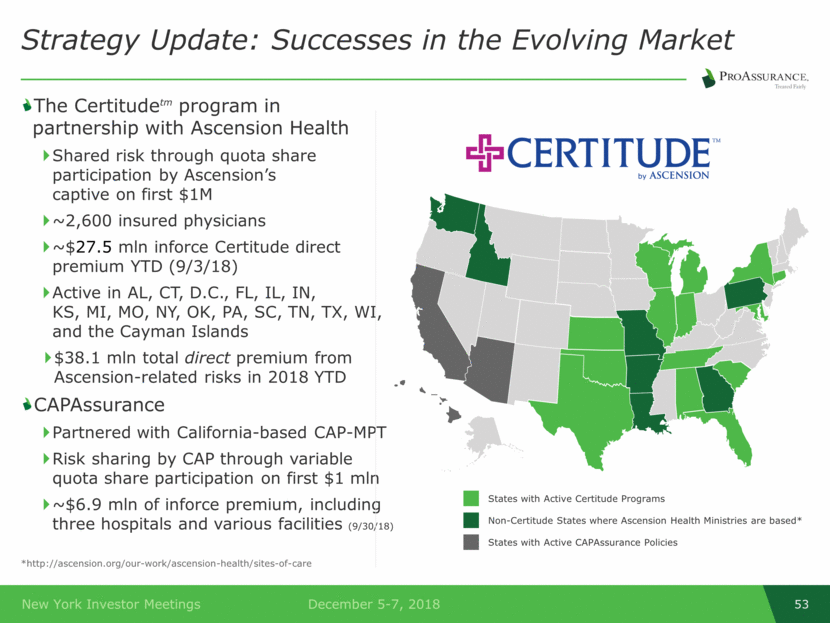
The Certitudetm program in partnership with Ascension Health Shared risk through quota share participation by Ascension’s captive on first $1M ~2,600 insured physicians ~$27.5 mln inforce Certitude direct premium YTD (9/3/18) Active in AL, CT, D.C., FL, IL, IN, KS, MI, MO, NY, OK, PA, SC, TN, TX, WI, and the Cayman Islands $38.1 mln total direct premium from Ascension-related risks in 2018 YTD CAPAssurance Partnered with California-based CAP-MPT Risk sharing by CAP through variable quota share participation on first $1 mln ~$6.9 mln of inforce premium, including three hospitals and various facilities (9/30/18) Strategy Update: Successes in the Evolving Market *http://ascension.org/our-work/ascension-health/sites-of-care States with Active Certitude Programs Non-Certitude States where Ascension Health Ministries are based* States with Active CAPAssurance Policies
Addressing a Wide Spectrum of Risk Appetites Traditional Policies Primarily agent-sold or direct Remains the majority of our business Proven performance supports discipline pricing Transitional Risk sharing/high deductible programs control cost and build “sticky” business Risk purchasing groups target specific specialties or program business Joint physician/hospital policies (ProControl®) address unique risk tolerance and claims expectations of each class of insured Alternative Risk Captive insurance programs allow large, sophisticated healthcare and workers’ compensation customers to control their own insurance programs Two joint healthcare professional and workers’ compensation programs are already in place Eastern Re brings proven experience and expertise in establishing and operating captives through segregated cells Coordinated sales & marketing efforts target insureds in these classes for additional products and services
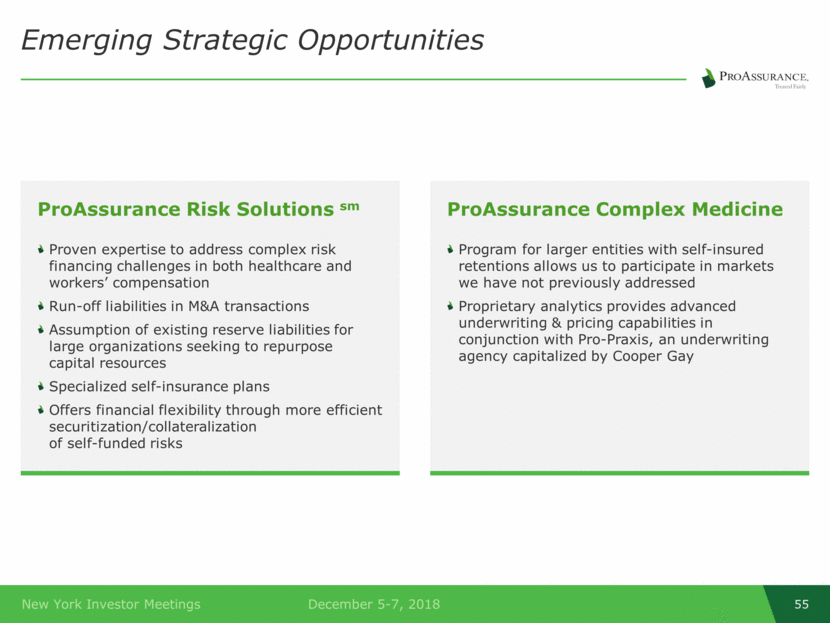
Emerging Strategic Opportunities ProAssurance Risk Solutions sm Proven expertise to address complex risk financing challenges in both healthcare and workers’ compensation Run-off liabilities in M&A transactions Assumption of existing reserve liabilities for large organizations seeking to repurpose capital resources Specialized self-insurance plans Offers financial flexibility through more efficient securitization/collateralization of self-funded risks ProAssurance Complex Medicine Program for larger entities with self-insured retentions allows us to participate in markets we have not previously addressed Proprietary analytics provides advanced underwriting & pricing capabilities in conjunction with Pro-Praxis, an underwriting agency capitalized by Cooper Gay
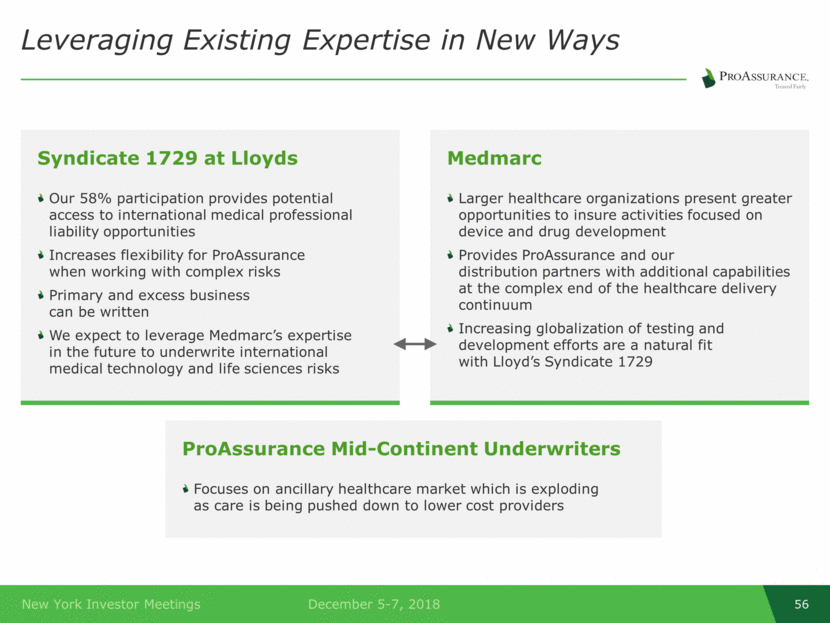
Leveraging Existing Expertise in New Ways Syndicate 1729 at Lloyds Our 58% participation provides potential access to international medical professional liability opportunities Increases flexibility for ProAssurance when working with complex risks Primary and excess business can be written We expect to leverage Medmarc’s expertise in the future to underwrite international medical technology and life sciences risks Medmarc Larger healthcare organizations present greater opportunities to insure activities focused on device and drug development Provides ProAssurance and our distribution partners with additional capabilities at the complex end of the healthcare delivery continuum Increasing globalization of testing and development efforts are a natural fit with Lloyd’s Syndicate 1729 ProAssurance Mid-Continent Underwriters Focuses on ancillary healthcare market which is exploding as care is being pushed down to lower cost providers
Segment Highlights Workers’ Compensation, November 2018

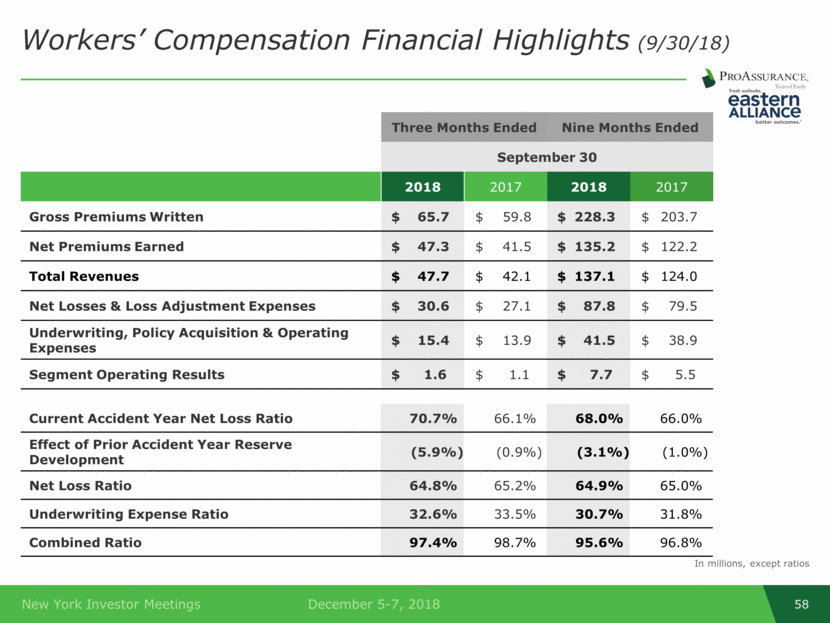
Workers’ Compensation Financial Highlights (9/30/18) Three Months Ended Nine Months Ended September 30 2018 2017 2018 2017 Gross Premiums Written $ 65.7 $ 59.8 $ 228.3 $ 203.7 Net Premiums Earned $ 47.3 $ 41.5 $ 135.2 $ 122.2 Total Revenues $ 47.7 $ 42.1 $ 137.1 $ 124.0 Net Losses & Loss Adjustment Expenses $ 30.6 $ 27.1 $ 87.8 $ 79.5 Underwriting, Policy Acquisition & Operating Expenses $ 15.4 $ 13.9 $ 41.5 $ 38.9 Segment Operating Results $ 1.6 $ 1.1 $ 7.7 $ 5.5 Current Accident Year Net Loss Ratio 70.7% 66.1% 68.0% 66.0% Effect of Prior Accident Year Reserve Development (5.9%) (0.9%) (3.1%) (1.0%) Net Loss Ratio 64.8% 65.2% 64.9% 65.0% Underwriting Expense Ratio 32.6% 33.5% 30.7% 31.8% Combined Ratio 97.4% 98.7% 95.6% 96.8% In millions, except ratios
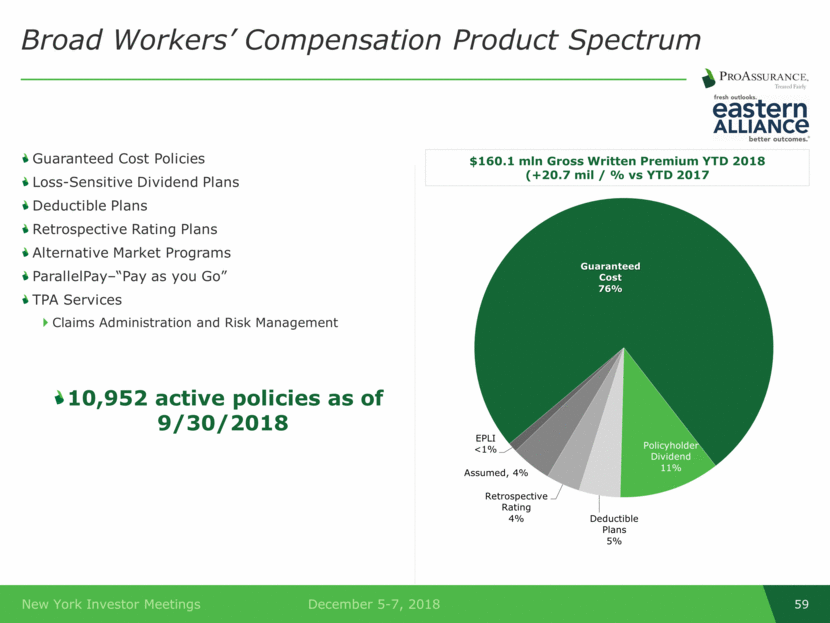
Guaranteed Cost Policies Loss-Sensitive Dividend Plans Deductible Plans Retrospective Rating Plans Alternative Market Programs ParallelPay–“Pay as you Go” TPA Services Claims Administration and Risk Management 10,952 active policies as of 9/30/2018 Broad Workers’ Compensation Product Spectrum $160.1 mln Gross Written Premium YTD 2018 (+20.7 mil / % vs YTD 2017 Guaranteed Cost 76% Policyholder Dividend 11% Deductible Plans 5% Retrospective Rating 4% Assumed , 4% EPLI <1 %
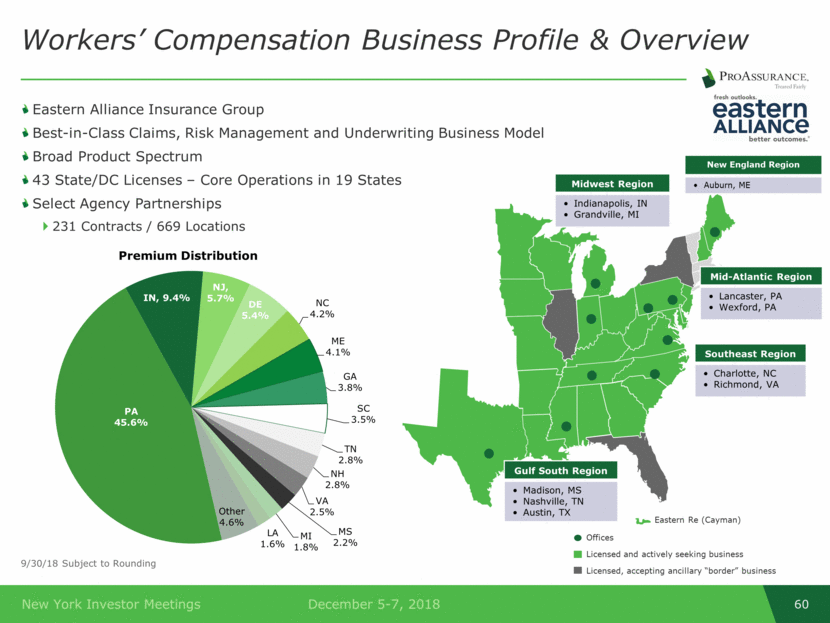
Eastern Alliance Insurance Group Best-in-Class Claims, Risk Management and Underwriting Business Model Broad Product Spectrum 43 State/DC Licenses – Core Operations in 19 States Select Agency Partnerships 231 Contracts / 669 Locations Workers’ Compensation Business Profile & Overview 9/30/18 Subject to Rounding Southeast Region Charlotte, NC Richmond, VA Gulf South Region Madison, MS Nashville, TN Austin, TX Midwest Region Indianapolis, IN Grandville, MI Mid-Atlantic Region Lancaster, PA Wexford, PA Offices Licensed and actively seeking business Licensed, accepting ancillary “border” business Eastern Re (Cayman) New England Region Auburn, ME PA 45.6% IN , 9.4% NJ , 5.7% DE 5.4% NC 4.2% ME 4.1% GA 3.8% SC 3.5% TN 2.8% NH 2.8% VA 2.5% MS 2.2% MI 1.8% LA 1.6% Other 4.6% Premium Distribution
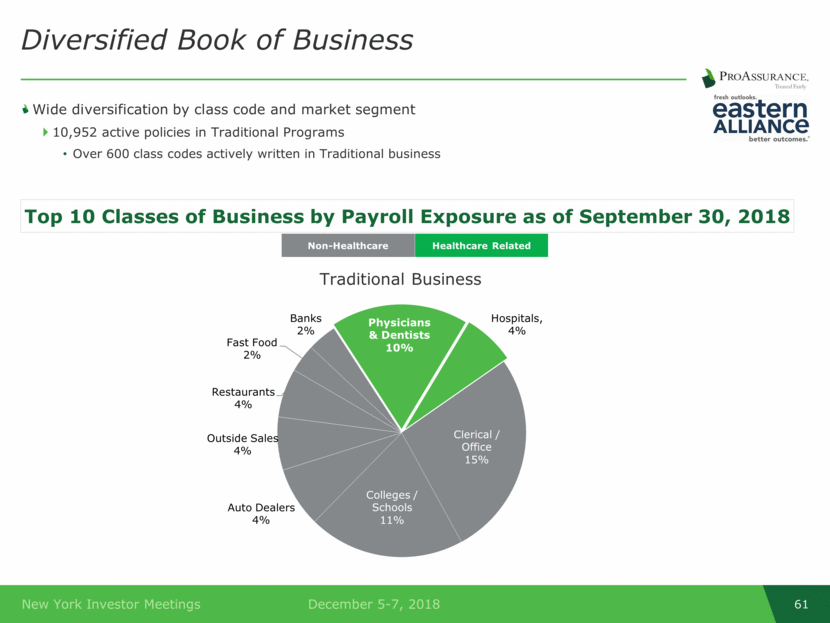
Wide diversification by class code and market segment 10,952 active policies in Traditional Programs Over 600 class codes actively written in Traditional business Diversified Book of Business Top 10 Classes of Business by Payroll Exposure as of September 30, 2018 Healthcare Related Non-Healthcare Physicians & Dentists 10% Hospitals , 4% Clerical / Office 15% Colleges / Schools 11% Auto Dealers 4% Outside Sales 4% Restaurants 4% Fast Food 2% Banks 2% Traditional Business
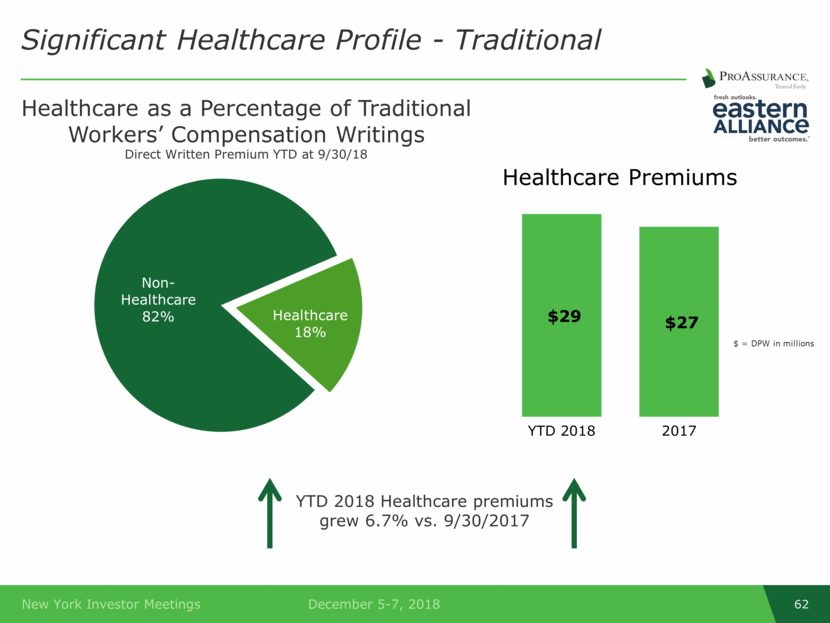
Healthcare as a Percentage of Traditional Workers’ Compensation Writings Direct Written Premium YTD at 9/30/18 Significant Healthcare Profile - Traditional YTD 2018 Healthcare premiums grew 6.7% vs. 9/30/2017 $ = DPW in millions Non - Healthcare 82% Healthcare 18% $29 $27 YTD 2018 2017 Healthcare Premiums
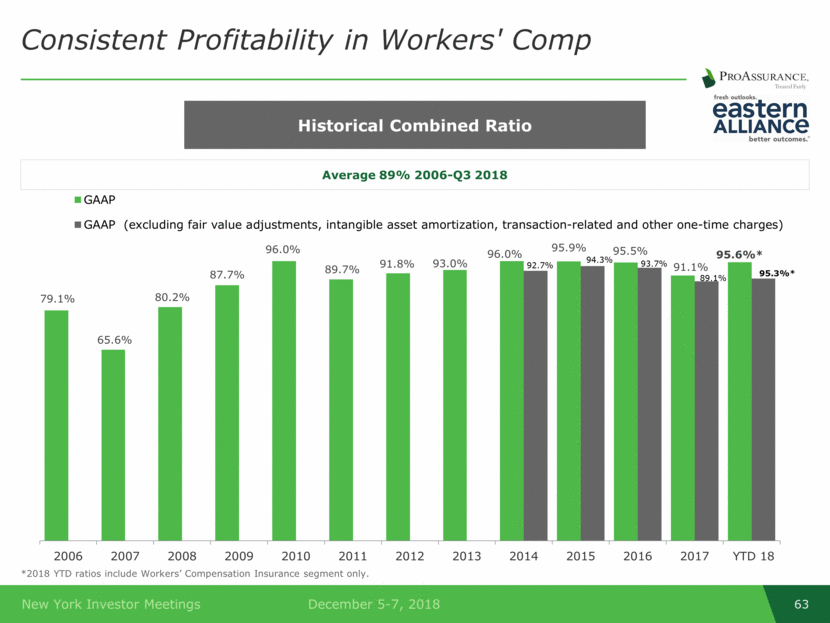
Consistent Profitability in Workers' Comp Historical Combined Ratio Average 89% 2006-Q3 2018 *2018 YTD ratios include Workers’ Compensation Insurance segment only. 79.1% 65.6% 80.2% 87.7% 96.0% 89.7% 91.8% 93.0% 96.0% 95.9% 95.5% 91.1% 95.6 %* 92.7% 94.3% 93.7% 89.1% 95.3%* 2006 2007 2008 2009 2010 2011 2012 2013 2014 2015 2016 2017 YTD 18 GAAP GAAP (excluding fair value adjustments, intangible asset amortization, transaction-related and other one-time charges)
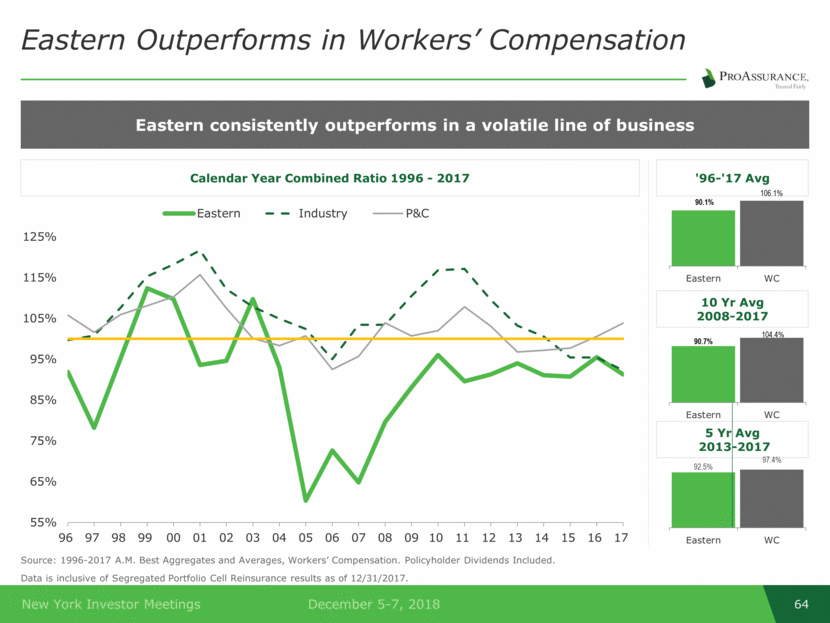
Source: 1996-2017 A.M. Best Aggregates and Averages, Workers’ Compensation. Policyholder Dividends Included. Data is inclusive of Segregated Portfolio Cell Reinsurance results as of 12/31/2017. Eastern Outperforms in Workers’ Compensation Eastern consistently outperforms in a volatile line of business Calendar Year Combined Ratio 1996 - 2017 '96-'17 Avg 10 Yr Avg 2008-2017 5 Yr Avg 2013-2017 55% 65% 75% 85% 95% 105% 115% 125% 96 97 98 99 00 01 02 03 04 05 06 07 08 09 10 11 12 13 14 15 16 17 Eastern Industry P&C 90.1% 106.1% Eastern WC 92.5% 97.4% Eastern WC 90.7% 104.4% Eastern WC
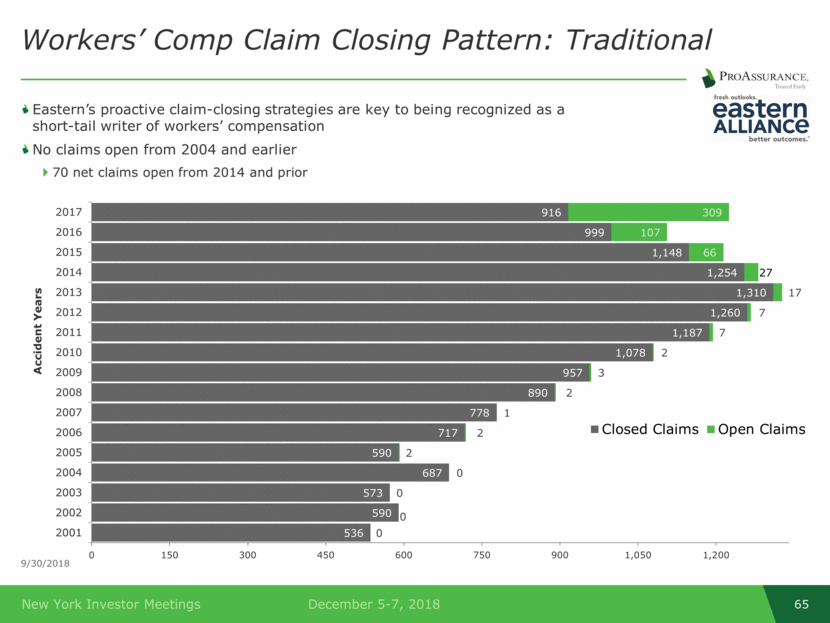
Eastern’s proactive claim-closing strategies are key to being recognized as a short-tail writer of workers’ compensation No claims open from 2004 and earlier 70 net claims open from 2014 and prior Workers’ Comp Claim Closing Pattern: Traditional 9/30/2018 536 590 573 687 590 717 778 890 957 1,078 1,187 1,260 1,310 1,254 1,148 999 916 0 0 0 0 2 2 1 2 3 2 7 7 17 27 66 107 309 0 150 300 450 600 750 900 1,050 1,200 2001 2002 2003 2004 2005 2006 2007 2008 2009 2010 2011 2012 2013 2014 2015 2016 2017 Accident Years Closed Claims Open Claims
Segment Strategic Review Workers’ Compensation, November 2018

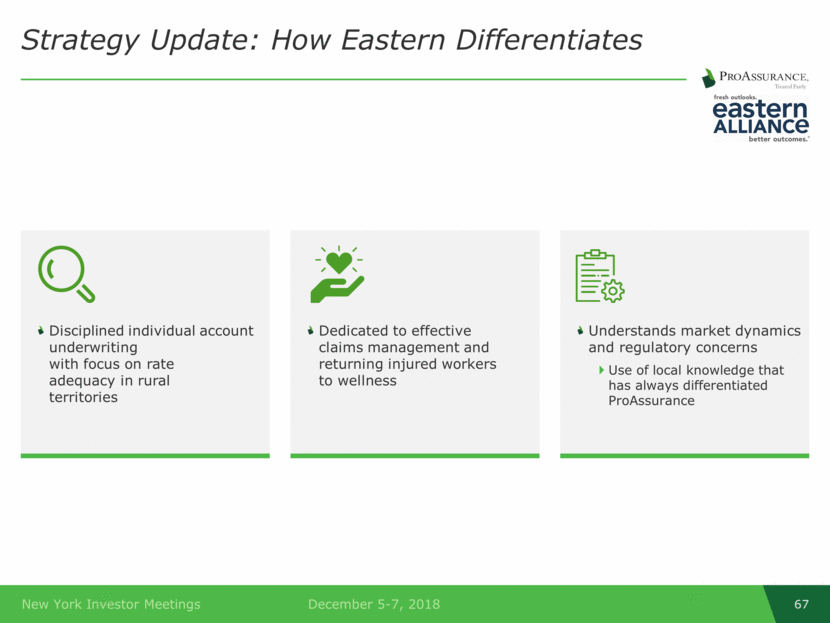
Strategy Update: How Eastern Differentiates Understands market dynamics and regulatory concerns Use of local knowledge that has always differentiated ProAssurance Disciplined individual account underwriting with focus on rate adequacy in rural territories Dedicated to effective claims management and returning injured workers to wellness
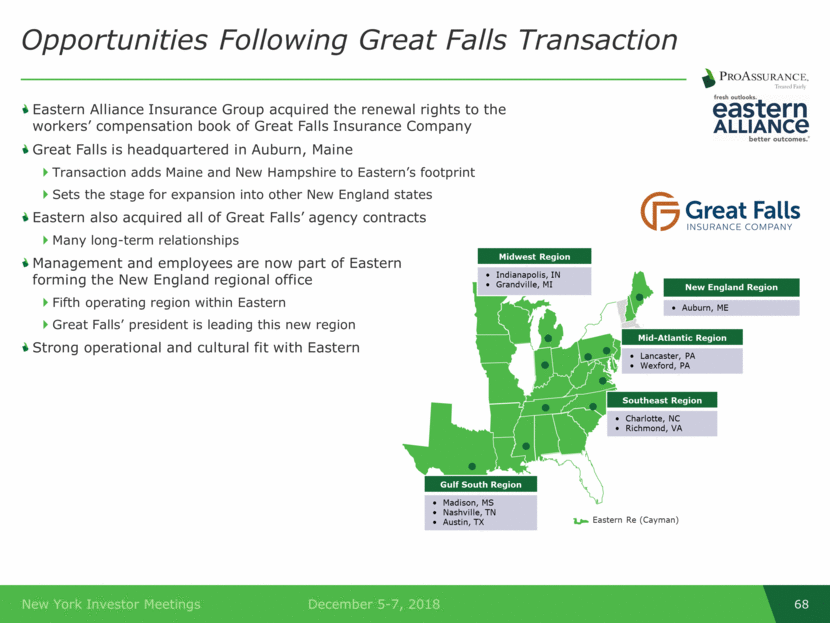
Opportunities Following Great Falls Transaction Eastern Alliance Insurance Group acquired the renewal rights to the workers’ compensation book of Great Falls Insurance Company Great Falls is headquartered in Auburn, Maine Transaction adds Maine and New Hampshire to Eastern’s footprint Sets the stage for expansion into other New England states Eastern also acquired all of Great Falls’ agency contracts Many long-term relationships Management and employees are now part of Eastern forming the New England regional office Fifth operating region within Eastern Great Falls’ president is leading this new region Strong operational and cultural fit with Eastern Southeast Region Charlotte, NC Richmond, VA Gulf South Region Madison, MS Nashville, TN Austin, TX New England Region Auburn, ME Mid-Atlantic Region Lancaster, PA Wexford, PA Eastern Re (Cayman) Midwest Region Indianapolis, IN Grandville, MI
Eastern Specialty Risk: Higher Risk But NOT High Risk Business Overview Focusing on the next level of risk: higher hazard but not typical “high hazard” Some classes previous written by Eastern in High Modification programs $5.2 million in direct premiums in 2017—includes $4.6 million of new business Loss trends are favorable Initial submission quantity and quality are solid, largely construction-related and regional transportation risks Business profile aligns with expected growth in payroll/premium in the US, especially in infrastructure-focused industries Broad acceptance from existing agents that have deep relationships with Eastern Many have one or two accounts with competitors and look to move those to Eastern with this option Expected Loss Profile Loss are expected to be less frequent, but more severe, although mitigated by an excellent reinsurance structure Full support of reinsurance partners Retentions remain the same as in existing business Deepens the reinsurance relationship by providing additional rate for new exposures Loss profile means higher premiums and greater margins Eastern will apply its innovative claims and risk management strategies to shorten the tail, reduce the incidence and severity of claims and enhance workplace safety
Segment Highlights Segregated Portfolio Cell Reinsurance, November 2018

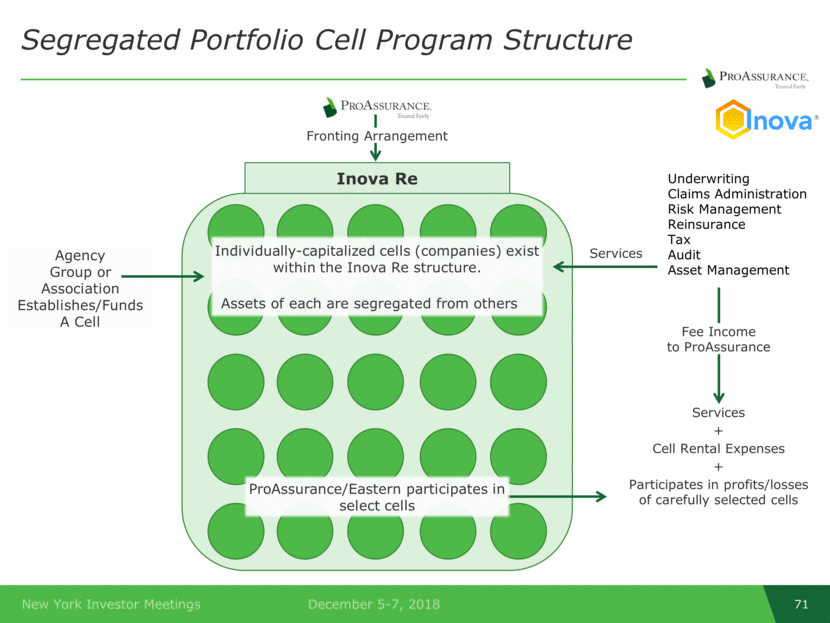
Segregated Portfolio Cell Program Structure Inova Re Underwriting Claims Administration Risk Management Reinsurance Tax Audit Asset Management Services + Cell Rental Expenses + Participates in profits/losses of carefully selected cells Fee Income to ProAssurance ProAssurance/Eastern participates in select cells Individually-capitalized cells (companies) exist within the Inova Re structure. Assets of each are segregated from others Agency Group or Association Establishes/Funds A Cell Services Fronting Arrangement
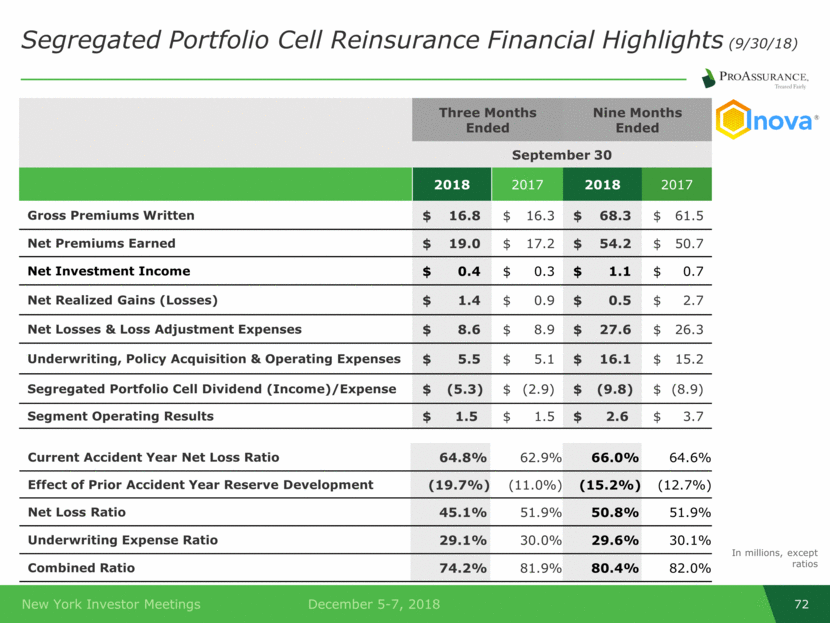
Segregated Portfolio Cell Reinsurance Financial Highlights (9/30/18) Three Months Ended Nine Months Ended September 30 2018 2017 2018 2017 Gross Premiums Written $ 16.8 $ 16.3 $ 68.3 $ 61.5 Net Premiums Earned $ 19.0 $ 17.2 $ 54.2 $ 50.7 Net Investment Income $ 0.4 $ 0.3 $ 1.1 $ 0.7 Net Realized Gains (Losses) $ 1.4 $ 0.9 $ 0.5 $ 2.7 Net Losses & Loss Adjustment Expenses $ 8.6 $ 8.9 $ 27.6 $ 26.3 Underwriting, Policy Acquisition & Operating Expenses $ 5.5 $ 5.1 $ 16.1 $ 15.2 Segregated Portfolio Cell Dividend (Income)/Expense $ (5.3) $ (2.9) $ (9.8) $ (8.9) Segment Operating Results $ 1.5 $ 1.5 $ 2.6 $ 3.7 In millions, except ratios Current Accident Year Net Loss Ratio 64.8% 62.9% 66.0% 64.6% Effect of Prior Accident Year Reserve Development (19.7%) (11.0%) (15.2%) (12.7%) Net Loss Ratio 45.1% 51.9% 50.8% 51.9% Underwriting Expense Ratio 29.1% 30.0% 29.6% 30.1% Combined Ratio 74.2% 81.9% 80.4% 82.0%
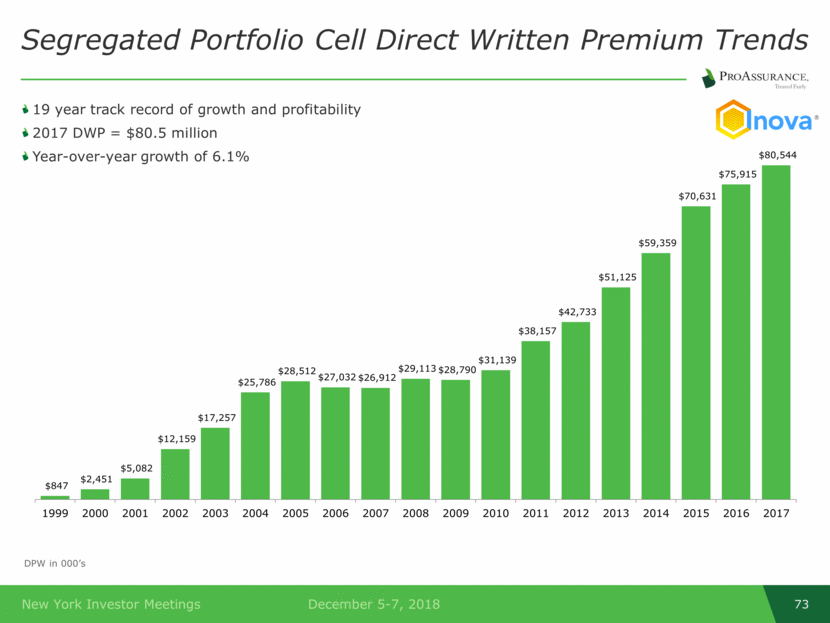
Segregated Portfolio Cell Direct Written Premium Trends DPW in 000’s 19 year track record of growth and profitability 2017 DWP = $80.5 million Year-over-year growth of 6.1%
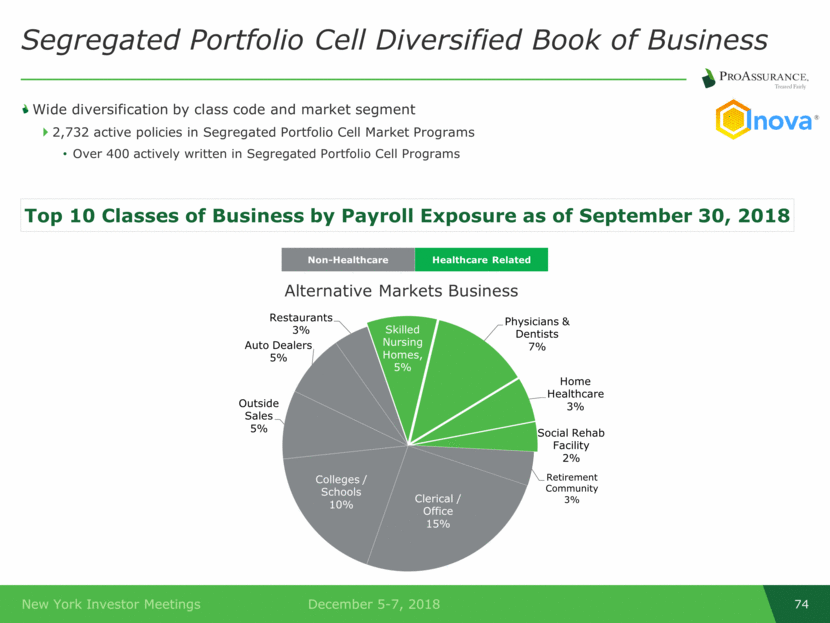
Wide diversification by class code and market segment 2,732 active policies in Segregated Portfolio Cell Market Programs Over 400 actively written in Segregated Portfolio Cell Programs Segregated Portfolio Cell Diversified Book of Business Top 10 Classes of Business by Payroll Exposure as of September 30, 2018 Healthcare Related Non-Healthcare Skilled Nursing Homes , 5% Physicians & Dentists 7% Home Healthcare 3% Social Rehab Facility 2% Retirement Community 3% Clerical / Office 15% Colleges / Schools 10% Outside Sales 5% Auto Dealers 5% Restaurants 3% Alternative Markets Business
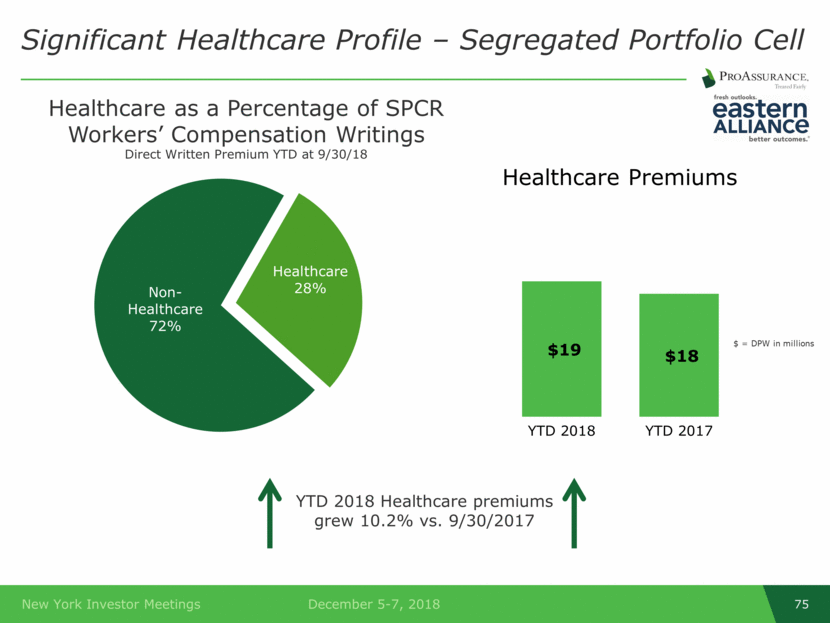
Healthcare as a Percentage of SPCR Workers’ Compensation Writings Direct Written Premium YTD at 9/30/18 Significant Healthcare Profile – Segregated Portfolio Cell YTD 2018 Healthcare premiums grew 10.2% vs. 9/30/2017 $ = DPW in millions Non - Healthcare 72% Healthcare 28% $19 $18 YTD 2018 YTD 2017 Healthcare Premiums
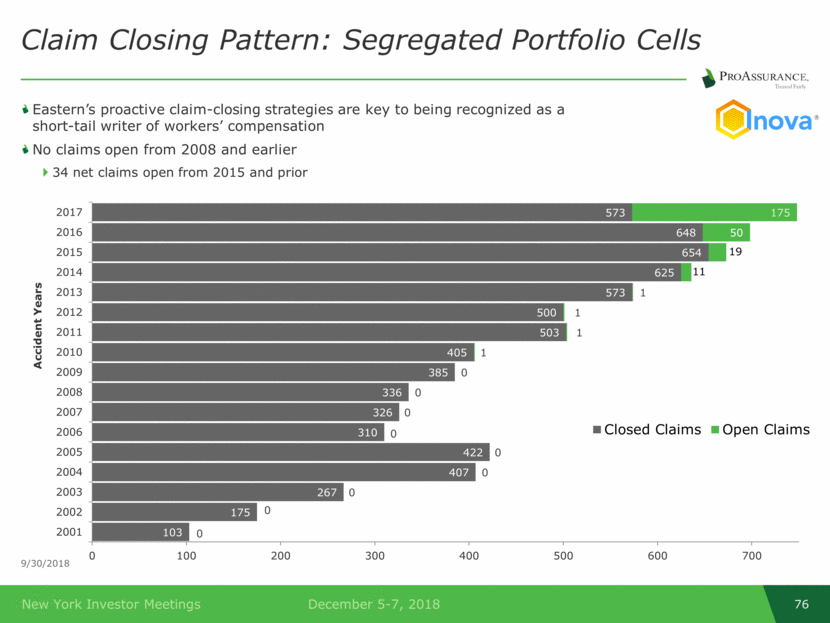
Claim Closing Pattern: Segregated Portfolio Cells 9/30/2018 Eastern’s proactive claim-closing strategies are key to being recognized as a short-tail writer of workers’ compensation No claims open from 2008 and earlier 34 net claims open from 2015 and prior 103 175 267 407 422 310 326 336 385 405 503 500 573 625 654 648 573 0 0 0 0 0 0 0 0 0 1 1 1 1 11 19 50 175 0 100 200 300 400 500 600 700 2001 2002 2003 2004 2005 2006 2007 2008 2009 2010 2011 2012 2013 2014 2015 2016 2017 Accident Years Closed Claims Open Claims
Segment Strategic Review Segregated Portfolio Cell Reinsurance, November 2018

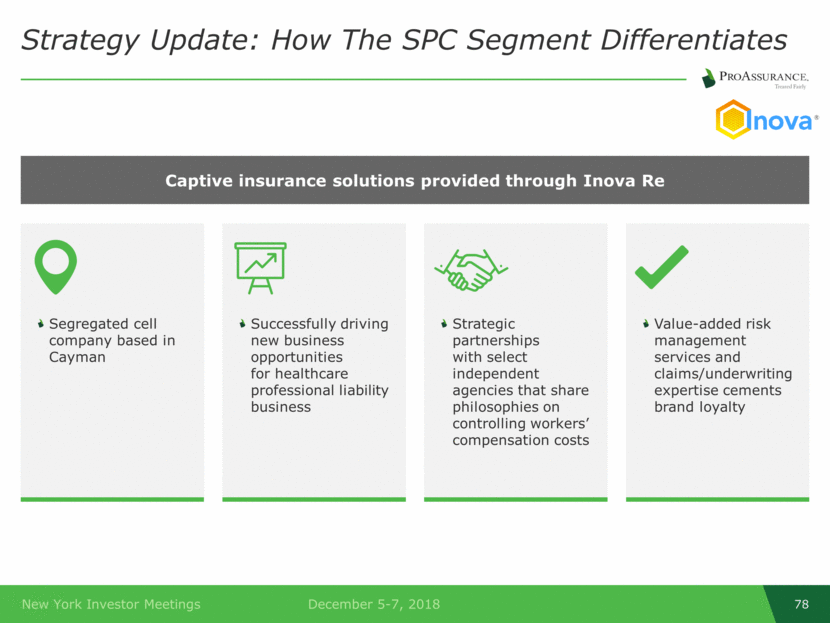
Strategy Update: How The SPC Segment Differentiates Captive insurance solutions provided through Inova Re Value-added risk management services and claims/underwriting expertise cements brand loyalty Strategic partnerships with select independent agencies that share philosophies on controlling workers’ compensation costs Segregated cell company based in Cayman Successfully driving new business opportunities for healthcare professional liability business
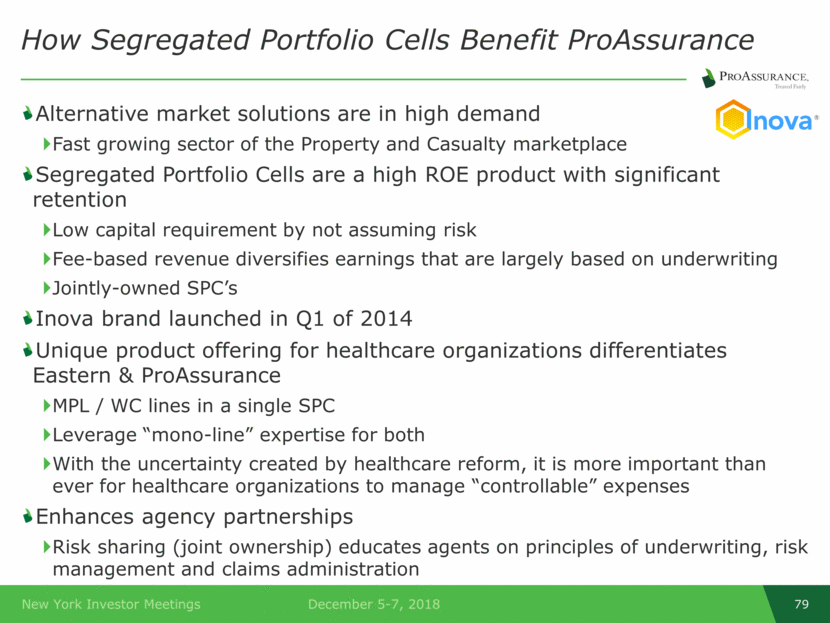
How Segregated Portfolio Cells Benefit ProAssurance Alternative market solutions are in high demand Fast growing sector of the Property and Casualty marketplace Segregated Portfolio Cells are a high ROE product with significant retention Low capital requirement by not assuming risk Fee-based revenue diversifies earnings that are largely based on underwriting Jointly-owned SPC’s Inova brand launched in Q1 of 2014 Unique product offering for healthcare organizations differentiates Eastern & ProAssurance MPL / WC lines in a single SPC Leverage “mono-line” expertise for both With the uncertainty created by healthcare reform, it is more important than ever for healthcare organizations to manage “controllable” expenses Enhances agency partnerships Risk sharing (joint ownership) educates agents on principles of underwriting, risk management and claims administration
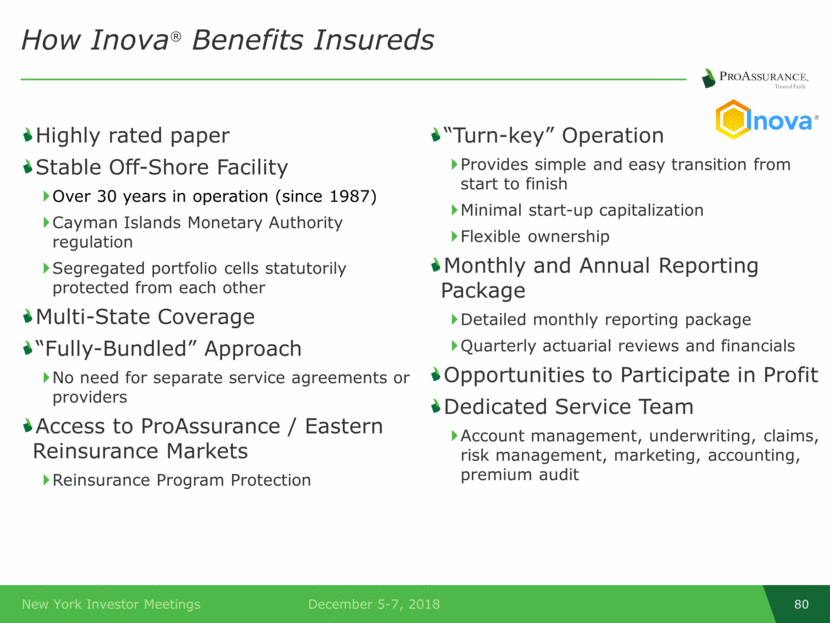
How Inova® Benefits Insureds Highly rated paper Stable Off-Shore Facility Over 30 years in operation (since 1987) Cayman Islands Monetary Authority regulation Segregated portfolio cells statutorily protected from each other Multi-State Coverage “Fully-Bundled” Approach No need for separate service agreements or providers Access to ProAssurance / Eastern Reinsurance Markets Reinsurance Program Protection “Turn-key” Operation Provides simple and easy transition from start to finish Minimal start-up capitalization Flexible ownership Monthly and Annual Reporting Package Detailed monthly reporting package Quarterly actuarial reviews and financials Opportunities to Participate in Profit Dedicated Service Team Account management, underwriting, claims, risk management, marketing, accounting, premium audit
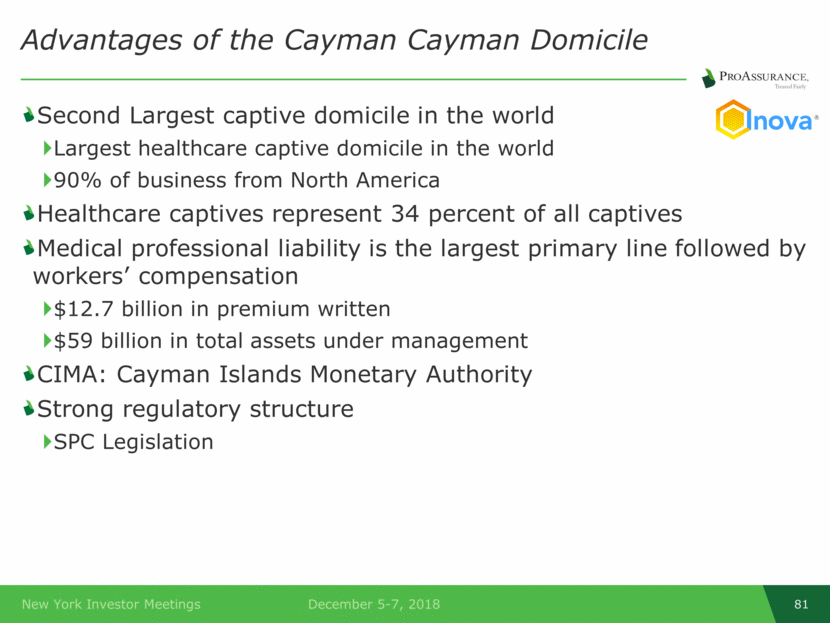
Advantages of the Cayman Cayman Domicile Second Largest captive domicile in the world Largest healthcare captive domicile in the world 90% of business from North America Healthcare captives represent 34 percent of all captives Medical professional liability is the largest primary line followed by workers’ compensation $12.7 billion in premium written $59 billion in total assets under management CIMA: Cayman Islands Monetary Authority Strong regulatory structure SPC Legislation
Segment Highlights Lloyds, November 2018

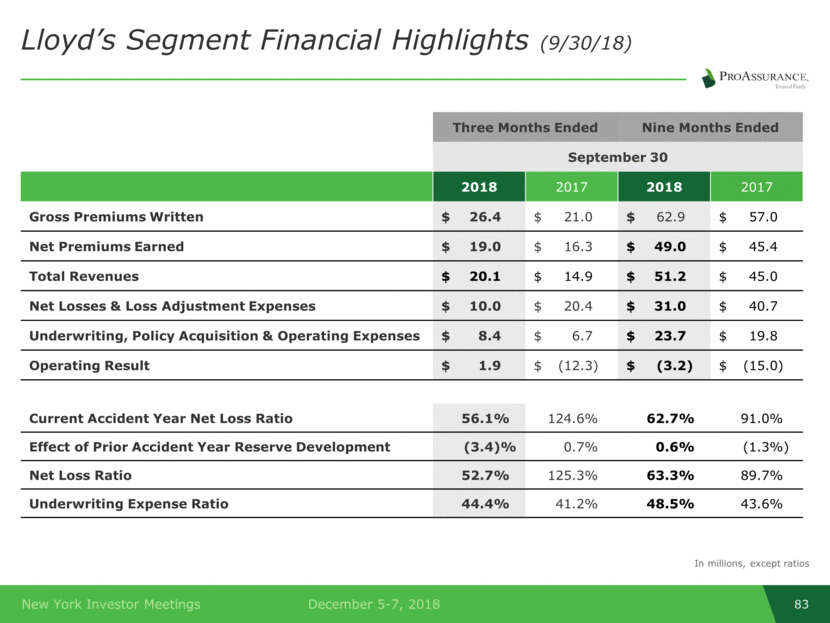
Lloyd’s Segment Financial Highlights (9/30/18) Three Months Ended Nine Months Ended September 30 2018 2017 2018 2017 Gross Premiums Written $ 26.4 $ 21.0 $ 62.9 $ 57.0 Net Premiums Earned $ 19.0 $ 16.3 $ 49.0 $ 45.4 Total Revenues $ 20.1 $ 14.9 $ 51.2 $ 45.0 Net Losses & Loss Adjustment Expenses $ 10.0 $ 20.4 $ 31.0 $ 40.7 Underwriting, Policy Acquisition & Operating Expenses $ 8.4 $ 6.7 $ 23.7 $ 19.8 Operating Result $ 1.9 $ (12.3) $ (3.2) $ (15.0) Current Accident Year Net Loss Ratio 56.1% 124.6% 62.7% 91.0% Effect of Prior Accident Year Reserve Development (3.4)% 0.7% 0.6% (1.3%) Net Loss Ratio 52.7% 125.3% 63.3% 89.7% Underwriting Expense Ratio 44.4% 41.2% 48.5% 43.6% In millions, except ratios
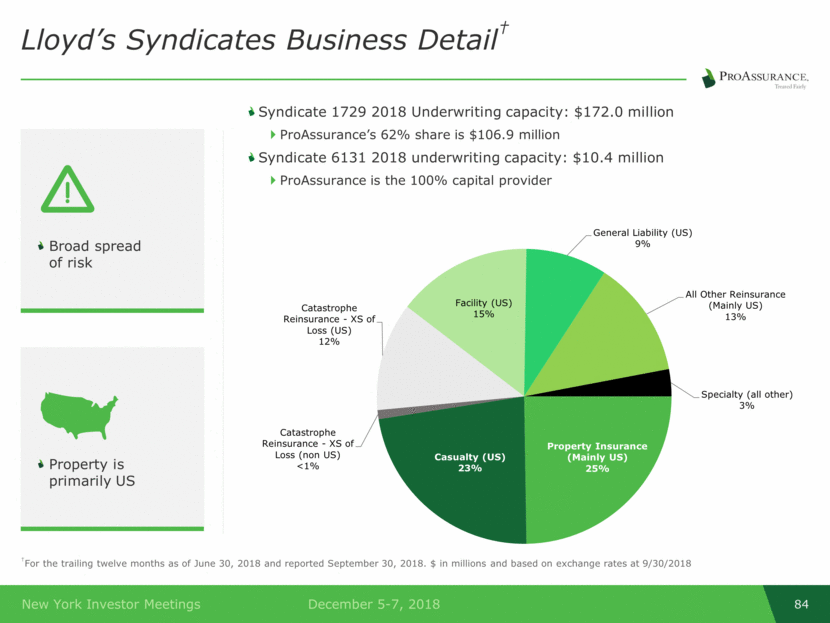
Syndicate 1729 2018 Underwriting capacity: $172.0 million ProAssurance’s 62% share is $106.9 million Syndicate 6131 2018 underwriting capacity: $10.4 million ProAssurance is the 100% capital provider Lloyd’s Syndicates Business Detail† †For the trailing twelve months as of June 30, 2018 and reported September 30, 2018. $ in millions and based on exchange rates at 9/30/2018 Broad spread of risk Property is primarily US Property Insurance (Mainly US) 25% Casualty (US) 23% Catastrophe Reinsurance - XS of Loss (non US) <1% Catastrophe Reinsurance - XS of Loss (US) 12% Facility (US) 15% General Liability (US) 9% All Other Reinsurance (Mainly US) 13% Specialty (all other) 3%
Segment Highlights & Strategic Review Lloyd’s, November 2018

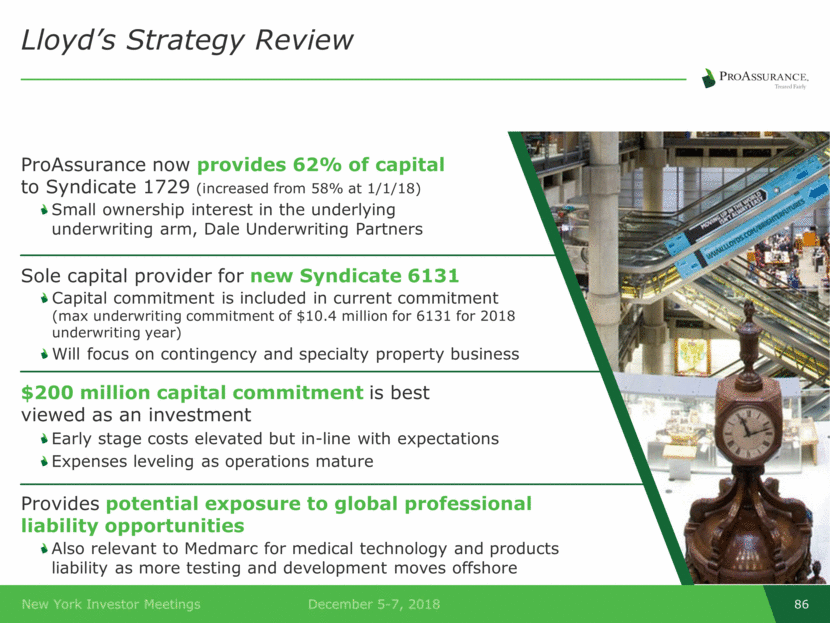
Lloyd’s Strategy Review ProAssurance now provides 62% of capital to Syndicate 1729 (increased from 58% at 1/1/18) Small ownership interest in the underlying underwriting arm, Dale Underwriting Partners $200 million capital commitment is best viewed as an investment Early stage costs elevated but in-line with expectations Expenses leveling as operations mature Provides potential exposure to global professional liability opportunities Also relevant to Medmarc for medical technology and products liability as more testing and development moves offshore Sole capital provider for new Syndicate 6131 Capital commitment is included in current commitment (max underwriting commitment of $10.4 million for 6131 for 2018 underwriting year) Will focus on contingency and specialty property business
Key Lloyd’s Opportunities Special Purpose Arrangement (SPA) within Syndicate 1729 began writing business in 2018 Syndicate 6131 Four experienced underwriters with established books of business prior to joining Planned premium is $22 million Business focus is contingency & specialty property Continuing success in international healthcare professional liability from the highly-experienced underwriting team that joined Syndicate 1729 in March 2016 Extensive experience in Canada, Australia, South America & Middle East

Syndicate 1729 Outlook for 2018 Little change in overall results expected for the next reported quarter Little or no exposure to Brexit and related issues Few UK risks written Improving market conditions Growth in a more profitable market More catastrophe risk, gross & net Addressed through additional reinsurance Remaining disciplined and focused on core products Trimming away lower margin business Maintaining vigilance on expenses
Investment Strategy and Detailed Holdings

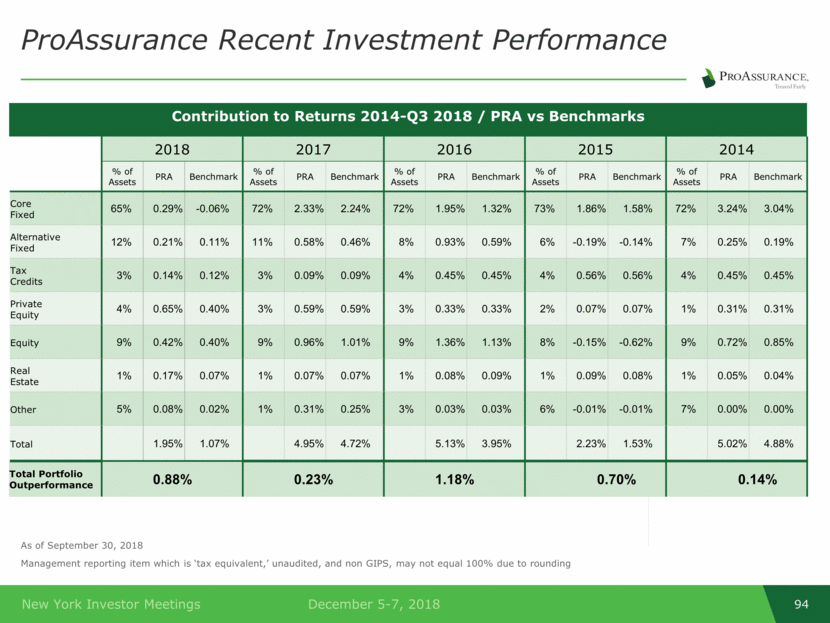
Proactively managing allocations for better risk-adjusted returns Investment Strategy and 2019 Outlook Duration management remains paramount We will not extend duration in search of incremental yield Optimizing our allocation Ensures non-correlation of returns Effective stewardship of capital ensures a position of financial strength through turbulent market cycles Ongoing analysis of holdings to ensure lasting quality and profitability Portfolio outperformance of 0.88% YTD 2018
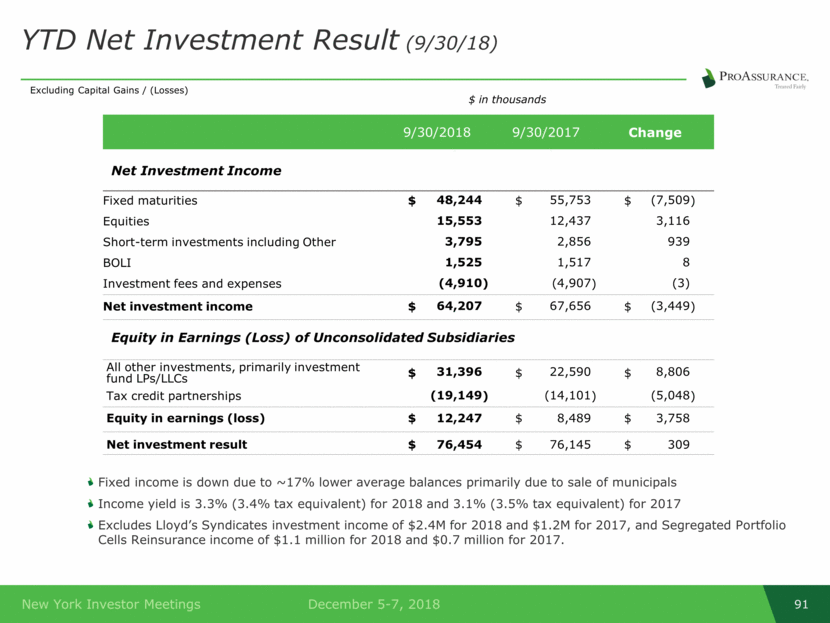
YTD Net Investment Result (9/30/18) 9/30/2018 9/30/2017 Change Net Investment Income Fixed maturities $ 48,244 $ 55,753 $ (7,509 ) Equities 15,553 12,437 3,116 Short-term investments including Other 3,795 2,856 939 BOLI 1,525 1,517 8 Investment fees and expenses (4,910 ) (4,907 ) (3) Net investment income $ 64,207 $ 67,656 $ (3,449 ) Equity in Earnings (Loss) of Unconsolidated Subsidiaries All other investments, primarily investment fund LPs/LLCs $ 31,396 $ 22,590 $ 8,806 Tax credit partnerships (19,149 ) (14,101 ) (5,048 ) Equity in earnings (loss) $ 12,247 $ 8,489 $ 3,758 Net investment result $ 76,454 $ 76,145 $ 309 $ in thousands Fixed income is down due to ~17% lower average balances primarily due to sale of municipals Income yield is 3.3% (3.4% tax equivalent) for 2018 and 3.1% (3.5% tax equivalent) for 2017 Excludes Lloyd’s Syndicates investment income of $2.4M for 2018 and $1.2M for 2017, and Segregated Portfolio Cells Reinsurance income of $1.1 million for 2018 and $0.7 million for 2017. Excluding Capital Gains / (Losses)
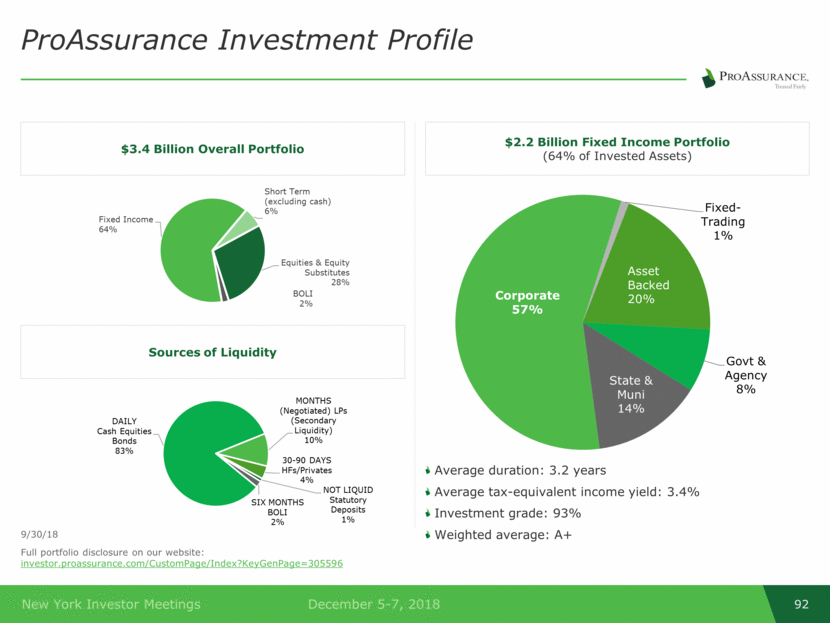
9/30/18 Full portfolio disclosure on our website: investor.proassurance.com/CustomPage/Index?KeyGenPage=305596 ProAssurance Investment Profile $2.2 Billion Fixed Income Portfolio (64% of Invested Assets) $3.4 Billion Overall Portfolio Sources of Liquidity Average duration: 3.2 years Average tax-equivalent income yield: 3.4% Investment grade: 93% Weighted average: A+ State & Muni 14% Corporate 57% Fixed - Trading 1% Asset Backed 20% Govt & Agency 8% Short Term (excluding cash) 6% Equities & Equity Substitutes 28% BOLI 2% Fixed Income 64% MONTHS (Negotiated) LPs (Secondary Liquidity) 10% 30 - 90 DAYS HFs/Privates 4% NOT LIQUID Statutory Deposits 1% SIX MONTHS BOLI 2% DAILY Cash Equities Bonds 83%
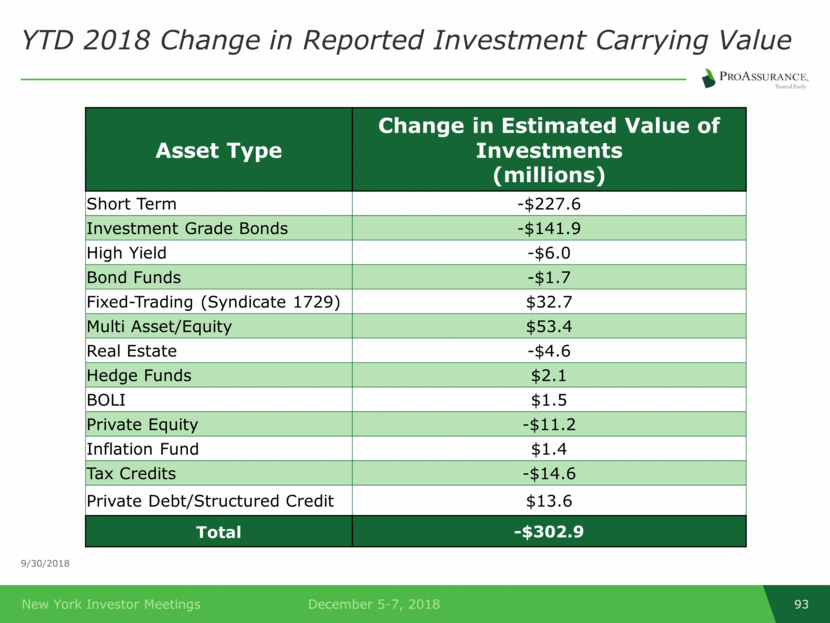
9/30/2018 YTD 2018 Change in Reported Investment Carrying Value Asset Type Change in Estimated Value of Investments (millions) Short Term -$227.6 Investment Grade Bonds -$141.9 High Yield -$6.0 Bond Funds -$1.7 Fixed-Trading (Syndicate 1729) $32.7 Multi Asset/Equity $53.4 Real Estate -$4.6 Hedge Funds $2.1 BOLI $1.5 Private Equity -$11.2 Inflation Fund $1.4 Tax Credits -$14.6 Private Debt/Structured Credit $13.6 Total -$302.9
ProAssurance Recent Investment Performance As of September 30, 2018 Management reporting item which is ‘tax equivalent,’ unaudited, and non GIPS, may not equal 100% due to rounding Contribution to Returns 2014-Q3 2018 / PRA vs Benchmarks 2018 2017 2016 2015 2014 % of Assets PRA Benchmark % of Assets PRA Benchmark % of Assets PRA Benchmark % of Assets PRA Benchmark % of Assets PRA Benchmark Core Fixed 65% 0.29% -0.06% 72% 2.33% 2.24% 72% 1.95% 1.32% 73% 1.86% 1.58% 72% 3.24% 3.04% Alternative Fixed 12% 0.21% 0.11% 11% 0.58% 0.46% 8% 0.93% 0.59% 6% -0.19% -0.14% 7% 0.25% 0.19% Tax Credits 3% 0.14% 0.12% 3% 0.09% 0.09% 4% 0.45% 0.45% 4% 0.56% 0.56% 4% 0.45% 0.45% Private Equity 4% 0.65% 0.40% 3% 0.59% 0.59% 3% 0.33% 0.33% 2% 0.07% 0.07% 1% 0.31% 0.31% Equity 9% 0.42% 0.40% 9% 0.96% 1.01% 9% 1.36% 1.13% 8% -0.15% -0.62% 9% 0.72% 0.85% Real Estate 1% 0.17% 0.07% 1% 0.07% 0.07% 1% 0.08% 0.09% 1% 0.09% 0.08% 1% 0.05% 0.04% Other 5% 0.08% 0.02% 1% 0.31% 0.25% 3% 0.03% 0.03% 6% -0.01% -0.01% 7% 0.00% 0.00% Total 1.95% 1.07% 4.95% 4.72% 5.13% 3.95% 2.23% 1.53% 5.02% 4.88% Total Portfolio Outperformance 0.88% 0.23% 1.18% 0.70% 0.14%
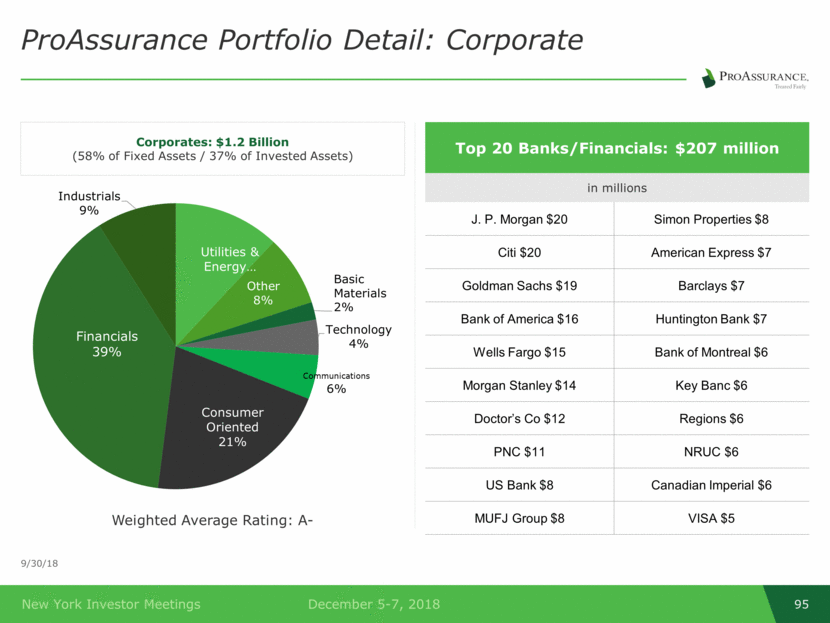
ProAssurance Portfolio Detail: Corporate Corporates: $1.2 Billion (58% of Fixed Assets / 37% of Invested Assets) Top 20 Banks/Financials: $207 million in millions J. P. Morgan $20 Simon Properties $8 Citi $20 American Express $7 Goldman Sachs $19 Barclays $7 Bank of America $16 Huntington Bank $7 Wells Fargo $15 Bank of Montreal $6 Morgan Stanley $14 Key Banc $6 Doctor’s Co $12 Regions $6 PNC $11 NRUC $6 US Bank $8 Canadian Imperial $6 MUFJ Group $8 VISA $5 Weighted Average Rating: A- 9/30/18 Utilities & Energy Other 8% Basic Materials 2% Technology 4% Communications 6% Consumer Oriented 21% Financials 39% Industrials 9%
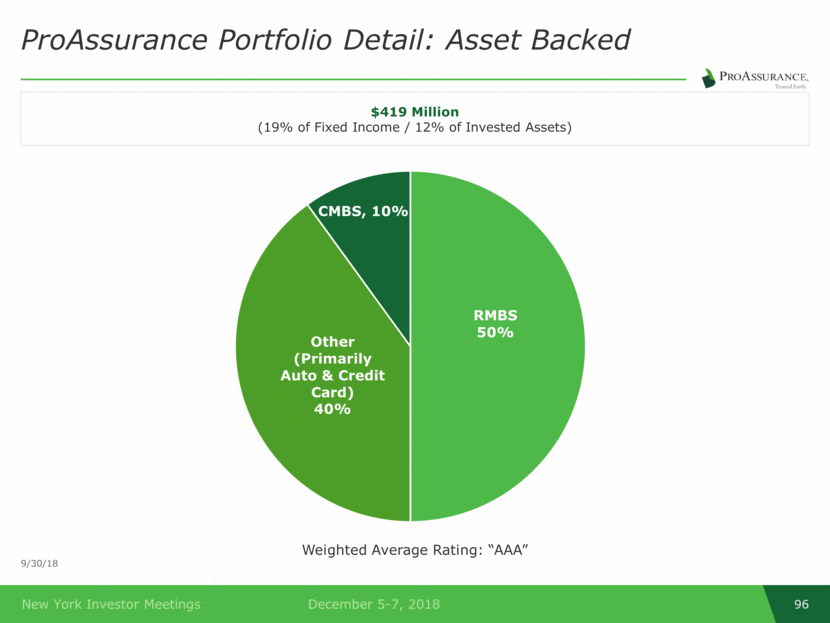
9/30/18 ProAssurance Portfolio Detail: Asset Backed Weighted Average Rating: “AAA” $419 Million (19% of Fixed Income / 12% of Invested Assets) RMBS 50% Other (Primarily Auto & Credit Card) 40% CMBS , 10%
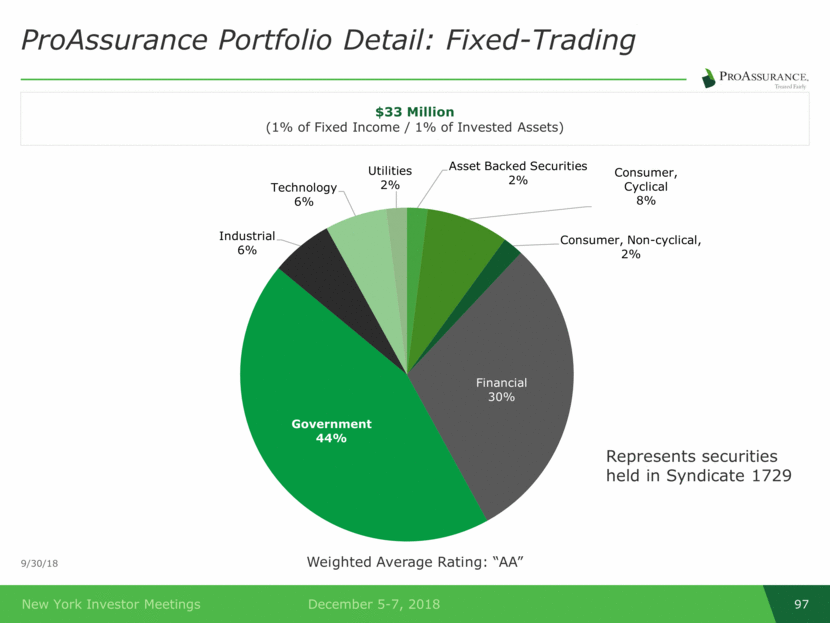
9/30/18 ProAssurance Portfolio Detail: Fixed-Trading Weighted Average Rating: “AA” $33 Million (1% of Fixed Income / 1% of Invested Assets) Represents securities held in Syndicate 1729 Asset Backed Securities 2% Consumer, Cyclical 8% Consumer, Non - cyclical , 2% Financial 30% Government 44% Industrial 6% Technology 6% Utilities 2%
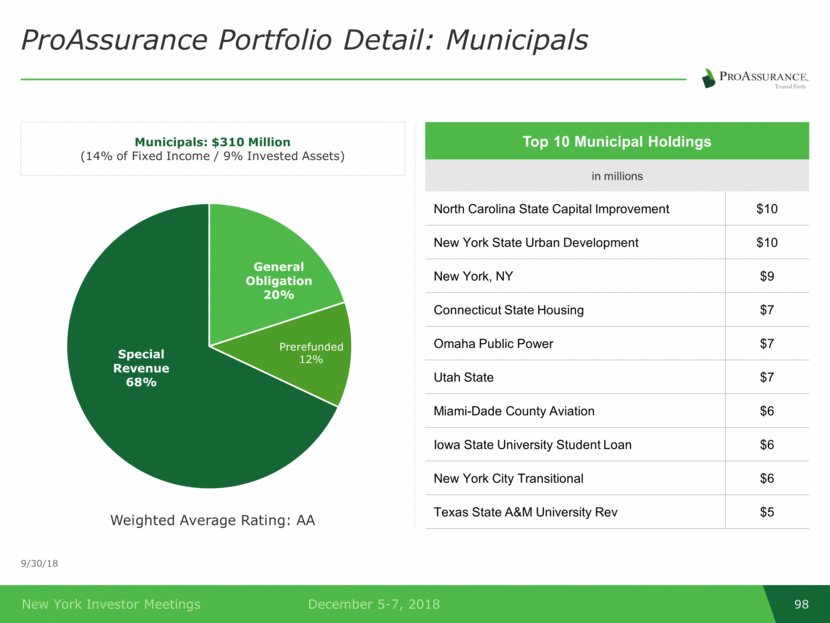
9/30/18 ProAssurance Portfolio Detail: Municipals Municipals: $310 Million (14% of Fixed Income / 9% Invested Assets) Weighted Average Rating: AA Top 10 Municipal Holdings in millions North Carolina State Capital Improvement $10 New York State Urban Development $10 New York, NY $9 Connecticut State Housing $7 Omaha Public Power $7 Utah State $7 Miami-Dade County Aviation $6 Iowa State University Student Loan $6 New York City Transitional $6 Texas State A&M University Rev $5 General Obligation 20% Prerefunded 12% Special Revenue 68%
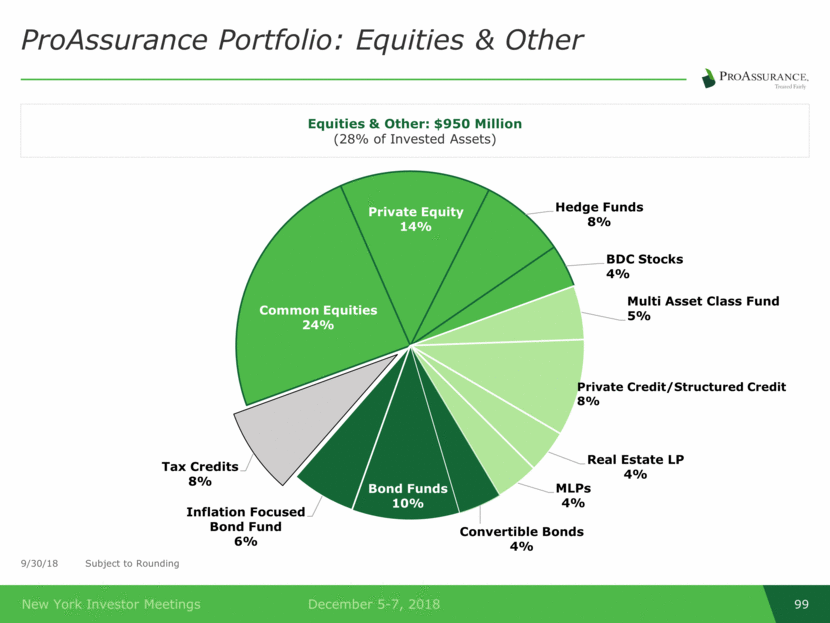
9/30/18 Subject to Rounding ProAssurance Portfolio: Equities & Other Equities & Other: $950 Million (28% of Invested Assets) Common Equities 24% Private Equity 14% Hedge Funds 8% BDC Stocks 4% Multi Asset Class Fund 5% Private Credit/Structured Credit 8% Real Estate LP 4% MLPs 4% Convertible Bonds 4% Bond Funds 10% Inflation Focused Bond Fund 6% Tax Credits 8%
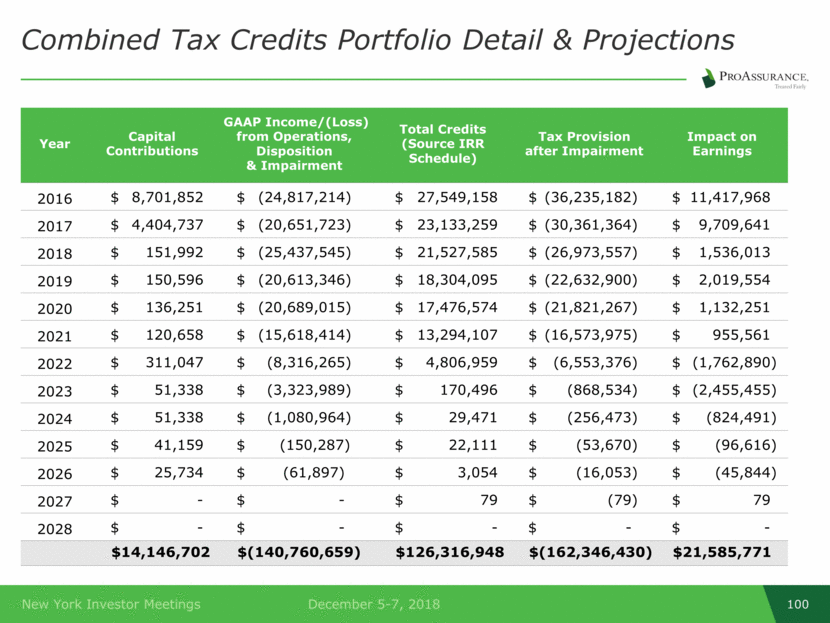
Combined Tax Credits Portfolio Detail & Projections Year Capital Contributions GAAP Income/(Loss) from Operations, Disposition & Impairment Total Credits (Source IRR Schedule) Tax Provision after Impairment Impact on Earnings 2016 $ 8,701,852 $ (24,817,214) $ 27,549,158 $ (36,235,182) $ 11,417,968 2017 $ 4,404,737 $ (20,651,723) $ 23,133,259 $ (30,361,364) $ 9,709,641 2018 $ 151,992 $ (25,437,545) $ 21,527,585 $ (26,973,557) $ 1,536,013 2019 $ 150,596 $ (20,613,346) $ 18,304,095 $ (22,632,900) $ 2,019,554 2020 $ 136,251 $ (20,689,015) $ 17,476,574 $ (21,821,267) $ 1,132,251 2021 $ 120,658 $ (15,618,414) $ 13,294,107 $ (16,573,975) $ 955,561 2022 $ 311,047 $ (8,316,265) $ 4,806,959 $ (6,553,376) $ (1,762,890) 2023 $ 51,338 $ (3,323,989) $ 170,496 $ (868,534) $ (2,455,455) 2024 $ 51,338 $ (1,080,964) $ 29,471 $ (256,473) $ (824,491) 2025 $ 41,159 $ (150,287) $ 22,111 $ (53,670) $ (96,616) 2026 $ 25,734 $ (61,897) $ 3,054 $ (16,053) $ (45,844) 2027 $ - $ - $ 79 $ (79) $ 79 2028 $ - $ - $ - $ - $ - $ 14,146,702 $ (140,760,659) $ 126,316,948 $ (162,346,430) $ 21,585,771
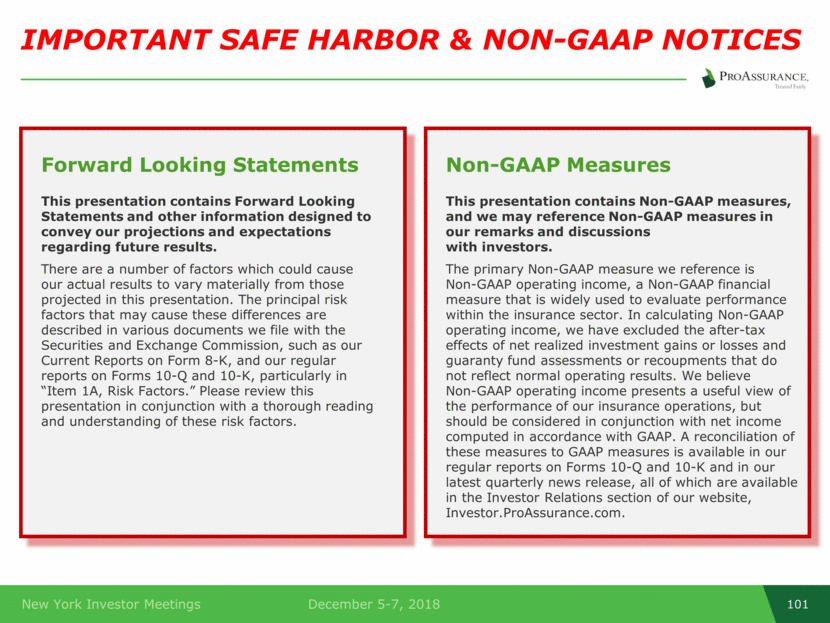
Forward Looking Statements Non-GAAP Measures This presentation contains Forward Looking Statements and other information designed to convey our projections and expectations regarding future results. There are a number of factors which could cause our actual results to vary materially from those projected in this presentation. The principal risk factors that may cause these differences are described in various documents we file with the Securities and Exchange Commission, such as our Current Reports on Form 8-K, and our regular reports on Forms 10-Q and 10-K, particularly in “Item 1A, Risk Factors.” Please review this presentation in conjunction with a thorough reading and understanding of these risk factors. This presentation contains Non-GAAP measures, and we may reference Non-GAAP measures in our remarks and discussions with investors. The primary Non-GAAP measure we reference is Non-GAAP operating income, a Non-GAAP financial measure that is widely used to evaluate performance within the insurance sector. In calculating Non-GAAP operating income, we have excluded the after-tax effects of net realized investment gains or losses and guaranty fund assessments or recoupments that do not reflect normal operating results. We believe Non-GAAP operating income presents a useful view of the performance of our insurance operations, but should be considered in conjunction with net income computed in accordance with GAAP. A reconciliation of these measures to GAAP measures is available in our regular reports on Forms 10-Q and 10-K and in our latest quarterly news release, all of which are available in the Investor Relations section of our website, Investor.ProAssurance.com. IMPORTANT SAFE HARBOR & NON-GAAP NOTICES