Attached files
| file | filename |
|---|---|
| EX-31.1 - EXHIBIT 31.1 - PROASSURANCE CORP | pra-ex311_20160630xq2.htm |
| EX-32.2 - EXHIBIT 32.2 - PROASSURANCE CORP | pra-ex322_20160630xq2.htm |
| EX-32.1 - EXHIBIT 32.1 - PROASSURANCE CORP | pra-ex321_20160630xq2.htm |
| EX-31.2 - EXHIBIT 31.2 - PROASSURANCE CORP | pra-ex312_20160630xq2.htm |
| EX-10.1 - EXHIBIT 10.1 - PROASSURANCE CORP | pra-ex101_20160630xq2.htm |
UNITED STATES
SECURITIES AND EXCHANGE COMMISSION
Washington, D.C. 20549
FORM 10-Q
(Mark One)
ý | Quarterly report pursuant to Section 13 or 15(d) of the Securities Exchange Act of 1934 |
For the quarterly period ended June 30, 2016 or
¨ | Transition report pursuant to Section 13 or 15(d) of the Securities Exchange Act of 1934 |
For the transition period from to
Commission file number 0-16533
ProAssurance Corporation
(Exact Name of Registrant as Specified in Its Charter)
Delaware | 63-1261433 |
(State or Other Jurisdiction of Incorporation or Organization) | (IRS Employer Identification No.) |
100 Brookwood Place, Birmingham, AL | 35209 |
(Address of Principal Executive Offices) | (Zip Code) |
(205) 877-4400 | |
(Registrant’s Telephone Number, Including Area Code) | (Former Name, Former Address, and Former Fiscal Year, if Changed Since Last Report) |
Indicate by check mark whether the registrant: (1) has filed all reports required to be filed by Section 13 or 15(d) of the Securities Exchange Act of 1934 during the preceding 12 months (or for such shorter period that the registrant was required to file such reports), and (2) has been subject to such filing requirements for the past 90 days. Yes ý No ¨
Indicate by check mark whether the registrant has submitted electronically and posted on its corporate web site, if any, every Interactive Data File required to be submitted and posted pursuant to Rule 405 of Regulation S-T (§232.405 of this chapter), during the preceding 12 months (or for such shorter period that the registrant was required to submit and post such files). Yes ý No ¨
Indicate by check mark whether the registrant is a large accelerated filer, an accelerated filer, a non-accelerated filer, or a smaller reporting company. See the definitions of "large accelerated filer," "accelerated filer" and "smaller reporting company" in Rule 12b-2 of the Exchange Act. (Check one):
Large accelerated filer | ý | Accelerated filer | ¨ | ||||
Non-accelerated filer | ¨ | (Do not check if a smaller reporting company) | Smaller reporting company | ¨ | |||
Indicate by check mark whether the registrant is a shell company (as defined in Rule 12b-2 of the Exchange Act). Yes ¨ No ý
As of July 31, 2016, there were 53,204,254 shares of the registrant’s common stock outstanding.
Glossary of Terms and Acronyms
When the following terms and acronyms appear in the text of this report, they have the meanings indicated below.
Term | Meaning |
AOCI | Accumulated other comprehensive income (loss) |
Board | Board of Directors of ProAssurance Corporation |
BOLI | Business owned life insurance |
Council of Lloyd's | The governing body for Lloyd's of London |
DPAC | Deferred policy acquisition costs |
Eastern Re | Eastern Re, LTD, S.P.C. |
EBUB | Earned, but unbilled premium |
FAL | Funds at Lloyd's |
FASB | Financial Accounting Standards Board |
FHLB | Federal Home Loan Bank |
GAAP | Generally accepted accounting principles in the United States of America |
HCPL | Healthcare professional liability |
IRS | Internal Revenue Service |
LLC | Limited liability company |
Lloyd's | Lloyd's of London market |
LP | Limited partnership |
Medical Technology Liability | Medical technology and life sciences products liability |
NAV | Net asset value |
NYSE | New York Stock Exchange |
NRSRO | Nationally recognized statistical rating organization |
OCI | Other comprehensive income (loss) |
OTTI | Other-than-temporary impairment |
PCAOB | Public Company Accounting Oversight Board |
Revolving Credit Agreement | ProAssurance's $250 million revolving credit agreement |
ROE | Return on equity |
SEC | Securities and Exchange Commission |
SPC | Segregated portfolio cell |
Specialty P&C | Specialty Property and Casualty |
Syndicate 1729 | Lloyd's of London Syndicate 1729 |
Syndicate Credit Agreement | Unconditional revolving credit agreement with the Premium Trust Fund of Syndicate 1729 |
TIPS | Treasury Inflation Protected Securities |
U.K. | United Kingdom of Great Britain and Northern Ireland |
ULAE | Unallocated loss adjustment expense |
VIE | Variable interest entity |
2
Forward-Looking Statements
Any statements in this Form 10-Q that are not historical facts are specifically identified as forward-looking statements. These statements are based upon our estimates and anticipation of future events and are subject to certain risks and uncertainties that could cause actual results to vary materially from the expected results described in the forward-looking statements. Forward-looking statements are identified by words such as, but not limited to, "anticipate," "believe," "estimate," "expect," "hope," "hopeful," "intend," "likely," "may," "optimistic," "possible," "potential," "preliminary," "project," "should," "will" and other analogous expressions. There are numerous factors that could cause our actual results to differ materially from those in the forward-looking statements. Thus, sentences and phrases that we use to convey our view of future events and trends are expressly designated as forward-looking statements as are sections of this Form 10-Q that are identified as giving our outlook on future business.
Forward-looking statements relating to our business include among other things: statements concerning future liquidity and capital requirements, investment valuation and performance, return on equity, financial ratios, net income, premiums, losses and loss reserve, premium rates and retention of current business, competition and market conditions, the expansion of product lines, the development or acquisition of business, the availability of acceptable reinsurance, actions by regulators and rating agencies, court actions, legislative actions, payment or performance of obligations under indebtedness, payment of dividends, and other matters.
These forward-looking statements are subject to significant risks, assumptions and uncertainties, including, among other things, the following factors that could affect the actual outcome of future events:
Ÿ | changes in general economic conditions, including the impact of inflation or deflation and unemployment; |
Ÿ | our ability to maintain our dividend payments; |
Ÿ | regulatory, legislative and judicial actions or decisions that could affect our business plans or operations; |
Ÿ | the enactment or repeal of tort reforms; |
Ÿ | formation or dissolution of state-sponsored insurance entities providing coverages now offered by ProAssurance which could remove or add sizable numbers of insureds from or to the private insurance market; |
Ÿ | changes in the interest rate environment; |
Ÿ | changes in U.S. laws or government regulations regarding financial markets or market activity that may affect the U.S. economy and our business; |
Ÿ | changes in the ability of the U.S. government to meet its obligations that may affect the U.S. economy and our business; |
Ÿ | performance of financial markets affecting the fair value of our investments or making it difficult to determine the value of our investments; |
Ÿ | changes in requirements or accounting policies and practices that may be adopted by our regulatory agencies, the FASB, the SEC, the PCAOB, or the NYSE that may affect our business; |
Ÿ | changes in laws or government regulations affecting the financial services industry, the property and casualty insurance industry or particular insurance lines underwritten by our subsidiaries; |
Ÿ | the effect on our insureds, particularly the insurance needs of our insureds, and our loss costs, of changes in the healthcare delivery system, including changes attributable to the Patient Protection and Affordable Care Act; |
Ÿ | consolidation of our insureds into or under larger entities which may be insured by competitors, or may not have a risk profile that meets our underwriting criteria or which may not use external providers for insuring or otherwise managing substantial portions of their liability risk; |
Ÿ | uncertainties inherent in the estimate of our loss and loss adjustment expense reserve and reinsurance recoverable; |
Ÿ | changes in the availability, cost, quality, or collectability of insurance/reinsurance; |
Ÿ | the results of litigation, including pre- or post-trial motions, trials and/or appeals we undertake; |
Ÿ | effects on our claims costs from mass tort litigation that are different from that anticipated by us; |
Ÿ | allegations of bad faith which may arise from our handling of any particular claim, including failure to settle; |
Ÿ | loss or consolidation of independent agents, agencies, brokers, or brokerage firms; |
Ÿ | changes in our organization, compensation and benefit plans; |
Ÿ | changes in the business or competitive environment may limit the effectiveness of our business strategy and impact our revenues; |
Ÿ | our ability to retain and recruit senior management; |
3
Ÿ | the availability, integrity and security of our technology infrastructure or that of our third-party providers of technology infrastructure, including any susceptibility to cyber-attacks which might result in a loss of information or operating capability; |
Ÿ | the impact of a catastrophic event, as it relates to both our operations and our insured risks; |
Ÿ | the impact of acts of terrorism and acts of war; |
Ÿ | the effects of terrorism-related insurance legislation and laws; |
Ÿ | assessments from guaranty funds; |
Ÿ | our ability to achieve continued growth through expansion into new markets or through acquisitions or business combinations; |
Ÿ | changes to the ratings assigned by rating agencies to our insurance subsidiaries, individually or as a group; |
Ÿ | provisions in our charter documents, Delaware law and state insurance laws may impede attempts to replace or remove management or may impede a takeover; |
Ÿ | state insurance restrictions may prohibit assets held by our insurance subsidiaries, including cash and investment securities, from being used for general corporate purposes; |
Ÿ | taxing authorities can take exception to our tax positions and cause us to incur significant amounts of legal and accounting costs and, if our defense is not successful, additional tax costs, including interest and penalties; and |
Ÿ | expected benefits from completed and proposed acquisitions may not be achieved or may be delayed longer than expected due to business disruption; loss of customers, employees or key agents; increased operating costs or inability to achieve cost savings; and assumption of greater than expected liabilities, among other reasons. |
Additional risks that could arise from our membership in the Lloyd's of London market and our participation in Syndicate 1729 include, but are not limited to, the following: | |
Ÿ | members of Lloyd's are subject to levies by the Council of Lloyd's based on a percentage of the member's underwriting capacity, currently a maximum of 3%, but can be increased by Lloyd's; |
Ÿ | Syndicate operating results can be affected by decisions made by the Council of Lloyd's over which the management of Syndicate 1729 has little ability to control, such as a decision to not approve the business plan of Syndicate 1729, or a decision to increase the capital required to continue operations, and by our obligation to pay levies to Lloyd's; |
Ÿ | Lloyd's insurance and reinsurance relationships and distribution channels could be disrupted or Lloyd's trading licenses could be revoked making it more difficult for Syndicate 1729 to distribute and market its products; |
Ÿ | rating agencies could downgrade their ratings of Lloyd's as a whole; and |
Ÿ | Syndicate 1729 operations are dependent on a small, specialized management team and the loss of their services could adversely affect the Syndicate’s business. The inability to identify, hire and retain other highly qualified personnel in the future, could adversely affect the quality and profitability of Syndicate 1729’s business. |
Our results may differ materially from those we expect and discuss in any forward-looking statements. The principal risk factors that may cause these differences are described in "Item 1A, Risk Factors" in our Form 10-K and other documents we file with the SEC, such as our current reports on Form 8-K, and our regular reports on Form 10-Q.
We caution readers not to place undue reliance on any such forward-looking statements, which are based upon conditions existing only as of the date made, and advise readers that these factors could affect our financial performance and could cause actual results for future periods to differ materially from any opinions or statements expressed with respect to future periods in any current statements. Except as required by law or regulations, we do not undertake and specifically decline any obligation to publicly release the result of any revisions that may be made to any forward-looking statements to reflect events or circumstances after the date of such statements or to reflect the occurrence of anticipated or unanticipated events.
4
TABLE OF CONTENTS | ||
5
ProAssurance Corporation and Subsidiaries
Condensed Consolidated Balance Sheets (Unaudited)
(In thousands, except share data)
June 30, 2016 | December 31, 2015 | ||||||
Assets | |||||||
Investments | |||||||
Fixed maturities, available for sale, at fair value; amortized cost, $2,691,341 and $2,722,063, respectively | $ | 2,787,261 | $ | 2,760,287 | |||
Equity securities, trading, at fair value; cost, $340,502 and $319,320, respectively | 351,348 | 322,353 | |||||
Short-term investments | 206,753 | 119,236 | |||||
Business owned life insurance | 58,111 | 57,213 | |||||
Investment in unconsolidated subsidiaries | 332,403 | 311,908 | |||||
Other investments, $30,267 and $30,611 at fair value, respectively, otherwise at cost or amortized cost | 80,719 | 79,133 | |||||
Total Investments | 3,816,595 | 3,650,130 | |||||
Cash and cash equivalents | 145,169 | 241,100 | |||||
Premiums receivable | 228,025 | 217,034 | |||||
Receivable from reinsurers on paid losses and loss adjustment expenses | 11,184 | 9,249 | |||||
Receivable from reinsurers on unpaid losses and loss adjustment expenses | 253,815 | 249,350 | |||||
Prepaid reinsurance premiums | 42,361 | 34,050 | |||||
Deferred policy acquisition costs | 47,713 | 44,388 | |||||
Deferred tax asset, net | — | 15,097 | |||||
Real estate, net | 38,475 | 38,470 | |||||
Intangible assets | 88,433 | 92,462 | |||||
Goodwill | 210,725 | 210,725 | |||||
Other assets | 94,342 | 103,966 | |||||
Total Assets | $ | 4,976,837 | $ | 4,906,021 | |||
Liabilities and Shareholders’ Equity | |||||||
Liabilities | |||||||
Policy liabilities and accruals | |||||||
Reserve for losses and loss adjustment expenses | $ | 1,992,801 | $ | 2,005,326 | |||
Unearned premiums | 385,214 | 362,066 | |||||
Reinsurance premiums payable | 34,039 | 30,114 | |||||
Total Policy Liabilities | 2,412,054 | 2,397,506 | |||||
Deferred tax liability, net | 8,755 | — | |||||
Other liabilities | 179,803 | 202,303 | |||||
Debt less debt issuance costs | 348,030 | 347,858 | |||||
Total Liabilities | 2,948,642 | 2,947,667 | |||||
Shareholders’ Equity | |||||||
Common shares, par value $0.01 per share, 100,000,000 shares authorized, 62,650,759 and 62,503,255 shares issued, respectively | 627 | 625 | |||||
Additional paid-in capital | 370,424 | 365,399 | |||||
Accumulated other comprehensive income (loss), net of deferred tax expense (benefit) of $32,773 and $12,972, respectively | 61,289 | 23,855 | |||||
Retained earnings | 2,017,521 | 1,988,035 | |||||
Treasury shares, at cost, 9,447,155 shares and 9,402,697 shares, respectively | (421,666 | ) | (419,560 | ) | |||
Total Shareholders’ Equity | 2,028,195 | 1,958,354 | |||||
Total Liabilities and Shareholders’ Equity | $ | 4,976,837 | $ | 4,906,021 | |||
See accompanying notes.
6
ProAssurance Corporation and Subsidiaries
Condensed Consolidated Statements of Changes in Capital (Unaudited)
(In thousands)
Common Stock | Additional Paid-in Capital | Accumulated Other Comprehensive Income (Loss) | Retained Earnings | Treasury Stock | Total | ||||||||||||||||||
Balance at December 31, 2015 | $ | 625 | $ | 365,399 | $ | 23,855 | $ | 1,988,035 | $ | (419,560 | ) | $ | 1,958,354 | ||||||||||
Common shares reacquired | — | — | — | — | (2,106 | ) | (2,106 | ) | |||||||||||||||
Common shares issued for compensation and effect of shares reissued to stock purchase plan | 1 | 2,194 | — | — | — | 2,195 | |||||||||||||||||
Share-based compensation | — | 5,813 | — | — | — | 5,813 | |||||||||||||||||
Net effect of restricted and performance shares issued and stock options exercised | 1 | (2,982 | ) | — | — | — | (2,981 | ) | |||||||||||||||
Dividends to shareholders | — | — | — | (32,913 | ) | — | (32,913 | ) | |||||||||||||||
Other comprehensive income (loss) | — | — | 37,434 | — | — | 37,434 | |||||||||||||||||
Net income | — | — | — | 62,399 | — | 62,399 | |||||||||||||||||
Balance at June 30, 2016 | $ | 627 | $ | 370,424 | $ | 61,289 | $ | 2,017,521 | $ | (421,666 | ) | $ | 2,028,195 | ||||||||||
Common Stock | Additional Paid-in Capital | Accumulated Other Comprehensive Income (Loss) | Retained Earnings | Treasury Stock | Total | ||||||||||||||||||
Balance at December 31, 2014 | $ | 623 | $ | 359,577 | $ | 58,204 | $ | 1,991,704 | $ | (252,164 | ) | $ | 2,157,944 | ||||||||||
Common shares reacquired | — | — | — | — | (123,301 | ) | (123,301 | ) | |||||||||||||||
Common shares issued for compensation and effect of shares reissued to stock purchase plan | — | 2,082 | — | — | — | 2,082 | |||||||||||||||||
Share-based compensation | — | 4,966 | — | — | — | 4,966 | |||||||||||||||||
Net effect of restricted and performance shares issued and stock options exercised | 2 | (4,395 | ) | — | — | — | (4,393 | ) | |||||||||||||||
Dividends to shareholders | — | — | — | (33,931 | ) | — | (33,931 | ) | |||||||||||||||
Other comprehensive income (loss) | — | — | (17,155 | ) | — | — | (17,155 | ) | |||||||||||||||
Net income | — | — | — | 70,972 | — | 70,972 | |||||||||||||||||
Balance at June 30, 2015 | $ | 625 | $ | 362,230 | $ | 41,049 | $ | 2,028,745 | $ | (375,465 | ) | $ | 2,057,184 | ||||||||||
See accompanying notes.
7
ProAssurance Corporation and Subsidiaries
Condensed Consolidated Statements of Income and Comprehensive Income (Unaudited)
(In thousands, except per share data)
Three Months Ended June 30 | Six Months Ended June 30 | ||||||||||||||
2016 | 2015 | 2016 | 2015 | ||||||||||||
Revenues | |||||||||||||||
Net premiums earned | $ | 176,732 | $ | 175,293 | $ | 354,312 | $ | 347,192 | |||||||
Net investment income | 24,583 | 27,955 | 50,023 | 55,258 | |||||||||||
Equity in earnings (loss) of unconsolidated subsidiaries | 376 | 2,420 | (3,259 | ) | 4,041 | ||||||||||
Net realized investment gains (losses): | |||||||||||||||
OTTI losses | — | (1,209 | ) | (10,734 | ) | (4,480 | ) | ||||||||
Portion of OTTI losses recognized in other comprehensive income before taxes | — | 348 | 1,068 | 1,789 | |||||||||||
Net impairment losses recognized in earnings | — | (861 | ) | (9,666 | ) | (2,691 | ) | ||||||||
Other net realized investment gains (losses) | 10,929 | (2,967 | ) | 12,244 | 3,702 | ||||||||||
Total net realized investment gains (losses) | 10,929 | (3,828 | ) | 2,578 | 1,011 | ||||||||||
Other income | 2,181 | 1,576 | 4,535 | 3,745 | |||||||||||
Total revenues | 214,801 | 203,416 | 408,189 | 411,247 | |||||||||||
Expenses | |||||||||||||||
Losses and loss adjustment expenses | 120,842 | 112,747 | 249,028 | 230,915 | |||||||||||
Reinsurance recoveries | (13,943 | ) | (8,808 | ) | (31,174 | ) | (21,837 | ) | |||||||
Net losses and loss adjustment expenses | 106,899 | 103,939 | 217,854 | 209,078 | |||||||||||
Underwriting, policy acquisition and operating expenses | 54,034 | 53,525 | 110,923 | 104,881 | |||||||||||
Segregated portfolio cells dividend expense (income) | 1,523 | 1,230 | 2,699 | 3,414 | |||||||||||
Interest expense | 3,851 | 3,710 | 7,537 | 7,341 | |||||||||||
Total expenses | 166,307 | 162,404 | 339,013 | 324,714 | |||||||||||
Income before income taxes | 48,494 | 41,012 | 69,176 | 86,533 | |||||||||||
Provision for income taxes | |||||||||||||||
Current expense (benefit) | 3,321 | 13,776 | 2,670 | 14,128 | |||||||||||
Deferred expense (benefit) | 2,092 | (5,922 | ) | 4,107 | 1,433 | ||||||||||
Total income tax expense (benefit) | 5,413 | 7,854 | 6,777 | 15,561 | |||||||||||
Net income | 43,081 | 33,158 | 62,399 | 70,972 | |||||||||||
Other comprehensive income (loss), after tax, net of reclassification adjustments | 14,174 | (24,828 | ) | 37,434 | (17,155 | ) | |||||||||
Comprehensive income | $ | 57,255 | $ | 8,330 | $ | 99,833 | $ | 53,817 | |||||||
Earnings per share: | |||||||||||||||
Basic | $ | 0.81 | $ | 0.60 | $ | 1.17 | $ | 1.27 | |||||||
Diluted | $ | 0.81 | $ | 0.60 | $ | 1.17 | $ | 1.26 | |||||||
Weighted average number of common shares outstanding: | |||||||||||||||
Basic | 53,205 | 55,445 | 53,182 | 56,016 | |||||||||||
Diluted | 53,428 | 55,645 | 53,395 | 56,226 | |||||||||||
Cash dividends declared per common share | $ | 0.31 | $ | 0.31 | $ | 0.62 | $ | 0.62 | |||||||
See accompanying notes.
8
ProAssurance Corporation and Subsidiaries
Condensed Consolidated Statements of Cash Flows (Unaudited)
(In thousands)
Six Months Ended June 30 | |||||||
2016 | 2015 | ||||||
Operating Activities | |||||||
Net income | $ | 62,399 | $ | 70,972 | |||
Adjustments to reconcile income to net cash provided by operating activities: | |||||||
Depreciation and amortization, net of accretion | 16,971 | 18,503 | |||||
Net realized investment (gains) losses | (2,578 | ) | (1,011 | ) | |||
Share-based compensation | 5,813 | 4,966 | |||||
Deferred income taxes | 4,107 | 1,433 | |||||
Policy acquisition costs, net amortization (net deferral) | (3,325 | ) | (5,608 | ) | |||
Equity in earnings (loss) of unconsolidated subsidiaries | 3,259 | (4,041 | ) | ||||
Other | (2,146 | ) | 559 | ||||
Other changes in assets and liabilities, excluding effect of business combinations: | |||||||
Premiums receivable | (10,991 | ) | (17,465 | ) | |||
Reinsurance related assets and liabilities | (10,786 | ) | 769 | ||||
Other assets | 16,019 | (5,909 | ) | ||||
Reserve for losses and loss adjustment expenses | (12,525 | ) | (31,569 | ) | |||
Unearned premiums | 23,148 | 24,631 | |||||
Other liabilities | (3,134 | ) | (2,478 | ) | |||
Net cash provided (used) by operating activities | 86,231 | 53,752 | |||||
Investing Activities | |||||||
Purchases of: | |||||||
Fixed maturities, available for sale | (373,180 | ) | (375,552 | ) | |||
Equity securities, trading | (59,336 | ) | (153,610 | ) | |||
Other investments | (11,382 | ) | (15,786 | ) | |||
Funding of qualified affordable housing tax credit limited partnerships | (956 | ) | (659 | ) | |||
Investment in unconsolidated subsidiaries | (28,096 | ) | (26,275 | ) | |||
Proceeds from sales or maturities of: | |||||||
Fixed maturities, available for sale | 387,496 | 520,169 | |||||
Equity securities, trading | 42,227 | 157,005 | |||||
Other investments | 7,216 | 11,918 | |||||
Distributions from unconsolidated subsidiaries | 5,180 | 13,619 | |||||
Net sales or maturities (purchases) of short-term investments | (87,517 | ) | (13,130 | ) | |||
Unsettled security transactions, net change | 25,720 | 1,229 | |||||
Other | (3,646 | ) | (5,266 | ) | |||
Net cash provided (used) by investing activities | (96,274 | ) | 113,662 | ||||
Continued on following page. | |||||||
9
Six Months Ended June 30 | |||||||
2016 | 2015 | ||||||
Financing Activities | |||||||
Borrowing under revolving credit agreement | — | 100,000 | |||||
Repurchase of common stock | (2,106 | ) | (123,301 | ) | |||
Dividends to shareholders | (85,893 | ) | (184,411 | ) | |||
External capital contribution received for segregated portfolio cells | 4,740 | — | |||||
Other | (2,629 | ) | (5,376 | ) | |||
Net cash provided (used) by financing activities | (85,888 | ) | (213,088 | ) | |||
Increase (decrease) in cash and cash equivalents | (95,931 | ) | (45,674 | ) | |||
Cash and cash equivalents at beginning of period | 241,100 | 197,040 | |||||
Cash and cash equivalents at end of period | $ | 145,169 | $ | 151,366 | |||
Significant non-cash transactions | |||||||
Dividends declared and not yet paid | $ | 16,461 | $ | 16,728 | |||
See accompanying notes.
10
ProAssurance Corporation and Subsidiaries
Notes to Condensed Consolidated Financial Statements (Unaudited)
June 30, 2016
1. Basis of Presentation
The accompanying unaudited Condensed Consolidated Financial Statements include the accounts of ProAssurance Corporation and its consolidated subsidiaries (ProAssurance, PRA or the Company). The financial statements have been prepared in accordance with GAAP for interim financial information and with the instructions to Form 10-Q and Article 10 of Regulation S-X. Accordingly, they do not include all of the information and notes required by GAAP for complete financial statements. In the opinion of management, all adjustments considered necessary for a fair presentation, consisting of normal recurring adjustments, have been included. ProAssurance’s results for the six months ended June 30, 2016 are not necessarily indicative of the results that may be expected for the year ending December 31, 2016. The accompanying Condensed Consolidated Financial Statements should be read in conjunction with the Consolidated Financial Statements and Notes contained in ProAssurance’s December 31, 2015 report on Form 10-K. In connection with its preparation of the Condensed Consolidated Financial Statements, ProAssurance evaluated events that occurred subsequent to June 30, 2016 for recognition or disclosure in its financial statements and notes to financial statements.
ProAssurance operates in four reportable segments as follows: Specialty P&C, Workers' Compensation, Lloyd's Syndicate and Corporate. For more information on the nature of products and services provided and for financial information by segment, refer to Note 12 of the Notes to Condensed Consolidated Financial Statements.
Reclassifications
On January 1, 2016 in accordance with adopted guidance, ProAssurance began presenting debt issuance costs as a direct deduction from the carrying amount of debt on the Condensed Consolidated Balance Sheet, and the December 31, 2015 Condensed Consolidated Balance Sheet has been conformed to the current presentation. Previously, debt issuance costs ($2.1 million at December 31, 2015) were reported in Other assets.
Other Liabilities
Other liabilities consisted of the following:
(In millions) | June 30, 2016 | December 31, 2015 | ||||||
SPC dividends payable | $ | 25.6 | $ | 16.7 | ||||
Unpaid dividends | 16.5 | 69.4 | ||||||
All other | 137.7 | 116.2 | ||||||
Total other liabilities | $ | 179.8 | $ | 202.3 | ||||
SPC dividends payable are the cumulative undistributed earnings contractually payable to the external preferred shareholders of SPCs operated by ProAssurance's Cayman Islands subsidiary, Eastern Re.
Unpaid dividends represent common stock dividends declared by ProAssurance's Board of Directors that had not yet been paid. Unpaid dividends at December 31, 2015 reflect a special dividend declared in late 2015 that was paid in January 2016.
11
ProAssurance Corporation and Subsidiaries
Notes to Condensed Consolidated Financial Statements (Unaudited)
June 30, 2016
Accounting Changes Adopted
Accounting for Share-Based Payments When the Terms of an Award Provide That a Performance Target Could Be Achieved After the Requisite Service Period
Effective for fiscal years beginning after December 15, 2015, the FASB issued guidance for share-based payments in which the terms of the award provide that a performance target can be achieved after completion of the requisite service period. The new guidance provides that compensation cost for such awards is to be recognized in the period in which it becomes probable that the performance target will be achieved and is to represent the compensation cost attributable to the period(s) for which the requisite service has already been rendered. ProAssurance adopted the guidance as of January 1, 2016. Adoption of the guidance had no effect on ProAssurance’s results of operations or financial position as ProAssurance has no awards with performance targets extending beyond the requisite service period.
Simplifying the Presentation of Debt Issuance Costs
Effective for fiscal years beginning after December 15, 2015, the FASB issued guidance related to the presentation of debt issuance costs. The new guidance requires that debt issuance costs related to a recognized debt liability be presented in the balance sheet as a direct deduction from the carrying amount of that debt liability, consistent with debt discounts. Related guidance issued by the SEC permits issuance costs associated with line-of-credit arrangements to be presented as an asset and subsequently amortized proportionally over the term of the arrangement. ProAssurance adopted the guidance as of January 1, 2016. Adoption of the guidance had no material effect on ProAssurance’s results of operations or financial position as it affected disclosure only.
Amendments to the Consolidation Analysis
Effective for fiscal years beginning after December 15, 2015, the FASB issued additional guidance regarding the consolidation of legal entities such as limited partnerships, limited liability corporations, and securitization structures (collateralized debt obligations, collateralized loan obligations, and mortgage-backed security transactions). The new standard modifies the evaluation of whether or not entities are VIEs and the consolidation analysis to be performed by entities involved with VIEs, particularly VIE's for which there are fee arrangements and related party relationships. ProAssurance retrospectively adopted the guidance as of January 1, 2016. Adoption of the guidance had no material effect on ProAssurance’s results of operations or financial position as it affected disclosure only.
Customer’s Accounting for Fees Paid in a Cloud Computing Arrangement
Effective for fiscal years beginning after December 15, 2015, the FASB issued additional guidance regarding accounting for cloud computing arrangements. Under the new guidance, the software license elements of cloud computing arrangements are to be accounted for in a manner that is consistent with the acquisition of other software licenses. Cloud computing arrangements that do not include a software license are to be accounted for as a service contract, following existing guidance for service contracts. ProAssurance adopted the guidance on a prospective basis as of January 1, 2016. Adoption of the guidance had no material effect on ProAssurance’s results of operations or financial position.
Disclosures about Short-Duration Contracts
Effective for fiscal years beginning after December 15, 2015 and interim periods within fiscal years beginning after December 15, 2016, the FASB issued guidance that requires insurance entities that issue short-duration contracts to provide detailed disclosures relative to the reserve for losses and loss adjustment expenses in annual reporting periods and a roll-forward of the reserve for losses and loss adjustment expenses in interim reporting periods. The guidance also requires disclosures regarding significant changes in the methodologies and assumptions used to calculate the reserve for losses and loss adjustment expenses, including reasons for and the effects of such changes. ProAssurance adopted the guidance as of January 1, 2016. Adoption of the guidance affects disclosures for the fiscal year 2016 and interim periods thereafter and is not expected to have a material effect on ProAssurance's results of operations or financial position.
12
ProAssurance Corporation and Subsidiaries
Notes to Condensed Consolidated Financial Statements (Unaudited)
June 30, 2016
Simplifying the Accounting for Measurement-Period Adjustments
Effective for fiscal years beginning after December 15, 2015 and interim periods within those fiscal years, the FASB issued guidance that requires an acquirer to recognize adjustments to estimated amounts that are identified during the measurement period in the reporting period in which the adjustment amounts are determined. An acquirer must also record, in the same period’s financial statements, the effect on earnings of changes in depreciation, amortization, or other income effects, if any, as a result of the change to the estimated amounts, calculated as if the accounting had been completed at the acquisition date. The amendments also require an entity to present separately on the face of the income statement or disclose in the notes the portion of the amount recorded in current-period earnings by line item that would have been recorded in previous reporting periods if the adjustment to the estimated amounts had been recognized as of the acquisition date. ProAssurance adopted the guidance as of January 1, 2016. Adoption of the guidance had no material effect on ProAssurance’s results of operations or financial position.
Accounting Changes Not Yet Adopted
Revenue from Contracts with Customers
Effective for fiscal years beginning after December 15, 2017, the FASB issued guidance related to revenue from contracts with customers. The core principle of the new guidance is that revenue is recognized to depict the transfer of promised goods or services to customers in an amount that reflects the consideration to which the entity expects to be entitled in exchange for those goods or services. ProAssurance plans to adopt the guidance beginning January 1, 2018. As the majority of ProAssurance's revenues come from insurance contracts which fall under the scope of other FASB standards, adoption of the guidance is expected to have no material effect on ProAssurance’s results of operations or financial position.
Disclosure of Uncertainties about an Entity's Ability to Continue as a Going Concern
Effective for fiscal years ending after December 15, 2016 and interim periods beginning after December 15, 2016, the FASB issued guidance that establishes principles and definitions related to management's evaluation of whether there is substantial doubt about the organization's ability to continue as a going concern. For each interim and annual reporting period, the new guidance requires management to evaluate the organization's ability to meet its obligations as they are due within one year of the date the financial statements are issued and requires disclosure when there is substantial doubt regarding the organization's ability to continue as a going concern. ProAssurance plans to adopt the guidance on its effective date. Adoption is expected to have no effect on ProAssurance’s results of operations or financial position.
Recognition and Measurement of Financial Assets and Financial Liabilities
Effective for fiscal years beginning after December 15, 2017 and interim periods within those fiscal years, the FASB issued guidance that requires equity investments (except those accounted for under the equity method of accounting, or those that result in consolidation of the investee) to be measured at fair value with changes in fair value recognized in net income. The new guidance also specifies that an entity use the exit price notion when measuring the fair value of financial instruments for disclosure purposes and present financial assets and liabilities by measurement category and form of financial asset. Other provisions of the new guidance include: revised disclosure requirements related to the presentation in comprehensive income of changes in the fair value of liabilities; elimination, for public companies, of disclosure requirements relative to the method(s) and significant assumptions underlying fair values disclosed for financial instruments measured at amortized cost; and simplified impairment assessments for equity investments without readily determinable fair values. ProAssurance plans to adopt the guidance beginning January 1, 2018. Adoption of the guidance is not expected to have a material effect on ProAssurance’s results of operations or financial position.
Leases
Effective for fiscal years beginning after December 15, 2018 and interim periods within those fiscal years, the FASB issued guidance that requires a lessee to recognize for all leases (with the exception of short-term leases) a lease liability, which is a lessee's obligation to make lease payments arising from a lease, measured on a discounted basis, and a right-of-use asset, which is an asset that represents the lessee's right to use, or control the use of, a specified asset for the lease term. ProAssurance plans to adopt the guidance beginning January 1, 2019. Adoption of the guidance is not expected to have a material effect on ProAssurance’s results of operations or financial position as ProAssurance does not have any material leases.
13
ProAssurance Corporation and Subsidiaries
Notes to Condensed Consolidated Financial Statements (Unaudited)
June 30, 2016
Simplifying the Transition to the Equity Method of Accounting
Effective for fiscal years beginning after December 15, 2016 and interim periods within those fiscal years, the FASB issued guidance that eliminates the requirement for retroactive restatement when an investment qualifies for use of the equity method as a result of an increase in the level of ownership interest or degree of influence. The new guidance provides that the cost of acquiring an additional interest in an investee is to be added to the current basis of an investor’s previously held interest and the equity method of accounting adopted as of the date the investment becomes qualified for equity method accounting with no retroactive adjustment of the investment. If an available-for-sale equity security qualifies for the equity method of accounting the unrealized holding gain or loss in accumulated other comprehensive income is to be recognized through earnings at the date the investment becomes qualified for use of the equity method. ProAssurance plans to adopt the guidance beginning January 1, 2017. Adoption of the guidance is not expected to have a material effect on ProAssurance’s results of operations or financial position.
Improvements to Employee Share-Based Payment Accounting
Effective for fiscal years beginning after December 15, 2016 and interim periods within those fiscal years, the FASB issued guidance that simplifies several aspects of the accounting for share-based payment transactions, including the income tax consequences, classification of cash flows, and the classification of awards as either equity or liabilities. Under the new guidance, the difference between the deduction for tax purposes and the compensation cost recognized for financial reporting purposes is to be recognized as income tax expense in the current period and included with other income tax cash flows as an operating activity. Also the threshold for equity classification has been revised to permit withholdings up to the maximum statutory tax rates in the applicable jurisdictions. ProAssurance is in the process of evaluating the effect the new guidance would have on its results of operations and financial position and plans to adopt the guidance beginning January 1, 2017.
Improvements to Financial Instruments - Credit Losses
Effective for fiscal years beginning after December 15, 2019 and interim periods within those fiscal years, the FASB issued guidance that replaces the incurred loss impairment methodology, which delays recognition of credit losses until a probable loss has been incurred, with a methodology that reflects expected credit losses and requires consideration of a broader range of reasonable and supportable information to inform credit loss estimates. Under the new guidance, credit losses are required to be recorded through an allowance for credit losses account and the income statement reflects the measurement for newly recognized financial assets, as well as increases or decreases of expected credit losses that have taken place during the period. ProAssurance is the process of evaluating the effect the new guidance would have on its results of operations and financial position and plans to adopt the guidance beginning January 1, 2020. Adoption of the guidance is not expected to have a material effect on ProAssurance’s results of operations or financial position.
14
ProAssurance Corporation and Subsidiaries
Notes to Condensed Consolidated Financial Statements (Unaudited)
June 30, 2016
2. Fair Value Measurement
Fair value is defined as the price that would be received to sell an asset or paid to transfer a liability in an orderly transaction between market participants at the measurement date. A three level hierarchy has been established for valuing assets and liabilities based on how transparent (observable) the inputs are that are used to determine fair value, with the inputs considered most observable categorized as Level 1 and those that are the least observable categorized as Level 3. Hierarchy levels are defined as follows:
Level 1: | quoted (unadjusted) market prices in active markets for identical assets and liabilities. For ProAssurance, Level 1 inputs are generally quotes for debt or equity securities actively traded in exchange or over-the-counter markets. | |
Level 2: | market data obtained from sources independent of the reporting entity (observable inputs). For ProAssurance, Level 2 inputs generally include quoted prices in markets that are not active, quoted prices for similar assets or liabilities, and results from pricing models that use observable inputs such as interest rates and yield curves that are generally available at commonly quoted intervals. | |
Level 3: | the reporting entity's own assumptions about market participant assumptions based on the best information available in the circumstances (non-observable inputs). For ProAssurance, Level 3 inputs are used in situations where little or no Level 1 or 2 inputs are available or are inappropriate given the particular circumstances. Level 3 inputs include results from pricing models for which some or all of the inputs are not observable, discounted cash flow methodologies, single non-binding broker quotes and adjustments to externally quoted prices that are based on management judgment or estimation. | |
Fair values of assets measured at fair value on a recurring basis as of June 30, 2016 and December 31, 2015 are shown in the following tables. Where applicable, the tables also indicate the fair value hierarchy of the valuation techniques utilized to determine those fair values. For some assets, the inputs used to measure fair value may fall into different levels of the fair value hierarchy. When this is the case, the asset is categorized based on the level of the most significant input to the fair value measurement. Assessments of the significance of a particular input to the fair value measurement require judgment and consideration of factors specific to the assets being valued.
15
ProAssurance Corporation and Subsidiaries
Notes to Condensed Consolidated Financial Statements (Unaudited)
June 30, 2016
June 30, 2016 | |||||||||||||||
Fair Value Measurements Using | Total | ||||||||||||||
(In thousands) | Level 1 | Level 2 | Level 3 | Fair Value | |||||||||||
Assets: | |||||||||||||||
Fixed maturities, available for sale | |||||||||||||||
U.S. Treasury obligations | $ | — | $ | 140,660 | $ | — | $ | 140,660 | |||||||
U.S. Government-sponsored enterprise obligations | — | 30,871 | — | 30,871 | |||||||||||
State and municipal bonds | — | 911,762 | — | 911,762 | |||||||||||
Corporate debt, multiple observable inputs | 2,423 | 1,305,667 | — | 1,308,090 | |||||||||||
Corporate debt, limited observable inputs | — | — | 17,810 | 17,810 | |||||||||||
Residential mortgage-backed securities | — | 241,428 | — | 241,428 | |||||||||||
Agency commercial mortgage-backed securities | — | 15,408 | — | 15,408 | |||||||||||
Other commercial mortgage-backed securities | — | 21,709 | — | 21,709 | |||||||||||
Other asset-backed securities | — | 98,768 | 755 | 99,523 | |||||||||||
Equity securities | |||||||||||||||
Financial | 73,663 | — | — | 73,663 | |||||||||||
Utilities/Energy | 49,460 | — | — | 49,460 | |||||||||||
Consumer oriented | 60,501 | — | — | 60,501 | |||||||||||
Industrial | 50,142 | — | — | 50,142 | |||||||||||
Bond funds | 75,509 | 10,017 | — | 85,526 | |||||||||||
All other | 16,351 | 15,705 | — | 32,056 | |||||||||||
Short-term investments | 200,536 | 4,661 | 1,556 | 206,753 | |||||||||||
Other investments | 2,867 | 27,400 | — | 30,267 | |||||||||||
Total assets categorized within the fair value hierarchy | $ | 531,452 | $ | 2,824,056 | $ | 20,121 | 3,375,629 | ||||||||
LP/LLC interests carried at NAV which approximates fair value. These interests, reported as a part of Investment in unconsolidated subsidiaries, are not categorized within the fair value hierarchy. | 186,151 | ||||||||||||||
Total assets at fair value | $ | 3,561,780 | |||||||||||||
16
ProAssurance Corporation and Subsidiaries
Notes to Condensed Consolidated Financial Statements (Unaudited)
June 30, 2016
December 31, 2015 | |||||||||||||||
Fair Value Measurements Using | Total | ||||||||||||||
(In thousands) | Level 1 | Level 2 | Level 3 | Fair Value | |||||||||||
Assets: | |||||||||||||||
Fixed maturities, available for sale | |||||||||||||||
U.S. Treasury obligations | $ | — | $ | 123,892 | $ | — | $ | 123,892 | |||||||
U.S. Government-sponsored enterprise obligations | — | 26,334 | — | 26,334 | |||||||||||
State and municipal bonds | — | 940,635 | — | 940,635 | |||||||||||
Corporate debt, multiple observable inputs | 2,362 | 1,274,824 | — | 1,277,186 | |||||||||||
Corporate debt, limited observable inputs | — | — | 14,500 | 14,500 | |||||||||||
Residential mortgage-backed securities | — | 238,387 | — | 238,387 | |||||||||||
Agency commercial mortgage-backed securities | — | 10,999 | — | 10,999 | |||||||||||
Other commercial mortgage-backed securities | — | 30,134 | — | 30,134 | |||||||||||
Other asset-backed securities | — | 97,463 | 757 | 98,220 | |||||||||||
Equity securities | |||||||||||||||
Financial | 67,764 | — | — | 67,764 | |||||||||||
Utilities/Energy | 41,050 | — | — | 41,050 | |||||||||||
Consumer oriented | 56,470 | — | — | 56,470 | |||||||||||
Industrial | 48,305 | — | — | 48,305 | |||||||||||
Bond funds | 76,316 | — | — | 76,316 | |||||||||||
All other | 18,239 | 14,209 | — | 32,448 | |||||||||||
Short-term investments | 86,271 | 32,965 | — | 119,236 | |||||||||||
Other investments | 3,478 | 27,133 | — | 30,611 | |||||||||||
Total assets categorized within the fair value hierarchy | $ | 400,255 | $ | 2,816,975 | $ | 15,257 | 3,232,487 | ||||||||
LP/LLC interests carried at NAV which approximates fair value. These interests, reported as a part of Investment in unconsolidated subsidiaries, are not categorized within the fair value hierarchy. | 162,624 | ||||||||||||||
Total assets at fair value | $ | 3,395,111 | |||||||||||||
The fair values for securities included in the Level 2 category, with the few exceptions described below, were developed by one of several third party, nationally recognized pricing services, including services that price only certain types of securities. Each service uses complex methodologies to determine values for securities and subject the values they develop to quality control reviews. Management selected a primary source for each type of security in the portfolio and reviewed the values provided for reasonableness by comparing data to alternate pricing services and to available market and trade data. Values that appeared inconsistent were further reviewed for appropriateness. Any value that did not appear reasonable was discussed with the service that provided the value and would have been adjusted, if necessary. No such adjustments were necessary in 2016 or 2015.
Level 2 Valuations
Below is a summary description of the valuation methodologies primarily used by the pricing services for securities in the Level 2 category, by security type:
U.S. Treasury obligations were valued based on quoted prices for identical assets, or, in markets that are not active, quotes for similar assets, taking into consideration adjustments for variations in contractual cash flows and yields to maturity.
U.S. Government-sponsored enterprise obligations were valued using pricing models that consider current and historical market data, normal trading conventions, credit ratings, and the particular structure and characteristics of the security being valued, such as yield to maturity, redemption options, and contractual cash flows. Adjustments to model inputs or model results were included in the valuation process when necessary to reflect recent regulatory, government or corporate actions or significant economic, industry or geographic events affecting the security’s fair value.
State and municipal bonds were valued using a series of matrices that considered credit ratings, the structure of the security, the sector in which the security falls, yields, and contractual cash flows. Valuations were further adjusted, when necessary, to reflect the expected effect on fair value of recent significant economic or geographic events or ratings changes.
17
ProAssurance Corporation and Subsidiaries
Notes to Condensed Consolidated Financial Statements (Unaudited)
June 30, 2016
Corporate debt with multiple observable inputs consisted primarily of corporate bonds, but also included a small number of bank loans. The methodology used to value Level 2 corporate bonds was the same as the methodology previously described for U.S. Government-sponsored enterprise obligations. Bank loans were valued based on an average of broker quotes for the loans in question, if available. If quotes were not available, the loans were valued based on quoted prices for comparable loans or, if the loan was newly issued, by comparison to similar seasoned issues. Broker quotes were compared to actual trade prices to permit assessment of the reliability of the quotes; unreliable quotes were not considered in quoted averages.
Residential and commercial mortgage backed securities. Agency pass-through securities were valued using a pricing matrix which considers the issuer type, coupon rate and longest cash flows outstanding. The matrix used was based on the most recently available market information. Agency and non-agency collateralized mortgage obligations were both valued using models that consider the structure of the security, current and historical information regarding prepayment speeds, ratings and ratings updates, and current and historical interest rate and interest rate spread data.
Other asset-backed securities were valued using models that consider the structure of the security, monthly payment information, current and historical information regarding prepayment speeds, ratings and ratings updates, and current and historical interest rate and interest rate spread data. Spreads and prepayment speeds consider collateral type.
Equity securities were securities not traded on an exchange on the valuation date. The securities were valued using the most recently available quotes for the securities.
Short-term investments are securities maturing within one year, carried at cost which approximated the fair value of the security due to the short term to maturity.
Other investments consisted primarily of convertible bonds valued using a pricing model that incorporated selected dealer quotes as well as current market data regarding equity prices and risk free rates. If dealer quotes were unavailable for the security being valued, quotes for securities with similar terms and credit status were used in the pricing model. Dealer quotes selected for use were those considered most accurate based on parameters such as underwriter status and historical reliability.
Level 3 Valuations
Below is a summary description of the valuation processes and methodologies used as well as quantitative information regarding securities in the Level 3 category.
Level 3 Valuation Processes
• | Level 3 securities are priced by the Chief Investment Officer. |
• | Level 3 valuations are computed quarterly. Prices are evaluated quarterly against prior period prices and the expected change in price. |
• | ProAssurance Level 3 securities are primarily NRSRO rated debt instruments for which comparable market inputs are commonly available for evaluating the securities in question. Valuation of these debt instruments is not overly sensitive to changes in the unobservable inputs used. |
18
ProAssurance Corporation and Subsidiaries
Notes to Condensed Consolidated Financial Statements (Unaudited)
June 30, 2016
Level 3 Valuation Methodologies
Corporate debt with limited observable inputs consisted of corporate bonds valued using dealer quotes for similar securities or discounted cash flow models using yields currently available for similar securities. Similar securities are defined as securities of comparable credit quality that have like terms and payment features. Assessments of credit quality were based on NRSRO ratings, if available, or were subjectively determined by management if not available. At June 30, 2016, 64% of the securities were rated; the average rating was A-. At December 31, 2015, 83% of the securities were rated; the average rating was A-.
Other asset-backed securities consisted of securitizations of receivables valued using dealer quotes for similar securities or discounted cash flow models using yields currently available for similar securities.
Short-term investments consisted of corporate bonds valued using dealer quotes for similar securities or discounted cash flow models using yields currently available for similar securities. Similar securities are defined as securities of comparable credit quality that have like terms and payment features.
Quantitative Information Regarding Level 3 Valuations
Fair Value at | ||||||||||
(In millions) | June 30, 2016 | December 31, 2015 | Valuation Technique | Unobservable Input | Range (Weighted Average) | |||||
Assets: | ||||||||||
Corporate debt with limited observable inputs | $17.8 | $14.5 | Market Comparable Securities | Comparability Adjustment | 0% - 5% (2.5%) | |||||
Discounted Cash Flows | Comparability Adjustment | 0% - 5% (2.5%) | ||||||||
Other asset-backed securities | $0.8 | $0.8 | Market Comparable Securities | Comparability Adjustment | 0% - 5% (2.5%) | |||||
Discounted Cash Flows | Comparability Adjustment | 0% - 5% (2.5%) | ||||||||
Short-term investments | $1.6 | $— | Market Comparable Securities | Comparability Adjustment | 0% - 5% (2.5%) | |||||
Discounted Cash Flows | Comparability Adjustment | 0% - 5% (2.5%) | ||||||||
The significant unobservable inputs used in the fair value measurement of the above listed securities were the valuations of comparable securities with similar issuers, credit quality and maturity. Changes in the availability of comparable securities could result in changes in the fair value measurements.
19
ProAssurance Corporation and Subsidiaries
Notes to Condensed Consolidated Financial Statements (Unaudited)
June 30, 2016
Fair Value Measurements - Level 3 Assets
The following tables (the Level 3 Tables) present summary information regarding changes in the fair value of assets measured at fair value using Level 3 inputs.
June 30, 2016 | |||||||||||||||||||
Level 3 Fair Value Measurements – Assets | |||||||||||||||||||
(In thousands) | State and Municipal Bonds | Corporate Debt | Asset-backed Securities | All other investments | Total | ||||||||||||||
Balance March 31, 2016 | $ | — | $ | 13,649 | $ | 4,088 | $ | 1,558 | $ | 19,295 | |||||||||
Total gains (losses) realized and unrealized: | |||||||||||||||||||
Included in earnings, as a part of: | |||||||||||||||||||
Net investment income | — | (22 | ) | — | (3 | ) | (25 | ) | |||||||||||
Equity in earnings of unconsolidated subsidiaries | — | — | — | — | — | ||||||||||||||
Net realized investment gains (losses) | — | — | — | — | — | ||||||||||||||
Included in other comprehensive income | — | 204 | 7 | 1 | 212 | ||||||||||||||
Purchases | — | 5,995 | — | — | 5,995 | ||||||||||||||
Sales | — | (2,016 | ) | (535 | ) | — | (2,551 | ) | |||||||||||
Transfers in | — | — | — | — | — | ||||||||||||||
Transfers out | — | — | (2,805 | ) | — | (2,805 | ) | ||||||||||||
Balance June 30, 2016 | $ | — | $ | 17,810 | $ | 755 | $ | 1,556 | $ | 20,121 | |||||||||
Change in unrealized gains (losses) included in earnings for the above period for Level 3 assets held at period-end | $ | — | $ | — | $ | — | $ | — | $ | — | |||||||||
June 30, 2016 | |||||||||||||||||||
Level 3 Fair Value Measurements – Assets | |||||||||||||||||||
(In thousands) | State and Municipal Bonds | Corporate Debt | Asset-backed Securities | All other investments | Total | ||||||||||||||
Balance December 31, 2015 | $ | — | $ | 14,500 | $ | 757 | $ | — | $ | 15,257 | |||||||||
Total gains (losses) realized and unrealized: | |||||||||||||||||||
Included in earnings, as a part of: | |||||||||||||||||||
Net investment income | — | (36 | ) | — | (4 | ) | (40 | ) | |||||||||||
Equity in earnings of unconsolidated subsidiaries | — | — | — | — | — | ||||||||||||||
Net realized investment gains (losses) | — | (75 | ) | — | — | (75 | ) | ||||||||||||
Included in other comprehensive income | — | 129 | 5 | — | 134 | ||||||||||||||
Purchases | — | 5,995 | 3,500 | 1,560 | 11,055 | ||||||||||||||
Sales | — | (2,697 | ) | (702 | ) | — | (3,399 | ) | |||||||||||
Transfers in | — | — | — | — | — | ||||||||||||||
Transfers out | — | (6 | ) | (2,805 | ) | — | (2,811 | ) | |||||||||||
Balance June 30, 2016 | $ | — | $ | 17,810 | $ | 755 | $ | 1,556 | $ | 20,121 | |||||||||
Change in unrealized gains (losses) included in earnings for the above period for Level 3 assets held at period-end | $ | — | $ | — | $ | — | $ | — | $ | — | |||||||||
20
ProAssurance Corporation and Subsidiaries
Notes to Condensed Consolidated Financial Statements (Unaudited)
June 30, 2016
June 30, 2015 | |||||||||||||||||||
Level 3 Fair Value Measurements – Assets | |||||||||||||||||||
(In thousands) | State and Municipal Bonds | Corporate Debt | Asset-backed Securities | All other investments | Total | ||||||||||||||
Balance March 31, 2015 | $ | 5,025 | $ | 9,977 | $ | 4,788 | $ | — | $ | 19,790 | |||||||||
Total gains (losses) realized and unrealized: | |||||||||||||||||||
Included in earnings, as a part of: | |||||||||||||||||||
Net investment income | — | — | — | — | — | ||||||||||||||
Net realized investment gains (losses) | — | — | — | — | — | ||||||||||||||
Included in other comprehensive income | (459 | ) | 21 | (11 | ) | (80 | ) | (529 | ) | ||||||||||
Purchases | — | — | — | 1,116 | 1,116 | ||||||||||||||
Sales | — | (536 | ) | — | — | (536 | ) | ||||||||||||
Transfers in | — | — | — | — | — | ||||||||||||||
Transfers out | (4,566 | ) | (994 | ) | — | — | (5,560 | ) | |||||||||||
Balance June 30, 2015 | $ | — | $ | 8,468 | $ | 4,777 | $ | 1,036 | $ | 14,281 | |||||||||
Change in unrealized gains (losses) included in earnings for the above period for Level 3 assets held at period-end | $ | — | $ | — | $ | — | $ | — | $ | — | |||||||||
June 30, 2015 | |||||||||||||||||||
Level 3 Fair Value Measurements – Assets | |||||||||||||||||||
(In thousands) | State and Municipal Bonds | Corporate Debt | Asset-backed Securities | All other investments | Total | ||||||||||||||
Balance December 31, 2014 | $ | 5,025 | $ | 13,081 | $ | 4,769 | $ | — | $ | 22,875 | |||||||||
Total gains (losses) realized and unrealized: | |||||||||||||||||||
Included in earnings, as a part of: | |||||||||||||||||||
Net investment income | — | 17 | — | — | 17 | ||||||||||||||
Net realized investment gains (losses) | — | 2 | — | — | 2 | ||||||||||||||
Included in other comprehensive income | (459 | ) | (262 | ) | 8 | (80 | ) | (793 | ) | ||||||||||
Purchases | — | 1,515 | — | 1,116 | 2,631 | ||||||||||||||
Sales | — | (836 | ) | — | — | (836 | ) | ||||||||||||
Transfers in | — | — | — | — | — | ||||||||||||||
Transfers out | (4,566 | ) | (5,049 | ) | — | — | (9,615 | ) | |||||||||||
Balance June 30, 2015 | $ | — | $ | 8,468 | $ | 4,777 | $ | 1,036 | $ | 14,281 | |||||||||
Change in unrealized gains (losses) included in earnings for the above period for Level 3 assets held at period-end | $ | — | $ | — | $ | — | $ | — | $ | — | |||||||||
Transfers
There were no transfers between Level 1 and Level 2 during the three months ended June 30, 2016 and transfers between the Level 1 and Level 2 categories during the 2016 six-month period were nominal. There were no transfers between the Level 1 and Level 2 categories during the three and six months ended June 30, 2015.
Transfers shown in the preceding Level 3 tables were as of the end of the period in which the transfer occurred. All transfers were to Level 2.
All transfers during the three and six months ended June 30, 2016 and 2015 related to securities held for which the level of market activity for identical or nearly identical securities varies from period to period. The securities were valued using multiple observable inputs when those inputs were available; otherwise the securities were valued using limited observable inputs.
21
ProAssurance Corporation and Subsidiaries
Notes to Condensed Consolidated Financial Statements (Unaudited)
June 30, 2016
Fair Values Not Categorized
Investments in unconsolidated subsidiaries at both June 30, 2016 and December 31, 2015 included interests in investment fund LPs/LLCs that measure fund assets at fair value on a recurring basis and that provide a NAV for the interest. The carrying value of these interests is based on the NAV provided, and was considered to approximate the fair value of the interests. In accordance with GAAP, the fair value of these investments was not classified within the fair value hierarchy. Additional information regarding these investments is as follows:
Unfunded Commitments | Fair Value | ||||||||
(In thousands) | June 30, 2016 | June 30, 2016 | December 31, 2015 | ||||||
Investments in LPs/LLCs: | |||||||||
Private debt funds (1) | $7,264 | $ | 56,350 | $ | 50,268 | ||||
Long equity fund (2) | None | 6,413 | 6,407 | ||||||
Long/short equity funds (3) | None | 29,073 | 28,030 | ||||||
Non-public equity funds (4) | $48,362 | 71,850 | 65,722 | ||||||
Multi-strategy fund of funds (5) | None | 8,193 | 8,252 | ||||||
Structured credit fund (6) | None | 3,946 | 3,945 | ||||||
Long/short commodities fund (7) | None | 10,326 | — | ||||||
$ | 186,151 | $ | 162,624 | ||||||
(1) | Comprised of interests in two unrelated LP funds that are structured to provide interest distributions primarily through diversified portfolios of private debt instruments. One LP allows redemption by special consent; the other does not permit redemption. Income and capital are to be periodically distributed at the discretion of the LPs over an anticipated time frame that spans from 3 to 8 years. |
(2) | The fund is a LP that holds long equities of public international companies. Redemptions are allowed at the end of any calendar month with a prior notice requirement of 15 days and are paid within 10 days of the end of the calendar month of the redemption request. |
(3) | Comprised of interests in multiple unrelated LP funds. The funds hold primarily long and short North American equities, and target absolute returns using strategies designed to take advantage of market opportunities. The funds generally permit quarterly or semi-annual capital redemptions subject to notice requirements of 30 to 90 days. For some funds, redemptions above specified thresholds (lowest threshold is 90%) may be only partially payable until after a fund audit is completed and are then payable within 30 days. |
(4) | Comprised of interests in three unrelated LP funds, each structured to provide capital appreciation through diversified investments in private equity, which can include investments in buyout, venture capital, mezzanine debt, distressed debt and other private equity-oriented LPs. One LP allows redemption by special consent; the others do not permit redemption. Income and capital are to be periodically distributed at the discretion of the LP over time frames that are anticipated to span up to 9 years. |
(5) | This fund is a LLC structured to build and manage low volatility, multi-manager portfolios that have little or no correlation to the broader fixed income and equity security markets. Redemptions are not permitted but offers to repurchase units of the LLC may be extended periodically. |
(6) | This fund is a LP seeking to obtain superior risk-adjusted absolute returns by acquiring and actively managing a diversified portfolio of debt securities, including bonds, loans and other asset-backed instruments. Redemptions are allowed at any quarter-end with a prior notice requirement of 90 days. |
(7) | This fund is a LLC invested across a broad range of commodities and focuses primarily on market neutral, relative value strategies, seeking to generate absolute returns with low correlation to broad commodity, equity and fixed income markets. Following an initial one year lock-up period, redemptions are allowed with a prior notice requirement of 30 days and are payable within 30 days. |
ProAssurance may not sell, transfer or assign its interest in any of the above LPs/LLCs without special consent from the LP/LLC.
22
ProAssurance Corporation and Subsidiaries
Notes to Condensed Consolidated Financial Statements (Unaudited)
June 30, 2016
Financial Instruments - Methodologies Other Than Fair Value
The following table provides the estimated fair value of our financial instruments that, in accordance with GAAP for the type of investment, are measured using a methodology other than fair value. All fair values provided fall within the Level 3 fair value category.
June 30, 2016 | December 31, 2015 | ||||||||||||||
(In thousands) | Carrying Value | Fair Value | Carrying Value | Fair Value | |||||||||||
Financial assets: | |||||||||||||||
BOLI | $ | 58,111 | $ | 58,111 | $ | 57,213 | $ | 57,213 | |||||||
Other investments | 50,452 | 52,470 | 48,522 | 51,646 | |||||||||||
Other assets | 23,465 | 23,466 | 24,215 | 24,193 | |||||||||||
Financial liabilities: | |||||||||||||||
Senior notes due 2023 | $ | 250,000 | $ | 272,125 | $ | 250,000 | $ | 261,308 | |||||||
Revolving credit agreement | 100,000 | 100,000 | 100,000 | 100,000 | |||||||||||
Other liabilities | 15,571 | 15,571 | 14,897 | 14,893 | |||||||||||
The fair value of the BOLI was equal to the cash surrender value associated with the policies on the valuation date.
Other investments listed in the table above include interests in certain investment fund LPs/LLCs accounted for using the cost method, investments in FHLB common stock carried at cost, and an annuity investment carried at amortized cost. The estimated fair value of the LP/LLC interests was based on the equity value of the interest provided by the LP/LLC managers for the most recent quarter, which approximates the fair value of the interest. The estimated fair value of the FHLB common stock was based on the amount ProAssurance would receive if its membership were canceled, as the membership cannot be sold. The fair value of the annuity represents the present value of the expected future cash flows discounted using a rate available in active markets for similarly structured instruments.
Other assets and Other liabilities primarily consisted of related investment assets and liabilities associated with funded deferred compensation agreements. Fair values of the funded deferred compensation assets and liabilities were based on the NAVs provided by the underlying funds. Other assets also included a secured note receivable and an unsecured receivable under a revolving credit agreement. Fair value of these receivables was based on the present value of expected cash flows from the receivables, discounted at market rates on the valuation date for receivables with similar credit standings and similar payment structures. Other liabilities also included contractual liabilities related to prior business combinations. The fair values of the business combination liabilities were based on the present value of the expected future cash outflows, discounted at ProAssurance’s assumed incremental borrowing rate on the valuation date for unsecured liabilities with similar repayment structures.
The fair value of the debt was estimated based on the present value of expected future cash outflows, discounted at rates available on the valuation date for similar debt issued by entities with a similar credit standing to ProAssurance.
23
ProAssurance Corporation and Subsidiaries
Notes to Condensed Consolidated Financial Statements (Unaudited)
June 30, 2016
3. Investments
Available-for-sale securities at June 30, 2016 and December 31, 2015 included the following:
June 30, 2016 | |||||||||||||||
(In thousands) | Amortized Cost | Gross Unrealized Gains | Gross Unrealized Losses | Estimated Fair Value | |||||||||||
Fixed maturities | |||||||||||||||
U.S. Treasury obligations | $ | 137,128 | $ | 3,534 | $ | 2 | $ | 140,660 | |||||||
U.S. Government-sponsored enterprise obligations | 29,917 | 956 | 2 | 30,871 | |||||||||||
State and municipal bonds | 869,154 | 43,247 | 639 | 911,762 | |||||||||||
Corporate debt | 1,287,244 | 45,988 | 7,332 | 1,325,900 | |||||||||||
Residential mortgage-backed securities | 232,695 | 8,785 | 52 | 241,428 | |||||||||||
Agency commercial mortgage-backed securities | 15,045 | 376 | 13 | 15,408 | |||||||||||
Other commercial mortgage-backed securities | 21,284 | 436 | 11 | 21,709 | |||||||||||
Other asset-backed securities | 98,874 | 712 | 63 | 99,523 | |||||||||||
$ | 2,691,341 | $ | 104,034 | $ | 8,114 | $ | 2,787,261 | ||||||||
December 31, 2015 | |||||||||||||||
(In thousands) | Amortized Cost | Gross Unrealized Gains | Gross Unrealized Losses | Estimated Fair Value | |||||||||||
Fixed maturities | |||||||||||||||
U.S. Treasury obligations | $ | 122,855 | $ | 1,696 | $ | 659 | $ | 123,892 | |||||||
U.S. Government-sponsored enterprise obligations | 25,456 | 927 | 49 | 26,334 | |||||||||||
State and municipal bonds | 904,719 | 36,739 | 823 | 940,635 | |||||||||||
Corporate debt | 1,296,128 | 24,720 | 29,162 | 1,291,686 | |||||||||||
Residential mortgage-backed securities | 233,659 | 6,039 | 1,311 | 238,387 | |||||||||||
Agency commercial mortgage-backed securities | 10,851 | 174 | 26 | 10,999 | |||||||||||
Other commercial mortgage-backed securities | 29,983 | 354 | 203 | 30,134 | |||||||||||
Other asset-backed securities | 98,412 | 54 | 246 | 98,220 | |||||||||||
$ | 2,722,063 | $ | 70,703 | $ | 32,479 | $ | 2,760,287 | ||||||||
24
ProAssurance Corporation and Subsidiaries
Notes to Condensed Consolidated Financial Statements (Unaudited)
June 30, 2016
The recorded cost basis and estimated fair value of available-for-sale fixed maturities at June 30, 2016, by contractual maturity, are shown below. Actual maturities may differ from contractual maturities because borrowers may have the right to call or prepay obligations with or without call or prepayment penalties.
(In thousands) | Amortized Cost | Due in one year or less | Due after one year through five years | Due after five years through ten years | Due after ten years | Total Fair Value | |||||||||||||||||
Fixed maturities, available for sale | |||||||||||||||||||||||
U.S. Treasury obligations | $ | 137,128 | $ | 8,771 | $ | 116,326 | $ | 12,118 | $ | 3,445 | $ | 140,660 | |||||||||||
U.S. Government-sponsored enterprise obligations | 29,917 | 12,747 | 3,471 | 12,890 | 1,763 | 30,871 | |||||||||||||||||
State and municipal bonds | 869,154 | 48,992 | 294,933 | 435,209 | 132,628 | 911,762 | |||||||||||||||||
Corporate debt | 1,287,244 | 92,770 | 781,765 | 421,464 | 29,901 | 1,325,900 | |||||||||||||||||
Residential mortgage-backed securities | 232,695 | 241,428 | |||||||||||||||||||||
Agency commercial mortgage-backed securities | 15,045 | 15,408 | |||||||||||||||||||||
Other commercial mortgage-backed securities | 21,284 | 21,709 | |||||||||||||||||||||
Other asset-backed securities | 98,874 | 99,523 | |||||||||||||||||||||
$ | 2,691,341 | $ | 2,787,261 | ||||||||||||||||||||
Excluding obligations of the U.S. Government or U.S. Government-sponsored enterprises, no investment in any entity or its affiliates exceeded 10% of Shareholders’ equity at June 30, 2016.
Cash and securities with a carrying value of $47.0 million at June 30, 2016 were on deposit with various state insurance departments to meet regulatory requirements. ProAssurance also held securities with a carrying value of $128.4 million at June 30, 2016 that are pledged as collateral security for advances under the Revolving Credit Agreement (see Note 8 of the Notes to Condensed Consolidated Financial Statements for additional detail on the Revolving Credit Agreement).
As a member of Lloyd's and a capital provider to Syndicate 1729, ProAssurance is required to maintain capital at Lloyd's, referred to as FAL. ProAssurance investments at June 30, 2016 included fixed maturities with a fair value of $95.9 million and short-term investments with a fair value of approximately $1.4 million on deposit with Lloyd's in order to satisfy these FAL requirements.
BOLI
ProAssurance holds BOLI policies that are carried at the current cash surrender value of the policies (original cost $33 million). All insured individuals were management employees at the time the policies were acquired. The primary purpose of the program is to offset future employee benefit expenses through earnings on the cash value of the policies. ProAssurance is the owner and beneficiary of these policies.
Other Investments
Other investments at June 30, 2016 and December 31, 2015 were comprised as follows:
(In thousands) | June 30, 2016 | December 31, 2015 | |||||
Investments in LPs/LLCs, at cost | $ | 46,948 | $ | 44,958 | |||
Convertible securities, at fair value | 30,267 | 30,611 | |||||
Other, principally FHLB capital stock, at cost | 3,504 | 3,564 | |||||
$ | 80,719 | $ | 79,133 | ||||
Investments in convertible securities are carried at fair value as permitted by the accounting guidance for hybrid financial instruments, with changes in fair value recognized in income as a component of Net realized investment gains or losses during the period of change.
FHLB capital stock is not marketable, but may be liquidated by terminating membership in the FHLB. The liquidation process can take up to five years.
25
ProAssurance Corporation and Subsidiaries
Notes to Condensed Consolidated Financial Statements (Unaudited)
June 30, 2016
Unconsolidated Subsidiaries
ProAssurance holds investments in unconsolidated subsidiaries, accounted for under the equity method. The investments include the following:
June 30, 2016 | Carrying Value | |||||||||
(In thousands) | Percentage Ownership | June 30, 2016 | December 31, 2015 | |||||||
Investment in LPs/LLCs: | ||||||||||
Qualified affordable housing tax credit partnerships | See below | $ | 114,128 | $ | 121,550 | |||||
Other tax credit partnerships | See below | 10,380 | 8,362 | |||||||
All other LPs/LLCs | See below | 207,895 | 181,996 | |||||||
$ | 332,403 | $ | 311,908 | |||||||
Qualified affordable housing tax credit partnership interests held by ProAssurance generate investment returns by providing tax benefits to fund investors in the form of tax credits and project operating losses. The carrying value of these investments reflects ProAssurance's total commitments (both funded and unfunded) to the partnerships. ProAssurance's ownership percentage relative to two of the tax credit partnership interests is almost 100%; these interests had a carrying value of $48.8 million at June 30, 2016 and $53.4 million at December 31, 2015. ProAssurance's ownership percentage relative to the remaining tax credit partnership interests is less than 20%; these interests had a carrying value of $65.3 million at June 30, 2016 and $68.1 million at December 31, 2015. ProAssurance does not have the ability to exert control over the partnerships; all are accounted for using the equity method.
Other tax credit partnerships are comprised entirely of historic tax credits. The historic tax credits generate investment returns by providing benefits to fund investors in the form of tax credits, tax deductible project operating losses and positive cash flows. ProAssurance's ownership percentage relative to the tax credit partnerships is almost 100%. ProAssurance does not have the ability to exert control over the partnerships; the interests are accounted for using the equity method.
As discussed in additional detail in Note 2 of the Notes to Condensed Consolidated Financial Statements, ProAssurance holds interests in certain LPs/LLCs that are investment funds which measure fund assets at fair value on a recurring basis and the fund managers provide a NAV for the interest. The carrying value of these interests is based on the NAV provided, and is considered to approximate the fair value of the interests; such interests totaled $186.2 million at June 30, 2016 and $162.6 million at December 31, 2015. ProAssurance also holds interests in other LPs/LLCs which are not considered to be investment funds; such interests totaled $21.7 million at June 30, 2016 and $19.4 million at December 31, 2015. ProAssurance's ownership percentage relative to two of the LPs/LLCs is greater than 25%, which is expected to be reduced as the funds mature and other investors participate in the fund; these investments had a carrying value of $8.0 million at June 30, 2016 and $8.3 million at December 31, 2015. ProAssurance's ownership percentage relative to the remaining LPs/LLCs is less than 25%; these interests had a carrying value of $199.9 million at June 30, 2016 and $173.7 million at December 31, 2015. ProAssurance does not have the ability to exert control over any of these funds.
26
ProAssurance Corporation and Subsidiaries
Notes to Condensed Consolidated Financial Statements (Unaudited)
June 30, 2016
Investments Held in a Loss Position
The following tables provide summarized information with respect to investments held in an unrealized loss position at June 30, 2016 and December 31, 2015, including the length of time the investment had been held in a continuous unrealized loss position.
June 30, 2016 | |||||||||||||||||||||||
Total | Less than 12 months | 12 months or longer | |||||||||||||||||||||
Fair | Unrealized | Fair | Unrealized | Fair | Unrealized | ||||||||||||||||||
(In thousands) | Value | Loss | Value | Loss | Value | Loss | |||||||||||||||||
Fixed maturities, available for sale | |||||||||||||||||||||||
U.S. Treasury obligations | $ | 1,149 | $ | 1 | $ | 1,149 | $ | 1 | $ | — | $ | — | |||||||||||
U.S. Government-sponsored enterprise obligations | 1,997 | 3 | 1,997 | 3 | — | — | |||||||||||||||||
State and municipal bonds | 22,558 | 639 | 16,988 | 38 | 5,570 | 601 | |||||||||||||||||
Corporate debt | 172,798 | 7,333 | 79,829 | 1,278 | 92,969 | 6,055 | |||||||||||||||||
Residential mortgage-backed securities | 5,729 | 52 | 2,399 | 11 | 3,330 | 41 | |||||||||||||||||
Agency commercial mortgage-backed securities | 416 | 13 | — | — | 416 | 13 | |||||||||||||||||
Other commercial mortgage-backed securities | 5,842 | 11 | 3,588 | 5 | 2,254 | 6 | |||||||||||||||||
Other asset-backed securities | 23,312 | 62 | 19,643 | 46 | 3,669 | 16 | |||||||||||||||||
$ | 233,801 | $ | 8,114 | $ | 125,593 | $ | 1,382 | $ | 108,208 | $ | 6,732 | ||||||||||||
Other investments | |||||||||||||||||||||||
Investments in LPs/LLCs carried at cost | $ | 21,740 | $ | 1,952 | $ | 21,740 | $ | 1,952 | $ | — | $ | — | |||||||||||
December 31, 2015 | |||||||||||||||||||||||
Total | Less than 12 months | 12 months or longer | |||||||||||||||||||||
Fair | Unrealized | Fair | Unrealized | Fair | Unrealized | ||||||||||||||||||
(In thousands) | Value | Loss | Value | Loss | Value | Loss | |||||||||||||||||
Fixed maturities, available for sale | |||||||||||||||||||||||
U.S. Treasury obligations | $ | 66,685 | $ | 658 | $ | 61,869 | $ | 591 | $ | 4,816 | $ | 67 | |||||||||||
U.S. Government-sponsored enterprise obligations | 6,819 | 49 | 6,819 | 49 | — | — | |||||||||||||||||
State and municipal bonds | 46,193 | 823 | 36,822 | 703 | 9,371 | 120 | |||||||||||||||||
Corporate debt | 622,991 | 29,162 | 555,097 | 15,691 | 67,894 | 13,471 | |||||||||||||||||
Residential mortgage-backed securities | 87,567 | 1,311 | 78,961 | 1,095 | 8,606 | 216 | |||||||||||||||||
Agency commercial mortgage-backed securities | 409 | 26 | — | — | 409 | 26 | |||||||||||||||||
Other commercial mortgage-backed securities | 15,960 | 203 | 12,635 | 170 | 3,325 | 33 | |||||||||||||||||
Other asset-backed securities | 79,637 | 247 | 74,150 | 237 | 5,487 | 10 | |||||||||||||||||
$ | 926,261 | $ | 32,479 | $ | 826,353 | $ | 18,536 | $ | 99,908 | $ | 13,943 | ||||||||||||
As of June 30, 2016, excluding U.S. Government backed securities, there were 269 debt securities (10.2% of all available-for-sale fixed maturity securities held) in an unrealized loss position representing 223 issuers. The greatest and second greatest unrealized loss positions among those securities were approximately $0.7 million and $0.6 million, respectively. The securities were evaluated for impairment as of June 30, 2016.
27
ProAssurance Corporation and Subsidiaries
Notes to Condensed Consolidated Financial Statements (Unaudited)
June 30, 2016
As of December 31, 2015, excluding U.S. Government backed securities, there were 773 debt securities (28.8% of all available-for-sale fixed maturity securities held) in an unrealized loss position representing 506 issuers. The greatest and second greatest unrealized loss position among those securities approximated $1.4 million and $1.3 million, respectively. The securities were evaluated for impairment as of December 31, 2015.
Each quarter, ProAssurance performs a detailed analysis for the purpose of assessing whether any of the securities it holds in an unrealized loss position have suffered an OTTI in value. A detailed discussion of the factors considered in the assessment is included in Note 1 of the Notes to Consolidated Financial Statements included in ProAssurance's December 31, 2015 Form 10-K.
Fixed maturity securities held in an unrealized loss position at June 30, 2016, excluding asset-backed securities, have paid all scheduled contractual payments and are expected to continue doing so. Expected future cash flows of asset-backed securities held in an unrealized loss position were estimated as part of the June 30, 2016 impairment evaluation using the most recently available six-month historical performance data for the collateral (loans) underlying the security or, if historical data was not available, sector based assumptions, and equaled or exceeded the current amortized cost basis of the security.
Net Investment Income
Net investment income by investment category was as follows:
Three Months Ended June 30 | Six Months Ended June 30 | ||||||||||||||
(In thousands) | 2016 | 2015 | 2016 | 2015 | |||||||||||
Fixed maturities | $ | 21,208 | $ | 25,025 | $ | 43,784 | $ | 49,984 | |||||||
Equities | 3,561 | 3,456 | 7,204 | 6,468 | |||||||||||
Short-term and Other investments | 678 | 396 | 1,082 | 902 | |||||||||||
BOLI | 439 | 474 | 899 | 930 | |||||||||||
Investment fees and expenses | (1,303 | ) | (1,396 | ) | (2,946 | ) | (3,026 | ) | |||||||
Net investment income | $ | 24,583 | $ | 27,955 | $ | 50,023 | $ | 55,258 | |||||||
Equity in Earnings (Loss) from Unconsolidated Subsidiaries
Equity in earnings (loss) from unconsolidated subsidiaries included losses from qualified affordable housing project tax credit investments of $3.0 million and $8.3 million for the three- and six-month periods ended June 30, 2016, respectively, and $2.6 million and $5.2 million for the three- and six-month periods ended June 30, 2015, respectively. The losses recorded reflect ProAssurance's allocable portion of partnership operating losses. ProAssurance recognized tax credits related to these qualified affordable housing investments that totaled $4.6 million and $9.3 million for the three- and six-month periods ended June 30th of both 2016 and 2015, respectively. Tax credits recognized reduced income tax expense in the respective periods.
28
ProAssurance Corporation and Subsidiaries
Notes to Condensed Consolidated Financial Statements (Unaudited)
June 30, 2016
Net Realized Investment Gains (Losses)
Realized investment gains and losses are recognized on the specific identification basis. The following table provides detailed information regarding net realized investment gains (losses):
Three Months Ended June 30 | Six Months Ended June 30 | ||||||||||||||
(In thousands) | 2016 | 2015 | 2016 | 2015 | |||||||||||
Total OTTI losses: | |||||||||||||||
Corporate debt | $ | — | $ | (1,209 | ) | $ | (7,604 | ) | $ | (4,480 | ) | ||||
Other investments | — | — | (3,130 | ) | — | ||||||||||
Portion recognized in OCI: | |||||||||||||||
Corporate debt | — | 348 | 1,068 | 1,789 | |||||||||||
Net impairments recognized in earnings | $ | — | $ | (861 | ) | $ | (9,666 | ) | $ | (2,691 | ) | ||||
Gross realized gains, available-for-sale securities | 1,885 | 3,627 | 5,070 | 7,640 | |||||||||||
Gross realized (losses), available-for-sale securities | (612 | ) | (810 | ) | (5,259 | ) | (2,065 | ) | |||||||
Net realized gains (losses), trading securities | 1,913 | 9,525 | 3,968 | 12,192 | |||||||||||
Net realized gains (losses), Short-term investments | 18 | — | 18 | — | |||||||||||
Net realized gains (losses), Other investments | 447 | 602 | 498 | 718 | |||||||||||
Change in unrealized holding gains (losses), trading securities | 7,115 | (15,751 | ) | 7,851 | (14,893 | ) | |||||||||
Change in unrealized holding gains (losses), convertible securities, carried at fair value | 162 | (968 | ) | 95 | (698 | ) | |||||||||
Other | 1 | 808 | 3 | 808 | |||||||||||
Net realized investment gains (losses) | $ | 10,929 | $ | (3,828 | ) | $ | 2,578 | $ | 1,011 | ||||||
ProAssurance did not recognize OTTI during the 2016 three-month period. ProAssurance recognized OTTI in earnings during the first quarter of 2016 of $6.5 million which included $5.5 million related to debt instruments of ten issuers in the energy sector. The fair value of the bonds and the credit quality of the issuers had declined and ProAssurance recognized credit-related OTTI to reduce the amortized cost basis of the bonds to the present value of future cash flows expected to be received from the bonds. ProAssurance also recognized non-credit OTTI in OCI during first quarter 2016 of $0.9 million related to certain of these same bonds, as the fair value of the bonds was less than the present value of the expected future cash flows from the securities.
ProAssurance also recognized a $3.1 million OTTI in earnings during the first quarter of 2016 related to an investment fund that is accounted for using the cost method (classified as Other investments). The fund is focused on the energy sector and securities held by the fund declined in value during the first quarter of 2016. An OTTI was recognized to reduce ProAssurance's carrying value of the investment to the NAV reported by the fund.
During the 2015 three- and six-month periods, ProAssurance recognized credit-related impairments of $0.9 million and $2.7 million, respectively, related to investments in high-yield securities from three issuers in the energy industry. ProAssurance also recognized non-credit impairments of $0.3 million and $1.8 million for the same respective periods, related to these securities as the fair value of the securities was less than the future cash flows expected to be received from the securities.
29
ProAssurance Corporation and Subsidiaries
Notes to Condensed Consolidated Financial Statements (Unaudited)
June 30, 2016
The following table presents a roll forward of cumulative credit losses recorded in earnings related to impaired debt securities for which a portion of the OTTI was recorded in OCI.
Three Months Ended June 30 | Six Months Ended June 30 | ||||||||||||||
(In thousands) | 2016 | 2015 | 2016 | 2015 | |||||||||||
Balance beginning of period | $ | 6,559 | $ | 2,062 | $ | 5,751 | $ | 232 | |||||||
Additional credit losses recognized during the period, related to securities for which: | |||||||||||||||
No OTTI has been previously recognized | — | — | 2,398 | 1,830 | |||||||||||
OTTI has been previously recognized | — | 861 | 2,154 | 861 | |||||||||||
Reductions due to: | |||||||||||||||
Securities sold during the period (realized) | (3,240 | ) | (293 | ) | (6,984 | ) | (293 | ) | |||||||
Balance June 30 | $ | 3,319 | $ | 2,630 | $ | 3,319 | $ | 2,630 | |||||||
Other information regarding sales and purchases of available-for-sale securities is as follows:
Three Months Ended June 30 | Six Months Ended June 30 | ||||||||||||||
(In millions) | 2016 | 2015 | 2016 | 2015 | |||||||||||
Proceeds from sales (exclusive of maturities and paydowns) | $ | 82.0 | $ | 95.1 | $ | 191.9 | $ | 301.0 | |||||||
Purchases | $ | 173.6 | $ | 160.5 | $ | 373.2 | $ | 375.6 | |||||||
4. Income Taxes
ProAssurance estimates its annual effective tax rate at the end of each quarterly reporting period and uses this estimated rate to record the provision for income taxes in the interim financial statements. The provision for income taxes is different from that which would be obtained by applying the statutory Federal income tax rate to income before taxes primarily because a portion of ProAssurance’s investment income is tax-exempt, and because ProAssurance utilizes tax credit benefits transferred from tax credit partnership investments. Also, in 2016 no U.S. or U.K. tax expense was recognized relative to ProAssurance's pro rata portion of the operating profits of Syndicate 1729 as prior year operating losses were available to offset the profits. In 2015, no U.K. tax benefit was recognized relative to ProAssurance's pro rata portion of Syndicate 1729's operating losses as there was no income against which the losses could be offset.
ProAssurance had receivables for Federal and U.K. income taxes of $1.4 million at June 30, 2016 and $16.4 million at December 31, 2015, both carried as a part of Other assets. The liability for unrecognized tax benefits was $8.4 million at June 30, 2016 and $8.2 million at December 31, 2015.
5. Deferred Policy Acquisition Costs
Policy acquisition costs that are primarily and directly related to the successful production of new and renewal insurance contracts, most significantly agent commissions, premium taxes, and underwriting salaries and benefits, are capitalized as policy acquisition costs and amortized to expense, net of ceding commissions earned, as the related premium revenues are earned.
Amortization of DPAC was $21.6 million and $43.1 million for the three and six months ended June 30, 2016, respectively, and $19.9 million and $38.9 million for the three and six months ended June 30, 2015, respectively.
30
ProAssurance Corporation and Subsidiaries
Notes to Condensed Consolidated Financial Statements (Unaudited)
June 30, 2016
6. Reserve for Losses and Loss Adjustment Expenses
The reserve for losses is established based on estimates of individual claims and actuarially determined estimates of future losses based on ProAssurance’s past loss experience, available industry data and projections as to future claims frequency, severity, inflationary trends and settlement patterns. Estimating the reserve, particularly the reserve appropriate for liability exposures, is a complex process. Claims may be resolved over an extended period of time, often five years or more, and may be subject to litigation. Estimating losses requires ProAssurance to make and revise judgments and assessments regarding multiple uncertainties over an extended period of time. As a result, the reserve estimate may vary significantly from the eventual outcome. The assumptions used in establishing ProAssurance’s reserve are regularly reviewed and updated by management as new data becomes available. Changes to estimates of previously established reserves are included in earnings in the period in which the estimate is changed.
During the three and six months ended June 30, 2016, ProAssurance recognized favorable net loss development of $36.8 million and $65.5 million, respectively, related to prior accident years. The favorable net loss development primarily reflected reductions in the Company's estimates of claims severity related to the 2009 through 2013 accident years.
For the three and six months ended June 30, 2015, ProAssurance recognized favorable net loss development of $35.1 million and $68.6 million, respectively, which primarily reflected reductions in estimated claims severity related to the 2008 through 2012 accident years.
7. Commitments and Contingencies
ProAssurance is involved in various legal actions related to insurance policies and claims handling including, but not limited to, claims asserted by policyholders. These types of legal actions arise in the Company's ordinary course of business and, in accordance with GAAP for insurance entities, are considered as a part of the Company's loss reserving process, which is described in detail under the heading "Losses and Loss Adjustment Expenses" in the Accounting Policies section in Note 1 of the Notes to Consolidated Financial Statements in ProAssurance's 2015 Form 10-K.
ProAssurance has funding commitments primarily related to non-public investment entities totaling approximately $93.9 million, expected to be paid as follows: $49.8 million in 2016, $41.5 million in 2017 and 2018 combined, $2.0 million in 2019 and 2020 combined and $0.6 million thereafter. Of these funding commitments, $1.5 million are related to qualified affordable housing project tax credit investments and are expected to be paid as follows: $0.2 million in 2016, $0.4 million in 2017 and 2018 combined, $0.3 million in 2019 and 2020 combined and $0.6 million thereafter.
As a member of Lloyd's and a capital provider to Syndicate 1729, ProAssurance is required to provide capital, referred to as FAL. At June 30, 2016, ProAssurance was satisfying the FAL requirement with investment securities on deposit with Lloyd's with a carrying value of $97.3 million (see Note 3 of the Notes to Condensed Consolidated Financial Statements).
ProAssurance has issued an unconditional revolving credit agreement to the Premium Trust Fund of Syndicate 1729 for the purpose of providing working capital. Permitted borrowings were expanded from £10 million to £20 million under an amended Syndicate Credit Agreement executed in April 2016. Under the amended Syndicate Credit Agreement advances bear interest at 3.8% annually, and may be repaid at any time but are repayable upon demand after December 31, 2019. As of June 30, 2016, the unused commitment under the Syndicate Credit Agreement approximated £11.3 million (approximately $15.0 million as of June 30, 2016).
31
ProAssurance Corporation and Subsidiaries
Notes to Condensed Consolidated Financial Statements (Unaudited)
June 30, 2016
8. Debt
ProAssurance’s outstanding debt consisted of the following:
(In thousands) | June 30, 2016 | December 31, 2015 | |||||
Senior notes due 2023, unsecured, interest at 5.3% annually | $ | 250,000 | $ | 250,000 | |||
Revolving Credit Agreement, outstanding borrowings are fully secured, see Note 3, and carried at an interest rate of 1.13%. Outstanding borrowings are not permitted to exceed $250 million aggregately; Agreement expires in 2020. The interest rate on the borrowing is set at the time the borrowing is initiated or renewed. The current borrowing can be repaid or renewed in October 2016. If renewed, the interest rate will reset. | 100,000 | 100,000 | |||||
Total principal | $ | 350,000 | $ | 350,000 | |||
Less debt issuance costs | 1,970 | 2,142 | |||||
Debt less debt issuance costs | $ | 348,030 | $ | 347,858 | |||
Covenant Compliance
There are no financial covenants associated with the Senior Notes due 2023.
The Revolving Credit Agreement contains customary representations, covenants and events constituting default, and remedies for default. The Revolving Credit Agreement also defines financial covenants regarding permitted leverage ratios. ProAssurance is currently in compliance with all covenants of the Agreement.
Additional Information
For additional information regarding ProAssurance's debt, see Note 10 of the Notes to Consolidated Financial Statements included in ProAssurance's December 31, 2015 Form 10-K.
32
ProAssurance Corporation and Subsidiaries
Notes to Condensed Consolidated Financial Statements (Unaudited)
June 30, 2016
9. Shareholders’ Equity
At June 30, 2016 and December 31, 2015, ProAssurance had 100 million shares of authorized common stock and 50 million shares of authorized preferred stock. The Board has the authority to determine provisions for the issuance of preferred shares, including the number of shares to be issued, the designations, powers, preferences and rights, and the qualifications, limitations or restrictions of such shares. To date, the Board has not approved the issuance of preferred stock.
ProAssurance declared cash dividends of $0.31 per share during both the first and second quarters of 2016 totaling $32.9 million. ProAssurance declared cash dividends of $0.31 per share during the first and second quarters of 2015 totaling $33.9 million.
At June 30, 2016, Board authorizations for the repurchase of common shares or the retirement of outstanding debt of $109.6 million remained available for use. ProAssurance repurchased approximately 44,500 shares at a cost of $2.1 million and 2.7 million shares at a cost of $123.3 million during the six-month periods ended June 30, 2016 and 2015, respectively.
Share-based compensation expense was $3.1 million and $5.8 million for both the three and six months ended June 30, 2016, respectively, and $2.3 million and $5.0 million for the three and six months ended June 30, 2015, respectively. Related tax benefits were $1.1 million and $2.0 million for the three and six months ended June 30, 2016, respectively, and $0.8 million and $1.7 million for the three and six months ended June 30, 2015, respectively.
ProAssurance awarded approximately 109,200 restricted share units and 60,000 base performance share units to employees in February 2016. The fair value of each unit awarded was estimated at $45.58, equal to the market value of a ProAssurance common share on the date of grant less the estimated present value of dividends during the vesting period. All awards are charged to expense as an increase to equity over the service period (generally the vesting period) associated with the award. Restricted share units and performance share units vest in their entirety at the end of a three-year period following the grant date based on a continuous service requirement and, for performance share units, achievement of a performance objective. Partial vesting is permitted for retirees. A ProAssurance common share is issued for each unit once vesting requirements are met, except that units sufficient to satisfy required tax withholdings are paid in cash. The number of common shares issued for performance share units varies from 50% to 200% of base awards depending upon the degree to which stated performance objectives are achieved. ProAssurance issued approximately 22,000 and 72,000 common shares to employees in February 2016 related to restricted share units and performance share units, respectively, granted in 2013. Performance share units for the 2013 award were issued at levels ranging from 83% to 125%.
ProAssurance issued approximately 24,000 common shares to employees in February 2016 as bonus compensation, as approved by the Compensation Committee of the Board. The shares issued were valued at fair value (the market price of a ProAssurance common share on the date of award).
Other Comprehensive Income (Loss) and Accumulated Other Comprehensive Income (Loss)
For the three and six months ended June 30, 2016 and June 30, 2015, OCI was primarily comprised of unrealized gains and losses, including non-credit impairment losses in the first quarter, arising during the period related to available-for-sale securities, less reclassification adjustments, net of tax. OCI also included a $0.5 million gain for the six months ended June 30, 2016 and a loss of $1.0 million for the six months ended June 30, 2015, net of tax, related to unrecognized changes in defined benefit plan liabilities from the reestimation of two defined benefit plans assumed in the Eastern acquisition, primarily recognized in the first quarter periods. Both plans are frozen as to the earning of additional benefits, but the unrecognized plan benefit liability is reestimated annually.
At June 30, 2016 and December 31, 2015, AOCI was primarily comprised of unrealized gains and losses from available-for-sale securities, including non-credit impairments recognized in OCI of $0.7 million and $2.0 million, respectively, net of tax. At June 30, 2016 and December 31, 2015, AOCI also included losses of $0.4 million and $1.0 million, respectively, related to unrecognized changes in defined benefit plan liabilities, net of tax. All tax effects were computed using a 35% rate, with the exception of unrealized gains and losses on available for sale securities held at our U.K. and Cayman Island entities which were immaterial in amount.
33
ProAssurance Corporation and Subsidiaries
Notes to Condensed Consolidated Financial Statements (Unaudited)
June 30, 2016
Amounts reclassified from AOCI to net income and the amounts of deferred tax expense (benefit) included in OCI were as follows:
Three Months Ended June 30 | Six Months Ended June 30 | ||||||||||||||
(In thousands) | 2016 | 2015 | 2016 | 2015 | |||||||||||
Reclassifications from AOCI to net income, available-for-sale securities: | |||||||||||||||
Realized investment gains (losses) | $ | 1,531 | $ | 3,248 | $ | (3,703 | ) | $ | 4,176 | ||||||
Non-credit impairment losses reclassified to earnings, due to sale of securities or reclassification as a credit loss | (260 | ) | (1,292 | ) | (3,018 | ) | (1,292 | ) | |||||||
Total amounts reclassified, before tax effect | 1,271 | 1,956 | (6,721 | ) | 2,884 | ||||||||||
Tax effect (at 35%) | (445 | ) | (685 | ) | 2,352 | (1,009 | ) | ||||||||
Net reclassification adjustments | $ | 826 | $ | 1,271 | $ | (4,369 | ) | $ | 1,875 | ||||||
Deferred tax expense (benefit) included in OCI | $ | 7,541 | $ | (13,481 | ) | $ | 19,801 | $ | (9,349 | ) | |||||
10. Variable Interest Entities
ProAssurance holds passive interests in a number of entities that are considered to be VIEs under GAAP guidance. As of January 1, 2016 ProAssurance has retrospectively adopted new guidance regarding the evaluation of whether or not entities are VIEs and the consolidation analysis required for VIEs (see Note 1 of the Notes to Condensed Consolidated Financial Statements). Adoption of the new guidance increased the number of ProAssurance investment interests considered to be interests in VIEs but did not require that any of the VIE interests be consolidated. ProAssurance's VIE interests principally consist of interests in LPs/LLCs formed for the purpose of achieving diversified equity and debt returns. ProAssurance's VIE interests carried as a part of Other investments totaled $27.6 million at June 30, 2016 and $26.0 million at December 31, 2015. ProAssurance's VIE interests carried as a part of Investment in unconsolidated subsidiaries totaled $281.9 million at June 30, 2016 and $275.0 million at December 31, 2015.
ProAssurance does not have power over the activities that most significantly impact the economic performance of these VIEs and thus is not the primary beneficiary. Therefore, ProAssurance has not consolidated these VIEs. ProAssurance’s involvement with each entity is limited to its direct ownership interest in the entity. ProAssurance has no arrangements with any of the entities to provide other financial support to or on behalf of the entity. At June 30, 2016, ProAssurance’s maximum loss exposure relative to these investments was limited to the carrying value of ProAssurance’s investment in the VIE.
11. Earnings Per Share
Diluted weighted average shares is calculated as basic weighted average shares plus the effect, calculated using the treasury stock method, of assuming that performance, restricted and purchase share units have vested. All outstanding performance, restricted and purchase share units had a dilutive effect for the three and six months ended June 30, 2016 and 2015.
34
ProAssurance Corporation and Subsidiaries
Notes to Condensed Consolidated Financial Statements (Unaudited)
June 30, 2016
12. Segment Information
ProAssurance operates in four segments that are organized around the nature of the products and services provided: Specialty P&C, Workers' Compensation, Lloyd's Syndicate, and Corporate. A description of each segment follows.
Specialty P&C is primarily focused on professional liability insurance and medical technology liability insurance. Professional liability insurance is primarily offered to healthcare providers and institutions and to attorneys and their firms. Medical technology liability insurance is offered for medical technology and life sciences companies that manufacture or distribute products including entities conducting human clinical trials. The Specialty P&C segment cedes certain premium to the Lloyd's Syndicate segment under a quota share agreement with Syndicate 1729. As discussed below, Syndicate 1729 operating results are reported on a quarter delay. For consistency purposes, results from this ceding arrangement, other than cash receipts or disbursements, have been reported within the Specialty P&C segment on the same one quarter delay.
Workers' Compensation provides workers' compensation products primarily to employers with 1,000 or fewer employees. The segment also offers alternative market solutions whereby policies written are 100% ceded either to captive insurers unaffiliated with ProAssurance or to SPCs operated by a wholly owned subsidiary of ProAssurance. Each SPC is owned, fully or in part, by an agency, group or association. Financial results (underwriting profit or loss, plus investment results) of the SPCs accrue to the owners of that cell.
Lloyd's Syndicate includes operating results from ProAssurance's 58% participation in Lloyd's of London Syndicate 1729. Syndicate 1729 underwrites risks over a wide range of property and casualty insurance and reinsurance lines in both the U.S and international markets. The results of this segment are reported on a quarter delay, except that investment results associated with investment assets solely allocated to Syndicate 1729 operations and certain U.S. paid administrative expenses are reported concurrently as that information is available on an earlier time frame.
Corporate includes ProAssurance's U.S. investment operations, interest expense and U.S. income taxes, all of which are managed at the corporate level, non-premium revenues generated outside of our insurance entities, and corporate expenses.
The accounting policies of the segments are the same as those described in Note 1 of the Notes to Consolidated Financial Statements in ProAssurance’s December 31, 2015 report on Form 10-K and Note 1 of the Notes to Condensed Consolidated Financial Statements. ProAssurance evaluates performance of its Specialty P&C and Workers' Compensation segments based on before tax underwriting profit or loss, which excludes investment performance. Performance of the Lloyd's Syndicate segment is evaluated based on underwriting profit or loss, plus investment results of investment assets solely allocated to Syndicate 1729 operations, net of U.K. income tax expense. Performance of the Corporate segment is evaluated based on the contribution made to consolidated after tax results. ProAssurance accounts for inter-segment transactions as if the transactions were to third parties at current market prices. Assets are not allocated to segments because investments and other assets are not managed at the segment level.
35
ProAssurance Corporation and Subsidiaries
Notes to Condensed Consolidated Financial Statements (Unaudited)
June 30, 2016
Financial data by segment were as follows:
Three Months Ended June 30, 2016 | |||||||||||||||||||||||
(In thousands) | Specialty P&C | Workers' Compensation | Lloyd's Syndicate | Corporate | Inter-segment Eliminations | Consolidated | |||||||||||||||||
Net premiums earned | $ | 108,126 | $ | 55,093 | $ | 13,513 | $ | — | $ | — | $ | 176,732 | |||||||||||
Net investment income | — | — | 337 | 24,246 | — | 24,583 | |||||||||||||||||
Equity in earnings (loss) of unconsolidated subsidiaries | — | — | — | 376 | — | 376 | |||||||||||||||||
Net realized gains (losses) | — | — | 14 | 10,915 | — | 10,929 | |||||||||||||||||
Other income | 1,732 | 139 | 188 | 286 | (164 | ) | 2,181 | ||||||||||||||||
Net losses and loss adjustment expenses* | (62,301 | ) | (34,661 | ) | (8,502 | ) | — | (1,435 | ) | (106,899 | ) | ||||||||||||
Underwriting, policy acquisition and operating expenses* | (25,902 | ) | (16,334 | ) | (5,240 | ) | (8,157 | ) | 1,599 | (54,034 | ) | ||||||||||||
Segregated portfolio cells dividend (expense) income | — | (1,523 | ) | — | — | — | (1,523 | ) | |||||||||||||||
Interest expense | — | — | — | (3,851 | ) | — | (3,851 | ) | |||||||||||||||
Income tax benefit (expense) | — | — | (812 | ) | (4,601 | ) | — | (5,413 | ) | ||||||||||||||
Segment operating results | $ | 21,655 | $ | 2,714 | $ | (502 | ) | $ | 19,214 | $ | — | $ | 43,081 | ||||||||||
Significant non-cash items: | |||||||||||||||||||||||
Depreciation and amortization | $ | 1,486 | $ | 1,393 | $ | 43 | $ | 5,421 | $ | — | $ | 8,343 | |||||||||||
Six Months Ended June 30, 2016 | |||||||||||||||||||||||
(In thousands) | Specialty P&C | Workers' Compensation | Lloyd's Syndicate | Corporate | Inter-segment Eliminations | Consolidated | |||||||||||||||||
Net premiums earned | $ | 218,882 | $ | 109,476 | $ | 25,954 | $ | — | $ | — | $ | 354,312 | |||||||||||
Net investment income | — | — | 653 | 49,370 | — | 50,023 | |||||||||||||||||
Equity in earnings (loss) of unconsolidated subsidiaries | — | — | — | (3,259 | ) | — | (3,259 | ) | |||||||||||||||
Net realized gains (losses) | — | — | 8 | 2,570 | — | 2,578 | |||||||||||||||||
Other income | 3,008 | 610 | 440 | 744 | (267 | ) | 4,535 | ||||||||||||||||
Net losses and loss adjustment expenses* | (133,477 | ) | (69,687 | ) | (14,690 | ) | — | — | (217,854 | ) | |||||||||||||
Underwriting, policy acquisition and operating expenses* | (50,954 | ) | (34,165 | ) | (10,406 | ) | (15,665 | ) | 267 | (110,923 | ) | ||||||||||||
Segregated portfolio cells dividend (expense) income | — | (2,699 | ) | — | — | — | (2,699 | ) | |||||||||||||||
Interest expense | — | — | — | (7,537 | ) | — | (7,537 | ) | |||||||||||||||
Income tax benefit (expense) | — | — | (897 | ) | (5,880 | ) | — | (6,777 | ) | ||||||||||||||
Segment operating results | $ | 37,459 | $ | 3,535 | $ | 1,062 | $ | 20,343 | $ | — | $ | 62,399 | |||||||||||
Significant non-cash items: | |||||||||||||||||||||||
Depreciation and amortization | $ | 3,497 | $ | 2,797 | $ | 109 | $ | 10,568 | $ | — | $ | 16,971 | |||||||||||
36
ProAssurance Corporation and Subsidiaries
Notes to Condensed Consolidated Financial Statements (Unaudited)
June 30, 2016
Three Months Ended June 30, 2015 | |||||||||||||||||||||||
(In thousands) | Specialty P&C | Workers' Compensation | Lloyd's Syndicate | Corporate | Inter-segment Eliminations | Consolidated | |||||||||||||||||
Net premiums earned | $ | 112,608 | $ | 53,581 | $ | 9,104 | $ | — | $ | — | $ | 175,293 | |||||||||||
Net investment income | — | — | 189 | 27,766 | — | 27,955 | |||||||||||||||||
Equity in earnings (loss) of unconsolidated subsidiaries | — | — | — | 2,420 | — | 2,420 | |||||||||||||||||
Net realized gains (losses) | — | — | 4 | (3,832 | ) | — | (3,828 | ) | |||||||||||||||
Other income | 1,376 | 163 | 3 | 111 | (77 | ) | 1,576 | ||||||||||||||||
Net losses and loss adjustment expenses | (64,054 | ) | (34,310 | ) | (5,575 | ) | — | — | (103,939 | ) | |||||||||||||
Underwriting, policy acquisition and operating expenses* | (26,645 | ) | (15,831 | ) | (3,964 | ) | (7,162 | ) | 77 | (53,525 | ) | ||||||||||||
Segregated portfolio cells dividend (expense) income | — | (1,230 | ) | — | — | — | (1,230 | ) | |||||||||||||||
Interest expense | — | — | — | (3,710 | ) | — | (3,710 | ) | |||||||||||||||
Income tax benefit (expense) | — | — | (620 | ) | (7,234 | ) | — | (7,854 | ) | ||||||||||||||
Segment operating results | $ | 23,285 | $ | 2,373 | $ | (859 | ) | $ | 8,359 | $ | — | $ | 33,158 | ||||||||||
Significant non-cash items: | |||||||||||||||||||||||
Depreciation and amortization | $ | 1,980 | $ | 1,429 | $ | 106 | $ | 5,421 | $ | — | $ | 8,936 | |||||||||||
Six Months Ended June 30, 2015 | |||||||||||||||||||||||
(In thousands) | Specialty P&C | Workers' Compensation | Lloyd's Syndicate | Corporate | Inter-segment Eliminations | Consolidated | |||||||||||||||||
Net premiums earned | $ | 227,472 | $ | 104,858 | $ | 14,862 | $ | — | $ | — | $ | 347,192 | |||||||||||
Net investment income | — | — | 393 | 54,865 | — | 55,258 | |||||||||||||||||
Equity in earnings (loss) of unconsolidated subsidiaries | — | — | — | 4,041 | — | 4,041 | |||||||||||||||||
Net realized gains (losses) | — | — | 15 | 996 | — | 1,011 | |||||||||||||||||
Other income | 2,874 | 300 | 492 | 268 | (189 | ) | 3,745 | ||||||||||||||||
Net losses and loss adjustment expenses | (133,084 | ) | (66,412 | ) | (9,582 | ) | — | — | (209,078 | ) | |||||||||||||
Underwriting, policy acquisition and operating expenses* | (53,806 | ) | (31,189 | ) | (7,544 | ) | (12,531 | ) | 189 | (104,881 | ) | ||||||||||||
Segregated portfolio cells dividend expense (income) | — | (3,414 | ) | — | — | — | (3,414 | ) | |||||||||||||||
Interest expense | — | — | — | (7,341 | ) | — | (7,341 | ) | |||||||||||||||
Income tax benefit (expense) | — | — | (620 | ) | (14,941 | ) | — | (15,561 | ) | ||||||||||||||
Segment operating results | $ | 43,456 | $ | 4,143 | $ | (1,984 | ) | $ | 25,357 | $ | — | $ | 70,972 | ||||||||||
Significant non-cash items: | |||||||||||||||||||||||
Depreciation and amortization | $ | 4,143 | $ | 2,869 | $ | 236 | $ | 11,255 | $ | — | $ | 18,503 | |||||||||||
* During the second quarter of 2016, ProAssurance discontinued the practice of eliminating in consolidation the portion of the management fee that was allocated to ULAE and reversed the elimination that was recorded in the first quarter of 2016. Thus, there was no management fee elimination recorded in ULAE for the 2016 six-month period. | |||||||||||||||||||||||
37
ProAssurance Corporation and Subsidiaries
Notes to Condensed Consolidated Financial Statements (Unaudited)
June 30, 2016
The following table provides detailed information regarding ProAssurance's gross premiums earned by product as well as a reconciliation to net premiums earned. All gross premiums earned are from external customers except as noted. ProAssurance's insured risks are primarily within the United States.
Three Months Ended June 30 | Six Months Ended June 30 | ||||||||||||||
(In thousands) | 2016 | 2015 | 2016 | 2015 | |||||||||||
Specialty P&C Segment | |||||||||||||||
Gross premiums earned: | |||||||||||||||
Healthcare professional liability | $ | 111,938 | $ | 115,057 | $ | 225,687 | $ | 230,887 | |||||||
Legal professional liability | 6,493 | 7,239 | 13,107 | 14,439 | |||||||||||
Medical technology liability | 8,243 | 8,685 | 16,794 | 17,657 | |||||||||||
Other | 154 | 388 | 421 | 771 | |||||||||||
Less: Ceded premiums earned | (18,702 | ) | (18,761 | ) | (37,127 | ) | (36,282 | ) | |||||||
Segment net premiums earned | 108,126 | 112,608 | 218,882 | 227,472 | |||||||||||
Workers' Compensation Segment | |||||||||||||||
Gross premiums earned: | |||||||||||||||
Traditional business | 42,193 | 43,986 | 84,844 | 85,989 | |||||||||||
Alternative market business | 18,805 | 15,885 | 37,099 | 31,615 | |||||||||||
Less: Ceded premiums earned | (5,905 | ) | (6,290 | ) | (12,467 | ) | (12,746 | ) | |||||||
Segment net premiums earned | 55,093 | 53,581 | 109,476 | 104,858 | |||||||||||
Lloyd's Syndicate Segment | |||||||||||||||
Gross premiums earned: | |||||||||||||||
Property and casualty* | 13,859 | 10,323 | 27,231 | 16,860 | |||||||||||
Less: Ceded premiums earned | (346 | ) | (1,219 | ) | (1,277 | ) | (1,998 | ) | |||||||
Segment net premiums earned | 13,513 | 9,104 | 25,954 | 14,862 | |||||||||||
Consolidated net premiums earned | $ | 176,732 | $ | 175,293 | $ | 354,312 | $ | 347,192 | |||||||
*Includes premium assumed from the Specialty P&C segment of $3.4 million and $7.0 million for the three and six months ended June 30, 2016, respectively, and $3.6 million and $7.0 million for the same respective periods of 2015.
38
ITEM 2. MANAGEMENT’S DISCUSSION AND ANALYSIS OF FINANCIAL CONDITION AND RESULTS OF OPERATIONS.
The following discussion should be read in conjunction with the Condensed Consolidated Financial Statements and Notes to those statements which accompany this report. Throughout the discussion we use certain terms and abbreviations, which can be found in the Glossary of Terms and Acronyms at the beginning of this report. In addition, a glossary of insurance terms and phrases is available on the investor section of our website. Throughout the discussion, references to "ProAssurance," "PRA," "Company," "we," "us" and "our" refer to ProAssurance Corporation and its consolidated subsidiaries. The discussion contains certain forward-looking information that involves risks and uncertainties. As discussed under the heading "Forward-Looking Statements," our actual financial condition and operating results could differ significantly from these forward-looking statements.
ProAssurance Overview
We report our results in four distinct segments based on the operational focus of the segment. Our Specialty P&C segment includes our professional liability business and our medical technology and life sciences liability business. Our Workers' Compensation segment includes workers' compensation insurance for employers, groups and associations. Our Lloyd's Syndicate segment reflects operating results from our 58% participation in Syndicate 1729. Syndicate 1729 underwrites risks over a wide range of property and casualty insurance and reinsurance lines in both the U.S. and international markets. Our Corporate segment includes our U.S. investment operations which are managed at the corporate level, non-premium revenues generated outside of our insurance entities, corporate expenses, interest and U.S. income taxes. Additional information regarding our segments is included in Note 12 of the Notes to Condensed Consolidated Financial Statements and in Part I of our 2015 Form 10-K.
Critical Accounting Estimates
Our Condensed Consolidated Financial Statements are prepared in conformity with GAAP. Preparation of these financial statements requires us to make estimates and assumptions that affect the amounts we report on those statements. We evaluate these estimates and assumptions on an ongoing basis based on current and historical developments, market conditions, industry trends and other information that we believe to be reasonable under the circumstances. There can be no assurance that actual results will conform to our estimates and assumptions; reported results of operations may be materially affected by changes in these estimates and assumptions.
Management considers the following accounting estimates to be critical because they involve significant judgment by management and the effect of those judgments could result in a material effect on our financial statements.
Reserve for Losses and Loss Adjustment Expenses
The largest component of our liabilities is our reserve for losses and loss adjustment expenses ("reserve for losses" or "reserve"), and the largest component of expense for our operations is incurred losses and loss adjustment expenses (also referred to as “losses and loss adjustment expenses,” “incurred losses,” “losses incurred,” and “losses”). Incurred losses reported in any period reflect our estimate of losses incurred related to the premiums earned in that period as well as any changes to our previous estimate of the reserve required for prior periods.
As of June 30, 2016 our reserve is almost entirely comprised of long-tail exposures. The estimation of long-tailed losses is inherently difficult and is subject to significant judgment on the part of management. Due to the nature of our claims, our loss costs, even for claims with similar characteristics, can vary significantly depending upon many factors, including but not limited to the specific characteristics of the claim and the manner in which the claim is resolved. Long-tailed insurance is characterized by the extended period of time typically required to assess the viability of a claim, potential damages, if any, and to then reach a resolution of the claim. The claims resolution process may extend to more than five years. The combination of continually changing conditions and the extended time required for claim resolution results in a loss cost estimation process that requires actuarial skill and the application of significant judgment, and such estimates require periodic modification.
Our reserve is established by management after taking into consideration a variety of factors including premium rates, claims frequency, historical paid and incurred loss development trends, the expected effect of inflation, general economic trends, the legal and political environment, and the conclusions reached by our internal and consulting actuaries. We update and review the data underlying the estimation of our reserve for losses each reporting period and make adjustments to loss estimation assumptions that we believe best reflect emerging data. Both our internal and consulting actuaries perform an in-depth review of our reserve for losses on at least a semi-annual basis using the loss and exposure data of our insurance subsidiaries.
39
Our reserving process can be broadly grouped into two areas: the establishment of the reserve for the current accident year (the initial reserve) and the re-estimation of the reserve for prior accident years (development of prior accident years).
Current Accident Year - Initial Reserve
Considerable judgment is required in establishing our initial reserve for any current accident year period, as there is limited data available upon which to base our case reserves. Our process for setting an initial reserve considers the unique characteristics of each product, but in general we rely heavily on the loss assumptions that were used to price business, as our pricing reflects our analysis of loss costs that we expect to incur relative to the insurance product being priced.
Specialty P&C Segment. Professional and medical technology liability loss costs are impacted by many factors, including but not limited to, the nature of the claim, including whether or not the claim is an individual or a mass tort claim, the personal situation of the claimant or the claimant's family, the outcome of jury trials, the legislative and judicial climate where any potential litigation may occur, general economic conditions and, for claims involving bodily injury, the trend of healthcare costs. Within our Specialty P&C segment, for our HCPL business (79% of our consolidated gross reserve for losses and loss adjustment expenses as of December 31, 2015), we set an initial reserve using the average loss ratio used in our pricing, plus an additional provision in consideration of the historical loss volatility we and others in the industry have experienced. For our HCPL business our target loss ratio during recent accident years has approximated 75% and the provision for loss volatility has ranged from 8 to 10 percentage points, producing an overall average initial loss ratio for our HCPL business of approximately 87%. The average initial loss ratio for our HCPL business has approximated 87% for recent years, which is higher than the underlying expected loss ratio and provision for volatility. The reasons for the higher loss provisions vary from period to period and have included additional loss activity within our surplus lines business, provisions for losses in excess of policy limits, adjustments to unallocated loss adjustment expenses, adjustment to the reserve for the death disability and retirement provisions in our policies and additional losses recorded for particular exposures, such as mass torts. These specific adjustments are made if we believe the results for a given accident year are likely to exceed those anticipated by our pricing. We believe use of a provision for volatility appropriately considers the inherent risks and limitations of our rate development process and the historic volatility of professional liability losses (the industry has experienced accident year loss ratios as high as 163% and as low as 53% over the past 30 years) and produces a reasonable best estimate of the reserve required to cover actual ultimate unpaid losses. A similar practice is followed for our legal professional liability business (5% of our consolidated gross reserve for losses and loss adjustment expenses as of December 31, 2015).
The risks insured in our medical technology liability business (6% of our consolidated gross reserve for losses and loss adjustment expenses as of December 31, 2015) are more varied, and policies are individually priced based on the risk characteristics of the policy and the account. These policies often have significant deductibles or self-insured retentions and the insured risks range from startup operations to large, multinational entities. Premiums are established using our most recently developed actuarial estimates of losses expected to be incurred based on factors which include: results from prior analysis of similar business, industry indications, observed trends and judgment. Claims in this line of business primarily involve bodily injury to individuals and are affected by factors similar to those of our HCPL line of business. For the medical technology liability business, we also establish an initial reserve using a loss ratio approach, including a provision in consideration of historical loss volatility that this line of business has exhibited.
Workers' Compensation Segment. Many factors affect the ultimate losses incurred for our workers' compensation coverages (9% of our consolidated gross reserve for losses and loss adjustment expenses as of December 31, 2015), including, but not limited to, the type and severity of the injury, the age and occupation of the injured worker, the estimated length of disability, medical treatment and related costs, and the jurisdiction and workers' compensation laws of the injury occurrence. We use various actuarial methodologies in developing our workers’ compensation reserve combined with a review of the exposure base generally based upon payroll of the insured. For the current accident year, given the lack of seasoned information, the different actuarial methodologies produce results with significant variability; therefore, more emphasis is placed on supplementing results from the actuarial methodologies with trends in exposure base, medical expense inflation, general inflation, severity, and claim counts, among other things, to select an expected loss ratio.
Lloyd's Syndicate Segment. Given the recent inception date for Syndicate 1729 (January 1, 2014) there is a lack of reliable historical claims data to use in establishing initial reserves for the exposures in our Lloyd's Syndicate segment. Consequently, we rely heavily on the historical claims experience of the Lloyd's market for similar risks in estimating the appropriate initial reserves for our Lloyd's Syndicate segment.
40
Development of Prior Accident Years
We re-evaluate the reserve for prior accident years each period based on our most recently available claims data and currently available industry trend information. Changes to previously established reserve estimates are recognized in the current period if management’s best estimate of ultimate losses differs from the estimate previously established. While management considers a variety of variables in determining its best estimate, in general, as claims age, our methodologies give more weight to actual loss costs which, for the majority of our reserves, continue to indicate that ultimate loss costs will be lower than our previous estimates. The discussion in our Critical Accounting Estimates section in Item 7 of our 2015 Form 10-K includes additional information regarding the methodologies used to evaluate our reserve.
Any change in our estimate of net ultimate losses for prior years is reflected in net income in the period in which such changes are made. In recent years such changes have reduced our estimate of net ultimate losses, resulting in a reduction of reported losses for the period and a corresponding increase in pre-tax income.
Due to the size of our consolidated reserve for losses and the large number of claims outstanding at any point in time, even a small percentage adjustment to our total reserve estimate could have a material effect on our results of operations for the period in which the adjustment is made.
We recognized net favorable reserve development of $36.8 million during the three months ended June 30, 2016, of which $33.0 million related to our Specialty P&C segment, $1.0 million related to our Workers' Compensation segment and $2.8 million related to our Lloyd's Syndicate segment. During the six months ended June 30, 2016, we recognized net favorable reserve development of $65.5 million, of which $60.2 million related to our Specialty P&C segment, $2.1 million related to our Workers' Compensation segment and $3.2 million related to our Lloyd's Syndicate segment. The net favorable development recognized within the Specialty P&C segment was primarily attributable to the favorable resolution of HCPL claims during the period and an evaluation of established case reserves and paid claims data that indicated that the actual severity trend associated with the remaining HCPL claims is less than we had previously estimated. Net favorable development recognized within our Workers' Compensation segment includes amortization of the purchase accounting fair value adjustment of $0.4 million and $0.8 million for the three and six months ended June 30, 2016, respectively; the remaining net favorable development of $0.6 million and $1.3 million for the three- and six-month periods, respectively, was attributable to our SPCs which are evaluated at the cell level. Because a relatively small number of claims are open per cell, the closing of claims can affect the actuarial projections for the remaining open claims in the cell to an extent that indicates development should be recognized for the cell. The net favorable development recognized within our Lloyd's Syndicate segment in 2016 is attributable to actual loss experience proving to have been better than the Lloyd's market historical averages for similar risks which were used to initially establish reserves. We did not recognize any reserve development in our Lloyd's Syndicate segment for the three and six months ended June 30, 2015.
Use of Judgment
Even though the actuarial process is highly technical, it is also highly judgmental, both as to the selection of the data used in the various actuarial methodologies (e.g., initial expected loss ratios and loss development factors) and in the interpretation of the output of the various methods used. Each actuarial method generally returns a different value and for the more recent accident years the variations among the various methodologies can be significant. For each partition of our reserves, the results of the various methods, along with the supplementary statistical data regarding such factors as closed with and without indemnity ratios, claim severity trends, the expected duration of such trends and changes in the legal and legislative environment and the current economic environment are used to develop a point estimate based upon management's judgment and past experience. The series of selected point estimates is then combined to produce an overall point estimate for ultimate losses.
Given the potential for unanticipated volatility for long-tailed lines of business, we are cautious in giving full credibility to emerging trends that, when more fully mature, may lead to the recognition of either favorable or adverse development of our losses. There may be trends, both positive and negative, reflected in the numerical data both within our own information and in the broader marketplace that mitigate or reverse as time progresses and additional data becomes available. This is particularly true for our HCPL business which has historically exhibited significant volatility as previously discussed.
HCPL. Over the past several years the most influential factor affecting the analysis of our HCPL reserves and the related development recognized has been the change, or lack thereof, in the severity of claims. The severity trend is an explicit component of our pricing models, whereas in our reserving process the severity trend's impact is implicit. Our estimate of this trend and our expectations about changes in this trend impact a variety of factors, from the selection of expected loss ratios to the ultimate point estimates established by management.
Because of the implicit and wide-ranging nature of severity trend assumptions on the loss reserving process it is not practical to specifically isolate the impact of changing severity trends. However, because severity is an explicit component of our HCPL pricing process we can better isolate the impact that changing severity can have on our loss costs and loss ratios as
41
regards our pricing models for this business component. Our current HCPL pricing models assume a severity trend of 2% to 3% in most states and products. If the severity trend were to be higher by 1 percentage point, the impact would be an increase in our expected loss ratio for this business of 3.2 percentage points, based on current claim disposition patterns. An increase in the severity trend of 3 percentage points would result in a 10.1 percentage point increase in our expected loss ratio. Due to the long-tailed nature of our claims and the previously discussed historical volatility of loss costs, selection of a severity trend assumption is a subjective process that is inherently likely to prove inaccurate over time. Given the long tail and volatility, we are generally cautious in making changes to the severity assumptions within our pricing models. Also of note is that all open claims and accident years are generally impacted by a change in the severity trend, which compounds the effect of such a change.
For the 2004 to 2009 accident years, both our internal and consulting actuaries observed an unprecedented reduction in the frequency of HCPL claims (or number of claims per exposure unit) that cannot be attributed to any single factor. Since 2009, claim frequency has been relatively constant, at a lower level than had historically existed. For a number of years, we believed that much of the reduction in claim frequency was the result of a decline in the filing of non-meritorious lawsuits that had historically been dismissed or otherwise resulted in no payment of indemnity on behalf of our insureds. With fewer non-meritorious claims being filed we expected that the claims that were filed had the potential for greater average losses, or greater severity. To date, however, this effect has not materialized to the extent we anticipated. The uncertainty as to the impact this decline in frequency might ultimately have on the average cost of claims complicated the selection of an appropriate severity trend for our pricing model for these lines. It also made it more challenging to factor severity into the various actuarial methodologies we use to evaluate our reserve. Based on the weighted average of payments, typically 91% of our HCPL claims are resolved after eight years for a given accident year.
Although we remain uncertain regarding the ultimate severity trend to project into the future due to the long-tailed nature of our business, we have given consideration to observed loss costs in setting our rates. For our HCPL business this practice has resulted in rate reductions in recent years. For example, on average, excluding our podiatry business acquired in 2009, we have gradually reduced the premium rates we charge on our standard physician renewal business (our largest HCPL line) by approximately 17% from the beginning of 2006 to June 30, 2016. Loss ratios for the current accident years have thus remained fairly constant because expected loss reductions have been reflected in our rates.
Workers' Compensation. The projection of changes in claim severity trend has not historically been an influential factor affecting our workers' compensation analysis of reserves, as claims are typically resolved more quickly than the industry norm. As previously mentioned, the determination and calculation of loss development factors requires considerable judgment. In particular the selection of tail factors, used to extend the projection of losses beyond historical data, requires considerable judgment. These factors are determined in the absence of direct loss development history and thus require reliance upon industry data which may not be representative of the Company’s data and experience.
Investment Valuations
We record the majority of our investments at fair value as shown in the table below. At June 30, 2016 the distribution of our investments based on GAAP fair value hierarchies (levels) was as follows:
Distribution by GAAP Fair Value Hierarchy | |||||||||
Level 1 | Level 2 | Level 3 | Not Categorized | Total Investments | |||||
Investments recorded at: | |||||||||
Fair value | 14% | 74% | 1% | 4% | 93% | ||||
Other valuations | 7% | ||||||||
Total Investments | 100% | ||||||||
Fair value is defined as the price that would be received to sell an asset or paid to transfer a liability in an orderly transaction between market participants at the measurement date. All of our fixed maturity and equity security investments are carried at fair value. Our short-term securities are carried at amortized cost, which approximates fair value.
Because of the number of securities we own and the complexity of developing accurate fair values, we utilize multiple independent pricing services to assist us in establishing the fair value of individual securities. The pricing services provide fair values based on exchange traded prices, if available. If an exchange traded price is not available, the pricing services, if possible, provide a fair value that is based on multiple broker/dealer quotes or that has been developed using pricing models. Pricing models vary by asset class and utilize currently available market data for securities comparable to ours to estimate a fair value for our security. The pricing services scrutinize market data for consistency with other relevant market information before including the data in the pricing models. The pricing services disclose the types of pricing models used and the inputs used for each asset class. Determining fair values using these pricing models requires the use of judgment to identify appropriate comparable securities and to choose a valuation methodology that is appropriate for the asset class and available data.
42
The pricing services provide a single value per instrument quoted. We review the values provided for reasonableness each quarter by comparing market yields generated by the supplied value versus market yields observed in the market place. We also compare yields indicated by the provided values to appropriate benchmark yields and review for values that are unchanged or that reflect an unanticipated variation as compared to prior period values. We utilize a primary pricing service for each security type and compare provided information for consistency with alternate pricing services, known market data and information from our own trades, considering both values and valuation trends. We also review weekly trades versus the prices supplied by the services. If a supplied value appears unreasonable, we discuss the valuation in question with the pricing service and make adjustments if deemed necessary. To date, our review has not resulted in any changes to the values supplied by the pricing services. The pricing services do not provide a fair value unless an exchange traded price or multiple observable inputs are available. As a result, the pricing services may provide a fair value for a security in some periods but not others, depending upon the level of recent market activity for the security or comparable securities.
Level 1 Investments
Fair values for a majority of our equity securities and portions of our corporate debt, short-term and convertible securities are determined using exchange traded prices. There is little judgment involved when fair value is determined using an exchange traded price. In accordance with GAAP, for disclosure purposes we classify securities valued using an exchange traded price as Level 1 securities.
Level 2 Investments
Most fixed income securities do not trade daily, and thus exchange traded prices are generally not available for these securities. However, market information (often referred to as observable inputs or market data, including but not limited to, last reported trade, non-binding broker quotes, bids, benchmark yield curves, issuer spreads, two sided markets, benchmark securities, offers and recent data regarding assumed prepayment speeds, cash flow and loan performance data) is available for most of our fixed income securities. We determine fair value for a large portion of our fixed income securities using available market information. In accordance with GAAP, for disclosure purposes we classify securities valued based on multiple market observable inputs as Level 2 securities.
Level 3 Investments
When a pricing service does not provide a value for one of our fixed maturity securities, management estimates fair value using either a single non-binding broker quote or pricing models that utilize market based assumptions which have limited observable inputs. The process involves significant judgment in selecting the appropriate data and modeling techniques to use in the valuation process. For disclosure purposes we classify securities valued using limited observable inputs as Level 3 securities.
Fair Values Not Categorized
We hold interests in certain LPs/LLCs that are investment funds which measure fund assets at fair value on a recurring basis and provide us with a NAV for our interest. As a practical expedient, we consider the NAV provided to approximate the fair value of the interest. In accordance with GAAP, we do not categorize these investments within the fair value hierarchy.
43
Investments - Other Valuation Methodologies
Certain of our investments, in accordance with GAAP for the type of investment, are measured using methodologies other than fair value. At June 30, 2016 these investments represented approximately 7% of total investments and are detailed in the following table. Additional information about these investments is provided in Notes 2 and 3 of the Notes to Condensed Consolidated Financial Statements.
(In millions) | Carrying Value | GAAP Measurement Method | |||
Other investments: | |||||
Investments in LPs | $ | 46.9 | Cost | ||
Other, principally FHLB capital stock | 3.6 | Cost | |||
50.5 | |||||
Investment in unconsolidated subsidiaries: | |||||
Investments in tax credit partnerships | 124.5 | Equity | |||
Equity method LPs/LLCs | 21.7 | Equity | |||
146.2 | |||||
BOLI | 58.1 | Cash surrender value | |||
Total investments - Other valuation methodologies | $ | 254.8 | |||
Investment Impairments
We evaluate our investments on at least a quarterly basis for declines in fair value that represent OTTI. We consider an impairment to be an OTTI if we intend to sell the security or if we believe we will be required to sell the security before we fully recover the amortized cost basis of the security. Otherwise, we consider various factors in our evaluation, as discussed below.
For debt securities, we consider whether we expect to fully recover the amortized cost basis of the security, based upon consideration of some or all of the following:
• | third party research and credit rating reports; |
• | the current credit standing of the issuer, including credit rating downgrades; |
• | the extent to which the decline in fair value is attributable to credit risk specifically associated with the security or its issuer; |
• | our internal assessments and those of our external portfolio managers regarding specific circumstances surrounding a security, which can cause us to believe the security is more or less likely to recover its value than other securities with a similar structure; |
• | for asset-backed securities, the origination date of the underlying loans, the remaining average life, the probability that credit performance of the underlying loans will deteriorate in the future, and our assessment of the quality of the collateral underlying the loan; |
• | failure of the issuer of the security to make scheduled interest or principal payments; |
• | any changes to the rating of the security by a rating agency; and |
• | recoveries or additional declines in fair value subsequent to the balance sheet date. |
In assessing whether we expect to recover the cost basis of debt securities, particularly asset-backed securities, we must make a number of assumptions regarding the cash flows that we expect to receive from the security in future periods. These judgments are subjective in nature and may subsequently be proved to be inaccurate.
We evaluate our cost method interests in LPs/LLCs for OTTI by considering whether there has been a decline in fair value below the recorded value, which involves assumptions and estimates. We receive a report from each of the LPs/LLCs at least quarterly which provides us a NAV for our interest. The NAV is based on the fair values of securities held by the LP/LLC as determined by the LP/LLC manager. We consider the most recent NAV provided, the performance of the LP/LLC relative to the market, the stated objectives of the LP/LLC, the cash flows expected from the LP/LLC and audited financial statements of the entity, if available, in considering whether an OTTI exists.
Our investments in tax credit partnerships are evaluated for OTTI by considering both qualitative and quantitative factors which include: whether cash flows, primarily tax benefits, currently expected from the investment equal or exceed the carrying value of the investment, whether currently expected cash flows are less than those expected at the time the investment was acquired, and our ability and intent to hold the investment until the recovery of its carrying value.
44
We also evaluate our holdings of FHLB securities for impairment. We consider the current capital status of the FHLB, whether the FHLB is in compliance with regulatory minimum capital requirements, and the FHLB’s most recently reported operating results.
Deferred Policy Acquisition Costs
Policy acquisition costs (primarily commissions, premium taxes and underwriting salaries) which are directly related to the successful acquisition of new and renewal premiums are capitalized as DPAC and charged to expense, net of ceding commissions earned, as the related premium revenue is recognized. We evaluate the recoverability of our DPAC at the segment level each reporting period, and any amounts estimated to be unrecoverable are charged to expense in the current period. As of June 30, 2016 we have not determined that any amounts are unrecoverable.
Estimation of Taxes / Tax Credits
For interim periods, we determine our provision for income taxes based on our current estimate of our annual effective tax rate. Items which are unusual, infrequent, or that cannot be reliably estimated are considered in the effective tax rate in the period in which the item is included in income. In calculating our estimated annual effective tax rate, we include the estimated benefit of tax credits for the annual period based on the most recently available information provided by the tax credit partnership; the actual amounts of credits provided by the tax credit partnerships may prove to be different than our estimates. The effect of such differences is recognized in the period identified.
Deferred Taxes
Deferred federal income taxes arise from the recognition of temporary differences between the bases of assets and liabilities determined for financial reporting purposes and the bases determined for income tax purposes. Our temporary differences principally relate to our loss reserve, unearned premiums, compensation recognition, deferred policy acquisition costs, unrealized investment gains (losses), intangibles, and basis differences on investment assets. Deferred tax assets and liabilities are measured using the enacted tax rates expected to be in effect when such benefits are realized. We review our deferred tax assets quarterly for impairment. If we determine that it is more likely than not that some or all of a deferred tax asset will not be realized, a valuation allowance is recorded to reduce the carrying value of the asset. In assessing the need for a valuation allowance, management is required to make certain judgments and assumptions about our future operations based on historical experience and information as of the measurement period regarding reversal of existing temporary differences, carryback capacity, future taxable income (including its capital and operating characteristics) and tax planning strategies.
Unrecognized Tax Benefits
We evaluate tax positions taken on tax returns and recognize positions in our financial statements when it is more likely than not that we will sustain the position upon resolution with a taxing authority. If recognized, the benefit is measured as the largest amount of benefit that has a greater than fifty percent probability of being realized. We review uncertain tax positions each period, considering changes in facts and circumstances, such as changes in tax law, interactions with taxing authorities and developments in case law, and make adjustments as we consider necessary. Adjustments to our unrecognized tax benefits may affect our income tax expense, and settlement of uncertain tax positions may require the use of cash. No significant adjustments were considered necessary during the first six months of 2016 or 2015. At June 30, 2016, our liability for unrecognized tax benefits approximated $8.4 million.
Goodwill
We review goodwill for impairment annually on October 1 and whenever events or changes in circumstances indicate the carrying amount of goodwill may not be recoverable. Goodwill is tested for impairment at the reporting unit level. Our reporting units are consistent with the reportable segments identified in Note 12 of the Notes to Condensed Consolidated Financial Statements. Of the four reporting units, two have goodwill - Specialty P&C and Workers' Compensation. As of October 1, 2015, we performed a quantitative goodwill impairment test for both the Specialty P&C and Workers' Compensation units. As of October 1, 2015 fair values for both the Specialty P&C and Workers' Compensation reporting units exceeded the carrying amounts, and no goodwill impairment was recorded. There have been no events or changes in circumstances since that evaluation date that would indicate the carrying amount of goodwill is not recoverable. Additional information regarding our goodwill evaluation at the segment level is included in Note 1 of the Notes to Consolidated Financial Statements included in ProAssurance's December 31, 2015 Form 10-K.
45
Intangibles
Intangible assets with definite lives are amortized over the estimated useful life of the asset. Amortizable intangible assets primarily consist of agency and policyholder relationships, renewal rights and trade names. Intangible assets with an indefinite life, primarily state licenses, are not amortized. Intangible assets are evaluated for impairment on an annual basis. Additional information regarding intangible assets is included in Note 1 of the Notes to Consolidated Financial Statements included in ProAssurance's December 31, 2015 Form 10-K.
Audit Premium
Workers’ compensation premiums are determined based upon the payroll of the insured, applicable premium rates and an experience based modification factor, where applicable. An audit of the policyholders’ records is conducted after policy expiration to make a final determination of applicable premiums. Audit premium due from or due to a policyholder as a result of an audit is reflected in net premiums written and earned when billed. We track, by policy, the amount of additional premium billed in final audit invoices as a percentage of payroll exposure and use this information to estimate the probable additional amount of EBUB premium as of the balance sheet date. We include changes to the EBUB premium estimate in net premiums written and earned in the period recognized.
Accounting Changes
We are not aware of any accounting changes not yet adopted as of June 30, 2016 that would have a material effect on our results of operations or financial position. Note 1 of the Notes to Condensed Consolidated Financial Statements provides additional detail regarding accounting changes.
46
Liquidity and Capital Resources and Financial Condition
Overview
ProAssurance Corporation is a holding company and is a legal entity separate and distinct from its subsidiaries. The holding company has no substantial external revenues other than its investment revenues, and dividends from its operating subsidiaries represent a significant source of funds for its obligations, including debt service and shareholder dividends. At June 30, 2016, we held cash and liquid investments of approximately $255 million outside our insurance subsidiaries that were available for use without regulatory approval or other restriction. Our holding company also has an additional $100 million in permitted borrowings under its Revolving Credit Agreement, and an accordion feature, which if subscribed successfully, would allow another $50 million in available funds as discussed in this section under the heading "Debt."
To date, during 2016, our insurance subsidiaries have paid dividends to us of approximately $94 million, which included extraordinary dividends of $50 million. In the aggregate, our domestic insurance subsidiaries have available and intend to pay dividends of approximately $100 million over the remainder of 2016 without the prior approval of state insurance regulators. The payment of any dividend requires prior notice to the insurance regulator in the state of domicile, and the regulator may reduce or prevent the dividend if, in its judgment, payment of the dividend would have an adverse effect on the surplus of the insurance subsidiary. We make the decision to pay dividends from an insurance subsidiary based on the capital needs of that subsidiary, and may pay less than the permitted dividend or may also request permission to pay an additional amount (an extraordinary dividend).
Operating Activities and Related Cash Flows
The principal components of our operating cash flows are the excess of premiums collected and net investment income over losses paid and operating costs, including income taxes. Timing delays exist between the collection of premiums and the payment of losses associated with the premiums. Premiums are generally collected within the twelve-month period after the policy is written, while our claim payments are generally paid over a more extended period of time. Likewise, timing delays exist between the payment of claims and the collection of any associated reinsurance recoveries.
Operating cash flows compare as follows:
Six Months Ended June 30 | |||||||
(In millions) | 2016 | 2015 | |||||
Cash provided by operating activities | $ | 86.2 | $ | 53.8 | |||
Change in Operating Cash Flows | 2016 vs 2015 | 2015 vs 2014 | |||||
Cash provided by operating activities, prior year | $ | 53.8 | $ | 29.1 | |||
Increase (decrease) in operating cash flows attributable to: | |||||||
Premium receipts | (2.0 | ) | 7.3 | ||||
Payments to reinsurers | 1.0 | 6.0 | |||||
Losses paid, net of reinsurance recoveries | 14.8 | (2.7 | ) | ||||
Cash received from investments | (6.6 | ) | (7.1 | ) | |||
Cash paid for other expenses | (0.2 | ) | (4.3 | ) | |||
Federal and state income tax payments | 33.1 | 11.8 | |||||
Cash flows produced by Lloyd's Syndicate operations | (8.5 | ) | 11.6 | ||||
Other amounts not individually significant, net | 0.8 | 2.1 | |||||
Cash provided by operating activities, current year | $ | 86.2 | $ | 53.8 | |||
Premium receipts. The decrease in premium receipts for 2016 as compared to 2015 reflects lower premium volume in 2016 for our Specialty P&C segment largely offset by higher volume in the Workers' Compensation segment. The increase in premium receipts for 2015 was primarily attributable to higher premium volume as compared to 2014, primarily within our Workers' Compensation segment, which more than offset the decline in our Specialty P&C segment.
47
Payments to reinsurers. Our reinsurance contracts generally cover policies written during the term of the agreement (usually one year), and are settled periodically over a number of years as claims covered by the contract are resolved. Some contracts require annual settlements while others require settlement only after a number of years have elapsed, thus the amounts paid can vary widely from period to period.
Payments to reinsurers (increased) decreased as compared to the prior period as shown below:
Six Months Ended June 30 | |||||||
(In millions) | 2016 vs 2015 | 2015 vs 2014 | |||||
Change in payments to reinsurers, exclusive of Syndicate 1729 | $ | 1.0 | $ | 9.3 | |||
Change in reinsurance paid to Syndicate 1729 | — | (3.3 | ) | ||||
$ | 1.0 | $ | 6.0 | ||||
Exclusive of the effect of our quota share reinsurance agreement with Syndicate 1729, payments to reinsurers decreased in 2016 as compared to 2015 and also decreased in 2015 as compared to 2014. Cash flows resulting from premium adjustments on our excess of loss reinsurance arrangements can vary widely as the estimated premium owed under these arrangements changes over time, with some settlements resulting in the receipt of cash and others resulting in cash disbursements. We received cash from settlements on our excess of loss reinsurance arrangements in both 2016 and 2015, but the cash received was greater in 2016 than in 2015. This was offset to an extent by higher payments made in 2016 relative to our shared risk reinsurance arrangements. In 2015 payments to reinsurers, exclusive of the effect of our quota share reinsurance agreement with Syndicate 1729, decreased as compared to 2014 primarily due to cash receipts from settlements of our excess of loss reinsurance arrangements as compared to cash disbursements in the prior year.
Payments to Syndicate 1729 were flat in 2016 as compared to 2015 and increased in 2015 as compared to 2014 due to 2014 being the initial period of the agreement. Net operating cash flows of our Syndicate 1729 operations reflects the receipt of these payments, but are reported pro rata (58%) and on a one quarter delay.
Losses paid, net of reinsurance recoveries. The timing of our net loss payments varies from period to period because the process for resolving claims is complex and occurs at an uneven pace depending upon the circumstances of the individual claim.
Six Months Ended June 30 | |||||||
(In millions) | 2016 vs 2015 | 2015 vs 2014 | |||||
(Increase) decrease change in losses paid | $ | (5.1 | ) | $ | (5.8 | ) | |
Increase (decrease) change in reinsurance recoveries | 3.9 | 3.1 | |||||
Cash received, Syndicate 1729 commutation | 16.0 | — | |||||
$ | 14.8 | $ | (2.7 | ) | |||
During 2016 we commuted the 2014 calendar year quota share reinsurance arrangement between our Specialty P&C segment and Syndicate 1729 which resulted in a cash receipt from Syndicate 1729. Our pro rata (58%) share of the cash payment by Syndicate 1729 is reflected as a cash outflow of $9.2 million in the operating cash flows of the Lloyd's Syndicate operations shown below.
Cash received from investments. Receipts from fixed income securities have declined due to a smaller fixed income portfolio. Also, the timing of dividend receipts and income distributions from our investment LPs/LLCs is uneven.
Cash paid for other expenses. The decrease in cash paid for other expenses in 2016 as compared to 2015 and for 2015 as compared to 2014 both reflect shifts in the timing of certain other expense payments.
48
Federal and state income tax payments. Net tax payments (increased) decreased as compared to the prior period as shown below:
Six Months Ended June 30 | |||||||
(In millions) | 2016 vs 2015 | 2015 vs 2014 | |||||
Change in amount of tax payments made for the prior tax year | $ | 4.0 | $ | (3.0 | ) | ||
Change in amount of estimated tax payments for the current tax year | 18.0 | 12.0 | |||||
Change in amount of excess tax benefits associated with share-based compensation | (0.3 | ) | 1.2 | ||||
Refunds related to prior tax periods | 11.1 | 1.6 | |||||
Change in other tax payments | 0.3 | — | |||||
$ | 33.1 | $ | 11.8 | ||||
Refunds received in 2016 include a $15 million refund for the 2015 tax year, due to estimated tax payments exceeding the final tax liability for the period.
Cash flows produced by Lloyd's Syndicate Operations. This represents our 58% share of Syndicate 1729 operating cash flows, reported on a one quarter delay. Cash flows decreased for 2016 as compared to 2015 primarily due to commutation of the 2014 quota share reinsurance agreement with the Specialty P&C segment as previously discussed. The large increase in operating cash flows in 2015 as compared to 2014 is due to the 2014 period reflecting only the initial quarter of Syndicate 1729 business operations.
49
Reinsurance
Within our Specialty P&C segment, we use insurance and reinsurance (collectively, “reinsurance”) to provide capacity to write larger limits of liability, to provide reimbursement for losses incurred under the higher limit coverages we offer and to provide protection against losses in excess of policy limits. We also have a quota share arrangement with Syndicate 1729 established to provide an initial premium base for Syndicate 1729. Within our Workers' Compensation segment, we use reinsurance to reduce our net liability on individual risks, to mitigate the effect of significant loss occurrences (including catastrophic events), to stabilize underwriting results, and to increase underwriting capacity by decreasing leverage. In both the Specialty P&C and Workers' Compensation segments, we use reinsurance in risk sharing arrangements, to align our objectives with those of our strategic business partners and to provide custom insurance solutions for large customer groups. The purchase of reinsurance does not relieve us from the ultimate risk on our policies, but it does provide reimbursement for certain losses we pay. We pay our reinsurers a premium in exchange for reinsurance of the risk. For our excess of loss arrangements, the premium due to the reinsurer is determined by the loss experience of the business reinsured, subject to certain minimum and maximum amounts. Until all loss amounts are known, we estimate the premium due to the reinsurer. Changes to the estimate of premium owed under reinsurance agreements related to prior periods are recorded in the period in which the change in estimate occurs and can have a significant effect on net premiums earned.
We generally reinsure risks under treaties (our excess of loss reinsurance arrangements) pursuant to which the reinsurers agree to assume all or a portion of all risks that we insure above our individual risk retention levels, up to the maximum individual limits offered. These arrangements are negotiated and renewed annually. Renewal dates for our healthcare professional liability, legal professional liability, medical technology liability and workers' compensation treaties are October 1, June 1, January 1 and May 1, respectively. As of October 1, 2015 our professional liability treaty renewed with more favorable terms and pricing than the previous agreement. Our medical technology liability treaty also renewed at a more favorable rate than the previous agreement. Our workers' compensation treaty renewed in 2016 at a slightly higher rate than the previous agreement. The significant terms of our excess of loss reinsurance arrangements are detailed in the following table.
Excess of Loss Reinsurance Agreements
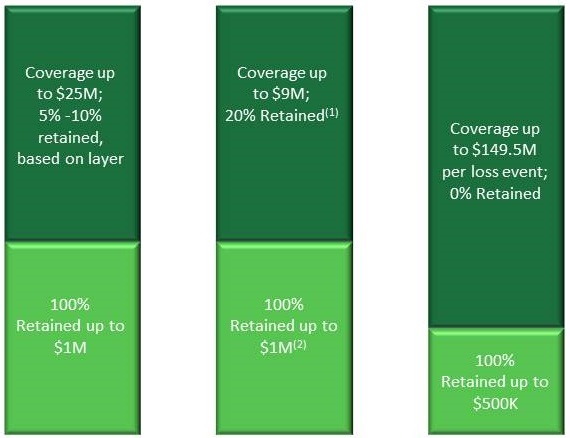
Professional Liability | Medical Technology & Life Sciences Products | Workers' Compensation - Traditional | |||
(1) Historically, retention has ranged from 5% to 32.5%.
(2) Historically, retention has been as high as $2M.
50
Large professional liability risks that are above the limits of our basic reinsurance treaties are reinsured on a facultative basis, whereby the reinsurer agrees to insure a particular risk up to a designated limit. We also have in place a number of risk sharing arrangements that apply to the first $1 million of losses for certain large healthcare systems and other insurance entities and with certain insurance agencies that produce business for us.
During the three and six months ended June 30, 2016, we wrote workers' compensation policies in our alternative market business generating premium of approximately $13.9 million and $36.6 million, respectively, under custom programs whereby the policies written are fully reinsured under 100% quota share agreements to the SPCs of our wholly owned subsidiary, Eastern Re, domiciled in the Cayman Islands, net of a ceding commission. The remaining premium written in our alternative market business of $1.1 million and $4.8 million for the 2016 three- and six-month periods is 100% ceded to unaffiliated captive insurers.
Each SPC has preferred shareholders and the underwriting profit or loss of each cell accrues fully to these preferred shareholders. We participate as a preferred shareholder in certain SPCs. Our ownership interest in the SPCs for which we participate is as low as 25% and as high as 77.5%.
Each SPC has in place its own reinsurance arrangements, which are illustrated in the table below.
Workers' Compensation Segregated Portfolio Cell Reinsurance
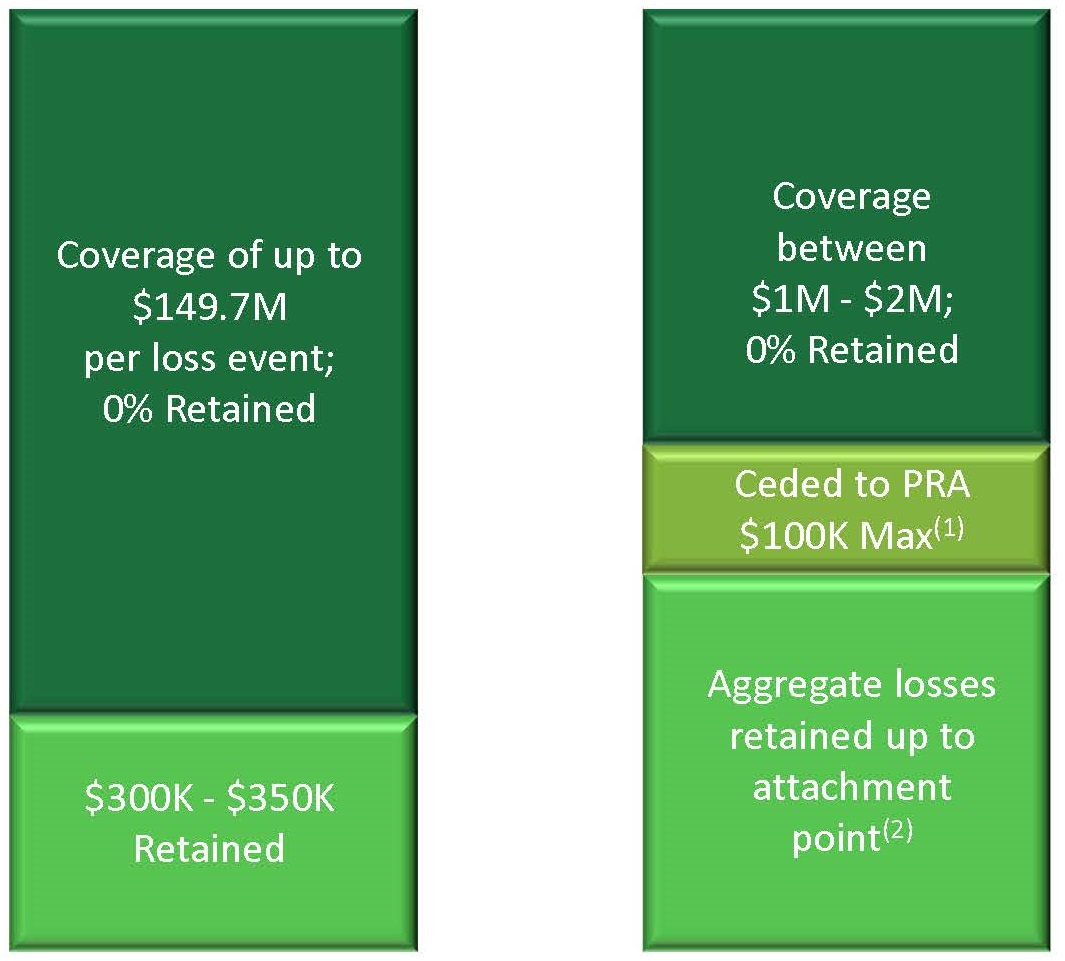
Per Occurrence Coverage | Aggregate Coverage | |
(1) ProAssurance assumes 100% of aggregate losses in excess of an aggregate attachment point with a maximum loss limit of $100K.
(2) The attachment point is based on a percentage of premium (average is 89%) and varies by cell.
Each SPC maintains a loss fund initially equal to the difference between premium assumed by the cell and the ceding commission. The external owners of each cell provide a letter of credit to us that is equal to the difference between the loss fund of the SPC (amount of funds available to pay losses after deduction of ceding commission) and the aggregate attachment point of the reinsurance.
Within our Lloyd's Syndicate segment, Syndicate 1729 purchases reinsurance to limit its liability on individual risks and to protect against catastrophic loss. The level of reinsurance that the Syndicate purchases is dependent on a number of factors, including its underwriting risk appetite for catastrophic exposure, the specific risks inherent in each line or class of business written and the pricing, coverage and terms and conditions available from the reinsurance market. Both quota share reinsurance and excess of loss reinsurance are utilized to manage the net loss exposure. The Syndicate may still be exposed to loss that exceeds the level of reinsurance purchased, as well as to reinstatement premiums triggered by losses exceeding specified levels.
51
For all of our segments, we make a determination of the amount of insurance risk we choose to retain based upon numerous factors, including our risk tolerance and the capital we have to support it, the price and availability of reinsurance, the volume of business, our level of experience with a particular set of claims and our analysis of the potential underwriting results. We purchase excess of loss reinsurance to limit the amount of risk we retain and we do so from a number of companies to mitigate concentrations of credit risk. We utilize reinsurance brokers to assist us in the placement of these reinsurance programs and in the analysis of the credit quality of our reinsurers. The determination of which reinsurers we choose to do business with is based upon an evaluation of their then-current financial strength, rating and stability. However, the financial strength of our reinsurers, and their corresponding ability to pay us, may change in the future due to forces or events we cannot control or anticipate.
Litigation
We are involved in various legal actions related to insurance policies and claims handling including, but not limited to, claims asserted against us by policyholders. These types of legal actions arise in the ordinary course of business and, in accordance with GAAP for insurance entities, are generally considered as a part of our loss reserving process, which is described in detail in our Critical Accounting Estimates section under the heading "Reserve for Losses and Loss Adjustment Expenses." We also have other direct actions against the Company unrelated to our claims activity which we evaluate and account for as a part of our other liabilities. For these corporate legal actions, we evaluate each case separately and establish what we believe is an appropriate reserve based on GAAP guidance related to contingent liabilities. As of June 30, 2016 there were no material reserves established for corporate legal actions.
52
Investing Activities and Related Cash Flows
Our investments at June 30, 2016 and December 31, 2015 are comprised as follows:
June 30, 2016 | December 31, 2015 | ||||||||||
($ in thousands) | Carrying Value | % of Total Investment | Carrying Value | % of Total Investment | |||||||
Fixed Maturities, Available for Sale | |||||||||||
U.S. Treasury obligations | $ | 140,660 | 4 | % | $ | 123,892 | 3 | % | |||
U.S. Government-sponsored enterprise obligations | 30,871 | 1 | % | 26,334 | 1 | % | |||||
State and municipal bonds | 911,762 | 24 | % | 940,635 | 26 | % | |||||
Corporate debt | 1,325,900 | 35 | % | 1,291,686 | 35 | % | |||||
Residential mortgage-backed securities | 241,428 | 6 | % | 238,387 | 7 | % | |||||
Commercial mortgage-backed securities | 37,117 | 1 | % | 41,133 | 1 | % | |||||
Other asset-backed securities | 99,523 | 2 | % | 98,220 | 3 | % | |||||
Total fixed maturities securities, available for sale | 2,787,261 | 73 | % | 2,760,287 | 76 | % | |||||
Equity securities, trading | 351,348 | 9 | % | 322,353 | 9 | % | |||||
Short-term investments | 206,753 | 5 | % | 119,236 | 3 | % | |||||
BOLI | 58,111 | 2 | % | 57,213 | 2 | % | |||||
Investment in unconsolidated subsidiaries | 332,403 | 9 | % | 311,908 | 9 | % | |||||
Other investments | 80,719 | 2 | % | 79,133 | 1 | % | |||||
Total Investments | $ | 3,816,595 | 100 | % | $ | 3,650,130 | 100 | % | |||
The distribution of our investments in fixed-maturity securities by rating were as follows:
($ in thousands) | June 30, 2016 | December 31, 2015 | |||||||||
Rating | Carrying Value | % of Fixed Maturities | Carrying Value | % of Fixed Maturities | |||||||
AAA | $ | 715,162 | 25 | % | $ | 688,449 | 25 | % | |||
AA+ | 239,482 | 8 | % | 224,956 | 8 | % | |||||
AA | 251,722 | 9 | % | 264,137 | 10 | % | |||||
AA- | 265,594 | 10 | % | 272,304 | 10 | % | |||||
A+ | 267,735 | 10 | % | 270,140 | 10 | % | |||||
A | 303,468 | 11 | % | 320,424 | 12 | % | |||||
A- | 243,953 | 9 | % | 244,083 | 9 | % | |||||
BBB+ | 132,404 | 5 | % | 133,778 | 5 | % | |||||
BBB | 111,775 | 4 | % | 115,902 | 4 | % | |||||
BBB- | 52,453 | 2 | % | 46,892 | 2 | % | |||||
Below investment grade | 159,361 | 5 | % | 156,928 | 4 | % | |||||
Not rated | 44,152 | 2 | % | 22,294 | 1 | % | |||||
Total | $ | 2,787,261 | 100 | % | $ | 2,760,287 | 100 | % | |||
A detailed listing of our investment holdings as of June 30, 2016 is located under the Financial Information header on the Investor Relations page of our website which can be reached directly at www.proassurance.com/investorrelations/supplemental.aspx, or through links from the Investor Relations section of our website, Investor.Proassurance.com.
We manage our investments to ensure that we will have sufficient liquidity to meet our obligations, taking into consideration the timing of cash flows from our investments, including interest payments, dividends and principal payments, as well as the expected cash flows to be generated by our operations. In addition to the interest and dividends we will receive, we anticipate that between $40 million and $90 million of our investments will mature (or be paid down) each quarter over the next twelve months and become available, if needed, to meet our cash flow requirements. The primary outflow of cash at our insurance subsidiaries is related to paid losses and operating costs, including income taxes. The payment of individual claims
53
cannot be predicted with certainty; therefore, we rely upon the history of paid claims in estimating the timing of future claims payments. To the extent that we may have an unanticipated shortfall in cash we may either liquidate securities or borrow funds under existing borrowing arrangements through our credit facility and the FHLB system. Currently, $150 million could be made available for use through our credit facility, as discussed in this section under the heading "Debt." Given the duration of our investments, we do not foresee a shortfall that would require us to meet operating cash needs through additional borrowings. Additional information regarding the credit facility is detailed in Note 8 of the Notes to Condensed Consolidated Financial Statements.
As discussed in Note 3 of the Notes to Condensed Consolidated Financial Statements, our fixed maturity and short-term investments include securities deposited with Lloyd's in order to meet our FAL requirement. At June 30, 2016 securities on deposit with Lloyd's included fixed maturities having a fair value of $95.9 million and short-term investments with a fair value of $1.4 million.
Our investment portfolio continues to be primarily composed of high quality fixed income securities with approximately 93% of our fixed maturities being investment grade securities as determined by national rating agencies. The weighted average effective duration of our fixed maturity securities at June 30, 2016 was 3.38 years; the weighted average effective duration of our fixed maturity securities combined with our short-term securities was 3.14 years.
The carrying value and unfunded commitments for certain of our investments are the following:
Carrying Value | June 30, 2016 | ||||||||||
($ in millions, except expected funding period) | June 30, 2016 | December 31, 2015 | Unfunded Commitment | Expected funding period in years | |||||||
Qualified affordable housing project tax credit partnerships (1) | $ | 114.1 | $ | 121.6 | $ | 1.5 | 6 | ||||
Historic tax credit partnerships (2) | 10.4 | 8.4 | 9.5 | 1 | |||||||
Investment fund LPs/LLCs (2) | 254.8 | 227.0 | 82.4 | 5 | |||||||
Total | $ | 379.3 | $ | 357.0 | $ | 93.4 | |||||
(1) The carrying value reflects our total commitments (both funded and unfunded) to the partnerships, less amortization, since our initial investment. We fund these investments based on funding schedules maintained by the partnerships. | |||||||||||
(2) The carrying value reflects our funded commitments less amortization. | |||||||||||
Investment fund LPs/LLCs are by nature less liquid and may involve more risk than other investments. We manage our risk through diversification of asset class and geographic location. At June 30, 2016, we had investments in 21 separate investment funds with a total carrying value of $254.8 million (7% of our total investments). We review and monitor the performance of these investments on a quarterly basis.
Energy Sector Exposures
Our total energy related exposures approximated $211.6 million (approximately 6% of invested assets) at June 30, 2016. Our energy-related debt securities at June 30, 2016 included investments of $150.2 million (of which approximately $26.9 million is below investment grade). We believe those in the energy sector could have the most volatility and potential for future impairments based upon petroleum and petroleum product prices. At June 30, 2016, approximately 99% of our energy-related debt securities were rated; the average rating was BBB+. In addition, we held a $23.7 million investment in a mid-stream focused energy infrastructure limited partnership, which was impaired by $3.1 million in the first quarter 2016, $37.5 million of energy related, dividend-paying blue chip stocks and MLPs and $0.3 million of other energy related investments. We will continue to monitor developments within the energy sector and the credit risk associated with energy companies within our investment portfolio using publicly available financial and rating agency data.
Financing Activities and Related Cash Flows
Treasury Shares
We repurchased approximately 44,500 common shares, having a total cost of approximately $2.1 million, during the six months ended June 30, 2016 (including approximately 16,800 shares at a total cost of $0.8 million during the three months ended June 30, 2016). During the six months ended June 30, 2015 we repurchased approximately 2.7 million shares, having a total cost of approximately $123.3 million (including approximately 1.5 million shares at a total cost of $66.1 million during the three months ended June 30, 2015). We did not repurchase any common shares subsequent to June 30, 2016 and as of July 31, 2016 our remaining Board authorization was approximately $109.6 million.
54
Shareholder Dividends
Our Board of Directors declared quarterly cash dividends of $0.31 per share during the first and second quarters of both 2016 and 2015, each of which was paid in the following quarter. Dividends paid during the first six months of 2016 and 2015 included the dividends declared in the first quarter of the current year as well as the quarterly and special dividends declared in the fourth quarter of the prior year. Any decision to pay future cash dividends is subject to the Board’s final determination after a comprehensive review of financial performance, future expectations and other factors deemed relevant by the Board.
Debt
At June 30, 2016 our debt included $250 million of outstanding unsecured senior notes. The notes bear interest at 5.3% annually and are due in 2023 although they may be redeemed in whole or part prior to maturity. There are no financial covenants associated with these notes.
We have available a Revolving Credit Agreement which may be used for general corporate purposes, including, but not limited to, short-term working capital, share repurchases as authorized by the Board, and support for other activities we enter into in the normal course of business. Our Revolving Credit Agreement permits borrowings of up to $200 million, and has available a $50 million accordion feature, which, if successfully subscribed, would expand permitted borrowings up to $250 million. At June 30, 2016 we had borrowed $100 million under the Revolving Credit Agreement, on a fully secured basis. Our outstanding borrowing is repayable or renewable in October 2016, and repayment can be deferred until expiration of the Revolving Credit Agreement in June 2020. We are in compliance with the financial covenants of the Agreement.
Additional information regarding our debt is provided in Note 8 of the Notes to Condensed Consolidated Financial Statements.
We are a member of a number of FHLBs. Through membership, we have access to secured cash advances which can be used for liquidity purposes or other operational needs. To date, we have not established a FHLB line of credit or materially utilized our membership.
55
Results of Operations – Three and Six Months Ended June 30, 2016 Compared to Three and Six Months Ended June 30, 2015
Selected consolidated financial data for each period is summarized in the table below.
Three Months Ended June 30 | Six Months Ended June 30 | ||||||||||||||||||||||
($ in thousands, except per share data) | 2016 | 2015 | Change | 2016 | 2015 | Change | |||||||||||||||||
Revenues: | |||||||||||||||||||||||
Net premiums written | $ | 171,469 | $ | 171,133 | $ | 336 | $ | 367,297 | $ | 368,746 | $ | (1,449 | ) | ||||||||||
Net premiums earned | $ | 176,732 | $ | 175,293 | $ | 1,439 | $ | 354,312 | $ | 347,192 | $ | 7,120 | |||||||||||
Net investment result | 24,959 | 30,375 | (5,416 | ) | 46,764 | 59,299 | (12,535 | ) | |||||||||||||||
Net realized investment gains (losses) | 10,929 | (3,828 | ) | 14,757 | 2,578 | 1,011 | 1,567 | ||||||||||||||||
Other income | 2,181 | 1,576 | 605 | 4,535 | 3,745 | 790 | |||||||||||||||||
Total revenues | 214,801 | 203,416 | 11,385 | 408,189 | 411,247 | (3,058 | ) | ||||||||||||||||
Expenses: | |||||||||||||||||||||||
Losses and loss adjustment expenses | 120,842 | 112,747 | 8,095 | 249,028 | 230,915 | 18,113 | |||||||||||||||||
Reinsurance recoveries | (13,943 | ) | (8,808 | ) | (5,135 | ) | (31,174 | ) | (21,837 | ) | (9,337 | ) | |||||||||||
Net losses and loss adjustment expenses | 106,899 | 103,939 | 2,960 | 217,854 | 209,078 | 8,776 | |||||||||||||||||
Underwriting, policy acquisition and operating expenses | 54,034 | 53,525 | 509 | 110,923 | 104,881 | 6,042 | |||||||||||||||||
Segregated portfolio cells dividend expense (income) | 1,523 | 1,230 | 293 | 2,699 | 3,414 | (715 | ) | ||||||||||||||||
Interest expense | 3,851 | 3,710 | 141 | 7,537 | 7,341 | 196 | |||||||||||||||||
Total expenses | 166,307 | 162,404 | 3,903 | 339,013 | 324,714 | 14,299 | |||||||||||||||||
Income before income taxes | 48,494 | 41,012 | 7,482 | 69,176 | 86,533 | (17,357 | ) | ||||||||||||||||
Income taxes | 5,413 | 7,854 | (2,441 | ) | 6,777 | 15,561 | (8,784 | ) | |||||||||||||||
Net income | $ | 43,081 | $ | 33,158 | $ | 9,923 | $ | 62,399 | $ | 70,972 | $ | (8,573 | ) | ||||||||||
Operating income | $ | 35,993 | $ | 35,695 | $ | 298 | $ | 60,756 | $ | 70,402 | $ | (9,646 | ) | ||||||||||
Earnings per share: | |||||||||||||||||||||||
Basic | $ | 0.81 | $ | 0.60 | $ | 0.21 | $ | 1.17 | $ | 1.27 | $ | (0.10 | ) | ||||||||||
Diluted | $ | 0.81 | $ | 0.60 | $ | 0.21 | $ | 1.17 | $ | 1.26 | $ | (0.09 | ) | ||||||||||
Operating earnings per share: | |||||||||||||||||||||||
Basic | $ | 0.68 | $ | 0.64 | $ | 0.04 | $ | 1.14 | $ | 1.26 | $ | (0.12 | ) | ||||||||||
Diluted | $ | 0.67 | $ | 0.64 | $ | 0.03 | $ | 1.14 | $ | 1.25 | $ | (0.11 | ) | ||||||||||
Net loss ratio | 60.5 | % | 59.3 | % | 1.2 | 61.5 | % | 60.2 | % | 1.3 | |||||||||||||
Underwriting expense ratio | 30.6 | % | 30.5 | % | 0.1 | 31.3 | % | 30.2 | % | 1.1 | |||||||||||||
Combined ratio | 91.1 | % | 89.8 | % | 1.3 | 92.8 | % | 90.4 | % | 2.4 | |||||||||||||
Operating ratio | 77.2 | % | 73.9 | % | 3.3 | 78.7 | % | 74.5 | % | 4.2 | |||||||||||||
Effective tax rate | 11.2 | % | 19.2 | % | (8.0 | ) | 9.8 | % | 18.0 | % | (8.2 | ) | |||||||||||
Return on equity* | 8.6 | % | 6.3 | % | 2.3 | 6.3 | % | 6.7 | % | (0.4 | ) | ||||||||||||
* Annualized | |||||||||||||||||||||||
In all tables that follow, the abbreviation "nm" indicates that the information or the percentage change is not meaningful.
56
Revenues
Our consolidated net premiums earned were as follows:
Three Months Ended June 30 | Six Months Ended June 30 | ||||||||||||||||||||||||||||
($ in thousands) | 2016 | 2015 | Change | 2016 | 2015 | Change | |||||||||||||||||||||||
Net Premiums Earned | |||||||||||||||||||||||||||||
Specialty P&C | $ | 108,126 | $ | 112,608 | $ | (4,482 | ) | (4.0 | %) | $ | 218,882 | $ | 227,472 | $ | (8,590 | ) | (3.8 | %) | |||||||||||
Workers' Compensation | 55,093 | 53,581 | 1,512 | 2.8 | % | 109,476 | 104,858 | 4,618 | 4.4 | % | |||||||||||||||||||
Lloyd's Syndicate | 13,513 | 9,104 | 4,409 | 48.4 | % | 25,954 | 14,862 | 11,092 | 74.6 | % | |||||||||||||||||||
Consolidated total | $ | 176,732 | $ | 175,293 | $ | 1,439 | 0.8 | % | $ | 354,312 | $ | 347,192 | $ | 7,120 | 2.1 | % | |||||||||||||
Consolidated net premiums earned increased during both the 2016 three- and six-month periods as compared to 2015 due to an increase in net premiums earned for both our Lloyd's Syndicate and Workers' Compensation segments which was substantially offset by a decrease in net premiums earned for our Specialty P&C segment.
Our net investment result, which includes both net investment income and earnings from unconsolidated subsidiaries, decreased $5.4 million or 17.8% for the 2016 three-month period and decreased $12.5 million or 21.1% for the 2016 six-month period. The decreases in both the 2016 three- and six-month periods are driven by lower average investment balances and lower yields on our fixed maturities portfolio and a reduction in earnings from our unconsolidated subsidiaries of $2.0 million and $7.3 million, respectively. The reduction in earnings from our unconsolidated subsidiaries were attributable to both lower reported earnings from our investments in LPs/LLCs and an acceleration of the recognition of tax credit partnership operating losses, which resulted in higher operating losses in both the 2016 three- and six-month periods. Operating losses on our tax credit partnerships are partially offset by reductions in our tax provision.
During the 2016 three- and six-month periods we had net realized investment gains of $10.9 million and $2.6 million, respectively, as compared to net realized investment losses of $3.8 million for the 2015 three-month period and net realized investment gains of $1.0 million for the 2015 six-month period. There was no OTTI recognized in earnings during the 2016 three-month period. OTTI recognized in earnings was $9.7 million for the 2016 six-month period and $0.9 million and $2.7 million for the 2015 three- and six-month periods, respectively.
Expenses
The following table shows our net loss ratio by segment:
Three Months Ended June 30 | Six Months Ended June 30 | ||||||||||||||||||||||
($ in millions) | 2016 | 2015 | Change | 2016 | 2015 | Change | |||||||||||||||||
Current accident year net loss ratio | |||||||||||||||||||||||
Consolidated ratio | 81.3 | % | 79.3 | % | 2.0 | 80.0 | % | 80.0 | % | — | |||||||||||||
Specialty P&C | 88.1 | % | 86.8 | % | 1.3 | 88.5 | % | 87.3 | % | 1.2 | |||||||||||||
Workers' Compensation | 64.8 | % | 66.8 | % | (2.0 | ) | 65.6 | % | 66.4 | % | (0.8 | ) | |||||||||||
Lloyd's Syndicate | 83.5 | % | 61.2 | % | 22.3 | 68.9 | % | 64.5 | % | 4.4 | |||||||||||||
Calendar year net loss ratio | |||||||||||||||||||||||
Consolidated ratio | 60.5 | % | 59.3 | % | 1.2 | 61.5 | % | 60.2 | % | 1.3 | |||||||||||||
Specialty P&C | 57.6 | % | 56.9 | % | 0.7 | 61.0 | % | 58.5 | % | 2.5 | |||||||||||||
Workers' Compensation | 62.9 | % | 64.0 | % | (1.1 | ) | 63.7 | % | 63.3 | % | 0.4 | ||||||||||||
Lloyd's Syndicate | 62.9 | % | 61.2 | % | 1.7 | 56.6 | % | 64.5 | % | (7.9 | ) | ||||||||||||
Favorable net loss development, prior accident years | |||||||||||||||||||||||
Consolidated | $ | 36.8 | $ | 35.1 | $ | 1.7 | $ | 65.5 | $ | 68.6 | $ | (3.1 | ) | ||||||||||
Specialty P&C | 33.0 | 33.6 | (0.6 | ) | 60.2 | 65.4 | (5.2 | ) | |||||||||||||||
Workers' Compensation | 1.0 | 1.5 | (0.5 | ) | 2.1 | 3.2 | (1.1 | ) | |||||||||||||||
Lloyd's Syndicate | 2.8 | — | 2.8 | 3.2 | — | 3.2 | |||||||||||||||||
Our consolidated current accident year net loss ratio increased 2.0 percentage points for the 2016 three-month period as compared to 2015 driven by the effect of a higher loss ratio in our Lloyd's Syndicate segment as well as a change in expense
57
allocations, as discussed below. Our consolidated current accident year net loss ratio remained flat for the 2016 six-month period as compared to 2015 primarily driven by the effect of a lower loss ratio in our Workers' Compensation segment offset by a higher loss ratio in our Specialty P&C segment.
Our consolidated calendar year net loss ratio was lower than our consolidated current accident year net loss ratio due to the recognition of net favorable loss development in our Specialty P&C, Workers' Compensation and Lloyd's Syndicate segments as shown in the previous table.
Our underwriting expense ratio reflected the following:
Three Months Ended June 30 | Six Months Ended June 30 | ||||||||||||||||
2016 | 2015 | Change | 2016 | 2015 | Change | ||||||||||||
Underwriting Expense Ratio | |||||||||||||||||
Consolidated | 30.6 | % | 30.5 | % | 0.1 | 31.3 | % | 30.2 | % | 1.1 | |||||||
Specialty P&C | 24.0 | % | 23.7 | % | 0.3 | 23.3 | % | 23.7 | % | (0.4 | ) | ||||||
Workers' Compensation | 29.6 | % | 29.5 | % | 0.1 | 31.2 | % | 29.7 | % | 1.5 | |||||||
Lloyd's Syndicate | 38.8 | % | 43.5 | % | (4.7 | ) | 40.1 | % | 50.8 | % | (10.7 | ) | |||||
Corporate* | 4.6 | % | 4.1 | % | 0.5 | 4.4 | % | 3.6 | % | 0.8 | |||||||
* There are no net premiums earned associated with the Corporate segment. Ratio shown is the contribution of the Corporate segment to the consolidated ratio (Corporate Operating expenses divided by consolidated Net premium earned). | |||||||||||||||||
The consolidated expense ratio increased for both the 2016 three- and six-month periods when compared to the same respective periods in 2015. Both the 2016 three- and six-month periods reflected an increase in underwriting expense when compared to the same periods in 2015, the effect of which was offset, to an extent, by a 0.8% and 2.1% increase in Net earned premium for the three- and six-month periods of 2016, respectively.
The primary components of the consolidated increase in Underwriting, policy acquisition and operating expense for both the three- and six-month periods were:
• | Increase in consolidated DPAC amortization, for both the three and six months ended June 30, 2016, by $1.7 million and $4.3 million, respectively, particularly in the Lloyd's Syndicate segment. |
• | Increase in operating expenses in our Corporate segment by $1.0 million and $3.1 million for the three and six months ended June 30, 2016 due to costs associated with a pre-acquisition liability from a discontinued operation and an increase in share-based compensation expenses resulting from the adjustment of the projected award value based upon the improvement, in the quarter, of one of the performance metrics associated with a particular year's award. |
• | Increase in underwriting expenses in our Workers' Compensation segment for the three and six months ended June 30, 2016 of $0.2 million and $2.1 million, respectively, primarily due to an increase in compensation and related costs and for the six-month period, pension settlement charges. |
There was a $1.4 million decrease in our consolidated underwriting expenses during the three-months ended June 30, 2016 that reflected a current year cumulative change in how the management fee was considered and allocated to losses and loss adjustment expenses. This change had a $1.4 million offsetting effect on consolidated losses and thus did not affect consolidated Net income. Likewise, the change resulted in a 0.8 point decrease to our consolidated underwriting expense ratio which was completely offset by a 0.8 point increase to our consolidated net loss ratio. We believe the change better reflects the involvement of senior management at a corporate level and their oversight of the claims process at the segment level.
Taxes
Our effective tax rate was 11.2% and 9.8% for the three and six months ended June 30, 2016, respectively, as compared to 19.2% and 18.0% for the same respective periods in 2015. The reductions to the ratio for the three and six months ended June 30, 2016 were due to the combined effect of lower year-to-date pre-tax income and the utilization of more tax credits.
58
Operating Ratio and ROE
Our operating ratio (calculated as our combined ratio, less our investment income ratio) increased by 3.3 and 4.2 percentage points in the three- and six-month periods ending June 30, 2016, respectively. For the three months ended June 30, 2016, the increase principally reflected a higher net loss ratio driven by losses in our Lloyd's segment and a lower investment ratio due to a decline in income from our fixed maturity securities. For the six months ended June 30, 2016, the increase principally reflected a higher net loss ratio due to a lower amount of prior year favorable development, a higher expense ratio due to an increase in operating expenses in our Workers' Compensation and Corporate segments and a lower investment ratio due to a decline in income from our fixed maturity securities.
ROE was 8.6% and 6.3% for the three- and six-month periods ending June 30, 2016 and was 6.3% and 6.7% for the same respective periods of 2015.
Book Value per Share
We believe our commitment to share repurchases and the declaration of dividends are currently our most effective uses of capital even though, in the short-term, dividends and significant share repurchases above book value dampen growth in book value per share. Our book value per share at June 30, 2016 as compared to December 31, 2015 is shown in the following table.
Book Value Per Share | |||
Book Value Per Share at December 31, 2015 | $ | 36.88 | |
Increase (decrease) to book value per share during the six months ended June 30, 2016 attributable to: | |||
Dividends declared | (0.62 | ) | |
Cumulative repurchase of shares | 0.18 | ||
Capital management activities | (0.44 | ) | |
Net income | 1.17 | ||
Increase in AOCI | 0.70 | ||
Other | (0.19 | ) | |
Book Value Per Share at June 30, 2016 | $ | 38.12 | |
59
Non-GAAP Financial Measures
Operating income is a non-GAAP financial measure that is widely used to evaluate performance within the insurance sector. In calculating operating income, we have excluded the after-tax effects of net realized investment gains or losses and guaranty fund assessments or recoupments that do not reflect normal operating results. We believe operating income presents a useful view of the performance of our insurance operations, but should be considered in conjunction with net income computed in accordance with GAAP.
The following table is a reconciliation of Net income to Operating income:
Three Months Ended June 30 | Six Months Ended June 30 | ||||||||||||||
(In thousands, except per share data) | 2016 | 2015 | 2016 | 2015 | |||||||||||
Net income | $ | 43,081 | $ | 33,158 | $ | 62,399 | $ | 70,972 | |||||||
Items excluded in the calculation of operating income: | |||||||||||||||
Net realized investment (gains) losses | (10,929 | ) | 3,828 | (2,578 | ) | (1,011 | ) | ||||||||
Guaranty fund assessments (recoupments) | 24 | 75 | 51 | 134 | |||||||||||
Pre-tax effect of exclusions | (10,905 | ) | 3,903 | (2,527 | ) | (877 | ) | ||||||||
Tax effect, at 35% | 3,817 | (1,366 | ) | 884 | 307 | ||||||||||
Operating income | $ | 35,993 | $ | 35,695 | $ | 60,756 | $ | 70,402 | |||||||
Per diluted common share: | |||||||||||||||
Net income | $ | 0.81 | $ | 0.60 | $ | 1.17 | $ | 1.26 | |||||||
Effect of exclusions | (0.14 | ) | 0.04 | (0.03 | ) | (0.01 | ) | ||||||||
Operating income per diluted common share | $ | 0.67 | $ | 0.64 | $ | 1.14 | $ | 1.25 | |||||||
Note: The 35% rate above is the annual expected incremental tax rate associated with the taxable or tax deductible items listed. We record the provision for income taxes in our interim financial statements based upon our estimated annual effective tax rate. For the 2016 three- and six-month periods, the effective tax rate applied to these items in calculating net income was 11.2% and 9.8%, respectively. | |||||||||||||||
60
Segment Operating Results - Specialty Property & Casualty
Our Specialty P&C segment focuses on professional liability insurance and medical technology liability insurance as discussed in Note 12 of the Notes to Condensed Consolidated Financial Statements. Specialty P&C segment operating results reflect pre-tax underwriting profit or loss from these insurance lines, exclusive of investment results, which are included in our Corporate segment. Segment operating results for the three and six months ended June 30, 2016 were $21.7 million and $37.5 million, respectively, as compared to $23.3 million and $43.5 million for the same respective periods of 2015, and included the following:
Three Months Ended June 30 | Six Months Ended June 30 | ||||||||||||||||||||||||||||
($ in thousands) | 2016 | 2015 | Change | 2016 | 2015 | Change | |||||||||||||||||||||||
Net premiums written | $ | 99,860 | $ | 96,050 | $ | 3,810 | 4.0 | % | $ | 219,522 | $ | 220,720 | $ | (1,198 | ) | (0.5 | %) | ||||||||||||
Net premiums earned | 108,126 | 112,608 | (4,482 | ) | (4.0 | %) | 218,882 | 227,472 | (8,590 | ) | (3.8 | %) | |||||||||||||||||
Net losses and loss adjustment expenses | 62,301 | 64,054 | (1,753 | ) | (2.7 | %) | 133,477 | 133,084 | 393 | 0.3 | % | ||||||||||||||||||
Underwriting, policy acquisition and operating expenses | 25,902 | 26,645 | (743 | ) | (2.8 | %) | 50,954 | 53,806 | (2,852 | ) | (5.3 | %) | |||||||||||||||||
Net loss ratio | 57.6% | 56.9% | 0.7 | 61.0% | 58.5% | 2.5 | |||||||||||||||||||||||
Underwriting expense ratio | 24.0% | 23.7% | 0.3 | 23.3% | 23.7% | (0.4 | ) | ||||||||||||||||||||||
Premiums Written
Changes in our premium volume within our Specialty P&C segment are driven by four primary factors: (1) the amount of new business, (2) our retention of existing business, (3) the premium charged for business that is renewed, which is affected by rates charged and by the amount and type of coverage an insured chooses to purchase, and (4) the timing of premium written through multi-period policies. In addition, premium volume may periodically be affected by shifts in the timing of renewals between periods. The healthcare professional liability market, which accounts for a majority of the revenues in this segment, remains challenging as physicians continue joining hospitals or larger group practices and are thus no longer purchasing insurance in the standard market. In addition, some competitors have chosen to compete primarily on price; both factors impact our ability to write new business and retain existing business.
Gross, ceded and net premiums written were as follows:
Three Months Ended June 30 | Six Months Ended June 30 | ||||||||||||||||||||||||||||
($ in thousands) | 2016 | 2015 | Change | 2016 | 2015 | Change | |||||||||||||||||||||||
Gross premiums written | $ | 116,117 | $ | 112,607 | $ | 3,510 | 3.1 | % | $ | 254,363 | $ | 256,141 | $ | (1,778 | ) | (0.7 | %) | ||||||||||||
Less: Ceded premiums written | 16,257 | 16,557 | (300 | ) | (1.8 | %) | 34,841 | 35,421 | (580 | ) | (1.6 | %) | |||||||||||||||||
Net premiums written | $ | 99,860 | $ | 96,050 | $ | 3,810 | 4.0 | % | $ | 219,522 | $ | 220,720 | $ | (1,198 | ) | (0.5 | %) | ||||||||||||
61
Gross Premiums Written
Gross premiums written by component were as follows:
Three Months Ended June 30 | Six Months Ended June 30 | ||||||||||||||||||||||||||||
($ in thousands) | 2016 | 2015 | Change | 2016 | 2015 | Change | |||||||||||||||||||||||
Professional liability | |||||||||||||||||||||||||||||
Physicians (1): | |||||||||||||||||||||||||||||
Twelve month term | $ | 74,340 | $ | 65,030 | $ | 9,310 | 14.3 | % | $ | 162,877 | $ | 158,804 | $ | 4,073 | 2.6 | % | |||||||||||||
Twenty-four month term | 4,479 | 10,829 | (6,350 | ) | (58.6 | %) | 13,105 | 17,496 | (4,391 | ) | (25.1 | %) | |||||||||||||||||
Total Physicians | 78,819 | 75,859 | 2,960 | 3.9 | % | 175,982 | 176,300 | (318 | ) | (0.2 | %) | ||||||||||||||||||
Healthcare facilities (2) | 11,096 | 8,659 | 2,437 | 28.1 | % | 23,772 | 20,670 | 3,102 | 15.0 | % | |||||||||||||||||||
Other healthcare providers (3) | 7,093 | 6,684 | 409 | 6.1 | % | 15,347 | 14,767 | 580 | 3.9 | % | |||||||||||||||||||
Legal professionals (4) | 6,541 | 7,698 | (1,157 | ) | (15.0 | %) | 14,421 | 17,171 | (2,750 | ) | (16.0 | %) | |||||||||||||||||
Tail coverages (5) | 3,169 | 4,379 | (1,210 | ) | (27.6 | %) | 7,877 | 10,333 | (2,456 | ) | (23.8 | %) | |||||||||||||||||
Total professional liability | 106,718 | 103,279 | 3,439 | 3.3 | % | 237,399 | 239,241 | (1,842 | ) | (0.8 | %) | ||||||||||||||||||
Medical technology liability (6) | 9,291 | 8,929 | 362 | 4.1 | % | 16,732 | 16,069 | 663 | 4.1 | % | |||||||||||||||||||
Other | 108 | 399 | (291 | ) | (72.9 | %) | 232 | 831 | (599 | ) | (72.1 | %) | |||||||||||||||||
Total | $ | 116,117 | $ | 112,607 | $ | 3,510 | 3.1 | % | $ | 254,363 | $ | 256,141 | $ | (1,778 | ) | (0.7 | %) | ||||||||||||
(1) | Physician policies were our greatest source of premium revenues in both 2016 and 2015. The increase in twelve month term policies during the 2016 three- and six-month periods was primarily due to the addition of several large accounts written during the second quarter 2016. The increases in both periods were partially offset by retention losses in 2016. Non-renewal of one large policy in the second quarter 2016 particularly reduced our retention percentage for the quarter. However, this had no comparative written premium effect since the expiring policy was neither processed nor recorded until the third quarter of 2015. Additionally, the 2016 six-month period reflects the shifting of certain policies from a twelve month term to a twenty-four month term. We offer twenty-four month term policies to our physician insureds in one selected jurisdiction. The net decline in twenty-four month premium, as compared to 2015, primarily reflects the normal cycle of renewals (policies subject to renewal in 2016 were previously written in 2014 rather than in 2015). |
(2) | Our healthcare facilities premium (which includes hospitals, surgery centers and other facilities) increased during the 2016 three- and six-month periods, primarily due to new business written during the second quarter 2016. |
(3) | Our other healthcare providers are primarily dentists, chiropractors and allied health professionals. |
(4) | Our legal professionals policies are primarily individual and small group policies in select areas of practice. The decline in the legal professionals premium for the 2016 three- and six-month periods was primarily due to the decrease in retention in both periods driven by an increase in renewal pricing in certain jurisdictions as well as stricter underwriting standards. |
(5) | We offer extended reporting endorsement or "tail" coverage to insureds who discontinue their claims-made coverage with us, and we also periodically offer "tail" coverage through custom policies. The amount of tail coverage premium written can vary widely from period to period. |
(6) | Our medical technology liability business is marketed throughout the United States; coverage is offered on a primary basis, within specified limits, to manufacturers and distributors of medical technology and life sciences products including entities conducting human clinical trials. In addition to the previously listed factors that affect our premium volume, our medical technology liability premium volume is impacted by the sales volume of insureds. While we were able to write a substantial amount of new business during both the 2016 three- and six-month periods, the benefit of this was largely offset by losses from non-renewals due to merger activity within the industry, competition and changes in coverages purchased by insureds upon renewal. |
62
New business written by component on a direct basis was as follows:
Three Months Ended June 30 | Six Months Ended June 30 | ||||||||||||||
(In millions) | 2016 | 2015 | 2016 | 2015 | |||||||||||
Physicians | $ | 12.4 | $ | 3.6 | $ | 16.7 | $ | 11.0 | |||||||
Healthcare facilities | 5.4 | 0.5 | 8.2 | 2.8 | |||||||||||
Other healthcare providers | 0.7 | 0.6 | 1.3 | 1.3 | |||||||||||
Legal professionals | 0.9 | 1.3 | 2.3 | 2.7 | |||||||||||
Medical technology liability | 1.6 | 0.9 | 3.1 | 1.9 | |||||||||||
Total | $ | 21.0 | $ | 6.9 | $ | 31.6 | $ | 19.7 | |||||||
We calculate our retention rate as annualized renewed premium divided by all annualized premium subject to renewal. Retention rates are affected by a number of factors. We may lose insureds to competitors or to alternative insurance mechanisms such as risk retention groups or self-insurance entities (often when physicians join hospitals or large group practices) or due to pricing or other issues. We may choose not to renew an insured as a result of our underwriting evaluation. Insureds may also terminate coverage because they have left the practice of medicine for various reasons, principally for retirement, death or disability, but also for personal reasons.
Retention by component was as follows:
Three Months Ended June 30 | Six Months Ended June 30 | ||||||||||
2016 | 2015 | 2016 | 2015 | ||||||||
Physicians | 87 | % | 90 | % | 88 | % | 87 | % | |||
Healthcare facilities | 91 | % | 84 | % | 82 | % | 88 | % | |||
Other healthcare providers | 86 | % | 80 | % | 87 | % | 81 | % | |||
Legal professionals* | 77 | % | 82 | % | 73 | % | 83 | % | |||
Medical technology liability | 85 | % | 76 | % | 85 | % | 81 | % | |||
* See Gross Premiums Written section above for further explanation of QTD and YTD retention declines in 2016. | |||||||||||
The pricing of our business includes the effects of filed rates, surcharges and discounts. We continue to base our pricing on expected losses, as indicated by our historical loss data and available industry loss data. We are committed to a rate structure that will allow us to fulfill our obligations to our insureds, while generating competitive returns for our shareholders.
Changes in renewal pricing by component was as follows:
Three Months Ended June 30 | Six Months Ended June 30 | ||||
2016 | 2016 | ||||
Physicians | 1 | % | — | % | |
Healthcare facilities* | 10 | % | 7 | % | |
Other healthcare providers* | 2 | % | 2 | % | |
Legal professionals | 10 | % | 6 | % | |
Medical technology liability* | (1 | %) | (1 | %) | |
* The changes in renewal pricing shown are reflective of changes in our exposure base, deductibles, self-insurance retention limits and other policy terms. | |||||
Ceded Premiums Written
Ceded premiums represent the amounts owed to our reinsurers for their assumption of a portion of our losses. Through our current excess of loss reinsurance arrangements we retain the first $1 million in risk insured by us and cede any coverages in excess of this amount. For our medical technology liability coverages, we also retain 20% of the next $9 million of risk for coverages in excess of $1 million. We pay our reinsurers a ceding premium in exchange for their accepting the risk, the ultimate amount of which is determined by the loss experience of the business ceded, subject to certain minimum and maximum amounts.
63
Ceded premiums written were as follows:
Three Months Ended June 30 | Six Months Ended June 30 | ||||||||||||||||||||||||||||
($ in thousands) | 2016 | 2015 | Change | 2016 | 2015 | Change | |||||||||||||||||||||||
Excess of loss reinsurance arrangements (1) | $ | 6,613 | $ | 7,257 | $ | (644 | ) | (8.9 | %) | $ | 11,898 | $ | 14,505 | $ | (2,607 | ) | (18.0 | %) | |||||||||||
Premium ceded to Syndicate 1729 (2) | 4,597 | 4,637 | (40 | ) | (0.9 | %) | 9,111 | 9,407 | (296 | ) | (3.1 | %) | |||||||||||||||||
Other shared risk arrangements (3) | 5,695 | 5,722 | (27 | ) | (0.5 | %) | 14,563 | 12,885 | 1,678 | 13.0 | % | ||||||||||||||||||
Other ceded premiums written | 1,872 | 1,636 | 236 | 14.4 | % | 4,099 | 4,259 | (160 | ) | (3.8 | %) | ||||||||||||||||||
Reduction in premiums owed under reinsurance agreements, prior accident years, net (4) | (2,520 | ) | (2,695 | ) | 175 | 6.5 | % | (4,830 | ) | (5,635 | ) | 805 | 14.3 | % | |||||||||||||||
Total ceded premiums written | $ | 16,257 | $ | 16,557 | $ | (300 | ) | (1.8 | %) | $ | 34,841 | $ | 35,421 | $ | (580 | ) | (1.6 | %) | |||||||||||
(1) | We generally reinsure risks under our excess of loss reinsurance arrangements pursuant to which the reinsurers agree to assume all or a portion of all risks that we insure above our individual risk retention levels, up to the maximum individual limits offered. The decrease in ceded premiums written under our excess of loss reinsurance arrangements for the 2016 three- and six-month periods was primarily due to more favorable contract terms on our core treaty which renewed in October 2015. |
(2) | As previously discussed, we are a 58% participant in Syndicate 1729 and record our pro rata share of its operating results in our Lloyd's Syndicate segment on a quarter delay. We also record the cession within the Specialty P&C segment on a quarter delay as the amounts are not material and this permits the cession to be reported by both the Lloyd's Syndicate segment and the Specialty P&C segment in the same reporting period. As our premiums are earned, we recognize the related ceding commission income which reduces underwriting expense by offsetting DPAC amortization. The related ceding commission income was $1.2 million and $2.5 million for the three- and six-month periods of 2016, respectively, and $1.3 million and $2.5 million for the three- and six-month periods of 2015, respectively. For our consolidated results, eliminations of the inter-segment portion (58% of the Specialty P&C cession) of the transactions are also recorded on a quarter delay. |
(3) | We have entered into various shared risk arrangements, including quota share, fronting, and captive arrangements, with certain large healthcare systems and other insurance entities. These arrangements include our Ascension Health and CAPAssurance Programs. While we cede a large portion of the premium written under these arrangements, they provide us an opportunity to grow net premium through strategic partnerships. |
(4) | Given the length of time that it takes to resolve our claims, many years may elapse before all losses recoverable under a reinsurance arrangement are known. As a part of the process of estimating our loss reserve we also make estimates regarding the amounts recoverable under our reinsurance arrangements. As previously discussed, the premiums ultimately ceded under our excess of loss reinsurance arrangements are subject to the losses ceded under the arrangements. In both 2016 and 2015, on a net basis, we reduced our estimate of expected losses and associated recoveries for prior year ceded losses, as well as our estimate of ceded premiums owed to reinsurers. Changes to estimates of premiums ceded related to prior accident years are fully earned in the period the changes in estimates occur. |
Ceded Premiums Ratio
As shown in the table below, our ceded premiums ratio was affected in both 2016 and 2015 by revisions to our estimate of premiums owed to reinsurers related to coverages provided in prior accident years.
Three Months Ended June 30 | Six Months Ended June 30 | ||||||||||||||||
2016 | 2015 | Change | 2016 | 2015 | Change | ||||||||||||
Ceded premiums ratio, as reported | 14.0 | % | 14.7 | % | (0.7 | ) | 13.7 | % | 13.8 | % | (0.1 | ) | |||||
Less the effect of reduction in premiums owed under reinsurance agreements, prior accident years (as previously discussed) | (2.2 | %) | (2.4 | %) | 0.2 | (1.9 | %) | (2.2 | %) | 0.3 | |||||||
Ratio, current accident year | 16.2 | % | 17.1 | % | (0.9 | ) | 15.6 | % | 16.0 | % | (0.4 | ) | |||||
The decrease in the current accident year ceded premiums ratio for the 2016 three- and six-month periods was primarily attributable to more favorable treaty terms in our excess of loss reinsurance arrangements. In the 2016 six-month period, this reduction to the ratio was partially offset by an increased amount of premium ceded under our shared risk arrangements and by lower premium volume during 2016.
64
Net Premiums Earned
Net premiums earned were as follows:
Three Months Ended June 30 | Six Months Ended June 30 | ||||||||||||||||||||||||||||
($ in thousands) | 2016 | 2015 | Change | 2016 | 2015 | Change | |||||||||||||||||||||||
Gross premiums earned | $ | 126,828 | $ | 131,369 | $ | (4,541 | ) | (3.5 | %) | $ | 256,009 | $ | 263,754 | $ | (7,745 | ) | (2.9 | %) | |||||||||||
Less: Ceded premiums earned | 18,702 | 18,761 | (59 | ) | (0.3 | %) | 37,127 | 36,282 | 845 | 2.3 | % | ||||||||||||||||||
Net premiums earned | $ | 108,126 | $ | 112,608 | $ | (4,482 | ) | (4.0 | %) | $ | 218,882 | $ | 227,472 | $ | (8,590 | ) | (3.8 | %) | |||||||||||
Net premiums earned consist of gross premiums earned less the portion of earned premiums that we cede to our reinsurers for their assumption of a portion of our losses. Because premiums are generally earned pro rata over the entire policy period, fluctuations in premiums earned tend to lag those of premiums written. Generally, our policies carry a term of one year, but as discussed above, we write certain policies with a twenty-four month term, and certain of our medical technology liability policies carry a multi-year term. Tail coverage premiums are generally 100% earned in the period written because the policies insure only incidents that occurred in prior periods and are not cancellable. Additionally, ceded premium changes due to changes to estimates of premiums owed under reinsurance agreements for prior accident years are fully earned in the period of change.
The decrease in gross premiums earned in 2016 primarily reflected the pro rata effect of lower physician premiums written during the preceding twelve months, including the 2016 decrease in tail coverages. In addition, for the 2016 three- and six-month periods, prior accident year ceded premiums reductions were $0.2 million and $0.8 million lower than for the 2015 three- and six-month periods, respectively (see discussion under the heading "Ceded Premiums Written").
Losses and Loss Adjustment Expenses
The determination of calendar year losses involves the actuarial evaluation of incurred losses for the current accident year and the actuarial re-evaluation of incurred losses for prior accident years, including an evaluation of the reserve amounts required for losses in excess of policy limits.
Accident year refers to the accounting period in which the insured event becomes a liability of the insurer. For claims-made policies, which represent over 90% of the premiums written in our Specialty P&C segment, the insured event generally becomes a liability when the event is first reported to the insurer. For occurrence policies the insured event becomes a liability when the event takes place. We believe that measuring losses on an accident year basis is the best measure of the underlying profitability of the premiums earned in that period, since it associates policy premiums earned with the estimate of the losses incurred related to those policy premiums.
The following table summarizes calendar year net loss ratios by separating losses between the current accident year and all prior accident years. Additionally, the table shows our current accident year net loss ratio was affected by revisions to our estimate of premiums owed to reinsurers related to coverages provided in prior accident years. Net loss ratios for the period were as follows:
Net Loss Ratios (1) | ||||||||||||||||
Three Months Ended June 30 | Six Months Ended June 30 | |||||||||||||||
2016 | 2015 | Change | 2016 | 2015 | Change | |||||||||||
Calendar year net loss ratio | 57.6 | % | 56.9 | % | 0.7 | 61.0 | % | 58.5 | % | 2.5 | ||||||
Less impact of prior accident years on the net loss ratio | (30.5 | %) | (29.9 | %) | (0.6 | ) | (27.5 | %) | (28.8 | %) | 1.3 | |||||
Current accident year net loss ratio | 88.1 | % | 86.8 | % | 1.3 | 88.5 | % | 87.3 | % | 1.2 | ||||||
Less estimated ratio increase (decrease) attributable to: | ||||||||||||||||
Ceded premium reductions, prior accident years (2) | (2.1 | %) | (2.1 | %) | — | (2.0 | %) | (2.2 | %) | 0.2 | ||||||
Current accident year net loss ratio, excluding the effect of prior year ceded premium (3) | 90.2 | % | 88.9 | % | 1.3 | 90.5 | % | 89.5 | % | 1.0 | ||||||
(1) | Net losses as specified divided by net premiums earned. |
(2) | Reductions to premiums owed under reinsurance agreements for prior accident years increased net premiums earned (the denominator of the current accident year ratio) in both 2016 and 2015. See the discussion in the Premiums section for our Specialty P&C segment under the heading "Ceded Premiums Written" for additional information. |
(3) | The increase in the current accident year net loss ratio for the 2016 three- and six-month periods primarily reflected higher loss expectations for certain risk categories, including, for the six-month period, additional losses relative to mass tort exposures. |
65
We recognized net favorable loss development related to our previously established reserves of $33.0 million and $60.2 million during the three and six months ended June 30, 2016, respectively, and $33.6 million and $65.4 million during the same respective periods of 2015. We re-evaluate our previously established reserve each quarter based on our most recently available claims data and currently available industry trend information. Development recognized during the three and six months ended June 30, 2016 principally related to accident years 2009 through 2013. Development recognized during the 2015 three- and six-month periods principally related to accident years 2008 through 2012.
A detailed discussion of factors influencing our recognition of loss development is included in our Critical Accounting Estimates section under the heading "Reserve for Losses and Loss Adjustment Expenses" and in our 2015 Form 10-K under the same heading. Assumptions used in establishing our reserve are regularly reviewed and updated by management as new data becomes available. Any adjustments necessary are reflected in the then current operations. Due to the size of our reserve, even a small percentage adjustment to the assumptions can have a material effect on our results of operations for the period in which the change is made, as was the case in both 2016 and 2015.
66
Underwriting, Policy Acquisition and Operating Expenses
Specialty P&C underwriting, policy acquisition and operating expenses were $25.9 million and $51.0 million for the three and six months ended June 30, 2016, respectively, and $26.6 million and $53.8 million for the same respective periods of 2015, and were comprised as follows:
Three Months Ended June 30 | Six Months Ended June 30 | ||||||||||||||||||||||||||||
($ in thousands) | 2016 | 2015 | Change | 2016 | 2015 | Change | |||||||||||||||||||||||
Specialty P&C segment: | |||||||||||||||||||||||||||||
DPAC amortization | $ | 11,034 | $ | 11,447 | $ | (413 | ) | (3.6 | %) | $ | 21,953 | $ | 23,789 | $ | (1,836 | ) | (7.7 | %) | |||||||||||
Management fees | 1,429 | 1,469 | (40 | ) | (2.7 | %) | 3,096 | 3,336 | (240 | ) | (7.2 | %) | |||||||||||||||||
Other underwriting and operating expenses | 13,439 | 13,729 | (290 | ) | (2.1 | %) | 25,905 | 26,681 | (776 | ) | (2.9 | %) | |||||||||||||||||
Total | $ | 25,902 | $ | 26,645 | $ | (743 | ) | (2.8 | %) | $ | 50,954 | $ | 53,806 | $ | (2,852 | ) | (5.3 | %) | |||||||||||
DPAC amortization. The decrease for the three and six months ended June 30, 2016 as compared to the same periods in 2015 was due to lower gross earned premium for the 2016 period and to a $0.3 million and $0.9 million increase in ceding commission income, respectively, which is an offset to expense.
Management fees. Pursuant to a management agreement, the operating subsidiaries within our Specialty P&C segment are charged a management fee by the Corporate segment for services provided, based on the extent to which services are provided to the subsidiary and the amount of premium written by the subsidiary. The terms of the management agreement were consistent between 2015 and 2016.
Other underwriting and operating expenses remained fairly consistent in the three and six months ended June 30, 2016 as compared to the same periods in 2015 with no individually significant variances by expense category.
Underwriting Expense Ratio (the Expense Ratio)
The underwriting expense ratio for the Specialty P&C segment reflected a slight increase for the 2016 three-month period and a slight decrease for the 2016 six-month period, as compared to the same respective 2015 periods, as shown below:
Three Months Ended June 30 | Six Months Ended June 30 | |||||||||||||||
2016 | 2015 | Change | 2016 | 2015 | Change | |||||||||||
Underwriting expense ratio | 24.0 | % | 23.7 | % | 0.3 | 23.3 | % | 23.7 | % | (0.4 | ) | |||||
The change in the ratio is principally attributable to the following:
Increase (decrease), 2016 versus 2015 | |||||
(In percentage points) | Comparative three-month periods | Comparative six-month periods | |||
Estimated ratio increase (decrease) attributable to: | |||||
Effect of reductions to Net earned premiums offset by the effect of lower DPAC amortization | 0.6 | — | |||
Effect of other expense reductions, including management fees | (0.3 | ) | (0.4 | ) | |
Net increase/(decrease) in ratio | 0.3 | (0.4 | ) | ||
The slight change in ratios for both the 2016 three- and six-month periods are primarily reflective of the effect of declines in net earned premium in both periods, offset, to an extent, for the three-month period and entirely for the six-month period by the effect of the previously discussed reductions in DPAC amortization.
67
Segment Operating Results - Workers' Compensation
Our Workers' Compensation segment provides traditional workers' compensation insurance products to employers with 1,000 or fewer employees and alternative market solutions, as discussed in Note 12 of the Notes to Condensed Consolidated Financial Statements. Segment operating results reflect pre-tax underwriting profit or loss, exclusive of investment results which are included in our Corporate segment. Segment operating results for the three and six months ended June 30, 2016 were $2.7 million and $3.5 million, respectively, as compared to $2.4 million and $4.1 million for the same respective periods of 2015, and included the following:
Three Months Ended June 30 | Six Months Ended June 30 | |||||||||||||||||||||||||
($ in thousands) | 2016 | 2015 | Change | 2016 | 2015 | Change | ||||||||||||||||||||
Net premiums written | $ | 51,991 | $ | 52,880 | $ | (889 | ) | (1.7 | %) | $ | 121,542 | $ | 121,815 | $ | (273 | ) | (0.2 | %) | ||||||||
Net premiums earned | 55,093 | 53,581 | 1,512 | 2.8 | % | 109,476 | 104,858 | 4,618 | 4.4 | % | ||||||||||||||||
Net losses and loss adjustment expenses | 34,661 | 34,310 | 351 | 1.0 | % | 69,687 | 66,412 | 3,275 | 4.9 | % | ||||||||||||||||
Underwriting, policy acquisition and operating expenses | 16,334 | 15,831 | 503 | 3.2 | % | 34,165 | 31,189 | 2,976 | 9.5 | % | ||||||||||||||||
SPC dividend expense (income) | 1,523 | 1,230 | 293 | 23.8 | % | 2,699 | 3,414 | (715 | ) | (20.9 | %) | |||||||||||||||
Net loss ratio | 62.9% | 64.0% | (1.1 | ) | 63.7% | 63.3% | 0.4 | |||||||||||||||||||
Underwriting expense ratio | 29.6% | 29.5% | 0.1 | 31.2% | 29.7% | 1.5 | ||||||||||||||||||||
Premiums Written
Our workers’ compensation premium volume is driven by four primary factors: (1) the amount of new business written, (2) audit premium, (3) retention of our existing book of business, and (4) premium rates charged on our renewal book of business.
Gross, ceded and net premiums written were as follows:
Three Months Ended June 30 | Six Months Ended June 30 | ||||||||||||||||||||||
($ in thousands) | 2016* | 2015 | Change | 2016* | 2015 | Change | |||||||||||||||||
Gross premiums written | |||||||||||||||||||||||
Traditional business | $ | 41,505 | $ | 44,159 | $ | (2,654 | ) | (6.0 | %) | $ | 93,182 | $ | 97,309 | $ | (4,127 | ) | (4.2 | %) | |||||
Alternative market business | 14,958 | 14,165 | 793 | 5.6 | % | 41,328 | 36,866 | 4,462 | 12.1 | % | |||||||||||||
Segment results | 56,463 | 58,324 | (1,861 | ) | (3.2 | %) | 134,510 | 134,175 | 335 | 0.2 | % | ||||||||||||
Less: Ceded premiums written | |||||||||||||||||||||||
Traditional business | 1,824 | 2,172 | (348 | ) | (16.0 | %) | 4,324 | 5,370 | (1,046 | ) | (19.5 | %) | |||||||||||
Alternative market business | 2,648 | 3,272 | (624 | ) | (19.1 | %) | 8,644 | 6,990 | 1,654 | 23.7 | % | ||||||||||||
Segment results | 4,472 | 5,444 | (972 | ) | (17.9 | %) | 12,968 | 12,360 | 608 | 4.9 | % | ||||||||||||
Net premiums written | |||||||||||||||||||||||
Traditional business | 39,681 | 41,987 | (2,306 | ) | (5.5 | %) | 88,858 | 91,939 | (3,081 | ) | (3.4 | %) | |||||||||||
Alternative market business | 12,310 | 10,893 | 1,417 | 13.0 | % | 32,684 | 29,876 | 2,808 | 9.4 | % | |||||||||||||
Segment results | $ | 51,991 | $ | 52,880 | $ | (889 | ) | (1.7 | %) | $ | 121,542 | $ | 121,815 | $ | (273 | ) | (0.2 | %) | |||||
* Traditional gross premiums written and alternative market ceded premiums written for the 2016 three- and six-month periods are reported net of alternative market premiums assumed by our traditional business totaling $0.2 million and $0.5 million, respectively. | |||||||||||||||||||||||
Our traditional workers’ compensation insurance products include guaranteed cost, dividend, deductible, and retrospectively-rated policies. Our alternative market business is 100% ceded to either the SPCs at our wholly owned Cayman Islands reinsurance subsidiary, Eastern Re, or to unaffiliated captive insurers. As of June 30, 2016, there were 23 (20 active) SPCs at Eastern Re and 4 active alternative market programs with unaffiliated captive insurers. We added a new alternative market program with an unaffiliated captive insurer during the first quarter of 2016 with direct premiums written of $1.9 million for the six-months ended June 30, 2016.
Additional information regarding the structure of the SPCs is included in the Underwriting, Policy Acquisition and Operating Expense section that follows.
68
Gross Premiums Written
Gross premiums written in our traditional and alternative market business for the three and six months ended June 30, 2016 and 2015 are reflected in the table on the previous page. The decrease in traditional gross premiums written for the three and six months ended June 30, 2016 primarily reflects price competition in the geographic markets in which we operate. The decrease in the traditional retention rate for the three months ended June 30, 2016 includes the non-renewal of two large accounts for underwriting reasons with expiring premium of approximately $1.3 million. We retained all 14 of the available alternative market programs up for renewal in the first six months of 2016, including five programs in the second quarter of 2016.
New business, audit premium, retention and renewal price changes for both the traditional business and the alternative market business for 2016 and 2015 are shown in the table below:
Three Months Ended June 30 | |||||||||||||||||||
2016 | 2015 | ||||||||||||||||||
($ in millions) | Traditional Business | Alternative Market Business | Segment Results | Traditional Business | Alternative Market Business | Segment Results | |||||||||||||
New business | $ | 4.7 | $ | 1.8 | $ | 6.5 | $ | 6.1 | $ | 1.9 | $ | 8.0 | |||||||
Audit premium (including EBUB) | $ | 1.1 | $ | 0.5 | $ | 1.6 | $ | 1.4 | $ | (0.1 | ) | $ | 1.3 | ||||||
Retention rate (1) | 80 | % | 83 | % | 81 | % | 81 | % | 86 | % | 82 | % | |||||||
Change in renewal pricing (2) | 2 | % | 2 | % | 2 | % | 5 | % | 2 | % | 4 | % | |||||||
Six Months Ended June 30 | |||||||||||||||||||
2016 | 2015 | ||||||||||||||||||
($ in millions) | Traditional Business | Alternative Market Business | Segment Results | Traditional Business | Alternative Market Business | Segment Results | |||||||||||||
New business | $ | 9.8 | $ | 6.1 | $ | 15.9 | $ | 15.9 | $ | 4.6 | $ | 20.4 | |||||||
Audit premium (including EBUB) | $ | 2.6 | $ | 0.5 | $ | 3.1 | $ | 2.4 | $ | 0.3 | $ | 2.7 | |||||||
Retention rate (1) | 84 | % | 89 | % | 85 | % | 83 | % | 91 | % | 85 | % | |||||||
Change in renewal pricing (2) | (1 | %) | — | % | — | % | 2 | % | 2 | % | 2 | % | |||||||
(1) We calculate our workers' compensation retention rate as annualized expiring renewed premium divided by all annualized expiring premium subject to renewal. Our retention rate can be impacted by various factors, including price or other competitive issues, insureds being acquired, or a decision not to renew based on our underwriting evaluation.
(2) The pricing of our business includes an assessment of the underlying policy exposure and the effects of current market conditions. We continue to base our pricing on expected losses, as indicated by our historical loss data. Changes in the renewal rate reflect the competitive workers’ compensation environment.
69
Ceded Premiums Written
Ceded premiums written reflected our external reinsurance programs and alternative market business ceded to unaffiliated captive insurance companies.
Ceded premiums written were as follows:
Three Months Ended June 30 | Six Months Ended June 30 | ||||||||||||||||||||||
($ in thousands) | 2016 | 2015 | Change | 2016 | 2015 | Change | |||||||||||||||||
Premiums ceded to external reinsurers | |||||||||||||||||||||||
Traditional business | $ | 2,122 | $ | 1,989 | $ | 133 | 6.7 | % | $ | 4,602 | $ | 4,653 | $ | (51 | ) | (1.1 | %) | ||||||
Alternative market business | 1,555 | 1,751 | (196 | ) | (11.2 | %) | 3,881 | 3,423 | 458 | 13.4 | % | ||||||||||||
Segment results | 3,677 | 3,740 | (63 | ) | (1.7 | %) | 8,483 | 8,076 | 407 | 5.0 | % | ||||||||||||
Change in return premium estimate under external reinsurance | |||||||||||||||||||||||
Traditional business | (298 | ) | 183 | (481 | ) | (262.8 | %) | (279 | ) | 717 | (996 | ) | (138.9 | %) | |||||||||
Alternative market business | — | — | — | nm | — | — | — | nm | |||||||||||||||
Segment results | (298 | ) | 183 | (481 | ) | (262.8 | %) | (279 | ) | 717 | (996 | ) | (138.9 | %) | |||||||||
Premiums ceded to unaffiliated captive insurers | |||||||||||||||||||||||
Traditional business | — | — | — | nm | — | — | — | nm | |||||||||||||||
Alternative market business | 1,093 | 1,521 | (428 | ) | (28.1 | %) | 4,764 | 3,567 | 1,197 | 33.6 | % | ||||||||||||
Segment results | 1,093 | 1,521 | (428 | ) | (28.1 | %) | 4,764 | 3,567 | 1,197 | 33.6 | % | ||||||||||||
Total ceded premiums written | |||||||||||||||||||||||
Traditional business | 1,824 | 2,172 | (348 | ) | (16.0 | %) | 4,323 | 5,370 | (1,047 | ) | (19.5 | %) | |||||||||||
Alternative market business | 2,648 | 3,272 | (624 | ) | (19.1 | %) | 8,645 | 6,990 | 1,655 | 23.7 | % | ||||||||||||
Segment results | $ | 4,472 | $ | 5,444 | $ | (972 | ) | (17.9 | %) | $ | 12,968 | $ | 12,360 | $ | 608 | 4.9 | % | ||||||
We retain the first $0.5 million in risk insured by us on our traditional business and cede losses in excess of this amount on each loss occurrence under our primary external reinsurance contract. The traditional external reinsurance contract contains a return premium provision under which we estimate return premium based on the underlying loss experience of policies covered under the contract. Changes in the return premium estimate reflect the loss experience under the reinsurance contract for the three and six months ended June 30, 2016 and 2015. In our alternative market business, the risk retention for each loss occurrence ranges from $0.3 million to $0.35 million based on the alternative market program. We cede 100% of premiums written under four alternative market programs to unaffiliated captive insurers.
Premiums ceded to external reinsurers in our traditional business increased during the three months ended June 30, 2016, which primarily reflects an increase in reinsurance rates for the contract year effective May 1, 2016. The decrease for the six months ended June 30, 2016 primarily reflects a reduction in reinsurance rates from the previous reinsurance contract, partially offset by the increase in reinsurance rates from the renewed reinsurance contract.
The return premium estimate increased $0.3 million for the three and six months ended June 30, 2016, which reflected loss experience on reinsurance contract years prior to 2014. The change in the return premium estimate, for the three and six months ended June 30, 2015, reflected reinsured claim activity that reduced the return premium estimate for the 2014 reinsurance contract year.
The workers’ compensation segment has experienced an increase in severity related claims, which has resulted in an increase in losses ceded under our external reinsurance contract. Calendar year ceded incurred losses in both our traditional and alternative market business totaled $8.3 million and $18.6 million for the three and six months ended June 30, 2016, respectively, and $2.5 million and $7.0 million for the same respective periods of 2015. In our traditional business, ceded incurred losses totaled $5.5 million and $16.0 million for the three and six months ended June 30, 2016, respectively, compared to $2.1 million and $5.0 million for the same respective periods of 2015. The increase in traditional ceded losses for the 2016 six-month period primarily reflects 3 loss occurrences totaling $12.4 million. The increase in our traditional reinsurance rate primarily reflects the increase in claim severity. Additionally, we have not accrued any return premium for the 2014 or 2015 reinsurance contract years as a result of the increase in ceded losses.
The decrease in premiums ceded to unaffiliated captive insurers during the three months ended June 30, 2016 primarily reflects the non-renewal of accounts for underwriting reasons. The increase in premiums ceded to unaffiliated captive insurers
70
during the six months ended June 30, 2016 primarily reflects the new alternative market program in the first quarter of 2016, partially offset by the non-renewed accounts noted above.
Ceded Premiums Ratio
Ceded premiums ratio was as follows:
Three Months Ended June 30 | |||||||
2016 | 2015 | ||||||
Traditional Business | Alternative Market Business | Segment Results | Traditional Business | Alternative Market Business | Segment Results | ||
Ceded premiums ratio, as reported | 4.4% | 17.7% | 7.9% | 4.9% | 23.1% | 9.3% | |
Less the effect of: | |||||||
Return premium estimated under external reinsurance | (0.7%) | —% | (0.5%) | 0.4% | —% | 0.3% | |
Premiums ceded to unaffiliated captive insurer (100%) | —% | 6.5% | 1.8% | —% | 9.3% | 2.4% | |
Ceded premiums ratio, less the effects of above | 5.1% | 11.2% | 6.6% | 4.5% | 13.8% | 6.6% | |
Six Months Ended June 30 | |||||||
2016 | 2015 | ||||||
Traditional Business | Alternative Market Business | Segment Results | Traditional Business | Alternative Market Business | Segment Results | ||
Ceded premiums ratio, as reported | 4.6% | 20.9% | 9.6% | 5.5% | 19.0% | 9.2% | |
Less the effect of: | |||||||
Return premium estimated under external reinsurance | (0.3%) | —% | (0.2%) | 0.7% | —% | 0.5% | |
Premiums ceded to unaffiliated captive insurer (100%) | —% | 10.3% | 3.3% | —% | 8.7% | 2.5% | |
Ceded premiums ratio, less the effects of above | 4.9% | 10.6% | 6.5% | 4.8% | 10.3% | 6.2% | |
Per our reinsurance agreements, we cede premiums related to our traditional business on an earned premium basis, whereas alternative market premiums are ceded on a written premium basis. The increase in the traditional ceded premiums ratio, less the effect of return premiums, for the 2016 three- and six-month periods when compared to same periods of 2015 reflect the increase in reinsurance rates noted above. The decrease in the alternative market ceded premiums ratio for the 2016 three-month period primarily reflects the impact of the premiums ceded to and assumed by the traditional business.
71
Net Premiums Earned
Net premiums earned were as follows:
Three Months Ended June 30 | Six Months Ended June 30 | ||||||||||||||||||||||
($ in thousands) | 2016* | 2015 | Change | 2016* | 2015 | Change | |||||||||||||||||
Gross premiums earned | |||||||||||||||||||||||
Traditional business | $ | 42,193 | $ | 43,986 | $ | (1,793 | ) | (4.1 | %) | $ | 84,844 | $ | 85,989 | $ | (1,145 | ) | (1.3 | %) | |||||
Alternative market business | 18,805 | 15,885 | 2,920 | 18.4 | % | 37,099 | 31,615 | 5,484 | 17.3 | % | |||||||||||||
Segment results | 60,998 | 59,871 | 1,127 | 1.9 | % | 121,943 | 117,604 | 4,339 | 3.7 | % | |||||||||||||
Less: Ceded premiums earned | |||||||||||||||||||||||
Traditional business | 1,823 | 2,869 | (1,046 | ) | (36.5 | %) | 4,324 | 5,923 | (1,599 | ) | (27.0 | %) | |||||||||||
Alternative market business | 4,082 | 3,421 | 661 | 19.3 | % | 8,143 | 6,823 | 1,320 | 19.3 | % | |||||||||||||
Segment results | 5,905 | 6,290 | (385 | ) | (6.1 | %) | 12,467 | 12,746 | (279 | ) | (2.2 | %) | |||||||||||
Net premiums earned | |||||||||||||||||||||||
Traditional business | 40,370 | 41,117 | (747 | ) | (1.8 | %) | 80,520 | 80,066 | 454 | 0.6 | % | ||||||||||||
Alternative market business | 14,723 | 12,464 | 2,259 | 18.1 | % | 28,956 | 24,792 | 4,164 | 16.8 | % | |||||||||||||
Segment results | $ | 55,093 | $ | 53,581 | $ | 1,512 | 2.8 | % | $ | 109,476 | $ | 104,858 | $ | 4,618 | 4.4 | % | |||||||
* Traditional gross premiums earned and alternative market ceded premiums earned for the 2016 three- and six-month periods are reported net of alternative market premiums assumed by our traditional business totaling $0.2 million and $0.5 million, respectively. | |||||||||||||||||||||||
Net premiums earned consist of gross premiums earned less the portion of earned premiums that we cede to our reinsurers for their assumption of a portion of our losses. Our workers’ compensation policies are twelve-month policies and premiums are earned on a pro rata basis over the policy period. Net premiums earned also include premium adjustments related to the audit of our insureds' payrolls. Payroll audits are conducted subsequent to the end of the policy period and any related adjustments are recorded as fully earned in the current period. In addition, we record an estimate for EBUB and evaluate the estimate on a quarterly basis. We did not adjust the EBUB estimate during the three and six months ended June 30, 2016. We increased the EBUB estimate by $0.2 million during the three and six months ended June 30, 2015.
72
Losses and Loss Adjustment Expenses
The following table summarizes calendar year net loss ratios by separating losses between the current accident year and all prior accident years. Calendar year net loss ratios by component were as follows:
Net Loss Ratios | ||||||||||||||||||||
Three Months Ended June 30 | ||||||||||||||||||||
2016 | 2015 | Change | ||||||||||||||||||
Traditional Business | Alternative Market Business | Segment Results | Traditional Business | Alternative Market Business | Segment Results | Traditional Business | Alternative Market Business | Segment Results | ||||||||||||
Calendar year net loss ratio* | 66.5 | % | 52.7 | % | 62.9 | % | 65.6 | % | 59.0 | % | 64.0 | % | 0.9 | (6.3 | ) | (1.1 | ) | |||
Less impact of prior accident years on the net loss ratio | (1.0 | %) | (4.4 | %) | (1.9 | %) | (0.9 | %) | (8.6 | %) | (2.8 | %) | (0.1 | ) | 4.2 | 0.9 | ||||
Current accident year net loss ratio | 67.5 | % | 57.1 | % | 64.8 | % | 66.5 | % | 67.6 | % | 66.8 | % | 1.0 | (10.5 | ) | (2.0 | ) | |||
Less impact of audit premium on loss ratio | — | % | (1.8 | %) | (0.6 | %) | — | % | 0.3 | % | 0.1 | % | — | (2.1 | ) | (0.7 | ) | |||
Current accident year net loss ratio, excluding the effect of audit premium | 67.5 | % | 58.9 | % | 65.4 | % | 66.5 | % | 67.3 | % | 66.7 | % | 1.0 | (8.4 | ) | (1.3 | ) | |||
Net Loss Ratios | |||||||||||||||||||
Six Months Ended June 30 | |||||||||||||||||||
2016 | 2015 | Change | |||||||||||||||||
Traditional Business | Alternative Market Business | Segment Results | Traditional Business | Alternative Market Business | Segment Results | Traditional Business | Alternative Market Business | Segment Results | |||||||||||
Calendar year net loss ratio* | 66.5 | % | 55.4 | % | 63.7 | % | 65.5 | % | 56.2 | % | 63.3 | % | 1.0 | (0.8 | ) | 0.4 | |||
Less impact of prior accident years on the net loss ratio | (1.0 | %) | (4.6 | %) | (1.9 | %) | (1.0 | %) | (9.7 | %) | (3.1 | %) | — | 5.1 | 1.2 | ||||
Current accident year net loss ratio | 67.5 | % | 60.0 | % | 65.6 | % | 66.5 | % | 65.9 | % | 66.4 | % | 1.0 | (5.9 | ) | (0.8 | ) | ||
Less impact of audit premium on loss ratio | — | % | (0.9 | %) | (0.3 | %) | — | % | (0.8 | %) | (2.0 | %) | — | (0.1 | ) | 1.7 | |||
Current accident year net loss ratio, excluding the effect of audit premium | 67.5 | % | 60.9 | % | 65.9 | % | 66.5 | % | 66.7 | % | 68.4 | % | 1.0 | (5.8 | ) | (2.5 | ) | ||
* The net loss ratios for the 2016 three- and six-month periods in the above tables are calculated before the impact of the $0.2 million and $0.5 million, respectively, of premiums earned that is assumed by and ceded from the traditional and alternative markets business. | |||||||||||||||||||
The current accident year net loss ratio in our traditional business increased during both the 2016 three- and six-month periods and primarily reflected the decrease in renewal rates in 2016. The decrease in the current accident year net loss ratio in our alternative market business for the 2016 three- and six-month periods reflects improved loss experience.
We recognized net favorable prior year development related to our previously established reserve of $1.0 million and $2.1 million for the three and six months ended June 30, 2016, respectively, and $1.5 million and $3.2 million for the same respective periods of 2015. The net favorable prior year development included $0.4 million and $0.8 million for both the three and six months ended June 30, 2016 and 2015, respectively, related to amortization of the purchase accounting fair value adjustment for our traditional business. Favorable net prior year development in our alternative market business was $0.6 million and $1.3 million for the three and six months ended June 30, 2016, respectively, and $1.1 million and $2.4 million for the same respective periods of 2015.
Within our alternative market business, audit premium from insureds results in a decrease in the net loss ratio, whereas audit premium returned to insureds results in an increase in the net loss ratio. We recognized audit premium in the three and six months ended June 30, 2016 and 2015, and the effect of which is reflected in the tables above.
In our traditional business, we estimate our current accident year loss and loss adjustment expenses based on an expected loss ratio. Incurred losses and loss adjustment expenses are determined by applying the expected loss ratio to net premiums earned, which includes audit premium, for the respective period. In our alternative market business, we estimate our current accident year losses and loss adjustment expenses based on the underlying actuarial methodologies without consideration of
73
audit premium. As a result, we remove the effects of audit premium in the above table for purposes of evaluating the current accident year loss ratio.
Underwriting, Policy Acquisition and Operating Expenses
Underwriting, policy acquisition and operating expenses include commissions, premium taxes and underwriting salaries, which are capitalized and deferred over the related workers’ compensation policy period, net of external ceding commissions earned. The capitalization of these costs can vary as they are subject to the success rate of our contract acquisition efforts. These expenses also include a management fee charged by the Corporate segment, which represents intercompany charges pursuant to a management agreement that became effective in 2015. The fee is based on the extent to which services are provided to the subsidiary and the amount of premium written by the subsidiary.
The table below provides a comparison of underwriting, policy acquisition and operating expenses:
Three Months Ended June 30 | Six Months Ended June 30 | ||||||||||||||||||||||
($ in thousands) | 2016 | 2015 | Change | 2016 | 2015 | Change | |||||||||||||||||
Traditional business | $ | 11,839 | $ | 11,888 | $ | (49 | ) | (0.4 | %) | $ | 25,316 | $ | 23,367 | $ | 1,949 | 8.3 | % | ||||||
Alternative market business | 4,495 | 3,943 | 552 | 14.0 | % | 8,849 | 7,822 | 1,027 | 13.1 | % | |||||||||||||
Underwriting, policy acquisition and operating expenses | $ | 16,334 | $ | 15,831 | $ | 503 | 3.2 | % | $ | 34,165 | $ | 31,189 | $ | 2,976 | 9.5 | % | |||||||
74
Underwriting Expense Ratio (the Expense Ratio)
The underwriting expense ratio for the Workers' Compensation segment included the impact of the following:
Underwriting Expense Ratios | ||||||||||||||||||||
Three Months Ended June 30 | ||||||||||||||||||||
2016 | 2015 | Change | ||||||||||||||||||
Traditional Business | Alternative Market Business | Segment Results | Traditional Business | Alternative Market Business | Segment Results | Traditional Business | Alternative Market Business | Segment Results | ||||||||||||
Underwriting expense ratio, as reported* | 29.2 | % | 31.0 | % | 29.6 | % | 28.9 | % | 31.6 | % | 29.5 | % | 0.3 | (0.6 | ) | 0.1 | ||||
Less estimated ratio increase (decrease) attributable to: | ||||||||||||||||||||
Amortization of intangible assets | 3.2 | % | — | % | 2.4 | % | 3.2 | % | — | % | 2.4 | % | — | — | — | |||||
Management fee | 1.0 | % | — | % | 0.8 | % | 1.1 | % | — | % | 0.8 | % | (0.1 | ) | — | — | ||||
Impact of audit premium | (0.8 | %) | (1.1 | %) | (0.9 | %) | (1.2 | %) | 0.2 | % | (0.9 | %) | 0.4 | (1.3 | ) | — | ||||
Impact of return premium estimate | (0.2 | %) | — | % | (0.2 | %) | 0.1 | % | — | % | 0.1 | % | (0.3 | ) | — | (0.3 | ) | |||
Underwriting expense ratio, less listed effects | 26.0 | % | 32.1 | % | 27.5 | % | 25.7 | % | 31.4 | % | 27.1 | % | 0.3 | 0.7 | 0.4 | |||||
* The underwriting expense ratios for 2016 in the above table are calculated before the impact of the $0.2 million of premiums earned that is assumed by and ceded from the traditional and alternative markets business, respectively. | ||||||||||||||||||||
Underwriting Expense Ratios | ||||||||||||||||||||
Six Months Ended June 30 | ||||||||||||||||||||
2016 | 2015 | Change | ||||||||||||||||||
Traditional Business | Alternative Market Business | Segment Results | Traditional Business | Alternative Market Business | Segment Results | Traditional Business | Alternative Market Business | Segment Results | ||||||||||||
Underwriting expense ratio, as reported* | 31.3 | % | 31.1 | % | 31.2 | % | 29.2 | % | 31.6 | % | 29.7 | % | 2.1 | (0.5 | ) | 1.5 | ||||
Less estimated ratio increase (decrease) attributable to: | ||||||||||||||||||||
Non-recurring/unusual expenses | 0.8 | % | — | % | 0.6 | % | — | % | — | % | — | % | 0.8 | — | 0.6 | |||||
Amortization of intangible assets | 3.2 | % | — | % | 2.4 | % | 3.2 | % | — | % | 2.5 | % | — | — | (0.1 | ) | ||||
Management fee | 1.2 | % | — | % | 0.9 | % | 1.3 | % | — | % | 1.0 | % | (0.1 | ) | — | (0.1 | ) | |||
Impact of audit premium | (1.1 | %) | (0.5 | %) | (0.9 | %) | (1.0 | %) | (0.4 | %) | (0.9 | %) | (0.1 | ) | (0.1 | ) | — | |||
Impact of return premium estimate | (0.1 | %) | — | % | (0.1 | %) | 0.3 | % | — | % | 0.2 | % | (0.4 | ) | — | (0.3 | ) | |||
Underwriting expense ratio, less listed effects | 27.3 | % | 31.6 | % | 28.3 | % | 25.4 | % | 32.0 | % | 26.9 | % | 1.9 | (0.4 | ) | 1.4 | ||||
* The underwriting expense ratios for 2016 in the above table are calculated before the impact of the $0.5 million of premiums earned that is assumed by and ceded from the traditional and alternative markets business, respectively. | ||||||||||||||||||||
Non-recurring expenses for the six months ended June 30, 2016 in the above table reflected a pension settlement charge of $0.6 million related to the purchase of annuities for in-pay pension plan participants. During the first quarter of 2016, a plan was approved to terminate a legacy Eastern pension plan. The termination of the pension plan is expected to be complete by the end of 2016 and will require additional cash contributions to fully fund the payment of benefits to the remaining participants. Management estimates the remaining cost to terminate the pension plan between $1.6 million and $2.1 million. The ultimate cost to complete the plan termination will be based on the difference between the cost to settle all plan liabilities and the fair value of the underlying plan assets. The cost to settle plan liabilities will vary based on whether participants elect a lump sum cash payment or an annuity. The cost of an annuity will be based on the current market rates at the time of settlement, which may be higher or lower than current market rates and can create variability in the ultimate settlement amount.
75
The remaining increase in the traditional expense ratio for the three and six months ended June 30, 2016, exclusive of the items noted in the tables, primarily reflected increases in employee benefit costs and retrospective premium adjustments, which reduced net premiums earned in 2016. The alternative markets expense ratio primarily reflected ceding commissions, which vary by program.
Segregated Portfolio Cell Dividend Expense (Income)
Our Workers' Compensation segment provides turn-key workers' compensation alternative market solutions that include program design, fronting, claims administration, risk management, SPC rental, asset management and SPC management services. The asset management and SPC management services are outsourced to a third party. Alternative market customers include individual companies, groups and associations. SPC dividend expense (income) for each period represents the profit or loss attributable to the alternative market business ceded to the SPCs of Eastern Re, net of any participation we have taken in the SPCs.
The SPCs are segregated pools of assets and liabilities that provide an insurance facility for a defined set of risks. Assets of each SPC are solely for the benefit of that individual cell and each SPC is solely responsible for the liabilities of that individual cell. Assets of one SPC are statutorily protected from the creditors of the others. We participate to a varying degree in the results of selected SPCs. Our ownership interest in the SPCs in which we participate is as low as 25% and as high as 77.5%. Under the SPC structure, the net operating results of each cell, net of our participation, are due to the external owners of that cell.
SPC dividend expense (income) was as follows:
Three Months Ended June 30 | Six Months Ended June 30 | ||||||||||||||||||||||
($ in thousands) | 2016 | 2015 | Change | 2016 | 2015 | Change | |||||||||||||||||
SPC net operating results - profit/(loss) | $ | 2,605 | $ | 1,273 | $ | 1,332 | 104.6 | % | $ | 4,559 | $ | 3,810 | $ | 749 | 19.7 | % | |||||||
Less: Eastern participation - profit/(loss) | 1,082 | 43 | 1,039 | 2,416.3 | % | 1,860 | 396 | 1,464 | 369.7 | % | |||||||||||||
SPC dividend expense (income) | $ | 1,523 | $ | 1,230 | $ | 293 | 23.8 | % | $ | 2,699 | $ | 3,414 | $ | (715 | ) | (20.9 | %) | ||||||
SPC operating results increased for the three and six months ended June 30, 2016, primarily reflecting a lower calendar year net loss ratio. The increase in income from our jointly-owned SPCs reflects improved operating results for both the three and six months ended June 30, 2016.
76
Segment Operating Results - Lloyd's Syndicate
Through a wholly owned and consolidated subsidiary, we are a corporate member of Lloyd's of London and have provided the majority (58%) of the capital to Syndicate 1729 which writes and reinsures property and casualty business. The remaining capital for Syndicate 1729 is provided by unrelated third parties, including private names and other corporate members.
Syndicate 1729 covers a range of property and casualty insurance and reinsurance lines, and has a maximum underwriting capacity of £90.0 million for the 2016 underwriting year, of which £51.8 million ($69.0 million based on June 30, 2016 exchange rates) is our allocated underwriting capacity. We are required to provide capital (also referred to as FAL) to support our underwriting capacity and are meeting our FAL requirement with investment securities held at Lloyd's. Our FAL securities had a fair value of $97.3 million at June 30, 2016, as discussed in Note 3 of the Notes to Condensed Consolidated Financial Statements.
Our Lloyd's Syndicate segment results include both our 58% participation in the operating results of Syndicate 1729 and 100% of the operating results of our wholly owned subsidiaries that support Syndicate 1729. We report results from our Syndicate 1729 involvement on a quarter delay, except that investment results associated with our FAL investments and certain U.S. paid administrative expenses are reported concurrently as that information is available on an earlier time frame.
Our Lloyd's Syndicate segment reported $0.5 million in net operating losses for the three months ended June 30, 2016 and net earnings of $1.1 million for the six months ended June 30, 2016, as compared to net operating losses of $0.9 million and $2.0 million for the same respective periods of 2015, comprised as follows:
Three Months Ended June 30 | Six Months Ended June 30 | ||||||||||||||||||||||
($ in thousands) | 2016 | 2015 | Change | 2016 | 2015 | Change | |||||||||||||||||
Gross premiums written | $ | 25,018 | $ | 25,832 | $ | (814 | ) | (3.2 | %) | $ | 31,914 | $ | 30,531 | $ | 1,383 | 4.5 | % | ||||||
Net premiums written | 19,618 | 22,202 | (2,584 | ) | (11.6 | %) | 26,233 | 26,211 | 22 | 0.1 | % | ||||||||||||
Net premiums earned | 13,513 | 9,104 | 4,409 | 48.4 | % | 25,954 | 14,862 | 11,092 | 74.6 | % | |||||||||||||
Net investment income | 337 | 189 | 148 | 78.3 | % | 653 | 393 | 260 | 66.2 | % | |||||||||||||
Net losses and loss adjustment expenses | 8,502 | 5,575 | 2,927 | 52.5 | % | 14,690 | 9,582 | 5,108 | 53.3 | % | |||||||||||||
Underwriting, policy acquisition and operating expenses | 5,240 | 3,964 | 1,276 | 32.2 | % | 10,406 | 7,544 | 2,862 | 37.9 | % | |||||||||||||
Income tax expense | 812 | 620 | 192 | 31.0 | % | 897 | 620 | 277 | 44.7 | % | |||||||||||||
Net loss ratio | 62.9% | 61.2% | 1.7 | 56.6% | 64.5% | (7.9 | ) | ||||||||||||||||
Underwriting expense ratio | 38.8% | 43.5% | (4.7 | ) | 40.1% | 50.8% | (10.7 | ) | |||||||||||||||
Gross premiums written in 2016 consisted of casualty coverages (65% of total gross written premium), property insurance coverages (24%), catastrophe reinsurance coverages (8%) and property reinsurance coverages (3%). Net premiums written decreased $2.6 million during the 2016 three-month period primarily attributable to timing differences related to the renewal of certain policies. Net premiums written for the 2016 six-month period were essentially flat between 2016 and 2015.
As discussed in our Specialty P&C segment operating results, Syndicate 1729 serves as a reinsurer on a quota share basis for a wholly owned insurance subsidiary in our Specialty P&C segment. For premium assumed, we include in written premium an estimate of all premiums to be earned over the entire period covered by the reinsurance agreement, generally one year, in the quarter in which the reinsurance agreement becomes effective. The quota share agreement with our Specialty P&C segment renewed effective January 1, 2016, and has been included in Lloyd's Syndicate segment written premium in the second quarter of 2016. Results from this ceding arrangement are reported in the Specialty P&C segment on the same quarter delay in order to be consistent with the Lloyd's Syndicate segment as the effect of doing so is not material.
The 2014 calendar year quota share arrangement with our Specialty P&C segment was commuted in December 2015. Due to the reporting delay, the effect of the commutation was reported by both segments in results during the first quarter 2016 and is reflected in the six months ended June 30, 2016. The commutation did not differ significantly from previously recorded amounts.
77
Net premiums earned consist of gross premiums earned less the portion of earned premiums that we cede to our reinsurers for their assumption of a portion of our losses. Policies written to date primarily carry a term of one year. Because premiums are generally earned pro rata over the entire policy period, fluctuations in premiums earned tend to lag those of premiums written. Additionally, premiums for certain policies and assumed reinsurance contracts are reported subsequent to the coverage period and/or may be subject to adjustment based on loss experience. These premium adjustments are earned when reported, which can result in further fluctuation in earned premium. Net premiums earned reported for the three- and six-month periods ended June 30, 2016 included premium assumed from our Specialty P&C segment of approximately $3.4 million and $7.0 million, respectively, and approximately $3.6 million and $7.0 million for the same respective periods of 2015.
Losses for each period were primarily recorded using the loss assumptions by risk category incorporated into the business plan submitted to Lloyd's for Syndicate 1729 with consideration given to loss experience incurred to date. The assumptions used in the business plan were consistent with loss results reflected in Lloyd's historical data for similar risks. We expect loss ratios to fluctuate from quarter to quarter as Syndicate 1729 writes more business and the book begins to mature. The loss ratios will also fluctuate due to the timing of earned premium adjustments described above. The increase in the net loss ratio for the three months ended June 30, 2016 as compared to the same period in 2015 reflects the effect of changes in the mix and timing of premium earned, largely offset by the recognition of $2.8 million in net favorable prior year development during the current period. We did not recognize any prior year development in 2015. The more favorable net loss ratio for the six months ended June 30, 2016 as compared the same period in 2015 reflects the effect of the recognition of $3.2 million in net favorable prior year development during the 2016 six month period, partially offset by shifts in the mix of business as well as increased reliance on the actual loss experience on the book of business written by Syndicate 1729.
Underwriting expenses increased by $1.3 million and $2.9 million, respectively, as compared to three and six months ended June 30, 2015, primarily reflecting a respective $1.9 million and $5.2 million increase in DPAC amortization. As operations have matured, the total amount of underwriting salaries has increased along with the number of policies successfully written. Underwriting compensation is capitalized as DPAC only when efforts are successful and amounts capitalized in 2016 were greater than in 2015. During 2014, the initial year of operations, no underwriting salaries were capitalized as DPAC, as there was no established success rate. The first quarter 2015 reflected results from 2014 due to the delay in reporting. Consequently, DPAC amortization was greater in 2016 than in 2015 but underwriting compensation charged directly to expense was lower in 2016 than in 2015. Also, certain startup expenses were incurred in 2015. The improvement in the 2016 expense ratio primarily reflects the increase in net premiums earned and we anticipate a continued reduction to the ratio as the level of net premiums earned is expected to grow.
Net investment income for the 2016 and 2015 three- and six-month periods was primarily attributable to interest earned on the FAL investments. Our FAL investments are primarily short-term investments and investment-grade corporate debt securities.
Operating results of this segment are subject to U.K. income tax law. Tax expense incurred in 2016 reflects use of prior year Syndicate 1729 operating losses to offset current period Syndicate 1729 operating profits.
78
Segment Operating Results - Corporate
Segment operating results for our Corporate segment for the three and six months ended June 30, 2016 were $19.2 million and $20.3 million, respectively, and were $8.4 million and $25.4 million for the same respective periods of 2015. Results included the following:
Three Months Ended June 30 | Six Months Ended June 30 | ||||||||||||||||||||||||||||
($ in thousands) | 2016 | 2015 | Change | 2016 | 2015 | Change | |||||||||||||||||||||||
Net investment income | $ | 24,246 | $ | 27,766 | $ | (3,520 | ) | (12.7 | %) | $ | 49,370 | $ | 54,865 | $ | (5,495 | ) | (10.0 | %) | |||||||||||
Equity in earnings (loss) of unconsolidated subsidiaries | 376 | 2,420 | (2,044 | ) | (84.5 | %) | (3,259 | ) | 4,041 | (7,300 | ) | (180.6 | %) | ||||||||||||||||
Total net realized investment gains (losses) | 10,915 | (3,832 | ) | 14,747 | 384.8 | % | 2,570 | 996 | 1,574 | 158.0 | % | ||||||||||||||||||
Operating expense | 8,157 | 7,162 | 995 | 13.9 | % | 15,665 | 12,531 | 3,134 | 25.0 | % | |||||||||||||||||||
Interest expense | 3,851 | 3,710 | 141 | 3.8 | % | 7,537 | 7,341 | 196 | 2.7 | % | |||||||||||||||||||
Income taxes | 4,601 | 7,234 | (2,633 | ) | (36.4 | %) | 5,880 | 14,941 | (9,061 | ) | (60.6 | %) | |||||||||||||||||
Net Investment Income, Equity in Earnings (Loss) of Unconsolidated Subsidiaries, Net Realized Investment Gains (Losses)
Net Investment Income
Net investment income is primarily derived from the income earned by our fixed maturity securities and also includes dividend income from equity securities, income from our short-term and cash equivalent investments, earnings from other investments and increases in the cash surrender value of BOLI contracts. Investment fees and expenses are deducted from investment income.
Net investment income by investment category was as follows:
Three Months Ended June 30 | Six Months Ended June 30 | ||||||||||||||||||||||||||||
($ in thousands) | 2016 | 2015 | Change | 2016 | 2015 | Change | |||||||||||||||||||||||
Fixed maturities | $ | 20,853 | $ | 24,783 | $ | (3,930 | ) | (15.9 | %) | $ | 43,099 | $ | 49,521 | $ | (6,422 | ) | (13.0 | %) | |||||||||||
Equities | 3,561 | 3,456 | 105 | 3.0 | % | 7,204 | 6,468 | 736 | 11.4 | % | |||||||||||||||||||
Short-term and Other investments | 673 | 394 | 279 | 70.8 | % | 1,068 | 896 | 172 | 19.2 | % | |||||||||||||||||||
BOLI | 439 | 474 | (35 | ) | (7.4 | %) | 899 | 930 | (31 | ) | (3.3 | %) | |||||||||||||||||
Investment fees and expenses | (1,280 | ) | (1,341 | ) | 61 | 4.5 | % | (2,900 | ) | (2,950 | ) | 50 | 1.7 | % | |||||||||||||||
Net investment income | $ | 24,246 | $ | 27,766 | $ | (3,520 | ) | (12.7 | %) | $ | 49,370 | $ | 54,865 | $ | (5,495 | ) | (10.0 | %) | |||||||||||
Fixed Maturities
The decrease in our income from fixed maturity securities for the three- and six-month periods of 2016 was due to lower average investment balances and to lower yields. We reduced the size of our fixed portfolio over the last year in order to repurchase stock, pay dividends and invest in other asset classes. On an overall basis our average investment in fixed securities was approximately 9% and 10% lower for the three- and six-month periods of 2016, respectively, as compared to the same periods in 2015.
Average yields for our fixed maturity portfolio were as follows:
Three Months Ended June 30 | Six Months Ended June 30 | ||||||
2016 | 2015 | 2016 | 2015 | ||||
Average income yield | 3.3% | 3.5% | 3.4% | 3.4% | |||
Average tax equivalent income yield | 3.7% | 4.0% | 3.8% | 3.9% | |||
Equities
Income from our equity portfolio increased during the 2016 three- and six-month periods as compared to the same periods in 2015 reflecting an increase to our allocation to this asset category as well as a different mix of equities owned.
79
Equity in Earnings (Loss) of Unconsolidated Subsidiaries
Equity in earnings (loss) of unconsolidated subsidiaries is derived from our investment interests accounted for under the equity method. Results were as follows:
Three Months Ended June 30 | Six Months Ended June 30 | ||||||||||||||||||||||||||||
($ in thousands) | 2016 | 2015 | Change | 2016 | 2015 | Change | |||||||||||||||||||||||
Investment LPs/LLCs | $ | 3,539 | $ | 5,067 | $ | (1,528 | ) | (30.2 | %) | $ | 5,343 | $ | 9,207 | $ | (3,864 | ) | (42.0 | %) | |||||||||||
Tax credit partnerships | (3,163 | ) | (2,647 | ) | (516 | ) | 19.5 | % | (8,602 | ) | (5,166 | ) | (3,436 | ) | 66.5 | % | |||||||||||||
Equity in earnings (loss) of unconsolidated subsidiaries | $ | 376 | $ | 2,420 | $ | (2,044 | ) | (84.5 | %) | $ | (3,259 | ) | $ | 4,041 | $ | (7,300 | ) | (180.6 | %) | ||||||||||
We hold interests in certain LPs/LLCs that generate earnings from trading portfolios, secured debt, debt securities, multi-strategy funds and private equity investments. The performance of the LPs is affected by the volatility of equity and credit markets. Our investment LPs/LLCs results for the 2016 three- and six-month periods were affected primarily by lower reported earnings from two LPs which did not perform as well as in prior periods.
Our tax credit investments are designed to generate returns in the form of tax credits and tax-deductible project operating losses. We account for our tax credit investments under the equity method and record our allocable portion of the operating losses of the underlying properties based on estimates provided by the partnerships. We adjust our estimates of our allocable portion of operating losses periodically as actual operating results of the underlying properties become available. During the 2016 three- and six-month periods, based on operating results received, we increased our estimate of partnership operating losses by $0.4 million and $3.0 million, respectively. The increase represented an acceleration of operating losses; total operating losses expected over the life of the partnership did not change.
The tax benefits received from our tax credit partnerships, which are not reflected in our investment results above, reduced our tax expenses in 2016 and 2015 as follows:
Three Months Ended June 30 | Six Months Ended June 30 | ||||||||||||||
(In millions) | 2016 | 2015 | 2016 | 2015 | |||||||||||
Tax credits recognized during the period | $ | 6.3 | $ | 5.2 | $ | 13.5 | $ | 10.4 | |||||||
Tax benefit of tax credit partnership operating losses | $ | 1.1 | $ | 0.9 | $ | 3.0 | $ | 1.8 | |||||||
During 2015, we began investing in historic tax credit partnerships. Tax credits provided by the underlying projects of these partnerships are typically available in the tax year in which the project is put into active service, whereas the tax credits provided by qualified affordable housing tax credit partnerships are provided over approximately a ten year period. The increase in tax credits for 2016 was primarily provided by our historic tax credit partnership investments.
80
Non-GAAP Financial Measure – Tax Equivalent Investment Result
We believe that to fully understand our investment returns it is important to consider the current tax benefits associated with certain investments as the tax benefit received represents a portion of the return provided by our tax-exempt bonds, BOLI, common and preferred stocks, and tax credit partnership investments (our tax-preferred investments). We impute a pro forma tax-equivalent result by estimating the amount of fully-taxable income needed to achieve the same after-tax result as is currently provided by our tax-preferred investments. We believe this better reflects the economics behind our decision to invest in certain asset classes that are either taxed at lower rates and/or result in reductions to our current federal income tax expense. Our pro forma tax-equivalent investment result is shown in the table that follows as is a reconciliation of our tax equivalent result to our GAAP net investment result.
Three Months Ended June 30 | Six Months Ended June 30 | ||||||||||||||
(In thousands) | 2016 | 2015 | 2016 | 2015 | |||||||||||
GAAP net investment result: | |||||||||||||||
Net investment income | $ | 24,246 | $ | 27,766 | $ | 49,370 | $ | 54,865 | |||||||
Equity in earnings (loss) of unconsolidated subsidiaries | 376 | 2,420 | (3,259 | ) | 4,041 | ||||||||||
GAAP net investment result | $ | 24,622 | $ | 30,186 | $ | 46,111 | $ | 58,906 | |||||||
Pro forma tax-equivalent investment result | $ | 38,102 | $ | 43,001 | $ | 75,181 | $ | 84,351 | |||||||
Reconciliation of pro forma and GAAP tax-equivalent investment result: | |||||||||||||||
Pro forma tax-equivalent investment result | $ | 38,102 | $ | 43,001 | $ | 75,181 | $ | 84,351 | |||||||
Less taxable equivalent adjustments, calculated using the 35% federal statutory tax rate: | |||||||||||||||
State and municipal bonds | 3,011 | 3,685 | 6,104 | 7,498 | |||||||||||
BOLI | 237 | 255 | 484 | 501 | |||||||||||
Dividends received | 470 | 858 | 1,673 | 1,415 | |||||||||||
Tax credit partnerships | 9,762 | 8,017 | 20,809 | 16,031 | |||||||||||
GAAP net investment result | $ | 24,622 | $ | 30,186 | $ | 46,111 | $ | 58,906 | |||||||
81
Net Realized Investment Gains (Losses)
The following table provides detailed information regarding our net realized investment gains (losses).
Three Months Ended June 30 | Six Months Ended June 30 | ||||||||||||||
(In thousands) | 2016 | 2015 | 2016 | 2015 | |||||||||||
OTTI losses, total: | |||||||||||||||
Corporate debt | $ | — | $ | (1,209 | ) | $ | (7,604 | ) | $ | (4,480 | ) | ||||
Other investments | — | — | (3,130 | ) | — | ||||||||||
Portion recognized in OCI: | |||||||||||||||
Corporate debt | — | 348 | 1,068 | 1,789 | |||||||||||
Net impairments recognized in earnings | $ | — | $ | (861 | ) | $ | (9,666 | ) | $ | (2,691 | ) | ||||
Gross realized gains, available-for-sale securities | 1,883 | 3,624 | 5,066 | 7,625 | |||||||||||
Gross realized (losses), available-for-sale securities | (611 | ) | (810 | ) | (5,251 | ) | (2,065 | ) | |||||||
Net realized gains (losses), trading securities | 1,912 | 9,523 | 3,969 | 12,191 | |||||||||||
Net realized gains (losses), other investments | 447 | 602 | 498 | 718 | |||||||||||
Change in unrealized holding gains (losses), trading securities | 7,103 | (15,749 | ) | 7,838 | (14,893 | ) | |||||||||
Change in unrealized holding gains (losses), convertible securities, carried at fair value as a part of Other investments | 162 | (970 | ) | 95 | (698 | ) | |||||||||
Other | 19 | 809 | 21 | 809 | |||||||||||
Net realized investment gains (losses) | $ | 10,915 | $ | (3,832 | ) | $ | 2,570 | $ | 996 | ||||||
We did not recognize any OTTI during the 2016 three-month period. During the 2016 six-month period, we recognized OTTI through earnings of $6.5 million related to corporate bonds, including credit-related OTTI of $5.5 million related to debt instruments from ten issuers in the energy sector. The fair value of these bonds declined in the first quarter of 2016 as did the credit quality of the issuers and we recognized credit-related OTTI to reduce the amortized cost basis of the bonds to the present value of future cash flows we expected to receive from the bonds. During the 2016 six-month period, we also recognized non-credit impairments of $0.9 million in OCI relative to the bonds of these issuers, as the fair value of the bonds was less than the present value of the expected future cash flows from the securities.
During the 2016 six-month period, we recognized OTTI through earnings of $3.1 million related to our interest in an investment fund that is accounted for using the cost method (classified as part of Other investments). The fund is focused on the energy sector and securities held by the fund declined in value during the first quarter of 2016 and an OTTI was recognized to reduce our carrying value of the investment to the NAV reported by the fund.
During the 2015 three- and six-month periods, we recognized credit-related impairments of $0.9 million and $2.7 million, respectively, related to our investments in high-yield securities from three issuers in the energy industry. We also recognized non-credit impairments of $0.3 million and $1.8 million for the same respective periods of 2015 related to these securities as the fair value of the securities was less than the future cash flows expected to be received from the securities.
Operating Expenses
Corporate segment operating expenses were $8.2 million and $15.7 million for the three and six months ended June 30, 2016, respectively, and were $7.2 million and $12.5 million for the same respective periods of 2015.
Segment operating expenses were comprised as follows:
Three Months Ended June 30 | Six Months Ended June 30 | ||||||||||||||||||||||||||||
($ in thousands) | 2016 | 2015 | Change | 2016 | 2015 | Change | |||||||||||||||||||||||
Operating expenses | $ | 11,317 | $ | 10,208 | $ | 1,109 | 10.9 | % | $ | 22,630 | $ | 19,571 | $ | 3,059 | 15.6 | % | |||||||||||||
Management fee offset | (3,159 | ) | (3,045 | ) | (114 | ) | 3.7 | % | (6,966 | ) | (7,038 | ) | 72 | (1.0 | %) | ||||||||||||||
Segment Total | $ | 8,158 | $ | 7,163 | $ | 995 | 13.9 | % | $ | 15,664 | $ | 12,533 | $ | 3,131 | 25.0 | % | |||||||||||||
The increase in operating expenses for both the three and six months ended June 30, 2016 was primarily due to costs incurred in 2016 related to a pre-acquisition liability from a discontinued operation and an increase in share-based compensation expenses resulting from the adjustment of the projected award value based upon the improvement, in the quarter, of one of the performance metrics associated with a particular year's award.
82
Operating subsidiaries within our Specialty P&C and Workers' Compensation segments are charged a management fee by the Corporate segment for services provided to these subsidiaries. The management fee is based on the extent to which services are provided to the subsidiary and the amount of premium written by the subsidiary. Under the arrangement, the expenses associated with such services are reported as expenses of the Corporate segment, and the management fees charged are reported as an offset to Corporate operating expenses. The terms of the management arrangement were consistent between 2015 and 2016.
Interest Expense
Interest expense was relatively unchanged for the three and six months ended June 30, 2016 as compared to the same periods in 2015 as weighted average debt outstanding and interest rates applicable to borrowings were approximately the same in each period.
Interest expense was composed of the following:
Three Months Ended June 30 | Six Months Ended June 30 | ||||||||||||||||||||||
(In thousands) | 2016 | 2015 | Change | 2016 | 2015 | Change | |||||||||||||||||
Senior notes due 2023 | $ | 3,357 | $ | 3,357 | $ | — | $ | 6,714 | $ | 6,714 | $ | — | |||||||||||
Revolving credit agreement (including fees and amortization) | 484 | 344 | 140 | 803 | 608 | 195 | |||||||||||||||||
Other | 10 | 9 | 1 | 20 | 19 | 1 | |||||||||||||||||
$ | 3,851 | $ | 3,710 | $ | 141 | $ | 7,537 | $ | 7,341 | $ | 196 | ||||||||||||
Taxes
Tax expense allocated to our Corporate segment includes U.S. tax only, which would include U.S. tax expense incurred from our corporate membership in Lloyd's of London. The U.K. tax expense incurred by the U.K. based subsidiaries of our Lloyd's Syndicate segment is allocated to that segment. Consolidated tax expense reflects tax expense of both segments, as shown in the table below:
Three Months Ended June 30 | Six Months Ended June 30 | ||||||||||||||
(In thousands) | 2016 | 2015 | 2016 | 2015 | |||||||||||
Corporate segment income tax expense | $ | 4,601 | $ | 7,234 | $ | 5,880 | $ | 14,941 | |||||||
Lloyd's Syndicate segment income tax expense | 812 | 620 | 897 | 620 | |||||||||||
Consolidated income tax expense | $ | 5,413 | $ | 7,854 | $ | 6,777 | $ | 15,561 | |||||||
Factors affecting our consolidated effective tax rate include the following:
Three Months Ended June 30 | Six Months Ended June 30 | ||||||||||
2016 | 2015 | 2016 | 2015 | ||||||||
Statutory rate | 35.0 | % | 35.0 | % | 35.0 | % | 35.0 | % | |||
Tax-exempt income* | (6.7 | %) | (6.2 | %) | (6.9 | %) | (6.5 | %) | |||
Tax credits | (18.1 | %) | (12.1 | %) | (19.3 | %) | (12.1 | %) | |||
U.K. operating results | (0.1 | %) | 0.1 | % | (0.2 | %) | 0.2 | % | |||
Other | 1.1 | % | 2.4 | % | 1.2 | % | 1.4 | % | |||
Effective tax rate | 11.2 | % | 19.2 | % | 9.8 | % | 18.0 | % | |||
* Includes tax-exempt interest, dividends received deduction and change in cash surrender value of BOLI. | |||||||||||
83
We estimate our annual effective tax rate at the end of each quarterly reporting period, which is used to record the provision for income taxes in our interim financial statements. Our effective tax rates for both 2016 and 2015 were different from the statutory Federal income tax rate primarily due to the following:
• | A portion of our investment income was tax-exempt. |
• | We utilized tax credits transferred to us from our tax credit partnership investments. |
• | We did not recognize U.S. or U.K. tax expense relative to our pro rata portion of the operating profits of Syndicate 1729 in 2016 as we were able to utilize Syndicate 1729 operating losses from prior years as an offset. We did not recognize a tax benefit for our U.K. operating losses in 2015 as no tax benefit was currently available and it was not more likely than not that a future benefit would be realized. |
The increased effect of the tax credits for the 2016 three- and six-month periods was due to the combined effect of lower year-to-date pre-tax income and an increased amount of tax credits in 2016 as compared to 2015. Tax credits for the three- and six-month periods ended June 30, 2016 were $6.3 million and $13.5 million, respectively, as compared to $5.2 million and $10.4 million for the same respective periods of 2015.
84
ITEM 3. QUANTITATIVE AND QUALITATIVE DISCLOSURES ABOUT MARKET RISK.
We believe that we are principally exposed to three types of market risk related to our investment operations. These risks are interest rate risk, credit risk and equity price risk. We have limited exposure to foreign currency risk as we issue few insurance contracts denominated in currencies other than the U.S. dollar and we have few monetary assets or obligations denominated in foreign currencies.
Interest Rate Risk
Our fixed maturities portfolio is exposed to interest rate risk. Fluctuations in interest rates have a direct impact on the market valuation of these securities. As interest rates rise, market values of fixed income portfolios fall and vice versa. Certain of the securities are held in an unrealized loss position; we do not intend to sell and believe we will not be required to sell any of the debt securities held in an unrealized loss position before its anticipated recovery.
The following table summarizes estimated changes in the fair value of our available-for-sale fixed maturity securities for specific hypothetical changes in interest rates by asset class at June 30, 2016 and December 31, 2015. There are principally two factors that determine interest rates on a given security: market interest rates and credit spreads. As different asset classes can be affected in different ways by movements in those two factors, we have broken out our portfolio by asset class in the following table.
Interest Rate Shift in Basis Points | |||||||||||||||||||
June 30, 2016 | |||||||||||||||||||
(200) | (100) | Current | 100 | 200 | |||||||||||||||
Fair Value (in millions): | |||||||||||||||||||
U.S. Treasury obligations | $ | 149 | $ | 145 | $ | 141 | $ | 137 | $ | 133 | |||||||||
U.S. Government-sponsored enterprise obligations | 32 | 32 | 30 | 30 | 29 | ||||||||||||||
State and municipal bonds | 985 | 947 | 912 | 877 | 844 | ||||||||||||||
Corporate debt | 1,421 | 1,373 | 1,326 | 1,280 | 1,236 | ||||||||||||||
Asset-backed securities | 383 | 384 | 378 | 367 | 354 | ||||||||||||||
All fixed maturity securities | $ | 2,970 | $ | 2,881 | $ | 2,787 | $ | 2,691 | $ | 2,596 | |||||||||
Duration: | |||||||||||||||||||
U.S. Treasury obligations | 3.04 | 2.98 | 2.92 | 2.87 | 2.82 | ||||||||||||||
U.S. Government-sponsored enterprise obligations | 1.79 | 1.80 | 2.27 | 3.04 | 3.26 | ||||||||||||||
State and municipal bonds | 3.86 | 3.81 | 3.80 | 3.82 | 3.87 | ||||||||||||||
Corporate debt | 3.43 | 3.42 | 3.47 | 3.48 | 3.42 | ||||||||||||||
Asset-backed securities | 2.07 | 1.69 | 2.30 | 3.28 | 3.85 | ||||||||||||||
All fixed maturity securities | 3.36 | 3.28 | 3.38 | 3.53 | 3.59 | ||||||||||||||
December 31, 2015 | |||||||||||||||||||
Fair Value (in millions): | |||||||||||||||||||
U.S. Treasury obligations | $ | 132 | $ | 128 | $ | 124 | $ | 118 | $ | 113 | |||||||||
U.S. Government-sponsored enterprise obligations | 27 | 27 | 26 | 26 | 25 | ||||||||||||||
State and municipal bonds | 986 | 973 | 941 | 907 | 874 | ||||||||||||||
Corporate debt | 1,375 | 1,340 | 1,292 | 1,245 | 1,201 | ||||||||||||||
Asset-backed securities | 388 | 387 | 378 | 365 | 351 | ||||||||||||||
All fixed maturity securities | $ | 2,908 | $ | 2,855 | $ | 2,761 | $ | 2,661 | $ | 2,564 | |||||||||
Duration: | |||||||||||||||||||
U.S. Treasury obligations | 3.68 | 3.64 | 3.56 | 3.44 | 3.36 | ||||||||||||||
U.S. Government-sponsored enterprise obligations | 2.23 | 2.18 | 2.38 | 2.50 | 2.49 | ||||||||||||||
State and municipal bonds | 3.46 | 3.51 | 3.54 | 3.62 | 3.70 | ||||||||||||||
Corporate debt | 3.58 | 3.59 | 3.64 | 3.59 | 3.53 | ||||||||||||||
Asset-backed securities | 1.52 | 1.87 | 2.97 | 3.73 | 4.00 | ||||||||||||||
All fixed maturity securities | 3.26 | 3.32 | 3.50 | 3.60 | 3.63 | ||||||||||||||
85
Computations of prospective effects of hypothetical interest rate changes are based on numerous assumptions, including the maintenance of the existing level and composition of fixed income security assets, and should not be relied on as indicative of future results.
Certain shortcomings are inherent in the method of analysis presented in the computation of the fair value of fixed rate instruments. Actual values may differ from the projections presented should market conditions vary from assumptions used in the calculation of the fair value of individual securities, including non-parallel shifts in the term structure of interest rates and changing individual issuer credit spreads.
Our cash and short-term investment portfolio at June 30, 2016 was carried on a cost basis which approximates its fair value. Our portfolio lacks significant interest rate sensitivity due to its short duration.
Credit Risk
We have exposure to credit risk primarily as a holder of fixed income securities. We control this exposure by emphasizing investment grade credit quality in the fixed income securities we purchase.
As of June 30, 2016, 93% of our fixed maturity securities were rated investment grade as determined by NRSROs, such as Fitch, Moody’s and Standard & Poor’s. We believe that this concentration in investment grade securities reduces our exposure to credit risk on our fixed income investments to an acceptable level. However, investment grade securities, in spite of their rating, can rapidly deteriorate and result in significant losses. Ratings published by the NRSROs are one of the tools used to evaluate the credit worthiness of our securities. The ratings reflect the subjective opinion of the rating agencies as to the credit worthiness of the securities, and therefore, we may be subject to additional credit exposure should the rating prove to be unreliable.
We also have exposure to credit risk related to our receivables from reinsurers. Our receivables from reinsurers (with regard to both paid and unpaid losses) approximated $265 million at June 30, 2016 and $259 million at December 31, 2015. We monitor the credit risk associated with our reinsurers using publicly available financial and rating agency data.
Equity Price Risk
At June 30, 2016 the fair value of our equity investments, excluding our equity investments in bond investment funds as discussed in the following paragraph, was $266 million. These equity securities are subject to equity price risk, which is the potential for loss in fair value due to a decline in equity prices. The weighted average beta of this group of securities was 0.97. Beta measures the price sensitivity of an equity security or group of equity securities to a change in the broader equity market, in this case the S&P 500 Index. If the value of the S&P 500 Index increased by 10%, the fair value of these securities would be expected to increase by 9.7% to $292 million. Conversely, a 10% decrease in the S&P 500 Index would imply a decrease of 9.7% in the fair value of these securities to $240 million. The selected hypothetical changes of plus or minus 10% do not reflect what could be considered the best or worst case scenarios and are used for illustrative purposes only.
Our equity investments include equity investments in certain bond investment funds which are not significantly subject to equity price risk, and thus we have excluded these investments from the above analysis.
86
ITEM 4. CONTROLS AND PROCEDURES.
The Chief Executive Officer and Chief Financial Officer of the Company participated in management’s evaluation of our disclosure controls and procedures (as defined in SEC Rule 13a-15(e)) as of June 30, 2016. ProAssurance’s disclosure controls and procedures are designed to reasonably assure that information required to be disclosed by us in reports we file or submit under the Exchange Act is accumulated and communicated to our management as appropriate to allow timely decisions regarding disclosure and is recorded, processed, summarized and reported within the time periods specified in the Securities and Exchange Commission’s rules and forms. Based on that evaluation, the Chief Executive Officer and Chief Financial Officer have concluded that our disclosure controls and procedures are effective.
Changes in Internal Control over Financial Reporting
There have been no significant changes in our internal controls over financial reporting that have materially affected, or are reasonably likely to materially affect, those controls during the quarter.
PART II. OTHER INFORMATION
ITEM 1. LEGAL PROCEEDINGS.
See Note 7 of the Notes to Condensed Consolidated Financial Statements.
ITEM 1A. RISK FACTORS.
There are no changes to the "Risk Factors" in Part 1, Item 1A of the 2015 Form 10-K.
ITEM 2. UNREGISTERED SALES OF EQUITY SECURITIES AND USE OF PROCEEDS.
(a) | Not applicable. |
(b) | Not applicable. |
(c) | Information required by Item 703 of Regulation S-K. |
Period | Total Number of Shares Purchased | Average Price Paid per Share | Total Number of Shares Purchased as Part of Publicly Announced Plans or Programs | Approximate Dollar Value of Shares that May Yet Be Purchased Under the Plans or Programs * (In thousands) | ||||||
April 1 - 30, 2016 | 7,144 | $47.80 | 7,144 | $110,106 | ||||||
May 1 - 31, 2016 | 9,645 | $48.04 | 9,645 | $109,643 | ||||||
June 1 - 30, 2016 | — | N/A | — | $109,643 | ||||||
Total | 16,789 | $47.94 | 16,789 | |||||||
* | Under its current plan begun in November 2010, the ProAssurance Board of Directors has authorized $600 million for the repurchase of common shares or the retirement of outstanding debt. This is ProAssurance’s only plan for the repurchase of common shares, and the plan has no expiration date. |
87
ITEM 6. EXHIBITS
Exhibit Number | Description | |
10.1 | Amendment to Facility Agreement between ProAssurance and the Premium Trust Fund of Syndicate 1729 | |
31.1 | Certification of Principal Executive Officer of ProAssurance as required under SEC rule 13a-14(a). | |
31.2 | Certification of Principal Financial and Accounting Officer of ProAssurance as required under SEC rule 13a-14(a). | |
32.1 | Certification of Principal Executive Officer of ProAssurance as required under SEC Rule 13a-14(b) and Section 1350 of Chapter 63 of Title 18 of the United States Code, as amended (18 U.S.C. 1350). | |
32.2 | Certification of Principal Financial and Accounting Officer of ProAssurance as required under SEC Rule 13a-14(b) and Section 1350 of Chapter 63 of Title 18 of the United States Code, as amended (18 U.S.C. 1350). | |
101.INS | XBRL Instance Document | |
101.SCH | XBRL Taxonomy Extension Schema Document | |
101.CAL | XBRL Taxonomy Extension Calculation Linkbase Document | |
101.DEF | XBRL Taxonomy Extension Definition Linkbase Document | |
101.LAB | XBRL Taxonomy Extension Labels Linkbase Document | |
101.PRE | XBRL Taxonomy Extension Presentation Linkbase Document | |
88
SIGNATURE
Pursuant to the requirements of the Securities Exchange Act of 1934, the registrant has duly caused this report to be signed on its behalf by the undersigned, thereunto duly authorized.
PROASSURANCE CORPORATION |
August 3, 2016
/s/ Edward L. Rand, Jr. |
Edward L. Rand, Jr. |
Chief Financial Officer |
(Duly authorized officer and principal financial officer) |
89