Attached files
| file | filename |
|---|---|
| 8-K - FORM 8-K - Manitex International, Inc. | d658390d8k.htm |
Exhibit 99.1
Exhibit 99.1 MANITEX INTERNATIONAL, INC. NASDAQ: MNTX December Corporate Presentation 2018
Forward-Looking Statement and Non-GAAP Measures Safe Harbor Statement under the U.S. Private Securities Litigation Reform Act of 1995: This presentation contains statements that are forward-looking in nature which express the beliefs and expectations of management including statements regarding the Company’s expected results of operations or liquidity; statements concerning projections, predictions, expectations, estimates or forecasts as to our business, financial and operational results and future economic performance; and statements of management’s goals and objectives and other similar expressions concerning matters that are not historical facts. In some cases, you can identify forward-looking statements by terminology such as “anticipate,” “estimate,” “plan,” “project,” “continuing,” “ongoing,” “expect,” “we believe,” “we intend,” “may,” “will,” “should,” “could,” and similar expressions. Such statements are based on current plans, estimates and expectations and involve a number of known and unknown risks, uncertainties and other factors that could cause the Company’s future results, performance or achievements to differ significantly from the results, performance or achievements expressed or implied by such forward-looking statements. These factors and additional information are discussed in the Company’s filings with the Securities and Exchange Commission and statements in this presentation should be evaluated in light of these important factors. Although we believe that these statements are based upon reasonable assumptions, we cannot guarantee future results. Forward-looking statements speak only as of the date on which they are made, and the Company undertakes no obligation to update publicly or revise any forward-looking statement, whether as a result of new information, future developments or otherwise. Non-GAAP Measures: Manitex International from time to time refers to various non-GAAP (generally accepted accounting principles) financial measures in this presentation. Manitex believes that this information is useful to understanding its operating results without the impact of special items. See Manitex’s Q3 2018 earnings release on the Investor Relations section of our website www.manitexinternational.com for a description and/or reconciliation of these measures. 2 NASDAQ : MNTX
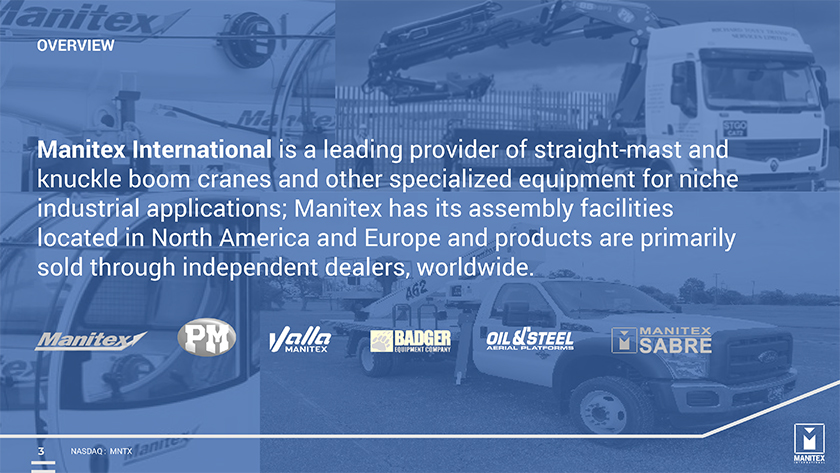
OVERVIEW Manitex International is a leading provider of straight-mast and knuckle boom cranes and other specialized equipment for niche industrial applications; Manitex has its assembly facilities located in North America and Europe and products are primarily sold through independent dealers, worldwide. 3 NASDAQ : MNTX
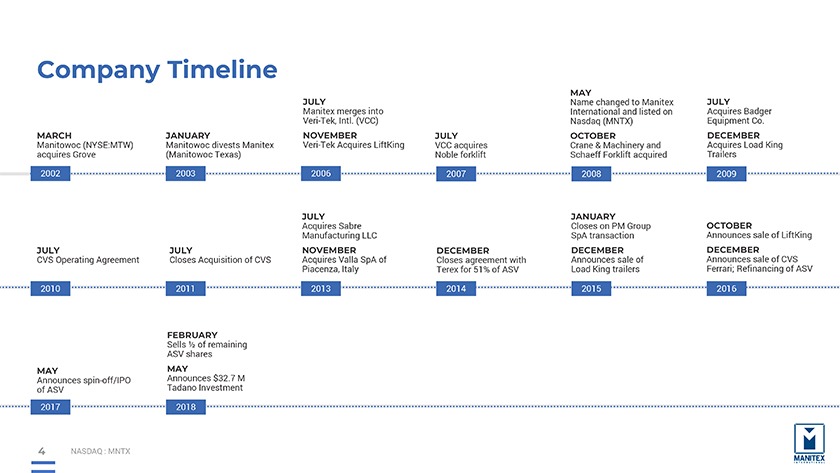
Company Timeline Manitowoc MARCH (NYSE:MTW) acquires Grove 2002 Manitowoc JANUARY divests Manitex (Manitowoc Texas) 2003 Manitex JULY merges into Veri-Tek, Intl. (VCC) Veri NOVEMBER -Tek Acquires LiftKing 2006 VCC JULY acquires Noble forklift 2007 Name MAY changed to Manitex International Nasdaq (MNTX) and listed on Crane OCTOBER & Machinery and Schaeff Forklift acquired 2008 Acquires JULY Badger Equipment Co. Acquires DECEMBER Load King Trailers 2009 CVS JULY Operating Agreement 2010 Closes JULY Acquisition of CVS 2011 Acquires JULY Sabre Manufacturing LLC Acquires NOVEMBER Valla SpA of Piacenza, Italy 2013 Closes DECEMBER agreement with Terex for 51% of ASV 2014 Closes JANUARY on PM Group SpA transaction Announces DECEMBER sale of Load King trailers 2015 Announces OCTOBER sale of LiftKing Announces DECEMBER sale of CVS Ferrari; Refinancing of ASV 2016 Announces MAY spin-off/IPO of ASV 2017 Sells FEBRUARY 1⁄2 of remaining ASV shares Announces MAY $32.7 M Tadano Investment 2018 4 NASDAQ : MNTX
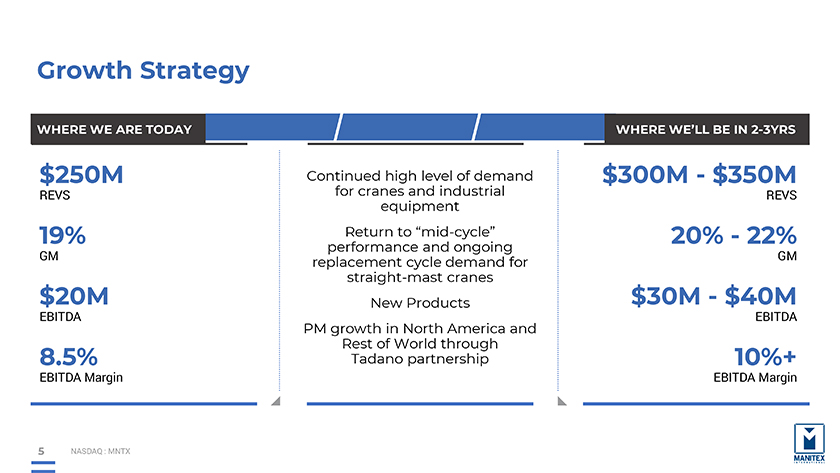
Growth Strategy WHERE WE ARE TODAY $250M REVS 19% GM $20M EBITDA 8.5% EBITDA Margin Continued high level of demand for cranes and industrial equipment Return to “mid-cycle” performance and ongoing replacement cycle demand for straight-mast cranes New Products PM growth in North America and Rest of World through Tadano partnership WHERE WE’LL BE IN 2-3YRS $300M—$350M REVS 20%—22% GM $30M—$40M EBITDA 10%+ EBITDA Margin 5 NASDAQ : MNTX
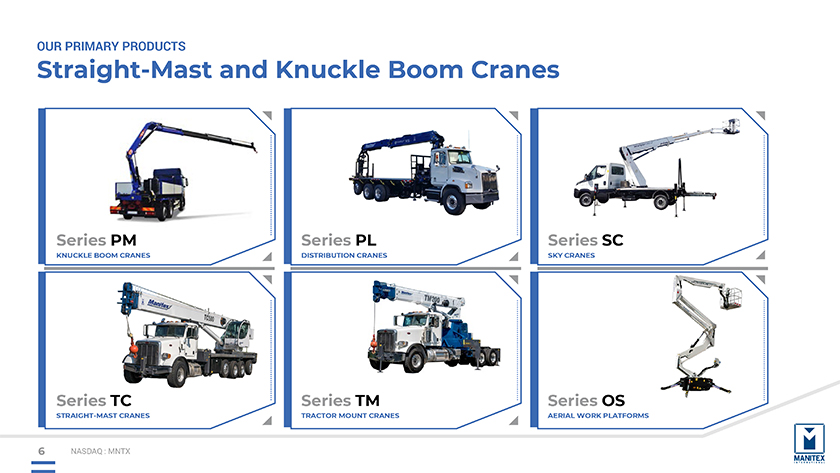
OUR PRIMARY PRODUCTS Straight-Mast and Knuckle Boom Cranes Series PM KNUCKLE BOOM CRANES Series PL DISTRIBUTION CRANES Series SC SKY CRANES Series TC STRAIGHT-MAST CRANES Series TM TRACTOR MOUNT CRANES Series OS AERIAL WORK PLATFORMS 6 NASDAQ : MNTX
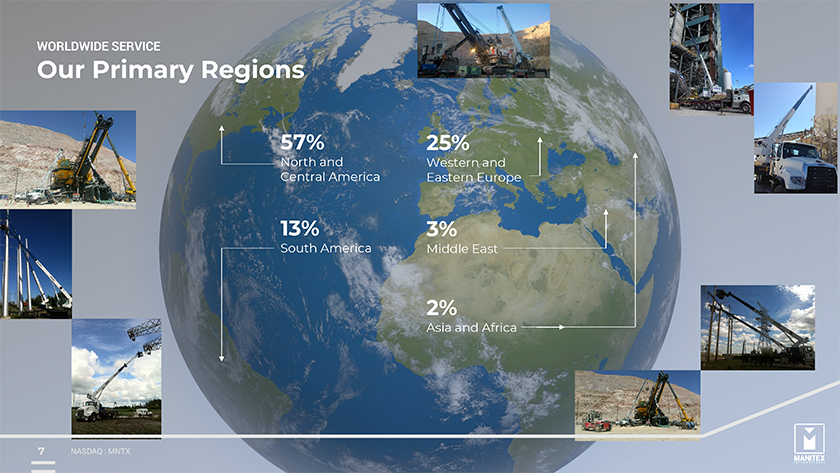
WORLDWIDE SERVICE Our Primary Regions 57% North and Central America 13% South America 25% Western and Eastern Europe 3% Middle East 2% Asia and Africa 7 NASDAQ : MNTX
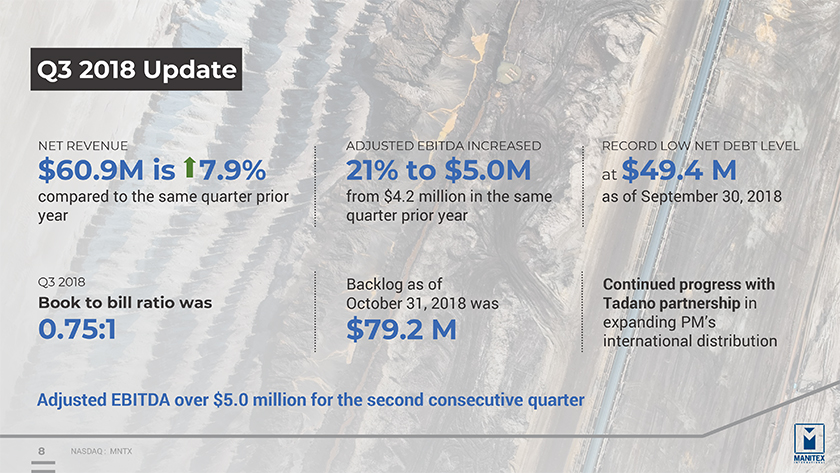
Q3 2018 Update NET $60 REVENUE .9M is 7.9% compared to the same quarter prior year Q3 2018 Book to bill ratio was 0.75:1 21% ADJUSTED to EBITDA $5 INCREASED .0M from $4.2 million in the same quarter prior year Backlog as of October $79. 31, 2 2018 M was RECORD LOW NET DEBT LEVEL at $49.4 M as of September 30, 2018 Continued progress with Tadano partnership in expanding PM’s international distribution Adjusted EBITDA over $5.0 million for the second consecutive quarter 8 NASDAQ : MNTX
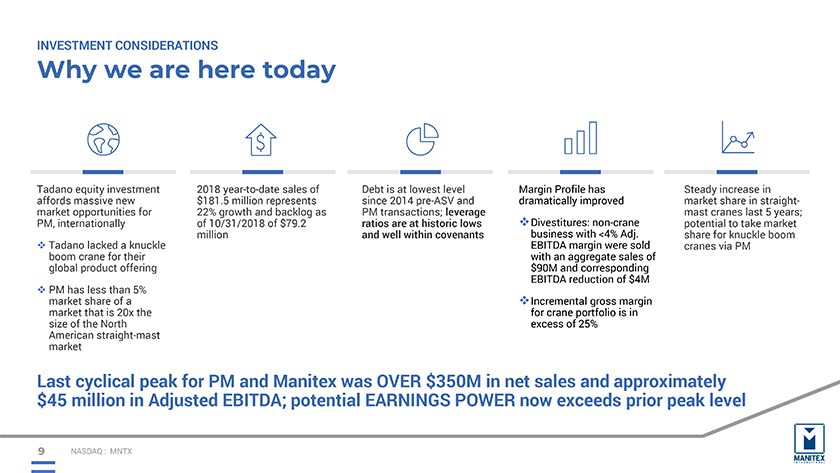
INVESTMENT CONSIDERATIONS Why we are here today Tadano affords massive equity investment new market PM, internationally opportunities for boom Tadano crane lacked for a their knuckle global product offering PM market has share less than of a 5% size market of the that North is 20x the American market straight-mast $ 2018 181. year 5 million -to-date represents sales of 22% of 10/31/2018 growth and of backlog $79.2 as million Debt since is 2014 at lowest pre-ASV level and ratios PM transactions; are at historic leverage lows and well within covenants dramatically Margin Profile improved has business Divestitures: with non <4% -crane Adj. with EBITDA an aggregate margin were sales sold of $ EBITDA 90M and reduction corresponding of $4M for Incremental crane portfolio gross is margin in excess of 25% Steady market increase share in straight in -mast potential cranes to take last market 5 years; share cranes for via knuckle PM boom Last $45 million cyclical in peak Adjusted for PM EBITDA; and Manitex potential was EARNINGS OVER $350M POWER in net now sales exceeds and approximately prior peak level 9 NASDAQ : MNTX
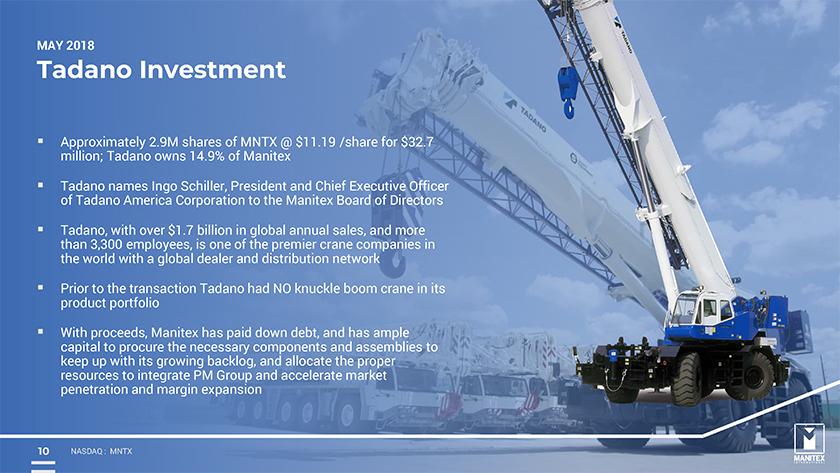
MAY 2018 Tadano Investment million; Approxi mately Tadano 2 owns .9M shares 14.9% of of MNTX Manitex @ $11.19 /share for $32.7 Tadano of Tada no names America Ingo Corporation Schiller, President to the Manitex and Chief Board Executive of Directors Officer Tadano, than 3,3 00 with employees, over $1.7 is billion one of in the global premier annual crane sales, companies and more in the world with a global dealer and distribution network product Prior to the portfolio transaction Tadano had NO knuckle boom crane in its capital With pr oceeds, to procure Manitex the necessary has paid components down debt, and and has assemblies ample to keep resourc upes with to integrate its growing PM backlog, Group and and accelerate allocate the market proper penetration and margin expansion 10 NASDAQ : MNTX
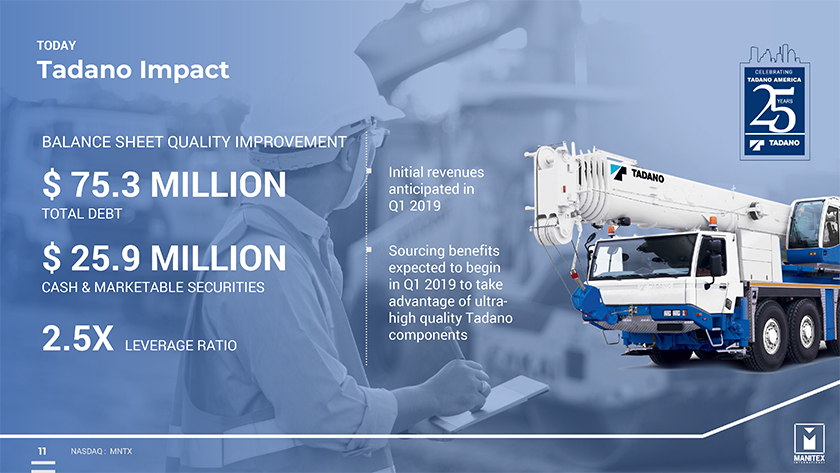
TODAY Tadano Impact BALANCE SHEET QUALITY IMPROVEMENT $ 75.3 MILLION TOTAL DEBT $ 25.9 MILLION CASH & MARKETABLE SECURITIES 2.5X LEVERAGE RATIO Initial revenues anticipated in Q1 2019 Sourcing benefits expected to begin in Q1 2019 to take advantage of ultra-high quality Tadano components 11 NASDAQ : MNTX
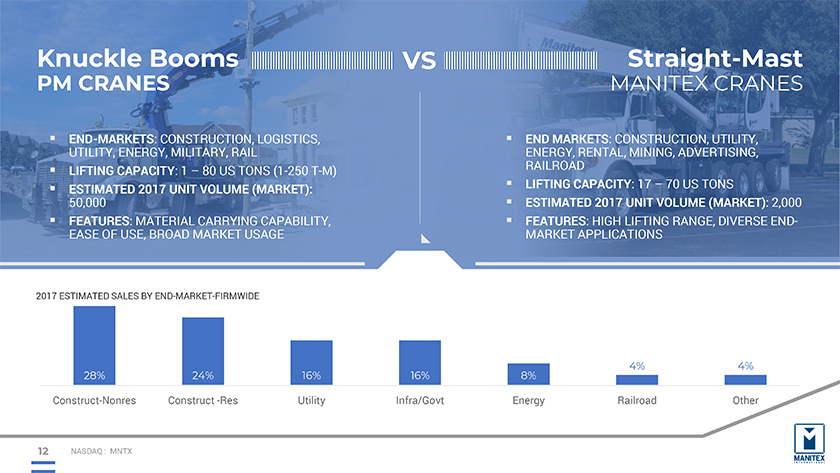
Knuckle Booms PM CRANES END UTILITY, -MARKETS ENERGY, : CONSTRUCTION, MILITARY, RAIL LOGISTICS, LIFTING CAPACITY: 1 – 80 US TONS (1-250 T-M) ESTIMATED 50,000 2017 UNIT VOLUME (MARKET): FEATURES EASE OF USE, : MATERIAL BROAD MARKET CARRYING USAGE CAPABILITY, VS Straight-Mast MANITEX CRANES END ENERGY, MARKETS RENTAL, : CONSTRUCTION, MINING, ADVERTISING, UTILITY, RAILROAD LIFTING CAPACITY: 17 – 70 US TONS ESTIMATED 2017 UNIT VOLUME (MARKET): 2,000 FEATURES MARKET APPLICATIONS : HIGH LIFTING RANGE, DIVERSE END- 2017 ESTIMATED SALES BY END-MARKET-FIRMWIDE 4% 4% 28% 24% 16% 16% 8% Construct-Nonres Construct -Res Utility Infra/Govt Energy Railroad Other 12 NASDAQ : MNTX
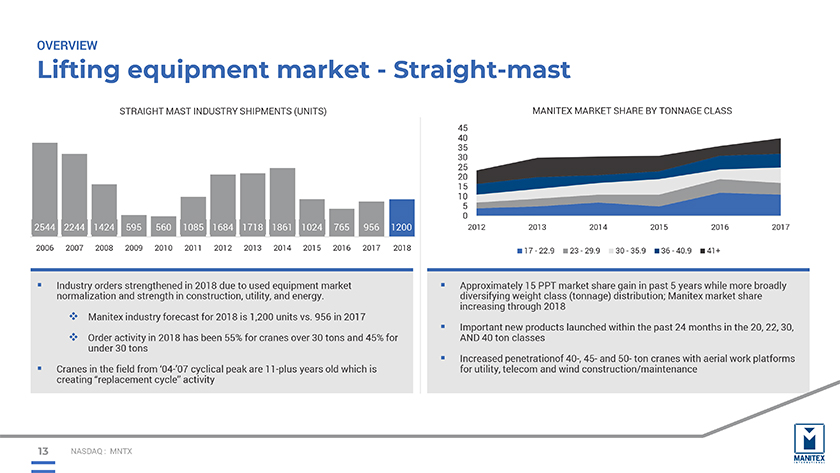
OVERVIEW Lifting equipment market—Straight-mast STRAIGHT MAST INDUSTRY SHIPMENTS (UNITS) MANITEX MARKET SHARE BY TONNAGE CLASS Industry normalization orders and strengthened strength in in construction, 2018 due to utility, used equipment and energy market . Manitex industry forecast for 2018 is 1,200 units vs. 956 in 2017 Order under activity 30 tons in 2018 has been 55% for cranes over 30 tons and 45% for Cranes creating in “replacement the field from cycle” ‘04-’07 activity cyclical peak are 11-plus years old which is Approximately diversifying weight 15 PPT class market (tonnage) share distribution; gain in past Manitex 5 years while market more share broadly increasing through 2018 Important AND 40 ton new classes products launched within the past 24 months in the 20, 22, 30, for Increased utility, telecom penetrationof and wind 40-, construction/maintenance 45- and 50- ton cranes with aerial work platforms 13 NASDAQ : MNTX
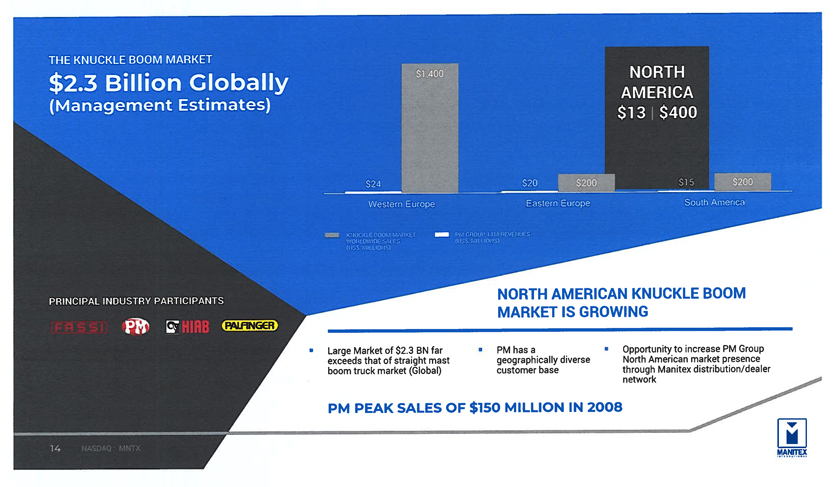
THE KNUCKLE BOOM MARKET $2.3 Billion Globally (Management Estimates) PRINCIPAL INDUSTRY PARTICIPANTS NORTH AMERICAN KNUCKLE BOOM MARKET IS GROWING Large Market of $2.3 BN far exceeds that of straight mast boom truck market (Global) PM has a geographically diverse customer base Opportunity to increase PM Group North American market presence through Manitex distribution/dealer network PM PEAK SALES OF $150 MILLION IN 2008 14 NASDAQ : MNTX
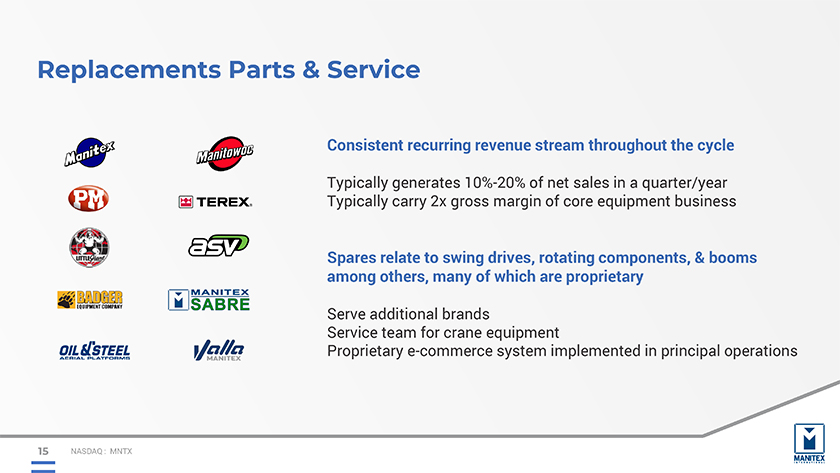
Replacements Parts & Service Consistent recurring revenue stream throughout the cycle Typically generates 10%-20% of net sales in a quarter/year Typically carry 2x gross margin of core equipment business Spares relate to swing drives, rotating components, & booms among others, many of which are proprietary Serve additional brands Service team for crane equipment Proprietary e-commerce system implemented in principal operations 15 NASDAQ : MNTX
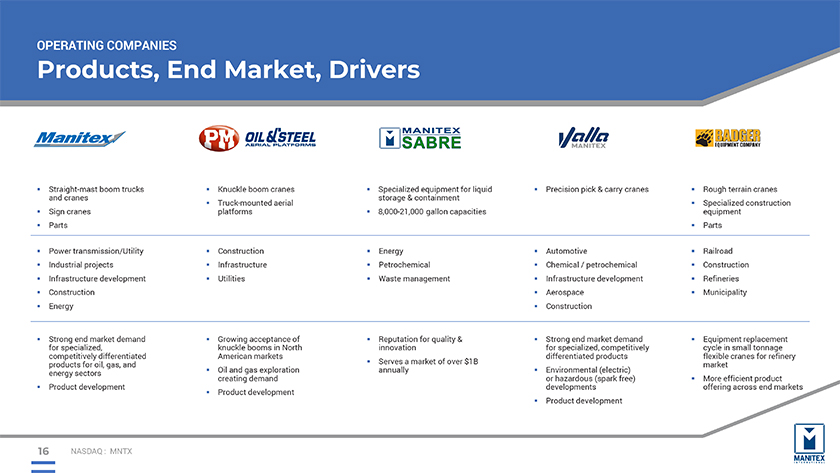
OPERATING COMPANIES Products, End Market, Drivers Straight and cranes -mast boom trucks Sign cranes Parts Power transmission/Utility Industrial projects Infrastructure development Construction Energy Strong for specialized, end market demand competitively products for oil, differentiated gas, and energy sectors Product development Knuckle boom cranes platforms Truck-mounted aerial Construction Infrastructure Utilities Growing knuckle booms acceptance in North of American markets Oil creating and gas demand exploration Product development Specialized storage & containment equipment for liquid 8,000-21,000 gallon capacities Energy Petrochemical Waste management Reputation innovation for quality & Serves annually a market of over $1B Precision pick & carry cranes Automotive Chemical / petrochemical Infrastructure development Aerospace Construction Strong for specialized, end market competitively demand differentiated products or Environmental hazardous (spark (electric) free) developments Product development Rough terrain cranes equipment Specialized construction Parts Railroad Construction Refineries Municipality Equipment cycle in small replacement tonnage flexible market cranes for refinery More offering efficient across product end markets 16 NASDAQ : MNTX
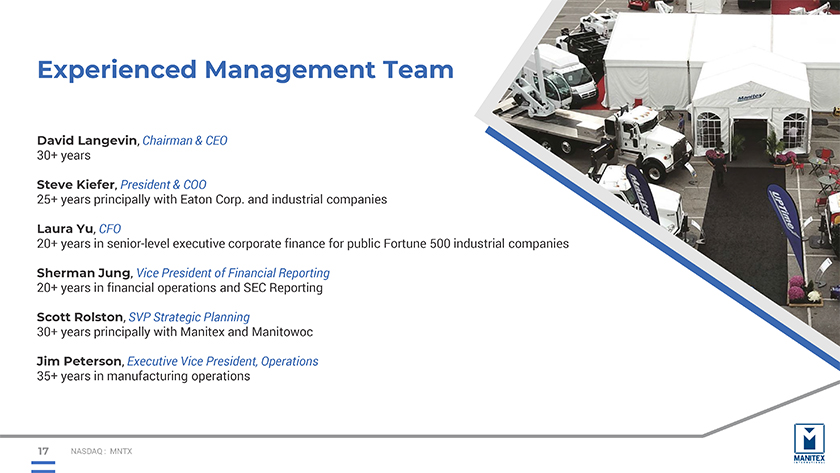
Experienced Management Team David Langevin, Chairman & CEO 30+ years Steve Kiefer, President & COO 25+ years principally with Eaton Corp. and industrial companies Laura Yu, CFO 20+ years in senior-level executive corporate finance for public Fortune 500 industrial companies Sherman Jung, Vice President of Financial Reporting 20+ years in financial operations and SEC Reporting Scott Rolston, SVP Strategic Planning 30+ years principally with Manitex and Manitowoc Jim Peterson, Executive Vice President, Operations 35+ years in manufacturing operations 17 NASDAQ : MNTX
MANITEX INTERNATIONAL, INC. Financial Overview 18
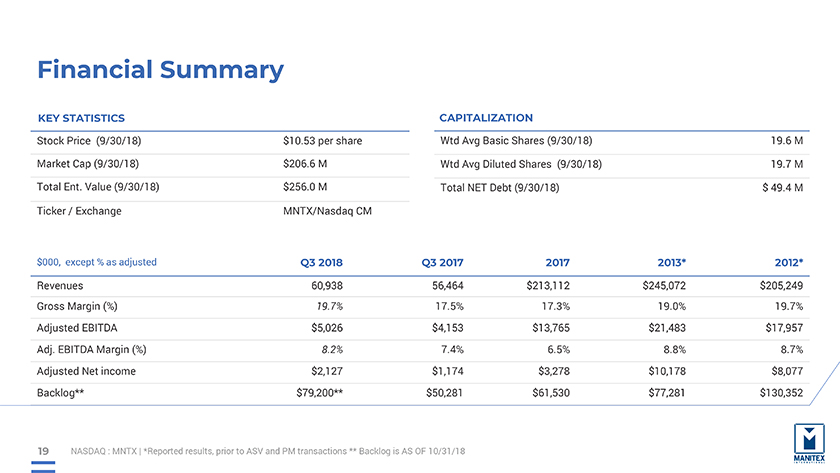
Financial Summary KEY STATISTICS Stock Price (9/30/18) Market Cap (9/30/18) Total Ent. Value (9/30/18) Ticker / Exchange $10.53 per share $206.6 M $256.0 M MNTX/Nasdaq CM CAPITALIZATION Wtd Avg Basic Shares (9/30/18) Wtd Avg Diluted Shares (9/30/18) Total NET Debt (9/30/18) 19.6 M 19.7 M $ 49.4 M $000, except % as adjusted Revenues Gross Margin (%) Adjusted EBITDA Adj. EBITDA Margin (%) Adjusted Net income Backlog** Q3 2018 60,938 19.7% $5,026 8.2% $2,127 $79,200** Q3 2017 56,464 17.5% $4,153 7.4% $1,174 $50,281 2017 $213,112 17.3% $13,765 6.5% $3,278 $61,530 2013* $245,072 19.0% $21,483 8.8% $10,178 $77,281 2012* $205,249 19.7% $17,957 8.7% $8,077 $130,352 19 NASDAQ : MNTX | *Reported results, prior to ASV and PM transactions ** Backlog is AS OF 10/31/18
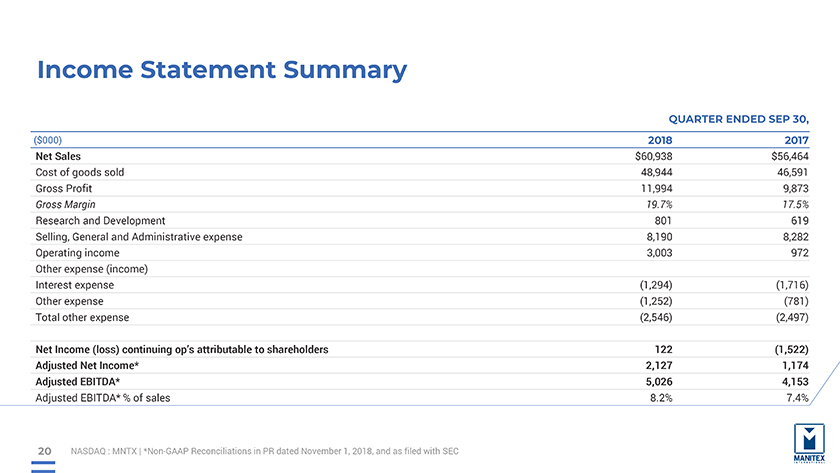
Income Statement Summary ($000) Net Sales Cost of goods sold Gross Profit Gross Margin Research and Development Selling, General and Administrative expense Operating income Other expense (income) Interest expense Other expense Total other expense Net Income (loss) continuing op’s attributable to shareholders Adjusted Net Income* Adjusted EBITDA* Adjusted EBITDA* % of sales QUARTER ENDED SEP 30, 2018 2017 $60,938 48,944 11,994 19.7% 801 8,190 3,003 (1,294) (1,252) (2,546) 122 2,127 5,026 8.2% $56,464 46,591 9,873 17.5% 619 8,282 972 (1,716) (781) (2,497) (1,522) 1,174 4,153 7.4% 20 NASDAQ : MNTX | *Non-GAAP Reconciliations in PR dated November 1, 2018, and as filed with SEC
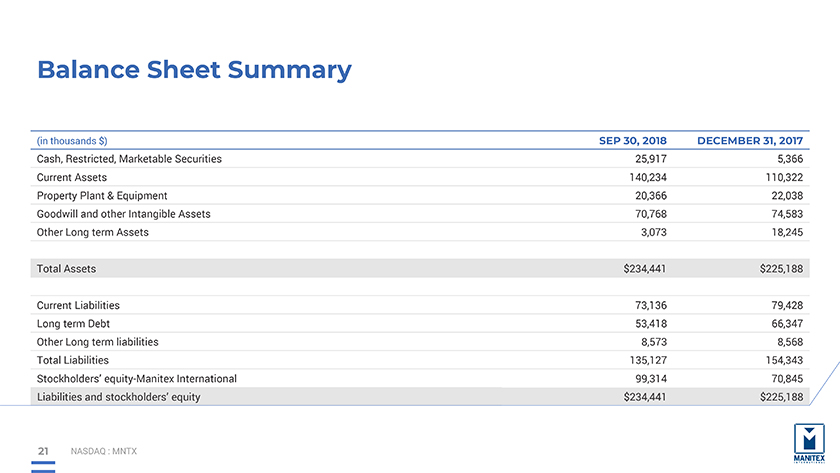
Balance Sheet Summary (in thousands $) Cash, Restricted, Marketable Securities Current Assets Property Plant & Equipment Goodwill and other Intangible Assets Other Long term Assets Total Assets Current Liabilities Long term Debt Other Long term liabilities Total Liabilities Stockholders’ equity-Manitex International Liabilities and stockholders’ equity SEP 30, 2018 25,917 140,234 20,366 70,768 3,073 $234,441 73,136 53,418 8,573 135,127 99,314 $234,441 DECEMBER 31, 2017 5,366 110,322 22,038 74,583 18,245 $225,188 79,428 66,347 8,568 154,343 70,845 $225,188 21 NASDAQ : MNTX
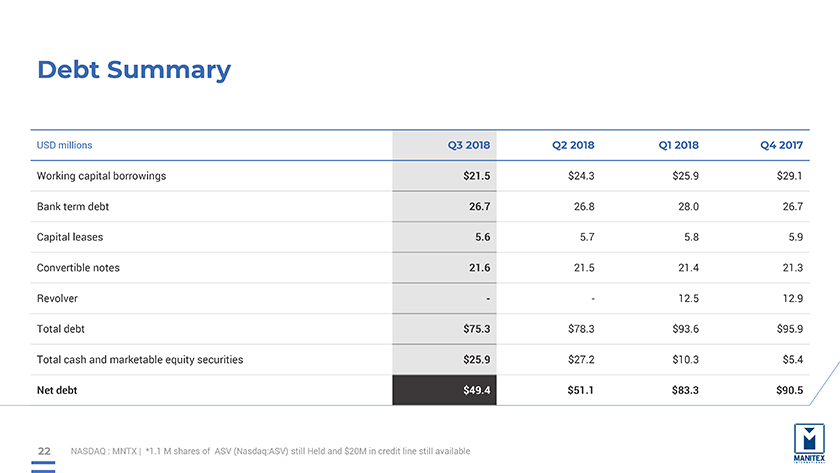
Debt Summary USD millions Working capital borrowings Bank term debt Capital leases Convertible notes Revolver Total debt Total cash and marketable equity securities Net debt Q3 2018 $21.5 26.7 5.6 21.6—$75.3 $25.9 $49.4 Q2 2018 $24.3 26.8 5.7 21.5—$78.3 $27.2 $51.1 Q1 2018 $25.9 28.0 5.8 21.4 12.5 $93.6 $10.3 $83.3 Q4 2017 $29.1 26.7 5.9 21.3 12.9 $95.9 $5.4 $90.5 22 NASDAQ : MNTX | *1.1 M shares of ASV (Nasdaq:ASV) still Held and $20M in credit line still available
MANITEX INTERNATIONAL, INC. December NASDAQ: MNTX 2018 Steve Kiefer, Pres., COO Manitex International 708-237-2065 skiefer@manitex.com Peter Seltzberg, IR Darrow Associates, Inc. 516-419-9915 pseltzberg@darrowir.com
