Attached files
| file | filename |
|---|---|
| 8-K - 8-K - FedNat Holding Co | fnhc124188k.htm |
FedNat Holding Company (NASDAQ: FNHC) Investor Update December 4, 2018
SAFE HARBOR STATEMENT Safe harbor statement under the Private Securities Litigation Reform Act of 1995: Statements that are not historical fact are forward‐looking statements that are subject to certain risks and uncertainties that could cause actual events and results to differ materially from those discussed herein. The risks and uncertainties include, without limitation, risks and uncertainties related to estimates, assumptions and projections generally; the nature of the Company’s business; the adequacy of its reserves for losses and loss adjustment expense; claims experience; weather conditions (including the severity and frequency of storms, hurricanes, tornadoes and hail) and other catastrophic losses; reinsurance costs and the ability of reinsurers to indemnify the Company; raising additional capital and our potential failure to meet minimum capital and surplus requirements; potential assessments that support property and casualty insurance pools and associations; the effectiveness of internal financial controls; the effectiveness of our underwriting, pricing and related loss limitation methods; changes in loss trends, including as a result of insureds’ assignment of benefits; court decisions and trends in litigation; our potential failure to pay claims accurately; ability to obtain regulatory approval applications for requested rate increases, or to underwrite in additional jurisdictions, and the timing thereof; inflation and other changes in economic conditions (including changes in interest rates and financial markets); pricing competition and other initiatives by competitors; legislative and regulatory developments; the outcome of litigation pending against the Company, and any settlement thereof; dependence on investment income and the composition of the Company’s investment portfolio; insurance agents; ratings by industry services; the reliability and security of our information technology systems; reliance on key personnel; acts of war and terrorist activities; and other matters described from time to time by the Company in releases and publications, and in periodic reports and other documents filed with the United States Securities and Exchange Commission In addition, investors should be aware that generally accepted accounting principles prescribe when a company may reserve for particular risks, including claims and litigation exposures. Accordingly, results for a given reporting period could be significantly affected if and when a reserve is established for a contingency. Reported results may therefore appear to be volatile in certain accounting periods. Readers are cautioned not to place undue reliance on these forward‐looking statements, which speak only as of the date on which they are made. We do not undertake any obligation to update publicly or revise any forward‐looking statements to reflect circumstances or events that occur after the date the forward‐looking statements are made. 2
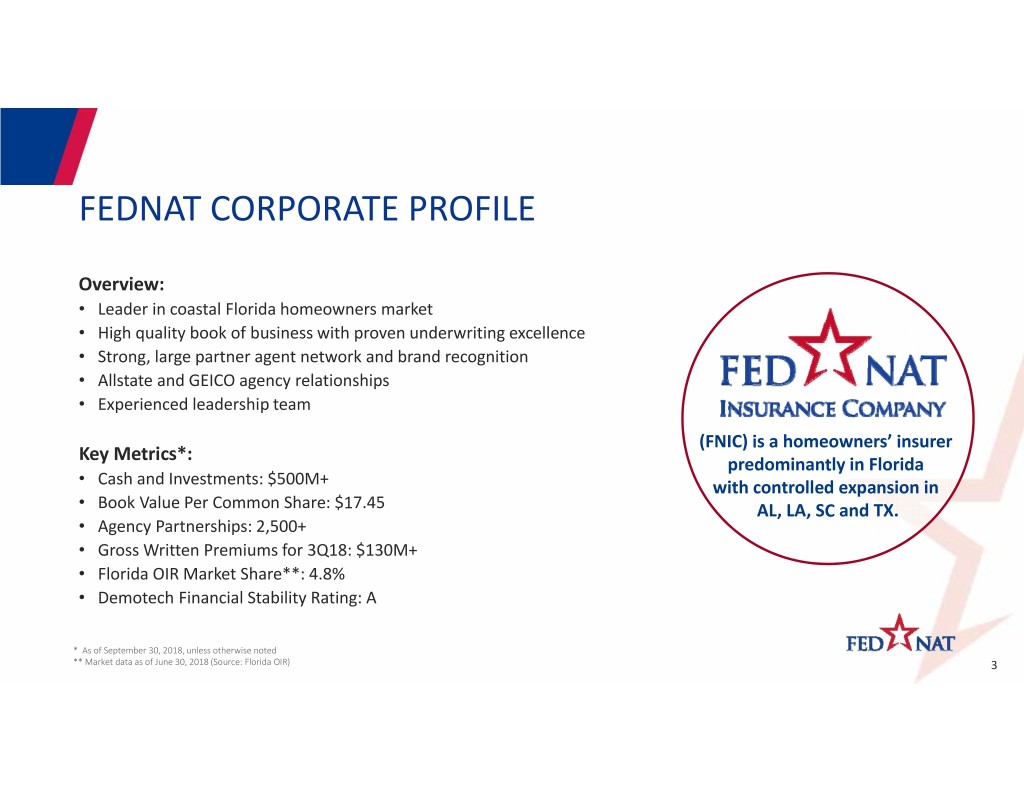
FEDNAT CORPORATE PROFILE Overview: • Leader in coastal Florida homeowners market • High quality book of business with proven underwriting excellence • Strong, large partner agent network and brand recognition • Allstate and GEICO agency relationships • Experienced leadership team (FNIC) is a homeowners’ insurer Key Metrics*: predominantly in Florida • Cash and Investments: $500M+ with controlled expansion in • Book Value Per Common Share: $17.45 AL, LA, SC and TX. • Agency Partnerships: 2,500+ • Gross Written Premiums for 3Q18: $130M+ • Florida OIR Market Share**: 4.8% • Demotech Financial Stability Rating: A * As of September 30, 2018, unless otherwise noted ** Market data as of June 30, 2018 (Source: Florida OIR) 3
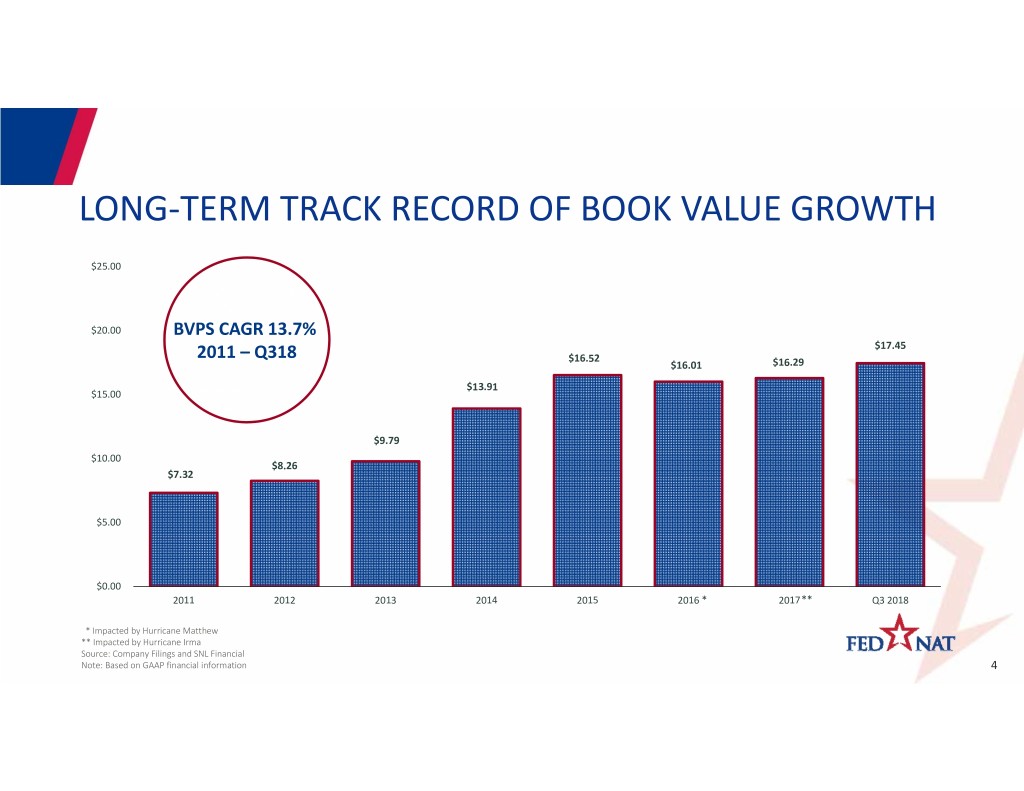
LONG‐TERM TRACK RECORD OF BOOK VALUE GROWTH $25.00 $20.00 BVPS CAGR 13.7% $17.45 2011 – Q318 $16.52 $16.01 $16.29 $13.91 $15.00 $9.79 $10.00 $8.26 $7.32 $5.00 $0.00 2011 2012 2013 2014 2015 2016* 2017** Q3 2018 * Impacted by Hurricane Matthew ** Impacted by Hurricane Irma Source: Company Filings and SNL Financial Note: Based on GAAP financial information 4
STRATEGIC EXECUTION DRIVING FORWARD EARNINGS MOMENTUM • Delivering improving ex‐cat underwriting profitability in core Florida Homeowners book • Selectively growing organically in neighboring coastal states, now ~15% of in‐force policies • Benefitting from effective exposure management resulting in reduced hurricane exposure and reinsurance costs • Mitigating AOB headwind through improved underwriting and claims management as well as implementation of Florida rate increases • Exiting unprofitable non‐core lines (auto and commercial general liability) • Improving operating efficiency and reducing expenses while investing in technology 5
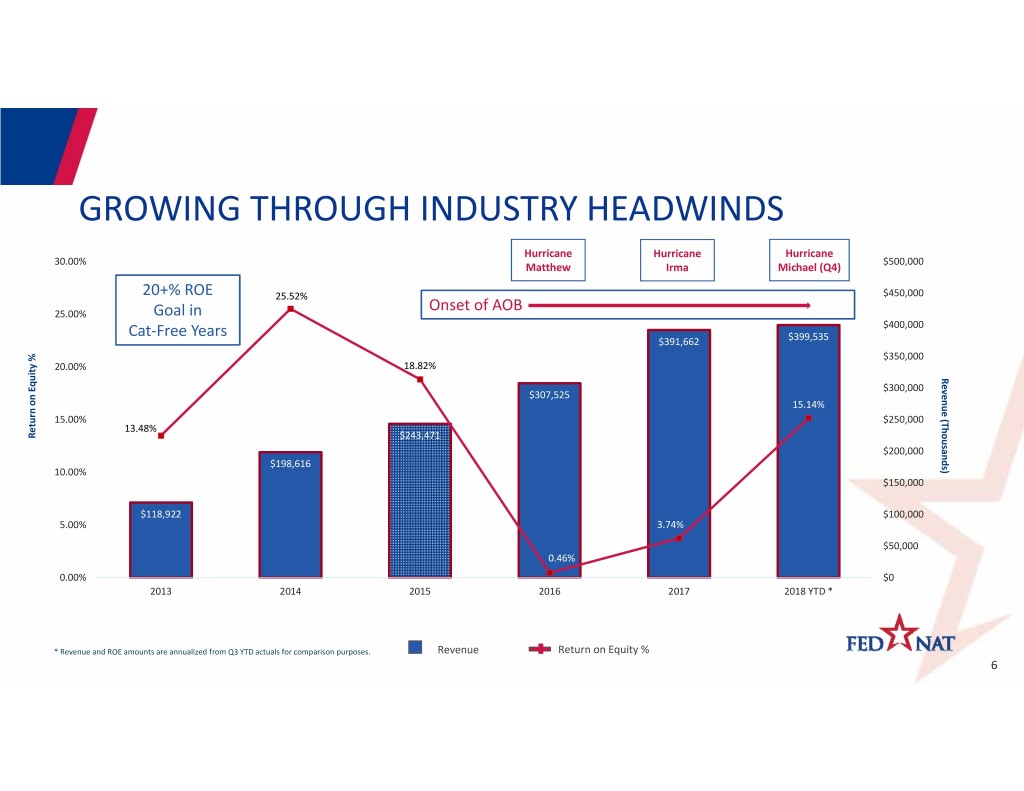
GROWING THROUGH INDUSTRY HEADWINDS Hurricane Hurricane Hurricane 30.00% $500,000 Matthew Irma Michael (Q4) 20+% ROE 25.52% $450,000 Onset of AOB 25.00% Goal in Cat‐Free Years $400,000 $391,662 $399,535 % $350,000 20.00% 18.82% Revenue Equity $300,000 $307,525 on 15.14% 15.00% $250,000 (Thousands) 13.48% Return $243,471 $200,000 $198,616 10.00% $150,000 $118,922 $100,000 5.00% 3.74% $50,000 0.46% 0.00% $0 2013 2014 2015 2016 2017 2018 YTD * * Revenue and ROE amounts are annualized from Q3 YTD actuals for comparison purposes. Revenue Return on Equity % 6
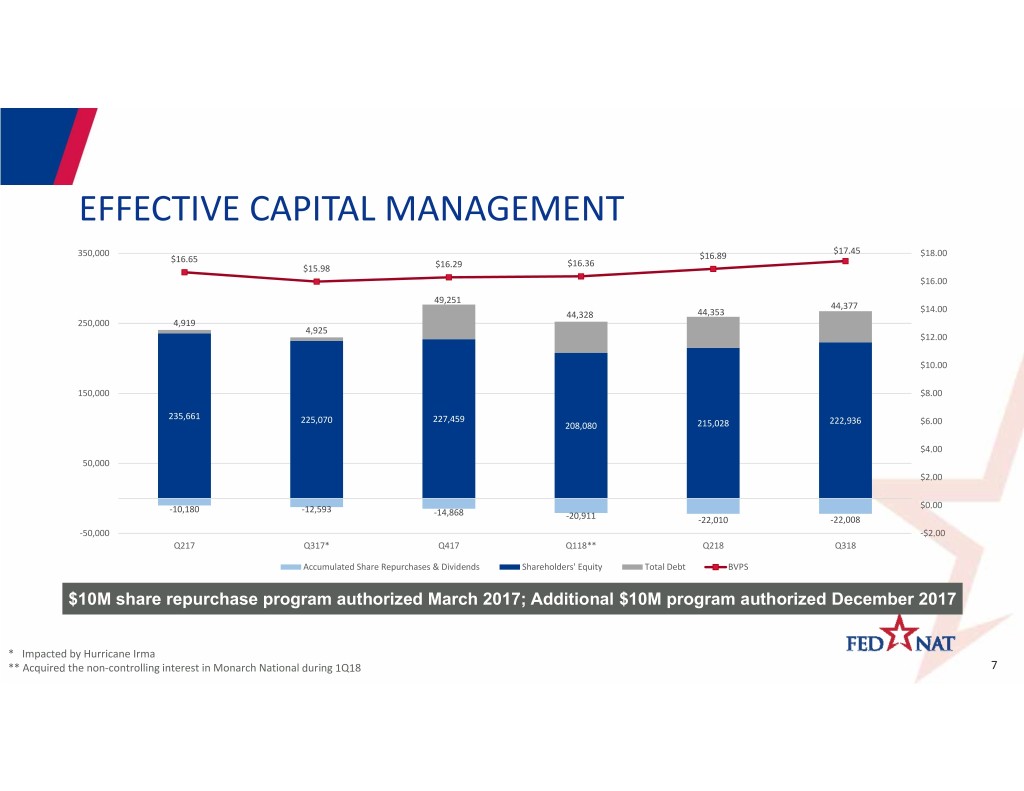
EFFECTIVE CAPITAL MANAGEMENT $17.45 350,000 $16.89 $18.00 $16.65 $16.36 $15.98 $16.29 $16.00 49,251 44,377 $14.00 44,328 44,353 250,000 4,919 4,925 $12.00 $10.00 150,000 $8.00 235,661 225,070 227,459 222,936 208,080 215,028 $6.00 $4.00 50,000 $2.00 $0.00 ‐10,180 ‐12,593 ‐14,868 ‐20,911 ‐22,010 ‐22,008 ‐50,000 ‐$2.00 Q217 Q317* Q417 Q118** Q218 Q318 Accumulated Share Repurchases & Dividends Shareholders' Equity Total Debt BVPS $10M share repurchase program authorized March 2017; Additional $10M program authorized December 2017 * Impacted by Hurricane Irma ** Acquired the non‐controlling interest in Monarch National during 1Q18 7
LEADER IN DYNAMIC FLORIDA HOMEOWNERS MARKET
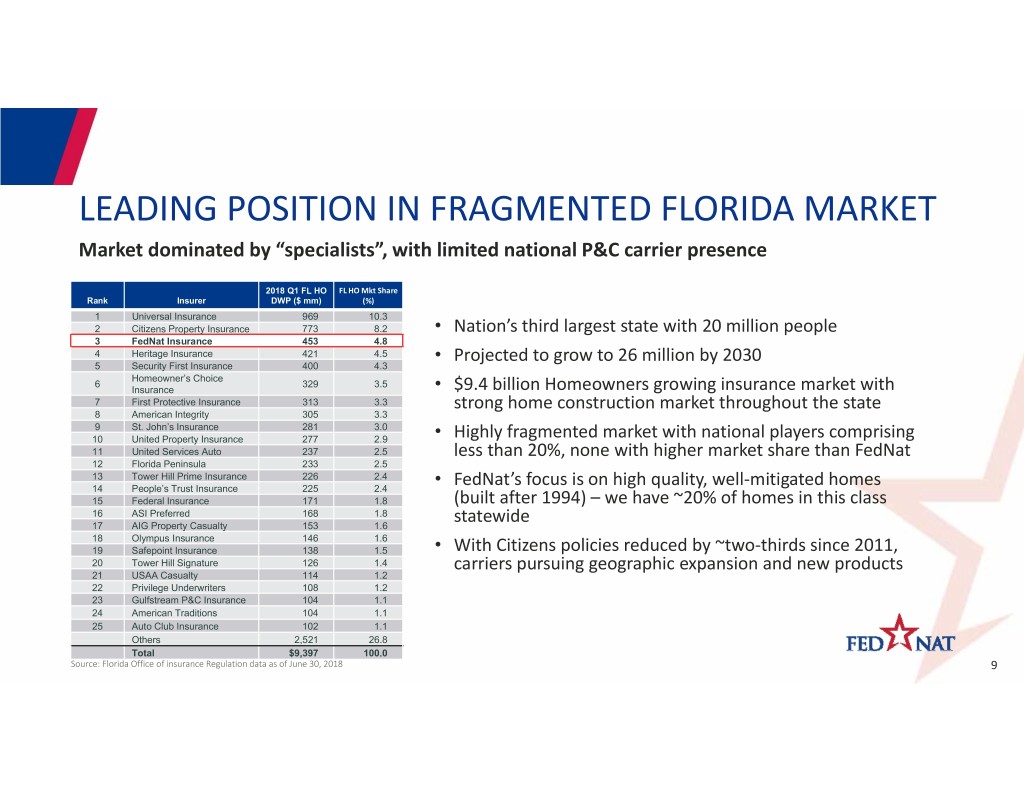
LEADING POSITION IN FRAGMENTED FLORIDA MARKET Market dominated by “specialists”, with limited national P&C carrier presence 2018 Q1 FL HO FL HO Mkt Share Rank Insurer DWP ($ mm) (%) 1 Universal Insurance 969 10.3 2 Citizens Property Insurance 773 8.2 • Nation’s third largest state with 20 million people 3 FedNat Insurance 453 4.8 4 Heritage Insurance 421 4.5 • Projected to grow to 26 million by 2030 5 Security First Insurance 400 4.3 Homeowner’s Choice 6 329 3.5 Insurance • $9.4 billion Homeowners growing insurance market with 7 First Protective Insurance 313 3.3 strong home construction market throughout the state 8 American Integrity 305 3.3 9 St. John’s Insurance 281 3.0 10 United Property Insurance 277 2.9 • Highly fragmented market with national players comprising 11 United Services Auto 237 2.5 less than 20%, none with higher market share than FedNat 12 Florida Peninsula 233 2.5 13 Tower Hill Prime Insurance 226 2.4 • 14 People’s Trust Insurance 225 2.4 FedNat’s focus is on high quality, well‐mitigated homes 15 Federal Insurance 171 1.8 (built after 1994) –we have ~20% of homes in this class 16 ASI Preferred 168 1.8 17 AIG Property Casualty 153 1.6 statewide 18 Olympus Insurance 146 1.6 19 Safepoint Insurance 138 1.5 • With Citizens policies reduced by ~two‐thirds since 2011, 20 Tower Hill Signature 126 1.4 carriers pursuing geographic expansion and new products 21 USAA Casualty 114 1.2 22 Privilege Underwriters 108 1.2 23 Gulfstream P&C Insurance 104 1.1 24 American Traditions 104 1.1 25 Auto Club Insurance 102 1.1 Others 2,521 26.8 Total $9,397 100.0 Source: Florida Office of insurance Regulation data as of June 30, 2018 9
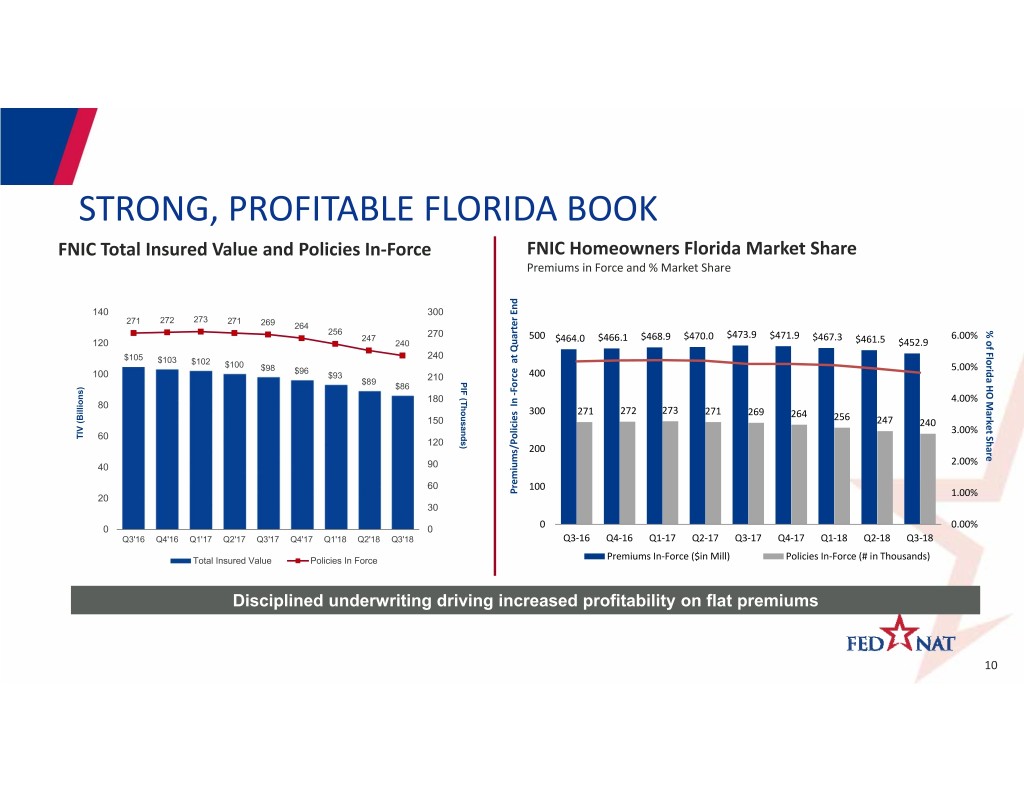
STRONG, PROFITABLE FLORIDA BOOK FNIC Total Insured Value and Policies In‐Force FNIC Homeowners Florida Market Share Premiums in Force and % Market Share End 140 300 271 272 273 271 269 264 % 256 270 $473.9 247 500 $466.1 $468.9 $470.0 $471.9 $467.3 6.00% of 120 240 $464.0 $461.5 $452.9 Quarter Florida $105 240 $103 $102 at $100 $98 $96 5.00% 100 $93 400 210 (Thousands) PIF $89 HO $86 Force ‐ 180 4.00% Market 80 In 300 271 272 273 271 269 264 256 150 247 240 3.00% Share TIV (Billions) TIV 60 120 200 2.00% 40 90 60 100 20 Premiums/Policies 1.00% 30 0 0 0 0.00% Q3'16 Q4'16 Q1'17 Q2'17 Q3'17 Q4'17 Q1'18 Q2'18 Q3'18 Q3‐16 Q4‐16 Q1‐17 Q2‐17 Q3‐17 Q4‐17 Q1‐18 Q2‐18 Q3‐18 Total Insured Value Policies In Force Premiums In‐Force ($in Mill) Policies In‐Force (# in Thousands) Disciplined underwriting driving increased profitability on flat premiums 10
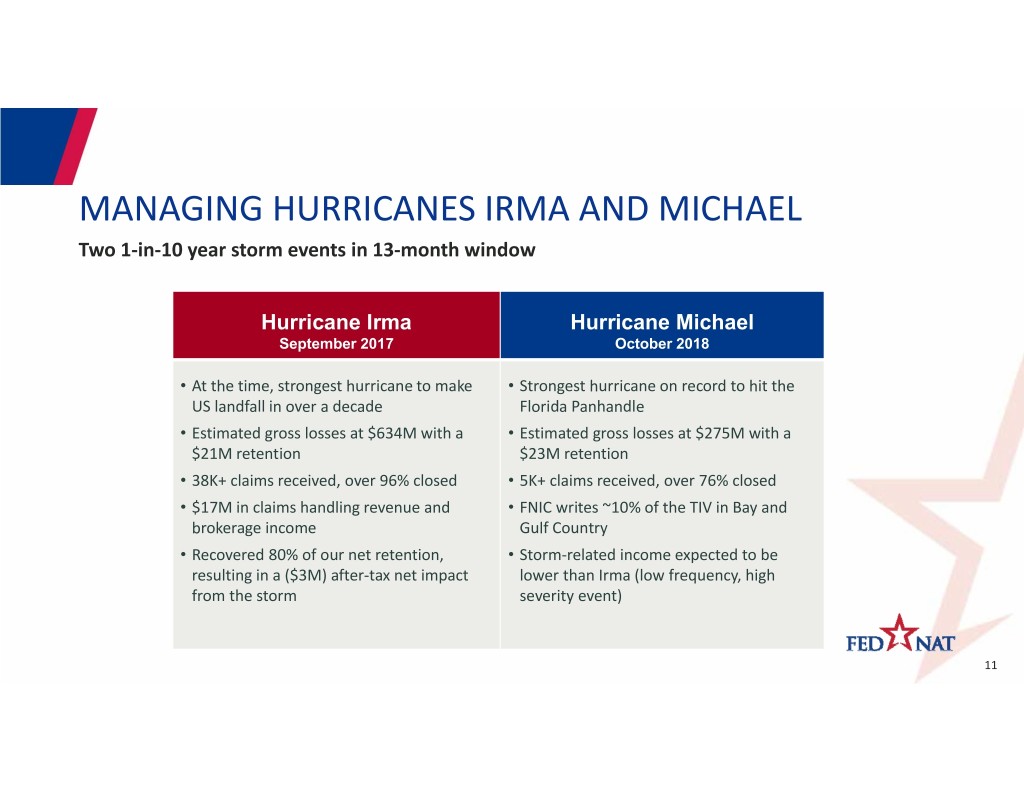
MANAGING HURRICANES IRMA AND MICHAEL Two 1‐in‐10 year storm events in 13‐month window Hurricane Irma Hurricane Michael September 2017 October 2018 • At the time, strongest hurricane to make • Strongest hurricane on record to hit the US landfall in over a decade Florida Panhandle • Estimated gross losses at $634M with a • Estimated gross losses at $275M with a $21M retention $23M retention • 38K+ claims received, over 96% closed • 5K+ claims received, over 76% closed • $17M in claims handling revenue and • FNIC writes ~10% of the TIV in Bay and brokerage income Gulf Country • Recovered 80% of our net retention, • Storm‐related income expected to be resulting in a ($3M) after‐tax net impact lower than Irma (low frequency, high from the storm severity event) 11
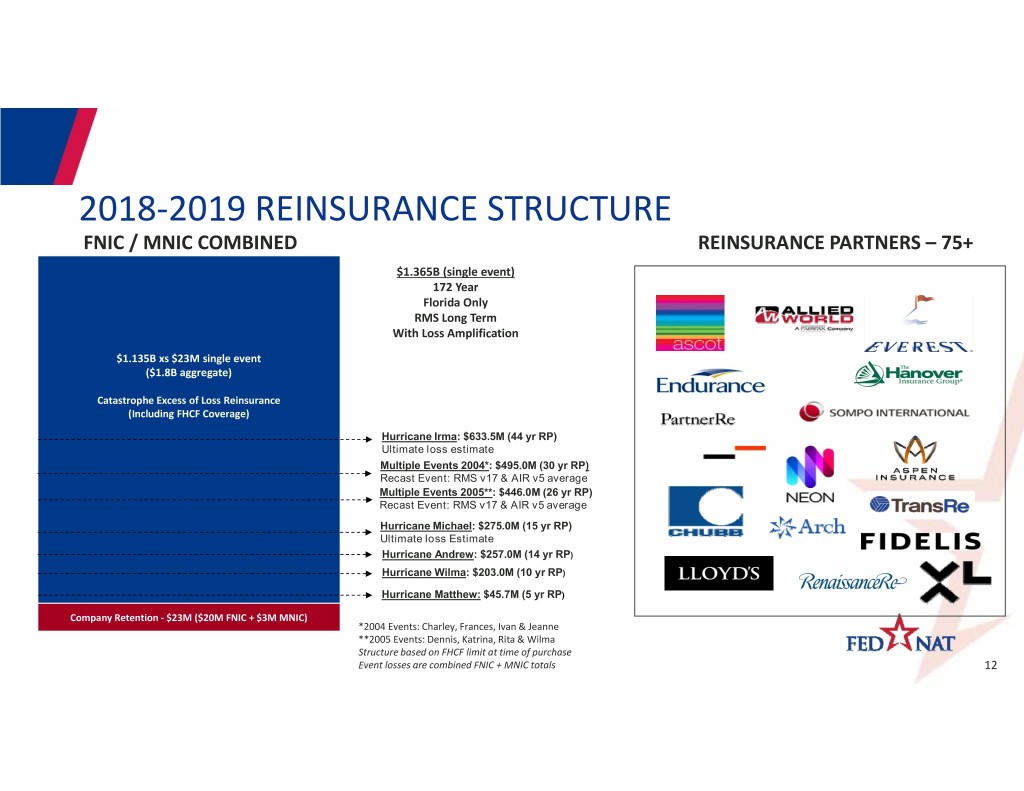
2018‐2019 REINSURANCE STRUCTURE FNIC / MNIC COMBINED REINSURANCE PARTNERS – 75+ $1.365B (single event) 172 Year Florida Only RMS Long Term With Loss Amplification $1.135B xs $23M single event ($1.8B aggregate) Catastrophe Excess of Loss Reinsurance (Including FHCF Coverage) Hurricane Irma: $633.5M (44 yr RP) Ultimate loss estimate Multiple Events 2004*: $495.0M (30 yr RP) Recast Event: RMS v17 & AIR v5 average Multiple Events 2005**: $446.0M (26 yr RP) Recast Event: RMS v17 & AIR v5 average Hurricane Michael: $275.0M (15 yr RP) Ultimate loss Estimate Hurricane Andrew: $257.0M (14 yr RP) Hurricane Wilma: $203.0M (10 yr RP) Hurricane Matthew: $45.7M (5 yr RP) Company Retention ‐ $23M ($20M FNIC + $3M MNIC) *2004 Events: Charley, Frances, Ivan & Jeanne **2005 Events: Dennis, Katrina, Rita & Wilma Structure based on FHCF limit at time of purchase Event losses are combined FNIC + MNIC totals 12
SUCCESSFULLY MITIGATING AOB Assignment of Benefits (AOB) abuse has been a significant drag on FL HO providers, but FedNat’s multi‐ pronged strategy has positioned the company for improved underwriting profitability. AOB is a contractual provision that allows a third party to be paid directly by the insurance company for services performed for an insured homeowner that has filed a claim. Unscrupulous vendors leverage AOB to perform excessive or over‐priced repairs and to gain legal standing for lawsuits. FedNat’s AOB Strategy • Achieved aggregate 18+% compounded homeowners rate increase (implemented over 2017‐2019 period) • Proactive management, training and engagement • Educating policyholders and agents on reporting claims upon occurrence • Analyze expected costs and work directly with AOB contractors and preferred FedNat vendors to arrive at a fair payment, or invoke policy appraisal clause • Reducing litigation and mitigation expense risk • Aggressively pursuing Alternative Dispute Resolution practices • Instituted FL OIR approved policy language changes that restrict emergency mitigation expenses 13

POSITIONING FOR GROWTH
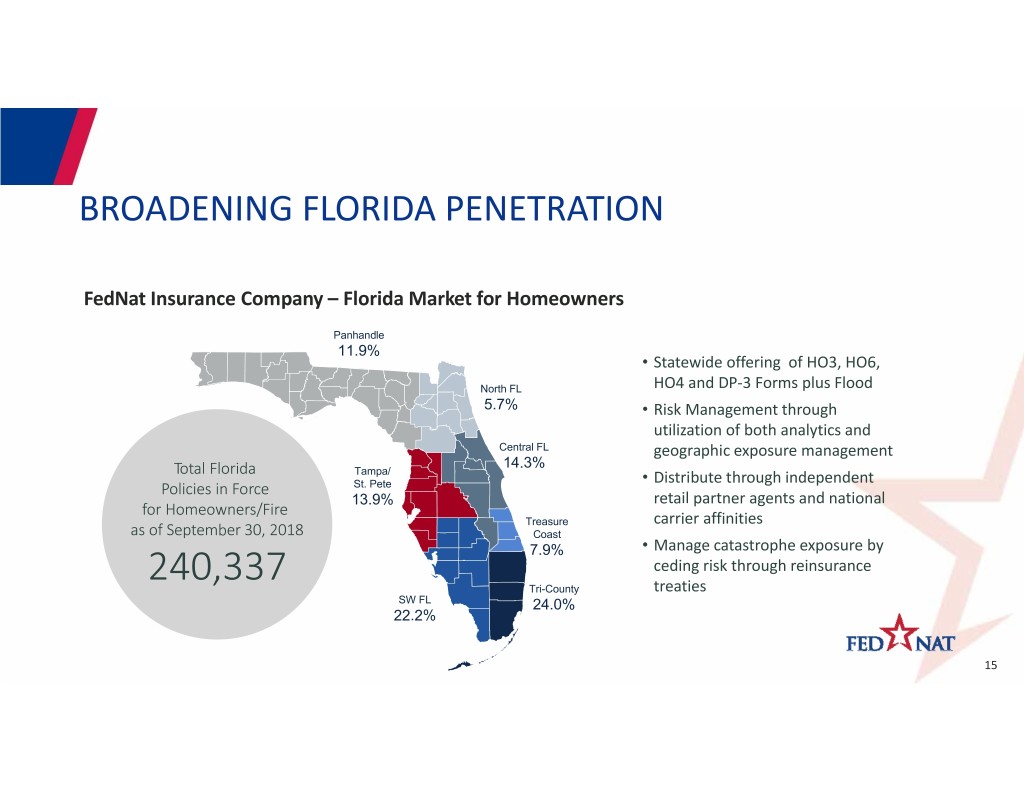
BROADENING FLORIDA PENETRATION FedNat Insurance Company – Florida Market for Homeowners Panhandle 11.9% • Statewide offering of HO3, HO6, North FL HO4 and DP‐3 Forms plus Flood 5.7% • Risk Management through utilization of both analytics and Central FL geographic exposure management 14.3% To ta l F l o r i d a Tampa/ • Distribute through independent Policies in Force St. Pete 13.9% retail partner agents and national for Homeowners/Fire Treasure carrier affinities as of September 30, 2018 Coast 7.9% • Manage catastrophe exposure by 240,337 ceding risk through reinsurance Tri-County treaties SW FL 24.0% 22.2% 15
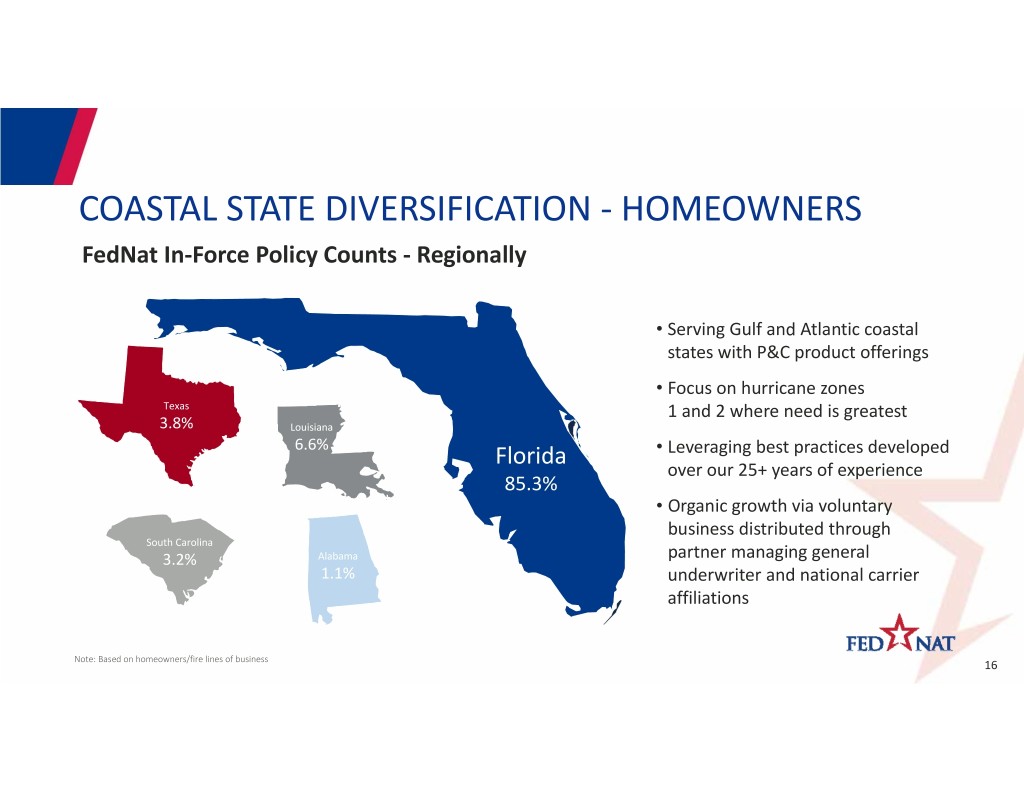
COASTAL STATE DIVERSIFICATION ‐ HOMEOWNERS FedNat In‐Force Policy Counts ‐ Regionally • Serving Gulf and Atlantic coastal states with P&C product offerings • Focus on hurricane zones Texas 1 and 2 where need is greatest 3.8% Louisiana 6.6% Florida • Leveraging best practices developed over our 25+ years of experience 85.3% • Organic growth via voluntary business distributed through South Carolina 3.2% Alabama partner managing general 1.1% underwriter and national carrier affiliations Note: Based on homeowners/fire lines of business 16
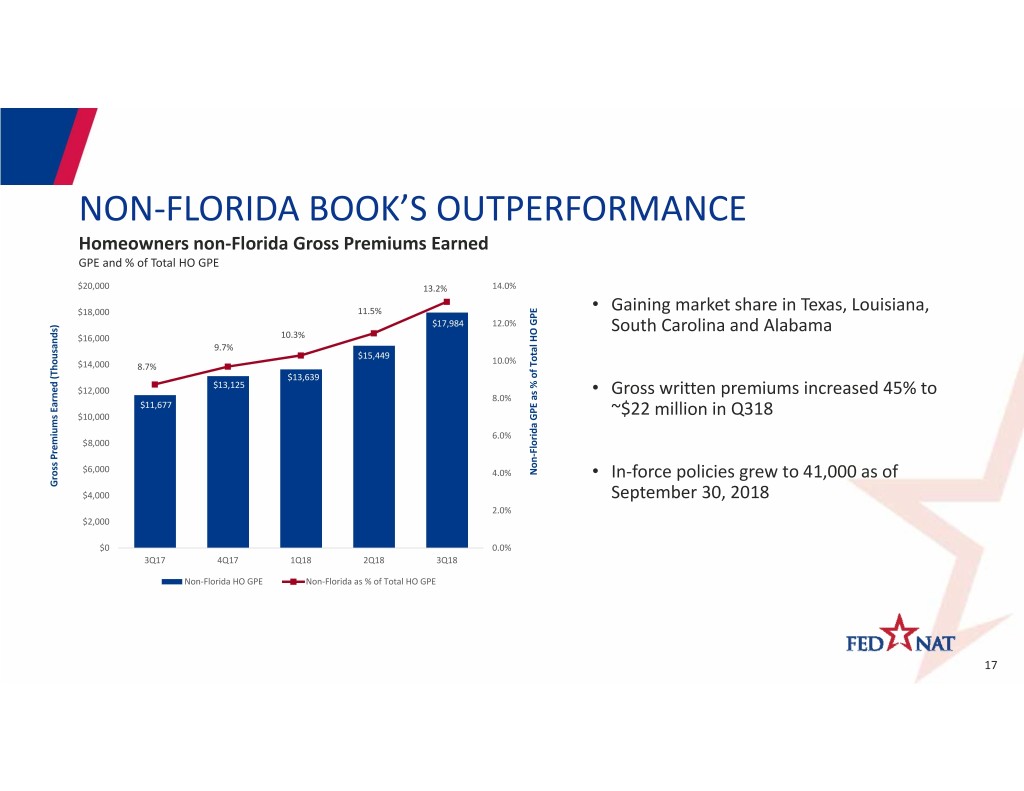
NON‐FLORIDA BOOK’S OUTPERFORMANCE Homeowners non‐Florida Gross Premiums Earned GPE and % of Total HO GPE $20,000 13.2% 14.0% $18,000 11.5% • Gaining market share in Texas, Louisiana, GPE $17,984 12.0% 10.3% South Carolina and Alabama $16,000 HO 9.7% $15,449 10.0% Total $14,000 8.7% of (Thousands) $13,639 $13,125 % $12,000 • Gross written premiums increased 45% to as 8.0% $11,677 Earned ~$22 million in Q318 $10,000 GPE 6.0% $8,000 Florida ‐ Premiums $6,000 4.0% Non • In‐force policies grew to 41,000 as of Gross $4,000 September 30, 2018 2.0% $2,000 $0 0.0% 3Q17 4Q17 1Q18 2Q18 3Q18 Non‐Florida HO GPE Non‐Florida as % of Total HO GPE 17
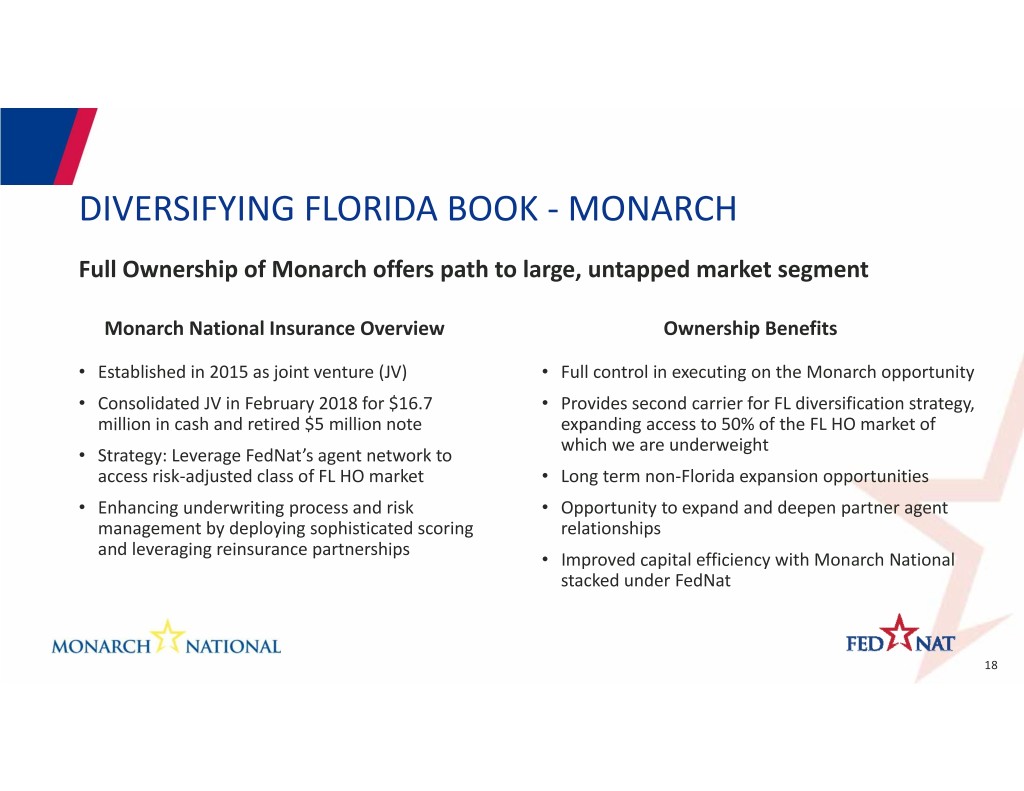
DIVERSIFYING FLORIDA BOOK ‐ MONARCH Full Ownership of Monarch offers path to large, untapped market segment Monarch National Insurance Overview Ownership Benefits • Established in 2015 as joint venture (JV) • Full control in executing on the Monarch opportunity • Consolidated JV in February 2018 for $16.7 • Provides second carrier for FL diversification strategy, million in cash and retired $5 million note expanding access to 50% of the FL HO market of which we are underweight • Strategy: Leverage FedNat’s agent network to access risk‐adjusted class of FL HO market • Long term non‐Florida expansion opportunities • Enhancing underwriting process and risk • Opportunity to expand and deepen partner agent management by deploying sophisticated scoring relationships and leveraging reinsurance partnerships • Improved capital efficiency with Monarch National stacked under FedNat 18
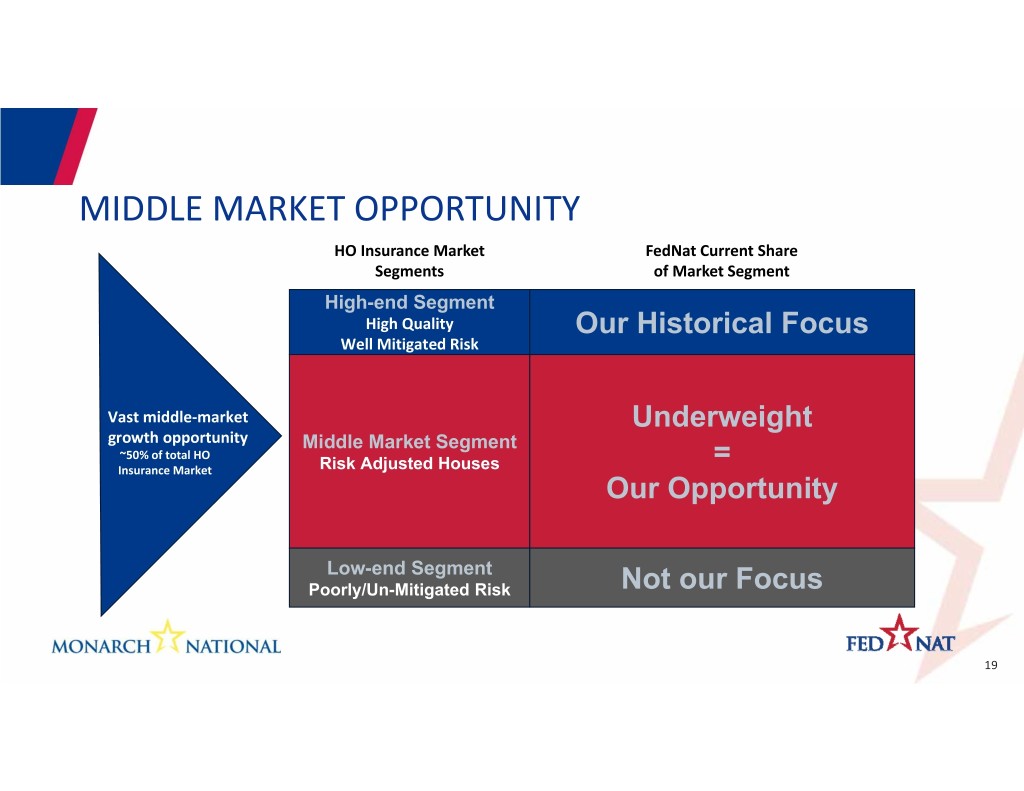
MIDDLE MARKET OPPORTUNITY HO Insurance Market FedNat Current Share Segments of Market Segment High-end Segment High Quality Our Historical Focus Well Mitigated Risk Vast middle‐market Underweight growth opportunity Middle Market Segment ~50% of total HO = Insurance Market Risk Adjusted Houses Our Opportunity Low-end Segment Poorly/Un-Mitigated Risk Not our Focus 19
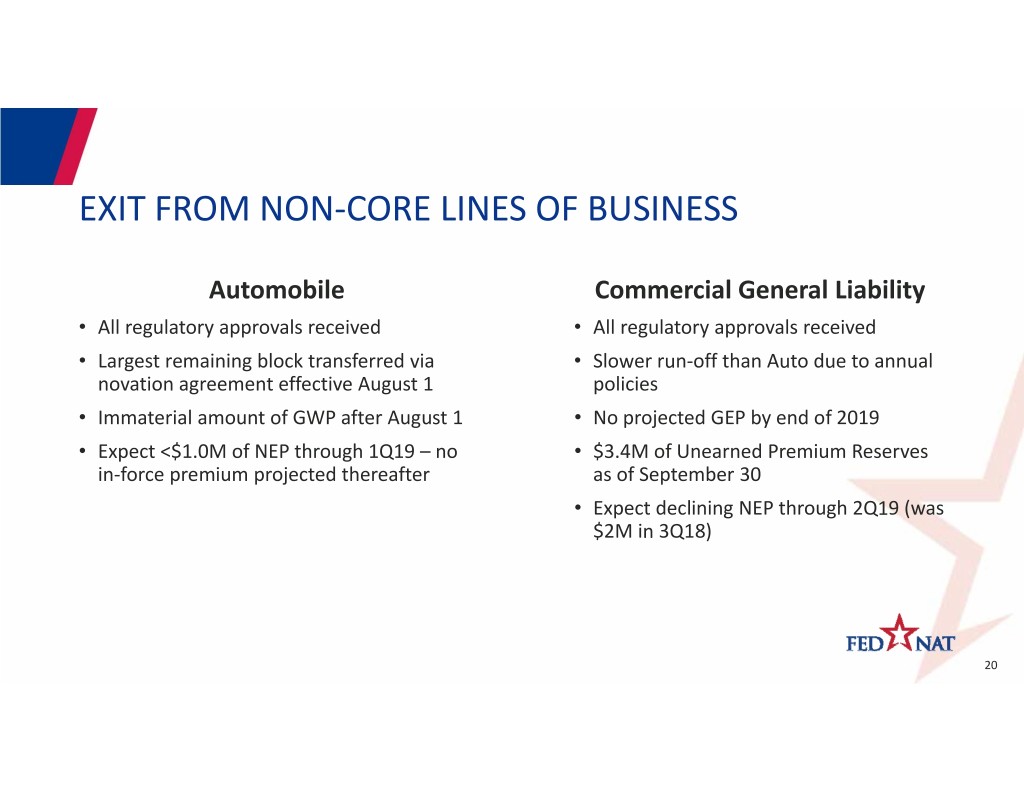
EXIT FROM NON‐CORE LINES OF BUSINESS Automobile Commercial General Liability • All regulatory approvals received • All regulatory approvals received • Largest remaining block transferred via • Slower run‐off than Auto due to annual novation agreement effective August 1 policies • Immaterial amount of GWP after August 1 • No projected GEP by end of 2019 • Expect <$1.0M of NEP through 1Q19 –no • $3.4M of Unearned Premium Reserves in‐force premium projected thereafter as of September 30 • Expect declining NEP through 2Q19 (was $2M in 3Q18) 20

UNDERWRITING & EXPOSURE MANAGEMENT
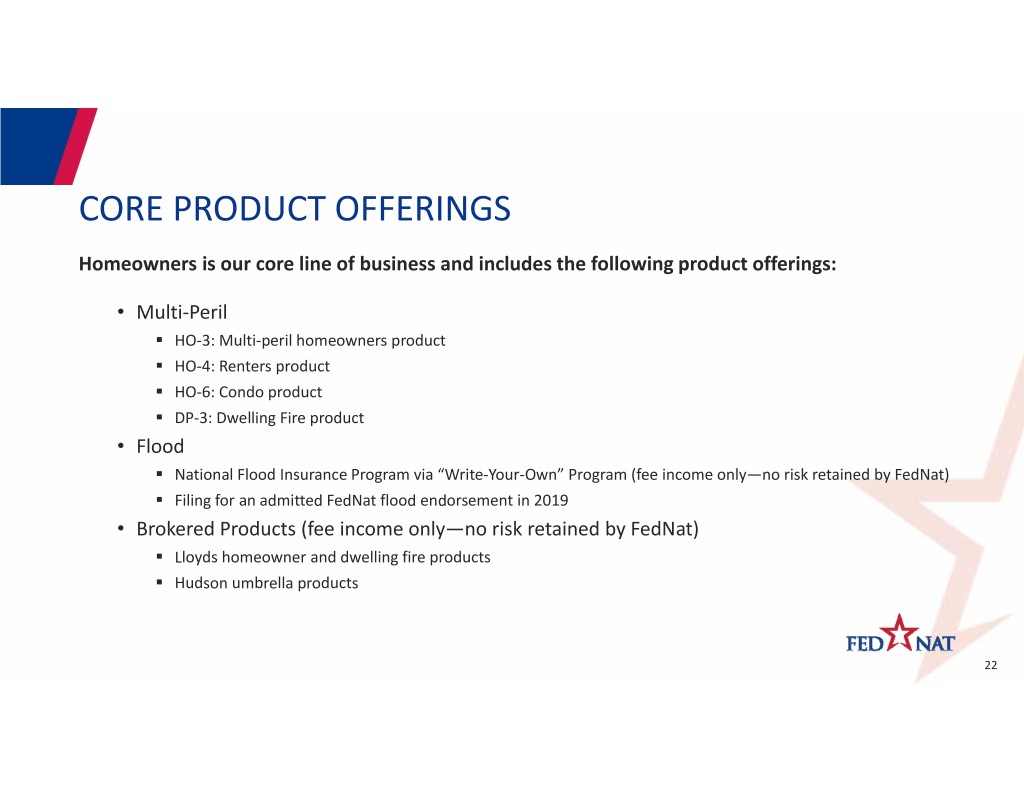
CORE PRODUCT OFFERINGS Homeowners is our core line of business and includes the following product offerings: • Multi‐Peril . HO‐3: Multi‐peril homeowners product . HO‐4: Renters product . HO‐6: Condo product . DP‐3: Dwelling Fire product • Flood . National Flood Insurance Program via “Write‐Your‐Own” Program (fee income only—no risk retained by FedNat) . Filing for an admitted FedNat flood endorsement in 2019 • Brokered Products (fee income only—no risk retained by FedNat) . Lloyds homeowner and dwelling fire products . Hudson umbrella products 22
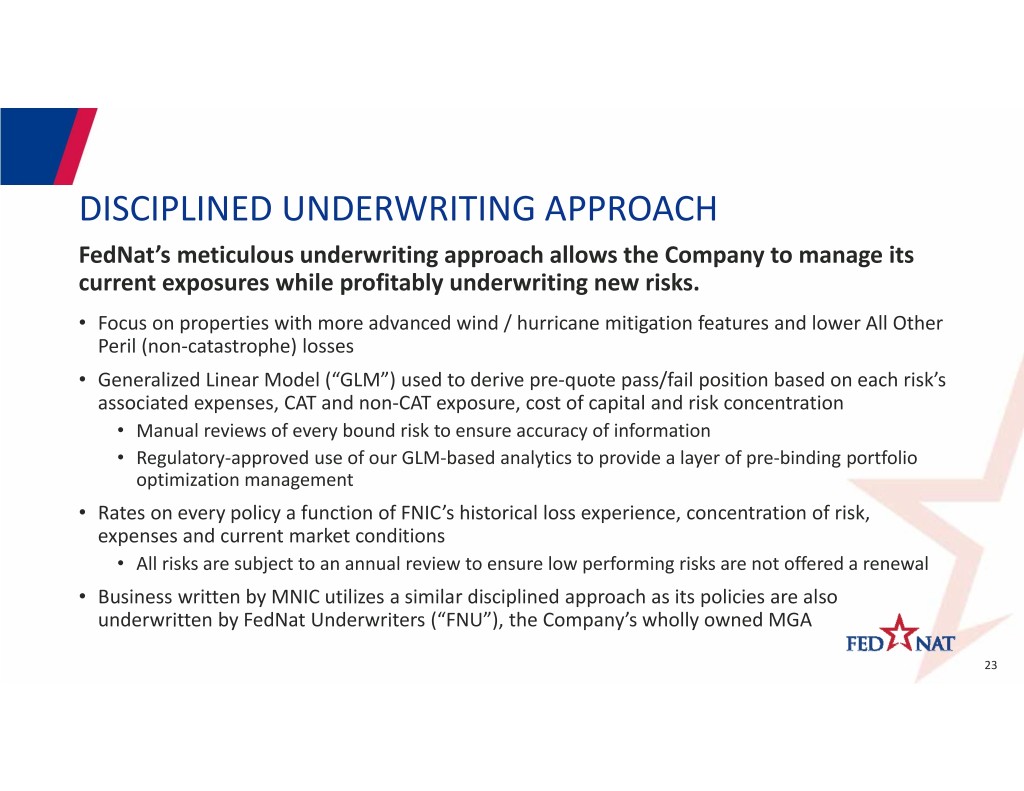
DISCIPLINED UNDERWRITING APPROACH FedNat’s meticulous underwriting approach allows the Company to manage its current exposures while profitably underwriting new risks. • Focus on properties with more advanced wind / hurricane mitigation features and lower All Other Peril (non‐catastrophe) losses • Generalized Linear Model (“GLM”) used to derive pre‐quote pass/fail position based on each risk’s associated expenses, CAT and non‐CAT exposure, cost of capital and risk concentration • Manual reviews of every bound risk to ensure accuracy of information • Regulatory‐approved use of our GLM‐based analytics to provide a layer of pre‐binding portfolio optimization management • Rates on every policy a function of FNIC’s historical loss experience, concentration of risk, expenses and current market conditions • All risks are subject to an annual review to ensure low performing risks are not offered a renewal • Business written by MNIC utilizes a similar disciplined approach as its policies are also underwritten by FedNat Underwriters (“FNU”), the Company’s wholly owned MGA 23
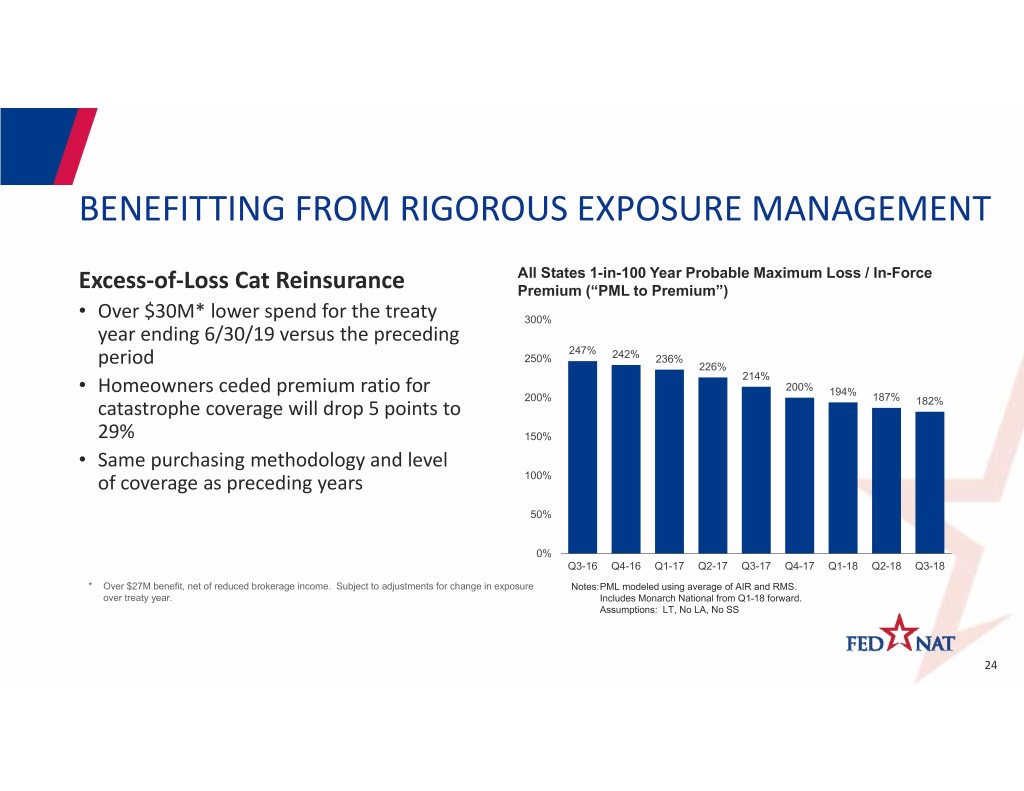
BENEFITTING FROM RIGOROUS EXPOSURE MANAGEMENT All States 1-in-100 Year Probable Maximum Loss / In-Force Excess‐of‐Loss Cat Reinsurance Premium (“PML to Premium”) • Over $30M* lower spend for the treaty 300% year ending 6/30/19 versus the preceding 247% 250% 242% 236% period 226% 214% • Homeowners ceded premium ratio for 200% 194% 200% 187% catastrophe coverage will drop 5 points to 182% 29% 150% • Same purchasing methodology and level of coverage as preceding years 100% 50% 0% Q3-16 Q4-16 Q1-17 Q2-17 Q3-17Q4-17Q1-18Q2-18Q3-18 * Over $27M benefit, net of reduced brokerage income. Subject to adjustments for change in exposure Notes:PML modeled using average of AIR and RMS. over treaty year. Includes Monarch National from Q1-18 forward. Assumptions: LT, No LA, No SS 24
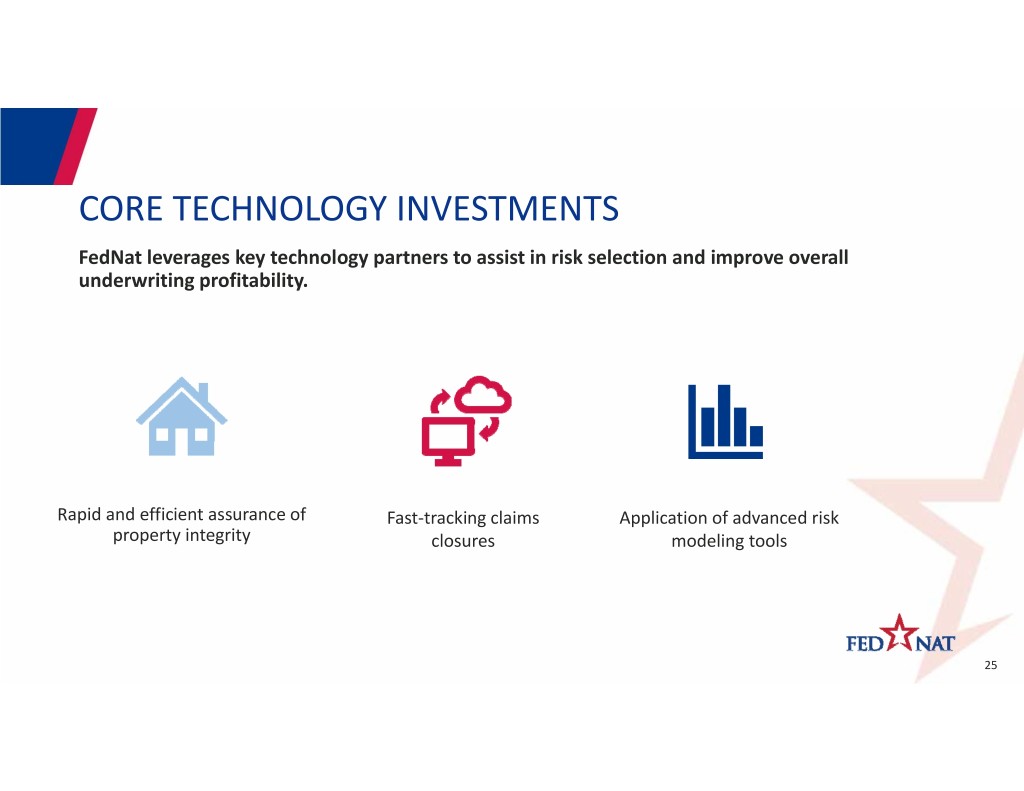
CORE TECHNOLOGY INVESTMENTS FedNat leverages key technology partners to assist in risk selection and improve overall underwriting profitability. Rapid and efficient assurance of Fast‐tracking claims Application of advanced risk property integrity closures modeling tools 25

FINANCIAL OVERVIEW
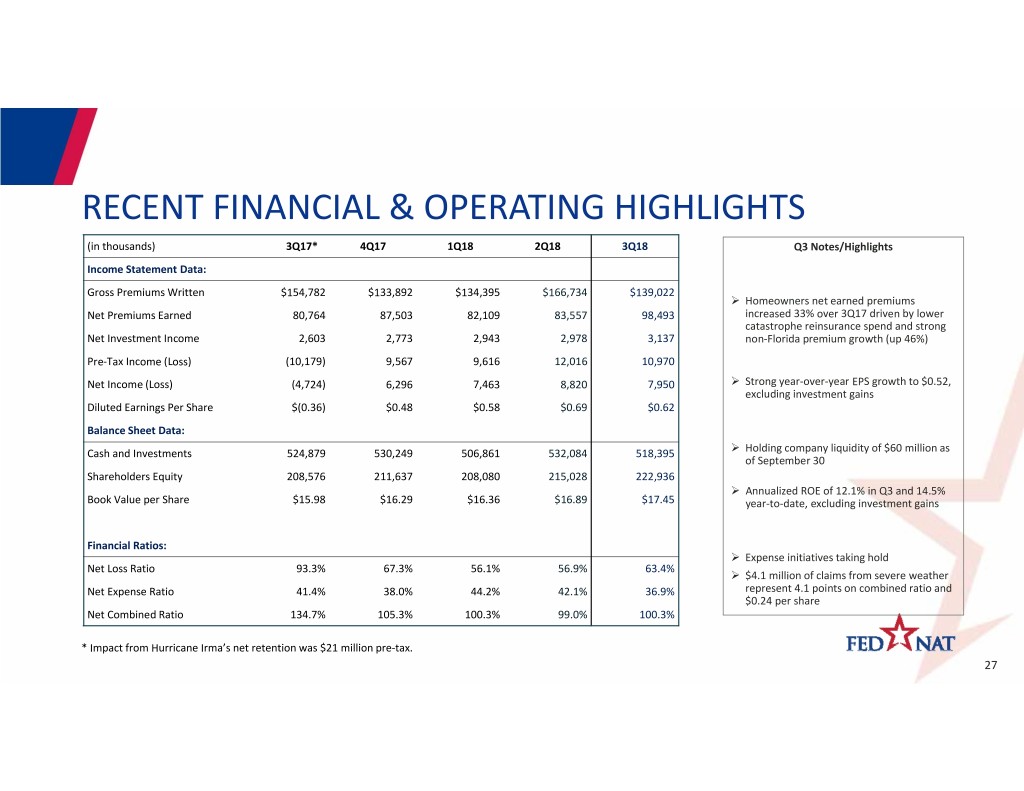
RECENT FINANCIAL & OPERATING HIGHLIGHTS (in thousands) 3Q17* 4Q17 1Q18 2Q18 3Q18 Q3 Notes/Highlights Income Statement Data: Gross Premiums Written $154,782 $133,892 $134,395 $166,734 $139,022 Homeowners net earned premiums Net Premiums Earned 80,764 87,503 82,109 83,557 98,493 increased 33% over 3Q17 driven by lower catastrophe reinsurance spend and strong Net Investment Income 2,603 2,773 2,943 2,978 3,137 non‐Florida premium growth (up 46%) Pre‐Tax Income (Loss) (10,179) 9,567 9,616 12,016 10,970 Net Income (Loss) (4,724) 6,296 7,463 8,820 7,950 Strong year‐over‐year EPS growth to $0.52, excluding investment gains Diluted Earnings Per Share $(0.36) $0.48 $0.58 $0.69 $0.62 Balance Sheet Data: Cash and Investments 524,879 530,249 506,861 532,084 518,395 Holding company liquidity of $60 million as of September 30 Shareholders Equity 208,576 211,637 208,080 215,028 222,936 Annualized ROE of 12.1% in Q3 and 14.5% Book Value per Share $15.98 $16.29 $16.36 $16.89 $17.45 year‐to‐date, excluding investment gains Financial Ratios: Expense initiatives taking hold Net Loss Ratio 93.3% 67.3% 56.1% 56.9% 63.4% $4.1 million of claims from severe weather Net Expense Ratio 41.4% 38.0% 44.2% 42.1% 36.9% represent 4.1 points on combined ratio and $0.24 per share Net Combined Ratio 134.7% 105.3% 100.3% 99.0% 100.3% * Impact from Hurricane Irma’s net retention was $21 million pre‐tax. 27
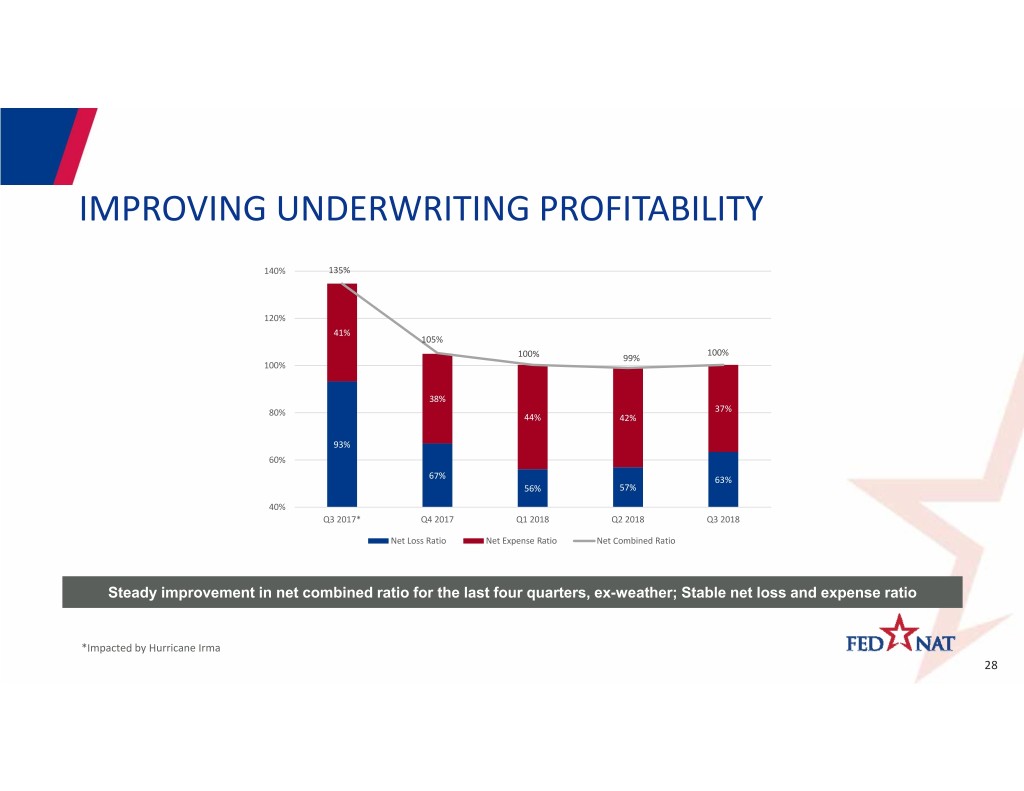
IMPROVING UNDERWRITING PROFITABILITY 140% 135% 120% 41% 105% 100% 100% 99% 100% 38% 80% 37% 44% 42% 93% 60% 67% 63% 56% 57% 40% Q3 2017* Q4 2017 Q1 2018 Q2 2018 Q3 2018 Net Loss Ratio Net Expense Ratio Net Combined Ratio Steady improvement in net combined ratio for the last four quarters, ex-weather; Stable net loss and expense ratio *Impacted by Hurricane Irma 28
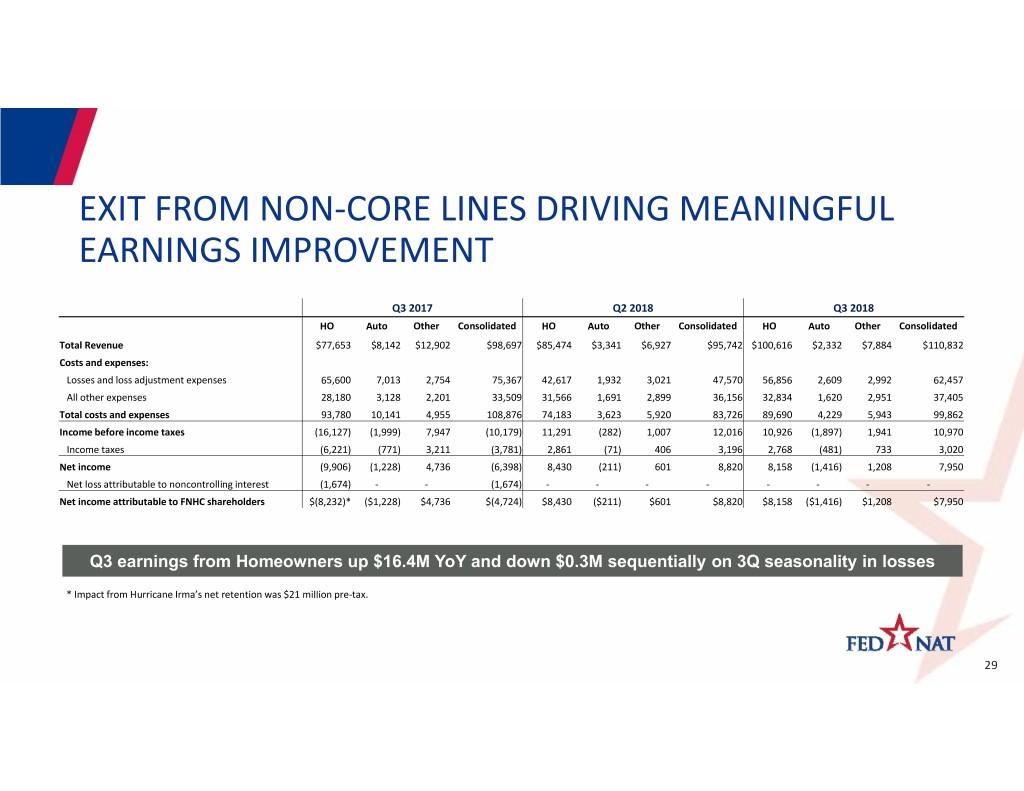
EXIT FROM NON‐CORE LINES DRIVING MEANINGFUL EARNINGS IMPROVEMENT Q3 2017 Q2 2018 Q3 2018 HO Auto Other Consolidated HO Auto Other Consolidated HO Auto Other Consolidated Total Revenue $77,653 $8,142 $12,902 $98,697 $85,474 $3,341 $6,927 $95,742 $100,616 $2,332 $7,884 $110,832 Costs and expenses: Losses and loss adjustment expenses 65,600 7,013 2,754 75,367 42,617 1,932 3,021 47,570 56,856 2,609 2,992 62,457 All other expenses 28,180 3,128 2,201 33,509 31,566 1,691 2,899 36,156 32,834 1,620 2,951 37,405 Total costs and expenses 93,780 10,141 4,955 108,876 74,183 3,623 5,920 83,726 89,690 4,229 5,943 99,862 Income before income taxes (16,127) (1,999) 7,947 (10,179) 11,291 (282) 1,007 12,016 10,926 (1,897) 1,941 10,970 Income taxes (6,221) (771) 3,211 (3,781) 2,861 (71) 406 3,196 2,768 (481) 733 3,020 Net income (9,906) (1,228) 4,736 (6,398) 8,430 (211) 601 8,820 8,158 (1,416) 1,208 7,950 Net loss attributable to noncontrolling interest (1,674) ‐‐ (1,674) ‐‐‐ ‐ ‐‐‐ ‐ Net income attributable to FNHC shareholders $(8,232)* ($1,228) $4,736 $(4,724) $8,430 ($211) $601 $8,820 $8,158 ($1,416) $1,208 $7,950 Q3 earnings from Homeowners up $16.4M YoY and down $0.3M sequentially on 3Q seasonality in losses * Impact from Hurricane Irma’s net retention was $21 million pre‐tax. 29
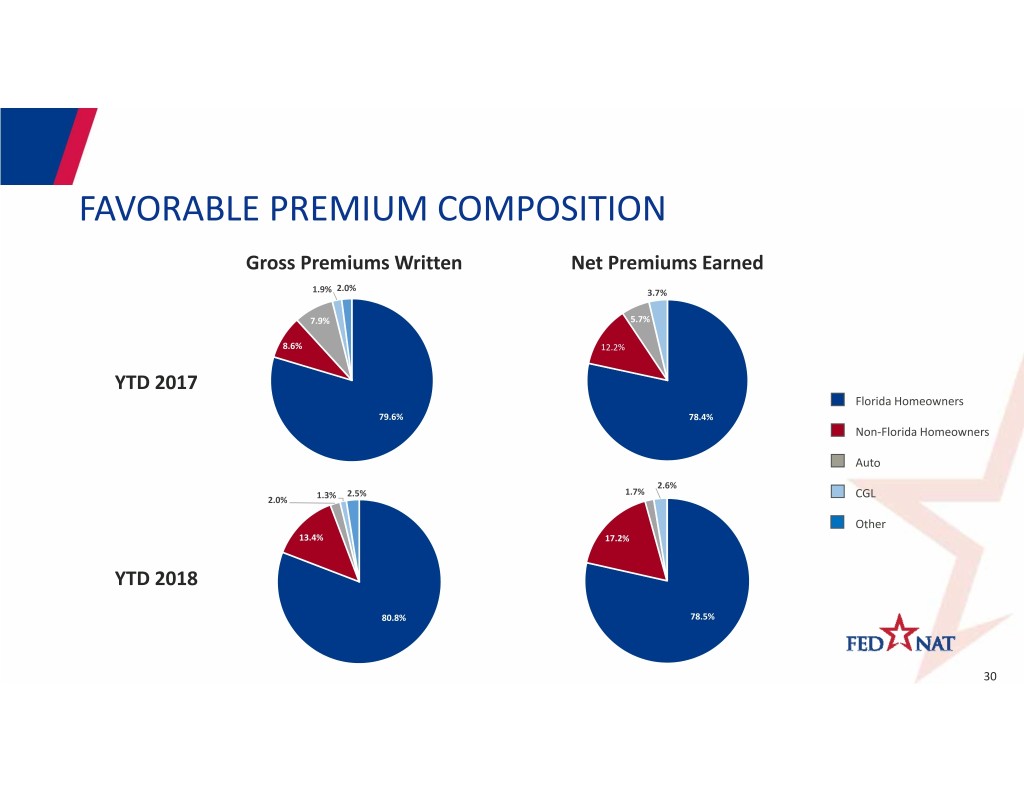
FAVORABLE PREMIUM COMPOSITION Gross Premiums Written Net Premiums Earned 2.0% 1.9% 3.7% 7.9% 5.7% 8.6% 12.2% YTD 2017 Florida Homeowners 79.6% 78.4% Non‐Florida Homeowners Auto 2.6% 2.5% 1.7% CGL 2.0% 1.3% Other 13.4% 17.2% YTD 2018 80.8% 78.5% 30
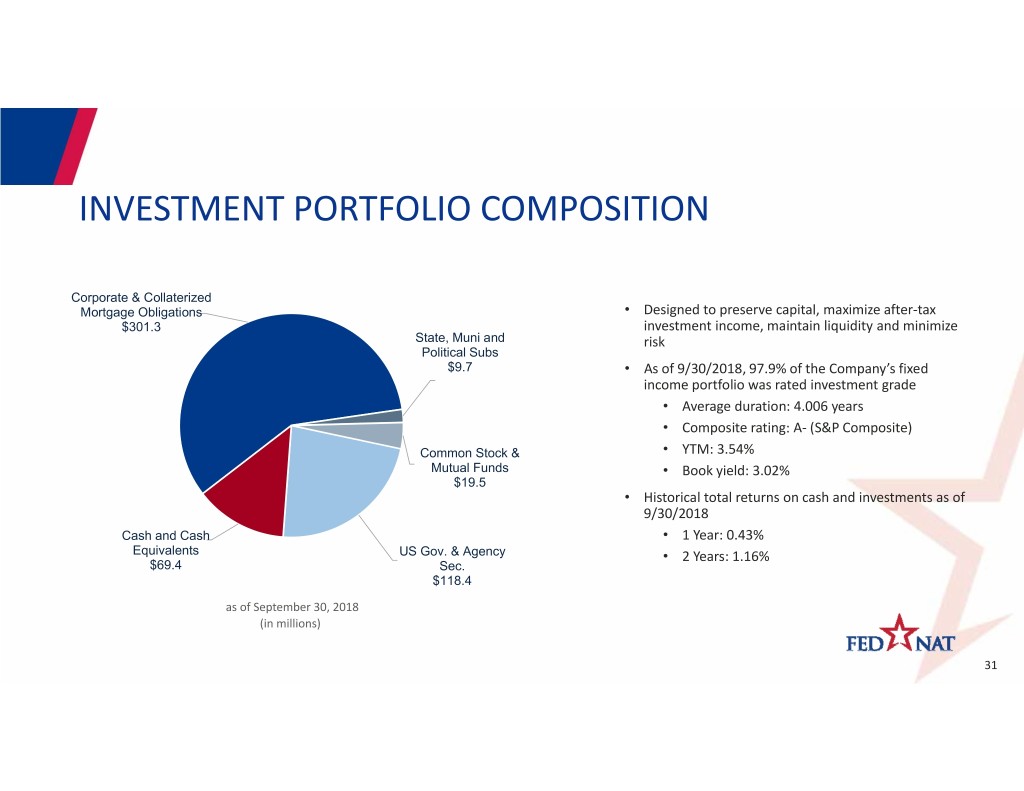
INVESTMENT PORTFOLIO COMPOSITION Corporate & Collaterized Mortgage Obligations • Designed to preserve capital, maximize after‐tax $301.3 investment income, maintain liquidity and minimize State, Muni and risk Political Subs $9.7 • As of 9/30/2018, 97.9% of the Company’s fixed income portfolio was rated investment grade • Average duration: 4.006 years • Composite rating: A‐ (S&P Composite) Common Stock & • YTM: 3.54% Mutual Funds • Book yield: 3.02% $19.5 • Historical total returns on cash and investments as of 9/30/2018 Cash and Cash • 1 Year: 0.43% Equivalents US Gov. & Agency • 2 Years: 1.16% $69.4 Sec. $118.4 as of September 30, 2018 (in millions) 31
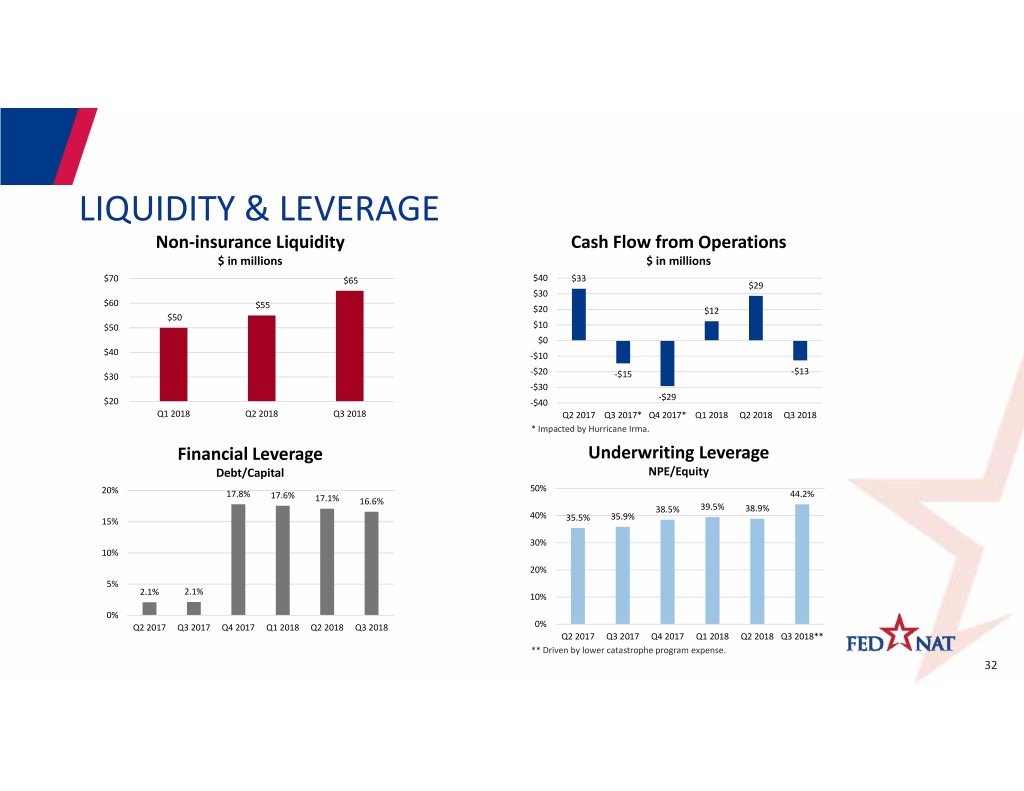
LIQUIDITY & LEVERAGE Non‐insurance Liquidity Cash Flow from Operations $ in millions $ in millions $70 $65 $40 $33 $29 $30 $60 $55 $20 $12 $50 $50 $10 $0 $40 ‐$10 ‐$20 ‐$13 $30 ‐$15 ‐$30 ‐$29 $20 ‐$40 Q1 2018 Q2 2018 Q3 2018 Q2 2017 Q3 2017* Q4 2017* Q1 2018 Q2 2018 Q3 2018 * Impacted by Hurricane Irma. Financial Leverage Underwriting Leverage Debt/Capital NPE/Equity 20% 50% 17.8% 17.6% 44.2% 17.1% 16.6% 38.5% 39.5% 38.9% 40% 35.9% 15% 35.5% 30% 10% 20% 5% 2.1% 2.1% 10% 0% Q2 2017 Q3 2017 Q4 2017 Q1 2018 Q2 2018 Q3 2018 0% Q2 2017 Q3 2017 Q4 2017 Q1 2018 Q2 2018 Q3 2018** ** Driven by lower catastrophe program expense. 32
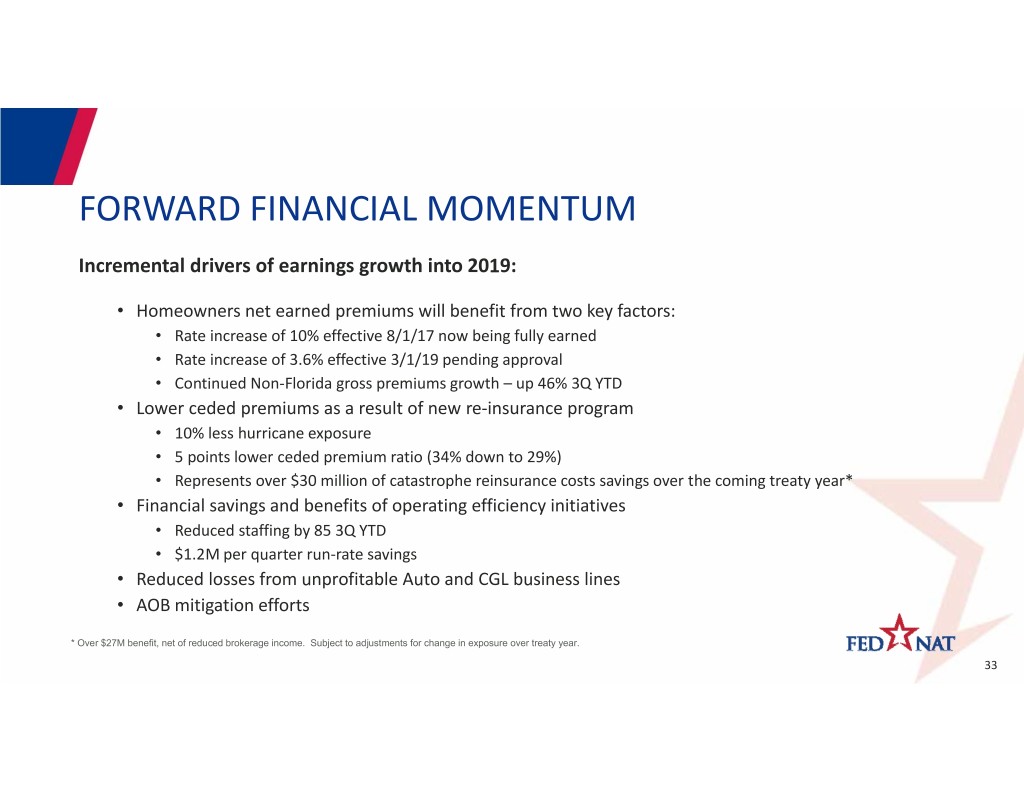
FORWARD FINANCIAL MOMENTUM Incremental drivers of earnings growth into 2019: • Homeowners net earned premiums will benefit from two key factors: • Rate increase of 10% effective 8/1/17 now being fully earned • Rate increase of 3.6% effective 3/1/19 pending approval • Continued Non‐Florida gross premiums growth –up 46% 3Q YTD • Lower ceded premiums as a result of new re‐insurance program • 10% less hurricane exposure • 5 points lower ceded premium ratio (34% down to 29%) • Represents over $30 million of catastrophe reinsurance costs savings over the coming treaty year* • Financial savings and benefits of operating efficiency initiatives • Reduced staffing by 85 3Q YTD • $1.2M per quarter run‐rate savings • Reduced losses from unprofitable Auto and CGL business lines • AOB mitigation efforts * Over $27M benefit, net of reduced brokerage income. Subject to adjustments for change in exposure over treaty year. 33
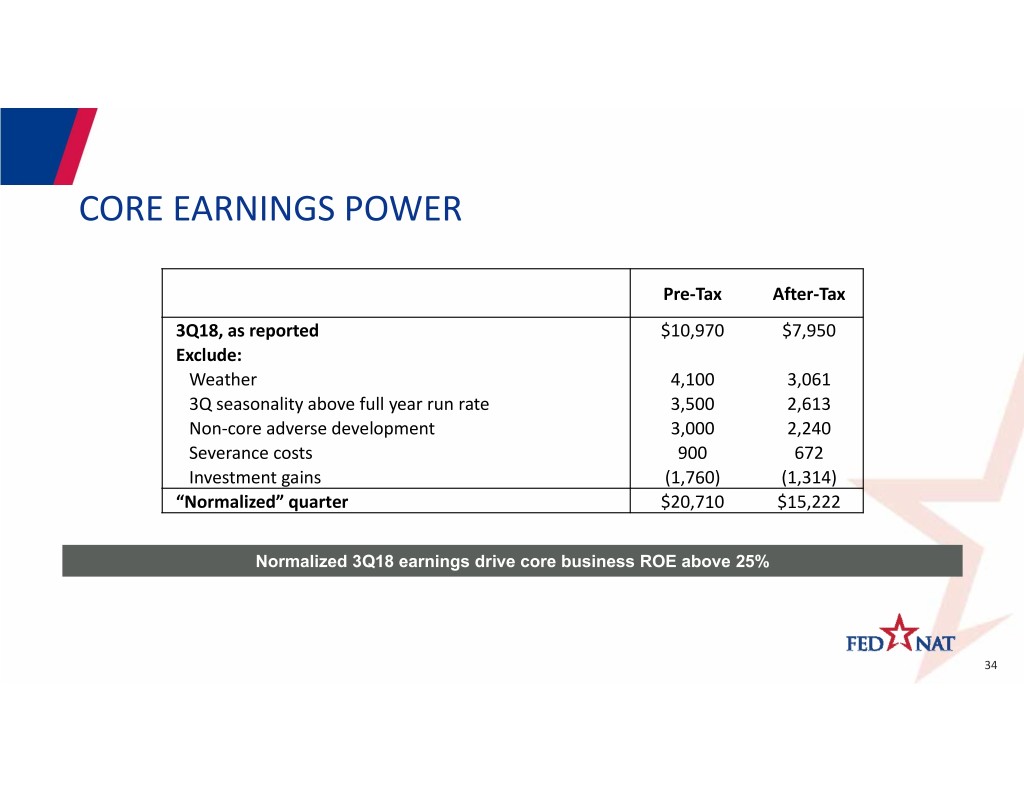
CORE EARNINGS POWER Pre‐Tax After‐Tax 3Q18, as reported $10,970 $7,950 Exclude: Weather 4,100 3,061 3Q seasonality above full year run rate 3,500 2,613 Non‐core adverse development 3,000 2,240 Severance costs 900 672 Investment gains (1,760) (1,314) “Normalized” quarter $20,710 $15,222 Normalized 3Q18 earnings drive core business ROE above 25% 34
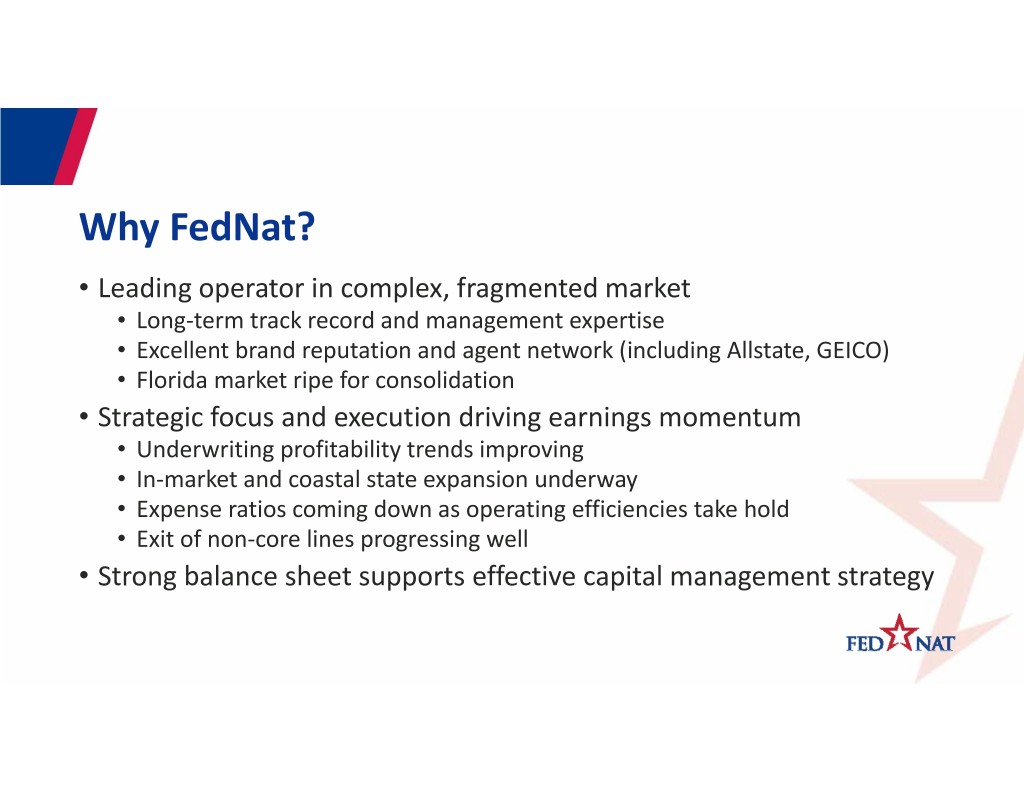
Why FedNat? • Leading operator in complex, fragmented market • Long‐term track record and management expertise • Excellent brand reputation and agent network (including Allstate, GEICO) • Florida market ripe for consolidation • Strategic focus and execution driving earnings momentum • Underwriting profitability trends improving • In‐market and coastal state expansion underway • Expense ratios coming down as operating efficiencies take hold • Exit of non‐core lines progressing well • Strong balance sheet supports effective capital management strategy
Questions? Michael Braun Chief Executive Officer, FedNat Holding Company Phone: 954‐308‐1322 mbraun@FedNat.com Ron Jordan Chief Financial Officer, FedNat Holding Company Phone: 954‐308‐1363 rjordan@FedNat.com
