Attached files
| file | filename |
|---|---|
| EX-32.2 - EX-32.2 - FedNat Holding Co | c996-20161231xex32_2.htm |
| EX-32.1 - EX-32.1 - FedNat Holding Co | c996-20161231xex32_1.htm |
| EX-31.2 - EX-31.2 - FedNat Holding Co | c996-20161231xex31_2.htm |
| EX-31.1 - EX-31.1 - FedNat Holding Co | c996-20161231xex31_1.htm |
| EX-23.2 - EX-23.2 - FedNat Holding Co | c996-20161231xex23_2.htm |
| EX-23.1 - EX-23.1 - FedNat Holding Co | c996-20161231xex23_1.htm |
| EX-21.1 - EX-21.1 - FedNat Holding Co | c996-20161231xex21_1.htm |
| EX-10.31 - EX-10.31 - FedNat Holding Co | c996-20161231xex10_31.htm |
| EX-10.30 - EX-10.30 - FedNat Holding Co | c996-20161231xex10_30.htm |
|
|
UNITED STATES SECURITIES AND EXCHANGE COMMISSION
WASHINGTON, D.C. 20549
FORM 10-K
☒ ANNUAL REPORT PURSUANT TO SECTION 13 OR 15(d) OF THE SECURITIES EXCHANGE ACT OF 1934
FOR THE FISCAL YEAR ENDED December 31, 2016
OR
☐ TRANSITION REPORT PURSUANT TO SECTION 13 OR 15(d) OF THE SECURITIES EXCHANGE ACT OF 1934
FOR THE TRANSITION PERIOD FROM ___________________TO _______________________
Commission File number 000-25001
Federated National Holding Company
(Exact name of registrant as specified in its charter)
|
|
Florida |
|
65-0248866 |
|
|
|
(State or Other Jurisdiction of Incorporation or Organization) |
|
(IRS Employer Identification Number) |
|
|
|
|
|
|
|
|
|
14050 N.W. 14th Street, Suite 180, Sunrise, FL |
|
33323 |
|
|
|
(Address of principal executive offices) |
|
(Zip Code) |
|
Registrant’s telephone number, including area code: 800-293-2532
Securities registered pursuant to Section 12(b) of the Exchange Act:
|
|
Title of Each Class |
|
Name of Each Exchange on Which Registered |
|
|
|
Common Stock, par value $0.01 per share |
|
NASDAQ Global Market |
|
Securities registered pursuant to Section 12(g) of the Exchange Act: None
Indicate by check mark if the Registrant is a well-known seasoned issuer, as defined in Rule 405 of the Securities Act. Yes ☐ No ☒
Indicate by check mark if the Registrant is not required to file reports pursuant to Section 13 or Section 15(d) of the Act. Yes ☐ No ☒
Indicate by check mark whether the registrant (1) has filed all reports required to be filed by Section 13 or 15(d) of the Securities Exchange Act of 1934 during the preceding 12 months (or for such shorter period that the registrant was required to file such reports), and (2) has been subject to such filing requirements for the past 90 days. Yes ☒ No ☐
Indicate by check mark whether the registrant has electronically submitted and posted on its corporate website, if any, every Interactive Data File required to be submitted and posted pursuant to Rule 405 of Regulation S-T (§232.405 of this chapter) during the preceding 12 months (or for such shorter period that the registrant was required to submit and post such files). Yes ☒ No ☐
Indicate by check mark if disclosure of delinquent filers pursuant to Item 405 of Regulation S-K is not contained herein, and will not be contained, to the best of registrant’s knowledge, in definitive proxy or information statements incorporated by reference in Part III of this Form 10-K or any amendment to this Form 10-K. ☐
Indicate by check mark whether the registrant is a large accelerated filer, an accelerated filer, a non-accelerated filer, or a smaller reporting company. See the definitions of “large accelerated filer”, “accelerated filer” and “smaller reporting company” in Rule 12b-2 of the Exchange Act. (Check one):
|
Large accelerated filer ☐ |
Accelerated filer ☒ |
Non‑accelerated filer ☐ |
Smaller reporting company ☐ |
|
|
|
(Do not check if a smaller reporting company) |
|
Indicate by check mark whether the registrant is a shell company (as defined in Rule 12b-2 of the Exchange Act). Yes ☐ No ☒
The aggregate market value of the Registrant’s common stock held by non-affiliates was $246,945,830 on June 30, 2016, computed on the basis of the closing sale price of the Registrant’s common stock on that date.
As of March 13, 2017, the total number of common shares outstanding of Registrant’s common stock was 13,853,574.
|
|
FEDERATED NATIONAL HOLDING COMPANY
|
|
|
|
|
PART I |
|
1 |
|
|
|
|
|
ITEM 1 |
1 | |
|
|
|
|
|
ITEM 1A |
10 | |
|
|
|
|
|
ITEM 1B |
20 | |
|
|
|
|
|
ITEM 2 |
20 | |
|
|
|
|
|
ITEM 3 |
20 | |
|
|
|
|
|
ITEM 4 |
20 | |
|
|
|
|
|
PART II |
|
21 |
|
|
|
|
|
ITEM 5 |
MARKET FOR REGISTRANT’S COMMON EQUITY, RELATED STOCKHOLDER MATTERS AND |
21 |
|
|
|
|
|
ITEM 6 |
24 | |
|
|
|
|
|
ITEM 7 |
MANAGEMENT’S DISCUSSION AND ANALYSIS OF FINANCIAL CONDITION AND |
25 |
|
|
|
|
|
ITEM 7A |
39 | |
|
|
|
|
|
ITEM 8 |
40 | |
|
|
|
|
|
ITEM 9 |
CHANGES IN AND DISAGREEMENTS WITH ACCOUNTANTS ON ACCOUNTING AND |
75 |
|
|
|
|
|
ITEM 9A |
75 | |
|
|
|
|
|
ITEM 9B |
75 | |
|
|
|
|
|
PART III |
|
|
|
|
|
|
|
ITEM 10 |
|
|
|
|
|
|
|
ITEM 11 |
83 | |
|
|
|
|
|
ITEM 12 |
SECURITY OWNERSHIP OF CERTAIN BENEFICIAL OWNERS AND MANAGEMENT AND |
96 |
|
|
|
|
|
ITEM 13 |
CERTAIN RELATIONSHIPS AND RELATED TRANSACTIONS, AND DIRECTOR INDEPENDENCE |
|
|
|
|
|
|
ITEM 14 |
98 | |
|
|
|
|
|
PART IV |
|
99 |
|
|
|
|
|
ITEM 15 |
99 | |
|
|
|
|
| 100 | ||
CAUTIONARY NOTE ABOUT FORWARD-LOOKING STATEMENTS
This Annual Report on Form 10-K contains forward-looking statements within the meaning of Section 27A of the Securities Act of 1933, as amended, or the Securities Act, and Section 21E of the Securities Exchange Act of 1934, as amended, or the Exchange Act. These statements are therefore entitled to the protection of the safe harbor provisions of these laws. These statements may be identified by the use of forward-looking terminology such as “anticipate,” “believe,” “budget,” “contemplate,” “continue,” “could,” “envision,” “estimate,” “expect,” “forecast,” “guidance,” “indicate,” “intend,” “may,” “might,” “outlook,” “plan,” “possibly,” “potential,” “predict,” “probably,” “pro-forma,” “project,” “seek,” “should,” “target,” “will,” “would,” “will be,” “will continue” or the negative thereof or other variations thereon or comparable terminology. We have based these forward-looking statements on our current expectations, assumptions, estimates and projections. While we believe these expectations, assumptions, estimates and projections are reasonable, such forward-looking statements are only predictions and involve a number of risks and uncertainties, many of which are beyond our control. These and other important factors may cause our actual results, performance or achievements to differ materially from any future results, performance or achievements expressed or implied by these forward-looking statements. Management cautions that the forward-looking statements contained in this Annual Report on Form 10-K are not guarantees of future performance, and we cannot assume that such statements will be realized or the forward-looking events and circumstances will occur. Factors that might cause such a difference include, without limitation, the risks and uncertainties discussed under “Risk Factors” in this Annual Form 10‑K, and discussed from time to time in our reports filed with the SEC.
Given these risks and uncertainties, you are cautioned not to place undue reliance on such forward-looking statements. The forward-looking statements included or incorporated by reference into this Annual Form 10-K are made only as of the date hereof. We do not undertake and specifically decline any obligation to update any such statements or to publicly announce the results of any revisions to any such statements to reflect future events or developments.
GENERAL
Federated National Holding Company (“FNHC”, “Company”, “we”, “us”) is an insurance holding company that controls substantially all steps in the insurance underwriting, distribution and claims processes through our subsidiaries and our contractual relationships with our independent agents and general agents. We are authorized to underwrite, and/or place through our wholly owned subsidiaries, homeowners’ multi-peril (“homeowners”), commercial general liability, federal flood, personal auto and other lines of insurance in Florida and other states. We market, distribute and service our own and third-party insurers’ products and our other services through a network of independent agents.
Our wholly owned insurance subsidiary is Federated National Insurance Company (“FNIC”), which is licensed as an admitted carrier in Florida, Alabama, Louisiana, Georgia, Texas and South Carolina. We also serve as managing general agent for Monarch National Insurance Company (“MNIC”), which was founded in 2015 through the joint venture, described below, and is licensed as an admitted carrier in Florida. An admitted carrier is an insurance company that has received a license from the state department of insurance giving the company the authority to write specific lines of insurance in that state. These companies are also bound by rate and form regulations, and are strictly regulated to protect policyholders from a variety of illegal and unethical practices, including fraud. Admitted carriers are also required to financially contribute to the state guarantee fund, which is used to pay for losses if an insurance carrier becomes insolvent or unable to pay the losses due their policyholders.
- 1 -
|
|
|||||||||
|
|
Year Ended December 31, |
||||||||
|
|
2016 |
2015 |
2014 |
||||||
|
Gross premiums written |
(in thousands) |
||||||||
|
Homeowners: |
|||||||||
|
Florida |
$ |
477,489 |
$ |
427,428 |
$ |
335,338 | |||
|
Louisiana |
25,385 | 18,540 | 9,288 | ||||||
|
South Carolina |
6,531 | 1,518 |
— |
||||||
|
Alabama |
3,332 | 2,280 | 312 | ||||||
|
Total homeowners |
512,737 | 449,766 | 344,938 | ||||||
|
Personal automobile: |
|||||||||
|
Texas |
34,239 | 17,916 | 10,805 | ||||||
|
Georgia |
31,831 | 2,762 | 197 | ||||||
|
Florida |
1,745 | 1,200 | 1,374 | ||||||
|
Alabama |
1,664 | 34 |
— |
||||||
|
Total personal automobile |
69,479 | 21,912 | 12,376 | ||||||
|
|
|||||||||
|
Commercial general liability |
13,256 | 13,928 | 12,432 | ||||||
|
Federal flood |
10,013 | 8,164 | 7,410 | ||||||
|
Gross premiums written total |
$ |
605,485 |
$ |
493,770 |
$ |
377,156 | |||
Monarch National Insurance Company Joint Venture
On March 19, 2015, the Company entered into a joint venture to organize MNIC, which received its certificate of authority to write homeowners’ property and casualty insurance in Florida from the Florida Office of Insurance Regulation (the “Florida OIR”). The Company’s joint venture partners are a majority-owned limited partnership of Crosswinds Holdings Inc., a publicly traded Canadian private equity firm and asset manager (“Crosswinds”); and Transatlantic Reinsurance Company (“TransRe”).
The Company and Crosswinds each invested $14.0 million in Monarch Delaware Holdings, LLC (“Monarch Delaware”), the indirect parent company of MNIC, for a 42.4% interest in Monarch Delaware (each holding 50% of the voting interests in Monarch Delaware). TransRe invested $5.0 million for a 15.2% non-voting interest in Monarch Delaware and advanced an additional $5.0 million in debt evidenced by a six-year promissory note bearing 6% annual interest payable by Monarch National Holding Company (“MNHC”), a wholly owned subsidiary of Monarch Delaware and the direct parent company of MNIC.
In connection with the organization of MNIC, the parties entered into the following agreements dated March 17, 2015:
|
· |
MNIC entered into a Managing General Agent and Claims Administration Agreement (the “Monarch MGA Agreement”) with FedNat Underwriters, Inc. (“FNU”), a wholly owned subsidiary of the Company, pursuant to which FNU provides underwriting, accounting, reinsurance placement and claims administration services to Monarch. For its services under the Monarch MGA Agreement, FNU will receive 4% of Monarch’s total written annual premium, excluding acquisition expenses payable to agents, for FNU’s managing general agent services; 3.6% of Monarch’s total earned annual premium for FNU’s claims administration services; and a per-policy administrative fee of $25 for each policy underwritten for Monarch. The Company will also receive an annual expense reimbursement for accounting and related services. |
|
· |
MNIC, MNHC and Monarch Delaware (collectively, the “Monarch Entities”) entered into an Investment Management Agreement (the “Monarch Investment Agreement”) with Crosswinds AUM LLC, a wholly owned subsidiary of Crosswinds (“Crosswinds AUM”), pursuant to which Crosswinds AUM will manage the investment portfolios of the Monarch Entities. The management fee, on an annual basis, is 0.75% of assets under management up to $100 million; 0.50% of assets under management of more than $100 million but less than $200 million; and 0.30% of assets under management of more than $200 million. |
|
· |
MNIC also entered into a Reinsurance Capacity Right of First Refusal Agreement with TransRe, pursuant to which TransRe has a right of first refusal for all quota share and excess of loss reinsurance agreements that Monarch Insurance deems necessary in its sole discretion for so long as TransRe remains a member of Monarch Delaware or the MNHC debt remains outstanding. Pursuant to this agreement, TransRe has the right to provide, at market rates and terms, a maximum of 15% of any reinsurance coverage obtained by MNIC in any individual reinsurance contract. |
|
· |
The Company’s CEO and Interim CFO hold their respective positions with Monarch Entities while they remain employed by the Company. |
- 2 -
MNIC expands our ability to provide insurance policies in Florida. Additionally, it strengthens our relationships with our partner agents. Monarch Entities are consolidated as a variable interest entity (“VIE”) in the accompanying consolidated financial statements included in Part II, Item 8 of this Report. Refer to notes 1 and 14 set forth in Part II, Item 8 “Financial Statements and Supplemental Data” of this Form 10-K for additional information regarding the accounting and consolidation of the joint venture.
Executive Offices
Our executive office is located at 14050 N.W. 14th Street, Suite 180, Sunrise, Florida 33323 and our telephone number is (800) 293-2532.
Available Information
Our internet web site is www.FedNat.com for policy holders, agents and investors. Our annual reports on Form 10-K, quarterly reports on Form 10-Q, current reports on Form 8-K and amendments to such reports are available, free of charge, through our website as soon as reasonably practicable after we electronically file or furnish such material to the Securities and Exchange Commission (“SEC”). The SEC maintains an internet site that contains reports, proxy and information statements and other information regarding our filings at www.sec.gov.
INSURANCE OPERATIONS AND RELATED SERVICES
Business Strategy
We expect that in 2017 we will capitalize on our operational efficiencies and business practices through:
|
· |
improved property analytical qualities such as a broader geographical dispersion of risks throughout the southeast United States and avoiding risks that do not yield an underwriting profit; |
|
· |
continued expansion of our homeowners’ and private passenger automobile insurance products into additional states; |
|
· |
employing our business practices developed and used in Florida in our expansion to other states; |
|
· |
maintaining a commitment to provide high quality customer service to our agents and insureds; |
|
· |
expansion of our marketing efforts by retaining key personnel and implementing direct marketing technologies; |
|
· |
offering attractive incentives to our agents to place a high volume of quality business with our companies; |
|
· |
cede our insurance risk through reinsurance treaties; and |
|
· |
additional strategies that may include possible mergers, acquisitions and joint ventures or dispositions of assets (such as the MNIC joint venture). |
Overview of Insurance Lines of Business
Homeowners Property and Casualty Insurance
FNIC and MNIC underwrite homeowners insurance in Florida and FNIC also underwrites homeowners insurance in Alabama, Louisiana, Texas and South Carolina. Homeowners insurance generally protects an owner of real and personal property against covered causes of loss to that property. The homeowners’ policies in-force totaled 279,109 and 254,105 at December 31, 2016 and 2015, respectively.
Our homeowners insurance products provide maximum dwelling coverage in the amount of approximately $3.8 million, with the aggregate maximum policy limit being approximately $6.5 million. We currently offer dwelling coverage “A” up to $4.0 million with an aggregate total insured value of $6.5 million. We continually subject these limits to review; during 2015, coverage “A” was increased by $1.0 million and total insured value increased by $1.5 million. The approximate average premium on the policies currently in-force is $1,837, as compared with $1,758 for 2015. The typical deductible is either $2,500 or $1,000 for non-hurricane-related claims and generally 2% of the coverage amount for the structure for hurricane-related claims.
- 3 -
Premium rates charged to our homeowners’ insurance policyholders are continually evaluated to assure that they meet the expectation that they are actuarially sound and produce a reasonable level of profit (neither excessive, inadequate or discriminatory). Premium rates in Florida and other states are regulated and approved by the respective states’ office of insurance regulation. In 2016, FNIC applied for and was approved by the Florida OIR for a rate increase of 5.6% for Florida homeowners multiple-peril insurance policies, which became effective for new and renewals on August 1, 2016. MNIC applied for and was approved by the Florida OIR for a rate decrease of 11.9% for Florida homeowners multiple-peril insurance policies, which became effective for new and renewals on April 15, 2016. In 2015, there were no rate increases or decreases in our voluntary property book of homeowners business in FNIC or MNIC. As of the date of this Report, the Company has applied with the Florida OIR for a 2017 rate increase of 6.5% for FNIC for Florida homeowners’ insurance policies only. These rate changes are currently awaiting approval from the Florida OIR. We continue to monitor and seek appropriate adjustment to our rates in order to remain competitive and profitable.
Other Lines of Business
Personal Automobile: Nonstandard personal automobile insurance is principally provided to insureds that are unable to obtain standard insurance coverage because of their driving record, age, vehicle type or other factors, including market conditions. We market this through licensed general agents in their respective territories. Currently, FNIC offers this line of business as an admitted carrier in Texas, Florida, Georgia, and Alabama.
Commercial General Liability: We underwrite for approximately 380 classes of skilled craft workers (excluding home-builders and developers) and mercantile trades (such as owners, landlords and tenants). The limits of liability range from $100,000 per occurrence with a $200,000 policy aggregate to $1.0 million per occurrence with a $2.0 million policy aggregate. We market the commercial general liability insurance products through independent agents and a limited number of general agencies unaffiliated with the Company.
Flood: FNIC writes flood insurance through the National Flood Insurance Program (“NFIP”). We write the policy for the NFIP, which assumes 100% of the flood risk while we retain a commission for our service. Currently, FNIC offers this line of business in Florida, Alabama, Louisiana, South Carolina, and Texas.
MARKETING AND DISTRIBUTION
Our independent agents and general agents have the authority to sell and bind insurance coverage in accordance with procedures established by FNU. FNU reviews all coverage bound by the agents promptly and generally accepts all coverage that falls within stated underwriting criteria. For all policies issued, FNU also has the right, within a period that varies by state between 60 days and 120 days from a policy’s inception, to cancel any policy, upon an advanced notice provided in accordance with statutory specific guidelines, even if the risk falls within our underwriting criteria. We are focusing our marketing efforts on continuing to expand our distribution network while maintaining our commitment to long-term relationships. We market our products and services throughout Florida and in other states by establishing relationships with additional independent agents and general agents. There can be no assurance, however, that we will be able to obtain the required regulatory approvals to offer additional insurance products or expand into other states.
We believe that our integrated computer systems, which allow for rapid automated premium quotation and policy issuance by our agents, are key elements in providing quality service to both our agents and insureds for various lines of our business.
LIABILITY FOR LOSS AND LOSS ADJUSTMENT EXPENSE RESERVES
We are directly liable for loss and loss adjustment expense reserves (“LAE”) payments under the terms of the insurance policies that are underwritten by our insurance companies. In many cases, there may be a time lag between the occurrence and reporting of an insured loss and our payment of that loss. As required by insurance regulations and accounting rules, we reflect the liability for the ultimate payment of all incurred losses and LAE’s by establishing a liability for those unpaid losses and LAE’s for both reported and unreported claims, which represent estimates of future amounts needed to pay claims and related expenses.
When a claim involving a probable loss is reported, we establish a liability for the estimated amount of our ultimate losses and LAE payments. The estimate of the amount of the ultimate loss is based upon such factors as the type of loss, jurisdiction of the occurrence, knowledge of the circumstances surrounding the claim, severity of injury or damage, potential for ultimate exposure, estimate of liability on the part of the insured, past experience with similar claims and the applicable policy provisions.
In addition, management provides for a liability on an aggregate basis to provide for incurred but not yet reported (“IBNR”). The estimates of the liability for loss and LAE reserves are subject to the effect of trends in claims severity and frequency and are continually reviewed. As part of this process, we review historical data and consider various factors, including known and anticipated legal developments, inflation and economic conditions. As experience develops and other data become available, these estimates are revised, as required, resulting in increases or decreases to the existing liability for loss and LAE reserves. Adjustments are reflected in results of operations in the period in which they are made and the liabilities may deviate substantially from prior estimates.
- 4 -
Among our classes of insurance, the automobile and homeowners’ liability claims historically tend to have longer time lapses between the occurrence of the event, the reporting of the claim and the final settlement, than do automobile physical damage and homeowners’ property claims. These liability claims often involve parties filing suit and therefore may result in litigation. By comparison, property damage claims tend to be reported in a relatively shorter period of time and settled in a shorter time frame with less occurrence of litigation.
REINSURANCE AGREEMENTS
Reinsurance is used primarily to manage overall capital adequacy and mitigate the insurance loss exposure related to certain events such as natural and man-made catastrophes.
FNIC and MNIC operate primarily by underwriting and accepting risks for their direct account on a gross basis and reinsuring a portion of the exposure on either an individual risk or an aggregate basis to the extent those exceed the desired retention level. We continually evaluate the relative attractiveness of different forms of reinsurance contracts and different markets that may be used to achieve our risk and profitability objectives.
Reinsurance markets include:
|
· |
Traditional local and global reinsurance markets including those in the United States, Bermuda, London and Europe, accessed directly and through reinsurance intermediaries; |
|
· |
Capital markets through insurance-linked securities and collateralized reinsurance transactions, such as catastrophe bonds, sidecars and similar vehicles; and |
|
· |
Other insurers that engage in both direct and assumed reinsurance |
The form of reinsurance that we may choose from time to time will generally depend on whether we are seeking:
|
· |
Proportional reinsurance, whereby we cede a specified percentage of premium and losses to reinsurers; |
|
· |
Non-proportional or excess of loss reinsurance, whereby we cede all or a specified portion of losses in excess of a specified amount on a per risk, per occurrence (including catastrophe reinsurance) or aggregate basis; or |
|
· |
Facultative contracts that reinsure individual policies |
All of our reinsurance contracts do not relieve FNIC or MNIC from their direct obligations to insured. While it is not always possible to reinsure every known and unknown risk to the company, an effective reinsurance program substantially mitigates our exposure to potentially significant losses. There is a credit risk exposure with respect to ceded losses to the extent that any reinsurer is unable or unwilling to meet the obligations assumed under the reinsurance contracts. The collectability of reinsurance is subject to the solvency of the reinsurers, interpretation of contract language and other factors. The availability and amount of ceded premiums and losses associated with the acquisition of reinsurance will vary year to year. Our reinsurance program is subject to approval primarily by the Florida OIR and other regulators in states where we do business, and is subject to review by Demotech, Inc. (“Demotech”), in connection with Demotech’s rating of FNIC or MNIC. Demotech provides financial stability ratings for property and casualty insurance companies.
FNIC and MNIC operate primarily by underwriting and accepting risks for their direct account on a gross basis and reinsuring a portion of the exposure on either an individual risk or an aggregate basis to the extent those exceed the desired retention level. We continually evaluate the relative attractiveness of different forms of reinsurance contracts and different markets that may be used to achieve our risk and profitability objectives. All of our reinsurance contracts do not relieve FNIC or MNIC from their direct obligations to the insured.
FNIC’s 2015-2016 catastrophe reinsurance program, which ran either from June 1 to May 31 or from July 1 to June 30, consists of the Florida Hurricane Catastrophe Fund (“FHCF”), excess of loss treaties placed with the private market and a 40% property quota-share program. The property quota-share reinsurance is a form of proportional reinsurance that provides coverage for the homeowners’ property lines for wind related catastrophes in Florida. The FHCF treaty affords coverage for losses sustained in Florida and represents only a portion of the reinsurance coverage in Florida.
The excess of loss and FHCF treaties, which became effective on July 1, 2015 and June 1, 2015, respectively, insure for approximately $1.82 billion of aggregate catastrophic losses and loss adjustment expenses (“LAE”) with a maximum single event coverage totaling approximately $1.26 billion, with the Company retaining the first $12.9 million in Florida and $5.0 million in
- 5 -
Louisiana, Alabama and South Carolina for losses and LAE from each event. Ceded premiums in connection with this program totaled approximately $149.7 million.
FNIC’s 2016-2017 reinsurance programs, costing approximately $179.5 million, include approximately $125.7 million for the private reinsurance for Federated National’s Florida exposure, including prepaid automatic premium reinstatement protection on all layers, along with approximately $53.8 million payable to the FHCF. The combination of private and FHCF reinsurance treaties will afford Federated National with approximately $2.22 billion of aggregate coverage with a maximum single event coverage totaling approximately $1.58 billion, exclusive of retentions. FNIC maintained its FHCF participation at 75% for the 2016 hurricane season. FNIC’s single event pre-tax retention for a catastrophic event in Florida is $18.45 million. In addition, FNIC purchases separate underlying reinsurance layers in Louisiana, Alabama, and South Carolina to cover losses and LAE outside of Florida for each catastrophic event from $8.0 million to $18.45 million. Depending on the characteristics of the catastrophic event, and the states involved, FNIC’s single event pre-tax retention could be as low as $8.0 million. The maximum pre-tax retention of $18.45 million for Florida represents 7.76% of the Company’s shareholders’ equity as of December 31, 2016.
Additionally, the Company’s private market excess of loss treaties became effective July 1, 2016 and all private layers have prepaid automatic reinstatement protection, which affords us additional coverage against multiple catastrophic events in the same hurricane season. The Company obtained multiple year protection for a portion of its program; as a result, some of the coverage will expire on June 30, 2017, and a portion of the coverage will remain in-force one additional treaty year until June 30, 2018. These private market excess of loss treaties structure coverage into layers, with a cascading feature such that substantially all private layers attach after $18.45 million in losses for FNIC’s Florida exposure. If the aggregate limit of the preceding layer is exhausted, the next layer drops down (cascades) in its place. Additionally, any unused layer protection drops down for subsequent events until exhausted.
MNIC’s 2016-2017 catastrophe reinsurance program, which runs from either June 1 to May 31 or June 1 to June 30 (13 month period), consists of the FHCF and private market excess of loss treaties. All private layers have prepaid automatic reinstatement protection, which affords MNIC additional coverage, and have a cascading feature such that substantially all layers attach at $3.4 million for MNIC's Florida exposure.
The Company’s property quota share treaties, which are included in the reinsurance program, run for a two-year period from July 1 to July 1 of the following year. The property quota-share treaties consist of two different treaties, one for 30% which became effective July 1, 2014, and the other for 10% which became effective July 1, 2015. The combined treaties provided up to a 40% quota-share reinsurance on the first $100 million of covered losses for the homeowners’ property insurance program in Florida. The treaties are accounted for as retrospectively rated contracts whereby the estimated ultimate premium or commission is recognized over the period of the contracts.
On July 1, 2016, the 30% property quota-share treaty expired on a cut-off basis, which means as of that date the Company will retain 30% of its unearned premiums and losses. The reinsurers will remain liable for 30% of the paid losses occurring during the term of the treaty, until the treaty is commuted.
The Company’s private passenger automobile quota share treaties are typically one-year programs which become effective at different points in the year and cover auto policies across several states. These automobile quota share treaties cede 75% to 90% of all written premiums entered into by the Company.
We are selective in choosing reinsurers and consider numerous factors, the most important of which are the financial stability of the reinsurer or capital specifically pledged to uphold the contract, its history of responding to claims and its overall reputation. In an effort to minimize our exposure to the insolvency of a reinsurer, we evaluate the acceptability and review the financial condition of the reinsurer at least annually. As of December 31, 2016, we have over 65 reinsurance companies in our program that are required to have at least an “A-” or better rating by A.M. Best Company (“A.M. Best”) or the agreement would need to be fully collateralized.
EMPLOYEES
As of December 31, 2016, we had 381 employees, including two executive officers. The 381 employees are made up of 187 from our claims department (of which 58 handle automobile claims), 81 from our underwriting department, 16 from our insurance agency, and 97 perform our back office functions. The back office functions include but are not limited to accounting, information technology, risk management and human resources. We are not a party to any collective bargaining agreement and we have not experienced work stoppages or strikes as a result of labor disputes. We consider relations with our employees to be satisfactory.
COMPETITION
We operate in highly competitive markets and face competition from national, regional and residual market insurance companies in the homeowners’, commercial general liability, automobile and flood markets. Our competitors include companies that market their products through agents, as well as companies that sell insurance directly to their customers. Large national writers may
- 6 -
have certain competitive advantages over agency writers, including increased name recognition, increased loyalty of their customer base and reduced policy acquisition costs. We compete based on underwriting criteria, our distribution network and superior service to our agents and insureds. Although our pricing is inevitably influenced to some degree by that of our competitors, we believe that it is generally not in our best interest to compete solely on price.
In Florida, more than 50 companies compete with us in the homeowners’ insurance market. Three of our larger competitors are Citizens Property Insurance Corporation (“Citizens”), Universal Property and Casualty Insurance Company and Security First Insurance Company. In Florida, more than a dozen companies compete with us in the commercial general liability insurance market.
Significant competition also emerged because of fundamental changes made to the property and casualty insurance business in Florida in recent years which resulted in a multi-pronged approach to address the cost of residential property insurance in Florida. First, the law increased the capacity of reinsurance that stabilized the reinsurance market to the benefit of the insurance companies writing properties lines in Florida. Secondly, the law provided for rate relief to all policyholders. The law also authorized the state-owned insurance company, Citizens, which is free of many of the restraints on private carriers such as surplus, ratios, income taxes and reinsurance expense, to reduce its premium rates and begin competing against private insurers in the residential property insurance market and expands the authority of Citizens to write commercial insurance.
REGULATION
Overview
Our insurance operations are subject to the laws and regulations of Alabama, Florida, Georgia, Louisiana, Nevada, South Carolina and Texas. We are also subject to employment regulations in Florida as well as California, North Carolina and Nevada, and regulations of any other states in which we seek to conduct business in the future. The regulations cover all aspects of our business and are generally designed to protect the interests of insurance policyholders, as opposed to the interests of shareholders. Such regulations relate to authorized lines of business, capital and surplus requirements, allowable rates and forms, investment parameters, underwriting limitations, transactions with affiliates, dividend limitations, changes in control, market conduct, maximum amount allowable for premium financing service charges and a variety of other financial and non-financial components of our business. Our failure to comply with certain provisions of applicable insurance laws and regulations could have a material adverse effect on our business, results of operations or financial condition. In addition, any changes in such laws and regulations, including the adoption of consumer initiatives regarding rates charged for coverage, could materially and adversely affect our operations or our ability to expand.
Most states’ laws restrict an insurer’s underwriting discretion, such as the ability to terminate policies, terminate agents or reject insurance coverage applications, and many state regulators have the power to reduce, or to disallow, increases in premium rates. In addition, state laws generally require that rate schedules and other information be filed with the state’s insurance regulatory authority, either directly or through a rating organization with which the insurer is affiliated. The regulatory authority may disapprove a rate filing if it finds that the rates are inadequate, excessive or unfairly discriminatory. Rates, which are not necessarily uniform for all insurers, vary by class of business, hazard covered, and size of risk. Certain states, including Florida, as discussed above, have adopted laws or are considering proposed legislation which, among other things, limit the ability of insurance companies to effect rate increases or to cancel, reduce or non-renew insurance coverage with respect to existing policies, particularly personal automobile insurance.
Most states require licensure or regulatory approval prior to the marketing of new insurance products. Typically, licensure review is comprehensive and includes a review of a company’s business plan, solvency, reinsurance, character of its officers and directors, rates, forms and other financial and non-financial aspects of a company. The regulatory authorities may prohibit entry into a new market by not granting a license or by withholding approval.
All insurance companies must file quarterly and annual statements with certain regulatory agencies and are subject to regular and special examinations by those agencies. We may be the subject of additional special examinations or analysis. These examinations or analysis may result in one or more corrective orders being issued by the Florida OIR. The Florida OIR is currently performing a regularly scheduled statutory examination of FNIC for the five years ended December 31, 2015. Prior to this, the most recent balance sheet audit of FNIC by the Florida OIR occurred as of December 31, 2010. There were no material findings by the Florida OIR in connection with this examination. FNIC also experienced a regularly scheduled statutory examination by the Florida OIR which occurred during 2010 for the five years ended December 31, 2010. There were no material findings in connection with this examination.
In some instances, various states routinely require deposits of assets for the protection of policyholders either in those states or for all policyholders. As of December 31, 2016, FNIC and MNIC held investment securities with a fair value of approximately $7.9 million, as deposits with the state of Florida, North Carolina, Alabama, and Georgia.
- 7 -
Consent Order
On October 21, 2015, the Florida OIR approved the filing made by FNIC to comply with their cease and desist order dated May 19, 2015 which enabled them to review and approve FNIC’s underwriting analytic models. Upon its approval of the filing, the Florida OIR rescinded the cease and desist order. FNIC was required to pay a nominal administration fee.
Insurance Holding Company Regulation
We, the parent company, are subject to laws governing insurance holding companies in Florida where FNIC and MNIC are domiciled. These laws, among other things, (i) require us to file periodic information with the Florida OIR, including information concerning our capital structure, ownership, financial condition and general business operations, (ii) regulate certain transactions between us and our affiliates, including the amount of dividends and other distributions, the terms of surplus notes and amounts that our affiliates can charge the holding company for services such as management fees or commissions, (iii) restrict the ability of any one person to acquire certain levels of our voting securities without prior regulatory approval. Any purchaser of 10% or more of the outstanding shares of our Common Stock will be presumed to have acquired control of FNIC unless the Florida OIR, upon application, determines otherwise.
Restrictions in Payments of Dividends by Domestic Insurance Companies
Under Florida law, a domestic insurer may not pay any dividend or distribute cash or other property to its shareholders except out of that part of its available and accumulated capital surplus funds which is derived from realized net operating profits on its business and net realized capital gains. A Florida domestic insurer may not make dividend payments or distributions to shareholders without prior approval of the Florida OIR if the dividend or distribution would exceed the larger of (i) the lesser of (a) 10.0% of its capital surplus or (b) net income, not including realized capital gains, plus a two-year carryforward, (ii) 10.0% of capital surplus with dividends payable constrained to unassigned funds minus 25.0% of unrealized capital gains or (iii) the lesser of (a) 10.0% of capital surplus or (b) net investment income plus a three-year carryforward with dividends payable constrained to unassigned funds minus 25.0% of unrealized capital gains.
Alternatively, a Florida domestic insurer may pay a dividend or distribution without the prior written approval of the Florida OIR (i) if the dividend is equal to or less than the greater of (a) 10.0% of the insurer’s capital surplus as regards policyholders derived from realized net operating profits on its business and net realized capital gains or (b) the insurer’s entire net operating profits and realized net capital gains derived during the immediately preceding calendar year, (ii) the insurer will have policy holder capital surplus equal to or exceeding 115.0% of the minimum required statutory capital surplus after the dividend or distribution, (iii) the insurer files a notice of the dividend or distribution with the Florida OIR at least ten business days prior to the dividend payment or distribution and (iv) the notice includes a certification by an officer of the insurer attesting that, after the payment of the dividend or distribution, the insurer will have at least 115.0% of required statutory capital surplus as to policyholders. Except as provided above, a Florida domiciled insurer may only pay a dividend or make a distribution (i) subject to prior approval by the Florida OIR or (ii) 30 days after the Florida OIR has received notice of such dividend or distribution and has not disapproved it within such time.
No dividends were paid by FNIC in 2016, 2015 and 2014, and none are anticipated in 2017. Also, no dividends were paid by MNIC since inception in 2015 and none are anticipated in 2017. Although we believe that amounts required to meet our financial and operating obligations will be available from sources other than dividends from our insurance subsidiaries, there can be no assurance in this regard. Further, there can be no assurance that, if requested, the Florida OIR will allow any dividends to be paid by FNIC or MNIC to us, the parent company, in the future. The maximum dividends permitted by state law are not necessarily indicative of an insurer’s actual ability to pay dividends or other distributions to a parent company, which also may be constrained by business and regulatory considerations, such as the impact of dividends on capital surplus, which could affect an insurer’s competitive position, the amount of premiums that can be written and the ability to pay future dividends. Further, state insurance laws and regulations require that the statutory capital surplus of an insurance company following any dividend or distribution by it be reasonable in relation to its outstanding liabilities and adequate for its financial needs.
While the non-insurance company subsidiaries (FNU and any other affiliate) are not subject directly to the dividend and other distribution limitations, insurance holding company regulations govern the amount that any affiliate within the holding company structure may charge any of the insurance companies for service (e.g., management fees and commissions).
Underwriting and Marketing Restrictions
During the past several years, various regulatory and legislative bodies have adopted or proposed new laws or regulations to address the cyclical nature of the insurance industry, catastrophic events and insurance capacity and pricing. These regulations include (i) the creation of “market assistance plans” under which insurers are induced to provide certain coverages, (ii) restrictions on the ability of insurers to rescind or otherwise cancel certain policies in mid-term, (iii) advance notice requirements or limitations imposed for certain policy non-renewals and (iv) limitations upon or decreases in rates permitted to be charged.
- 8 -
National Association of Insurance Commissioners (“NAIC”) Risk-Based Capital Requirements
In order to enhance the regulation of insurer solvency, NAIC established risk-based capital requirements for insurance companies that are designed to assess capital adequacy and to raise the level of protection that statutory surplus provides for policy holders. These requirements measure three major areas of risk facing property and casualty insurers: (i) underwriting risks, which encompass the risk of adverse loss developments and inadequate pricing; (ii) declines in asset values arising from credit risk; and (iii) other business risks from investments. Insurers having less statutory surplus than required will be subject to varying degrees of regulatory action, depending on the level of capital inadequacy. The Florida OIR, which follows these requirements, could require FNIC or MNIC to cease operations in the event they fail to maintain the required statutory capital.
Based upon the 2016 and 2015 statutory financial statements for FNIC and MNIC, statutory surplus exceeded the regulatory action levels established by the NAIC’s risk-based capital requirements.
Based on risk-based capital requirements, the extent of regulatory intervention and action increases as the ratio of an insurer’s statutory surplus to its Authorized Control Level (“ACL”), as calculated under the NAIC’s requirements, decreases. The first action level, the Company Action Level, requires an insurer to submit a plan of corrective actions to the insurance regulators if statutory surplus falls below 200.0% of the ACL amount. The second action level, the Regulatory Action Level, requires an insurer to submit a plan containing corrective actions and permits the insurance regulators to perform an examination or other analysis and issue a corrective order if statutory surplus falls below 150.0% of the ACL amount. The third action level, ACL, allows the regulators to rehabilitate or liquidate an insurer in addition to the aforementioned actions if statutory surplus falls below the ACL amount. The fourth action level is the Mandatory Control Level, which requires the regulators to rehabilitate or liquidate the insurer if statutory surplus falls below 70.0% of the ACL amount. FNIC’s ratio of statutory surplus to its ACL was 307.5%, 439.3% and 534.0% at December 31, 2016, 2015 and 2014, respectively. MNIC’s ratio of statutory surplus to its ACL was 2,419.8% and 7,260.0% at December 31, 2016 and 2015, respectively.
Industry Ratings Services
Third-party rating agencies assess and rate the ability of insurers to pay their claims. These financial strength ratings are used by the insurance industry to assess the financial strength and quality of insurers. These ratings are based on criteria established by the rating agencies and reflect evaluations of each insurer’s profitability, debt and cash levels, customer base, adequacy and soundness of reinsurance, quality and estimated market value of assets, adequacy of reserves and management. Ratings are based upon factors of concern to agents, reinsurers and policyholders and are not directed toward the protection of investors, such as purchasers of our common stock.
As of December 31, 2016, FNIC and MNIC are rated by Demotech as “A” (“Exceptional”), which is the third of seven ratings, and defined as “Regardless of the severity of a general economic downturn or deterioration in the insurance cycle, insurers earning a Financial Stability Rating (“FSR”) of “A” possess “Exceptional” financial stability related to maintaining surplus as regards to policyholders”. Demotech’s ratings are based upon factors of concern to agents, reinsurers and policyholders and are not primarily directed toward the protection of investors. Our Demotech rating could be jeopardized by factors including adverse development and various surplus related ratio exceptions. On November 16, 2016, Demotech reaffirmed FNIC’s FSR of “A” (“Exceptional”) and on November 30, 2016 Demotech reaffirmed MNIC’s FSR of “A” (“Exceptional”).
- 9 -
We are subject to certain risks in our business operations which are described below. Careful consideration of these risks should be made before making an investment decision. The risks and uncertainties described below are not the only ones facing FNHC. Additional risks and uncertainties not presently known or currently deemed immaterial may also impair our business operations.
Risks Related to Our Business
Our financial condition could be adversely affected by the occurrence of natural and man-made disasters.
We write insurance policies that cover homeowners, business owners and automobile owners for losses that result from, among other things, catastrophes and sinkholes. Catastrophic losses can be caused by natural events such as hurricanes, tropical storms, tornadoes, wind, hail, fires, explosions and other events, and their incidence and severity are inherently unpredictable. They can also be caused by terrorist attacks, war, riots, political instability and other man-made events. The extent of losses from a catastrophe is a function of two factors: the total amount of the insurance company’s exposure in the area affected by the event and the severity of the event. Although our homeowners’ policyholders are disbursed throughout the Southeast, the majority of which are located in Florida, which is especially subject to adverse weather conditions such as hurricanes and tropical storms, and a substantial portion are located in southeastern Florida.
The occurrence of claims from catastrophic events could result in substantial volatility in our results of operations or financial condition for any fiscal quarter or year. Increases in the values and concentrations of insured property may also increase the severity of these occurrences in the future. Although we attempt to manage our exposure to such events through the use of underwriting controls and the purchase of third-party reinsurance, catastrophic events are inherently unpredictable and the actual nature of such events when they occur could be more frequent or severe than contemplated in our pricing and risk management expectations. As a result, the occurrence of one or more catastrophic events could have a material adverse effect on our results of operations or financial condition.
Florida experienced two significant hurricanes in 2016, which some weather analysts believe is consistent with a period of greater hurricane activity. We are exploring alternatives to reduce our exposure to these types of storms, which may increase operating expenses and may not be successful in protecting long-term profitability. If our loss experience is more adverse than is contemplated by our loss reserves, the related increase in our loss reserves may have a material adverse effect on our results of operations in the period in which the increase occurs.
Although we follow the industry practice of reinsuring a portion of our risks, our costs of obtaining reinsurance fluctuates and we may not be able to successfully alleviate risk through reinsurance arrangements.
We have a reinsurance structure that is a combination of private reinsurance and the FHCF. Our reinsurance structure is composed of several reinsurance companies with varying levels of participation providing coverage for loss and LAE’s at pre-established minimum and maximum amounts. Losses incurred in connection with a catastrophic event below the minimum and above the maximum are the responsibility of FNIC and MNIC.
The availability and costs associated with the acquisition of reinsurance will vary year to year. We are not able to control these fluctuations which may be significant and may limit our ability to purchase adequate coverage. The recovery of increased reinsurance costs through rate action is not immediate and cannot be presumed, as it is subject to approval of the Florida OIR.
We face a risk of non-collectability of reinsurance, which could materially and adversely affect our business, results of operations and financial condition.
As is common practice within the insurance industry, we transfer a portion of the risks insured under our policies to other companies through the purchase of reinsurance. This reinsurance is maintained to protect our insurance subsidiary against the severity of losses on individual claims, unusually serious occurrences in which a number of claims produce an aggregate extraordinary loss and other catastrophic events. Although reinsurance does not discharge our insurance subsidiary from its primary obligation to pay for losses insured under the policies it issues, reinsurance does make the assuming reinsurer liable to the insurance subsidiary for the reinsured portion of the risk. A credit exposure exists with respect to ceded losses to the extent that any reinsurer is unable or unwilling to meet the obligations assumed under the reinsurance contracts. The collectability of reinsurance is subject to the solvency of the reinsurers, interpretation of contract language and other factors. A reinsurer’s insolvency or inability to make payments under the terms of a reinsurance contract could have a material adverse effect on our business, results of operations and financial condition.
Our reinsurance structure has significant risks, including the fact that the FHCF or our other reinsurers may not have available capital resources to pay their claims or that their ability to pay their claims in a timely manner may be impaired. This could result in significant financial, legal and operational challenges to our company. Therefore, in the event of a catastrophic loss, we may become
- 10 -
dependent upon the FHCF’s ability to pay, which may, in turn, be dependent upon the SBA’s ability to issue bonds in amounts that would be required to meet its reinsurance obligations in the event of such a catastrophic loss.
If we are unable to continue our growth because our capital must be used to pay greater than anticipated claims, our financial results may suffer.
Our future growth will depend on our ability to expand the types of insurance products we offer and the geographic markets in which we do business, both balanced by the business risks we choose to assume and cede. We believe that our Company is sufficiently capitalized to operate our business as it now exists and as we currently plan to expand it. Our existing sources of funds include possible sales of our investment securities and our earnings from operations and investments. Unexpected catastrophic events in our market areas, such as the hurricanes experienced in Florida and South Carolina in 2016, have resulted and may result in greater claims losses than anticipated, which could require us to limit or halt our growth while we redeploy our capital to pay these unanticipated claims.
We may require additional capital in the future which may not be available or only available on unfavorable terms.
Our future capital requirements depend on many factors, including our ability to write new business successfully and to establish premium rates and reserves at levels sufficient to cover losses. To the extent that our capital may be insufficient to meet future operating requirements and/or cover losses, we may need to raise additional funds through financings or curtail our growth. Many factors will affect the amount and timing of our capital needs, including our growth and profitability, our claims experience, and the availability of reinsurance, as well as possible acquisition opportunities, market disruptions and other unforeseeable developments.
If we were required to raise additional capital, equity or debt financing may not be available at all or may be available only on terms that are not favorable to us. In the case of equity financings, dilution to our shareholders’ ownership could result, and in any case such securities may have rights, preferences and privileges that are senior to those of existing shareholders. If we raise additional funds by incurring debt financing, the terms of the debt may involve significant cash payment obligations as well as covenants and specific financial ratios that may restrict our ability to operate our business or pay dividends. If we cannot obtain adequate capital on favorable terms or at all, our business, financial condition or results of operations could be materially adversely affected.
Our business is heavily regulated, and changes in regulation may reduce our profitability and limit our growth.
We are subject to extensive regulation in the states in which we conduct business. This regulation is generally designed to protect the interests of policyholders, as opposed to shareholders and other investors, and relates to authorization for lines of business, capital and surplus requirements, investment limitations, underwriting limitations, transactions with affiliates, dividend limitations, changes in control, premium rates and a variety of other financial and non-financial components of an insurance company’s business. These regulatory requirements may adversely affect or inhibit our ability to achieve some or all of our business objectives. State regulatory authorities also conduct periodic examinations into insurers’ business practices. These reviews may reveal deficiencies in our insurance operations or differences between our interpretations of regulatory requirements and those of the regulators.
The NAIC and state insurance regulators are constantly reexamining existing laws and regulations, generally focusing on modifications to holding company regulations, interpretations of existing laws and the development of new laws.
From time to time, some states in which we conduct business have considered or enacted laws that may alter or increase state authority to regulate insurance companies and insurance holding companies. In other situations, states in which we conduct business have considered or enacted laws that impact the competitive environment and marketplace for property and casualty insurance. In addition, in recent years the state insurance regulatory framework has come under increased federal scrutiny. Changes in federal legislation and administrative policies in several areas, including changes in financial services regulation and federal taxation, can significantly impact the insurance industry and us.
We cannot predict with certainty the effect any enacted, proposed or future state or federal legislation or NAIC initiatives may have on the conduct of our business. Furthermore, there can be no assurance that the regulatory requirements applicable to our business will not become more stringent in the future or result in materially higher costs than current requirements. Changes in the regulation of our business may reduce our profitability, limit our growth or otherwise adversely affect our operations.
We may experience financial exposure from climate change.
A body of scientific evidence indicates that climate change may be occurring. Climate change, to the extent that it may affect weather patterns, may cause an increase in the frequency and/or the severity of catastrophic events or severe weather conditions. Our financial exposure from climate change is most notably associated with losses in connection with the occurrence of hurricanes striking Florida. We mitigate the risk of financial exposure from climate change by restrictive underwriting criteria, sensitivity to geographic concentrations, and reinsurance.
- 11 -
Restrictive underwriting criteria can include, but are not limited to, higher premiums and deductibles and more specifically excluded policy risks such as fences and screened-in enclosures. New technological advances in computer generated geographical mapping afford us an enhanced perspective as to geographic concentrations of policyholders and proximity to flood prone areas. Our amount of maximum reinsurance coverage is determined by subjecting our homeowner exposures to statistical forecasting models that are designed to quantify a catastrophic event in terms of the frequency of a storm occurring once in every “n” years. Additionally, if the statistical forecasting models fail to contemplate an emerging claim trend, such as the assignment of insurance benefits in Florida then there is the risk the Company may not purchase adequate catastrophic wind coverage. Our reinsurance coverage contemplates the effects of a catastrophic event that occurs only once every 100 years. Our amount of losses retained (our deductible) in connection with a catastrophic event is determined by market capacity, pricing conditions and surplus preservation. There can be no assurance that our reinsurance coverage and other measures taken will be sufficient to mitigate losses resulting from one or more catastrophic events.
Our loss reserves are estimates and may be inadequate to cover our actual liability for losses, causing our results of operations to be adversely affected.
We maintain reserves to cover our estimated ultimate liabilities for losses and LAE. These reserves are estimates based on historical data and statistical projections of what we believe the settlement and administration of claims will cost based on facts and circumstances then known to us. Actual loss and LAE reserves, however, may vary significantly from our estimates.
Factors that affect loss and LAE reserves include the estimates made on a claim-by-claim basis known as “case reserves” coupled with bulk estimates known as IBNR. Periodic estimates by management of the ultimate costs required to settle all claim files are based on the Company’s analysis of historical data and estimations of the impact of numerous factors such as (i) per claim information; (ii) Company and industry historical loss experience, including the impact of trends such as the assignment of benefits by insureds; (iii) legislative enactments, judicial decisions, legal developments in the awarding of damages, and changes in political attitudes; and (iv) trends in general economic conditions, including the effects of inflation. Management revises its estimates based on the results of its analysis. This process assumes that past experience, adjusted for the effects of current developments and anticipated trends, is an appropriate basis for estimating the ultimate settlement of all claims. There is no precise method for subsequently evaluating the impact of any specific factor on the adequacy of the reserves, because the eventual redundancy or deficiency is affected by multiple factors.
Because of the uncertainties that surround estimated loss reserves, we cannot be certain that our reserves will be adequate to cover our actual losses. If our loss and LAE reserves are less than actual losses and LAE’s, we will be required to increase our reserves with a corresponding reduction in our net income in the period in which the deficiency is identified. Future loss experience, substantially in excess of our loss and LAE reserves, could substantially harm our results of operations and financial condition.
Our revenues and operating performance will fluctuate due to statutorily approved assessments that support property and casualty insurance pools and associations.
We operate in a regulatory environment where certain entities and organizations have the authority to require us to participate in assessments. Currently these entities and organizations include, but are not limited to, the Florida Joint Underwriters Association (“JUA”), the Florida Insurance Guaranty Association (“FIGA”), Citizens and the FHCF.
The insurance companies currently pass the assessments on to holders or insurance policies, in the form of a policy surcharge, and reflect the collection of these assessments as fully earned credits to operations in the period collected. The collection of these fees may adversely affect our overall marketing strategy due to the competitive landscape in Florida.
In addition, the impact of future assessments on our balance sheet, results of operations or cash flow are undeterminable at this time.
Our investment portfolio may suffer reduced returns or losses, which would significantly reduce our earnings.
Like other insurance companies, we depend on income from our investment portfolio for a substantial portion of our earnings. During the time that normally elapses between the receipt of insurance premiums and any payment of insurance claims, we invest the premiums received, together with our other available capital, primarily in debt securities and to a lesser extent in equity securities, in order to generate investment income.
Our investment portfolio contains interest rate sensitive instruments, such as bonds, which may be adversely affected by changes in interest rates. A significant increase in interest rates or decrease in credit worthiness could have a material adverse effect on our financial condition or results of operations. Generally, bond prices decrease as interest rates rise. Changes in interest rates could also have an adverse effect on our investment income and results of operations. For example, if interest rates decline, investment of new premiums received and funds reinvested will earn less than expected.
- 12 -
Our determination of the amount of other-than-temporary impairment to record varies by investment type and is based upon our periodic evaluation and assessment of known and inherent risks associated with the respective investment type. We revise our evaluations and assessments as conditions change and new information becomes available, and we reflect changes in other-than- temporary impairments in our consolidated statements of income. We base our assessment of whether other-than-temporary impairments have occurred on our case-by-case evaluation of the underlying reasons for the decline in fair value. We can neither provide assurance that we have accurately assessed whether the impairment of one or more of our investments is temporary or other-than-temporary, nor that we have accurately recorded amounts for other-than-temporary impairments in our financial statements. Furthermore, historical trends may not be indicative of future impairments and additional impairments may need to be recorded in the future.
In addition, volatile and illiquid markets increase the likelihood that investment securities may not behave in historically predictable manners, resulting in fair value estimates that may be overstated compared with actual amounts that could be realized upon disposition or maturity of the security. The effects of market volatility and declining economic conditions may have unforeseen consequences on the credit quality, liquidity and financial stability of the issuers of securities we hold, or reinsurers with which we do business. Such deteriorations in financial condition can occur rapidly, leaving us unable to react to such a scenario in a prudent manner consistent with our historical practices in dealing with more orderly markets. This in turn could adversely and negatively affect our results of operations, liquidity or financial condition.
The failure of any of the loss limitation methods we employ could have a material adverse effect on our financial condition or our results of operations.
Various provisions of our policies, such as limitations or exclusions from coverage which have been negotiated to limit our risks, may not be enforceable in the manner we intend. At the present time we employ a variety of exclusions to our policies that limit exposure to known risks, including, but not limited to, exclusions relating to certain named liabilities, types of vehicles and specific artisan activities.
In addition, the policies we issue contain conditions requiring the prompt reporting of claims to us and our right to decline coverage in the event of a violation of that condition. While we believe our insurance product exclusions and limitations reduce the loss exposure to us and help eliminate known exposures to certain risks, it is possible that a court or regulatory authority could nullify or void an exclusion or that legislation could be enacted modifying or barring the use of such endorsements and limitations in a way that would adversely affect our loss experience, which could have a material adverse effect on our financial condition or results of operations.
The effects of emerging claim and coverage issues on our business are uncertain.
As industry practices and legal, judicial, social and other conditions change, unexpected and unintended issues related to claims and coverage may emerge. These issues may adversely affect our business by either extending coverage beyond our underwriting intent or by increasing the number or size of claims. In some instances, these changes may not become apparent until sometime after we have issued insurance contracts that are affected by the changes. As a result, the full extent of liability under our insurance contracts may not be known for many years after a contract is issued.
Another example of an existing trend, particularly in Florida homeowners insurance, is the assignment of homeowner benefits for a claim where a service provider agrees to make a repair that may be covered by an insurance policy in exchange for the policyholder’s right to sue the insurance carrier directly. The assignment of the insurance benefits has substantially increased, and is likely to continue to increase, the Company’s exposure to inflated claims, attorney fees and costs. Although legislative actions in the State of Florida to limit the effect of assignment of benefits on insurance companies are being contemplated, there can be no assurances that any such legislative actions will become law or, if enacted, that such actions will have the effect of limiting the impact on us of assignments of benefits by insureds.
Our failure to pay claims accurately could adversely affect our business, financial results and capital requirements.
We must accurately evaluate and pay claims that are made under our policies. Many factors affect our ability to pay claims accurately, including the training and experience of our claims representatives, the culture of our claims organization and the effectiveness of our management, our ability to develop or select and implement appropriate procedures and systems to support our claims functions and other factors. Our failure to pay claims accurately could lead to material litigation, undermine our reputation in the marketplace, impair our image and negatively affect our financial results.
In addition, if we do not train new claims adjusting employees effectively or if we lose a significant number of experienced claims adjusting employees, our claims department’s ability to handle an increasing workload as we grow could be adversely affected. In addition to potentially requiring that growth be slowed in the affected markets, we could suffer decreased quality of claims work, which in turn could lower our operating margins.
- 13 -
Our insurance company is subject to minimum capital and surplus requirements, and our failure to meet these requirements could subject us to regulatory action.
Our insurance company is subject to risk-based capital standards and other minimum capital and surplus requirements imposed under applicable state laws, including the laws of the State of Florida. The risk-based capital (“RBC”) standards, based upon the Risk Based Capital Model Act adopted by the NAIC, require our insurance company to report their results of RBC calculations to state departments of insurance and the NAIC. These RBC standards provide for different levels of regulatory attention depending upon the ratio of an insurance company’s total adjusted capital, as calculated in accordance with NAIC guidelines, to its authorized control level risk-based capital.
If we fail to meet the applicable RBC or minimum statutory capital requirements imposed by the laws of Florida or other states where we do business, we could be subject to further examination or corrective action imposed by state regulators, including limitations on out writing of additional business, state supervision or liquidation, and may be required to raise additional capital. Similarly, an increase in existing RBC requirements or minimum statutory capital requirements may require us to increase our statutory capital levels.
Our revenues and operating performance may fluctuate with business cycles in the property and casualty insurance industry.
Historically, the financial performance of the property and casualty insurance industry has tended to fluctuate in cyclical patterns characterized by periods of significant competition in pricing and underwriting terms and conditions, which is known as a “soft” insurance market, followed by periods of lessened competition and increasing premium rates, which is known as a “hard” insurance market. Although an individual insurance company’s financial performance is dependent on its own specific business characteristics, the profitability of most property and casualty insurance companies tends to follow this cyclical market pattern, with profitability generally increasing in hard markets and decreasing in soft markets. At present, we are experiencing a softening market in the property and casualty market in Florida and in the other states we operate in because of increased competition. We cannot predict, however, how long these market conditions will persist. Although we do not compete entirely on price or targeted market share, negative market conditions may impair our ability to write insurance at rates that we consider appropriate relative to the risk assumed. If we cannot write insurance at appropriate rates, our revenues and operating performance may be adversely affected.
We may not obtain the necessary regulatory approvals to expand the types of insurance products we offer or the states in which we operate.
The insurance industry is highly regulated. Prior to selling a new insurance product in a state, we must obtain approval from the applicable state insurance regulators. The insurance regulators in states to which we might apply may request additional information, add conditions to the license that we find unacceptable, or deny our application. This would delay or prevent us from operating in that state. If we want to operate in any additional states, we must file similar applications for licenses, which we may not be successful in obtaining.
Adverse ratings by insurance rating agencies may adversely impact our ability to write new policies, renew desirable policies or obtain adequate insurance, which could limit or halt our growth and harm our business.
Third-party rating agencies assess and rate the ability of insurers to pay their claims. These financial strength ratings are used by the insurance industry to assess the financial strength and quality of insurers. These ratings are based on criteria established by the rating agencies and reflect evaluations of each insurer’s profitability, debt and cash levels, customer base, adequacy and soundness of reinsurance, quality and estimated market value of assets, adequacy of reserves, and management. Ratings are based upon factors of concern to agents, reinsurers and policyholders and are not directed toward the protection of investors, such as purchasers of our common stock.
Our ability to compete successfully in states outside of Florida and to expand our business footprint may also be negatively affected by our lack of an A.M. Best Company rating of our financial strength. Although our insurance subsidiaries have a Demotech rating of “A” (Exceptional), which is generally accepted in Florida and certain other states, a rating by A.M. Best is more widely accepted outside of Florida and may cause customers and agents to prefer a policy written by an A.M. Best-rated company over a policy written by us. In addition, some mortgage companies outside of Florida may require homeowners to obtain property insurance from an insurance company with a minimum A.M. Best rating.
The withdrawal of our ratings could limit or prevent us from writing or renewing desirable insurance policies, from competing with insurers who have higher ratings, from obtaining adequate reinsurance, or from borrowing on a line of credit. The withdrawal or downgrade of our ratings could have a material adverse effect on our results of operations and financial position because our insurance products might no longer be acceptable to the secondary marketplace and mortgage lenders. Furthermore, a withdrawal or downgrade of our ratings could prevent independent agents from selling and servicing our insurance products or could increase the commissions we must pay to these agents.
- 14 -
We rely on independent and general agents to write our insurance policies, and if we are not able to attract and retain independent and general agents, our revenues would be negatively affected.
We currently market and distribute our products and services through contractual relationships with a network of independent agents and a selected number of general agents. Our independent agents are our primary source for our property and liability insurance policies. Many of our competitors also rely on independent agents. As a result, we must compete with other insurers for independent agents’ business. Our competitors may offer a greater variety of insurance products, lower premiums for insurance coverage, or higher commissions to their agents. If our products, pricing and commissions do not remain competitive, we may find it more difficult to attract business from independent agents to sell our products. A material reduction in the amount of our products that independent agents sell or a material reduction in the number of independent agents with whom we maintain a relationship could negatively affect our results of operations and financial condition.
We are a party to an Insurance Agency Master Agreement with Ivantage Select Agency, Inc. (“ISA”) an affiliate of Allstate Insurance Company, or Allstate, pursuant to which we are authorized by ISA to appoint Allstate agents to offer our homeowners’ and commercial general liability insurance products to consumers in Florida. Since that time, our homeowners’ premiums and the percentage of homeowners’ premiums attributable to Allstate agents has increased rapidly. During 2016, 24.1% of the homeowners’ premiums we underwrote were from Allstate’s network of Florida agents, and this concentration may continue to increase. An interruption or change in our relationship with ISA could have a material adverse effect on the amount of premiums we are able to write, as well as our results of operations.
Our business could be materially and adversely affected by a security breach or other attack involving our computer systems or the systems of one or more of our business partners or vendors.
Our business requires that we build and maintain computer systems to run our operations and to store the significant volume of data that we acquire, including the personal confidential information of our customers, agents and employees and our intellectual property, trade secrets, and other sensitive business and financial information. These systems are subject to attacks by sophisticated third parties with substantial computing resources and capabilities. Such attacks may include, among other things, attempts to gain unauthorized access to this confidential or proprietary data or attempts to disrupt or shut down the system. Additionally, an employee, consultant, vendor representative or other person with legitimate access to our systems may take actions, or be the subject of a security breach or cyber-attack, which could result in improper or unauthorized access to our systems, and in the loss or theft of our intellectual property or the personal information of our customers, agents or employees.
We undertake substantial efforts to protect our systems and sensitive or confidential information. These efforts include internal processes and technological defenses that are preventative or detective, and other controls designed to provide multiple layers of security protection. While we expend significant resources on these defensive measures, there can be no assurance that we will be successful in preventing attacks or detecting and stopping them once they have begun.
We also conduct significant business functions and computer operations using the systems of third-party business partners and vendors, who provide software, hosting, communication, and other computer services to us. These third-party systems may experience cyber-attacks and other security breaches, which could result in the loss, theft or unauthorized publication of our information or the confidential information of our customers, agents or employees.
Our business could be significantly damaged by a security breach, data loss or corruption, or cyber-attack. In addition to the potentially high costs of investigating and stopping such an event and implementing necessary fixes, we could incur substantial liability if confidential customer, agent or employee information is stolen. This could cause a significant disruption of our ability to conduct our insurance operations, adversely affect our competitive position if trade secrets or other proprietary information is stolen, and have severe ramifications on our reputation and brand, resulting in a materially adverse effect on our ability to generate new and renewal business. To mitigate these costs, we carry a cyber-liability insurance policy. Our insurance may not be sufficient to protect against all financial and other loss. Additionally, this policy will not afford us coverage for security breaches, data loss, or cyber-attacks experienced by our third-party business partners who have access to our customer, agent, or employee data.
We rely on our information technology and telecommunications systems, and the failure of these systems could disrupt our operations.
Our business is highly dependent upon the successful and uninterrupted functioning of our current information technology and telecommunications systems. We rely on these systems to process new and renewal business, provide customer service, make claims payments and facilitate collections and cancellations, as well as to perform actuarial and other analytical functions necessary for pricing and product development. As a result, the failure of these systems could interrupt our operations and adversely affect our financial results. We utilize a third-party to provide certain information security related services designed to prevent an information security event or detect one timely. Although we have implemented security measures to protect our systems from computer viruses and intrusions by third parties, there can be no assurances that these measures will be effective.
- 15 -
Nonstandard automobile insurance historically has a higher frequency of claims than standard automobile insurance, thereby increasing our potential for loss exposure beyond what we would be likely to experience if we offered only standard automobile insurance.
Nonstandard automobile insurance is provided to insureds that are unable to obtain preferred or standard insurance coverage because of their payment histories, driving records, age, vehicle types, or prior claims histories. This type of automobile insurance historically has a higher frequency of claims than does preferred or standard automobile insurance policies, although the average dollar amount of the claim is usually smaller under nonstandard insurance policies. As a result, we are exposed to the possibility of increased loss exposure and higher claims experience than would be the case if we offered only standard automobile insurance.
Our success depends on our ability to accurately price the risks we underwrite.
The results of operations and the financial condition of our insurance company depend on our ability to underwrite and set premium rates accurately for a wide variety of risks. Rate adequacy is necessary to generate sufficient premiums to pay losses, LAE’s and underwriting expenses and to earn a profit. In order to price our products accurately, we must collect and properly analyze a substantial amount of data; develop, test and apply appropriate rating formulas; closely monitor and timely recognize changes in trends; and project both severity and frequency of losses with reasonable accuracy. Our ability to undertake these efforts successfully and price our products accurately is subject to a number of risks and uncertainties, some of which are outside our control, including:
|
· |
the availability of sufficient reliable data and our ability to properly analyze available data; |
|
· |
the uncertainties that inherently characterize estimates and assumptions; |
|
· |
our selection and application of appropriate rating and pricing techniques; |
|
· |
changes in legal standards, claim settlement practices, medical care expenses and restoration costs; |
|
· |
regulatory restrictions; and |
|
· |
legislatively imposed consumer initiatives. |
Consequently, we could underprice risks, which would negatively affect our profit margins, or we could overprice risks, which could reduce our sales volume and competitiveness. In either event, the profitability of our insurance company could be materially and adversely affected.
Current operating resources are necessary to develop future new insurance products.
We currently intend to expand our product offerings by underwriting additional insurance products and programs, and marketing them through our distribution network. Expansion of our product offerings will result in increases in expenses due to additional costs incurred in actuarial rate justifications, software and personnel. Offering additional insurance products may also require regulatory approval, further increasing our costs. There can be no assurance that we will be successful bringing new insurance products to our marketplace in a manner that is profitable.
Increased competition, competitive pressures, industry developments and market conditions could affect the growth of our business and adversely impact our financial results.
We operate in highly competitive markets and face competition from national, regional and residual market insurance companies in the homeowners’, commercial general liability, and automobile markets, many of whom are larger, have greater financial and other resources, have higher financial strength ratings and offer more diversified insurance coverage. Our competitors include companies that market their products through agents, as well as companies that sell insurance directly to their customers. Large national writers may have certain competitive advantages over agency writers, including increased name recognition, increased loyalty of their customer base and reduced policy acquisition costs. We may be forced to reduce our premiums significantly to compete, which could make us less profitable and have a material adverse effect on our business, results of operations and financial condition. If we do not meet the prices offered by our competitors, we may lose business in the short term, which could also result in a material adverse effect on our business, results of operations and financial condition.
- 16 -
MNIC has focused on the Florida homeowners’ insurance market, which has increased our exposure to the factors that impact the Florida insurance market generally, such as the occurrence of hurricanes, trends in claims experience, and the impact of changes in Florida insurance law and regulations.
MNIC is organized as a Florida property and casualty insurer and has initially focused primarily on the Florida homeowners’ insurance market. As a result, the presence of MNIC in the Florida market increases our exposure to the factors that impact insurers in the Florida market generally, such as the occurrence of catastrophic events such as hurricanes, the trends experienced in administering and resolving claims resulting from the increased use of private adjusters, and the impact of changes in Florida’s insurance laws and regulations. To the extent that these factors may adversely affect our operations, the presence of MNIC in the Florida market will have the effect of magnifying the effect of those factors.
MNIC writes insurance policies that have a higher risk profile than those written by FNIC, allowing MNIC to reach a broader market and charge higher premiums. While MNIC underwriting standards avoids the highest risk policies, the occurrence of a catastrophic event could result in greater losses per policy for MNIC and have a material adverse effect on the Company’s results of operations, financial position and cash flows.
Our executive management team is critical to the strategic direction of our company. If there were an unplanned loss of service by any of our officers our business could be harmed.
We depend, and will continue to depend, on the services of our executive management team, which includes Michael H. Braun, our Chief Executive Officer and President. Our success also will depend in part upon our ability to attract and retain qualified executive officers, experienced underwriting talent and other skilled employees who are knowledgeable about our business. If we were to lose the services of one or more members of our executive management team, our business could be adversely affected. Although we have employment agreements with our executive officers, any unplanned loss of service could substantially harm our business.
New homeowners’ insurance operations outside of the State of Florida may not be profitable.
We plan to continue the expansion of admitted homeowners’ property and casualty programs into other states as opportunities avail themselves. Risks associated with execution of our planned operations include the inability to market an adequately priced policy, inadequate commission structures, and overpriced or unavailable catastrophic reinsurance for wind events. Additionally, each state has its own authoritative body designed to regulate the insurance products and operations of new and existing insurance companies under their respective authority.
There can be no guarantees that our operations will be profitable in a given state nor can there be any guarantees that the state authorities will allow us to do business in that state.
Risks Related to an Investment in Our Shares
Our stock price in recent years has been volatile and is likely to continue to be volatile. As a result, the market price of our common stock may drop below the price you pay, and you may not be able to resell your shares at a profit.
The market price of our common stock has experienced, and may continue to experience, significant volatility from time to time. Such volatility may be affected by various factors and events, such as:
|
· |
our quarterly operating results, including a shortfall in operating revenue or net income from that expected by securities analysts and investors; |
|
· |
recognition of large unanticipated accounting charges, such as related to a loss reserve enhancement; |
|
· |
changes in securities analysts’ estimates of our financial performance or the financial performance of our competitors or companies in our industry generally; |
|
· |
the announcement of a material event or anticipated event involving us or our industry or the markets in which we operate; |
|
· |
the issuance of a significant number of shares; and |
|
· |
the other risk factors described in this annual Form 10-K, the accompanying notes and the documents incorporated by reference herein. |
- 17 -
In recent years, the U.S. stock market has experienced extreme price and volume fluctuations, which have sometimes affected the market price of the securities issued by a particular company in a manner unrelated to the operational performance of the company. This type of market effect could impact our common stock price as well. The volatility of our common stock means that the price of our common stock may have declined substantially at such time as you may look to sell your shares of our common stock. If our share price decreases, the value of your investment could decline.
We have authorized but unissued preferred stock, which could affect rights of holders of common stock.
Our articles of incorporation authorize the issuance of preferred stock with designations, rights and preferences determined from time to time by our board of directors. Accordingly, our board of directors is empowered, without shareholder approval, to issue preferred stock with dividends, liquidation, conversion, voting or other rights that could adversely affect the voting power or other rights of the holders of common stock. In addition, the preferred stock could be issued as a method of discouraging a takeover attempt. Although we do not intend to issue any preferred stock at this time, we may do so in the future.
Provisions in our articles of incorporation and our bylaws, as amended, and the Florida Business Corporation Act could make it more difficult to acquire us and may reduce the market price of our common stock.
Our articles of incorporation and our bylaws presently contain certain provisions which may make it more difficult and time-consuming for shareholders or third parties to influence our management, policies or affairs, and may discourage, delay or prevent a transaction involving a change-in-control of the Company and offering a premium over the current market price of our common stock. These provisions include those which:
|
· |
prohibit cumulative voting in the election of our directors, |
|
· |
establish a classified board of directors with staggered three-year terms, |
|
· |
establish advance notice and disclosure procedures for shareholders to bring matters, including nominations for election to our board, before a meeting of our shareholders, and |
|
· |
eliminate the ability of shareholders to take action by written consent in lieu of a shareholder meeting. |
As a result, we may be less likely to receive unsolicited offers to acquire us that some of our shareholders might consider beneficial.
The Florida Business Corporation Act, as amended, contains provisions, which our directors have elected not to opt out of, that are designed to enhance the ability of our board to respond to and potentially defer attempts to acquire control of the Company. These provisions may discourage altogether takeover attempts that have not been approved by our board. These provisions may also adversely affect the price that a potential purchaser would be willing to pay for our common stock and, therefore, deprive you of the opportunity to obtain a takeover premium for your shares. These provisions could make the removal of our incumbent directors and management more difficult. These provisions may enable a minority of our directors and the holders of a minority of our outstanding voting stock or the holders of an existing control block to prevent, delay, discourage or make more difficult a merger, tender offer or proxy contest, even though the transaction may be favorable to the interests of a majority of our non-affiliate shareholders. These provisions could also potentially adversely affect the market price of our common stock.
As a holding company, we depend on the earnings of our subsidiaries and their ability to pay management fees and dividends to the holding company as the primary source of our income.
We are an insurance holding company whose primary assets are the stock of our wholly and partially owned subsidiaries. Our operations, and our ability to pay dividends or service future potential debt, are limited by the earnings of our subsidiaries and their payment of their earnings to us in the form of management fees, commissions, dividends, loans, advances or the reimbursement of expenses. These payments can be made only when our subsidiaries have adequate earnings. In addition, dividend payments made to us by our insurance subsidiary are restricted by Florida law governing the insurance industry. Generally, Florida law limits the dividends payable by insurance companies under complicated formulas based on the subsidiary’s available capital and earnings.
Payment of dividends in the future will depend on our earnings and financial position and such other factors, as our Board of Directors deems relevant.
Future sales of our common stock may depress our stock price.
Sales of a substantial number of shares of our common stock in the public market or otherwise, by us or by a major stockholder could depress the market price of our common stock and impair our ability to raise capital through the sale of additional equity securities.
- 18 -
In addition, we may issue additional shares of our common stock from time to time in the future in amounts that may be significant. The sale of substantial amounts of our common stock, or the perception that these sales may occur, could adversely impact our stock price.
As of December 31, 2016, there were 79,484 shares issuable upon the exercise of outstanding and exercisable stock options and 243,759 additional shares available for grant under our equity-based compensation plans. The market price of the common shares may be depressed by the potential exercise of these options or grant of these shares. The holders of these options are likely to exercise them when we would otherwise be able to obtain additional capital on more favorable terms than those provided by the options.
- 19 -
ITEM 1B. UNRESOLVED STAFF COMMENTS
None.
Our executive offices are located at 14050 N.W. 14th Street, Suite 180, Sunrise, Florida 33323 in an 18,554 square foot office facility. Our original lease for this office space was scheduled to expire in May 2017. During March 2014, we extended our lease term to expire in August 2019 and expanded the leased premises to include an additional 13,642 square feet. During September 2015, we extended our lease term to expire in December 2022 and expanded the leased premises to include an additional 10,048 square feet. Refer to Note 8 set forth in Part II, Item 8 “Financial Statements and Supplemental Data” of this Form 10-K for further information about our leases.
In the ordinary course of conducting our business, we become involved in various legal actions and claims. Litigation is subject to many uncertainties and we may be unable to accurately predict the outcome of such matters, some of which could be decided unfavorably to us. Management does not believe the ultimate outcome of any pending matters of the nature described above would be material.
The Company is a party to a Co-Existence Agreement effective as of August 30, 2013 (the “Co-Existence Agreement”) with Federated Mutual Insurance Company (“Mutual”) pursuant to which the Company has agreed to certain restrictions on its use of the word “FEDERATED” without the word “NATIONAL” when referring to FNHC and Federated National Insurance Company. In response to Mutual’s allegations that the Company’s use of the word “FED” as part of the Company’s federally registered “FEDNAT” trademark infringes on Mutual’s federal and common law trademark rights, which the Company disputes, on July 21, 2016, the Company filed a declaratory judgment action for non-infringement of trademark in the U.S. District Court for the Southern District of Florida. Specifically, the Company seeks a declaration that its federally registered trademark "FEDNAT" does not infringe any alleged trademark rights of Mutual and that Mutual does not own any trademark rights to the name or mark "FED" in connection with insurance services outside of Owatonna, Minnesota. On July 26, 2016, Mutual filed a demand for arbitration against the Company before the American Arbitration Association (“AAA”) alleging a breach of the Co-Existence Agreement. On November 29, 2016, the U.S. District Court for the Southern District of Florida granted Mutual’s motion to compel arbitration of the Company’s declaratory judgment action for non-infringement of a trademark. On February 3, 2017, the AAA granted the Company’s motion to terminate the arbitration for lack of jurisdiction based upon Mutual’s failure to comply with the Co-Existence Agreement’s regarding the selection of an arbitrator. The parties are currently in the process of conferring upon the selection of a mutually agreeable arbitrator. The Company nevertheless intends to vigorously defend against Mutual’s allegations, although there can be no assurances as to the outcome of this matter.
On March 2, 2017, the Company filed a complaint in Broward County, Florida court to enforce the terms of the restrictive covenants set forth in the Amended and Restated Non-Competition, Non-Disclosure and Non-Solicitation Agreement dated August 5, 2013, as amended, entered into between Peter J. Prygelski, III and the Company during Mr. Prygelski’s employment with the Company and set forth in the separation agreement he entered into in connection with his separation from the Company. The Company believes that he accepted employment with a competitor in contravention of these restrictive covenants and therefore the Company is seeking injunctive relief, declaratory relief and damages, although there can be no assurances as to the outcome of this matter. The Company has not recognized a gain contingency in the financial statements as of December 31, 2016.
Refer to Note 9 set forth in Part II, Item 8 “Financial Statements and Supplemental Data” of this Form 10-K for additional information on legal proceedings.
ITEM 4. MINE SAFETY DISCLOSURES
Not applicable.
- 20 -
ITEM 5. MANAGEMENT’S DISCUSSION AND ANALYSIS OF FINANCIAL CONDITION AND RESULTS OF OPERATIONS
Our common stock is listed for trading on The NASDAQ Global Market under the symbol “FNHC”. The following table sets forth quarterly high and low closing sale prices as reported on the NASDAQ Global Market. These reported prices reflect prices between dealers, without accounting for retail mark-ups, markdowns or commissions, and may not represent actual transactions.
|
|
||||||
|
Quarter Ended: |
High |
Low |
||||
|
March 31, 2016 |
$ |
29.08 |
$ |
18.68 | ||
|
June 30, 2016 |
22.93 | 18.00 | ||||
|
September 30, 2016 |
22.45 | 17.08 | ||||
|
December 31, 2016 |
19.33 | 14.03 | ||||
|
|
||||||
|
March 31, 2015 |
$ |
31.87 |
$ |
23.15 | ||
|
June 30, 2015 |
31.76 | 23.26 | ||||
|
September 30, 2015 |
25.90 | 20.23 | ||||
|
December 31, 2015 |
32.61 | 23.54 | ||||
The closing price of our common stock on March 15, 2017 was $18.12.
HOLDERS
As of March 15, 2017, there were 94 holders of record of our common stock. We believe that the number of beneficial owners of our common stock is in excess of 5,800.
DIVIDENDS
The Board of Directors of FNHC declared regular quarterly dividends as follows:
|
· |
In September 2016, our Board of Directors declared a $0.08 per common share dividend payable December 1, 2016 to shareholders of record on November 1, 2016, totaling $1.1 million. |
|
· |
In May and June 2016, our Board of Directors declared quarterly dividend payments of $0.06 per common share, respectively, paid in June and August 2016, respectively, totaling $1.7 million. |
|
· |
In February 2016, our Board of Directors declared a quarterly dividend payment of $0.05 per common share, paid in March 2016, amounting to $0.7 million. |
|
· |
$0.05 per common share payable on December 1, 2015 and March 1, 2016 to shareholders of record as of November 2, 2015 and February 1, 2016. |
|
· |
$0.04 per common share payable on March 2, June 1 and September 1, 2015 to shareholders of record as of February 2, May 4 and August 3, 2015. |
|
· |
$0.03 per common share payable on September 3 and December 2, 2013 and March 3, June 2, and September 2, 2014 to shareholders of record as of August 5 and November 4, 2013 and February 3, May 5, August 4, 2014. $0.04 per common share payable on and December 1, 2014 to shareholders of record as of November 3, 2014. |
Payment of dividends in the future will depend on our earnings and financial position and such other factors, as our Board of Directors deems relevant. Moreover, our ability to continue to pay dividends may be restricted by regulatory limits on the amount of dividends that FNIC and MNIC are permitted to pay to the parent company.
- 21 -
SECURITIES AUTHORIZED FOR ISSUANCE UNDER EQUITY COMPENSATION PLANS
The following table summarizes our equity compensation plans as of December 31, 2016. All equity compensation plans were approved by our shareholders. We have not granted any options, warrants or rights to our shareholders outside of these equity compensation plans.
|
|
|||
|
Equity Compensation Plan Information |
|||
|
|
Number of securities |
||
|
|
remaining available for |
||
|
|
Number of securities to |
Weighted-average |
future issuance under |
|
|
be issued upon exercise of |
exercise price of |
equity compensation plans |
|
|
outstanding options, |
outstanding options, |
(excluding securities |
|
|
warrants and rights |
warrants and rights |
reflected in column (a)) |
|
Plan category |
(a) |
(b) |
(c) |
|
Equity compensation plans approved by stockholders |
79,484 | 3.70 | 243,759 |
For additional information concerning our equity compensation, refer to Note 10 set forth in Part II, Item 8 “Financial Statements and Supplemental Data” of this Form 10-K.
STOCK PERFORMANCE GRAPH
The following graph shows the cumulative total shareholder return on our common stock over the last five fiscal years as compared with the total returns of the NASDAQ Composite Index and the SNL Property & Casualty Insurance Index. In accordance with SEC rules, this graph includes indices that we believe are comparable and appropriate.
|
|
Federated National Holding Company |
|
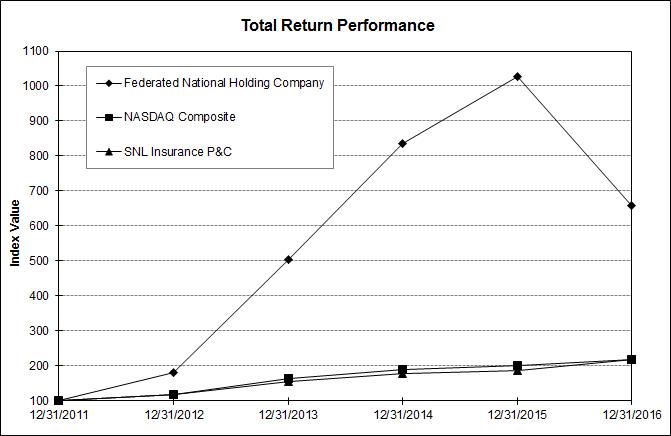
- 22 -
|
|
||||||||||||
|
|
Period Ending |
|||||||||||
|
Index |
12/31/11 |
12/31/12 |
12/31/13 |
12/31/14 |
12/31/15 |
12/31/16 |
||||||
|
Federated National Holding Company |
100.00 | 181.39 | 503.83 | 835.03 | 1,027.79 | 658.07 | ||||||
|
NASDAQ Composite |
100.00 | 117.45 | 164.57 | 188.84 | 201.98 | 219.89 | ||||||
|
SNL Insurance P&C |
100.00 | 118.04 | 156.39 | 179.61 | 185.79 | 219.27 | ||||||
Returns are based on the change in year-end to year-end price. The graph assumes $100 was invested on December 31, 2011 in our common stock, the NASDAQ Composite Index and the SNL Property & Casualty Insurance Index and that all dividends were reinvested. Past performance is not necessarily an indicator of future results.
Our filings with the SEC may incorporate information by reference, including this Form 10-K. Unless we specifically state otherwise, the information under this heading “Stock Performance Graph” shall not be deemed to be “soliciting materials” and shall not be deemed to be “filed” with the SEC or incorporated by reference into any of our filings under the Securities Act of 1933, as amended, or the Securities Exchange Act of 1934.
- 23 -
ITEM 6. SELECTED FINANCIAL DATA
The following selected consolidated financial data should be read in conjunction with the consolidated financial statements and notes thereto and “Management’s Discussion and Analysis of Financial Condition and Results of Operations” appearing elsewhere in this Annual Report on Form 10-K.
|
|
|||||||||||||||
|
|
Year Ended December 31, |
||||||||||||||
|
|
2016 |
2015 |
2014 |
2013 |
2012 |
||||||||||
|
Statement of Operations Data: |
(in thousands, except per share data) |
||||||||||||||
|
Revenue: |
|||||||||||||||
|
Net premiums earned |
$ |
259,872 |
$ |
210,020 |
$ |
170,905 |
$ |
104,381 |
$ |
59,359 | |||||
|
Net investment income |
9,063 | 7,226 | 5,385 | 3,332 | 3,819 | ||||||||||
|
Net realized investment gains |
3,045 | 3,616 | 4,426 | 2,881 | 1,072 | ||||||||||
|
Direct written policy fees |
17,730 | 11,248 | 8,689 | 6,196 | 2,093 | ||||||||||
|
Other income |
26,674 | 17,783 | 11,287 | 4,947 | 2,304 | ||||||||||
|
Total revenue |
316,384 | 249,893 | 200,692 | 121,737 | 68,647 | ||||||||||
|
Costs and expenses: |
|||||||||||||||
|
Losses and loss adjustment expenses |
187,341 | 104,353 | 81,036 | 56,410 | 30,209 | ||||||||||
|
Commissions and other underwriting expenses |
108,776 | 64,868 | 52,077 | 38,580 | 26,515 | ||||||||||
|
General and administrative expenses |
17,186 | 15,223 | 10,272 | 7,529 | 5,175 | ||||||||||
|
Interest expense |
348 | 256 |
— |
— |
— |
||||||||||
|
Total costs and expenses |
313,651 | 184,700 | 143,385 | 102,519 | 61,899 | ||||||||||
|
Income before income taxes |
2,733 | 65,193 | 57,307 | 19,218 | 6,748 | ||||||||||
|
Income taxes |
2,683 | 24,753 | 20,108 | 6,491 | 2,435 | ||||||||||
|
Net income |
50 | 40,440 | 37,199 | 12,727 | 4,313 | ||||||||||
|
Net income (loss) attributable to noncontrolling interest |
246 | (445) |
— |
— |
— |
||||||||||
|
Net (loss) income attributable to Federated National Holding Company shareholders |
$ |
(196) |
$ |
40,885 |
$ |
37,199 |
$ |
12,727 |
$ |
4,313 | |||||
|
|
|||||||||||||||
|
Per share data: |
|||||||||||||||
|
Net (loss) income per share attributable to Federated National Holding Company shareholders: |
|||||||||||||||
|
Basic |
$ |
(0.01) |
$ |
2.98 |
$ |
3.08 |
$ |
1.50 |
$ |
0.53 | |||||
|
Diluted |
$ |
(0.01) |
$ |
2.92 |
$ |
2.99 |
$ |
1.45 |
$ |
0.53 | |||||
|
Dividends |
$ |
0.27 |
$ |
0.18 |
$ |
0.13 |
$ |
0.11 |
$ |
0.02 | |||||
|
|
|||||||||||||||
|
|
December 31, |
||||||||||||||
|
|
2016 |
2015 |
2014 |
2013 |
2012 |
||||||||||
|
|
(in thousands, except per share data) |
||||||||||||||
|
Balance Sheet Data: |
|||||||||||||||
|
Cash and invested assets |
$ |
484,275 |
$ |
437,369 |
$ |
370,920 |
$ |
262,156 |
$ |
151,238 | |||||
|
Total assets |
$ |
813,127 |
$ |
699,254 |
$ |
503,631 |
$ |
316,741 |
$ |
185,888 | |||||
|
Loss and loss adjustment expense reserves |
$ |
158,110 |
$ |
97,340 |
$ |
78,330 |
$ |
61,016 |
$ |
49,908 | |||||
|
Total liabilities |
$ |
575,271 |
$ |
448,495 |
$ |
311,052 |
$ |
208,247 |
$ |
119,983 | |||||
|
Total shareholders’ equity |
$ |
237,856 |
$ |
250,759 |
$ |
192,579 |
$ |
108,494 |
$ |
65,905 | |||||
|
Book value per share |
$ |
17.65 |
$ |
18.17 |
$ |
14.13 |
$ |
9.95 |
$ |
8.26 | |||||
- 24 -
ITEM 7. MANAGEMENT’S DISCUSSION AND ANALYSIS OF FINANCIAL CONDITION AND RESULTS OF OPERATIONS
RESULTS OF OPERATIONS
Operating Results Overview - Year Ended December 31, 2016 Compared with Year Ended December 31, 2015
The following overview does not address all of the matters covered in the other sections of Management’s Discussion and Analysis of Financial Condition and Results of Operations or contain all of the information that may be important to our shareholders or the investing public. This overview should be read in conjunction with the other sections of Management’s Discussion and Analysis of Financial Condition and Results of Operations.
The following table summarizes our audited results of operations for the years ended December 31, 2016 and 2015:
|
|
||||||||
|
|
Year Ended |
|||||||
|
|
December 31, |
|||||||
|
|
2016 |
% Change |
2015 |
|||||
|
Revenue: |
(Dollars in thousands) |
|||||||
|
Gross premiums written |
$ |
605,485 | 22.6% |
$ |
493,770 | |||
|
Increase in unearned premiums |
(40,062) |
(34.9)% |
(61,536) | |||||
|
Gross premiums earned |
565,423 | 30.8% | 432,234 | |||||
|
Ceded premiums earned |
(305,551) | 37.5% | (222,214) | |||||
|
Net premiums earned |
259,872 | 23.7% | 210,020 | |||||
|
Net investment income |
9,063 | 25.4% | 7,226 | |||||
|
Net realized investment gains |
3,045 |
(15.8)% |
3,616 | |||||
|
Direct written policy fees |
17,730 | 57.6% | 11,248 | |||||
|
Other income |
26,674 | 50.0% | 17,783 | |||||
|
Total revenue |
316,384 | 26.6% | 249,893 | |||||
|
|
||||||||
|
Expenses: |
||||||||
|
Losses and LAE |
187,341 | 79.5% | 104,353 | |||||
|
Commissions and other underwriting expenses |
108,776 | 67.7% | 64,868 | |||||
|
General and administrative expenses |
17,186 | 12.9% | 15,223 | |||||
|
Interest expense |
348 | 35.9% | 256 | |||||
|
Total costs and expenses |
313,651 | 69.8% | 184,700 | |||||
|
|
||||||||
|
Income before income taxes |
2,733 |
(95.8)% |
65,193 | |||||
|
Income taxes |
2,683 |
(89.2)% |
24,753 | |||||
|
Net income |
50 |
(99.9)% |
40,440 | |||||
|
Net income (loss) attributable to noncontrolling interest |
246 |
(155.3)% |
(445) | |||||
|
Net (loss) income attributable to FNHC |
$ |
(196) |
(100.5)% |
$ |
40,885 | |||
|
|
||||||||
|
Ratios to net premiums earned: |
||||||||
|
Net loss ratio (1) |
72.1% | 49.7% | ||||||
|
Net expense ratio (2) |
48.5% | 38.1% | ||||||
|
Net combined ratio (3) |
120.7% | 87.9% | ||||||
|
(1) |
The net loss ratio is calculated as losses and LAE divided by net premiums earned. |
|
(2) |
The net expense ratio is calculated as all operating expenses less interest expense divided by net premiums earned. |
|
(3) |
The net combined ratio is calculated as the sum of losses and LAE and all operating expenses less interest expense divided by net premiums earned. |
Revenue
Total revenue for the year ended December 31, 2016 of $316.4 million increased $66.5 million, or 26.6%, compared to revenue of $249.9 million in 2015.
- 25 -
Gross Premiums Written
The following table represents the gross premiums written breakout for the years ended December 31, 2016 and 2015:
|
|
||||||
|
|
Year Ended December 31, |
|||||
|
|
2016 |
2015 |
||||
|
Gross premiums written: |
(in thousands) |
|||||
|
Homeowners Florida |
$ |
477,489 |
$ |
427,428 | ||
|
Homeowners non-Florida |
35,248 | 22,338 | ||||
|
Personal automobile |
69,479 | 21,912 | ||||
|
Commercial general liability |
13,256 | 13,928 | ||||
|
Federal flood |
10,013 | 8,164 | ||||
|
Total gross premiums written |
$ |
605,485 |
$ |
493,770 | ||
Gross written premiums increased $111.7 million, or 22.6%, to $605.5 million for the year ended December 31, 2016, compared with $493.8 million for the same period last year. The increase predominantly reflects market share growth in our homeowners’ and personal automobile lines of business. Homeowners’ gross written premiums increased $63.0 million, or 14.0%, to $512.7 million for the year ended December 31, 2016, compared with $449.8 million for the same twelve-month period last year. Gross written premiums for our personal automobile line of business increased by $47.6 million to $69.5 million in 2016, compared to $21.9 million in the prior year period. This increase is also reflected in in the increase in our homeowners’ in-force policy count to 279,109 as of December 31, 2016, compared with 254,105 as of December 31, 2015. These increases reflect management’s strategy to continue to grow market share in Florida as well as expand operations outside of Florida with the growth in our personal automobile line of business. With the expansion into areas outside of Florida, we are able to continue to leverage our personnel and, at the same time, diversify our insurance risk.
Gross Premiums Earned
The following table represents the gross premiums earned breakout for the years ended December 31, 2016 and 2015:
|
|
||||||
|
|
Year Ended December 31, |
|||||
|
|
2016 |
2015 |
||||
|
Gross premiums earned: |
(in thousands) |
|||||
|
Homeowners Florida |
$ |
455,252 |
$ |
381,027 | ||
|
Homeowners non-Florida |
29,101 | 15,799 | ||||
|
Personal automobile |
58,312 | 14,108 | ||||
|
Commercial general liability |
13,675 | 13,542 | ||||
|
Federal flood |
9,083 | 7,758 | ||||
|
Total gross premiums earned |
$ |
565,423 |
$ |
432,234 | ||
Gross premiums earned increased $133.2 million, or 30.8%, to $565.4 million for the year ended December 31, 2016, compared with $432.2 million for the same period last year.
Ceded Premiums Earned
Ceded premiums earned increased by $83.3 million, or 37.5%, to $305.6 million for the year ended December 31, 2016, compared with $222.2 million in the same period last year. This increase is driven by the additional excess-of-loss reinsurance costs recorded in 2016 as compared to 2015 related to the homeowners’ premium growth. Additionally, we recorded increased ceded premiums related to the premium growth in personal automobile in 2016, which is generally ceded at 75% to 80% through a quota share agreement. These increases were offset by lower ceded premiums in 2016 as compared to 2015 due to the expiration of the 30% Florida only property quota share treaty, which ended on July 1, 2016.
Net Investment Income
Net investment income increased $1.8 million, or 25.4%, to $9.1 million during the year ended December 31, 2016, compared with $7.2 million during the year ended December 31, 2015. This increase is mainly due to a year-over-year overall growth of our investment portfolio, specifically growth in the debt securities investments. Our debt securities investment yields, net, remained steady year over year at 2.3% for the years ended December 31, 2016 and 2015, respectively.
- 26 -
Net Realized Investment Gains
Net realized investment gains totaled $3.0 million for the year ended December 31, 2016, compared with $3.6 million for the year ended December 31, 2015. From time to time, our portfolio managers, under our control, move out of positions due to both macro and micro conditions; these movements generate both realized gains and losses. The slight decrease is due to less favorable market conditions for the year ended December 2016, as compared to the year ended December 31, 2015.
Direct Written Policy Fees
Direct written policy fees increased by $6.5 million, or 57.6%, to $17.7 million for the year ended December 31, 2016, compared with $11.2 million in 2016. The increase in direct written policy fees is correlated to the increase in gross written premiums in our homeowners and personal automobile lines of business compared to the prior year. These fees are generated when the Company writes a policy and the fee varies from state to state and by line of business. Policy fees generated by the managing general agent are earned by the Company. All other policy fees are collected by us and passed through to the general agent as acquisition costs and recognized in commission and other underwriting expenses.
Other Income
Other income increased $8.9 million, or 50.0%, to $26.7 million for the year ended December 31, 2016, compared with $17.8 million for the year ended December 31, 2015. The following table represents the other income detail:
|
|
||||||||
|
|
Year Ended |
|||||||
|
|
December 31, |
|||||||
|
|
2016 |
% Change |
2015 |
|||||
|
|
(Dollars in thousands) |
|||||||
|
Other income: |
||||||||
|
Commission income |
$ |
17,229 | 120.6% |
$ |
7,811 | |||
|
Brokerage revenue |
7,301 | 46.6% | 4,979 | |||||
|
Quota-share profit sharing |
- |
(100.0)% |
3,077 | |||||
|
Finance revenue |
2,144 | 11.9% | 1,916 | |||||
|
Total other income |
$ |
26,674 | 50.0% |
$ |
17,783 | |||
The increase in commission income is primarily a result of the premium growth in personal automobile, which has increased the ceded commissions and the fees we receive for managing that business. These fees are received by FNIC and passed through to FNU for its services as a managing general agent. The commission income from personal automobile is designed to offset the commission and other acquisition costs incurred when the Company writes the policies, which are recognized in the commissions and other underwriting expenses account.
The increase in brokerage revenue is driven by the increase in our homeowners reinsurance program, the type of reinsurance purchased, and the commissions paid on these reinsurance agreements in calendar year 2016 as compared to calendar year 2015.
The decrease in quota-share profit sharing is the result of our re-evaluation, effective September 30, 2015, of the accounting treatment for the quota-share reinsurance contracts with retrospective rating provisions. At that time, we eliminated recording of future estimated quota-share profits in one line, ("Quota-share profit sharing"), on the consolidated statement of operations.
Expenses
Losses and Loss Adjustment Expenses
Losses and LAE increased $83.0 million, or 79.5%, to $187.3 million for the year ended December 31, 2016, compared with $104.4 million for the same twelve-month period last year. The increase in losses and LAE is driven by $40.0 million of losses due to increased earned premiums in our homeowners and personal automobile lines of business, $33.3 million incurred in catastrophe losses resulting from a series of tornados and severe weather events that impacted the state of Florida and South Carolina (i.e., Hurricane Matthew, Hurricane Hermine, Tropical Storm Colin), and $16.0 million of losses related to increasing our Florida homeowners’ attritional loss ratio throughout 2016. Additionally, losses and LAE were impacted by unfavorable development of $11.0 million for the 2015 accident year in our homeowners’ coverage in the state of Florida as a result of assignment of benefits and other related adjusting expenses. The factors listed above were offset by ceded losses pertaining to the property quota-share treaty.
- 27 -
As of December 31, 2016, the Company recorded $158.1 million in losses and LAE expense reserves for all lines of business, which includes $99.2 million in incurred but not yet reported (“IBNR”) reserves. As of December 31, 2015, the Company recorded $97.3 million in losses and LAE expense reserves for all lines of business, which includes $51.1 million in IBNR reserves.
Commissions and Other Underwriting Expenses
The following table represents the commissions and other underwriting expenses breakout for the years ended December 31, 2016 and 2015:
|
|
||||||
|
|
Year Ended December 31, |
|||||
|
|
2016 |
2015 |
||||
|
Commissions and other underwriting expenses: |
(in thousands) |
|||||
|
Homeowners Florida |
$ |
61,319 |
$ |
41,033 | ||
|
All others |
23,742 | 14,739 | ||||
|
Ceded commissions |
(27,705) | (32,828) | ||||
|
Total commissions and other fees |
57,356 | 22,944 | ||||
|
Salaries and wages |
22,387 | 17,934 | ||||
|
Other underwriting expenses |
29,033 | 23,990 | ||||
|
Commissions and other underwriting expenses |
$ |
108,776 |
$ |
64,868 | ||
Commissions and other underwriting expenses increased $43.9 million, or 67.7%, to $108.8 million for the year ended December 31, 2016, compared with $64.9 million for the year ended December 31, 2015. The $43.9 million increase is related to the premium growth in our homeowners’ and personal automobile lines of business; with personal automobile and homeowners’ non-Florida lines of business carrying higher acquisition costs as a result of our different distribution models we employ to market our insurance products. Although personal automobile quota-share treaties cede 75% to 90% of all premiums, the full expense for commissions and other acquisition costs are recognized in this line item, which partially offsets the related commission income recorded within the other income line in the statements of operations.
General and Administrative Expenses
General and administrative expenses increased $2.0 million, or 12.9%, to $17.2 million for the year ended December 31, 2016, compared with $15.2 million for the year ended December 31, 2015. The increase primarily reflects expenses incurred of $1.9 million in connection with the resignation of the Company’s former Chief Financial Officer during the second quarter of 2016.
Income Taxes
Income taxes decreased $22.1 million, or 89.2%, to an income tax expense of $2.7 million for the year ended December 31, 2016, compared with an income tax expense of $24.8 million for the year ended December 31, 2015. The change was primarily due to a decrease in taxable income. Additionally, in 2016, the Company recorded $2.2 million of additional tax expense related to a prior year adjustment impacting deferred taxes.
- 28 -
Operating Results Overview - Year Ended December 31, 2015 Compared with Year Ended December 31, 2014
The following overview does not address all of the matters covered in the other sections of Management’s Discussion and Analysis of Financial Condition and Results of Operations or contain all of the information that may be important to our shareholders or the investing public. This overview should be read in conjunction with the other sections of Management’s Discussion and Analysis of Financial Condition and Results of Operations.
The following table reports our audited results of operations for the years ended December 31, 2015 and 2014:
|
|
||||||||
|
|
Year Ended |
|||||||
|
|
December 31, |
|||||||
|
|
2015 |
% Change |
2014 |
|||||
|
Revenue: |
(Dollars in thousands) |
|||||||
|
Gross premiums written |
$ |
493,770 | 30.9% |
$ |
377,156 | |||
|
Increase in unearned premiums |
(61,536) |
(4.0)% |
(64,081) | |||||
|
Gross premiums earned |
432,234 | 38.1% | 313,075 | |||||
|
Ceded premiums earned |
(222,214) | 56.3% | (142,170) | |||||
|
Net premiums earned |
210,020 | 22.9% | 170,905 | |||||
|
Net investment income |
7,226 | 34.2% | 5,385 | |||||
|
Net realized investment gains |
3,616 |
(18.3)% |
4,426 | |||||
|
Direct written policy fees |
11,248 | 29.5% | 8,689 | |||||
|
Other income |
17,783 | 57.6% | 11,287 | |||||
|
Total revenue |
249,893 | 24.5% | 200,692 | |||||
|
|
||||||||
|
Expenses: |
||||||||
|
Losses and LAE |
104,353 | 28.8% | 81,036 | |||||
|
Commissions and other underwriting expenses |
64,868 | 24.6% | 52,077 | |||||
|
General and administrative expenses |
15,223 | 48.2% | 10,272 | |||||
|
Interest expense |
256 | 100.0% |
- |
|||||
|
Total costs and expenses |
184,700 | 28.8% | 143,385 | |||||
|
|
||||||||
|
Income before income taxes |
65,193 | 13.8% | 57,307 | |||||
|
Income taxes |
24,753 | 23.1% | 20,108 | |||||
|
Net income |
40,440 | 8.7% | 37,199 | |||||
|
Net loss attributable to noncontrolling interest |
(445) |
(100.0)% |
- |
|||||
|
Net income attributable to FNHC |
$ |
40,885 | 9.9% |
$ |
37,199 | |||
|
|
||||||||
|
Ratios to net premiums earned: |
||||||||
|
Net loss ratio (1) |
49.7% | 47.4% | ||||||
|
Net expense ratio (2) |
38.1% | 36.5% | ||||||
|
Net combined ratio (3) |
87.9% | 83.9% | ||||||
|
(1) |
The net loss ratio is calculated as losses and LAE divided by net premiums earned. |
|
(2) |
The net expense ratio is calculated as all operating expenses less interest expense divided by net premiums earned. |
|
(3) |
The net combined ratio is calculated as the sum of losses and LAE and all operating expenses less interest expense divided by net premiums earned. |
Revenue
Total revenue for the year ended December 31, 2015 of $249.9 million increased $49.2 million, or 24.5%, compared to revenue of $200.7 million in 2014.
- 29 -
Gross Premiums Written
The following table represents the gross premiums written breakout for the years ended December 31, 2015 and 2014:
|
|
||||||
|
|
Year Ended December 31, |
|||||
|
|
2015 |
2014 |
||||
|
Gross premiums written: |
(in thousands) |
|||||
|
Homeowners Florida |
$ |
427,428 |
$ |
335,338 | ||
|
Homeowners non-Florida |
22,338 | 9,600 | ||||
|
Personal automobile |
21,912 | 12,376 | ||||
|
Commercial general liability |
13,928 | 12,432 | ||||
|
Federal flood |
8,164 | 7,410 | ||||
|
Total gross premiums written |
$ |
493,770 |
$ |
377,156 | ||
Gross premiums written increased $116.6 million, or 30.9%, to $493.8 million for the year ended December 31, 2015, compared with $377.2 million for the same period in 2014. The increase predominantly reflects market share growth in our homeowners’ and personal automobile lines of business. Homeowners’ gross premiums written increased $104.8 million, or 30.4%, to $449.8 million for the year ended December 31, 2015, compared with $344.9 million in 2014. Gross premiums written for the personal automobile line of business increased by $9.5 million to $21.9 million in 2016, compared to $12.4 million in 2014. Additionally, this increase reflects an increase in our homeowners’ in-force policy count to 254,105 as of December 31, 2015, compared with 182,557 as of December 31, 2014.
Gross Premiums Earned
The following table represents the gross premiums earned breakout for the years ended December 31, 2015 and 2014:
|
|
||||||
|
|
Year Ended December 31, |
|||||
|
|
2015 |
2014 |
||||
|
Gross premiums earned: |
(in thousands) |
|||||
|
Homeowners Florida |
$ |
381,027 |
$ |
279,514 | ||
|
Homeowners non-Florida |
15,799 | 4,052 | ||||
|
Personal automobile |
14,108 | 11,617 | ||||
|
Commercial general liability |
13,542 | 11,245 | ||||
|
Federal flood |
7,758 | 6,648 | ||||
|
Total gross premiums earned |
$ |
432,234 |
$ |
313,075 | ||
Gross premiums earned increased $119.2 million, or 38.1%, to $432.2 million for the year ended December 31, 2015, compared with $313.1 million for the same period in 2014.
Ceded Premiums Earned
Ceded premiums earned increased by $80.0 million, or 56.3%, to $222.2 million for the year ended December 31, 2015, compared with $142.2 million in the same twelve-month period last year. This increase is driven by the additional excess-of-loss reinsurance costs recorded in 2015 as compared to 2014 related to the homeowners’ premium growth. Additionally, we recorded higher ceded premiums in 2015 as compared to 2014 as the 30% Florida-only property quota share treaty was in place for a full year in 2015 as compared to only 6 months in 2014 as well as having the 10% Florida-only property quota share treaty in place for 6 months in 2015.
Net Investment Income
Net investment income increased $1.8 million, or 34.2%, to $7.2 million during the year ended December 31, 2015, compared with $5.4 million during the year ended December 31, 2014. This increase is mainly due to a year-over-year overall growth of our investment portfolio and a decrease in our debt securities investment yields. Our investment yield, net was 2.3% and 2.7%, for the years ended December 31, 2015 and 2014, respectively.
- 30 -
Net Realized Investment Gains
Net realized investment gains were $3.6 million for the year ended December 31, 2015, compared with $4.4 million for the year ended December 31, 2014. From time to time, our portfolio managers, under our control, move out of positions due to both macro and micro conditions; these movements generate both realized gains and losses.
Direct Written Policy Fees
Direct written policy fees increased by $2.6 million, or 29.5%, to $11.2 million for the year ended December 31, 2015, compared with $8.7 million in 2014. The increase in direct written policy fees is correlated to the increase in gross written premiums in our homeowners and personal automobile lines of business compared to the prior year. These fees are generated when the Company writes a policy and the fee varies from state to state and by line of business. Policy fees generated by the managing general agent are earned by the Company. All other policy fees are collected by us and passed through to the general agent as acquisition costs and recognized in commission and other underwriting expenses.
Other Income
Other income increased $6.5 million, or 57.6%, to $17.8 million for the year ended December 31, 2015, compared with $11.3 million for the year ended December 31, 2014. The following table represents the other income detail:
|
|
||||||||
|
|
Year Ended |
|||||||
|
|
December 31, |
|||||||
|
|
2015 |
% Change |
2014 |
|||||
|
|
(Dollars in thousands) |
|||||||
|
Other income: |
||||||||
|
Commission income |
$ |
7,811 | 72.9% |
$ |
4,517 | |||
|
Brokerage revenue |
4,979 | 98.1% | 2,513 | |||||
|
Quota-share profit sharing |
3,077 | 10.2% | 2,792 | |||||
|
Finance revenue |
1,916 | 30.8% | 1,465 | |||||
|
Total other income |
$ |
17,783 | 57.6% |
$ |
11,287 | |||
The increase in commission income is primarily a result of the premium growth in personal automobile, which has increased the ceded commissions and the fees we receive for managing that business. These fees are received by FNIC and passed through to FNU for its services as a managing general agent. The commission income from personal automobile is designed to offset the commission and other acquisition costs incurred when the Company writes the policies, which are recognized in the commissions and other underwriting expenses account.
The increase in brokerage revenue is driven by the increase in our homeowners reinsurance program, the type of reinsurance purchased, and the commissions paid on these reinsurance agreements in calendar year 2015 as compared to calendar year 2014.
Expenses
Losses and Loss Adjustment Expenses
Losses and LAE increased $23.3 million, or 28.8%, to $104.4 million during the year ended December 31, 2015, compared with $81.0 million during the year ended December 31, 2014. The increase to losses and LAE is directly related to an increase in net premiums earned and an increase in our net loss ratio year over year. Our net loss ratio for 2015 was 49.7% compared with 47.4% for the same period in 2014. The increase in the ratio is the result of increasing our Florida homeowners’ attritional loss ratio due to assignment of benefits and the temporary discontinuation of the underwriting analytics. The underwriting analytics were not used for several months in the second and third quarter of 2015, due to our compliance with a cease and desist order from the Florida OIR requiring us to obtain approval of these analytics without prior approval from them. The temporary discontinuation of the underwriting analytics caused us to underwrite polices outside of our standard process.
- 31 -
Commissions and Other Underwriting Expenses
The following table represents commissions and other underwriting expenses breakout for the years ended December 31, 2015 and 2014:
|
|
||||||
|
|
Year Ended December 31, |
|||||
|
|
2015 |
2014 |
||||
|
Commissions and other underwriting expenses: |
(in thousands) |
|||||
|
Homeowners Florida |
$ |
41,033 |
$ |
27,983 | ||
|
All others |
14,739 | 11,802 | ||||
|
Ceded commissions |
(32,828) | (12,310) | ||||
|
Total commissions and other fees |
22,944 | 27,475 | ||||
|
Salaries and wages |
17,934 | 11,125 | ||||
|
Other underwriting expenses |
23,990 | 13,477 | ||||
|
Commissions and other underwriting expenses |
$ |
64,868 |
$ |
52,077 | ||
Commissions and other underwriting expenses increased $12.8 million, or 24.6%, to $64.9 million for the year ended December 31, 2015, compared with $52.1 million for the year ended December 31, 2014. Our net expense ratio for 2015 was 38.1% compared with 36.5% for the same period in 2014. The increase is directly related to the significant increase in net premiums written and earned during the same period offset by an increase in ceded commissions from the 30% Florida-only property quota share treaty, which was in place for a full year in 2015 as compared to only 6 months in 2014 as well as the 10% Florida-only property quota share treaty, which was in place for 6 months in 2015.
General and Administrative Expenses
General and administrative expenses increased $5.0 million, or 48.2%, to $15.2 million for the year ended December 31, 2015, compared with $10.3 million for the year ended December 31, 2014. The change is due to an increase in salaries and benefits, including share-based compensation, legal and professional fees, including $0.9 million of start-up costs related to the organization of Monarch Delaware. Professional fees include audit, tax and actuarial fees. The increased costs are in support of the significant growth in our gross and net premiums written in 2015 as compared to 2014.
Income Taxes
Income taxes increased $4.7 million, or 23.1%, to $24.8 million for the year ended December 31, 2015, compared with $20.1 million for the year ended December 31, 2014. The change was due to an increase in taxable income and an increase in our effective tax rate. Our effective tax rate was 38.0% for the year ended December 31, 2015, compared with 35.1% for the year ended December 31, 2014. The increase in the effective tax rate is the result of having less permanent items and true up adjustments in 2015 as compared to 2014.
LIQUIDITY AND CAPITAL RESOURCES
Our primary sources of funds are net premiums, investment income, commissions and fee income. Our primary uses of funds are the payment of claims and operating expenses. As of December 31, 2016, we had $74.6 million in cash and cash equivalents and $409.7 million in investments. As of December 31, 2015, we had $53.0 million in cash and cash equivalents and $384.3 million in investments.
Operating Activities
Net cash provided by operating activities for the year ended December 31, 2016 was $69.8 million, compared to net cash provided by operating activities for the year ended December 31, 2015 of $52.9 million. This increase was primarily as a result of the decrease in the prepaid reinsurance premium account and increase loss and LAE expense reserves in 2016, partly offset by decreases in reinsurance recoverables, unearned premiums, and deferred acquisition costs. Net cash provided by operating activities for the year ended December 31, 2015 was $52.9 million, compared to net cash provided by operating activities for the year ended December 31, 2014 of $63.1 million. This decrease was primarily as a result a decrease in prepaid reinsurance premium account.
Investing Activities
Net cash used in investing activities for the year ended December 31, 2016 was $33.2 million, compared to net cash used in investing activities for the year ended December 31, 2015 of $63.6 million. This decrease was the result of less net purchases of
- 32 -
investment securities as compared to prior year. Net cash used in investing activities for the year ended December 31, 2015 was $63.6 million, compared to net cash used in investing activities for the year ended December 31, 2014 of $107.9 million. This decrease was the result of less net purchases, maturities and redemptions of investment securities as compared to prior year.
Financing Activities
Net cash used in financing activities for the year ended December 31, 2016 was $15.0 million, compared to net cash provided by financing activities for the year ended December 31, 2015 of $23.6 million. This decrease was primarily due to $18.7 million related to the noncontrolling interest equity investment and $5.0 million related to the issuance of debt in our consolidated VIE during the year ended December 31, 2015 and $11.3 million of common stock repurchases and dividends paid during the year ended December 31, 2016. Net cash provided by financing activities for the year ended December 31, 2015 was $23.6 million, compared to net cash provided by financing activities for the year ended December 31, 2014 of $43.5 million. This decrease was primarily due to $43.1 million related to issuance of common stock in public offering during the year ended December 31, 2014 offset by $18.7 million related to the noncontrolling interest equity investment and $5.0 million related to the issuance of debt in our consolidated VIE during the year ended December 31, 2015.
We believe that existing cash and investment balances, when combined with anticipated cash flows as noted above, will be adequate to meet our expected liquidity needs in both the short-term and the reasonably foreseeable future. We currently expect to continue declaring and paying dividends at comparable levels, subject to our future liquidity needs and reserve requirements. The Company also considers various opportunities, including common stock repurchases, to deploy its excess capital. Any future growth strategy may require external financing, and we may from time to time seek to obtain external financing. We cannot assure that additional sources of financing will be available to us on favorable terms, or at all, or that any such financing would not negatively impact our results of operations.
Impact of Inflation and Changing Prices
The consolidated financial statements and related data presented herein have been prepared in accordance with GAAP, which requires the measurement of financial position and operating results in terms of historical dollars without considering changes in the relative purchasing power of money over time due to inflation. Our primary assets and liabilities are monetary in nature. As a result, interest rates have a more significant impact on performance than the effects of general levels of inflation. Interest rates do not necessarily move in the same direction or with the same magnitude as the inflationary effect on the cost of paying losses and LAE.
Insurance premiums are established before we know the amount of losses and LAE and the extent to which inflation may affect such expenses. Consequently, we attempt to anticipate the future impact of inflation when establishing rate levels. While we attempt to charge adequate premiums, we may be limited in raising premium levels for competitive and regulatory reasons. Inflation may also affect the market value of our investment portfolio and the investment rate of return. Any future economic changes that result in prolonged and increasing levels of inflation could cause increases in the dollar amount of incurred losses and LAE and thereby materially adversely affect future liability requirements.
CONTRACTUAL OBLIGATIONS
A summary of long-term contractual obligations as of December 31, 2016 follows (in thousands). The amounts represent estimates of gross undiscounted amounts payable over time.
|
|
|||||||||||||||
|
|
Payments Due By Period |
||||||||||||||
|
|
Less |
More |
|||||||||||||
|
|
than |
1 - 3 |
3 - 5 |
than |
|||||||||||
|
|
Total |
1 Year |
Years |
Years |
5 Years |
||||||||||
|
Loss and loss adjustment expense reserves (1) |
$ |
158,110 |
$ |
93,854 |
$ |
55,196 |
$ |
7,654 |
$ |
1,406 | |||||
|
Debt from consolidated variable interest entity |
5,000 |
— |
— |
5,000 |
— |
||||||||||
|
Operating leases |
4,057 | 644 | 1,996 | 1,417 |
— |
||||||||||
|
Other liabilities |
120 | 120 |
— |
— |
— |
||||||||||
|
Total |
$ |
167,287 |
$ |
94,618 |
$ |
57,192 |
$ |
14,071 |
$ |
1,406 | |||||
|
(1) |
Loss and loss adjustment expense reserves do not have contractual maturity dates; however, based on historical payment patterns, the amount presented is our estimate of the expected timing of these payments. The timing of payments is subject to significant uncertainty. We maintain a portfolio of marketable investments with varying maturities and a substantial amount of cash and cash equivalents intended to provide adequate cash flows for such payments. |
- 33 -
CRITICAL ACCOUNTING POLICIES
The preparation of consolidated financial statements in conformity with GAAP requires management to make estimates and assumptions about future events that affect the amounts reported in the financial statements and accompanying notes. Future events and their effects cannot be determined with absolute certainty. Therefore, the determination of estimates requires the exercise of judgment. Actual results inevitably will differ from those estimates, and such differences may be material to the financial statements.
We believe our most critical accounting estimates inherent in the preparation of our financial statements are: (i) fair value measurements of our investments, (ii) accounting for investments, (iii) premium and unearned premium calculation, (iv) reinsurance contracts, (v) the amount and recoverability of Deferred Acquisition Costs (“DAC”), (vi) reserve for loss and losses adjustment expenses and (vii) income taxes. The accounting estimates that result require the use of assumptions about certain matters that are highly uncertain at the time of estimation. To the extent actual experience differs from the assumptions used, our financial condition, results of operations, and cash flows would be affected.
FAIR VALUE
The fair value is the price that would be received to sell an asset or paid to transfer a liability between market participants in the principal market or in the most advantageous market when no principal market exists. Adjustments to transaction prices or quoted market prices may be required in illiquid or disorderly markets in order to estimate fair value. Alternative valuation techniques may be appropriate under the circumstances to determine the value that would be received to sell an asset or paid to transfer a liability in an orderly transaction. Market participants are assumed to be independent, knowledgeable, able and willing to transact an exchange and not acting under duress. Our nonperformance or credit risk is considered in determining the fair value of liabilities. Considerable judgment may be required in interpreting market data used to develop the estimates of fair value. Accordingly, estimates of fair value presented herein are not necessarily indicative of the amounts that could be realized in a current or future market exchange.
INVESTMENTS
Investments consist of debt and equity securities. Debt securities consist of securities with an initial fixed maturity of more than one year, which include corporate bonds, municipal bonds and United States government bonds. Equity securities generally consist of securities that represent ownership interests in an enterprise. The Company determines the appropriate classification of investments in debt and equity securities at the acquisition date and re-evaluates the classification at each balance sheet date.
Held-to-maturity investments are recorded at the amortized cost, reflecting the ability and intent to hold the securities to maturity. All other securities were classified as available-for-sale and recorded at fair value. Unrealized gains and losses during the year, net of the related tax effect applicable to available-for-sale, are excluded from income and reflected in other comprehensive income, and the cumulative effect is reported as a separate component of shareholders’ equity until realized. If a decline in fair value is deemed to be other-than-temporary, the investment is written down to its fair value and the amount of the write-down is recorded as an other-than-temporary impairment (“OTTI”) loss on the statement of income. In addition, any portion of such decline related to debt securities that is believed to arise from factors other than credit is recorded as a component of other comprehensive income rather than against income.
Net realized gains and losses on investments are determined in accordance with the specific identification method.
Net investment income consists primarily of interest income from debt securities, cash and cash equivalents, including any premium amortization or discount accretion and dividend income from equity securities; less expenses related to investments.
PREMIUMS AND UNEARNED PREMIUMS
Premiums are recognized as revenue on a pro-rata basis over the term of an insurance policy. Assumed reinsurance premiums written and earned are based on reports received from ceding companies for pro-rata treaty contracts and are generally recorded as written based on contract terms for excess-of-loss and quota share contracts. Premiums are earned ratably over the terms of the related coverage.
Unearned premiums and ceded unearned premiums represent the portion of gross premiums written and ceded premiums written, respectively, relating to the unexpired terms of such coverage.
Premium receivable balances are reported net of an allowance for estimated uncollectible premium amounts. Such allowance is based upon an ongoing review of amounts outstanding, length of collection periods, the creditworthiness of the insured and other relevant factors. Amounts deemed to be uncollectible are written off against the allowance.
- 34 -
REINSURANCE
Reinsurance is used to mitigate the exposure to losses, manage capacity and protect capital resources. Reinsuring loss exposures does not relieve a ceding entity from its obligations to policyholders and cedants. Reinsurance recoverables (including amounts related to claims incurred but not reported) and ceded unearned premiums are reported as assets. To minimize exposure to losses from a reinsurer’s inability to pay, the financial condition of such reinsurer is evaluated initially upon placement of the reinsurance and periodically thereafter. In addition to considering the financial condition of the reinsurer, the collectability of the reinsurance recoverables is evaluated (and where appropriate, whether an allowance for estimated uncollectible reinsurance recoverables is to be established) based upon a number of other factors. Such factors include the amounts outstanding, length of collection periods, disputes, any collateral or letters of credit held and other relevant factors. To the extent that an allowance for uncollectible reinsurance recoverable is established, amounts deemed to be uncollectible are written off against the allowance for estimated uncollectible reinsurance recoverables. The Company currently has no allowances for uncollectible reinsurance recoverables.
Ceded premiums written are recorded in accordance with applicable terms of the various reinsurance contracts and ceded premiums earned are charged against revenue over the period of the various reinsurance contracts. This also generally applies to reinstatement premiums paid to a reinsurer, which arise when contractually-specified ceded loss triggers have been breached. Ceded commissions reduce commissions, brokerage and other underwriting expenses and ceded losses incurred reduce net loss and loss adjustment expense incurred over the applicable periods of the various reinsurance contracts with third party reinsurers. If premiums or commissions are subject to adjustment (for example, retrospectively-rated or experience-rated), the estimated ultimate premium or commission is recognized over the period of the contract.
Amounts recoverable from reinsurers are estimated in a manner consistent with the claim liability associated with the reinsured business and consistent with the terms of the underlying reinsurance contract.
DEFERRED ACQUISITION COSTS (“DAC”)
DAC represent those costs that are incremental and directly related to the successful acquisition of new or renewal of existing insurance contracts. The Company defers incremental costs that result directly from, and are essential to, the acquisition or renewal of an insurance contract. Such DAC generally include agent or broker commissions, premium taxes, medical and inspection fees that would not have been incurred if the insurance contract had not been acquired or renewed. Each cost is analyzed to assess whether it is fully deferrable.
The Company also defers a portion of the employee total compensation and payroll-related fringe benefits directly related to time spent performing specific acquisition or renewal activities, including costs associated with the time spent on underwriting, policy issuance and processing, and sales force contract selling.
The acquisition costs are deferred and amortized over the period in which the related premiums written are earned, generally 12 months. It is grouped consistent with the manner in which the insurance contracts are acquired, serviced and measured for profitability and is reviewed for recoverability based on the profitability of the underlying insurance contracts. Investment income is anticipated in assessing the recoverability of DAC. The Company assesses the recoverability of DAC on an annual basis or more frequently if circumstances indicate impairment may have occurred.
LOSSES AND LOSS ADJUSTMENT EXPENSES (“LAE”)
Overview
The estimation of the liability for unpaid loss and LAE is inherently difficult and subjective, especially in view of changing legal and economic environments that impact the development of loss reserves, and therefore, quantitative techniques frequently have to be supplemented by subjective considerations and managerial judgment. In addition, trends that have affected development of liabilities in the past may not necessarily occur or affect liability development to the same degree in the future.
Each of our insurance companies establishes reserves on its balance sheet for unpaid loss and LAE related to its property and casualty insurance and related reinsurance contracts. As of any balance sheet date, there are claims that have not yet been reported, and some claims may not be reported for many years after the date a loss occurs. As a result of this historical pattern, the liability for unpaid loss and LAE includes significant estimates for IBNR claims. Additionally, reported claims are in various stages of the settlement process. Each claim is settled individually based upon its merits, and certain claims may take years to settle, especially if legal action is involved. As a result, the liabilities for unpaid loss and LAE include significant judgments, assumptions and estimates made by management relating to the actual ultimate losses that will arise from the claims. Due to the inherent uncertainties in the process of establishing these liabilities, the actual ultimate loss from a claim is likely to differ, perhaps materially, from the liability initially recorded.
- 35 -
As noted above, as of any balance sheet date, not all claims that have occurred have been reported to us, and if reported may not have been settled. The time period between the occurrence of a loss and the time it is settled is referred to as the “claim tail.” In general, actuarial judgments for shorter-tailed lines of business generally have much less of an effect on the determination of the loss reserve amount than when those same judgments are made regarding longer-tailed lines of business. Reported losses for the shorter-tailed classes, such as property and certain marine, aviation and energy classes, generally reach the ultimate level of incurred losses in a relatively short period of time. Rather than having to rely on actuarial assumptions for many accident years, these assumptions are generally only relevant for the more recent accident years.
The process of recording quarterly and annual liabilities for unpaid loss and LAE for short-tail lines is primarily focused on maintaining an appropriate reserve level for reported claims and IBNR. Specifically, we assess the reserve adequacy of IBNR in light of such factors as the current levels of reserves for reported claims and expectations with respect to reporting lags, catastrophe events, historical data, legal developments, and economic conditions, including the effects of inflation.
Standard actuarial methodologies employed to estimate ultimate losses incorporate the inherent lag from the time claims occur to when they are reported to an insurer and, if applicable, to when an insurer reports the claims to a reinsurer. Certain actuarial methodologies may be more appropriate than others in instances where this lag may not be consistent from period to period. Consequently, additional actuarial judgment is employed in the selection of methodologies to best incorporate the potential impact of this situation.
Our insurance companies provide coverage on both a claims-made and occurrence basis. Claims-made policies generally require that claims occur and be reported during the coverage period of the policy. Occurrence policies allow claims which occur during a policy’s coverage period to be reported after the coverage period, and as a result, these claims can have a very long claim tail, occasionally extending for decades. Casualty claims can have a very long claim tail, in certain situations extending for many years. In addition, casualty claims are more susceptible to litigation and the legal environment and can be significantly affected by changing contract interpretations, all of which contribute to extending the claim tail. For long-tail casualty lines of business, estimating the ultimate liabilities for unpaid loss and LAE is a more complex process and depends on a number of factors, including the line and volume of the business involved. For these reasons, our insurance companies will generally use actuarial projections in setting reserves for all casualty lines of business.
In conformity with GAAP, our insurance companies are not permitted to establish reserves for catastrophe losses that have not occurred. Therefore, losses related to a significant catastrophe, or accumulation of catastrophes, in any reporting period could have a material adverse effect on our results of operations and financial condition during that period.
We believe that the reserves for unpaid loss and LAE established by our insurance companies are adequate as of December 31, 2016; however, additional reserves, which could have a material impact upon our financial condition, results of operations and cash flows, may be necessary in the future.
Methodologies and Assumptions
Our insurance companies use a variety of techniques that employ significant judgments and assumptions to establish the liabilities for unpaid loss and LAE recorded at the balance sheet date. These techniques include detailed statistical analyses of past claims reporting, settlement activity, claims frequency, internal loss experience, changes in pricing or coverages and severity data when sufficient information exists to lend statistical credibility to the analyses. More subjective techniques are used when statistical data is insufficient or unavailable. These liabilities also reflect implicit or explicit assumptions regarding the potential effects of future inflation, judicial decisions, changes in laws and recent trends in such factors, as well as a number of actuarial assumptions that vary across our reinsurance and insurance subsidiaries and across lines of business. This data is analyzed by line of business, coverage, accident year or underwriting year and reinsurance contract type, as appropriate.
Our loss reserve review processes use actuarial methods that vary by operating subsidiary and line of business and produce point estimates for each class of business. The actuarial methods used include the following methods:
|
· |
Reported Loss Development Method: a reported loss development pattern is calculated based on historical loss development data, and this pattern is then used to project the latest evaluation of cumulative reported losses for each accident year or underwriting year, as appropriate, to ultimate levels; |
|
· |
Paid Development Method: a paid loss development pattern is calculated based on historical paid loss development data, and this pattern is then used to project the latest evaluation of cumulative paid losses for each accident year or underwriting year, as appropriate, to ultimate levels; |
|
· |
Expected Loss Ratio Method: expected loss ratios are applied to premiums earned, based on historical company experience, or historical insurance industry results when company experience is deemed not to be sufficient; and |
- 36 -
|
· |
Bornhuetter-Ferguson Method: the results from the Expected Loss Ratio Method are essentially blended with either the Reported Loss Development Method or the Paid Development Method. |
The primary actuarial assumptions used by insurance companies include the following:
|
· |
Expected loss ratios represent management’s expectation of losses, in relation to earned premium, at the time business is written, before any actual claims experience has emerged. This expectation is a significant determinant of the estimate of loss reserves for recently written business where there is little paid or incurred loss data to consider. Expected loss ratios are generally derived from historical loss ratios adjusted for the impact of rate changes, loss cost trends and known changes in the type of risks underwritten. For certain longer-tailed reinsurance business that are typically lower frequency, high severity classes, expected loss ratios are often used for the last several accident years or underwriting years, as appropriate. |
|
· |
Rate of loss cost inflation (or deflation) represents management’s expectation of the inflation associated with the costs we may incur in the future to settle claims. Expected loss cost inflation is particularly important for longer-tailed classes |
|
· |
Reported and paid loss emergence patterns represent management’s expectation of how losses will be reported and ultimately paid in the future based on the historical emergence patterns of reported and paid losses and are derived from past experience of our subsidiaries, modified for current trends. These emergence patterns are used to project current reported or paid loss amounts to their ultimate settlement value. |
In the absence of sufficiently credible internally-derived historical information, each of the above actuarial assumptions may also incorporate data from the insurance industries as a whole, or peer companies writing substantially similar coverages. Data from external sources may be used to set expectations, as well as assumptions regarding loss frequency or severity relative to an exposure unit or claim, among other actuarial parameters. Assumptions regarding the application or composition of peer group or industry reserving parameters require substantial judgment.
Loss Frequency and Severity
Loss frequency and severity are measures of loss activity that are considered in determining the key assumptions described above. Loss frequency is a measure of the number of claims per unit of insured exposure, and loss severity is a measure of the average size of claims. Factors affecting loss frequency include the effectiveness of loss controls and safety programs and changes in economic conditions or weather patterns. Factors affecting loss severity include changes in policy limits, retentions, rate of inflation and judicial interpretations. Another factor affecting estimates of loss frequency and severity is the loss reporting lag, which is the period of time between the occurrence of a loss and the date the loss is reported to our insurance companies. The length of the loss reporting lag affects their ability to accurately predict loss frequency (loss frequencies are more predictable for lines with short reporting lags), as well as the amount of reserves needed for IBNR. If the actual level of loss frequency and severity is higher or lower than expected, the ultimate losses will be different than management’s estimates.
Prior Year Development
Our insurance companies continually evaluate the potential for changes, both favorable and unfavorable, in their estimates of their loss and LAE liabilities and use the results of these evaluations to adjust both recorded liabilities and underwriting criteria. With respect to liabilities for unpaid loss and LAE established in prior years, these liabilities are periodically analyzed and their expected ultimate cost adjusted, where necessary, to reflect favorable or unfavorable development in loss experience and new information, including, for certain catastrophe events, revised industry estimates of the magnitude of a catastrophe. Adjustments to previously recorded liabilities for unpaid loss and LAE, both favorable and unfavorable, are reflected in our financial results in the periods in which these adjustments are made and are referred to as prior accident year reserve development. We adjusted our prior year loss and LAE reserve estimates during 2016, 2015 and 2014 based on current information that differed from previous assumptions made at the time such loss and LAE reserves were previously estimated.
Refer to Notes 1 and 6 to Notes to Consolidated Financial Statements set forth in Part II, Item 8, “Financial Statements and Supplementary Data” of this Form 10-K for additional information on our loss and LAE.
INCOME TAXES
Income taxes are accounted for under the asset and liability method. Deferred tax assets and liabilities are recognized for the estimated future tax consequences attributable to differences between the financial statement carrying amounts of existing assets and liabilities and their respective tax bases, and operating loss, capital loss and tax-credit carryforwards. Deferred tax assets and liabilities are measured using enacted tax rates expected to apply to taxable income in the years in which those temporary differences are expected
- 37 -
to be recovered or settled. The effect on deferred tax assets and liabilities of a change in tax rates is recognized in income or expense in the period that includes the enactment date.
RECENT ACCOUNTING PRONOUNCEMENTS
Refer to Note 2, “Summary of Significant Accounting Policies – Recent Accounting Pronouncements” in the Notes to the Consolidated Financial Statements set forth in Part II, Item 8 “Financial Statements and Supplemental Data” of this Form 10-K for a discussion of recent accounting pronouncements and their effect, if any, on the Company.
OFF BALANCE SHEET TRANSACTIONS
For the years ended December 31, 2016 and 2015, the Company had no off balance sheet transactions.
- 38 -
ITEM 7A. QUANTITATIVE AND QUALITATIVE DISCLOSURE ABOUT MARKET RISK
Our investment objective is to maximize total rate of return after federal income taxes while maintaining liquidity and minimizing risk. Our current investment policy limits investment in non-investment-grade debt securities (including high-yield bonds), and limits total investments in preferred stock, common stock and mortgage notes receivable. We also comply with applicable laws and regulations that further restrict the type, quality and concentration of our investments. In general, these laws and regulations permit investments, within specified limits and subject to certain qualifications, in federal, state and municipal obligations, corporate bonds, preferred and common equity securities and real estate mortgages.
Our investment policy is established by the Board of Directors Investment Committee and is reviewed on a regular basis. Pursuant to this investment policy, as of December 31, 2016, approximately 93% of investments were in debt securities and cash and cash equivalents, which are considered to be either held-to-maturity or available-for-sale, based upon our estimates of required liquidity. Approximately 99% of the debt securities are considered available-for-sale and are marked to market. We may in the future consider additional debt securities to be held-to-maturity and carried at amortized cost. We do not use any swaps, options, futures or forward contracts to hedge or enhance our investment portfolio.
The following table provides information about the financial instruments, as of December 31, 2016, that is sensitive to changes in interest rates. The table presents principal cash flows and the related weighted average interest rate by expected maturity date based upon par values.
|
|
||||||||||||||||||||||||
|
|
Carrying |
|||||||||||||||||||||||
|
|
2017 |
2018 |
2019 |
2020 |
2021 |
Thereafter |
Total |
Amount |
||||||||||||||||
|
Principal amount by expected |
||||||||||||||||||||||||
|
United States government |
$ |
9,721 |
$ |
6,509 |
$ |
1,765 |
$ |
4,921 |
$ |
3,425 |
$ |
14,600 |
$ |
40,941 |
$ |
40,553 | ||||||||
|
Obligations of states and |
21,600 | 12,690 | 22,825 | 21,525 | 10,520 | 48,250 | 137,410 | 151,183 | ||||||||||||||||
|
Corporate securities |
15,677 | 17,567 | 14,573 | 15,249 | 20,888 | 58,015 | 141,969 | 144,646 | ||||||||||||||||
|
International securities |
1,300 | 2,335 | 406 | 551 | 1,469 | 5,641 | 11,702 | 11,934 | ||||||||||||||||
|
Collateralized mortgage obligations |
3,071 | 1,280 | 955 | 1,311 | 4,809 | 19,422 | 30,848 | 31,991 | ||||||||||||||||
|
Total investments |
$ |
51,369 |
$ |
40,381 |
$ |
40,524 |
$ |
43,557 |
$ |
41,111 |
$ |
145,928 |
$ |
362,870 |
$ |
380,307 | ||||||||
|
|
||||||||||||||||||||||||
|
Weighted average interest rate by |
||||||||||||||||||||||||
|
United States government |
0.83% | 0.76% | 1.90% | 0.46% | 1.24% | 1.54% | 1.11% | |||||||||||||||||
|
Obligations of states and |
4.53% | 5.00% | 4.99% | 4.93% | 4.87% | 4.92% | 4.88% | |||||||||||||||||
|
Corporate securities |
3.59% | 3.74% | 3.47% | 3.56% | 3.29% | 3.69% | 3.59% | |||||||||||||||||
|
International securities |
3.00% | 3.77% | 7.38% | 3.31% | 2.98% | 4.08% | 3.84% | |||||||||||||||||
|
Collateralized mortgage obligations |
4.38% | 2.48% | 3.03% | 3.34% | 4.09% | 3.69% | 3.73% | |||||||||||||||||
|
Total investments |
3.49% | 3.62% | 4.29% | 3.88% | 3.61% | 3.90% | 3.82% | |||||||||||||||||
- 39 -
ITEM 8. FINANCIAL STATEMENTS AND SUPPLEMENTARY DATA
INDEX TO CONSOLIDATED FINANCIAL STATEMENTS
- 40 -
REPORT OF INDEPENDENT REGISTERED PUBLIC ACCOUNTING FIRM
The Board of Directors and Shareholders
Federated National Holding Company and Subsidiaries
We have audited the accompanying consolidated balance sheets of Federated National Holding Company and subsidiaries as of December 31, 2016 and 2015 and the related consolidated statements of operations, comprehensive income, changes in shareholders' equity and cash flows for the years ended December 31, 2016 and 2015. Our audits also included the financial statement schedules listed in the Index at Item 15(a). These financial statements and schedules are the responsibility of the Company's management. Our responsibility is to express an opinion on these financial statements and schedules based on our audits.
We conducted our audits in accordance with the standards of the Public Company Accounting Oversight Board (United States). Those standards require that we plan and perform the audit to obtain reasonable assurance about whether the financial statements are free of material misstatement. An audit includes examining, on a test basis, evidence supporting the amounts and disclosures in the financial statements. An audit also includes assessing the accounting principles used and significant estimates made by management, as well as evaluating the overall financial statement presentation. We believe that our audits provide a reasonable basis for our opinion.
In our opinion, the financial statements referred to above present fairly, in all material respects, the consolidated financial position of Federated National Holding Company and subsidiaries at December 31, 2016 and 2015 and the consolidated results of their operations and their cash flows for the years ended December 31, 2016 and 2015, in conformity with U.S. generally accepted accounting principles. Also, in our opinion, the related financial statement schedules, when considered in relation to the basic financial statements taken as a whole, present fairly, in all material respects, the information set forth therein.
We also have audited, in accordance with the standards of the Public Company Accounting Oversight Board (United States), Federated National Holding Company and subsidiaries' internal control over financial reporting as of December 31, 2016, based on criteria established in Internal Control-Integrated Framework issued by the Committee of Sponsoring Organizations of the Treadway Commission (2013 framework) and our report dated March 16, 2017 expressed an unqualified opinion thereon.
/s/ Ernst & Young LLP
Charlotte, North Carolina
March 16, 2017
- 41 -
REPORT OF INDEPENDENT REGISTERED PUBLIC ACCOUNTING FIRM
To the Board of Directors and
Stockholders of Federated National Holding Company
We have audited the accompanying consolidated balance sheets of Federated National Holding Company as of December 31, 2014 and 2013, and the related consolidated statements of income, comprehensive income, stockholders’ equity, and cash flows for each of the years in the three year period ended December 31, 2014. In connection with our audits of the financial statements, we have also audited the financial statement schedules listed in the accompanying index. We also have audited Federated National Holdings Company’s internal control over financial reporting as of December 31, 2014, based on criteria established in Internal Control—Integrated Framework (2013) issued by the Committee of Sponsoring Organizations of the Treadway Commission (COSO). Federated National Holdings Company’s management is responsible for these consolidated financial statements, for maintaining effective internal control over financial reporting, and for its assessment of the effectiveness of internal control over financial reporting, included in the accompanying Item 9A Controls and Procedures. Our responsibility is to express an opinion on these consolidated financial statements and an opinion on the company’s internal control over financial reporting based on our audits.
We conducted our audits in accordance with the standards of the Public Company Accounting Oversight Board (United States). Those standards require that we plan and perform the audits to obtain reasonable assurance about whether the consolidated financial statements are free of material misstatement and whether effective internal control over financial reporting was maintained in all material respects. Our audits of the consolidated financial statements included examining, on a test basis, evidence supporting the amounts and disclosures in the consolidated financial statements, assessing the accounting principles used and significant estimates made by management, and evaluating the overall consolidated financial statement presentation. Our audit of internal control over financial reporting included obtaining an understanding of internal control over financial reporting, assessing the risk that a material weakness exists, and testing and evaluating the design and operating effectiveness of internal control based on the assessed risk. Our audits also included performing such other procedures as we considered necessary in the circumstances. We believe that our audits provide a reasonable basis for our opinions.
A company’s internal control over financial reporting is a process designed to provide reasonable assurance regarding the reliability of financial reporting and the preparation of consolidated financial statements for external purposes in accordance with generally accepted accounting principles. A company’s internal control over financial reporting includes those policies and procedures that (1) pertain to the maintenance of records that, in reasonable detail, accurately and fairly reflect the transactions and dispositions of the assets of the company; (2) provide reasonable assurance that transactions are recorded as necessary to permit preparation of financial statements in accordance with generally accepted accounting principles, and that receipts and expenditures of the company are being made only in accordance with authorizations of management and directors of the company; and (3) provide reasonable assurance regarding prevention or timely detection of unauthorized acquisition, use, or disposition of the company’s assets that could have a material effect on the financial statements.
Because of its inherent limitations, internal control over financial reporting may not prevent or detect misstatements. Also, projections of any evaluation of effectiveness to future periods are subject to the risk that controls may become inadequate because of changes in conditions, or that the degree of compliance with the policies or procedures may deteriorate.
In our opinion, the consolidated financial statements referred to above present fairly, in all material respects, the consolidated financial position of Federated National Holding Company as of December 31, 2014 and 2013, and the consolidated results of its operations and its cash flows for each of the years in the three year period ended December 31, 2014, in conformity with accounting principles generally accepted in the United States of America. Also in our opinion, Federated National Holdings Company maintained, in all material respects, effective internal control over financial reporting as of December 31, 2014, based on criteria established in Internal Control—Integrated Framework (2013) issued by the Committee of Sponsoring Organizations of the Treadway Commission (COSO).
/s/Goldstein Schechter Koch
Fort Lauderdale, FL
March 16, 2015, except for Schedule II dated March 14, 2016
- 42 -
FEDERATED NATIONAL HOLDING COMPANY AND SUBSIDIARIES
CONSOLIDATED BALANCE SHEETS
(In thousands, except share and per share data)
|
|
||||||
|
|
December 31, |
|||||
|
|
2016 |
2015 |
||||
|
ASSETS |
||||||
|
Investments: |
||||||
|
Debt securities, available-for-sale, at fair value (amortized cost of $376,644 and |
||||||
|
$338,021, respectively) |
$ |
374,756 |
$ |
339,178 | ||
|
Debt securities, held-to-maturity, at amortized cost |
5,551 | 6,619 | ||||
|
Equity securities, available-for-sale, at fair value (cost of $24,163 and $33,581, respectively) |
29,375 | 38,534 | ||||
|
Total investments (including $28,704 and $22,670 related to the VIE, respectively) |
409,682 | 384,331 | ||||
|
|
||||||
|
Cash and cash equivalents (including $15,668 and $14,616 related to the VIE, respectively) |
74,593 | 53,038 | ||||
|
Prepaid reinsurance premiums |
156,932 | 181,840 | ||||
|
Premiums receivable, net of allowance of $55 and $302, respectively |
||||||
|
(including $1,584 and $355 related to the VIE, respectively) |
54,854 | 38,594 | ||||
|
Reinsurance recoverable, net |
48,530 | 12,714 | ||||
|
Deferred acquisition costs |
38,962 | 15,547 | ||||
|
Income taxes receivable |
13,871 | 2,691 | ||||
|
Property and equipment, net |
4,194 | 2,894 | ||||
|
Other assets (including $1,910 and $1,037 related to the VIE, respectively) |
11,509 | 7,605 | ||||
|
TOTAL ASSETS |
$ |
813,127 |
$ |
699,254 | ||
|
|
||||||
|
LIABILITIES AND SHAREHOLDERS’ EQUITY |
||||||
|
LIABILITIES: |
||||||
|
Loss and loss adjustment expense reserves |
$ |
158,110 |
$ |
97,340 | ||
|
Unearned premiums |
294,022 | 253,960 | ||||
|
Reinsurance payable |
79,154 | 61,069 | ||||
|
Debt from consolidated variable interest entity |
4,909 | 4,887 | ||||
|
Deferred income taxes, net |
1,433 | 5,627 | ||||
|
Other liabilities |
37,643 | 25,612 | ||||
|
Total liabilities |
575,271 | 448,495 | ||||
|
SHAREHOLDERS’ EQUITY: |
||||||
|
Preferred stock, $0.01 par value: 1,000,000 shares authorized |
— |
— |
||||
|
Common stock, $0.01 par value: 25,000,000 shares authorized; |
||||||
|
13,473,120 and 13,798,773 shares issued and outstanding, respectively |
134 | 138 | ||||
|
Additional paid-in capital |
136,779 | 131,998 | ||||
|
Accumulated other comprehensive income |
1,941 | 3,985 | ||||
|
Retained earnings |
80,275 | 96,461 | ||||
|
Total shareholders’ equity attributable to Federated National Holding Company shareholders equity |
219,129 | 232,582 | ||||
|
Noncontrolling interest |
18,727 | 18,177 | ||||
|
Total shareholders’ equity |
237,856 | 250,759 | ||||
|
TOTAL LIABILITIES AND SHAREHOLDERS’ EQUITY |
$ |
813,127 |
$ |
699,254 | ||
See accompanying notes to consolidated financial statements.
- 43 -
FEDERATED NATIONAL HOLDING COMPANY AND SUBSIDIARIES
CONSOLIDATED STATEMENTS OF OPERATIONS
(In thousands, except per share data)
|
|
|||||||||
|
|
Year Ended |
||||||||
|
|
December 31, |
||||||||
|
|
2016 |
2015 |
2014 |
||||||
|
Revenue: |
|||||||||
|
Net premiums earned |
$ |
259,872 |
$ |
210,020 |
$ |
170,905 | |||
|
Net investment income |
9,063 | 7,226 | 5,385 | ||||||
|
Net realized investment gains |
3,045 | 3,616 | 4,426 | ||||||
|
Direct written policy fees |
17,730 | 11,248 | 8,689 | ||||||
|
Other income |
26,674 | 17,783 | 11,287 | ||||||
|
Total revenue |
316,384 | 249,893 | 200,692 | ||||||
|
|
|||||||||
|
Costs and expenses: |
|||||||||
|
Losses and loss adjustment expenses |
187,341 | 104,353 | 81,036 | ||||||
|
Commissions and other underwriting expenses |
108,776 | 64,868 | 52,077 | ||||||
|
General and administrative expenses |
17,186 | 15,223 | 10,272 | ||||||
|
Interest expense |
348 | 256 |
- |
||||||
|
Total costs and expenses |
313,651 | 184,700 | 143,385 | ||||||
|
|
|||||||||
|
Income before income taxes |
2,733 | 65,193 | 57,307 | ||||||
|
Income taxes |
2,683 | 24,753 | 20,108 | ||||||
|
Net income |
50 | 40,440 | 37,199 | ||||||
|
Net income (loss) attributable to noncontrolling interest |
246 | (445) |
- |
||||||
|
Net (loss) income attributable to Federated National |
|||||||||
|
Holding Company shareholders |
$ |
(196) |
$ |
40,885 |
$ |
37,199 | |||
|
|
|||||||||
|
Net (loss) income per share attributable to Federated National |
|||||||||
|
Holding Company shareholders: |
|||||||||
|
Basic |
$ |
(0.01) |
$ |
2.98 |
$ |
3.08 | |||
|
Diluted |
$ |
(0.01) |
$ |
2.92 |
$ |
2.99 | |||
|
|
|||||||||
|
Weighted average number of shares of common stock |
|||||||||
|
outstanding: |
|||||||||
|
Basic |
13,758 | 13,729 | 12,082 | ||||||
|
Diluted |
13,758 | 13,997 | 12,438 | ||||||
|
|
|||||||||
|
Dividends declared per share of common stock |
$ |
0.27 |
$ |
0.18 |
$ |
0.13 | |||
See accompanying notes to consolidated financial statements.
- 44 -
FEDERATED NATIONAL HOLDING COMPANY AND SUBSIDIARIES
CONSOLIDATED STATEMENTS OF COMPREHENSIVE INCOME
(In thousands)
|
|
|||||||||
|
|
Year Ended |
||||||||
|
|
December 31, |
||||||||
|
|
2016 |
2015 |
2014 |
||||||
|
|
|||||||||
|
Net income |
$ |
50 |
$ |
40,440 |
$ |
37,199 | |||
|
Change in net unrealized (losses) gains on investments, |
|||||||||
|
available-for-sale |
(2,786) | (6,308) | 2,856 | ||||||
|
Comprehensive (loss) income before income taxes |
(2,736) | 34,132 | 40,055 | ||||||
|
|
|||||||||
|
Income tax benefit (expense) related to items of other |
|||||||||
|
comprehensive income |
1,046 | 2,454 | (1,102) | ||||||
|
Comprehensive (loss) income |
(1,690) | 36,586 | 38,953 | ||||||
|
|
|||||||||
|
Less: comprehensive income (loss) attributable to |
|||||||||
|
noncontrolling interest |
550 | (566) |
— |
||||||
|
Comprehensive (loss) income attributable to Federated National |
|||||||||
|
Holding Company shareholders |
$ |
(2,240) |
$ |
37,152 |
$ |
38,953 | |||
See accompanying notes to consolidated financial statements.
- 45 -
FEDERATED NATIONAL HOLDING COMPANY AND SUBSIDIARIES
CONSOLIDATED STATEMENTS OF CHANGES IN SHAREHOLDERS’ EQUITY
(In thousands, except per share data)
|
|
||||||||||||||||||||||||||
|
|
||||||||||||||||||||||||||
|
|
Total Shareholders' |
|||||||||||||||||||||||||
|
|
Accumulated |
Equity Attributable to |
||||||||||||||||||||||||
|
|
Common Stock |
Additional |
Other |
Federated National |
Total |
|||||||||||||||||||||
|
|
Preferred |
Issued |
Paid-in |
Comprehensive |
Retained |
Holding Company |
Noncontrolling |
Shareholders' |
||||||||||||||||||
|
|
Stock |
Shares |
Amount |
Capital |
Income |
Earnings |
Shareholders |
Interest |
Equity |
|||||||||||||||||
|
Balance as of December 31, 2013 |
$ |
— |
10,901,716 |
$ |
109 |
$ |
80,525 |
$ |
5,964 |
$ |
21,896 |
$ |
108,494 |
$ |
— |
$ |
108,494 | |||||||||
|
Net income |
— |
— |
— |
— |
— |
37,199 | 37,199 |
— |
37,199 | |||||||||||||||||
|
Other comprehensive income |
— |
— |
— |
— |
1,754 |
— |
1,754 |
— |
1,754 | |||||||||||||||||
|
Dividends |
— |
— |
— |
— |
— |
(1,672) | (1,672) |
— |
(1,672) | |||||||||||||||||
|
Stock issued in public offering |
— |
2,358,975 | 23 | 43,086 |
— |
— |
43,109 |
— |
43,109 | |||||||||||||||||
|
Shares issued under share- |
||||||||||||||||||||||||||
|
based compensation plans |
— |
371,723 | 4 | 1,551 |
— |
— |
1,555 |
— |
1,555 | |||||||||||||||||
|
Tax benefits from share-based |
||||||||||||||||||||||||||
|
awards |
— |
— |
— |
480 |
— |
— |
480 |
— |
480 | |||||||||||||||||
|
Share-based compensation |
— |
— |
— |
1,660 |
— |
— |
1,660 |
— |
1,660 | |||||||||||||||||
|
Balance as of December 31, 2014 |
— |
13,632,414 | 136 | 127,302 | 7,718 | 57,423 | 192,579 |
— |
192,579 | |||||||||||||||||
|
Net income (loss) |
— |
— |
— |
— |
— |
40,885 | 40,885 | (445) | 40,440 | |||||||||||||||||
|
Other comprehensive income, |
— |
— |
— |
— |
(3,733) |
— |
(3,733) | (121) | (3,854) | |||||||||||||||||
|
Noncontrolling interest capital |
||||||||||||||||||||||||||
|
contributions |
18,743 | 18,743 | ||||||||||||||||||||||||
|
Dividends |
— |
— |
— |
— |
— |
(1,847) | (1,847) |
— |
(1,847) | |||||||||||||||||
|
Shares issued under share- |
||||||||||||||||||||||||||
|
based compensation plans |
— |
166,359 | 2 | 169 |
— |
— |
171 |
— |
171 | |||||||||||||||||
|
Tax benefits from share-based |
||||||||||||||||||||||||||
|
awards |
— |
— |
— |
1,564 |
— |
— |
1,564 |
— |
1,564 | |||||||||||||||||
|
Share-based compensation |
— |
— |
— |
2,963 |
— |
— |
2,963 |
— |
2,963 | |||||||||||||||||
|
Balance as of December 31, 2015 |
— |
13,798,773 |
$ |
138 |
$ |
131,998 |
$ |
3,985 |
$ |
96,461 |
$ |
232,582 |
$ |
18,177 |
$ |
250,759 | ||||||||||
|
Net (loss) income |
— |
— |
— |
— |
— |
(196) | (196) | 246 | 50 | |||||||||||||||||
|
Other comprehensive (loss) income |
— |
— |
— |
— |
(2,044) |
— |
(2,044) | 304 | (1,740) | |||||||||||||||||
|
Dividends |
— |
— |
— |
— |
— |
(4,677) | (4,677) |
— |
(4,677) | |||||||||||||||||
|
Shares issued under share- |
||||||||||||||||||||||||||
|
based compensation plans |
— |
299,165 |
— |
361 |
— |
— |
361 |
— |
361 | |||||||||||||||||
|
Tax benefits from share-based |
||||||||||||||||||||||||||
|
awards |
— |
— |
— |
590 |
— |
— |
590 |
— |
590 | |||||||||||||||||
|
Repurchases of common stock |
— |
(624,818) | (4) |
— |
— |
(11,313) | (11,317) |
— |
(11,317) | |||||||||||||||||
|
Share-based compensation |
— |
— |
— |
3,831 |
— |
— |
3,831 |
— |
3,831 | |||||||||||||||||
|
Balance as of December 31, 2016 |
$ |
— |
13,473,120 |
$ |
134 |
$ |
136,779 |
$ |
1,941 |
$ |
80,275 |
$ |
219,129 |
$ |
18,727 |
$ |
237,856 | |||||||||
See accompanying notes to consolidated financial statements.
- 46 -
FEDERATED NATIONAL HOLDING COMPANY AND SUBSIDIARIES
CONSOLIDATED STATEMENTS OF CASH FLOWS
(In thousands)
|
|
|||||||||
|
|
Year Ended |
||||||||
|
|
December 31, |
||||||||
|
|
2016 |
2015 |
2014 |
||||||
|
Cash flow from operating activities: |
|||||||||
|
Net income |
$ |
50 |
$ |
40,440 |
$ |
37,199 | |||
|
Adjustments to reconcile net income to net cash provided by (used in) |
|||||||||
|
Net realized investment gains |
(3,045) | (3,616) | (4,426) | ||||||
|
Amortization of investment premium or discount, net |
5,346 | 5,645 | 4,165 | ||||||
|
Depreciation and amortization |
869 | 624 | 149 | ||||||
|
Share-based compensation |
4,420 | 4,527 | 2,140 | ||||||
|
Changes in operating assets and liabilities: |
|||||||||
|
Prepaid reinsurance premiums |
24,908 | (84,875) | (59,829) | ||||||
|
Premiums receivable, net |
(16,260) | (11,319) | (4,860) | ||||||
|
Reinsurance recoverable, net |
(35,816) | (180) | (9,793) | ||||||
|
Deferred acquisition costs |
(23,415) | (1,937) | 3,098 | ||||||
|
Income taxes receivable, net |
(11,769) | (2,445) | (4,189) | ||||||
|
Loss and loss adjustment expense reserves |
60,770 | 19,010 | 17,315 | ||||||
|
Unearned premiums |
40,062 | 61,535 | 64,081 | ||||||
|
Reinsurance payable |
18,085 | 18,606 | 12,918 | ||||||
|
Deferred income taxes, net of other comprehensive income |
(2,575) | 6,741 | 765 | ||||||
|
Other, net |
8,120 | 135 | 4,411 | ||||||
|
Net cash provided by operating activities |
69,750 | 52,891 | 63,144 | ||||||
|
Cash flow from investing activities: |
|||||||||
|
Sales, maturities and redemptions of investment securities |
311,109 | 169,979 | 87,151 | ||||||
|
Purchases of investment securities |
(342,113) | (231,884) | (194,087) | ||||||
|
Purchases of property and equipment |
(2,147) | (1,736) | (969) | ||||||
|
Net cash used in investing activities |
(33,151) | (63,641) | (107,905) | ||||||
|
Cash flow from financing activities: |
|||||||||
|
Noncontrolling interest equity investment |
— |
18,743 |
— |
||||||
|
Issuance of common stock in public offering |
— |
— |
43,109 | ||||||
|
Tax benefit related to share-based compensation |
589 | 1,564 | 480 | ||||||
|
Issuance of debt in consolidated variable interest entity |
— |
5,000 |
— |
||||||
|
Purchases of FNHC common stock |
(11,317) |
— |
— |
||||||
|
Issuance of common stock for share-based awards |
361 | 171 | 1,555 | ||||||
|
Dividends paid |
(4,677) | (1,847) | (1,672) | ||||||
|
Net cash (used in) provided by financing activities |
(15,044) | 23,631 | 43,472 | ||||||
|
Net increase in cash and cash equivalents |
21,555 | 12,881 | (1,289) | ||||||
|
Cash and cash equivalents at beginning of period |
53,038 | 40,157 | 41,446 | ||||||
|
Cash and cash equivalents at end of period |
$ |
74,593 |
$ |
53,038 |
$ |
40,157 | |||
See accompanying notes to consolidated financial statements.
- 47 -
FEDERATED NATIONAL HOLDING COMPANY AND SUBSIDIARIES
CONSOLIDATED STATEMENTS OF CASH FLOWS (CONTINUED)
(In thousands)
|
|
|||||||||
|
|
Year Ended |
||||||||
|
|
December 31, |
||||||||
|
|
2016 |
2015 |
2014 |
||||||
|
Supplemental disclosure of cash flow information: |
|||||||||
|
Cash paid during the period for: |
|||||||||
|
Income taxes |
$ |
14,360 |
$ |
15,662 |
$ |
19,185 | |||
|
Non-cash investing and finance activities: |
|||||||||
|
Accrued dividends payable |
$ |
1,115 |
$ |
712 |
$ |
564 | |||
See accompanying notes to consolidated financial statements.
- 48 -
Federated National Holding Company and Subsidiaries
Notes to Consolidated Financial Statements
December 31, 2016
1. ORGANIZATION, CONSOLIDATION AND BASIS OF PRESENTATION
Organization
Federated National Holding Company, (“FNHC,” the “Company,” “we,” or “us”), is an insurance holding company that controls substantially all steps in the insurance underwriting, distribution and claims processes through our subsidiaries and our contractual relationships with our independent agents and general agents. We are authorized to underwrite, and/or place through our wholly owned subsidiaries, homeowners’ multi-peril (“homeowners’”), personal automobile, commercial general liability, federal flood, and other lines of insurance in Florida and other states. We market, distribute and service our own and third-party insurers’ products and our other services through a network of independent agents.
Our wholly owned insurance subsidiary is Federated National Insurance Company (“FNIC”), which is licensed as an admitted carrier in Florida, Texas, Georgia, Alabama, Louisiana and South Carolina. We also serve as managing general agent for Monarch National Insurance Company (“MNIC”), which was founded in 2015 through the joint venture, described below, and is licensed as an admitted carrier in Florida. An admitted carrier is an insurance company that has received a license from the state department of insurance giving the Company the authority to write specific lines of insurance in that state. These companies are also bound by rate and form regulations, and are strictly regulated to protect policyholders from a variety of illegal and unethical practices, including fraud. Admitted carriers are also required to financially contribute to the state guarantee fund, which is used to pay for losses if an insurance carrier becomes insolvent or unable to pay the losses due to their policyholders.
On March 19, 2015, the Company entered into a joint venture to organize MNIC, which received its certificate of authority to write homeowners’ property and casualty insurance in Florida from the Florida Office of Insurance Regulation (the “Florida OIR”). The Company’s joint venture partners are a majority-owned limited partnership of Crosswinds Holdings Inc., a publicly traded Canadian private equity firm and asset manager (“Crosswinds”); and Transatlantic Reinsurance Company (“TransRe”).
The Company and Crosswinds each invested $14.0 million in Monarch Delaware Holdings LLC (“Monarch Delaware”), the indirect parent company of MNIC, for a 42.4% interest in Monarch Delaware (each holding 50% of the voting interests in Monarch Delaware). TransRe invested $5.0 million for a 15.2% non-voting interest in Monarch Delaware and advanced an additional $5.0 million in debt evidenced by a six-year promissory note bearing 6% annual interest payable by Monarch National Holding Company (“MNHC”), a wholly owned subsidiary of Monarch Delaware and the direct parent company of MNIC.
Significant Customer
We entered into an Insurance Agency Master Agreement with Ivantage Select Agency, Inc., (“ISA”), an affiliate of Allstate Insurance Company (“Allstate”), pursuant to which we are authorized by ISA to appoint Allstate agents to offer our homeowners’ and commercial general liability insurance products to consumers in Florida. As a percentage of the total homeowners’ premiums we underwrote in the years ended December 31, 2016, 2015, and 2014, 24.1%, 25.4%, and 20.5%, respectively, were from Allstate’s network of Florida agents.
Principles of Consolidation
The accompanying consolidated financial statements include the accounts of FNHC and all other entities in which we have a controlling financial interest and any variable interest entities (“VIE”) in which we are the primary beneficiary. All material inter-company accounts and transactions have been eliminated in consolidation. A VIE is an entity that does not have sufficient equity to finance its own activities without additional financial support or where investors lack certain characteristics of a controlling financial interest. We assess our contractual, ownership or other interests in a VIE to determine if our interest participates in the variability the VIE was designed to absorb and pass onto variable interest holders. We perform an ongoing qualitative assessment of our variable interests in VIEs to determine whether we have a controlling financial interest and would therefore be considered the primary beneficiary of the VIE. If we determine we are the primary beneficiary of a VIE, we consolidate the assets and liabilities of the VIE in our consolidated financial statements.
In connection with the investment in Monarch Delaware, we have determined that we are the primary beneficiary of this VIE, as we possess the power to direct the activities of the VIE that most significantly impact its economic performance. Accordingly, we consolidate the VIE in our consolidated financial statements. Refer to Note 14 for additional information on the VIE.
- 49 -
Federated National Holding Company and Subsidiaries
Notes to Consolidated Financial Statements (continued)
December 31, 2016
Basis of Presentation
The accompanying consolidated financial statements are prepared in accordance with United States of America Generally Accepted Accounting Principles (“GAAP”). Certain GAAP policies, which significantly affect the determination of financial condition, results of operations and cash flows, are summarized below.
2. SIGNIFICANT ACCOUNTING POLICIES AND PRACTICES
Accounting Estimates and Assumptions
The preparation of financial statements in conformity with GAAP requires management to make estimates and assumptions about future events that affect the amounts reported in the financial statements and accompanying notes. Future events and their effects cannot be determined with absolute certainty. Therefore, the determination of estimates requires the exercise of judgment. Actual results inevitably will differ from those estimates.
Similar to other property and casualty insurers, our liability for losses and loss adjustment expense reserves, although supported by actuarial projections and other data, is ultimately based on management’s reasoned expectations of future events. Although considerable variability is inherent in these estimates, we believe that this liability is adequate. Estimates are reviewed regularly and adjusted as necessary. Such adjustments are reflected in current operations.
Fair Value
The fair value is the price that would be received to sell an asset or paid to transfer a liability between market participants in the principal market or in the most advantageous market when no principal market exists. Adjustments to transaction prices or quoted market prices may be required in illiquid or disorderly markets in order to estimate fair value. Alternative valuation techniques may be appropriate under the circumstances to determine the value that would be received to sell an asset or pay to transfer a liability in an orderly transaction. Market participants are assumed to be independent, knowledgeable, able and willing to transact an exchange and not acting under duress. Our nonperformance or credit risk is considered in determining the fair value of liabilities. Considerable judgment may be required in interpreting market data used to develop the estimates of fair value. Accordingly, estimates of fair value presented herein are not necessarily indicative of the amounts that could be realized in a current or future market exchange.
Refer to Note 3 for additional information regarding fair value.
Investments
Investments consist of debt and equity securities. Debt securities consist of securities with an initial fixed maturity, which include corporate bonds, municipal bonds and United States government bonds. Equity securities generally consist of securities that represent ownership interests in an enterprise. The Company determines the appropriate classification of investments in debt and equity securities at the acquisition date and re-evaluates the classification at each balance sheet date.
Held-to-maturity investments are recorded at the amortized cost, reflecting the ability and intent to hold the securities to maturity. All other securities were classified as available-for-sale and recorded at fair value. Unrealized gains and losses during the year, net of the related tax effect applicable to available-for-sale, are excluded from income and reflected in other comprehensive income, and the cumulative effect is reported as a separate component of shareholders’ equity until realized. If a decline in fair value is deemed to be other-than-temporary, the investment is written down to its fair value and the amount of the write-down is recorded as an other-than-temporary impairment (“OTTI”) loss on the statement of operations. In addition, any portion of such decline related to debt securities that is believed to arise from factors other than credit is recorded as a component of other comprehensive income rather than against income.
Net realized gains and losses on investments are determined in accordance with the specific identification method.
Net investment income consists primarily of interest income from debt securities, cash and cash equivalents, including any premium amortization or discount accretion and dividend income from equity securities; less expenses related to investments.
Refer to Note 4 for additional information regarding investments.
- 50 -
Federated National Holding Company and Subsidiaries
Notes to Consolidated Financial Statements (continued)
December 31, 2016
Cash and Cash Equivalents
Cash and cash equivalents consist of all deposit balances with a bank that are available for immediate withdrawal and highly liquid investments. All investments with maturities of three months or less at the date of the purchase are considered cash equivalents.
Premiums and Unearned Premiums
Premiums are recognized as revenue on a pro-rata basis over the term of an insurance policy. Assumed reinsurance premiums written and earned are based on reports received from ceding companies for pro-rata treaty contracts and are generally recorded as written based on contract terms for excess-of-loss and quota share contracts. Premiums are earned ratably over the terms of the related coverage.
Unearned premiums and ceded unearned premiums represent the portion of gross premiums written and ceded premiums written, respectively, relating to the unexpired terms of such coverage.
Premium receivable balances are reported net of an allowance for estimated uncollectible premium amounts. Such allowance is based upon an ongoing review of amounts outstanding, length of collection periods, the creditworthiness of the insured and other relevant factors. Amounts deemed to be uncollectible are written off against the allowance.
Reinsurance
Reinsurance is used to mitigate the exposure to losses, manage capacity and protect capital resources. Reinsuring loss exposures does not relieve a ceding entity from its obligations to policyholders and cedants. Reinsurance recoverables (including amounts related to claims incurred but not reported) and ceded unearned premiums are reported as assets. To minimize exposure to losses from a reinsurer’s inability to pay, the financial condition of such reinsurer is evaluated initially upon placement of the reinsurance and periodically thereafter. In addition to considering the financial condition of the reinsurer, the collectability of the reinsurance recoverables is evaluated (and where appropriate, whether an allowance for estimated uncollectible reinsurance recoverables is to be established) based upon a number of other factors. Such factors include the amounts outstanding, length of collection periods, disputes, any collateral or letters of credit held and other relevant factors. To the extent that an allowance for uncollectible reinsurance recoverable is established, amounts deemed to be uncollectible are written off against the allowance for estimated uncollectible reinsurance recoverables. The Company currently has no allowances for uncollectible reinsurance recoverables.
Ceded premiums written are recorded in accordance with applicable terms of the various reinsurance contracts and ceded premiums earned are charged against revenue over the period of the various reinsurance contracts. This also generally applies to reinstatement premiums paid to a reinsurer, which arise when contractually-specified ceded loss triggers have been breached. Ceded commissions reduce commissions, brokerage and other underwriting expenses and ceded losses incurred reduce net loss and loss adjustment expense incurred over the applicable periods of the various reinsurance contracts with third party reinsurers. If premiums or commissions are subject to adjustment (for example, retrospectively-rated or experience-rated), the estimated ultimate premium or commission is recognized over the period of the contract.
Amounts recoverable from reinsurers are estimated in a manner consistent with the claim liability associated with the reinsured business and consistent with the terms of the underlying reinsurance contract.
Direct Written Policy Fees
Policy fees represent a non-refundable application fee for insurance coverage, which are intended to reimburse us for the costs incurred to underwrite the policy. Policy fees are recognized on the effective date of the insurance policy.
Other Income
Other income represents primarily brokerage and commission related income from our personal automobile line of business and agency operations. The commission income from our personal automobile line of business is made up of ceded commission income and fee income for administration and claims handling services. The income associated with ceded commission and fee income is recognized over the respective terms of the contracts. The fees associated with the administrative services is recognized upfront upon policy inception. Commission income from our agency operations are recognized upfront upon policy inception.
- 51 -
Federated National Holding Company and Subsidiaries
Notes to Consolidated Financial Statements (continued)
December 31, 2016
Deferred Acquisition Costs
Deferred Acquisition Costs (“DAC”) represent those costs that are incremental and directly related to the successful acquisition of new or renewal of existing insurance contracts. The Company defers incremental costs that result directly from, and are essential to, the acquisition or renewal of an insurance contract. Such DAC generally include agent or broker commissions, referral fees, premium taxes, medical and inspection fees that would not have been incurred if the insurance contract had not been acquired or renewed. Each cost is analyzed to assess whether it is fully deferrable.
The Company also defers a portion of the employee total compensation and payroll-related fringe benefits directly related to time spent performing specific acquisition or renewal activities, including costs associated with the time spent on underwriting, policy issuance and processing, and sales force contract selling
The acquisition costs are deferred and amortized over the period in which the related premiums written are earned, generally 12 months. It is grouped consistent with the manner in which the insurance contracts are acquired, serviced and measured for 6 or profitability and is reviewed for recoverability based on the profitability of the underlying insurance contracts. Investment income is anticipated in assessing the recoverability of DAC. The Company assesses the recoverability of DAC on an annual basis or more frequently if circumstances indicate impairment may have occurred.
Property and Equipment
Property and equipment is stated at cost, net of accumulated depreciation and amortization. Depreciation is calculated using a straight-line method over the estimated useful lives, ranging from 3 to 15 years. Repairs and maintenance are charged to expense as incurred.
The Company accounts for internal-use software development costs in accordance with accounting guidelines which state that software costs, including internal payroll costs, incurred in connection with the development or acquisition of software for internal use is charged to expense as incurred until the project enters the application development phase. Costs incurred in the application development phase are capitalized and are depreciated using the straight-line method over an estimated useful life of 5 years, beginning when the software is ready for use.
Losses and Loss Adjustment Expenses (“LAE”)
The reserves for loss and loss adjustment expense (“LAE”) represent management’s best estimate of the ultimate cost of all reported and unreported losses incurred through the balance sheet date. Such liabilities are determined based upon our assessment of claims pending and the development of prior years’ loss liability. These amounts include liabilities based upon individual case estimates for reported losses and LAE’s and estimates of such amounts that are incurred but not yet reported (“IBNR”). Changes in the estimated liability are charged or credited to operations as the losses and LAE’s are settled.
The estimates of the liability for loss and LAE reserves are subject to the effect of trends in claims severity and frequency and are continually reviewed. As part of this process, we review historical data and consider various factors, including known and anticipated legal developments, inflation and economic conditions. As experience develops and other data become available, these estimates are revised, as required, resulting in increases or decreases to the existing liability for loss and loss adjustment expense reserves. Adjustments are reflected in results of operations in the period in which they are made and the liabilities may deviate substantially from prior estimates.
Income Taxes
Income taxes are accounted for under the asset and liability method. Deferred tax assets and liabilities are recognized for the estimated future tax consequences attributable to differences between the financial statement carrying amounts of existing assets and liabilities and their respective tax bases, and operating loss, capital loss and tax-credit carryforwards. Deferred tax assets and liabilities are measured using enacted tax rates expected to apply to taxable income in the years in which those temporary differences are expected to be recovered or settled. The effect on deferred tax assets and liabilities of a change in tax rates is recognized in income or expense in the period that includes the enactment date.
Share-based Compensation
The Company accounts for share-based compensation based on the estimated grant date fair value. The Company grants awards with service only conditions and generally amortizes them on a straight-line over the requisite service period of the award, which is the
- 52 -
Federated National Holding Company and Subsidiaries
Notes to Consolidated Financial Statements (continued)
December 31, 2016
vesting term. The fair value of the restricted stock grants is determined based on the closing market price on the date of grant. Non-employee directors are treated as employees for accounting purposes.
Basic and Diluted Net Income per Share
Basic net income per share is computed by dividing net (loss) income available to common shareholders by the weighted average number of common shares, while diluted net income per share is computed by dividing net income available to common shareholders by the weighted average number of such common shares and dilutive share equivalents result from the assumed exercise of employee stock options and vesting of restricted common stock and are calculated using the treasury stock method.
Reclassifications
Certain amounts in prior year’s consolidated financial statements have been reclassified to conform to the 2016 presentation. These reclassifications had no effect on the reported results of operations, financial condition, and cash flows. In the current period, the Company concluded it was appropriate to present reinsurance assets and reinsurance payables separately on the consolidated balance sheets and statements of cash flows. The Company believes this reclassification provide greater clarity and insight into the consolidated financial statements for the periods presented.
Adopted Accounting Pronouncements
In February 2015, the Financial Accounting Standards Board (“FASB”) issued Accounting Standard Update (“ASU”) 2015-02, Consolidation (Topic 810): Amendments to the Consolidation Analysis (“ASU 2015-02”). ASU 2015-02 amended the consolidation guidance by modifying the evaluation criteria for whether limited partnerships and similar legal entities are variable interest entities or voting interest entities, eliminating the presumption that a general partner should consolidate a limited partnership, and affecting the consolidation analysis of reporting entities that are involved with variable interest entities. We adopted the provisions of ASU 2015-02 effective January 1, 2016 and re-evaluated all legal entity investments under the revised consolidation model. The adoption of ASU 2015-02 did not have any impact on our consolidated financial statements.
In April 2015, the FASB issued ASU 2015-03, Interest-Imputation of Interest. ASU 2015-03 reduces the complexity of disclosing debt issuance costs and debt discount and premium on the balance sheet by requiring that debt issuance costs related to a recognized debt liability be presented in the balance sheet as a direct deduction from the carrying amount of the debt liability, consistent with debt discounts. The Company adopted this ASU retrospectively as of January 1, 2016. Other assets and debt from consolidated variable interest entity have been reclassified to be consistent with the adoption of this standard, which resulted in a reduction of $0.1 million each. There were no changes to shareholders’ equity as a result of this adoption. There were no other impacts on the Company’s consolidated financial statements.
In May 2015, the FASB issued ASU 2015-09, Financial Services – Insurance (Topic 944): Disclosures about Short-Duration-Contracts. The amendments in this ASU apply to all insurance entities that issue short-duration contracts as defined in Topic 944, Financial Services—Insurance. The amendments require insurance entities to disclose for annual reporting periods information on the liability for unpaid claims and claim adjustment expenses. The amendments in this ASU are effective for annual periods beginning after December 15, 2015, and interim periods within annual periods beginning after December 15, 2016. The disclosure requirements of this guidance were adopted; see Note 6 Loss and Loss Adjustment Expense Reserves for further details.
Recent Accounting Pronouncements
In May 2014, the FASB issued ASU 2014-09, Revenue from Contracts with Customers (“ASU 2014-09”). ASU 2014-09 requires an entity to recognize the amount of revenue to which it expects to be entitled for the transfer of promised goods or services to customers. This authoritative guidance replaces all general and most industry specific revenue recognition guidance (excluding insurance) currently prescribed by U.S. GAAP. The core principle is that an entity recognizes revenue to reflect the transfer of a promised good or service to customers in an amount that reflects that consideration to which the entity expects to be entitled in exchange for that good or service. This guidance also provides clarification on when an entity is a principal or an agent in a transaction. The guidance may be applied using one of the two following methods: (1) retrospectively to each prior reporting periods presented, or (2) retrospectively with the cumulative effect of initially applying the standard recognized at the date of initial application. In addition, during 2016 the FASB issued ASU 2016-08, ASU 2016-10, and ASU 2016-12, all of which clarify certain implementation guidance within ASU 2014-09. We will adopt this accounting standard update effective January 1, 2018. While we are currently evaluating the method of adoption and the impact of the provisions of this accounting standard update, only a portion of our revenues are impacted by this guidance because the guidance does not apply to revenue on contracts accounted for under the financial instruments or insurance contracts standards. Our
- 53 -
Federated National Holding Company and Subsidiaries
Notes to Consolidated Financial Statements (continued)
December 31, 2016
evaluation process includes, but is not limited to, identifying contracts within the scope of the guidance, reviewing and documenting our accounting for these contracts, and identifying and determining the accounting for any related contract costs.
In January 2016, the FASB issued ASU 2016-01, Recognition and Measurement of Financial Assets and Financial Liabilities, which addresses certain aspects of recognition, measurement, presentation, and disclosure of financial instruments. Most notably, this new guidance requires equity investments (except those accounted for under the equity method of accounting or those that result in consolidation of the investee) to be measured at fair value with changes in fair value recognized in net income. This new guidance is effective for annual reporting periods beginning after December 15, 2017. We are currently evaluating the impact the adoption of this standard would have on the Company’s consolidated financial statements.
In February 2016, the FASB issued ASU 2016-02, Leases (Topic 842) (“ASU 2016-02”). Upon the effective date, ASU 2016-02 will supersede the current lease guidance in Topic 840, Leases. Under the new guidance, lessees will be required to recognize for all leases, with the exception of short-term leases, a lease liability, which is a lessee’s obligation to make lease payments arising from a lease, measured on a discounted basis. Concurrently, lessees will be required to recognize a right-of-use asset, which is an asset that represents the lessee’s right to use, or control the use of, a specified asset for the lease term. ASU 2016-02 is effective for interim and annual reporting periods beginning after December 15, 2018, with early adoption permitted. The guidance is required to be applied using a modified retrospective transition approach for leases existing at, or entered into after, the beginning of the earliest comparative periods presented in the financial statements. This guidance will require us to add our operating leases to the balance sheet. We are currently evaluating other impacts this guidance will have on our consolidated financial statements.
In March 2016, the FASB issued ASU 2016-09, Compensation – Stock Compensation (Topic 718): Improvements to Employee Share-Based Payment Accounting (“ASU 2016-09”), which is intended to simplify several aspects of the accounting for share-based payment transactions, including the income tax consequences, classification of awards as either equity or liabilities, and classification on the statement of cash flows. ASU 2016-09 is effective for annual periods beginning after December 15, 2016, and interim periods therein. Early application is permitted. The guidance will be adopted on a prospective basis as indicated by the guidance for each area of change and will not have a material impact on our consolidated financial statements.
In June 2016, the FASB issued ASU 2016-13, Financial Instruments- Credit Losses (Topic 326): Measurement of Credit Losses on Financial Instruments (“ASU 2016-13”) which significantly changes the measurement of credit losses for most financial assets and certain other instruments that are not measured at fair value through net income. ASU 2016-13 will require entities to record allowances for available-for-sale debt securities rather than reduce the carrying amount, as currently performed under the other-than-temporary impairment model. Additionally, the standard will require enhanced disclosures for financial assets measured at amortized cost and available-for-sale debt securities to help the financial statement users better understand significant judgments used in estimating credit losses, as well as the credit quality and underwriting standards of an entity’s portfolio. ASU 2016-13 is effective for interim and annual reporting periods beginning after December 15, 2019, with early adoption permitted. We are currently evaluating the effects the adoption of ASU 2016-13 will have on the Company’s consolidated financial statements.
In August 2016, the FASB issued ASU 2016-15, Statement of Cash Flows (Topic 230), Classification of Certain Cash Receipts and Cash Payments (“ASU 2016-15”). ASU 2016-15 provides guidance on the following eight specific cash flow classification issues: (1) debt prepayment or debt extinguishment costs; (2) settlement of zero-coupon debt instruments or other debt instruments with coupon interest rates that are insignificant in relation to the effective interest rate of the borrowing; (3) contingent consideration payments made after a business combination; (4) proceeds from the settlement of insurance claims; (5) proceeds from the settlement of corporate-owned life insurance policies, including bank-owned life insurance policies; (6) distributions received from equity method investees; (7) beneficial interests in securitization transactions; and (8) separately identifiable cash flows and application of the predominance principle. Current GAAP does not include specific guidance on these eight cash flow classification issues. The amendments of this ASU are effective for reporting periods beginning after December 15, 2017, with early adoption permitted. The Company is evaluating the effect that ASU 2015-16 will have on its consolidated financial statements and related disclosures.
3. FAIR VALUE
Fair value measurements are generally based upon observable and unobservable inputs. Observable inputs are based on market data from independent sources, while unobservable inputs reflect the Company’s view of market assumptions in the absence of observable market information. All assets and liabilities that are carried at fair value are classified and disclosed in one of the following categories:
Level 1 — Quoted prices (unadjusted) in active markets for identical assets or liabilities. An active market is defined as a market where transactions for the financial statement occur with sufficient frequency and volume to provide pricing information on an ongoing basis.
- 54 -
Federated National Holding Company and Subsidiaries
Notes to Consolidated Financial Statements (continued)
December 31, 2016
Level 2 — Quoted market prices for similar assets or liabilities and valuations, using models or other valuation techniques that use observable market data. All significant inputs are observable, or derived from observable information in the marketplace, or are supported by observable levels at which transactions are executed in the market place.
Level 3 — Instruments that use non-binding broker quotes or model driven valuations that do not have observable market data or those that are estimated based on an ownership interest to which a proportionate share of net assets is attributed. Currently, the Company has no level 3 investments.
The Company’s financial instruments measured at fair value and the level of the fair value hierarchy of inputs used were as follows:
|
|
||||||||||||
|
|
December 31, 2016 |
|||||||||||
|
|
Level 1 |
Level 2 |
Level 3 |
Total |
||||||||
|
|
(in thousands) |
|||||||||||
|
Debt securities: |
||||||||||||
|
United States government obligations and authorities |
$ |
36,560 |
$ |
25,645 |
$ |
— |
$ |
62,205 | ||||
|
Obligations of states and political subdivisions |
— |
151,183 |
— |
151,183 | ||||||||
|
Corporate |
— |
149,505 |
— |
149,505 | ||||||||
|
International |
— |
11,863 |
— |
11,863 | ||||||||
|
|
36,560 | 338,196 |
— |
374,756 | ||||||||
|
|
||||||||||||
|
Equity securities |
28,960 | 415 |
— |
29,375 | ||||||||
|
|
||||||||||||
|
Total investments |
$ |
65,520 |
$ |
338,611 |
$ |
— |
$ |
404,131 | ||||
|
|
||||||||||||
|
|
December 31, 2015 |
|||||||||||
|
|
Level 1 |
Level 2 |
Level 3 |
Total |
||||||||
|
|
(in thousands) |
|||||||||||
|
Debt securities: |
||||||||||||
|
United States government obligations and authorities |
$ |
34,733 |
$ |
26,820 |
$ |
— |
$ |
61,553 | ||||
|
Obligations of states and political subdivisions |
— |
110,702 |
— |
110,702 | ||||||||
|
Corporate |
— |
154,620 |
— |
154,620 | ||||||||
|
International |
— |
12,303 |
— |
12,303 | ||||||||
|
|
34,733 | 304,445 |
— |
339,178 | ||||||||
|
|
||||||||||||
|
Equity securities |
38,012 | 522 |
— |
38,534 | ||||||||
|
|
||||||||||||
|
Total investments |
$ |
72,745 |
$ |
304,967 |
$ |
— |
$ |
377,712 | ||||
A third party nationally recognized pricing service provides the fair value of securities in Level 2. A summary of the significant valuation techniques and market inputs for each class of security is as follows:
United States government obligations and authorities: In determining the fair value for U.S. Government securities we use the market approach. The primary inputs to the valuation include reported trades, dealer quotes for identical or similar assets in markets that are not active, benchmark yields, credit spreads, reference data and industry and economic events.
Obligations of states and political subdivisions: In determining the fair value for state and municipal securities we use the market approach. The primary inputs to the valuation include reported trades, dealer quotes for identical or similar assets in markets that are not active, benchmark yields, credit spreads, reference data and industry and economic events.
Corporate and International: In determining the fair value for corporate securities we use the market approach. The primary inputs to the valuation include reported trades, dealer quotes for identical or similar assets in markets that are not active, benchmark yields, credit
- 55 -
Federated National Holding Company and Subsidiaries
Notes to Consolidated Financial Statements (continued)
December 31, 2016
spreads (for investment grade securities), observations of equity and credit default swap curves (for high-yield corporates), reference data and industry and economic events.
We review the third party pricing methodologies quarterly and test for significant differences between the market price used to value the security and recent sales activity.
4. INVESTMENTS
Unrealized Gains and Losses
The amortized cost and the fair value of debt and equity securities as of December 31, 2016 and 2015 are summarized as follows:
|
|
||||||||||||
|
|
Amortized |
Gross |
Gross |
|||||||||
|
|
Cost |
Unrealized |
Unrealized |
|||||||||
|
|
or Cost |
Gains |
Losses |
Fair Value |
||||||||
|
|
(in thousands) |
|||||||||||
|
December 31, 2016 |
||||||||||||
|
Debt securities - available-for-sale: |
||||||||||||
|
United States government obligations and authorities |
$ |
62,881 |
$ |
177 |
$ |
853 |
$ |
62,205 | ||||
|
Obligations of states and political subdivisions |
152,823 | 427 | 2,067 | 151,183 | ||||||||
|
Corporate |
149,053 | 1,347 | 895 | 149,505 | ||||||||
|
International |
11,887 | 95 | 119 | 11,863 | ||||||||
|
|
376,644 | 2,046 | 3,934 | 374,756 | ||||||||
|
|
||||||||||||
|
Debt securities - held-to-maturity: |
||||||||||||
|
United States government obligations and authorities |
4,163 | 22 | 118 | 4,067 | ||||||||
|
Corporate |
1,317 | 20 | 2 | 1,335 | ||||||||
|
International |
71 |
— |
— |
71 | ||||||||
|
|
5,551 | 42 | 120 | 5,473 | ||||||||
|
Equity securities |
24,163 | 5,500 | 288 | 29,375 | ||||||||
|
Total investments |
$ |
406,358 |
$ |
7,588 |
$ |
4,342 |
$ |
409,604 | ||||
|
|
||||||||||||
|
|
Amortized |
Gross |
Gross |
|||||||||
|
|
Cost |
Unrealized |
Unrealized |
|||||||||
|
|
or Cost |
Gains |
Losses |
Fair Value |
||||||||
|
|
(in thousands) |
|||||||||||
|
December 31, 2015 |
||||||||||||
|
Debt securities - available-for-sale: |
||||||||||||
|
United States government obligations and authorities |
$ |
61,384 |
$ |
489 |
$ |
320 |
$ |
61,553 | ||||
|
Obligations of states and political subdivisions |
109,152 | 1,590 | 40 | 110,702 | ||||||||
|
Corporate |
154,957 | 1,153 | 1,490 | 154,620 | ||||||||
|
International |
12,528 | 18 | 243 | 12,303 | ||||||||
|
|
338,021 | 3,250 | 2,093 | 339,178 | ||||||||
|
|
||||||||||||
|
Debt securities - held-to-maturity: |
||||||||||||
|
United States government obligations and authorities |
4,275 | 30 | 204 | 4,101 | ||||||||
|
Corporate |
2,253 | 14 | 20 | 2,247 | ||||||||
|
International |
91 |
— |
— |
91 | ||||||||
|
|
6,619 | 44 | 224 | 6,439 | ||||||||
|
Equity securities |
33,581 | 6,809 | 1,856 | 38,534 | ||||||||
|
Total investments |
$ |
378,221 |
$ |
10,103 |
$ |
4,173 |
$ |
384,151 | ||||
- 56 -
Federated National Holding Company and Subsidiaries
Notes to Consolidated Financial Statements (continued)
December 31, 2016
Net Realized Gains and Losses
The Company calculates the gain or loss realized on the sale of investments by comparing the sales price (fair value) to the cost or amortized cost of the security sold. Net realized gains and losses on investments are determined in accordance with the specific identification method. The following tables detail the Company’s net realized gains (losses) by major investment category for the years ended December 31, 2016, 2015 and 2014:
|
|
|||||||||
|
|
Year Ended |
||||||||
|
|
December 31, |
||||||||
|
|
2016 |
2015 |
2014 |
||||||
|
|
(in thousands) |
||||||||
|
Gross realized gains: |
|||||||||
|
Debt securities |
$ |
3,208 |
$ |
1,272 |
$ |
725 | |||
|
Equity securities |
4,264 | 4,959 | 4,489 | ||||||
|
Total gross realized gains |
7,472 | 6,231 | 5,214 | ||||||
|
|
|||||||||
|
Gross realized losses: |
|||||||||
|
Debt securities |
(1,614) | (805) | (147) | ||||||
|
Equity securities |
(2,813) | (1,810) | (641) | ||||||
|
Total gross realized losses |
(4,427) | (2,615) | (788) | ||||||
|
Net realized gains on investments |
$ |
3,045 |
$ |
3,616 |
$ |
4,426 | |||
During the years ended December 31, 2016, 2015 and 2014, the proceeds from sales of investment securities were $229.3 million, $157.2 million and $87.1 million, respectively.
Contractual Maturity
The amortized cost and estimated fair value of debt securities as of December 31, 2016 and 2015 by contractual maturity are shown below. Expected maturities will differ from contractual maturities because borrowers may have the right to call or prepay obligations with or without call or prepayment penalties.
|
|
||||||||||||
|
|
December 31, 2016 |
December 31, 2015 |
||||||||||
|
|
Amortized |
Amortized |
||||||||||
|
|
Cost |
Fair Value |
Cost |
Fair Value |
||||||||
|
Securities with maturity dates: |
(in thousands) |
|||||||||||
|
Debt securities, available-for-sale: |
||||||||||||
|
One year or less |
$ |
46,189 |
$ |
46,231 |
$ |
24,470 |
$ |
24,488 | ||||
|
Over one through five years |
177,982 | 177,899 | 170,797 | 171,113 | ||||||||
|
Over five through ten years |
150,557 | 148,783 | 142,728 | 143,545 | ||||||||
|
Over ten years |
1,916 | 1,843 | 26 | 32 | ||||||||
|
|
376,644 | 374,756 | 338,021 | 339,178 | ||||||||
|
Debt securities, held-to-maturity: |
||||||||||||
|
One year or less |
170 | 170 | 486 | 487 | ||||||||
|
Over one through five years |
1,719 | 1,750 | 1,899 | 1,915 | ||||||||
|
Over five through ten years |
3,662 | 3,553 | 4,234 | 4,037 | ||||||||
|
|
5,551 | 5,473 | 6,619 | 6,439 | ||||||||
|
Total |
$ |
382,195 |
$ |
380,229 |
$ |
344,640 |
$ |
345,617 | ||||
- 57 -
Federated National Holding Company and Subsidiaries
Notes to Consolidated Financial Statements (continued)
December 31, 2016
Net Investment Income
The following table summarizes the Company’s net investment income for years ended December 31, 2016, 2015 and 2014:
|
|
|||||||||
|
|
Year Ended |
||||||||
|
|
December 31, |
||||||||
|
|
2016 |
2015 |
2014 |
||||||
|
|
(in thousands) |
||||||||
|
Interest income |
$ |
7,920 |
$ |
6,638 |
$ |
4,832 | |||
|
Dividends income |
1,143 | 588 | 553 | ||||||
|
Net investment income |
$ |
9,063 |
$ |
7,226 |
$ |
5,385 | |||
Aging of Gross Unrealized Losses
As of December 31, 2016 and 2015, gross unrealized losses and related fair values for debt and equity securities, grouped by duration of time in a continuous unrealized loss position, were as follows:
|
|
|||||||||||||||||
|
|
Less than 12 months |
12 months or longer |
Total |
||||||||||||||
|
|
Gross |
Gross |
Gross |
||||||||||||||
|
|
Fair |
Unrealized |
Fair |
Unrealized |
Fair |
Unrealized |
|||||||||||
|
|
Value |
Losses |
Value |
Losses |
Value |
Losses |
|||||||||||
|
December 31, 2016 |
(in thousands) |
||||||||||||||||
|
Debt securities - available-for-sale: |
|||||||||||||||||
|
United States government obligations |
|||||||||||||||||
|
and authorities |
$ |
45,255 |
$ |
850 |
$ |
111 |
$ |
3 |
$ |
45,366 |
$ |
853 | |||||
|
Obligations of states and political subdivisions |
103,724 | 2,066 | 1,007 | 1 | 104,731 | 2,067 | |||||||||||
|
Corporate |
59,970 | 864 | 2,427 | 31 | 62,397 | 895 | |||||||||||
|
International |
5,925 | 119 | 5 |
- |
5,930 | 119 | |||||||||||
|
|
214,874 | 3,899 | 3,550 | 35 | 218,424 | 3,934 | |||||||||||
|
|
|||||||||||||||||
|
Equity securities |
4,701 | 253 | 434 | 35 | 5,135 | 288 | |||||||||||
|
|
|||||||||||||||||
|
Total investments |
$ |
219,575 |
$ |
4,152 |
$ |
3,984 |
$ |
70 |
$ |
223,559 |
$ |
4,222 | |||||
|
|
|||||||||||||||||
|
|
Less than 12 months |
12 months or longer |
Total |
||||||||||||||
|
|
Gross |
Gross |
Gross |
||||||||||||||
|
|
Fair |
Unrealized |
Fair |
Unrealized |
Fair |
Unrealized |
|||||||||||
|
|
Value |
Losses |
Value |
Losses |
Value |
Losses |
|||||||||||
|
December 31, 2015 |
(in thousands) |
||||||||||||||||
|
Debt securities - available-for-sale: |
|||||||||||||||||
|
United States government obligations |
|||||||||||||||||
|
and authorities |
$ |
30,464 |
$ |
303 |
$ |
659 |
$ |
17 |
$ |
31,123 |
$ |
320 | |||||
|
Obligations of states and political subdivisions |
16,652 | 40 |
— |
— |
16,652 | 40 | |||||||||||
|
Corporate |
87,176 | 1,420 | 3,590 | 70 | 90,766 | 1,490 | |||||||||||
|
International |
8,660 | 191 | 281 | 52 | 8,941 | 243 | |||||||||||
|
|
142,952 | 1,954 | 4,530 | 139 | 147,482 | 2,093 | |||||||||||
|
|
|||||||||||||||||
|
Equity securities |
11,790 | 1,850 | 84 | 6 | 11,874 | 1,856 | |||||||||||
|
|
|||||||||||||||||
|
Total investments |
$ |
154,742 |
$ |
3,804 |
$ |
4,614 |
$ |
145 |
$ |
159,356 |
$ |
3,949 | |||||
- 58 -
Federated National Holding Company and Subsidiaries
Notes to Consolidated Financial Statements (continued)
December 31, 2016
As of December 31, 2016, the Company held a total of 1,132 debt and equity securities that were in an unrealized loss position, of which 36 securities were in an unrealized loss position continuously for 12 months or more. As of December 31, 2015, the Company held a total of 676 debt and equity securities that were in an unrealized loss position, of which 22 securities were in an unrealized loss position continuously for 12 months or more. The unrealized losses associated with these securities consisted primarily of losses related to corporate securities.
The Company holds its equity securities and some of its debt securities as available-for-sale and as such, these securities are recorded at fair value. The Company continually monitors the difference between cost and the estimated fair value of its investments, which involves uncertainty as to whether declines in value are temporary in nature. If the decline of a particular investment is deemed temporary, the Company records the decline as an unrealized loss in shareholders’ equity. If the decline is deemed to be other than temporary, the Company will write the security’s cost-basis or amortized cost-basis down to the fair value of the investment and recognizes an other than temporary impairment (“OTTI”) loss in our consolidated statement of operations. Additionally, any portion of such decline related to debt securities that is believed to arise from factors other than credit will be recorded as a component of other comprehensive income rather than charged against income.
The Company’s assessment of equity securities initially involves an evaluation of all securities that are in an unrealized loss position, regardless of the duration or severity of the loss, as of the applicable balance sheet date. Such initial review consists primarily of assessing whether: (i) there has been a negative credit or news event with respect to the issuer that could indicate the existence of an OTTI; and (ii) the Company has the ability and intent to hold an equity security for a period of time sufficient to allow for an anticipated recovery (generally considered to be one year from the balance sheet date).
To the extent that an equity security in an unrealized loss position is not impaired based on the initial review described above, the Company then evaluates such equity security by considering qualitative and quantitative factors. These factors include but are not limited to facts and circumstances specific to individual securities, asset classes, the financial condition of the issuer, changes in dividend payment, the length of time fair value had been less than cost, the severity of the decline in fair value below cost, industry outlook and our ability and intent to hold each position until its forecasted recovery.
Debt securities classified as available-for-sale in a gross unrealized loss position for twelve months or longer are primarily comprised of non-credit losses on investment grade securities where management does not intend to sell, and it is not more than likely than not that the Company will not be required to sell the security before recovery. The Company has analyzed these securities and has determined that they are not other than temporarily impaired.
During the years ended December 31, 2016, 2015 and 2014, OTTI losses were $0.3 million, $0.4 million and $0, respectively. The determination that unrealized losses on such securities were other-than-temporary was primarily based on the duration of the decline in the fair value of such securities relative to their cost as of the balance sheet date.
Statutory Deposits
As of December 31, 2016, investments with fair values of approximately $7.9 million, the majority of which were debt securities, were deposited with governmental authorities and into custodial bank accounts as required by law or contractual obligations.
5. REINSURANCE
Overview
Reinsurance is used to mitigate the exposure to losses, manage capacity and protect capital resources. The Company reinsures (cedes) a portion of written premiums on an excess of loss or a quota share basis in order to limit our loss exposure. To the extent that reinsuring companies are unable to meet their obligations assumed under these reinsurance agreements, we remain primarily liable to our policyholders.
We are selective in choosing reinsurers and consider numerous factors, the most important of which are the financial stability of the reinsurer or capital specifically pledged to uphold the contract, its history of responding to claims and its overall reputation. In an effort to minimize our exposure to the insolvency of a reinsurer, we evaluate the acceptability and review the financial condition of the reinsurer at least annually with the assistance of our reinsurance broker.
- 59 -
Federated National Holding Company and Subsidiaries
Notes to Consolidated Financial Statements (continued)
December 31, 2016
Significant Reinsurance Contracts
FNIC and MNIC operate primarily by underwriting and accepting risks for their direct account on a gross basis and reinsuring a portion of the exposure on either an individual risk or an aggregate basis to the extent those exceed the desired retention level. We continually evaluate the relative attractiveness of different forms of reinsurance contracts and different markets that may be used to achieve our risk and profitability objectives. All of our reinsurance contracts do not relieve FNIC or MNIC from their direct obligations to the insured.
FNIC’s 2015-2016 catastrophe reinsurance program, which ran either from June 1 to May 31 or from July 1 to June 30, consists of the Florida Hurricane Catastrophe Fund (“FHCF”), excess of loss treaties placed with the private market and a 40% property quota-share program. The property quota-share reinsurance is a form of proportional reinsurance that provides coverage for the homeowners’ property lines for wind related catastrophes in Florida. The FHCF treaty affords coverage for losses sustained in Florida and represents only a portion of the reinsurance coverage in Florida.
The excess of loss and FHCF treaties, which became effective on July 1, 2015 and June 1, 2015, respectively, insure for approximately $1.82 billion of aggregate catastrophic losses and loss adjustment expenses (“LAE”) with a maximum single event coverage totaling approximately $1.26 billion, with the Company retaining the first $12.9 million in Florida and $5.0 million in Louisiana, Alabama and South Carolina for losses and LAE from each event. Ceded premiums in connection with this program totaled approximately $149.7 million.
FNIC’s 2016-2017 reinsurance programs, costing approximately $179.5 million, include approximately $125.7 million for the private reinsurance for Federated National’s Florida exposure, including prepaid automatic premium reinstatement protection on all layers, along with approximately $53.8 million payable to the FHCF. The combination of private and FHCF reinsurance treaties will afford Federated National with approximately $2.22 billion of aggregate coverage with a maximum single event coverage totaling approximately $1.58 billion, exclusive of retentions. FNIC maintained its FHCF participation at 75% for the 2016 hurricane season. FNIC’s single event pre-tax retention for a catastrophic event in Florida is $18.45 million. In addition, FNIC purchases separate underlying reinsurance layers in Louisiana, Alabama, and South Carolina to cover losses and LAE outside of Florida for each catastrophic event from $8.0 million to $18.45 million. Depending on the characteristics of the catastrophic event, and the states involved, FNIC’s single event pre-tax retention could be as low as $8.0 million. The maximum pre-tax retention of $18.45 million for Florida represents 7.76% of the Company’s shareholders’ equity as of December 31, 2016.
Additionally, the Company’s private market excess of loss treaties became effective July 1, 2016 and all private layers have prepaid automatic reinstatement protection, which affords us additional coverage against multiple catastrophic events in the same hurricane season. The Company obtained multiple year protection for a portion of its program; as a result, some of the coverage will expire on June 30, 2017, and a portion of the coverage will remain in-force one additional treaty year until June 30, 2018. These private market excess of loss treaties structure coverage into layers, with a cascading feature such that substantially all private layers attach after $18.45 million in losses for FNIC’s Florida exposure. If the aggregate limit of the preceding layer is exhausted, the next layer drops down (cascades) in its place. Additionally, any unused layer protection drops down for subsequent events until exhausted.
MNIC’s 2016-2017 catastrophe reinsurance program, which runs from either June 1 to May 31 or June 1 to June 30 (13 month period), consists of the FHCF and private market excess of loss treaties. All private layers have prepaid automatic reinstatement protection, which affords MNIC additional coverage, and have a cascading feature such that substantially all layers attach at $3.4 million for MNIC's Florida exposure.
The Company’s property quota share treaties, which are included in the reinsurance program, run for a two-year period from July 1 to July 1 of the following year. The property quota-share treaties consist of two different treaties, one for 30% which became effective July 1, 2014, and the other for 10% which became effective July 1, 2015. The combined treaties provided up to a 40% quota-share reinsurance on the first $100 million of covered losses for the homeowners’ property insurance program in Florida. The treaties are accounted for as retrospectively rated contracts whereby the estimated ultimate premium or commission is recognized over the period of the contracts.
On July 1, 2016, the 30% property quota-share treaty expired on a cut-off basis, which means as of that date the Company will retain 30% of its unearned premiums and losses. The reinsurers will remain liable for 30% of the paid losses occurring during the term of the treaty, until the treaty is commuted.
- 60 -
Federated National Holding Company and Subsidiaries
Notes to Consolidated Financial Statements (continued)
December 31, 2016
The Company’s private passenger automobile quota share treaties are typically one-year programs which become effective at different points in the year and cover auto policies across several states. These automobile quota share treaties cede 75% to 90% of all written premiums entered into by the Company.
Certain reinsurance agreements require FNIC to secure the credit, regulatory and business risk. Fully funded trust agreements securing these risks totaled $2.6 million as of December 31, 2016 and $3.5 million as of December 31, 2015.
Reinsurance Recoverables
Amounts recoverable from reinsurers are recognized in a manner consistent with the claims liabilities associated with the reinsurance placement and presented on the consolidated balance sheet as reinsurance recoverables. The following reinsurance recoverable is reflected in the consolidated balance sheets as of the dates presented as follows:
|
|
||||||
|
|
December 31, |
|||||
|
|
2016 |
2015 |
||||
|
|
(in thousands) |
|||||
|
Reinsurance recoverable on paid losses |
$ |
7,451 |
$ |
5,218 | ||
|
Reinsurance recoverable on unpaid losses |
41,079 | 7,496 | ||||
|
Reinsurance recoverable, net |
$ |
48,530 |
$ |
12,714 | ||
Premiums Written and Earned
The following table presents premiums written and earned for the years ended December 31, 2016, 2015, and 2014:
|
|
|||||||||
|
|
Year Ended |
||||||||
|
|
December 31, |
||||||||
|
|
2016 |
2015 |
2014 |
||||||
|
|
(in thousands) |
||||||||
|
Net premiums written: |
|||||||||
|
Direct |
$ |
605,485 |
$ |
493,770 |
$ |
377,156 | |||
|
Ceded |
(285,986) | (268,516) | (201,998) | ||||||
|
|
$ |
319,499 |
$ |
225,254 |
$ |
175,158 | |||
|
Net premiums earned: |
|||||||||
|
Direct |
$ |
565,423 |
$ |
432,234 |
$ |
313,075 | |||
|
Ceded |
(305,551) | (222,214) | (142,170) | ||||||
|
|
$ |
259,872 |
$ |
210,020 |
$ |
170,905 | |||
- 61 -
Federated National Holding Company and Subsidiaries
Notes to Consolidated Financial Statements (continued)
December 31, 2016
6. LOSS AND LOSS ADJUSTMENT EXPENSE RESERVES
The liability for loss and LAE reserves is determined on an individual-case basis for all claims reported. The liability also includes amounts for unallocated expenses, anticipated future claim development and incurred but not yet reported (“IBNR”).
Activity in the liability for loss and LAE reserves is summarized as follows:
|
|
|||||||||
|
|
Year Ended December 31, |
||||||||
|
|
2016 |
2015 |
2014 |
||||||
|
|
(in thousands) |
||||||||
|
Gross reserves, beginning of period |
$ |
97,340 |
$ |
78,330 |
$ |
61,016 | |||
|
Less: reinsurance recoverable (1) |
(7,496) | (10,394) | (2,313) | ||||||
|
Net reserves, beginning of period |
89,844 | 67,936 | 58,703 | ||||||
|
|
|||||||||
|
Incurred loss, net of reinsurance, related to: |
|||||||||
|
Current year |
174,795 | 113,819 | 79,932 | ||||||
|
Prior years |
12,546 | (9,466) | 1,104 | ||||||
|
Total incurred loss and LAE, net of reinsurance |
187,341 | 104,353 | 81,036 | ||||||
|
|
|||||||||
|
Paid loss, net of reinsurance, related to: |
|||||||||
|
Current year |
113,196 | 49,531 | 40,680 | ||||||
|
Prior years |
56,958 | 32,914 | 31,123 | ||||||
|
Total paid loss and LAE, net of reinsurance |
160,154 | 82,445 | 71,803 | ||||||
|
|
|||||||||
|
Net reserves, end of period |
117,031 | 89,844 | 67,936 | ||||||
|
Plus: reinsurance recoverable (1) |
41,079 | 7,496 | 10,394 | ||||||
|
Gross reserves, end of period |
$ |
158,110 |
$ |
97,340 |
$ |
78,330 | |||
|
(1) |
Reinsurance recoverable in this table includes only ceded loss and LAE reserves. |
The establishment of loss reserves is an inherently uncertain process and changes in loss reserve estimates are expected as such estimates are subject to the outcome of future events. The factors influencing changes in claim costs are often difficult to isolate or quantify and developments in paid and incurred losses from historical trends are frequently subject to multiple interpretations. Changes in estimates, or differences between estimates and amounts ultimately paid, are reflected in the operating results of the period during which such adjustments are made.
During the year ended December 31, 2016, the Company experienced unfavorable loss and LAE reserve development on prior year accident years primarily in its all other peril homeowners’ coverage in Florida. The deficiency primarily relates to reserve development on prior year accident years and was related to the all other peril homeowners’ coverage in the state of Florida. The deficiency primarily relates to higher severity above the expected development factor anticipated at December 31, 2015 which was driven by the impact from assignment of benefits and other related adjusting expenses.
During the year ended December 31, 2015, the Company experienced a redundancy on prior year accident years primarily a result of continued favorable loss experience (mostly caused by decreased severity in reported claims) in the Company’s all other peril homeowners’ coverage caused in part by the absence of severe weather in Florida. Specifically, we have experienced better severity than expected on the 2014 and 2013 accident years.
- 62 -
Federated National Holding Company and Subsidiaries
Notes to Consolidated Financial Statements (continued)
December 31, 2016
The following tables provide incurred losses and allocated loss adjustment expenses (“ALAE”) as well as cumulative paid claims and ALAE, net of reinsurance, for the prior ten accident years for our largest lines of business, homeowners’’. In addition, as of the most recent reporting period, the total of IBNR reserves plus expected development on reported claims and the cumulative number of reported claims are presented (in thousands, except severity). The information about incurred and paid claims development for the years ended December 31, 2007 to December 31, 2015 is presented as supplementary information.
|
|
||||||||||||||
|
|
IBNR & expected |
Cumulative |
||||||||||||
|
|
Incurred losses and ALAE, net of reinsurance |
development on |
number of |
|||||||||||
|
|
For the years ended December 31, |
reported claims |
reported claims (1) |
Severity (2) |
||||||||||
|
|
(unaudited) |
|||||||||||||
|
Accident Year |
2007 |
2008 |
2009 |
2010 |
2011 |
2012 |
2013 |
2014 |
2015 |
2016 |
2016 |
2016 |
2016 |
|
|
2007 |
19,410 | 18,293 | 17,319 | 17,544 | 17,494 | 17,761 | 17,912 | 17,715 | 17,553 | 17,559 | 6 | 1,883 | 9,325 | |
|
2008 |
18,305 | 15,784 | 15,811 | 15,977 | 15,659 | 16,021 | 15,661 | 15,604 | 15,609 | 4 | 1,705 | 9,155 | ||
|
2009 |
26,228 | 25,618 | 25,955 | 26,482 | 27,015 | 27,041 | 27,119 | 27,163 | 101 | 2,323 | 11,693 | |||
|
2010 |
24,825 | 25,056 | 26,151 | 27,895 | 28,968 | 29,407 | 29,945 | 34 | 2,348 | 12,753 | ||||
|
2011 |
20,492 | 21,344 | 23,007 | 23,932 | 24,582 | 25,957 | 40 | 2,344 | 11,074 | |||||
|
2012 |
23,032 | 23,301 | 24,186 | 24,468 | 25,889 | 326 | 2,579 | 10,038 | ||||||
|
2013 |
43,807 | 42,021 | 35,834 | 35,859 | 216 | 3,209 | 11,175 | |||||||
|
2014 |
64,312 | 63,300 | 61,770 | 2,222 | 5,679 | 10,877 | ||||||||
|
2015 |
99,286 | 92,159 | 8,097 | 11,196 | 8,231 | |||||||||
|
2016 |
168,875 | 48,663 | 20,923 | 8,071 | ||||||||||
|
|
Total |
$500,785 | ||||||||||||
|
|
Cumulative paid losses and ALAE, net of reinsurance |
|||||||||
|
|
For the years ended December 31, |
|||||||||
|
|
(unaudited) |
|||||||||
|
Accident Year |
2007 |
2008 |
2009 |
2010 |
2011 |
2012 |
2013 |
2014 |
2015 |
2016 |
|
2007 |
11,358 | 15,352 | 16,160 | 16,783 | 17,027 | 17,291 | 17,429 | 17,443 | 17,509 | 17,519 |
|
2008 |
9,477 | 13,832 | 14,689 | 15,190 | 15,308 | 15,445 | 15,595 | 15,583 | 15,587 | |
|
2009 |
15,047 | 23,095 | 24,657 | 26,007 | 26,462 | 26,831 | 26,927 | 26,982 | ||
|
2010 |
14,052 | 21,350 | 24,730 | 26,886 | 27,984 | 29,092 | 29,739 | |||
|
2011 |
11,119 | 19,250 | 21,323 | 22,723 | 24,047 | 25,580 | ||||
|
2012 |
13,693 | 20,728 | 23,120 | 23,923 | 25,186 | |||||
|
2013 |
19,986 | 31,606 | 33,867 | 35,123 | ||||||
|
2014 |
37,033 | 53,831 | 57,891 | |||||||
|
2015 |
52,190 | 76,169 | ||||||||
|
2016 |
101,532 | |||||||||
|
|
Total |
$414,308 | ||||||||
|
|
||||||||||
|
All outstanding liabilities for unpaid claims and LAE prior to 2007, net of reinsurance |
1,478 | |||||||||
|
Total outstanding liabilities for unpaid claims and LAE, net of reinsurance |
$ 87,955 |
|||||||||
|
(1) |
The cumulative number of reported claims is measured by individual claimant at a coverage level. |
|
(2) |
Calculated severity amounts by accident year are based on inception-to-date incurred less IBNR and expected development dollars on reported claims. Note the older accident years are more developed than recent accident years. |
- 63 -
Federated National Holding Company and Subsidiaries
Notes to Consolidated Financial Statements (continued)
December 31, 2016
The reconciliation of the net incurred and paid development tables to the liability for unpaid losses and LAE in the consolidated balance sheets is as follows:
|
|
|||||
|
|
|||||
|
|
As of December 31, 2016 |
||||
|
|
(in thousands) |
||||
|
Liabilities for unpaid losses and LAE: |
|||||
|
Homeowners |
$ 87,955 |
||||
|
Other lines |
28,915 | ||||
|
Total liabilities for unpaid losses and LAE, net of reinsurance |
116,870 | ||||
|
|
|||||
|
Reinsurance recoverables: |
|||||
|
Homeowners |
19,964 | ||||
|
Other lines |
21,115 | ||||
|
Total reinsurance recoverables |
41,079 | ||||
|
|
|||||
|
Unallocated loss adjustment expenses |
161 | ||||
|
Gross liability for unpaid losses and LAE |
$ 158,110 |
Other lines include our CGL and personal automobile lines of business. Management performed a quantitative and qualitative assessment and determined that neither line of business met the guidelines for disaggregation, above.
Management establishes a liability on an aggregate basis to provide for the estimated IBNR. The estimates of the liability for loss and LAE reserves are subject to the effect of trends in claims severity and frequency and are continually reviewed. As part of this process, we review historical data and consider various factors, including known and anticipated legal developments, inflation and economic conditions. As experience develops and other data become available, these estimates are revised, as required, resulting in increases or decreases to the existing liability for loss and LAE reserves. Adjustments are reflected in results of operations in the period in which they are made and the liabilities may deviate substantially from prior estimates.
Various actuarial methods are utilized to determine the reserves that are booked to our financial statements. Weightings of tests and methods at a detailed level may change from evaluation to evaluation based on a number of observations, measures and time elements. On an overall basis, changes to methods and/or assumptions underlying reserve estimations and selections as of December 31, 2016, were not considered material.
IBNR reserves are established for the quarter and year-end based on a quarterly reserve analysis by our actuarial staff. Various standard actuarial tests are applied to subsets of the business at a line of business and coverage basis. Included in the analyses are the following:
|
· |
Reported Loss Development Method: a reported loss development pattern is calculated based on historical loss development data, and this pattern is then used to project the latest evaluation of cumulative reported losses for each accident year or underwriting year, as appropriate, to ultimate levels; |
|
· |
Paid Development Method: a paid loss development pattern is calculated based on historical paid loss development data, and this pattern is then used to project the latest evaluation of cumulative paid losses for each accident year or underwriting year, as appropriate, to ultimate levels; |
|
· |
Expected Loss Ratio Method: expected loss ratios are applied to premiums earned, based on historical company experience, or historical insurance industry results when company experience is deemed not to be sufficient; and |
|
· |
Bornhuetter-Ferguson Method: the results from the Expected Loss Ratio Method are essentially blended with either the Reported Loss Development Method or the Paid Development Method. |
- 64 -
Federated National Holding Company and Subsidiaries
Notes to Consolidated Financial Statements (continued)
December 31, 2016
Supplementary Information on Historical Loss and LAE Duration (Unaudited)
The following table provides supplementary information about the average annual percentage payout of incurred losses and ALAE, net of reinsurance, as of December 31, 2016:
|
|
Average annual payout of losses and LAE, net of reinsurance |
|||||||||
|
|
(unaudited) |
|||||||||
|
|
Year 1 |
Year 2 |
Year 3 |
Year 4 |
Year 5 |
Year 6 |
Year 7 |
Year 8 |
Year 9 |
Year 10 |
|
Homeowners |
53.4% | 28.3% | 7.4% | 4.2% | 2.2% | 2.6% | 1.0% | 0.1% | 0.4% | 0.0% |
7. LONG-TERM DEBT
On March 17, 2015, MNHC, our consolidated VIE, issued a promissory note with a principal amount of $5.0 million bearing 6% annual interest, due March 17, 2021 with interest payable on an annual basis due March 17 each year. The debt was issued to TransRe and is being carried at the unpaid principal balance; any accrued and unpaid interest is recognized in other liabilities in the consolidated statement of operations. In addition, the company recorded $0.1 million of debt issuance costs related to the 6% promissory note.
8. INCOME TAXES
The provision for income tax expense for the years ended December 31, 2016, 2015 and 2014 is as follows:
|
|
|||||||||
|
|
Year Ended |
||||||||
|
|
December 31, |
||||||||
|
|
2016 |
2015 |
2014 |
||||||
|
|
(in thousands) |
||||||||
|
Federal: |
|||||||||
|
Current |
$ |
5,076 |
$ |
15,523 |
$ |
16,659 | |||
|
Deferred |
(2,771) | 6,118 | 1,059 | ||||||
|
Federal income tax expense |
2,305 | 21,641 | 17,718 | ||||||
|
State: |
|||||||||
|
Current |
674 | 2,489 | 2,204 | ||||||
|
Deferred |
(296) | 623 | 186 | ||||||
|
State income tax expense |
378 | 3,112 | 2,390 | ||||||
|
Total income tax expense |
$ |
2,683 |
$ |
24,753 |
$ |
20,108 | |||
The actual income tax expense differs from the “expected” income tax expense (computed by applying the combined applicable effective federal and state tax rates to income before income tax expense) as follows:
|
|
|||||||||
|
|
Year Ended |
||||||||
|
|
December 31, |
||||||||
|
|
2016 |
2015 |
2014 |
||||||
|
|
(in thousands) |
||||||||
|
Computed expected tax expense provision, at federal rate |
$ |
957 |
$ |
22,829 |
$ |
19,887 | |||
|
State tax, net of federal tax benefit |
85 | 2,291 | 1,696 | ||||||
|
Tax-exempt interest |
(571) | (445) | (312) | ||||||
|
Income subject to dividends-received deduction |
(219) | (109) | (136) | ||||||
|
Meals and entertainment |
130 |
- |
- |
||||||
|
Return to provision and rate changes |
145 | 119 | (1,027) | ||||||
|
Prior year deferred tax true-up |
2,163 |
- |
- |
||||||
|
Other |
(7) | 68 |
- |
||||||
|
Total income tax expense |
$ |
2,683 |
$ |
24,753 |
$ |
20,108 | |||
- 65 -
Federated National Holding Company and Subsidiaries
Notes to Consolidated Financial Statements (continued)
December 31, 2016
Income tax expense for the year ended December 31, 2016 was $2.7 million, which includes $2.2 million of additional tax expense related to a prior year adjustment impacting deferred taxes.
Deferred income taxes reflect the net tax effects of temporary differences between the carrying amounts of assets and liabilities for financial reporting purposes and the amounts used for income tax purposes. Significant components of our net deferred tax liability are as follows:
|
|
||||||
|
|
Year Ended December 31, |
|||||
|
|
2016 |
2015 |
||||
|
|
(in thousands) |
|||||
|
Deferred tax assets: |
||||||
|
Unearned premiums |
$ |
13,975 |
$ |
9,375 | ||
|
Unpaid losses and loss adjustment expenses |
1,612 | 1,175 | ||||
|
Accrued expenses |
692 | 694 | ||||
|
Net operating loss carryforwards |
7 | 140 | ||||
|
Share-based compensation |
582 | 606 | ||||
|
Other |
155 | 212 | ||||
|
Total |
17,023 | 12,202 | ||||
|
|
||||||
|
Deferred tax liabilities: |
||||||
|
Deferred acquisition costs |
(16,364) | (11,906) | ||||
|
Unrealized gains on investment securities |
(1,277) | (2,336) | ||||
|
Deferred revenue related to reinsurance |
- |
(3,395) | ||||
|
Depreciation and amortization |
(718) |
- |
||||
|
Other |
(97) | (192) | ||||
|
Total |
(18,456) | (17,829) | ||||
|
|
||||||
|
Net deferred tax liability |
$ |
(1,433) |
$ |
(5,627) | ||
The Company files a federal income tax return and various state and local tax returns. The Company’s consolidated federal and state income tax returns for 2013 - 2015 are open for review by the Internal Revenue Service (“IRS”) and other state taxing authorities.
As of December 31, 2016, 2015, and 2014, we have determined that there are no uncertain tax positions.
9. COMMITMENTS AND CONTINGENCIES
Legal Proceedings
In the ordinary course of conducting business, the Company is involved in various legal proceedings, specifically claims litigation. The company’s insurance subsidiaries participate in most of these proceedings by either defending third-party claims brought against insureds or litigating first-party coverage claims. The Company accounts for such activity through the establishment of loss and loss adjustment expense reserves. We believe that the ultimate liability, if any, with respect to such ordinary-course claims litigation, after consideration of provisions made for potential losses and costs of defense, is immaterial to our consolidated financial statements. The Company is also occasionally involved in other legal and regulatory proceedings, some of which may assert claims for substantial amounts. These other legal proceedings may occasionally make us party to individual actions in which extra-contractual damages, punitive damages or penalties are sought, such as claims alleging bad faith in the handling of insurance claims.
On a quarterly basis, the Company reviews these outstanding matters, if any. Consistent with GAAP, the Company establishes accruals when it is probable that a loss has been incurred and the Company can reasonably estimate its potential exposure. We record for such probable and estimable losses, if any, through the establishment of legal expense reserves. Based on our quarterly review, the Company believes that our accruals for probable and estimable losses are reasonable and that the amounts accrued do not have a material effect on our consolidated financial statements.
- 66 -
Federated National Holding Company and Subsidiaries
Notes to Consolidated Financial Statements (continued)
December 31, 2016
On July 26, 2016, Mutual filed a demand for arbitration against the Company before the American Arbitration Association (“AAA”) alleging a breach of the Co-Existence Agreement. On November 29, 2016, the U.S. District Court for the Southern District of Florida granted Mutual’s motion to compel arbitration of the Company’s declaratory judgment action for non-infringement of a trademark. On February 3, 2017, the AAA granted the Company’s motion to terminate the arbitration for lack of jurisdiction based upon Mutual’s failure to comply with the Co-Existence Agreement’s regarding the selection of an arbitrator. The parties are currently in the process of conferring upon the selection of a mutually agreeable arbitrator. The Company nevertheless intends to vigorously defend against Mutual’s allegations, although there can be no assurances as to the outcome of this matter.
On March 2, 2017, the Company filed a complaint in Broward County, Florida court to enforce the terms of the restrictive covenants set forth in the Amended and Restated Non-Competition, Non-Disclosure and Non-Solicitation Agreement dated August 5, 2013, as amended, entered into between Peter J. Prygelski, III and the Company during Mr. Prygelski’s employment with the Company and set forth in the separation agreement he entered into in connection with his separation from the Company. The Company believes that he accepted employment with a competitor in contravention of these restrictive covenants and therefore the Company is seeking injunctive relief, declaratory relief and damages. The Company has not recognized a gain contingency in the financial statements as of December 31, 2016.
Assessment Related Activity
We operate in a regulatory environment where certain entities and organizations have the authority to require us to participate in assessments. Currently these entities and organizations include: Florida Insurance Guaranty Association (“FIGA”), Citizens Property Insurance Corporation (“Citizens”), FHCF, Florida Joint Underwriters Insurance Association (“JUA”), Georgia Insurers Insolvency Pool (“GIIP”), Special Insurance Fraud Fund (“SIIF”), Fair Access to Insurance Requirements Plan (“FAIRP”), Georgia Automobile Insurance Plan (“GAIP”), Property Insurance Association of Louisiana (“PIAL”), Louisiana Automobile Insurance Plan (“LAIP”), South Carolina Property & Casualty Insurance Guaranty Association (“SCPCIGA”), Texas Property and Casualty Insurance Guaranty Association (“TPCIGA”), Texas Windstorm Insurance Association (“TWIA”), Texas Automobile Insurance Plan Association (“TAIPA”), Alabama Insurance Guaranty Association (“AIGA”), and Alabama Insurance Underwriters Association (“AIUA”). As a direct premium writer in Florida, we are required to participate in certain insurer solvency associations under Florida law, administered by FIGA.
FNIC is also required to participate in an insurance apportionment plan under Florida law, which is referred to as a JUA Plan. The JUA Plan provides for the equitable apportionment of any profits realized, or losses and expenses incurred, among participating automobile insurers. In the event of an underwriting deficit incurred by the JUA Plan which is not recovered through the policyholders in the JUA Plan, such deficit shall be recovered from the companies participating in the JUA Plan in the proportion that the net direct written premiums of each such member during the preceding calendar year bear to the aggregate net direct premiums written in this state by all members of the JUA Plan. FNIC was not assessed by the JUA Plan.
Leases
The Company is committed under various operating lease agreements for office space. Rental expense for the years ended December 31, 2016, 2015 and 2014 was $0.6 million, $0.7 million and $0.5 million, respectively. As of December 31, 2016, the future minimum lease payments under these agreements are as follows:
|
|
|||
|
|
Aggregate Minimum |
||
|
Year Ended December 31, |
Lease Payments |
||
|
|
(in thousands) |
||
|
2017 |
$ |
644 | |
|
2018 |
662 | ||
|
2019 |
656 | ||
|
2020 |
678 | ||
|
2021 |
698 | ||
|
Thereafter |
719 | ||
|
Total |
$ |
4,057 | |
- 67 -
Federated National Holding Company and Subsidiaries
Notes to Consolidated Financial Statements (continued)
December 31, 2016
10. SHAREHOLDERS’ EQUITY
Common Stock Repurchases
In March 2016, our Board of Directors authorized a program to repurchase shares of common stock of FNHC, at such times and at prices as management determines advisable, up to an aggregate of $10.0 million through March 31, 2017. In November 2016, our Board of Directors authorized a program to repurchase shares of common stock of FNHC, at such times and at prices as management determines advisable, up to an aggregate of $10.0 million through March 1, 2017. Common stock repurchases are conducted in the open market or under Rule 10b5-1 trading plans from time to time in its discretion, based on ongoing assessments of the Company’s capital needs, the market price of its common stock and general market conditions. The amount and timing of all repurchase transactions are contingent upon market conditions, applicable legal requirements and other factors. This program may be modified, suspended or terminated by us at any time without notice.
Pursuant to our Board of Directors’ authorizations, the Company repurchased 624,818 shares of its common stock at a total cost of $11.3 million, which is an average price per share of $19.23, during the year ended December 31, 2016.
Stock Compensation Plan
In April 2012, our Board of Directors adopted, and in September 2012 our shareholders approved, the Company’s 2012 Stock Incentive Plan (the “2012 Plan”). The 2012 Plan permits the issuance of up to 1,000,000 shares of our common stock, subject to adjustment as provided for in the 2012 Plan, in connection with the grant of a variety of equity incentive awards, such as stock options and restricted stocks. Officers, directors, executive management and all other employees of the Company and its subsidiaries are eligible to participate in the 2012 Plan. Awards may be granted singly, in combination, or in tandem. The 2012 Plan will expire on April 5, 2022.
Share-Based Compensation Expense
The following table provides certain information in connection with the Company’s share-based compensation arrangements as follows:
|
|
|||||||||
|
|
Year Ended |
||||||||
|
|
December 31, |
||||||||
|
|
2016 |
2015 |
2014 |
||||||
|
|
(in thousands) |
||||||||
|
Restricted stock |
$ |
3,831 |
$ |
2,930 |
$ |
1,525 | |||
|
Stock options |
— |
33 | 135 | ||||||
|
Total share-based compensation expense |
$ |
3,831 |
$ |
2,963 |
$ |
1,660 | |||
|
|
|||||||||
|
Intrinsic value of options exercised |
$ |
13,732 |
$ |
1,124 |
$ |
5,172 | |||
|
Fair value of restricted stock vested |
$ |
41,495 |
$ |
2,303 |
$ |
549 | |||
The intrinsic value of options exercised represents the difference between the stock option exercise price and the weighted average closing stock price of FNHC common stock on the exercise dates, as reported on The NASDAQ Global Market.
The unamortized share-based compensation expense is $5.6 million for the year ended December 31, 2016, which will be recognized over the remaining weighted average vesting period of approximately 1.76 years.
- 68 -
Federated National Holding Company and Subsidiaries
Notes to Consolidated Financial Statements (continued)
December 31, 2016
Stock Option Awards
A summary of the Company’s stock option activity for the period from January 1, 2014 to December 31, 2016 is as follows:
|
|
|||||
|
|
Number of Shares |
Weighted Average |
|||
|
Outstanding at January 1, 2014 |
526,521 |
$ |
4.56 | ||
|
Granted |
— |
$ |
— |
||
|
Exercised |
(302,735) |
$ |
5.13 | ||
|
Cancelled |
(4,501) |
$ |
3.49 | ||
|
Outstanding at December 31, 2014 |
219,285 |
$ |
3.79 | ||
|
Granted |
— |
$ |
— |
||
|
Exercised |
(44,652) |
$ |
3.81 | ||
|
Cancelled |
— |
$ |
— |
||
|
Outstanding at December 31, 2015 |
174,633 |
$ |
3.79 | ||
|
Granted |
— |
$ |
— |
||
|
Exercised |
(94,249) |
$ |
3.85 | ||
|
Cancelled |
(900) |
$ |
4.40 | ||
|
Outstanding at December 31, 2016 |
79,484 |
$ |
3.70 | ||
A following table summarizes information about stock options outstanding and exercisable in a select price range as of December 31, 2016:
|
|
Options Outstanding and Exercisable |
|||||||
|
|
Weighted Average |
|||||||
|
|
Remaining |
|||||||
|
|
Shares Outstanding |
Contractual Life |
Weighted Average |
Aggregate |
||||
|
Range of Exercise Price |
and Exercisable |
(years) |
Exercise Price |
Intrinsic Value |
||||
|
$2.45 - $4.40 |
79,484 |
4.87 |
3.70 |
1,191,218 |
||||
- 69 -
Federated National Holding Company and Subsidiaries
Notes to Consolidated Financial Statements (continued)
December 31, 2016
Restricted Stock
During the years ended December 31, 2016, 2015 and 2014, the restricted stock awards issued have been granted to executives, directors and other key employees. The shares granted typically vest in equal portions over three or five years. A summary of the Company’s restricted stock activity for the period from January 1, 2014 to December 31, 2016 is as follows:
|
|
|||||
|
|
Number of Shares |
Weighted Average Grant Date Fair Value |
|||
|
Outstanding at January 1, 2014 |
249,500 |
$ |
8.24 | ||
|
Granted |
268,648 |
$ |
22.50 | ||
|
Vested |
(68,988) |
$ |
7.96 | ||
|
Cancelled |
(1,359) |
$ |
8.29 | ||
|
Outstanding at December 31, 2014 |
447,801 |
$ |
16.84 | ||
|
Granted |
116,140 |
$ |
27.53 | ||
|
Vested |
(145,134) |
$ |
15.87 | ||
|
Cancelled |
— |
$ |
— |
||
|
Outstanding at December 31, 2015 |
418,807 |
$ |
20.14 | ||
|
Granted |
128,472 |
$ |
19.16 | ||
|
Vested |
(204,916) |
$ |
20.25 | ||
|
Cancelled |
(5,160) |
$ |
20.58 | ||
|
Outstanding at December 31, 2016 |
337,203 |
$ |
19.69 | ||
The weighted average grant date fair value is measured at the closing price of FNHC common stock on the grant date, as reported on the NASDAQ Global Market.
Accumulated Other Comprehensive Income
The following table presents a reconciliation of the changes in accumulated other comprehensive income during the years ended December 31, 2016 and 2015:
|
|
||||||||||||||||||
|
|
||||||||||||||||||
|
|
Year Ended December 31, |
|||||||||||||||||
|
|
2016 |
2015 |
||||||||||||||||
|
|
Before |
Income |
Net |
Before |
Income |
Net |
||||||||||||
|
|
(in thousands) |
|||||||||||||||||
|
Accumulated other comprehensive income, |
||||||||||||||||||
|
beginning of period |
$ |
6,111 |
$ |
(2,247) |
$ |
3,864 |
$ |
12,419 |
$ |
(4,701) |
$ |
7,718 | ||||||
|
Other comprehensive income before reclassifications |
1,774 | (470) | 1,305 | (324) | 86 | (238) | ||||||||||||
|
Reclassification adjustment for realized gains included |
||||||||||||||||||
|
in net (loss) income |
(4,560) | 1,515 | (3,045) | (5,984) | 2,368 | (3,616) | ||||||||||||
|
|
(2,786) | 1,046 | (1,740) | (6,308) | 2,454 | (3,854) | ||||||||||||
|
Accumulated other comprehensive income, end of period |
$ |
3,323 |
$ |
(1,199) |
$ |
2,124 |
$ |
6,111 |
$ |
(2,247) |
$ |
3,864 | ||||||
11. EMPLOYEE BENEFIT PLAN
The Company sponsors a profit sharing plan under Section 401(K) of the Internal Revenue Code, which is a defined contribution plan that allows employees to defer compensation through contributions to the 401(K) Plan. This plan covers substantially all employees who meet specified service requirements and includes a 100% match up to the first 6% of an employee’s salary, not to exceed statutory limits. Additionally, the Company may make additional profit-sharing contributions. For the year ended December 31, 2016, there was no additional profit-sharing contribution. For the year ended December 31, 2015, the Company made an additional contribution of 1% of an employee’s salary.
- 70 -
Federated National Holding Company and Subsidiaries
Notes to Consolidated Financial Statements (continued)
December 31, 2016
The Company’s total contributions to the 401(K) Plan were $0.9 million, $0.6 million and $0.4 million for the years ended December 31, 2016, 2015 and 2014, respectively.
12. RELATED PARTY TRANSACTIONS
The following is a summary of the related party transactions entered into by the Company for the years ended December 31, 2016, 2015 and 2014.
The Company entered into catastrophe excess of loss and quota share reinsurance agreements with TransRe. For the years ended December 31, 2016, 2015 and 2014, the Company ceded premiums related to these agreements totaling $5.0 million, $4.3 million and $1.2 million, respectively. In connection with Hurricane Matthew and the quota share agreements, we have ceded losses of $0.8 million and $0.1 million for the years ended December 31, 2016 and 2015 relating to these agreements. For the years ended December 31, 2014, there were no ceded losses relating to these agreements.
Bruce F. Simberg, the Company’s Chairman of the Board, is a partner of the Hollywood, Florida law firm of Conroy Simberg, which specializes in insurance defense and coverage matters. The Company paid legal fees to Conroy Simberg for services rendered in the amount of $72,198, $26,286, and $6,538 for the years ended December 31, 2016, 2015, and 2014, respectively. We believe that the fees charged for services provided by Conroy Simberg are on terms at least as favorable as those that we could secure from a non-affiliated law firm. The firm has handled only a limited number of matters for the Company. Mr. Simberg has not been personally involved in any of the legal matters handled by the firm for the Company and he received de minimis direct personal benefit from the fees paid to the firm by the Company. The matters handled by the firm for the Company as of December 31, 2016 have been completed or are in the process of being completed, and the Company does not at this time anticipate retaining the firm for future matters.
For the years ended December 31, 2016 and 2015, the Company paid investment fees to Crosswinds AUM, LLC, a wholly owned subsidiary of Crosswinds, totaling $0.2 million and $0.2 million, respectively.
Refer to Note 7 for information relating to the debt owed to TransRe.
13. EARNINGS PER SHARE
The following table illustrates our computations of basic and diluted net income per share.
|
|
|||||||||
|
|
Year Ended |
||||||||
|
|
December 31, |
||||||||
|
|
2016 |
2015 |
2014 |
||||||
|
|
(in thousands, except per share data) |
||||||||
|
Net (loss) income attributable to Federated National Holding |
|||||||||
|
Company shareholders |
$ |
(196) |
$ |
40,885 |
$ |
37,199 | |||
|
Weighted average number of common shares outstanding - |
|||||||||
|
basic |
13,758 | 13,729 | 12,082 | ||||||
|
Net (loss) income per share - basic |
$ |
(0.01) |
$ |
2.98 |
$ |
3.08 | |||
|
|
|||||||||
|
Weighted average number of common shares outstanding - |
|||||||||
|
basic |
13,758 | 13,729 | 12,082 | ||||||
|
Dilutive effect of stock compensation plans |
- |
268 | 356 | ||||||
|
Weighted average number of common shares outstanding - |
|||||||||
|
diluted |
13,758 | 13,997 | 12,438 | ||||||
|
Net (loss) income per share - diluted |
$ |
(0.01) |
$ |
2.92 |
$ |
2.99 | |||
|
|
|||||||||
|
Dividends per share |
$ |
0.27 |
$ |
0.18 |
$ |
0.13 | |||
- 71 -
Federated National Holding Company and Subsidiaries
Notes to Consolidated Financial Statements (continued)
December 31, 2016
14. VARIABLE INTEREST ENTITY
The carrying amounts of Monarch Delaware, our consolidated VIE, assets, which can only be used to settle obligations of Monarch Delaware, and liabilities of Monarch Delaware for which creditors do not have recourse are as follows:
|
|
||||||
|
|
December 31, |
|||||
|
|
2016 |
2015 |
||||
|
ASSETS |
(in thousands) |
|||||
|
Investments |
||||||
|
Debt securities, available-for-sale, at amortized cost |
$ |
27,100 |
$ |
21,312 | ||
|
Equity securities, available-for-sale, at fair value |
1,604 | 1,358 | ||||
|
Total investments |
28,704 | 22,670 | ||||
|
|
||||||
|
Cash and cash equivalents |
15,668 | 14,616 | ||||
|
Prepaid reinsurance premiums |
1,070 | 34 | ||||
|
Premiums receivable, net |
1,584 | 355 | ||||
|
Other assets |
1,910 | 1,037 | ||||
|
Total assets |
$ |
48,936 |
$ |
38,712 | ||
|
|
||||||
|
LIABILITIES |
||||||
|
Loss and loss adjustment expense reserves |
$ |
1,659 |
$ |
237 | ||
|
Unearned premiums |
8,406 | 1,448 | ||||
|
Reinsurance payable |
864 |
— |
||||
|
Debt |
4,909 | 4,887 | ||||
|
Income taxes payable |
— |
8 | ||||
|
Other liabilities |
1,026 | 374 | ||||
|
Total liabilities |
$ |
16,864 |
$ |
6,954 | ||
15. STATUTORY ACCOUNTING AND DIVIDEND RESTRICTIONS
The Company’s insurance companies are subject to regulations and standards of the Florida OIR. These standards require that insurance companies prepare statutory-basis financial statements in accordance with the National Association of Insurance Commissioners Accounting Practices and Procedures Manual. The Company did not use any prescribed or permitted statutory accounting practices that differed from the National Association of Insurance Commissioners’ statutory accounting practices as of December 31, 2016.
The Company’s insurance companies are required to report their risk-based capital (“RBC”) each December 31. Failure to maintain an adequate RBC could subject the Company to regulatory action and could restrict the payment of dividends. As of December 31, 2016, the RBC levels of the Company’s insurance companies did not subject them to any regulatory action.
Additionally, Florida Statutes require the Company’s insurance companies to maintain specified levels of statutory capital and restrict the timing and amount of dividends and other distributions that may be paid to the parent company. These standards require dividends to be paid only from statutory unassigned surplus. The maximum dividend that may be paid by the Company’s insurance companies to their parent company, without prior regulatory approval is limited to the lesser of statutory net income from operations of the preceding calendar year, not including realized capital gains, plus a 2-year carryforward or 10.0% of statutory unassigned surplus as of the preceding year end. A dividend may also be taken without prior regulatory approval if (a) the dividend is equal to or less than the greater of (i) Ten percent of the insurer’s surplus as to policyholders derived from realized net operating profits on its business and net realized capital gains; or (ii) the insurer’s entire net operating profits and realized net capital gains derived during the immediately preceding calendar year; (b) the insurer will have surplus as to policyholders equal to or exceeding 115 percent of the minimum required statutory surplus as to policyholders after the dividend or distribution is made; and (c) the insurer has filed notice with the office at least 10 business days prior to the dividend payment or distribution, or such shorter period of time as approved by the Florida OIR on a case-by-case basis. These dividends are referred to as “ordinary dividends.” However, if a dividend, together with other dividends paid within the preceding twelve months, exceeds this statutory limit or is paid from sources other than earned surplus, the entire dividend is generally considered an “extraordinary dividend” and must receive prior regulatory approval before such dividend can be paid.
- 72 -
Federated National Holding Company and Subsidiaries
Notes to Consolidated Financial Statements (continued)
December 31, 2016
As of December 31, 2016 and 2015, on a consolidated statutory basis, the capital and surplus of the Company’s insurance companies was $172.1 million and $175.9 million, respectively. For the year ended December 31, 2016 consolidated statutory net loss of the Company’s insurance companies was $37.0 million. For the years ended December 31, 2015, and 2014, consolidated statutory net income of the Company’s insurance companies was $23.9 million and $29.3 million, respectively. Statutory capital and surplus significantly exceeds amounts necessary to satisfy regulatory requirements.
16. QUARTERLY RESULTS OF OPERATIONS (UNAUDITED)
The following is a summary of unaudited quarterly results of operations:
|
|
||||||||||||
|
|
First |
Second |
Third |
Fourth |
||||||||
|
|
Quarter |
Quarter |
Quarter |
Quarter |
||||||||
|
|
(in thousands, except per share data) |
|||||||||||
|
2016 |
||||||||||||
|
Net premiums earned |
$ |
54,997 |
$ |
60,045 |
$ |
69,405 |
$ |
75,425 | ||||
|
Total revenue |
$ |
68,960 |
$ |
75,064 |
$ |
83,790 |
$ |
88,570 | ||||
|
Losses and loss adjustment expenses |
$ |
29,545 |
$ |
47,025 |
$ |
43,613 |
$ |
67,158 | ||||
|
Total costs and expenses |
$ |
53,562 |
$ |
73,249 |
$ |
82,250 |
$ |
104,590 | ||||
|
Net (loss) income attributable to Federated National Holding Company shareholders |
$ |
9,535 |
$ |
991 |
$ |
1,394 |
$ |
(12,116) | ||||
|
Net (loss) income per share - basic |
$ |
0.69 |
$ |
0.07 |
$ |
0.10 |
$ |
(0.89) | ||||
|
|
||||||||||||
|
2015 |
||||||||||||
|
Net premiums earned |
$ |
44,786 |
$ |
49,227 |
$ |
62,286 |
$ |
53,721 | ||||
|
Total revenue |
$ |
54,936 |
$ |
58,790 |
$ |
72,599 |
$ |
63,568 | ||||
|
Losses and loss adjustment expenses |
$ |
23,949 |
$ |
23,149 |
$ |
28,412 |
$ |
28,843 | ||||
|
Total costs and expenses |
$ |
40,452 |
$ |
40,151 |
$ |
54,974 |
$ |
49,123 | ||||
|
Net income attributable to Federated National Holding |
$ |
9,284 |
$ |
11,734 |
$ |
10,593 |
$ |
9,274 | ||||
|
Net income per share - basic |
$ |
0.68 |
$ |
0.86 |
$ |
0.77 |
$ |
0.67 | ||||
17. SUBSEQUENT EVENTS
On March 1, 2017, the Company entered into a Reimbursement Contract with the State Board of Administration of Florida (“SBA”) for the 2017 – 2018 hurricane season. The SBA is the agency that administers the FHCF. The Contracts will reimburse FNIC and MNIC for covered property losses under their respective homeowners’ insurance policies resulting from hurricanes that cause damage in the State of Florida, from June 1, 2017 through May 31, 2018.
On March 1, 2017, in connection with the Company’s review of its subsidiaries’ financial condition and capital resources as of the end of the 2016 fiscal year, the Company’s Board of Directors approved $25.0 million of capital to be transferred into FNIC from FNHC to support FNIC’s book of business and regulatory requirements.
On March 10, 2017, our Board of Directors authorized an additional $10 million share buyback program to repurchase shares of common stock through March 8, 2018. The Company may repurchase shares in open market transactions or under Rule 10b5-1 trading plans from time to time in its discretion, based on ongoing assessments of the Company’s capital needs, the market price of its common stock and general market conditions. The Company will fund the share repurchase program with cash from operations.
On March 13, 2017, we announced that the Company’s Board of Directors approved a dividend of $0.08 per share, which will be paid on June 1, 2017 to shareholders on record as of May 1, 2017.
- 73 -
REPORT OF INDEPENDENT REGISTERED PUBLIC ACCOUNTING FIRM
Internal Control over Financial Reporting
The Board of Directors and Shareholders
Federated National Holding Company and Subsidiaries
We have audited Federated National Holding Company and subsidiaries’ internal control over financial reporting as of December 31, 2016, based on criteria established in Internal Control—Integrated Framework issued by the Committee of Sponsoring Organizations of the Treadway Commission (2013 framework) (the COSO criteria). Federated National Holding Company and subsidiaries’ management is responsible for maintaining effective internal control over financial reporting, and for its assessment of the effectiveness of internal control over financial reporting included in the accompanying Management’s Report on Internal Control over Financial Reporting. Our responsibility is to express an opinion on the company’s internal control over financial reporting based on our audit.
We conducted our audit in accordance with the standards of the Public Company Accounting Oversight Board (United States). Those standards require that we plan and perform the audit to obtain reasonable assurance about whether effective internal control over financial reporting was maintained in all material respects. Our audit included obtaining an understanding of internal control over financial reporting, assessing the risk that a material weakness exists, testing and evaluating the design and operating effectiveness of internal control based on the assessed risk, and performing such other procedures as we considered necessary in the circumstances. We believe that our audit provides a reasonable basis for our opinion.
A company’s internal control over financial reporting is a process designed to provide reasonable assurance regarding the reliability of financial reporting and the preparation of financial statements for external purposes in accordance with generally accepted accounting principles. A company’s internal control over financial reporting includes those policies and procedures that (1) pertain to the maintenance of records that, in reasonable detail, accurately and fairly reflect the transactions and dispositions of the assets of the company; (2) provide reasonable assurance that transactions are recorded as necessary to permit preparation of financial statements in accordance with generally accepted accounting principles, and that receipts and expenditures of the company are being made only in accordance with authorizations of management and directors of the company; and (3) provide reasonable assurance regarding prevention or timely detection of unauthorized acquisition, use, or disposition of the company’s assets that could have a material effect on the financial statements.
Because of its inherent limitations, internal control over financial reporting may not prevent or detect misstatements. Also, projections of any evaluation of effectiveness to future periods are subject to the risk that controls may become inadequate because of changes in conditions, or that the degree of compliance with the policies or procedures may deteriorate.
In our opinion, Federated National Holding Company and subsidiaries maintained, in all material respects, effective internal control over financial reporting as of December 31, 2016, based on the COSO criteria.
We also have audited, in accordance with the standards of the Public Company Accounting Oversight Board (United States), the consolidated balance sheets as of December 31, 2016 and 2015 and the related consolidated statements of operations, comprehensive income, changes in shareholders' equity and cash flows for the years ended December 31, 2016 and 2015, of Federated National Holding Company and subsidiaries and our report dated March 16, 2017 expressed an unqualified opinion thereon.
Charlotte, North Carolina
- 74 -
ITEM 9. CHANGES IN AND DISAGREEMENTS WITH ACCOUNTANTS ON ACCOUNTING AND FINANCIAL DISCLOSURE
None
ITEM 9A. CONTROLS AND PROCEDURES
Evaluation of Disclosure Controls and Procedures
We maintain disclosure controls and procedures that are designed to ensure that information required to be disclosed in the reports that we file or submit under the Exchange Act is recorded, processed, summarized, and reported within the time periods specified in the SEC’s rules and forms, and that such information is accumulated and communicated to our management, including our Chief Executive Officer and Interim Chief Financial Officer, as appropriate, to allow timely decisions regarding required disclosures.
As of the end of the period covered by this report, we carried out an evaluation, under the supervision and with the participation of our principal executive officer and principal financial officer, of the effectiveness of the design and operation of our disclosure controls and procedures. Based on that evaluation, our Chief Executive Officer and Interim Chief Financial Officer concluded that our disclosure controls and procedures were effective as of December 31, 2016.
Management’s Report on Internal Control over Financial Reporting
Because of its inherent limitations, internal controls over financial reporting may not prevent or detect misstatements. Also, projections of any evaluation of effectiveness to future periods are subject to the risk that controls may become inadequate because of changes in condition, or that the degree of compliance with the policies or procedures may deteriorate.
Our management is responsible for establishing and maintaining adequate internal control over financial reporting, as such term is defined in Exchange Act Rule 13a-15(f). Under the supervision and with the participation of our management, including our Chief Executive Officer and Interim Chief Financial Officer, we conducted an evaluation of the effectiveness of our internal control over financial reporting based on the framework in Internal Control — Integrated Framework (2013) issued by the COSO.
Based on the results of this evaluation, our management has concluded that our internal control over financial reporting was effective as of December 31, 2016 to provide reasonable assurance regarding the reliability of financial reporting and the preparation of financial statements for external reporting purposes in accordance with GAAP. We reviewed the results of management’s assessment with the Company’s Audit Committee. Our independent registered public accounting firm that audited the consolidated financial statements include in this Form 10-K, Ernst & Young LLP, has issued an attestation report on the effectiveness of our internal control over financial reporting which appears in Part II, Item 8, “Financial Statements and Supplementary Data” included on page 64 of this Form 10-K.
Changes in Internal Control over Financial Reporting
There were no changes in our internal control over financial reporting that occurred during the year ended December 31, 2016 that has materially affected, or is reasonably likely to materially affect, our internal control over financial reporting.
Limitations on Effectiveness
Our management and our audit committee do not expect that our disclosure controls and procedures or internal control over financial reporting will prevent all errors or all instances of fraud. A control system, no matter how well designed and operated, can provide only reasonable, not absolute, assurance that the control system’s objectives will be met. Further, the design of the control system must reflect the fact that there are resource constraints, and the benefits of controls must be considered relative to their costs. Because of the inherent limitations in all control systems, no evaluation of controls can provide absolute assurance that all control gaps and instances of fraud have been detected. These inherent limitations include the realities that judgments and decision-making can be faulty, and that breakdowns can occur because of simple errors or mistakes. Controls can also be circumvented by the individual acts of some persons, by collusion of two or more people, or by management override of the controls. The design of any system of controls is based in part upon certain assumptions about the likelihood of future events, and any design may not succeed in achieving its stated goals under all potential future conditions.
None.
- 75 -
ITEM 10. DIRECTORS, EXECUTIVE OFFICERS AND CORPORATE GOVERNANCE
The following table sets forth certain information with respect to our executive officers and directors as of March 14, 2017:
|
Name |
Age |
Position with the Company |
|
Michael H. Braun (5) |
49 |
Chief Executive Officer, President, |
|
|
|
Class I Director |
|
|
|
|
|
Erick A. Fernandez |
38 |
Interim Chief Financial Officer, Treasurer |
|
|
|
|
|
Bruce F Simberg (2)(3)(4)(5) |
68 |
Chairman of the Board, Class II Director |
|
|
|
|
|
Jenifer G. Kimbrough (1)(3)(4) |
45 |
Class I Director |
|
|
|
|
|
Richard W. Wilcox Jr. (1)(3)(4) |
75 |
Lead Director, Class II Director |
|
|
|
|
|
William G. Stewart (2)(4) |
68 |
Class II Director |
|
|
|
|
|
Carl Dorf (1)(2)(4) |
75 |
Class III Director |
|
|
|
|
|
Thomas A. Rogers (3)(4)(5) |
65 |
Class III Director |
---------------------------------------
(1)Audit Committee Member
(2)Investment Committee Member
(3)Compensation Committee Member
(4)Nominating Committee Member
(5)Business Development Committee Member
Our Articles of Incorporation provide that our Board of Directors shall consist of three classes of directors, as nearly equal in number as possible, designated Class I, Class II and Class III, and provides that the exact number of directors comprising our Board of Directors will be determined from time to time by resolution adopted by the Board. At each annual meeting of shareholders, successors to the class of directors whose term expires at that annual meeting are elected for a three-year term. The current term of the Class I directors terminates on the date of our 2019 annual meeting. The current term of the Class II directors terminates on the date of our 2018 annual meeting and the current term of the Class III directors terminate as of the date of our 2017 annual meeting.
The following is a brief description of the business experience of each director and executive officer of the Company.
Michael H. Braun was appointed Chief Executive Officer of the Company in July 2008, President in June 2009, elected to the Board of Directors in December 2005 and served as Chairman of the Board from March 2015 to January 2016. Previously, Mr. Braun was Chief Operating Officer, where he was responsible for the Company’s day-to-day operations and strategic product portfolio. Mr. Braun has also served as President of Federated National Insurance Company (“FNIC”), a subsidiary of the Company, since September 2003, a position that he continues to hold. Previously, he held key management positions within FNIC, responsible for operations, marketing and underwriting. Prior to joining the Company, Mr. Braun was Managing Partner for an independent chain of insurance agencies, which was acquired by the Company in 1998. Mr. Braun received a Bachelor’s of Science degree in Business Administration from the State University of New York. Mr. Braun does not serve on the board of directors of any other SEC reporting company.
Mr. Braun’s nearly 20-year tenure with the Company, together with his substantial experience in all aspects of insurance company operations, including product development, strategy, reinsurance and underwriting, have been critical to the Company’s growth in the Florida homeowners’ insurance market.
Erick A. Fernandez was appointed to serve as the Company’s Interim Chief Financial Officer on June 20, 2016. Mr. Fernandez joined the Company in January 2016 and was the Company’s Vice President, Corporate Accounting and Reporting, until his appointment as Interim Chief Financial Officer. Mr. Fernandez brings more than 15 years of experience in accounting, finance, financial reporting and auditing. Prior to joining the Company, Mr. Fernandez worked for Verizon Communications, Inc. in that company’s Cloud and Datacenter segment as a Senior Director of Financial Planning and Analysis, responsible for strategic planning and finance operations. From June 2008 to June 2011, Mr. Fernandez held various finance and accounting positions at Terremark Worldwide, Inc., including Senior Director of Accounting and External Reporting, Director of Budgeting and Reporting, and Director of SEC Reporting. From September 2001 to June 2008, Mr. Fernandez worked for “Big 5” accounting firms, including as an Audit Manager at Ernst & Young LLP from May 2002 to June 2008. Mr. Fernandez is a Certified Public Accountant and received his Bachelor’s degree in accounting and a Master’s of Business Administration from Florida International University.
- 76 -
Mr. Fernandez was appointed to his position following the resignation on June 20, 2016 by Peter J. Prygelski III from his positions as a director and Chief Financial Officer and Treasurer of the Company to pursue other opportunities.
Bruce F. Simberg rejoined the Board on January 29, 2016, after serving as a director of the Company from January 1998 to March 2015. Mr. Simberg has been a practicing attorney since October 1975, most recently as managing partner of Conroy Simberg, P.A. (“Conroy Simberg”), a law firm in Hollywood, Florida, since October 1979. Mr. Simberg received his Bachelors of Science degree from Emory University and his Juris Doctor from the University of Miami. Mr. Simberg does not serve on the board of directors of any other SEC reporting company.
Mr. Simberg has significant historical knowledge and understanding of the Company’s development, as well as significant experience in insurance-related and other litigation and risk assessment matters.
Jenifer G. Kimbrough has served as a director of the Company since April 2009. Ms. Kimbrough serves as Managing Director, Chief Financial Officer at Oakworth Capital Bank since October 2015, prior to which Ms. Kimbrough was the Vice President of Compliance and Audit for Surgical Care Affiliates from March 2010 to October 2015. Prior to 2010, Ms. Kimbrough served as the Vice President of Assurance and Process Improvement. Prior to 2007, Ms. Kimbrough was the Senior Vice President of Investor Relations at Regions Financial Corporation. From 1993 to 2003, Ms. Kimbrough served as an Audit Senior Manager at Ernst & Young LLP. Ms. Kimbrough received her certification as a Certified Public Accountant (“CPA”) from the Alabama State Board of Public Accountancy in 1994 and obtained a Bachelor’s of Science degree in Commerce & Business Administration (Accounting) from The University of Alabama in 1993. Ms. Kimbrough is a member of several professional societies, including: American Woman’s Society of Certified Public Accountants (“AWSCPA”), Alabama State Society of Certified Public Accountants and American Institute of Certified Public Accountants (“AICPA”). Additionally, she served on the AICPA Women’s Initiative Executive Committee and as National President of the AWSCPA and serves in various volunteer leadership capacities. Ms. Kimbrough does not serve on the board of directors of any other SEC reporting company.
Ms. Kimbrough brings her significant knowledge in compliance and audit, from both the issuer’s perspective and the auditor’s perspective, to the Company and the Board.
Richard W. Wilcox Jr. has served as a director of the Company since January 2003. Mr. Wilcox has been in the insurance industry for more than 40 years. In 1963, Mr. Wilcox purchased an insurance agency that he grew into a business generating $10 million in annual revenue. In 1991, Mr. Wilcox sold his agency to Hilb, Rogal and Hamilton Company (“HRH”) of Fort Lauderdale, for which he retained the position of President through 1998. In 1998, HRH of Fort Lauderdale merged with Poe and Brown of Fort Lauderdale, and Mr. Wilcox served as the Vice President of Poe and Brown until 1999, when he retired. Mr. Wilcox holds CIC designation as a member of the Society of Certified Insurance Counselors. Mr. Wilcox also holds an Advanced Professional Director Certification from the American College of Corporate Directors, a national public company director education and credentialing organization. Mr. Wilcox does not serve on the board of directors of any other SEC reporting company.
Mr. Wilcox’s substantial experience with insurance agency operations, his overall knowledge of the insurance industry, as well as his historical knowledge of the Company, are considered to be valuable expertise for the Board.
William G. Stewart has served as a director of the Company since October 1, 2015. Mr. Stewart has significant experience in administration and investment management. He has served as the Deputy Secretary of Administration for the State of Maryland, Department of Public Safety and Correctional Services, since February 2015. From 2003 to 2007, Mr. Stewart was an Assistant Secretary for Administration/Business Services and an Acting Deputy Secretary for the State of Maryland, Department of Juvenile Services. He has more than 35 years’ experience in the securities industry, including as a Senior Consultant at Asset Strategy Consultants, an investment management consulting firm, from 2007 to 2015, and as a senior executive officer and registered representative at Mercantile Capital Advisors, Inc. from 2000 to 2002, and at BT Alex. Brown Incorporated and Alex. Brown & Sons Incorporated from 1973 to 1999. Mr. Stewart received a Bachelor of Arts degree from Princeton University and a Masters of Business Administration from the University of Virginia Graduate School of Business Administration. Mr. Stewart does not serve on the board of directors of any other SEC reporting company.
Mr. Stewart’s significant experience in administration and investment management provides the Board with greater depth of knowledge regarding management of the Company’s investment portfolio.
Carl Dorf has served as a director of the Company since August 2001. Mr. Dorf has over 40 years of diversified investment experience as a security analyst, portfolio manager, mutual fund manager and hedge fund manager. He earned the Chartered Financial Analyst (CFA) designation and in the past served as director of the Los Angeles Society of Security Analysts. Since April 2001, Mr. Dorf has been the principal of Dorf Asset Management, LLC, and is responsible for all investment decisions made by that company. From January 1991 to February 2001, Mr. Dorf served as the Fund Manager of ING Pilgrim Bank and Thrift Fund. Prior to his experience at Pilgrim, Mr. Dorf was a principal in Dorf & Associates, an investment management company. Mr. Dorf has a
- 77 -
Bachelor’s degree in Business Administration, with a minor in accounting, and a Master’s of Business Administration in finance from the Bernard Baruch School of Business and Public Administration, The City College of New York. Mr. Dorf does not serve on the board of directors of any other SEC reporting company.
The Board believes that Mr. Dorf’s significant knowledge and experience in investments and financial instruments, in addition to his long tenure on the Board, are important additions to the Board.
Thomas A. Rogers has served as a director of the Company since October 1, 2015. Mr. Rogers has more than 40 years’ experience in the reinsurance industry, including 22 years serving in senior executive officer positions with Aon Benfield Inc. until his retirement in 2014 as its Vice Chairman. Prior to Aon Benfield, Mr. Rogers spent 18 years with both reinsurance underwriting and intermediary companies and specialized in the development and management of specialized property and casualty lines. Mr. Rogers received his Bachelors of Science degree from Drexel University. Mr. Rogers does not serve on the board of directors of any other SEC reporting company.
Mr. Rogers’ significant knowledge of reinsurance underwriting, including day-to-day insurance operations, and in specialized property and casualty lines provides the Board with expertise that is highly relevant to the Company’s current operations and that will be beneficial in connection with possible future expansion of the Company’s business lines.
Corporate Governance Update
The Company has experienced significant growth, both in revenues and market capitalization, in recent years. The Board of Directors has received feedback from shareholders and others regarding certain provisions of the Company’s articles of incorporation and bylaws, which reflect anti-takeover provisions that were typical when the Company first became publicly traded in 1998 and which have fallen out of favor with investors. With that feedback in mind, and being cognizant of the Company’s recent growth, the Board of Directors has undertaken a comprehensive review of our Company’s corporate governance, including the Company’s articles of incorporation and bylaws, in order to assure strong Board accountability and effective shareholder rights policies. This review was done in conjunction with a review by our Compensation Committee of our executive compensation practices, which resulted in significant updates to our executive compensation practices as described more fully below under the caption “Compensation Discussion and Analysis.” The Board believes that certain of the Company’s current corporate governance practices and provisions of its articles and bylaws are consistent with those of a public company that is a comparable size to the Company and that is in the Company’s industry, and are in the best interests of its shareholders. Still, the Board agrees that updating of the Company’s corporate governance practices are advisable now and has approved the following actions:
|
· |
The Board added two new independent directors in 2015, with the result that six of the seven Board members are independent. |
|
· |
The Board separated the roles of Chairman of the Board and Chief Executive Officer with Bruce F. Simberg’s return to the Board. |
|
· |
The Board has amended the Company’s bylaws to implement a majority voting standard for uncontested elections of directors. |
|
· |
The Board approved increasing the frequency of the shareholder vote on executive compensation (“say-on-pay”) to occur annually, with which the shareholders concurred in the 2016 say-on-pay frequency vote; |
|
· |
The Board proposed and received shareholder approval to amend the Company’s articles and bylaws to reduce the supermajority requirement (66-2/3% of the shares outstanding) to amend certain provisions to a majority of shares outstanding. |
|
· |
The Board proposed and received shareholder approval to amend the Company’s articles and bylaws to reduce the percentage of shares required to call a special meeting from 33% to 25%. |
|
· |
The Board approved stock ownership and retention guidelines applicable to our directors, in addition to our Chief Executive Officer and Chief Financial Officer. Under these guidelines, our outside, non-employee directors are each required to hold shares of the Company’s common stock with a value of at least four times the annual retainer. The guidelines further provide that the outside directors should achieve the guideline amounts within five years of the policy’s adoption and, until the guideline amounts are achieved, our directors must retain 66-2/3% of any shares received as equity grants from the Company, net of shares withheld or sold to pay taxes. |
- 78 -
|
· |
The Board prohibited directors and executive officers from hedging or pledging the Company’s common stock, without exception. |
|
· |
The Board adopted corporate governance guidelines, which update, consolidate and memorialize the corporate governance practices followed by the Board and the Company. |
The Board believes that these steps are all significant steps forward as the Company continues its growth.
Leadership Structure and Risk Oversight
The Chairman of the Board is elected by the members of the Board and typically presides at all meetings of the Board. Bruce F. Simberg currently serves as our Chairman, a position he has held since 1998 other than a brief hiatus from March 2015 to January 2016. Richard W. Wilcox Jr., an independent member of the Board since 2003, served as the Board’s Lead Independent Director during that hiatus and continues to hold that position in recognition of his significant knowledge of the Company’s history, growth and operations. The responsibilities of the Company’s Chairman of the Board are: (i) presiding at all meetings of the Board (with the Lead Independent Director presiding at meetings where the Chairman is not present), including presiding at executive sessions of the Board (without management present) at every regularly scheduled Board meeting, (ii) serving as a liaison between management and the independent directors, (iii) providing input regarding meeting agendas, time schedules and other information provided to the Board, and (iv) being available for direct communication and consultation with major shareholders, as appropriate, upon request. Our Chairman also has the authority to call meetings of the independent directors. The Chief Executive Officer is currently the only member of management on the Board.
The Company believes that its Board as a whole should encompass a diverse range of talents, skills, perspectives, and experiences, enabling it to provide sound guidance with respect to the Company's operations and interests. The Company's policy is to have at least a majority of directors qualify as independent as defined by the listing and maintenance rules of The Nasdaq Stock Market (the “Nasdaq Rules”). The Nominating Committee identifies candidates for election to the Board of Directors; reviews their skills, characteristics and experience; and recommends nominees for director to the Board for approval. The Nominating Committee's Charter provides that the Board of Directors as a whole should be balanced and diverse, and consist of individuals with various and relevant career experience, relevant technical skills, industry knowledge and experience, financial expertise and local or community ties. Minimum individual requirements include strength of character, mature judgment, familiarity with the Company's business and industry, independence of thought and an ability to work collegially. The Board believes that the qualifications of the directors, as set forth in their biographies above provide them with the qualifications and skills to serve as a director of our Company
Board Self-Assessment Process
The Board believes that ongoing self-assessment is important to strengthening its performance and fulfilling its role on behalf of the Company’s shareholders. To that end, the Board conducts an annual evaluation process that begins by asking each Board member to complete a comprehensive evaluation form that addresses the Board’s overall performance and a self-evaluation of the individual director’s performance. Overall Board performance is evaluated based on, among other things, the conduct of Board meetings, the composition of the Board, the quality of information provided to the Board, Board effectiveness, and access to management. Individual performance is evaluated to determine, among other things, whether the director continues to be able to devote the necessary time to Board and committee matters, whether the director’s skills are best utilized, and whether the director contributes to Board decision making. In addition, the Audit Committee conducts an annual evaluation of its performance, including a review of the effectiveness of its processes, the composition of the Committee, the Committee’s interactions with management and the Company’s auditors, and the Committee members’ understanding of the Company’s risks, controls and compliance. These evaluation forms are reviewed by the Chairman of the Board or the Audit Committee, and by the entire Board or Committee, and are discussed in detail at a Board or Audit Committee meeting, as applicable.
The Company encourages its directors to remain current in corporate governance, compliance and industry topics facing publicly traded insurance companies such as the Company. In that regard, the Company provides directors with the opportunity to attend seminars and conferences on director education, board leadership, current issues facing the insurance industry generally and the Florida insurance market in particular, governance, risk management and other subjects of interest to Board members and relevant to the Company. Certain of our directors also obtain significant continuing education relevant to the Company in connection with their professional licenses and certifications in accounting, finance and law.
Corporate Governance Guidelines
The Board has adopted Corporate Governance Guidelines, which have updated, consolidated and memorialized the corporate governance practices followed by the Board and the Company. Among other things, the guidelines address the following matters relating
- 79 -
to the Board and its committees:
|
· |
Director qualifications generally and guidelines on the composition of the Board and its committees; |
|
· |
Director responsibilities and the standards for carrying out such responsibilities; |
|
· |
Board membership criteria; |
|
· |
Board committee requirements; |
|
· |
Director compensation; |
|
· |
Director access to management and independent advisors; |
|
· |
Director orientation and continuing education requirements; and |
|
· |
CEO evaluation, management succession and CEO compensation. |
The Corporate Governance Guidelines are reviewed at least annually by the Board.
Risk Oversight
The Board’s role in connection with risk oversight is to oversee and monitor the management of risk practiced by the Company’s management in the performance of their duties. The Board does this in a number of ways, principally through the oversight responsibility of committees of the Board, but also as part of the strategic planning process. For example, our Audit Committee oversees management of risks related to accounting, auditing and financial reporting, maintaining effective internal controls over financial reporting, and information security and technology risks. Our Nominating Committee oversees risk associated with corporate governance and the Company’s code of conduct, including compliance with listing standards for independent directors and conflicts of interest. Our Compensation Committee oversees the risk related to our executive compensation plans and arrangements. Our Investment Committee oversees the risks related to managing our investment portfolio. Our Directors Compensation Committee has been responsible for reviewing and recommending our non-employee director compensation plans and arrangements. The full Board receives reports on a regular basis regarding each committee’s oversight from the chairperson of each committee when reporting on their committee’s actions at regular Board meetings, as well as overseeing the development and implementation of strategic initiatives.
Meetings and Committees of the Board of Directors
During 2016, the Board of Directors held 11 regular meetings, seven special meetings and took actions by written consent on four occasions. During 2016, no director attended fewer than 75% of the Board and committee meetings held during this period. The Board of Directors encourages, but does not require, its directors to attend the Company’s annual meeting. Last year, the seven directors that constituted the entire Board at the time attended our annual meeting.
The Board has determined that the following directors continue to be independent pursuant to the Nasdaq Rules applicable to the Company: Bruce F. Simberg, Carl Dorf, Richard W. Wilcox Jr., Jenifer G. Kimbrough, William G. Stewart and Thomas A. Rogers.
The independent directors of the Board also meet in executive sessions without management present. These sessions, which generally occur at every regularly scheduled Board meeting, are led by the Chairman. Executive sessions allow the independent directors to discuss, among other issues, management performance and compensation.
To facilitate the Board’s oversight functions and to take advantage of the knowledge and experience of its members, the Board has created several standing committees. These committees, the Audit, Investment, Nominating, Compensation and Business Development committees, allow regular risk oversight and monitoring, and deeper analysis of issues before the Board. The Audit, Compensation, Investment and Nominating committees are composed exclusively of independent directors. The membership of the standing committees is reviewed from time to time, and specific committee assignments are proposed and appointed by the Board. Each committee holds regularly scheduled meetings and confers between regularly scheduled meetings as needed.
Charters for the Audit, Compensation and Nominating committees, and the Corporate Governance Guidelines, are available upon the Company’s website at www.fednat.com and are also available in print to any shareholder upon request from our Corporate Secretary.
- 80 -
Audit Committee. As of December 31, 2016, the Audit Committee was composed of Jenifer G. Kimbrough, who served as the Chair, Richard W. Wilcox Jr. and Carl Dorf. Each member was determined to be “independent” as defined under the Nasdaq Rules applicable to the Company and SEC rules for Audit Committee membership. Ms. Kimbrough, who is a Certified Public Accountant, was designated as a “financial expert” as that term is defined in the applicable rules and regulations of the Exchange Act based on her understanding of U.S. generally accepted accounting principles (“GAAP”) and financial statements; her ability to assess the general application of GAAP in connection with the accounting for estimates, accruals and reserves; her experience preparing, auditing, analyzing and evaluating financial statements that present a breadth and level of complexity of accounting issues that are generally comparable to the breadth and complexity of issues that can reasonably be expected to be raised by the Company’s financial statements, or experience actively supervising one or more persons engaged in such activities; her understanding of internal controls and procedures for financial reporting; and her understanding of audit committee functions. The Audit Committee held four regular meetings in fiscal 2016 and one special meeting.
Pursuant to its written charter, the duties and responsibilities of the Audit Committee include, but are not limited to, (a) the appointment of the independent certified public accountants and any termination of such engagement, (b) reviewing the plan and scope of independent audits, (c) reviewing significant accounting and reporting policies and operating controls, (d) having general responsibility for all related auditing and financial statement matters, and (e) reporting its recommendations and findings to the full Board of Directors. The Audit Committee pre-approves all auditing services and permitted non-audit services (including the fees and terms thereof) to be performed by the independent accountants, subject to the de minimis exceptions for non-audit services described in Section 10A(i)(1)(B) of the Exchange Act that are approved by the Audit Committee prior to the completion of the audit.
To ensure prompt handling of unexpected matters, the Audit Committee delegates to the Chair the authority to amend or modify the list of approved permissible non-audit services and fees. The Chair will report action taken to the Audit Committee at the next committee meeting. The Chief Financial Officer is responsible for tracking all independent auditor fees against the budget for such services and reports at least annually to the Audit Committee.
Compensation Committee. As of December 31, 2016, the Company’s Compensation Committee was composed of Jenifer G. Kimbrough, Bruce F. Simberg, Thomas A. Rogers and Richard W. Wilcox Jr. Each member is independent as defined by the NASDAQ Rules. The Compensation Committee performs the duties and responsibilities pursuant to its charter, which includes reviewing and approving the compensation of the Company's executive officers. Mr. Wilcox serves as the Chairman. During fiscal 2016, the Compensation Committee held one regular meeting and eight special meetings. For 2017, the members of the Compensation Committee will be Jenifer G. Kimbrough, Thomas A. Rogers and Richard W. Wilcox Jr.
For the 2016 fiscal year, the Compensation Committee engaged the independent executive compensation consulting firm of Meridian Compensation Partners, LLC (“Meridian”) to review the structure and competitiveness of the Company’s executive and director compensation for 2016. Meridian provides no other services to the Company other than those directly to the Compensation Committee relating to executive and director compensation. Meridian attends meetings of the Compensation Committee at the request of the committee, meets with the Compensation Committee in executive sessions without the presence of management, and communicates with the Chairman of the Compensation Committee with respect to emerging issues.
The Compensation Committee Chairman and certain Company officials furnished Meridian with information concerning the compensation of its executives and copies of their employment contracts. After review, Meridian provided the Compensation Committee with a detailed report concerning its current and future executive compensation program along with observations of comparable companies. The Compensation Committee met with a representative of Meridian to review and discuss their findings and recommendations. The Compensation Committee may use the services of Meridian or other comparable companies in the future to assist it in providing a fair and competitive compensation plan for its executives.
Nominating Committee. As of December 31, 2016, the Company’s Nominating Committee was composed of Jenifer G. Kimbrough, Carl Dorf, Richard W. Wilcox Jr., Bruce F. Simberg, Thomas A. Rogers and William G. Stewart. Each member is independent as defined by the NASDAQ Rules. During fiscal 2016, the Nominating Committee held two regular meetings. For 2017, the members of the Nominating Committee will be Jenifer G. Kimbrough, Carl Dorf, Richard W. Wilcox Jr., Thomas A. Rogers and William G. Stewart.
In recommending proposed nominees to the full Board, the Nominating Committee is charged with building and maintaining a Board that has an ideal mix of talent and experience to achieve the Company’s business objectives. In particular, the Nominating Committee considers all aspects of a candidate’s qualifications in the context of the needs of the Company at that point in time with a view to creating a Board with a diversity of experience and perspectives. Among the qualifications, qualities and skills of a candidate considered important by the Nominating Committee is a person with strength of character, mature judgment, familiarity with the Company’s business and industry, independence of thought and an ability to work collegially. The Nominating Committee considers diversity, together with these other factors, when evaluating candidates, but does not have a specific policy in place with respect to diversity.
- 81 -
The Nominating Committee will consider candidates for director who are recommended by its members, by other Board members and by management of the Company and who have the experience and skill set best suited to benefit the Company and its shareholders. The Nominating Committee will consider nominees recommended by our shareholders if the shareholder submits the nomination in compliance with the advance notice, information and other requirements described in our bylaws and applicable securities laws. The Nominating Committee evaluates director candidates recommended by shareholders in the same way that it evaluates candidates recommended by its members, other members of the Board, or other persons.
Shareholders who wish to recommend nominees to the Nominating Committee should submit their recommendation in writing to the Secretary of the Company at its executive offices pursuant to the requirements contained in Article III, Section 13 of the Company’s Bylaws. This section provides that the notice shall include: (a) as to each person who the shareholder proposed to nominate for election, (i) name, age, business address and residence address of the person, (ii) the principal occupation or employment of the person, (iii) the class and number of shares of capital stock of the Company which are beneficially owned by the person, (iv) the consent of each nominee to serve as a director of the Company if so elected and (v) any other information relating to the person that is required to be disclosed in solicitation for proxies for the election of directors pursuant to Rule 14A under the Exchange Act; and (b) as to the shareholder giving the notice, the name and record address of the shareholder, and (ii) the class and number of shares of capital stock of the Company which are beneficially owned by the shareholder. The Company may require any proposed nominee to furnish such other information as may reasonably be required by the Company to determine the eligibility of such proposed nominee to serve as a director of the Company. To be timely, a shareholder’s notice shall be delivered to or mailed and received at the Company’s principal executive offices not less than 60 days nor more than 90 days prior to the meeting. If we give less than 70 days’ notice or prior public disclosure of the date of the meeting date, however, notice by the shareholder to be timely must be so received not later than the close of business on the tenth day following either the date we publicly announce the date of our annual meeting or the date of mailing of the notice of the meeting, whichever first occurs.
Investment Committee. As of December 31, 2016, the Company’s Investment Committee was composed of Carl Dorf, Bruce F. Simberg and William G. Stewart. The Investment Committee manages our investment portfolio pursuant to its adopted Investment Policy Statement. Mr. Dorf serves as the Chairman. During fiscal 2016, the Investment Committee held five regular meetings.
Business Development Committee. As of December 31, 2016, the Company’s Business Development Committee was composed of Thomas A. Rogers, Michael H. Braun and Bruce F. Simberg. The Business Development Committee provides advice, oversight and guidance both to management of the Company and to the Board on matters involving the Company’s development of programs and projects, and acquisitions of new technologies or products and other business opportunities of strategic importance to the Company. Mr. Rogers serves as the Chairman. During fiscal 2016, the Business Development Committee held four regular meetings.
We have adopted a Code of Conduct for all employees, officers and directors of the Company. A copy of our Code of Conduct is available on our web site at www.fednat.com.
Section 16(a) Beneficial Ownership Reporting Compliance
Section 16(a) of the Exchange Act requires that our executive officers, directors, and persons who own more than 10% of a registered class of our equity securities to file reports of beneficial ownership and certain changes in beneficial ownership with the SEC and to furnish us with copies of those reports. To our knowledge, based solely on a review of the copies of such reports furnished to us or written representations that no other reports were required, we believe that during the year ended December 31, 2016, our officers, directors and greater than 10% shareholders timely filed all reports required by Section 16(a).
- 82 -
ITEM 11. EXECUTIVE COMPENSATION
COMPENSATION DISCUSSION AND ANALYSIS
The following Compensation Discussion and Analysis describes the components and objectives of the Company’s executive compensation program for fiscal 2016 for our “Named Executive Officers,” describes the process through which the decisions regarding executive compensation have been made, and describes the results of this decision-making process. Our Named Executive Officers for fiscal 2016 were our Chief Executive Officer and President, our Interim Chief Financial Officer and our former Chief Financial Officer. The following Compensation Discussion and Analysis reflects the compensation paid to our Named Executive Officers for fiscal 2016 and the Compensation Committee’s decisions with respect to the compensation for fiscal 2017 for the Named Executive Officers.
Philosophy of the Company’s Executive Compensation Programs
The Compensation Committee of the Board is responsible for establishing, implementing and monitoring adherence to the Company’s compensation philosophy and oversees our compensation programs for our Named Executive Officers. With respect to executive compensation, the Compensation Committee’s primary goals are to attract and retain the most qualified, knowledgeable, dedicated and seasoned executives possible; provide challenging but attainable goals by which to measure performance; reward them for their contributions to the development of the Company’s business; and align the executives’ compensation and incentives with the Company’s performance and the interests of our shareholders. The Compensation Committee also endeavors, while compensating our Named Executive Officers for their performance, to structure the Company’s compensation programs so as to not encourage unnecessary or excessive risk-taking. The Compensation Committee believes that crafting incentives so as to not encourage unnecessary or excessive risk taking is especially important in the homeowners’ insurance industry in the Company’s home state of Florida.
The Compensation Committee is committed to ensuring our compensation programs are strongly aligned with the Company’s long-term business strategy. The Committee seeks to continuously and rigorously evaluate its compensation plans to reflect strong governance practices and shareholder feedback.
|
|
|
|
|
|
|
What We Do |
|
What We Do Not Do |
|
✓ |
Established long-term performance-based criteria for the equity awards to our Chief Executive Officer, which for 2017 will constitute 50% of his total incentive award. |
x |
No change-in-control excise tax gross-ups. |
|
✓ |
Implemented a clawback policy that allows for the recovery of previously paid incentive compensation in the event of a restatement of our financial statements. |
x |
No tax gross-ups on perquisites. |
|
✓ |
Established stock ownership and retention guidelines for our executive officers and directors. |
x |
No excessive perquisites. |
|
✓ |
Conducted robust shareholder outreach program in response to our 2016 say-on-pay vote to solicit investor feedback on compensation plan design and disclosure. |
x |
No hedging or pledging of the Company’s common stock. |
|
✓ |
Amended our Chief Executive Officer’s employment agreement to require a “double trigger” for the payment of change-in-control payments to him, meaning that payments will not be triggered without a qualifying termination following a change in control, and to provide that his change in control payment would be based on the average of the preceding three years’ actual bonuses earned. |
x |
No option repricing without shareholder approval. |
The Company’s 2016 Performance
The Company’s financial results for 2016 reflect the impact of several severe weather events and other challenges in the Company’s operating environment, such as the continuing frequency of the assignment of benefits by insureds to third parties. Nevertheless, the Company achieved significant accomplishments during 2016 that the Company believes will result in increased shareholder value, such as:
|
· |
22.6% increase in gross written premiums to $605.5 million, reflecting market share growth in our homeowners’ and personal automobile lines of business; |
|
· |
9.8% increase in Florida homeowners’ policies to approximately 279,000; |
- 83 -
|
· |
26.6% increase in total revenue to $316.4 million; |
|
· |
$47.6 million increase in gross written premium of our personal automobile line of business to $69.5 million; |
|
· |
Continued development of our partnerships to expand the policies we write, including our agreement with Allstate, and our new agreement with GEICO; |
|
· |
Increases in the Company’s dividend from $0.05 per share beginning December 1, 2015, to $0.06 per share beginning June 1, 2016 and to $0.08 per share beginning December 1, 2016; and |
|
· |
Approval of an average statewide rate increase of 5.6% in effect since August 1, 2016, with another rate increase of 6.5% to be effective August 1, 2017 pending. |
Coupled with those accomplishments, however, were the significant increase in losses from multiple weather events, most particularly Hurricane Matthew, which impacted Florida and South Carolina in October 2016, and the inflated costs of handling homeowners’ claims in Florida, primarily as a result of the growth of assignment of benefits by insureds. The Company anticipates that its approved and pending rate increases should gradually offset the increased costs associated with assignment of benefits claims. In the fourth quarter of 2016, the Company recorded for Hurricane Matthew $47.0 million of gross claims, which represented a decrease from the initial estimate of $77.5 million, and $21.4 million of claims, net of reinsurance. The Company also increased its total loss reserves by $30.6 million during the quarter, which increased the Company’s total loss reserves at December 31, 2016 to $158.1 million. The foregoing resulted in a net loss of $0.2 million or $(0.01) per undiluted share for the year ended December 31. 2016.
Results of Our Evaluations
The following table summarizes the Compensation Committee’s 2016 compensation decisions for our Named Executive Officers, consistent with how the Compensation Committee views total compensation. The Compensation Committee reached these compensation decisions based on its evaluation of performance relative to the incentive criteria established at the beginning of 2016 as described below. For comparative purposes, the table also presents 2015 and 2014 compensation decisions for our Named Executive Officers. While the table below summarizes how the Compensation Committee views compensation, it is not a substitute for the tables and disclosures required by the SEC’s rules, which begin on page 90. Further detail on how individual pay decisions were made and descriptions of the elements of compensation can be found following this table.
|
Named Executive Officer |
Year |
Base Salary Rate |
Annual Incentive Awards |
Long-term Incentive Awards |
Total Compensation |
||||||||||||
|
Michael H. Braun, CEO and President |
2016 |
|
$ |
1,000,000 |
|
|
$ |
0 |
|
|
$ |
0 |
|
|
$ |
1,000,000 |
|
|
2015 |
|
$ |
600,000 |
|
|
$ |
1,200,000 |
|
|
$ |
1,200,000 |
|
|
$ |
3,000,000 |
|
|
|
2014 |
|
$ |
475,000 |
|
|
$ |
950,000 |
|
|
$ |
1,293,000 |
|
|
$ |
2,693,300 |
|
|
|
Peter J. Prygelski III, CFO & Treasurer (1) |
2016 |
|
$ |
325,000 |
|
|
$ |
0 |
|
|
$ |
0 |
|
|
$ |
325,000 |
|
|
2015 |
|
$ |
325,000 |
|
|
$ |
487,500 |
|
|
$ |
243,750 |
|
|
$ |
1,056,250 |
|
|
|
2014 |
|
$ |
300,000 |
|
|
$ |
450,000 |
|
|
$ |
0 |
|
|
$ |
750,000 |
|
|
|
Erick A. Fernandez, Interim CFO and Treasurer (2) |
2016 |
|
$ |
212,000 |
|
|
$ |
30,000 |
|
|
$ |
63,228 |
|
|
$ |
305,228 |
|
|
2015 |
|
$ |
0 |
|
|
$ |
0 |
|
|
$ |
0 |
|
|
$ |
0 |
|
|
|
2014 |
|
$ |
0 |
|
|
$ |
0 |
|
|
$ |
0 |
|
|
$ |
0 |
|
|
(1)Mr. Prygelski separated from the Company in June 2016.
(2)Mr. Fernandez became the Company’s Interim Chief Financial Officer and Treasurer in June 2016. The annual incentive award for Mr. Fernandez was paid pursuant to a bonus agreement entered into prior to his appointment as the Interim Chief Financial Officer. The long-term incentive award consists of restricted stock vesting over three years that was granted to him also prior to his appointment as Interim Chief Financial Officer.
Shareholder Outreach and “Say-on-Pay”
At our advisory shareholder vote on executive compensation in 2016, our say-on-pay proposal received the affirmative vote of 49.07% of the shares voted on the proposal. Our directors nominated for re-election at the 2016 annual meeting, Michael H. Braun, Jenifer G. Kimbrough, Bruce F. Simberg, Thomas A. Rogers and William G. Stewart, received votes for re-election from the shares
- 84 -
voted at the meeting as shown in the table below.
|
Director |
% of Shares Voted |
|
Michael H. Braun |
93.76% |
|
Jenifer G. Kimbrough |
92.65% |
|
Bruce F. Simberg |
86.22% |
|
Thomas A. Rogers |
92.76% |
|
William G. Stewart |
93.48% |
In response to the 2016 say-on-pay vote, the Compensation Committee has sought and received feedback and guidance from shareholders and others regarding the Company’s executive compensation practices, with a view to better understand and address investor concerns, while continuing to evolve our compensation practices in a way that both meets the Board’s compensation goals and benefits our shareholders.
During the course of our outreach, we contacted all of the Company’s top 30 shareholders, representing approximately 62% of our outstanding common stock. We received responses from and engaged in dialogue with seven of these shareholders, and will continue this outreach process during the months preceding our 2017 annual meeting. We also held discussions with the major proxy advisory firms to learn more about their perspectives and policies.
The Compensation Committee has carefully considered the shareholder feedback and guidance it received and has undertaken a comprehensive review of, and made several positive changes to, our executive compensation program.
What We Heard:
|
· |
The metrics used to determine awards under the short and long-term incentive plans should be different from one another and closely tied to Company performance, and Compensation Committee should minimize discretionary payouts. |
|
· |
Our historical reliance on time-based vesting of equity awards should be reduced, with the emphasis instead on performance-based vesting of equity. |
|
· |
Awards made under the long-term incentive plan should be granted predominantly in the form of equity, rather than cash. |
|
· |
The Company should clearly disclose the performance metrics, goals and weighting that were considered when determining our Named Executive Officers’ incentive compensation payouts. |
How We Responded:
|
· |
The Compensation Committee has approved a new formula-based short and long-term incentive plan structure for evaluating our Chief Executive Officer’s performance beginning in 2017, with 50% of his incentive award based on annual goals that reflect the Company’s financial and operating performance on a year-to-year basis, and 50% based on long-term goals that reflect the growth realized by the Company’s shareholders over a more extended horizon. |
|
· |
Beginning in 2017, a portion of our Chief Executive Officer’s awards granted under the long-term incentive plan will be granted in the form of performance-based equity. |
|
· |
We have substantially revamped and restructured our Compensation Discussion and Analysis to provide a more detailed and transparent presentation of the alignment between pay and performance. |
|
· |
We entered into amendments to the employment agreement with our Chief Executive Officer to provide for a “double-trigger” for payment of his change of control bonus and to modify the calculation of that bonus to be based on the average of the Chief Executive Officer’s actual bonuses received for the three years prior to the change of control. |
Evaluation Process
The Compensation Committee conducts an annual review of the total compensation of our executive officers, executive compensation, as well as the mix of elements used to compensate our Named Executive Officers. This review is based in part on an analysis of feedback from shareholders and current best practices in executive compensation and in part on a survey of executive compensation paid by various comparable publicly traded property and casualty insurance companies as reported in each company’s proxy statement. For 2016, our direct peer group encompassed publicly traded companies that compete with us in the Florida homeowners’ insurance market: Heritage Insurance Holdings, Inc. (NYSE: HRTG), HCI Group, Inc. (NYSE: HCI), United Insurance
- 85 -
Holdings Corp. (NASDAQ: UIHC) and Universal Insurance Holdings, Inc. (NYSE: UVE).
In addition to the four insurance companies listed above, the Company included the following companies in its peer group for comparison purposes for 2016:
– Safety Insurance Group Inc. (NASDAQ: SAFT)
– Donegal Group Inc. (NASDAQ: DGICA)
– Greenlight Capital Re Ltd. (NASDAQ: GLRE)
– Third Point Reinsurance Ltd. (NYSE: TPRE)
– Hallmark Financial Services (NASDAQ: HALL)
– First Acceptance Corp. (NYSE: FAC)
– Atlas Financial Holdings Inc. (NASDAQ: AFH)
– RLI Corp. (NYSE: RLI)
– EMC Insurance Group Inc. (NASDAQ: EMCI)
– Baldwin & Lyons (NASDAQ: BWINB)
– Atlantic American Corp. (NASDAQ: AAME)
These additional peers provide the Compensation Committee with a broader perspective of compensation practices among relevant insurance companies. The Committee assessed the competitiveness of the Company’s compensation program in comparison to the entire peer group, as well as the subset of the Company’s direct peers who are competitors in the Florida homeowners’ insurance market.
For the 2016 fiscal year, the Compensation Committee engaged Meridian Compensation Partners, an independent executive compensation consulting firm, to review the structure and competitiveness of the Company’s executive and director compensation for 2016. Meridian provided no other services to the Company other than those directly to the Compensation Committee relating to executive and director compensation. Meridian attended meetings of the Compensation Committee at the request of the committee, met with the Compensation Committee in executive sessions without the presence of management, and communicated with the Chairman of the Compensation Committee with respect to emerging issues.
We also consider the industry knowledge and experience of our Committee members to be an important component of our compensation review process. Our Committee members each have substantial management experience in running businesses in the insurance, financial services and legal services industries, many of which have substantial management teams. As a result, their personal experience extends to developing and implementing management compensation and incentive programs, enabling our Committee members to use that experience when reviewing the Company’s executive compensation programs and working with Meridian to make appropriate updates.
Meridian was provided with information about our Named Executive Officers’ historical compensation and the Company’s financial results, and was provided copies of their employment agreements. Meridian then delivered to the Compensation Committee a detailed report comparing the Company’s current executive compensation program to those comparable companies, together with recommendations for future updates. The Compensation Committee, on multiple occasions, met with or spoke with a representative of Meridian to review and discuss Meridian’s findings and recommendations. The Compensation Committee may use the services of Meridian or other consultants in the future to assist it in providing a fair and competitive compensation plan for its executives.
Elements of Compensation
The Compensation Committee has been committed to updating the Company’s executive compensation programs to reflect the Company’s growth and the evolution of best practices, and to reflect the feedback received as a result of our outreach to our largest shareholders. In that regard, the Compensation Committee approved in 2016 and 2017 a significant revamp of the Company’s compensation practices, in particular the incentive compensation of the Company’s Chief Executive Officer and President. The Company’s executive compensation programs for its Named Executive Officers consist of elements described below.
Base Salary. The Compensation Committee annually reviews the base salaries of the Named Executive Officers, and considers a number of factors, such as each Named Executive Officer’s level of responsibility, performance during the prior fiscal year (with respect to specific areas of responsibility and on an overall basis), past and present contributions to and achievement of Company goals, historical compensation levels of the Named Executive Officer, and the Company’s financial condition and results of operations. The Compensation Committee also considers the median base salary levels for executives in similar positions with similar responsibilities at companies of comparable size in the insurance and financial services industries when reviewing our Named Executive Officers’ base salaries. That review for 2016 indicated that Mr. Braun’s base salary was below the median for the Company’s peer group and lowest among our direct peer group, while Mr. Prygelski’s salary was approximately at the median of our peer group. The Compensation Committee reviewed the compensation analysis report prepared by Meridian and, based on the factors described above, the Compensation Committee approved an increase for fiscal 2016 to Mr. Braun’s base salary to $1,000,000 to bring his base salary above
- 86 -
the median, while Mr. Prygelski’s base salary of $325,000 remained unchanged. Following the resignation of Mr. Prygelski and appointment of Mr. Fernandez as the Interim Chief Financial Officer in June 2016, Mr. Fernandez’s base salary was increased to $212,000. For 2017, both Mr. Braun’s and Mr. Fernandez’s base salaries were unchanged.
Incentive Compensation. Consistent with the Company’s pay-for-performance philosophy of compensating our Named Executive Officers for the Company’s achievements for the prior year and their roles in those achievements, and reflecting the feedback received from our outreach to our largest shareholders, in 2017 the Compensation Committee completely revamped the incentive compensation of our Chief Executive Officer and President.
For 2017, Mr. Braun will be entitled to receive performance-based incentive compensation, 50% of which will be an annual bonus payable in cash and 50% of which will be a long-term incentive bonus payable in equity, based on the performance metrics and weighting described below. The total payout for both the annual and long-term bonuses will be based on Mr. Braun’s base salary of $1,000,000 for 2017, at the threshold, target and maximum percentages indicated below:
|
|
|
|
|
|
|
|
|
|
|
|
|
|
|
Incentive Plan Payout |
||||
|
Annual Incentive Plan(A): |
|
|
|
(% Based on 50% of Base Salary) |
||||
|
|
|
|
|
|
|
|
|
|
|
Performance Metrics |
|
Weight |
|
Threshold |
|
Target |
|
Maximum |
|
Increase in Gross Revenues |
|
33% |
|
100% |
|
175% |
|
250% |
|
Expense Control |
|
33% |
|
100% |
|
175% |
|
250% |
|
EBITDA |
|
33% |
|
100% |
|
175% |
|
250% |
|
|
|
|
|
|
|
|
|
|
|
|
|
|
|
Incentive Plan Payout |
||||
|
Long-Term Incentive Plan: |
|
|
|
(% Based on 50% of Base Salary) |
||||
|
|
|
|
|
|
|
|
|
|
|
Performance Metrics |
|
Weight |
|
Threshold |
|
Target |
|
Maximum |
|
Return on Equity |
|
33% |
|
100% |
|
175% |
|
250% |
|
Increase in Book Value |
|
33% |
|
100% |
|
175% |
|
250% |
|
Relative TSR (3-Year) |
|
33% |
|
100% |
|
175% |
|
250% |
|
(A) |
No payouts will be made under the annual incentive plan unless the Company’s 2017 net income is above a minimum threshold determined by the Compensation Committee. |
The Compensation Committee believes that the annual financial and operating metrics selected for the annual incentive plan—increase in gross revenues, expense control and EBITDA--appropriately reflect the important measurements of the Company’s results of operations on a year-to-year basis, and provide incentives to grow the Company’s business in a cost-effective way.
The metrics selected by the Compensation Committee for the long-term incentive plan—return on equity (“ROE”), increase in book value, and relative shareholder return (“Relative TSR”)—are appropriate measures of the Company’s success over a longer time horizon, with particular emphasis on the measurements that are meaningful to the Company’s shareholders and relevant to the Company’s long-term business strategy. The ROE and increase in book value metrics will be measured over successive one-year performance periods, and the equity granted will vest 1/3 annually beginning one year after the grant date. The Relative TSR metric will be measured over a three-year performance period, and the equity granted will cliff vest at the end of the three-year performance period based on the Company’s performance relative to the primary peer group of Florida homeowners’ insurers. For the Relative TSR metric, the Compensation Committee determined that the most appropriate comparison of the Company’s performance would be to the Company’s direct peer group of Florida homeowners’ insurers because of the unique competitive aspects of the Florida homeowners’ insurance market and because external factors such as hurricanes would likely impact all of the members of the direct peer group in a more consistent way.
The Compensation Committee established the minimum, target and maximum percentages of base salary taking into account that Mr. Braun will receive no increase in base salary for 2017.
- 87 -
The incentive compensation plan structure approved for 2017 is a significant departure from the incentive compensation plan structure approved by the Compensation Committee for 2016. For 2016, Mr. Braun was entitled to receive annual and long-term awards as follows:
|
|
|
|
|
Performance Metrics |
Weight |
2016 Results |
|
Pre-tax income |
45% |
$2.7 million |
|
ROE |
45% |
(5.38)% |
|
Executive-specific goals |
10% |
As determined by the Compensation Committee |
The annual and long-term awards would be based on a percentage of base salary and paid 50% in cash and 50% in the Company’s common stock. Of the equity portion, 75% would time vest over five years and 25% would be granted with performance vesting criteria that will be evaluated over three years. The executive-specific goals for Mr. Braun included increasing the Company’s market share in Florida, expanding the Company’s marketing relationships, and expanding the Company’s product lines The Compensation Committee determined that, although the Company had achieved significant accomplishments during 2016, as described above under “The Company’s 2016 Performance,” the Company’s results did not meet the goals established and therefore Mr. Braun would not be awarded any bonus for 2016.
Erick A. Fernandez, our Interim Chief Financial Officer, received for 2016 a bonus of $30,000 pursuant to a bonus agreement entered into with him when he joined the Company.
Our 2012 Stock Incentive Plan, which was adopted by the Board of Directors and approved by our shareholders in 2012, authorizes us to grant a variety of equity incentive awards, such as incentive stock options, non-qualified stock options, stock appreciation rights, dividend equivalent rights, restricted stock, restricted stock units, and performance shares to officers, directors and executive, managerial, administrative and professional employees of the Company and its subsidiaries. Awards may be granted singly, in combination, or in tandem. Our Compensation Committee is the administrator of the equity plans. The Compensation Committee reviews and approves equity awards to executive officers based upon a review of competitive compensation data, its assessment of individual performance, and retention considerations, as well as a review of the individual’s existing share and option holdings. Equity grants have been made at the discretion of the Compensation Committee and/or executive management members, who have been granted limited authority by the Compensation Committee. To date, only restricted stock has been granted under the 2012 Stock Incentive Plan. The Board has adopted a policy prohibiting repricing of stock options and prohibiting cash buyouts of underwater options, and intends to propose amendments to the 2012 Plan implementing these policies for approval by the Company’s shareholders.
Other Employee Benefit Plans. Our employees, including our Named Executive Officers, are entitled to various employee benefits. These benefits include medical and dental care plans; flexible benefit accounts; life, accidental death and dismemberment and disability insurance; a 401(k) plan; and paid vacation.
Under our 401(k) plan, the Company matches 100% of the first 6% of participant elective contributions and, from time to time, the Board of Directors approves an additional discretionary profit sharing contribution. No additional contribution was approved for 2016. The Board of Directors currently intends to review the Company’s financial results annually to determine whether to approve a discretionary profit sharing contribution in any future years.
Other Compensation. At the present time, we do not offer pension benefits or, except as described above, other forms of deferred compensation plans. The Compensation Committee periodically reviews the overall employment packages and benefits offered to the Company’s Name Executive Officers. As part of that review, Mr. Braun’s employment agreement with the Company was amended in February 2017 to eliminate the 100% coverage of his health insurance premiums, with his reimbursement to be the same as the Company’s other senior management. The Compensation Committee believes that the benefits and perquisites offered to the Named Executive Officers are currently set at competitive levels for comparable companies, requiring no further changes at this time. The Compensation Committee may, however, at its discretion, modify or increase the Named Executive Officers’ executive benefits and perquisites, if it deems it appropriate or advisable.
Clawback Policy. In 2016, the Board adopted a clawback policy applicable to our Named Executive Officers and other current or former executive officers of the Company. Pursuant to this policy, the Company will have the right, in appropriate circumstances as determined by the Board in its sole discretion, to seek to recover all or any part of the cash or equity incentive-based compensation granted to our Named Executive Officers or such other executive officers during the three fiscal years preceding the date on which the Company is required to prepare an accounting restatement to correct a material error, if the restatement is required because of a knowing violation of SEC rules and regulations, GAAP, other applicable legal or regulatory requirements, or Company policy by a Named Executive Officer or such other executive officer. Incentive-based compensation subject to the policy includes any cash or equity compensation granted, earned or vested based wholly or in part on the attainment of a financial reporting measure. Financial reporting measures include measures that are based on accounting principles used in preparing the Company’s financial statements, measures that
- 88 -
are derived from information in the Company’s financial statements, and stock price and total shareholder return. The Board will have the discretion to forgo such recovery if it determines that seeking such recovery would be unreasonable or not in the Company’s best interests.
Stock Ownership and Retention Guidelines. The Board also approved in 2016 stock ownership guidelines applicable to our Named Executive Officers. Under these guidelines, our Chief Executive Officer is required to hold shares of the Company’s common stock with a value of at least six times his annual salary rate, and our Chief Financial Officer is required to hold shares with a value of at least three times his annual salary rate. The guidelines further provide that the Named Executive Officers should achieve the guideline amounts within five years of becoming subject to the policy and, until the guideline amounts are achieved, the Named Executive Officers must retain 66-2/3% of any shares received as equity grants from the Company, net of shares withheld or sold to pay taxes. The Board also prohibited hedging or pledging the Company’s common stock, without exception.
Tax Considerations. Under Section 162(m) of the Internal Revenue Code of 1986, as amended, the federal income tax deductibility of compensation paid to our Named Executive Officers may be limited to the extent that compensation to a Named Executive Officer exceeds $1.0 million in any year. The Company can deduct compensation in excess of that amount if it qualifies as “performance-based compensation” under Section 162(m). Among other things, compensation qualifies as performance-based for purposes of Section 162(m) if the compensation is approved by shareholders or awarded under a plan approved by shareholders. Although the Compensation Committee considers the desirability of limiting our non-deductible expenses when it makes compensation decisions, the committee believes in maintaining the flexibility and competitive effectiveness of the executive compensation program. Tax deductibility, while an important consideration, is analyzed as one component of the overall program.
Compensation Committee Report
The Compensation Committee of the Company has reviewed and discussed the foregoing Compensation Discussion and Analysis with management. Based on our review and discussion with management, we have recommended to the Board of Directors that the Compensation Discussion and Analysis be included in the Company’s SEC filings, including its proxy statement for the 2017 Annual Meeting of Shareholders.
Respectfully Submitted
March 15, 2017
/s/ Richard W. Wilcox Jr., Chairman
/s/ Jenifer G. Kimbrough
/s/ Thomas A. Rogers
SUMMARY COMPENSATION TABLE
The following table sets forth information regarding compensation earned by, awarded to or paid to our Chief Executive Officer and President, our Interim Chief Financial Officer, and our former Chief Financial Officer, for the fiscal years ended December 31, 2016, 2015 and 2014. We refer to these officers as our Named Executive Officers in other parts of this Form 10-K. We currently do not have any other employees of the Company designated as executive officers.
|
|
||||||||||||||||||||||||||
|
|
||||||||||||||||||||||||||
|
|
Non-Equity |
Nonqualified |
||||||||||||||||||||||||
|
|
Incentive Plan |
Deferred |
All Other |
|||||||||||||||||||||||
|
Name and Principal |
Option |
Compensation |
Compensation |
Compensation |
||||||||||||||||||||||
|
Position |
Year |
Salary |
Bonus (1) |
Stock Awards (1) |
Awards |
(2) |
Earnings |
(3) |
Total |
|||||||||||||||||
|
Michael H. Braun |
2016 |
$ |
993,846 |
$ |
— |
$ |
— |
— |
$ |
— |
— |
$ |
36,492 |
$ |
1,030,338 | |||||||||||
|
Chief Executive Officer, |
2015 |
$ |
617,308 |
$ |
1,200,000 |
$ |
600,000 |
(4) |
— |
$ |
600,000 |
— |
$ |
48,466 |
$ |
3,065,774 | ||||||||||
|
President |
2014 |
$ |
469,231 |
$ |
— |
(5) |
$ |
4,703,100 |
(6) |
— |
$ |
— |
— |
$ |
34,883 |
$ |
5,207,214 | |||||||||
|
Peter J. Prygelski III |
2016 |
$ |
325,000 |
$ |
— |
$ |
1,164,529 |
(10) |
— |
$ |
— |
— |
$ |
36,418 |
$ |
1,525,947 | ||||||||||
|
Former Chief Financial Officer, |
2015 |
$ |
336,346 |
$ |
487,500 |
$ |
243,750 |
(4) |
— |
$ |
— |
— |
$ |
51,358 |
$ |
1,118,954 | ||||||||||
|
Treasurer (7) |
2014 |
$ |
297,638 |
$ |
175,000 |
$ |
658,700 |
(8) |
— |
$ |
— |
— |
$ |
39,572 |
$ |
1,170,910 | ||||||||||
|
Erick A. Fernandez |
2016 |
$ |
180,846 |
$ |
40,000 |
$ |
— |
$ |
— |
— |
$ |
8,131 |
$ |
218,977 | ||||||||||||
|
Interim Chief Financial Officer, |
2015 |
$ |
— |
$ |
— |
$ |
— |
— |
$ |
— |
— |
$ |
— |
$ |
— |
|||||||||||
|
Treasurer (9) |
2014 |
$ |
— |
$ |
— |
$ |
— |
— |
$ |
— |
— |
$ |
— |
$ |
— |
|||||||||||
|
(1) |
Reflects cash bonuses earned by the Named Executive Officer for the applicable fiscal year but that were paid in the following fiscal year. The amounts shown for the bonuses and stock awards in 2014 were updated to reflect the amounts awarded for that year but that were paid in the following fiscal year, and to remove amounts paid in that year that were awarded for the prior year. |
|
(2) |
Reflects cash awarded to the Named Executive Officer as long-term incentive compensation for the applicable fiscal year but that was paid in the following fiscal year. |
|
(3) |
See table "All Other Compensation" below for an itemized disclosure of this element of compensation. |
|
(4) |
The nominal amounts remaining after calculation of awards as restricted stock which was based on the fair market value on the grant date of March 10, 2016, which was $19.16 per share, was paid in cash. |
- 89 -
|
(5) |
Mr. Braun elected to receive 100% of his 2014 performance award, which was paid in 2015, as restricted stock. The nominal amounts remaining after calculation of his award as restricted stock, based on the fair market value on the grant dates of March 10, 2015 and May 5, 2015, which were $28.79 and $25.86 per share, respectively, were paid in cash. |
|
(6) |
Includes the 2014 performance awards referenced in Note (5) above and grants made on September 9, 2014 and December 9, 2014, which were awarded to bring his total compensation more in line with the Company’s direct peer group, vest over a five-year period and were based on the fair market values of $25.58 and $26.18, respectively, per share on the grant dates. |
|
(7) |
Mr. Prygelski terminated his employment with the Company on June 20, 2016. The amounts shown include $168,750 paid to Mr. Prygelski in 2016 pursuant to his severance agreement. |
|
(8) |
Reflects a portion of his 2014 performance award, which was paid in 2015, paid in cash and the remaining portion paid in shares of restricted stock. The nominal amount remaining after calculation of his award as restricted stock which was based on the fair market value on the grant date of March 10, 2015, which was $28.79 per share, was paid in cash. Also includes a grant in 2014 to bring his total compensation more in line with the Company’s direct peer group. All unvested shares held by him were vested upon his separation from the Company in June 2016. |
|
(9) |
Mr. Fernandez was appointed Interim Chief Financial Officer effective June 20, 2016. |
|
(10) |
Includes grant date fair value and/or incremental fair value of restricted stock for which vesting was accelerated upon his separation from the Company. |
ALL OTHER COMPENSATION
|
|
|||||||||||||||||
|
|
All Other |
||||||||||||||||
|
|
Club Member |
Insurance |
Contribution to |
Compensation |
|||||||||||||
|
Name |
Year |
Auto |
Fees |
Benefits (1) |
401(k) Plan (2) |
Total |
|||||||||||
|
Michael H. Braun |
2016 |
$ |
3,817 |
(3) |
$ |
-- |
$ |
11,261 |
$ |
20,015 |
$ |
35,093 | |||||
|
|
2015 |
$ |
7,614 |
$ |
-- |
$ |
10,407 |
$ |
19,930 |
$ |
48,466 | ||||||
|
|
2014 |
$ |
7,998 |
$ |
-- |
$ |
9,385 |
$ |
17,500 |
$ |
34,883 | ||||||
|
Peter J. Prygelski III |
2016 |
$ |
2,885 |
$ |
617 |
$ |
12,901 |
$ |
20,015 |
$ |
36,418 | ||||||
|
|
2015 |
$ |
6,231 |
$ |
9,239 |
$ |
7,883 |
$ |
19,930 |
$ |
51,358 | ||||||
|
|
2014 |
$ |
6,000 |
$ |
9,228 |
$ |
6,844 |
$ |
17,500 |
$ |
39,572 | ||||||
|
Erick A. Fernandez |
2016 |
$ |
-- |
$ |
-- |
$ |
-- |
$ |
8,131 |
$ |
8,131 | ||||||
|
|
2015 |
$ |
-- |
$ |
-- |
$ |
-- |
$ |
-- |
$ |
-- |
||||||
|
|
2014 |
$ |
-- |
$ |
-- |
$ |
-- |
$ |
-- |
$ |
-- |
||||||
|
(1) |
Represents premiums for medical insurance. |
|
(2) |
Represents matching contributions and a discretionary profit contribution made by the Company on behalf of the Named Executive Officers to the Company’s 401(k) plan. |
|
(3) |
Mr. Braun’s automobile allowance was eliminated in July 2016 and payment of 100% of his health insurance premiums was eliminated effective January 1, 2017. |
Employment Agreements
Michael H. Braun, Chief Executive Officer and President. We entered into a second amended and restated employment agreement with Michael H. Braun effective as of January 18, 2012, which amended and restated Mr. Braun’s prior employment agreement. In connection with the organization of Monarch National Insurance Company (“Monarch Insurance”) in 2015, the Company's Board of Directors approved an amendment to his employment agreement to extend the term of his employment agreement to four years from the date of the amendment with automatic extensions so that at all times the balance of the term is not less than two years unless sooner terminated as provided in the employment agreement. Under his agreement, Mr. Braun’s annual salary, which may be increased at any time during the term of the agreement, was increased to $1,000,000 effective January 1, 2016. Mr. Braun is also entitled to receive such bonuses and increases as may be awarded by the Board of Directors. It also contains customary confidentiality and non-solicitation provisions. Mr. Braun’s agreement was further amended in 2016 to eliminate a car allowance as a perquisite and to modify the definition of “Good Reason” so that the payments due to him following a “Change in Control” under the agreement will be payable only upon a “double-trigger” and in February 2017 to eliminate his full reimbursement for health insurance and to modify the calculation of his Change of Control bonus, as described below.
Mr. Braun is entitled to receive certain payments upon the termination of employment under certain circumstances as set forth in his agreement, as amended. If his employment is terminated by us without Cause (as defined in his agreement), we must make a lump sum payment to the executive equal to two years' base salary (the “Termination Severance”). In addition, all unvested stock options and any other equity awards held by him will become vested. If Mr. Braun’s employment with us is terminated for Cause or as a result of his death or disability, he will be entitled to his base salary prorated through the date of the termination and any benefits due him as may be provided under the applicable plan, program or arrangement.
The agreement also provides for payments to him if he is employed by us on the date on which a Change of Control occurs. Under the agreements, a “Change of Control” will be deemed to have occurred if: (i) any person, including a “group” as defined
- 90 -
in Section 13(d)(3) of the Exchange Act, becomes the owner or beneficial owner of our securities having 50% or more of the combined voting power of our then-outstanding securities that may be voted for the election of our directors (other than as a result of an issuance of securities initiated by us, or open market purchases approved by our Board, as long as the majority of the Board approving the purchases is the majority at the time the purchases are made), or (ii) the persons who were our directors before such transactions shall cease to constitute a majority of our Board, or any successor to us, as the direct or indirect result of or in connection with, any cash tender or exchange offer, merger or other business combination, sale of assets or contested election, or any combination of the foregoing transactions. If, following a Change in Control, Mr. Braun’s employment is terminated by us (or any successor or subsidiary) without Cause or by the executive for Good Reason (as defined in his agreement), we will make a lump sum payment to the executive in an amount equal to two times the sum of his base salary immediately preceding the Change of Control plus the average of his actual bonus for the three fiscal years immediately preceding the Change of Control (the "Change of Control Severance"). Additionally, all unvested stock options and any other equity awards held by him will become vested and the Company will continue to provide Mr. Braun (and his family) with medical insurance for a period of two years after the date of such termination of employment at no cost and on the same terms and conditions as in effect on the date on which such termination of employment occurs.
If Mr. Braun is terminated by us without Cause prior to a Change of Control, and a Change of Control occurs within six months following such termination, then in addition to the Termination Severance described above, he will be entitled to an additional lump sum payment in an amount equal to (i) the Change of Control Severance, less (ii) the Termination Severance.
As a condition to Mr. Braun’s entitlement to receive the base salary amounts and equity award acceleration referenced above, he is bound by the terms of an agreement that sets forth certain restrictive covenants. Pursuant to the non-competition provisions of this agreement, as amended, he is prohibited from working in the insurance industry in any territories where the Company has been doing business for a period of two years from the date on which he terminates employment with the Company for any reason (other than without cause). For a period of two years after his employment is terminated, he is also prohibited from soliciting, for himself or for any third person, any employees or former employees of the Company, unless the employees have not been employed by the Company for a period in excess of six months, and from disclosing any confidential information that he learned about the Company during his employment. In connection with the organization of Monarch Insurance in 2015, the Company's Board of Directors approved an amendment to his Amended and Restated Non-Competition, Non-Disclosure and Non-Solicitation Agreement dated as of August 5, 2013 (the "Restrictive Covenant Agreement") to permit him to hold his positions with Monarch Insurance and its parent companies (the “Monarch Entities”) while remaining employed by the Company. Mr. Braun's Restrictive Covenant Agreement was further amended to permit him to continue to hold his positions with the Monarch Entities if he is terminated without cause by the Company.
Erick A. Fernandez, Interim Chief Financial Officer. Mr. Fernandez is not currently a party to an employment agreement with the Company. In connection with his joining the Company in January 2016, Mr. Fernandez and the Company entered into a Bonus Agreement dated as of January 11, 2016 (the “Bonus Agreement”) and a Change of Control Agreement dated as of May 2, 2016 (the “Change of Control Agreement”). The Bonus Agreement provides for a bonus payable to Mr. Fernandez on a quarterly basis equal to 0.060% of net income as reported in the Company’s Form 10-Q, with a minimum bonus for 2016 of $40,000. The Change of Control Agreement provides for payments to Mr. Fernandez if he is employed by us on the date on which a Change of Control (as defined above) occurs. If, during the one-year period following a Change in Control, Mr. Fernandez’s employment is terminated by us without Cause or by Mr. Fernandez for Good Reason (each as defined in the Change of Control Agreement), he will be entitled to receive a lump sum payment equal to one year of his base salary in effect immediately prior to the Change of Control.
Peter J. Prygelski III, Former Chief Financial Officer. Mr. Prygelski resigned his positions as Chief Financial Officer and Treasurer of the Company on June 20, 2016 and therefore the employment-related provisions of his Second Amended and Restated Employment Agreement dated effective as of January 18, 2012 were deemed terminated as of that date. The confidentiality, non-competition and non-solicitation provisions remain in effect. In connection with his resignation, the Company agreed to pay him cash severance equal to two years’ base salary, or $650,000, payable bi-weekly over two years, and accelerated the vesting of approximately 66,500 unvested restricted shares.
Grants of Plan Based Awards. The following table provides information regarding restricted stock granted to our Named Executive Officers during 2016 under the Company’s Amended and Restated 2012 Stock Incentive Plan (the “2012 Plan”).
- 91 -
|
|
||||||||||
|
|
All Other Equity Awards |
Exercise or Base |
Grant Date Fair |
|||||||
|
|
/ Number of Securities |
Price of Equity |
Value of |
|||||||
|
Name |
Grant Date |
Underlying Options |
Awards |
Equity Awards (1) |
||||||
|
Michael H. Braun |
3/10/2016 |
31,315 |
(2) |
$ |
19.16 |
$ |
599,995 | |||
|
Peter J. Prygelski III |
3/10/2016 |
12,721 |
(2) |
$ |
19.16 |
$ |
243,734 | |||
|
Erick A. Fernandez |
3/10/2016 |
3,300 |
(3) |
$ |
19.16 |
$ |
63,228 | |||
|
(1) |
This amount reflects the aggregate grant date fair value computed in accordance with FASB ASC Topic 718. Assumptions used in the calculation of this amount are included in Footnote 14 to the Company’s audited financial statements for fiscal year ended December 31, 2016. |
|
(2) |
Shares granted in 2016 for incentive awards based on 2015 performance. |
|
(3) |
Shares granted to Mr. Fernandez upon his employment with the Company and prior to his appointment as Interim Chief Financial Officer. |
Stock Incentive Plan. Our 2012 Plan is administered by the Compensation Committee. The objectives of the 2012 Plan include attracting, motivating and retaining key personnel and promoting our success by linking the interests of our employees, directors and consultants with our success.
Awards may be made under the 2012 Plan in the form of (a) incentive stock options, (b) non-qualified stock options, (c) stock appreciation rights, (d) dividend equivalent rights, (e) restricted stock, (f) unrestricted stock, (g) restricted stock units, and (h) performance shares. No incentive stock option may be granted to a person who is not an employee of the Company or one of its subsidiaries on the date of grant. In addition, both incentive stock options and non-statutory stock options were granted under our 2002 stock option plan. This plan has expired, although as of December 31, 2016, 79,484 options remain outstanding under the 2002 plan.
Shares Available for Issuance. As of December 31, 2016, 367,071 shares were remaining available to be awarded under the 2012 Plan. As of December 31, 2016, all shares of common stock authorized for issuance upon exercise of options granted under the 2002 plan have been issued or are issuable upon exercise of outstanding options. The shares to be delivered pursuant to awards will be made available, at the discretion of the Compensation Committee, from authorized but unissued shares or outstanding options or awards that expire or are cancelled. If shares covered by an option or award cease to be issuable for any reason, such number of shares will no longer count against the shares authorized under the plan and may again be granted under the 2012 Plan.
Vesting Schedule. Awards granted under the 2012 Plan typically vest in equal portions over three or five years. Awards granted under the 2012 Plans require that the recipient of a grant be continuously employed or otherwise provide services to us or our subsidiaries. Failure to be continuously employed or in another service relationship generally results in the forfeiture of awards not vested at the time the employment or other service relationship ends. Termination of a recipient’s employment or other service relationship for cause generally results in the forfeiture of all of the recipient’s unexercised awards.
Policy on Repricing and Cash Buyouts of Underwater Options. The Board has adopted a policy prohibiting repricing of stock options and prohibiting cash buyouts of underwater options, and intends to propose amendments to the 2012 Plan implementing these policies for approval by the Company’s shareholders
Adjustments in Our Capital Structure. The number and kind of shares available for grants under our 2012 Plans and any outstanding awards under the plans, as well as the exercise price of outstanding options or awards, will be subject to adjustment by the Compensation Committee in the event of any merger, consolidation, reorganization, stock split, stock dividend or other event causing a capital adjustment affecting the number of outstanding shares of common stock. In the event of a business combination or in the event of a sale of all or substantially all of our assets, the committee may cash out some or all of the unexercised, vested options or awards under the plan, or allow some or all of the options or awards to remain outstanding, subject to certain conditions. Unless otherwise provided in individual option agreements, the vesting of outstanding options or awards will not accelerate in connection with a business combination or in the event of a sale of all or substantially all of our assets.
Administration. The Compensation Committee has full discretionary authority to determine all matters relating to awards granted under the 2012 Plan, including the persons eligible to receive awards, the number of shares subject to each award, the exercise price of each option or award, if applicable, any vesting schedule, any acceleration of the vesting schedule and any extension of the exercise period. The committee has granted limited authority to executive management members to grant awards to eligible individuals.
Amendment and Termination. Our Board of Directors has authority to suspend, amend or terminate the 2012 Plan, except as would adversely affect participants’ rights to outstanding awards without their consent. The 2012 Plan was amended and restated in March 2013 to clarify the plan administrator’s authority to permit the vesting of unvested restricted shares in the event of the death of the grantee. As the plan administrator, our Committee has the authority to interpret the plans and options or awards granted under the stock plans and to make all other determinations necessary or advisable for plan administration.
- 92 -
Outstanding Equity Awards at Fiscal Year-End. The following table summarizes the equity awards held by our Chief Executive Officer and President and our Interim Chief Financial Officer, as of December 31, 2016.
|
|
||||||||||||||||||
|
Stock Option Awards |
Restricted Stock Awards |
|||||||||||||||||
|
|
Number of |
Market or |
||||||||||||||||
|
|
Unearned |
Payout Value of |
||||||||||||||||
|
|
Number of |
Number of |
Market Value |
Shares, Units |
Unearned |
|||||||||||||
|
|
Securities |
Securities |
Shares |
of Shares |
or Other |
Shares, Units or |
||||||||||||
|
|
Underlying |
Underlying |
Option |
Option |
That |
That Have |
Rights That |
Other Rights |
||||||||||
|
|
Exercisable |
Unexercisable |
Exercise |
Expiration |
Have Not |
Not Vested |
Have Not |
That Have |
||||||||||
|
Name |
Options (#) |
Options (#) |
Price ($) |
Date |
Vested (#) |
($)(1) |
Vested |
Not Vested |
||||||||||
|
Michael H. Braun |
40,000 |
$ |
747,600 |
— |
— |
(2) |
||||||||||||
|
|
14,666 |
$ |
274,108 |
— |
— |
(3) |
||||||||||||
|
|
27,000 |
$ |
504,630 |
— |
— |
(4) |
||||||||||||
|
|
30,000 |
$ |
560,700 |
— |
— |
(5) |
||||||||||||
|
|
21,998 |
$ |
411,143 |
— |
— |
(6) |
||||||||||||
|
|
40,000 |
$ |
747,600 |
— |
— |
(7) |
||||||||||||
|
|
31,315 |
$ |
585,227 |
— |
— |
(8) |
||||||||||||
|
Erick A. Fernandez |
3,300 |
$ |
61,677 |
— |
— |
(8) |
||||||||||||
|
|
||||||||||||||||||
|
|
||||||||||||||||||
|
(1) |
Based on the market value per share of $29.56 on December 31, 2016. |
|
(2) |
Restricted stock vested as to 25% on December 31, 2016, the remaining 50% vest as follows: |
25% on 8/5/2017 and 25% on 8/5 2018.
|
(3) |
Restricted stock vested as to 66 2/3% on December 31, 2016, the remaining 33 1/3% vests on 3/4/2017. |
|
(4) |
Restricted stock vested as to 40% on December 31, 2016, the remaining 60% vest as follows: |
20% on 9/9/2017, 20% on 9/9/2018 and 20% on 9/9/2019.
|
(5) |
Restricted stock vested as to 40% on December 31, 2016, the remaining 60% vest as follows: |
20% on 12/9/2017, 20% on 12/9/2018 and 20% on 12/9/2019.
|
(6) |
Restricted stock vested as to 33 1/3% on December 31, 2016, the remaining 66 2/3% vest as follows: |
33 1/3% on 3/10/2017 and 33 1/3% on 3/10/2018.
|
(7) |
Restricted stock vested as to 20% on December 31, 2016, the remaining 80% vest as follows: |
20% on 5/5/2017, 20% on 5/5/2018, 20% on 5/5/2019 and 20% on 5/5/20
|
(8) |
Restricted stock vests as follows: 33 1/3% on 3/10/2017, 33 1/3% on 3/10/2018 and 33 1/3% on 3/10/2019.. |
Option Exercises and Stock Vested. The following table sets forth certain information with respect to stock options exercised and restricted stock awards vested during calendar year 2016 by our Chief Executive Officer, our former Chief Financial Officer, and our Interim Chief Financial Officer.
|
|
Stock Option Awards |
Restricted Stock Awards |
||||||||
|
|
Shares acquired |
Value Realized on |
Shares Acquired on |
Value Realized on |
||||||
|
Name |
on Exercise (#) |
Exercise ($) |
Vesting (#) |
Vesting ($) |
||||||
|
Michael H. Braun |
15,000 |
$ |
204,461 |
— |
— |
|||||
|
|
10,000 |
$ |
156,133 |
— |
— |
|||||
|
|
15,000 |
$ |
209,500 |
— |
— |
|||||
|
|
— |
— |
8,333 |
$ |
201,075 | |||||
|
|
— |
— |
20,000 |
$ |
370,200 | |||||
|
|
— |
— |
14,665 |
$ |
353,866 | |||||
|
|
— |
— |
9,000 |
$ |
159,840 | |||||
|
|
— |
— |
10,000 |
$ |
187,300 | |||||
|
|
— |
— |
10,999 |
$ |
210,741 | |||||
|
|
— |
— |
10,000 |
$ |
216,300 | |||||
|
Peter J. Prygelski III |
15,000 |
$ |
204,461 |
— |
— |
|||||
|
|
10,000 |
$ |
156,133 |
— |
— |
|||||
|
Erick A. Fernandez |
— |
— |
— |
— |
||||||
- 93 -
Compensation of Directors
Cash Compensation. The Company’s policy is that only our non-employee directors receive annual cash compensation and reimbursement of actual out-of-pocket expenses in connection with their service on the Board. Members of our Board of Directors who are also executive officers do not receive additional compensation for service on the Board. During 2016, the non-employee directors received an annual retainer of $75,000, payable in quarterly installments in January, April, and July and October. We had five non-employee directors until January 20, 2016, when Mr. Simberg re-joined the Board, bringing the total number of non-employee directors to six.
The Company does not currently pay per-meeting fees, but does pay to the non-employee chairperson of certain of the Board committees an additional annual fee for serving as chair. These annual fees are: Chairman of the Board, $40,000; chairperson of the Audit Committee, $20,000; chairperson of the Investment Committee, $17,500; chairperson of the Compensation Committee, $15,000; and chairperson of Business Development Committee, $15,000. Richard W. Wilcox Jr. also received a fee of $20,000 as the Lead Director during 2016, and did not receive any compensation for serving as the chairperson of the Compensation Committee. These annual chair fees are also payable in quarterly installments in January, April, and July and October.
For 2017, the Board approved a 5% increase in the annual retainer and chair fees, reflecting the impact of the Company’s growth, strategic initiatives and operating environment on the Board’s workload.
Equity Compensation. In addition to the cash annual retainers and chair fees, our non-employee directors receive compensation for their service in the form of grants of restricted stock. The Board believes that providing a substantial portion of the non-employee directors’ total compensation in the form of equity aligns the directors’ compensation with the interests of the Company’s shareholders. For 2016, each non-employee director received a grant of $70,000 in shares of restricted stock that vests over three years.
The Board requested in 2015 that Meridian conduct a review of the Board’s compensation of its non-employee directors. Meridian evaluated the Company’s outside director compensation relative to the peer group used for its evaluation of the Company’s executive compensation. This evaluation demonstrated that the Company’s outside director compensation was competitive with its peer group and, therefore, no changes were made for 2016.
Cash compensation paid to, and the dollar value of equity awards granted to, our non-employee directors in 2016 are shown in the table below.
NON-EMPLOYEE DIRECTORS' COMPENSATION SUMMARY
|
|
||||||||||||||||||||
|
|
Equity |
Non-Qualified |
||||||||||||||||||
|
|
Fees Earned |
(Restricted |
Stock |
Non-Equity |
Deferred |
|||||||||||||||
|
|
or Paid in |
Stock) |
Option |
Incentive Plan |
Compensation |
All Other |
||||||||||||||
|
Name |
Cash |
Awards (1) |
Awards (1) |
Compensation |
Earnings |
Compensation |
Total |
|||||||||||||
|
Carl Dorf |
$ |
92,500 |
$ |
69,991 |
— |
— |
— |
— |
$ |
162,491 | ||||||||||
|
Jenifer G. Kimbrough |
$ |
95,000 |
$ |
69,991 |
— |
— |
— |
— |
$ |
164,991 | ||||||||||
|
Thomas A. Rogers |
$ |
86,250 |
$ |
169,988 |
— |
— |
— |
— |
$ |
256,238 | ||||||||||
|
Bruce F. Simberg |
$ |
110,055 |
(2) |
$ |
69,991 |
— |
— |
— |
— |
$ |
180,046 | |||||||||
|
William G. Stewart |
$ |
75,000 |
$ |
169,988 |
— |
— |
— |
— |
$ |
244,988 | ||||||||||
|
Richard W. Wilcox Jr. |
$ |
95,000 |
$ |
69,991 |
— |
— |
— |
$ |
396 |
(3) |
$ |
165,387 | ||||||||
|
(1) |
The following table provides certain additional information concerning the outstanding stock options and/or equity awards held by our non-employee directors as of the end of 2016. |
|
(2) |
Mr. Simberg resigned from the Board of Directors in March 2015 for personal reasons, becoming a consultant to the Company for which he earned consulting fees, and rejoined the Board in January 2016. This amount includes his director’s fees paid to him during 2016 and his consulting fees for the first few weeks of 2016. |
|
(3) |
Includes the fair value of events attended by Mr. Wilcox in 2016, |
- 94 -
|
|
|||||||||
|
|
Total Stock |
||||||||
|
|
Option/Equity Awards |
Stock Option / Equity |
|||||||
|
|
Outstanding at 2016 |
Awards Granted |
Grant Date Fair Value of |
||||||
|
|
Fiscal Year End |
During Fiscal Year |
Equity Awards Granted |
||||||
|
Name |
(Shares) |
2016 (Shares) |
During Fiscal Year 2016 ($) |
||||||
|
Carl Dorf |
37,089 |
(a) |
3,653 |
$ |
69,991 |
(b) |
|||
|
Jenifer G. Kimbrough |
27,089 |
(c) |
3,653 |
$ |
69,991 |
(b) |
|||
|
Thomas A. Rogers |
8,872 |
(d) |
8,872 |
$ |
169,988 |
(b) |
|||
|
Bruce F. Simberg |
3,653 |
(e) |
3,653 |
$ |
69,991 |
(b) |
|||
|
William G. Stewart |
8,872 |
(d) |
8,872 |
$ |
169,988 |
(b) |
|||
|
Richard W. Wilcox Jr. |
12,089 |
(f) |
3,653 |
$ |
69,991 |
(b) |
|||
|
(a) |
Includes 10,000 fully vested options granted on 8/22/2011 with an exercise price of $2.45,and an expiration date of 8/22/2021; 15,000 fully vested options granted on 4/6/2012 with an exercise price of $4.40 and an expiration date of 4/6/2022; 6,000 shares of restricted stock which began vesting at 20% per year on September 9, 2015; 695 shares of restricted stock which began vesting at 33 1/3% per year on March 10, 2016 and 2,435 shares of restricted stock which began vesting at 33 1/3% per year on March 10, 2017. |
|
(b) |
Based on the market value of $19.16 on March 10, 2016. |
(c)Includes 15,000 fully vested options granted on 4/6/2012 with an exercise price of $4.40 and an expiration date of 4/6/2022; 6,000 shares of restricted stock which began vesting at 20% per year on September 9, 2015; 695 shares of restricted stock which began vesting at 33 1/3% per year on March 10, 2016 and 2,435 shares of restricted stock which began vesting at 33 1/3% per year on March 10, 2017.
(d)Includes 2,436 shares of restricted stock which began vesting at 33 1/3% per year on March 10, 2017 and 4,176 shares of restricted stock which began vesting at 20% per year on March 10, 2017.
(e)Includes 2,435 shares of restricted stock which began vesting at 33 1/3% per year on March 10, 2017.
(f)Includes 6,000 shares of restricted stock which began vesting at 20% per year on September 9,2015; 695 shares of restricted stock which began vesting at 33 1/3% per year on March 10, 2016 and 2,435 shares of restricted stock which began vesting at 33 1/3% per year on March 10, 2017.
In March 2016, the Board granted to each of Mr. Rogers and Mr. Stewart $100,000 in shares of restricted stock that vest over five years in consideration of their joining the Board. All of the non-employee directors also received an annual grant of $70,000 in shares of restricted stock in March 2016 that vests over three years.
Director Stock Ownership and Retention Guidelines. The Board approved stock ownership and retention guidelines applicable to our directors. Under these guidelines, our outside, non-employee directors are each required to hold shares of the Company’s common stock with a value of at least four times the annual retainer. The guidelines further provide that the outside directors should achieve the guideline amounts within five years of the policy’s adoption and, until the guideline amounts are achieved, our directors must retain 66-2/3% of any shares received as equity grants from the Company, net of share withheld or sold to pay taxes. The Board also prohibited hedging the Company’s common stock and prohibited pledging the Company’s common stock except in limited circumstances as approved by the Board. All of our directors except for two new Board members are in compliance with these guidelines.
- 95 -
ITEM 12. SECURITY OWNERSHIP OF CERTAIN BENEFICIAL OWNERS AND MANAGEMENT AND RELATED STOCKHOLDER MATTERS
The following table sets forth, as of March 13, 2017, information with respect to the beneficial ownership of our common stock by (i) each person who is known by us to beneficially own 5% or more of our outstanding common stock, (ii) each of our Named Executive Officers, (iii) each of our directors, and (iv) all directors and executive officers as a group.
As used herein, the term “beneficial ownership” with respect to a security is defined by Rule 13d-3 under the Exchange Act as consisting of sole or shared voting power (including the power to vote or direct the vote) and/or sole or shared investment power (including the power to dispose or direct the disposition of) with respect to the security through any contract, arrangement, understanding, relationship or otherwise, including a right to acquire such power(s) during the next 60 days. Unless otherwise noted, beneficial ownership consists of sole ownership, voting and investment rights and the address for each person is c/o Federated National Holding Company, 14050 NW 14 Street, Suite 180, Sunrise, Florida 33323.
|
|
|||||
|
|
Number of Shares |
Percent of |
|||
|
|
Beneficially |
Class |
|||
|
Name and Address of Beneficial Owner |
Owned |
Outstanding (1) |
|||
|
Bruce F. Simberg (2) |
499,018 | 3.60 |
% |
||
|
Michael H. Braun (3) |
458,490 | 3.31 |
% |
||
|
Richard W. Wilcox Jr. (4) |
186,129 | 1.34 |
% |
||
|
Carl Dorf (5) |
175,142 | 1.26 |
% |
||
|
Jenifer G. Kimbrough (6) |
33,914 |
* |
|||
|
Thomas A. Rogers (7) |
8,872 |
* |
|||
|
William G. Stewart (8) |
8,872 |
* |
|||
|
Erick A. Fernandez (9) |
3,300 |
* |
|||
|
|
|||||
|
All directors and executive officers as a group (eight persons) (10) |
1,373,737 | 9.89 |
% |
||
|
|
|||||
|
5% or greater holders: |
|||||
|
Lenox Capital Management, Inc. (11) |
1,023,323 | 7.39 |
% |
||
|
322 Alana Drive |
|||||
|
New Lenox, Il 60451 |
|||||
|
|
|||||
|
BlackRock, Inc. (12) |
955,850 | 6.90 |
% |
||
|
55 East 52nd Street |
|||||
|
New York, NY 10022 |
|||||
|
|
|||||
|
Dimensional Fund Advisors LP (13) |
825,137 | 5.96 |
% |
||
|
Building One |
|||||
|
6300 Bee Cave Road |
|||||
|
Austin, TX 78746 |
|||||
|
|
|||||
|
Renaissance Technologies Holdings Corporation |
703,655 | 5.08 |
% |
||
|
Renaissance Technologies LLC (14) |
|||||
|
800 Third Avenue |
|||||
* Less than 1%.
|
(1) |
Based on 13,853,574 shares outstanding as of March 13, 2017. |
|
(2) |
Includes 2,435 shares of restricted stock, 33 1/3% of which vest each year beginning on March 10, 2017. |
|
(3) |
Includes 40,000 shares of restricted stock, which began vesting over five years beginning on August 5, 2014, 27,000 shares of restricted stock, 20% of which began vesting each year beginning on September 9, 2015, 30,000 shares of restricted stock, 20% of which began vesting each year beginning on December 9, 2015, 10,999 shares of restricted stock, 33 1/3% of which began vesting each year beginning on March 10, 2016, 40,000 shares of restricted stock, of which vest over five years beginning on May 5, 2016, and 25,052 shares of restricted stock, 20% of which vest each year beginning on March 10, 2017. |
- 96 -
|
(4) |
Includes 3,000 shares of common stock held in Mr. Wilcox’s IRA, 40,000 shares of common stock held by Mr. Wilcox’s spouse, 6,000 shares of restricted stock, 20% of which vest each year beginning on September 9, 2015, 695 shares of restricted stock, 33 1/3% of which vest each year beginning on March 10, 2016 and 2,435 shares of restricted stock, 33 1/3% of which vest each year beginning on March 10, 2017 . |
|
(5) |
Includes 63,491 shares of common stock held by Dorf Trust, 59,624 shares of common stock held by Carl Dorf Rollover IRA, 6,000 shares of restricted stock, 20% of which began vesting each year beginning on September 9, 2015, 695 shares of restricted stock, 33 1/3% of which began vesting each year beginning on March 10, 2016, 2,435 shares of restricted stock, 33 1/3% of which vest each year beginning on March 10, 2017 and 25,000 shares of common stock issuable upon the exercise of vested stock options held by Mr. Dorf. |
|
(6) |
Includes 1,110 shares of common stock held in Ms. Kimbrough’s IRA, 6,000 shares of restricted stock, 20% of which vest each year beginning on September 9, 2015, 695 shares of restricted stock, 33 1/3% of which vest each year beginning on March 10, 2016, 2,435 shares of restricted stock, 33 1/3% of which vest each year beginning on March 10, 2017 and 15,000 shares of common stock issuable upon the exercise of vested stock options held by Ms. Kimbrough. |
|
(7) |
Includes 2,435 shares of restricted stock, 33 1/3% of which vest each year beginning on March 10, 2017 and 4,176 shares of restricted stock, 20% of which vest each year beginning on March 10, 2017. |
|
(8) |
Includes 2,435 shares of restricted stock, 33 1/3% of which vest each year beginning on March 10, 2017 and 4,176 shares of restricted stock, 20% of which vest each year beginning on March 10, 2017. |
|
(9) |
Includes 2,200 shares of restricted stock, 33 1/3% of which vest each year beginning on March 10, 2017 |
|
(10) |
Includes 40,000 shares of restricted stock, which began vesting over five years beginning on August 5, 2014, 45,000 shares of restricted stock, 20% of which vest each year beginning on September 9, 2015, 30,000 shares of restricted stock, 20% of which vest each year beginning on December 9, 2015, 13,084 shares of restricted stock, of which 33 1/3% vest each year beginning on March 10, 2016, 40,000 shares of restricted stock, which begin vesting over five years beginning on May 5, 2015, 37,227 shares of restricted stock 33 1/3% of which vest each year beginning on March 10, 2017, 8,352 shares of restricted stock 20% of which will vest beginning March 10, 2017 and 40,000 shares of common stock issuable upon the exercise of vested stock options. |
|
(11) |
This information is based on a Schedule 13G filed with the SEC on June 28, 2016 |
|
(12) |
This information is based on an Amendment No. 2 to the Schedule 13G filed with the SEC on January 24, 2017 |
|
(13) |
This information is based on an Amendment No. 7 to the Schedule 13G filed with the SEC on February 9, 2017 |
|
(14) |
This information is based on a Schedule 13G filed with the SEC on February 14, 2017 |
ITEM 13. CERTAIN RELATIONSHIPS AND RELATED TRANSACTIONS, AND DIRECTOR INDEPENENCE
There are no family relationships between or among our current executive officers and directors.
Related Transactions
The following is a summary of transactions during 2015 and 2016 between the Company and its executive officers, directors, nominees for director, principal shareholders and other related parties involving amounts in excess of $120,000 or that the Company has chosen to voluntarily disclose.
Bruce F. Simberg, our Chairman of the Board, is a partner of the Fort Lauderdale, Florida law firm of Conroy Simberg, which specializes in insurance defense and coverage matters. The Company paid legal fees to Conroy Simberg for services rendered in the amount of $26,286 and $72,198 in 2015 and 2016, respectively. We believe that the fees charged for services provided by Conroy Simberg are on terms at least as favorable as those that we could secure from a non-affiliated law firm. The firm has handled only a limited number of matters for the Company. Mr. Simberg has not been personally involved in any of the legal matters handled by the firm for the Company and he received de minimis direct personal benefit from the fees paid to the firm by the Company. The matters handled by the firm for the Company as of December 31, 2016 have been completed or are in the process of being completed, and the Company does not at this time anticipate retaining the firm for future matters.
During 2015 and 2016, Michael H. Braun, the Company’s Chief Executive Officer and President, received the compensation described in "Executive Compensation" above. Mr. Braun’s brother received salary compensation of $148,917 for his services in 2015 as Vice President of Accounting and Finance and in 2016 as Director of Budgeting and Forecasting, respectively. We believe that the compensation provided to this individual is comparable to that paid by other companies in our industry and market for similar positions.
- 97 -
We have adopted a written policy that any transactions between the Company and executive officers, directors, principal shareholders or their affiliates take place on an arm’s-length basis and require the approval of a majority of our independent directors, as defined in the Nasdaq Rules.
The Board has determined that the following directors are independent pursuant to the Nasdaq Rules applicable to the Company: Bruce F. Simberg, Carl Dorf, Richard W. Wilcox Jr., Jenifer G. Kimbrough, Thomas A. Rogers and William G. Stewart. In making the independence determination with respect to Mr. Simberg, the Board considered that the fees paid by the Company in connection with the legal services provided by Conroy Simberg during the past three fiscal years did not exceed the amounts set forth in Nasdaq Rule 5605(a)(2)(D) and, therefore, the Board has determined that Mr. Simberg qualifies as an independent director under Nasdaq Rule 5605(a)(2).
ITEM 14. PRINCIPAL ACCOUNTING FEES AND SERVICES
The Audit Committee has approved the engagement of Ernst & Young LLP (“E&Y”) as the Company's independent registered public accounting firm to perform the audit of the Company’s consolidated financial statements and management’s assessment of the effectiveness of internal control over financial reporting for the fiscal year ended December 31, 2016. The dismissal of Goldstein Schechter Koch, P.A. ("GSK"), the Company’s prior auditing firm, became effective upon the completion of the 2015 second quarter review by GSK.
Our Audit Committee requires that management obtain the prior approval of the Audit Committee for all audit and permissible non-audited services to be provided by E&Y. The Audit Committee considers and approves at each meeting, as needed, anticipated audit and permissible non-audit services to be provided by E&Y during the year and estimated fees. The Audit Committee Chairman may approve permissible non-audit services with subsequent notification to the full Audit Committee. All services rendered to us by GSK and E&Y in 2016 were pre-approved in accordance with these procedures.
The Company’s independent auditors for the 2016 fiscal year, E&Y, as successor to GSK, has advised the Company that neither it, nor any of its members, has any direct financial interest in the Company as a promoter, underwriter, voting trustee, director, officer or employee. All professional services rendered by E&Y and GSK during the fiscal year ended December 31, 2016 were furnished at customary rates and were performed by full-time, permanent employees.
The following table shows fees that we paid (or accrued) for professional services rendered by E&Y and GSK for fiscal 2016 and 2015.
|
|
|||||||
|
Year Ended December 31, |
|||||||
|
2016 |
2015 |
||||||
|
Audit Fees (1) |
$ |
882,522 |
$ |
1,299,760 |
(2) |
||
|
Audit-Related Fees (4) |
22,055 | 6,425 |
(3) |
||||
|
Tax fees (5) |
205,820 |
— |
|||||
|
All other fees (6) |
— |
— |
|||||
|
Total |
$ |
1,110,397 |
$ |
1,306,185 | |||
(1) Audit fees consisted of audit work performed in the preparation of financial statements, as well as work generally only the independent auditor can reasonably be expected to provide, such as statutory audits.
(2) Represent $0.9 million for fees billed by E&Y and $0.4 million for fees billed by GSK.
(3) Represent fees billed by GSK
(4) Audit-related fees consist of fees billed for assurance and related services that are reasonably related to the performance of the audit or review of our consolidated financial statements and are not reported under “Audit fees.”
(5) Tax fees consist of fees billed for professional services rendered for tax compliance, tax advice, and tax planning. These services include assistance regarding federal, state, and international tax compliance, acquisitions and international tax planning.
(6) All other fees consist of fees for products and services other than the services reported above.
- 98 -
ITEM 15. EXHIBITS, FINANCIAL STATEMENT SCHEDULES, AND REPORTS ON FORM 10-K
|
|
(a) |
The following documents are filed as part of this report. |
|
|
(1) |
Financial Statements |
|
|
|
The following consolidated financial statements of the Company and the reports of independent auditors thereon are filed with this report: |
|
|
|
Independent Auditor’s Reports |
|
|
|
Consolidated Balance Sheets as of December 31, 2016 and 2015 |
|
|
|
Consolidated Statements of Operations for the years ended December 31, 2016, 2015 and 2014. |
|
|
|
Consolidated Statements of Comprehensive Income for the years ended December 31, 2016, 2015 and 2014. |
|
|
|
Consolidated Statements of Shareholders’ Equity for the years ended December 31, 2016, 2015 and 2014. |
|
|
|
Consolidated Statements of Cash Flows for the years ended December 31, 2016, 2015 and 2014. |
|
|
|
Notes to Consolidated Financial Statements for the years ended December 31, 2016, 2015 and 2014. |
|
|
(2) |
Financial Statement Schedules. |
|
|
|
The following are included herein under Item 8, Financial Statements and Supplementary Data: |
|
|
|
Schedule II, Condensed Financial Information of Registrant |
|
|
|
Schedule V, Valuation and Qualifying Accounts |
|
|
|
Schedule VI, Supplemental Information Concerning Insurance Operations |
|
|
(3) |
Exhibits. |
- 99 -
Pursuant to the requirements of Section 13 or 15 (d) of the Securities Exchange Act of 1934, the registrant has duly caused this Form 10-K report to be signed on its behalf by the undersigned, thereto duly authorized.
|
|
FEDERATED NATIONAL HOLDING COMPANY |
|
|
|
|
|
|
|
|
|
By: |
/s/ Michael H. Braun |
|
|
|
|
Michael H. Braun, Chief Executive Officer |
|
|
|
|
(Principal Executive Officer) |
|
|
|
|
|
|
|
|
|
|
|
|
|
|
/s/ Erick A. Fernandez |
|
|
|
|
Erick A. Fernandez, Interim Chief Financial Officer |
|
|
|
|
(Principal Financial and Accounting Officer) |
|
Date: March 16, 2017
Pursuant to the requirements of the Securities Exchange Act of 1934, this Report has been signed by the following persons on behalf of the registrant and in the capacities and on the date indicated.
|
Signature |
|
Title |
Date |
|
|
|
|
|
|
/s/ Michael H. Braun |
|
Chief Executive Officer, President and Director |
March 16, 2017 |
|
Michael H. Braun |
|
(Principal Executive Officer) |
|
|
|
|
|
|
|
|
|
|
|
|
/s/ Erick A. Fernandez |
|
Interim Chief Financial Officer |
March 16, 2017 |
|
Erick A. Fernandez |
|
(Principal Financial and Accounting Officer) |
|
|
|
|
|
|
|
|
|
|
|
|
/s/ Bruce F. Simberg |
|
Chairman of the Board and Director |
March 16, 2017 |
|
Bruce F. Simberg |
|
|
|
|
|
|
|
|
|
|
|
|
|
|
/s/ Carl Dorf |
|
Director |
March 16, 2017 |
|
Carl Dorf |
|
|
|
|
|
|
|
|
|
|
|
|
|
|
/s/ Jenifer G. Kimbrough |
|
Director |
March 16, 2017 |
|
Jenifer G. Kimbrough |
|
|
|
|
|
|
|
|
|
|
|
|
|
|
/s/ Thomas A. Rogers |
|
Director |
March 16, 2017 |
|
Thomas A. Rogers |
|
|
|
|
|
|
|
|
|
|
|
|
|
|
/s/ William G. Stewart |
|
Director |
March 16, 2017 |
|
William G. Stewart |
|
|
|
|
|
|
|
|
|
|
|
|
|
|
/s/ Richard W. Wilcox, Jr. |
|
Director |
March 16, 2017 |
|
Richard W. Wilcox, Jr. |
|
|
|
- 100 -
Index to Financial Statement Schedules
|
|
PAGE |
|
|
|
|
102 |
|
|
106 |
|
|
Schedule VI Supplemental Information Concerning Insurance Operations |
107 |
- 101 -
Schedule II – Condensed Financial Information of Registrant
Condensed Balance Sheets
FEDERATED NATIONAL HOLDING COMPANY (Parent Company Only)
December 31, 2016 and 2015
|
|
||||||
|
|
December 31, |
|||||
|
|
2016 |
2015 |
||||
|
ASSETS |
(in thousands) |
|||||
|
Investments in subsidiaries |
$ |
283,669 |
$ |
282,504 | ||
|
Investments securities, available-for-sale, at fair value |
31,750 | 25,649 | ||||
|
Cash and cash equivalents |
7,786 | 2,397 | ||||
|
Deferred income taxes, net |
— |
485 | ||||
|
Income taxes receivable |
9,811 | 10,471 | ||||
|
Other assets |
2,030 | 1,506 | ||||
|
Total assets |
$ |
335,046 |
$ |
323,012 | ||
|
|
||||||
|
LIABILITIES AND SHAREHOLDERS’ EQUITY |
||||||
|
Due to subsidiaries |
$ |
93,653 |
$ |
70,079 | ||
|
Deferred income taxes, net |
1,642 |
— |
||||
|
Other liabilities |
1,895 | 2,174 | ||||
|
Total liabilities |
97,190 | 72,253 | ||||
|
|
||||||
|
Preferred stock |
— |
— |
||||
|
Common stock |
134 | 138 | ||||
|
Additional paid-in capital |
136,779 | 131,998 | ||||
|
Accumulated other comprehensive income |
1,941 | 3,985 | ||||
|
Retained earnings |
80,275 | 96,461 | ||||
|
Total shareholders’ equity attributable Federated National Holding Company shareholders |
219,129 | 232,582 | ||||
|
Noncontrolling interest |
18,727 | 18,177 | ||||
|
Total shareholders’ equity |
237,856 | 250,759 | ||||
|
Total liabilities and shareholders’ equity |
$ |
335,046 |
$ |
323,012 | ||
See accompanying note to condensed financial statements.
- 102 -
Schedule II – Condensed Financial Information of Registrant (continued)
Condensed Statements of Earnings
FEDERATED NATIONAL HOLDING COMPANY (Parent Company Only)
|
|
|||||||||
|
|
Year Ended December 31, |
||||||||
|
|
2016 |
2015 |
2014 |
||||||
|
|
(in thousands) |
||||||||
|
Revenue: |
|||||||||
|
Management fees |
$ |
2,492 |
$ |
2,489 |
$ |
2,387 | |||
|
Net investment income |
623 | 609 | 417 | ||||||
|
Equity in income of consolidated subsidiaries |
9,480 | 71,905 | 61,653 | ||||||
|
Total revenue |
12,595 | 75,003 | 64,457 | ||||||
|
|
|||||||||
|
Costs and expenses: |
|||||||||
|
General and administrative expenses |
9,862 | 9,810 | 7,150 | ||||||
|
Total costs and expenses |
9,862 | 9,810 | 7,150 | ||||||
|
|
|||||||||
|
Income before income taxes |
2,733 | 65,193 | 57,307 | ||||||
|
Income taxes |
2,683 | 24,753 | 20,108 | ||||||
|
Net income |
50 | 40,440 | 37,199 | ||||||
|
Net income (loss) attributable to noncontrolling interest |
246 | (445) |
— |
||||||
|
|
|||||||||
|
Net (loss) income attributable to Federated National Holding Company shareholders |
$ |
(196) |
$ |
40,885 |
$ |
37,199 | |||
See accompanying note to condensed financial statements.
- 103 -
Schedule II – Condensed Financial Information of Registrant (continued)
Condensed Statements of Cash Flows
FEDERATED NATIONAL HOLDING COMPANY (Parent Company Only)
|
|
|||||||||
|
|
Year Ended December 31, |
||||||||
|
|
2016 |
2015 |
2014 |
||||||
|
|
(in thousands) |
||||||||
|
Cash flow from operating activities: |
|||||||||
|
Net income |
$ |
50 |
$ |
40,440 |
$ |
37,199 | |||
|
Adjustments to reconcile net income to net cash provided by (used in) |
|||||||||
|
Equity in undistributed income of consolidated subsidiaries |
(9,480) | (71,905) | (61,653) | ||||||
|
Depreciation and amortization |
73 | 64 | 92 | ||||||
|
Share-based compensation |
4,420 | 4,527 | 2,140 | ||||||
|
Changes in operating assets and liabilities: |
|||||||||
|
Deferred income taxes, net of other comprehensive (loss) income |
2,127 | (153) | 674 | ||||||
|
Income taxes receivable, net |
2,978 | 24,352 | 16,521 | ||||||
|
Capital contribution payable |
— |
(18,501) | 2,501 | ||||||
|
Due to subsidiaries |
23,574 | 6,430 | (2,069) | ||||||
|
Other, net |
3,786 | 2,057 | 4,460 | ||||||
|
Net cash provided by (used in) operating activities |
27,528 | (12,689) | (135) | ||||||
|
|
|||||||||
|
Cash flow from investing activities: |
|||||||||
|
Capital contributions to consolidated subsidiaries, net |
— |
(32,743) | (18,501) | ||||||
|
Sales, maturities and redemptions of investments securities |
76,928 | 38,612 | 22,414 | ||||||
|
Purchases of investment securities |
(83,724) | (21,354) | (36,949) | ||||||
|
Purchases from property and equipment |
(299) | (113) | (391) | ||||||
|
Net cash used in investing activities |
(7,095) | (15,598) | (33,427) | ||||||
|
Cash flow from financing activities: |
|||||||||
|
Noncontrolling interest equity investment |
— |
18,743 |
— |
||||||
|
Tax benefit related to share-based compensation |
589 | 1,564 | 480 | ||||||
|
Issuance of common stock for share-based awards |
361 | 171 | 1,555 | ||||||
|
Issuance of common stock in public offering |
— |
— |
43,109 | ||||||
|
Purchases of FNHC common stock |
(11,317) |
— |
— |
||||||
|
Dividends paid |
(4,677) | (1,847) | (1,672) | ||||||
|
Net cash (used in) provided by financing activities |
(15,044) | 18,631 | 43,472 | ||||||
|
Net (decrease) increase in cash and cash equivalents |
5,389 | (9,656) | 9,910 | ||||||
|
Cash and cash equivalents at beginning of period |
2,397 | 12,053 | 2,143 | ||||||
|
Cash and cash equivalents at end of period |
$ |
7,786 |
$ |
2,397 |
$ |
12,053 | |||
See accompanying note to condensed financial statements.
- 104 -
Schedule II – Condensed Financial Information of Registrant (continued)
Note to Condensed Financial Statements
FEDERATED NATIONAL HOLDING COMPANY (Parent Company Only)
(1) ORGANIZATION AND BASIS OF PRESENTATION
FNHC, the Parent Company, is an insurance holding company that controls substantially all steps in the insurance underwriting, distribution and claims processes through our subsidiaries and our contractual relationships with our independent agents and general agents.
The accompanying condensed financial statements include the activity of the Parent Company and, on an equity basis, its consolidated subsidiaries. Accordingly, these condensed financial statements have been presented for the parent company only. These condensed financial statements should be read in conjunction with the consolidated financial statements and related notes of FNHC and subsidiaries set forth in Part II, Item 8 “Financial Statements and Supplemental Data” of this Form 10-K.
In applying the equity method to our consolidated subsidiaries, we record the investment at cost and subsequently adjust for additional capital contributions, distributions and proportionate share of earnings or losses.
Certain amounts in prior year’s condensed financial statements have been reclassified to conform to the 2016 presentation.
- 105 -
Schedule V – Valuation and Qualifying Accounts
FEDERATED NATIONAL HOLDING COMPANY AND SUBSIDIARIES
|
|
||||||||||||||
|
|
Charged to |
|||||||||||||
|
|
Balance at |
Costs and |
Balance at |
|||||||||||
|
Year |
Description |
January 1, |
Expenses |
Deductions |
December 31, |
|||||||||
|
|
(in thousands) |
|||||||||||||
|
2016 |
Allowance for uncollectible reinsurance recoverable |
$ |
— |
$ |
— |
$ |
— |
$ |
||||||
|
|
Allowance for uncollectible premiums receivable |
$ |
302 |
$ |
(219) |
$ |
(28) |
$ |
55 | |||||
|
2015 |
Allowance for uncollectible reinsurance recoverable |
$ |
— |
$ |
— |
$ |
— |
$ |
— |
|||||
|
|
Allowance for uncollectible premiums receivable |
$ |
148 |
$ |
192 |
$ |
(38) |
$ |
302 | |||||
|
2014 |
Allowance for uncollectible reinsurance recoverable |
$ |
— |
$ |
— |
$ |
— |
$ |
— |
|||||
|
|
Allowance for uncollectible premiums receivable |
$ |
143 |
$ |
45 |
$ |
(40) |
$ |
148 | |||||
- 106 -
Schedule VI – Supplemental Information Concerning Insurance Operations
FEDERATED NATIONAL HOLDING COMPANY AND SUBSIDIARIES
|
|
||||||||||||||||||||||||||||||||
|
|
At December 31, |
For the Year Ended December 31, |
||||||||||||||||||||||||||||||
|
|
||||||||||||||||||||||||||||||||
|
|
Loss and |
Claim and Claim |
||||||||||||||||||||||||||||||
|
|
Loss |
Adjustment Expenses |
Amortization |
Paid Claims |
||||||||||||||||||||||||||||
|
|
Deferred |
Adjustment |
Net |
Incurred Related to |
of Deferred |
and Claim |
||||||||||||||||||||||||||
|
|
Line of |
Acquisition |
Expense |
Unearned |
Earned |
Investment |
Current |
Prior |
Acquisition |
Adjustment |
Premiums |
|||||||||||||||||||||
|
Year |
Business |
Costs |
Reserves |
Premiums |
Premiums |
Income |
Year |
Year |
Costs |
Expenses |
Written |
|||||||||||||||||||||
|
(in thousands) |
||||||||||||||||||||||||||||||||
|
2016 |
Property and |
$ |
38,962 |
$ |
158,110 |
$ |
294,022 |
$ |
259,872 |
$ |
9,063 |
$ |
174,795 |
$ |
12,546 |
$ |
75,850 |
$ |
160,154 |
$ |
319,499 | |||||||||||
|
2015 |
Property and |
$ |
15,547 |
$ |
97,340 |
$ |
253,960 |
$ |
210,020 |
$ |
7,226 |
$ |
113,819 |
$ |
(9,466) |
$ |
37,276 |
$ |
82,445 |
$ |
225,254 | |||||||||||
|
2014 |
Property and |
$ |
13,610 |
$ |
78,330 |
$ |
192,424 |
$ |
170,905 |
$ |
5,385 |
$ |
79,932 |
$ |
1,104 |
$ |
27,474 |
$ |
71,803 |
$ |
175,158 | |||||||||||
- 107 -
EXHIBIT INDEX
|
|
|
|
Exhibit |
Description |
|
|
|
|
3.1 |
Amended and Restated Articles of Incorporation, as amended (Exhibit 3.1 in the Company’s Quarterly Report on Form 10-Q for the quarter ended September 30, 2012 filed with the SEC on November 14, 2012). |
|
|
|
|
3.2 |
Amended and Restated Bylaws of the Company (incorporated by reference to Exhibit 10.1 in the Company’s Current Report on Form 8-K filed with the SEC on November 28, 2007). |
|
|
|
|
4.1 |
Specimen of Common Stock Certificate (incorporated by reference to Exhibit 4.1 in Amendment No. 1 to the Company’s Registration Statement on Form SB-2 filed with the SEC on October 7, 1998 [File No. 333-63623]). |
|
|
|
|
10.1 |
Amended and Restated 2012 Stock Incentive Plan (incorporated by reference to Exhibit 10.3 in the Company’s Annual Report on Form 10-K for the year ended December 31,2012 filed with the SEC on April 1, 2013).+ |
|
|
|
|
10.2 |
Form of Restricted Stock Agreement between the Company and individuals awarded restricted stock from the 2012 Stock Incentive Plan, as amended (incorporated by reference to Exhibit 10.1 in the Company’s Current Report on Form 8-K filed with the SEC on March 8, 2012).+ |
|
|
|
|
10.3 |
Federated National Holding Company 2002 Stock Option Plan, as amended, and Stock Plan Acknowledgment (incorporated by reference to Annex A in the Company’s Definitive Proxy Statement for its 2009 Annual Meeting of Stockholders filed with the SEC on April 2, 2009).+ |
|
|
|
|
10.5 |
Form of Indemnification Agreement between the Company and its directors and executive officers (incorporated by reference from Exhibit 10.15 in the Company’s Annual Report on Form 10-K for its year ended December 31, 1007 filed with the SEC on March 17, 2008). |
|
|
|
|
10.6 |
Reimbursement Contract between Federated National Insurance Company and The State Board of Administration of Florida (SBA) which administers the Florida Hurricane Catastrophe Fund (FHCF) effective June 1, 2015 (incorporated by reference to Exhibit 10.1 in the Company’s Current Report on Form 8-K filed with the SEC on February 23, 2015). |
|
|
|
|
10.7 |
Excess Catastrophe Reinsurance Contract, effective July 1, 2015, between Federated National Insurance Company and subscribing reinsurers (incorporated by reference from Exhibit 10.1 in the Company’s Quarterly Report on Form 10-Q for its quarter ended September 30, 2015 filed with the SEC on November 9, 2015). |
|
|
|
|
10.8 |
Reinstatement Premium Protection Reinsurance Contract, effective July 1, 2015, between Federated National Insurance Company and subscribing reinsurers (incorporated by reference from Exhibit 10.2 in the Company’s Quarterly Report on Form 10-Q for its quarter ended September 30, 2015 filed with the SEC on November 9, 2015). |
|
|
|
|
10.9 |
Homeowners Quota Share Reinsurance Contract, effective July 1, 2015 between Federated National Insurance Company and subscribing reinsurers (incorporated by reference from Exhibit 10.3 in the Company’s Quarterly Report on Form 10-Q for its quarter ended September 30, 2015 filed with the SEC on November 9, 2015). |
|
|
|
|
10.10 |
Non-Florida Property Catastrophe Excess of Loss Reinsurance Contract, effective July 1, 2015 between Federated National Insurance Company and subscribing reinsurers (incorporated by reference from Exhibit 10.4 in the Company’s Quarterly Report on Form 10-Q for its quarter ended September 30, 2015 filed with the SEC on November 9, 2015). |
|
|
|
|
10.11 |
Non-Florida Reinstatement Premium Protection Reinsurance Contract, effective July 1, 2015 between Federated National Insurance Company and subscribing reinsurers (incorporated by reference from Exhibit 10.5 in the Company’s Quarterly Report on Form 10-Q for its quarter ended September 30, 2015 filed with the SEC on November 9, 2015). |
|
|
|
|
10.12 |
FHCF Supplement Layer Reinsurance Contract, effective June 1, 2015 between Federated National Insurance Company and subscribing reinsurers (incorporated by reference from Exhibit 10.6 in the Company’s Quarterly Report on Form 10-Q for its quarter ended September 30, 2015 filed with the SEC on November 9, 2015). |
- 108 -
|
|
|
|
10.13 |
Order to Cease and Desist dated May 19, 2015 from the Florida Office of Insurance Regulation to Federated National Insurance Company (incorporated by reference from Exhibit 99.1 in the Company’s Current Report on Form 8-K filed with the SEC on June 8, 2015). |
|
|
|
|
10.14 |
Final Order dated October 21, 2015 from the Florida Office of Insurance Regulation to Federated National Insurance Company (incorporated by reference to Exhibit 99.1 in the Company’s Current Report on Form 8-K filed with the SEC on October 26, 2015). |
|
|
|
|
10.15 |
Form of Amended and Restated Non-Competition, Non-Disclosure and Non-Solicitation Agreement between the Company and certain employees of the Company (incorporated by reference to Exhibit 10.1 in the Company’s Current Report on Form 8-K filed with the SEC on August 7, 2013) |
|
|
|
|
10.16 |
Second Amended and Restated Employment Agreement dated January 18, 2012 between the Company and Michael H. Braun (incorporated by reference to Exhibit 10.1 in the Company’s Current Report on Form 8-K filed with the SEC on January 20, 2012).+ |
|
|
|
|
10.17 |
Second Amended and Restated Employment Agreement dated January 18, 2012 between the Company and Peter J. Prygelski, III (incorporated by reference to Exhibit 10.2 in the Company’s Current Report on Form 8-K filed with the SEC on January 20, 2012).+ |
|
|
|
|
10.18 |
Amendment to Employment Agreement and Restrictive Covenant Agreement effective as of March 17, 2015 between Monarch Delaware Holdings LLC and Michael H. Braun (incorporated by reference from Exhibit 10.3 in the Company’s Quarterly Report on Form 10-Q for its quarter ended March 31, 2015 filed with the SEC on May 11, 2015).+ |
|
|
|
|
10.19 |
Non-Competition, Non-Disclosure and Non-Solicitation Agreement effective as of March 17, 2015 between Monarch Delaware Holdings LLC and Michael H. Braun (incorporated by reference from Exhibit 10.4 in the Company’s Quarterly Report on Form 10-Q for its quarter ended March 31, 2015 filed with the SEC on May 11, 2015).+ |
|
|
|
|
10.20 |
Amendment No. 1 to the Amended and Restated Non-Competition, Non-Disclosure and Non-Solicitation Agreement effective March 17, 2015 between Federated National Holding Company and Peter J. Prygelski, III (incorporated by reference from Exhibit 10.5 in the Company’s Quarterly Report on Form 10-Q for its quarter ended March 31, 2015 filed with the SEC on May 11, 2015).+ |
|
|
|
|
10.21 |
Insurance Agency Master Agreement dated February 4, 2013 between Ivantage Select Agency, Inc. and Federated National Underwriters, Inc. (incorporated by reference from Exhibit 10.5 in the Company’s Quarterly Report on Form 10-Q for its quarter ended September 30, 2013 filed with the SEC on November 6, 2013). |
|
|
|
|
10.22 |
First Amendment to Insurance Agency Master Agreement dated February 12, 2013 between Ivantage Select Agency, Inc. and Federated National Underwriters, Inc. (incorporated by reference from Exhibit 10.6 in the Company’s Quarterly Report on Form 10-Q for its quarter ended September 30, 2013 filed with the SEC on November 6, 2013). |
|
|
|
|
10.23 |
Second Amendment to Insurance Agency Master Agreement dated January 1, 2015 between Federated National Underwriters, Inc. and Ivantage Select Agency, Inc. (incorporated by reference from Exhibit 10.6 in the Company’s Quarterly Report on Form 10-Q for its quarter ended March 31, 2015 filed with the SEC on May 11, 2015). |
|
|
|
|
10.24 |
Subscription Agreement, effective as of July 18, 2014, among C.A. Bancorp Inc., Federated National Holding Company, and Transatlantic Reinsurance Company (incorporated by reference from Exhibit 10.6 in the Company’s Quarterly Report on Form 10-Q for its quarter ended September 30, 2014 filed with the SEC on November 10, 2014). |
|
|
|
|
10.25 |
Managing General Agent and Claims Administration Agreement dated as of March 17, 2015 between Monarch National Insurance Company and FedNat Underwriters, Inc. (incorporated by reference from Exhibit 10.1 in the Company’s Quarterly Report on Form 10-Q for its quarter ended March 31, 2015 filed with the SEC on May 11, 2015). |
- 109 -
|
|
|
|
10.26 |
Limited Liability Company Agreement of Monarch Delaware Holdings LLC dated as of March 17, 2015 (incorporated by reference from Exhibit 10.2 in the Company’s Quarterly Report on Form 10-Q for its quarter ended March 31, 2015 filed with the SEC on May 11, 2015). |
|
|
|
|
10.27 |
Consulting Agreement dated as of May 6, 2015 between Bruce F. Simberg and Federated National Holding Company (incorporated by reference from Exhibit 10.7 in the Company’s Quarterly Report on Form 10-Q for its quarter ended March 31, 2015 filed with the SEC on May 11, 2015). |
|
|
|
|
10.28 |
Reimbursement Contract between Federated National Insurance Company and The State Board of Administration of Florida (SBA) which administers the Florida Hurricane Catastrophe Fund (FHCF) to be effective June 1, 2016 (incorporated by reference to Exhibit 10.1 in the Company’s Current Report on Form 8-K filed with the SEC on March 2, 2016). |
|
|
|
|
10.29 |
Reimbursement Contract between Monarch National Insurance Company and The State Board of Administration of Florida (SBA) which administers the Florida Hurricane Catastrophe Fund (FHCF) to be effective June 1, 2016 (incorporated by reference to Exhibit 10.2 in the Company’s Current Report on Form 8-K filed with the SEC on March 2, 2016). |
|
|
|
|
10.30 |
Bonus Agreement dated as of January 11, 2016 between Federated National Holding Company and Erick Fernandez.+* |
|
|
|
|
10.31 |
Change of Control Agreement dated as of May 2, 2016 between Federated National Holding Company and Erick Fernandez.+* |
|
|
|
|
21.1 |
Subsidiaries of the Company * |
|
|
|
|
23.1 |
Consent of Goldstein, Schechter, Koch, P.A. Independent Certified Public Accountants * |
|
|
|
|
23.2 |
Consent of Ernst & Young LLP Independent Certified Public Accountants * |
|
|
|
|
31.1 |
Certification of Chief Executive Officer pursuant to Section 302 of the Sarbanes-Oxley Act * |
|
|
|
|
31.2 |
Certification of Chief Financial Officer pursuant to Section 302 of the Sarbanes-Oxley Act * |
|
|
|
|
32.1 |
Certification of Chief Executive Officer pursuant to Section 906 of the Sarbanes-Oxley Act * |
|
|
|
|
32.2 |
Certification of Chief Financial Officer pursuant to Section 906 of the Sarbanes-Oxley Act * |
|
|
|
|
101.INS-XBRL Instance Document. ** |
|
|
101.SCH-XBRL Taxonomy Extension Schema Document. ** |
|
|
101.CAL-XBRL Taxonomy Extension Calculation Linkbase Document. ** |
|
|
101.LAB-XBRL Taxonomy Extension Label Linkbase Document. ** |
|
|
101.PRE-XBRL Taxonomy Extension Presentation Linkbase Document. ** |
|
________________________
+ Management Compensation Plan or Arrangement
* Filed herewith
** In accordance with Rule 406T of Regulation S-T, these interactive data files are deemed not filed for purposes of Section 18 of the Exchange Act, or otherwise subject to the liability of that section, and shall not be part of any registration statement or other document filed under the Securities Act of Exchange Act, except as shall be expressly set forth by specific reference in such filing.
- 110 -