Attached files
| file | filename |
|---|---|
| EX-99.1 - EX-99.1 - SYNAPTICS Inc | d522136dex991.htm |
| 8-K - 8-K - SYNAPTICS Inc | d522136d8k.htm |

First Quarter Fiscal 2019 Earnings November 8, 2018 Exhibit 99.2
This presentation contains forward-looking statements that are subject to the safe harbors created under the Securities Act of 1933, as amended (the “Securities Act”), and the Securities Exchange Act of 1934, as amended (the “Exchange Act”). Forward-looking statements give our current expectations and projections relating to our financial condition, results of operations, plans, objectives, future performance and business, and can be identified by the fact that they do not relate strictly to historical or current facts. Such forward-looking statements may include words such as ”expect,” “anticipate,” “intend,” “believe,” “estimate,” “plan,” “target,” “strategy,” “continue,” “may,” “will,” “should,” variations of such words, or other words and terms of similar meaning. All forward-looking statements reflect our best judgment and are based on several factors relating to our operations and business environment, all of which are difficult to predict and many of which are beyond our control. Such factors include, but are not limited to, the risks as identified in the “Risk Factors,” “Management’s Discussion and Analysis of Financial Condition and Results of Operations” and “Business” sections of our Annual Report on Form 10-K for the fiscal year ended June 30, 2018, and other risks as identified from time to time in our Securities and Exchange Commission reports. Forward-looking statements are based on information available to us on the date hereof, and we do not have, and expressly disclaim, any obligation to publicly release any updates or any changes in our expectations, or any change in events, conditions, or circumstances on which any forward-looking statement is based. Our actual results and the timing of certain events could differ materially from the forward-looking statements. These forward-looking statements do not reflect the potential impact of any mergers, acquisitions, or other business combinations that had not been completed as of the date of this presentation. Safe Harbor Statement
Non-GAAP Results •In evaluating our business, we consider and use non-GAAP net income, which we define as net income excluding share-based compensation, acquisition related costs, and certain other non-cash or recurring and non-recurring items we do not believe are indicative of our core operating performance as a supplemental measure of operating performance. •Non-GAAP net income is not a measurement of our financial performance under GAAP and should not be considered as an alternative to GAAP net income. We present non-GAAP net income because we consider it an important supplemental measure of our performance since it facilitates operating performance comparisons from period to period by eliminating potential differences in net income caused by the existence and timing of share-based compensation charges, acquisition related costs, and certain other non-cash or recurring and non-recurring items. •Non-GAAP net income has limitations as an analytical tool and should not be considered in isolation or as a substitute for our GAAP net income. The principal limitations of this measure are that it does not reflect our actual expenses and may thus have the effect of inflating our net income and net income per share as compared to our operating results reported under GAAP. •Please see our first quarter fiscal 2019 press release for additional discussion of our use of non-GAAP financial measures, and the tables attached to the end of this presentation for a complete reconciliation of GAAP to non-GAAP financial measures used in this presentation.
Synaptics Key Commentary Diversification leading to expected gross margin expansion and earnings growth in FY19 Combination of strong revenue and non-GAAP GM% drove Q1 non-GAAP EPS up 20% YoY At mid-point, seasonal sequential growth in Q2 driving projected non-GAAP EPS up 26% YoY Resumed stock repurchase program with the repurchase of 862,454 shares in Q1 Product News: OLED DDICs and touch controllers featured in Huawei Mate 20 Pro COF display solutions for OLED and LCD selected by broad variety of smartphone OEMs Synaptics digital headset SoC selected for Google Pixel USB-C Earbuds Launched new virtual reality display driver and VR bridge Automotive TDDI selected by Tier 1s and OEMs for upcoming vehicles AudioSmart Far-Field Voice featured in TCL’s new Alexa Built-In TVs New VideoSmart processor integrates AudioSmart Far-Field Voice for STB's Partnered with industry-leaders on turnkey Android TV STB for pay TV operators
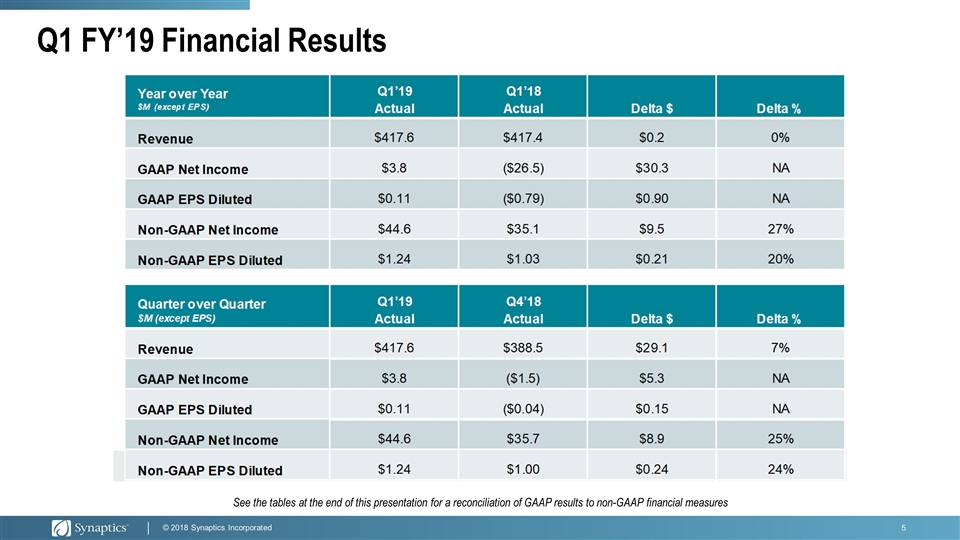
Q1 FY’19 Financial Results See the tables at the end of this presentation for a reconciliation of GAAP results to non-GAAP financial measures Year over Year Q1’19 Actual Q1’18 Actual Delta $ Delta % Non-GAAP EPS Diluted
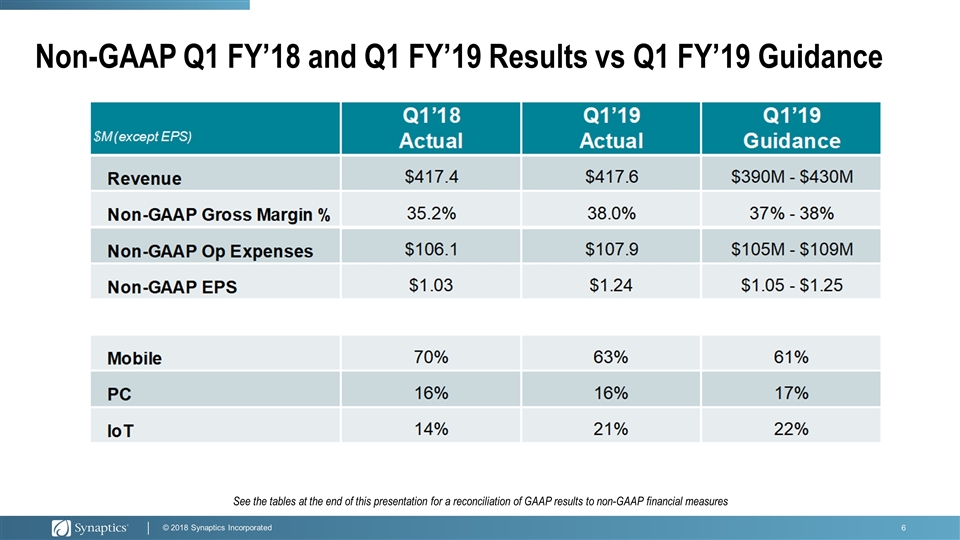
Non-GAAP Q1 FY’18 and Q1 FY’19 Results vs Q1 FY’19 Guidance See the tables at the end of this presentation for a reconciliation of GAAP results to non-GAAP financial measures
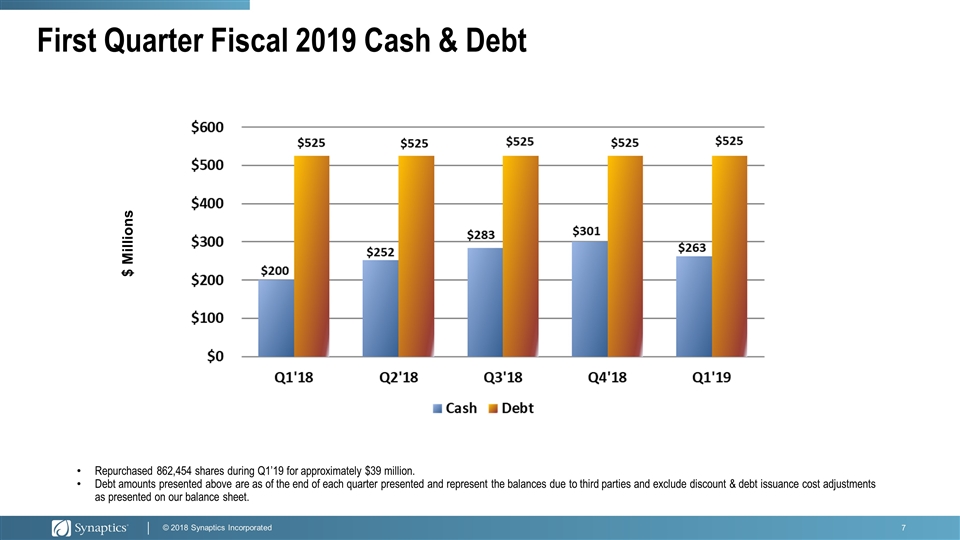
First Quarter Fiscal 2019 Cash & Debt Repurchased 862,454 shares during Q1’19 for approximately $39 million. Debt amounts presented above are as of the end of each quarter presented and represent the balances due to third parties and exclude discount & debt issuance cost adjustments as presented on our balance sheet. $ Millions
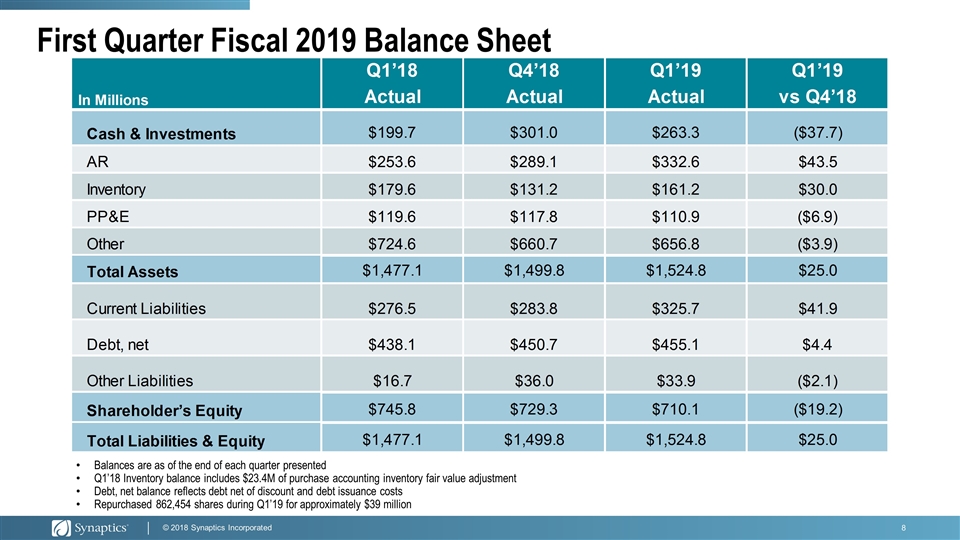
First Quarter Fiscal 2019 Balance Sheet Balances are as of the end of each quarter presented Q1’18 Inventory balance includes $23.4M of purchase accounting inventory fair value adjustment Debt, net balance reflects debt net of discount and debt issuance costs Repurchased 862,454 shares during Q1’19 for approximately $39 million
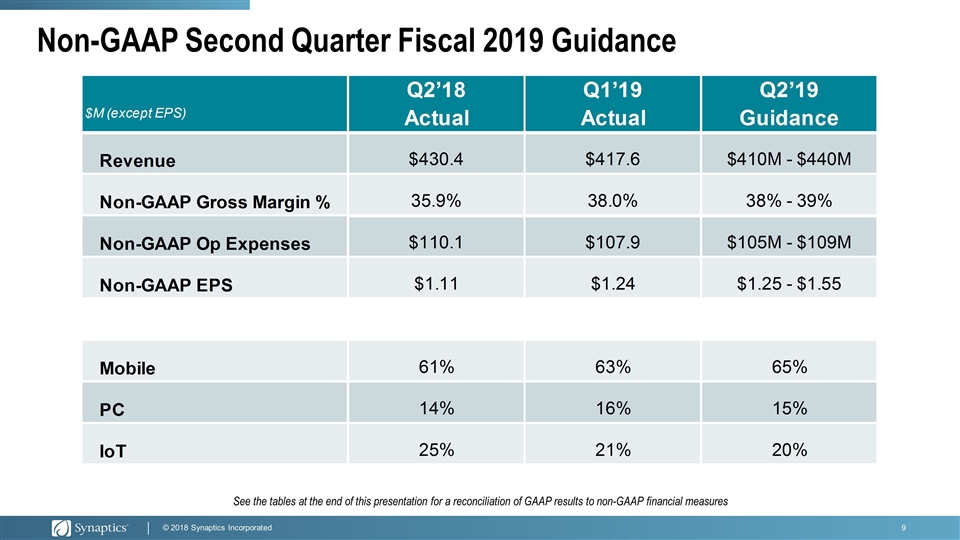
Non-GAAP Second Quarter Fiscal 2019 Guidance See the tables at the end of this presentation for a reconciliation of GAAP results to non-GAAP financial measures
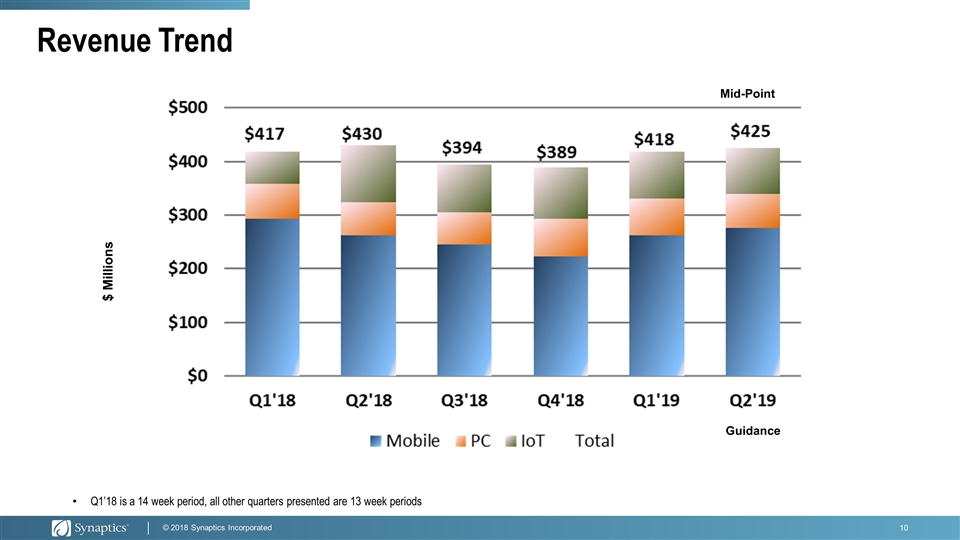
Revenue Trend $ Millions Q1’18 is a 14 week period, all other quarters presented are 13 week periods Mid-Point Guidance
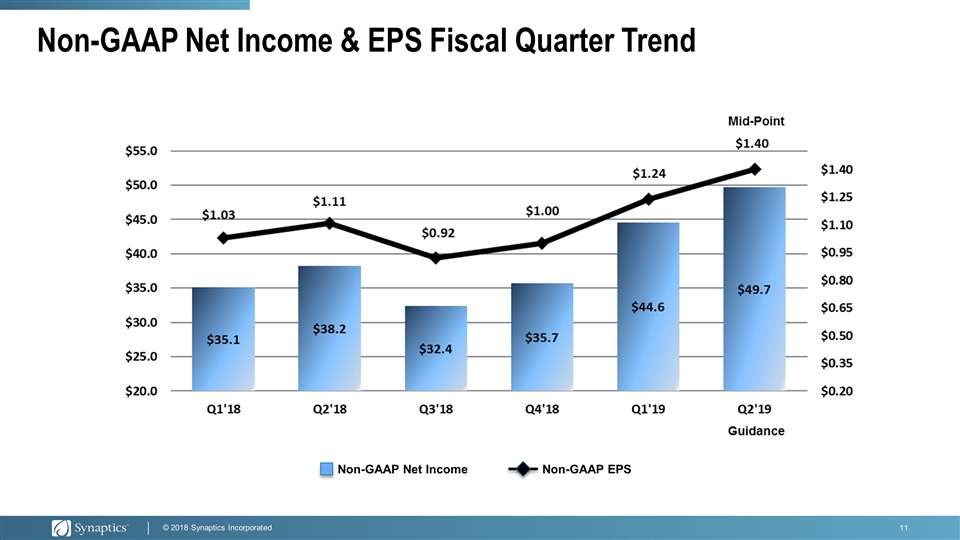
Non-GAAP Net Income & EPS Fiscal Quarter Trend Non-GAAP Net Income Non-GAAP EPS
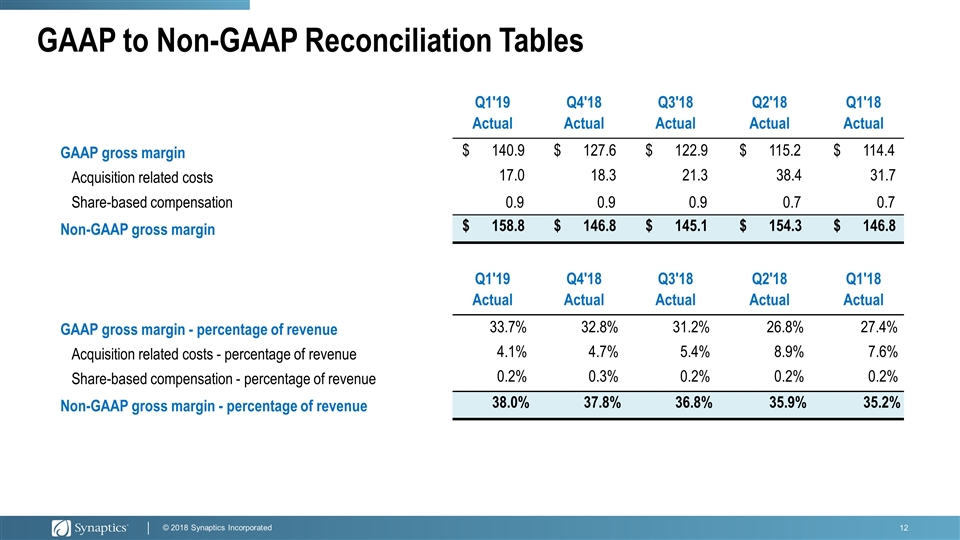
GAAP to Non-GAAP Reconciliation Tables Q1'19 Actual Q4'18 Actual Q3'18 Actual Q2'18 Actual Q1'18 Actual GAAP gross margin $ 140.9 $ 127.6 $ 122.9 $ 115.2 $ 114.4 Acquisition related costs 17.0 18.3 21.3 38.4 31.7 Share-based compensation 0.9 0.9 0.9 0.7 0.7 Non-GAAP gross margin $ 158.8 $ 146.8 $ 145.1 $ 154.3 $ 146.8 Q1'19 Actual Q4'18 Actual Q3'18 Actual Q2'18 Actual Q1'18 Actual GAAP gross margin - percentage of revenue 33.7% 32.8% 31.2% 26.8% 27.4% Acquisition related costs - percentage of revenue 4.1% 4.7% 5.4% 8.9% 7.6% Share-based compensation - percentage of revenue 0.2% 0.3% 0.2% 0.2% 0.2% Non-GAAP gross margin - percentage of revenue 38.0% 37.8% 36.8% 35.9% 35.2%
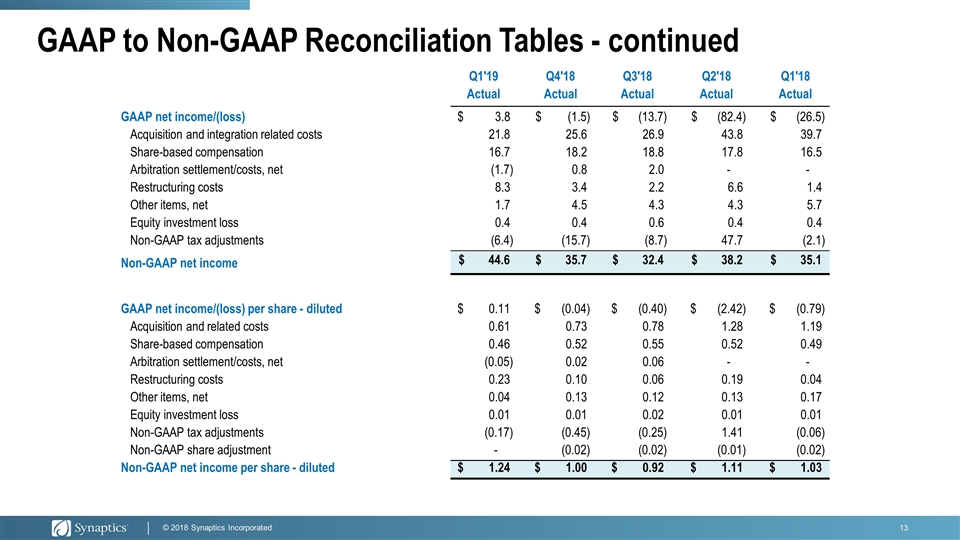
GAAP to Non-GAAP Reconciliation Tables - continued Q1'19 Actual Q4'18 Actual Q3'18 Actual Q2'18 Actual Q1'18 Actual GAAP net income/(loss) 3.8 $ (1.5) $ (13.7) $ (82.4) $ (26.5) $ Acquisition and integration related costs 21.8 25.6 26.9 43.8 39.7 Share-based compensation 16.7 18.2 18.8 17.8 16.5 Arbitration settlement/costs, net (1.7) 0.8 2.0 - - Restructuring costs 8.3 3.4 2.2 6.6 1.4 Other items, net 1.7 4.5 4.3 4.3 5.7 Equity investment loss 0.4 0.4 0.6 0.4 0.4 Non-GAAP tax adjustments (6.4) (15.7) (8.7) 47.7 (2.1) Non-GAAP net income $ 44.6 $ 35.7 $ 32.4 $ 38.2 $ 35.1 GAAP net income/(loss) per share - diluted 0.11 $ (0.04) $ (0.40) $ (2.42) $ (0.79) $ Acquisition and related costs 0.61 0.73 0.78 1.28 1.19 Share-based compensation 0.46 0.52 0.55 0.52 0.49 Arbitration settlement/costs, net (0.05) 0.02 0.06 - - Restructuring costs 0.23 0.10 0.06 0.19 0.04 Other items, net 0.04 0.13 0.12 0.13 0.17 Equity investment loss 0.01 0.01 0.02 0.01 0.01 Non-GAAP tax adjustments (0.17) (0.45) (0.25) 1.41 (0.06) Non-GAAP share adjustment - (0.02) (0.02) (0.01) (0.02) Non-GAAP net income per share - diluted 1.24 $ 1.00 $ 0.92 $ 1.11 $ 1.03 $
