Attached files
| file | filename |
|---|---|
| EXCEL - IDEA: XBRL DOCUMENT - SYNAPTICS Inc | Financial_Report.xls |
| EX-10.25.A - EX-10.25(A) - SYNAPTICS Inc | d736661dex1025a.htm |
| EX-21 - EX-21 - SYNAPTICS Inc | d736661dex21.htm |
| EX-10.34 - EX-10.34 - SYNAPTICS Inc | d736661dex1034.htm |
| EX-31.2 - EX-31.2 - SYNAPTICS Inc | d736661dex312.htm |
| EX-32.2 - EX-32.2 - SYNAPTICS Inc | d736661dex322.htm |
| EX-31.1 - EX-31.1 - SYNAPTICS Inc | d736661dex311.htm |
| EX-32.1 - EX-32.1 - SYNAPTICS Inc | d736661dex321.htm |
| EX-10.28 - EX-10.28 - SYNAPTICS Inc | d736661dex1028.htm |
| EX-2.2 - EX-2.2 - SYNAPTICS Inc | d736661dex22.htm |
| EX-23.1 - EX-23.1 - SYNAPTICS Inc | d736661dex231.htm |
Table of Contents
UNITED STATES
SECURITIES AND EXCHANGE COMMISSION
WASHINGTON, D.C. 20549
FORM 10-K
ANNUAL REPORT PURSUANT TO SECTION 13 OR 15(d)
OF THE SECURITIES EXCHANGE ACT OF 1934
For the Fiscal Year Ended June 28, 2014
Commission File Number 000-49602
SYNAPTICS INCORPORATED
(Exact name of registrant as specified in its charter)
| Delaware | 77-0118518 | |
| (State or other jurisdiction of incorporation or organization) |
(I.R.S. Employer Identification No.) |
| 1251 McKay Drive San Jose, California |
95131 | |
| (Address of principal executive offices) | (Zip Code) |
(408) 904-1100
Registrant’s telephone number, including area code
Securities registered pursuant to Section 12(b) of the Act:
| Title of each class |
Name of each exchange on which registered | |
| Common Stock, par value $.001 per share | The Nasdaq Global Select Market | |
| Preferred Stock Purchase Rights | The Nasdaq Global Select Market |
Securities registered pursuant to Section 12(g) of the Act: None
Indicate by check mark if the registrant is a well-known seasoned issuer, as defined in Rule 405 of the Securities Act. Yes x No ¨
Indicate by check mark if the registrant is not required to file reports pursuant to Section 13 or Section 15(d) of the Act. Yes ¨ No x
Indicate by check mark whether the registrant (1) has filed all reports required to be filed by Section 13 or 15(d) of the Securities Exchange Act of 1934 during the preceding 12 months (or for such shorter period that the registrant was required to file such reports), and (2) has been subject to such filing requirements for the past 90 days. Yes x No ¨
Indicate by check mark whether the registrant has submitted electronically and posted on its corporate Web site, if any, every Interactive Data File required to be submitted and posted pursuant to Rule 405 of Regulation S-T (§232.405 of this chapter) during the preceding 12 months (or for such shorter period that the registrant was required to submit and post such files). Yes x No ¨
Indicate by check mark if disclosure of delinquent filers pursuant to Item 405 of Regulation S-K (§229.405 of this chapter) is not contained herein, and will not be contained, to the best of registrant’s knowledge, in definitive proxy or information statements incorporated by reference in Part III of this Form 10-K or any amendment to this Form 10-K. ¨
Indicate by check mark whether the registrant is a large accelerated filer, an accelerated filer, a non-accelerated filer, or a smaller reporting company. See the definitions of “large accelerated filer,” “accelerated filer,” and “smaller reporting company” in Rule 12b-2 of the Exchange Act. (Check one):
| Large accelerated filer | x | Accelerated filer | ¨ | |||
| Non-accelerated filer | ¨ (Do not check if a smaller reporting company) | Smaller reporting company | ¨ | |||
Indicate by check mark whether the registrant is a shell company (as defined in Rule 12b-2 of the Act). Yes ¨ No x
The aggregate market value of Common Stock held by nonaffiliates of the registrant (27,358,085 shares), based on the closing price of the registrant’s Common Stock as reported on the Nasdaq Global Select Market on December 27, 2013 of $50.43, was $1,379,668,227. For purposes of this computation, all officers, directors, and 10% beneficial owners of the registrant are deemed to be affiliates. Such determination should not be deemed to be an admission that such officers, directors, or 10% beneficial owners are, in fact, affiliates of the registrant.
As of August 15, 2014, there were outstanding 36,744,790 shares of the registrant’s Common Stock, par value $.001 per share.
Documents Incorporated by Reference
Portions of the registrant’s definitive Proxy Statement for the 2014 Annual Meeting of Stockholders are incorporated by reference into Part III of this Form 10-K.
Table of Contents
SYNAPTICS INCORPORATED
ANNUAL REPORT ON FORM 10-K
FISCAL 2014
Statement Regarding Forward-Looking Statements
The statements contained in this report on Form 10-K that are not purely historical are forward-looking statements within the meaning of applicable securities laws. Forward-looking statements include statements regarding our “expectations,” “anticipation,” “intentions,” “beliefs,” or “strategies” regarding the future, whether or not those words are used. Forward-looking statements also include statements regarding revenue, margins, expenses, and earnings analysis for fiscal 2015 and thereafter; our positioning in our target markets; our ability to continue to enhance our market position and increase our business through introducing market leading interface solutions; the strength of our intellectual property portfolio, engineering know-how, systems engineering experience, and technological expertise; the success of our product development strategies; the attractiveness of our product solutions, including their performance, cost, customer satisfaction, market position, and potential; continued success of our virtual manufacturing platform; the strength of our customer relationships; the amounts of revenue generated as a result of sales to significant customers; our competitive position and competitive factors; acquisitions or strategic alliances; the success of particular product or marketing programs; and liquidity and anticipated cash needs and availability. All forward-looking statements included in this report are based on information available to us as of the filing date of this report, and we assume no obligation to update any such forward-looking statements. Our actual results could differ materially from the forward-looking statements. Among the factors that could cause actual results to differ materially are the factors discussed in Item 1A. Risk Factors.
Table of Contents
| ITEM 1. | BUSINESS |
Overview
We are a leading worldwide developer and supplier of custom-designed human interface solutions that enable people to interact more easily and intuitively with a wide variety of mobile computing, communications, entertainment, and other electronic devices. We currently target the markets for smartphones, tablets, the personal computer, or PC, products, primarily notebook computers, and other select electronic devices. Every solution we deliver either contains or consists of our touch- or finger-based semiconductor solutions, which includes our capacitive sensing ASIC, customer-specific firmware, and software.
We are a market leader in providing human interface solutions to our target markets. Our original equipment manufacturer, or OEM, customers include most of the world’s largest OEMs for smartphones and tier one PC OEMs. We generally supply our human interface solutions to our OEM customers through their contract manufacturers, which take delivery of our products and pay us directly for such products.
Our website is located at www.synaptics.com. Through our website, we make available, free of charge, all our Securities and Exchange Commission, or SEC, filings, including our annual reports on Form 10-K, our proxy statements, our quarterly reports on Form 10-Q, and our current reports on Form 8-K, as well as Form 3, Form 4, and Form 5 Reports for our directors, officers, and principal stockholders, together with amendments to those reports filed or furnished pursuant to Sections 13(a), 15(d), or 16 under the Securities Exchange Act of 1934, as amended, or the Exchange Act. These reports are available on our website immediately after their electronic filing with the SEC. Our website also includes corporate governance information, including our Code of Conduct, our Code of Ethics for the CEO and Senior Financial Officers, and our Board Committee Charters.
Our fiscal year is the 52- or 53-week period ending on the last Saturday in June. The fiscal years presented in this report were 52-week periods ended June 28, 2014 and June 29, 2013 and a 53-week period ended June 30, 2012.
Mobile Product Applications Markets
We believe our intellectual property portfolio, engineering know-how, systems engineering experience, technological expertise, and experience in providing human interface solutions to major OEMs of electronic devices position us to be a key technological enabler for multiple consumer electronic devices targeted to meet the growing mobile product applications markets, which include all touchscreen video display products and finger-based products. Based on these strengths, we are pursuing opportunities created by the growth of mobile computing communications, mobile product applications and entertainment devices. Mobile product applications include smartphones, tablets, large touchscreen applications, as well as a variety of mobile, handheld, wireless, and entertainment devices. Our array of human interface solutions for mobile product applications are designed to enrich the interface on smartphones, tablets, and peripherals, allowing the user to access their devices or applications through fingerprint recognition and to more easily use or navigate complex menu systems on their devices. We believe our existing technologies, our range of product solutions, and our emphasis on ease of use, small size, low power consumption, advanced functionality, secure access, durability, and reliability enable us to serve multiple aspects of the markets for mobile product applications and other electronic devices.
Our human interface solutions for mobile product applications constitute an important percentage of our net revenue. Net revenue for our human interface solutions for mobile product applications accounted for approximately 73%, 64%, and 49% of our net revenue for fiscal 2014, 2013, and 2012, respectively. Our ongoing success in serving these markets will depend upon the continued growth of the smartphone portion of the overall mobile phone market; our continued growth in the tablet and large touchscreen applications markets; our ability to demonstrate to mobile product applications OEMs the advantages of our human interface solutions in terms of performance, usability, size, simplified security, durability, power consumption, integration, and industrial design possibilities; and the success of products utilizing our human interface solutions. In addition, our success will depend on our ability to demonstrate to mobile product applications OEMs the advantages of our flexible touchscreen and fingerprint sensor fulfillment model and systems engineering expertise.
1
Table of Contents
Industry projections for the smartphone market for the period 2014 to 2015 show a growth rate of approximately 12.9%, reflecting the trend towards greater functionality in smartphone products to meet and address the expanded needs and expectations of the consumer-oriented market. These products require a simple, durable, and intuitive human interface solution to access their devices or applications through fingerprint recognition and enable the user to navigate efficiently through menus and scroll through information contained in the host device. We believe we are well positioned to take advantage of this growing market based on our technology, engineering know-how, systems engineering experience, and the acceptance of our human interface solutions by OEMs in this market.
The tablet and large touchscreen markets also represent an opportunity for our touchscreen and fingerprint sensor intellectual property portfolio, engineering know-how, and technological expertise. Touchscreen and fingerprint sensor solutions required for the tablet market range from basic e-book vendor solutions to multi-function solutions designed for more complex operating systems. Tablet-based capacitive touch interface devices are now offered by several leading PC and mobile phone OEMs and utilize various operating systems, including Android and Windows 8. Industry projections for the tablet market for the period 2014 to 2015 show a growth rate of approximately 12.9%.
PC Product Applications Market
We provide custom human interface solutions for navigation, cursor control, and multimedia controls and for access to devices or applications through fingerprint recognition for many of the world’s premier PC OEMs. In addition to notebook applications, other PC product applications for our technology include peripherals, such as keyboards, mice, and monitors, as well as remote control devices for desktops, PCs, and digital home applications. Net revenue for our human interface solutions for PC product applications accounted for approximately 27%, 36%, and 51% of our net revenue for fiscal 2014, 2013, and 2012, respectively.
The latest industry projections for notebook unit growth for the period 2014 to 2015 show a growth rate of approximately 2.9%. Customers continue to migrate from desktops to notebooks, which is fueled by users’ desire for mobile computing and on-the-go access to applications, information, and digital content. Based on the strength of our technology and engineering know-how, we believe we are well positioned to take advantage of the growth opportunity in the notebook computer market. Our position is further strengthened by our touchpad, pointing stick, fingerprint sensor, and keyboard product lines, which allow us to address 100% of the notebook computer market.
Our Strategy
Our objective is to continue to enhance our position as a leading supplier of human interface solutions for the mobile product applications markets, including smartphones, for the tablet and large touchscreen markets, and for the PC product applications market. Key aspects of our strategy to achieve this objective include those set forth below.
Extend Our Technological Leadership
We plan to utilize our extensive intellectual property portfolio, engineering know-how, and technological expertise to extend the functionality of our product solutions and offer innovative product solutions to customers across multiple markets. We intend to continue utilizing our technological expertise to reduce the overall size, weight, cost, and power consumption of our human interface solutions while increasing their applications, capabilities, and performance. We plan to continue enhancing the ease of use and functionality of our solutions. We also plan to expand our research and development efforts through increased investment in our engineering activities, the hiring of additional engineering personnel, and strategic acquisitions and alliances. We believe that these efforts will enable us to meet customer expectations and achieve our goal of supplying, on a timely and cost-effective basis, the most advanced, easy-to-use, functional human interface solutions to our target markets.
Enhance Our Position in the Smartphone, Tablet, and PC Product Application Markets
We intend to continue introducing market-leading human interface solutions in terms of performance, functionality, size, and ease of use for the smartphone, tablet, and PC product applications markets. We plan to continue enhancing our customers’ industrial design alternatives and device functionality through innovative product development, in order to enhance and grow our position within our target markets.
2
Table of Contents
Capitalize on Growth of New and Evolving Markets
We intend to capitalize on the growth of new and evolving markets, such as the tablet market and ultrabook and convertible portions of the PC market, brought about by the convergence of computing, communications, and entertainment devices. We plan to build upon our existing innovative, intuitive human interface solutions and continue to address the evolving portability, connectivity, security, and functionality requirements of these new markets. We plan to offer these solutions to existing and potential OEM customers to enable increased functionality, reduced size, lower cost, simplified security, enhanced industrial design features, and to enhance the user experience of their products. We plan to utilize our existing technologies as well as aggressively pursue new technologies as new markets evolve that demand new solutions.
Emphasize and Expand Customer Relationships
We plan to emphasize and expand our strong and long-lasting customer relationships and establish successful relationships with new customers. In each market we serve, we plan to provide the most advanced human interface solutions for our customers’ products. We believe that our human interface solutions enable our customers to deliver simplified security and a positive user experience and to differentiate their products from those of their competitors. We continually strive to enhance the competitive position of our customers by providing them with innovative, distinctive, and high-quality human interface solutions on a timely and cost-effective basis. To do so, we work continually to improve our productivity, reduce costs, and increase the speed of delivery of our human interface solutions. We endeavor to streamline the entire design and delivery process through our ongoing design, engineering, and production improvement efforts. We also focus on providing timely support to our customers after their purchase of our human interface solutions.
We plan to increase our business with existing customers and attract new customers by offering fingerprint sensor solutions and both custom designed touch solutions, as well as design tools, documentation, a family of capacitive sensing ASICs, and technical support to assist the development of human interface designs in products such as smartphones, tablets, notebooks, PC peripherals, and other digital entertainment devices. We offer our customers a choice of determining the most optimal way to meet their emerging and growing touch solution needs: our traditional custom module solutions or our chip or tail solutions, which enable customers to utilize our proprietary solutions together with third-party components and assembly. Our chip solution consists of our proprietary controller ASIC, customer-specific firmware, and software. Our tail solution consists of our proprietary controller ASIC, associated electronics, customer-specific firmware, software, and flexible circuit material. Touchscreen solutions for mobile phones, tablets, and notebooks are primarily a chip solution. Fingerprint sensor solutions are a module solution.
Pursue Strategic Relationships and Acquisitions
We intend to develop and expand strategic relationships to enhance our ability to offer value-added human interface solutions to our customers, penetrate new markets, and strengthen the technological leadership of our product solutions. We also intend to evaluate the potential acquisition of companies in order to expand our technological expertise and to establish or strengthen our presence in selected target markets.
Continue Virtual Manufacturing
We plan to expand and diversify our production capacity through third-party relationships, thereby strengthening our virtual manufacturing platform. This strategy results in a scalable business model; enables us to concentrate on our core competencies of research and development, technological advances, and product design and engineering, and reduces our capital expenditures and working capital requirements. Our virtual manufacturing strategy allows us to maintain a variable cost model, in which we do not incur most of our manufacturing costs until our product solutions have been shipped and billed to our customers.
Product Solutions
We develop and enhance interface technologies that provide simplified security and enrich the user’s experience in interacting with the user’s mobile computing, communications, and entertainment devices. We engage with our customers in the design of their custom products and offer product solutions ranging from ASICs, which may include customer-specific firmware, to full module solutions. Our innovative and intuitive human interface solutions can be engineered to accommodate many diverse platforms and our expertise in human factors and usability can be utilized to improve the features and functionality of our solutions. Our extensive array of technologies includes ASICs, firmware, software, mechanical and electrical designs, fingerprint authentication, pattern recognition, and touch-sensing technologies.
3
Table of Contents
Our custom-designed human interface solutions are custom engineered, total solutions for our customers, and include sensor design, module layout, ASICs, firmware, and software features for which we provide manufacturing and design support, and device testing. This allows us to be a one-stop supplier for complete human interface design from the early design stage, to manufacturing, to testing and support. Through our engineering know-how and technological expertise, we provide our customers with solutions that address their individual design requirements and result in high-performance, feature-rich, and reliable interface solutions. We believe our interface solutions offer the following characteristics:
| • | Ease of Use. Our interface solutions offer the ease of use and intuitive interaction that users demand. |
| • | Small Size. The small, thin size of our interface solutions enables our customers to reduce the overall size and weight of their products in order to satisfy consumer demand for portability. |
| • | Low Power Consumption. The low power consumption of our interface solutions enables our customers to offer products with longer battery life or smaller battery size. |
| • | Advanced Functionality. Our interface solutions offer advanced features, such as virtual scrolling, customizable tap zones, edge motion, and tapping and dragging icons, to enhance the user experience. |
| • | Reliability. The reliability of our interface solutions satisfies consumer requirements for dependability, which is a major component of consumer satisfaction. |
| • | Durability. Our interface solutions withstand repeated use, harsh physical treatment, and temperature fluctuations while providing a superior level of performance. |
| • | Simplified Security. Our fingerprint authentication solutions protect the user’s identity, while simplifying the user experience for electronic devices. |
We believe these characteristics will enable us to continue to enhance our position as a technological enabler within our target markets.
Our emphasis on technological leadership and design capabilities positions us to provide unique human interface solutions that address specific customer requirements, as well as satisfy our customers’ specifications, including features and functionality, industrial design, security, mechanical, and electrical requirements. Our products also offer unique integration options, including allowing our capacitive sensors to be placed underneath the plastic of the device, which allows for streamlined and stylized designs, and LED integration to indicate status or enhance industrial design.
Our long-term working relationships with large, global OEMs provide us with the experience to satisfy their demanding design specifications and other requirements. Our custom product solutions provide OEMs with numerous benefits, including the following:
| • | ease of system integration; |
| • | reduced product development costs; |
| • | shorter product time to market; |
| • | compact and efficient platforms; |
| • | improved product functionality and utility; and |
| • | product differentiation. |
4
Table of Contents
Our collaborative efforts with our customers reduces the duplication and overlap of investment and resources, enabling our OEM partners to devote more time and resources to the market development of their differentiated products.
We utilize capacitive technology rather than resistive or mechanical technology in our touch and fingerprint sensor solutions. Unlike resistive and mechanical technology, our solid-state capacitive technology has no moving parts and does not require activation force, thereby providing a durable, more reliable solution that can be integrated into both curved and flat surfaces. Capacitive technologies also allow for much thinner sensors than resistive or mechanical technology, providing for slimmer, more compact and unique industrial designs.
Products
Our family of product solutions allows our customers to solve their interface needs and differentiate their products from those of their competitors.
ClearPadTM
Our ClearPad family of products enables the user to interact directly with the display on electronic devices, such as smartphones and tablets. Our ClearPad has distinct advantages, including low-profile form factor; high reliability, durability, and accuracy; and low power consumption. We typically sell our ClearPad solution as a chip or tail, together with customer-specific firmware, to sensor manufacturers to use in the production of discrete touchscreen products. A discrete touchscreen product typically consists of a transparent, thin capacitive sensor that can be placed over any display, such as a Liquid Crystal Display, or LCD, or an Organic Light Emitting Diode, or OLED, and combined with a flexible circuit material and a touch controller chip. Each ClearPad solution is custom designed to integrate customer-specific input preferences such as pen input, gloved finger recognition, proximity, finger hover, and air swipe functionality.
Our ClearPad Series 3 product family can provide full-time tracking of ten or more fingers simultaneously and features stylus support as well as support for various sensor configurations, including traditional discrete sensors; sensor-on-lens, which includes sensor electrodes patterned on the bottom of the glass cover lens; on-cell, which includes sensor electrodes patterned on the display glass; and in-cell, which includes sensor electrodes patterned inside the LCD glass.
Our ClearPad Series 4 product family combines our proprietary capacitive multi-touch technology with a device’s display driver (TDDI) in a single-chip solution delivering advanced display noise management and improved capacitive sensing performance. Our display integration on-cell and in-cell solutions provide cost-effective, capacitive, multi-touch interfaces for mobile devices and enable thinner form factors.
Our ClearPad Series 7 product family is designed to meet the requirements of the large touchscreen market for products more closely related to clamshell notebooks, slates, tablets, and similar devices. Our ClearPad Series 7 products include low-cost, single-chip touchscreen solutions and multi-chip touchscreen solutions designed for devices that have more demanding user input requirements, such as gaming applications.
TouchPadTM
Our TouchPad family of products, which can take the place of, and exceed, the functionality of a mouse, is a small, touch-sensitive pad that senses the position and movement of one or more fingers on its surface through the measurement of capacitance. Our TouchPad provides an accurate, comfortable, and reliable method for screen navigation, cursor movement, and gestures and provides a platform for interactive input for both the consumer and corporate markets. Our TouchPad solutions allow our customers to provide stylish, simple, user-friendly, and intuitive human interface solutions. Our TouchPad solutions also offer various advanced features, including scrolling, customizable tap zones, tapping and dragging of icons, and device interaction.
Our TouchPad solutions are available in a variety of sizes, electrical interfaces, and thicknesses, and are designed to meet the electrical and mechanical specifications of our customers. Customized firmware and driver software ensure the availability of specialized features. As a result of their solid state characteristics, our TouchPad solutions have no moving parts that wear out, resulting in a robust and reliable input solution that also allows for unique industrial designs.
5
Table of Contents
ClickPadTM
Our ClickPad introduces a clickable mechanical design to the TouchPad application that eliminates the need for physical buttons. The buttonless design of our ClickPad allows for unique, intuitive industrial design and makes it an excellent alternative to conventional input and navigation devices. Our ClickPad is activated by pressing down on the internal tact switch to perform left-button or right-button clicks and provides tactile feedback similar to pressing a physical button. The latest version of ClickPad features ClickEQTM, a mechanical solution that provides uniform click depth to maximize the surface area available for gestures and improves click performance over hinged designs.
ForcePad®
Our ForcePad is a thinner version of our ClickPad, which introduces a new dimension in control through the addition of variable force sensitivity. ForcePad is designed to provide consistent performance across OEM models through its design intelligence and self-calibration features. By varying the amount of force applied, ForcePad is engineered to enable more intuitive and precise user interactions in operating system controls and applications. Designed with thin and light notebooks in mind, ForcePad is 40% thinner than a conventional touch pad.
ThinTouch®
ThinTouch is a design technology employing an innovative ramp capability that delivers a full keyboard solution that is 40% thinner than traditional keyboard solutions. ThinTouch utilizes an innovative design architecture that facilitates improved backlighting, reliability, and improved manufacturability when compared to conventional mechanical keyboards. By combining our TouchPad technology with ThinTouch technology, we expect to deliver keyboard solutions targeted for the next generation of thin and light notebook PC form factors.
Natural ID™
Natural ID is an industry leading fingerprint ID family of products designed for use with Fast IDentity Online (FIDO) enabled devices. FIDO was formed to enhance online authentication by developing an open, scalable technical standard to help facilitate the adoption of robust, easy to use authentication that reduces the reliance on passwords.
Other Products
Other product solutions we offer include Dual Pointing Solutions, TouchStyk, ClearButtons, and TouchButtons. Our dual pointing solutions offer TouchPad with a pointing stick in a single notebook computer, enabling users to select their interface of choice. TouchStyk is a self-contained pointing stick module that uses capacitive technology similar to that used in our TouchPad. A ClearButton is a clear sensor that can be mounted under plastic, providing OEMs with easy integration and attractive design options for scrolling and buttons. TouchButtons provide capacitive buttons and scrolling controls for an easy-to-use and stylish interface solution designed to replace mechanical buttons.
Capabilities
Our products are supported by a variety of feature capabilities allowing for further product differentiation and easy customer integration.
ChiralMotion Gesture
With our ChiralMotion Gesture technology, the user can apply one continuous circular motion to initiate precise and fine-tuned scrolling on any two-dimensional input surface, such as our TouchPad and ClearPad solutions.
ChiralMotion Gesture technology is well suited for small handheld products, such as feature-rich mobile handsets, personal navigation systems, and personal media players that require easy access for entertainment, music, and other digital files. Scrolling through long documents or pages on a notebook PC becomes simple when using a TouchPad enhanced with ChiralMotion and reversing the direction of scrolling simply requires the user to reverse the circular motion of their finger.
6
Table of Contents
Enhanced Gesture Recognition™
Our Enhanced Gesture Recognition is a suite of ClearPad gestures included in our firmware. Customers can easily enable SingleTouch gestures, such as Tap, Double Tap, Press, and Flick; DualTouch gestures, such as Pinch and Pivot Rotate; and multi-finger gestures for ClearPad directly from our touch module firmware. No additional recognition software is required on the host processor to implement these gestures. This approach lowers host processor resource requirements and ensures that gestures are implemented using our pattern-recognition technology.
Design Studio™
Design Studio provides customers an advanced and comprehensive touch system tool set, designed to enable the customer to evaluate touch system performance and efficiently implement its ClearPad touchscreen solution.
Proximity Sensing
Our proximity sensing technology enables users to interact with consumer electronics without touch including our latest 3D-touch capability. With this technology, sensors in a device, such as a notebook PC, mobile phone, peripheral, or digital photo frame, sense the presence of a user’s finger or hand to activate a function. These sensors can illuminate LEDs for discoverable buttons, immediately wake devices from power-saving mode, or activate other functionality.
SignalClarity Technology
SignalClarity technology provides an improved signal-to-noise ratio for enhanced touch detection and noise immunity and enables smartphone OEMs to support inexpensive chargers and work with multiple display types. SignalClarity technology works with multidisplay configurations, including discrete sensors, sensor-on-lens, on-cell, and in-cell stackup solutions.
Synaptics Gesture Suite
Our Synaptics Gesture Suite, or SGSTM, provides users with an intuitive way to interact productively with their notebook computers. SGS was developed by analyzing the most common workflows from entertainment activities, such as viewing photos and listening to music, to productivity activities, such as accessing emails and presentations. The result is an intelligent usability model that makes it intuitive for consumers to understand and discover features easily, resulting in a better user experience. SGS represents a growing portfolio of gestures available on our interface solutions. These gestures are compatible with a wide range of Microsoft Windows and Linux applications to enhance the value and productivity of notebook PCs and peripheral devices that use our TouchPads. Gestures currently in the market include Pinch, Rotate, ChiralMotion Scrolling, Two-Finger Scrolling, Three-Finger Flick, Three-Finger Down, and Four-Finger Flick.
TypeGuard™
TypeGuard technology allows the system to differentiate between a finger and a palm, virtually eliminating accidental cursor movements, scrolling and clicks.
Technologies
We have developed and own an extensive array of technologies, encompassing ASICs, firmware, software, mechanical and electrical designs, display systems, pattern recognition, and touch-sensing technologies. We continue to develop technology in these areas. We believe these technologies and the related intellectual property rights create barriers for competitors and allow us to provide high-value human interface solutions in a variety of high-growth markets.
7
Table of Contents
Our broad line of human interface solutions is currently based upon the following key technologies:
| • | capacitive position sensing technology; |
| • | capacitive force sensing technology; |
| • | transparent capacitive position sensing technology; |
| • | pattern recognition technology; |
| • | mixed-signal integrated circuit technology; |
| • | display systems and circuit technology; |
| • | capacitive active pen technology; |
| • | multi-touch technology; |
| • | proprietary microcontroller technology; |
| • | ThinTouch technology; and |
| • | fingerprint sensing technology. |
In addition to these technologies, we develop firmware and device driver software that we incorporate into our products, which provide unique features, such as virtual scrolling, customizable tap zones, PalmCheck, EdgeMotion, and tapping and dragging of icons. In addition, our ability to integrate all of our products to interface with major operating systems provides us with a competitive advantage.
Capacitive Position Sensing Technology. This technology provides a method for sensing the presence, position, and contact area of one or more fingers or a stylus on a flat or curved surface. Our technology works with very light touch, supports full multi-touch capabilities, and provides highly responsive cursor navigation, scrolling, and selection. It uses no moving parts, can be implemented under plastic, and is extremely durable. Our technology can also track one or more fingers in proximity to the touch surface.
Capacitive Force Sensing Technology. This technology senses the direction and magnitude of a force applied to an object. The object can either move when force is applied, like a typical joystick used for gaming applications, or it can be isometric, with no perceptible motion during use, like our TouchStyk or ForcePad. The primary competition for this technology is resistive strain gauge technology. Resistive strain gauge technology requires electronics that can sense very small changes in resistance, presenting challenges to the design of that circuitry, including sensitivity to electrical noise and interference. Our electronic circuitry determines the magnitude and direction of an applied force, permits very accurate sensing of tiny changes in capacitance, and minimizes electrical interference from other sources.
Transparent Capacitive Position Sensing Technology. This technology allows us to build transparent sensors for use with our capacitive position sensing technology, such as in our ClearPad. It has all the advantages of our capacitive position sensing technology and allows for visual feedback when incorporated with a display device, such as an LCD. Our technology supports full multi-touch, does not require calibration, does not produce undesirable internal reflections, and has reduced power requirements, allowing for longer battery life.
Pattern Recognition Technology. This technology is a set of software algorithms and techniques for converting real-world data, such as gestures and handwriting, into a digital form that can be recognized and manipulated within a computer. Our technology provides reliable gesture decoding and handwriting recognition, and can be used in other applications such as signature verification for a richer user experience.
Mixed-Signal Integrated Circuit Technology. This hybrid analog-digital integrated circuit technology combines the power of digital computation with the ability to interface with non-digital, real-world signals, such as the position of a finger or stylus on a surface. Our patented design techniques permit us to utilize this technology to optimize our core ASIC engine for all our products. Our mixed-signal technology consists of a broad portfolio of circuit expertise in areas such as the following:
| • | precision capacitance measurement; |
| • | power management (switching converters, charge pumps, and Low-dropout regulators (“LDOs”)); |
8
Table of Contents
| • | analog-to-digital and digital-to-analog converters; |
| • | LCD source and Vcom drivers; |
| • | high-speed serial interfaces; |
| • | display timing controllers, (“TCONs”); |
| • | SRAM, DRAM, and non-volatile memories; |
| • | VLSI digital circuits with multiple clock and power domains; and |
| • | communications and signal processing circuits. |
Display Systems and Circuit Technology. This technology enables us to develop optimized human interface solutions with improved compatibility with their application environments. This technology consists of mobile and large format display semiconductor expertise, including the following functional blocks:
| • | TCONs; |
| • | TFT gamma references; |
| • | Vcom drivers; |
| • | source drivers; |
| • | high-speed serial interfaces such as MIPI DSI and Qualcomm MDDI; and |
| • | display power circuits such as inductive switchers, charge pumps, and LDOs. |
This technology also enables us to develop advanced products that combine the functions of the display and touch sensing systems to enable highly integrated display and touch functionality with improved performance, thinner form factors, and lower system cost.
Capacitive Active Pen Technology. This technology allows us to develop a pen that can be used for input on a capacitive touchscreen. As well as generating a signal that allows the touchscreen to track the pen, additional data, such as the pen applied force and pen button states, are also communicated to the touchscreen device.
Proprietary Microcontroller Technology. One example of this technology is our proprietary 16-bit microcontroller core that is embedded in the digital portion of our mixed signal ASIC, which allows us to optimize our ASIC for position sensing tasks. Our embedded microcontroller provides great flexibility in customizing our products via firmware, which eliminates the need to design new circuitry for each new application.
ThinTouch Technology. This keyboard technology allows a key to move downwards in a diagonal motion providing a longer total travel than a key that has purely vertical motion. This allows us to develop higher performing keyboards in low profile form factors. The technology also allows capacitive sensing to be integrated into the keyboard.
Fingerprint Sensing Technology. This technology provides for fingerprint authentication by scanning and matching an image of a user’s fingerprint. Our fingerprint sensing technology simplifies the system or application authentication process by substituting the user’s fingerprint for the login name and password.
Research and Development
We conduct ongoing research and development programs that focus on advancing our technologies, developing new products, improving design and manufacturing processes, and enhancing the quality and performance of our product solutions. Our goal is to provide our customers with innovative solutions that address their needs and improve their competitive positions. Our research and development programs focus on advancing our existing interface technologies, improving our current product solutions, and expanding our technologies to serve new markets. Our long-term vision is to offer human interface solutions, such as touch, fingerprint, handwriting, vision, voice capabilities, and other biometrics that can be readily incorporated into various electronic devices.
9
Table of Contents
Our research and development programs focus on the development of accurate, easy to use, reliable, and intuitive human interfaces for electronic devices. We believe our innovative interface technologies can be applied to many diverse products. We believe the interface is a key factor in the differentiation of these products. We believe that our interface technologies enable us to provide customers with product solutions that have significant advantages over alternative technologies in terms of functionality, size, power consumption, durability, and reliability. We also intend to pursue strategic relationships and acquisitions to enhance our research and development capabilities, leverage our technology, and shorten our time to market with new technological applications.
Our research, design, and engineering teams frequently work directly with our customers to design custom solutions for specific applications. We focus on enabling our customers to overcome their technical barriers and enhance the performance of their products. We believe our engineering know-how and electronic systems expertise provide significant benefits to our customers by enabling them to concentrate on their core competencies of production and marketing.
As of the end of fiscal 2014, we employed 845 people in our technology, engineering, and product design functions in the United States, Taiwan, Hong Kong, Korea, Japan, India, and China. Our research and development expenses were approximately $192.7 million, $144.7 million, and $118.0 million for fiscal 2014, 2013, and 2012, respectively.
Intellectual Property Rights
Our success and ability to compete depend in part on our ability to maintain the proprietary aspects of our technologies and products. We rely on a combination of patents, trade secrets, trademarks, confidentiality agreements, and other contractual provisions to protect our intellectual property, but these measures may provide only limited protection. Our research, design, and engineering teams frequently work directly with our OEM customers to design custom solutions for specific applications.
As of June 11, 2014, we had 216 U.S. patents in force and 348 patents pending, as well as their non-U.S. counterparts. Collectively, these patents and patent applications cover various aspects of our key technologies, including those for opaque touchpads, clear touch screens, fingerprint sensors, user interfaces, keyboards, displays, and isometric joysticks. Our proprietary software, including source code, is also protected by copyright laws and applicable trade secret laws.
Our extensive array of technologies includes those related to ASICs, firmware, software, and mechanical hardware. Our products rely on a combination of these technologies, making it difficult to use any single technology as the basis for replicating our products. Furthermore, the length and customization of the customer design cycle serve to protect our intellectual property rights.
Customers
Our customers include many of the world’s largest smartphone, tablet, and PC OEMs, based on unit shipments, as well as a variety of consumer electronics manufacturers. Our demonstrated track record of technological leadership, design innovation, product performance, cost effectiveness, and on-time deliveries have resulted in our leadership position in providing human interface solutions. We believe our strong relationship with our OEM customers, many of which are also currently developing tablets, and mobile application products, will continue to position us as a source of supply for their product offerings.
10
Table of Contents
Our industry-leading OEM customers in fiscal 2014 included the following:
| • Acer |
• LG Electronics | |
| • Amazon |
• Nokia | |
| • BlackBerry |
• Oppo Mobile | |
| • Dell |
• Samsung | |
| • Hewlett-Packard |
• Sharp | |
| • HTC |
• Sony | |
| • Huawei |
• Toshiba | |
| • Lenovo |
• ZTE | |
We generally supply custom-designed products to OEMs through their contract manufacturers or supply chain. We sell our custom-designed products directly to these customers, some of which include Samsung Display Co., Japan Display Inc., Compal, and Wintek. Sales to Samsung Display Co. and its affiliates accounted for approximately 28% and 14% of our net revenue for fiscal 2014 and 2013, respectively. Sales to TPK accounted for approximately 12% of our net revenue for fiscal 2012.
We consider both the OEMs and their contract manufacturers or supply chain partners to be our customers. Both the OEMs and their partners may determine the design and pricing requirements and make the overall decision regarding the use of our human interface solutions in their products. The contract manufacturers place orders with us for the purchase of our products, take title to the products purchased upon shipment by us, and pay us directly for those purchases. These customers have no return privileges except for warranty provisions.
Strategic Relationships
We have used strategic relationships to enhance our ability to offer value-added customer solutions in the past. We intend to enter into additional strategic relationships with companies that may help us serve our target markets.
Sales and Marketing
We sell our product solutions for incorporation into the products of our OEM customers. We generate sales through direct sales employees as well as outside sales representatives and distributors. Our sales personnel receive substantial technical assistance and support from our internal engineering resources because of the highly technical nature of our product solutions. Sales frequently result from multi-level sales efforts that involve senior management, design engineers, and our sales personnel interacting with our customers’ decision makers throughout the product development and order process.
As of the end of fiscal 2014, we employed 247 sales and marketing professionals. We maintain nine customer support offices domestically and internationally, which are located in the United States, Taiwan, China, Korea, Japan, and Europe. In addition, we utilize sales representatives and sales distributors in China, Japan, and Taiwan.
International sales constituted over 90% of our revenue for each of fiscal 2014, 2013, and 2012. Approximately 70% of our sales were made to companies located in China and South Korea that provide design and manufacturing services for major notebook computer and mobile product applications OEMs. All of our sales were denominated in U.S. dollars. This information should be read in conjunction with note 12 to the financial statements contained elsewhere in this report.
Manufacturing
We employ a virtual manufacturing platform through third-party relationships. We currently utilize two semiconductor wafer manufacturers to supply us with silicon wafers integrating our proprietary design specifications. The completed silicon wafers are forwarded to third-party package and test processors for further processing into die and packaged ASICs, as applicable, which are then utilized in our custom interface products or processed as our ASIC-based solution.
After processing and testing, the die and ASICs are consigned to various contract manufacturers for assembly or are shipped directly to our customers. During the assembly process, our die or ASIC is either combined with other components to complete the module for our custom human interface solution or the ASIC is maintained as a standalone finished good. The finished assembled product is subsequently shipped directly to our customers or by our contract manufacturers directly to our customers for integration into their products.
11
Table of Contents
We believe our virtual manufacturing strategy provides a scalable business model; enables us to concentrate on our core competencies of research and development, technological advances, and product design and engineering; and reduces our capital investment. In addition, this strategy significantly reduces our working capital requirements for inventory because we do not incur most of our manufacturing costs until we have actually shipped our interface products to our customers and invoiced those customers for those products.
Our third-party contract manufacturers and semiconductor fabricators are Asian-based organizations. We provide our contract manufacturers with six-month rolling forecasts of our production requirements. We do not, however, have long-term agreements with any of our contract manufacturers that guarantee production capacity, prices, lead times, or delivery schedules. Our reliance on those parties exposes us to vulnerability owing to our dependence on few sources of supply. We believe, however, that other sources of supply are available. In addition, we may establish relationships with other contract manufacturers in order to reduce our dependence on any one source of supply.
Periodically, we purchase inventory from our contract manufacturers when a customer delays its delivery schedule or cancels its order. In those circumstances in which our customer has cancelled its order and we purchase inventory from our contract manufacturers, we consider a write-down to reduce the carrying value of the inventory purchased to its net realizable value. We charge write-downs to reduce the carrying value of obsolete, slow moving, and non-usable inventory to its net realizable value and charge such write-downs to cost of revenue. We also record a liability and charge to cost of revenue for estimated losses on inventory we are obligated to purchase from our contract manufacturers when such losses become probable from customer delays or order cancellations.
Backlog
As of the end of fiscal 2014, we had a backlog of orders of $132.3 million, an increase of $36.3 million compared with a backlog of orders as of the end of fiscal 2013 of $96.0 million. The mix of products ordered by customers at the end of fiscal 2014 had a slightly lower average selling price than those ordered at the end of fiscal 2013; however, the quantity on backlog was substantially higher due to improved demand for both mobile product applications and PC product applications at the end of fiscal 2014 compared with the end of fiscal 2013, resulting in increased backlog. Our backlog consists of product orders for which purchase orders have been received and which are scheduled for shipment in the subsequent quarter. Most orders are subject to rescheduling or cancellation with limited penalties. Because of the possibility of customer changes in product shipments, our backlog as of a particular date may not necessarily be indicative of net revenue for any succeeding period.
Competition
Our touch-based semiconductor products are sold into markets for mobile applications products, PC product applications and other electronic devices. The markets for touchscreen products are characterized by rapidly changing technology and intense competition. Our principal competition in the sale of touchscreen products includes Atmel, Cypress, Elan Microelectronics, Focaltech, Himax, Maxim, Melfas, and various other companies involved in human interface solutions. Our principal competitors in the sale of notebook touch pads are Alps, Cypress, and Elan Microelectronics. Our principal competitors in the sale of fingerprint authentication solutions for the mobile and PC product applications markets are Fingerprint Cards and IDEX. In certain cases, large OEMs may acquire a competing technology, develop alternative human interface solutions for their own products or provide alternative key components for use in designing human interface solutions.
We believe our solutions-based systems and engineering experience, coupled with our technologies, offer benefits in terms of size, power consumption, durability, ease of use, cost effectiveness, and reliability when compared to our competitors and other technologies. While our markets continue to evolve, we believe we are well positioned to compete aggressively for this business based on our proven track record, our technological expertise, our marquee global customer base, our technology roadmap, and our reputation for design innovation. Our competitive position could be adversely affected if one or more of our current OEMs reduce their orders or if we are unable to develop new customers for our human interface solutions.
12
Table of Contents
Employees
As of the end of fiscal 2014, we employed a total of 1,230 persons, including 138 in operations, finance, and administration; 247 in sales and marketing; and 845 in research and development. Of these employees, 615 were located in North America, 609 in Asia/Pacific, and six in Europe. We consider our relationship with our employees to be good, and none of our employees are represented by a union in collective bargaining with us.
Competition for qualified personnel in our industry is extremely intense, particularly for engineering and other technical personnel. Our success depends on our continued ability to attract, hire, and retain qualified personnel.
Acquisition Activity
On November 7, 2013, we acquired Validity Sensors, Inc., or Validity, a leading provider of capacitive-based biometric fingerprint authentication solutions for smartphone and tablet applications, for approximately $127.8 million in cash and common stock. This acquisition is designed to bring together substantial synergies through the combination of the Validity technologies and workforce and our financial stability, scale, infrastructure, customer relationships, and technology delivery performance record. With this acquisition, our goal is to gain access to the fast-growing biometrics market, significantly expanding our market opportunity and underscoring our commitment to making smart devices easier to use.
On June 10, 2014, we entered into a stock purchase agreement to acquire Renesas SP Drivers, Inc., or RSP, a leading provider of small and medium-sized display driver ICs for smartphones and tablets, for approximately ¥48.5 billion (or approximately US$475 million based on a reference conversion rate of JPY102 to US$1). The purchase price is based on cash and other adjustments and is subject to customary adjustments for net working capital, net debt, target inventory and third party expenses. The transaction was approved by our company’s board of directors, RSP’s board of directors, and the board of directors of the companies that currently own RSP. The acquisition of RSP is intended to accelerate our product roadmap for high-performance, low-cost display integration products, strengthen our relationships with key customers, and create opportunities to drive increased revenue and research and development activity. Subject to certain financing conditions and other customary closing conditions, the transaction is expected to close in our second quarter of fiscal 2015.
13
Table of Contents
Executive Officers of the Registrant
The following table sets forth certain information regarding our executive officers as of August 15, 2014:
| Name |
Age |
Position | ||
| Richard A. Bergman | 50 | President and Chief Executive Officer, and Director | ||
| Kathleen A. Bayless | 58 | Senior Vice President, Chief Financial Officer, and Treasurer | ||
| Kevin D. Barber | 54 | Senior Vice President and General Manager, Smart Display Division | ||
| Scott Deutsch | 49 | Senior Vice President, World Wide Sales | ||
| Ritu Favre | 46 | Senior Vice President, General Manager, Biometrics Product Division | ||
| John McFarland | 47 | Senior Vice President, General Counsel and Secretary | ||
| Bret C. Sewell | 53 | Senior Vice President of Marketing and Business Development | ||
| Alex Wong | 59 | Senior Vice President of World Wide Operations |
Richard A. Bergman has been President and Chief Executive Officer of our company since September 2011. Prior to joining our company, Mr. Bergman was Senior Vice President and General Manager of Advanced Micro Devices (“AMD”) Product Group from May 2009 to September 2011. From October 2006 to May 2009, Mr. Bergman served as Senior Vice President and General Manager of AMD’s Graphics Product Group. Mr. Bergman’s career at AMD began in October 2006 when AMD acquired ATI Technologies (“ATI”), where he served as Senior Vice President and General Manager of the PC Group. Prior to ATI, Mr. Bergman served as Chief Operating Officer at S3 Graphics, a division of SonicBlue Inc. Mr. Bergman has held senior level management positions in the technology field since his early roles at Texas Instruments, Inc. and IBM. Mr. Bergman holds a Bachelor of Science degree in Electrical Engineering from the University of Michigan and a Master’s degree in Business Administration from the University of Colorado.
Kathleen A. Bayless has been Senior Vice President, Chief Financial Officer, and Treasurer of our company since September 2009. Ms. Bayless served as the Senior Vice President – Finance of our company from March 2009 to September 2009 and as Secretary of our company from September 2009 to November 2013. Ms. Bayless spent 13 years at Komag, a leading supplier of thin-film disks to the disk drive industry, where she served most recently as Executive Vice President, Secretary, and Chief Financial Officer beginning in September 2002. Prior to joining Komag, Ms. Bayless held the position of Senior Audit Manager at the public accounting firm of Ernst & Young. Ms. Bayless holds a Bachelor of Science degree from California State University Fresno and is a certified public accountant.
Kevin D. Barber has been Senior Vice President and General Manager of Smart Display Division of our company since January 2011. Prior to joining our company, Mr. Barber was Chief Executive Officer of ACCO Semiconductor since 2008. From 2007 to 2008, Mr. Barber served as a principal consultant at PRTM focused on the electronics industry. Mr. Barber was Senior Vice President, General Manager of the Mobile Solutions business at Skyworks Solutions from 2003 to 2006 where he was responsible for delivering innovative RF products to the mobile industry. Mr. Barber was Senior Vice President of Operations at Skyworks Solutions from 2002 to 2003 and Conexant Systems from 2001 to 2002. Previously, Mr. Barber held various senior operations positions at Conexant Systems and Rockwell Semiconductor. Mr. Barber holds a Bachelor of Science degree in Electrical Engineering from San Diego State University and a Master’s degree in Business Administration from Pepperdine University.
14
Table of Contents
Scott Deutsch has been Senior Vice President of World Wide Sales of our company since January 2013. Prior to joining our company, Mr. Deutsch served as Vice President of Worldwide Sales for AuthenTec from 2010 to 2012. Mr. Deutsch held positions of Vice President of World Wide Sales at Alereon from 2008 to 2009 and Vice President of Sales and Marketing for SanDisk’s OEM Consumer Products Division from 2004 to 2008. Earlier in his career, Mr. Deutsch was the Director of Sales for the Western U.S. with MMC Networks. Before joining MMC Networks, Mr. Deutsch spent eight years at Cypress Semiconductor in various sales and management roles. Mr. Deutsch holds a Bachelor of Science degree in Electrical Engineering from Fresno State University.
Ritu Favre has been the Senior Vice President and General Manager of the Biometrics Product Division of our company since June 2014. Prior to joining our company, Ms. Favre held various senior level positions at Freescale Semiconductor from 2003 to 2014, including Senior Vice President and General Manager of the RF Division from 2012 through 2014, and Vice President and Division General Manager of the RF Division from 2010 to 2012. Ms. Favre ran the North America/Japan Automotive Business in the Analog and Mixed Signal Products Division inside Motorola Semiconductor from 2002 to 2003 and the Compound Semiconductor business in the Motorola Wireless Infrastructure Division from 1999 to 2002. Ms. Favre holds a Bachelor of Science degree in Electrical Engineering, as well as a Master’s of Science degree in Electrical Engineering from Arizona State University.
John McFarland has been Senior Vice President, General Counsel and Secretary of our company since November 2013. Prior to joining our company, Mr. McFarland served for nine years as the Executive Vice President, General Counsel and Secretary of MagnaChip Semiconductor. Mr. McFarland spent his early career at law firms in Palo Alto, California, and Seoul, Korea. Mr. McFarland holds a Bachelor of Arts degree in Asian Studies, conferred with highest distinction from the University of Michigan, and a Juris Doctor degree from the University of California, Los Angeles, School of Law.
Bret C. Sewell has been Senior Vice President of Marketing and Business Development of our company since May 2012. Prior to joining our company, Mr. Sewell served as Executive Vice President at Coulomb Technologies from 2010 to 2011, and served as Chief Executive Officer of Venturi Wireless and Kiwi Networks from from 2005 to 2007, and 2003 to 2004, respectively. After SnapTrack’s acquisition by Qualcomm, he served as President of Qualcomm’s SnapTrack subsidiary and Senior Vice President in Qualcomm’s semiconductor division. Earlier in his career, Mr. Sewell served as general manager for the Asia Pacific divisions of Octel Communications and Aspect Telecommunications. Mr. Sewell holds a Master’s degree in Business Administration from the Wharton School of the University of Pennsylvania, a Master’s of Arts degree in International Studies from the University of Pennsylvania, and a Bachelor of Arts degree in Biological Anthropology from Harvard University.
Alex Wong has been Senior Vice President of World Wide Operations of our company since July 2010. Mr. Wong served as Vice President of World Wide Operations of our company from September 2006 to July 2010. From 2003 to 2006, Mr. Wong served our company as Managing Director of Hong Kong and Director of Operations. Prior to joining our company, Mr. Wong held various management positions with National Semiconductor Corporation, including General Manager for National Joint Ventures in China and Hong Kong and Director of Corporate Business Development. Mr. Wong holds a Bachelor of Science degree in Computer Science from California State University at Northridge and a Master’s degree in Business Administration from the University of East Asia, Macau.
There are no arrangements, understandings, or family relationships pursuant to which our executive officers were selected. There are no related party transactions between us and our executive officers. We have entered into indemnification agreements with our officers and directors.
15
Table of Contents
| ITEM 1A. | RISK FACTORS |
You should carefully consider the following factors, together with all the other information included in this report, in evaluating our company and our business.
We currently depend on our human interface solutions for the mobile product applications market and the PC product applications market for substantially all of our revenue, and any downturn in sales of these products would adversely affect our business, revenue, operating results, and financial condition.
We currently depend on our human interface solutions for the mobile product applications market and the PC product applications market for substantially all of our revenue. Any downturn in sales of these products would adversely affect our business, revenue, operating results, and financial condition. Similarly, a softening of demand in the smartphone market, the tablet market, or the notebook portion of the PC product applications market, a reduced level of our participation in the notebook portion of the PC product applications market, or a slowdown of growth in the notebook portion of the PC product applications market because of consumer preferences, the emergence of applications not including our solutions, or other factors would cause our business, operating results, and financial position to suffer.
Net revenue from our human interface solutions for mobile product applications has been volatile in the past, and may not increase or be less volatile in the future.
Net revenue from our human interface solutions for mobile product applications, particularly smartphones has been volatile in the past. Our net revenue from our human interface solutions for mobile product applications may not increase or be less volatile in the future. Net revenue from our human interface solutions for mobile product applications was $689.9 million for fiscal 2014, $424.1 million for fiscal 2013, and $270.1 million for fiscal 2012. Our interface business for mobile product applications faces many uncertainties, including our success in enhancing our position in evolving markets dominated by a limited number of OEMs, and market acceptance of our product solutions over competitive product solutions. Our inability to address these uncertainties successfully would negatively affect our business.
We are exposed to industry downturns and cyclicality in our target markets that may result in fluctuations in our operating results.
The PC and electronics industries have experienced significant economic downturns at various times. These downturns are characterized by diminished product demand, accelerated erosion of average selling prices, and production overcapacity. In addition, the PC and electronics industries are cyclical in nature. We seek to reduce our exposure to industry downturns and cyclicality by providing design and production services for leading companies in rapidly expanding industry segments. We may, however, experience substantial period-to-period fluctuations in future operating results because of general industry conditions or events occurring in the general economy.
We cannot assure you that our human interface business for new markets will be successful or that we will be able to continue to generate significant revenue from these markets.
Our product solutions may not be successful in new markets despite the fact that these product solutions are capable of enabling people to interact more easily and intuitively with a wide variety of mobile computing, communication, entertainment, and electronic devices in addition to notebook computers and smartphones.
Various target markets for our interface solutions, such as tablets and large touchscreen applications including automotive touchscreens, may develop slower than anticipated or could utilize competing technologies. The markets for certain of these products depend in part upon the continued development and deployment of wireless and other technologies, which may or may not address the needs of the users of these products.
16
Table of Contents
Our ability to generate significant revenue from new markets will depend on various factors, including the following:
| • | the development and growth of these markets; |
| • | the ability of our technologies and product solutions to address the needs of these markets, the price and performance requirements of OEMs, and the preferences of end users; and |
| • | our ability to provide OEMs with human interface solutions that provide advantages in terms of size, power consumption, reliability, durability, performance, and value-added features compared with alternative solutions. |
Many manufacturers of these products have well-established relationships with competitive suppliers. Our ongoing success in these markets will require us to offer better performance alternatives to other solutions at competitive costs. The failure of any of these target markets to develop as we expect, or our failure to serve these markets to a significant extent, will impede our sales growth and could result in substantially reduced earnings. We cannot predict the size or growth rate of these markets or the market share we will achieve or maintain in these markets in the future.
If we fail to maintain and build relationships with our customers, or our customers’ products which utilize our human interface solutions do not gain widespread market acceptance, our revenue may stagnate or decline.
We do not sell any products to end users and we do not control or influence the manufacture, promotion, distribution, or pricing of the products that incorporate our human interface solutions. Instead, we design various human interface solutions that our OEM customers incorporate into their products and depend on such OEM customers to successfully manufacture and distribute products incorporating our human interface solutions and to generate consumer demand through marketing and promotional activities. As a result of this, our success depends almost entirely upon the widespread market acceptance of our OEM customers’ products that incorporate our human interface solutions. Even if our technologies successfully meet our customers’ price and performance goals, our sales would decline or fail to develop if our customers do not achieve commercial success in selling their products that incorporate our human interface solutions
We must maintain our relationships with our existing customers, particularly with the leading notebook computer OEMs, and expand our relationships with smartphone and tablet OEMs. Our customers do not provide us with firm, long-term volume purchase commitments, opting instead, to issue purchase orders that they can cancel, reduce, or delay at any time. In order to meet the expectations of our customers, we must provide innovative human interface solutions on a timely and cost-effective basis. This requires us to match our design and production capacity with customer demand, maintain satisfactory delivery schedules, and meet performance goals. If we are unable to achieve these goals for any reason, our sales may decline or fail to develop, which would result in decreasing revenue.
In addition to maintaining and expanding our customer relationships, we must also identify areas of significant growth potential in other markets, establish relationships with OEMs in those markets, and assist those OEMs in developing products that incorporate our human interface product solutions. Our failure to identify potential growth opportunities, particularly in the smartphone and the tablet market, the PC product applications market, or establish and maintain relationships with OEMs in those markets, would prevent our business from growing in those markets.
A significant portion of our sales comes from one or more large customers, the loss of which could harm our business, financial condition, and operating results.
Historically, we have relied on a limited number of customers for a substantial portion of our total revenue. If we lost key customers, or if key customers reduced or stopped placing orders for our high-volume products, our financial results could be adversely affected. In fiscal 2014 and 2013, sales to Samsung Display Co. and its affiliates accounted for approximately 28% and 14%, respectively, of our net revenue. In fiscal 2012, sales to TPK accounted for approximately 12% of our net revenue. Significant reductions in sales to our largest customer, the loss of other major customers, or a general decrease in demand for our products within a short period of time could adversely affect our revenue, financial condition and business.
We sell to contract manufacturers that serve our OEM customers. Any material delay, cancellation, or reduction of orders from any one or more of these contract manufacturers or the OEMs they serve could harm our business, financial condition, and operating results. The adverse effect would be more substantial if our other customers do not increase their orders or if we are unsuccessful in generating orders for human interface solutions from new customers. Many of these contract manufacturers sell to the same OEMs, and therefore our concentration with certain OEMs may be higher than with any individual contract manufacturer. Concentration in our customer base may make fluctuations in revenue and earnings more severe and make business planning more difficult.
17
Table of Contents
We depend on third parties to maintain satisfactory manufacturing yields and delivery schedules, and their inability to do so could increase our costs, disrupt our supply chain, and result in our inability to deliver our products, which would adversely affect our operating results.
We depend on our contract manufacturers and semiconductor fabricators to maintain high levels of productivity and satisfactory delivery schedules at manufacturing and assembly facilities located primarily in China, Taiwan, and Thailand. We provide our contract manufacturers with six-month rolling forecasts of our production requirements. We do not, however, have long-term agreements with any of our contract manufacturers that guarantee production capacity, prices, lead times, or delivery schedules. On occasion, customers require rapid increases in production, which can strain our resources and reduce our margins. Although we have been able to obtain increased production capacity from our third-party contract manufacturers in the past, there is no guarantee that our contract manufacturers will be able to increase production capacity to meet customer demands in the future. Our contract manufacturers also serve other customers, a number of which have greater production requirements than we do. As a result, our contract manufacturers could determine to prioritize production capacity for other customers or reduce or eliminate deliveries to us on short notice. Qualifying new contract manufacturers, and specifically semiconductor foundries, is time consuming and might result in unforeseen manufacturing and operations problems. We may also encounter lower manufacturing yields and longer delivery schedules in commencing volume production of new products that we introduce, which could increase our costs or disrupt our supplies. The loss of relationships with our contract manufacturers or assemblers, or their inability to conduct their manufacturing and assembly services for us as anticipated in terms of capacity, cost, quality, and timeliness could adversely affect our ability to fill customer orders in accordance with required delivery, quality, and performance requirements, and adversely affect our operating results.
Shortages of components and materials may delay or reduce our sales and increase our costs, thereby harming our operating results.
The inability to obtain sufficient quantities of components and other materials necessary for the production of our products could result in reduced or delayed sales or lost orders. Many of the materials used in the production of our products are available only from a limited number of foreign suppliers, particularly suppliers located in Asia. In most cases, neither we nor our contract manufacturers have long-term supply contracts with these suppliers. As a result, we are subject to increased costs, supply interruptions, and difficulties in obtaining materials. Our customers also may encounter difficulties or increased costs in obtaining the materials necessary to produce their products into which our product solutions are incorporated. Future shortages of materials and components, including potential supply constraints of silicon, could cause delayed shipments and customer dissatisfaction, which may result in lower revenue.
We are subject to lengthy development periods and product acceptance cycles, which can result in development and engineering costs without any future revenue.
We provide human interface solutions that are incorporated by OEMs into the products they sell. OEMs make the determination during their product development programs whether to incorporate our human interface solutions or pursue other alternatives. This process requires us to make significant investments of time and resources in the design of human interface solutions well before our customers introduce their products incorporating these interfaces, and before we can be sure that we will generate any significant sales to our customers or even recover our investment. During a customer’s entire product development process, we face the risk that our interfaces will fail to meet our customer’s technical, performance, or cost requirements, or that our products will be replaced by competitive products or alternative technological solutions. Even if we complete our design process in a manner satisfactory to our customer, the customer may delay or terminate its product development efforts. The occurrence of any of these events could cause sales to not materialize, be deferred, or be cancelled, which would adversely affect our operating results.
We face intense competition that could result in our losing or failing to gain market share and suffering reduced revenue.
We serve intensely competitive markets that are characterized by price erosion, rapid technological change, and competition from major domestic and international companies. This intense competition could result in pricing pressures, lower sales, reduced margins, and lower market share. Depressed economic conditions, a slowdown in the PC product applications market, the emergence of new products not including our product solutions, rapid changes in the smartphone market and competitive pressures may result in lower demand for our product solutions, and reduced unit margins.
18
Table of Contents
Any movement away from high-quality, custom designed, feature-rich human interface solutions to lower priced alternatives would adversely affect our business. Some of our competitors, particularly in the markets for mobile product applications and other electronic devices, have greater market recognition, larger customer bases, and substantially greater financial, technical, marketing, distribution, and other resources than we possess and that afford them greater competitive advantages. As a result, they may be able to devote greater resources to the promotion and sale of products, negotiate lower prices for raw materials and components, deliver competitive products at lower prices, and introduce new product solutions and respond to customer requirements more quickly than we can. Our competitive position could suffer if one or more of our customers determine not to utilize our custom engineered, total solutions approach and instead, decide to design and manufacture their own interfaces, contract with our competitors, or use alternative technologies.
Our ability to compete successfully depends on a number of factors, both within and outside our control. These factors include the following:
| • | our success in designing and introducing new human interface solutions, including those implementing new technologies; |
| • | our ability to predict the evolving needs of our customers and to assist them in incorporating our technologies into their new products; |
| • | our ability to meet our customers’ requirements for low power consumption, ease of use, reliability, durability, and small form factor; |
| • | our ability to meet our customers’ price and performance requirements; |
| • | the quality of our customer service and support; |
| • | the rate at which customers incorporate our human interface solutions into their own products; |
| • | product or technology introductions by our competitors; and |
| • | foreign currency fluctuations, which may cause a foreign competitor’s products to be priced significantly lower than our product solutions. |
If we do not keep pace with technological innovations, our products may not remain competitive and our revenue and operating results may suffer.
We operate in rapidly changing highly competitive markets. Technological advances, the introduction of new products and new design techniques could adversely affect our business unless we are able to adapt to the changing conditions. Technological advances could render our solutions less competitive or obsolete, and we may not be able to respond effectively to the technological requirements of evolving markets. Therefore, we will be required to expend substantial funds for and commit significant resources to enhancing and developing new technology which may include purchasing advanced design tools and test equipment, hiring additional highly qualified engineering and other technical personnel, and continuing and expanding research and development activities on existing and potential human interface solutions.
Our research and development efforts with respect to new technologies may not result in customer or market acceptance. Some or all of those technologies may not successfully make the transition from the research and development stage to cost-effective production as a result of technology problems, competitive cost issues, yield problems, and other factors. Even if we successfully complete a research and development effort with respect to a particular technology, our customers may decide not to introduce or may terminate products utilizing the technology for a variety of reasons, including difficulties with other suppliers of components for the products superior technologies developed by our competitors and unfavorable comparisons of our solutions with these technologies price considerations and lack of anticipated or actual market demand for the products.
19
Table of Contents
Our business could be harmed if we are unable to develop and utilize new technologies that address the needs of our customers, or our competitors or customers develop and utilize new technologies more effectively or more quickly than we can. Any investments made to enhance or develop new technologies that are not successful could have an adverse effect on our net revenue and operating results.
We may not be able to enhance our existing product solutions and develop new product solutions in a timely manner.
Our future operating results will depend to a significant extent on our ability to continue to provide new human interface solutions that compare favorably with alternative solutions on the basis of time to introduction, cost, performance, and end user preferences. Our success in maintaining existing and attracting new customers, and developing new business depends on various factors, including the following:
| • | innovative development of new solutions for customer products; |
| • | utilization of advances in technology; |
| • | maintenance of quality standards; |
| • | performance advantages; |
| • | efficient and cost-effective solutions; and |
| • | timely completion of the design and introduction of new human interface solutions. |
Our inability to enhance our existing product solutions and develop new product solutions on a timely basis could harm our operating results and impede our growth.
Additionally, our human interface solutions are designed to integrate touch, handwriting, and vision capabilities. New computing and communications devices could be developed that call for a different interface solution. Existing devices could also be modified to allow for a different interface solution. Our business could be harmed if our products become noncompetitive as a result of a technological breakthrough that allows a new interface solution to displace our solutions and achieve significant market acceptance.
International sales and manufacturing risks could adversely affect our operating results.
Our manufacturing and assembly operations are primarily conducted in China, Taiwan, and Thailand by contract manufacturers and semiconductor fabricators. We have sales and logistics operations in Hong Kong, and sales and engineering design support operations in China, Japan, Korea, Switzerland, and Taiwan. These international operations expose us to various economic, political, and other risks that could adversely affect our operations and operating results, including the following:
| • | difficulties and costs of staffing and managing a multi-national organization; |
| • | unexpected changes in regulatory requirements; |
| • | differing labor regulations; |
| • | potentially adverse tax consequences; |
| • | tariffs, duties and other trade barrier restrictions; |
| • | changes to export or import compliance laws; |
| • | possible employee turnover or labor unrest; |
| • | greater difficulty in collecting accounts receivable; |
20
Table of Contents
| • | the burdens and costs of compliance with a variety of foreign laws; |
| • | the volatility of currency exchange rates; |
| • | potentially reduced protection for intellectual property rights; |
| • | political or economic instability in certain parts of the world; and |
| • | natural disasters, including earthquakes or tsunamis. |
If any of these risks associated with international operations materialize, our operations could be disrupted, which would negatively affect our operating results.
Our operating results could be adversely affected by fluctuations in the value of the U.S. dollar against foreign currencies.
We transact business predominantly in U.S. dollars, and we invoice and collect our sales in U.S. dollars. A weakening of the U.S. dollar could cause our overseas vendors to require renegotiation of either the prices or currency we pay for their goods and services. In the future, customers may negotiate pricing and make payments in non-U.S. currencies. For fiscal 2014, approximately 8% of our costs were denominated in non-U.S. currencies, including Canadian dollars, Hong Kong dollars, British pounds, Taiwan dollars, Japanese yen, Korean won, Chinese yuan, and Swiss francs.
If our overseas vendors or customers require us to transact business in non-U.S. currencies, fluctuations in foreign currency exchange rates could affect our cost of goods, operating expenses, and operating margins and could result in exchange losses. In addition, currency devaluation could result in a loss to us if we hold deposits of that currency. Hedging foreign currencies can be difficult, especially if the currency is not freely traded. We cannot predict the impact of future exchange rate fluctuations on our operating results. We currently do not hedge any foreign currencies.
If we fail to manage our growth effectively, our infrastructure, management, and resources could be strained, our ability to effectively manage our business could be diminished, and our operating results could suffer.
The failure to manage our planned growth effectively could strain our resources, which would impede our ability to increase revenue. We have increased the number of our human interface solutions and plan to further expand the number and diversity of our solutions and their use in the future. Our ability to manage our planned diversification and growth effectively will require us to:
| • | successfully hire, train, retain, and motivate additional employees, including employees outside the United States; |
| • | efficiently plan and expand our facilities to meet increased headcount requirements; |
| • | enhance our global operational, financial, and management infrastructure; and |
| • | expand our development and production capacity. |
In connection with the expansion and diversification of our product and customer base, we are increasing our personnel and making other expenditures to meet demand for our expanding product offerings, including offerings in the mobile product applications market and the notebook computer market. Any increase in expenses or investments in infrastructure and facilities in anticipation of future orders that do not materialize would adversely affect our profitability. Our customers also may require rapid increases in design and production services that place an excessive short-term burden on our resources and the resources of our contract manufacturers. An inability to quickly expand our development, design or production capacity or an inability of our third-party manufacturers to quickly expand development, design or production capacity to meet this customer demand could result in a decrease to our revenue or operating results. If we cannot manage our growth effectively, our business and operating results could suffer.
21
Table of Contents
We depend on key personnel who would be difficult to replace, and our business will likely be harmed if we lose their services or cannot hire additional qualified personnel.
Our success depends substantially on the efforts and abilities of our senior management and other key personnel. The competition for qualified management and key personnel, especially engineers, is intense. Although we maintain noncompetition and nondisclosure covenants with most of our key personnel, and our key executives have change of control severance agreements, we do not have employment agreements with any of them. The loss of services of one or more of our key employees or the inability to hire, train, and retain key personnel, especially engineers and technical support personnel, and capable sales and customer-support employees outside the United States, could delay the development and sale of our products, disrupt our business, and interfere with our ability to execute our business plan.
In the future, if we are unable to obtain stockholder approval of additional shares for our share-based compensation award programs we could be at a competitive disadvantage in the marketplace for qualified personnel or may be required to increase the cash element of our compensation program.
Our compensation program, which includes cash and share-based compensation award components, has been instrumental in attracting, hiring, motivating, and retaining qualified personnel. Competition for qualified personnel in our industry is extremely intense, particularly for engineering and other technical personnel. Our success depends on our continued ability to attract, hire, motivate, and retain qualified personnel and our share-based compensation award programs provide us with a competitive compensatory tool for this purpose. The continued use of our share-based compensation program is necessary for us to compete for engineering and other technical personnel and professional talent without significantly increasing cash compensation costs. In the future, if we are unable to obtain stockholder approval of additional shares for our share-based compensation award programs we could be at a competitive disadvantage in the marketplace for qualified personnel or may be required to increase the cash elements of our compensation program to account for this disadvantage.
Our ability to compete successfully and continue growing as a company depends on our ability to adequately protect our proprietary technology and confidential information.
We protect our proprietary technology and confidential information through the use of patents, trade secrets, trademarks, confidentiality agreements and other contractual provisions. The process of seeking patent protection is lengthy and expensive. Further, there can be no assurance that even if a patent is issued, that it will not be challenged, invalidated or circumvented, or that the rights granted under the patents will provide us with meaningful protection or any commercial advantage.
We have not applied for, and do not have, any copyright registration on our technologies or products. We have applied to register certain of our trademarks in the United States and other countries. There can be no assurance that we will obtain registrations of principal or other trademarks in key markets. Failure to obtain registrations could compromise our ability to fully protect our trademarks and brands, and could increase the risk of challenge from third parties to our use of our trademarks and brands. Effective intellectual property protection may be unavailable or limited in some foreign countries in which we operate. In particular, the validity, enforceability and scope of protection of intellectual property in China, where we derive a significant portion of our net sales, and certain other countries where we derive net sales, are still evolving and historically, have not protected and may not protect in the future, intellectual property rights to the same extent as laws developed in the United States.
We do not consistently rely on written agreements with our customers, suppliers, manufacturers, and other recipients of our technologies and products, and therefore some trade secret protection may be lost and our ability to enforce our intellectual property rights may be limited. Confidentiality and non-disclosure agreements which are in place may not be adequate to protect our proprietary technologies or may be breached by other parties. Additionally, our customers, suppliers, manufacturers, and other recipients of our technologies and products may seek to use our technologies and products without appropriate limitations. In the past, we did not consistently require our employees and consultants to enter into confidentiality, employment, or proprietary information and invention assignment agreements. Therefore, our former employees and consultants may try to claim some ownership interest in our technologies and products, and may use our technologies and products competitively and without appropriate limitations. Unauthorized parties may attempt to copy or otherwise use aspects of our technologies and products that we regard as proprietary. Other companies, including our competitors, may independently develop technologies that are similar or superior to our technologies, duplicate our technologies, or design around our patents. If our intellectual property protection is insufficient to protect our intellectual property rights, we could face increased competition in the markets for our technologies and products.
22
Table of Contents
In the future, we may need to file lawsuits to enforce our intellectual property rights, to protect our trade secrets, or to determine the validity and scope of the proprietary rights of others. This litigation, whether successful or unsuccessful, could result in substantial costs and diversion of resources, which could have a material adverse effect on our business, financial condition, and operating results.
Any claims that our technologies infringe the intellectual property rights of third parties could result in significant costs and have a material adverse effect on our business.
We cannot be certain that our technologies and products do not and will not infringe issued patents or other third party proprietary rights. Any claims, with or without merit, could result in significant litigation costs and diversion of resources, including the attention of management, and could require us to enter into royalty or licensing agreements, any of which could have a material adverse effect on our business. There can be no assurance that such licenses could be obtained on commercially reasonable terms, if at all, or that the terms of any offered licenses would be acceptable to us. We may also have to pay substantial damages to third parties, or indemnify customers or licensees for damages they suffer if the products they purchase from us or the technology they license from us violates any third party intellectual property rights. An adverse determination in a judicial or administrative proceeding, or a failure to obtain necessary licenses to use such third-party technology could prevent us from manufacturing, using, or selling certain of our products, and there is no guarantee that we will able to develop or acquire alternate non-infringing technology.
In addition, we license certain technology used in and for our products from third parties. These third-party licenses are granted with restrictions, and there can be no assurances that such third-party technology will remain available to us on commercially acceptable terms.
If third-party technology currently utilized in our products is no longer available to us on commercially acceptable terms, or if any third party initiates litigation against us for alleged infringement of their proprietary rights, we may not be able to sell certain of our products and we could incur significant costs in defending against litigation or attempting to develop or acquire alternate non-infringing products, which would have an adverse effect on our operating results.
If we become subject to product returns or claims resulting from defects in our products, we may incur significant costs resulting in a decrease in revenue.
We develop complex products in an evolving marketplace and generally warrant our products for a period of 12 months from the date of sale. Despite testing by us and our customers, defects may be found in existing or new products. Manufacturing errors or product defects could result in a delay in recognition or loss of revenue, loss of market share, or failure to achieve market acceptance. Additionally, defects could result in financial or other damages to our customers, causing us to incur significant warranty, support, and repair costs, and diverting the attention of our engineering personnel from key product development efforts.
Potential strategic alliances may not achieve their objectives, and the failure to do so could impede our growth.
We have entered, and we anticipate that we will continue to enter, into strategic alliances. We continually explore strategic alliances designed to enhance or complement our technology or to work in conjunction with our technology; to provide necessary know-how, components, or supplies; and to develop, introduce, and distribute products utilizing our technology. Certain strategic alliances may not achieve their intended objectives, and parties to our strategic alliances may not perform as contemplated. The failure of these alliances to achieve their objectives may impede our ability to introduce new products and enter new markets.
23
Table of Contents
Any acquisitions that we undertake could be difficult to integrate, disrupt our business, dilute stockholder value, and harm our operating results.
We expect to pursue opportunities to acquire other businesses and technologies in order to complement our current human interface solutions, expand the breadth of our markets, enhance our technical capabilities, or otherwise create growth opportunities. In fiscal year 2014, we acquired Validity and entered into an agreement to acquire RSP. We cannot accurately predict the timing, size, and success of any future acquisitions. We may be unable to identify suitable acquisition candidates or to complete the acquisitions of candidates that we identify. Increased competition for acquisition candidates or increased asking prices by acquisition candidates may increase purchase prices for acquisitions to levels beyond our financial capability or to levels that would not result in the returns required by our acquisition criteria. Acquisitions may also become more difficult in the future as we or others acquire the most attractive candidates. Unforeseen expenses, difficulties, and delays frequently encountered in connection with rapid expansion through acquisitions could inhibit our growth and negatively impact our operating results. If we make any future acquisitions, we could issue stock that would dilute existing stockholders’ percentage ownership, incur substantial debt, assume contingent liabilities, or experience higher operating expenses.
We may be unable to effectively complete an integration of the management, operations, facilities, and accounting and information systems of acquired businesses with our own; efficiently manage the combined operations of the acquired businesses with our operations; achieve our operating, growth, and performance goals for acquired businesses; achieve additional revenue as a result of our expanded operations; or achieve operating efficiencies or otherwise realize cost savings as a result of anticipated acquisition synergies. The integration of acquired businesses involves numerous risks, including the following:
| • | the potential disruption of our core business; |
| • | the potential strain on our financial and managerial controls, reporting systems and procedures; |
| • | potential unknown liabilities associated with the acquired business; |
| • | unanticipated costs associated with the acquisition; |
| • | diversion of management’s attention from our core business; |
| • | problems assimilating the purchased operations, technologies, or products; |
| • | risks associated with entering markets and businesses in which we have little or no prior experience; |
| • | failure of acquired businesses to achieve expected results; |
| • | adverse effects on existing business relationships with suppliers and customers; |
| • | failure to retain key customers, suppliers, or personnel of acquired businesses; |
| • | the risk of impairment charges related to potential write-downs of acquired assets; and |
| • | the potential inability to create uniform standards, controls, procedures, policies, and information systems. |
We cannot assure you that we would be successful in overcoming problems encountered in connection with any acquisitions, and our inability to do so could disrupt our operations, result in goodwill or intangible asset impairment charges, and adversely affect our business.
Repatriation of our foreign earnings to the United States or changes in tax laws may adversely affect our future reported tax rates and financial results or the way we conduct our business.
Changes in tax laws may adversely affect our future reported tax rates and financial results or the way we conduct our business. We consider the undistributed operating earnings of certain foreign subsidiaries of approximately $548.8 million as of the end of fiscal 2014, to be indefinitely invested outside the United States and have not provided for U.S. federal and state income taxes that may result from future remittances of those undistributed operating earnings. Proposals to reform U.S. tax laws, including proposals that could reduce or eliminate the deferral of U.S. income tax on our foreign subsidiaries’ undistributed earnings, could require those earnings to be taxed at the U.S. federal income tax rate. If we do need to access our foreign subsidiaries’ undistributed earnings for our domestic operations, we would be required to accrue and pay U.S. taxes to repatriate these funds, which would adversely impact our financial position and results of operations.
24
Table of Contents
Currently our investments in auction rate securities, or ARS investments, are not liquid, and we may lose some or all of our principal invested, or may be required to further reduce the carrying value if the issuers are not able to meet their payment obligations or if we sell our ARS investments before they recover.
We ended fiscal 2014 with $24.0 million invested in ARS investments for which the auctions have failed and our investments are not liquid. The carrying value of these investments was $19.8 million, reflecting $12.8 million of other-than-temporary impairment, partially offset by $8.6 million of unrealized recovery. If the issuers are not able to meet their payment obligations or if we sell our ARS investments before they recover, we may lose some or all of the principal invested or may be required to further reduce the carrying value. This would adversely affect our financial position, operating results, and cash flows.
We face risks associated with security breaches or cyber attacks.
We face risks associated with security breaches or cyber attacks of our computer systems or those of our third-party representatives, vendors, and service providers. Although we have implemented security procedures and controls to address these threats, our systems may still be vulnerable to data theft, computer viruses, programming errors, attacks by third parties, or similar disruptive problems. If our systems, or systems owned by third parties affiliated with our company, were breached or attacked, the proprietary and confidential information of our company and our customers could be disclosed and we may be required to incur substantial costs and liabilities, including the following: expenses to rectify the consequences of the security breach or cyber attack; liability for stolen assets or information; costs of repairing damage to our systems; lost revenue and income resulting from any system downtime caused by such breach or attack; loss of competitive advantage if our proprietary information is obtained by competitors as a result of such breach or attack; increased costs of cyber security protection; costs of incentives we may be required to offer to our customers or business partners to retain their business; and damage to our reputation. In addition, any compromise of security or a cyber attack could deter customers or business partners from entering into transactions that involve providing confidential information to us. As a result, any compromise of security of our systems or cyber attack could have a material adverse effect on our business, reputation, financial condition, and operating results.
We must finance the growth of our business and the development of new products, which could have an adverse effect on our operating results.
To remain competitive, we must continue to make significant investments in research and development, marketing, and business development. Our failure to increase sufficiently our net revenue to offset these increased costs would adversely affect our operating results.
From time to time, we may seek additional equity or debt financing to provide for funds required to expand our business, including through acquisitions. We cannot predict the timing or amount of any such requirements at this time. If such financing is not available on satisfactory terms, we may be unable to expand our business or to develop new business at the rate desired and our operating results may suffer. If obtained, the financing itself carries risks including the following: debt financing increases expenses and must be repaid regardless of operating results. Equity financing, including issuance of additional shares in connection with acquisitions, could result in dilution to existing stockholders and could adversely affect the price of our common stock.
We expect to incur additional expenses in complying with corporate governance and public disclosure requirements.
Changing laws, regulations, and standards relating to corporate governance and public disclosure, including SEC regulations and Nasdaq Global Select Market rules, create uncertainty and increased expenses for companies such as ours. New or changed laws, regulations, and standards are subject to varying interpretations in many cases due to their lack of specificity and, as a result, their application in practice may evolve over time as new guidance is provided by regulatory and governing bodies, which could result in continuing uncertainty regarding compliance matters and higher costs necessitated by ongoing revisions to disclosure and governance practices. We are committed to maintaining high standards of corporate governance and public disclosure. As a result, our efforts to comply with evolving laws, regulations, and standards have resulted in, and are likely to continue to result in, increased general and administrative expenses and a diversion of management time and attention from revenue-generating activities to compliance activities. We expect these efforts to require the continued commitment of significant resources.
25
Table of Contents
During the third quarter of calendar year 2012, the SEC adopted rules implementing the Dodd-Frank Wall Street Reform and Consumer Protection Act, or Dodd-Frank. These rules impose diligence and disclosure requirements regarding the use of “conflict minerals” mined from the Democratic Republic of Congo and adjoining countries. Compliance with these rules is likely to result in additional costs and expenses, including cost and expenses incurred for due diligence, to determine and verify the sources of any conflict minerals used in our products, and remediation and other changes to products, processes, or sources of supply as a consequence of such verification efforts. These rules may also affect the sourcing and availability of minerals used in the manufacture of our products as there may be only a limited number of suppliers offering “conflict free” minerals that can be used in our products. There can be no assurance that we will be able to obtain such minerals in sufficient quantities or at competitive prices.
The accounting requirements for income taxes on certain of our share-based compensation awards will subject our future quarterly and annual effective tax rates to greater volatility and, consequently, our ability to reasonably estimate our future quarterly and annual effective tax rates will be greatly diminished.
We recognize a tax benefit upon expensing nonqualified stock options and deferred stock units, or DSUs, issued under our share-based compensation plans. However, under current accounting standards, we cannot recognize that tax benefit concurrent with expensing incentive stock options and employee stock purchase plan shares (qualified stock options) issued under our share-based compensation plans. For qualified stock options that vested after our adoption of the applicable accounting standards, we recognize the tax benefit only in the period when disqualifying dispositions of the underlying stock occur and, for qualified stock options that vested prior to our adoption of the applicable accounting standards, the tax benefit is recorded directly to additional paid-in capital. Accordingly, because we cannot recognize the tax benefit for share-based compensation expense associated with qualified stock options until the occurrence of future disqualifying dispositions of the underlying stock, such disqualified dispositions may happen in periods when our stock price substantially increases, and because a portion of that tax benefit may be directly recorded to additional paid-in capital, our future quarterly and annual effective tax rates will be subject to greater volatility and, consequently, our ability to estimate reasonably our future quarterly and annual effective tax rates is greatly diminished.
Our charter documents and Delaware law could make it more difficult for a third party to acquire us, and discourage a takeover.
Our certificate of incorporation and the Delaware General Corporation Law contain provisions that may have the effect of making more difficult or delaying attempts by others to obtain control of our company, even when these attempts may be in the best interests of our stockholders. Our certificate of incorporation also authorizes our Board of Directors, without stockholder approval, to issue one or more series of preferred stock, which could have voting and conversion rights that adversely affect or dilute the voting power of the holders of common stock. Delaware law also imposes conditions on certain business combination transactions with “interested stockholders.” Our certificate of incorporation divides our Board of Directors into three classes, with one class to stand for election each year for a three-year term after the election. The classification of directors tends to discourage a third party from initiating a proxy solicitation or otherwise attempting to obtain control of our company and may maintain the incumbency of our Board of Directors, as this structure generally increases the difficulty of, or may delay, replacing a majority of directors. Our certificate of incorporation authorizes our Board of Directors to fill vacancies or newly created directorships. A majority of the directors then in office may elect a successor to fill any vacancies or newly created directorships.
The market price of our common stock has been and may continue to be volatile.
The trading price of our common stock has been and may continue to be subject to wide fluctuations in response to various factors, including the following:
| • | variations in our quarterly results; |
| • | the financial guidance we may provide to the public, any changes in such guidance, or our failure to meet such guidance; |
| • | changes in financial estimates by industry or securities analysts or our failure to meet such estimates; |
26
Table of Contents
| • | various market factors or perceived market factors, including rumors, whether or not correct, involving us, our customers, our suppliers, or our competitors; |
| • | announcements of technological innovations by us or by our competitors; |
| • | introductions of new products or new pricing policies by us or by our competitors; |
| • | acquisitions or strategic alliances by us or our competitors; |
| • | recruitment or departure of key personnel; |
| • | the gain or loss of significant orders; |
| • | the gain or loss of significant customers; |
| • | market conditions in our industry, the industries of our customers, and the economy as a whole; |
| • | short positions held by investors; and |
| • | general financial market conditions or occurrences. |
In addition, stocks of technology companies have experienced extreme price and volume fluctuations that often have been unrelated or disproportionate to these companies’ operating performance. Public announcements by technology companies concerning, among other things, their performance, accounting practices, or legal problems could cause the market price of our common stock to decline regardless of our actual operating performance.
| ITEM 1B. | UNRESOLVED STAFF COMMENTS |
Not applicable.
| ITEM 2. | PROPERTIES |
Our principal executive offices, as well as our principal research and development, sales, marketing, and administrative functions, are located in San Jose, California, where we own approximately 161,000 square feet of facilities. During our fiscal year 2014, we purchased a 5.35-acre site adjacent to our principal executive offices with two buildings totaling approximately 80,000 square feet. We plan to retrofit one of the buildings to support the expansion of our San Jose-based employee population. We also have research and development functions in leased offices in New York, Arizona, Texas, Idaho, and Georgia. Our Asia/Pacific principal offices are located in a leased office in Hong Kong, where we have sales, operations, and research and development functions. We also have sales and research and development functions in leased offices in Taiwan, Japan, India and South Korea, and we have sales functions in leased offices in China, Switzerland, and Finland.
| ITEM 3. | LEGAL PROCEEDINGS |
None.
| ITEM 4. | MINE SAFETY DISCLOSURES |
Not applicable.
27
Table of Contents
| ITEM 5. | MARKET FOR THE REGISTRANT’S COMMON EQUITY, RELATED STOCKHOLDER MATTERS AND ISSUER PURCHASES OF EQUITY SECURITIES |
Market Information on Common Stock
Our common stock has been listed on the Nasdaq Global Select Market (formerly on the Nasdaq National Market) under the symbol “SYNA” since January 29, 2002. Prior to that time, there was no public market for our common stock. The following table sets forth, for the periods indicated, the high and low sales prices of our common stock as quoted on the Nasdaq Global Select Market.
| High | Low | |||||||
| Fiscal 2014: |
||||||||
| First quarter |
$ | 45.84 | $ | 37.87 | ||||
| Second quarter |
$ | 56.50 | $ | 43.06 | ||||
| Third quarter |
$ | 67.11 | $ | 48.62 | ||||
| Fourth quarter |
$ | 91.50 | $ | 55.46 | ||||
| Fiscal 2013: |
||||||||
| First quarter |
$ | 31.56 | $ | 23.67 | ||||
| Second quarter |
$ | 30.36 | $ | 22.58 | ||||
| Third quarter |
$ | 41.49 | $ | 29.28 | ||||
| Fourth quarter |
$ | 45.40 | $ | 34.74 | ||||
Stockholders
As of August 15, 2014, there were approximately 178 holders of record of our common stock. The closing price of our common stock as quoted on the Nasdaq Global Select Market as of August 15, 2014 was $80.35.
Dividends
We have never declared or paid cash dividends on our common stock. We currently plan to retain all earnings to finance the growth of our business or purchase shares under our common stock repurchase program. Payments of any cash dividends in the future will depend on our financial condition, operating results, and capital requirements, as well as other factors deemed relevant by our board of directors.
Our revolving line of credit also places restrictions on the payment of any dividends.
Issuer Purchases of Equity Securities
From April 2005 through July 2014, our Board of Directors cumulatively authorized $730.0 million for our common stock repurchase program, which expires in July 2016. As of July 2014, the remaining amount authorized for the repurchase of our common stock is $199.6 million. There were no repurchases under the stock repurchase program during the three-month period ended June 28, 2014.
28
Table of Contents
Performance Graph
The following line graph compares cumulative total stockholder returns for the five years ended June 30, 2014 for (i) our common stock, (ii) the Nasdaq Composite Index and (iii) the Philadelphia Semiconductor Index. The graph assumes an investment of $100 on June 30, 2009. The calculations of cumulative stockholder return on the Nasdaq Composite Index and the Philadelphia Semiconductor Index include reinvestment of dividends. The calculation of cumulative stockholder return on our common stock does not include reinvestment of dividends because we did not pay any dividends during the measurement period. The historical performance shown is not necessarily indicative of future performance.
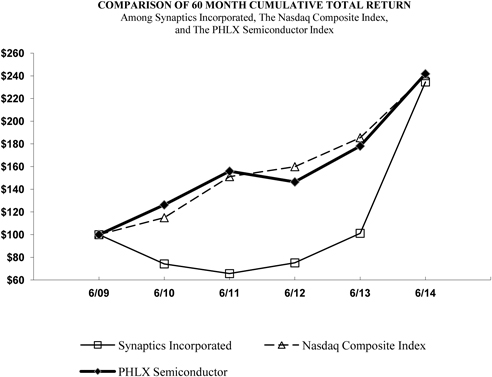
The performance graph above shall not be deemed “filed” for purposes of Section 18 of the Exchange Act, or otherwise subject to the liability of that section. The performance graph above will not be deemed incorporated by reference into any filing of our company under the Exchange Act or the Securities Act.
29
Table of Contents
| ITEM 6. | SELECTED FINANCIAL DATA |
The following table presents selected financial data for each fiscal year in the five-year period ended June 30, 2014. Our fiscal year is the 52- or 53-week period ending on the last Saturday in June. Fiscal 2012 was a 53-week period and the other fiscal years presented were 52-week periods. Our past results of operations are not necessarily indicative of our future results of operations. You should read the selected financial data below in conjunction with Item 7. Management’s Discussion and Analysis of Financial Condition and Results of Operations and our consolidated financial statements and related notes contained elsewhere in this report.
| 2014 | 2013 | 2012 | 2011 | 2010 | ||||||||||||||||
| (in thousands, except per share amounts) | ||||||||||||||||||||
| Consolidated Statements of Income Data: |
||||||||||||||||||||
| Net revenue |
$ | 947,539 | $ | 663,588 | $ | 548,228 | $ | 598,538 | $ | 514,890 | ||||||||||
| Cost of revenue |
511,459 | 337,784 | 292,661 | 352,468 | 306,188 | |||||||||||||||
|
|
|
|
|
|
|
|
|
|
|
|||||||||||
| Gross margin |
436,080 | 325,804 | 255,567 | 246,070 | 208,702 | |||||||||||||||
|
|
|
|
|
|
|
|
|
|
|
|||||||||||
| Operating expenses: |
||||||||||||||||||||
| Research and development |
192,681 | 144,699 | 117,954 | 105,003 | 86,552 | |||||||||||||||
| Selling, general, and administrative |
100,005 | 79,620 | 70,045 | 68,549 | 60,027 | |||||||||||||||
| Acquired intangibles amortization |
1,047 | 1,025 | — | — | — | |||||||||||||||
| Change in contingent consideration |
69,861 | 1,347 | — | — | — | |||||||||||||||
| Gain on sale of property and equipment |
— | (1,578 | ) | — | — | — | ||||||||||||||
|
|
|
|
|
|
|
|
|
|
|
|||||||||||
| Total operating expenses |
363,594 | 225,113 | 187,999 | 173,552 | 146,579 | |||||||||||||||
|
|
|
|
|
|
|
|
|
|
|
|||||||||||
| Operating income |
72,486 | 100,691 | 67,568 | 72,518 | 62,123 | |||||||||||||||
| Interest income/(expense), net |
1,973 | 1,042 | 905 | 894 | (1,423 | ) | ||||||||||||||
| Other charges or expenses |
— | — | 77 | 59 | (443 | ) | ||||||||||||||
|
|
|
|
|
|
|
|
|
|
|
|||||||||||
| Income before provision for income taxes |
74,459 | 101,733 | 68,550 | 73,471 | 60,257 | |||||||||||||||
| Provision for income taxes |
27,770 | 2,800 | 14,406 | 9,675 | 7,292 | |||||||||||||||
|
|
|
|
|
|
|
|
|
|
|
|||||||||||
| Net income |
$ | 46,689 | $ | 98,933 | $ | 54,144 | $ | 63,796 | $ | 52,965 | ||||||||||
|
|
|
|
|
|
|
|
|
|
|
|||||||||||
| Net income per share: |
||||||||||||||||||||
| Basic |
$ | 1.34 | $ | 3.03 | $ | 1.64 | $ | 1.87 | $ | 1.57 | ||||||||||
|
|
|
|
|
|
|
|
|
|
|
|||||||||||
| Diluted |
$ | 1.26 | $ | 2.89 | $ | 1.57 | $ | 1.80 | $ | 1.50 | ||||||||||
|
|
|
|
|
|
|
|
|
|
|
|||||||||||
| Shares used in computing net income per share: |
||||||||||||||||||||
| Basic |
34,761 | 32,658 | 33,030 | 34,042 | 33,836 | |||||||||||||||
|
|
|
|
|
|
|
|
|
|
|
|||||||||||
| Diluted |
37,105 | 34,239 | 34,435 | 35,454 | 35,423 | |||||||||||||||
|
|
|
|
|
|
|
|
|
|
|
|||||||||||
| Consolidated Balance Sheets Data: |
||||||||||||||||||||
| Cash, cash equivalents, and short-term investments |
$ | 447,205 | $ | 355,303 | $ | 305,005 | $ | 247,153 | $ | 209,858 | ||||||||||
| Working capital |
488,023 | 410,794 | 340,579 | 281,423 | 228,534 | |||||||||||||||
| Total assets |
1,020,333 | 691,266 | 541,505 | 456,201 | 414,679 | |||||||||||||||
| Long-term debt |
— | 2,305 | 2,305 | 2,305 | 2,305 | |||||||||||||||
| Treasury shares, at cost |
530,422 | 460,160 | 413,885 | 352,142 | 281,932 | |||||||||||||||
| Total stockholders’ equity |
701,157 | 521,855 | 396,790 | 339,993 | 286,511 | |||||||||||||||
Our basic net income per share amounts for each period presented have been computed using the weighted average number of shares of common stock outstanding. Our diluted net income per share amounts for each period presented include the weighted average effect of potentially dilutive shares. We used the “treasury stock” method to determine the dilutive effect of our stock options, Deferred Stock Units, or DSUs, Market Stock Units, or MSUs, and convertible notes.
30
Table of Contents
| ITEM 7. | MANAGEMENT’S DISCUSSION AND ANALYSIS OF FINANCIAL CONDITION AND RESULTS OF OPERATIONS |
Forward-Looking Statements and Factors That May Affect Results
You should read the following discussion and analysis in conjunction with our financial statements and related notes contained elsewhere in this report. This discussion contains forward-looking statements that involve risks, uncertainties, and assumptions. Our actual results may differ materially from those anticipated in these forward-looking statements as a result of a variety of factors, including those set forth under Item 1A. Risk Factors.
Overview
We are a leading worldwide developer and supplier of custom-designed human interface solutions that enable people to interact more easily and intuitively with a wide variety of mobile computing, communications, entertainment, and other electronic devices. We believe our results to date reflect the combination of our customer focus, the strength of our intellectual property and our engineering know-how, which allow us to develop or engineer products that meet the demanding design specifications of OEMs.
We recognize revenue from product sales when there is persuasive evidence that an arrangement exists, delivery has occurred and title has transferred, the price is fixed or determinable, and collection is reasonably assured. Our net revenue increased from $514.9 million for fiscal 2010 to $947.5 million for fiscal 2014, representing a compound annual growth rate of approximately 17%. For fiscal 2010, we derived 59% of our net revenue from the personal computer market and 41% of our net revenue from the mobile product applications market. For fiscal 2014, revenue from the personal computer market accounted for 27% of our net revenue and revenue from the mobile product applications market accounted for 73% of our net revenue.
Many of our customers have manufacturing operations in China, and many of our OEM customers have established design centers in Asia. With our expanding global presence, including offices in China, Finland, Hong Kong, India, Japan, Korea, Switzerland, Taiwan, and the United States, we are well positioned to provide local sales, operational, and engineering support services to our existing customers, as well as potential new customers, on a global basis.
Our manufacturing operations are based on a variable cost model in which we outsource all of our production requirements and generally drop ship our products directly to our customers from our contract manufacturers’ facilities, eliminating the need for significant capital expenditures and allowing us to minimize our investment in inventories. This approach requires us to work closely with our contract manufacturers and semiconductor fabricators to ensure adequate production capacity to meet our forecasted volume requirements. We provide our contract manufacturers with six-month rolling forecasts and issue purchase orders based on our anticipated requirements for the next 90 days. However, we do not have any long-term supply contracts with any of our contract manufacturers. We use two third-party wafer manufacturers to supply wafers and four third-party packaging manufacturers to package our proprietary ASICs. In certain cases, we rely on a single source or a limited number of suppliers to provide other key components of our products. Our cost of revenue includes all costs associated with the production of our products, including materials, logistics, manufacturing, assembly, and test costs paid to third-party manufacturers, and related overhead costs associated with our indirect manufacturing operations personnel. Additionally, we charge all warranty costs, yield losses, and any inventory provisions or write-downs to cost of revenue.
Our gross margin generally reflects the combination of the added value we bring to our OEM customers’ products in meeting their custom design requirements and the impact of our ongoing cost-improvement programs. These cost-improvement programs include reducing materials and component costs, and implementing design and process improvements. Our newly introduced products may have lower margins than our more mature products, which have realized greater benefits associated with our ongoing cost-improvement programs. As a result, new product introductions may initially negatively impact our gross margin.
Our research and development expenses include costs for supplies and materials related to product development, as well as the engineering costs incurred to design human interface solutions for OEM customers prior to and after their commitment to incorporate those solutions into their products. These expenses have generally increased, reflecting our continuing commitment to the technological and design innovation required to maintain our position in our existing markets, and to adapt our existing technologies or develop new technologies for new markets.
31
Table of Contents
Selling, general, and administrative expenses include expenses related to sales, marketing, and administrative personnel; internal sales and outside sales representatives’ commissions; market and usability research; outside legal, accounting, and consulting costs; and other marketing and sales activities. These expenses have generally increased, primarily reflecting incremental staffing and related support costs associated with our increased business levels, growth in our existing markets, and penetration into new markets.
Critical Accounting Policies and Estimates
The preparation of consolidated financial statements in conformity with GAAP requires us to make estimates and judgments that affect the reported amounts of assets, liabilities, revenue, expenses, and related disclosure of contingent assets and liabilities. On an ongoing basis, we evaluate our estimates, including those related to revenue recognition, allowance for doubtful accounts, cost of revenue, inventories, product warranty, share-based compensation costs, provision for income taxes, deferred income tax asset valuation allowances, uncertain tax positions, tax contingencies, goodwill, intangible assets, investments, and contingencies. We base our estimates on historical experience, applicable laws and regulations, and various other assumptions that we believe to be reasonable under the circumstances, the results of which form the basis for making judgments about the carrying value of assets and liabilities that are not readily apparent from other sources. Actual results may differ from these estimates under different assumptions or conditions.
The methods, estimates, interpretations, and judgments we use in applying our most critical accounting policies can have a significant impact on the results that we report in our consolidated financial statements. The SEC considers an entity’s most critical accounting policies to be those policies that are both most important to the portrayal of the entity’s financial condition and results of operations and those that require the entity’s most difficult, subjective, or complex judgments, often as a result of the need to make assumptions and estimates about matters that are inherently uncertain. We believe the following critical accounting policies affect our more significant judgments and estimates used in the preparation of our consolidated financial statements.
Revenue Recognition
We recognize revenue from product sales when there is persuasive evidence that an arrangement exists, delivery has occurred and title has transferred, the price is fixed or determinable, and collection is reasonably assured, which is generally upon shipment of the product. We accrue for estimated sales returns, incentives and other allowances at the time we recognize revenue. Our products contain embedded firmware and software that allows for further differentiation and customer integration, which together with, or consisting of, our ASIC chip delivers the essential functionality of our products and, as such, software revenue recognition guidance is not applicable.
Investments
Accounting standards require us to record available-for-sale securities at fair value, with unrealized gains and losses being reported as a component of other comprehensive income. We follow the accounting standards to assess whether our investments with loss positions are other-than-temporarily impaired. We follow the hierarchal approach established under the accounting standards to determine fair value of our investments.
The accounting standards define fair value as the price that would be received to sell an asset or paid to transfer a liability in an orderly transaction between market participants at the measurement date. Our fair value estimates consider, among other factors, the collateral underlying the security investments, creditworthiness of the counterparty, timing of expected future cash flows, and, in the case of ARS investments, the probability of a successful auction in a future period. We follow the guidance provided to estimate fair value when the volume and level of activity for an asset or liability have significantly decreased in relation to normal market activity for the asset or liability, and to determine circumstances that may indicate that a transaction is not orderly.
Further, we use judgment in evaluating whether a decline in fair value is temporary or other-than-temporary and consider the following indicators: changes in credit ratings or asset quality; changes in the economic environment; length of time and extent to which fair value has been below cost basis; changes in market conditions; and changes in expected cash flows. We do not intend to sell the investments, and it is more likely than not that we will not be required to sell the investments before recovery of their amortized cost basis. Temporary declines in fair value are recorded as charges to accumulated other comprehensive income in the equity section of our balance sheet, while other-than-temporary declines in fair value are bifurcated between credit losses, which are charged to earnings, and noncredit losses which, depending on facts and circumstances may be charged to other comprehensive income or earnings.
32
Table of Contents
Inventory
We state our inventories at the lower of cost or market. We base our assessment of the ultimate realization of inventories on our projections of future demand and market conditions. Sudden declines in demand, rapid product improvements, or technological changes, or any combination of these factors can cause us to have excess or obsolete inventories. On an ongoing basis, we review for estimated obsolete or unmarketable inventories and write down our inventories to their net realizable value based upon our forecasts of future demand and market conditions. If actual market conditions are less favorable than our forecasts, additional inventory write-downs may be required. The following factors influence our estimates: changes to or cancellations of customer orders, unexpected decline in demand, rapid product improvements and technological advances, and termination or changes by our OEM customers of any product offerings incorporating our product solutions.
Periodically, we purchase inventory from our contract manufacturers when a customer delays its delivery schedule or cancels its order. In those circumstances in which our customer has cancelled its order and we purchase inventory from our contract manufacturers, we record a write-down, if necessary, to reduce the carrying value of the inventory purchased to its net realizable value. The effect of these write-downs is to establish a new cost basis in the related inventory, which we do not subsequently write up. We also record a liability and charge to cost of revenue for estimated losses on inventory we are obligated to purchase from our contract manufacturers when such losses become probable from customer delays or order cancellations.
Goodwill
Goodwill represents the excess of the purchase price over the fair value of net tangible and identifiable intangible assets acquired.
Goodwill is measured and tested for impairment annually during the last quarter of our fiscal year, or more frequently if we believe indicators of impairment exist. Events that could trigger a more frequent impairment review may include adverse industry or economic trends, restructuring actions, lower projections of profitability, or a sustained decline in our market capitalization. During our annual assessment of goodwill impairment, we have the option to first assess qualitative factors to determine whether the existence of events or circumstances leads to a determination that it is more likely than not that the fair value of a reporting unit is less than its carrying value before performing the two step quantitative impairment test. If, after assessing the totality of events or circumstances, we determine it is not more likely than not that the fair value of a reporting unit is less than its carrying amount, then performing the two step impairment test is not necessary. The first step requires comparing the fair value of our one reporting unit to its net book value, including goodwill. We have allocated our goodwill to a single company-wide reporting unit. If we subsequently determine that our goodwill should be allocated to a separate reportable unit within our company then determining the fair value of a reporting unit will be judgmental in nature and involves the use of significant estimates and assumptions. These estimates and assumptions include revenue growth rates and forecasted operating margins used to calculate projected future cash flows, risk-adjusted discount rates, future economic and market conditions and determination of appropriate market comparables. We base our fair value estimates on assumptions we believe to be reasonable. Actual future results may differ from those estimates. Future competitive, market and economic conditions could negatively impact key assumptions including our market capitalization or the carrying value of our net assets, which could require us to realize an impairment of our goodwill and intangible assets.
A potential impairment exists if the fair value of the reporting unit is less than its net book value. The second step of the process is only performed if a potential impairment exists, and it involves determining the difference between the fair value of the reporting unit’s net assets, other than goodwill, to the fair value of the reporting unit. If the difference is less than the net book value of goodwill, an impairment exists and is recorded. No goodwill impairment was recognized in fiscal 2014, 2013, and 2012.
Acquired Intangibles
We review acquired intangible assets with finite lives for impairment whenever events or changes in circumstances indicate the carrying value of an asset may not be recoverable. Recoverability of these intangible assets is assessed based on the estimated undiscounted future cash flows expected to result from the use of the asset. If the undiscounted future cash flows are less than the carrying amount, the acquired intangible assets with finite lives are considered to be impaired. The amount of the impairment is measured as the difference between the carrying amount of these assets and the fair value.
33
Table of Contents
Our business combinations have included the purchase of in-process research and development assets that are not amortizable until the underlying project is complete. We assess that our in-process research and development project is complete when all material research and development costs have been incurred and no significant risks remain. We review the carrying value of indefinite-lived intangible assets for impairment at least annually during the last quarter of our fiscal year, or more frequently if we believe indicators of impairment exist.
Business Combinations
We have applied significant estimates and judgments in order to determine the fair value of the identified assets acquired, liabilities assumed, goodwill recognized, and contingent consideration recorded in connection with our business combinations to ensure the value of the assets and liabilities acquired are recognized at fair value as of the acquisition date. In measuring the fair value, we utilize valuation techniques consistent with the market approach, income approach, or cost approach.
The valuation of the identifiable assets and liabilities includes assumptions made in performing the valuation, such as projected revenue, weighted average cost of capital, discount rates, estimated useful lives, estimated probabilities of achieving contingent payment milestones, and other relevant assessments. These assessments can be significantly affected by our estimates, judgments, and assumptions. If actual results are not consistent with our estimates, judgments, or assumptions, or if additional or new information arises in the future that affects our fair value estimates, then adjustments to our initial fair value estimates may have a material impact to our purchase accounting or our results of operations.
Share-Based Compensation Costs
We account for employee share-based compensation costs in accordance with relevant accounting standards. We utilize the Black-Scholes option pricing model to estimate the grant date fair value of certain employee share-based compensatory awards, which requires the input of highly subjective assumptions, including expected volatility and expected life. Historical and implied volatilities were used in estimating the fair value of our share-based awards. The expected life for our options was previously estimated based on historical trends since our initial public offering. In fiscal 2011, we began to grant options with a contractual life of seven years rather than ten years, and we began using the simplified method of establishing the expected life as we do not have any history of options with seven-year lives. In fiscal 2013, we began to grant options that vest over a three-year period rather than a four-year period, and we continue to use the simplified method of establishing the expected life as we do not have any history of options that vest over a three-year period. Changes in these inputs and assumptions can materially affect the measure of estimated fair value of our share-based compensation. Estimated forfeitures for share-based awards that are not expected to vest are estimated based on historical trends since our initial public offering. We charge the estimated fair value less estimated forfeitures to earnings on a straight-line basis over the vesting period of the underlying awards, which is now generally three years for our stock options, DSUs, MSUs and up to two years for our employee stock purchase plan.
The Black-Scholes option pricing model was developed for use in estimating the fair value of traded options that have no vesting restrictions and are fully transferable. As our stock option and our employee stock purchase plan awards have characteristics that differ significantly from traded options, and as changes in the assumptions can materially affect the estimated value, our estimate of fair value may not accurately represent the value assigned by a third party in an arms-length transaction. There currently is no market-based mechanism to verify the reliability and accuracy of the estimates derived from the Black-Scholes option pricing model or other allowable valuation models, nor is there a means to compare and adjust the estimates to actual values. While our estimate of fair value and the associated charge to earnings materially affects our results of operations, it has no impact on our cash position.
We estimate the fair value of market-based MSUs at the date of grant using a Monte Carlo simulation model and amortize those fair values over the requisite service period, generally three years, adjusted for estimated forfeitures for each separately vesting tranche of the award. The Monte Carlo simulation model that we use to estimate the fair value of market-based MSUs at the date of grant incorporates into the valuation the possibility that the market condition may not be satisfied. Provided that the requisite service is rendered, the total fair value of the market-based MSUs at the date of grant must be recognized as compensation expense even if the market condition is not achieved. However, the number of shares that ultimately vest can vary significantly with the performance of the specified market criteria.
34
Table of Contents
There are significant variations among allowable valuation models, and there is a possibility that we may adopt a different valuation model or refine the inputs and assumptions under our current valuation models in the future, resulting in a lack of consistency in future periods. Our current or future valuation model and the inputs and assumptions we make may also lack comparability to other companies that use different models, inputs, or assumptions, and the resulting differences in comparability could be material.
Income Taxes
We recognize federal, foreign, and state current tax liabilities or assets based on our estimate of taxes payable or refundable in the then current fiscal year for each tax jurisdiction. We also recognize federal, foreign, and state deferred tax liabilities or assets for our estimate of future tax effects attributable to temporary differences and carryforwards and record a valuation allowance to reduce any deferred tax assets by the amount of any tax benefits that, based on available evidence and our judgment, are not expected to be realized. If our assumptions, and consequently our estimates, change in the future, the valuation allowance we established for our deferred tax assets may change, which could impact income tax expense.
We use a two-step approach to recognizing and measuring uncertain tax positions. The first step is to determine whether it is more-likely-than-not that a tax position will be sustained upon examination, including resolution of any related appeals or litigation processes. The second step is to measure the tax benefit as the largest amount that is more than 50% likely of being realized upon ultimate settlement with a taxing authority. The calculation of tax liabilities involves significant judgment in estimating the impact of uncertainties in the application of highly complex tax laws. Resolution of these uncertainties in a manner inconsistent with our expectations could have a material impact on our consolidated financial position, result of operations, or cash flows. We believe we have adequately provided for reasonably foreseeable outcomes in connection with the resolution of income tax uncertainties. However, our results have in the past, and could in the future, include favorable and unfavorable adjustments to our estimated tax liabilities in the period a determination of such estimated tax liability is made or resolved, upon the filing of an amended return, upon a change in facts, circumstances, or interpretation, or upon the expiration of a statute of limitation. Accordingly, our effective tax rate could fluctuate materially from period to period.
We consider the operating earnings of our foreign subsidiaries to be indefinitely invested outside the United States. Accordingly, no provision has been made for the U.S. federal, state, or foreign taxes that may result from future remittances of undistributed earnings of our foreign subsidiaries.
We recognize a tax benefit upon expensing certain share-based awards associated with our share-based compensation plans, including nonqualified stock options, DSUs, and MSUs, but we cannot recognize tax benefit concurrent with the recognition of share-based compensation expenses associated with qualified stock options (incentive stock options and employee stock purchase plan shares). For qualified stock options, we recognize a tax benefit only in the period when disqualifying dispositions of the underlying stock occur, which historically has been up to several years after vesting and in a period when our stock price substantially increases. As a result, our future quarterly and annual effective tax rates will be subject to greater volatility and, consequently, our ability to estimate reasonably our future quarterly and annual effective tax rates is greatly diminished.
Changes in contingent consideration can be significant from period to period and a portion of the change in contingent consideration is non-deductible. As a result, changes in contingent consideration can have a material impact on our effective tax rate from period to period.
35
Table of Contents
Results of Operations
The following sets forth certain of our consolidated statements of income data for fiscal 2014, 2013, and 2012, along with comparative information regarding the absolute and percentage changes in these amounts (in thousands, except percentages):
| 2014 (1) | 2013 | $ Change | % Change | 2013 | 2012 | $ Change | % Change | |||||||||||||||||||||||||
| Mobile product applications |
$ | 689,866 | $ | 424,076 | $ | 265,790 | 62.7 | % | $ | 424,076 | $ | 270,106 | $ | 153,970 | 57.0 | % | ||||||||||||||||
| PC product applications |
257,673 | 239,512 | 18,161 | 7.6 | % | 239,512 | 278,122 | (38,610 | ) | (13.9 | %) | |||||||||||||||||||||
|
|
|
|
|
|
|
|
|
|
|
|
|
|||||||||||||||||||||
| Net revenue |
947,539 | 663,588 | 283,951 | 42.8 | % | 663,588 | 548,228 | 115,360 | 21.0 | % | ||||||||||||||||||||||
|
|
|
|
|
|
|
|
|
|
|
|
|
|||||||||||||||||||||
| Gross margin |
436,080 | 325,804 | 110,276 | 33.8 | % | 325,804 | 255,567 | 70,237 | 27.5 | % | ||||||||||||||||||||||
|
|
|
|
|
|
|
|
|
|
|
|
|
|||||||||||||||||||||
| Operating expenses: |
||||||||||||||||||||||||||||||||
| Research and development |
192,681 | 144,699 | 47,982 | 33.2 | % | 144,699 | 117,954 | 26,745 | 22.7 | % | ||||||||||||||||||||||
| Selling, general, and administrative |
100,005 | 79,620 | 20,385 | 25.6 | % | 79,620 | 70,045 | 9,575 | 13.7 | % | ||||||||||||||||||||||
| Acquired intangibles amortization |
1,047 | 1,025 | 22 | 2.1 | % | 1,025 | — | 1,025 | n/m | (2) | ||||||||||||||||||||||
| Change in contingent consideration |
69,861 | 1,347 | 68,514 | 5086.4 | % | 1,347 | — | 1,347 | n/m | (2) | ||||||||||||||||||||||
| Gain on sale of property and equipment |
— | (1,578 | ) | 1,578 | (100.0 | %) | (1,578 | ) | — | (1,578 | ) | n/m | (2) | |||||||||||||||||||
|
|
|
|
|
|
|
|
|
|
|
|
|
|||||||||||||||||||||
| Operating income |
72,486 | 100,691 | (28,205 | ) | (28.0 | %) | 100,691 | 67,568 | 33,123 | 49.0 | % | |||||||||||||||||||||
| Interest income, net |
1,973 | 1,042 | 931 | 89.3 | % | 1,042 | 982 | 60 | 6.1 | % | ||||||||||||||||||||||
|
|
|
|
|
|
|
|
|
|
|
|
|
|||||||||||||||||||||
| Income before provision for income taxes |
74,459 | 101,733 | (27,274 | ) | (26.8 | %) | 101,733 | 68,550 | 33,183 | 48.4 | % | |||||||||||||||||||||
| Provision for income taxes |
27,770 | 2,800 | 24,970 | 891.8 | % | 2,800 | 14,406 | (11,606 | ) | (80.6 | %) | |||||||||||||||||||||
|
|
|
|
|
|
|
|
|
|
|
|
|
|||||||||||||||||||||
| Net income |
$ | 46,689 | $ | 98,933 | $ | (52,244 | ) | (52.8 | %) | $ | 98,933 | $ | 54,144 | $ | 44,789 | 82.7 | % | |||||||||||||||
|
|
|
|
|
|
|
|
|
|
|
|
|
|||||||||||||||||||||
| (1) | Includes the results of operations from Validity, which was acquired on November 7, 2013 (see Note 5 to the consolidated financial statements) |
| (2) | not meaningful |
The following sets forth certain of our consolidated statements of income data as a percentage of net revenues for fiscal 2014, 2013, and 2012:
| 2014 (1) | 2013 | Percentage Point Increase (Decrease) |
2013 | 2012 | Percentage Point Increase (Decrease) |
|||||||||||||||||||
| Mobile product applications |
72.8 | % | 63.9 | % | 8.9 | % | 63.9 | % | 49.3 | % | 14.6 | % | ||||||||||||
| PC product applications |
27.2 | % | 36.1 | % | (8.9 | %) | 36.1 | % | 50.7 | % | (14.6 | %) | ||||||||||||
|
|
|
|
|
|
|
|
|
|||||||||||||||||
| Net revenue |
100.0 | % | 100.0 | % | 100.0 | % | 100.0 | % | ||||||||||||||||
|
|
|
|
|
|
|
|
|
|||||||||||||||||
| Gross margin |
46.0 | % | 49.1 | % | (3.1 | %) | 49.1 | % | 46.6 | % | 2.5 | % | ||||||||||||
|
|
|
|
|
|
|
|
|
|||||||||||||||||
| Operating expenses: |
||||||||||||||||||||||||
| Research and development |
20.3 | % | 21.8 | % | (1.5 | %) | 21.8 | % | 21.5 | % | 0.3 | % | ||||||||||||
| Selling, general, and administrative |
10.6 | % | 12.0 | % | (1.4 | %) | 12.0 | % | 12.8 | % | (0.8 | %) | ||||||||||||
| Acquired intangibles amortization |
0.1 | % | 0.2 | % | (0.1 | %) | 0.2 | % | 0.0 | % | 0.2 | % | ||||||||||||
| Change in contingent consideration |
7.4 | % | 0.2 | % | 7.2 | % | 0.2 | % | 0.0 | % | 0.2 | % | ||||||||||||
|
|
|
|
|
|
|
|
|
|||||||||||||||||
| Operating income |
7.6 | % | 15.2 | % | (7.6 | %) | 15.2 | % | 12.3 | % | 2.9 | % | ||||||||||||
| Income before provision for income taxes |
7.9 | % | 15.3 | % | (7.4 | %) | 15.3 | % | 12.5 | % | 2.8 | % | ||||||||||||
| Provision for income taxes |
2.9 | % | 0.4 | % | 2.5 | % | 0.4 | % | 2.6 | % | (2.2 | %) | ||||||||||||
|
|
|
|
|
|
|
|
|
|||||||||||||||||
| Net income |
4.9 | % | 14.9 | % | (10.0 | %) | 14.9 | % | 9.9 | % | 5.0 | % | ||||||||||||
|
|
|
|
|
|
|
|
|
|||||||||||||||||
| (1) | Includes the results of operations from Validity, which was acquired on November 7, 2013 (see Note 5 to the consolidated financial statements) |
36
Table of Contents
Fiscal 2014 Compared with Fiscal 2013
Net Revenue.
Net revenue was $947.5 million for fiscal 2014 compared with $663.6 million for fiscal 2013, an increase of $283.9 million, or 42.8%. Of our fiscal 2014 net revenue, $689.8 million, or 72.8%, of net revenue was from the mobile product applications market and $257.7 million, or 27.2%, of net revenue was from the PC product applications market. The overall increase in net revenue for fiscal 2014 was attributable to a $265.8 million, or 62.7%, increase in net revenue from mobile product applications, and an increase of $18.1 million, or 7.6%, in net revenue from PC product applications. Specific reasons for the increase in net revenue include an increase in the units sold in the mobile product applications market, reflecting both the growing market and an increase in our market share, as well as sales related to our new biometrics products. Within the mobile product applications market, one customer accounted for 28% of fiscal 2014 net revenue. The increase in PC product applications was primarily a result of higher unit sales related to our new biometrics products. Fingerprint sensor product revenue, which contributed to both mobile and PC product applications revenue, was $105.4 million in fiscal 2014.
Based on industry estimates of unit shipments from calendar 2013 to 2014, the smartphone market is anticipated to increase approximately 23%, the notebook market is anticipated to decrease approximately 4%, and the tablet market is anticipated to increase 12%.
Gross Margin.
Gross margin as a percentage of net revenue was 46.0%, or $436.1 million, for fiscal 2014 compared with 49.1%, or $325.8 million, for fiscal 2013. The 310 basis point decline in gross margin was primarily attributable to an unfavorable mix of lower margin revenue driven largely by the addition of fingerprint sensor module products, an increase in PC application module products, and further penetration into lower end mobile application products in China.
We continuously introduce new product solutions, many of which have life cycles of less than a year. Further, as we sell our capacitive sensing technology in designs that are generally unique or specific to an OEM customer’s application, gross margin varies on a product-by-product basis, making our cumulative gross margin a blend of our product specific designs. As a virtual manufacturer, our gross margin percentage is generally not impacted materially by our shipment volume. We charge losses on inventory purchase obligations and write-down to reduce the carrying value of obsolete, slow moving, and non-usable inventory to net realizable value (including warranty costs) to cost of revenue.
Operating Expenses.
Research and Development Expenses. Research and development expenses increased $48.0 million, to $192.7 million, for fiscal 2014 compared with fiscal 2013. The increase in research and development expenses primarily reflected (i) a $24.5 million increase in employee compensation and employment-related costs, resulting from a 38.2% increase in research and development headcount associated with the ongoing expansion of our product portfolio, including new employees related to the recent acquisition of Validity and annual compensation adjustments, (ii) a $7.2 million increase in infrastructure costs related to new facilities and information technology to support the additional staff, (iii) a $5.0 million increase in non-employee services, (iv) a $4.5 million increase in supplies and project related costs, and (v) a $2.3 million increase in software license fees.
Selling, General, and Administrative Expenses. Selling, general, and administrative expenses increased $20.4 million, to $100.0 million, for fiscal 2014 compared with fiscal 2013. The increase in selling, general, and administrative expenses primarily reflected (i) a $10.2 million increase in employee compensation and employment-related costs resulting from a 30.8% increase in selling, general, and administrative headcount, including new employees related to the Validity acquisition, and annual compensation adjustments, (ii) a $5.2 million increase in professional fees, primarily associated with acquisition-related costs, (iii) a $4.1 million increase in temporary employee services, and (iv) a $2.6 million increase in travel and related expenses, partially offset by a $2.3 million decrease in share-based compensation.
37
Table of Contents
Acquired Intangibles Amortization. Acquired intangibles amortization reflects the amortization of intangibles acquired through recent acquisitions. See note 6 to the financial statements contained elsewhere in this report.
Change in Contingent Consideration. Our contingent consideration increased $68.5 million for fiscal 2014 compared with fiscal 2013. The increase was primarily attributable to the increase in the estimated fair value of the contingent consideration liability related to the Validity acquisition, which resulted from a substantial increase in expected unit sales of products embodying the Validity fingerprint sensor technology over the remaining earn-out period. See note 5 to the financial statements contained elsewhere in this report.
Gain on property and equipment. The gain on sale of property and equipment for fiscal 2013 resulted from the sale of our former headquarters building.
Operating Income.
We generated operating income of $72.5 million for fiscal 2014, a decline of $28.2 million compared with fiscal 2013. As discussed in the preceding paragraphs, the decrease in operating income was primarily the result of a significant increase in the change in contingent consideration, partially offset by increased operating leverage from the 42.8% increase in net revenue.
Non-Operating Income.
Interest income, net. Interest income, net was $2.0 million for fiscal 2014 compared with $1.0 million for fiscal 2013, resulting from increases in interest rates.
Provision for Income Taxes.
The provision for income taxes was $27.8 million and $2.8 million for fiscal 2014 and 2013, respectively. The income tax provision represented estimated U.S. federal, foreign, and state taxes for fiscal 2014 and 2013. The effective tax rate for fiscal 2014 was approximately 37.3% and diverged from the combined federal and state statutory rate, primarily as a result of overseas profits taxed in lower tax rate jurisdictions, and the benefit of research tax credits; partially offset by foreign withholding taxes, nondeductible contingent consideration, and net unrecognized tax benefits associated with qualified stock options. The effective tax rate for fiscal 2013 was approximately 2.8% and diverged from the combined federal and state statutory rate, primarily as a result of overseas profits taxed in lower tax rate jurisdictions, the resolution of an income tax audit, and the benefit of research tax credits; partially offset by foreign withholding taxes and net unrecognized tax benefits associated with qualified stock options.
In May 2011, we were notified by the Internal Revenue Service, or the Service, that our fiscal 2003 through 2006 and fiscal 2008 through 2010 would be subject to examination. The early periods were being audited in connection with a mandatory review of tax refunds in excess of $2.0 million which resulted when we carried back our fiscal 2008 net operating loss. In March 2013, we received the Revenue Agent’s Report resolving our examination with the Service and paid an assessment that had no material impact on our condensed consolidated financial statements. Our case is pending review by the Joint Committee on Taxation, which we anticipate will conclude in our fiscal 2015. Any prospective adjustments to our unrecognized tax benefits will be recorded as an increase or decrease to income tax expense and cause a corresponding change to our effective tax rate. Accordingly, our effective tax rate could fluctuate materially from period to period.
On January 2, 2013, President Barack Obama signed into law The American Taxpayer Relief Act of 2013, or the Act. The Act extended the federal research credit for two years retroactively from January 1, 2012 through December 31, 2013. As such, we only recognized six months of tax benefit from the research tax credit for fiscal 2014.
It is reasonably possible that the amount of liability for unrecognized tax benefits may change within the next 12 months and an estimate of the range of possible changes could result in an increase of up to $2.0 million.
38
Table of Contents
Fiscal 2013 Compared with Fiscal 2012
Net Revenue.
Net revenue was $663.6 million for fiscal 2013 compared with $548.2 million for fiscal 2012, an increase of $115.4 million, or 21.0%. Of our fiscal 2013 net revenue, $424.1 million, or 63.9%, of net revenue was from the mobile product applications market and $239.5 million, or 36.1%, of net revenue was from the PC product applications market. The overall increase in net revenue for fiscal 2013 was attributable to a $154.0 million, or 57.0%, increase in net revenue from mobile product applications, partially offset by a decrease of $38.6 million, or 13.9%, in net revenue from PC product applications. Specific reasons for the increase in net revenue were primarily attributable to an increase in the units sold in the mobile product applications market, reflecting both the growing market and an increase in our market share. Within the mobile product applications market, one customer accounted for 14% of fiscal 2013 net revenue. The decrease in revenue from PC product applications was primarily a result of lower unit sales reflecting the continued weakness in the worldwide PC product applications market.
Gross Margin.
Gross margin as a percentage of net revenue was 49.1%, or $325.8 million, for fiscal 2013 compared with 46.6%, or $255.6 million, for fiscal 2012. The 150 basis point improvement in gross margin was primarily attributable to a favorable mix of higher margin mobile product applications revenue driven largely by the continued shift in our overall revenue mix to mobile product applications revenue consisting predominately of higher margin chip solutions.
Operating Expenses.
Research and Development Expenses. Research and development expenses increased $26.7 million, to $144.7 million, for fiscal 2013 compared with fiscal 2012. The increase in research and development expenses primarily reflected a $16.0 million increase in employee compensation and employment-related costs, resulting from a 13.9% increase in research and development staffing and annual compensation adjustments, and a $5.8 million increase in infrastructure costs to support the additional staff.
Selling, General, and Administrative Expenses. Selling, general, and administrative expenses increased $9.6 million, to $79.6 million, for fiscal 2013 compared with fiscal 2012. The increase in selling, general, and administrative expenses primarily reflected a $7.6 million increase in employee compensation and employment-related costs resulting from a 11.8% increase in selling, general, and administrative staffing and annual compensation adjustments.
Acquired Intangibles Amortization. Acquired intangibles amortization reflects the amortization of intangibles acquired through recent acquisitions. See note 6 to the financial statements contained elsewhere in this report.
Change in Contingent Consideration. Change in contingent consideration reflects the change in fair value of the contingent consideration liability related to our acquisition of Pacinian.
Gain on property and equipment. The gain on sale of property and equipment resulted from the sale of our former headquarters building.
Operating Income.
We generated operating income of $100.7 million for fiscal 2013, an increase of $33.1 million compared with fiscal 2012. As discussed in the preceding paragraphs, the increase in operating income was primarily the result of increased operating leverage from the 21% increase in net revenue, the decline in operating expenses as a percentage of net revenue, and the higher gross margin percentage.
39
Table of Contents
Non-Operating Income.
Interest Income, net. Interest income, net was $1.0 million for fiscal 2013 compared with $982,000 for fiscal 2012.
Provision for Income Taxes.
The provision for income taxes was $2.8 million and $14.4 million for fiscal 2013 and 2012, respectively. The income tax provision represented estimated U.S. federal, foreign, and state taxes for fiscal 2013 and 2012. The effective tax rate for fiscal 2013 was approximately 2.8% and diverged from the combined federal and state statutory rate, primarily as a result of overseas profits taxed in lower tax rate jurisdictions, the resolution of an income tax audit, and the benefit of research tax credits; partially offset by foreign withholding taxes and net unrecognized tax benefits associated with qualified stock options. The effective tax rate for fiscal 2012 was approximately 21.0% and diverged from the combined federal and state statutory rate, primarily as a result of overseas profits taxed in lower tax rate jurisdictions, the recognition of previously unrecognized tax benefits, and the benefit of research tax credits, partially offset by foreign withholding taxes and net unrecognized tax benefits associated with qualified stock options.
As a result of the Revenue Agent’s Report discussed above, we paid an assessment that had no material impact to our condensed consolidated financial statements, which at that time triggered the reevaluation of the measurement of prior year uncertain tax positions and resulted in the recognition of $15.8 million of previously unrecognized tax benefits for fiscal 2013.
40
Table of Contents
Quarterly Results of Operations
The following table sets forth our unaudited quarterly results of operations for the eight quarters in the two-year period ended June 30, 2014. The following table should be read in conjunction with the financial statements and related notes contained elsewhere in this report. We have prepared this unaudited information on the same basis as our audited financial statements. This table includes all adjustments, consisting only of normal recurring adjustments that we consider necessary for a fair presentation of our financial position and results of operations for the quarters presented. Past results of operations are not necessarily indicative of future operating performance; accordingly, you should not draw any conclusions about our future results from the results of operations for any quarter presented.
| Three Months Ended | ||||||||||||||||||||||||||||||||
| (in thousands, except per share amounts) | June | March | December | September | June | March | December | September | ||||||||||||||||||||||||
| (unaudited) | 2014(1) | 2014(1) | 2013(1) | 2013 | 2013 | 2013 | 2012 | 2012 | ||||||||||||||||||||||||
| Net revenue |
$ | 314,898 | $ | 204,271 | $ | 205,763 | $ | 222,607 | $ | 230,183 | $ | 163,324 | $ | 143,040 | $ | 127,041 | ||||||||||||||||
| Cost of revenue |
175,072 | 111,841 | 111,218 | 113,328 | 115,062 | 82,241 | 74,010 | 66,471 | ||||||||||||||||||||||||
|
|
|
|
|
|
|
|
|
|
|
|
|
|
|
|
|
|||||||||||||||||
| Gross margin |
139,826 | 92,430 | 94,545 | 109,279 | 115,121 | 81,083 | 69,030 | 60,570 | ||||||||||||||||||||||||
|
|
|
|
|
|
|
|
|
|
|
|
|
|
|
|
|
|||||||||||||||||
| Operating expenses: |
||||||||||||||||||||||||||||||||
| Research and development |
56,896 | 49,412 | 45,931 | 40,442 | 40,900 | 36,740 | 34,257 | 32,802 | ||||||||||||||||||||||||
| Selling, general, and administrative |
30,180 | 25,856 | 22,845 | 21,124 | 21,521 | 20,183 | 19,008 | 18,908 | ||||||||||||||||||||||||
| Acquired intangibles amortization |
262 | 262 | 261 | 262 | 262 | 262 | 261 | 240 | ||||||||||||||||||||||||
| Change in contingent consideration |
13,130 | 53,043 | 3,430 | 258 | 247 | 237 | 576 | 287 | ||||||||||||||||||||||||
| Gain on sale of property and equipment |
— | — | — | — | (1,578 | ) | — | — | — | |||||||||||||||||||||||
|
|
|
|
|
|
|
|
|
|
|
|
|
|
|
|
|
|||||||||||||||||
| Total operating expenses |
100,468 | 128,573 | 72,467 | 62,086 | 61,352 | 57,422 | 54,102 | 52,237 | ||||||||||||||||||||||||
|
|
|
|
|
|
|
|
|
|
|
|
|
|
|
|
|
|||||||||||||||||
| Operating income/(loss) |
39,358 | (36,143 | ) | 22,078 | 47,193 | 53,769 | 23,661 | 14,928 | 8,333 | |||||||||||||||||||||||
| Interest income, net |
560 | 516 | 471 | 426 | 415 | 193 | 220 | 214 | ||||||||||||||||||||||||
|
|
|
|
|
|
|
|
|
|
|
|
|
|
|
|
|
|||||||||||||||||
| Income/(loss) before income taxes |
39,918 | (35,627 | ) | 22,549 | 47,619 | 54,184 | 23,854 | 15,148 | 8,547 | |||||||||||||||||||||||
| Provision/(benefit) for income taxes |
5,446 | 4,429 | 5,215 | 12,680 | 8,864 | (12,592 | ) | 4,034 | 2,494 | |||||||||||||||||||||||
|
|
|
|
|
|
|
|
|
|
|
|
|
|
|
|
|
|||||||||||||||||
| Net income/(loss) |
$ | 34,472 | $ | (40,056 | ) | $ | 17,334 | $ | 34,939 | $ | 45,320 | $ | 36,446 | $ | 11,114 | $ | 6,053 | |||||||||||||||
|
|
|
|
|
|
|
|
|
|
|
|
|
|
|
|
|
|||||||||||||||||
| Net income/(loss) per share: |
||||||||||||||||||||||||||||||||
| Basic |
$ | 0.95 | $ | (1.12 | ) | $ | 0.51 | $ | 1.06 | $ | 1.37 | $ | 1.13 | $ | 0.34 | $ | 0.18 | |||||||||||||||
|
|
|
|
|
|
|
|
|
|
|
|
|
|
|
|
|
|||||||||||||||||
| Diluted |
$ | 0.89 | $ | (1.12 | ) | $ | 0.48 | $ | 1.00 | $ | 1.29 | $ | 1.07 | $ | 0.33 | $ | 0.18 | |||||||||||||||
|
|
|
|
|
|
|
|
|
|
|
|
|
|
|
|
|
|||||||||||||||||
| Shares used in computing net income/(loss) per share: |
||||||||||||||||||||||||||||||||
| Basic |
36,411 | 35,685 | 33,990 | 32,958 | 32,979 | 32,234 | 32,478 | 32,941 | ||||||||||||||||||||||||
|
|
|
|
|
|
|
|
|
|
|
|
|
|
|
|
|
|||||||||||||||||
| Diluted |
38,817 | 35,685 | 36,059 | 35,020 | 35,150 | 34,135 | 33,313 | 34,014 | ||||||||||||||||||||||||
|
|
|
|
|
|
|
|
|
|
|
|
|
|
|
|
|
|||||||||||||||||
| (1) | Includes the results of operations from Validity, which was acquired on November 7, 2013 (see Note 5 to the condensed consolidated financial statements) |
Liquidity and Capital Resources
Our cash and cash equivalents, which exclude ARS investments, were $447.2 million as of the end of fiscal 2014 compared with $355.3 million as of the end of fiscal 2013, an increase of $91.9 million. This increase primarily reflected $131.6 million provided from operating cash flows, $80.7 million from the issuance of shares under our employee equity compensation programs, $19.3 million for excess tax benefit from share-based compensation, partially offset by $70.3 million used to repurchase shares of our common stock, $38.7 million used for the purchase of property and equipment, which includes the renovation of our new headquarters campus and the purchase of two adjacent buildings for future expansion, $19.6 million used for a business acquisition, and $8.9 million used for payroll taxes for deferred stock units. We consider earnings of our foreign subsidiaries indefinitely invested overseas and have made no provision for income or withholding taxes that may result from a future repatriation of those earnings. As of June 30, 2014, $289.3 million of cash and cash equivalents was held by our foreign subsidiaries. If these funds are needed for our operations in the United States, we would be required to accrue and pay U.S. taxes to repatriate these funds.
41
Table of Contents
Cash Flows from Operating Activities. For fiscal 2014, net cash provided by operating activities of $131.6 million was primarily attributable to net income of $46.7 million plus adjustments for non-cash charges, including accretion and re-measurement of the contingent consideration liability of $69.9 million, share-based compensation costs of $32.8 million, depreciation and amortization of $14.2 million, other non-cash adjustments of $18.6 million, and a net change in operating assets and liabilities of $50.8 million. The net change in operating assets and liabilities related primarily to the $42.8 million increase in accounts receivable, which resulted from the substantial increase in net revenue in the fourth quarter of fiscal 2014 compared with fiscal 2013. Our days sales outstanding improved from 58 to 56 days from fiscal 2013 to fiscal 2014. Our inventory turns decreased from nine to eight from fiscal 2013 to fiscal 2014. For fiscal 2013, net cash provided by operating activities of $102.2 million was primarily attributable to net income of $98.9 million plus adjustments for non-cash charges, including share-based compensation costs of $32.2 million, depreciation and amortization of $10.8 million, other non-cash adjustments of $1.0 million and a net change in operating assets and liabilities of $38.8 million. The net change in operating assets and liabilities related primarily to the $44.3 million increase in accounts receivable resulting from the substantial increase in net revenue in the fourth quarter of fiscal 2013 compared with fiscal 2012. Our days sales outstanding improved from 68 to 58 days from fiscal 2012 to fiscal 2013. Our inventory turns remained stable at nine for the same period. For fiscal 2012, net cash provided by operating activities of $101.4 million was primarily attributable to net income of $54.1 million plus adjustments for non-cash charges, including share-based compensation costs of $34.2 million, depreciation and deferred taxes aggregating $9.7 million, and a net change in operating assets and liabilities of $2.2 million. Our days sales outstanding increased from 59 to 68 days from fiscal 2011 to fiscal 2012 as our net revenue was more backend loaded in fiscal 2012 than it was in fiscal 2011. Our inventory turns decreased from 11 to nine for the same period.
Cash Flows from Investing Activities. Net cash used in investing activities for fiscal 2014, 2013, and 2012 was $58.3 million, $37.5 million, and $14.9 million, respectively. Net cash used in investing activities for fiscal 2014 consisted of $38.7 million used for the purchase of capital assets and $19.6 million used for a business acquisition. Net cash used in investing activities for fiscal 2013 consisted of $48.5 million used for the purchase of capital assets and $5.0 million used for a business acquisition, partially offset by proceeds of $12.6 million for the sale of a building and land, as well as proceeds of $3.4 million from redemptions of ARS investments. Net cash used in investing activities for fiscal 2012 consisted of $14.6 million used for a business acquisition, $10.4 million used for the purchase of capital assets, partially offset by proceeds of $10.1 million from redemptions of ARS investments.
Cash Flows from Financing Activities. Net cash provided by financing activities for fiscal 2014 was $18.6 million, and net cash used in financing for fiscal 2013 and 2012 was $14.3 million and $28.7 million, respectively. Our net cash provided by financing activities for fiscal 2014 was primarily attributable to $80.7 million of proceeds from common stock issued under our share-based compensation plans and $19.3 million of excess tax benefit from share-based compensation, partially offset by $70.3 million used to repurchase shares of our common stock in the open market, and $8.9 million used for the payment of payroll taxes for DSUs and MSUs. Our net cash used in financing activities for fiscal 2013 was primarily attributable to $46.3 million used to repurchase shares of our common stock in the open market, $4.7 million used for the payment of payroll taxes for DSUs, and $4.6 million used for the payment of contingent consideration, partially offset by $37.4 million of proceeds from common stock issued under our share-based compensation plans. Our net cash used in financing activities for fiscal 2012 was primarily attributable to $61.7 million used to repurchase shares of our common stock in the open market and $3.9 million used for the payment of payroll taxes for DSUs, partially offset by $34.9 million of proceeds from common stock issued under our share-based compensation plans.
Common Stock Repurchase Program. In July 2014, our Board of Directors authorized the purchase of up to an additional $110.0 million of our common stock pursuant to our common stock repurchase program bringing the cumulative authorized total to $730.0 million, expiring in July 2016. The program authorizes us to purchase our common stock in the open market or in privately negotiated transactions, depending upon market conditions and other factors. The number of shares purchased and the timing of purchases is based on the level of our cash balances, general business and market conditions, and other factors, including alternative investment opportunities. Common stock purchased under this program is held as treasury stock. From April 2005 through the end of fiscal 2014, we repurchased 19,047,711 shares of our common stock in the open market for an aggregate cost of $530.4 million. Treasury shares purchased prior to August 28, 2008 were not subject to the stock split on that date if adjusted for the stock split, the average cost would be $22.48. As of July 2014, we had $199.6 million remaining under our common stock repurchase program.
Bank Credit Facility. We currently maintain a $75.0 million working capital line of credit with Wells Fargo Bank. The Wells Fargo Bank revolving line of credit, which expires on September 1, 2014, provides for an interest rate equal to the prime lending rate or 150 basis points above LIBOR, depending on whether we choose a variable or fixed rate, respectively. We did not borrow any amounts under the line of credit during and subsequent to fiscal 2014. We are currently negotiating the replacement of this line of credit with a $300 million multi-bank five-year term loan and line of credit lead by Wells Fargo Bank.
42
Table of Contents
$100 Million Shelf Registration. We have registered an aggregate of $100.0 million of common stock and preferred stock for issuance in connection with acquisitions, which shares generally will be freely tradeable after their issuance under Rule 145 of the Securities Act unless held by an affiliate of the acquired company, in which case such shares will be subject to the volume and manner of sale restrictions of Rule 144.
Liquidity and Capital Resources. We believe our existing cash and cash equivalents and anticipated cash flows from operating activities will be sufficient to meet our working capital and other cash requirements of our existing business for at least the next 12 months, including our contingent consideration obligation associated with the acquisition of Validity. We are currently negotiating a $300 million aggregate multi-bank five-year term loan and line of credit lead by Wells Fargo Bank, to be used in part to finance our acquisition of RSP. Our future capital requirements will depend on many factors, including our revenue, the timing and extent of spending to support product development efforts, costs related to protecting our intellectual property, the expansion of sales and marketing activities, the timing of introductions of new products and enhancements to existing products, the costs to ensure access to adequate manufacturing capacity, the costs of maintaining sufficient space or renovating recently acquired building space for our expanding workforce, the continuing market acceptance of our product solutions, our common stock repurchase program, and the amount and timing of our investments in, or acquisitions of, other technologies or companies. Further equity or debt financing may not be available to us on acceptable terms or at all. If sufficient funds are not available or are not available on acceptable terms, our ability to take advantage of business opportunities or to respond to competitive pressures could be limited or severely constrained.
Our non-current investments consist of ARS investments, which have failed to settle in auctions. These investments are not liquid, and in the event we need to access these funds, we will not be able to do so without a loss of principal, unless a future auction on these investments is successful.
Based on our ability to access our cash and cash equivalents, our expected operating cash flows, and our other sources of cash, we do not anticipate that the lack of liquidity on these investments will affect our ability to operate our business as usual. Further, while we do not anticipate the need to remit undistributed earnings of our foreign subsidiaries to meet our working capital and other cash requirements, if we did remit such earnings we would be required to accrue and pay U.S. taxes to repatriate these funds, which would adversely impact our financial position and results of operations.
Contractual Obligations and Commercial Commitments
The following table sets forth a summary of our material contractual obligations and commercial commitments as of the end of fiscal 2014 (in millions):
| Payments due by period | ||||||||||||||||||||
| Less than | 1-3 | 3-5 | More than | |||||||||||||||||
| Contractual Obligations |
Total | 1 year | Years | Years | 5 Years | |||||||||||||||
| Leases |
$ | 13 | $ | 4 | $ | 5 | $ | 3 | $ | 1 | ||||||||||
| Purchase obligations and other commitments (1) |
108 | 58 | 50 | — | — | |||||||||||||||
|
|
|
|
|
|
|
|
|
|
|
|||||||||||
| Total |
$ | 121 | $ | 62 | $ | 55 | $ | 3 | $ | 1 | ||||||||||
|
|
|
|
|
|
|
|
|
|
|
|||||||||||
| (1) | Purchase obligations and other commitments include payments due under a building construction agreement, contingent consideration, long-term services agreement and inventory purchase obligations with contract |
manufacturers .
In connection with the acquisition of Validity in November 2013, we entered into a contingent consideration arrangement. As of June 30, 2014, we may owe up to $146.2 million of additional cash consideration to the former Validity stockholders and option holders based on unit sales of products utilizing Validity technology through March 2016. The estimated fair value of the contingent consideration liability as of June 30, 2014 was $104.0 million.
In connection with the acquisition of Pacinian in June 2012, we entered into a contingent consideration arrangement and subsequently paid $5.0 million of additional consideration to the former Pacinian stockholders upon customer acceptance of a ThinTouch product. As of June 30, 2014, we may owe up to $10.0 million of additional consideration to the former Pacinian stockholders based on unit sales of products utilizing ThinTouch technology through June 2016. The estimated fair value of the contingent consideration liability as of June 30, 2014 was $6.1 million.
43
Table of Contents
The amounts in the table above exclude unrecognized tax benefits of $10.2 million. As of June 30, 2014, we were unable to make a reasonably reliable estimate of when cash settlement with a taxing authority may occur in connection with our gross unrecognized tax benefit.
Off-Balance Sheet Arrangements
We do not have any transactions, arrangements, or other relationships with unconsolidated entities that are reasonably likely to materially affect our financial condition, revenues or expenses, results of operations, liquidity, or capital resources. We have no special purpose or limited purpose entities that provide off-balance sheet financing, liquidity, or market or credit risk support; engage in leasing, hedging, or research and development services; or have other relationships that expose us to liability that is not reflected in our financial statements.
Recently Issued Accounting Pronouncements Not Yet Effective
In July 2013, the Financial Accounting Standards Board, or the FASB, issued an accounting standards update on presentation of an unrecognized tax benefit when a net operating loss carryforward, a similar tax loss carryforward, or a tax credit carryforward exists. The new standard requires that an unrecognized tax benefit should be presented as a reduction of deferred tax assets for a net operating loss carryforward, a similar tax loss carryforward, or a tax credit carryforward, if such carryforwards are required or expected to settle additional income taxes in the event the uncertain tax position is disallowed. The new standard also requires in situations carryforwards cannot be used or the deferred tax assets are not intended to be used for such purpose, that the unrecognized tax benefit should be recorded as a liability and should not be presented as a reduction of deferred tax assets. We are required to adopt this standard for our interim and annual periods in fiscal 2015. We are currently evaluating the impact of adopting this guidance, but do not expect it to have a material impact on our consolidated financial statements.
In May 2014, the FASB issued an accounting standards update on Revenue from Contracts with Customers, which requires an entity to recognize the amount of revenue to which it expects to be entitled for the transfer of promised goods or services to customers. The new standard will replace most existing revenue recognition guidance in U.S. GAAP when the new standard becomes effective. The new standard is effective for us in our fiscal year 2018. Early application is not permitted. We are evaluating the effect the new standard will have on our consolidated financial statements and related disclosures. The new standard permits the use of either the retrospective or cumulative effect transition method. We have not yet selected a transition method or determined the effect of the standard on our ongoing financial reporting.
44
Table of Contents
| ITEM 7A. | QUANTITATIVE AND QUALITATIVE DISCLOSURES ABOUT MARKET RISK |
Interest rate risk
Our exposure to market risk for changes in interest rates relates primarily to our cash and cash equivalents and ARS investments. We do not use our investment portfolio for trading or other speculative purposes.
The table below presents principal amounts and related weighted average interest rates by year of maturity for our cash equivalents and investments as of the end of fiscal 2014 (in thousands, except average interest rates):
| Fair | ||||||||||||||||||||||||||||||||
| Fiscal Year Ended June |
2015 | 2016 | 2017 | 2018 | 2019 | Thereafter | Total | Value | ||||||||||||||||||||||||
| Assets |
||||||||||||||||||||||||||||||||
| Cash equivalents – variable rate |
||||||||||||||||||||||||||||||||
| Money market |
$ | 439,675 | $ | — | $ | — | $ | — | $ | — | $ | — | $ | 439,675 | $ | 439,675 | ||||||||||||||||
| Average interest rate |
0.14 | % | — | — | — | — | — | 0.14 | % | |||||||||||||||||||||||
| Total cash equivalents |
$ | 439,675 | $ | — | $ | — | $ | — | $ | — | $ | — | $ | 439,675 | $ | 439,675 | ||||||||||||||||
| Average interest rate |
0.14 | % | — | — | — | — | — | 0.14 | % | |||||||||||||||||||||||
| Non-current investments |
$ | — | $ | 2,000 | $ | — | $ | 13,500 | $ | — | $ | 8,500 | $ | 24,000 | $ | 19,785 | ||||||||||||||||
| Average interest rate |
— | 0.40 | % | — | 2.29 | % | — | 1.44 | % | 1.97 | % | |||||||||||||||||||||
Our non-current investments, which consist of ARS investments, have a par value of $24.0 million and have failed to settle in auctions beginning in 2007. These investments are not liquid, and in the event we need to access these funds, we will not be able to do so without a loss of principal, unless redeemed by the issuers or a future auction on these investments is successful. During fiscal 2014, none of our ARS investments were redeemed and therefore we had no recognized gain or loss on these investments.
As there are currently no active markets for our various failed ARS investments, we have estimated the fair value of these investments as of the end of fiscal 2014 using a trinomial discounted cash flow analysis. The analysis considered, among other factors, the following:
| • | the collateral underlying the security investments; |
| • | the creditworthiness of the counterparty; |
| • | the timing of expected future cash flows; |
| • | the probability of a successful auction in a future period; |
| • | the underlying structure of each investment; |
| • | the present value of future principal and interest payments discounted at rates considered to reflect current market conditions; |
| • | a consideration of the probabilities of default, passing a future auction, or redemption at par for each period; and |
| • | estimates of the recovery rates in the event of default for each investment. |
When possible, our failed ARS investments were compared to other observable market data or securities with similar characteristics. Our estimate of the fair value of our ARS investments could fluctuate materially from period to period depending on future market conditions.
Our ARS investments include $13.9 million fair value maturing from fiscal 2016 to fiscal 2018, $3.2 million maturing from fiscal 2044 to fiscal 2046, and $2.7 million with no maturity. Of our ARS investments, $5.5 million par value are investment grade and the remaining $18.5 million par value are below investment grade.
Based on our ability to access our cash and cash equivalents, our expected operating cash flows, and our other sources of cash, we do not anticipate the lack of liquidity on these investments to affect our ability to operate our business as usual.
There have been no significant changes in the maturity dates and average interest rates for our cash equivalents and debt obligations subsequent to fiscal 2014.
45
Table of Contents
Foreign currency exchange risk
All of our revenue and approximately 92% of our consolidated costs are denominated in U.S. dollars. As a result, we have relatively little exposure to foreign currency exchange risks and foreign exchange losses have been immaterial to date. We do not currently enter into forward-exchange contracts to hedge exposure denominated in foreign currencies or any other derivative financial instruments for trading or speculative purposes. In the future, if our operations change and we determine that our foreign exchange exposure has increased, we may consider entering into hedging transactions to mitigate such risk.
| ITEM 8. | FINANCIAL STATEMENTS AND SUPPLEMENTARY DATA |
Reference is made to the financial statements, the report of our independent registered public accounting firm, and the notes thereto commencing at page F-1 of this report, which financial statements, report, and notes are incorporated herein by reference. Reference is also made to the quarterly results of operations on page 41 of this report, which are incorporated herein by reference.
| ITEM 9. | CHANGES IN AND DISAGREEMENTS WITH ACCOUNTANTS ON ACCOUNTING AND FINANCIAL DISCLOSURE |
Not applicable.
| ITEM 9A. | CONTROLS AND PROCEDURES |
Conclusions Regarding Disclosure Controls and Procedures
Under the supervision and with the participation of our management, including our Chief Executive Officer and Chief Financial Officer, we conducted an evaluation of the effectiveness of the design and operation of our disclosure controls and procedures (as defined in Rules 13a-15(e) and 15d-15(e) under the Exchange Act). Based on this evaluation, our Chief Executive Officer and Chief Financial Officer, as of June 28, 2014, concluded that our disclosure controls and procedures (as defined in Rules 13a-15(e) and 15d-15(e) under the Exchange Act) are effective to ensure that information required to be disclosed by us in the reports we file or submit under the Exchange Act is recorded, processed, summarized, and reported within the time periods specified in the SEC rules and forms and that such information is accumulated and communicated to our management, including our Chief Executive Officer and Chief Financial Officer, as appropriate to allow timely decisions regarding required disclosure.
Management’s Report on Internal Control Over Financial Reporting
We are responsible for establishing and maintaining adequate internal control over financial reporting (as defined in Rules 13a-15(f) and 15d-15(f) under the Exchange Act). Under the supervision and with the participation of our management, including our Chief Executive Officer and Chief Financial Officer, we conducted an evaluation of the effectiveness of our internal control over financial reporting based on the framework in the Internal Control—Integrated Framework issued by the Committee of Sponsoring Organizations of the Treadway Commission which was issued in 1992. Based on our evaluation under the framework in Internal Control—Integrated Framework, our management concluded that our internal control over financial reporting was effective as of June 28, 2014. The effectiveness of our internal control over financial reporting as of June 28, 2014 has been audited by KPMG LLP, an independent registered public accounting firm, as stated in its report included herein on page F-2.
Changes in Internal Control Over Financial Reporting
There was no change in our internal control over financial reporting during our most recent fiscal quarter that has materially affected, or is reasonably likely to materially affect, our internal control over financial reporting.
46
Table of Contents
Inherent Limitations on Effectiveness of Controls
Our management, including our Chief Executive Officer and Chief Financial Officer, does not expect that our disclosure controls and procedures or our internal controls over financial reporting will prevent all error and all fraud. A control system, no matter how well conceived and operated, can provide only reasonable, not absolute, assurance that the objectives of the control system are met. Further, the design of a control system must reflect the fact that there are resource constraints, and the benefits of controls must be considered relative to their costs. Because of the inherent limitations in all control systems, no evaluation of controls can provide absolute assurance that all control issues, misstatements, errors, and instances of fraud, if any, within our company have been or will be prevented or detected. Further, internal controls may become inadequate as a result of changes in conditions, or through the deterioration of the degree of compliance with policies or procedures.
| ITEM 9B. | OTHER INFORMATION |
There were no items requiring reporting on Form 8-K that were not reported on Form 8-K during the fourth quarter of the year covered by this Form 10-K.
47
Table of Contents
| ITEM 10. | DIRECTORS, EXECUTIVE OFFICERS AND CORPORATE GOVERNANCE |
The information required by this Item relating to directors of our company and corporate governance is incorporated herein by reference to the definitive Proxy Statement to be filed pursuant to Regulation 14A of the Exchange Act for our 2014 Annual Meeting of Stockholders. The information required by this Item relating to our executive officers is included in Item 1. Business – Executive Officers of the Registrant.
We have adopted a code of ethics that applies to our principal executive officer, principal financial officer, and other senior accounting personnel. The “Code of Ethics for the CEO and Senior Financial Officers” is located on our website at www.synaptics.com in the Investor Relations section under Corporate Governance.
We intend to satisfy the disclosure requirement under Item 5.05(c) of Form 8-K regarding any amendment to, or waiver from, a provision of this code of ethics by posting such information on our website, at the address and location specified above.
| ITEM 11. | EXECUTIVE COMPENSATION |
The information required by this Item is incorporated herein by reference to the definitive Proxy Statement (particularly under the caption “Executive Compensation”) to be filed pursuant to Regulation 14A of the Exchange Act for our 2014 Annual Meeting of Stockholders.
| ITEM 12. | SECURITY OWNERSHIP OF CERTAIN BENEFICIAL OWNERS AND MANAGEMENT AND RELATED STOCKHOLDER MATTERS |
The information required by this Item is incorporated herein by reference to the definitive Proxy Statement (particularly under the caption “Security Ownership of Principal Stockholders, Directors, and Officers”) to be filed pursuant to Regulation 14A of the Exchange Act for our 2014 Annual Meeting of Stockholders.
| ITEM 13. | CERTAIN RELATIONSHIPS AND RELATED TRANSACTIONS, AND DIRECTOR INDEPENDENCE |
The information required by this Item is incorporated herein by reference to the definitive Proxy Statement (particularly under the caption “Certain Relationships and Related Transactions”) to be filed pursuant to Regulation 14A of the Exchange Act for our 2014 Annual Meeting of Stockholders.
| ITEM 14. | PRINCIPAL ACCOUNTANT FEES AND SERVICES |
The information required by this Item is incorporated herein by reference to the definitive Proxy Statement (particularly under the caption “Ratification of Appointment of Independent Auditor”) to be filed pursuant to Regulation 14A of the Exchange Act for our 2014 Annual Meeting of Stockholders.
48
Table of Contents
| ITEM 15. | EXHIBITS AND FINANCIAL STATEMENT SCHEDULES |
(a) Financial Statements and Financial Statement Schedules
(1) Financial Statements are listed in the Index to Financial Statements on page F-1 of this report.
(b) Exhibits
| Exhibit |
Exhibit | |
| 2.1 | Agreement and Plan of Reorganization, dated as of October 9, 2013, by and among Synaptics Incorporated, Itsme Acquisition Corp., Itsme Acquisition II LLC, Validity Sensors, Inc., and Shareholder Representative Services LLC (1) | |
| 2.2†# | Stock Purchase Agreement, dated June 11, 2014, by and among Renesas Electronics Corporation, Renesas SP Drivers, Inc., Renesas SP Drivers Taiwan, Inc., Sharp Corporation, Powerchip Technology Corp., Global Powertec Co. Ltd., Quantum Vision Corporation, the registrant and Synaptics Holding GmbH | |
| 3.1 | Certificate of Incorporation (2) | |
| 3.1(b) | Certificate of Designation of Series A Junior Participating Preferred Stock (3) | |
| 3.2 | Third Amended and Restated Bylaws (amended and restated as of July 27, 2010) (4) | |
| 3.3 | Certificate of Amendment of Certificate of Incorporation of the registrant (5) | |
| 3.4 | Certificate of Amendment of Certificate of Incorporation of the registrant (6) | |
| 4 | Form of Common Stock Certificate (7) | |
| 4(b) | Rights Agreement, dated as of August 15, 2002, between the registrant and American Stock Transfer & Trust Company, as Rights Agent (3) | |
| 4(c) | Amendment No. 1 to Rights Agreement (8) | |
| 4.6 | Form of Indenture (9) | |
| 10.6(d)* | Amended and Restated 2001 Incentive Compensation Plan (as amended through January 23, 2007) (10) | |
| 10.6(b)* | Form of grant agreements for Amended and Restated 2001 Incentive Compensation Plan (11) | |
| 10.6(c)* | Form of deferred stock award agreement for Amended and Restated 2001 Incentive Compensation Plan (12) | |
| 10.17* | Form of Indemnification Agreement entered into with the following directors and executive officers as of January 28, 2002 with Francis F. Lee, Russell J. Knittel, Keith B. Geeslin, and Richard L. Sanquini; as of June 26, 2004 with Jeffrey D. Buchanan; as of March 28, 2006 with Hing Chung (Alex) Wong; as of February 20, 2007 with Nelson C. Chan; as of October 23, 2007 with James L. Whims; as of March 2, 2009 with Kathleen A. Bayless; as of January 10, 2011 with Kevin D. Barber; as of September 28, 2011 with Richard A. Bergman; as of May 22, 2012 with Bret Sewell; as of January 28, 2013 with Scott Deutsch; as of November 4, 2013 with John McFarland, and as of June 9, 2014 with Ritu Favre (2) | |
| 10.24(a)* | 2010 Incentive Compensation Plan (13) | |
| 10.24(b)* | Form of Non-Qualified Stock Option Agreement for 2010 Incentive Compensation Plan (14) | |
| 10.24(c)* | Form of Incentive Stock Option Agreement for 2010 Incentive Compensation Plan (14) | |
| 10.24(d)* | Form of Deferred Stock Award Agreement for 2010 Incentive Compensation Plan (14) | |
| 10.24(e)* | Amended and Restated 2010 Incentive Compensation Plan (15) | |
| 10.24(f)* | Form of Deferred Stock Award Agreement for Market Stock Units for Amended and Restated 2010 Incentive Compensation Plan (16) | |
| 10.25(a)* | Amended and Restated 2010 Employee Stock Purchase Plan | |
| 10.27* | Employment Offer Letter dated September 28, 2011 between the registrant and Richard Bergman (17) | |
| 10.28* | Change of Control Severance Policy For Executive Officers | |
| 10.29* | Severance Policy for Principal Executive Officers (18) | |
| 10.30 | Agreement of Purchase and Sale and Escrow Instructions dated as of June 25, 2012 between McKay Henry, LLC and the registrant (19) | |
| 10.30(a) | First Amendment to Agreement of Purchase and Sale and Escrow Instructions dated as of July 2, 2012 between McKay Henry, LLC and the registrant (19) | |
49
Table of Contents
| 10.33 | Agreement of Purchase and Sale and Escrow Instructions dated as of October 19, 2012 between Orchard Partners, LLC and the registrant (16) | |
| 10.33(a) | First Amendment to Agreement of Purchase and Sale and Escrow Instructions dated as of November 19, 2012 between Orchard Partners, LLC and the registrant (16) | |
| 10.33(b) | Second Amendment to Agreement of Purchase and Sale and Escrow Instructions dated as of January 4, 2013 between Orchard Partners, LLC and the registrant (20) | |
| 10.34 | Commitment Letter, dated June 11, 2014, by and among Wells Fargo Bank, National Association, Wells Fargo Securities, LLC and the registrant | |
| 21 | List of Subsidiaries | |
| 23.1 | Consent of Independent Registered Public Accounting Firm | |
| 31.1 | Certification of Chief Executive Officer pursuant to Rule 13a-14(a)/15d-14(a) | |
| 31.2 | Certification of Chief Financial Officer pursuant to Rule 13a-14(a)/15d-14(a) | |
| 32.1 | Section 1350 Certification of Chief Executive Officer | |
| 32.2 | Section 1350 Certification of Chief Financial Officer | |
| 101.INS | XBRL Instance Document | |
| 101.SCH | XBRL Taxonomy Extension Schema Document | |
| 101.CAL | XBRL Taxonomy Extension Calculation Linkbase Document | |
| 101.DEF | XBRL Taxonomy Extension Definition Linkbase Document | |
| 101.LAB | XBRL Taxonomy Extension Label Linkbase Document | |
| 101.PRE | XBRL Taxonomy Extension Presentation Linkbase Document | |
| (1) | Incorporated by reference to the registrant’s Form 8-K as filed with the SEC on November 12, 2013. |
| (2) | Incorporated by reference to the registrant’s Form 10-Q as filed with the SEC on February 21, 2002. |
| (3) | Incorporated by reference to the registrant’s Form 8-A as filed with the SEC on August 16, 2002. |
| (4) | Incorporated by reference to the registrant’s Current Report on Form 8-K as filed with the SEC on August 2, 2010. |
| (5) | Incorporated by reference to the registrant’s Current Report on Form 8-K as filed with the SEC on December 7, 2004. |
| (6) | Incorporation by reference to the registrant’s Current Report on Form 8-K as filed with the SEC on October 22, 2010. |
| (7) | Incorporated by reference to the registrant’s Form 10-K as filed with the SEC on September 12, 2002. |
| (8) | Incorporated by reference to the registrant’s Current Report on Form 8-K as filed with the SEC on April 24, 2008. |
| (9) | Incorporated by reference to the registrant’s registration statement on Form S-3 (Registration No. 333-155582) as filed with the SEC on November 21, 2008 and declared effective May 7, 2009. |
| (10) | Incorporated by reference to the registrant’s Form 10-Q as filed with the SEC on November 8, 2007. |
| (11) | Incorporated by reference to the registrant’s Form 10-Q as filed with the SEC on February 6, 2003. |
| (12) | Incorporated by reference to the registrant’s Form 10-K as filed with the SEC on September 7, 2006. |
| (13) | Incorporated by reference to the registrant’s Form 10-Q as filed with the SEC on November 2, 2010. |
| (14) | Incorporated by reference to the registrant’s Current Report on Form 8-K as filed with the SEC on October 22, 2010. |
| (15) | Incorporated by reference to the registrant’s Form 10-Q as filed with the SEC on May 4, 2012. |
| (16) | Incorporated by reference to the registrant’s Form 10-Q as filed with the SEC on February 1, 2013. |
| (17) | Incorporated by reference to the registrant’s Current Report on Form 8-K as filed with the SEC on October 4, 2011. |
| (18) | Incorporated by reference to the registrant’s Current Report on Form 8-K as filed with the SEC on October 6, 2011. |
| (19) | Incorporated by reference to the registrant’s Form 10-K as filed with the SEC on August 27, 2012. |
| (20) | Incorporated by reference to the registrant’s Form 10-Q as filed with the SEC on May 3, 2013. |
| * | Indicates a contract with management or compensatory plan or arrangement. |
| † | Portions of this exhibit are subject to a request for confidential treatment and have been redacted and filed separately with the Securities and Exchange Commission. |
| # | Certain schedules have been omitted pursuant to Item 601(b)(2) of Regulation S-K. A copy of any omitted schedule will be furnished supplementally to the Securities and Exchange Commission upon request. |
50
Table of Contents
Pursuant to the requirements of Section 13 or 15(d) of the Securities Exchange Act of 1934, the registrant has duly caused this report to be signed on its behalf by the undersigned, thereunto duly authorized.
| SYNAPTICS INCORPORATED | ||||
| Date August 22, 2014 | By: | /s/ Richard A. Bergman | ||
| Richard A. Bergman | ||||
| President and Chief Executive Officer | ||||
Pursuant to the requirements of the Securities Exchange Act of 1934, this report has been signed below by the following persons on behalf of the registrant and in the capacities and on the dates indicated.
| Signature |
Title |
Date | ||
| /s/ Richard A. Bergman |
President and Chief Executive Officer, | |||
| Richard A. Bergman | and Director | August 22, 2014 | ||
| /s/ Kathleen A. Bayless |
Senior Vice President, Chief Financial Officer, | August 22, 2014 | ||
| Kathleen A. Bayless | and Treasurer (Principal | |||
| Financial and Accounting Officer) | ||||
| /s/ Francis F. Lee |
Chairman of the Board | August 22, 2014 | ||
| Francis F. Lee | ||||
| /s/ Jeffrey D. Buchanan |
Director | August 22, 2014 | ||
| Jeffrey D. Buchanan | ||||
| /s/ Nelson C. Chan |
Director | August 22, 2014 | ||
| Nelson C. Chan | ||||
| /s/ Keith B. Geeslin |
Director | August 22, 2014 | ||
| Keith B. Geeslin | ||||
| /s/ Russell J. Knittel |
Director | August 22, 2014 | ||
| Russell J. Knittel | ||||
| /s/ Richard L. Sanquini |
Director | August 22, 2014 | ||
| Richard L. Sanquini | ||||
| /s/ James L. Whims |
Director | August 22, 2014 | ||
| James L. Whims | ||||
51
Table of Contents
SYNAPTICS INCORPORATED AND SUBSIDIARIES
| F-2 | ||||
| F-3 | ||||
| F-4 | ||||
| F-5 | ||||
| F-6 | ||||
| F-7 | ||||
| F-8 | ||||
F-1
Table of Contents
Report of Independent Registered Public Accounting Firm
The Board of Directors and Stockholders
Synaptics Incorporated:
We have audited the accompanying consolidated balance sheets of Synaptics Incorporated and subsidiaries (the Company) as of June 28, 2014 and June 29, 2013, and the related consolidated statements of income, comprehensive income, stockholders’ equity, and cash flows for each of the years in the three-year period ended June 28, 2014. We also have audited the Company’s internal control over financial reporting as of June 28, 2014, based on criteria established in Internal Control – Integrated Framework issued by the Committee of Sponsoring Organizations of the Treadway Commission (COSO) issued in 1992. The Company’s management is responsible for these consolidated financial statements, for maintaining effective internal control over financial reporting, and for its assessment of the effectiveness of internal control over financial reporting, included in the accompanying Management’s Report on Internal Control Over Financial Reporting appearing under Item 9A. Our responsibility is to express an opinion on these consolidated financial statements and an opinion on the Company’s internal control over financial reporting based on our audits.
We conducted our audits in accordance with the standards of the Public Company Accounting Oversight Board (United States). Those standards require that we plan and perform the audits to obtain reasonable assurance about whether the financial statements are free of material misstatement and whether effective internal control over financial reporting was maintained in all material respects. Our audits of the consolidated financial statements included examining, on a test basis, evidence supporting the amounts and disclosures in the financial statements, assessing the accounting principles used and significant estimates made by management, and evaluating the overall financial statement presentation. Our audit of internal control over financial reporting included obtaining an understanding of internal control over financial reporting, assessing the risk that a material weakness exists, and testing and evaluating the design and operating effectiveness of internal control based on the assessed risk. Our audits also included performing such other procedures as we considered necessary in the circumstances. We believe that our audits provide a reasonable basis for our opinions.
A company’s internal control over financial reporting is a process designed to provide reasonable assurance regarding the reliability of financial reporting and the preparation of financial statements for external purposes in accordance with generally accepted accounting principles. A company’s internal control over financial reporting includes those policies and procedures that (1) pertain to the maintenance of records that, in reasonable detail, accurately and fairly reflect the transactions and dispositions of the assets of the company; (2) provide reasonable assurance that transactions are recorded as necessary to permit preparation of financial statements in accordance with generally accepted accounting principles, and that receipts and expenditures of the company are being made only in accordance with authorizations of management and directors of the company; and (3) provide reasonable assurance regarding prevention or timely detection of unauthorized acquisition, use, or disposition of the company’s assets that could have a material effect on the financial statements.
Because of its inherent limitations, internal control over financial reporting may not prevent or detect misstatements. Also, projections of any evaluation of effectiveness to future periods are subject to the risk that controls may become inadequate because of changes in conditions, or that the degree of compliance with the policies or procedures may deteriorate.
In our opinion, the consolidated financial statements referred to above present fairly, in all material respects, the financial position of Synaptics Incorporated and subsidiaries as of June 28, 2014 and June 29, 2013, and the results of their operations and their cash flows for each of the years in the three-year period ended June 28, 2014, in conformity with U.S. generally accepted accounting principles. Also in our opinion, the Company maintained, in all material respects, effective internal control over financial reporting as of June 28, 2014, based on criteria established in Internal Control – Integrated Framework issued by the COSO.
/s/ KPMG LLP
Santa Clara, California
August 22, 2014
F-2
Table of Contents
SYNAPTICS INCORPORATED AND SUBSIDIARIES
(in thousands, except par value and share amounts)
| June 2014 |
June 2013 |
|||||||
| ASSETS | ||||||||
| Current Assets: |
||||||||
| Cash and cash equivalents |
$ | 447,205 | $ | 355,303 | ||||
| Accounts receivable, net of allowances of $883 at June 2014 and 2013 |
195,057 | 148,454 | ||||||
| Inventories |
82,311 | 49,948 | ||||||
| Prepaid expenses and other current assets |
17,858 | 6,715 | ||||||
|
|
|
|
|
|||||
| Total current assets |
742,431 | 560,420 | ||||||
| Property and equipment, net |
80,849 | 58,035 | ||||||
| Goodwill |
61,030 | 20,695 | ||||||
| Acquired intangibles |
82,111 | 13,110 | ||||||
| Non-current investments |
19,785 | 16,969 | ||||||
| Other assets |
34,127 | 22,037 | ||||||
|
|
|
|
|
|||||
| $ | 1,020,333 | $ | 691,266 | |||||
|
|
|
|
|
|||||
| LIABILITIES AND STOCKHOLDERS’ EQUITY | ||||||||
| Current Liabilities: |
||||||||
| Accounts payable |
$ | 97,109 | $ | 83,710 | ||||
| Accrued compensation |
30,682 | 23,728 | ||||||
| Income taxes payable |
12,538 | 10,751 | ||||||
| Contingent consideration |
57,388 | 196 | ||||||
| Other accrued liabilities |
56,691 | 31,241 | ||||||
|
|
|
|
|
|||||
| Total current liabilities |
254,408 | 149,626 | ||||||
| Notes payable |
— | 2,305 | ||||||
| Other liabilities |
64,768 | 17,480 | ||||||
| Commitments and contingencies |
||||||||
| Stockholders’ Equity: |
||||||||
| Preferred stock: |
||||||||
| $0.001 par value; 10,000,000 shares authorized; no shares issued and outstanding |
— | — | ||||||
| Common stock: |
||||||||
| $0.001 par value; 120,000,000 shares authorized, 55,911,513 and 50,673,758 shares issued, and 36,863,802 and 33,289,826 shares outstanding, at June 2014 and 2013, respectively |
56 | 51 | ||||||
| Additional paid-in capital |
740,282 | 539,170 | ||||||
| Treasury stock: 19,047,711 and 17,383,932 common shares at June 2014 and 2013, respectively, at cost |
(530,422 | ) | (460,160 | ) | ||||
| Accumulated other comprehensive income |
8,560 | 6,802 | ||||||
| Retained earnings |
482,681 | 435,992 | ||||||
|
|
|
|
|
|||||
| Total stockholders’ equity |
701,157 | 521,855 | ||||||
|
|
|
|
|
|||||
| $ | 1,020,333 | $ | 691,266 | |||||
|
|
|
|
|
|||||
See accompanying notes to consolidated financial statements.
F-3
Table of Contents
SYNAPTICS INCORPORATED AND SUBSIDIARIES
CONSOLIDATED STATEMENTS OF INCOME
(in thousands, except per share amounts)
| Fiscal | ||||||||||||
| 2014 | 2013 | 2012 | ||||||||||
| Net revenue |
$ | 947,539 | $ | 663,588 | $ | 548,228 | ||||||
| Cost of revenue |
511,459 | 337,784 | 292,661 | |||||||||
|
|
|
|
|
|
|
|||||||
| Gross margin |
436,080 | 325,804 | 255,567 | |||||||||
|
|
|
|
|
|
|
|||||||
| Operating expenses: |
||||||||||||
| Research and development |
192,681 | 144,699 | 117,954 | |||||||||
| Selling, general, and administrative |
100,005 | 79,620 | 70,045 | |||||||||
| Acquired intangibles amortization |
1,047 | 1,025 | — | |||||||||
| Change in contingent consideration |
69,861 | 1,347 | — | |||||||||
| Gain on sale of property and equipment |
— | (1,578 | ) | — | ||||||||
|
|
|
|
|
|
|
|||||||
| Total operating expenses |
363,594 | 225,113 | 187,999 | |||||||||
|
|
|
|
|
|
|
|||||||
| Operating income |
72,486 | 100,691 | 67,568 | |||||||||
| Interest income, net |
1,973 | 1,042 | 905 | |||||||||
| Impairment recovery on investments, net |
— | — | 77 | |||||||||
|
|
|
|
|
|
|
|||||||
| Income before provision for income taxes |
74,459 | 101,733 | 68,550 | |||||||||
| Provision for income taxes |
27,770 | 2,800 | 14,406 | |||||||||
|
|
|
|
|
|
|
|||||||
| Net income |
$ | 46,689 | $ | 98,933 | $ | 54,144 | ||||||
|
|
|
|
|
|
|
|||||||
| Net income per share: |
||||||||||||
| Basic |
$ | 1.34 | $ | 3.03 | $ | 1.64 | ||||||
|
|
|
|
|
|
|
|||||||
| Diluted |
$ | 1.26 | $ | 2.89 | $ | 1.57 | ||||||
|
|
|
|
|
|
|
|||||||
| Shares used in computing net income per share: |
||||||||||||
| Basic |
34,761 | 32,658 | 33,030 | |||||||||
|
|
|
|
|
|
|
|||||||
| Diluted |
37,105 | 34,239 | 34,435 | |||||||||
|
|
|
|
|
|
|
|||||||
See accompanying notes to consolidated financial statements.
F-4
Table of Contents
SYNAPTICS INCORPORATED AND SUBSIDIARIES
CONSOLIDATED STATEMENTS OF COMPREHENSIVE INCOME
(in thousands)
| Fiscal | ||||||||||||
| 2014 | 2013 | 2012 | ||||||||||
| Net income |
$ | 46,689 | $ | 98,933 | $ | 54,144 | ||||||
| Other comprehensive income: |
||||||||||||
| Change in unrealized net gain/(loss) on investments |
2,816 | 4,998 | (522 | ) | ||||||||
| Reclassification from accumulated other comprehensive income to interest income for accretion of non-current investments |
(1,058 | ) | (194 | ) | — | |||||||
|
|
|
|
|
|
|
|||||||
| Net current-period other comprehensive income |
1,758 | 4,804 | (522 | ) | ||||||||
|
|
|
|
|
|
|
|||||||
| Comprehensive income |
$ | 48,447 | $ | 103,737 | $ | 53,622 | ||||||
|
|
|
|
|
|
|
|||||||
See accompanying notes to consolidated financial statements.
F-5
Table of Contents
SYNAPTICS INCORPORATED AND SUBSIDIARIES
CONSOLIDATED STATEMENTS OF STOCKHOLDERS’ EQUITY
(in thousands, except share amounts)
| Accumulated | ||||||||||||||||||||||||||||
| Additional | Other | Total | ||||||||||||||||||||||||||
| Common Stock | Paid-in | Treasury | Comprehensive | Retained | Stockholders’ | |||||||||||||||||||||||
| Shares | Amount | Capital | Stock | Income/(Loss) | Earnings | Equity | ||||||||||||||||||||||
| Balance at June 2011 |
46,832,208 | $ | 47 | $ | 406,653 | $ | (352,142 | ) | $ | 2,520 | $ | 282,915 | $ | 339,993 | ||||||||||||||
| Net income |
— | — | — | — | — | 54,144 | 54,144 | |||||||||||||||||||||
| Net unrealized loss on available-for-sale investments |
— | — | — | — | (522 | ) | — | (522 | ) | |||||||||||||||||||
| Issuance of common stock for share-based award compensation plans |
1,848,140 | 2 | 34,874 | — | — | — | 34,876 | |||||||||||||||||||||
| Payroll taxes for deferred stock units |
— | — | (3,946 | ) | — | — | — | (3,946 | ) | |||||||||||||||||||
| Purchases of treasury stock |
— | — | — | (61,743 | ) | — | — | (61,743 | ) | |||||||||||||||||||
| Tax shortfall associated with share-based awards |
— | — | (173 | ) | — | — | — | (173 | ) | |||||||||||||||||||
| Share-based compensation |
— | — | 34,161 | — | — | — | 34,161 | |||||||||||||||||||||
|
|
|
|
|
|
|
|
|
|
|
|
|
|
|
|||||||||||||||
| Balance at June 2012 |
48,680,348 | 49 | 471,569 | (413,885 | ) | 1,998 | 337,059 | 396,790 | ||||||||||||||||||||
| Net income |
— | — | — | — | — | 98,933 | 98,933 | |||||||||||||||||||||
| Net unrealized gain on available-for-sale investments |
— | — | — | — | 4,804 | — | 4,804 | |||||||||||||||||||||
| Issuance of common stock for share-based award compensation plans |
1,993,410 | 2 | 37,432 | — | — | — | 37,434 | |||||||||||||||||||||
| Payroll taxes for deferred stock units |
— | — | (4,692 | ) | — | — | — | (4,692 | ) | |||||||||||||||||||
| Purchases of treasury stock |
— | — | — | (46,275 | ) | — | — | (46,275 | ) | |||||||||||||||||||
| Tax benefit associated with share-based awards |
— | — | 2,651 | — | — | — | 2,651 | |||||||||||||||||||||
| Share-based compensation |
— | — | 32,210 | — | — | — | 32,210 | |||||||||||||||||||||
|
|
|
|
|
|
|
|
|
|
|
|
|
|
|
|||||||||||||||
| Balance at June 2013 |
50,673,758 | 51 | 539,170 | (460,160 | ) | 6,802 | 435,992 | 521,855 | ||||||||||||||||||||
| Net income |
— | — | — | — | — | 46,689 | 46,689 | |||||||||||||||||||||
| Net unrealized gain on available-for-sale investments |
— | — | — | — | 1,758 | — | 1,758 | |||||||||||||||||||||
| Issuance of common stock for share-based award compensation plans |
3,534,142 | 3 | 80,744 | — | — | — | 80,747 | |||||||||||||||||||||
| Issuance of common stock for acquisition |
1,671,904 | 2 | 75,764 | — | — | — | 75,766 | |||||||||||||||||||||
| Issuance of common stock for conversion of notes payable |
31,709 | — | — | — | — | — | — | |||||||||||||||||||||
| Payroll taxes for deferred stock units |
— | — | (8,859 | ) | — | — | — | (8,859 | ) | |||||||||||||||||||
| Purchases of treasury stock |
— | — | — | (70,262 | ) | — | — | (70,262 | ) | |||||||||||||||||||
| Tax benefit associated with share-based awards |
— | — | 20,602 | — | — | — | 20,602 | |||||||||||||||||||||
| Share-based compensation |
— | — | 32,861 | — | — | — | 32,861 | |||||||||||||||||||||
|
|
|
|
|
|
|
|
|
|
|
|
|
|
|
|||||||||||||||
| Balance at June 2014 |
55,911,513 | $ | 56 | $ | 740,282 | $ | (530,422 | ) | $ | 8,560 | $ | 482,681 | $ | 701,157 | ||||||||||||||
|
|
|
|
|
|
|
|
|
|
|
|
|
|
|
|||||||||||||||
See accompanying notes to consolidated financial statements.
F-6
Table of Contents
SYNAPTICS INCORPORATED AND SUBSIDIARIES
CONSOLIDATED STATEMENTS OF CASH FLOWS
(in thousands)
| Fiscal | ||||||||||||
| 2014 | 2013 | 2012 | ||||||||||
| Cash flows from operating activities |
||||||||||||
| Net income |
$ | 46,689 | $ | 98,933 | $ | 54,144 | ||||||
| Adjustments to reconcile net income to net cash provided by operating activities: |
||||||||||||
| Share-based compensation costs |
32,861 | 32,210 | 34,161 | |||||||||
| Depreciation and amortization |
14,237 | 9,821 | 10,409 | |||||||||
| Acquired intangibles amortization |
7,399 | 1,025 | — | |||||||||
| Gain on sale of property and equipment |
— | (1,578 | ) | — | ||||||||
| Accretion and remeasurement of contingent consideration liability |
69,861 | 1,347 | — | |||||||||
| Deferred taxes |
12,275 | (890 | ) | (741 | ) | |||||||
| Impairment of property and equipment |
— | 300 | 1,269 | |||||||||
| Non-cash interest income |
(1,058 | ) | (194 | ) | — | |||||||
| Impairment recovery on investments, net |
— | — | (77 | ) | ||||||||
| Changes in operating assets and liabilities, net of acquisitions: |
||||||||||||
| Accounts receivable, net |
(42,763 | ) | (44,314 | ) | (10,329 | ) | ||||||
| Inventories |
(30,209 | ) | (16,872 | ) | (2,817 | ) | ||||||
| Prepaid expenses and other current assets |
(5,764 | ) | (109 | ) | (530 | ) | ||||||
| Other assets |
(18,799 | ) | 921 | 1,894 | ||||||||
| Accounts payable |
13,208 | 23,264 | 10,235 | |||||||||
| Accrued compensation |
5,609 | 11,086 | (634 | ) | ||||||||
| Income taxes payable |
2,903 | (17,106 | ) | 674 | ||||||||
| Other accrued liabilities |
25,147 | 4,313 | 3,735 | |||||||||
|
|
|
|
|
|
|
|||||||
| Net cash provided by operating activities |
131,596 | 102,157 | 101,393 | |||||||||
|
|
|
|
|
|
|
|||||||
| Cash flows from investing activities |
||||||||||||
| Proceeds from sales of non-current investments |
— | 3,350 | 10,110 | |||||||||
| Proceeds from sale of property and equipment |
— | 12,626 | — | |||||||||
| Acquisition of business, net of cash acquired |
(19,620 | ) | (5,000 | ) | (14,632 | ) | ||||||
| Purchases of property and equipment |
(38,675 | ) | (48,519 | ) | (10,359 | ) | ||||||
|
|
|
|
|
|
|
|||||||
| Net cash used in investing activities |
(58,295 | ) | (37,543 | ) | (14,881 | ) | ||||||
|
|
|
|
|
|
|
|||||||
| Cash flows from financing activities |
||||||||||||
| Payment of contingent consideration |
— | (4,600 | ) | — | ||||||||
| Payment of notes payable |
(2,305 | ) | — | — | ||||||||
| Purchases of treasury stock |
(70,262 | ) | (46,275 | ) | (61,743 | ) | ||||||
| Proceeds from issuance of shares |
80,747 | 37,434 | 34,876 | |||||||||
| Excess tax benefit from share-based compensation |
19,280 | 3,817 | 2,153 | |||||||||
| Payroll taxes for deferred stock units |
(8,859 | ) | (4,692 | ) | (3,946 | ) | ||||||
|
|
|
|
|
|
|
|||||||
| Net cash provided by/(used in) financing activities |
18,601 | (14,316 | ) | (28,660 | ) | |||||||
|
|
|
|
|
|
|
|||||||
| Net increase in cash and cash equivalents |
91,902 | 50,298 | 57,852 | |||||||||
| Cash and cash equivalents at beginning of period |
355,303 | 305,005 | 247,153 | |||||||||
|
|
|
|
|
|
|
|||||||
| Cash and cash equivalents at end of period |
$ | 447,205 | $ | 355,303 | $ | 305,005 | ||||||
|
|
|
|
|
|
|
|||||||
| Supplemental disclosures of cash flow information |
||||||||||||
| Cash paid for taxes |
$ | 15,575 | $ | 18,716 | $ | 12,305 | ||||||
|
|
|
|
|
|
|
|||||||
| Non-cash investing and financing activities: |
||||||||||||
| Property and equipment received but unpaid |
$ | 3,277 | $ | 5,226 | $ | — | ||||||
|
|
|
|
|
|
|
|||||||
| Common stock issued pursuant to acquisition |
$ | 70,280 | $ | — | $ | — | ||||||
|
|
|
|
|
|
|
|||||||
| Contingent consideration liability pursuant to acquisition |
$ | 37,499 | $ | — | $ | — | ||||||
|
|
|
|
|
|
|
|||||||
| Common stock issued in settlement of contingent consideration liability |
$ | 5,486 | $ | — | $ | — | ||||||
|
|
|
|
|
|
|
|||||||
| Common stock issued upon conversion of notes payable |
$ | 1,761 | $ | — | $ | — | ||||||
|
|
|
|
|
|
|
|||||||
See accompanying notes to consolidated financial statements.
F-7
Table of Contents
SYNAPTICS INCORPORATED AND SUBSIDIARIES
NOTES TO CONSOLIDATED FINANCIAL STATEMENTS
1. Organization and Summary of Significant Accounting Policies
Organization and Basis of Presentation
We are a leading worldwide developer and supplier of custom-designed human interface solutions that enable people to interact more easily and intuitively with a wide variety of mobile computing, communications, entertainment, and other electronic devices. We currently target the markets for smartphones, tablets, personal computer, or PC, products, primarily notebook computers; and other select electronic devices, with our customized human interface solutions. Every solution we deliver either contains or consists of our touch- or fingerprint-based semiconductor solutions, which includes our capacitive sensing ASIC, customer-specific firmware, and software. Our original equipment manufacturer, or OEM, customers include many of the world’s largest OEMs for smartphones and most of the tier one PC OEMs.
The consolidated financial statements are presented in accordance with U.S. generally accepted accounting principles, or U.S. GAAP, and include our financial statements and those of our wholly owned subsidiaries. All significant intercompany balances and transactions have been eliminated upon consolidation.
Our fiscal year is the 52- or 53-week period ending on the last Saturday in June. The fiscal years presented in this report were 52-week periods ended June 28, 2014 and June 29, 2013 and a 53-week period ended June 30, 2012.
Use of Estimates
The preparation of consolidated financial statements in conformity with U.S. GAAP requires us to make estimates and judgments that affect the reported amounts of assets, liabilities, revenue, expenses, and related disclosure of contingent assets and liabilities. On an ongoing basis, we evaluate our estimates, including those related to revenue, allowance for doubtful accounts, cost of revenue, inventories, loss on purchase commitments, product warranty, share-based compensation costs, provision for income taxes, deferred income tax asset valuation allowances, uncertain tax positions, goodwill, intangible assets, investments, contingent consideration liability and loss contingencies. We base our estimates on historical experience, applicable laws and regulations, and various other assumptions that we believe to be reasonable under the circumstances, the results of which form the basis for making judgments about the carrying value of assets and liabilities that are not readily apparent from other sources. Actual results may differ from these estimates under different assumptions or conditions.
Cash Equivalents and Investments
Cash equivalents consist of highly liquid investments with original maturities of three months or less. Our non-current investments are reported at fair value, with unrealized gains and losses excluded from earnings and shown separately as a component of accumulated other comprehensive income within stockholders’ equity. We charge other-than-temporary declines in the fair value of a debt security to earnings if the decline is due to a credit loss or if we intend to or need to sell at a loss, resulting in the establishment of a new cost basis in the debt security. We charge other-than-temporary declines in the fair value of a debt security to other comprehensive income if the decline is due to a noncredit loss. We charge other-than-temporary declines in the fair value of an equity security to earnings. We include interest earned and accretion on securities in interest income. We determine realized gains and losses on the sale of securities using the specific identification method.
F-8
Table of Contents
Our cash equivalents and investments classified as available-for-sale securities as of the end of fiscal 2014 and 2013 were as follows (in thousands):
| 2014 | ||||||||||||||||
| Gross | Gross | |||||||||||||||
| Amortized | Unrealized | Unrealized | Fair | |||||||||||||
| Cost | Gains | Losses | Value | |||||||||||||
| Reported as cash equivalents: |
||||||||||||||||
| Money market funds |
$ | 439,675 | $ | — | $ | — | $ | 439,675 | ||||||||
| Reported as non-current investments: |
||||||||||||||||
| Auction rate securities |
11,225 | 8,709 | 149 | 19,785 | ||||||||||||
|
|
|
|
|
|
|
|
|
|||||||||
| Total available-for-sale securities |
$ | 450,900 | $ | 8,709 | $ | 149 | $ | 459,460 | ||||||||
|
|
|
|
|
|
|
|
|
|||||||||
| 2013 | ||||||||||||||||
| Gross | Gross | |||||||||||||||
| Amortized | Unrealized | Unrealized | Fair | |||||||||||||
| Cost | Gains | Losses | Value | |||||||||||||
| Reported as cash equivalents: |
||||||||||||||||
| Money market funds |
$ | 350,521 | $ | — | $ | — | $ | 350,521 | ||||||||
| Reported as non-current investments: |
||||||||||||||||
| Auction rate securities |
10,167 | 6,980 | 178 | 16,969 | ||||||||||||
|
|
|
|
|
|
|
|
|
|||||||||
| Total available-for-sale securities |
$ | 360,688 | $ | 6,980 | $ | 178 | $ | 367,490 | ||||||||
|
|
|
|
|
|
|
|
|
|||||||||
Fair Value
We measure certain financial assets and liabilities at fair value. When we measure fair value on either a recurring or nonrecurring basis, inputs used in valuation techniques are assigned a hierarchical level as follows:
| • | Level 1 inputs are observable inputs that reflect quoted prices for identical assets or liabilities in active markets. |
| • | Level 2 inputs reflect quoted prices for identical assets or liabilities in markets that are not active; quoted prices for similar assets or liabilities in active markets; inputs other than quoted prices that are observable for the assets or liabilities; or inputs that are derived principally from or corroborated by observable market data by correlation or other means. |
| • | Level 3 inputs are unobservable inputs reflecting our assumptions, which are incorporated into valuation techniques and models used to determine fair value. The assumptions are consistent with market participant assumptions that are reasonably available. |
F-9
Table of Contents
Financial assets and liabilities measured at fair value on a recurring basis, by level within the fair value hierarchy, as of the end of fiscal 2014 and 2013 were as follows (in thousands):
| 2014 | 2013 | |||||||||||||||
| Level 1 | Level 3 | Level 1 | Level 3 | |||||||||||||
| Assets: |
||||||||||||||||
| Money market funds |
$ | 439,675 | $ | — | $ | 350,521 | $ | — | ||||||||
| Auction rate securities |
— | 19,785 | — | 16,969 | ||||||||||||
|
|
|
|
|
|
|
|
|
|||||||||
| Total available-for-sale securities |
$ | 439,675 | $ | 19,785 | $ | 350,521 | $ | 16,969 | ||||||||
|
|
|
|
|
|
|
|
|
|||||||||
| Liabilities: |
||||||||||||||||
| Contingent consideration liabilities recorded for business combinations |
$ | — | $ | 110,122 | $ | — | $ | 8,247 | ||||||||
|
|
|
|
|
|
|
|
|
|||||||||
In connection with the acquisition of Validity Sensors, Inc., or Validity (see Note 5), we entered into a contingent consideration arrangement providing for up to $162.5 million of additional consideration to the former Validity stockholders and option holders based on sales of products utilizing Validity technology through March 2016.
In connection with the acquisition of Pacinian we entered into a contingent consideration arrangement, and subsequently paid $5.0 million of additional consideration to the former Pacinian stockholders upon customer acceptance of a ThinTouch product. As of the end of fiscal 2014, we may owe up to $10.0 million of additional consideration to the former Pacinian stockholders based on sales of products utilizing ThinTouch technology through June 2016.
We have classified the contingent consideration liabilities recorded for business acquisitions as a Level 3 liability, of which $52.7 million and $8.1 million is included in the non-current portion of other liabilities as of the end of fiscal 2014 and 2013, respectively, and $57.4 million and $196,000 has been included in current liabilities as of the end of fiscal 2014 and 2013, respectively.
Changes in fair value of our Level 3 financial assets for fiscal 2014 and 2013 were as follows (in thousands):
| 2014 | 2013 | |||||||
| Beginning balance |
$ | 16,969 | $ | 15,321 | ||||
| Net unrealized gain |
2,816 | 4,998 | ||||||
| Redemptions |
— | (3,350 | ) | |||||
|
|
|
|
|
|||||
| Ending balance |
$ | 19,785 | $ | 16,969 | ||||
|
|
|
|
|
|||||
Changes in fair value of contingent consideration measured using significant unobservable inputs (Level 3) for fiscal 2014 and 2013 were as follows (in thousands):
| 2014 | 2013 | |||||||
| Beginning balance |
$ | 8,247 | $ | 11,900 | ||||
| Contingent consideration liability incurred |
37,499 | — | ||||||
| Cash settlement of contingent consideration liability |
— | (5,000 | ) | |||||
| Issuance of common stock in settlement of liability |
(5,485 | ) | — | |||||
| Accretion and remeasurement |
69,861 | 1,347 | ||||||
|
|
|
|
|
|||||
| Ending balance |
$ | 110,122 | $ | 8,247 | ||||
|
|
|
|
|
|||||
There were no transfers in or out of our Level 1, 2, or 3 assets or liabilities during fiscal 2014 or 2013.
The fair values of our accounts receivable and accounts payable approximate their carrying values because of the short-term nature of those instruments. Intangible assets, property and equipment, and goodwill are measured at fair value on a non-recurring basis if impairment is indicated.
F-10
Table of Contents
Concentration of Credit Risk
Financial instruments that potentially subject us to concentrations of credit risk consist primarily of cash equivalents, investments, and accounts receivable. Our investment policy, which is predicated on capital preservation and liquidity, limits investments to U.S. government treasuries and agency issues, taxable securities, and municipal issued securities with a minimum rating of A1 (Moody’s) or P1 (Standard and Poor’s) or equivalent. Included within our investment portfolio are investments in ARS investments, which met our investment guidelines at the time of our investment. Our ARS investments are currently not liquid as a result of continued auction failures.
We sell our products to contract manufacturers that provide manufacturing services for OEMs and to some OEMs directly. We extend credit based on an evaluation of a customer’s financial condition, and we generally do not require collateral.
The following customers accounted for more than 10% of our accounts receivable balance as of the end of fiscal 2014 and 2013:
| 2014 | 2013 | |||||||
| Customer A |
27 | % | 27 | % | ||||
| Customer B |
12 | % | * | |||||
| * | Less than 10% |
Other Concentrations
Our products include certain components that are currently single sourced. We believe other vendors would be able to provide similar components; however, the qualification of such vendors may require start-up time. In order to mitigate any adverse impacts from a disruption of supply, we strive to maintain an adequate supply of critical single-sourced components.
Revenue Recognition
We recognize revenue from product sales when there is persuasive evidence that an arrangement exists, delivery has occurred and title has transferred, the price is fixed or determinable, and collection is reasonably assured, which is generally upon shipment of the product. We accrue for estimated sales returns, incentives and other allowances at the time we recognize revenue. Our products contain embedded firmware and software that allows for further differentiation and customer integration, which together with, or consisting of, our ASIC chip delivers the essential functionality of our products and, as such, software revenue recognition guidance is not applicable.
Advertising Costs
Advertising costs, if any, are expensed when incurred.
Allowance for Doubtful Accounts
We maintain allowances for doubtful accounts for estimated losses resulting from the inability of customers to meet their financial obligations. On an ongoing basis, we evaluate the collectability of accounts receivable based on a combination of factors. In circumstances in which we are aware of a specific customer’s potential inability to meet its financial obligation, we record a specific reserve of the bad debt against amounts due. In addition, we make judgments and estimates on the collectability of accounts receivable based on our historical bad debt experience, customers’ creditworthiness, current economic trends, recent changes in customers’ payment trends, and deterioration in customers’ operating results or financial position. If circumstances change adversely, additional bad debt allowances may be required. For all periods presented, credit losses on our accounts receivable have been insignificant, and we believe that an adequate allowance for doubtful accounts has been provided.
F-11
Table of Contents
Cost of Revenue
Our cost of revenue includes the cost of products shipped to our customers, which primarily includes the cost of products built to our specifications by our contract manufacturers, the cost of silicon wafers supplied by independent semiconductor wafer manufacturers, and the related assembly, package, and test costs of our die and packaged ASICs. Also included in our cost of revenue are personnel and related costs, including share-based compensation, for quality assurance and manufacturing support; logistics costs; depreciation of equipment supporting manufacturing; license amortization; inventory write-downs and losses on purchase obligations; and warranty costs.
Inventories
Inventories are stated at the lower of cost (first-in, first-out method) or market (estimated net realizable value) as of the end of fiscal 2014 and 2013 and consisted of the following (in thousands):
| 2014 | 2013 | |||||||
| Raw materials |
$ | 58,717 | $ | 38,181 | ||||
| Finished goods |
23,594 | 11,767 | ||||||
|
|
|
|
|
|||||
| $ | 82,311 | $ | 49,948 | |||||
|
|
|
|
|
|||||
Periodically, we purchase inventory from our contract manufacturers when a customer delays its delivery schedule or cancels its order. In those circumstances in which our customer has cancelled its order and we purchase inventory from our contract manufacturers, we record a write-down, if necessary, to reduce the carrying value of the inventory purchased to its net realizable value. The effect of these write-downs is to establish a new cost basis in the related inventory, which we do not subsequently write up. We also record a liability and charge to cost of revenue for estimated losses on inventory we are obligated to purchase from our contract manufacturers when such losses become probable from customer delays or order cancellations.
Property and Equipment
We state property and equipment at cost less accumulated depreciation and amortization. We compute depreciation using the straight-line method over the estimated useful lives of the assets. We amortize leasehold improvements over the shorter of the lease term or the useful life of the asset.
Foreign Currency
The U.S. dollar is our functional and reporting currency. We remeasure our monetary assets and liabilities not denominated in the functional currency into U.S. dollar equivalents at the rate of exchange in effect on the balance sheet date. We measure and record non-monetary balance sheet accounts at the historical rate in effect at the date of transaction. All of our revenue and approximately 92% of our consolidated costs are denominated in U.S. dollars. We remeasure foreign currency expenses at the weighted average exchange rate in the month that the transaction occurred. Remeasurement of monetary assets and liabilities that are not denominated in the functional currency are included currently in operating results. Foreign currency losses included in operating results for fiscal 2014, 2013, and 2012 were not material. To date, we have not undertaken hedging transactions related to foreign currency exposure.
F-12
Table of Contents
Goodwill
Goodwill represents the excess of the purchase price over the fair value of net tangible and identifiable intangible assets acquired. Changes in our goodwill balance for fiscal 2014 and 2013 were as follows (in thousands):
| 2014 | 2013 | |||||||
| Beginning balance |
$ | 20,695 | $ | 18,995 | ||||
| Acquisition activity |
38,975 | 1,700 | ||||||
| Post acquisition adjustments |
1,360 | — | ||||||
|
|
|
|
|
|||||
| Ending balance |
$ | 61,030 | $ | 20,695 | ||||
|
|
|
|
|
|||||
Goodwill is measured and tested for impairment annually during the last quarter of our fiscal year, or more frequently if we believe indicators of impairment exist. Events that could trigger a more frequent impairment review may include adverse industry or economic trends, restructuring actions, lower projections of profitability, or a sustained decline in our market capitalization. The impairment test involves a two-step process where the first step requires comparing the fair value of our one reporting unit to its net book value, including goodwill. We have allocated our goodwill to a single company-wide reporting unit. Determining the fair value of a reporting unit is judgmental in nature and involves the use of significant estimates and assumptions. These estimates and assumptions include revenue growth rates and forecasted operating margins used to calculate projected future cash flows, risk-adjusted discount rates, future economic and market conditions and determination of appropriate market comparables. We base our fair value estimates on assumptions we believe to be reasonable. Actual future results may differ from those estimates. Future competitive, market and economic conditions could negatively impact key assumptions including our market capitalization or the carrying value of our net assets which could require us to realize an impairment of our goodwill and intangible assets.
A potential impairment exists if the fair value of the reporting unit is less than its net book value. The second step of the process is only performed if a potential impairment exists, and it involves determining the difference between the fair value of the reporting unit’s net assets other than goodwill to the fair value of the reporting unit and if the difference is less than the net book value of goodwill, an impairment exists and is recorded. No goodwill impairment was recognized for fiscal 2014, 2013, and 2012.
Impairment of Long-Lived Assets
We evaluate long-lived assets, such as property and equipment and intangible assets subject to amortization, for impairment whenever events or changes in circumstances indicate that the carrying value of an asset may not be recoverable. We measure recoverability of assets to be held and used by a comparison of the carrying amount of an asset to estimated undiscounted future cash flows expected to be generated by the asset. We review the carrying value of indefinite-lived intangible assets for impairment at least annually during the last quarter of our fiscal year, or more frequently if we believe indicators of impairment exist. If the carrying amount of the asset exceeds its estimated undiscounted future cash flows, we recognize an impairment charge in an amount by which the carrying amount of the asset exceeds the fair value of the asset. Assets to be disposed of would be separately presented in the consolidated balance sheets and reported at the lower of the carrying amount or fair value less costs to sell, and would no longer be depreciated. The assets and liabilities of a disposed group classified as held for sale would be presented separately in the appropriate asset and liability sections of the consolidated balance sheets. There were no events during the fiscal year that triggered an impairment of our long-lived assets.
F-13
Table of Contents
Other Accrued Liabilities
As of the end of fiscal 2014 and 2013, other accrued liabilities consisted of the following (in thousands):
| 2014 | 2013 | |||||||
| Customer obligations |
$ | 38,758 | $ | 16,291 | ||||
| Inventory obligations |
4,096 | 6,333 | ||||||
| Warranty |
1,659 | 1,696 | ||||||
| Other |
12,178 | 6,921 | ||||||
|
|
|
|
|
|||||
| $ | 56,691 | $ | 31,241 | |||||
|
|
|
|
|
|||||
Segment Information
We operate in one segment: the development, marketing, and sale of intuitive human interface solutions for electronic devices and products. The chief operating decision maker is the chief executive officer who evaluates financial performance and allocates resources on a company-wide basis.
Share-Based Compensation
We utilize the Black-Scholes option pricing model to estimate the grant date fair value of stock options granted to employees, which requires the input of highly subjective assumptions, including expected volatility and expected life. Historical and implied volatilities were used in estimating the fair value of our stock option awards. The expected life for our options was previously estimated based on historical trends since our initial public offering. In fiscal 2011, we began to grant options with a contractual life of seven years rather than 10 years and we began using the simplified method of establishing the expected life as we did not have any history of options with seven-year lives. In fiscal 2013, we began to grant options that vest over a three-year period rather than a four-year period and we continued to use the simplified method of establishing the expected life as we do not have any history of options which vest over a three year period. Changes in these inputs and assumptions can materially affect the measure of estimated fair value of our share-based compensation. Further, we estimate forfeitures for share-based awards that are not expected to vest. We charge estimated fair value less estimated forfeitures to earnings on a straight-line basis over the vesting period of the entire underlying award, which is generally three to four years for our stock option and deferred stock unit, or DSU, awards, three years for our market stock unit, or MSU, awards, and up to two years for our employee stock purchase plan.
Product Warranties
We generally warrant our products for a period of 12 months from the date of sale and estimate probable product warranty costs at the time we recognize revenue. Factors that affect our warranty liability include historical and anticipated rates of warranty claims, materials usage, rework, and delivery costs. We assess the adequacy of our warranty obligations periodically and adjust the accrued warranty liability on the basis of our estimates.
Changes in our warranty liability (included in other accrued liabilities) for fiscal 2014 and 2013 were as follows (in thousands):
| 2014 | 2013 | |||||||
| Beginning accrued warranty |
$ | 1,696 | $ | 2,175 | ||||
| Provision for product warranties |
2,419 | 875 | ||||||
| Cost of warranty claims and settlements |
(2,456 | ) | (1,354 | ) | ||||
|
|
|
|
|
|||||
| Ending accrued warranty |
$ | 1,659 | $ | 1,696 | ||||
|
|
|
|
|
|||||
F-14
Table of Contents
Income Taxes
We account for income taxes under the asset and liability method. We recognize deferred tax assets and liabilities for the future tax consequences attributable to differences between the financial statement carrying amounts of existing assets and liabilities and their respective tax bases and operating loss and tax credit carryforwards. We measure deferred tax assets and liabilities using enacted tax rates expected to apply to taxable income in the years in which those temporary differences are expected to be recovered or settled. We recognize the effect of a change in tax rates in income on deferred tax assets and liabilities in the period that includes the enactment date. We establish valuation allowances when necessary to reduce deferred tax assets to the amounts that are more likely than not to be realized. We consider the operating earnings of our foreign subsidiaries to be indefinitely invested outside the United States. Accordingly, no provision has been made for the U.S. federal, state, or foreign taxes that may result from future remittances of undistributed earnings of our foreign subsidiaries.
We use a two-step approach to recognizing and measuring uncertain tax positions. The first step is to determine whether it is more-likely-than-not that a tax position will be sustained upon examination, including resolution of any related appeals or litigation processes. The second step is to measure the tax benefit as the largest amount that is more than 50% likely of being realized upon ultimate settlement with a taxing authority. The calculation of tax liabilities involves significant judgment in estimating the impact of uncertainties in the application of highly complex tax laws. Resolution of these uncertainties in a manner inconsistent with our expectations could have a material impact on our consolidated financial position, results of operations, and cash flows. We believe we have adequately provided for reasonably foreseeable outcomes in connection with the resolution of income tax uncertainties. However, our results have in the past, and could in the future, include favorable and unfavorable adjustments to our estimated tax liabilities in the period a determination of such estimated tax liability is made or resolved, upon the filing of an amended return, upon a change in facts, circumstances, or interpretation, or upon the expiration of a statute of limitation. Accordingly, our effective tax rate could fluctuate materially from period to period.
Research and Development
Research and development costs are expensed as incurred.
2. Net Income Per Share
The computation of basic and diluted net income per share for fiscal 2014, 2013, and 2012 was as follows (in thousands, except per share amounts):
| 2014 | 2013 | 2012 | ||||||||||
| Numerator: |
||||||||||||
| Net income |
$ | 46,689 | $ | 98,933 | $ | 54,144 | ||||||
|
|
|
|
|
|
|
|||||||
| Denominator: |
||||||||||||
| Shares, basic |
34,761 | 32,658 | 33,030 | |||||||||
| Effect of dilutive share-based awards |
2,344 | 1,581 | 1,405 | |||||||||
|
|
|
|
|
|
|
|||||||
| Shares, diluted |
37,105 | 34,239 | 34,435 | |||||||||
|
|
|
|
|
|
|
|||||||
| Net income per share: |
||||||||||||
| Basic |
$ | 1.34 | $ | 3.03 | $ | 1.64 | ||||||
|
|
|
|
|
|
|
|||||||
| Diluted |
$ | 1.26 | $ | 2.89 | $ | 1.57 | ||||||
|
|
|
|
|
|
|
|||||||
Diluted net income per share does not include the effect of potential common shares related to certain share-based awards for fiscal 2014, 2013, and 2012 as follows (in thousands):
| 2014 | 2013 | 2012 | ||||||||||
| Share-based awards |
236 | 1,742 | 3,841 | |||||||||
|
|
|
|
|
|
|
|||||||
These share-based awards were not included in the computation of diluted net income per share because the proceeds received, if any, from such share-based awards combined with the average unamortized compensation costs adjusted for the hypothetical tax benefit or deficiency creditable or chargeable, respectively, to additional paid-in capital, were greater than the average market price of our common stock, and therefore, their effect would have been antidilutive.
F-15
Table of Contents
Our basic net income per share amounts for each period presented have been computed using the weighted average number of shares of common stock outstanding. Our diluted net income per share amounts for each period presented include the weighted average effect of potentially dilutive shares. We used the “treasury stock” method to determine the dilutive effect of our stock options, DSUs, MSUs, and convertible notes.
3. Auction Rate Securities
Our ARS investments, which are included in non-current investments, have failed to settle in auctions beginning in 2007. These investments are not liquid, and in the event we need to access these funds, we will not be able to do so without a loss of principal, unless redeemed by the issuers or a future auction on these investments is successful. During fiscal 2014 none of our ARS investments were redeemed. During 2013 and 2012, $3.4 million and $10.1 million, respectively, of our ARS investments were redeemed.
As there are currently no active markets for our various failed ARS investments, we have estimated the fair value of these investments as of the end of fiscal 2014 using a trinomial discounted cash flow analysis. The analysis considered, among others, the following factors:
| • | the collateral underlying the security investments; |
| • | the creditworthiness of the counterparty; |
| • | the timing of expected future cash flows; |
| • | the probability of a successful auction in a future period; |
| • | the underlying structure of each investment; |
| • | the present value of future principal and interest payments discounted at rates considered to reflect current market conditions; |
| • | a consideration of the probabilities of default, passing a future auction, or redemption at par for each period; and |
| • | estimates of the recovery rates in the event of default for each investment. |
When possible, our failed ARS investments were compared to other observable market data or securities with similar characteristics. Our estimate of the fair value of our ARS investments could fluctuate materially from period to period depending on future market conditions.
We have ARS investments with a fair value of $13.9 million that mature from fiscal 2016 to 2018, $3.2 million that mature from 2044 to 2046, and $2.7 million that have no maturity. Of our ARS investments, $5.5 million par value are investment grade and the remaining $18.5 million par value are below investment grade.
F-16
Table of Contents
The various types of ARS investments we held as of the end of fiscal 2014, including the original cost basis, other-than-temporary impairment included in retained earnings, new cost basis, unrealized gain/(loss), and fair value consisted of the following (in thousands):
| Original Cost Basis |
Other-than- temporary Impairment in Retained Earnings |
New Cost Basis |
Unrealized Gain/(Loss) |
Fair Value |
||||||||||||||||
| Student loans |
$ | 3,500 | $ | (179 | ) | $ | 3,321 | $ | (149 | ) | $ | 3,172 | ||||||||
| Credit linked notes |
13,500 | (7,513 | ) | 5,987 | 5,891 | 11,878 | ||||||||||||||
| Preferred stock |
5,000 | (5,000 | ) | — | 2,750 | 2,750 | ||||||||||||||
| Municipals |
2,000 | (83 | ) | 1,917 | 68 | 1,985 | ||||||||||||||
|
|
|
|
|
|
|
|
|
|
|
|||||||||||
| Total ARS |
$ | 24,000 | $ | (12,775 | ) | $ | 11,225 | $ | 8,560 | $ | 19,785 | |||||||||
|
|
|
|
|
|
|
|
|
|
|
|||||||||||
During fiscal 2014, we recorded $1.1 million of accretion as interest income on our credit linked notes.
All of the ARS investments in the above table with unrealized losses have been in a continuous unrealized loss position for more than 12 months.
The various types of ARS investments we held as of the end of fiscal 2013, including the original cost basis, other-than-temporary impairment included in retained earnings, new cost basis, unrealized gain/(loss), and fair value consisted of the following (in thousands):
| Original Cost Basis |
Other-than- temporary Impairment in Retained Earnings |
New Cost Basis |
Unrealized Gain/(Loss) |
Fair Value |
||||||||||||||||
| Student loans |
$ | 3,500 | $ | (179 | ) | $ | 3,321 | $ | (168 | ) | $ | 3,153 | ||||||||
| Credit linked notes |
13,500 | (8,571 | ) | 4,929 | 4,980 | 9,909 | ||||||||||||||
| Preferred stock |
5,000 | (5,000 | ) | — | 2,000 | 2,000 | ||||||||||||||
| Municipals |
2,000 | (83 | ) | 1,917 | (10 | ) | 1,907 | |||||||||||||
|
|
|
|
|
|
|
|
|
|
|
|||||||||||
| Total ARS |
$ | 24,000 | $ | (13,833 | ) | $ | 10,167 | $ | 6,802 | $ | 16,969 | |||||||||
|
|
|
|
|
|
|
|
|
|
|
|||||||||||
All of the ARS investments in the above table with unrealized losses have been in a continuous unrealized loss position for more than 12 months.
We have accounted for all of our ARS investments as non-current as we are not able to reasonably determine when the ARS markets will recover or be restructured. Based on our ability to access our cash and cash equivalents, our expected operating cash flows, and our other sources of cash, we do not intend to sell our ARS investments and it is not more likely than not that we will be required to sell our ARS investments before the recovery of the amortized cost basis. We will continue to monitor our ARS investments and evaluate our accounting for these investments quarterly.
F-17
Table of Contents
4. Property and Equipment
Property and equipment as of the end of fiscal 2014 and 2013 consisted of the following (in thousands):
| Life |
2014 | 2013 | ||||||||
| Land |
— | $ | 13,300 | $ | 7,900 | |||||
| Building and building improvements |
35 years | 30,993 | 27,000 | |||||||
| Computer equipment |
3 - 5 years | 15,395 | 10,536 | |||||||
| Manufacturing equipment |
1 year to 5 years | 33,368 | 22,508 | |||||||
| Furniture, fixtures, and leasehold improvements |
3 years to 10 years | 19,830 | 11,157 | |||||||
| Capitalized software |
3 years to 7 years | 17,445 | 14,219 | |||||||
|
|
|
|
|
|||||||
| 130,331 | 93,320 | |||||||||
| Accumulated depreciation and amortization |
(49,482 | ) | (35,285 | ) | ||||||
|
|
|
|
|
|||||||
| Property and equipment, net |
$ | 80,849 | $ | 58,035 | ||||||
|
|
|
|
|
|||||||
In fiscal 2014 there was no property and equipment retired which was fully depreciated. For fiscal 2013, we retired fully depreciated equipment and furniture with an original cost of $4.3 million.
During fiscal 2014, we purchased a 5.35 acre site, with two single story buildings totaling approximately 80,000 square feet, located adjacent to our San Jose headquarters for approximately $10.1 million in cash. We allocated $5.4 million of the cost to land and the remaining $4.7 million to buildings. We plan to retrofit one of the two buildings, or approximately 51,000 square feet, to support expansion of our San Jose-based employee population. The second building is leased to a tenant through March 2016, with an option for the tenant to renew the lease for an additional five years.
5. Acquisitions
Validity
On November 7, 2013, or the Acquisition Date, we acquired 100% of the outstanding common and preferred shares and voting interest of a privately held company, Validity Sensors, Inc., or Validity. We accounted for this acquisition using the purchase method for business combinations. The results of Validity’s operations have been included in our consolidated financial statements since the Acquisition Date. Validity was a leading provider of capacitive-based biometric fingerprint authentication solutions for notebook applications. Prior to the acquisition, Validity began targeting its biometric fingerprint authentication solutions for smartphone and tablet applications and, as of the Acquisition Date, had one revenue-generating design win with one customer. This acquisition is intended to bring together substantial synergies through the combination of the Validity technologies and workforce and our financial stability, scale, infrastructure, customer relationships, and technology delivery performance record. Our goal is to gain access to the fast-growing biometrics market, significantly expanding our market opportunity and underscoring our commitment to making smart devices easier to use.
The Acquisition Date fair value of the consideration transferred totaled $127.8 million, which consisted of the following (in thousands):
| Cash |
$ | 19,985 | ||
| Shares issued |
70,280 | |||
| Contingent consideration |
37,499 | |||
|
|
|
|||
| $ | 127,764 | |||
|
|
|
In connection with the acquisition, we issued 1,577,559 shares of our common stock to the former Validity stockholders valued at $70.3 million based on the closing price of our common stock of $44.55 on the Acquisition Date. The contingent consideration arrangement requires us to make earn-out consideration payments of up to $162.5 million, based primarily on sales, calculated quarterly, ending on March 31, 2016, of certain products embodying Validity fingerprint sensor technology. The earn-out consideration will be payable in cash, except for the initial $16.3 million of contingent consideration, which will be satisfied by delivery of 338,427 shares of our common stock, based on the transaction reference price of $48.278. Under certain conditions, we may be required to deliver additional shares to ensure that at least 40% of the value of consideration transferred to the former Validity stockholders is paid in shares of our common stock.
F-18
Table of Contents
We estimated the fair value of the contingent consideration using a probability-weighted discounted cash flow model. These fair value measurements were based on significant inputs not observable in the market and thus represent a Level 3 measurement. Key assumptions in applying the probability-weighted discounted cash flow model was a 23% discount rate under three unequally weighted cash flow scenarios reviewed by senior management and our board to assess the transaction.
The estimated fair value of the contingent consideration arrangement as of the Acquisition Date was $37.5 million. The contingent consideration is remeasured to fair value each reporting period and adjustments are recorded through earnings. As of the end of fiscal 2014, the estimated fair value of the contingent consideration was $104.0 million. The increase in the estimated fair value of the contingent consideration during fiscal 2014 was primarily due to the increase in the forecasted unit sales of products embodying Validity fingerprint sensor technology and, to a lesser extent, the increase in our stock price for the portion of contingent consideration to be settled with our stock at the reference price.
The following table summarizes the estimated fair values of the assets acquired and liabilities assumed as of the Acquisition Date (in thousands):
| Cash |
$ | 365 | ||
| Accounts receivable |
3,840 | |||
| Inventory |
2,154 | |||
| Prepaid expenses and other |
984 | |||
| Property and equipment |
326 | |||
| Deferred tax assets |
12,242 | |||
| Acquired intangible assets |
76,400 | |||
| Other assets |
1,283 | |||
|
|
|
|||
| Total identifiable assets acquired |
97,594 | |||
| Accounts payable |
2,141 | |||
| Accrued liabilities |
1,497 | |||
| Non-current deferred tax liabilities |
5,327 | |||
| Non-current taxes payable |
700 | |||
| Other non-current accrued liabilities |
500 | |||
|
|
|
|||
| Net identifiable assets acquired |
87,429 | |||
| Goodwill |
40,335 | |||
|
|
|
|||
| Net assets acquired |
$ | 127,764 | ||
|
|
|
Of the $76.4 million of acquired intangible assets, $57.0 million was assigned to in-process research and development projects and will be amortized over estimated useful lives to be determined at the date the underlying projects are determined to be substantively complete; $18.6 million was assigned to developed technology and is amortizing over estimated useful lives of 2-3 years; and $750,000 was assigned to backlog and was amortized during the quarter ended December 31, 2013. We estimated the fair value of the identified intangible assets using a discounted cash flow model for each of the underlying identified intangible assets. These fair value measurements were based on significant inputs not observable in the market and thus represent a Level 3 measurement. Key assumptions in applying the discounted cash flow model to the identified intangible assets included discount rates ranging from 17% to 25%.
In-process research and development consists of next generation fingerprint authentication technology designed for the mobile product and PC markets. Developed technology consists of established fingerprint authentication technology initially designed for and sold into the PC market and adapted for the mobile product market. We anticipate that all in-process research and development projects will be substantially completed within the next three months. The value of goodwill reflects the anticipated synergies of the combined operations and workforce of Validity as of the Acquisition Date.
F-19
Table of Contents
During fiscal 2014, we made one purchase price allocation adjustment reducing a deferred tax asset by $1.4 million with a corresponding increase in goodwill. As of the end of fiscal 2014, we believe our purchase price allocation is complete and no additional adjustments to the recorded assets and liabilities are required.
In connection with the acquisition, we recognized $1.2 million of indemnification assets, consisting of $700,000 for foreign income tax and $500,000 for foreign service tax. These amounts represent estimated tax settlements plus interest and penalties. Under the merger agreement, we are indemnified for any additional tax liability incurred (as well as other reasonable expenses) before the acquisition.
The Validity fingerprint authentication products are an extension of our existing interactive user interface solution products and are marketed to our existing customer base. We report revenue from these products on a combined basis with our other products based on device type. We continue to operate in one segment and therefore the goodwill applies to a company-wide reporting unit. None of the goodwill is expected to be deductible for income tax purposes.
We recognized approximately $2.0 million of legal and consulting costs that were expensed in fiscal 2014. These costs are included in our consolidated statements of income as selling, general, and administrative expenses.
Prior to the acquisition, we did not have an existing relationship or transactions with Validity.
The consolidated financial statements include $105.4 million of revenue from Validity fingerprint authentication products from the Acquisition Date through the end of fiscal 2014.
The following unaudited pro forma financial information presents the combined results of operations for us and Validity as if the acquisition had occurred at the beginning of fiscal 2012. The unaudited pro forma financial information has been prepared for comparative purposes only and does not purport to be indicative of the actual operating results that would have been recorded had the acquisition actually taken place at the beginning of fiscal 2012, and should not be taken as indicative of future consolidated operating results. Additionally, the unaudited pro forma financial results do not include any anticipated synergies or other expected benefits from the acquisition. The following table presents unaudited pro forma financial results for fiscal 2014 and 2013 (in thousands, except per share data).
| 2014 | 2013 | |||||||
| Revenue |
$ | 955,422 | $ | 680,171 | ||||
| Net income |
36,095 | 74,924 | ||||||
| Net income per share—diluted |
0.96 | 2.09 | ||||||
Pro forma adjustments used to arrive at pro forma net income for fiscal 2014 and 2013, were as follows (in thousands):
| 2014 | 2013 | |||||||
| Buyer transaction costs |
$ | 2,000 | $ | — | ||||
| Seller transaction costs |
517 | — | ||||||
| Inventory adjustment |
575 | — | ||||||
| Share-based compensation |
280 | 350 | ||||||
| Intangible amortization |
(8,242 | ) | (7,618 | ) | ||||
| Deferred compensation |
47 | (75 | ) | |||||
|
|
|
|
|
|||||
| $ | (4,823 | ) | $ | (7,343 | ) | |||
|
|
|
|
|
|||||
Renesas SP Drivers
On June 10, 2014, we entered into a stock purchase agreement, or Agreement, to acquire a privately held company, Renesas SP Drivers, Inc., or RSP, a leading provider of small and medium-sized display driver ICs for smartphones and tablets. The transaction was approved by our board of directors, RSP’s boards of directors and the board of directors of the companies that own RSP. The transaction is subject to certain financing and other customary closing conditions and is expected to close in the second quarter of our fiscal 2015.
F-20
Table of Contents
In connection with the Agreement, we received a commitment from a Wells Fargo for $150 million of senior secured term loans and $150 million of senior secured revolving credit commitments. This acquisition is intended to increase our addressable market and to accelerate our product roadmap for touch-and-display driver integration. The acquisition is expected to be completed by acquiring all outstanding capital stock of RSP for an aggregate base purchase price of JPY48.5 billion (or approximately $475 million based on a Japanese Yen to U.S. Dollar reference conversion rate of JPY102 to US$1). The purchase price is based on cash and other adjustments and is subject to customary adjustments for net working capital, net debt, target inventory, and third party expenses. We incurred approximately $4.7 million in direct acquisition related costs during fiscal 2014, which were expensed as incurred.
The acquisition will be accounted for using the purchase method of accounting in accordance with the business acquisition guidance. Under the purchase accounting method, the total estimated purchase consideration of the acquisition will be allocated to the tangible and identifiable intangible assets acquired and liabilities assumed based on their relative fair values. The excess of the purchase consideration over the net tangible and identifiable intangible assets acquired and liabilities will be recorded as goodwill.
6. Acquired Intangibles
The following table summarizes the life, the gross carrying value of our acquired intangible assets, and the related accumulated amortization as of the end of fiscal 2014 and 2013 (in thousands):
| Life |
2014 | 2013 | ||||||||
| In-process research and development |
To be determined | $ | 57,000 | $ | 8,900 | |||||
| Fingerprint developed technology |
2-3 years | 18,650 | — | |||||||
| Thintouch developed technology |
7 years | 8,900 | — | |||||||
| Customer relationships |
5 years | 3,800 | 3,800 | |||||||
| Licensed technology and other |
5 years | 1,335 | 1,335 | |||||||
| Backlog |
Less than 1 year | 750 | — | |||||||
| Patents |
5 years | 100 | 100 | |||||||
|
|
|
|
|
|||||||
| 90,535 | 14,135 | |||||||||
| Accumulated amortization |
(8,424 | ) | (1,025 | ) | ||||||
|
|
|
|
|
|||||||
| Acquired intangibles, net |
$ | 82,111 | $ | 13,110 | ||||||
|
|
|
|
|
|||||||
Amortization expense is calculated using the straight-line method over the estimated useful lives of the acquired intangibles. The total amortization expense for the acquired intangible assets was $7.4 million in fiscal 2014 and $1.0 million in fiscal 2013. This amortization expense was included in our consolidated statements of income as acquired intangibles amortization and cost of revenue.
The following table presents expected annual aggregate amortization expense in future fiscal years (in thousands):
| 2015 |
$ | 10,560 | ||
| 2016 |
7,016 | |||
| 2017 |
3,221 | |||
| 2018 |
1,293 | |||
| 2019 |
1,271 | |||
| Thereafter |
1,750 | |||
| To be determined |
57,000 | |||
|
|
|
|||
| Future amortization |
$ | 82,111 | ||
|
|
|
F-21
Table of Contents
The in-process research and development intangible asset as of June 30, 2014, was recognized in connection with the acquisition of Validity. At the end of fiscal 2014, we determined the underlying projects are still under development as a significant amount of future research and development costs are expected to be incurred and additional development is required to overcome the remaining technological risks. We expect to complete this project and begin to amortize the related in-process research and development intangible asset early in fiscal 2015.
7. Commitments and Contingencies
Leases
We maintain office facilities in various locations under operating leases with expiration dates from fiscal 2015 to fiscal 2022, some of which have renewal options of one to five years. Our leased office facilities are located in China, Finland, Hong Kong, India, Japan, Korea, Switzerland, Taiwan, and the United States. We recognized rent expense on a straight-line basis of $4.7 million, $4.6 million, and $4.3 million for fiscal 2014, 2013, and 2012, respectively.
The aggregate future minimum rental commitments in future fiscal years for non-cancelable operating leases with initial or remaining terms in excess of one year were as follows (in thousands):
| Fiscal Year |
Operating Lease Payments |
|||
| 2015 |
$ | 4,340 | ||
| 2016 |
3,007 | |||
| 2017 |
1,943 | |||
| 2018 |
1,563 | |||
| 2019 |
725 | |||
| Thereafter |
975 | |||
|
|
|
|||
| Total minimum operating lease payments |
$ | 12,553 | ||
|
|
|
|||
Contingencies
We have in the past and may in the future receive notices from third parties that claim our products infringe their intellectual property rights. We cannot be certain that our technologies and products do not and will not infringe issued patents or other proprietary rights of third parties.
Any infringement claims, with or without merit, could result in significant litigation costs and diversion of management and financial resources, including the payment of damages, which could have a material adverse effect on our business, financial condition, and results of operations.
Indemnifications
In connection with certain agreements we are obligated to indemnify the counterparty against third party claims alleging infringement of certain intellectual property rights by us. We have also entered into indemnification agreements with our officers and directors. Maximum potential future payments cannot be estimated because these agreements do not have a maximum stated liability. However, historical costs related to these indemnification provisions have not been significant. We have not recorded any liability in our consolidated financial statements for such indemnification obligations.
Line of Credit
We have an unsecured $75.0 million working capital line of credit with Wells Fargo Bank. The Wells Fargo Bank revolving line of credit, which expires on September 1, 2014, has an interest rate equal to the prime lending rate or 150 basis points above LIBOR, depending on whether we choose a variable or fixed rate, respectively. We did not borrow any amounts under the line of credit during fiscal 2014.
F-22
Table of Contents
8. Stockholders’ Equity
Preferred Stock
We are authorized, subject to limitations imposed by Delaware law, to issue up to a total of 10,000,000 shares of preferred stock in one or more series without stockholder approval. Our board of directors has the power to establish from time to time the number of shares to be included in each series and to fix the rights, preferences, and privileges of the shares of each wholly unissued series and any of its qualifications, limitations, or restrictions. Our board of directors can also increase or decrease the number of shares of a series, but not below the number of shares of that series then outstanding, without any further vote or action by the stockholders.
Our board of directors may authorize the issuance of preferred stock with voting or conversion rights that could harm the voting power or other rights of the holders of our common stock. The issuance of preferred stock, while providing flexibility in connection with possible acquisitions and other corporate purposes, could, among other things, have the effect of delaying, deferring, or preventing a change in control of our company and might harm the market price of our common stock and the voting power and other rights of the holders of common stock. As of the end of fiscal 2014, there were no shares of preferred stock outstanding.
Shares Reserved for Future Issuance
Shares of common stock reserved for future issuance as of the end of fiscal 2014 were as follows:
| Stock options outstanding |
3,693,375 | |||
| Deferred stock units outstanding |
1,058,243 | |||
| Market stock units outstanding |
120,330 | |||
| Awards available for grant under all share-based compensation plans |
3,494,327 | |||
|
|
|
|||
| Reserved for future issuance |
8,366,275 | |||
|
|
|
Treasury Stock
In July 2014, our board of directors has authorized an additional $110.0 million for our common stock repurchase program bringing the cumulative authorization to $730.0 million, expiring in July 2016. The program authorizes us to repurchase our common stock in the open market or in privately negotiated transactions depending upon market conditions and other factors. The number of shares repurchased and the timing of repurchases is based on the level of our cash balances, general business and market conditions, and other factors, including alternative investment opportunities. Common stock repurchased under this program is held as treasury stock. As of the date of the additional authorization we had $199.6 million remaining under our common stock repurchase program.
9. Share-Based Compensation
The purpose of our various share-based compensation plans is to attract, motivate, retain, and reward high-quality employees, directors, and consultants by enabling such persons to acquire or increase their proprietary interest in our common stock in order to strengthen the mutuality of interests between such persons and our stockholders and to provide such persons with annual and long-term performance incentives to focus their best efforts on the creation of stockholder value. Consequently, we determine share-based compensatory awards issued subsequent to the initial award for our employees and consultants primarily on individual performance. Our share-based compensation plans with outstanding awards consist of our 2001 Incentive Compensation Plan, as amended, or our 2001 Plan; our Amended and Restated 2010 Incentive Compensation Plan, or our 2010 Plan; and our 2010 Employee Stock Purchase Plan, or our 2010 ESPP.
F-23
Table of Contents
Share-based compensation awards available for grant or issuance for each plan as of the beginning of the fiscal year, including changes in the balance of awards available for grant for fiscal 2014, were as follows:
| Awards Available Under All Share-Based Award Plans |
2001 Incentive Compensation Plan |
2010 Incentive Compensation Plan |
2010 Employee Stock Purchase Plan |
|||||||||||||
| Balance at June 2013 |
1,674,601 | — | 1,341,788 | 332,813 | ||||||||||||
| Additional shares authorized |
3,332,898 | — | 3,000,000 | 332,898 | ||||||||||||
| Stock options granted |
(554,108 | ) | — | (554,108 | ) | — | ||||||||||
| Deferred stock units granted |
(647,927 | ) | — | (647,927 | ) | — | ||||||||||
| Market stock units granted |
(80,730 | ) | — | (80,730 | ) | — | ||||||||||
| Market stock units performance adjustment |
(10,782 | ) | — | (10,782 | ) | — | ||||||||||
| Purchases under employee stock purchase plan |
(409,084 | ) | — | — | (409,084 | ) | ||||||||||
| Forfeited |
227,026 | 37,567 | 189,459 | — | ||||||||||||
| Plan shares expired |
(37,567 | ) | (37,567 | ) | — | — | ||||||||||
|
|
|
|
|
|
|
|
|
|||||||||
| Balance at June 2014 |
3,494,327 | — | 3,237,700 | 256,627 | ||||||||||||
|
|
|
|
|
|
|
|
|
|||||||||
Our 2001 Plan, which expired in March 2011, was replaced by our 2010 Plan. Option awards and DSUs that are currently outstanding under our 2001 Plan will remain outstanding until exercised, delivered, forfeited, or cancelled under the terms of their respective grant agreements.
Share-based compensation and the related tax benefit recognized in our consolidated statements of income for fiscal 2014, 2013, and 2012 were as follows (in thousands):
| 2014 | 2013 | 2012 | ||||||||||
| Cost of revenue |
$ | 1,142 | $ | 911 | $ | 1,129 | ||||||
| Research and development |
18,455 | 15,775 | 15,509 | |||||||||
| Selling, general, and administrative |
13,264 | 15,524 | 17,523 | |||||||||
|
|
|
|
|
|
|
|||||||
| Total |
$ | 32,861 | $ | 32,210 | $ | 34,161 | ||||||
|
|
|
|
|
|
|
|||||||
| Income tax benefit on share-based compensation |
$ | 10,563 | $ | 9,202 | $ | 9,589 | ||||||
|
|
|
|
|
|
|
|||||||
We recognize a tax benefit upon expensing certain share-based awards associated with our share-based compensation plans, including nonqualified stock options, DSUs, and MSUs, but we cannot recognize tax benefit concurrent with the recognition of share-based compensation expenses associated with incentive stock options and employee stock purchase plan shares (qualified stock awards). For qualified stock awards we recognize a tax benefit only in the period when disqualifying dispositions of the underlying stock occur, which historically has been up to several years after vesting and in a period when our stock price substantially increases.
We determine excess tax benefit using the long-haul method in which we compare the actual tax benefit associated with the tax deduction from share-based award activity to the hypothetical tax benefit based on the grant date fair values of the corresponding share-based awards. Tax benefit associated with excess tax deduction creditable to additional paid-in capital is not recognized until the deduction reduces taxes payable.
Historically, we have issued new shares in connection with our share-based compensation plans; however, treasury shares were also available for issuance as of the end of fiscal 2014. Any additional shares repurchased under our common stock repurchase program would be available for issuance under our share-based compensation plans.
F-24
Table of Contents
Stock Options
Our share-based compensation plans with outstanding stock option awards include our 2001 Plan and our 2010 Plan. Under our 2010 Plan, we may grant incentive stock options or nonqualified stock options to purchase shares of our common stock at not less than 100% of the fair market value, or FMV, on the date of grant. Stock options granted to our employees generally are incentive stock options, or qualified options, under the Internal Revenue Code, subject to calendar year vesting limitations with any balance being nonqualified stock options, while consultants and directors receive nonqualified stock options.
Options granted under our 2010 Plan generally vest over three to four years from the vesting commencement date and expire seven years after the date of grant if not exercised.
Certain stock option activity for fiscal 2014 and balances as of the end of fiscal 2014 were as follows:
| Stock Option Awards Outstanding |
Weighted Average Exercise Price |
Intrinsic Value (In thousands) |
||||||||||
| Balance at June 2013 |
6,030,287 | $ | 26.15 | |||||||||
| Granted |
554,108 | 52.64 | ||||||||||
| Exercised |
(2,757,509 | ) | 26.01 | |||||||||
| Forfeited |
(133,511 | ) | 30.46 | |||||||||
|
|
|
|||||||||||
| Balance at June 2014 |
3,693,375 | 30.08 | $ | 219,037 | ||||||||
|
|
|
|
|
|||||||||
| Exercisable at June 2014 |
2,598,694 | 25.89 | $ | 164,987 | ||||||||
|
|
|
|
|
|||||||||
The aggregate intrinsic value was determined using the closing price of our common stock on the last trading day of fiscal 2014, or June 27, 2014, of $89.38 and excludes the impact of options that were not in-the-money. Approximately 70% of the stock option awards outstanding were vested and in-the-money as of the end of fiscal 2014.
At the end of fiscal 2014, we estimated that we have 3.6 million fully vested options and options expected to vest with an aggregate intrinsic value of $215.7 million, having a weighted average exercise price of $29.77 and a weighted average remaining contractual term of 4.5 years. The weighted average remaining contractual term for the options exercisable is approximately 4.1 years.
Cash received and the aggregate intrinsic value of stock options exercised for fiscal 2014, 2013, and 2012 were as follows (in thousands):
| 2014 | 2013 | 2012 | ||||||||||
| Cash received |
$ | 71,721 | $ | 30,766 | $ | 28,939 | ||||||
| Aggregate intrinsic value |
$ | 79,277 | $ | 23,559 | $ | 16,878 | ||||||
The fair value of each award granted under our share-based compensation plans for fiscal 2014, 2013, and 2012 was estimated at the date of grant using the Black-Scholes option pricing model, assuming no expected dividends and the following range of assumptions:
| 2014 | 2013 | 2012 | ||||
| Expected volatility |
40.1% - 44.5% | 41.8% - 48.9% | 44.6% - 47.6% | |||
| Expected life in years |
3.8 - 4.3 | 3.5 - 4.6 | 4.6 | |||
| Risk-free interest rate |
1.31% - 1.74% | 0.62% -0.72% | 0.7% - 1.3% | |||
| Fair value per award |
$18.72 | $11.40 | $10.70 |
F-25
Table of Contents
The unrecognized share-based compensation costs for stock options granted under our various plans were approximately $16.9 million as of the end of fiscal 2014 to be recognized over a weighted average period of approximately 1.8 years.
Deferred Stock Units
Our 2001 Plan, which expired in March 2011, provided for the grant of DSU awards to our employees, consultants, and directors. Currently, our 2010 Plan provides for the grant of DSU awards to our employees, consultants, and directors. A DSU is a promise to deliver shares of our common stock at a future date in accordance with the terms of the DSU grant agreement. We began granting DSUs in January 2006.
DSUs granted under our 2010 Plan generally vest ratably over three to four years from the vesting commencement date. Delivery of shares under the plan takes place on the quarterly vesting dates. At the delivery date, we withhold shares to cover statutory minimum tax withholding by delivering a net quantity of shares. Until delivery of shares, the grantee has no rights as a stockholder.
An election to defer delivery of the underlying shares for unvested DSUs can be made by the grantee provided the deferral election is made at least one year before vesting and the deferral period is at least five years from the scheduled delivery date.
DSU activity, including DSUs granted, delivered, and forfeited in fiscal 2014, and the balance and aggregate intrinsic value of DSUs as of the end of fiscal 2014 were as follows:
| DSU Awards Outstanding |
Aggregate Intrinsic Value (in thousands) |
Weighted Average Grant Date Fair Value |
||||||||||
| Balance at June 30, 2013 |
1,005,435 | $ | 29.24 | |||||||||
| Granted |
647,927 | 52.83 | ||||||||||
| Delivered |
(506,937 | ) | 30.48 | |||||||||
| Forfeited |
(88,182 | ) | 34.80 | |||||||||
|
|
|
|||||||||||
| Balance at June 30, 2014 |
1,058,243 | $ | 94,586 | 42.62 | ||||||||
|
|
|
|
|
|||||||||
Of the shares delivered, 157,489 shares valued at $8.2 million were withheld to meet statutory minimum tax withholding requirements. The aggregate intrinsic value was determined using the closing price of our common stock on the last trading day of fiscal 2014, or June 27, 2014, of $89.38.
The unrecognized share-based compensation cost for DSUs granted under our 2001 Plan and our 2010 Plan was approximately $43.7 million as of the end of fiscal 2014, which will be recognized over a weighted average period of approximately 2.0 years. The aggregate market value of DSUs delivered in fiscal 2014, 2013, and 2012 was $26.3 million, $14.7 million, and $13.3 million, respectively.
Market Stock Units
Our 2010 Plan provides for the grant of MSU awards, which are a type of DSU award, to our employees, consultants, and directors. An MSU is a promise to deliver shares of our common stock at a future date based on the achievement of market-based performance requirements in accordance with the terms of the MSU grant agreement. We began granting MSUs in November 2012.
We have granted MSUs to our executive officers, which were designed to vest in three tranches with the target quantity for each tranche equal to one-third of the total MSU grant. The first tranche vests based on a one-year performance period; the second tranche vests based on a two-year performance period; and the third tranche vests based on a three-year performance period. Performance is measured on the achievement of a specified level of total stockholder return, or TSR, relative to the TSR of the Philadelphia Semiconductor Index, or SOX Index. The potential payout ranges from 0% to 200% of the grant target quantity and is adjusted on a two-to-one ratio based on our TSR performance relative to the SOX Index TSR performance using the following formula:
(100% + ([Synaptics TSR - SOX Index TSR] x 2))
F-26
Table of Contents
Delivery of shares earned, if any, will take place on the dates provided in the MSU grant agreement, assuming the grantee is still an employee, consultant, or director of our company at the end of the applicable performance period. On the delivery date, we withhold shares to cover statutory minimum tax withholding by delivering a net quantity of shares. Until delivery of shares, the grantee has no rights as a stockholder with respect to any shares underlying the MSU award.
MSU activity, including MSUs granted, delivered, and forfeited in fiscal 2014, and the balance and aggregate intrinsic value of MSUs as of the end of fiscal 2014 were as follows:
| Aggregate | Weighted | |||||||||||
| Intrinsic | Average | |||||||||||
| MSU Awards | Value | Grant Date | ||||||||||
| Outstanding | (in thousands) | Fair Value | ||||||||||
| Balance at June 30, 2013 |
67,400 | $ | 25.82 | |||||||||
| Granted |
80,730 | 60.62 | ||||||||||
| Performance adjustment |
10,782 | — | ||||||||||
| Delivered |
(33,249 | ) | 25.82 | |||||||||
| Forfeited |
(5,333 | ) | 25.82 | |||||||||
|
|
|
|||||||||||
| Balance at June 30, 2014 |
120,330 | $ | 10,755 | 49.17 | ||||||||
|
|
|
|
|
|||||||||
As a result of the Synaptics TSR exceeding the SOX Index TSR by 24 percentage points, we delivered 148% of the targeted shares underlying the November 2012 MSU grants, or 10,782 additional shares. Of the shares delivered, 15,148 shares valued at $670,000 were withheld to meet statutory minimum tax withholding requirements. The aggregate intrinsic value assumes a 100% payout factor and was determined using the closing price of our common stock on the last trading day of fiscal 2014, or June 27, 2014, of $89.38.
The fair value of each MSU granted from our plans for fiscal 2014 and 2013 was estimated at the date of grant using the Monte Carlo simulation model, assuming no expected dividends and the following assumptions:
| 2014 | 2013 | |||||||
| Expected volatility of company |
38.79 | % | 36.63 | % | ||||
| Expected volatility of SOX index |
24.95 | % | 28.57 | % | ||||
| Correlation coefficient |
0.53 | 0.58 | ||||||
| Expected life in years |
2.92 | 2.87 | ||||||
| Risk-free interest rate |
0.57 | % | 0.31 | % | ||||
| Fair value per award |
$ | 60.62 | $ | 25.82 | ||||
We amortize the compensation expense over the three-year performance and service period. The unrecognized share-based compensation cost of our outstanding MSUs was approximately $4.5 million as of the end of fiscal 2014, which will be recognized over a weighted average period of approximately 1.1 years.
Employee Stock Purchase Plan
Our 2010 ESPP became effective on January 1, 2011. The 2010 ESPP allows employees to designate up to 15% of their base compensation, subject to legal restrictions and limitations, to purchase shares of common stock at 85% of the lesser of the FMV at the beginning of the offering period or the exercise date. The offering period extends for up to two years and includes four exercise dates occurring at six-month intervals. Under the terms of our 2010 ESPP, if the FMV at an exercise date is less than the FMV at the beginning of the offering period, the current offering period will terminate and a new two-year offering period will commence.
F-27
Table of Contents
Shares purchased, weighted average purchase price, cash received, and the aggregate intrinsic value for employee stock purchase plan purchases in fiscal 2014, 2013, and 2012 were as follows (in thousands, except shares purchased and weighted average purchase price):
| 2014 | 2013 | 2012 | ||||||||||
| Shares purchased |
409,084 | 327,465 | 242,225 | |||||||||
| Weighted average purchase price |
$ | 22.07 | $ | 20.36 | $ | 24.51 | ||||||
| Cash received |
$ | 9,026 | $ | 6,668 | $ | 5,937 | ||||||
| Aggregate intrinsic value |
$ | 12,815 | $ | 4,845 | $ | 1,534 | ||||||
In accordance with accounting standards related to the accounting for employee stock purchase plans with a look-back option, the early termination of an offering period followed by the commencement of a new offering period represents a modification to the terms of the related awards. Under the terms of our 2010 ESPP, the offering period that commenced on May 16, 2012 was terminated on November 15, 2012 and a new offering period commenced on November 16, 2012. The November 16, 2012 modification affected approximately 474 employees and resulted in incremental compensation costs that were not material and is being recognized on a straight-line basis over the two-year period ending November 15, 2014.
Under the terms of our 2010 ESPP, the offering period that commenced on May 16, 2011 was terminated on May 15, 2012 and a new offering period commenced on May 16, 2012. The May 16, 2012 modification affected approximately 491 employees and resulted in incremental compensation costs that were not material and that were recognized on a straight-line basis over the two-year period ended May 15, 2014.
The fair value of each award granted under our 2010 ESPP for fiscal 2014, 2013, and 2012 was estimated using the Black-Scholes option pricing model, assuming no expected dividends and the following range of assumptions:
| 2014 | 2013 | 2012 | ||||
| Expected volatility |
43.8% - 49.3% | 38.6% - 40.2% | 34.0% - 37.3% | |||
| Expected life in years |
0.5 - 1.0 | 0.5 - 2.0 | 0.5 - 2.0 | |||
| Risk-free interest rate |
0.05% - 0.13% | 0.12% - 0.24% | 0.1% - 0.3% | |||
| Fair value per award |
$15.04 | $8.31 | $8.93 |
The expected volatility is based on either implied volatility for the expected lives of 0.5 years or a weighting of implied and historical volatility for expected lives greater than 0.5 years; the expected life is based on each period that begins with the enrollment date until each purchase date remaining in the offering period at the date of enrollment in the plan; and the risk free interest rate is based on U.S. Treasury yields or yield curve in effect for each expected life.
Unrecognized share-based compensation costs for awards granted under our 2010 ESPP at the end of fiscal 2014 were approximately $1.9 million that will be amortized over the next 4 months.
10. Employee Benefit Plans
401(k) Plan
We have a 401(k) Retirement Savings Plan for full-time employees. Under the plan, eligible employees may contribute a portion of their net compensation up to the annual limit of $17,500, or $23,000 for employees who are 50 years or older. In fiscal 2014, we provided matching funds of 25% of our employees’ contributions, excluding catch-up contributions. The employer matching funds vest 25% over four years and are fully vested at the end of the fourth year. We made matching contributions of $1.6 million, $1.4 million, and $1.2 million in fiscal 2014, 2013, and 2012, respectively.
F-28
Table of Contents
11. Income Taxes
Income before provision for income taxes for fiscal 2014, 2013, and 2012 consisted of the following (in thousands):
| 2014 | 2013 | 2012 | ||||||||||
| United States |
$ | 76,709 | $ | 44,005 | $ | 3,602 | ||||||
| Foreign |
(2,250 | ) | 57,728 | 64,948 | ||||||||
|
|
|
|
|
|
|
|||||||
| Income before provision for income taxes |
$ | 74,459 | $ | 101,733 | $ | 68,550 | ||||||
|
|
|
|
|
|
|
|||||||
The provision for income taxes for fiscal 2014, 2013, and 2012 consisted of the following (in thousands):
| 2014 | 2013 | 2012 | ||||||||||
| Current tax expense (benefit) |
||||||||||||
| Federal |
$ | (3,370 | ) | $ | (9,232 | ) | $ | 5,524 | ||||
| State |
7 | 4 | 36 | |||||||||
| Foreign |
12,334 | 10,521 | 9,587 | |||||||||
|
|
|
|
|
|
|
|||||||
| 8,971 | 1,293 | 15,147 | ||||||||||
|
|
|
|
|
|
|
|||||||
| Deferred tax expense (benefit) |
||||||||||||
| Federal |
18,713 | 1,876 | (814 | ) | ||||||||
| State |
— | — | — | |||||||||
| Foreign |
86 | (369 | ) | 73 | ||||||||
|
|
|
|
|
|
|
|||||||
| 18,799 | 1,507 | (741 | ) | |||||||||
|
|
|
|
|
|
|
|||||||
| Provision for income taxes |
$ | 27,770 | $ | 2,800 | $ | 14,406 | ||||||
|
|
|
|
|
|
|
|||||||
The provision for income taxes differs from the federal statutory rate for fiscal 2014, 2013, and 2012 as follows (in thousands):
| 2014 | 2013 | 2012 | ||||||||||
| Provision at U.S. federal statutory rate |
$ | 26,061 | $ | 35,606 | $ | 23,992 | ||||||
| State income taxes |
5 | 3 | 139 | |||||||||
| Qualified stock options |
939 | 2,071 | 2,280 | |||||||||
| Business credits |
(2,852 | ) | (3,722 | ) | (1,278 | ) | ||||||
| Foreign tax differential |
(19,584 | ) | (16,589 | ) | (10,933 | ) | ||||||
| Remeasurement of unrecognized tax benefits |
— | (15,569 | ) | — | ||||||||
| Non-deductible portion of contingent consideration |
21,222 | — | — | |||||||||
| Change in valuation allowance |
(370 | ) | (154 | ) | (27 | ) | ||||||
| Nondeductible amortization |
935 | 578 | — | |||||||||
| Other differences |
1,414 | 576 | 233 | |||||||||
|
|
|
|
|
|
|
|||||||
| Provision for income taxes |
$ | 27,770 | $ | 2,800 | $ | 14,406 | ||||||
|
|
|
|
|
|
|
|||||||
Net deferred tax assets as of the end of fiscal 2014 and 2013 consisted of the following (in thousands):
| 2014 | 2013 | |||||||
| Current deferred tax assets |
$ | 7,232 | $ | 2,837 | ||||
| Non-current deferred tax assets |
5,043 | 13,374 | ||||||
|
|
|
|
|
|||||
| Net deferred tax assets |
$ | 12,275 | $ | 16,211 | ||||
|
|
|
|
|
|||||
F-29
Table of Contents
Current deferred tax assets and non-current deferred tax assets are included in prepaid expenses and other current assets, and other assets, respectively, in the accompanying consolidated balance sheets.
Significant components of our deferred tax assets (liabilities) as of the end of fiscal 2014 and 2013 consisted of the following (in thousands):
| 2014 | 2013 | |||||||
| Deferred tax assets: |
||||||||
| Investment writedowns |
$ | 6,279 | $ | 6,769 | ||||
| Capital loss carryforward |
14 | 1,352 | ||||||
| Inventory writedowns |
305 | 268 | ||||||
| Depreciation and amortization |
2,277 | 86 | ||||||
| Accrued compensation |
2,519 | 2,027 | ||||||
| Deferred compensation |
4,605 | — | ||||||
| Share-based compensation |
9,255 | 15,436 | ||||||
| Business credit carryforward |
18,103 | 13,332 | ||||||
| Net operating loss carryforward |
8,738 | 1,166 | ||||||
| Other accruals |
681 | 437 | ||||||
|
|
|
|
|
|||||
| 52,776 | 40,873 | |||||||
| Valuation allowance |
(14,812 | ) | (15,556 | ) | ||||
|
|
|
|
|
|||||
| 37,964 | 25,317 | |||||||
|
|
|
|
|
|||||
| Deferred tax liabilities: |
||||||||
| Acquisition intangibles |
(18,057 | ) | (834 | ) | ||||
| Interest |
(7,632 | ) | (8,272 | ) | ||||
|
|
|
|
|
|||||
| (25,689 | ) | (9,106 | ) | |||||
|
|
|
|
|
|||||
| Net deferred tax assets |
$ | 12,275 | $ | 16,211 | ||||
|
|
|
|
|
|||||
Realization of deferred tax assets depends on our generating sufficient U.S. and certain foreign taxable income in future years to obtain a benefit from the utilization of those deferred tax assets on our tax returns. Accordingly, the amount of deferred tax assets considered realizable may increase or decrease when we reevaluate the underlying basis for our estimates of future U.S. and foreign taxable income. As of the end of fiscal 2014, a valuation allowance of $14.8 million had been established to reduce deferred tax assets to levels that we believe are more likely than not to be realized through future taxable income. The net change in the valuation allowance during fiscal 2014 was a decrease of $744,000.
Undistributed operating earnings of our foreign subsidiaries were approximately $548.8 million as of the end of fiscal 2014 and are considered to be indefinitely reinvested overseas; accordingly, no U.S. income taxes have been provided for on these earnings. The potential deferred tax liability associated with undistributed operating earnings of our foreign subsidiaries was approximately $120.2 million.
As of the end of fiscal 2014, we had California net operating loss carryforwards of approximately $48.2 million. The California net operating loss carryforwards of $33.1 million were attributable to share-based award deductions. Any benefit of these net operating losses will be recorded directly to additional paid-in capital when realized. The California net operating loss will begin to expire in fiscal 2021, if not utilized. The federal and state capital loss carryforwards will begin to expire in fiscal 2015, if not utilized. In addition, we had $25.0 million of federal, $2.4 million of Idaho, and $15.0 million of California net operating loss carryforwards related to acquisitions. Under current tax law, net operating loss and tax credit carryforwards available to offset future income or income taxes may be limited by statute or upon the occurrence of certain events, including significant changes in ownership.
We had $8.3 million and $13.1 million of federal and state research tax credit carryforwards, respectively, as of the end of fiscal 2014. The federal research tax credit carryforward will begin to expire in 2027 and the state research tax credit can be carried forward indefinitely. We also had $1.3 million of federal alternative minimum tax credit carryforward available to offset future federal tax liabilities with no expiration.
F-30
Table of Contents
The total liability for gross unrecognized tax benefits, included in other liabilities in our consolidated balance sheets, increased by $2.0 million to $10.2 million in fiscal 2014 from $8.2 million in fiscal 2013. This total amount would reduce the effective tax rate on income from continuing operations, if recognized. A reconciliation of the beginning and ending balance of gross unrecognized tax benefits for fiscal 2014, 2013, and 2012 consisted of the following (in millions):
| 2014 | 2013 | 2012 | ||||||||||
| Beginning balance |
$ | 8.2 | $ | 23.1 | $ | 20.2 | ||||||
| Increase in unrecognized tax benefits related to current year tax positions |
1.1 | 1.8 | 2.6 | |||||||||
| Increase in unrecognized tax benefits related to prior year tax positions |
1.7 | — | 0.3 | |||||||||
| Remeasurement for results of income tax examination |
— | (15.0 | ) | — | ||||||||
| Decrease due to statute expiration |
(0.8 | ) | (1.7 | ) | — | |||||||
|
|
|
|
|
|
|
|||||||
| Ending Balance |
$ | 10.2 | $ | 8.2 | $ | 23.1 | ||||||
|
|
|
|
|
|
|
|||||||
Accrued interest and penalties increased by $22,000, decreased by $1.5 million, and increased by $749,000 representing income tax expense or benefit, in fiscal 2014, 2013, and 2012, respectively. Accrued interest and penalties was $935,000 and $913,000 as of June 30, 2014 and 2013, respectively. Our policy is to classify interest and penalties, if any, as components of income tax expense.
In May 2011, we were notified by the Internal Revenue Service, or the Service, that our fiscal 2003 through 2006 and fiscal 2008 through 2010 returns would be subject to examination. The early periods were being audited in connection with a mandatory review of tax refunds in excess of $2.0 million which resulted when we carried back our fiscal 2008 net operating loss. In March 2013, we received the Revenue Agent’s Report resolving our examination with the Service and paid an assessment that had no material impact on our condensed consolidated financial statements. Our case is pending review by the Joint Committee on Taxation, which we anticipate will conclude in our fiscal 2015. Any prospective adjustments to our unrecognized tax benefits will be recorded as an increase or decrease to income tax expense and cause a corresponding change to our effective tax rate. Accordingly, our effective tax rate could fluctuate materially from period to period.
On January 2, 2013, President Barack Obama signed into law The American Taxpayer Relief Act of 2013, or the Act. The Act extended the federal research credit for two years retroactively from January 1, 2012 through December 31, 2013. As such, we only recognized six months of tax benefit from the research tax credit for fiscal 2014.
It is reasonably possible that the amount of liability for unrecognized tax benefits may change within the next 12 months and an estimate of the range of possible changes could result in an increase of up to $2.0 million.
Our major tax jurisdictions are the United States, California, and Hong Kong SAR, and fiscal 2003 onward remain subject to examination by one or more of these jurisdictions.
12. Segment, Customers, and Geographic Information
We operate in one segment: the development, marketing, and sale of interactive human interface solutions for electronic devices and products. We generate our revenue from two broad product categories: the mobile product applications markets and the PC product applications market.
F-31
Table of Contents
Net revenue within geographic areas based on our customers’ locations for fiscal 2014, 2013, and 2012 consisted of the following (in thousands):
| 2014 | 2013 | 2012 | ||||||||||
| China |
$ | 449,431 | $ | 390,043 | $ | 353,522 | ||||||
| South Korea |
233,917 | 102,840 | 35,046 | |||||||||
| Taiwan |
118,776 | 84,380 | 60,980 | |||||||||
| United States |
93,783 | 22,576 | 5,179 | |||||||||
| Japan |
45,039 | 61,330 | 65,129 | |||||||||
| Other |
6,593 | 2,419 | 28,372 | |||||||||
|
|
|
|
|
|
|
|||||||
| $ | 947,539 | $ | 663,588 | $ | 548,228 | |||||||
|
|
|
|
|
|
|
|||||||
Net revenue from external customers for each group of similar products for fiscal 2014, 2013, and 2012 consisted of the following (in thousands):
| 2014 | 2013 | 2012 | ||||||||||
| Mobile product applications |
$ | 689,866 | $ | 424,076 | $ | 270,106 | ||||||
| PC product applications |
257,673 | 239,512 | 278,122 | |||||||||
|
|
|
|
|
|
|
|||||||
| $ | 947,539 | $ | 663,588 | $ | 548,228 | |||||||
|
|
|
|
|
|
|
|||||||
Long-lived assets within geographic areas as of the end of fiscal 2014 and 2013 consisted of the following (in thousands):
| 2014 | 2013 | |||||||
| United States |
$ | 210,833 | $ | 83,535 | ||||
| Asia/Pacific |
13,157 | 8,305 | ||||||
|
|
|
|
|
|||||
| $ | 223,990 | $ | 91,840 | |||||
|
|
|
|
|
|||||
Our goodwill of $61.0 million has been allocated to a company-wide reporting unit.
Major customers’ revenue as a percentage of total net revenue for fiscal 2014, 2013, and 2012 were as follows:
| 2014 | 2013 | 2012 | ||||||||||
| Customer A |
28 | % | 14 | % | * | |||||||
| Customer B |
* | * | 12 | % | ||||||||
| * | Less than 10% |
F-32
Table of Contents
INDEX TO EXHIBITS
| Exhibit Number |
Exhibit | |
| 2.1 | Agreement and Plan of Reorganization, dated as of October 9, 2013, by and among Synaptics Incorporated, Itsme Acquisition Corp., Itsme Acquisition II LLC, Validity Sensors, Inc., and Shareholder Representative Services LLC (1) | |
| 2.2†# | Stock Purchase Agreement, dated June 11, 2014, by and among Renesas Electronics Corporation, Renesas SP Drivers, Inc., Renesas SP Drivers Taiwan, Inc., Sharp Corporation, Powerchip Technology Corp., Global Powertec Co. Ltd., Quantum Vision Corporation, the registrant and Synaptics Holding GmbH | |
| 3.1 | Certificate of Incorporation (2) | |
| 3.1(b) | Certificate of Designation of Series A Junior Participating Preferred Stock (3) | |
| 3.2 | Third Amended and Restated Bylaws (amended and restated as of July 27, 2010) (4) | |
| 3.3 | Certificate of Amendment of Certificate of Incorporation of the registrant (5) | |
| 3.4 | Certificate of Amendment of Certificate of Incorporation of the registrant (6) | |
| 4 | Form of Common Stock Certificate (7) | |
| 4(b) | Rights Agreement, dated as of August 15, 2002, between the registrant and American Stock Transfer & Trust Company, as Rights Agent (3) | |
| 4(c) | Amendment No. 1 to Rights Agreement (8) | |
| 4.6 | Form of Indenture (9) | |
| 10.6(d)* | Amended and Restated 2001 Incentive Compensation Plan (as amended through January 23, 2007) (10) | |
| 10.6(b)* | Form of grant agreements for Amended and Restated 2001 Incentive Compensation Plan (11) | |
| 10.6(c)* | Form of deferred stock award agreement for Amended and Restated 2001 Incentive Compensation Plan (12) | |
| 10.17* | Form of Indemnification Agreement entered into with the following directors and executive officers as of January 28, 2002 with Francis F. Lee, Russell J. Knittel, Keith B. Geeslin, and Richard L. Sanquini; as of June 26, 2004 with Jeffrey D. Buchanan; as of March 28, 2006 with Hing Chung (Alex) Wong; as of February 20, 2007 with Nelson C. Chan; as of October 23, 2007 with James L. Whims; as of March 2, 2009 with Kathleen A. Bayless; as of January 10, 2011 with Kevin D. Barber; as of September 28, 2011 with Richard A. Bergman; as of May 22, 2012 with Bret Sewell; as of January 28, 2013 with Scott Deutsch; as of November 4, 2013 with John McFarland, and as of June 9, 2014 with Ritu Favre (2) | |
| 10.24(a)* | 2010 Incentive Compensation Plan (13) | |
| 10.24(b)* | Form of Non-Qualified Stock Option Agreement for 2010 Incentive Compensation Plan (14) | |
| 10.24(c)* | Form of Incentive Stock Option Agreement for 2010 Incentive Compensation Plan (14) | |
| 10.24(d)* | Form of Deferred Stock Award Agreement for 2010 Incentive Compensation Plan (14) | |
| 10.24(e)* | Amended and Restated 2010 Incentive Compensation Plan (15) | |
| 10.24(f)* | Form of Deferred Stock Award Agreement for Market Stock Units for Amended and Restated 2010 Incentive Compensation Plan (16) | |
| 10.25(a)* | Amended and Restated 2010 Employee Stock Purchase Plan | |
| 10.27* | Employment Offer Letter dated September 28, 2011 between the registrant and Richard Bergman (17) | |
| 10.28* | Change of Control Severance Policy For Executive Officers | |
| 10.29* | Severance Policy for Principal Executive Officers (18) | |
| 10.30 | Agreement of Purchase and Sale and Escrow Instructions dated as of June 25, 2012 between McKay Henry, LLC and the registrant (19) | |
| 10.30(a) | First Amendment to Agreement of Purchase and Sale and Escrow Instructions dated as of July 2, 2012 between McKay Henry, LLC and the registrant (19) | |
| 10.33 | Agreement of Purchase and Sale and Escrow Instructions dated as of October 19, 2012 between Orchard Partners, LLC and the registrant (16) | |
| 10.33(a) | First Amendment to Agreement of Purchase and Sale and Escrow Instructions dated as of November 19, 2012 between Orchard Partners, LLC and the registrant (16) | |
| 10.33(b) | Second Amendment to Agreement of Purchase and Sale and Escrow Instructions dated as of January 4, 2013 between Orchard Partners, LLC and the registrant (20) | |
52
Table of Contents
| 10.34 | Commitment Letter, dated June 11, 2014, by and among Wells Fargo Bank, National Association, Wells Fargo Securities, LLC and the registrant | |
| 21 | List of Subsidiaries | |
| 23.1 | Consent of Independent Registered Public Accounting Firm | |
| 31.1 | Certification of Chief Executive Officer pursuant to Rule 13a-14(a)/15d-14(a) | |
| 31.2 | Certification of Chief Financial Officer pursuant to Rule 13a-14(a)/15d-14(a) | |
| 32.1 | Section 1350 Certification of Chief Executive Officer | |
| 32.2 | Section 1350 Certification of Chief Financial Officer | |
| 101.INS | XBRL Instance Document | |
| 101.SCH | XBRL Taxonomy Extension Schema Document | |
| 101.CAL | XBRL Taxonomy Extension Calculation Linkbase Document | |
| 101.DEF | XBRL Taxonomy Extension Definition Linkbase Document | |
| 101.LAB | XBRL Taxonomy Extension Label Linkbase Document | |
| 101.PRE | XBRL Taxonomy Extension Presentation Linkbase Document | |
| (1) | Incorporated by reference to the registrant’s Form 8-K as filed with the SEC on November 12, 2013. |
| (2) | Incorporated by reference to the registrant’s Form 10-Q as filed with the SEC on February 21, 2002. |
| (3) | Incorporated by reference to the registrant’s Form 8-A as filed with the SEC on August 16, 2002. |
| (4) | Incorporated by reference to the registrant’s Current Report on Form 8-K as filed with the SEC on August 2, 2010. |
| (5) | Incorporated by reference to the registrant’s Current Report on Form 8-K as filed with the SEC on December 7, 2004. |
| (6) | Incorporation by reference to the registrant’s Current Report on Form 8-K as filed with the SEC on October 22, 2010. |
| (7) | Incorporated by reference to the registrant’s Form 10-K as filed with the SEC on September 12, 2002. |
| (8) | Incorporated by reference to the registrant’s Current Report on Form 8-K as filed with the SEC on April 24, 2008. |
| (9) | Incorporated by reference to the registrant’s registration statement on Form S-3 (Registration No. 333-155582) as filed with the SEC on November 21, 2008 and declared effective May 7, 2009. |
| (10) | Incorporated by reference to the registrant’s Form 10-Q as filed with the SEC on November 8, 2007. |
| (11) | Incorporated by reference to the registrant’s Form 10-Q as filed with the SEC on February 6, 2003. |
| (12) | Incorporated by reference to the registrant’s Form 10-K as filed with the SEC on September 7, 2006. |
| (13) | Incorporated by reference to the registrant’s Form 10-Q as filed with the SEC on November 2, 2010. |
| (14) | Incorporated by reference to the registrant’s Current Report on Form 8-K as filed with the SEC on October 22, 2010. |
| (15) | Incorporated by reference to the registrant’s Form 10-Q as filed with the SEC on May 4, 2012. |
| (16) | Incorporated by reference to the registrant’s Form 10-Q as filed with the SEC on February 1, 2013. |
| (17) | Incorporated by reference to the registrant’s Current Report on Form 8-K as filed with the SEC on October 4, 2011. |
| (18) | Incorporated by reference to the registrant’s Current Report on Form 8-K as filed with the SEC on October 6, 2011. |
| (19) | Incorporated by reference to the registrant’s Form 10-K as filed with the SEC on August 27, 2012. |
| (20) | Incorporated by reference to the registrant’s Form 10-Q as filed with the SEC on May 3, 2013. |
| * | Indicates a contract with management or compensatory plan or arrangement. |
| † | Portions of this exhibit are subject to a request for confidential treatment and have been redacted and filed separately with the Securities and Exchange Commission. |
| # | Certain schedules have been omitted pursuant to Item 601(b)(2) of Regulation S-K. A copy of any omitted schedule will be furnished supplementally to the Securities and Exchange Commission upon request. |
53