Attached files
| file | filename |
|---|---|
| 8-K - 8-K - Daseke, Inc. | f8-k.htm |
Exhibit 99.1
| WE MOVE INDUSTRIES Q3 2018 Earnings Presentation November 6, 2018 0 |

| Presenters Scott Wheeler President and Director Don Daseke CEO and Chairman Bharat Mahajan CFO 1 |

| Important Disclaimers Forward-Looking Statements This presentation includes “forward-looking statements” within the meaning of the “safe harbor” provisions of the United States Private Securities Litigation Reform Act of 1995. Forward-looking statements may be identified by the use of words such as "forecast," "intend," "seek," "target," “anticipate,” “believe,” “expect,” “estimate,” “plan,” “outlook,” and “project” and other similar expressions that predict or indicate future events or trends or that are not statements of historical matters. Projected financial information, including our guidance outlook, are forward-looking statements. Forward-looking statements, including those with respect to revenues, earnings, performance, strategies, prospects and other aspects of the business of Daseke, are based on current expectations that are subject to risks and uncertainties.A number of factors could cause actual results or outcomes to differ materially from those indicated by such forward-looking statements. These factors include, but are not limited to, general economic and business risks (such as downturns in customers’ business cycles and disruptions in capital and credit markets), driver shortages and increases in driver compensation or owner-operator contracted rates, loss of senior management or key operating personnel, Daseke’s ability to recognize the anticipated benefits of recent acquisitions, Daseke’s ability to identify and execute future acquisitions successfully, seasonality and the impact of weather and other catastrophic events, fluctuations in the price or availability of diesel fuel, increased prices for, or decreases in the availability of, new revenue equipment and decreases in the value of used revenue equipment, Daseke’s ability to generate sufficient cash to service all of its indebtedness, restrictions in Daseke’s existing and future debt agreements, increases in interest rates, changes in existing laws or regulations, including environmental and worker health safety laws and regulations and those relating to tax rates or taxes in general, the impact of governmental regulations and other governmental actions related to Daseke and its operations, litigation and governmental proceedings, and insurance and claims expenses. For additional information regarding known material factors that could cause actual results to differ from those expressed in forward- looking statements, please see Daseke’s filings with the Securities and Exchange Commission, available at www.sec.gov, including Daseke’s Current Report on Form 10-K, filed with the SEC on March 16, 2018, particularly the section “Risk Factors”. You are cautioned not to place undue reliance upon any forward-looking statements, which speak only as of the date made. Daseke undertakes no commitment to update or revise the forward-looking statements, whether as a result of new information, future events or otherwise. Acquisitions Daseke has a long history of, and intends to continue, acquiring strategic and complementary flatbed and specialized trucking companies. Negotiations and discussions with potential target companies are an integral part of the Company’s operations. These negotiations and discussions can be in varying stages from infancy to very mature. Therefore, investors in Daseke’s stock should assume the Company is always evaluating, negotiating and performing diligence on potential acquisitions. Non-GAAP Financial Measures This presentation includes non-GAAP financial measures for the Company and its operating segments, including Adjusted EBITDA, Acquisition-Adjusted Revenue, Acquisition-Adjusted EBITDA, Adjusted EBITDA Margin and Adjusted EBITDA Margin (Excluding Acquisitions). You can find the reconciliations of these measures to the nearest comparable GAAP measure elsewhere in the Appendix of this presentation. Daseke defines Adjusted EBITDA as net income (loss) plus (i) depreciation and amortization, (ii) interest expense, including other fees and charges associated with indebtedness, net of interest income, (iii) income taxes, (iv) acquisition-related transaction expenses (including due diligence costs, legal, accounting and other advisory fees and costs, retention and severance payments and financing fees and expenses), (v) stock-based compensation expense, (vi) non-cash impairments, (vii) losses (gains) on sales of defective revenue equipment out of the normal replacement cycle, (viii) impairments related to defective revenue equipment sold out of the normal replacement cycle, (ix) withdrawn initial public offering-related expenses, and (x) expenses related to the business combination that was consummated in February 2017 and related transactions. Daseke’s board of directors and executive management team use Adjusted EBITDA as a key measure of its performance and for business planning. Adjusted EBITDA assists them in comparing Daseke’s operating performance over various reporting periods on a consistent basis because it removes from Daseke’s operating results the impact of items that, in their opinion, do not reflect Daseke’s core operating performance. Adjusted EBITDA also allows Daseke to more effectively evaluate its operating performance by allowing it to compare its results of operations against its peers without regard to its or its peers’ financing method or capital structure. Daseke defines Excluded Acquisition as all acquisitions in 2017, excluding (A) all acquisitions after August 31,2017; however, including (B) Belmont and Kelsey Trail. Belmont and Kelsey Trail are included due to their operational and financial integration into SPD and Big Freight, respectively. Acquisition-Adjusted EBITDA and Acquisition-Adjusted Revenue give effect to all Daseke’s acquisitions completed in 2017 and 2018 (excluding the Kelsey Trail acquisition) as though those acquisitions were completed on the first date of the applicable measurement period. These ‘‘as if’’ estimates of potential operating results were not prepared in accordance with GAAP or the pro forma rules of Regulation S-X promulgated by the SEC. The presentation of Acquisition-Adjusted Revenue and Acquisition-Adjusted EBITDA should not be construed as an inference that Daseke’s future results will be consistent with these ‘‘as if’’ estimates and are presented for informational purposes only. To derive Acquisition-Adjusted EBITDA, we add to our Adjusted EBITDA (i) the aggregate Adjusted EBITDA of the companies acquired in 2017 and in 2018 (excluding the Kelsey Trail acquisition) for the period beginning on the first day of the applicable measurement period and ending on the date of our acquisition (or if earlier, the last date of the applicable measurement period), based on the acquired company’s unaudited internal financial statements or publicly available financial statements for the period prior to the acquisition date, (ii) charges and expenses attributable to the undertaking or implementation of cost savings, optimization or restructuring efforts and (iii) the amount of any expected cost savings, operating expense reductions and synergies (net of actual amounts realized) that are reasonably identifiable and factually supportable. See the Appendix for more information and reconciliations. To derive Acquisition-Adjusted Revenue, we add to our revenue the aggregate revenue of the companies acquired in 2017 and in 2018 (excluding Kelsey Trail acquisition) for the period beginning on the first day of the applicable measurement period and ending on the date of our acquisition (or if earlier, the last date of the applicable measurement period), based on the acquired company’s unaudited internal financial statements or publicly available financial statements for the period prior to the acquisition date. See the Appendix for more information and reconciliations. Please note that these non-GAAP measures are not substitutes for, or more meaningful than, net income (loss), cash flows from operating activities, operating income or any other measure prescribed by GAAP, and there are limitations to using non-GAAP measures. Certain items excluded from non-GAAP measures are significant components in understanding and assessing a company’s financial performance, such as a company’s cost of capital, tax structure and the historic costs of depreciable assets. In particular, Adjusted EBITDA should not be considered measures of the income generated by Daseke’s business or discretionary cash available to it to invest in the growth of its business. Other companies in Daseke’s industry may define these non-GAAP measures differently than Daseke does, and as a result, it may be difficult to use these non-GAAP measures to compare the performance of those companies to Daseke’s performance. To compensate for these limitations, Daseke’s board and management do not consider these non-GAAP measures in isolation or as an alternative to financial measures determined in accordance with GAAP and instead rely primarily on Daseke’s GAAP results and use non-GAAP measures supplementally. See Appendix for most directly comparable GAAP measures. Industry and Market Data This presentation includes market data and other statistical information from third party sources, including independent industry publications, government publications and other published independent sources. Although Daseke believes these third party sources are reliable as of their respective dates, Daseke has not independently verified the accuracy or completeness of this information. 2 |
| Third Quarter 2018 Financial Summary & Operational Highlights Detailed Review of Third Quarter 2018 Financial Results Executing on 2018 Strategic Priorities 3 Today’s Agenda |
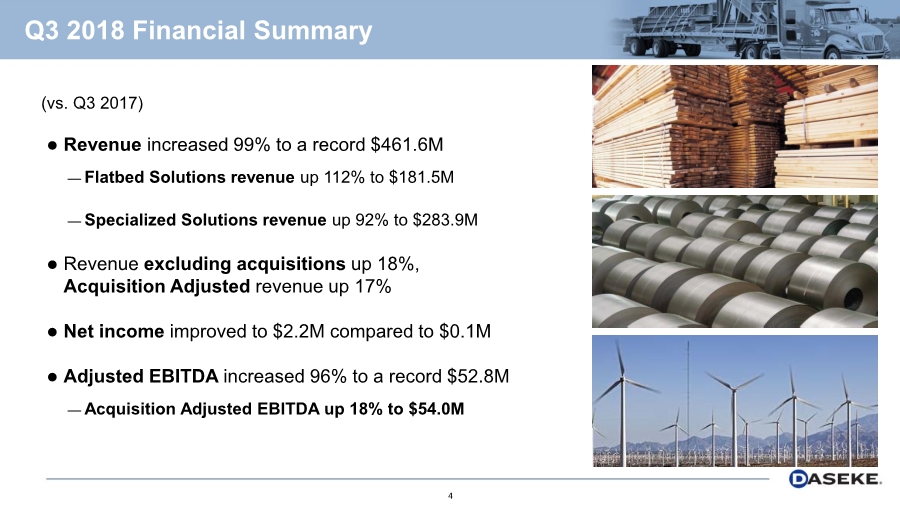
| (vs. Q3 2017) Revenue increased 99% to a record $461.6M — Flatbed Solutions revenue up 112% to $181.5M — Specialized Solutions revenue up 92% to $283.9M Revenue excluding acquisitions up 18%, Acquisition Adjusted revenue up 17% Net income improved to $2.2M compared to $0.1M Adjusted EBITDA increased 96% to a record $52.8M — Acquisition Adjusted EBITDA up 18% to $54.0M 4 Q3 2018 Financial Summary |
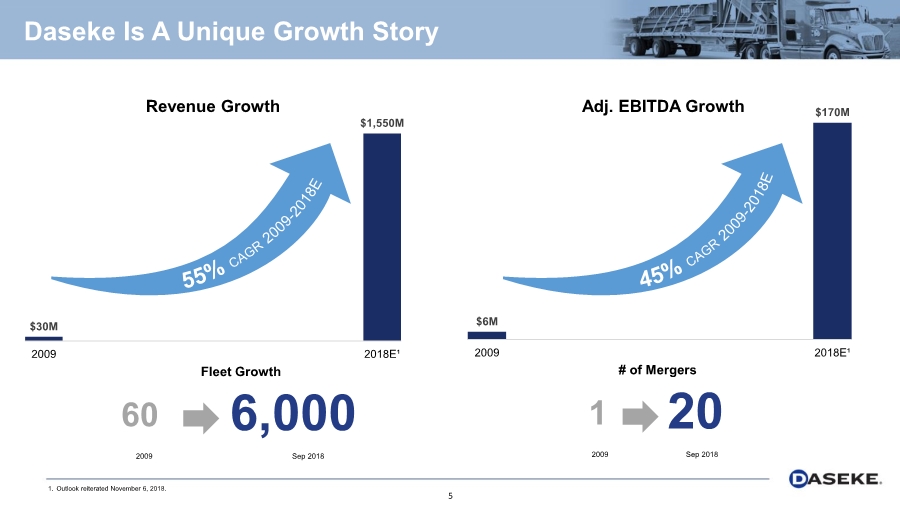
| Daseke Is A Unique Growth Story 1. Outlook reiterated November 6, 2018. $30M $1,550M 2009 2018E¹ Revenue Growth $6M $170M 2009 2018E¹ Adj. EBITDA Growth Fleet Growth 2009 Sep 2018 # of Mergers 6,00060 2009 Sep 2018 201 5 |
| Detailed Review of Third Quarter 2018 Financial Results 6 |
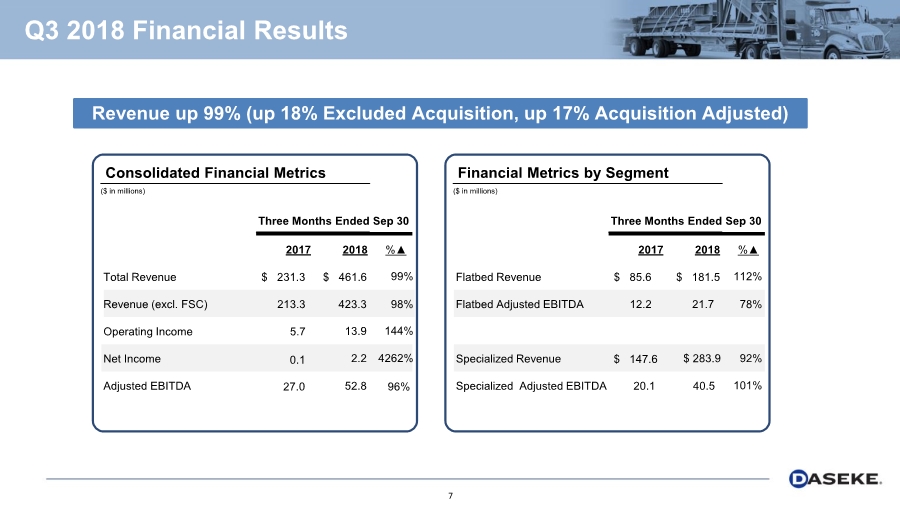
| ($ in millions) Consolidated Financial Metrics 2017 2018 Total Revenue $ 231.3 $ 461.6 Revenue (excl. FSC) 213.3 423.3 Operating Income 5.7 13.9 Net Income 0.1 2.2 Adjusted EBITDA 27.0 52.8 Three Months Ended Sep 30 Revenue up 99% (up 18% Excluded Acquisition, up 17% Acquisition Adjusted) %▲ 99% ($ in millions) Financial Metrics by Segment 2017 2018 Flatbed Revenue $ 85.6 $ 181.5 Flatbed Adjusted EBITDA 12.2 21.7 Specialized Revenue Specialized Adjusted EBITDA 20.1 40.5 Three Months Ended Sep 30 %▲ 112% 78% $ 147.6 $ 283.9 92% 101% 98% 144% 96% 4262% 7 Q3 2018 Financial Results |
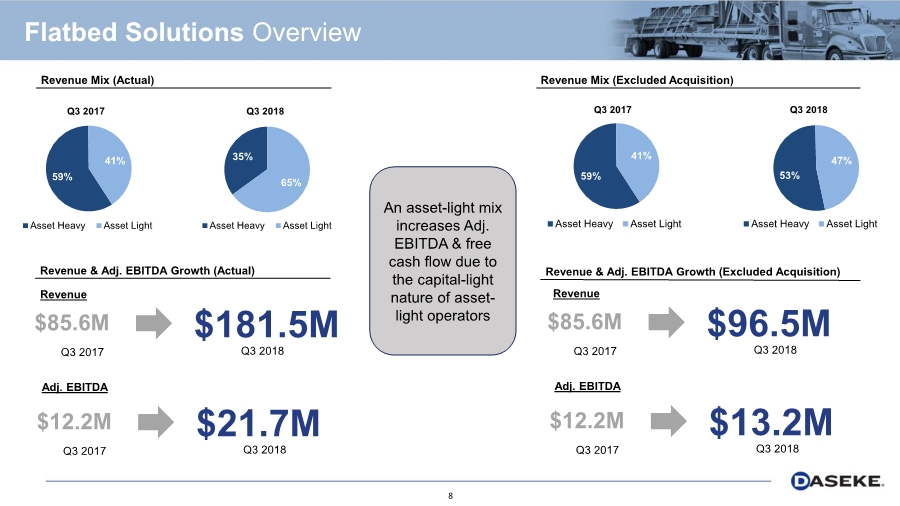
| Revenue Mix (Excluded Acquisition) 8 59% 41% Q3 2017 Asset Heavy Asset Light 35% 65% Q3 2018 Asset Heavy Asset Light 59% 41% Q3 2017 Asset Heavy Asset Light 53% 47% Q3 2018 Asset Heavy Asset Light Revenue Mix (Actual) Flatbed Solutions Overview An asset-light mix increases Adj. EBITDA & free cash flow due to the capital-light nature of asset- light operators Adj. EBITDA $181.5M$85.6M Revenue & Adj. EBITDA Growth (Actual) Revenue Q3 2017 Q3 2018 $21.7M$12.2M Q3 2017 Q3 2018 Revenue & Adj. EBITDA Growth (Excluded Acquisition) Adj. EBITDA $96.5M$85.6M Revenue Q3 2017 Q3 2018 $13.2M$12.2M Q3 2017 Q3 2018 |
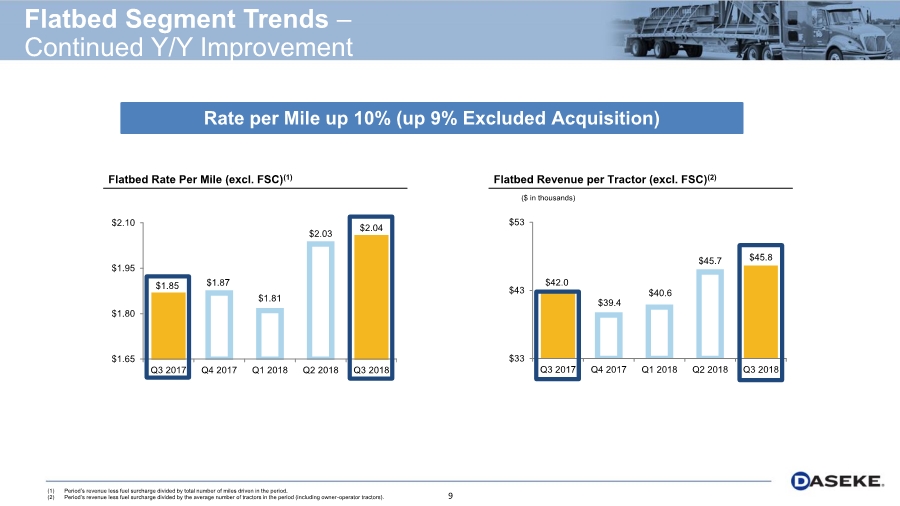
| 9 $42.0 $39.4 $40.6 $45.7 $45.8 Q3 2017 Q4 2017 Q1 2018 Q2 2018 Q3 2018 $33 $43 $53 $1.85 $1.87 $1.81 $2.03 $2.04 Q3 2017 Q4 2017 Q1 2018 Q2 2018 Q3 2018 $1.65 $1.80 $1.95 $2.10 Flatbed Revenue per Tractor (excl. FSC)(2)Flatbed Rate Per Mile (excl. FSC)(1) ($ in thousands) Rate per Mile up 10% (up 9% Excluded Acquisition) (1) Period’s revenue less fuel surcharge divided by total number of miles driven in the period. (2) Period’s revenue less fuel surcharge divided by the average number of tractors in the period (including owner-operator tractors). Flatbed Segment Trends – Continued Y/Y Improvement |
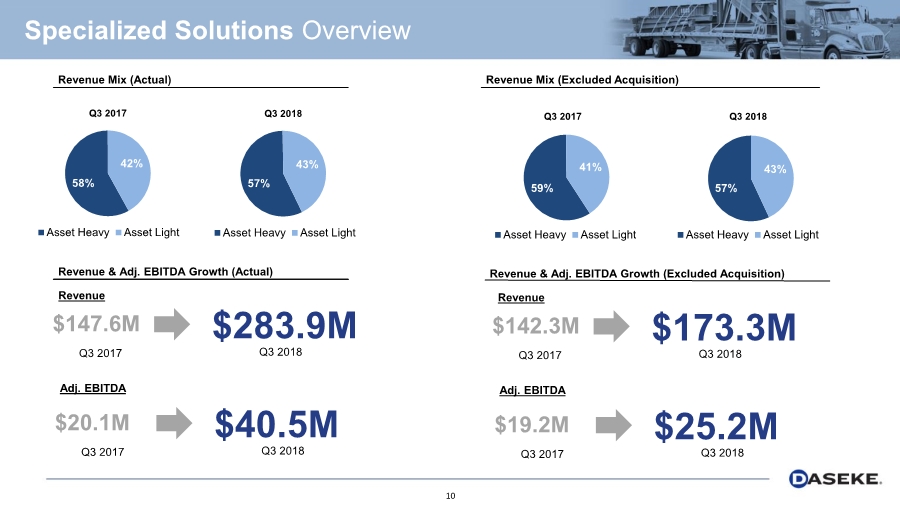
| Revenue Mix (Excluded Acquisition) 58% 42% Q3 2017 Asset Heavy Asset Light 57% 43% Q3 2018 Asset Heavy Asset Light 59% 41% Q3 2017 Asset Heavy Asset Light 57% 43% Q3 2018 Asset Heavy Asset Light 10 Revenue Mix (Actual) Specialized Solutions Overview Revenue & Adj. EBITDA Growth (Actual) Adj. EBITDA $283.9M$147.6M Revenue Q3 2017 Q3 2018 $40.5M$20.1M Q3 2017 Q3 2018 Revenue & Adj. EBITDA Growth (Excluded Acquisition) Adj. EBITDA $173.3M$142.3M Revenue Q3 2017 Q3 2018 $25.2M$19.2M Q3 2017 Q3 2018 |
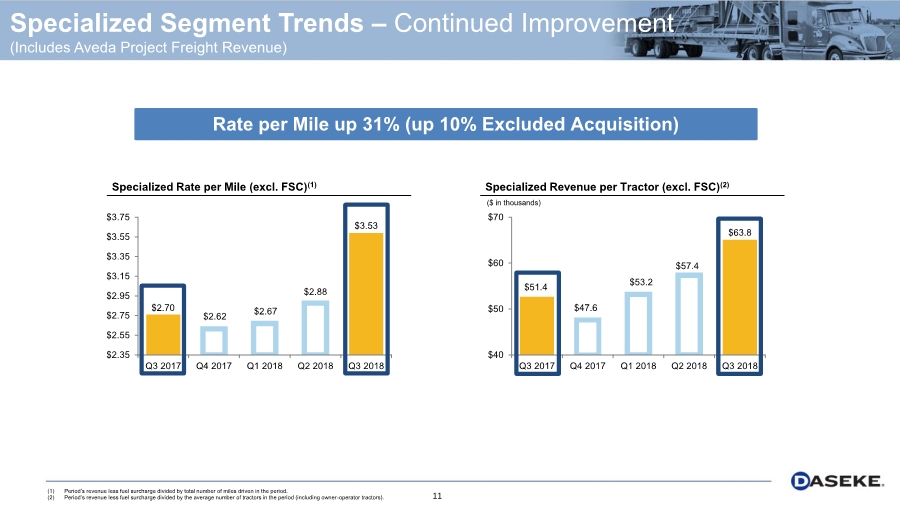
| 11 Specialized Segment Trends – Continued Improvement (Includes Aveda Project Freight Revenue) $2.70 $2.62 $2.67 $2.88 $3.53 Q3 2017 Q4 2017 Q1 2018 Q2 2018 Q3 2018 $2.35 $2.55 $2.75 $2.95 $3.15 $3.35 $3.55 $3.75 Specialized Rate per Mile (excl. FSC)(1) $51.4 $47.6 $53.2 $57.4 $63.8 Q3 2017 Q4 2017 Q1 2018 Q2 2018 Q3 2018 $40 $50 $60 $70 Specialized Revenue per Tractor (excl. FSC)(2) ($ in thousands) Rate per Mile up 31% (up 10% Excluded Acquisition) (1) Period’s revenue less fuel surcharge divided by total number of miles driven in the period. (2) Period’s revenue less fuel surcharge divided by the average number of tractors in the period (including owner-operator tractors). |
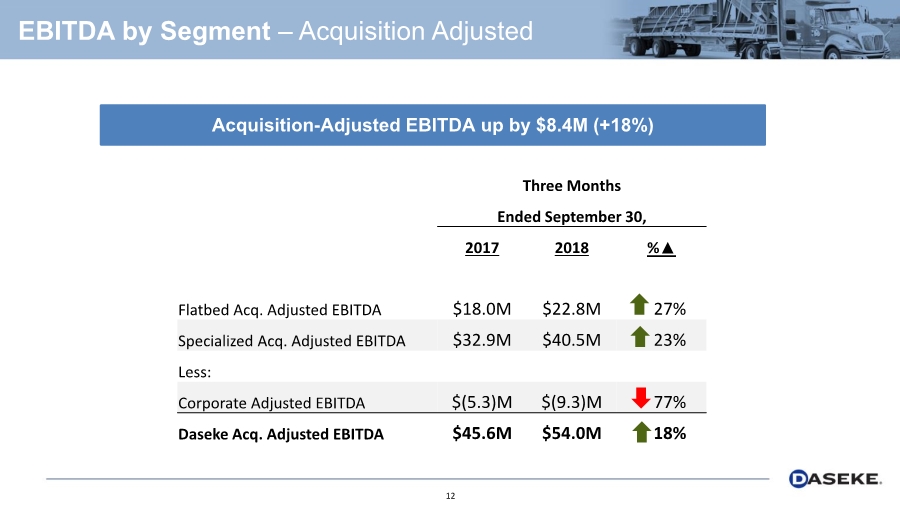
| EBITDA by Segment – Acquisition Adjusted Three Months Ended September 30, 2017 2018 %▲ Flatbed Acq. Adjusted EBITDA $18.0M $22.8M 27% Specialized Acq. Adjusted EBITDA $32.9M $40.5M 23% Less: Corporate Adjusted EBITDA $(5.3)M $(9.3)M 77% Daseke Acq. Adjusted EBITDA $45.6M $54.0M 18% Acquisition-Adjusted EBITDA up by $8.4M (+18%) 12 |
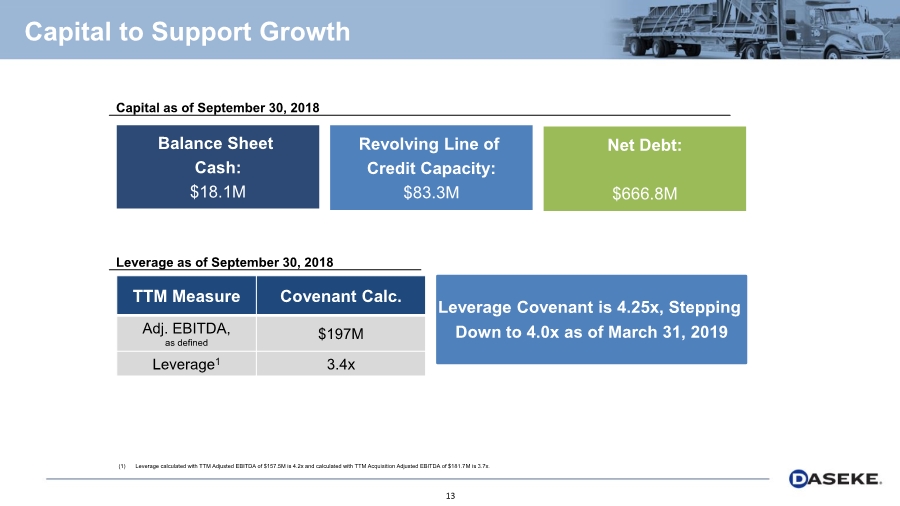
| Balance Sheet Cash: $18.1M Revolving Line of Credit Capacity: $83.3M Net Debt: $666.8M Capital as of September 30, 2018 TTM Measure Covenant Calc. Adj. EBITDA, as defined $197M Leverage1 3.4x Leverage as of September 30, 2018 (1) Leverage calculated with TTM Adjusted EBITDA of $157.5M is 4.2x and calculated with TTM Acquisition Adjusted EBITDA of $181.7M is 3.7x. Leverage Covenant is 4.25x, Stepping Down to 4.0x as of March 31, 2019 13 Capital to Support Growth |
| Executing on 2018 Strategic Priorities 14 |
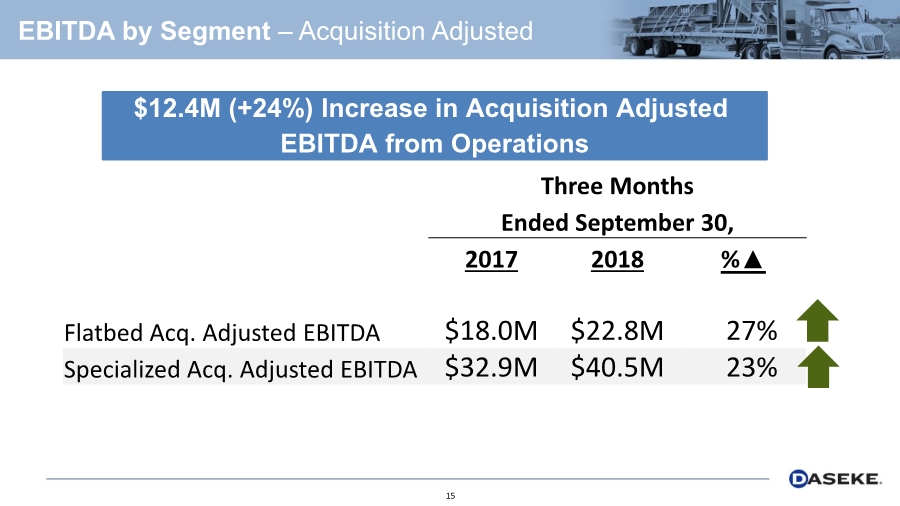
| EBITDA by Segment – Acquisition Adjusted Three Months Ended September 30, 2017 2018 %▲ Flatbed Acq. Adjusted EBITDA $18.0M $22.8M 27% Specialized Acq. Adjusted EBITDA $32.9M $40.5M 23% $12.4M (+24%) Increase in Acquisition Adjusted EBITDA from Operations 15 |
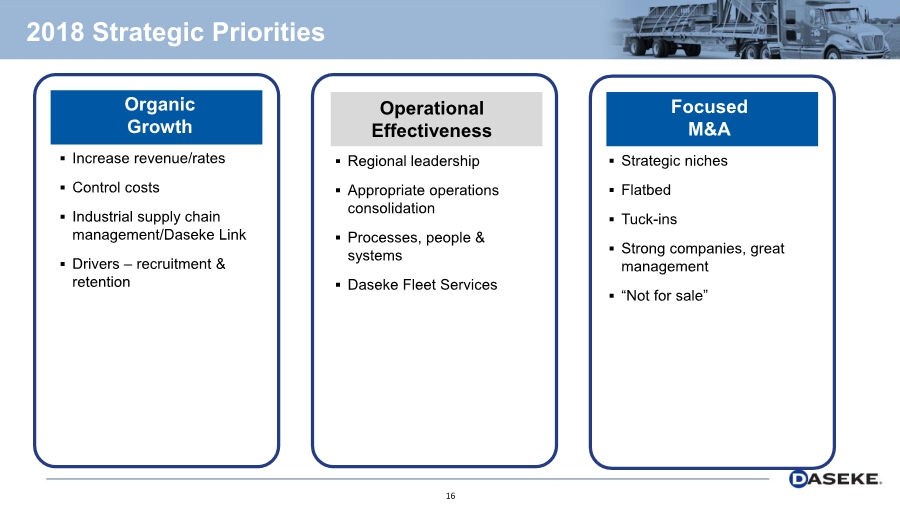
| 2018 Strategic Priorities 16 Focused M&A ▪ Strategic niches ▪ Flatbed ▪ Tuck-ins ▪ Strong companies, great management ▪ “Not for sale” Operational Effectiveness ▪ Regional leadership ▪ Appropriate operations consolidation ▪ Processes, people & systems ▪ Daseke Fleet Services Organic Growth ▪ Increase revenue/rates ▪ Control costs ▪ Industrial supply chain management/Daseke Link ▪ Drivers – recruitment & retention Operational Effectiveness |
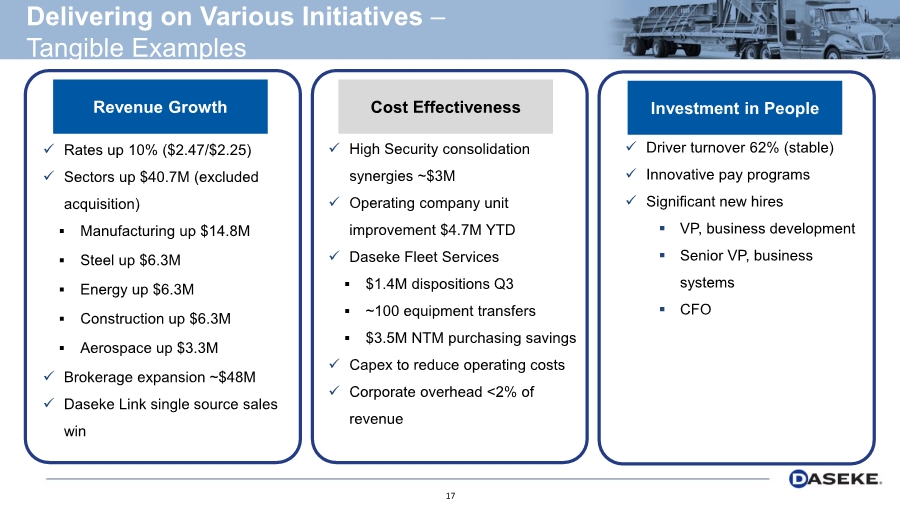
| Delivering on Various Initiatives – Tangible Examples 17 Revenue Growth ✓ High Security consolidation synergies ~$3M ✓ Operating company unit improvement $4.7M YTD ✓ Daseke Fleet Services ▪ $1.4M dispositions Q3 ▪ ~100 equipment transfers ▪ $3.5M NTM purchasing savings ✓ Capex to reduce operating costs ✓ Corporate overhead <2% of revenue Cost Effectiveness ✓ Rates up 10% ($2.47/$2.25) ✓ Sectors up $40.7M (excluded acquisition) ▪ Manufacturing up $14.8M ▪ Steel up $6.3M ▪ Energy up $6.3M ▪ Construction up $6.3M ▪ Aerospace up $3.3M ✓ Brokerage expansion ~$48M ✓ Daseke Link single source sales win Investment in People ✓ Driver turnover 62% (stable) ✓ Innovative pay programs ✓ Significant new hires ▪ VP, business development ▪ Senior VP, business systems ▪ CFO |
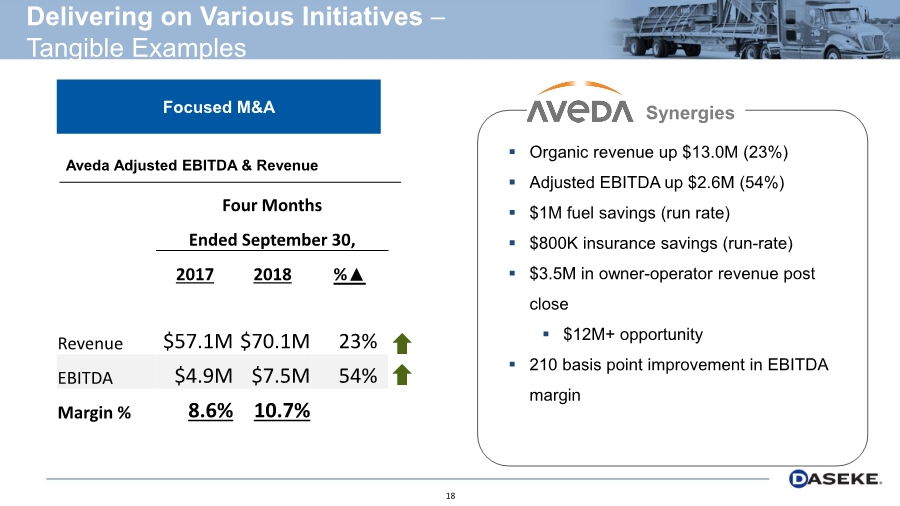
| 18 Four Months Ended September 30, 2017 2018 %▲ Revenue $57.1M $70.1M 23% EBITDA $4.9M $7.5M 54% Margin % 8.6% 10.7% Aveda Adjusted EBITDA & Revenue ▪ Organic revenue up $13.0M (23%) ▪ Adjusted EBITDA up $2.6M (54%) ▪ $1M fuel savings (run rate) ▪ $800K insurance savings (run-rate) ▪ $3.5M in owner-operator revenue post close ▪ $12M+ opportunity ▪ 210 basis point improvement in EBITDA margin SynergiesFocused M&A Delivering on Various Initiatives – Tangible Examples |
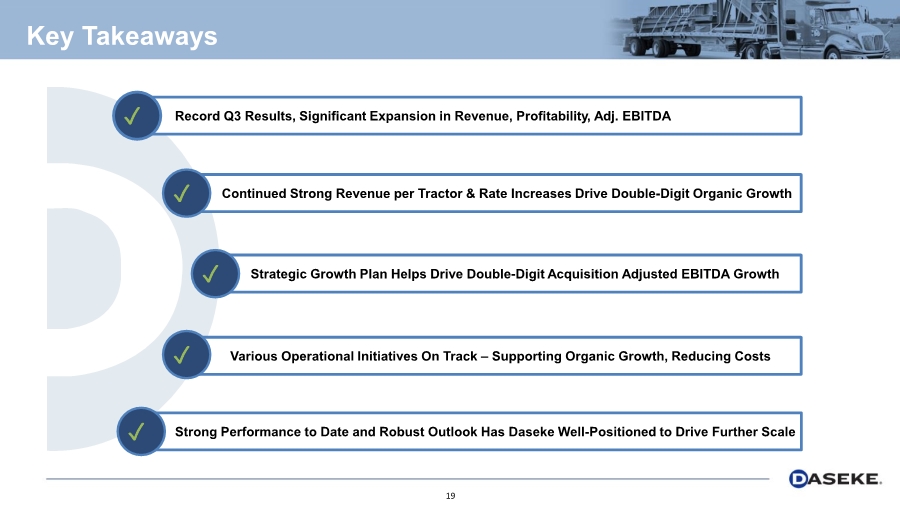
| Key Takeaways 19 Record Q3 Results, Significant Expansion in Revenue, Profitability, Adj. EBITDA✓ Continued Strong Revenue per Tractor & Rate Increases Drive Double-Digit Organic Growth✓ Strategic Growth Plan Helps Drive Double-Digit Acquisition Adjusted EBITDA Growth✓ Various Operational Initiatives On Track – Supporting Organic Growth, Reducing Costs ✓ Strong Performance to Date and Robust Outlook Has Daseke Well-Positioned to Drive Further Scale ✓ |
| 20 Questions |

| Appendix 21 |
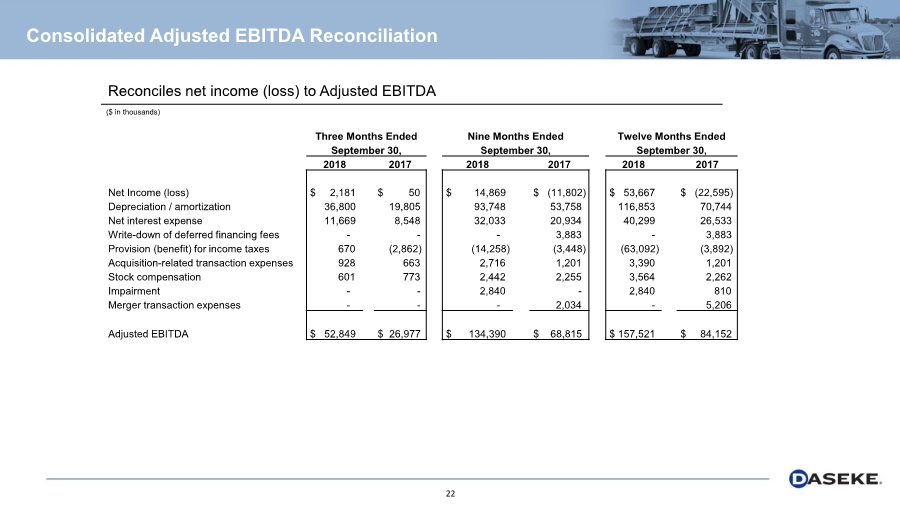
| Consolidated Adjusted EBITDA Reconciliation ($ in thousands) 22 Reconciles net income (loss) to Adjusted EBITDA Three Months Ended Nine Months Ended Twelve Months Ended September 30, September 30, September 30, 2018 2017 2018 2017 2018 2017 Net Income (loss) $ 2,181 $ 50 $ 14,869 $ (11,802) $ 53,667 $ (22,595) Depreciation / amortization 36,800 19,805 93,748 53,758 116,853 70,744 Net interest expense 11,669 8,548 32,033 20,934 40,299 26,533 Write-down of deferred financing fees --- 3,883 - 3,883 Provision (benefit) for income taxes 670 (2,862) (14,258) (3,448) (63,092) (3,892) Acquisition-related transaction expenses 928 663 2,716 1,201 3,390 1,201 Stock compensation 601 773 2,442 2,255 3,564 2,262 Impairment -- 2,840 - 2,840 810 Merger transaction expenses --- 2,034 - 5,206 Adjusted EBITDA $ 52,849 $ 26,977 $ 134,390 $ 68,815 $ 157,521 $ 84,152 |
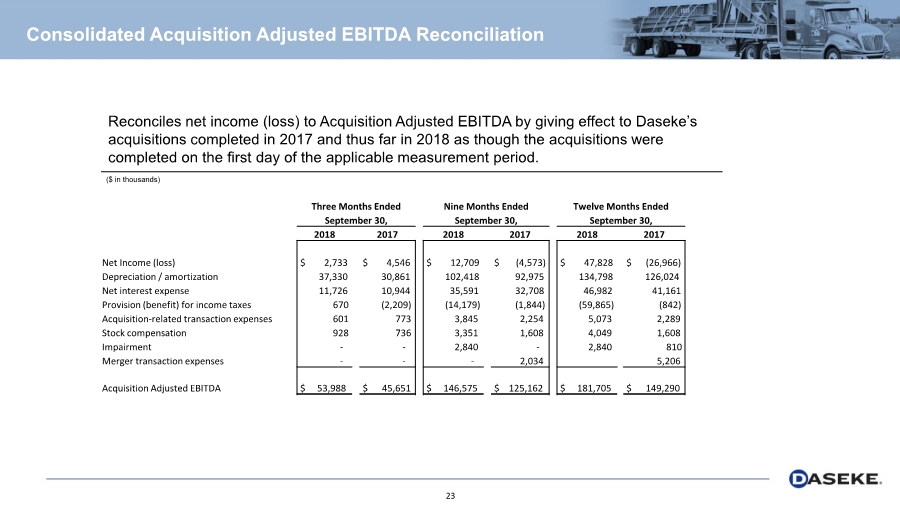
| Consolidated Acquisition Adjusted EBITDA Reconciliation ($ in thousands) 23 Reconciles net income (loss) to Acquisition Adjusted EBITDA by giving effect to Daseke’s acquisitions completed in 2017 and thus far in 2018 as though the acquisitions were completed on the first day of the applicable measurement period. Three Months Ended Nine Months Ended Twelve Months Ended September 30, September 30, September 30, 2018 2017 2018 2017 2018 2017 Net Income (loss) $ 2,733 $ 4,546 $ 12,709 $ (4,573) $ 47,828 $ (26,966) Depreciation / amortization 37,330 30,861 102,418 92,975 134,798 126,024 Net interest expense 11,726 10,944 35,591 32,708 46,982 41,161 Provision (benefit) for income taxes 670 (2,209) (14,179) (1,844) (59,865) (842) Acquisition-related transaction expenses 601 773 3,845 2,254 5,073 2,289 Stock compensation 928 736 3,351 1,608 4,049 1,608 Impairment -- 2,840 - 2,840 810 Merger transaction expenses --- 2,034 5,206 Acquisition Adjusted EBITDA $ 53,988 $ 45,651 $ 146,575 $ 125,162 $ 181,705 $ 149,290 |
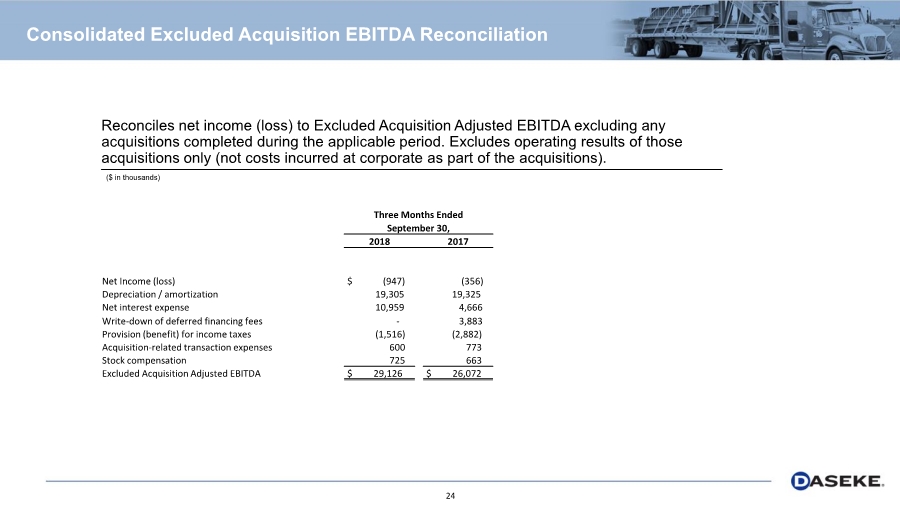
| Consolidated Excluded Acquisition EBITDA Reconciliation ($ in thousands) 24 Reconciles net income (loss) to Excluded Acquisition Adjusted EBITDA excluding any acquisitions completed during the applicable period. Excludes operating results of those acquisitions only (not costs incurred at corporate as part of the acquisitions). Three Months Ended September 30, 2018 2017 Net Income (loss) $ (947) (356) Depreciation / amortization 19,305 19,325 Net interest expense 10,959 4,666 Write-down of deferred financing fees - 3,883 Provision (benefit) for income taxes (1,516) (2,882) Acquisition-related transaction expenses 600 773 Stock compensation 725 663 Excluded Acquisition Adjusted EBITDA $ 29,126 $ 26,072 |
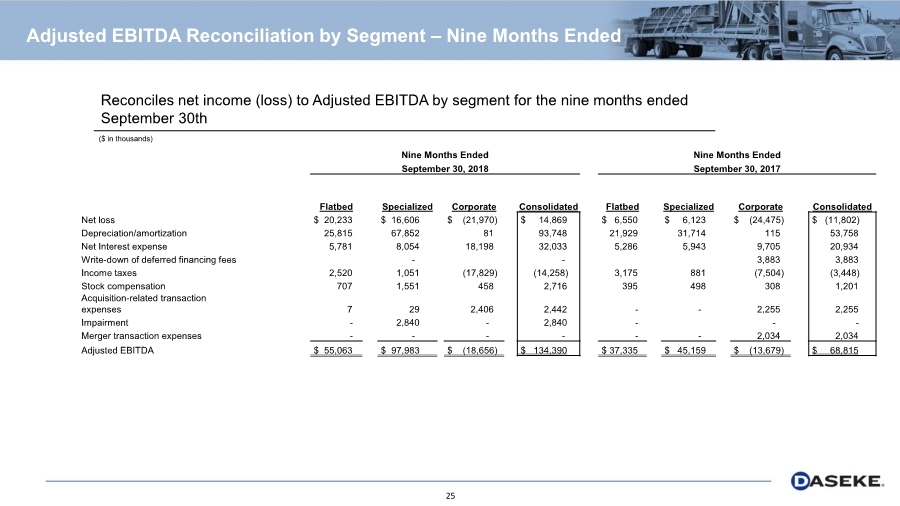
| Adjusted EBITDA Reconciliation by Segment – Nine Months Ended ($ in thousands) 25 Reconciles net income (loss) to Adjusted EBITDA by segment for the nine months ended September 30th Nine Months Ended Nine Months Ended September 30, 2018 September 30, 2017 Flatbed Specialized Corporate Consolidated Flatbed Specialized Corporate Consolidated Net loss $ 20,233 $ 16,606 $ (21,970) $ 14,869 $ 6,550 $ 6,123 $ (24,475) $ (11,802) Depreciation/amortization 25,815 67,852 81 93,748 21,929 31,714 115 53,758 Net Interest expense 5,781 8,054 18,198 32,033 5,286 5,943 9,705 20,934 Write-down of deferred financing fees -- 3,883 3,883 Income taxes 2,520 1,051 (17,829) (14,258) 3,175 881 (7,504) (3,448) Stock compensation 707 1,551 458 2,716 395 498 308 1,201 Acquisition-related transaction expenses 7 29 2,406 2,442 -- 2,255 2,255 Impairment - 2,840 - 2,840 --- Merger transaction expenses ------ 2,034 2,034 Adjusted EBITDA $ 55,063 $ 97,983 $ (18,656) $ 134,390 $ 37,335 $ 45,159 $ (13,679) $ 68,815 |
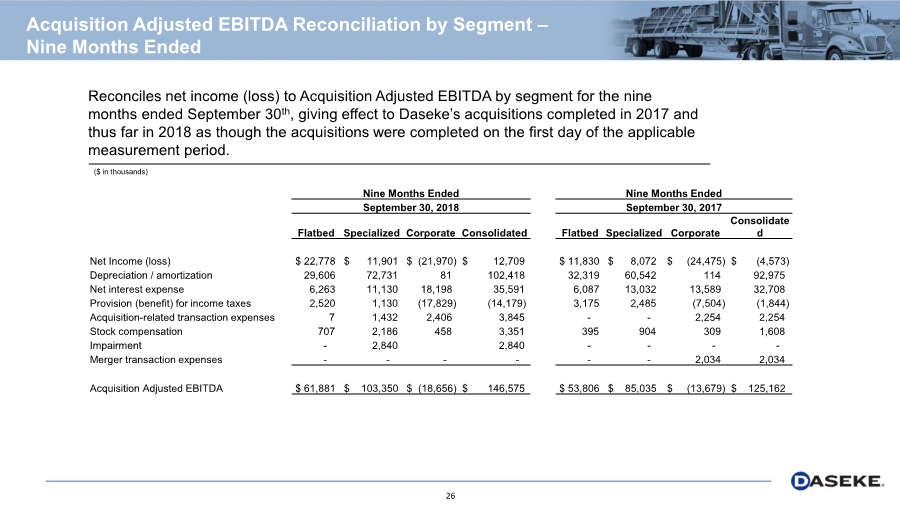
| Acquisition Adjusted EBITDA Reconciliation by Segment – Nine Months Ended ($ in thousands) 26 Reconciles net income (loss) to Acquisition Adjusted EBITDA by segment for the nine months ended September 30th, giving effect to Daseke’s acquisitions completed in 2017 and thus far in 2018 as though the acquisitions were completed on the first day of the applicable measurement period. Nine Months Ended Nine Months Ended September 30, 2018 September 30, 2017 Flatbed Specialized Corporate Consolidated Flatbed Specialized Corporate Consolidate d Net Income (loss) $ 22,778 $ 11,901 $ (21,970) $ 12,709 $ 11,830 $ 8,072 $ (24,475) $ (4,573) Depreciation / amortization 29,606 72,731 81 102,418 32,319 60,542 114 92,975 Net interest expense 6,263 11,130 18,198 35,591 6,087 13,032 13,589 32,708 Provision (benefit) for income taxes 2,520 1,130 (17,829) (14,179) 3,175 2,485 (7,504) (1,844) Acquisition-related transaction expenses 7 1,432 2,406 3,845 -- 2,254 2,254 Stock compensation 707 2,186 458 3,351 395 904 309 1,608 Impairment - 2,840 2,840 ---- Merger transaction expenses ------ 2,034 2,034 Acquisition Adjusted EBITDA $ 61,881 $ 103,350 $ (18,656) $ 146,575 $ 53,806 $ 85,035 $ (13,679) $ 125,162 |
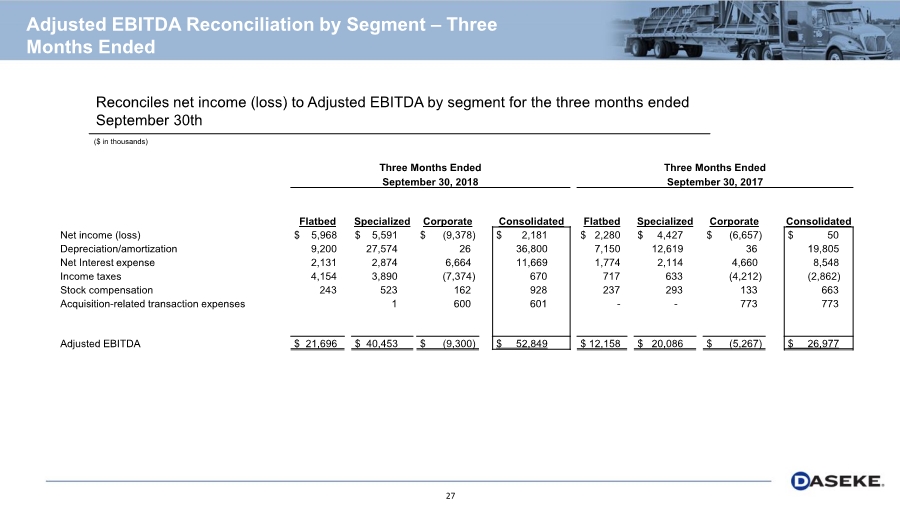
| Adjusted EBITDA Reconciliation by Segment – Three Months Ended ($ in thousands) 27 Reconciles net income (loss) to Adjusted EBITDA by segment for the three months ended September 30th Three Months Ended Three Months Ended September 30, 2018 September 30, 2017 Flatbed Specialized Corporate Consolidated Flatbed Specialized Corporate Consolidated Net income (loss) $ 5,968 $ 5,591 $ (9,378) $ 2,181 $ 2,280 $ 4,427 $ (6,657) $ 50 Depreciation/amortization 9,200 27,574 26 36,800 7,150 12,619 36 19,805 Net Interest expense 2,131 2,874 6,664 11,669 1,774 2,114 4,660 8,548 Income taxes 4,154 3,890 (7,374) 670 717 633 (4,212) (2,862) Stock compensation 243 523 162 928 237 293 133 663 Acquisition-related transaction expenses 1 600 601 -- 773 773 Adjusted EBITDA $ 21,696 $ 40,453 $ (9,300) $ 52,849 $ 12,158 $ 20,086 $ (5,267) $ 26,977 |
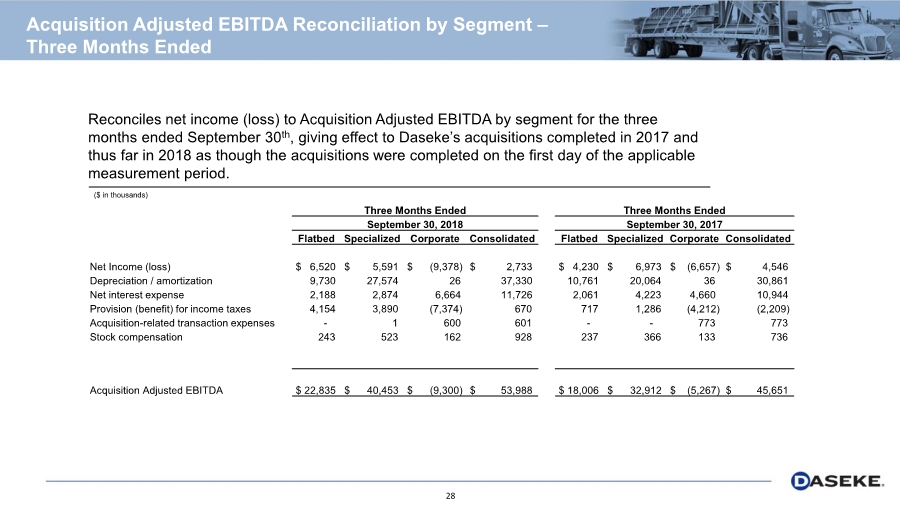
| Acquisition Adjusted EBITDA Reconciliation by Segment – Three Months Ended ($ in thousands) 28 Reconciles net income (loss) to Acquisition Adjusted EBITDA by segment for the three months ended September 30th, giving effect to Daseke’s acquisitions completed in 2017 and thus far in 2018 as though the acquisitions were completed on the first day of the applicable measurement period. Three Months Ended Three Months Ended September 30, 2018 September 30, 2017 Flatbed Specialized Corporate Consolidated Flatbed Specialized Corporate Consolidated Net Income (loss) $ 6,520 $ 5,591 $ (9,378) $ 2,733 $ 4,230 $ 6,973 $ (6,657) $ 4,546 Depreciation / amortization 9,730 27,574 26 37,330 10,761 20,064 36 30,861 Net interest expense 2,188 2,874 6,664 11,726 2,061 4,223 4,660 10,944 Provision (benefit) for income taxes 4,154 3,890 (7,374) 670 717 1,286 (4,212) (2,209) Acquisition-related transaction expenses - 1 600 601 -- 773 773 Stock compensation 243 523 162 928 237 366 133 736 Acquisition Adjusted EBITDA $ 22,835 $ 40,453 $ (9,300) $ 53,988 $ 18,006 $ 32,912 $ (5,267) $ 45,651 |
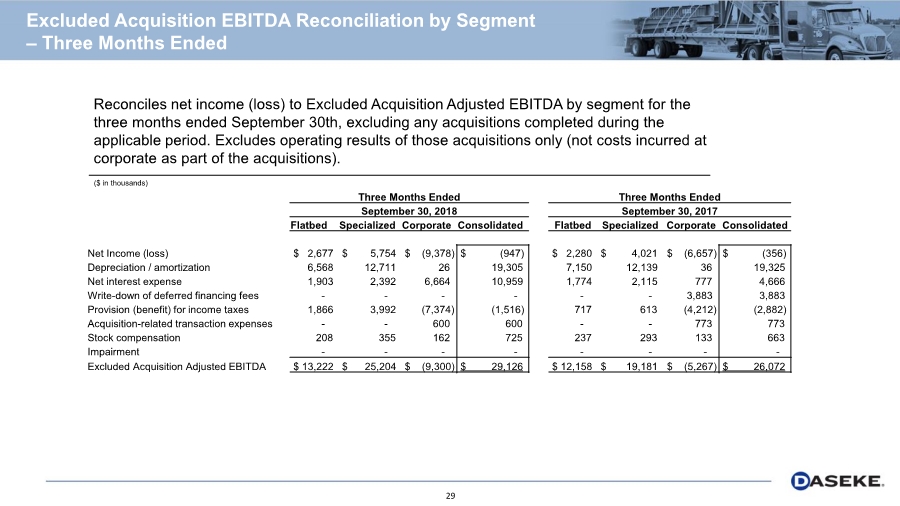
| Excluded Acquisition EBITDA Reconciliation by Segment – Three Months Ended ($ in thousands) 29 Reconciles net income (loss) to Excluded Acquisition Adjusted EBITDA by segment for the three months ended September 30th, excluding any acquisitions completed during the applicable period. Excludes operating results of those acquisitions only (not costs incurred at corporate as part of the acquisitions). Three Months Ended Three Months Ended September 30, 2018 September 30, 2017 Flatbed Specialized Corporate Consolidated Flatbed Specialized Corporate Consolidated Net Income (loss) $ 2,677 $ 5,754 $ (9,378) $ (947) $ 2,280 $ 4,021 $ (6,657) $ (356) Depreciation / amortization 6,568 12,711 26 19,305 7,150 12,139 36 19,325 Net interest expense 1,903 2,392 6,664 10,959 1,774 2,115 777 4,666 Write-down of deferred financing fees ------ 3,883 3,883 Provision (benefit) for income taxes 1,866 3,992 (7,374) (1,516) 717 613 (4,212) (2,882) Acquisition-related transaction expenses -- 600 600 -- 773 773 Stock compensation 208 355 162 725 237 293 133 663 Impairment -------- Excluded Acquisition Adjusted EBITDA $ 13,222 $ 25,204 $ (9,300) $ 29,126 $ 12,158 $ 19,181 $ (5,267) $ 26,072 |
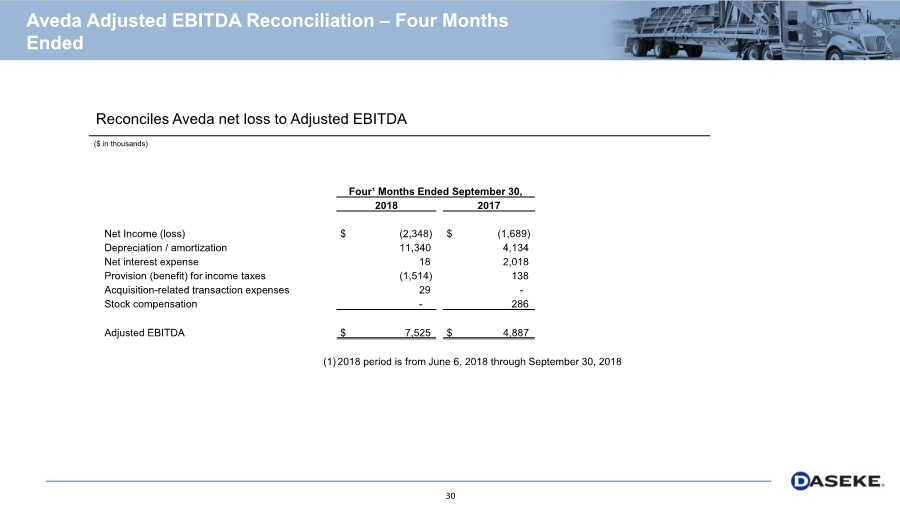
| Aveda Adjusted EBITDA Reconciliation – Four Months Ended ($ in thousands) 30 Reconciles Aveda net loss to Adjusted EBITDA Four¹ Months Ended September 30, 2018 2017 Net Income (loss) $ (2,348) $ (1,689) Depreciation / amortization 11,340 4,134 Net interest expense 18 2,018 Provision (benefit) for income taxes (1,514) 138 Acquisition-related transaction expenses 29 - Stock compensation - 286 Adjusted EBITDA $ 7,525 $ 4,887 (1)2018 period is from June 6, 2018 through September 30, 2018 |
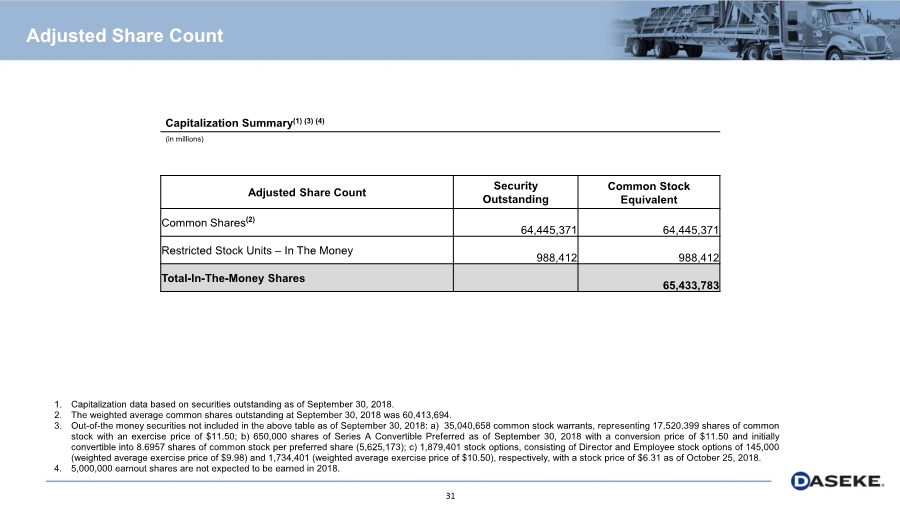
| 1. Capitalization data based on securities outstanding as of September 30, 2018. 2. The weighted average common shares outstanding at September 30, 2018 was 60,413,694. 3. Out-of-the money securities not included in the above table as of September 30, 2018: a) 35,040,658 common stock warrants, representing 17,520,399 shares of common stock with an exercise price of $11.50; b) 650,000 shares of Series A Convertible Preferred as of September 30, 2018 with a conversion price of $11.50 and initially convertible into 8.6957 shares of common stock per preferred share (5,625,173); c) 1,879,401 stock options, consisting of Director and Employee stock options of 145,000 (weighted average exercise price of $9.98) and 1,734,401 (weighted average exercise price of $10.50), respectively, with a stock price of $6.31 as of October 25, 2018. 4. 5,000,000 earnout shares are not expected to be earned in 2018. Capitalization Summary(1) (3) (4) (in millions) Adjusted Share Count Adjusted Share Count Security Outstanding Common Stock Equivalent Common Shares(2) 64,445,371 64,445,371 Restricted Stock Units – In The Money 988,412 988,412 Total-In-The-Money Shares 65,433,783 31 |