Attached files
| file | filename |
|---|---|
| 8-K - FORM 8-K - REG FD DISCLOSURE - CENTURY ALUMINUM CO | form8-kunnamed.htm |
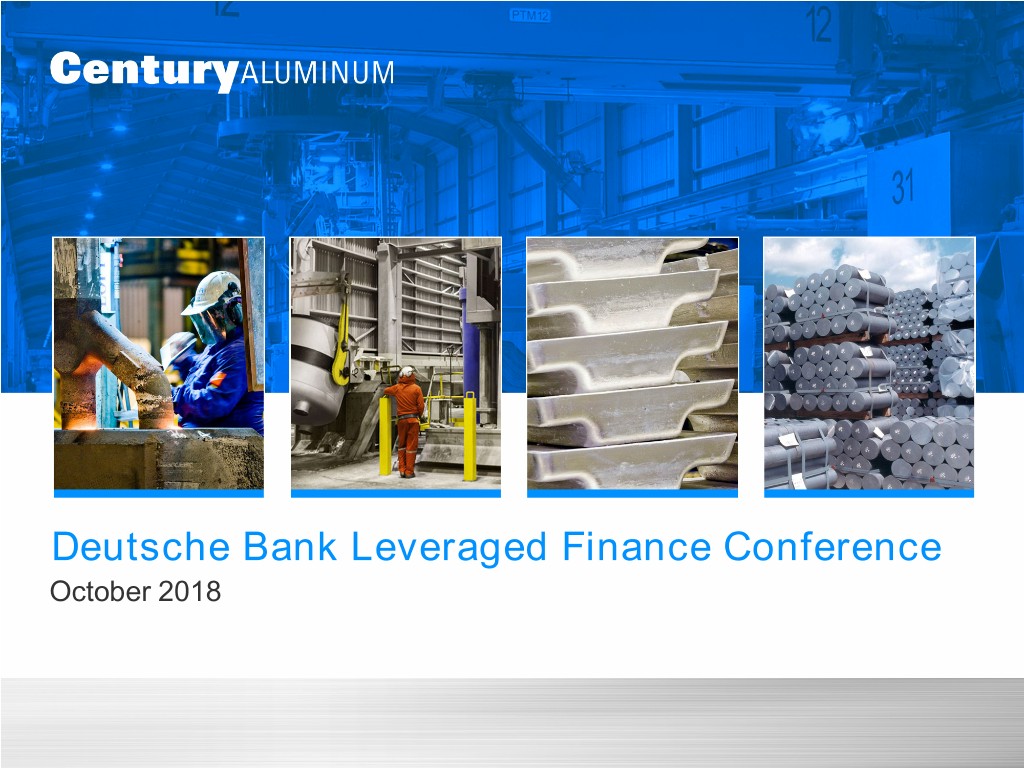
Deutsche Bank Leveraged Finance Conference October 2018
Cautionary Statement This presentation and comments made by Century Aluminum management on the quarterly conference call contain "forward-looking statements" within the meaning of the Private Securities Litigation Reform Act of 1995, Section 27A of the Securities Act of 1933 and Section 21E of the Securities Exchange Act of 1934. Forward-looking statements are statements about future events and are based on our current expectations. These forward-looking statements may be identified by the words “believe,” “expect,” “hope,” “target,” “anticipate,” “intend,” “plan,” “seek,” “estimate,” “potential,” “project,” “scheduled,” “forecast” or words of similar meaning, or future or conditional verbs such as “will,” “would,” “should,” “could,” “might,” or “may.” Our forward-looking statements include, without limitation, statements with respect to: future global and local financial and economic conditions; our assessment of the aluminum market and aluminum prices (including premiums); our ability to procure alumina, carbon products and other raw materials and our assessment of pricing and costs and other terms relating thereto; our plans to restart curtailed production at Hawesville and any expected incremental production volume, costs, benefits or actions associated with the restart, including our plans and ability to hire and retain qualified employees; the future financial and operating performance of Century, its subsidiaries and its projects, including any estimates of incremental EBITDA from the anticipated restart of curtailed production at Hawesville or as a result of future raw material costs or otherwise; the future impact of any Section 232 relief or other trade remedies to Century, on aluminum prices or more generally, the extent to which any such remedies may be changed, including any exemptions, and the duration of any trade remedy; our ability to access our existing or future financing arrangements and the terms of any such future financing arrangements; our ability to repay debt in the future; our assessment of power pricing and our ability to successfully obtain and/or implement long-term competitive power arrangements for our operations and projects; our plans and expectations with respect to the future operation of our smelters and our other operations, including any plans and expectations to curtail or restart production at any of our operations; and our future business objectives, strategies and initiatives. Where we express an expectation or belief as to future events or results, such expectation or belief is expressed in good faith and believed to have a reasonable basis. However, our forward-looking statements are based on current expectations and assumptions that are subject to risks and uncertainties which may cause actual results to differ materially from future results expressed, projected or implied by those forward-looking statements. Important factors that could cause actual results and events to differ from those described in such forward-looking statements can be found in the risk factors and forward-looking statements cautionary language contained in our Annual Report on Form 10-K, quarterly reports on Form 10-Q and in other filings made with the Securities and Exchange Commission. Although we have attempted to identify those material factors that could cause actual results or events to differ from those described in such forward-looking statements, there may be other factors that could cause results or events to differ from those anticipated, estimated or intended. Many of these factors are beyond our ability to control or predict. Given these uncertainties, investors are cautioned not to place undue reliance on our forward-looking statements. We undertake no obligation to update or revise publicly any forward-looking statements, whether as a result of new information, future events, or otherwise. In addition, throughout this conference call, we will use non-GAAP financial measures. Reconciliations to the most comparable GAAP financial measures can be found in the Appendix of today’s presentation 1
Century Overview • Upstream aluminum producer o Capacity ~1 million metric tons (full production) • Largest primary producer in the U.S. o Only volume producer (one of handful in world) of high purity (military grade) aluminum o Valuable presence in value-added products markets • World class business in Iceland o Duty-free status in EU o Powered by 100% renewable energy under competitive contracts • Strong financial profile o Low financial leverage o Significant earnings power in normalized commodity markets 2
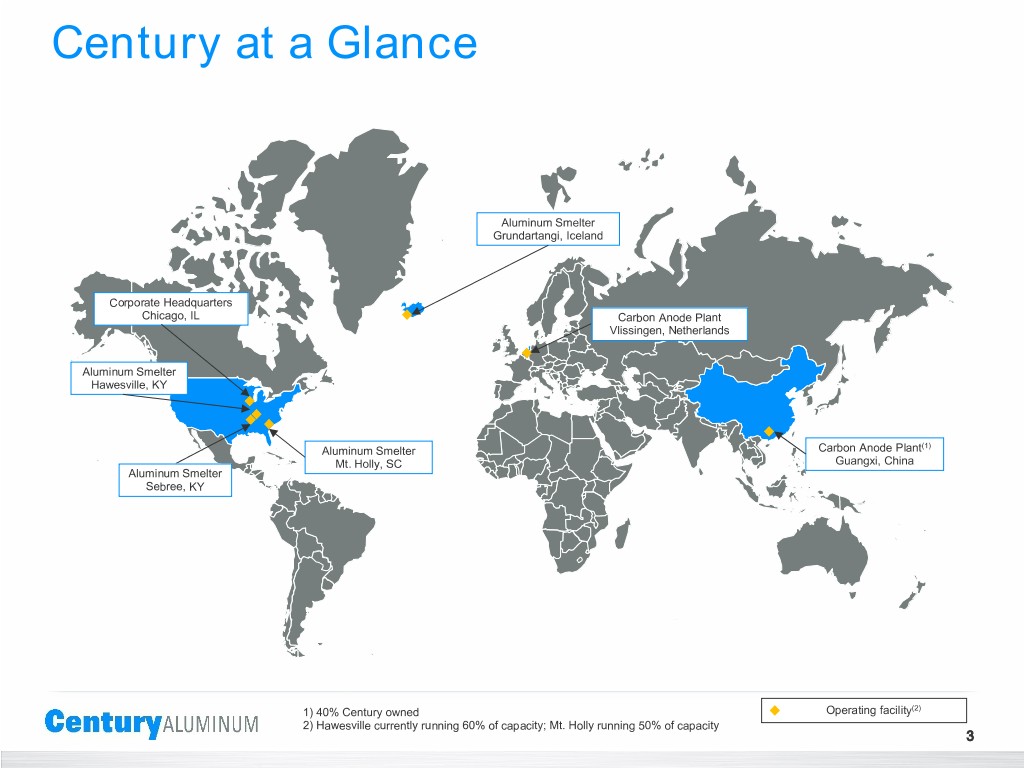
Century at a Glance Aluminum Smelter Grundartangi, Iceland Corporate Headquarters Chicago, IL Carbon Anode Plant Vlissingen, Netherlands Aluminum Smelter Hawesville, KY (1) Aluminum Smelter Carbon Anode Plant Mt. Holly, SC Guangxi, China Aluminum Smelter Sebree, KY 1) 1) 40% Century owned Operating facility(2) 2) 2) Hawesville currently running 60% of capacity; Mt. Holly running 50% of capacity 3
Strategy • Best-in-class safety and environmental culture and performance • Earnings leverage via production increase o Idled U.S. capacity o Continuing capacity creep in Iceland • Continue to increase value added products production o Attractive position in two short markets (U.S., Europe) o Modest low-risk, high-return investments • Manage exposure to other commodities • Mitigate volatility in alumina price 4
Industry Environment • Global growth steady at 4% (ROW) to 5% (China) • Production growth modest at 2% (ROW and China) • 2018 global deficit forecast at ~2 million metric tons • Since 2015, global inventories down ~3 million metric tons • Section 232 tariffs provide short and longer term support for U.S. premiums • Other factors yield attractive conditions in Century’s markets 5
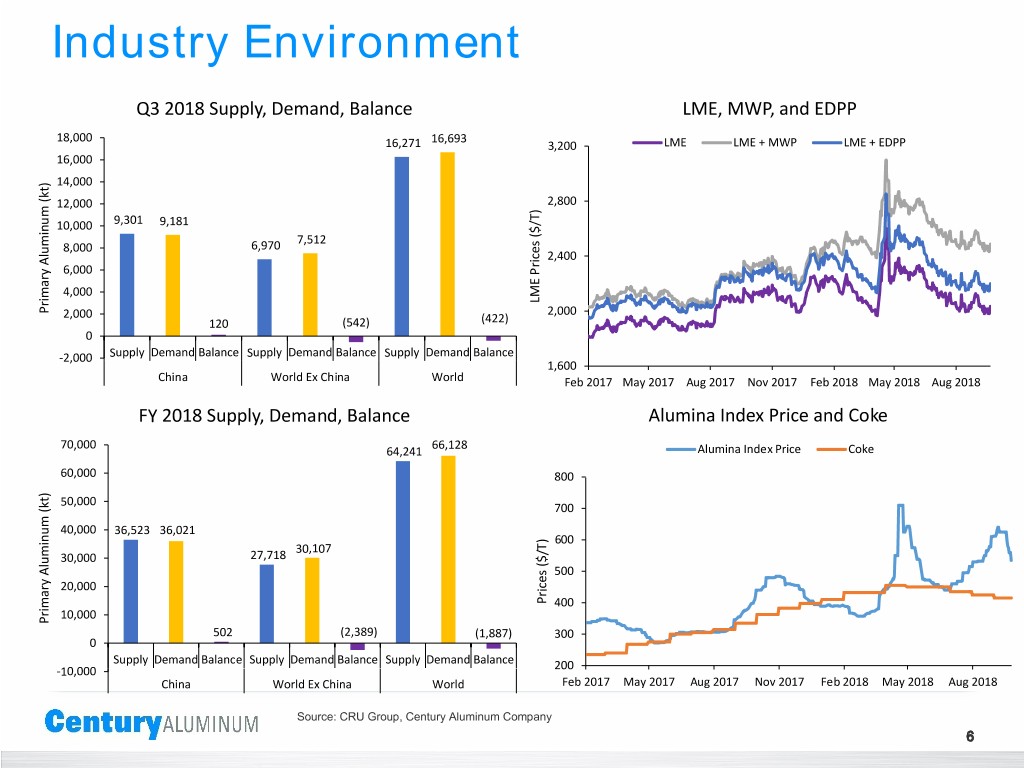
Industry Environment Q3 2018 Supply, Demand, Balance LME, MWP, and EDPP 18,000 16,693 16,271 3,200 LME LME + MWP LME + EDPP 16,000 14,000 12,000 2,800 10,000 9,301 9,181 7,512 8,000 6,970 2,400 6,000 4,000 LME Prices ($/T) Primary Aluminum (kt) Aluminum Primary 2,000 2,000 120 (542) (422) 0 -2,000 Supply Demand Balance Supply Demand Balance Supply Demand Balance 1,600 China World Ex China World Feb 2017 May 2017 Aug 2017 Nov 2017 Feb 2018 May 2018 Aug 2018 FY 2018 Supply, Demand, Balance Alumina Index Price and Coke 70,000 66,128 64,241 Alumina Index Price Coke 60,000 800 50,000 700 40,000 36,523 36,021 600 30,107 30,000 27,718 500 20,000 Prices ($/T) Prices 400 10,000 Primary Aluminum (kt) Aluminum Primary 502 (2,389) (1,887) 300 0 Supply Demand Balance Supply Demand Balance Supply Demand Balance -10,000 200 China World Ex China World Feb 2017 May 2017 Aug 2017 Nov 2017 Feb 2018 May 2018 Aug 2018 Source: CRU Group, Century Aluminum Company 6
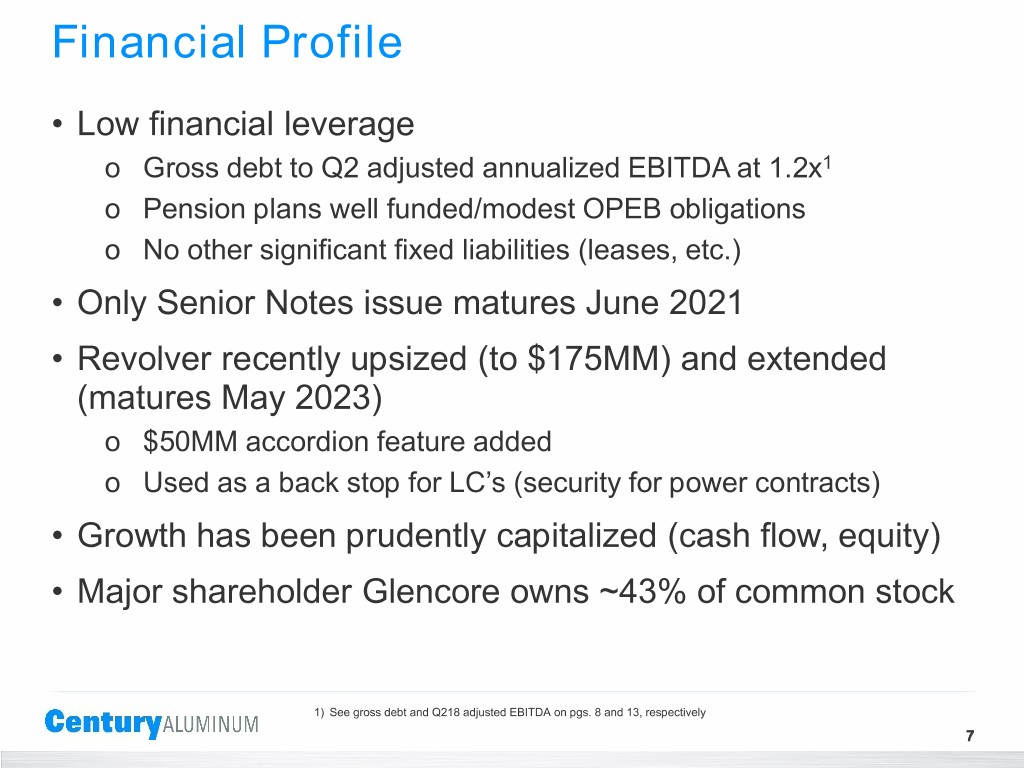
Financial Profile • Low financial leverage 1 o Gross debt to Q2 adjusted annualized EBITDA at 1.2x o Pension plans well funded/modest OPEB obligations o No other significant fixed liabilities (leases, etc.) • Only Senior Notes issue matures June 2021 • Revolver recently upsized (to $175MM) and extended (matures May 2023) o $50MM accordion feature added o Used as a back stop for LC’s (security for power contracts) • Growth has been prudently capitalized (cash flow, equity) • Major shareholder Glencore owns ~43% of common stock 1)1) See gross debt and Q218 adjusted EBITDA on pgs. 8 and 13, respectively 7
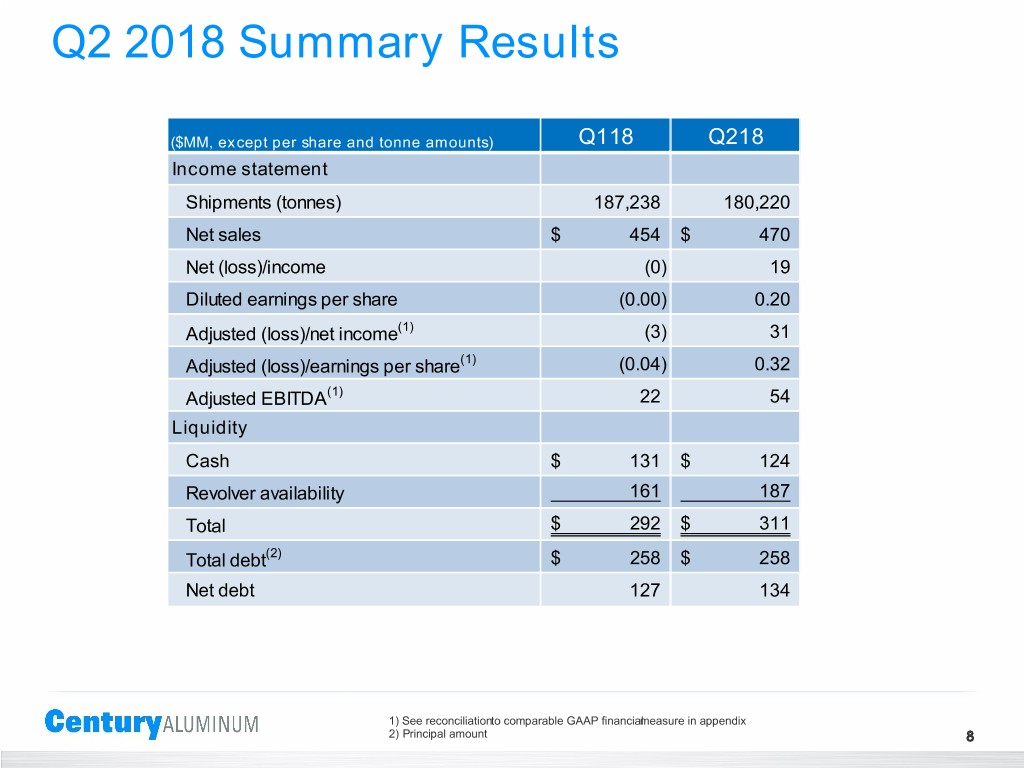
Q2 2018 Summary Results ($MM, except per share and tonne amounts) Q118 Q218 Income statement Shipments (tonnes) 187,238 180,220 Net sales $ 454 $ 470 Net (loss)/income (0) 19 Diluted earnings per share (0.00) 0.20 Adjusted (loss)/net income(1) (3) 31 Adjusted (loss)/earnings per share(1) (0.04) 0.32 Adjusted EBITDA(1) 22 54 Liquidity Cash $ 131 $ 124 Revolver availability 161 187 Total $ 292 $ 311 Total debt(2) $ 258 $ 258 Net debt 127 134 (1) 1) See reconciliationto comparable GAAP financialmeasure in appendix (2) 2) Principal amount 8
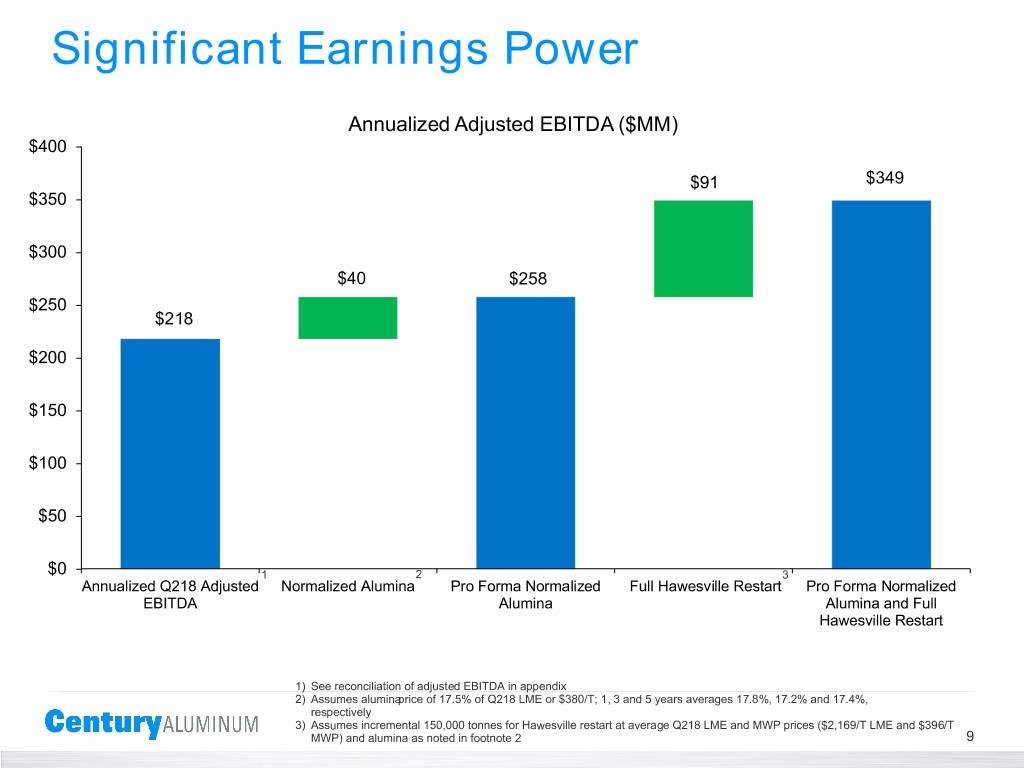
Significant Earnings Power Annualized Adjusted EBITDA ($MM) $400 $91 $349 $350 $300 $40 $258 $250 $218 $200 $150 $100 $50 $0 1 2 3 Annualized Q218 Adjusted Normalized Alumina Pro Forma Normalized Full Hawesville Restart Pro Forma Normalized EBITDA Alumina Alumina and Full Hawesville Restart 1)1) See reconciliation of adjusted EBITDA in appendix 2)2) Assumes aluminaprice of 17.5% of Q218 LME or $380/T; 1, 3 and 5 years averages 17.8%, 17.2% and 17.4%, respectively 3)3) Assumes incremental 150,000 tonnes for Hawesville restart at average Q218 LME and MWP prices ($2,169/T LME and $396/T MWP) and alumina as noted in footnote 2 9
Appendix
Non-GAAP Financial Measures Adjusted EBITDA, adjusted net income and adjusted earnings per share are non-GAAP financial measures that management uses to evaluate Century's financial performance. These non-GAAP financial measures facilitate comparisons of this period’s results with prior periods on a consistent basis by adjusting for items that management does not believe are indicative of Century’s ongoing operating performance and ability to generate cash. Management believes these non-GAAP financial measures enhance an overall understanding of Century’s performance and our investors’ ability to review Century’s business from the same perspective as management. The following slides provide a reconciliation of each non-GAAP financial measure to the most directly comparable GAAP financial measure. Non-GAAP financial measures should be viewed in addition to, and not as an alternative for, the Company's reported results prepared in accordance with GAAP. In addition, because not all companies use identical calculations, adjusted EBITDA, adjusted net income and adjusted earnings per share included in the following slides may not be comparable to similarly titled measures of other companies. Investors are encouraged to review the reconciliations in conjunction with the presentation of these non-GAAP financial measures. 11
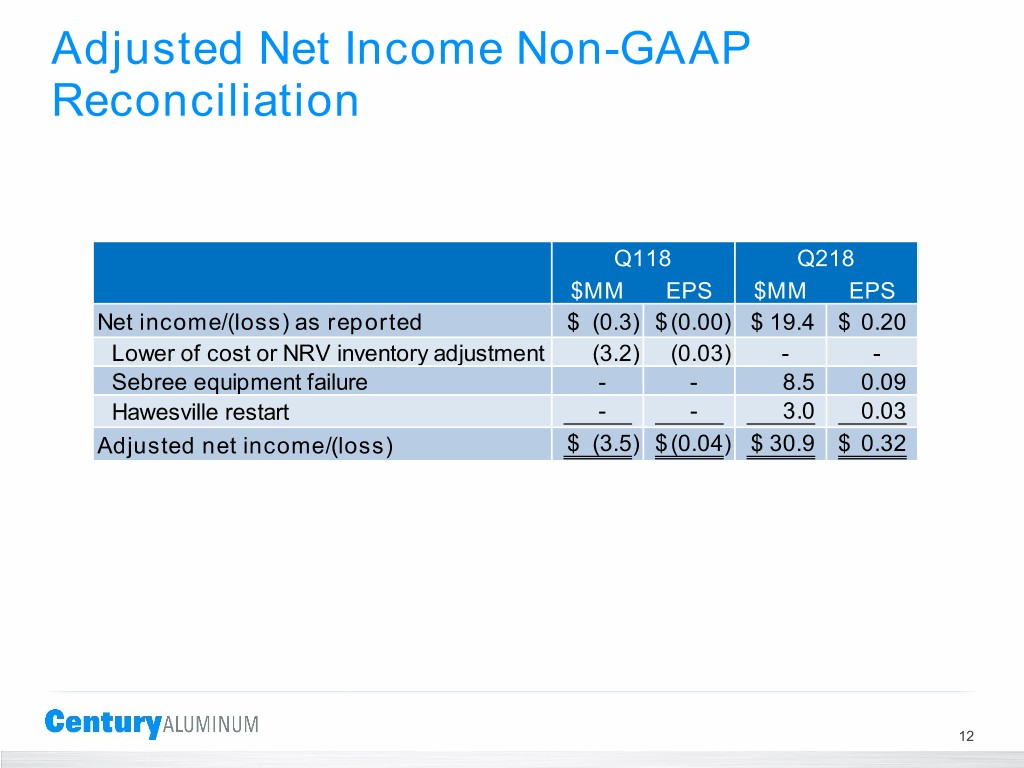
Adjusted Net Income Non-GAAP Reconciliation Q118 Q218 $MM EPS $MM EPS Net income/(loss) as reported $ (0.3) $ (0.00) $ 19.4 $ 0.20 Lower of cost or NRV inventory adjustment (3.2) (0.03) - - Sebree equipment failure - - 8.5 0.09 Hawesville restart - - 3.0 0.03 Adjusted net income/(loss) $ (3.5) $ (0.04) $ 30.9 $ 0.32 12
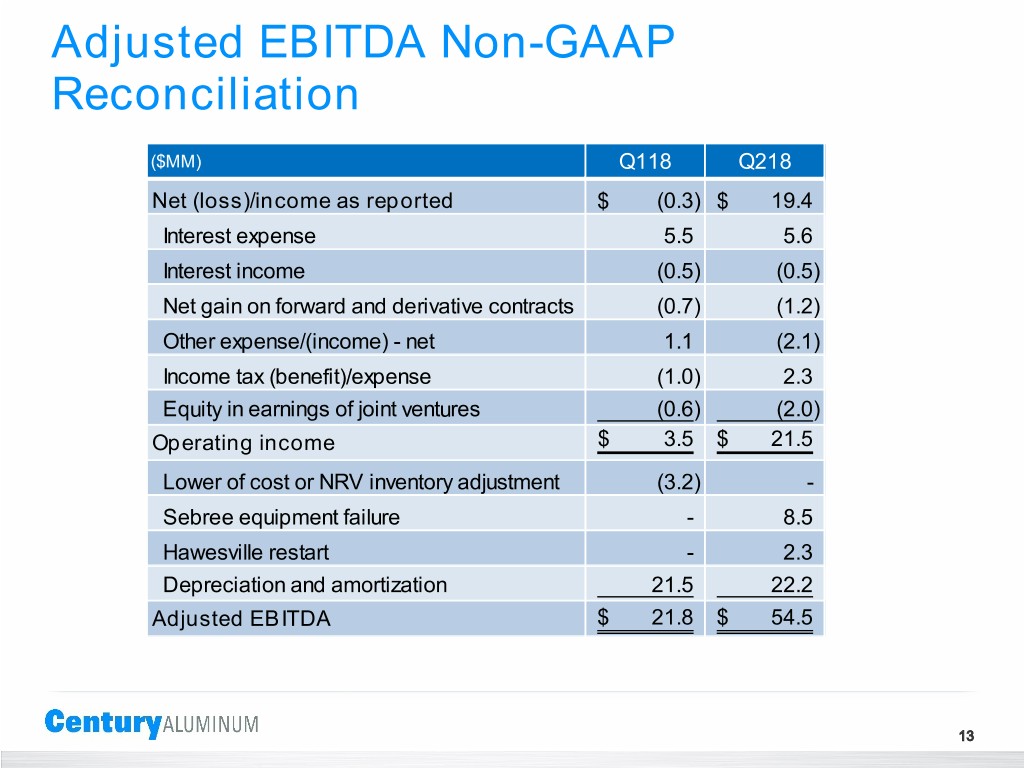
Adjusted EBITDA Non-GAAP Reconciliation ($MM) Q118 Q218 Net (loss)/income as reported $ (0.3) $ 19.4 Interest expense 5.5 5.6 Interest income (0.5) (0.5) Net gain on forward and derivative contracts (0.7) (1.2) Other expense/(income) - net 1.1 (2.1) Income tax (benefit)/expense (1.0) 2.3 Equity in earnings of joint ventures (0.6) (2.0) Operating income $ 3.5 $ 21.5 Lower of cost or NRV inventory adjustment (3.2) - Sebree equipment failure - 8.5 Hawesville restart - 2.3 Depreciation and amortization 21.5 22.2 Adjusted EBITDA $ 21.8 $ 54.5 13
