Attached files
| file | filename |
|---|---|
| EX-99.1 - EXHIBIT 99.1 - UNITED NATURAL FOODS INC | q4fy18earningsrelease.htm |
| 8-K - 8-K - UNITED NATURAL FOODS INC | a8-kq42018.htm |
Supplemental Presentation on UNFI’s Pending Supervalu Acquisition 1
Forward Looking Statements This presentation contains, and certain statements made by representatives of UNFI, and respective affiliates, from time to time may contain, “forward-looking statements” within the meaning of the “safe harbor” provisions of the Private Securities Litigation Reform Act of 1995. UNFI’s actual results may differ from their expectations, estimates and projections and consequently, you should not rely on these forward looking statements as predictions of future events. Words such as “expect,” “estimate,” “project,” “budget,” “forecast,” “anticipate,” “intend,” “plan,” “may,” “will,” “could,” “should,” “believes,” “predicts,” “potential,” “might” and “continues,” and similar expressions are intended to identify such forward-looking statements. These forward-looking statements include, without limitation, UNFI’s expectations with respect to future performance and anticipated financial impacts of the business combination, the satisfaction of the closing conditions to the business combination and the timing of the completion of the business combination. These forward-looking statements involve significant risks and uncertainties that could cause actual results to differ materially from expected results. Most of these factors are outside UNFI’s and SUPERVALU’s control and are difficult to predict. Factors that may cause such differences include, but are not limited to: (1) the occurrence of any event, change or other circumstances that could give rise to the termination of the merger agreement relating to the proposed business combination; (2) the outcome of any legal proceedings that have been or may be instituted against UNFI or SUPERVALU in connection with the merger agreement and the transactions contemplated therein; (3) the inability to complete the business combination, including due to failure to obtain approval of the shareholders of SUPERVALU or other conditions to closing in the merger agreement; (4) risks related to the financing of the transaction; (5) the risk that announcement and consummation of the business combination disrupts current plans and operations; (6) the ability to recognize the anticipated benefits of the business combination, which may be affected by, among other things, competition, the ability of the combined company to grow and manage growth profitably and retain its key employees; (7) costs related to the business combination; and (8) other risks and uncertainties identified in UNFI’s and SUPERVALU’s filings with the Securities and Exchange Commission (“SEC”). More information about other potential factors that could affect UNFI’s and SUPERVALU’s business and financial results is included under the captions “Risk Factors” and “Management’s Discussion and Analysis of Financial Condition and Results of Operations” in UNFI’s Annual Report on Form 10-K for the fiscal year ended July 29, 2017 and SUPERVALU’s Report on Form 10-K for the fiscal year ended February 24, 2018, as amended, and any updates to those risk factors set forth in UNFI’s and SUPERVALU’s Quarterly Reports on Form 10-Q, Current Reports on Form 8-K and other filings, which have been filed with the SEC and are available on the SEC’s website at www.sec.gov. The foregoing list of factors is not exhaustive. UNFI cautions readers not to place undue reliance upon any forward-looking statements, which speak only as of the date made. UNFI does not undertake or accept any obligation or undertaking to release publicly any updates or revisions to any forward-looking statements to reflect any change in its expectations or any change in events, conditions or circumstances on which any such statement is based, other than as required by applicable law. This presentation also contains certain non-GAAP financial measures such as adjusted diluted earnings per common share, adjusted estimated diluted earnings per common share, debt to Adjusted EBITDA ratio, adjusted net sales, adjusted operating income, adjusted operating income margin, adjusted estimated effective tax rate and free cash flow. The reconciliations of non-GAAP financial measures to the most directly comparable GAAP financial measures are presented in the appendix to this presentation. The presentation of these non-GAAP financial measures is not intended to be considered in isolation or as a substitute for any measure prepared in accordance with GAAP. UNFI believes that presenting these non-GAAP financial measures aids in making period-to-period comparisons and is a meaningful indication of its estimated operating performance. UNFI's management utilizes and plans to utilize this non-GAAP financial information to compare UNFI's operating performance during certain fiscal periods to the comparable periods in the other fiscal years and, in certain cases, to internally prepared projections. 2
Transforming into North America’s Premier Wholesale Distributor ✓ Leader in Food Wholesale Industry with Significant Scale and Reach ✓ Significant Cost Synergies And Growth Opportunities ✓ Well Positioned to Continue to Capture Natural / Organic Growth Across All Channels ✓ Experienced Management Team with Deep Wholesale and Natural / Organic Expertise, Strong Integration Capabilities ✓ Long-term Shareholder Value Creation, Including Disciplined Capital Allocation 3
Combination Creates Compelling Value for Customers and Shareholders 1 Delivers Significant Synergies Creates run-rate cost synergy opportunity of more than $175 million, with ~95% of synergies expected to be achieved by year 3; more than $185 million in cost synergies by year 4. 2 Diversifies Customer Base Expands customer base and increases distribution opportunities across channels, including those where demand for “better for you” products is accelerating and UNFI is under-represented 3 Expands Market Reach and Scale Wider geographic reach and greater scale is expected to increase efficiencies and effectiveness across new and existing customers and capture a greater share of industry growth. 4 Enhances Technology, Capacity and Systems Leverages scalable systems which provide opportunity to streamline processes, more efficiently meet the needs of customers and significantly reduce future capital expenditures. 5 Enables Cross-Selling Opportunities Delivers comprehensive and expanded offerings – including high-growth perimeter categories such as meat and produce – to UNFI’s natural and organic products, and a more robust “better for you” product offering to Supervalu. 4
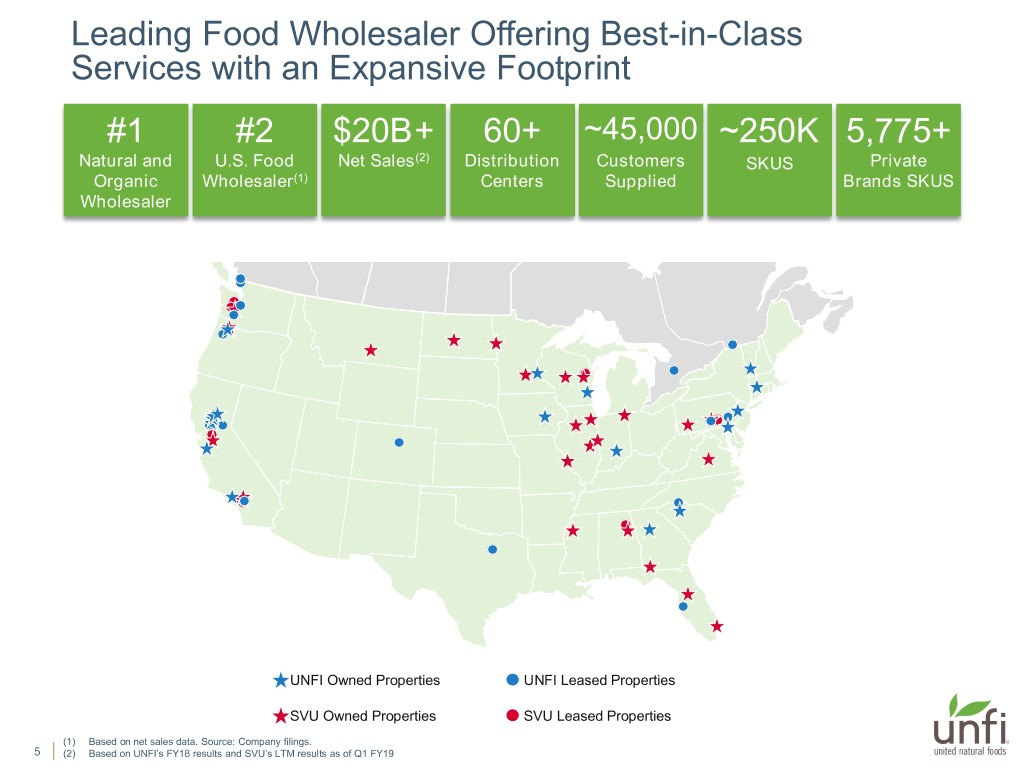
Leading Food Wholesaler Offering Best-in-Class Services with an Expansive Footprint #1 #2 $20B+ 60+ ~45,000 ~250K 5,775+ . Natural and U.S. Food Net Sales(2) Distribution Customers SKUS Private Organic Wholesaler(1) Centers Supplied Brands SKUS Wholesaler UNFI Owned Properties UNFI Leased Properties SVU Owned Properties SVU Leased Properties (1) Based on net sales data. Source: Company filings. 5 (2) Based on UNFI’s FY18 results and SVU’s LTM results as of Q1 FY19
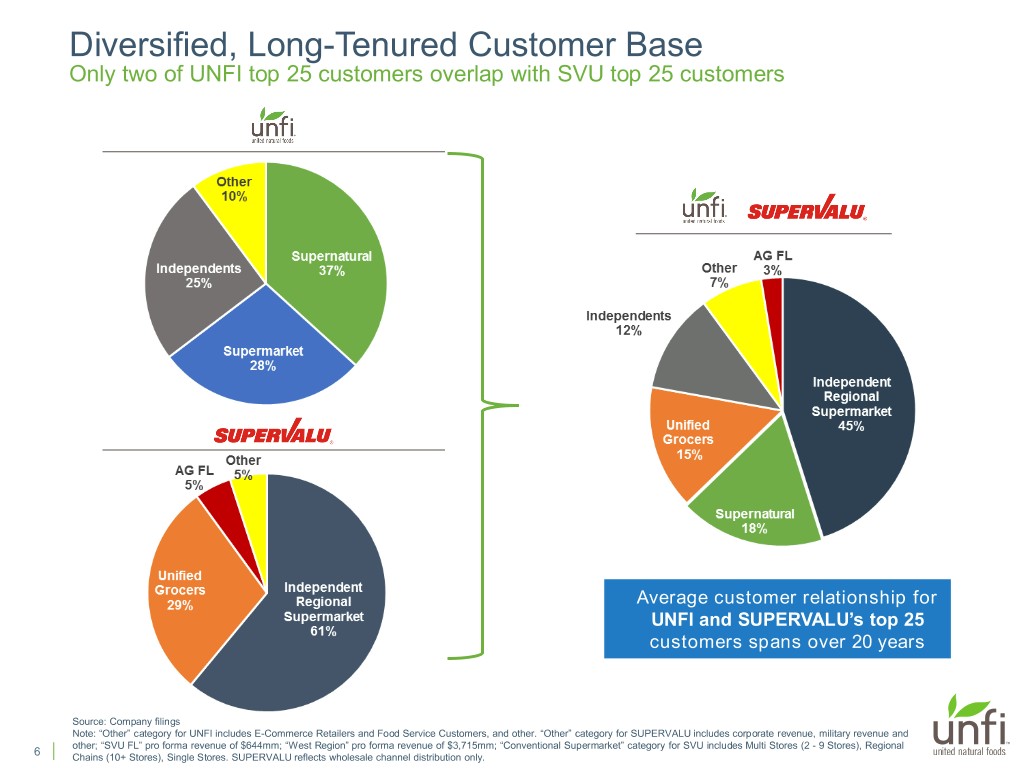
Diversified, Long-Tenured Customer Base Only two of UNFI top 25 customers overlap with SVU top 25 customers Average customer relationship for UNFI and SUPERVALU’s top 25 customers spans over 20 years Source: Company filings Note: “Other” category for UNFI includes E-Commerce Retailers and Food Service Customers, and other. “Other” category for SUPERVALU includes corporate revenue, military revenue and other; “SVU FL” pro forma revenue of $644mm; “West Region” pro forma revenue of $3,715mm; “Conventional Supermarket” category for SVU includes Multi Stores (2 - 9 Stores), Regional 6 Chains (10+ Stores), Single Stores. SUPERVALU reflects wholesale channel distribution only.
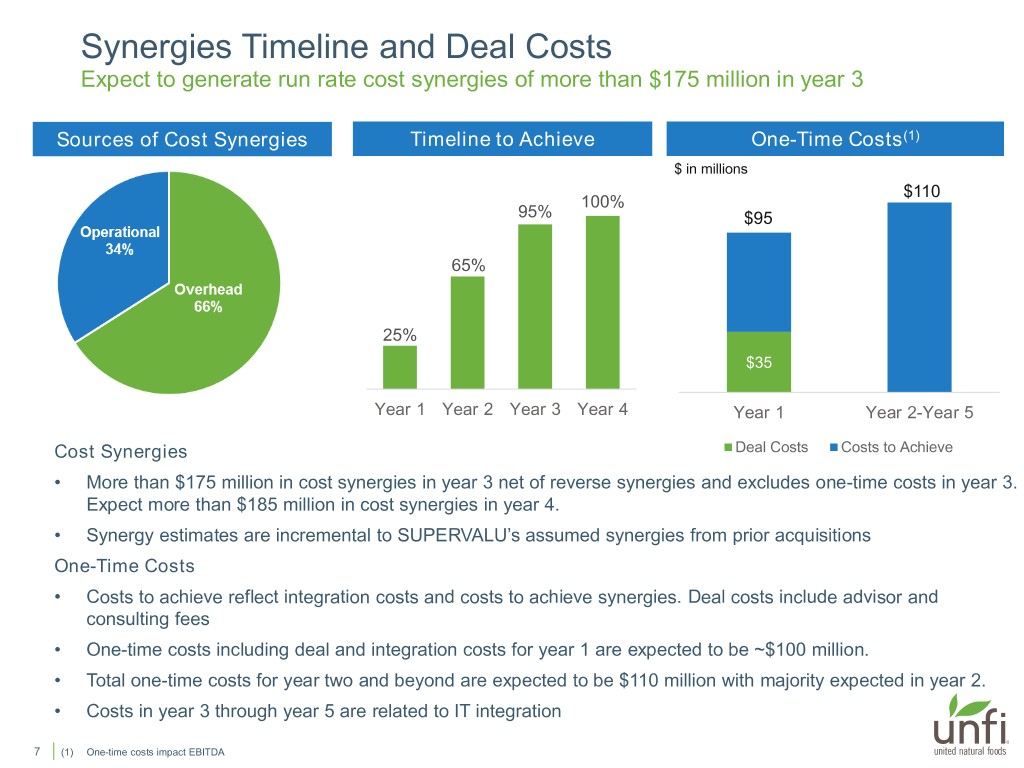
Synergies Timeline and Deal Costs Expect to generate run rate cost synergies of more than $175 million in year 3 Sources of Cost Synergies Timeline to Achieve One-Time Costs(1) $ in millions $110 100% 95% $95 65% 25% $35 Year 1 Year 2 Year 3 Year 4 Year 1 Year 2-Year 5 Cost Synergies Deal Costs Costs to Achieve • More than $175 million in cost synergies in year 3 net of reverse synergies and excludes one-time costs in year 3. Expect more than $185 million in cost synergies in year 4. • Synergy estimates are incremental to SUPERVALU’s assumed synergies from prior acquisitions One-Time Costs • Costs to achieve reflect integration costs and costs to achieve synergies. Deal costs include advisor and consulting fees • One-time costs including deal and integration costs for year 1 are expected to be ~$100 million. • Total one-time costs for year two and beyond are expected to be $110 million with majority expected in year 2. • Costs in year 3 through year 5 are related to IT integration 7 (1) One-time costs impact EBITDA
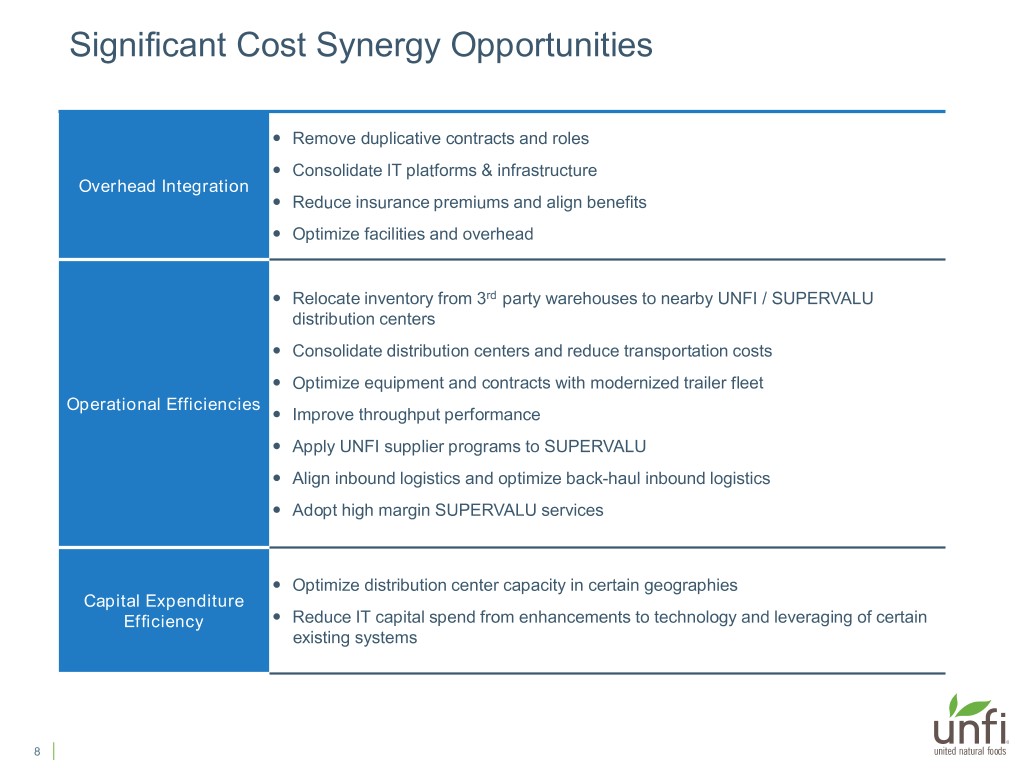
Significant Cost Synergy Opportunities Remove duplicative contracts and roles Consolidate IT platforms & infrastructure Overhead Integration Reduce insurance premiums and align benefits Optimize facilities and overhead Relocate inventory from 3rd party warehouses to nearby UNFI / SUPERVALU distribution centers Consolidate distribution centers and reduce transportation costs Optimize equipment and contracts with modernized trailer fleet Operational Efficiencies Improve throughput performance Apply UNFI supplier programs to SUPERVALU Align inbound logistics and optimize back-haul inbound logistics Adopt high margin SUPERVALU services Optimize distribution center capacity in certain geographies Capital Expenditure Efficiency Reduce IT capital spend from enhancements to technology and leveraging of certain existing systems 8
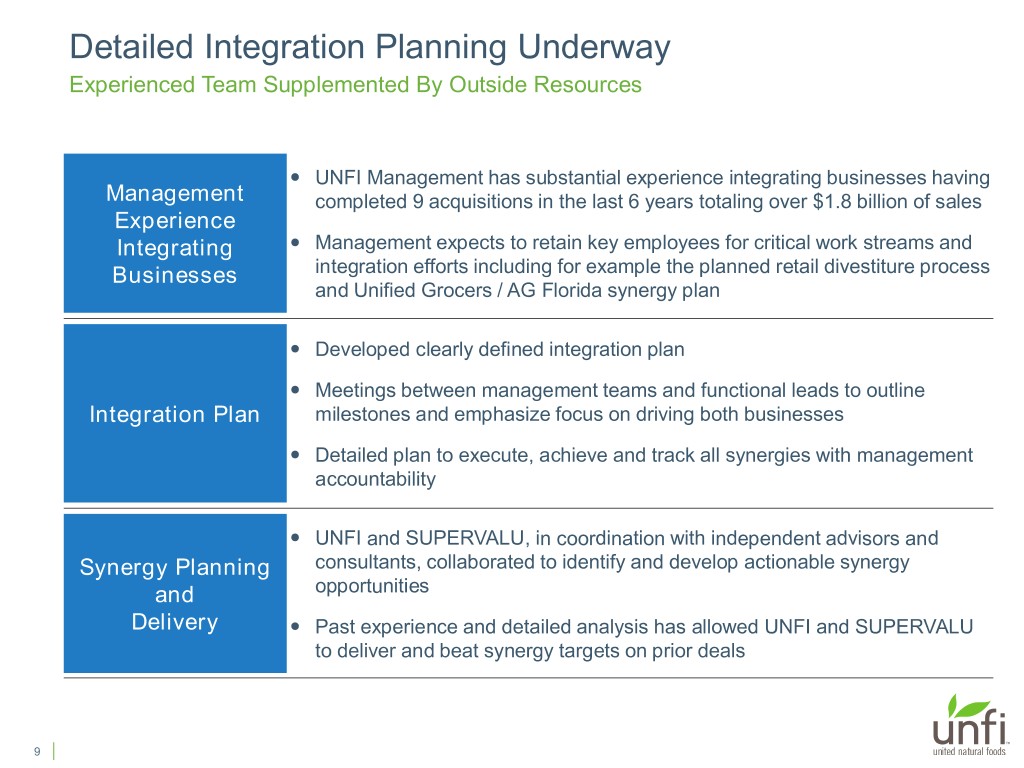
Detailed Integration Planning Underway Experienced Team Supplemented By Outside Resources UNFI Management has substantial experience integrating businesses having Management completed 9 acquisitions in the last 6 years totaling over $1.8 billion of sales Experience Integrating Management expects to retain key employees for critical work streams and Businesses integration efforts including for example the planned retail divestiture process and Unified Grocers / AG Florida synergy plan Developed clearly defined integration plan Meetings between management teams and functional leads to outline Integration Plan milestones and emphasize focus on driving both businesses Detailed plan to execute, achieve and track all synergies with management accountability UNFI and SUPERVALU, in coordination with independent advisors and Synergy Planning consultants, collaborated to identify and develop actionable synergy and opportunities Delivery Past experience and detailed analysis has allowed UNFI and SUPERVALU to deliver and beat synergy targets on prior deals 9
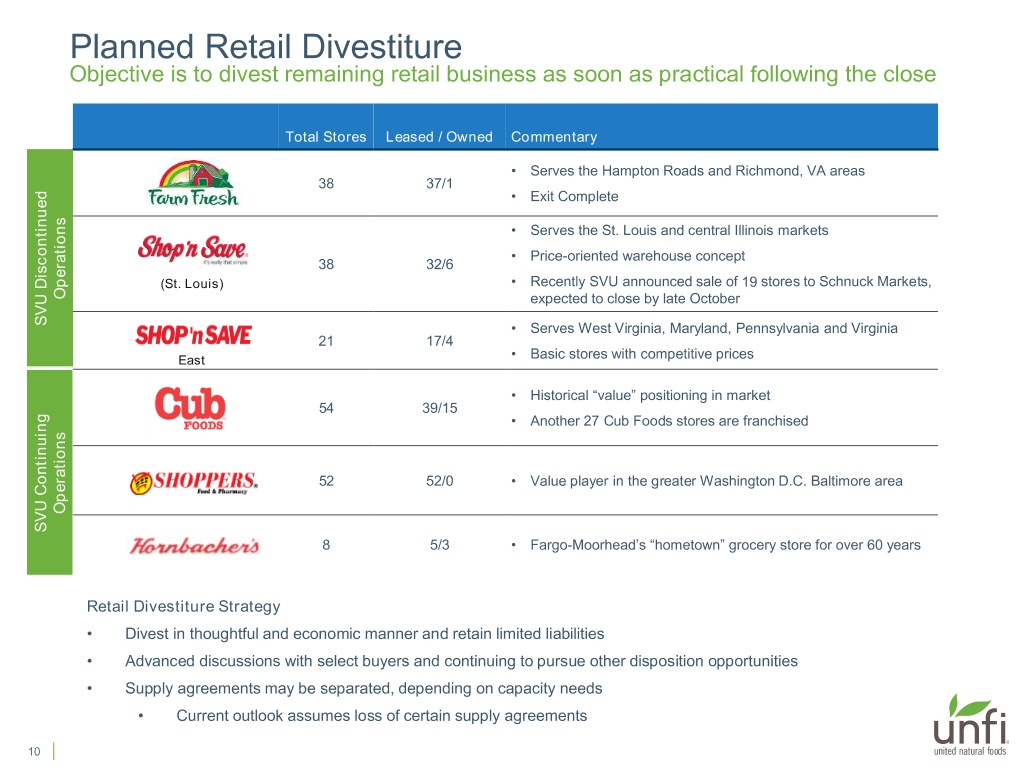
Planned Retail Divestiture Objective is to divest remaining retail business as soon as practical following the close Total Stores Leased / Owned Commentary • Serves the Hampton Roads and Richmond, VA areas 38 37/1 • Exit Complete • Serves the St. Louis and central Illinois markets • Price-oriented warehouse concept 38 32/6 (St. Louis) • Recently SVU announced sale of 19 stores to Schnuck Markets, Operations expected to close by late October SVU Discontinued Discontinued SVU • Serves West Virginia, Maryland, Pennsylvania and Virginia 21 17/4 East • Basic stores with competitive prices • Historical “value” positioning in market 54 39/15 • Another 27 Cub Foods stores are franchised 52 52/0 • Value player in the greater Washington D.C. Baltimore area Operations SVU SVU Continuing 8 5/3 • Fargo-Moorhead’s “hometown” grocery store for over 60 years Retail Divestiture Strategy • Divest in thoughtful and economic manner and retain limited liabilities • Advanced discussions with select buyers and continuing to pursue other disposition opportunities • Supply agreements may be separated, depending on capacity needs • Current outlook assumes loss of certain supply agreements 10
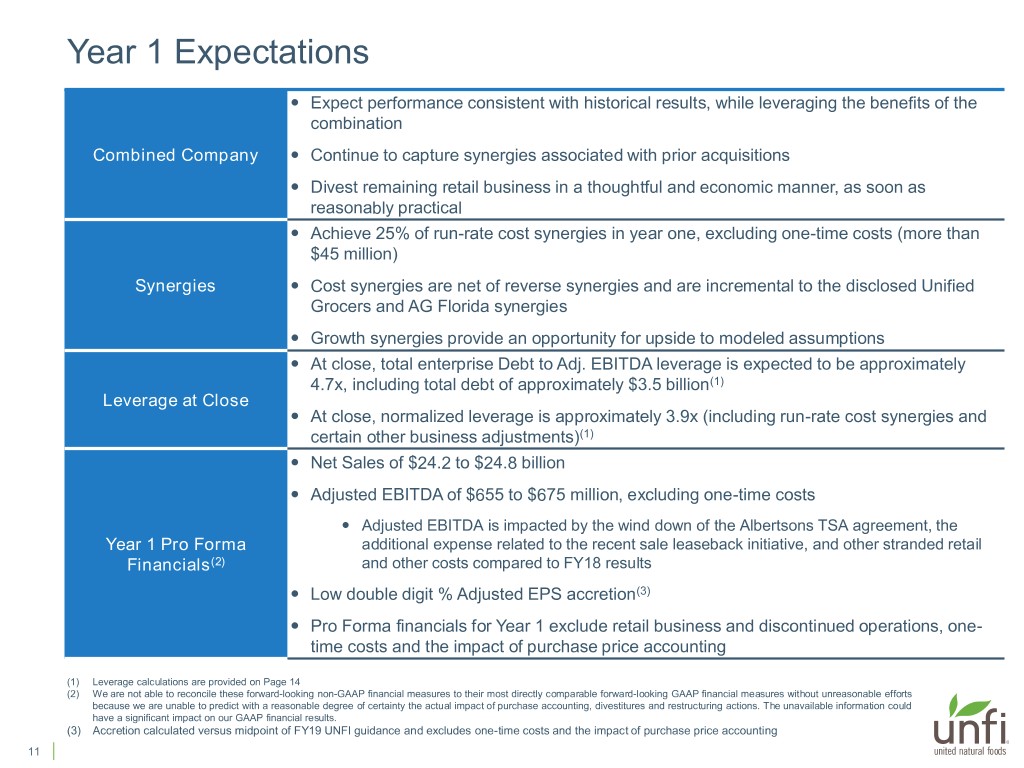
Year 1 Expectations Expect performance consistent with historical results, while leveraging the benefits of the combination Combined Company Continue to capture synergies associated with prior acquisitions Divest remaining retail business in a thoughtful and economic manner, as soon as reasonably practical Achieve 25% of run-rate cost synergies in year one, excluding one-time costs (more than $45 million) Synergies Cost synergies are net of reverse synergies and are incremental to the disclosed Unified Grocers and AG Florida synergies Growth synergies provide an opportunity for upside to modeled assumptions At close, total enterprise Debt to Adj. EBITDA leverage is expected to be approximately 4.7x, including total debt of approximately $3.5 billion(1) Leverage at Close At close, normalized leverage is approximately 3.9x (including run-rate cost synergies and certain other business adjustments)(1) Net Sales of $24.2 to $24.8 billion Adjusted EBITDA of $655 to $675 million, excluding one-time costs Adjusted EBITDA is impacted by the wind down of the Albertsons TSA agreement, the Year 1 Pro Forma additional expense related to the recent sale leaseback initiative, and other stranded retail Financials(2) and other costs compared to FY18 results Low double digit % Adjusted EPS accretion(3) Pro Forma financials for Year 1 exclude retail business and discontinued operations, one- time costs and the impact of purchase price accounting (1) Leverage calculations are provided on Page 14 (2) We are not able to reconcile these forward-looking non-GAAP financial measures to their most directly comparable forward-looking GAAP financial measures without unreasonable efforts because we are unable to predict with a reasonable degree of certainty the actual impact of purchase accounting, divestitures and restructuring actions. The unavailable information could have a significant impact on our GAAP financial results. (3) Accretion calculated versus midpoint of FY19 UNFI guidance and excludes one-time costs and the impact of purchase price accounting 11
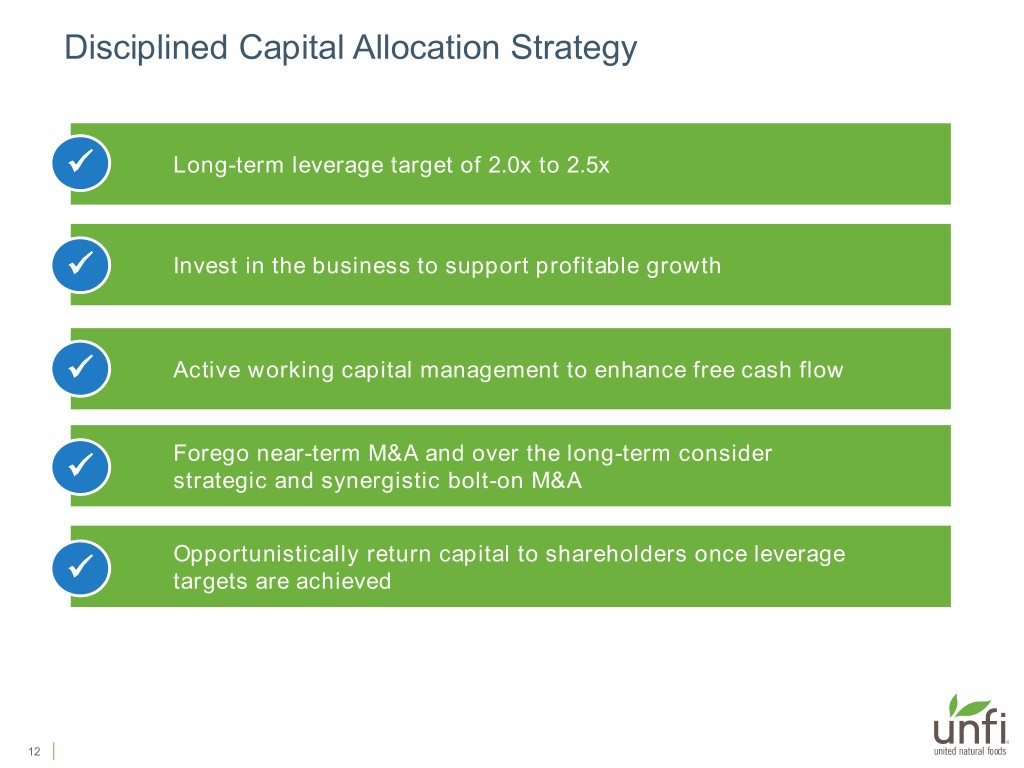
Disciplined Capital Allocation Strategy ✓ Long-term leverage target of 2.0x to 2.5x ✓ Invest in the business to support profitable growth ✓ Active working capital management to enhance free cash flow ✓ Forego near-term M&A and over the long-term consider strategic and synergistic bolt-on M&A ✓ Opportunistically return capital to shareholders once leverage targets are achieved 12
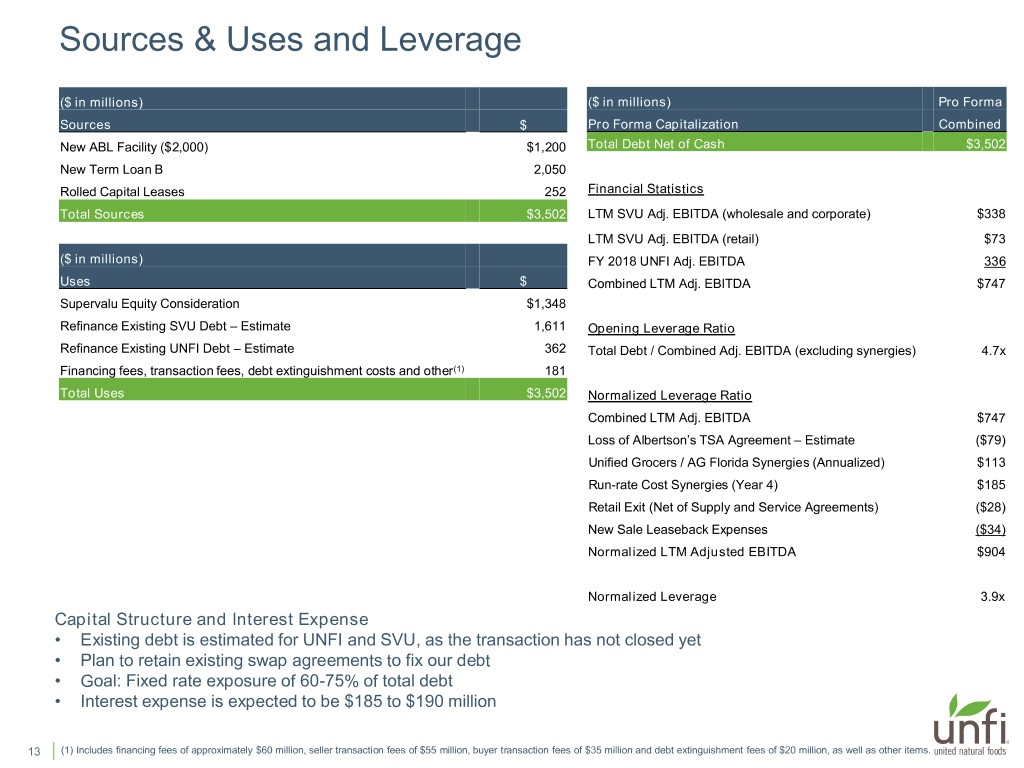
Sources & Uses and Leverage ($ in millions) ($ in millions) Pro Forma Sources $ Pro Forma Capitalization Combined New ABL Facility ($2,000) $1,200 Total Debt Net of Cash $3,502 New Term Loan B 2,050 Rolled Capital Leases 252 Financial Statistics Total Sources $3,502 LTM SVU Adj. EBITDA (wholesale and corporate) $338 LTM SVU Adj. EBITDA (retail) $73 ($ in millions) FY 2018 UNFI Adj. EBITDA 336 Uses $ Combined LTM Adj. EBITDA $747 Supervalu Equity Consideration $1,348 Refinance Existing SVU Debt – Estimate 1,611 Opening Leverage Ratio Refinance Existing UNFI Debt – Estimate 362 Total Debt / Combined Adj. EBITDA (excluding synergies) 4.7x Financing fees, transaction fees, debt extinguishment costs and other(1) 181 Total Uses $3,502 Normalized Leverage Ratio Combined LTM Adj. EBITDA $747 Loss of Albertson’s TSA Agreement – Estimate ($79) Unified Grocers / AG Florida Synergies (Annualized) $113 Run-rate Cost Synergies (Year 4) $185 Retail Exit (Net of Supply and Service Agreements) ($28) New Sale Leaseback Expenses ($34) Normalized LTM Adjusted EBITDA $904 Normalized Leverage 3.9x Capital Structure and Interest Expense • Existing debt is estimated for UNFI and SVU, as the transaction has not closed yet • Plan to retain existing swap agreements to fix our debt • Goal: Fixed rate exposure of 60-75% of total debt • Interest expense is expected to be $185 to $190 million 13 (1) Includes financing fees of approximately $60 million, seller transaction fees of $55 million, buyer transaction fees of $35 million and debt extinguishment fees of $20 million, as well as other items.
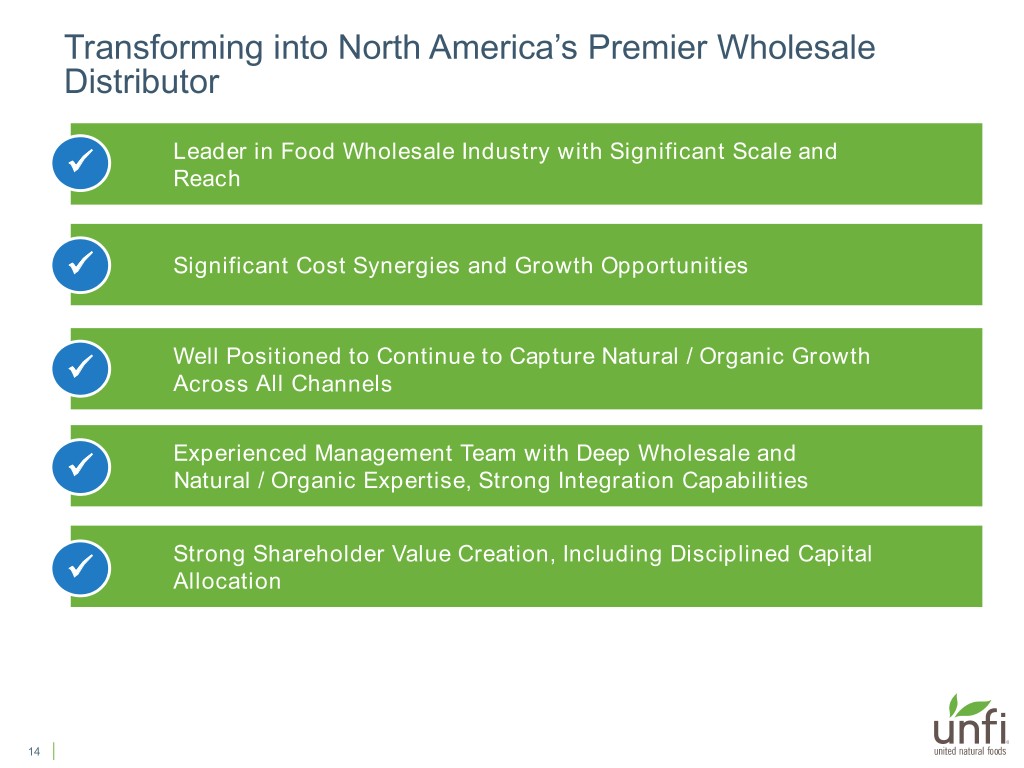
Transforming into North America’s Premier Wholesale Distributor ✓ Leader in Food Wholesale Industry with Significant Scale and Reach ✓ Significant Cost Synergies and Growth Opportunities ✓ Well Positioned to Continue to Capture Natural / Organic Growth Across All Channels ✓ Experienced Management Team with Deep Wholesale and Natural / Organic Expertise, Strong Integration Capabilities ✓ Strong Shareholder Value Creation, Including Disciplined Capital Allocation 14
Appendix 15
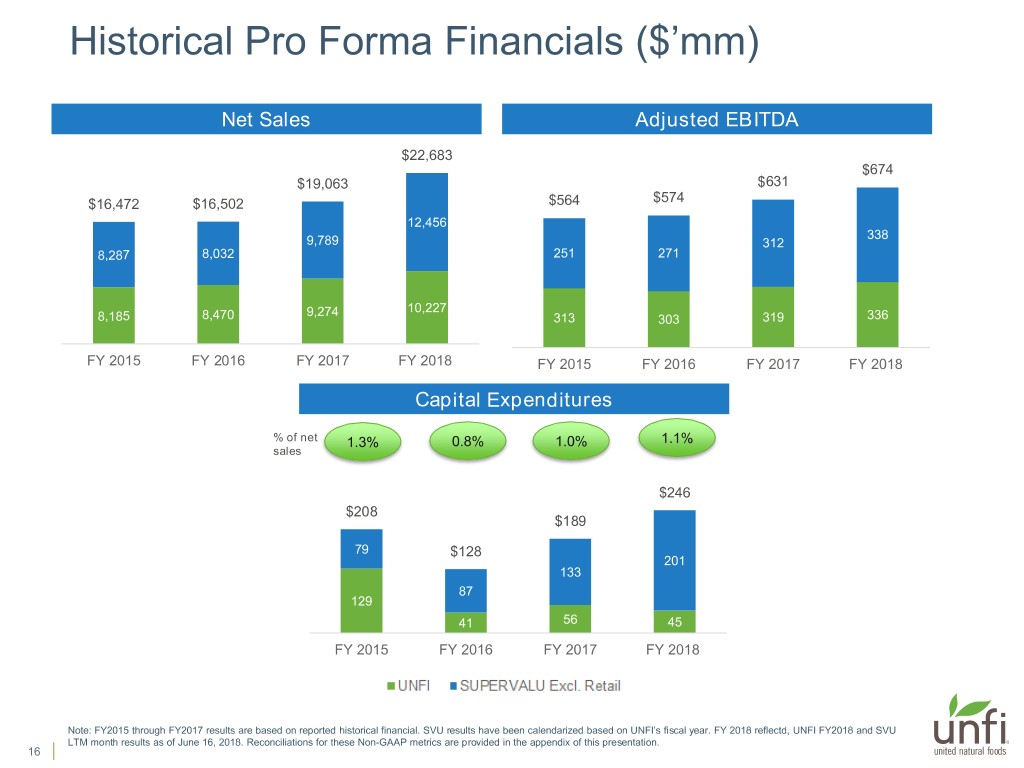
Historical Pro Forma Financials ($’mm) Net Sales Adjusted EBITDA $22,683 $674 $19,063 $631 $16,472 $16,502 $564 $574 12,456 338 9,789 312 8,287 8,032 251 271 9,274 10,227 8,185 8,470 313 303 319 336 FY 2015 FY 2016 FY 2017 FY 2018 FY 2015 FY 2016 FY 2017 FY 2018 Capital Expenditures % of net 1.3% 0.8% 1.0% 1.1% sales $246 $208 $189 79 $128 201 133 87 129 41 56 45 FY 2015 FY 2016 FY 2017 FY 2018 Note: FY2015 through FY2017 results are based on reported historical financial. SVU results have been calendarized based on UNFI’s fiscal year. FY 2018 reflectd, UNFI FY2018 and SVU LTM month results as of June 16, 2018. Reconciliations for these Non-GAAP metrics are provided in the appendix of this presentation. 16
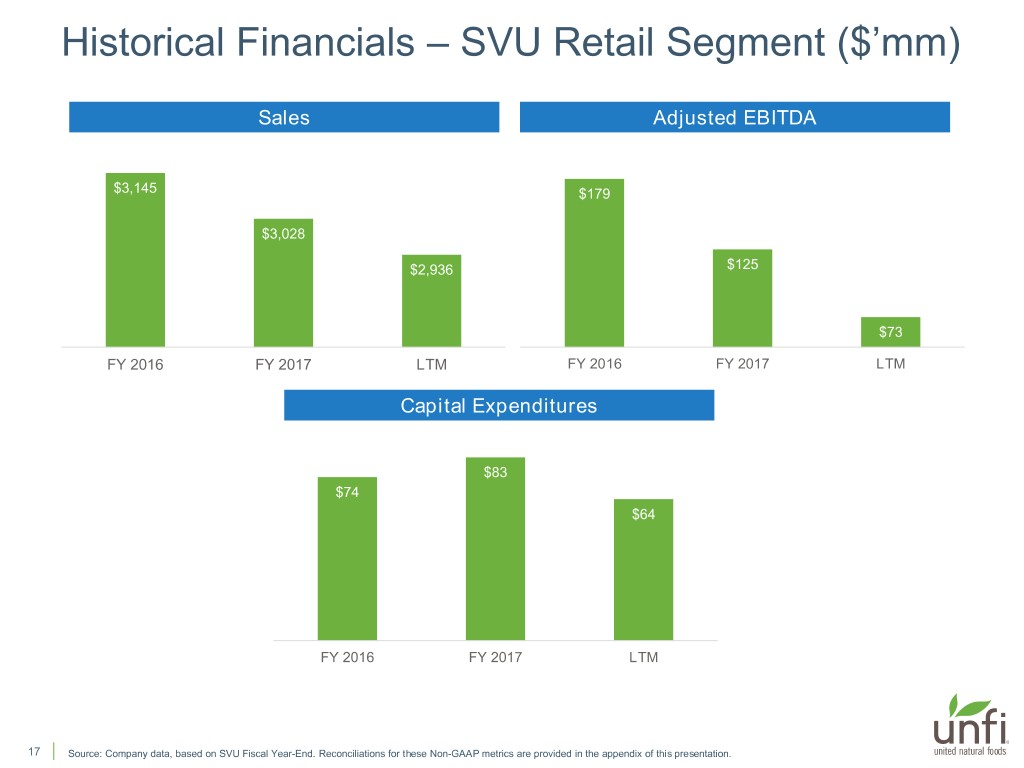
Historical Financials – SVU Retail Segment ($’mm) Sales Adjusted EBITDA $3,145 $179 $3,028 $2,936 $125 $73 FY 2016 FY 2017 LTM FY 2016 FY 2017 LTM Capital Expenditures $83 $74 $64 FY 2016 FY 2017 LTM 17 Source: Company data, based on SVU Fiscal Year-End. Reconciliations for these Non-GAAP metrics are provided in the appendix of this presentation.
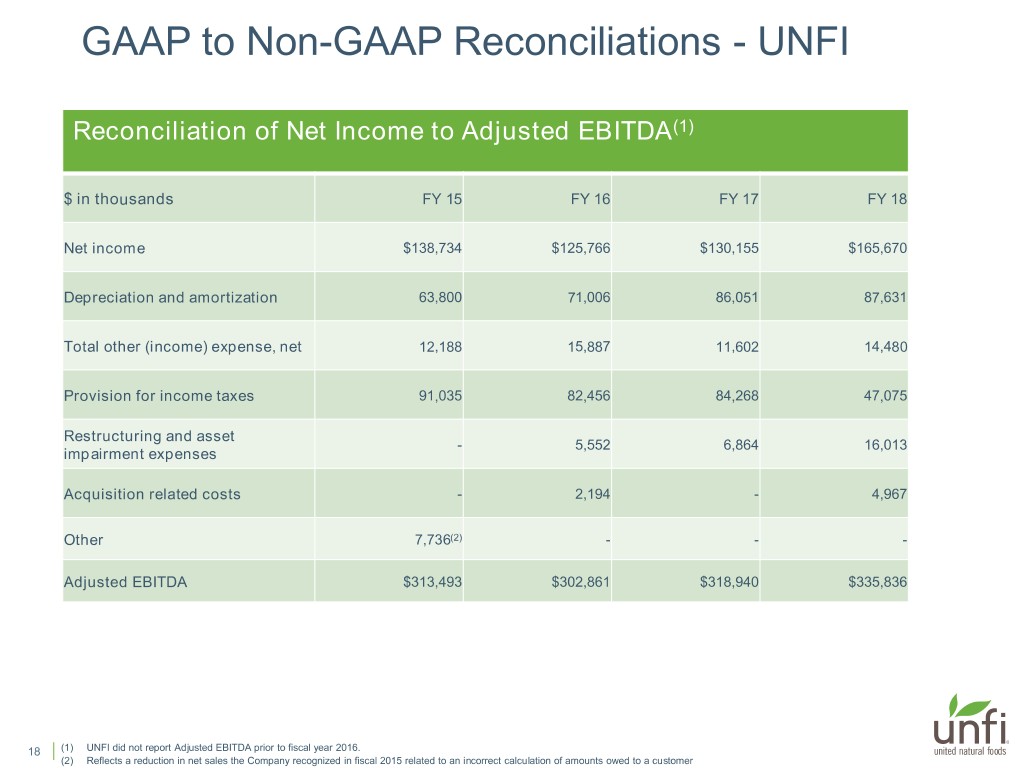
GAAP to Non-GAAP Reconciliations - UNFI Reconciliation of Net Income to Adjusted EBITDA(1) $ in thousands FY 15 FY 16 FY 17 FY 18 Net income $138,734 $125,766 $130,155 $165,670 Depreciation and amortization 63,800 71,006 86,051 87,631 Total other (income) expense, net 12,188 15,887 11,602 14,480 Provision for income taxes 91,035 82,456 84,268 47,075 Restructuring and asset - 5,552 6,864 16,013 impairment expenses Acquisition related costs - 2,194 - 4,967 Other 7,736(2) - - - Adjusted EBITDA $313,493 $302,861 $318,940 $335,836 18 (1) UNFI did not report Adjusted EBITDA prior to fiscal year 2016. (2) Reflects a reduction in net sales the Company recognized in fiscal 2015 related to an incorrect calculation of amounts owed to a customer
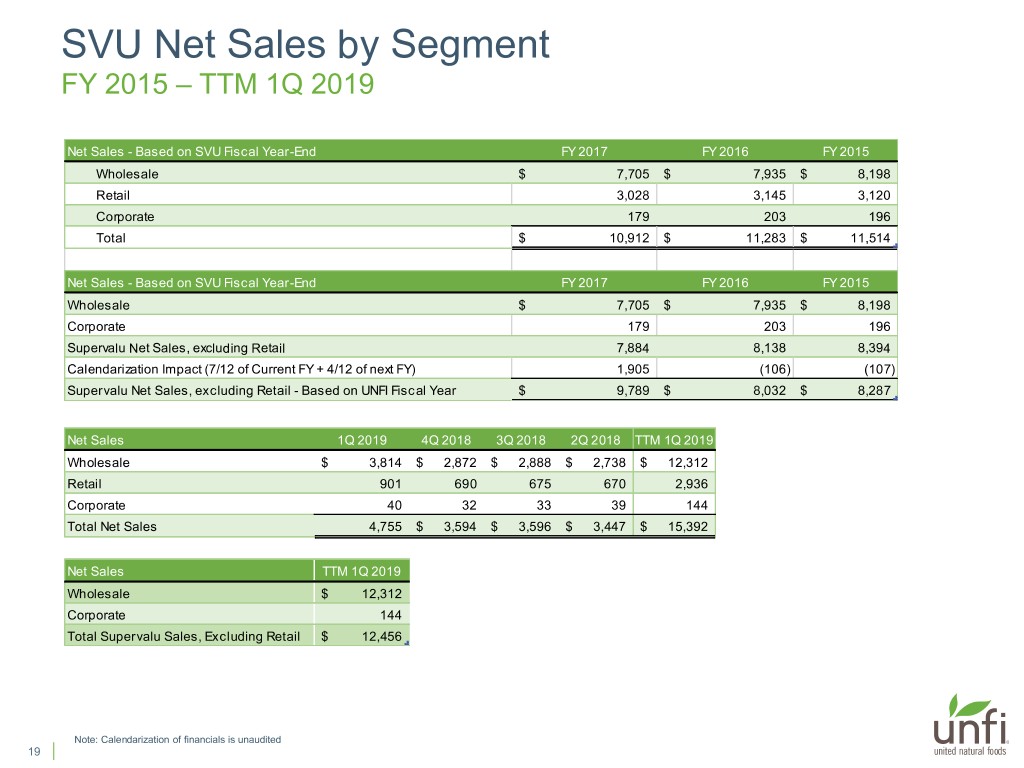
SVU Net Sales by Segment FY 2015 – TTM 1Q 2019 Net Sales - Based on SVU Fiscal Year-End FY 2017 FY 2016 FY 2015 Wholesale $ 7,705 $ 7,935 $ 8,198 Retail 3,028 3,145 3,120 Corporate 179 203 196 Total $ 10,912 $ 11,283 $ 11,514 Net Sales - Based on SVU Fiscal Year-End FY 2017 FY 2016 FY 2015 Wholesale $ 7,705 $ 7,935 $ 8,198 Corporate 179 203 196 Supervalu Net Sales, excluding Retail 7,884 8,138 8,394 Calendarization Impact (7/12 of Current FY + 4/12 of next FY) 1,905 (106) (107) Supervalu Net Sales, excluding Retail - Based on UNFI Fiscal Year $ 9,789 $ 8,032 $ 8,287 Net Sales 1Q 2019 4Q 2018 3Q 2018 2Q 2018 TTM 1Q 2019 Wholesale $ 3,814 $ 2,872 $ 2,888 $ 2,738 $ 12,312 Retail 901 690 675 670 2,936 Corporate 40 32 33 39 144 Total Net Sales 4,755 $ 3,594 $ 3,596 $ 3,447 $ 15,392 Net Sales TTM 1Q 2019 Wholesale $ 12,312 Corporate 144 Total Supervalu Sales, Excluding Retail $ 12,456 Note: Calendarization of financials is unaudited 19
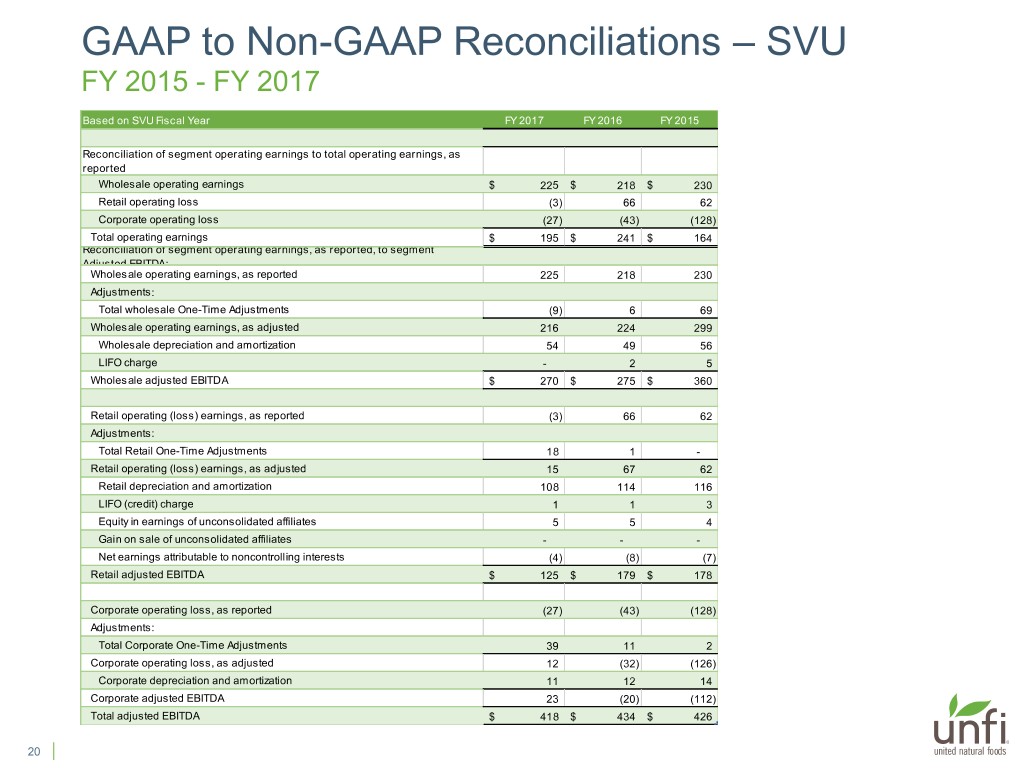
GAAP to Non-GAAP Reconciliations – SVU FY 2015 - FY 2017 Based on SVU Fiscal Year FY 2017 FY 2016 FY 2015 Reconciliation of segment operating earnings to total operating earnings, as reported Wholesale operating earnings $ 225 $ 218 $ 230 Retail operating loss (3) 66 62 Corporate operating loss (27) (43) (128) Total operating earnings $ 195 $ 241 $ 164 Reconciliation of segment operating earnings, as reported, to segment Adjusted EBITDA: Wholesale operating earnings, as reported 225 218 230 Adjustments: Total wholesale One-Time Adjustments (9) 6 69 Wholesale operating earnings, as adjusted 216 224 299 Wholesale depreciation and amortization 54 49 56 LIFO charge - 2 5 Wholesale adjusted EBITDA $ 270 $ 275 $ 360 Retail operating (loss) earnings, as reported (3) 66 62 Adjustments: Total Retail One-Time Adjustments 18 1 - Retail operating (loss) earnings, as adjusted 15 67 62 Retail depreciation and amortization 108 114 116 LIFO (credit) charge 1 1 3 Equity in earnings of unconsolidated affiliates 5 5 4 Gain on sale of unconsolidated affiliates - - - Net earnings attributable to noncontrolling interests (4) (8) (7) Retail adjusted EBITDA $ 125 $ 179 $ 178 Corporate operating loss, as reported (27) (43) (128) Adjustments: Total Corporate One-Time Adjustments 39 11 2 Corporate operating loss, as adjusted 12 (32) (126) Corporate depreciation and amortization 11 12 14 Corporate adjusted EBITDA 23 (20) (112) Total adjusted EBITDA $ 418 $ 434 $ 426 20
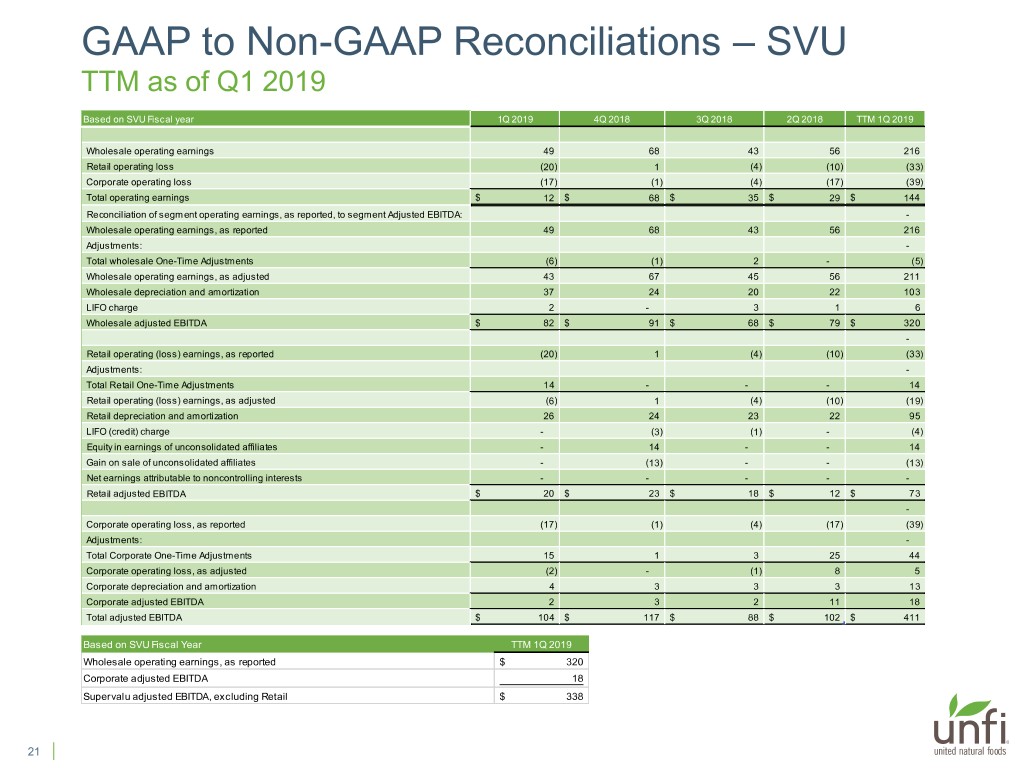
GAAP to Non-GAAP Reconciliations – SVU TTM as of Q1 2019 Based on SVU Fiscal year 1Q 2019 4Q 2018 3Q 2018 2Q 2018 TTM 1Q 2019 Wholesale operating earnings 49 68 43 56 216 Retail operating loss (20) 1 (4) (10) (33) Corporate operating loss (17) (1) (4) (17) (39) Total operating earnings $ 12 $ 68 $ 35 $ 29 $ 144 Reconciliation of segment operating earnings, as reported, to segment Adjusted EBITDA: - Wholesale operating earnings, as reported 49 68 43 56 216 Adjustments: - Total wholesale One-Time Adjustments (6) (1) 2 - (5) Wholesale operating earnings, as adjusted 43 67 45 56 211 Wholesale depreciation and amortization 37 24 20 22 103 LIFO charge 2 - 3 1 6 Wholesale adjusted EBITDA $ 82 $ 91 $ 68 $ 79 $ 320 - Retail operating (loss) earnings, as reported (20) 1 (4) (10) (33) Adjustments: - Total Retail One-Time Adjustments 14 - - - 14 Retail operating (loss) earnings, as adjusted (6) 1 (4) (10) (19) Retail depreciation and amortization 26 24 23 22 95 LIFO (credit) charge - (3) (1) - (4) Equity in earnings of unconsolidated affiliates - 14 - - 14 Gain on sale of unconsolidated affiliates - (13) - - (13) Net earnings attributable to noncontrolling interests - - - - - Retail adjusted EBITDA $ 20 $ 23 $ 18 $ 12 $ 73 - Corporate operating loss, as reported (17) (1) (4) (17) (39) Adjustments: - Total Corporate One-Time Adjustments 15 1 3 25 44 Corporate operating loss, as adjusted (2) - (1) 8 5 Corporate depreciation and amortization 4 3 3 3 13 Corporate adjusted EBITDA 2 3 2 11 18 Total adjusted EBITDA $ 104 $ 117 $ 88 $ 102 $ 411 Based on SVU Fiscal Year TTM 1Q 2019 Wholesale operating earnings, as reported $ 320 Corporate adjusted EBITDA 18 Supervalu adjusted EBITDA, excluding Retail $ 338 21
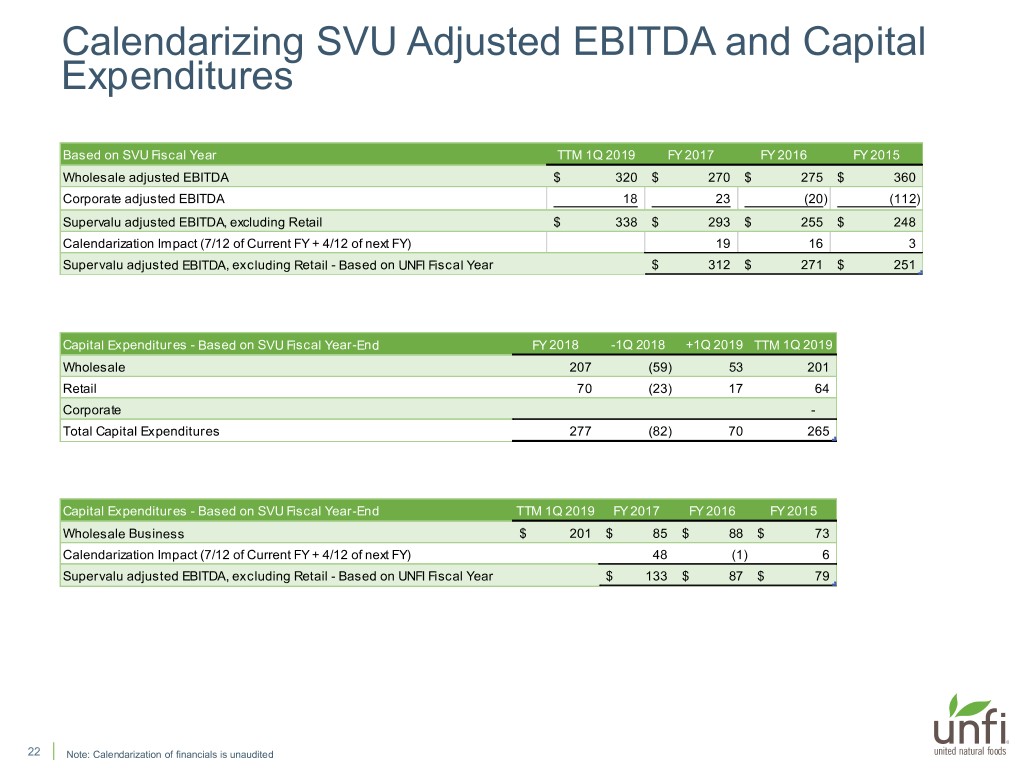
Calendarizing SVU Adjusted EBITDA and Capital Expenditures Based on SVU Fiscal Year TTM 1Q 2019 FY 2017 FY 2016 FY 2015 Wholesale adjusted EBITDA $ 320 $ 270 $ 275 $ 360 Corporate adjusted EBITDA 18 23 (20) (112) Supervalu adjusted EBITDA, excluding Retail $ 338 $ 293 $ 255 $ 248 Calendarization Impact (7/12 of Current FY + 4/12 of next FY) 19 16 3 Supervalu adjusted EBITDA, excluding Retail - Based on UNFI Fiscal Year $ 312 $ 271 $ 251 Capital Expenditures - Based on SVU Fiscal Year-End FY 2018 -1Q 2018 +1Q 2019 TTM 1Q 2019 Wholesale 207 (59) 53 201 Retail 70 (23) 17 64 Corporate - Total Capital Expenditures 277 (82) 70 265 Capital Expenditures - Based on SVU Fiscal Year-End TTM 1Q 2019 FY 2017 FY 2016 FY 2015 Wholesale Business $ 201 $ 85 $ 88 $ 73 Calendarization Impact (7/12 of Current FY + 4/12 of next FY) 48 (1) 6 Supervalu adjusted EBITDA, excluding Retail - Based on UNFI Fiscal Year $ 133 $ 87 $ 79 22 Note: Calendarization of financials is unaudited
