Attached files
UNITED STATES
SECURITIES AND EXCHANGE COMMISSION
Washington, D.C. 20549
FORM 10-K
X | ANNUAL REPORT PURSUANT TO SECTION 13 OR 15(d) OF THE SECURITIES EXCHANGE ACT OF 1934 | |
For the fiscal year ended July 30, 2016 | ||
or | ||
__ | TRANSITION REPORT PURSUANT TO SECTION 13 OR 15(d) OF THE SECURITIES EXCHANGE ACT OF 1934 | |
For the transition period from _______ to _______ | ||
Commission File Number: 0-21531
UNITED NATURAL FOODS, INC.
(Exact name of registrant as specified in its charter)
Delaware | 05-0376157 | |
(State or other jurisdiction of incorporation or organization) | (I.R.S. Employer Identification No.) | |
313 Iron Horse Way, Providence, RI 02908 (Address of principal executive offices) (Zip Code) | ||
Registrant's telephone number, including area code: (401) 528-8634 | ||
Securities registered pursuant to Section 12(b) of the Act:
Title of each class | Name of each exchange on which registered | |
Common Stock, par value $0.01 per share | NASDAQ Global Select Market | |
Securities registered pursuant to Section 12(g) of the Act: None
Indicate by check mark if the registrant is a well-known seasoned issuer, as defined in Rule 405 of the Securities Act. Yes X No __
Indicate by check mark if the registrant is not required to file reports pursuant to Section 13 or Section 15(d) of the Act. Yes __ No X
Indicate by check mark whether the registrant (1) has filed all reports required to be filed by Section 13 or 15(d) of the Securities Exchange Act of 1934 during the preceding 12 months (or for such shorter period that the registrant was required to file such reports), and (2) has been subject to such filing requirements for the past 90 days. Yes X No __
Indicate by check mark whether the registrant has submitted electronically and posted on its corporate Web site, if any, every Interactive Data File required to be submitted and posted pursuant to Rule 405 of Regulation S-T during the preceding 12 months (or for such shorter period that the registrant was required to submit and post such files). Yes X No __
Indicate by check mark if disclosure of delinquent filers pursuant to Item 405 of Regulation S-K is not contained herein, and will not be contained, to the best of registrant's knowledge, in definitive proxy or information statements incorporated by reference in Part III of this Form 10-K or any amendment to this Form 10-K __
Indicate by check mark whether the registrant is a large accelerated filer, an accelerated filer, a non-accelerated filer or a smaller reporting company. See the definitions of "large accelerated filer," "accelerated filer" and "smaller reporting company" in Rule 12b-2 of the Exchange Act.
Large Accelerated Filer X | Accelerated Filer __ | |
Non-accelerated Filer __ (Do not check if a smaller reporting company) | Smaller Reporting Company __ | |
Indicate by check mark whether the registrant is a shell company (as defined in Rule 12b-2 of the Act). Yes __ No X
The aggregate market value of the common stock held by non-affiliates of the registrant was $1,762,586,087 based upon the closing price of the registrant's common stock on the Nasdaq Global Select Market® on January 29, 2016. The number of shares of the registrant's common stock, par value $0.01 per share, outstanding as of September 12, 2016 was 50,388,499.
DOCUMENTS INCORPORATED BY REFERENCE
Portions of the registrant's definitive Proxy Statement for the Annual Meeting of Stockholders to be held on December 15, 2016 are incorporated herein by reference into Part III of this Annual Report on Form 10-K.
UNITED NATURAL FOODS, INC.
FORM 10-K
TABLE OF CONTENTS
Section | Page | |||
PART I.
ITEM 1. BUSINESS
Unless otherwise specified, references to "United Natural Foods," "UNFI," "we," "us," "our" or "the Company" in this Annual Report on Form 10-K ("Annual Report" or "Report") mean United Natural Foods, Inc. and all entities included in our consolidated financial statements. See the consolidated financial statements and notes thereto included in "Item 8. Financial Statements and Supplementary Data" of this Report for information regarding our financial performance.
Overview
We believe we are a leading distributor based on sales of natural, organic and specialty foods and non-food products in the United States and Canada, and that our thirty-three distribution centers, representing approximately 8.7 million square feet of warehouse space, provide us with the largest capacity of any North American-based distributor principally focused on the natural, organic and specialty products industry. We offer more than 100,000 high-quality natural, organic and specialty foods and non-food products, consisting of national, regional and private label brands grouped into six product categories: grocery and general merchandise, produce, perishables and frozen foods, nutritional supplements and sports nutrition, bulk and foodservice products and personal care items. We serve more than 43,000 customer locations primarily located across the United States and Canada which can be classified as follows:
• | independently owned natural products retailers, which include single store and chain accounts (excluding Supernatural), which carry more than 90% natural products and buying clubs of consumer groups joined to buy products; |
• | supernatural chains, which consist of chain accounts that are national in scope and carry greater than 90% natural products, and at this time currently consists solely of Whole Foods Market, Inc. ("Whole Foods Market"); |
• | supermarkets, which include accounts that also carry conventional products, and at this time currently include chain accounts, supermarket independents, and gourmet and ethnic specialty stores; and |
• | other, which includes foodservice, e-commerce and international customers outside of Canada. |
We were the first organic food distribution network in the United States designated as a "Certified Organic Distributor" by Quality Assurance International, Inc. ("QAI"), an organic certifying agency accredited by the United States Department of Agriculture ("USDA"). This process involved a comprehensive review by QAI of our operating and purchasing systems and procedures. This certification covers all of our broadline distribution centers in the United States, except for facilities acquired in connection with the acquisitions of Tony's Fine Foods ("Tony's"), Haddon House Food Products Inc. ("Haddon"), Nor-Cal Produce, Inc. ("Nor-Cal") and Gourmet Guru Inc. ("Gourmet Guru"). Although not designated as a "Certified Organic Distributor" by QAI, the three Tony's California locations are certified as Organic by the State of California Department of Public Health Food and Drug Branch, and Nor-Cal is currently registered with the California Department of Food and Agriculture Organic Program as an organic handler. In addition, our Canadian distribution centers in British Columbia, Ontario and Quebec all hold one of the following organic distributor certifications: QAI, EcoCert Canada or ProCert Canada. Our distribution center located in Ontario also offers a large selection of Kosher certified, non-organic products.
Since the formation of our predecessor in 1976, we have grown our business both organically and through acquisitions which have expanded our distribution network, product selection and customer base. Since fiscal 2006, our net sales have increased at a compounded annual growth rate of 13.3%. In recent years, our sales to existing and new customers have increased through the continued growth of the natural and organic products industry in general; increased market share through our high-quality service and broader product selection, including specialty products, the acquisition of, or merger with, natural, organic, conventional produce and specialty product distributors; our efforts to increase the number of conventional supermarket customers to whom we distribute products; the expansion of our existing distribution centers; the construction of new distribution centers; the introduction of new products and the development of our own line of natural and organic branded products. Through these efforts, we believe that we have broadened our geographic penetration, expanded our customer base, enhanced and diversified our product selection and increased our market share.
We have been the primary distributor to Whole Foods Market for more than eighteen years. Under the terms of our agreement with Whole Foods Market, we serve as the primary distributor to Whole Foods Market in all of its regions in the United States. Our agreement with Whole Foods Market expires on September 28, 2025.
In July 2014, we completed the acquisition of all of the outstanding capital stock of Tony's, through our wholly-owned subsidiary UNFI West, Inc. ("UNFI West"), for consideration of approximately $202.7 million. With the completion of the transaction, Tony's became a wholly-owned subsidiary and continues to operate as Tony's Fine Foods. Founded in 1934 by the Ingoglia family, Tony's is headquartered in West Sacramento, California and is a leading distributor of perishable food products, including a wide array of specialty protein, cheese, deli, food service and bakery goods to retail and specialty grocers, food service customers and other distribution companies principally located throughout the Western United States, as well as Alaska and Hawaii. We believe that the acquisition of Tony's accomplished certain of our strategic objectives as Tony's has provided us with a platform
1
for expanding both our high-growth perishable product offerings and our distribution footprint in the Western Region of the United States.
During fiscal 2015, we began shipping customers both center of the store products and an enhanced selection of fresh, perishable products. Our customers utilized both UNFI’s broadline and Tony's offerings, including grocery, refrigerated, protein, specialty cheese and prepared foods. Our customers’ broad utilization supports our belief that there is significant value in UNFI's position as a leading provider of logistics, distribution and category management for both center store and perimeter products. Additionally, we believe that gourmet and ethnic products and fresh foods represent significant incremental growth opportunities for UNFI and as a result we acquired Haddon, a leading distributor of gourmet and ethnic products in the Eastern United States in May 2016.
In March 2016, the Company acquired certain assets of Global Organic/Specialty Source, Inc. and related affiliates (collectively "Global Organic") through our wholly owned subsidiary Albert's Organics, Inc. ("Albert's"), for consideration of approximately $20.6 million in cash. Global Organic is a premier distributor of organic fruits, vegetables, juices, milk, eggs, nuts, and coffee located in Sarasota, Florida serving customer locations across the Southeastern United States. Global Organic's operations have been combined with the existing Albert's business in the Southeast and operate as Albert's.
In March 2016, the Company acquired all of the outstanding stock of Nor-Cal and an affiliated entity as well as certain real estate, for approximately $68.6 million in cash, subject to certain customary post-closing adjustments. With the completion of the transaction, Nor-Cal became a wholly-owned subsidiary and continues to operate as Nor-Cal Produce, Inc. Founded in 1972, Nor-Cal is a distributor of conventional and organic produce and other fresh products primarily to independent retailers in Northern California, with primary operations located in West Sacramento, California. We believe that our acquisition of Nor-Cal will aid in our efforts to expand our fresh offering, particularly within the conventional produce segment.
In May 2016, the Company completed its acquisition of all of the outstanding equity interests of Haddon and certain affiliates in a cash transaction for approximately $219.1 million, subject to certain customary post-closing adjustments. With the completion of the transaction, Haddon became a wholly-owned subsidiary of UNFI and continues to operate as Haddon House Food Products, Inc. Founded in 1960, Haddon is a well-respected distributor and merchandiser of natural and organic and gourmet ethnic products throughout the Eastern United States. Haddon has a history of providing quality high touch merchandising services to their customers. Haddon has a diverse, multi-channel customer base including conventional supermarkets, gourmet food stores and independently owned product retailers. We believe that our acquisition of Haddon will expand the product and service offering that we expect to play an important role in our ongoing strategy to build out our gourmet and ethnic product categories.
In August 2016, the Company acquired all of the outstanding stock of Gourmet Guru in cash. Founded in 1996 and headquartered in Bronx, New York, Gourmet Guru is a distributor and merchandiser of fresh and organic food focusing on new and emerging brands. We believe that our acquisition of Gourmet Guru enhances our strength in finding and cultivating emerging fresh and organic brands and further expands our presence in key urban markets.
Our ability to distribute specialty food items (including ethnic, kosher and gourmet products) has accelerated our expansion into a number of high-growth business markets and allowed us to establish immediate market share in the fast-growing specialty foods market. We have now integrated specialty food products and natural and organic specialty non-food items into all of our broadline distribution centers across the United States and Canada. Due to our expansion into specialty foods, over the past several fiscal years we have been awarded new business with a number of conventional supermarkets. We believe our acquisition of Haddon will expand our capabilities in the specialty category and we expect to expand our offerings of specialty products to include those products distributed by Haddon that we did not previously distribute to our customers. We believe that the distribution of these products enhances our conventional supermarket business channel and that our complementary product lines continue to present opportunities for cross-selling.
We are a Delaware corporation based in Providence, Rhode Island, and we conduct business through our various wholly owned subsidiaries. We operated thirty-three distribution centers at our 2016 fiscal year end, and we believe that our approximately 8.7 million square feet of distribution space provide us with the largest capacity of any distributor that primarily distributes natural, organic and specialty products in the United States or Canada.
We operate thirteen natural products retail stores within the United States, located primarily in Florida (with two locations in Maryland and one in Massachusetts), through our subsidiary doing business as Earth Origins Market ("Earth Origins"). In the first quarter of fiscal 2017, the Company closed two of these store locations that had been underperforming. We believe that our retail business serves as a natural complement to our distribution business because it enables us to develop new marketing programs and improve customer service. In addition, our subsidiary doing business as Woodstock Farms Manufacturing specializes in importing, roasting, packaging and the distribution of nuts, dried fruit, seeds, trail mixes, granola, natural and organic snack items and confections for our customers and in branded products of our own.
2
Our Industry
The natural products industry encompasses a wide range of products including organic and non-organic foods, nutritional, herbal and sports supplements, toiletries and personal care items, naturally-based cosmetics, natural/homeopathic medicines, pet products and cleaning agents. According to The Natural Foods Merchandiser, a leading natural products industry trade publication, sales for all types of natural products were $131.2 billion in calendar 2015, a growth of $10.8 billion or approximately 9.0% from calendar 2014. According to The Specialty Food Association, a leading specialty food industry trade publication, sales in calendar 2015 were $120.5 billion, representing growth of 21.3% from calendar 2013. We believe the growth of the natural and specialty products industries is a result of the increasing demand by consumers for a healthy lifestyle, food safety and environmental sustainability.
Our Operating Structure
Our operations are comprised of three principal operating divisions. These operating divisions are:
• | our wholesale division, which includes: |
◦ | our broadline natural, organic and specialty distribution business in the United States; |
◦ | UNFI Canada, Inc. ("UNFI Canada"), which is our natural, organic and specialty distribution business in Canada; |
◦ | Tony's, which is a leading distributor of a wide array of specialty protein, cheese, deli, food service and bakery goods, principally throughout the Western United States; |
◦ | Albert's, which is a leading distributor of organically grown produce and non-produce perishable items within the United States; |
◦ | Nor-Cal, a distributor of organic and conventional produce and non-produce perishable items in Northern California; |
◦ | Haddon, a distributor and merchandiser of natural and organic specialty and gourmet ethnic products throughout the Eastern United States; and |
◦ | Select Nutrition, which distributes vitamins, minerals and supplements; |
• | our retail division, consisting of Earth Origins, which operates our thirteen natural products retail stores within the United States; and |
• | our manufacturing and branded products divisions, consisting of |
◦ | Woodstock Farms Manufacturing, which specializes in importing, roasting, packaging and the distribution of nuts, dried fruit, seeds, trail mixes, granola, natural and organic snack items and confections; and |
◦ | our Blue Marble Brands branded product lines. |
Wholesale Division
Our broadline distribution business is organized into three regions—our Eastern Region, Western Region and our Canadian Region. We distribute natural, organic and specialty products in all of our product categories to customers in the Eastern and Midwestern portions of the United States through our Eastern Region and to customers in the Western and Central portions of the United States through our Western Region. Our Canadian Region distributes natural, organic and specialty products in all of our product categories to all of our customers in Canada. As of our 2016 fiscal year end, our Eastern Region operated ten distribution centers, which provided approximately 3.6 million square feet of warehouse space, our Western Region operated seven distribution centers, which provided approximately 2.9 million square feet of warehouse space and our Canadian Region operated four distribution centers, which provided approximately 0.3 million square feet of warehouse space.
Through Tony's, we distribute perishable food products, including a wide array of specialty protein, cheese, deli, food service and bakery goods. Tony's operates out of four distribution centers strategically located on the West coast in California and Washington, providing approximately 0.5 million square feet of warehouse space. The three California locations are certified as Organic by the State of California Department of Public Health-Food and Drug Branch. In addition to the four Tony's facilities, the Company has begun to distribute Tony's perishable products in other broadline distribution centers, including our Aurora, Colorado facility.
Through Albert's, we distribute organically grown produce and non-produce perishables, such as organic milk, dressings, eggs, juices, poultry and various other refrigerated specialty items. Albert's operates out of four distribution centers strategically located throughout the United States, providing approximately 0.3 million square feet of warehouse space, and is designated as a "Certified Organic Distributor" by QAI.
Through Nor-Cal, we distribute conventional and organic produce and other fresh products principally in Northern California. Nor-Cal operates out of a distribution center in West Sacramento, California, providing approximately 80,000 square feet of warehouse space.
3
Through Haddon, we distribute natural and organic and gourmet ethnic products throughout the Eastern United States. Haddon operates out of two distribution centers, strategically located in Howell Township, New Jersey and Richburg, South Carolina, providing approximately 0.7 million square feet of warehouse space. We are in the process of integrating Haddon's operations with ours and anticipate the Haddon distribution centers will become part of our broadline network in the Eastern Region. This will allow for Haddon products to be rolled out to our other broadline distribution centers.
Through Select Nutrition, we distribute more than 14,000 health and beauty aids, vitamins, minerals and supplements from distribution centers in Pennsylvania and California.
Certain of our distribution centers are shared by multiple operations within our wholesale division.
In August 2016, we launched a new initiative to organize our sales structure in the United States. We believe this initiative will bring our teams closer to retail operators and will contribute to us providing an exemplary customer experience. This new structure is regional with a Pacific, Central, and Atlantic region. Each region will have a president responsible for all our products and services within the territory, including fresh, grocery, wellness, e-commerce, food services, and ethnic gourmet. Territory managers in these regions will now sell across our complete lines of products. This change brings us to our customer more frequently with all of our service offerings and we anticipate identifying and taking advantage of sales opportunities from our customers having a single point of contact for all of our products and services.
Retail Division
We operate thirteen natural products retail stores as Earth Origins within the United States, ten of which are located in Florida, two in Maryland and one in Massachusetts. In the first quarter of fiscal 2017, the Company closed two of these store locations that had been underperforming. We believe that our retail business serves as a natural complement to our distribution business because it enables us to see market trends, develop new marketing programs and receive direct customer feedback.
We believe our natural products retail stores have a number of advantages over their competitors, including our financial strength and marketing expertise, the purchasing power resulting from group purchasing by stores within Earth Origins and the breadth of our product selection.
We believe that we benefit from certain advantages in acting as a distributor to our natural products retail stores, including our ability to:
• | control the purchases made by these stores; |
• | expand the number of high-growth, high-margin product categories, such as produce and prepared foods, within these stores; and |
• | stay abreast of the trends in the retail marketplace, which enables us to better anticipate and serve the needs of our wholesale customers. |
Additionally, as the primary natural products distributor to our retail locations, we realize significant economies of scale and operating and buying efficiencies. As an operator of natural products retail stores, we also have the ability to test market select products prior to offering them nationally. We can then evaluate consumer reaction to the product without incurring significant inventory risk. We also are able to test new marketing and promotional programs within our stores prior to offering them to our wholesale customer base.
Manufacturing and Branded Products Divisions
Our subsidiary, Woodstock Farms Manufacturing, specializes in importing, roasting, packaging and the distribution of nuts, dried fruit, seeds, trail mixes, granola, natural and organic snack items and confections. We sell these items in bulk and through private label packaging arrangements with large health food, supermarket and convenience store chains and independent owners. We operate an organic (USDA and QAI) and kosher (Circle K) certified packaging, roasting, and processing facility in New Jersey that is SQF (Safety Quality Food) level 2 certified.
Our Blue Marble Brands portfolio is a collection of 15 organic, natural and specialty food brands representing more than 650 unique products. We have a dedicated team of marketing, supply chain and sales professionals that have a passion to energize our retail partners and provide consumers with affordable Non-GMO foods. Our unique Blue Marble Brands products are sold through our wholesale division, third-party distributors and directly to retailers. Our Field Day® brand is primarily sold to customers in our independent natural products retailer channel ("independent retailers"), and is meant to serve as a private label brand for independent retailers to allow them to compete with conventional supermarkets and supernatural chains which often have their own private label store brands. In connection with the acquisition of Haddon, we acquired six additional specialty food brands representing 350 unique products. We expect to combine these brands with the existing Blue Marble Brands to expand our branded product offerings.
4
Our Competitive Strengths
We believe we distinguish ourselves from our competitors through the following strengths:
We are a market leader with a nationwide presence in the United States and Canada.
We believe that we are the largest distributor of natural, organic and specialty foods and non-food products by sales in the United States and Canada, and one of the few distributors capable of meeting the natural, organic and specialty product needs of regional and local independent retailer customers, conventional supermarket chains, and the supernatural chain. The opening of a new facility in Hudson Valley, New York in September 2014 and the acquisition of the Haddon facility in Howell Township, New Jersey, has provided additional space to serve the growing New York City metropolitan market. The addition of these facilities will allow our other facilities to be deployed to further penetrate our northeastern, mid-Atlantic and southeastern markets. Also aiding in the southeast is the acquisition of Haddon's facility in Richburg, South Carolina, which further increases our capacity in the southeastern United States. We believe the opening of our facilities in Racine and Prescott, Wisconsin in June 2014 and April 2015, respectively, and Gilroy, California in February 2016, will allow us to serve the markets in and around Twin Cities, Minnesota, Greater Chicago and California, respectively, with greater operational efficiencies. We believe that our network of thirty-three distribution centers (including four in Canada) creates significant advantages over smaller national and regional distributors. Our presence across the United States and Canada in many instances positions us to have locations closer to our customers than our competitors, offer marketing and customer service programs across regions, offer a broader product selection and provide operational excellence with high service levels and same day or next day on-time deliveries.
We are an efficient distributor.
We believe that our scale affords us significant benefits within a highly fragmented industry including volume purchasing opportunities and warehouse and distribution efficiencies. Our continued growth has allowed us to expand our existing facilities and open new facilities as we seek to achieve maximum operating efficiencies, including reduced fuel and other transportation costs, and has created sufficient capacity for future growth. Some of the efficiency improvements we have instituted include the centralization of general and administrative functions, the consolidation of systems applications among physical locations and regions and the optimization of customer distribution routes. We have made significant investments in our people, facilities, equipment and technology to broaden our footprint and enhance the efficiency of our operations. Key examples in the last several years include the following:
• | In May 2013 our Albert's division commenced operations at a new 55,000 square foot distribution facility in Logan Township, New Jersey which allows us to more efficiently serve our growing customer base on the East Coast, including the New York City metropolitan market. |
• | In June 2013 we commenced operations at a new 540,000 square foot distribution center in Aurora, Colorado and consolidated all existing Aurora operations including an Albert's location and off-site storage into one building. |
• | In June 2014 we commenced operations at a new 450,000 square foot distribution center in Racine, Wisconsin. |
• | In connection with the acquisition of Tony's in July 2014, we acquired four distribution centers in California and Washington with approximately 500,000 square feet of combined distribution space. |
• | In September 2014 we commenced operations at a new 510,000 square foot distribution center in Hudson Valley, New York which allows us to service the growing New York City metropolitan market and to transfer certain routes from our York, Pennsylvania, Chesterfield, New Hampshire and Dayville, Connecticut distribution centers. |
• | In April 2015 we commenced operations at a new 300,000 square foot distribution center in Prescott, Wisconsin which services the Twin Cities market. |
• | In February 2016 we commenced operations at a new 400,000 square foot distribution center in Gilroy, California. |
• | In connection with the acquisition of Global Organic in March 2016, we acquired additional distribution capacity adjacent to our existing Sarasota, Florida facility, which increased distribution space by approximately 80,000 square feet. |
• | In connection with the acquisition of Nor-Cal in March 2016, we acquired an 80,000 square foot distribution center in West Sacramento, California. |
• | In connection with the acquisition of Haddon in May 2016, we acquired a distribution center in each of New Jersey and South Carolina with approximately 700,000 square feet of combined distribution space. |
5
We have extensive and long-standing customer relationships and provide superior service.
Throughout the 40 years of our and our predecessors' operations, we have developed long-standing customer relationships, which we believe are among the strongest in our industry. In particular, we have been the primary supplier of natural and organic products to the largest supernatural chain in the United States, Whole Foods Market, for more than 18 years. We believe a key driver of our strong customer loyalty is our superior service levels, which include accurate fulfillment of orders, timely product delivery, competitive prices and a high level of product marketing support. Our average broadline distribution in-stock service level for fiscal 2016, measured as the percentage of items ordered by customers that are delivered by the requested delivery date (excluding manufacturer out-of-stocks and discontinued items), was approximately 97%. We believe that our high distribution service levels are attributable to our experienced inventory planning and replenishment department and sophisticated warehousing, inventory control and distribution systems. Furthermore, we offer next-day delivery service to a majority of our active customers and offer multiple deliveries each week to our largest customers, which we believe differentiates us from many of our competitors.
We have an experienced, motivated management team.
Our management team has extensive experience in the retail and distribution business, including the natural, organic and specialty product industries. On average, each of our ten executive officers has over twenty-seven years of experience in the retail, natural products or food distribution industry. Furthermore, a significant portion of our management-level employees' compensation is equity based or performance based, and, therefore management is incentivized to generate continued strong operating results in the future.
Our Growth Strategy
We seek to maintain and enhance our position within the natural and organic industry in the United States and Canada and to increase our market share in the specialty products industry. Since our formation, we have grown our business organically and through the acquisition of a number of distributors and suppliers, which has expanded our distribution network, product selection and customer base. For example, we acquired our Albert's, UNFI Canada, Earth Origins, Woodstock Farms Manufacturing, Tony's, Haddon, Nor-Cal and specialty businesses.
From fiscal 2009 through fiscal 2015, our strategic plan focused on increasing market share, particularly in our conventional supermarket channel. This channel typically generates lower gross margins than our independent retailer channel, but also typically has lower operating expenses. Beginning with our acquisition of Tony's in July 2014, our strategy has shifted as we have moved more heavily into the growing market of perishable food products and focused on our "building out the store" strategy, which focuses on delivering more products sold in the perimeter of our customers' stores. Our acquisitions of Haddon, Nor-Cal and Global Organic continue this current strategy, with the addition of gourmet ethnic products and conventional produce. Our strategic plan also includes the roll-out of new technology including a national warehouse management and procurement system and transportation management system upgrade. These steps and others are intended to promote operational efficiencies and further reduce our operating expenses to offset the lower gross margins we expect with increased sales to the conventional supermarket and supernatural channels and from sales of our fresh perishable products, which can sell for a lower gross margin than our other natural, organic and specialty products.
To implement our growth strategy, we intend to continue increasing our market share of the growing natural and organic products industry by expanding our customer base, increasing our share of existing customers' business and continuing to expand and further penetrate new distribution territories. We plan to expand our presence within the specialty industry by offering new and existing customers a single wholesale distributor capable of meeting their specialty and natural and organic product needs on a national or regional basis. Key elements of our strategy include:
Expanding Our Customer Base
As of July 30, 2016, we served more than 43,000 customer locations primarily in the United States and Canada. We plan to expand our coverage of the natural and organic and specialty products industry by cultivating new customer relationships within the industry and by further developing our existing channels of distribution, such as independent natural products retailers, conventional supermarkets, mass market outlets, institutional foodservice providers, buying clubs, restaurants and gourmet stores. With the coordinated distribution of our specialty products with our natural and organic products, including our increased array of specialty protein, cheese, deli, food service and bakery offerings as a result of our acquisition of Tony's and gourmet ethnic products as a result of our acquisition of Haddon, we believe that we have the opportunity to continue gaining market share in the conventional supermarket channel as the result of our ability to offer an integrated and efficient distribution solution for our customers. We have gained new business from a number of conventional supermarket customers, including Giant-Landover, Giant Eagle, Shop-Rite, Kings, Raley's, Harris Teeter and Wegmans, partially as a result of our complementary product selection and acquisitions.
Increasing Our Market Share of Existing Customers' Business
6
We believe that we are the primary distributor of natural and organic products to the majority of our natural products customer base, including to Whole Foods Market, our largest customer. We intend to maintain our position as the primary supplier for a majority of our customers, and to add to the number of customers for which we serve as primary supplier by offering the broadest product selection in our industry at competitive prices. With the expansion of fresh, perishable and specialty product offerings, including proteins, cheeses and deli items as a result of the Tony's acquisition, and ethnic and gourmet items as a result of the Haddon acquisition, we believe that we have the ability to further meet our existing customers' needs for specialty foods and non-food products, representing an opportunity to continue to grow within the conventional supermarket, supernatural and independent channels.
Continuing to Improve the Efficiency of Our Nationwide Distribution Network
We have invested significant capital in our distribution network and infrastructure over the past five fiscal years. We are at the end of our multi-year expansion plan, which included new distribution centers in Racine, Wisconsin, Hudson Valley, New York, Prescott, Wisconsin, and Gilroy, California from which we began operations in June 2014, September 2014, April 2015 and February 2016, respectively. We believe that as a result of the opening of our Gilroy, California distribution center, and our acquisition of Haddon, which operates distribution centers in New Jersey and South Carolina, we are unlikely to open or commence construction on a new distribution center in the next twelve months.
We will strive to continue to maintain our focus on realizing efficiencies and economies of scale in purchasing, warehousing, transportation and general and administrative functions, which, combined with transportation expense savings and incremental fixed cost leverage, should lead to continued improvements in our operating performance.
Expanding into Other Distribution Channels and Geographic Markets
We believe that we will be successful in continuing to expand into the foodservice and e-commerce channels as well as continuing to develop our presence outside of the United States and Canada through our relationships with brokers primarily in Asia and the Caribbean. We will continue to seek to develop regional relationships and alliances with companies in the foodservice channel and the e-commerce channel and seek other alliances outside the United States and Canada.
Continuing to Selectively Pursue Opportunistic Acquisitions
Throughout our history, we have successfully identified, consummated and integrated multiple acquisitions. Since fiscal 2000, we have successfully completed nineteen acquisitions of distributors, manufacturers and suppliers, the most recent being the acquisitions of Haddon, Global Organic and Nor-Cal during fiscal 2016 and Gourmet Guru in the first quarter of fiscal 2017. We intend to continue to selectively pursue opportunistic acquisitions to expand the breadth of our distribution network, increase our efficiency, procure beneficial customer relationships or add additional products and capabilities.
Continuing to Provide the Leading Distribution Solution
We believe that we provide a leading distribution solution to the natural, organic and specialty products industry through our national presence, regional preferences, focus on customer service and breadth of product offerings. Our service levels, which we believe to be the highest in our industry, are attributable to our experienced inventory planning and replenishment department and our sophisticated warehousing, inventory control and distribution systems. See "—Our Focus on Technology" below for more information regarding our use of technology in our warehousing, inventory control and distribution systems.
We also offer our customers a selection of inventory management, merchandising, marketing, promotional and event management services designed to increase sales and enhance customer satisfaction. These marketing services, which primarily are utilized by customers in our independently owned natural products retailers channel and many of which are co-sponsored with suppliers, include monthly and thematic circular programs, in-store signage and assistance in product display.
Our Customers
We maintain long-standing customer relationships with independently-owned natural products retailers, supernatural chains and supermarket chains. In addition, we emphasize our relationships with new customers, such as conventional supermarkets, mass market outlets and gourmet stores, which are continually increasing their natural product offerings. The following were included among our wholesale customers for fiscal 2016:
• | Whole Foods Market, the largest supernatural chain in the United States and Canada; and |
• | Other customers, including Kroger, Natural Grocers, Wegmans, Sprouts Farmers Market, Giant-Carlisle, Stop & Shop, Giant-Landover, Giant Eagle, Hannaford, Food Lion, Bashas', Shop-Rite, Publix, Raley's, Lucky's and Fred Meyer. |
Whole Foods Market is our only customer that represented more than 10% of total net sales in fiscal 2016, and accounted for approximately 35% of our net sales.
7
Net sales by channel were adjusted in fiscal 2016 to reflect changes in the classification of customer types resulting from an in-depth analysis of our customer channel classifications. This process was undertaken to ensure consistency in reporting across all of the Company's divisions. There was no financial statement impact as a result of revising the classification of customer types. The following table lists the percentage of net sales by customer type for the fiscal years ended July 30, 2016, August 1, 2015 and August 2, 2014 after giving effect to the reclassification:
Percentage of Net Sales | |||||||||
Customer Type | 2016 | 2015 | 2014 | ||||||
Independently owned natural products retailers | 27 | % | 27 | % | 30 | % | |||
Supernatural chains | 35 | % | 34 | % | 36 | % | |||
Conventional supermarkets and mass market chains | 27 | % | 29 | % | 27 | % | |||
Other | 11 | % | 10 | % | 7 | % | |||
We distribute natural, organic and specialty foods and non-food products to customers located in the United States and Canada, as well as to customers located in other foreign countries. Our total international sales, including those by UNFI Canada, represented approximately four percent of our business in fiscal 2016 and fiscal 2015 and five percent in fiscal 2014. We believe that our sales outside the United States, as a percentage of our total sales, will expand as we seek to continue to grow our Canadian operations and our foodservice and e-commerce businesses, both of which include customers based outside of the United States.
Our Marketing Services
We offer a variety of marketing services designed to increase sales for our customers and suppliers, including consumer and trade marketing programs, as well as programs to support suppliers in understanding our markets. Trade and consumer marketing programs are supplier-sponsored programs that cater to a broad range of retail formats. These programs are designed to educate consumers, profile suppliers and increase sales for retailers, many of which do not have the resources necessary to conduct such marketing programs independently.
Our consumer marketing programs include:
• | multiple monthly, region-specific, consumer circular programs, with the participating retailer’s imprint featuring products sold by the retailer to its customers. The monthly circular programs are structured to pass through the benefit of our negotiated discounts and advertising allowances to the retailer, and also provide retailers with shelf tags corresponding to each month's promotions. We also offer a web-based tool which retailers can use to produce highly customized circulars and other marketing materials for their stores. |
• | quarterly coupon programs featuring supplier sponsored coupons, for display and distribution by participating retailers. |
• | a truck advertising program that allows our suppliers to purchase advertising space on the sides of our hundreds of trailers traveling throughout the United States and Canada, increasing brand exposure to consumers. |
Our trade marketing programs include:
• | wholesale biannual catalogs, which serve as a primary reference guide and ordering tool for retailers. |
• | a Customer Portal advertising program that allows our suppliers to advertise directly to retailers using the portal. |
• | a variety of programs with advertising focus on foodservice options designed to support accounts in that category. |
• | programs designed to generate volume purchases and retail promotions. |
• | monthly specials catalogs that highlight promotions and new product introductions. |
• | specialized catalogs for holiday and seasonal products. |
Our supplier marketing programs include:
• | ClearVue®, an information sharing program designed to improve the transparency of information and drive efficiency within the supply chain. With the availability of in-depth data and tailored reporting tools, participants are able to reduce inventory balances with the elimination of forward buys, while improving service levels. |
• | Supply Chain by ClearVue®, an information sharing program designed to provide heightened transparency to suppliers through demand planning, forecasting and procurement insights. This program offers weekly and monthly reporting enabling suppliers to identify areas of sales growth while pinpointing specific focuses in which the supplier can become more profitable. |
• | Supplier-In-Site (SIS), an information-sharing website that helps our suppliers better understand the independent natural channel in order to generate mutually beneficial incremental sales in an efficient manner. |
• | Growth incentive programs, supplier-focused high-level sales and marketing support for selected brands, which foster our partnership by building incremental, mutually profitable sales for suppliers and us. |
8
We keep current with the latest trends in the industry. Periodically, we conduct focus group sessions with certain key retailers and suppliers to ascertain their needs and allow us to better service them. We also provide our customers with:
• | quarterly reports of trends in the natural and organic industry; |
• | product data information such as best seller lists, store usage reports and catalogs; |
• | assistance with store layout designs; new store design and equipment procurement; |
• | planogramming, shelf and category management support; |
• | in-store signage and promotional materials assistance with planning and setting up product displays; |
• | shelf tags for products; and |
• | a robust customer portal with product information, search and ordering capabilities, reports and publications. |
Our Products
Our extensive selection of high-quality natural, organic and specialty foods and non-food products enables us to provide a primary source of supply to a diverse base of customers whose product needs vary significantly. We offer more than 100,000 high-quality natural, organic and specialty foods and non-food products, consisting of national brand, regional brand, private label and master distribution products, in six product categories: grocery and general merchandise, produce, perishables and frozen foods, nutritional supplements and sports nutrition, bulk and food service products and personal care items. Our branded product lines address certain needs of our customers, including providing a lower-cost label known as Field Day.
We continuously evaluate potential new products based on both existing and anticipated trends in consumer preferences and buying patterns. Our Retail Category Management and Supplier Relationship Management teams regularly attend regional and national natural, organic, specialty, ethnic and gourmet product shows to review the latest products that are likely to be of interest to retailers and consumers. We also utilize syndicated data as a compass to ensure that we are carrying the right mix of products in each of our distribution centers. We make the majority of our new product decisions at the regional level and look to carry those items through national distribution as we begin to spot an emerging trend or brand. We believe that our category review practices at the local distribution center level allow our supplier relationship managers to react quickly to changing consumer preferences and to evaluate new products and new product categories regionally. Additionally, as many of the new products that we offer are marketed on a regional basis or in our own natural products retail stores prior to being offered nationally, this enables us to evaluate consumer reaction to the products without incurring significant inventory risk. Furthermore, by exchanging regional product sales information between our regions, we are able to make more informed and timely new product decisions in each region.
We maintain a comprehensive quality assurance program. All of the products we sell that are represented as "organic" are required to be certified as such by an independent third-party agency. We maintain current certification affidavits on most organic commodities and produce in order to verify the authenticity of the product. Most potential suppliers of organic products are required to provide such third-party certifications to us before they are approved as suppliers.
Our Suppliers
We purchase our products from more than 10,000 suppliers. The majority of our suppliers are based in the United States and Canada, but we also source products from suppliers throughout Europe, Asia, Central America, South America, Africa and Australia. We believe suppliers of natural and organic products seek to distribute their products through us because we provide access to a large and growing customer base across the United States and Canada, distribute the majority of the suppliers' products and offer a wide variety of marketing programs to our customers to help sell the suppliers' products. Substantially all product categories that we distribute are available from a number of suppliers and, therefore, we are not dependent on any single source of supply for any product category. In addition, although we have exclusive distribution arrangements and vendor support programs with several suppliers, none of our suppliers account for more than 10% of our total purchases in fiscal 2016. Our largest supplier, Hain Celestial Group, Inc. ("Hain"), accounted for approximately 5% of our total purchases in fiscal 2016. However, we believe the product categories we purchase from Hain can be purchased from a number of other suppliers.
We have positioned ourselves as one of the largest purchasers of organically grown bulk products in the natural and organic products industry by centralizing our purchase of nuts, seeds, grains, flours and dried foods. As a result, we are able to negotiate purchases from suppliers on the basis of volume and other considerations that may include discounted pricing or prompt payment discounts. Furthermore, some of our purchase arrangements include the right of return to the supplier with respect to products that we do not sell in a certain period of time. As described under "Our Products" above, each region is responsible for placing its own orders and can select the products that it believes will most appeal to its customers, although each region is able to participate in our company-wide purchasing programs. Our outstanding commitments for the purchase of inventory were approximately $18.9 million as of July 30, 2016.
9
Our Distribution System
We have carefully chosen the sites for our distribution centers to provide direct access to our regional markets. This proximity allows us to reduce our transportation costs relative to those of our competitors that seek to service these customers from locations that are often several hundred miles away. We believe that we incur lower inbound freight expense than our regional competitors, because our scale allows us to buy full and partial truckloads of products. Products are delivered to our distribution centers primarily by our fleet of leased trucks, contract carriers and the suppliers themselves. When financially advantageous, we backhaul between vendors or satellite, staging facilities and our distribution centers using our own trucks. Additionally, we generally can redistribute overstocks and inventory imbalances between our distribution centers if needed, which helps to reduce out of stocks and to sell perishable products prior to their expiration date.
We lease most of our trucks from national leasing companies such as Ryder Truck Leasing and Penske Truck Leasing, which in some cases maintain facilities on our premises for the maintenance and service of these vehicles. Other trucks are leased from regional firms that offer competitive services.
We ship certain orders for supplements or for items that are destined for areas outside of regular delivery routes through United States Postal Service, the United Parcel Service and other independent carriers. Deliveries to areas outside the continental United States and Canada are typically shipped by ocean-going containers on a weekly basis.
Our Focus on Technology
We have made significant investments in distribution, financial, information and warehouse management systems. We continually evaluate and upgrade our management information systems at our regional operations in an effort to make the systems more efficient, cost-effective and responsive to customer needs. These systems include functionality in radio frequency inventory control, pick-to-voice systems, pick-to-light systems, computer-assisted order processing and slot locator/retrieval assignment systems. At most of our receiving docks, warehouse associates attach computer-generated, preprinted locator tags to inbound products. These tags contain the expiration date, locations, quantity, lot number and other information about the products in bar code format. Customer returns are processed by scanning the UPC bar codes. We also employ a management information system that enables us to lower our inbound transportation costs by making optimum use of our own fleet of trucks or by consolidating deliveries into full truckloads. Orders from multiple suppliers and multiple distribution centers are consolidated into single truckloads for efficient use of available vehicle capacity and return-haul trips. In addition, we utilize route efficiency software that assists us in developing the most efficient routes for our outbound trucks. We are in the process of rolling out a national warehouse management and procurement system to convert our existing facilities into a single warehouse management and supply chain platform ("WMS"). We have completed WMS system conversions at our Lancaster, Texas, Ridgefield, Washington, Auburn, Washington, Prescott, Wisconsin, Racine, Wisconsin, Hudson Valley, New York, Auburn, California, Iowa City, Iowa, Greenwood, Indiana, Dayville, Connecticut and Gilroy, California facilities, and we expect to complete the roll-out to all of our existing U.S. broadline facilities by the end of fiscal 2018.
Intellectual Property
We do not own or have the right to use any patent, trademark, trade name, license, franchise, or concession which upon loss would have a material adverse effect on our results of operations or financial condition.
Competition
Our largest competition comes from direct distribution, whereby a customer reaches a product volume level that justifies distribution directly from the manufacturer in order to obtain a lower price. Our major wholesale distribution competitor in both the United States and Canada is KeHE Distributors, LLC ("Kehe"). In addition to its natural and organic products, Kehe distributes specialty food products and markets its own private label program. Kehe's subsidiary, Tree of Life, has also earned QAI certification. We also compete in the United States and Canada with numerous smaller regional and local distributors of natural, organic, ethnic, kosher, gourmet and other specialty foods that focus on niche or regional markets, and with national, regional and local distributors of conventional groceries who have significantly expanded their natural and organic product offerings in recent years and companies that distribute to their own retail facilities.
We believe that distributors in the natural and specialty products industries primarily compete on distribution service levels, product quality, depth of inventory selection, price and quality of customer service. We believe that we currently compete effectively with respect to each of these factors.
Our natural products retail stores compete against other natural products outlets, supernatural chains, conventional supermarkets and specialty stores. We believe that retailers of natural products compete principally on product quality and selection, price, customer service, knowledge of personnel and convenience of location. We believe that we currently compete effectively with respect to each of these factors.
10
Government Regulation
Our operations and many of the products that we distribute in the United States are subject to regulation by state and local health departments, the USDA and the United States Food and Drug Administration (the "FDA"), which generally impose standards for product quality and sanitation and are responsible for the administration of bioterrorism legislation. In the United States, our facilities generally are inspected at least once annually by state or federal authorities. For certain product lines, we are also subject to the Federal Meat Inspection Act, the Poultry Products Inspection Act, the Perishable Agricultural Commodities Act, the Packers and Stockyard Act and regulations promulgated by the USDA to interpret and implement these statutory provisions. The USDA imposes standards for product safety, quality and sanitation through the federal meat and poultry inspection program.
In late 2010, the FDA Food Safety Modernization Act ("FSMA") was enacted. The FSMA represents a significant expansion of food safety requirements and FDA food safety authorities and, among other things, requires that the FDA impose comprehensive, prevention-based controls across the food supply chain, further regulates food products imported into the United States, and provides the FDA with mandatory recall authority. The FSMA requires the FDA to undertake numerous rulemakings and to issue numerous guidance documents, as well as reports, plans, standards, notices, and other tasks. As a result, implementation of the legislation is ongoing and likely to take several years.
The Surface Transportation Board and the Federal Highway Administration regulate our trucking operations. In addition, interstate motor carrier operations are subject to safety requirements prescribed by the United States Department of Transportation and other relevant federal and state agencies. Such matters as weight and dimension of equipment are also subject to federal and state regulations.
Many of our facilities in the U.S. and in Canada are subject to various environmental protection statutes and regulations, including those relating to the use of water resources and the discharge of wastewater. Further, many of our distribution facilities have ammonia-based refrigeration systems and tanks for the storage of diesel fuel, hydrogen fuel and other petroleum products which are subject to laws regulating such systems and storage tanks. Moreover, in some of our facilities we, or third parties with whom we contract, perform vehicle maintenance. Our policy is to comply with all applicable environmental and safety legal requirements. We are subject to other federal, state, provincial and local provisions relating to the protection of the environment or the discharge of materials; however, these provisions do not materially impact the use or operation of our facilities.
The failure to comply with applicable regulatory requirements could result in, among other things, administrative, civil, or criminal penalties or fines, mandatory or voluntary product recalls, warning or untitled letters, cease and desist orders against operations that are not in compliance, closure of facilities or operations, the loss, revocation, or modification of any existing licenses, permits, registrations, or approvals, or the failure to obtain additional licenses, permits, registrations, or approvals in new jurisdictions where we intend to do business, any of which could have a material adverse effect on our business, financial condition, or results of operations. These laws and regulations may change in the future and we may incur material costs in our efforts to comply with current or future laws and regulations or in any required product recalls.
We believe that we are in material compliance with all federal, provincial, state and local laws applicable to our operations.
Employees
As of July 30, 2016 we had approximately 9,554 full and part-time employees, 363 of whom (approximately 3.8%) are covered by collective bargaining agreements at our Auburn, Washington, Edison, New Jersey, Iowa City, Iowa, Moreno Valley, California, Dayville, Connecticut and Nor-Cal's West Sacramento, California facilities. The Auburn, Washington, Edison, New Jersey, Iowa City, Iowa, Moreno Valley, California, Dayville, Connecticut and West Sacramento, California agreements expire in February 2017, June 2017, June 2017, March 2019, July 2019 and May 2020, respectively. We have in the past been the focus of union-organizing efforts, and we believe it is likely that we will be the focus of similar efforts in the future.
In July 2016, the National Labor Relations Board certified the election results of our drivers in Hudson Valley, New York to be represented by the Teamsters union. We are in the process of negotiating a collective bargaining agreement with these employees.
Seasonality
Generally, we do not experience any material seasonality. However, our sales and operating results may vary significantly from quarter to quarter due to factors such as changes in our operating expenses, management's ability to execute our operating and growth strategies, personnel changes, demand for our products, supply shortages and general economic conditions.
Available Information
Our internet address is http://www.unfi.com. The contents of our website are not part of this Annual Report on Form 10-K, and our internet address is included in this document as an inactive textual reference only. We make our Annual Report on Form 10-
11
K, Quarterly Reports on Form 10-Q, Current Reports on Form 8-K and all amendments to those reports filed or furnished pursuant to Section 13(a) or 15(d) of the Securities Exchange Act of 1934, as amended (the "Exchange Act") available free of charge through our website as soon as reasonably practicable after we file such reports with, or furnish such reports to, the Securities and Exchange Commission.
We have adopted a code of conduct and ethics that applies to our Chief Executive Officer, Chief Financial Officer and employees within our finance operations and sales departments. Our code of conduct and ethics is publicly available on our website at www.unfi.com and is available free of charge by writing to United Natural Foods, Inc., 313 Iron Horse Way, Providence, Rhode Island 02908, Attn: Investor Relations. We intend to make any legally required disclosures regarding amendments to, or waivers of, the provisions of the code of conduct and ethics on our website at www.unfi.com. Please note that our website address is provided as an inactive textual reference only.
Executive Officers of the Registrant
Our executive officers are elected on an annual basis and serve at the discretion of our Board of Directors. Our executive officers and their ages as of September 28, 2016 are listed below:
Name | Age | Position | ||
Steven L. Spinner | 56 | President and Chief Executive Officer | ||
Michael P. Zechmeister | 49 | Senior Vice President, Chief Financial Officer and Treasurer | ||
Sean F. Griffin | 57 | Chief Operating Officer | ||
Danielle Benedict | 43 | Senior Vice President, Human Resources | ||
Eric A. Dorne | 55 | Chief Administrative and Information Officer | ||
Paul S. Green | 54 | President, Pacific Region | ||
John M. Hummel | 45 | President, Central Region | ||
Craig H. Smith | 57 | Senior Vice President, Fresh Sales | ||
Christopher P. Testa | 46 | President, Atlantic Region | ||
Joseph J. Traficanti | 65 | Senior Vice President, General Counsel, Chief Compliance Officer and Corporate Secretary | ||
Steven L. Spinner has served as our President and Chief Executive Officer and as a member of our Board of Directors since September 2008. Mr. Spinner served as the Interim President of our Eastern Region, from September 2010 to December 2010. Prior to joining us in September 2008, Mr. Spinner served as a director and as Chief Executive Officer of Performance Food Group Company ("PFG") from October 2006 to May 2008, when PFG was acquired by affiliates of The Blackstone Group and Wellspring Capital Management. Mr. Spinner previously had served as PFG's President and Chief Operating Officer beginning in May 2005. Mr. Spinner served as PFG's Senior Vice President and Chief Executive Officer—Broadline Division from February 2002 to May 2005 and as PFG's Broadline Division President from August 2001 to February 2002. Mr. Spinner has served as director of ArcBest Corporation since July 2011 and as its Lead Independent Director since April 2016.
Michael P. Zechmeister has served as our Senior Vice President since September 2015 and as our Chief Financial Officer since October 2015. Prior to joining us, Mr. Zechmeister served in a variety of senior finance roles with General Mills, Inc., including most recently as Vice President, Finance at Yoplait USA from 2012 to September 2015. In addition, Mr. Zechmeister was Vice President and Treasurer from 2010 to 2012, Vice President, Finance US Retail Sales from 2007 to 2010 and Vice President, Finance, Pillsbury Division from 2005 to 2007.
Sean F. Griffin has served as our Chief Operating Officer since September 2014. Mr. Griffin previously served as our Senior Vice President, Group President from June 2012 to September 2014 and as our Senior Vice President, National Distribution from January 2010 to June 2012. Prior to joining us, Mr. Griffin was East Region Broadline President of PFG. Previously he served as President of PFG in Springfield, MA from 2003 until 2008. He began his career with Sysco Corporation in 1986 and has held various leadership positions in the foodservice distribution industry with U.S. Foodservice, Alliant Foodservice and Sysco Corporation.
Danielle Benedict has served as our Senior Vice President Human Resources since May 2016. Mrs. Benedict previously served as our National Vice President Human Resources from August 2014 to May 2016 and as our Director Compensation & Benefits from April 2013 to August 2014. Prior to joining us, Ms. Benedict was Vice President Human Resources & Leadership Development at Clean Harbors Environmental Services from 2007 to 2013. She began her career with Dunkin Brands, Inc. in 1999.
12
Eric A. Dorne was appointed as our Chief Administrative and Information Officer in September 2016. Mr. Dorne previously served as our Senior Vice President, Chief Information Officer from September 2011 to September 2016. Prior to joining us, Mr. Dorne was Senior Vice President and Chief Information Officer for The Great Atlantic & Pacific Tea Company, Inc., the parent company of the A&P, Pathmark, SuperFresh, Food Emporium and Waldbaum's supermarket chains located in the Eastern United States from January 2011 to August 2011, and Vice President and Chief Information Officer from August 2005 to January 2011. In his more than 30 years at The Great Atlantic & Pacific Tea Company, Mr. Dorne held various executive positions including Vice President of Enterprise IT Application Management and Development, Vice President of Store Operations Systems and Director of Retail Support Services.
Paul S. Green has served as our President, Pacific Region since August 2016. Mr. Green previously served as our Senior Vice President, Operations from June 2014 to August 2016 and Vice President, Operations from May 2010 to June 2014. Prior to joining us, Mr. Green was Vice President of Sales for PFG-Springfield, MA from 2008 until 2010 and Vice President of Operations for PFG-Springfield, MA from 2005 until 2008. Mr. Green held various other leadership positions in his ten years at PFG. He began his career with Fleming Foods and held several positions over 16 years.
John M. Hummel has served as our President, Central Region, since August 2016. Mr. Hummel previously served as our Vice President of Distribution, Central Region, from May 2013 until July 2016. Prior to joining us, he was Corporate Vice President of Operations for Reinhart FoodService, LLC, a division of Reyes Holdings, LLC, from 2005 until 2013. In his 24 years at Reinhart, he held other key divisional leadership roles, including Director of Physical Distribution for their largest location in Milwaukee, Wisconsin. He began his career with Walter's Food Service, Inc., in 1987 and has held various leadership positions in other large scale foodservice distribution organizations such as PepsiCo Food Systems/AmeriServe and Institution Food House.
Craig H. Smith has served as our Senior Vice President, Fresh Sales since August 2016. Mr. Smith previously served as our Senior Vice President, National Sales and Service from September 2013 to July 2016. Prior to that, Mr. Smith served as our President of the Eastern Region from December 2010 to August 2013. Prior to joining us, Mr. Smith was Atlantic Region President of U.S. Foodservice, a leading broadline foodservice distributor of national, private label, and signature brand items in the United States from May 2008 to December 2010. In his 17 years at U.S. Foodservice, Mr. Smith held various executive positions including Senior Vice President Street Sales, North Region Zone President, Detroit Market President and Boston Market President. Prior to U.S. Foodservice, Mr. Smith held several positions at foodservice industry manufacturer and distributor Rykoff-Sexton, Inc. from 1982 until 1993.
Christopher P. Testa has served as our President, Atlantic Region since August 2016. Mr. Testa previously served as President, Woodstock Farms Manufacturing since September 2012 and President, Blue Marble Brands since August 2009. Prior to joining us, Mr. Testa served as Vice President of Marketing for Cadbury Schweppes Americas Beverages from August 2002 to May 2005 and as CEO of Wild Waters, Inc. from May 2005 to August 2009.
Joseph J. Traficanti has served as our Senior Vice President, General Counsel, Chief Compliance Officer and Corporate Secretary since April 2009. Prior to joining us, Mr. Traficanti served as Senior Vice President, General Counsel, Chief Compliance Officer and Corporate Secretary of PFG from November 2004 until April 2009.
ITEM 1A. RISK FACTORS
Our business, financial condition and results of operations are subject to various risks and uncertainties, including those described below and elsewhere in this Annual Report on Form 10-K. This section discusses factors that, individually or in the aggregate, we think could cause our actual results to differ materially from expected and historical results. Our business, financial condition or results of operations could be materially adversely affected by any of these risks.
We note these factors for investors as permitted by the Private Securities Litigation Reform Act of 1995. You should understand that it is not possible to predict or identify all such factors. Consequently, you should not consider the following to be a complete discussion of all potential risks or uncertainties applicable to our business. See "Item 7. Management's Discussion and Analysis of Financial Condition and Results of Operations—Forward-Looking Statements."
We depend heavily on our principal customers and our success is heavily dependent on our principal customers' ability to grow their business.
Whole Foods Market accounted for approximately 35% of our net sales in fiscal 2016. We serve as the primary distributor of natural, organic and specialty non-perishable products to Whole Foods Market in all of its regions in the United States under the terms of our distribution agreement which expires on September 28, 2025. Through our Tony's subsidiary, we also sell certain specialty protein, cheese, and deli items to certain Whole Foods Market stores in California and other states in the Western United States. Whole Foods Market was Tony's largest customer in fiscal 2016. Our ability to maintain a close mutually beneficial relationship with Whole Foods Market is an important element to our continued growth.
13
The loss or cancellation of business from Whole Foods Market, including from increased distribution to their own facilities, closures of their stores or reductions in the amount of products that Whole Food Market sells to its customers, could materially and adversely affect our business, financial condition or results of operations. Similarly, if Whole Foods Market is not able to grow its business, including as a result of a reduction in the level of discretionary spending by its customers or competition from other retailers, our business, financial condition or results of operations may be materially and adversely affected.
In addition to our dependence on Whole Foods Market, we are also dependent upon sales to our conventional supermarket customers. Net sales to these customers accounted for approximately 27% of our total net sales in fiscal 2016. To the extent that customers in this group make decisions to utilize alternative sources of products, whether other distributors or through self distribution, our business, financial condition or results of operations may be materially and adversely affected.
Our operations are sensitive to economic downturns.
The grocery industry is sensitive to national and regional economic conditions and the demand for the products that we distribute, particularly our specialty products, may be adversely affected from time to time by economic downturns that impact consumer spending, including discretionary spending. Future economic conditions such as employment levels, business conditions, housing starts, interest rates, inflation rates, energy and fuel costs, fund costs and tax rates could reduce consumer spending or change consumer purchasing habits. Among these changes could be a reduction in the number of natural and organic products that consumers purchase where there are non-organic, which we refer to as conventional, alternatives, given that many natural and organic products, and particularly natural and organic foods, often have higher retail prices than do their conventional counterparts.
Our business is a low margin business and our profit margins may decrease due to consolidation in the grocery industry and our focus on sales to the conventional supermarket channel.
The grocery distribution industry generally is characterized by relatively high volume of sales with relatively low profit margins. The continuing consolidation of retailers in the natural products industry and the growth of supernatural chains may reduce our profit margins in the future as more customers qualify for greater volume discounts, and we experience pricing pressures from suppliers and retailers. Sales to customers within our supernatural chain and conventional supermarket channels generate a lower gross margin than do sales to our independent customers. Many of these customers, including our largest customer, have agreements with us that include volume discounts. As the amounts these customers purchase from us increase, the price that they pay for the products they purchase is reduced, putting downward pressure on our gross margins on these sales. To compensate for these lower gross margins, we must increase the amount of products we sell or reduce the expenses we incur to service these customers. If we are unable to reduce our expenses as a percentage of net sales, including our expenses related to servicing this lower gross margin business, our business, financial condition or results of operations could be materially and adversely impacted.
Our business may be sensitive to inflationary and deflationary pressures.
Many of our sales are at prices that are based on our product cost plus a percentage markup. As a result, volatile food costs have a direct impact upon our profitability. Prolonged periods of product cost inflation and periods of rapidly increasing inflation may have a negative impact on our profit margins and results of operations to the extent that we are unable to pass on all or a portion of such product cost increases to our customers. In addition, product cost inflation may negatively impact the consumer discretionary spending trends of our customers' customers, which could adversely affect our sales. Conversely, because many of our sales are at prices that are based upon product cost plus a percentage markup, our profit levels may be negatively impacted during periods of product cost deflation even though our gross profit as a percentage of net sales may remain relatively constant. To compensate for lower gross margins, we, in turn, must reduce expenses that we incur to service our customers. If we are unable to reduce our expenses as a percentage of net sales, our business, financial condition or results of operations could be materially and adversely impacted.
Our customers generally are not obligated to continue purchasing products from us and larger customers that do have multiyear contracts with us may terminate these contracts early in certain situations or choose not to renew or extend the contract at its expiration.
Many of our customers buy from us under purchase orders, and we generally do not have agreements with or long-term commitments from these customers for the purchase of products. We cannot assure you that these customers will maintain or increase their sales volumes or orders for the products supplied by us or that we will be able to maintain or add to our existing customer base. Decreases in our volumes or orders for products supplied by us for these customers with whom we do not have a long-term contract may have a material adverse effect on our business, financial condition or results of operations.
We may have contracts with certain of our customers (as is the case with many of our conventional supermarket customers) that obligate the customer to buy products from us for a particular period of time. Even in this case, the contracts may not require the customer to purchase a minimum amount of products from us or the contracts may afford the customer better pricing in the
14
event that the volume of the customer’s purchases exceeds certain levels. If these customers were to terminate these contracts prior to their scheduled termination, or if we or the customer elected not to renew or extend the term of the contract at its expiration, it may have a material adverse effect on our business, financial condition or results of operations, including additional operational expenses to transition out of the business or to adjust our staffing levels to account for the reduction in net sales.
We have significant competition from a variety of sources.
We operate in competitive markets and our future success will be largely dependent on our ability to provide quality products and services at competitive prices. Bidding for contracts or arrangements with customers, particularly within the supernatural chain and conventional supermarket channels, is highly competitive and we may market our services to a particular customer over a long period of time before we are invited to bid. Our competition comes from a variety of sources, including other distributors of natural products as well as specialty grocery and mass market grocery distributors and retail customers that have their own distribution channels. Mass market grocery distributors in recent years have increased their emphasis on natural and organic products and are now competing more directly with us and many conventional supermarket chains have increased self-distribution of particular items that we sell or have increased their purchases of particular items that we sell directly from suppliers. New competitors are also entering our markets as barriers to entry for new competitors are relatively low. For instance, more natural and organic products are being sold in convenience stores and other big box retailers than was the case a few years ago and many of these customers are being serviced by conventional distributors or are self-distributing. Some of the mass market grocery distributors with whom we compete may have been in business longer than we have, may have substantially greater financial and other resources than we have and may be better established in their markets. We cannot assure you that our current or potential competitors will not provide products or services comparable or superior to those provided by us or adapt more quickly than we do to evolving industry trends or changing market requirements. It is also possible that alliances among competitors may develop and rapidly acquire significant market share or that certain of our customers will increase distribution to their own retail facilities. Increased competition may result in price reductions, reduced gross margins, lost business and loss of market share, any of which could materially and adversely affect our business, financial condition or results of operations.
We cannot provide assurance that we will be able to compete effectively against current and future competitors.
We may not realize the anticipated benefits from our acquisitions of Global Organic, Nor-Cal, Haddon and Gourmet Guru.
We cannot assure you that our acquisitions of Global Organic, Nor-Cal, Haddon or Gourmet Guru will enhance our financial performance. Our ability to achieve the expected benefits of these acquisitions will depend on, among other things, our ability to effectively translate our business strategies into a new set of products, our ability to retain and assimilate the acquired businesses' employees, our ability to retain customers and suppliers on terms similar to those in place with the acquired businesses, our ability to expand the products we offer in many of our markets to include the products distributed by these businesses, the adequacy of our implementation plans, our ability to maintain our financial and internal controls and systems as we expand our operations, the ability of our management to oversee and operate effectively the combined operations and our ability to achieve desired operating efficiencies and sales goals. The integration of the businesses that we acquired might also cause us to incur unforeseen costs, which would lower our future earnings and would prevent us from realizing the expected benefits of these acquisitions. Failure to achieve these anticipated benefits could result in a reduction in the price of our common stock as well as in increased costs, decreases in the amount of expected revenues and diversion of management’s time and energy and could materially and adversely impact our business, financial condition and operating results.
Our investment in information technology may not result in the anticipated benefits.
In our attempt to reduce operating expenses and increase operating efficiencies, we have aggressively invested in the development and implementation of new information technology. Based on our currently anticipated timeline, we expect to complete the roll-out of our warehouse management system and transportation management system within our existing U.S. broadline facilities by the end of fiscal 2018. While we currently believe this revised timeline will be met, we may not be able to implement these technological changes in the time frame that we have planned and delays in implementation could negatively impact our business, financial condition or results of operations. In addition, the costs to make these changes may exceed our estimates and will exceed the benefits during the early stages of implementation. Even if we are able to implement the changes in accordance with our current plans, and within our current cost estimates, we may not be able to achieve the expected efficiencies and cost savings from this investment, which could have a material adverse effect on our business, financial condition or results of operations. Moreover, as we implement information technology enhancements, disruptions in our business may be created (including disruption with our customers) which may have a material adverse effect on our business, financial condition or results of operations.
Failure by us to develop and operate a reliable technology platform could negatively impact our business.
Our ability to decrease costs and increase profits, as well as our ability to serve customers most effectively, depends on the reliability of our technology platform. We use software and other technology systems, among other things, to generate and select
15
orders, to load and route trucks and to monitor and manage our business on a day-to-day basis. Any disruption to these computer systems could adversely impact our customer service, decrease the volume of our business and result in increased costs negatively affecting our business, financial condition or results of operations.
We have experienced losses due to the uncollectability of accounts receivable in the past and could experience increases in such losses in the future if our customers are unable to timely pay their debts to us.
Certain of our customers have from time to time experienced bankruptcy, insolvency and/or an inability to pay their debts to us as they come due. If our customers suffer significant financial difficulty, they may be unable to pay their debts to us timely or at all, which could have a material adverse effect on our results of operations. It is possible that customers may reject their contractual obligations to us under bankruptcy laws or otherwise. Significant customer bankruptcies could further adversely affect our revenues and increase our operating expenses by requiring larger provisions for bad debt. In addition, even when our contracts with these customers are not rejected, if customers are unable to meet their obligations on a timely basis, it could adversely affect our ability to collect receivables. Further, we may have to negotiate significant discounts and/or extended financing terms with these customers in such a situation, each of which could have a material adverse effect on our business, financial condition, results of operations or cash flows. During periods of economic weakness, small to medium-sized businesses, like many of our independently owned natural products retailer customers, may be impacted more severely and more quickly than larger businesses. Similarly, these smaller businesses may be more likely to be more severely impacted by events outside of their control, like significant weather events. Consequently, the ability of such businesses to repay their obligations to us may deteriorate, and in some cases this deterioration may occur quickly, which could materially and adversely impact our business, financial condition or results of operations.
Our acquisition strategy may adversely affect our business.
A portion of our past growth has been achieved through acquisitions of, or mergers with, other distributors of natural, organic and specialty products. We also continually evaluate opportunities to acquire other companies. We believe that there are risks related to acquiring companies, including an inability to successfully identify suitable acquisition candidates or consummate such potential acquisitions. To the extent that our future growth includes acquisitions, we cannot assure you that we will not overpay for acquisitions, lose key employees of acquired companies, or fail to achieve potential synergies or expansion into new markets as a result of our acquisitions. Therefore, future acquisitions, if any, may have a material adverse effect on our results of operations, particularly in periods immediately following the consummation of those transactions while the operations of the acquired business are being integrated with our operations. Achieving the benefits of acquisitions depends on timely, efficient and successful execution of a number of post-acquisition events, including, among other things:
• | maintaining the customer and supplier base; |
• | optimizing delivery routes; |
• | coordinating administrative, distribution and finance functions; and |
• | integrating management information systems and personnel. |
The integration process could divert the attention of management and any difficulties or problems encountered in the transition process could have a material adverse effect on our business, financial condition or results of operations. In particular, the integration process may temporarily redirect resources previously focused on reducing product cost and operating expenses, resulting in lower gross profits in relation to sales. In addition, the process of combining companies could cause the interruption of, or a loss of momentum and operating profits in, the activities of the respective businesses, which could have an adverse effect on their combined operations.
In connection with acquisitions of businesses in the future, if any, we may decide to consolidate the operations of any acquired businesses with our existing operations or make other changes with respect to the acquired businesses, which could result in special charges or other expenses. Our results of operations also may be adversely affected by expenses we incur in making acquisitions, by amortization of acquisition-related intangible assets with definite lives and by additional depreciation attributable to acquired assets. Any of the businesses we acquire may also have liabilities or adverse operating issues, including some that we fail to discover before the acquisition, and our indemnity for such liabilities may also be limited. Additionally, our ability to make any future acquisitions may depend upon obtaining additional financing. We may not be able to obtain additional financing on acceptable terms or at all. To the extent that we seek to acquire other businesses in exchange for our common stock, fluctuations in our stock price could have a material adverse effect on our ability to complete acquisitions.
Our business strategy of increasing our sales of fresh, perishable items, which we accelerated with our acquisitions of Tony’s, Global Organic and Nor-Cal, may not produce the results that we expect.
A key element of our current growth strategy is to increase the amount of fresh, perishable products that we distribute. We believe that the ability to distribute these products that are typically found in the perimeter of our customers’ stores, in addition to the products we have historically distributed, will differentiate us from our competitors and increase demand for our products.
16
We accelerated this strategy with our acquisitions of Tony’s, Global Organic and Nor-Cal. If we are unable to grow this portion of our business and manage that growth effectively, our business, financial condition and results of operations may be materially and adversely affected.
We may have difficulty managing our growth.
The growth in the size of our business and operations has placed, and is expected to continue to place, a significant strain on our management. Our future growth may be limited by our inability to make acquisitions, successfully integrate acquired entities or significant new customers, implement information systems initiatives, acquire or timely construct new distribution centers or expand our existing distribution centers, or adequately manage our personnel. Our future growth is limited in part by the size and location of our distribution centers. As we near maximum utilization of a given facility or maximize our processing capacity, operations may be constrained and inefficiencies have been and may be created, which could adversely affect our results of operations unless the facility is expanded, volume is shifted to another facility or additional processing capacity is added. Conversely, as we add additional facilities or expand existing operations or facilities, excess capacity may be created. Any excess capacity may also create inefficiencies and adversely affect our results of operations, including as a result of incurring additional operating costs for these facilities before demand for products to be supplied from these facilities rises to a sufficient level. We cannot assure you that we will be able to successfully expand our existing distribution centers or open new distribution centers in new or existing markets as needed to accommodate or facilitate growth. Even if we are able to expand our distribution network, our ability to compete effectively and to manage future growth, if any, will depend on our ability to continue to implement and improve operational, financial and management information systems, including our warehouse management systems, on a timely basis and to expand, train, motivate and manage our work force. We cannot assure you that our existing personnel, systems, procedures and controls will be adequate to support the future growth of our operations. Our inability to manage our growth effectively could have a material adverse effect on our business, financial condition or results of operations.
Increased fuel costs may adversely affect our results of operations.
Increased fuel costs may have a negative impact on our results of operations. The high cost of diesel fuel can increase the price we pay for products as well as the costs we incur to deliver products to our customers. These factors, in turn, may negatively impact our net sales, margins, operating expenses and operating results. To manage this risk, we have in the past periodically entered, and may in the future periodically enter, into heating oil derivative contracts to hedge a portion of our projected diesel fuel requirements. Heating crude oil prices have a highly correlated relationship to fuel prices, making these derivatives effective in offsetting changes in the cost of diesel fuel. We are not party to any commodity swap agreements and, as a result, our exposure to volatility in the price of diesel fuel has increased relative to our exposure to volatility in prior periods in which we had outstanding heating oil derivative contracts. We do not enter into fuel hedge contracts for speculative purposes. We have in the past, and may in the future, periodically enter into forward purchase commitments for a portion of our projected monthly diesel fuel requirements at fixed prices. As of July 30, 2016, we had forward diesel fuel commitments totaling approximately $2.6 million through December 2016. Our commitments were entered into at prevailing rates throughout the fiscal year. If fuel prices decrease significantly, these forward purchases may prove ineffective and result in us paying higher than the then market costs for a portion of our diesel fuel. We also maintain a fuel surcharge program which allows us to pass some of our higher fuel costs through to our customers. We cannot guarantee that we will continue to be able to pass a comparable proportion or any of our higher fuel costs to our customers in the future, which may adversely affect our business, financial condition or results of operations.
Disruption of our distribution network could adversely affect our business.
Damage or disruption to our distribution capabilities due to weather, natural disaster, fire, terrorism, pandemic, strikes, the financial and/or operational instability of key suppliers, or other reasons could impair our ability to distribute our products. To the extent that we are unable, or it is not financially feasible, to mitigate the likelihood or potential impact of such events, or to manage effectively such events if they occur, there could be an adverse effect on our business, financial condition or results of operations.
The cost of the capital available to us and limitations on our ability to access additional capital may have a material adverse effect on our business, financial condition or results of operations.
Historically, acquisitions and capital expenditures have been a large component of our growth. We anticipate that acquisitions and capital expenditures will continue to be important to our growth in the future. As a result, increases in the cost of capital available to us, which could result from us not being in compliance with fixed charge coverage ratio covenants under our amended and restated revolving credit facility, or our inability to access additional capital to finance acquisitions and capital expenditures through borrowed funds could restrict our ability to grow our business organically or through acquisitions, which could have a material adverse effect on our business, financial condition or results of operations.
In addition, our profit margins depend on strategic investment buying initiatives, such as discounted bulk purchases, which require spending significant amounts of working capital up-front to purchase products that we then sell over a multi-month
17
time period. Therefore, increases in the cost of capital available to us or our inability to access additional capital through borrowed funds could restrict our ability to engage in strategic investment buying initiatives, which could reduce our profit margins and have a material adverse effect on our business, financial condition or results of operations.
Our debt agreements contain restrictive covenants that may limit our operating flexibility.
Our debt agreements underlying our amended and restated revolving credit facility and Term Loan Agreement contain financial covenants and other restrictions that limit our operating flexibility, limit our flexibility in planning for or reacting to changes in our business and make us more vulnerable to economic downturns and competitive pressures. Our indebtedness could have significant negative consequences, including:
• | increasing our vulnerability to general adverse economic and industry conditions; |
• | limiting our ability to obtain additional financing; |
• | limiting our ability to pursue certain acquisitions; |
• | limiting our flexibility in planning for or reacting to changes in our business and the industry in which we compete; and |
• | placing us at a competitive disadvantage compared to competitors with less leverage or better access to capital resources. |
In addition, our amended and restated revolving credit facility and the Term Loan Agreement each require that we comply with various financial tests and impose certain restrictions on us, including among other things, restrictions on our ability to incur additional indebtedness, create liens on assets, make loans or investments or pay dividends. Failure to comply with these covenants could have a material adverse effect on our business, financial condition or results of operations.
Our operating results are subject to significant fluctuations.
Our operating results may vary significantly from period to period due to:
• | demand for our products, including as a result of seasonal fluctuations; |
• | changes in our operating expenses, including fuel and insurance expenses; |
• | management's ability to execute our business and growth strategies; |
• | changes in customer preferences, including levels of enthusiasm for health, fitness and environmental issues; |
• | public perception of the benefits of natural and organic products when compared to similar conventional products; |
• | fluctuation of natural product prices due to competitive pressures; |
• | the addition or loss of significant customers; |
• | personnel changes; |
• | general economic conditions, including inflation; |
• | supply shortages, including a lack of an adequate supply of high-quality livestock or agricultural products due to poor growing conditions, water shortages, natural disasters or otherwise; |
• | volatility in prices of high-quality livestock or agricultural products resulting from poor growing conditions, water shortages, natural disasters or otherwise; and |
• | future acquisitions, particularly in periods immediately following the consummation of such acquisition transactions while the operations of the acquired businesses are being integrated into our operations. |
Due to the foregoing factors, we believe that period-to-period comparisons of our operating results may not necessarily be meaningful and that such comparisons cannot be relied upon as indicators of future performance.
Conditions beyond our control can interrupt our supplies and increase our product costs.
We offer more than 100,000 high-quality natural, organic and specialty foods and non-food products, which we purchase from more than 10,000 suppliers. The majority of our suppliers are based in the United States and Canada, but we also source products from suppliers throughout Europe, Asia, Central America, South America, Africa and Australia. For the most part, we do not have long-term contracts with our suppliers committing them to provide products to us. Although our purchasing volume can provide benefits when dealing with suppliers, suppliers may not provide the products needed by us in the quantities and at the prices requested. We are also subject to delays caused by interruption in production and increases in product costs based on conditions outside of our control. These conditions include work slowdowns, work interruptions, strikes or other job actions by employees of suppliers, short-term weather conditions or more prolonged climate change, crop conditions, product recalls, water shortages, transportation interruptions, unavailability of fuel or increases in fuel costs, competitive demands, raw material shortages and natural disasters or other catastrophic events (including, but not limited to food-borne illnesses). We have continued to experience higher levels of manufacturer out-of-stocks causing us to incur higher operating expenses as we moved products around our distribution facilities as we sought to keep our service level high, and we cannot be sure when this trend will end or whether it will recur during future years. As the consumer demand for natural and organic products has increased, certain retailers and other producers have entered the market and attempted to buy certain raw materials directly, limiting their availability to be used in certain vendor products. Further, increased frequency or duration of extreme weather conditions could also impair production
18
capabilities, disrupt our supply chain or impact demand for our products, including the specialty protein and cheese products sold by Tony's. For example, weather patterns in recent years have resulted in lower than normal levels of precipitation in key agricultural states such as California, impacting the price of water and corresponding prices of food products grown in states facing drought conditions. The impact of sustained droughts is uncertain and could result in volatile input costs. Input costs could increase at any point in time for a large portion of the products that we sell for a prolonged period. Our inability to obtain adequate products as a result of any of the foregoing factors or otherwise could mean that we could not fulfill our obligations to customers, and customers may turn to other distributors. In that case, our financial condition, results of operations and business could be materially and adversely affected.
Changes in relationships with our vendors may adversely affect our profitability.
We cooperatively engage in a variety of promotional programs with our vendors. We manage these programs to maintain or improve margins and increase sales. A reduction or change in promotional spending by our vendors could have a significant impact on our profitability. We depend heavily on our ability to purchase merchandise in sufficient quantities at competitive prices. We have no assurances of continued supply, pricing, or access to new products and any vendor could at any time change the terms upon which it sells to us or discontinue selling to us.
We are subject to significant governmental regulation.
Our business is highly regulated at the federal, state and local levels and our products and distribution operations require various licenses, permits and approvals. In particular:
• | the products that we distribute in the United States are subject to inspection by the FDA; |
• | our warehouse and distribution centers are subject to inspection by the USDA and state health authorities; and |
• | the United States Department of Transportation and the United States Federal Highway Administration regulate our United States trucking operations. |
Our Canadian operations are similarly subject to extensive regulation, including the English and French dual labeling requirements applicable to products that we distribute in Canada. The loss or revocation of any existing licenses, permits or approvals or the failure to obtain any additional licenses, permits or approvals in new jurisdictions where we intend to do business could have a material adverse effect on our business, financial condition or results of operations. In addition, as a distributor and manufacturer of natural, organic, and specialty foods, we are subject to increasing governmental scrutiny of and public awareness regarding food safety and the sale, packaging and marketing of natural and organic products. Compliance with these laws may impose a significant burden on our operations. If we were to manufacture or distribute foods that are or are perceived to be contaminated, any resulting product recalls could have an adverse effect on our business, financial condition or results of operations. Additionally, concern over climate change, including the impact of global warming, has led to significant United States and international legislative and regulatory efforts to limit greenhouse gas emissions. Increased regulation regarding greenhouse gas emissions, especially diesel engine emissions, could impose substantial costs on us. These costs include an increase in the cost of the fuel and other energy we purchase and capital costs associated with updating or replacing our vehicles prematurely. Until the timing, scope and extent of such regulation becomes known, we cannot predict its effect on our results of operations. It is reasonably possible, however, that it could impose material costs on us which we may be unable to pass on to our customers.
If we fail to comply with applicable laws and regulations or encounter disagreements with respect to our contracts subject to governmental regulations, including those referred to above, we may be subject to investigations, criminal sanctions or civil remedies, including fines, injunctions, prohibitions on exporting, seizures or debarments from contracting with the government. The cost of compliance or the consequences of non-compliance, including debarments, could have a material adverse effect on our business and results of operations. In addition, governmental units may make changes in the regulatory frameworks within which we operate that may require either the corporation as a whole or individual businesses to incur substantial increases in costs in order to comply with such laws and regulations.
Product liability claims could have an adverse effect on our business.
We face an inherent risk of exposure to product liability claims if the products we manufacture or sell cause injury or illness. In addition, meat, seafood, cheese, poultry and other products that we distribute could be subject to recall because they are, or are alleged to be, contaminated, spoiled or inappropriately labeled. Our meat and poultry products may be subject to contamination by disease-producing organisms, or pathogens, such as Listeria monocytogenes, Salmonella and generic E.coli. These pathogens are generally found in the environment, and as a result, there is a risk that they, as a result of food processing, could be present in our meat and poultry products. These pathogens can also be introduced as a result of improper handling at the consumer level. These risks may be controlled, although not eliminated, by adherence to good manufacturing practices and finished product testing. We have little, if any, control over proper handling before we receive the product or once the product has been shipped to our customers. We may be subject to liability, which could be substantial, because of actual or alleged contamination in products manufactured or sold by us, including products sold by companies before we acquired them. We have, and the companies we have
19
acquired have had, liability insurance with respect to product liability claims. This insurance may not continue to be available at a reasonable cost or at all, and may not be adequate to cover product liability claims against us or against companies we have acquired. We generally seek contractual indemnification from manufacturers, but any such indemnification is limited, as a practical matter, to the creditworthiness of the indemnifying party. If we or any of our acquired companies do not have adequate insurance or contractual indemnification available, product liability claims and costs associated with product recalls, including a loss of business, could have a material adverse effect on our business, financial condition or results of operations.
A cybersecurity incident and other technology disruptions could negatively impact our business and our relationships with customers.
We use computers in substantially all aspects of our business operations. We also use mobile devices, social networking and other online activities to connect with our employees, suppliers, business partners and our customers. Such uses give rise to cybersecurity risks, including security breach, espionage, system disruption, theft and inadvertent release of information. Our business involves the storage and transmission of numerous classes of sensitive and/or confidential information and intellectual property, including customers’ and suppliers' personal information, private information about employees, and financial and strategic information about the Company and its business partners. Further, as we pursue our strategy to grow through acquisitions and to pursue new initiatives that improve our operations and cost structure, we are also expanding and improving our information technologies, resulting in a larger technological presence and corresponding exposure to cybersecurity risk. If we fail to assess and identify cybersecurity risks associated with acquisitions and new initiatives, we may become increasingly vulnerable to such risks. Additionally, while we have implemented measures to prevent security breaches and cyber incidents, our preventative measures and incident response efforts may not be entirely effective. The theft, destruction, loss, misappropriation, or release of sensitive and/or confidential information or intellectual property, or interference with our information technology systems or the technology systems of third parties on which we rely, could result in business disruption, negative publicity, brand damage, violation of privacy laws, loss of customers, potential liability and competitive disadvantage all of which could have a material adverse effect on our business, financial condition or results of operations.
We are dependent on a number of key executives.
Management of our business is substantially dependent upon the services of certain key management employees. Loss of the services of any officers or any other key management employee could have a material adverse effect on our business, financial condition or results of operations.
Union-organizing activities could cause labor relations difficulties.
As of July 30, 2016 we had approximately 9,554 full and part-time employees, 363 of whom (approximately 3.8%) are covered by collective bargaining agreements at our Auburn, Washington, Edison, New Jersey, Iowa City, Iowa, Moreno Valley, California, Dayville, Connecticut and Nor-Cal's West Sacramento, California facilities. The Auburn, Washington, Edison, New Jersey, Iowa City, Iowa, Moreno Valley, California, Dayville, Connecticut and West Sacramento, California agreements expire in February 2017, June 2017, June 2017, March 2019, July 2019 and May 2020, respectively. If we are not able to renew these agreements or are required to make significant changes to these agreements, our relationship with these employees may become fractured or we may incur additional expenses which could have a material adverse effect on our business, financial condition, or results of operations. We have in the past been the focus of union-organizing efforts, and we believe it is likely that we will be the focus of similar efforts in the future.
As we increase our employee base and broaden our distribution operations to new geographic markets, our increased visibility could result in increased or expanded union-organizing efforts. In the event we are unable to negotiate contract renewals with our union associates, we could be subject to work stoppages. In that event, it would be necessary for us to hire replacement workers to continue to meet our obligations to our customers. The costs to hire replacement workers and employ effective security measures could negatively impact the profitability of any such facility, and depending on the length of time that we are required to employ replacement workers and security measures these costs could be significant and could have a material adverse effect on our business, financial condition or results of operations.
In July 2016, the National Labor Relations Board certified the election results of our drivers in Hudson Valley, New York to be represented by the Teamsters union. We are in the process of negotiating a collective bargaining agreement with these employees. The terms of this agreement could cause our expenses at this facility to increase, negatively impacting the results of operations at this facility.
We may fail to establish sufficient insurance reserves and adequately estimate for future workers' compensation and automobile liabilities.
We are primarily self-insured for workers' compensation and general and automobile liability insurance. We believe that our workers' compensation and automobile insurance coverage is customary for businesses of our size and type. However, there
20
are types of losses we may incur that cannot be insured against or that we believe are not commercially reasonable to insure. These losses, should they occur, could have a material adverse effect on our business, financial condition or results of operations. In addition, the cost of workers' compensation insurance and automobile insurance fluctuates based upon our historical trends, market conditions and availability.
Any projection of losses concerning workers' compensation and automobile insurance is subject to a considerable degree of variability. Among the causes of this variability are unpredictable external factors affecting litigation trends, benefit level changes and claim settlement patterns. If actual losses incurred are greater than those anticipated, our reserves may be insufficient and additional costs could be recorded in our consolidated financial statements. If we suffer a substantial loss that is not covered by our self-insurance reserves, the loss and attendant expenses could harm our business and operating results. We have purchased stop loss coverage from third parties, which limits our exposure above the amounts we have self-insured.
Adverse judgments or settlements resulting from legal proceedings in which we may be involved in the normal course of our business could reduce our profits or limit our ability to operate our business.
In the normal course of our business, we are involved in various legal proceedings. The outcome of these proceedings cannot be predicted. If any of these proceedings were to be determined adversely to us or a settlement involving a payment of a material sum of money were to occur, it could materially and adversely affect our results of operations or ability to operate our business. Additionally, we could become the subject of future claims by third parties, including our employees, our investors, or regulators. Any significant adverse judgments or settlements would reduce our profits and could limit our ability to operate our business. Further, we may incur costs related to claims for which we have appropriate third-party indemnity, but such third parties fail to fulfill their contractual obligations.
The market price for our common stock may be volatile.
At times, there has been significant volatility in the market price of our common stock. In addition, the market price of our common stock could fluctuate substantially in the future in response to a number of factors, including the following:
• | our quarterly operating results or the operating results of other distributors of organic or natural food and non-food products and of supernatural chains and conventional supermarkets and other of our customers; |
• | the addition or loss of significant customers; |
• | changes in general conditions in the economy, the financial markets or the organic or natural food and non-food product distribution industries; |
• | changes in financial estimates or recommendations by stock market analysts regarding us or our competitors; |
• | announcements by us or our competitors of significant acquisitions; |
• | increases in labor, energy, fuel costs or the costs of food products; |
• | natural disasters, severe weather conditions or other developments affecting us or our competitors; |
• | publication of research reports about us, the benefits of organic and natural products, or the organic or natural food and non-food product distribution industries generally; |
• | changes in market valuations of similar companies; |
• | additions or departures of key management personnel; |
• | actions by institutional stockholders; and |
• | speculation in the press or investment community. |
In addition, in recent years the stock market has experienced extreme price and volume fluctuations. This volatility has had a significant effect on the market prices of securities issued by many companies for reasons unrelated to their operating performance. These broad market fluctuations may materially adversely affect our stock price, regardless of our operating results.
A failure of our internal control over financial reporting could materially impact our business or stock price.
Our management is responsible for establishing and maintaining adequate internal control over financial reporting. An internal control system, no matter how well designed and operated, can provide only reasonable, not absolute, assurance that the objectives of the control system are met. Further, the design of a control system must reflect the fact that there are resource constraints, and the benefits of controls must be considered relative to their costs. Because of the inherent limitations in all internal control systems, internal control over financial reporting may not prevent or detect misstatements. Any failure to maintain an effective system of internal control over financial reporting could limit our ability to report our financial results accurately and timely or to detect and prevent fraud, and could expose us to litigation or adversely affect the market price of our common stock. See Part II, “Item 9A. Controls and Procedures - Management’s Report on Internal Control over Financial Reporting,” of this report for additional information regarding our internal control over financial reporting.
ITEM 1B. UNRESOLVED STAFF COMMENTS
21
None.
ITEM 2. PROPERTIES
We maintained thirty-three distribution centers at July 30, 2016 which were utilized by our wholesale division. These facilities, including offsite storage space, consisted of an aggregate of approximately 8.7 million square feet of storage space, which we believe represents the largest capacity of any distributor within the United States in the natural, organic and specialty products industry. In the third quarter of fiscal 2016 we began operations at our new distribution center in Gilroy, California.
Set forth below for each of our distribution centers is its location and the expiration of leases as of July 30, 2016 for those distribution centers that we do not own.
Location | Lease Expiration | |
Atlanta, Georgia* | Owned | |
Auburn, California* | Owned | |
Auburn, Washington | August 2019 | |
Aurora, Colorado | October 2033 | |
Burnaby, British Columbia | October 2018 | |
Charlotte, North Carolina | September 2019 | |
Chesterfield, New Hampshire* | Owned | |
Concord, Ontario | December 2021 | |
Dayville, Connecticut* | Owned | |
Gilroy, California | Owned | |
Greenwood, Indiana* | Owned | |
Howell Township, New Jersey | Owned | |
Hudson Valley, New York* | Owned | |
Iowa City, Iowa* | Owned | |
Lancaster, Texas | July 2025 | |
Logan Township, New Jersey | May 2028 | |
Moreno Valley, California | July 2023 | |
Philadelphia, Pennsylvania | January 2020 | |
Prescott, Wisconsin | Owned | |
Racine, Wisconsin* | Owned | |
Richburg, South Carolina | Owned | |
Richmond, British Columbia | August 2022 | |
Ridgefield, Washington* | Owned | |
Ridgefield, Washington | September 2017 | |
Rocklin, California* | Owned | |
Sarasota, Florida | July 2017 | |
St. Laurent, Quebec | July 2017 | |
Truckee, California | August 2020 | |
Vernon, California* | Owned | |
West Sacramento, California | Owned | |
West Sacramento, California | Owned | |
York, Pennsylvania | May 2020 | |
Yuba City, California | September 2021 | |
*The properties noted above are mortgaged under and encumbered by our Term Loan Agreement initially entered into on August 14, 2014.
22
We lease facilities to operate thirteen natural products retail stores through our Earth Origins division in Florida, Maryland and Massachusetts, each with various lease expiration dates. As of the end of our 2016 fiscal year, we decided to close two of these locations, one in Maryland and one in Florida, and we closed these stores during the first quarter of fiscal 2017. We also lease a processing and manufacturing facility in Edison, New Jersey with a lease expiration date of March 31, 2018.
We lease office space in Santa Cruz, California, Chesterfield, New Hampshire, Uniondale, New York, Richmond, Virginia, Medford, New Jersey, Wayne, Pennsylvania and Providence, Rhode Island, the site of our corporate headquarters. Our leases have been entered into upon terms that we believe to be reasonable and customary.
We lease warehouse facilities in West Sacramento, California that we acquired in connection with our acquisition of Tony's. This facility is currently being subleased under an agreement that expires concurrently with our lease termination in April 2018. We also lease offsite storage space near certain of our distribution facilities.
ITEM 3. LEGAL PROCEEDINGS
From time to time, we are involved in routine litigation or other legal proceedings that arise in the ordinary course of our business. There are no pending material legal proceedings to which we are a party or to which our property is subject.
ITEM 4. MINE SAFETY DISCLOSURES
Not applicable.
23
PART II.
ITEM 5. MARKET FOR THE REGISTRANT'S COMMON EQUITY, RELATED STOCKHOLDER MATTERS AND ISSUER PURCHASES OF EQUITY SECURITIES
Our common stock is traded on the Nasdaq Global Select Market® under the symbol "UNFI." Our common stock began trading on the Nasdaq Stock Market® on November 1, 1996.
The following table sets forth, for the fiscal periods indicated, the high and low sale prices per share of our common stock on the Nasdaq Global Select Market®:
Fiscal 2016 | High | Low | ||||||
First Quarter | $ | 55.69 | $ | 44.05 | ||||
Second Quarter | 52.07 | 33.85 | ||||||
Third Quarter | 43.02 | 29.75 | ||||||
Fourth Quarter | 52.18 | 33.16 | ||||||
Fiscal 2015 | ||||||||
First Quarter | $ | 69.51 | $ | 58.48 | ||||
Second Quarter | 80.77 | 67.71 | ||||||
Third Quarter | 83.91 | 66.34 | ||||||
Fourth Quarter | 69.26 | 45.26 | ||||||
On July 30, 2016, we had 78 stockholders of record. The number of record holders may not be representative of the number of beneficial holders of our common stock because depositories, brokers or other nominees hold many shares.
We have never declared or paid any cash dividends on our capital stock. We anticipate that all of our earnings in the foreseeable future will be retained to finance the continued growth and development of our business, and we have no current intention to pay cash dividends. Our future dividend policy will depend on our earnings, capital requirements and financial condition, requirements of the financing agreements to which we are then a party and other factors considered relevant by our Board of Directors. Additionally, the terms of our amended and restated revolving credit facility and Term Loan Agreement restrict us from making any cash dividends unless certain conditions and financial tests are met.
Effective October 30, 2015, the UNFI Employee Stock Ownership Plan (the “ESOP”) was merged with the Company's 401(k) Plan. In connection with this merger, the ESOP acquired 324 shares of the Company's common stock on the open market at an average price per share of $51.11. We did not purchase any shares of our common stock in the quarter ended July 30, 2016.
Comparative Stock Performance
The graph below compares the cumulative total stockholder return on our common stock for the last five fiscal years with the cumulative total return on (i) an index of Food Service Distributors and Grocery Wholesalers and (ii) The NASDAQ Composite Index. The comparison assumes the investment of $100 on July 30, 2011 in our common stock and in each of the indices and, in each case, assumes reinvestment of all dividends. The stock price performance shown below is not necessarily indicative of future performance.
The index of Food Distributors and Wholesalers includes SuperValu, Inc. and SYSCO Corporation.
This performance graph shall not be deemed "soliciting material" or be deemed to be "filed" for purposes of Section 18 of the Exchange Act or otherwise subject to the liabilities under that Section and shall not be deemed to be incorporated by reference into any of our filings under the Securities Act of 1933, as amended (the "Securities Act"), or the Exchange Act.
24
COMPARISION OF 5 YEAR CUMULATIVE TOTAL RETURN*
Among United Natural Foods, Inc., the NASDAQ Composite Index,
and Index of Food Distributors and Wholesalers
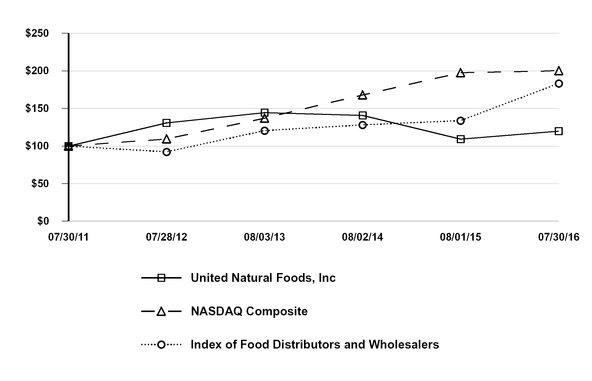
* | $100 invested on 7/30/11 in UNFI common stock or 7/30/11 in relevant index, including reinvestment of dividends. Index calculated on a month-end basis. |
ITEM 6. SELECTED FINANCIAL DATA
The selected consolidated financial data presented below are derived from our consolidated financial statements, which have been audited by KPMG LLP, our independent registered public accounting firm. The historical results are not necessarily indicative of results to be expected for any future period. The following selected consolidated financial data should be read in conjunction with and is qualified by reference to "Item 7. Management's Discussion and Analysis of Financial Condition and Results of Operations" and our Consolidated Financial Statements and Notes thereto included elsewhere in this Annual Report on Form 10-K.
25
Consolidated Statement of Income Data: (1)(2) | July 30, 2016 | August 1, 2015 | August 2, 2014 | August 3, 2013 | July 28, 2012 | |||||||||||||||
(53 weeks) | ||||||||||||||||||||
(In thousands, except per share data) | ||||||||||||||||||||
Net sales | $ | 8,470,286 | $ | 8,184,978 | $ | 6,794,447 | $ | 6,064,355 | $ | 5,236,021 | ||||||||||
Cost of sales | 7,190,935 | 6,924,463 | 5,666,802 | 5,040,323 | 4,320,914 | |||||||||||||||
Gross profit | 1,279,351 | 1,260,515 | 1,127,645 | 1,024,032 | 915,107 | |||||||||||||||
Operating expenses | 1,049,690 | 1,017,755 | 916,857 | 837,953 | 755,744 | |||||||||||||||
Restructuring and asset impairment expense | 5,552 | 803 | — | 1,629 | 5,101 | |||||||||||||||
Total operating expenses | 1,055,242 | 1,018,558 | 916,857 | 839,582 | 760,845 | |||||||||||||||
Operating income | 224,109 | 241,957 | 210,788 | 184,450 | 154,262 | |||||||||||||||
Other expense (income): | ||||||||||||||||||||
Interest expense | 16,259 | 14,498 | 7,753 | 5,897 | 4,734 | |||||||||||||||
Interest income | (1,115 | ) | (356 | ) | (508 | ) | (632 | ) | (715 | ) | ||||||||||
Other, net | 743 | (1,954 | ) | (3,865 | ) | 6,113 | 356 | |||||||||||||
Total other expense, net | 15,887 | 12,188 | 3,380 | 11,378 | 4,375 | |||||||||||||||
Income before income taxes | 208,222 | 229,769 | 207,408 | 173,072 | 149,887 | |||||||||||||||
Provision for income taxes | 82,456 | 91,035 | 81,926 | 65,865 | 59,088 | |||||||||||||||
Net income | $ | 125,766 | $ | 138,734 | $ | 125,482 | $ | 107,207 | $ | 90,799 | ||||||||||
Per share data—Basic: | ||||||||||||||||||||
Net income | $ | 2.50 | $ | 2.77 | $ | 2.53 | $ | 2.18 | $ | 1.86 | ||||||||||
Weighted average basic shares of common stock | 50,313 | 50,021 | 49,602 | 49,217 | 48,766 | |||||||||||||||
Per share data—Diluted: | ||||||||||||||||||||
Net income | $ | 2.50 | $ | 2.76 | $ | 2.52 | $ | 2.17 | $ | 1.85 | ||||||||||
Weighted average diluted shares of common stock | 50,399 | 50,267 | 49,888 | 49,509 | 49,100 | |||||||||||||||
Consolidated Balance Sheet Data: (2) | July 30, 2016 | August 1, 2015 | August 2, 2014 | August 3, 2013 | July 28, 2012 | ||||||||||||||
(In thousands) | |||||||||||||||||||
Working capital | $ | 991,468 | $ | 1,018,437 | $ | 850,006 | $ | 712,506 | $ | 608,902 | |||||||||
Total assets | 2,852,155 | 2,540,994 | 2,284,446 | 1,725,463 | 1,490,148 | ||||||||||||||
Total long-term debt and capital leases, excluding current portion | 161,739 | 172,949 | 32,510 | 33,091 | 635 | ||||||||||||||
Total stockholders' equity | $ | 1,519,504 | $ | 1,381,088 | $ | 1,238,919 | $ | 1,094,701 | $ | 974,918 | |||||||||
(1) | Includes the effect of acquisitions from the date of acquisition. |
(2) | Periods prior to the year ended July 30, 2016 have been restated for immaterial corrections for identified errors in accounting for early payment discounts on inventory purchases and the reclassification of debt issuance costs resulting from the Company's early adoption of Accounting Standards Update No. 2015-03, Interest- Imputation of Interest (Subtopic 835-30). For more information, see Note 15 of the footnotes accompanying our audited financial statements included in this Annual Report on Form 10-K. |
ITEM 7. MANAGEMENT'S DISCUSSION AND ANALYSIS OF FINANCIAL CONDITION AND RESULTS OF OPERATIONS
The following discussion and analysis should be read in conjunction with our consolidated financial statements and the notes thereto appearing elsewhere in this Annual Report on Form 10-K.
26
Forward-Looking Statements
This Annual Report on Form 10-K and the documents incorporated by reference in this Annual Report on Form 10-K contain forward-looking statements within the meaning of Section 27A of the Securities Act, and Section 21E of the Exchange Act that involve substantial risks and uncertainties. In some cases you can identify these statements by forward-looking words such as "anticipate," "believe," "could," "estimate," "expect," "intend," "may," "plans," "seek," "should," "will," and "would," or similar words. You should read statements that contain these words carefully because they discuss future expectations, contain projections of future results of operations or of financial positions or state other "forward-looking" information.
Forward-looking statements involve inherent uncertainty and may ultimately prove to be incorrect or false. You are cautioned not to place undue reliance on forward-looking statements. Except as otherwise may be required by law, we undertake no obligation to update or revise forward-looking statements to reflect changed assumptions, the occurrence of unanticipated events or actual operating results. Our actual results could differ materially from those anticipated in these forward-looking statements as a result of various factors, including, but not limited to:
• | our ability to retain customers of Haddon House Food Products, Inc. ("Haddon"), Nor-Cal Produce, Inc. ("Nor-Cal"), Global Organic/Specialty Source, Inc. ("Global Organic") and Gourmet Guru, Inc. ("Gourmet Guru") and their affiliated entities of which we purchased on terms similar to those in place prior to our acquisition of these businesses; |
• | our dependence on principal customers; |
• | our sensitivity to general economic conditions, including the current economic environment; |
• | changes in disposable income levels and consumer spending trends; |
• | our ability to reduce our expenses in amounts sufficient to offset our increased focus on sales to conventional supermarkets and the shift in our product mix as a result of our acquisition of Tony’s Fine Foods ("Tony's") and the resulting lower gross margins on these sales; |
• | our reliance on the continued growth in sales of natural and organic foods and non-food products in comparison to conventional products; |
• | increased competition in our industry as a result of increased distribution of natural, organic and specialty products by conventional grocery distributors and direct distribution of those products by large retailers; |
• | our ability to timely and successfully deploy our new warehouse management system throughout our distribution centers and our transportation management system across our Company; |
• | the addition or loss of significant customers; |
• | volatility in fuel costs; |
• | our sensitivity to inflationary and deflationary pressures; |
• | the relatively low margins and economic sensitivity of our business; |
• | the potential for disruptions in our supply chain by circumstances beyond our control; |
• | the risk of interruption of supplies due to lack of long-term contracts, severe weather, work stoppages or otherwise; |
• | consumer demand for natural and organic products outpacing suppliers’ ability to produce these products; |
• | moderated supplier promotional activity, including decreased forward buying opportunities; |
• | union-organizing activities that could cause labor relations difficulties and increased costs; |
• | the ability to identify and successfully complete acquisitions of other natural, organic and specialty food and non-food products distributors; |
• | management's allocation of capital and the timing of capital expenditures; and |
• | our ability to successfully deploy our operational initiatives to achieve synergies from the acquisitions of Tony's, Global Organic, Nor-Cal, Haddon and Gourmet Guru. |
This list of risks and uncertainties, however, is only a summary of some of the most important factors and is not intended to be exhaustive. You should carefully review the risks described under "Part I. Item 1A. Risk Factors," as well as any other cautionary language in this Annual Report on Form 10-K, as the occurrence of any of these events could have an adverse effect on our business, results of operations and financial condition.
Overview
We believe we are a leading national distributor based on sales of natural, organic and specialty foods and non-food products in the United States and Canada and that our thirty-three distribution centers, representing approximately 8.7 million square feet of warehouse space, provide us with the largest capacity of any North American-based distributor in the natural, organic and specialty products industry. We offer more than 100,000 high-quality natural, organic and specialty foods and non-food products, consisting of national brands, regional brands, private label and master distribution products, in six product categories: grocery and general merchandise, produce, perishables and frozen foods, nutritional supplements and sports nutrition, bulk and food service products and personal care items. We serve more than 43,000 customer locations primarily located across the United States and Canada, the majority of which can be classified into one of the following categories: independently owned natural products retailers,
27
which include buying clubs; supernatural chains, which consist solely of Whole Foods Market; conventional supermarkets, which include mass market chains; and other which includes foodservice and international customers outside of Canada.
Our operations are comprised of three principal operating divisions. These operating divisions are:
• | our wholesale division, which includes: |
◦ | our broadline natural, organic and specialty distribution business in the United States; |
◦ | UNFI Canada, Inc. ("UNFI Canada"), which is our natural, organic and specialty distribution business in Canada; |
◦ | Tony's, which is a leading distributor of a wide array of specialty protein, cheese, deli, food service and bakery goods, principally throughout the Western United States; |
◦ | Albert's, which is a leading distributor of organically grown produce and non-produce perishable items within the United States; |
◦ | Nor-Cal, a distributor of organic and conventional produce and non-produce perishable items in Northern California; |
◦ | Haddon, a distributor and merchandiser of natural and organic specialty and gourmet ethnic products throughout the Eastern United States; and |
◦ | Select Nutrition, which distributes vitamins, minerals and supplements; |
• | our retail division, consisting of Earth Origins, which operates our thirteen natural products retail stores within the United States; and |
• | our manufacturing and branded products divisions, consisting of: |
◦ | Woodstock Farms Manufacturing, which specializes in importing, roasting, packaging and the distribution of nuts, dried fruit, seeds, trail mixes, granola, natural and organic snack items and confections; and |
◦ | our Blue Marble Brands branded product lines. |
In recent years, our sales to existing and new customers have increased through the continued growth of the natural and organic products industry in general, increased market share as a result of our high quality service and a broader product selection, including specialty products, and the acquisition of, or merger with, natural and specialty products distributors, the expansion of our existing distribution centers; the construction of new distribution centers; the introduction of new products and the development of our own line of natural and organic branded products. Through these efforts, we believe that we have been able to broaden our geographic penetration, expand our customer base, enhance and diversify our product selections and increase our market share. Our strategic plan is focused on increasing the type of products we distribute to our customers, including perishable products and conventional produce. As part of our “one company” approach, we are in the process of rolling out a national warehouse management and procurement system to convert our existing facilities into a single warehouse management and supply chain platform ("WMS"). We have completed WMS system conversions at our Lancaster, Texas, Ridgefield, Washington, Auburn, Washington and Prescott, Wisconsin facilities. We have also implemented the WMS platform at our Racine, Wisconsin, Montgomery, New York, Auburn, California, Iowa City, Iowa, Greenwood, Indiana, Dayville, Connecticut and Gilroy, California facilities, and we expect to complete the roll-out to all of our existing U.S. broadline facilities by the end of fiscal 2018. These steps and others are intended to promote operational efficiencies and further reduce our operating expenses as a percentage of net sales as we attempt to offset the lower gross margins we expect to generate by increased sales to the supernatural and conventional supermarket channels and as a result of additional competition in our business.
We have been the primary distributor to Whole Foods Market for more than eighteen years. We have and continue to serve as the primary distributor to Whole Foods Market in all of its regions in the United States pursuant to a distribution agreement that expires on September 28, 2025. Whole Foods Market accounted for approximately 35% and 34% of our net sales for the years ended July 30, 2016 and August 1, 2015, respectively.
In July 2014, we completed the acquisition of all of the outstanding capital stock of Tony's, through our wholly-owned subsidiary, UNFI West, for consideration of approximately $202.7 million. With the completion of the transaction, Tony's became a wholly-owned subsidiary and continues to operate as Tony's Fine Foods. Founded in 1934 by the Ingoglia family, Tony's is headquartered in West Sacramento, California and is a leading distributor of perishable food products, including a wide array of specialty protein, cheese, deli, food service and bakery goods to retail and specialty grocers, food service customers and other distribution companies principally located throughout the Western United States, as well as Alaska and Hawaii. We believe that the acquisition of Tony's accomplished certain of our strategic objectives as Tony’s provides us with a platform for expanding both our high-growth perishable product offerings and our distribution footprint in the Western Region of the United States.
In March 2016, the Company acquired certain assets of Global Organic/Specialty Source, Inc. and related affiliates (collectively "Global Organic") through our wholly owned subsidiary Albert's Organics, Inc. ("Albert's"), for consideration of approximately $20.6 million in cash. Global Organic is a premier distributor of organic fruits, vegetables, juices, milk, eggs, nuts, and coffee located in Sarasota, Florida serving customer locations across the Southeastern United States. Global Organic's operations have been combined with the existing Albert's business in the Southeast and operate as Albert's.
28
In March 2016, the Company acquired all of the outstanding stock of Nor-Cal and an affiliated entity as well as certain real estate, for approximately $68.6 million in cash, subject to certain customary post-closing adjustments. With the completion of the transaction, Nor-Cal became a wholly-owned subsidiary and continues to operate as Nor-Cal Produce Inc. Founded in 1972, Nor-Cal is a distributor of conventional and organic produce and other fresh products primarily to independent retailers in Northern California, with primary operations located in West Sacramento, California. We believe that our acquisition of Nor-Cal will aid in our efforts to expand our fresh offering, particularly within the conventional produce segment.
In May 2016, the Company completed its acquisition of all of the outstanding equity interests of Haddon and certain affiliates for total consideration of approximately $219.1 million in cash, subject to certain customary post-closing adjustments. With the completion of the transaction, Haddon became a wholly-owned subsidiary and continues to operate as Haddon House Food Products, Inc. Founded in 1960 by the Anderson family, Haddon is a well-respected distributor and merchandiser of natural and organic and gourmet ethnic products throughout the Eastern United States. Haddon has a history of providing quality high touch merchandising services to their customers. Haddon has a diverse, multi-channel customer base including conventional supermarkets, gourmet food stores and independently owned product retailers. We believe that our acquisition of Haddon will expand the product and service offering that we expect to play an important role in our ongoing strategy to build out our gourmet and ethnic product categories.
In August 2016, the Company acquired all of the outstanding stock of Gourmet Guru. Founded in 1996 and headquartered in Bronx, New York, Gourmet Guru is a distributor and merchandiser of fresh and organic food focusing on new and emerging brands. We believe that our acquisition of Gourmet Guru enhances our strength in finding and cultivating emerging fresh and organic brands and further expands our presence in key urban markets.
The ability to distribute specialty food items (including ethnic, kosher and gourmet) has accelerated our expansion into a number of high-growth business markets and allowed us to establish immediate market share in the fast-growing specialty foods market. We have now integrated specialty food products and natural and organic specialty non-food products into all of our broadline distribution centers across the United States and Canada. Due to our expansion into specialty foods, over the past several years we have been awarded new business with a number of conventional supermarkets that we previously had not done business with because we did not distribute specialty products. We believe our acquisition of Haddon will expand our capabilities in the specialty category and we expect to expand our offerings of specialty products to include those products distributed by Haddon that we did not previously distribute to our customers. We believe that distribution of these products enhances our conventional supermarket business channel and that our complementary product lines continue to present opportunities for cross-selling.
To maintain our market leadership and improve our operating efficiencies, we seek to continually:
• | expand our marketing and customer service programs across regions; |
• | expand our national purchasing opportunities; |
• | offer a broader product selection than our competitors; |
• | offer operational excellence with high service levels and a higher percentage of on-time deliveries than our competitors; |
• | centralize general and administrative functions to reduce expenses; |
• | consolidate systems applications among physical locations and regions; |
• | increase our investment in people, facilities, equipment and technology; |
• | integrate administrative and accounting functions; and |
• | reduce the geographic overlap between regions. |
Our continued growth has allowed us to expand our existing facilities and open new facilities in an effort to achieve increasing operating efficiencies. We have made significant capital expenditures and incurred considerable expenses in connection with the opening and expansion of our facilities. At July 30, 2016, our distribution capacity totaled approximately 8.7 million square feet. We are at the end of our multi-year expansion plan, which included new distribution centers in Racine, Wisconsin, Hudson Valley, New York, Prescott, Wisconsin, and Gilroy, California from which we began operations in June 2014, September 2014, April 2015 and February 2016, respectively. We believe that as a result of the opening of our Gilroy, California distribution center, and our acquisition of Haddon, which operates distribution centers in New Jersey and South Carolina, we are unlikely to open or commence construction on a new distribution center in the next twelve months.
Our net sales consist primarily of sales of natural, organic and specialty products to retailers, adjusted for customer volume discounts, returns and allowances. Net sales also consist of amounts charged by us to customers for shipping and handling and fuel surcharges. The principal components of our cost of sales include the amounts paid to manufacturers and growers for product
29
sold, plus the cost of transportation necessary to bring the product to our distribution centers, offset by consideration received from suppliers in connection with the purchase or promotion of the suppliers' products. Cost of sales also includes amounts incurred by us at our manufacturing subsidiary, Woodstock Farms Manufacturing, for inbound transportation costs and for depreciation for manufacturing equipment. Our gross margin may not be comparable to other similar companies within our industry that may include all costs related to their distribution network in their costs of sales rather than as operating expenses. We include purchasing, receiving, selecting and outbound transportation expenses within our operating expenses rather than in our cost of sales. Total operating expenses include salaries and wages, employee benefits, warehousing and delivery, selling, occupancy, insurance, administrative, share-based compensation, depreciation and amortization expense. Other expenses (income) include interest on our outstanding indebtedness, including the financing obligation related to our Aurora, Colorado distribution center, interest income and miscellaneous income and expenses. Fiscal 2015 other income includes a gain of $4.2 million associated with a transfer of land at the Company's Prescott, Wisconsin facility. Fiscal 2014 other income includes a gain of $4.8 million associated with a non-cash transfer pursuant to which we acquired the land on which we constructed our Racine, Wisconsin facility.
Results of Operations
The following table presents, for the periods indicated, certain income and expense items expressed as a percentage of net sales:
Fiscal year ended | ||||||||||
July 30, 2016 | August 1, 2015 | August 2, 2014 | ||||||||
Net sales | 100.0 | % | 100.0 | % | 100.0 | % | ||||
Cost of sales | 84.9 | % | 84.6 | % | 83.4 | % | ||||
Gross profit | 15.1 | % | 15.4 | % | 16.6 | % | ||||
Operating expenses | 12.4 | % | 12.4 | % | 13.5 | % | ||||
Restructuring and asset impairment expenses | 0.1 | % | — | % | — | % | ||||
Total operating expenses | 12.5 | % | 12.4 | % | 13.5 | % | ||||
Operating income | 2.6 | % | 3.0 | % | 3.1 | % | ||||
Other expense (income): | ||||||||||
Interest expense | 0.2 | % | 0.2 | % | 0.1 | % | ||||
Interest income | — | % | — | % | — | % | ||||
Other, net | — | % | — | % | (0.1 | )% | ||||
Total other expense, net | 0.2 | % | 0.1 | % | * | — | % | |||
Income before income taxes | 2.5 | % | * | 2.8 | % | * | 3.1 | % | ||
Provision for income taxes | 1.0 | % | 1.1 | % | 1.2 | % | ||||
Net income | 1.5 | % | 1.7 | % | 1.8 | % | * | |||
* Total reflects rounding
Fiscal year ended July 30, 2016 compared to fiscal year ended August 1, 2015
Net Sales
Our net sales for the fiscal year ended July 30, 2016 increased approximately 3.5%, or $285.3 million, to $8.47 billion from $8.18 billion for the fiscal year ended August 1, 2015. The year-over-year increase in net sales was primarily due to growth in our wholesale segment of $296.0 million. We experienced net sales organic growth (sales growth excluding the impact of current year acquisitions) of 1.5% over the prior fiscal year due to the continued growth of the natural and organic products industry in general, increased market share as a result of our focus on service and value added services, and a broader selection of products, including specialty foods. Net sales growth for fiscal 2016 was negatively impacted in part by the termination of our distribution relationship with a large conventional supermarket customer in September 2015. Net sales for the fiscal year ended July 30, 2016 was favorably impacted by the acquisitions of Nor-Cal and Haddon which contributed approximately $51.4 million and $100.4 million of net sales, respectively. Our net sales for the fiscal year ended July 30, 2016 were also favorably impacted by moderate price inflation of approximately 1% during the year.
30
Our net sales by customer type for the fiscal years ended July 30, 2016 and August 1, 2015 were as follows (in millions):
Customer Type | 2016 Net Sales | % of Total Net Sales | 2015 Net Sales | % of Total Net Sales | |||||||||||
Independently owned natural products retailers | $ | 2,326 | 27 | % | $ | 2,175 | 27 | % | |||||||
Supernatural chains | 2,951 | 35 | % | 2,812 | 34 | % | |||||||||
Conventional supermarkets | 2,259 | 27 | % | 2,399 | 29 | % | |||||||||
Other | 934 | 11 | % | 799 | 10 | % | |||||||||
Total | $ | 8,470 | 100 | % | $ | 8,185 | 100 | % | |||||||
Net sales by channel have been adjusted to reflect changes in the classification of customer types resulting from a review of our customer lists. There was no financial statement impact as a result of revising the classification of customer types. As a result of this adjustment, net sales to our conventional supermarket and other channels for the fiscal year ended August 1, 2015 increased approximately $267 million and $218 million, respectively, or 3% in each category as a percentage of net sales compared to the previously reported amounts, while this adjustment caused net sales to the independent retailer channel to decrease approximately $475 million, or 5%, and net sales to our supernatural channel to decrease approximately $10 million, or 1%, as a percentage of net sales, for fiscal year ended August 1, 2015 compared to the previously reported amounts.
Net sales to our independent retailer channel increased by approximately $151 million, or 6.9% during the fiscal year ended July 30, 2016 compared to the fiscal year ended August 1, 2015, and accounted for 27% of our total net sales for each of fiscal 2016 and fiscal 2015. The increase in net sales in this channel is primarily attributable to net sales from our acquisitions during fiscal 2016 as well as growth in our wholesale division, which includes our broadline distribution business.
Whole Foods Market is our only supernatural chain customer, and net sales to Whole Foods Market for the fiscal year ended July 30, 2016 increased by approximately $139 million or 4.9% over the prior year and accounted for approximately 35% and 34% of our total net sales for the fiscal years ended July 30, 2016 and August 1, 2015, respectively. The increase in net sales to Whole Foods Market is primarily due to new store openings offset in part by lower year over year same store sales at Whole Foods Market.
Net sales to conventional supermarkets for the fiscal year ended July 30, 2016 decreased by approximately $140 million, or 5.8% from fiscal 2015 and represented approximately 27% and 29% of total net sales in fiscal 2016 and fiscal 2015, respectively. The decrease in net sales to conventional supermarkets is due in part to the termination of our distribution relationship with a large conventional supermarket customer in September 2015, offset in part by increased sales to certain of our other existing conventional supermarket customers and sales to new conventional supermarket customers that we added, including through acquisitions, since fiscal 2015.
Other net sales, which include sales to foodservice, e-commerce sales and sales from the United States to other countries, as well as sales through our retail division, manufacturing division, and our branded product lines, increased by approximately $135 million or 16.9% during the fiscal year ended July 30, 2016 over the prior fiscal year and accounted for approximately 11% of total net sales in fiscal 2016 as compared to 10% in fiscal 2015. The increase in other net sales is attributable to expanded sales to our existing foodservice partners and growth in our e-commerce business.
As we continue to aggressively pursue new customers and expand relationships with existing customers and pursue opportunistic acquisitions, we expect net sales for fiscal 2017 to grow over fiscal 2016. We believe that the integration of our specialty business into our national platform has allowed us to attract customers that we would not have been able to attract without that business and will continue to allow us to pursue a broader array of customers as many customers seek a single source for their natural, organic and specialty products. We believe that our acquisitions of Haddon, Nor-Cal and Global Organic will enhance our ability to offer our customers a more comprehensive set of products than many of our competitors. We also expect that our ability to add products that each of Tony's and Haddon has historically sold to our selection of products in our other markets will contribute to an increase in net sales. We believe that our projected net sales growth will come from both sales to new customers (including as a result of acquisitions) and an increase in the number of products that we sell to existing customers. We expect that most of this net sales growth will occur in our lower gross margin supernatural and conventional supermarket channels. Although sales to these customers typically generate lower gross margins than sales to customers within our independent retailer channel, they also typically carry a lower average cost to serve than sales to our independent customers.
Cost of Sales and Gross Profit
Our gross profit increased approximately 1.5%, or $18.8 million, to $1.28 billion for the fiscal year ended July 30, 2016, from $1.26 billion for the fiscal year ended August 1, 2015. Our gross profit as a percentage of net sales was 15.1% for the fiscal year ended July 30, 2016 and 15.4% for the fiscal year ended August 1, 2015. The decrease in gross profit as a percentage of net
31
sales was primarily due to competitive pricing pressures, moderated supplier promotional activity, a reduction in fuel surcharges and the unfavorable impact of foreign exchange for our Canadian business, offset, in part, by a benefit from current year acquisitions compared to the prior year.
We anticipate net sales growth in the conventional supermarket channel will outpace growth in our other channels in fiscal 2017. We expect that our distribution relationship with Whole Foods Market as well as our opportunities in the conventional supermarket channel along with increased competition from self distribution and conventional grocery retailers will continue to generate lower gross profit percentages than our historical rates. We will seek to fully offset these reductions in gross profit percentages by reducing our operating expenses as a percent of net sales primarily through improved efficiencies in our supply chain and improvements to our information technology infrastructure, including our ongoing warehouse management system platform.
Operating Expenses
Our total operating expenses increased approximately 3.6%, or $36.7 million, to $1.06 billion for the fiscal year ended July 30, 2016, from $1.02 billion for the fiscal year ended August 1, 2015. As a percentage of net sales, total operating expenses increased to approximately 12.5% for the fiscal year ended July 30, 2016, from approximately 12.4% for the fiscal year ended August 1, 2015.The increase in total operating expenses for the fiscal year ended July 30, 2016 was primarily due to an increase in net sales and the additional costs to service higher sales volume. Operating expenses for fiscal 2016 also included the impact of $4.8 million of severance and other transition costs related to the Company's restructuring plan, $0.8 million of restructuring and impairment costs related to the Company's retail business recorded in the fourth quarter of fiscal 2016, $1.8 million of bad debt expense related to outstanding receivables for a customer who declared bankruptcy in the first quarter of fiscal 2016, $2.2 million of acquisition costs, $2.4 million of amortization of intangibles from current year acquisitions, and $2.5 million of startup costs related to the Company's Gilroy, California facility. Total operating expenses for fiscal 2015 included startup costs of approximately $3.0 million related to the Company's Hudson Valley, New York, Auburn, California and Prescott, Wisconsin facilities, $0.6 million associated with the write-off of an intangible asset related to the Company's Canadian division, which was acquired in 2010, a $0.2 million restructuring charge related to the closure of the Company's Aux Mille facility located in Quebec, Canada, and approximately $0.3 million in costs related to the Company's acquisition of Tony's, offset in part by a $0.8 million energy grant received related to the Company's Hudson Valley, New York facility.
Total operating expenses for fiscal 2016 include share-based compensation expense of $15.3 million, compared to $14.0 million in fiscal 2015. The Company did not record share-based compensation expense related to performance-based share awards in fiscal 2016, including compensation expense with respect to the long-term incentive awards with performance metrics tied to fiscal 2016 results, as a result of performance measures not being attained at the end of the fiscal year and the resulting forfeiture of these awards. The Company recognized a benefit of $1.0 million related to performance-based share awards for the fiscal year ended August 1, 2015 due to the reversal of share-based compensation expense recorded in fiscal 2014 caused by performance measures not being attained as of the end of fiscal 2015 and the resulting forfeiture of these awards. See Note 3 "Equity Plans" to our Consolidated Financial Statements included in "Item 8. Financial Statements and Supplementary Data" of this Annual Report on Form 10-K.
Operating Income
Operating income decreased approximately 7.4%, or $17.8 million, to $224.1 million for the fiscal year ended July 30, 2016, from $242.0 million for the fiscal year ended August 1, 2015. As a percentage of net sales, operating income was 2.6% and 3.0% for the fiscal years ended July 30, 2016 and August 1, 2015, respectively.
Other Expense (Income)
Other expense, net increased $3.7 million to $15.9 million for the fiscal year ended July 30, 2016, from $12.2 million for the fiscal year ended August 1, 2015. Interest expense for the fiscal year ended July 30, 2016 increased to $16.3 million from $14.5 million in the fiscal year ended August 1, 2015. This increase is primarily due to an increase in borrowings over the prior year, as we utilized borrowings under our amended and restated revolving credit facility to finance our acquisitions in fiscal 2016. Interest income for the fiscal year ended July 30, 2016 increased to $1.1 million from $0.4 million in the fiscal year ended August 1, 2015. Other income for the fiscal year ended August 1, 2015 includes a gain of $4.2 million associated with a transfer of land at the Company's Prescott, Wisconsin facility.
Provision for Income Taxes
Our effective income tax rate was 39.6% for each of the fiscal years ended July 30, 2016 and August 1, 2015.
32
Net Income
Reflecting the factors described in more detail above, net income decreased $13.0 million to $125.8 million, or $2.50 per diluted share, for the fiscal year ended July 30, 2016, compared to $138.7 million, or $2.76 per diluted share for the fiscal year ended August 1, 2015.
Fiscal year ended August 1, 2015 compared to fiscal year ended August 2, 2014
Net Sales
Our net sales for the fiscal year ended August 1, 2015 increased approximately 20.5%, or $1.39 billion, to $8.18 billion from $6.79 billion for the fiscal year ended August 2, 2014. Net sales for the fiscal year ended August 1, 2015 were negatively impacted by $9.3 million as a result of additional amounts owed to a customer from an incorrect calculation of contractual obligations to that customer from fiscal 2009 through fiscal 2014. The year-over-year increase in net sales of $1.39 billion was primarily due to growth in our wholesale segment. We experienced organic growth (sales growth excluding the impact of acquisitions) of 7.9% over the prior fiscal year due to the continued growth of the natural and organic products industry in general, increased market share as a result of our focus on service and value added services, and a broader selection of products, including specialty foods. Net sales for the fiscal year ended August 1, 2015 were favorably impacted by the acquisition of Tony's which contributed approximately $882.8 million of net sales as compared to $45.3 million for the fiscal year ended August 2, 2014, as Tony's was acquired during the fourth quarter of fiscal 2014. Our net sales for the fiscal year ended August 1, 2015 were also favorably impacted by moderate price inflation of approximately 2% during the year.
Our net sales by customer type for the fiscal years ended August 1, 2015 and August 2, 2014 were as follows (in millions):
Customer Type | 2015 Net Sales | % of Total Net Sales | 2014 Net Sales | % of Total Net Sales | |||||||||||
Independently owned natural products retailers | $ | 2,175 | 27 | % | $ | 2,020 | 30 | % | |||||||
Supernatural chains | 2,812 | 34 | % | 2,422 | 36 | % | |||||||||
Conventional supermarkets | 2,399 | 29 | % | 1,813 | 27 | % | |||||||||
Other | 799 | 10 | % | 539 | 7 | % | * | ||||||||
Total | $ | 8,185 | 100 | % | $ | 6,794 | 100 | % | |||||||
* Total reflects rounding
Net sales by channel have been adjusted to reflect changes in the classification of customer types resulting from a review of our customer lists. There was no financial statement impact as a result of revising the classification of customer types. As a result of this adjustment, net sales to our conventional supermarket and other channels for the fiscal year ended August 1, 2015 increased approximately $267 million and $218 million, respectively, or 3% in each category as a percentage of net sales compared to the previously reported amounts, while this adjustment caused net sales to the independent retailer channel to decrease approximately $475 million, or 5%, and net sales to our supernatural channel to decrease approximately $10 million, or 1%, as a percentage of net sales, for fiscal year ended August 1, 2015 compared to the previously reported amounts. Net sales to our conventional supermarket and other channels for the fiscal year ended August 2, 2014 increased approximately $58 million and $145 million, respectively, or 1% in each case as a percentage of net sales compared to previously reported amounts, while this adjustment caused net sales to the independent retailer channel to decrease approximately $203 million, or 2%, as a percentage of net sales.
Net sales to our independent retailer channel increased by approximately $155 million, or 7.7% during the fiscal year ended August 1, 2015 compared to the fiscal year ended August 2, 2014, and accounted for 27% and 30% of our total net sales for fiscal 2015 and fiscal 2014, respectively. While net sales in this channel increased, they grew at a slower rate than net sales in our supernatural and conventional supermarket channels, and therefore represent a lower percentage of our total net sales compared to the prior year.
Whole Foods Market is our only supernatural chain customer, and net sales to Whole Foods Market for the fiscal year ended August 1, 2015 increased by approximately $390 million or 16.1% over the prior year and accounted for approximately 34% and 36% of our total net sales for the fiscal years ended August 1, 2015 and August 2, 2014, respectively. The increase in sales to Whole Foods Market was primarily due to increases in same-store sales as well as net store openings and net sales to Whole Foods Market by our Tony's business.
Net sales to conventional supermarkets for the fiscal year ended August 1, 2015 increased by approximately $586 million, or 32% from fiscal 2014 and represented approximately 29% and 27% of total net sales for the fiscal years ended August 1, 2015 and August 2, 2014, respectively. The increase in net sales to conventional supermarkets was due to continued success in our
33
strategy of seeking to be the sole supplier of natural, organic and specialty products to our conventional supermarket customers, as well as net sales by our Tony's business.
Other net sales, which included sales to foodservice and e-commerce sales and sales from the United States to other countries, as well as sales through our retail division, manufacturing division, and our branded product lines, increased by approximately $260 million or 48% during the fiscal year ended August 1, 2015 over the prior fiscal year and accounted for approximately 10% of total net sales in fiscal 2015 as compared to 7% in fiscal 2014. The increase in other net sales was attributable to net sales from our Tony's business and expanded sales to our existing foodservice partners.
Cost of Sales and Gross Profit
Our gross profit increased approximately 11.8%, or $132.9 million, to $1.26 billion for the fiscal year ended August 1, 2015, from $1.13 billion for the fiscal year ended August 2, 2014. Our gross profit as a percentage of net sales was 15.4% for the fiscal year ended August 1, 2015 and 16.6% for the fiscal year ended August 2, 2014. The decrease in gross profit as a percentage of net sales in fiscal 2015 was primarily due to the dilution from Tony's net sales, the adverse impact from the reduction in net sales attributable to the incorrect calculation of customer contractual obligations disclosed above, the impact of unfavorable foreign exchange on our Canadian business, a decline in fuel surcharges and a shift in the mix of sales.
Our gross profits are generally higher on net sales to independently owned retailers and lower on net sales in the conventional supermarket and the supernatural channels. For the fiscal year ended August 1, 2015 approximately $976 million of our total net sales growth of $1.39 billion was from increased net sales in the conventional supermarket and supernatural channels. Approximately 64% and 62% of our total net sales for fiscal years 2015 and 2014, respectively, were to the conventional supermarket and supernatural channels.
Operating Expenses
Our total operating expenses increased approximately 11.1%, or $101.7 million, to $1.02 billion for the fiscal year ended August 1, 2015, from $916.9 million for the fiscal year ended August 2, 2014. As a percentage of net sales, total operating expenses decreased to approximately 12.4% for the fiscal year ended August 1, 2015, from approximately 13.5% for the fiscal year ended August 2, 2014. The increase in total operating expenses for the fiscal year ended August 1, 2015 was primarily due to an increase in net sales and the additional costs to service higher sales volume. Total operating expenses for the fiscal year ended August 1, 2015 included startup costs of approximately $3.0 million related to the our Hudson Valley, New York, Auburn, California and Prescott, Wisconsin facilities, $0.6 million associated with the write-off of an intangible asset related to the Company's Canadian division, which was acquired in June 2010, a $0.2 million restructuring charge related to the closure of the Company's Aux Mille facility located in Quebec, Canada, and approximately $0.3 million in costs related to the Company's acquisition of Tony's, offset in part by a $0.8 million energy grant received related to our Hudson Valley, New York facility. Operating expenses for the fiscal year ended August 2, 2014 included approximately $2.2 million related to the start up of the Company's Racine, Wisconsin and Hudson Valley, New York facilities, in addition to approximately $1.5 million of Tony's acquisition costs.
Total operating expenses for fiscal 2015 include share-based compensation expense of $14.0 million, compared to $14.6 million in fiscal 2014. Share-based compensation expense for the fiscal year ended August 2, 2014 included approximately $1.1 million in expense related to performance share-based awards granted to our Chief Executive Officer related to certain financial goals for the fiscal year ended August 2, 2014. No such expense was recorded for the fiscal year ended August 1, 2015 as the applicable goals were not attained. Share-based compensation expense also included an overall benefit of $1.0 million and $0.1 million for the years ended August 1, 2015 and August 2, 2014, respectively, related to performance-based equity compensation arrangements with a 2-year performance-based vesting component established for members of our executive leadership team. The $1.0 million net benefit recorded for fiscal 2015 was a result of established metrics not being met for the 2-year performance period ended August 1, 2015 as compared to a $0.1 million benefit recorded in fiscal 2014 as result of established metrics not being met for the 2-year performance period ended August 2, 2014. See Note 3 "Equity Plans" to our Consolidated Financial Statements included in "Item 8. Financial Statements and Supplementary Data" of this Annual Report on Form 10-K.
Operating Income
Operating income increased approximately 14.8%, or $31.2 million, to $242.0 million for the fiscal year ended August 1, 2015, from $210.8 million for the fiscal year ended August 2, 2014. As a percentage of net sales, operating income was 3.0% and 3.1% for the fiscal years ended August 1, 2015 and August 2, 2014, respectively.
Other Expense (Income)
Other expense, net increased $8.8 million to $12.2 million for the fiscal year ended August 1, 2015, from $3.4 million for the fiscal year ended August 2, 2014. Interest expense for the fiscal year ended August 1, 2015 increased to $14.5 million from $7.8 million in the fiscal year ended August 2, 2014. This increase was primarily due to an increase in borrowings over the prior
34
year and higher average interest rates as well as $0.9 million of interest expense recorded related to the capital lease for our Providence, Rhode Island headquarters as the lease agreement was amended during fiscal 2015. Interest income for the fiscal year ended August 1, 2015 decreased to $0.4 million from $0.5 million in the fiscal year ended August 2, 2014. Other income for the fiscal year ended August 1, 2015 included a gain of $4.2 million associated with a transfer of land at the Company's Prescott, Wisconsin facility. Other income for the fiscal year ended August 2, 2014 included a pre-tax gain of $4.8 million associated with a non-cash transfer pursuant to which we acquired the land on which we constructed our Racine, Wisconsin facility.
Provision for Income Taxes
Our effective income tax rate was 39.6% and 39.5% for the fiscal years ended August 1, 2015 and August 2, 2014, respectively. The increase in the effective income tax rate was primarily due to the reduced tax benefit of our foreign operations partially offset by the benefit for a federal solar tax credit claimed by the Company in fiscal 2015.
Net Income
Reflecting the factors described in more detail above, net income increased $13.3 million to $138.7 million, or $2.76 per diluted share, for the fiscal year ended August 1, 2015, compared to $125.5 million, or $2.52 per diluted share for the fiscal year ended August 2, 2014.
Liquidity and Capital Resources
We finance our day to day operations and growth primarily with cash flows from operations, borrowings under our amended and restated revolving credit facility, operating leases, a finance lease, trade payables and bank indebtedness. In addition, from time to time, we may issue equity and debt securities to finance our operations and acquisitions. We believe that our cash on hand and available credit through our amended and restated revolving credit facility as discussed below is sufficient for our operations and planned capital expenditures over the next twelve months. We expect to generate an average of $175.0 million to $230 million in cash flow from operations per year for the 2017 and 2018 fiscal years. We intend to continue to utilize this cash generated from operations to fund acquisitions, fund investment in working capital and capital expenditure needs and reduce our debt levels. We intend to manage capital expenditures to approximately 0.6% to 0.8% of net sales for fiscal 2017, reflecting a slight increase over fiscal 2016 levels and a decrease over levels experienced in fiscal 2014 and fiscal 2015. We expect to finance requirements with cash generated from operations and borrowings under our amended and restated revolving credit facility. Our planned capital projects for fiscal 2017 will be focused on continuing the implementation of our information technology projects across the Company that we believe will provide us with increased efficiency and the capacity to continue to support the growth of our customer base. Future investments and acquisitions may be financed through equity, long-term debt or borrowings under our amended and restated revolving credit facility.
The Company has not recorded a tax provision for U.S. tax purposes on UNFI Canada’s profits as it has no assessable profits arising in or derived from the United States and we intend to indefinitely reinvest accumulated earnings in the UNFI Canada operations.
On April 29, 2016, we entered into the Third Amended and Restated Loan and Security Agreement (the “Third A&R Credit Agreement”) amending and restating certain terms and provisions of our revolving credit facility, which increased the maximum borrowings under the amended and restated revolving credit facility and extended the maturity date to April 29, 2021. Up to $850.0 million is available to our U.S. subsidiaries and up to $50.0 million is available to UNFI Canada. After giving effect to the Third A&R Credit Agreement, the amended and restated revolving credit facility provides an option to increase the U.S. or Canadian revolving commitments by up to an additional $600 million (but in not less than $10.0 million increments) subject to certain customary conditions and the lenders committing to provide the increase in funding.
The borrowings of the U.S. portion of the amended and restated revolving credit facility, after giving effect to the Third A&R Credit Agreement, accrue interest, at the base rate plus an applicable margin of 0.25% or LIBOR rate plus an applicable margin of 1.25% for the twelve month period ending April 29, 2017. After this period, the interest on the U.S. borrowings is accrued at the Company's option, at either (i) a base rate (generally defined as the highest of (x) the Bank of America Business Capital prime rate, (y) the average overnight federal funds effective rate plus one-half percent (0.50%) per annum and (z) one-month LIBOR plus one percent (1%) per annum) plus an applicable margin that varies depending on daily average aggregate availability, or (ii) the LIBOR rate plus an applicable margin that varies depending on daily average aggregate availability. The borrowings on the Canadian portion of the credit facility accrue interest at the Canadian prime rate plus an applicable margin of 0.25% or a bankers' acceptance equivalent rate plus an applicable margin of 1.25% for the twelve month period ending April 29, 2017. After this period, the borrowings on the Canadian portion of the credit facility accrue interest, at the Company's option, at either (i) a Canadian prime rate (generally defined as the highest of (x) 0.50% over 30-day Reuters Canadian Deposit Offering Rate ("CDOR") for bankers' acceptances, (y) the prime rate of Bank of America, N.A.'s Canada branch, and (z) a bankers' acceptance equivalent rate for a one month interest period plus 1.00%) plus an applicable margin that varies depending on daily average aggregate
35
availability, or (ii) a bankers' acceptance equivalent rate of the rate of interest per annum equal to the annual rates applicable to Canadian Dollar bankers' acceptances on the "CDOR Page" of Reuter Monitor Money Rates Service, plus five basis points, and an applicable margin that varies depending on daily average aggregate availability. Unutilized commitments are subject to an annual fee in the amount of 0.30% if the total outstanding borrowings are less than 25% of the aggregate commitments, or a per annum fee of 0.25% if such total outstanding borrowings are 25% or more of the aggregate commitments. The Company is also required to pay a letter of credit fronting fee to each letter of credit issuer equal to 0.125% per annum of the stated amount of each such letter of credit (or such other amount as may be mutually agreed by the borrowers under the facility and the applicable letter of credit issuer), as well as a fee to all lenders equal to the applicable margin for LIBOR or bankers’ acceptance equivalent rate loans, as applicable, times the average daily stated amount of all outstanding letters of credit.
As of July 30, 2016, the Company's borrowing base, which is calculated based on eligible accounts receivable and inventory levels, net of $7.4 million in reserves, was $832.7 million. As of July 30, 2016, the Company had $426.5 million of borrowings outstanding under the Company's amended and restated revolving credit facility and $37.4 million in letter of credit commitments which reduced the Company's available borrowing capacity under its revolving credit facility on a dollar for dollar basis. The Company's resulting remaining availability was approximately $368.7 million as of July 30, 2016.
The revolving credit facility, as amended and restated, subjects us to a springing minimum fixed charge coverage ratio (as defined in the Third A&R Credit Agreement) of 1.0 to 1.0 calculated at the end of each of our fiscal quarters on a rolling four quarter basis when the adjusted aggregate availability (as defined in the Third A&R Credit Agreement) is less than the greater of (i) $60.0 million and (ii) 10% of the aggregate borrowing base. We were not subject to fixed charge coverage ratio covenants of the amended and restated revolving credit facility as of the fiscal year ended July 30, 2016.
On August 14, 2014, we and certain of our subsidiaries entered into a real estate backed term loan agreement (the "Term Loan Agreement"). The total initial borrowings under our term loan facility were $150.0 million. We are required to make $2.5 million principal payments quarterly. Under the Term Loan Agreement, we at our option may request the establishment of one or more new term loan commitments in increments of at least $10.0 million, but not to exceed $50.0 million in total, subject to the approval of the Lenders electing to participate in such incremental loans and the satisfaction of the conditions required by the Term Loan Agreement. We will be required to make quarterly principal payments on these incremental borrowings in accordance with the terms of the Term Loan Agreement. Proceeds from this Term Loan Agreement were used to pay down borrowings on our amended and restated revolving credit facility.
On April 29, 2016, the Company entered into a First Amendment Agreement (the “Term Loan Amendment”) to the Term Loan Agreement which amends the Term Loan Agreement. The Term Loan Amendment was entered into to reflect the changes to the amended and restated revolving credit facility reflected in the Third A&R Credit Agreement. The Term Loan Agreement will terminate on the earlier of (a) August 14, 2022 and (b) the date that is ninety days prior to the termination date of our amended and restated revolving credit facility.
On September 1, 2016, the Company entered into a Second Amendment Agreement (the "Second Amendment") to the Term Loan Agreement which amends the Term Loan Agreement to adjust the applicable margin charged to borrowings thereunder. As amended by the Second Amendment, borrowings under the Term Loan Agreement bear interest at rates that, at the Company's option, can be either: (1) a base rate generally defined as the sum of (i) the highest of (x) the Administrative Agent's prime rate, (y) the average overnight federal funds effective rate plus 0.50% and (z) one-month LIBOR plus one percent (1%) per annum and (ii) a margin of 0.75%; or, (2) a LIBOR rate generally defined as the sum of (i) LIBOR (as published by Reuters or other commercially available source) for one, two, three or six months or, if approved by all affected lenders, nine months (all as selected by the Company), and (ii) a margin of 1.75%. Interest accrued on borrowings under the Term Loan Agreement is payable in arrears. Interest accrued on any LIBOR loan is payable on the last day of the interest period applicable to the loan and, with respect to any LIBOR loan of more than three (3) months, on the last day of every three (3) months of such interest period. Interest accrued on base rate loans is payable on the first day of every month. The Company is also required to pay certain customary fees to the Administrative Agent. The borrowers’ obligations under the Term Loan Agreement are secured by certain parcels of the borrowers’ real property.
The Term Loan Agreement includes financial covenants that require (i) the ratio of our consolidated EBITDA (as defined in the Term Loan Agreement) minus the unfinanced portion of Capital Expenditures (as defined in the Term Loan Agreement) to our consolidated Fixed Charges (as defined in the Term Loan Agreement) to be at least 1.20 to 1.00 as of the end of any period of four fiscal quarters, (ii) the ratio of our Consolidated Funded Debt (as defined in the Term Loan Agreement) to our EBITDA for the four fiscal quarters most recently ended to be not more than 3.00 to 1.00 as of the end of any fiscal quarter and (iii) the ratio, expressed as a percentage, of our outstanding principal balance under the Loans (as defined in the Term Loan Agreement), divided by the Mortgaged Property Value (as defined in the Term Loan Agreement) to be not more than 75% at any time.
36
On January 23, 2015 we entered into a forward starting interest rate swap agreement with an effective date of August 3, 2015, which expires in August 2022 concurrent with the scheduled maturity of our Term Loan Agreement. This interest rate swap agreement has an initial notional amount of $140.0 million and provides for us to pay interest for a seven-year period at a fixed rate of 1.795% while receiving interest for the same period at the one-month LIBOR on the same notional principal amount. The interest rate swap agreement has an amortizing notional amount which adjusts down on the dates payments are due on the underlying term loan. The interest rate swap has been entered into as a hedge against LIBOR movements on $140.0 million of the current variable rate indebtedness under the Term Loan Agreement at one-month LIBOR plus 1.00% and a margin of 1.50%, thereby fixing our effective rate on the notional amount at 4.295%. The swap agreement qualifies as an “effective” hedge under Accounting Standards Codification ("ASC") 815 Derivatives and Hedging.
On June 7, 2016, the Company entered into two pay fixed and receive floating interest rate swap agreements to effectively fix the underlying variable rate debt on the Company’s amended and restated revolving credit facility. The first agreement has an effective date of June 9, 2016 and expires in June of 2019. This interest rate swap agreement has a notional principal amount of $50.0 million and provides for the Company to pay interest for a three-year period at a fixed annual rate of 0.8725% while receiving interest for the same period at one-month LIBOR on the same notional principal amount. This swap, in conjunction with the amended and restated revolving credit facility, effectively fixes the interest rate on the $50.0 million notional amount. The second agreement has an effective date of June 9, 2016 and expires concurrent with the scheduled maturity of our amended and restated revolving credit facility in April of 2021. This interest rate swap agreement has a notional principal amount of $25.0 million and provides for the Company to pay interest for a five-year period at a fixed rate of 1.065% while receiving interest for the same period at one-month LIBOR on the same notional principal amount. This swap, in conjunction with the amended and restated revolving credit facility, effectively fixes the interest rate on the $25.0 million notional amount.
On June 24, 2016, the Company entered into two additional pay fixed and receive floating interest rate swap agreements to effectively fix the underlying variable rate debt on the Company’s amended and restated revolving credit facility. The first agreement has an effective date of July 24, 2016 and expires in June of 2019. This interest rate swap agreement has a notional principal amount of $50.0 million and provides for the Company to pay interest for a three year period at a fixed annual rate of 0.7265% while receiving interest for the same period at one-month LIBOR on the same notional principal amount. This swap, in conjunction with the amended and restated revolving credit facility, effectively fixes the interest rate on the $50.0 million notional amount. The second agreement has an effective date of July 24, 2016 and expires concurrent with the scheduled maturity of our amended and restated revolving credit facility in April of 2021. This interest rate swap agreement has a notional principal amount of $25.0 million and provides for the Company to pay interest for a five year period at a fixed rate of 0.9260% while receiving interest for the same period at one-month LIBOR on the same notional principal amount. This swap, in conjunction with the amended and restated revolving credit facility, effectively fixes the interest rate on the $25.0 million notional amount.
Our capital expenditures for the 2016 fiscal year were $41.4 million, compared to $129.1 million for fiscal 2015, a decrease of $87.7 million, primarily driven by spending in fiscal 2015 on the construction of our new Racine, Wisconsin, Hudson Valley, New York, and Gilroy, California distribution centers. In the case of our Gilroy facility, the majority of our spending occurred in fiscal 2015 ahead of that facility's opening in fiscal 2016. We believe that our capital requirements for fiscal 2017 will be between $55 million and $80 million. We expect to finance these requirements with cash generated from operations and borrowings under our amended and restated revolving credit facility. Our planned capital projects will provide technology that we believe will provide us with increased efficiency and the capacity to continue to support the growth of our customer base. We believe that our capital requirements after fiscal 2017 will be consistent with our anticipated fiscal 2017 requirements, as a percentage of net sales, although we plan to continue to invest in technology and expand our facilities. We anticipate that future investments and acquisitions will be financed through our amended and restated revolving credit facility, or with the issuance of equity or long-term debt, negotiated at the time of the potential acquisition.
Net cash provided by operations was $296.6 million for the year ended July 30, 2016, an increase of $247.7 million from the $48.9 million provided by operations for the year ended August 1, 2015. The primary reasons for the net cash provided by operating activities for fiscal 2016 were net income for the year of $125.8 million which included depreciation and amortization of $71.0 million, a decrease in accounts receivable of $29.4 million and increases in accounts payable and accrued expenses of $14.4 million and $13.1 million, respectively. Net cash provided by operations of $48.9 million for the year ended August 1, 2015 was impacted by an increase in inventories of $153.7 million in part as a result of stocking inventory in our Racine, Wisconsin facility as we began to commence operations, and an increase in accounts receivable of $42.3 million due to our sales growth during the year, offset by net income of $138.7 million. Days in inventory was 49 days at July 30, 2016, compared to 50 days at August 1, 2015. Days sales outstanding decreased from 22 at August 1, 2015 to 20 days at July 30, 2016. Working capital decreased by $27.0 million, or 2.6%, to $991.5 million at July 30, 2016, compared to working capital of $1.02 billion at August 1, 2015, primarily as a result of the increase in our accounts payable and accrued expense and other liability balances.
Net cash used in investing activities increased $208.8 million to $350.9 million for the fiscal year ended July 30, 2016, compared to $142.1 million for the fiscal year ended August 1, 2015. The increase from the fiscal year ended August 1, 2015 was
37
primarily due to the fact that we completed three acquisitions during fiscal 2016. Net cash used in investing activities of $142.1 million for the fiscal year ended August 1, 2015 was primarily due to capital spending associated with our distribution centers in Racine, Wisconsin, Hudson Valley, New York, and Gilroy, California, which was primarily constructed in fiscal 2015 and opened in fiscal 2016.
Net cash provided by financing activities was $56.3 million for the fiscal year ended July 30, 2016. We present proceeds and borrowings related to the Company's amended and restated revolving credit facility on a gross basis. The net cash provided by financing activities was primarily due to gross borrowings under our amended and restated revolving credit facility of $710.0 million, which were primarily due to borrowings used to fund fiscal 2016 acquisitions, partially offset by repayments of our revolving credit line and long-term debt of $646.5 million and $11.3 million, respectively. Net cash provided by financing activities was $94.4 million for the fiscal year ended August 1, 2015 and was primarily due to the borrowings used to fund capital expenditures associated with our Racine, Wisconsin, Hudson Valley, New York and Gilroy, California distribution centers.
In addition to the previously discussed interest rate swaps, from time-to-time we enter into fixed price fuel supply agreements. As of July 30, 2016, we had entered into agreements which require us to purchase a total of approximately 6.1 million gallons of diesel fuel ranging from $1.76 to $3.18 per gallon through December 2016. As of August 1, 2015, we had entered into agreements which required us to purchase a total of approximately 7.4 million gallons of diesel fuel at prices ranging from $3.20 to $3.92 per gallon through December 2015. These fixed price fuel agreements qualify for the "normal purchase" exception under ASC 815, Derivatives and Hedging as physical deliveries will occur rather than net settlements, therefore the fuel purchases under these contracts are expensed as incurred and included within operating expenses.
Critical Accounting Policies and Estimates
The preparation of our consolidated financial statements requires us to make estimates and judgments that affect the reported amounts of assets, liabilities, revenues and expenses, and the related disclosure of contingent assets and liabilities. The Securities and Exchange Commission has defined critical accounting policies as those that are both most important to the portrayal of our financial condition and results and require our most difficult, complex or subjective judgments or estimates. Based on this definition, we believe our critical accounting policies are: (i) determining our allowance for doubtful accounts, (ii) determining our reserves for the self-insured portions of our workers' compensation and automobile liabilities, (iii) valuing assets and liabilities acquired in business combinations; and (iv) valuing goodwill and intangible assets. For all financial statement periods presented, there have been no material modifications to the application of these critical accounting policies.
Allowance for doubtful accounts
We analyze customer creditworthiness, accounts receivable balances, payment history, payment terms and historical bad debt levels when evaluating the adequacy of our allowance for doubtful accounts. In instances where a reserve has been recorded for a particular customer, future sales to the customer are conducted using either cash-on-delivery terms, or the account is closely monitored so that as agreed upon payments are received, orders are released; a failure to pay results in held or canceled orders. Our accounts receivable balance was $489.7 million and $474.5 million, net of the allowance for doubtful accounts of $9.6 million and $7.5 million, as of July 30, 2016 and August 1, 2015, respectively. Our notes receivable balances were $3.7 million and $7.4 million, net of the allowance for doubtful accounts of $1.6 million and $1.0 million, as of July 30, 2016 and August 1, 2015, respectively.
Insurance reserves
We are primarily self-insured for workers' compensation and general and automobile liability insurance. It is our policy to record the self-insured portions of our workers' compensation and automobile liabilities based upon actuarial methods of estimating the future cost of claims and related expenses that have been reported but not settled, and that have been incurred but not yet reported. Any projection of losses concerning workers' compensation and automobile liability is subject to a considerable degree of variability. Among the causes of this variability are unpredictable external factors affecting litigation trends, benefit level changes and claim settlement patterns. If actual claims incurred are greater than those anticipated, our reserves may be insufficient and additional costs could be recorded in our consolidated financial statements. Accruals for workers' compensation and automobile liabilities totaled $23.4 million and $18.7 million as of July 30, 2016 and August 1, 2015, respectively.
38
Business Combinations
We account for acquired businesses using the purchase method of accounting which requires that the assets acquired and liabilities assumed be recorded at the date of the acquisition at their respective estimated fair values. The judgments made in determining the estimated fair value assigned to each class of assets acquired, as well as the estimated life of each asset, can materially impact the net income of the periods subsequent to the acquisition through depreciation and amortization, and in certain instances through impairment charges, if the asset becomes impaired in the future. In determining the estimated fair value for intangible assets, we typically utilize the income approach, which discounts the projected future net cash flow using an appropriate discount rate that reflects the risks associated with such projected future cash flow.
Determining the useful life of an intangible asset also requires judgment, as different types of intangible assets will have different useful lives and certain assets may even be considered to have indefinite useful lives. Intangible assets determined to have an indefinite useful life are reassessed periodically based on the expected use of the asset by us, legal or contractual provisions that may affect the useful life or renewal or extension of the asset’s contractual life without substantial cost, and the effects of demand, competition and other economic factors.
Valuation of goodwill and intangible assets
We are required to test goodwill for impairment at least annually, and between annual tests if events occur or circumstances change that would more likely than not reduce the fair value of a reporting unit below its carrying amount. We have elected to perform our annual tests for indications of goodwill impairment as of the first day of the fourth quarter of each fiscal year. We test for goodwill impairment at the reporting unit level, which is at or one level below the operating segment level. Beginning in fiscal 2012, the first step in our annual assessment of each of our reporting units is a qualitative assessment as allowed under Accounting Standards Update ("ASU") No. 2011-08, Intangibles—Goodwill and Other (Topic 350): Testing Goodwill for Impairment ("ASU 2011-08"), unless we believe it is more likely than not that a reporting unit's fair value is less than the carrying value. In order to qualify for an exclusion from the quantitative two-step goodwill test, the thresholds used by the Company for this determination are that a reporting unit must (1) have passed its previous two-step test with a margin of calculated fair value versus carrying value of at least 20%, (2) have had a two-step test within the past five years, (3) have had no significant changes to its working capital structure, (4) have current year income which is at least 85% of prior year amounts, and (5) present no other factors to be considered as outlined in ASU 2011-08. For reporting units which do not meet this exclusion, the quantitative goodwill impairment analysis is a two-step test. The first step, used to identify potential impairment, involves comparing each reporting unit's estimated fair value to its carrying value, including goodwill. Each reporting unit regularly prepares discrete operating forecasts and uses these forecasts as the basis for the assumptions used in the discounted cash flow analysis. If the estimated fair value of a reporting unit exceeds its carrying value, goodwill is considered not to be impaired and no further testing is required. If the carrying value exceeds estimated fair value, there is an indication of potential impairment and the second step is performed to measure the amount of impairment. If required, the second step involves calculating an implied fair value of goodwill for each reporting unit for which the first step indicated potential impairment. The implied fair value of goodwill is determined in a manner similar to the amount of goodwill calculated in a business combination, by measuring the excess of the estimated fair value of the reporting unit, as determined in the first step, over the aggregate estimated fair values of the individual assets, liabilities and identifiable intangibles as if the reporting unit was being acquired in a business combination. If the implied fair value of goodwill exceeds the carrying value of goodwill assigned to the reporting unit, there is no impairment. If the carrying value of goodwill assigned to a reporting unit exceeds the implied fair value of the goodwill, an impairment charge is recorded for the excess.
As of July 30, 2016, our annual assessment of each of our reporting units indicated that no impairment of goodwill existed. Approximately 95.1% of our goodwill is within our wholesale reporting unit. Total goodwill as of July 30, 2016 and August 1, 2015 was $366.2 million and $266.6 million, respectively. Refer to Note 1, "Significant Accounting Policies", to our Consolidated Financial Statements included in "Item 8. Financial Statements and Supplementary Data" of this Annual Report on Form 10-K for further detail.
Intangible assets with indefinite lives are tested for impairment at least annually as of the first day of the fourth fiscal quarter and if events occur or circumstances change that would indicate that the value of the asset may be impaired. In accordance with ASU No. 2012-02, Intangibles - Goodwill and Other (Topic 350): Testing Indefinite-Lived Intangible Assets for Impairment ("ASU No. 2012-02"), we analyzed several qualitative factors to determine whether it was more likely than not that an indefinite-lived intangible asset was impaired as a basis for determining whether it is necessary to perform the quantitative impairment test. Impairment would be measured as the difference between the fair value of the asset and its carrying value. As of July 30, 2016, our annual assessment of each of our intangible assets with indefinite lives indicated that no impairment existed, Total indefinite lived intangible assets as of July 30, 2016 and August 1, 2015 were $55.7 million and $53.7 million, respectively.
Intangible assets and other long lived assets with finite lives are tested for impairment whenever events or changes in circumstances indicate that the carrying value may not be recoverable. Cash flows expected to be generated by the related assets are estimated over the asset's useful life based on updated projections. If the evaluation indicates that the carrying amount of the
39
asset may not be recoverable, the potential impairment is measured based on a projected discounted cash flow model. During the fiscal year ended July 30, 2016, impairment charges of $0.4 million, and $0.3 million were recorded related to the closure of a Canadian facility and the planned closure of two retail stores at Earth Origins, respectively. During the fiscal year ended August 1, 2015, an impairment charge of $0.6 million was recognized in connection with the closure of a Canadian facility. Total finite-lived intangible assets as of July 30, 2016 and August 1, 2015 were $166.6 million and $72.2 million, respectively.
The assessment of the recoverability of goodwill and intangible assets will be impacted if estimated future cash flows are not achieved.
Commitments and Contingencies
The following schedule summarizes our contractual obligations and commercial commitments as of July 30, 2016:
Payments Due by Period | |||||||||||||||||||
Total | Less than One Year | 1–3 Years | 3–5 Years | Thereafter | |||||||||||||||
(in thousands) | |||||||||||||||||||
Inventory purchase commitments | $ | 18,876 | $ | 18,876 | $ | — | $ | — | $ | — | |||||||||
Diesel fuel purchase commitments | 2,603 | 2,603 | — | — | — | ||||||||||||||
Notes payable (1) | 426,519 | — | — | 426,519 | — | ||||||||||||||
Long-term debt (2) | 175,145 | 11,854 | 24,618 | 105,874 | 32,799 | ||||||||||||||
Deferred compensation | 9,024 | 1,248 | 2,214 | 1,725 | 3,837 | ||||||||||||||
Company owned life insurance premiums | 8,775 | 2,925 | 5,850 | — | — | ||||||||||||||
Long-term non-capitalized leases | 264,632 | 56,269 | 95,813 | 57,186 | 55,364 | ||||||||||||||
Total | $ | 905,574 | $ | 93,775 | $ | 128,495 | $ | 591,304 | $ | 92,000 | |||||||||
(1) The notes payable obligations shown reflect the expiration of the credit facility, not necessarily the underlying individual borrowings. Notes payable does not include outstanding letters of credit of approximately $37.4 million at July 30, 2016 or approximately $39.3 million in interest payments (including unused lines fees) projected to be due in future years (less than 1 year – $8.6 million; 1−3 years – $17.0 million; and 3-5 years – $13.7 million) based on the variable rates in effect at July 30, 2016. Variable rates, as well as outstanding principal balances, could change in future periods. See "Liquidity and Capital Resources" above and Note 7 "Notes Payable" to our Consolidated Financial Statements included in "Item 8. Financial Statements and Supplementary Data" of this Annual Report on Form 10-K for a discussion of our credit facility.
(2) Long-term debt does not include interest payments projected to be due in future years related to our capital lease obligations and real-estate backed Term Loan Agreement, which amount to approximately $28.6 million and $25.9 million, respectively (less than 1 year - $9.3 million; 1-3 years - $16.9 million; 3-5 years - $18.9 million; thereafter - $9.4 million). See Note 8 "Long-Term Debt" to our Consolidated Financial Statements included in "Item 8. Financial Statements and Supplementary Data" of this Annual Report on Form 10-K for a discussion of our long-term debt.
Included in other liabilities in the consolidated balance sheet at July 30, 2016 are uncertain tax positions including potential interest and penalties of $0.4 million that have been taken or are expected to be taken in various income tax returns. The Company does not know the ultimate resolution of these uncertain tax positions and as such, does not know the ultimate timing of payments related to this liability. Accordingly, these amounts are not included in the table above.
Seasonality
Generally, we do not experience any material seasonality. However, our sales and operating results may vary significantly from quarter to quarter due to factors such as changes in our operating expenses, management's ability to execute our operating and growth strategies, personnel changes, demand for natural products, supply shortages and general economic conditions.
Recently Issued Financial Accounting Standards
In March 2016, the Financial Accounting Standards Board (“FASB”) issued Accounting Standards Update (“ASU”) No. 2016-09, Compensation - Stock Compensation (Topic 718): Improvements to Employee Share-Based Payment Accounting, which is intended to improve the accounting for share-based payment transactions as part of the FASB's simplification initiative. This ASU will change aspects of accounting for share-based payment award transactions including accounting for income taxes, the classification of excess tax benefits and the classification of employee taxes paid when shares are withheld for tax-withholding purposes on the statement of cash flows, forfeitures, and minimum statutory tax withholding requirements. The ASU is effective
40
for public companies with interim and fiscal years beginning after December 15, 2017, which for the Company will be the first quarter of the fiscal year ending August 3, 2019. Early adoption is permitted provided that the entire ASU is adopted. The Company has not yet adopted this standard, but if the Company had adopted this standard in fiscal 2016, the result would have been a reclassification from additional paid-in capital to income tax expense. For fiscal 2016, the result would have increased current year income tax expense by $0.1 million and for fiscal 2015, the result would have decreased current year income tax expense by $2.7 million.
In February 2016, the FASB issued ASU No. 2016-2, Leases (Topic 842), which will require companies as the lessee to recognize lease assets and liabilities for leases formerly classified as operating leases. The ASU is effective for public companies with interim and annual periods in fiscal years beginning after December 15, 2018, which for the Company will be the first quarter of the fiscal year ending August 1, 2020. We are in the process of evaluating the impact that this new guidance will have on the Company's consolidated financial statements.
In January 2016, the FASB issued ASU No. 2016-1, Financial Instruments - Overall (Subtopic 825-10): Recognition and Measurement of Financial Assets and Liabilities, which will change the income statement impact of equity investments, and the recognition of changes in fair value of financial liabilities when the fair value option is elected. The ASU is effective for public companies with interim and annual periods in fiscal years beginning after December 15, 2017, which for the Company will be the first quarter of the fiscal year ending August 3, 2019. We do not expect the adoption of this guidance to have a significant impact on the Company’s consolidated financial statements.
In November 2015, the FASB issued ASU No. 2015-17, Balance Sheet Classification of Deferred Taxes, which requires entities with a classified balance sheet to present all deferred tax assets and liabilities as noncurrent. The new pronouncement is effective for public companies with annual periods, and interim periods within those periods, beginning after December 15, 2016, which for the Company will be the first quarter of the fiscal year ending July 28, 2018. Early adoption at the beginning of an interim or annual period is permitted. The Company has not yet adopted this standard, but if the Company had adopted this standard in fiscal 2016, the result would have been a reclassification from current deferred income tax assets to noncurrent deferred income tax liabilities of $35.2 million and $32.3 million as of July 30, 2016 and August 1, 2015, respectively.
In August 2015, the FASB issued ASU No. 2015-14, Revenue from Contracts with Customers, (Topic 606): Deferral of the Effective Date deferring the adoption of previously issued guidance published in May 2014, ASU No. 2014-09, Revenue from Contracts with Customers, (Topic 606). The core principle of the new guidance is that an entity will recognize revenue to depict the transfer of promised goods or services to customers in an amount that reflects the consideration to which the entity expects to be entitled in exchange for those goods or services. The new pronouncement is effective for public companies with annual periods, and interim periods within those periods, beginning after December 15, 2017, which for the Company will be the first quarter of the fiscal year ending August 3, 2019. We are in the process of evaluating the impact that this new guidance will have on the Company's consolidated financial statements.
In April 2015, the FASB issued ASU No. 2015-03, Interest - Imputation of Interest (Subtopic 835-30) ("ASU 2015-03"), which simplifies the presentation of debt issuance costs. ASU 2015-03 requires that debt issuance costs related to a recognized debt liability be presented in the balance sheet as a direct deduction from the carrying amount of that debt liability, consistent with the presentation of debt discounts. ASU 2015-03 is effective for financial statements issued for fiscal years beginning after December 15, 2015, and interim periods within those fiscal years. The Company early adopted this standard in the fourth quarter of fiscal 2016, which resulted in the reclassification of $1.6 million and $1.8 million as of July 30, 2016 and August 1, 2015, respectively, from other long-term assets to long-term debt on the Company's Consolidated Balance Sheets.
In August 2014, the FASB issued ASU No. 2014-15, Disclosure of Uncertainties about an Entity’s Ability to Continue as a Going Concern. The new guidance requires management to evaluate whether there is substantial doubt about an entity’s ability to continue as a going concern and to provide related footnote disclosures as appropriate. The new pronouncement is effective for public companies with annual periods ending after December 15, 2016, and interim periods thereafter, which for the Company will be first quarter of fiscal 2017. We do not expect the adoption of this guidance to have a significant impact on the Company’s consolidated financial statements.
ITEM 7A. QUANTITATIVE AND QUALITATIVE DISCLOSURES ABOUT MARKET RISK.
We are exposed to interest rate fluctuations on our borrowings. As more fully described in Note 9 "Fair Value Measurements" to the Consolidated Financial Statements included in "Item 8. Financial Statements and Supplementary Data" of this Annual Report on Form 10-K, we have used interest rate swap agreements to modify certain of our variable rate obligations to fixed rate obligations.
At July 30, 2016, we had long-term floating rate debt under our amended and restated revolving credit facility of $426.5 million and our real-estate backed Term Loan of $130.0 million, gross of deferred financing costs, and long-term fixed rate debt
41
of $45.1 million, representing 92.5% and 7.5%, respectively, of our long-term borrowings. At August 1, 2015, we had long-term floating rate debt under our amended and restated revolving credit facility of $363.0 million and our real-estate backed Term Loan of $140.0 million, gross of deferred financing costs, and long-term fixed rate debt of $46.4 million, representing 91.6% and 8.4%, respectively, of our long-term borrowings. Holding other debt levels constant, a 25 basis point increase in interest rates would change the unrealized fair market value of our fixed rate debt by approximately $0.7 million for each of the fiscal years ended July 30, 2016 and August 1, 2015.
42
ITEM 8. FINANCIAL STATEMENTS AND SUPPLEMENTARY DATA
The financial statements listed below are filed as part of this Annual Report on Form 10-K.
INDEX TO FINANCIAL STATEMENTS
United Natural Foods, Inc. and Subsidiaries: | Page | |
43
Report of Independent Registered Public Accounting Firm
The Board of Directors and Stockholders
United Natural Foods, Inc.:
We have audited the accompanying consolidated balance sheets of United Natural Foods, Inc. and subsidiaries (“UNFI”) as of July 30, 2016 and August 1, 2015, and the related consolidated statements of income, comprehensive income, stockholders’ equity, and cash flows for each of the years in the three-year period ended July 30, 2016. We also have audited UNFI’s internal control over financial reporting as of July 30, 2016, based on criteria established in Internal Control - Integrated Framework (2013) issued by the Committee of Sponsoring Organizations of the Treadway Commission (COSO). UNFI’s management is responsible for these consolidated financial statements, for maintaining effective internal control over financial reporting, and for its assessment of the effectiveness of internal control over financial reporting, included in the accompanying Management’s Annual Report on Internal Control Over Financial Reporting. Our responsibility is to express an opinion on these consolidated financial statements and an opinion on the Company’s internal control over financial reporting based on our audits.
We conducted our audits in accordance with the standards of the Public Company Accounting Oversight Board (United States). Those standards require that we plan and perform the audits to obtain reasonable assurance about whether the financial statements are free of material misstatement and whether effective internal control over financial reporting was maintained in all material respects. Our audits of the consolidated financial statements included examining, on a test basis, evidence supporting the amounts and disclosures in the financial statements, assessing the accounting principles used and significant estimates made by management, and evaluating the overall financial statement presentation. Our audit of internal control over financial reporting included obtaining an understanding of internal control over financial reporting, assessing the risk that a material weakness exists, and testing and evaluating the design and operating effectiveness of internal control based on the assessed risk. Our audits also included performing such other procedures as we considered necessary in the circumstances. We believe that our audits provide a reasonable basis for our opinions.
A company’s internal control over financial reporting is a process designed to provide reasonable assurance regarding the reliability of financial reporting and the preparation of financial statements for external purposes in accordance with generally accepted accounting principles. A company’s internal control over financial reporting includes those policies and procedures that (1) pertain to the maintenance of records that, in reasonable detail, accurately and fairly reflect the transactions and dispositions of the assets of the company; (2) provide reasonable assurance that transactions are recorded as necessary to permit preparation of financial statements in accordance with generally accepted accounting principles, and that receipts and expenditures of the company are being made only in accordance with authorizations of management and directors of the company; and (3) provide reasonable assurance regarding prevention or timely detection of unauthorized acquisition, use, or disposition of the company’s assets that could have a material effect on the financial statements.
Because of its inherent limitations, internal control over financial reporting may not prevent or detect misstatements. Also, projections of any evaluation of effectiveness to future periods are subject to the risk that controls may become inadequate because of changes in conditions, or that the degree of compliance with the policies or procedures may deteriorate.
In our opinion, the consolidated financial statements referred to above present fairly, in all material respects, the financial position of United Natural Foods, Inc. and subsidiaries as of July 30, 2016 and August 1, 2015, and the results of their operations and their cash flows for each of the years in the three-year period ended July 30, 2016, in conformity with U.S. generally accepted accounting principles. Also in our opinion, United Natural Foods, Inc. maintained, in all material respects, effective internal control over financial reporting as of July 30, 2016, based on criteria established in Internal Control - Integrated Framework (2013) issued by the Committee of Sponsoring Organizations of the Treadway Commission (COSO) .
On March 31, 2016 the Company acquired all of the outstanding stock of Nor-Cal Produce, Inc. ("Nor-Cal"), and management excluded from its assessment of the effectiveness of the Company’s internal control over financial reporting as of July 30, 2016, Nor-Cal’s internal control over financial reporting with associated assets of approximately $68.6 million (of which $30.0 million represents customer lists and $1.5 million represents a tradename and intangible assets included within the scope of the assessment) and total revenue of $51.4 million generated by Nor-Cal that was included in the Company’s consolidated financial statements as of and for the year ended July 30, 2016. Our audit of internal control over financial reporting of United Natural Foods, Inc. and subsidiaries also excluded an evaluation of the internal control over financial reporting of Nor-Cal.
On May 13, 2016 the Company acquired all of the outstanding stock of Haddon House Food Products, Inc. ("Haddon"), and management excluded from its assessment of the effectiveness of the Company’s internal control over financial reporting as of July 30, 2016, Haddon’s internal control over financial reporting with associated assets of approximately $219.1 million (of which $62.7 million represents customer relationships and $49.3 million represents goodwill and intangible assets included within the scope of the assessment) and total revenue of $100.4 million generated by Haddon that was included in the Company’s consolidated financial statements as of and for the year ended July 30, 2016. Our audit of internal control over financial reporting of United Natural Foods, Inc. and subsidiaries also excluded an evaluation of the internal control over financial reporting of Haddon.

Providence, Rhode Island
September 28, 2016
44
UNITED NATURAL FOODS, INC. AND SUBSIDIARIES
CONSOLIDATED BALANCE SHEETS
(In thousands, except per share data)
July 30, 2016 | August 1, 2015 | ||||||
ASSETS | |||||||
Current assets: | |||||||
Cash and cash equivalents | $ | 18,593 | $ | 17,380 | |||
Accounts receivable, net of allowance of $9,638 and $7,489, respectively | 489,708 | 474,494 | |||||
Inventories | 1,021,663 | 975,194 | |||||
Deferred income taxes | 35,228 | 32,333 | |||||
Prepaid expenses and other current assets | 45,998 | 46,976 | |||||
Total current assets | 1,611,190 | 1,546,377 | |||||
Property and equipment, net | 616,605 | 572,452 | |||||
Goodwill | 366,168 | 266,640 | |||||
Intangible assets, net of accumulated amortization of $34,315 and $25,717, respectively | 222,314 | 125,830 | |||||
Other assets | 35,878 | 29,695 | |||||
Total assets | $ | 2,852,155 | $ | 2,540,994 | |||
LIABILITIES AND STOCKHOLDERS' EQUITY | |||||||
Current liabilities: | |||||||
Accounts payable | $ | 445,430 | $ | 390,134 | |||
Accrued expenses and other current liabilities | 162,438 | 126,193 | |||||
Current portion of long-term debt | 11,854 | 11,613 | |||||
Total current liabilities | 619,722 | 527,940 | |||||
Notes payable | 426,519 | 362,993 | |||||
Deferred income taxes | 95,220 | 65,644 | |||||
Other long-term liabilities | 29,451 | 30,380 | |||||
Long-term debt, excluding current portion | 161,739 | 172,949 | |||||
Total liabilities | 1,332,651 | 1,159,906 | |||||
Commitments and contingencies (Note 10) | |||||||
Stockholders' equity: | |||||||
Preferred stock, $0.01 par value, authorized 5,000 shares; none issued or outstanding | — | — | |||||
Common stock, $0.01 par value, authorized 100,000 shares; 50,383 issued and outstanding shares at July 30, 2016; 50,096 issued and outstanding shares at August 1, 2015 | 504 | 501 | |||||
Additional paid-in capital | 436,167 | 420,584 | |||||
Accumulated other comprehensive loss | (22,379 | ) | (19,443 | ) | |||
Retained earnings | 1,105,212 | 979,446 | |||||
Total stockholders' equity | 1,519,504 | 1,381,088 | |||||
Total liabilities and stockholders' equity | $ | 2,852,155 | $ | 2,540,994 | |||
See accompanying notes to consolidated financial statements.
45
UNITED NATURAL FOODS, INC. AND SUBSIDIARIES
CONSOLIDATED STATEMENTS OF INCOME
(In thousands, except per share data)
Fiscal year ended | |||||||||||
July 30, 2016 | August 1, 2015 | August 2, 2014 | |||||||||
Net sales | $ | 8,470,286 | $ | 8,184,978 | $ | 6,794,447 | |||||
Cost of sales | 7,190,935 | 6,924,463 | 5,666,802 | ||||||||
Gross profit | 1,279,351 | 1,260,515 | 1,127,645 | ||||||||
Operating expenses | 1,049,690 | 1,017,755 | 916,857 | ||||||||
Restructuring and asset impairment expenses | 5,552 | 803 | — | ||||||||
Total operating expenses | 1,055,242 | 1,018,558 | 916,857 | ||||||||
Operating income | 224,109 | 241,957 | 210,788 | ||||||||
Other expense (income): | |||||||||||
Interest expense | 16,259 | 14,498 | 7,753 | ||||||||
Interest income | (1,115 | ) | (356 | ) | (508 | ) | |||||
Other, net | 743 | (1,954 | ) | (3,865 | ) | ||||||
Total other expense, net | 15,887 | 12,188 | 3,380 | ||||||||
Income before income taxes | 208,222 | 229,769 | 207,408 | ||||||||
Provision for income taxes | 82,456 | 91,035 | 81,926 | ||||||||
Net income | $ | 125,766 | $ | 138,734 | $ | 125,482 | |||||
Basic per share data: | |||||||||||
Net income | $ | 2.50 | $ | 2.77 | $ | 2.53 | |||||
Weighted average basic shares of common stock | 50,313 | 50,021 | 49,602 | ||||||||
Diluted per share data: | |||||||||||
Net income | $ | 2.50 | $ | 2.76 | $ | 2.52 | |||||
Weighted average diluted shares of common stock | 50,399 | 50,267 | 49,888 | ||||||||
See accompanying notes to consolidated financial statements.
46
UNITED NATURAL FOODS, INC. AND SUBSIDIARIES
CONSOLIDATED STATEMENTS OF COMPREHENSIVE INCOME
(In thousands)
Fiscal year ended | |||||||||||
July 30, 2016 | August 1, 2015 | August 2, 2014 | |||||||||
Net income | $ | 125,766 | $ | 138,734 | $ | 125,482 | |||||
Other comprehensive loss: | |||||||||||
Foreign currency translation adjustments | $ | 205 | $ | (13,852 | ) | $ | (4,060 | ) | |||
Change in fair value of swap agreements, net of tax | (3,141 | ) | (439 | ) | — | ||||||
Total other comprehensive loss | $ | (2,936 | ) | $ | (14,291 | ) | $ | (4,060 | ) | ||
Total comprehensive income | $ | 122,830 | $ | 124,443 | $ | 121,422 | |||||
See accompanying notes to consolidated financial statements.
47
UNITED NATURAL FOODS, INC. AND SUBSIDIARIES
CONSOLIDATED STATEMENTS OF STOCKHOLDERS' EQUITY
Common Stock | Treasury Stock | Additional Paid in Capital | Unallocated Shares of ESOP | Accumulated Other Comprehensive (Loss) Income | Retained Earnings | Total Stockholders' Equity | |||||||||||||||||||||||||||
(In thousands) | Shares | Amount | Shares | Amount | |||||||||||||||||||||||||||||
Balances at August 3, 2013 | 49,330 | $ | 493 | — | $ | — | $ | 380,109 | $ | (39 | ) | $ | (1,092 | ) | $ | 715,230 | $ | 1,094,701 | |||||||||||||||
Allocation of shares to ESOP | 25 | 25 | |||||||||||||||||||||||||||||||
Issuance of common stock for acquisition | 112 | 1 | 7,103 | 7,104 | |||||||||||||||||||||||||||||
Stock option exercises and restricted stock vestings, net | 329 | 4 | (1,546 | ) | (1,542 | ) | |||||||||||||||||||||||||||
Share-based compensation | 14,608 | 14,608 | |||||||||||||||||||||||||||||||
Tax benefit associated with stock plans | 2,601 | 2,601 | |||||||||||||||||||||||||||||||
Foreign currency translation | (4,060 | ) | (4,060 | ) | |||||||||||||||||||||||||||||
Net income | 125,482 | 125,482 | |||||||||||||||||||||||||||||||
Balances at August 2, 2014 | 49,771 | $ | 498 | — | $ | — | $ | 402,875 | $ | (14 | ) | $ | (5,152 | ) | $ | 840,712 | $ | 1,238,919 | |||||||||||||||
Allocation of shares to ESOP | 14 | 14 | |||||||||||||||||||||||||||||||
Stock option exercises and restricted stock vestings, net | 325 | 3 | 982 | 985 | |||||||||||||||||||||||||||||
Share-based compensation | 13,981 | 13,981 | |||||||||||||||||||||||||||||||
Tax benefit associated with stock plans | 2,746 | 2,746 | |||||||||||||||||||||||||||||||
Fair value of swap agreements, net of tax | (439 | ) | (439 | ) | |||||||||||||||||||||||||||||
Foreign currency translation | (13,852 | ) | (13,852 | ) | |||||||||||||||||||||||||||||
Net income | 138,734 | 138,734 | |||||||||||||||||||||||||||||||
Balances at August 1, 2015 | 50,096 | $ | 501 | — | $ | — | $ | 420,584 | $ | — | $ | (19,443 | ) | $ | 979,446 | $ | 1,381,088 | ||||||||||||||||
Stock option exercises and restricted stock vestings, net | 287 | 3 | — | — | 291 | 294 | |||||||||||||||||||||||||||
Share-based compensation | 15,308 | 15,308 | |||||||||||||||||||||||||||||||
Share-based compensation / restructuring costs | 67 | 67 | |||||||||||||||||||||||||||||||
Tax deficit associated with stock plans | (83 | ) | (83 | ) | |||||||||||||||||||||||||||||
Fair value of swap agreements, net of tax | (3,141 | ) | (3,141 | ) | |||||||||||||||||||||||||||||
Foreign currency translation | 205 | 205 | |||||||||||||||||||||||||||||||
Net income | 125,766 | 125,766 | |||||||||||||||||||||||||||||||
Balances at July 30, 2016 | 50,383 | $ | 504 | — | $ | — | $ | 436,167 | $ | — | $ | (22,379 | ) | $ | 1,105,212 | $ | 1,519,504 | ||||||||||||||||
See accompanying notes to consolidated financial statements.
48
UNITED NATURAL FOODS, INC. AND SUBSIDIARIES
CONSOLIDATED STATEMENTS OF CASH FLOWS
Fiscal year ended | |||||||||||
(In thousands) | July 30, 2016 | August 1, 2015 | August 2, 2014 | ||||||||
CASH FLOWS FROM OPERATING ACTIVITIES: | |||||||||||
Net income | $ | 125,766 | $ | 138,734 | $ | 125,482 | |||||
Adjustments to reconcile net income to net cash provided by operating activities: | |||||||||||
Depreciation and amortization | 71,006 | 63,800 | 48,758 | ||||||||
Deferred income tax expense | 12,480 | 15,339 | 881 | ||||||||
Share-based compensation | 15,308 | 13,981 | 14,608 | ||||||||
Excess tax deficit (benefit) from share-based payment arrangements | 83 | (2,746 | ) | (2,601 | ) | ||||||
Loss (gain) on disposals of property and equipment | 458 | (499 | ) | 647 | |||||||
Restructuring and asset impairment | 758 | 803 | — | ||||||||
Gain associated with acquisition of land | — | (2,824 | ) | (4,840 | ) | ||||||
Provision for doubtful accounts | 6,426 | 5,059 | 3,152 | ||||||||
Non-cash interest (income) expense | (106 | ) | 389 | 2,012 | |||||||
Changes in assets and liabilities, net of acquired companies: | |||||||||||
Accounts receivable | 29,417 | (42,257 | ) | (71,247 | ) | ||||||
Inventories | 2,113 | (153,701 | ) | (97,819 | ) | ||||||
Prepaid expenses and other assets | 5,381 | 4,541 | 2,024 | ||||||||
Accounts payable | 14,379 | 16,001 | 28,734 | ||||||||
Accrued expenses and other liabilities | 13,140 | (7,756 | ) | 12,627 | |||||||
Net cash provided by operating activities | 296,609 | 48,864 | 62,418 | ||||||||
CASH FLOWS FROM INVESTING ACTIVITIES: | |||||||||||
Capital expenditures | (41,375 | ) | (129,134 | ) | (147,303 | ) | |||||
Purchases of acquired businesses, net of cash acquired | (306,724 | ) | (8,036 | ) | (211,574 | ) | |||||
Long-term investment | — | (3,000 | ) | — | |||||||
Payment of company owned life insurance premiums | (2,925 | ) | (2,925 | ) | — | ||||||
Proceeds from disposals of property and equipment | 109 | 1,026 | 6,084 | ||||||||
Net cash used in investing activities | (350,915 | ) | (142,069 | ) | (352,793 | ) | |||||
CASH FLOWS FROM FINANCING ACTIVITIES: | |||||||||||
Proceeds from borrowings under revolving credit line | 709,972 | 728,316 | 853,884 | ||||||||
Repayments of borrowings under revolving credit line | (646,481 | ) | (779,461 | ) | (568,338 | ) | |||||
Proceeds from borrowings of long-term debt | — | 150,000 | — | ||||||||
Repayments of long-term debt | (11,255 | ) | (11,197 | ) | (1,226 | ) | |||||
Increase in bank overdraft | 6,063 | 5,003 | 11,501 | ||||||||
Proceeds from exercise of stock options | 2,011 | 3,415 | 2,215 | ||||||||
Payment of employee restricted stock tax withholdings | (1,717 | ) | (2,430 | ) | (3,757 | ) | |||||
Excess tax (deficit) benefit from share-based payment arrangements | (83 | ) | 2,746 | 2,601 | |||||||
Capitalized debt issuance costs | (2,164 | ) | (1,965 | ) | (1,523 | ) | |||||
Net cash provided by financing activities | 56,346 | 94,427 | 295,357 | ||||||||
Effect of exchange rate changes on cash and cash equivalents | (827 | ) | 42 | 23 | |||||||
NET INCREASE IN CASH AND CASH EQUIVALENTS | 1,213 | 1,264 | 5,005 | ||||||||
Cash and cash equivalents at beginning of period | 17,380 | 16,116 | 11,111 | ||||||||
Cash and cash equivalents at end of period | $ | 18,593 | $ | 17,380 | $ | 16,116 | |||||
Supplemental disclosures of cash flow information: | |||||||||||
Non-cash financing activity | $ | — | $ | 14,088 | $ | — | |||||
Non-cash investing activity | $ | — | $ | 14,088 | $ | 7,104 | |||||
Cash paid for interest | $ | 16,696 | $ | 14,632 | $ | 6,599 | |||||
Cash paid for federal and state income taxes, net of refunds | $ | 67,028 | $ | 72,357 | $ | 77,091 | |||||
See accompanying notes to consolidated financial statements.
49
UNITED NATURAL FOODS, INC.
NOTES TO CONSOLIDATED FINANCIAL STATEMENTS
1. | SIGNIFICANT ACCOUNTING POLICIES |
(a) | Nature of Business |
United Natural Foods, Inc. and its subsidiaries (the "Company") is a leading distributor and retailer of natural, organic and specialty products. The Company sells its products primarily throughout the United States and Canada.
(b) | Basis of Presentation |
The accompanying consolidated financial statements include the accounts of the Company and its wholly-owned subsidiaries. All significant intercompany transactions and balances have been eliminated in consolidation. Certain prior year amounts have been reclassified to conform to the current year's presentation.
The fiscal year of the Company ends on the Saturday closest to July 31. Fiscal 2016, 2015 and 2014 ended on July 30, 2016, August 1, 2015 and August 2, 2014, respectively. Fiscal 2016, 2015 and 2014 contained 52 weeks. Each of the Company's interim quarters consisted of 13 weeks.
Net sales consist primarily of sales of natural, organic and specialty products to retailers, adjusted for customer volume discounts, returns and allowances. Net sales also include amounts charged by the Company to customers for shipping and handling, and fuel surcharges. The principal components of cost of sales include the amounts paid to manufacturers and growers for product sold, plus the cost of transportation necessary to bring the product to the Company's distribution centers, offset by consideration received from suppliers in connection with the purchase of the suppliers' products. Cost of sales also includes amounts incurred by the Company's manufacturing subsidiary, Woodstock Farms Manufacturing, for inbound transportation costs and depreciation for manufacturing equipment, offset by consideration received from suppliers in connection with the purchase or promotion of the suppliers' products. Operating expenses include salaries and wages, employee benefits, warehousing and delivery, selling, occupancy, insurance, administrative, share-based compensation and amortization expense. Operating expenses also include depreciation expense related to the wholesale and retail divisions. Other expense (income) includes interest on outstanding indebtedness, interest income and miscellaneous income and expenses. Certain items in the consolidated balance sheet as of August 1, 2015 have been reclassified as a result of an immaterial correction explained in Note 15, "Immaterial Correction of Prior Period Financial Statements." These revisions were not material to the Company's consolidated financial statements as a whole.
(c) | Cash Equivalents |
Cash equivalents consist of highly liquid investments with original maturities of three months or less.
(d) | Inventories and Cost of Sales |
Inventories consist primarily of finished goods and are stated at the lower of cost or market, with cost being determined using the first-in, first-out (FIFO) method. Allowances received from suppliers are recorded as reductions in cost of sales upon the sale of the related products.
(e) | Property and Equipment |
Property and equipment are stated at cost less accumulated depreciation and amortization. Equipment under capital leases is stated at the lower of the present value of minimum lease payments at the inception of the lease or the fair value of the asset. Property and equipment includes the non-cash expenditures made by the landlord for the Aurora, Colorado distribution center in addition to office space utilized as the Company's Corporate headquarters in Providence, Rhode Island as the lease qualifies for capital lease treatment pursuant to Financial Accounting Standards Board Accounting Standards Codification 840, Leases. Property and equipment also includes accumulated depreciation with respect to these items. Refer to Note 8, Long-Term Debt, for additional information.
Applicable interest charges incurred during the construction of new facilities may be capitalized as one of the elements of cost and are amortized over the assets' estimated useful lives. The Company capitalized $0.4 million of interest during the fiscal year ended July 30, 2016 related to the construction of a new distribution center in Gilroy, California which began operations in February 2016. The Company capitalized $0.5 million of interest during the fiscal year ended August 1, 2015 related to the construction of new distribution centers in Prescott, Wisconsin and Gilroy, California. The Company capitalized $0.9 million of interest during the fiscal year ended August 2, 2014 related to the construction of new distribution centers in Racine, Wisconsin and Hudson Valley, New York.
50
Property and equipment consisted of the following at July 30, 2016 and August 1, 2015:
Original Estimated Useful Lives (Years) | 2016 | 2015 | |||||||
(In thousands, except years) | |||||||||
Land | $ | 52,641 | $ | 43,033 | |||||
Buildings and improvements | 20-40 | 403,822 | 302,066 | ||||||
Leasehold improvements | 5-20 | 136,758 | 133,120 | ||||||
Warehouse equipment | 3-30 | 163,494 | 155,477 | ||||||
Office equipment | 3-10 | 55,915 | 57,519 | ||||||
Computer software | 3-7 | 146,766 | 130,652 | ||||||
Motor vehicles | 3-7 | 4,597 | 4,357 | ||||||
Construction in progress | 15,018 | 63,557 | |||||||
979,011 | 889,781 | ||||||||
Less accumulated depreciation and amortization | 362,406 | 317,329 | |||||||
Net property and equipment | $ | 616,605 | $ | 572,452 | |||||
Depreciation expense amounted to $61.1 million, $55.0 million and $42.9 million for the fiscal years ended July 30, 2016, August 1, 2015 and August 2, 2014, respectively.
(f) | Income Taxes |
The Company accounts for income taxes under the asset and liability method. Under the asset and liability method, deferred tax assets and liabilities are recognized for the future tax consequences attributable to differences between the financial statement carrying amounts of existing assets and liabilities and their respective tax bases. Deferred tax assets and liabilities are measured using enacted tax rates expected to apply to taxable income in the years in which those temporary differences are expected to be recovered or settled. The effect on deferred tax assets and liabilities of a change in tax rates is recognized in income in the period that includes the enactment date.
The calculation of the Company's tax liabilities includes addressing uncertainties in the application of complex tax regulations and is based on the financial statement recognition and measurement of a tax position taken or expected to be taken in a tax return,
(g) | Long-Lived Assets |
Management reviews long-lived assets, including definite-lived intangible assets, for indicators of impairment whenever events or changes in circumstances indicate that the carrying value of the assets may not be recoverable. Cash flows expected to be generated by the related assets are estimated over the assets' useful lives based on updated projections. If the evaluation indicates that the carrying amount of an asset may not be recoverable, the potential impairment is measured based on a fair value discounted cash flow model.
(h) | Goodwill and Intangible Assets |
Goodwill represents the excess of cost over the fair value of net assets acquired in a business combination. Goodwill and other intangible assets with indefinite lives are not amortized. Intangible assets with definite lives are amortized on a straight-line basis over the following lives:
Customer relationships | 7-20 years | |
Non-competition agreements | 1-10 years | |
Trademarks and tradenames | 4-10 years | |
Goodwill is assigned to the reporting units that are expected to benefit from the synergies of the business combination. The Company is required to test goodwill for impairment at least annually, and between annual tests if events occur or circumstances change that would more likely than not reduce the fair value of a reporting unit below its carrying amount. The Company has elected to perform its annual tests for indications of goodwill impairment as of the first day of the fourth quarter of each fiscal year.
51
The Company's reporting units are at or one level below the operating segment level. Approximately 95.1% of the Company's goodwill is within its wholesale reporting unit as of July 30, 2016. In accordance with Accounting Standards Update ("ASU") No. 2011-08, Intangibles- Goodwill and Other (Topic 350): Testing Goodwill for Impairment ("ASU 2011-08"), the Company is allowed to perform a qualitative assessment for goodwill impairment unless it believes it is more likely than not that a reporting unit's fair value is less than the carrying value. The thresholds used by the Company for this determination in fiscal 2016 were for any reporting units that (1) have passed their previous two-step test with a margin of calculated fair value versus carrying value of at least 20%, (2) have had a two-step test within the past five years, (3) have had no significant changes to their working capital structure, (4) have current year income which is at least 85% of prior year amounts, and (5) present no other factors to be considered as outlined in ASU 2011-08. Based on the qualitative assessment performed for fiscal 2016, three of the Company's four reporting units met these thresholds. As these reporting units have passed their previous two-step tests within the past 5 years, the reporting units' net income has not decreased more than 15% and their working capital requirements have not increased significantly, no quantitative testing was performed on these reporting units as part of the annual test in fiscal 2016.
For the reporting unit that did not meet the thresholds above for fiscal 2016, the Company performed a two-step goodwill impairment analysis. The first step to identify potential impairment involves comparing the reporting unit's estimated fair value to its carrying value, including goodwill. The reporting unit regularly prepares discrete operating forecasts and uses these forecasts as the basis for the assumptions used in the discounted cash flow analysis which is the basis for the fair value analysis. If the estimated fair value of the reporting unit exceeds its carrying value, goodwill is considered not to be impaired and no further testing is required. This was the case for the reporting unit that required a quantitative test for the annual assessment in fiscal 2016. Had the carrying value exceeded estimated fair value for this unit, there would have been an indication of potential impairment and the second step would have been performed to measure the amount of impairment. If required, the second step involves calculating an implied fair value of goodwill for each reporting unit for which the first step indicated potential impairment. The implied fair value of goodwill is determined in a manner similar to the amount of goodwill calculated in a business combination, by measuring the excess of the estimated fair value of the reporting unit, as determined in the first step, over the aggregate estimated fair values of the individual assets, liabilities and identifiable intangible assets. If the implied fair value of goodwill exceeds the carrying value of goodwill assigned to the reporting unit, there is no impairment. If the carrying value of goodwill assigned to a reporting unit exceeds the implied fair value of the goodwill, an impairment charge is recorded for the excess.
Intangible assets with indefinite lives are tested for impairment at least annually as of the first day of the fourth fiscal quarter and if events occur or circumstances change that would indicate that the value of the asset may be impaired. Impairment is measured as the difference between the fair value of the asset and its carrying value.
In accordance with ASU No. 2012-02, Intangibles- Goodwill and Other (Topic 350): Testing Indefinite Lived Intangible Assets for Impairment, the Company is allowed to perform a qualitative assessment for intangible asset impairment unless it believes it is more likely than not that an intangible asset's fair value is less than the carrying value. The thresholds used by the Company for this determination in the fourth quarter of fiscal 2016 were for any intangible assets (or groups of assets) that (1) have passed their previous two-step test with a margin of calculated fair value versus carrying value of at least 20%, (2) have had performed a two-step test within the past five years, and (3) have current year income which is at least 85% of prior year amounts. The Company's only indefinite lived intangible assets are the branded product line asset group. During fiscal 2016, the Company's annual qualitative assessment of its indefinite lived intangible assets indicated that no impairment existed.
During fiscal 2015, the Company ceased operations at its Canadian facility located in Scotstown, Quebec which was acquired in 2010. In connection with this closure, the Company recognized an impairment of $0.6 million during the first quarter of fiscal 2015 representing the remaining unamortized value of an intangible asset.
The changes in the carrying amount of goodwill and the amount allocated by reportable segment for the years presented are as follows (in thousands):
Wholesale | Other | Total | |||||||||
Goodwill as of August 2, 2014 | $ | 256,817 | $ | 17,731 | $ | 274,548 | |||||
Goodwill adjustment for prior year business combinations | (3,487 | ) | — | (3,487 | ) | ||||||
Change in foreign exchange rates | (4,421 | ) | — | (4,421 | ) | ||||||
Goodwill as of August 2, 2015 | $ | 248,909 | $ | 17,731 | $ | 266,640 | |||||
Goodwill from current year business combinations | 99,142 | 294 | 99,436 | ||||||||
Change in foreign exchange rates | 92 | — | 92 | ||||||||
Goodwill as of July 30, 2016 | $ | 348,143 | $ | 18,025 | $ | 366,168 | |||||
52
The following table presents the detail of the Company's other intangible assets (in thousands):
July 30, 2016 | August 1, 2015 | ||||||||||||||||||||||
Gross Carrying Amount | Accumulated Amortization | Net | Gross Carrying Amount | Accumulated Amortization | Net | ||||||||||||||||||
Amortizing intangible assets: | |||||||||||||||||||||||
Customer relationships | $ | 196,313 | $ | 33,447 | $ | 162,866 | $ | 96,192 | $ | 25,364 | $ | 70,828 | |||||||||||
Non-compete agreements | 2,900 | 753 | 2,147 | 1,700 | 353 | 1,347 | |||||||||||||||||
Trademarks and tradenames | 1,700 | 115 | 1,585 | — | — | — | |||||||||||||||||
Total amortizing intangible assets | 200,913 | 34,315 | 166,598 | 97,892 | 25,717 | 72,175 | |||||||||||||||||
Indefinite lived intangible assets: | |||||||||||||||||||||||
Trademarks and tradenames | 55,716 | — | 55,716 | 53,655 | — | 53,655 | |||||||||||||||||
Total | $ | 256,629 | $ | 34,315 | $ | 222,314 | $ | 151,547 | $ | 25,717 | $ | 125,830 | |||||||||||
Amortization expense was $8.9 million, $7.8 million and $5.1 million for the fiscal years ended July 30, 2016, August 1, 2015 and August 2, 2014, respectively. The estimated future amortization expense for each of the next five fiscal years and thereafter on definite lived intangible assets existing as of July 30, 2016 is shown below:
Fiscal Year: | (In thousands) | ||
2017 | $ | 15,099 | |
2018 | 14,720 | ||
2019 | 14,704 | ||
2020 | 14,047 | ||
2021 | 13,130 | ||
2022 and thereafter | 94,898 | ||
$ | 166,598 | ||
(i) | Revenue Recognition and Concentration of Credit Risk |
The Company records revenue upon delivery of products. Revenues are recorded net of applicable sales discounts and estimated sales returns. Sales incentives provided to customers are accounted for as reductions in revenue as the related revenue is recorded. The Company's sales are primarily to customers located throughout the United States and Canada.
Whole Foods Market, Inc. was the Company's largest customer in each fiscal year presented. Whole Foods Market, Inc. accounted for approximately 35% and 34% of the Company's net sales for the fiscal years ended July 30, 2016 and August 1, 2015, respectively, and 36% of the Company's net sales for the fiscal year ended August 2, 2014. There were no other customers that individually generated 10% or more of the Company's net sales during those periods.
The Company analyzes customer creditworthiness, accounts receivable balances, payment history, payment terms and historical bad debt levels when evaluating the adequacy of its allowance for doubtful accounts. In instances where a reserve has been recorded for a particular customer, future sales to the customer are conducted using either cash-on-delivery terms, or the account is closely monitored so that as agreed upon payments are received, orders are released; a failure to pay results in held or canceled orders.
(j) | Fair Value of Financial Instruments |
The carrying amounts of the Company's financial instruments including cash and cash equivalents, accounts receivable, accounts payable and certain accrued expenses approximate fair value due to the short-term nature of these instruments.
The following estimated fair value amounts have been determined by the Company using available market information and appropriate valuation methodologies. Refer to Note 9, Fair Value Measurements, for additional information regarding the fair value hierarchy. The fair value of notes payable and long-term debt are based on the instruments' interest rate, terms, maturity date and collateral, if any, in comparison to the Company's incremental borrowing rate for similar financial instruments. However, considerable judgment is required in interpreting market data to develop the estimates of fair value. Accordingly, the estimates presented herein are not necessarily indicative of the amounts that the Company could realize in a current market exchange.
53
July 30, 2016 | August 1, 2015 | ||||||||||||||
Carrying Value | Fair Value | Carrying Value | Fair Value | ||||||||||||
(In thousands) | |||||||||||||||
Assets: | |||||||||||||||
Cash and cash equivalents | $ | 18,593 | $ | 18,593 | $ | 17,380 | $ | 17,380 | |||||||
Accounts receivable | 489,708 | 489,708 | 474,494 | 474,494 | |||||||||||
Notes receivable | 3,709 | 3,709 | 7,361 | 7,361 | |||||||||||
Liabilities: | |||||||||||||||
Accounts payable | 445,430 | 445,430 | 390,134 | 390,134 | |||||||||||
Notes payable | 426,519 | 426,519 | 362,993 | 362,993 | |||||||||||
Long-term debt, including current portion | 173,593 | 182,790 | 184,562 | 192,679 | |||||||||||
(k) | Use of Estimates |
The preparation of consolidated financial statements in conformity with accounting principles generally accepted in the United States of America requires management to make estimates and assumptions that affect amounts reported therein. Due to the inherent uncertainty involved in making estimates, actual results reported in future periods may be based on amounts that differ from those estimates.
(l) | Notes Receivable, Trade |
The Company issues trade notes receivable to certain customers under two basic circumstances; inventory purchases for initial store openings and overdue accounts receivable. Notes issued in connection with store openings are generally receivable over a period not to exceed thirty-six months. Notes issued in connection with overdue accounts receivable may extend for periods greater than one year. All notes are issued at a market interest rate and contain certain guarantees and collateral assignments in favor of the Company.
(m) | Share-Based Compensation |
The Company accounts for its share-based compensation in accordance with FASB ASC 718, Stock Compensation ("ASC 718"). ASC 718 requires the recognition of the fair value of share-based compensation in net income. The Company has four share-based employee compensation plans, which are described more fully in Note 3. Share-based compensation consists of stock options, restricted stock awards, restricted stock units, performance shares and performance units. Stock options are granted to employees and directors at exercise prices equal to the fair market value of the Company's stock at the dates of grant. Generally, stock options, restricted stock awards and restricted stock units granted to employees vest ratably over 4 years from the grant date and grants to members of the Company's Board of Directors vest ratably over 6 months with one half vesting immediately. The Company's President and Chief Executive Officer and its other executive officers or members of senior management have been granted performance units which have vested, when and if earned, in accordance with the terms of the related performance unit award agreements. During fiscal 2016, fiscal 2015 and fiscal 2014, the Company granted performance-based stock units to its executive officers that will vest if the Company achieves certain performance metrics as of and for the years ended July 29, 2017, July 30, 2016 and August 1, 2015, respectively. The Company recognizes share-based compensation expense on a straight-line basis over the requisite service period of the individual grants, which generally equals the vesting period.
ASC 718 also requires that compensation expense be recognized for only the portion of share-based awards that are expected to vest. Therefore, we apply estimated forfeiture rates that are derived from historical employee and director termination activity to reduce the amount of compensation expense recognized. If the actual forfeitures differ from the estimate, additional adjustments to compensation expense may be required in future periods.
The Company receives an income tax deduction for restricted stock awards and restricted stock units when they vest and for non-qualified stock options exercised by employees equal to the excess of the fair market value of its common stock on the vesting or exercise date over the exercised price. Excess tax benefits (tax benefits resulting from tax deductions in excess of compensation cost recognized) and tax deficit (tax deficit resulting from compensation cost recognized in excess of tax deductions) are presented as a cash inflow or outflow provided by financing activities in the accompanying consolidated statement of cash flows.
54
(n) | Earnings Per Share |
Basic earnings per share is calculated by dividing net income by the weighted average number of common shares outstanding during the period. Diluted earnings per share is calculated by adding the dilutive potential common shares to the weighted average number of common shares that were outstanding during the period. For purposes of the diluted earnings per share calculation, outstanding stock options, restricted stock awards, restricted stock units and performance-based awards, if applicable, are considered common stock equivalents, using the treasury stock method. A reconciliation of the weighted average number of shares outstanding used in the computation of the basic and diluted earnings per share for all periods presented follows:
Fiscal year ended | ||||||||
July 30, 2016 | August 1, 2015 | August 2, 2014 | ||||||
(In thousands) | ||||||||
Basic weighted average shares outstanding | 50,313 | 50,021 | 49,602 | |||||
Net effect of dilutive common stock equivalents based upon the treasury stock method | 86 | 246 | 286 | |||||
Diluted weighted average shares outstanding | 50,399 | 50,267 | 49,888 | |||||
Potential anti-dilutive share-based payment awards excluded from the computation above | 84 | 7 | 6 | |||||
(o) | Comprehensive Income (Loss) |
Comprehensive income (loss) is reported in accordance with ASU No. 2013-02, and includes net income and the change in other comprehensive income (loss). Other comprehensive income (loss) is comprised of the net change in fair value of derivative instruments designated as cash flow hedges, as well as foreign currency translation related to the translation of UNFI Canada, Inc. ("UNFI Canada") from the functional currency of Canadian dollars to U.S. dollar reporting currency. For all periods presented, the Company displays comprehensive income (loss) and its components in the consolidated statements of comprehensive income.
(p) | Derivative Financial Instruments |
The Company is exposed to market risks arising from changes in interest rates, fuel costs, and with the operation of UNFI Canada, foreign currency exchange rates. The Company uses derivatives principally in the management of interest rate and fuel price exposure. From time to time the Company may use contracts to hedge transactions in foreign currency. The Company does not utilize derivatives that contain leverage features. For derivative transactions accounted for as hedges, on the date the Company enters into the derivative transaction, the exposure is identified. The Company formally documents all relationships between hedging instruments and hedged items, as well as its risk-management objective and strategy for undertaking the hedge transaction. In this documentation, the Company specifically identifies the asset, liability, firm commitment, forecasted transaction, or net investment that has been designated as the hedged item and states how the hedging instrument is expected to reduce the risks related to the hedged item. The Company measures effectiveness of its hedging relationships both at hedge inception and on an ongoing basis as needed.
(q) | Shipping and Handling Fees and Costs |
The Company includes shipping and handling fees billed to customers in net sales. Shipping and handling costs associated with inbound freight are generally recorded in cost of sales, whereas shipping and handling costs for selecting, quality assurance, and outbound transportation are recorded in operating expenses. Outbound shipping and handling costs totaled $467.5 million, $452.9 million and $397.7 million for the fiscal years ended July 30, 2016, August 1, 2015 and August 2, 2014, respectively.
(r) | Reserves for Self-Insurance |
The Company is primarily self-insured for workers' compensation and general and automobile liability insurance. It is the Company's policy to record the self-insured portion of workers' compensation and automobile liabilities based upon actuarial methods to estimate the future cost of claims and related expenses that have been reported but not settled, and that have been incurred but not yet reported. Any projection of losses concerning workers' compensation and automobile liability is subject to a considerable degree of variability. Among the causes of this variability are unpredictable external factors affecting litigation trends, benefit level changes and claim settlement patterns.
55
(s) | Operating Lease Expenses |
The Company records lease expense via the straight-line method. For leases with step rent provisions whereby the rental payments increase over the life of the lease, and for leases where the Company receives rent-free periods, the Company recognizes expense based on a straight-line basis based on the total minimum lease payments to be made over the expected lease term.
(t) | Recently Issued Accounting Pronouncements |
In March 2016, the FASB issued ASU No. 2016-09, Compensation - Stock Compensation (Topic 718): Improvements to Employee Share-Based Payment Accounting, which is intended to improve the accounting for share-based payment transactions as part of the FASB's simplification initiative. This ASU will change aspects of accounting for share-based payment award transactions including accounting for income taxes, the classification of excess tax benefits and the classification of employee taxes paid when shares are withheld for tax-withholding purposes on the statement of cash flows, forfeitures, and minimum statutory tax withholding requirements. The ASU is effective for public companies with interim and fiscal years beginning after December 15, 2017, which for the Company will be the first quarter of the fiscal year ending August 3, 2019. Early adoption is permitted provided that the entire ASU is adopted. The Company has not yet adopted this standard, but if the Company had adopted this standard in fiscal 2016, the result would have been a reclassification from additional paid-in capital to income tax expense. For fiscal 2016, the result would have increased current year income tax expense by $0.1 million and for fiscal 2015, the result would have decreased current year income tax expense by $2.7 million.
In February 2016, the FASB issued ASU No. 2016-2, Leases (Topic 842), which will require companies as the lessee to recognize lease assets and liabilities for leases formerly classified as operating leases. The ASU is effective for public companies with interim and annual periods in fiscal years beginning after December 15, 2018, which for the Company will be the first quarter of the fiscal year ending August 1, 2020. We are in the process of evaluating the impact that this new guidance will have on the Company's consolidated financial statements.
In January 2016, the FASB issued ASU No. 2016-1, Financial Instruments - Overall (Subtopic 825-10): Recognition and Measurement of Financial Assets and Liabilities, which will change the income statement impact of equity investments, and the recognition of changes in fair value of financial liabilities when the fair value option is elected. The ASU is effective for public companies with interim and annual periods in fiscal years beginning after December 15, 2017, which for the Company will be the first quarter of the fiscal year ending August 3, 2019. We do not expect the adoption of this guidance to have a significant impact on the Company’s consolidated financial statements.
In November 2015, the FASB issued ASU No. 2015-17, Balance Sheet Classification of Deferred Taxes, which requires entities with a classified balance sheet to present all deferred tax assets and liabilities as noncurrent. The new pronouncement is effective for public companies with annual periods, and interim periods within those periods, beginning after December 15, 2016, which for the Company will be the first quarter of the fiscal year ending July 28, 2018. Early adoption at the beginning of an interim or annual period is permitted. The Company has not yet adopted this standard, but if the Company had adopted this standard in fiscal 2016, the result would have been a reclassification from current deferred income tax assets to noncurrent deferred income tax liabilities of $35.2 million and $32.3 million as of July 30, 2016 and August 1, 2015, respectively.
In August 2015, the FASB issued ASU No. 2015-14, Revenue from Contracts with Customers, (Topic 606): Deferral of the Effective Date deferring the adoption of previously issued guidance published in May 2014, ASU No. 2014-09, Revenue from Contracts with Customers, (Topic 606). The core principle of the new guidance is that an entity will recognize revenue to depict the transfer of promised goods or services to customers in an amount that reflects the consideration to which the entity expects to be entitled in exchange for those goods or services. The new pronouncement is effective for public companies with annual periods, and interim periods within those periods, beginning after December 15, 2017, which for the Company will be the first quarter of the fiscal year ending August 3, 2019. We are in the process of evaluating the impact that this new guidance will have on the Company's consolidated financial statements.
In April 2015, the FASB issued ASU No. 2015-03, Interest - Imputation of Interest (Subtopic 835-30) ("ASU 2015-03"), which simplifies the presentation of debt issuance costs. ASU 2015-03 requires that debt issuance costs related to a recognized debt liability be presented in the balance sheet as a direct deduction from the carrying amount of that debt liability, consistent with the presentation of debt discounts. ASU 2015-03 is effective for financial statements issued for fiscal years beginning after December 15, 2015, and interim periods within those fiscal years. The Company early adopted this standard in the fourth quarter of fiscal 2016, which resulted in the reclassification of $1.6 million and $1.8 million as of July 30, 2016 and August 1, 2015, respectively, from other long-term assets to long-term debt on the Company's Consolidated Balance Sheets.
56
(u) | Correction of Prior Period Errors |
During the three months ended January 31, 2015, the Company recorded a cumulative adjustment to net sales for $7.7 million related to amounts owed to a customer resulting from an incorrect calculation of contractual obligations to that customer from fiscal year 2009 through fiscal year 2014. The aggregate amount of the reduction in net sales related to this incorrect calculation in fiscal 2015 was $9.3 million, including a $1.6 million reduction in the first quarter of fiscal 2015. The Company reviewed the impact of these corrections in accordance with Securities and Exchange Commission ("SEC") Staff Accounting Bulletin No. 99 "Materiality," and determined that these corrections were not material to prior periods or the periods in which the amounts were recorded.
During the fourth quarter of fiscal 2016, the Company revised previously reported amounts for identified errors in accounting for early payment discounts on inventory purchases. Management considered both the quantitative and qualitative factors within the provisions of SEC Staff Accounting Bulletin No. 99, "Materiality", and Staff Accounting Bulletin No. 108, Considering the Effects of Prior Year Misstatements when Quantifying Misstatements in Current Year Financial Statements. Based on evaluation of the errors, management has concluded that the prior period errors were immaterial to the previously issued consolidated financial statements. Refer to Note 15, "Immaterial Correction of Prior Period Financial Statements" for further detail.
2. | ACQUISITIONS |
Wholesale Segment
Global Organic/Specialty Source, Inc. On March 7, 2016, the Company acquired certain assets of Global Organic/Specialty Source Inc. and related affiliates (collectively "Global Organic") through its wholly owned subsidiary Albert's Organics, Inc. ("Albert's"). Global Organic is a premier distributor of organic fruits, vegetables, juices, milk, eggs, nuts, and coffee located in Sarasota, Florida serving customer locations across the Southeastern United States. Total cash consideration related to this acquisition was approximately $20.6 million, subject to certain customary post-closing adjustments. The fair value of identifiable intangible assets acquired was determined by using an income approach. During the three months ended July 30, 2016, the Company recorded an adjustment to certain provisional amounts recorded as of April 30, 2016. The adjustment included a decrease to the customer list intangible asset by $1.0 million based on updated valuation information with a corresponding increase to goodwill. The identifiable intangible asset recorded based on a provisional valuation consisted of customer lists of $7.4 million, which are being amortized on a straight-line basis over an estimated useful life of approximately ten years. Global Organic's operations have been combined with the existing Albert's business; therefore, the Company does not record the expenses separately from the rest of the wholesale distribution business and results are not separable.
Nor-Cal Produce, Inc. On March 31, 2016 the Company acquired all of the outstanding stock of Nor-Cal Produce, Inc. ("Nor-Cal") and an affiliated entity as well as certain real estate. Founded in 1972, Nor-Cal is a family owned and operated distributor of conventional and organic produce and other fresh products in Northern California, with primary operations located in West Sacramento, California. Total cash consideration related to this acquisition was approximately $68.6 million, subject to certain customary post-closing adjustments. The identifiable intangible assets recorded based on provisional valuations include customer lists of $30.3 million, a tradename with an estimated fair value of $1.0 million, and a non-compete with an estimated fair value of $0.5 million, which are being amortized on a straight-line basis over estimated useful lives of approximately 13 and five years, respectively. The preliminary fair value of the identifiable intangible assets acquired was determined by using an income approach. Significant assumptions utilized in the income approach were based on company-specific information and projections, which are not observable in the market and are thus considered Level 3 measurements as defined by authoritative guidance. The goodwill of $40.3 million represents the future economic benefits expected to arise that could not be individually identified and separately recognized. Net sales attributed to Nor-Cal from the date of acquisition through the fiscal year ended July 30, 2016 were $51.4 million.
57
The following table summarizes the preliminary fair values of assets and liabilities for the Nor-Cal acquisition and the amounts of assets acquired and liabilities assumed as of the acquisition date, including adjustments made through July 30, 2016:
(in thousands) | Preliminary as of April 30, 2016 | Adjustments in Current Fiscal Year | Preliminary as of July 30, 2016 | ||||||||
Accounts receivable | $ | 8,483 | $ | — | $ | 8,483 | |||||
Inventories | 1,902 | — | 1,902 | ||||||||
Property and equipment | 10,743 | (714 | ) | 10,029 | |||||||
Other assets | 1,097 | (972 | ) | 125 | |||||||
Customer relationships | 30,000 | 300 | 30,300 | ||||||||
Tradename | 1,000 | — | 1,000 | ||||||||
Non-compete | 500 | — | 500 | ||||||||
Goodwill | 39,458 | 884 | 40,342 | ||||||||
Total assets | $ | 93,183 | $ | (502 | ) | $ | 92,681 | ||||
Liabilities | 24,603 | (502 | ) | 24,101 | |||||||
Total purchase price | $ | 68,580 | $ | — | $ | 68,580 | |||||
Haddon House Food Products, Inc. On May 13, 2016 the Company acquired all of the outstanding stock of Haddon House Food Products, Inc. (“Haddon”) and certain affiliated entities and real estate. Founded in 1960 by the Anderson family, Haddon is a well-respected distributor and merchandiser of natural and organic and gourmet ethnic products throughout the Eastern United States. Haddon has a diverse, multi-channel customer base including conventional supermarkets, gourmet food stores and independently owned product retailers. Total consideration related to this acquisition was approximately $219.1 million, $217.5 million of which was paid in cash and $1.6 million of which was included in accounts payable as of July 30, 2016. The purchase price is subject to certain customary post-closing adjustments. The identifiable intangible assets recorded based on provisional valuations include customer relationships with an estimated fair value of $62.7 million, the Haddon tradename with an estimated fair value of $0.7 million, non-compete agreements with an estimated fair value of $0.7 million, and a trademark asset related to Haddon owned branded product lines with an estimated fair value of $2.0 million. The customer relationship intangible asset is currently being amortized on a straight-line basis over an estimated useful life of approximately 13 years, the Haddon tradename is being amortized over an estimated useful life of approximately 3 years, the non-compete agreements that the Company received from the owners of Haddon are being amortized over the 5-year term of the agreements, and the Haddon trademark asset associated with its branded product lines is estimated to have an indefinite useful life. The preliminary fair value of the identifiable intangible assets acquired was determined by using an income approach. Significant assumptions utilized in the income approach were based on company-specific information and projections, which are not observable in the market and are thus considered Level 3 measurements as defined by authoritative guidance. The goodwill of $45.9 million represents the future economic benefits expected to arise that could not be individually identified and separately recognized.
Net sales of Haddon from the date of acquisition through the fiscal year ended July 30, 2016 were $100.4 million.
58
The following table summarizes the preliminary fair values of assets and liabilities for the Haddon acquisition and the amounts of assets acquired and liabilities assumed as of the acquisition date:
(in thousands) | Preliminary as of July 30, 2016 | ||
Accounts receivable | $ | 40,434 | |
Other receivable | 3,621 | ||
Inventories | 46,138 | ||
Prepaid expenses and other current assets | 1,645 | ||
Property and equipment | 54,501 | ||
Other assets | 280 | ||
Customer relationships | 62,700 | ||
Tradename | 700 | ||
Non-compete | 700 | ||
Other intangible assets | 2,000 | ||
Goodwill | 45,851 | ||
Total assets | $ | 258,570 | |
Liabilities | 39,510 | ||
Total purchase price | $ | 219,060 | |
Cash paid for Nor-Cal, Global Organic and Haddon was financed through borrowings under the Company’s amended and restated revolving credit facility. Acquisition costs related to the current year acquisitions of Global Organic, Nor-Cal and Haddon were approximately $2.1 million for the year ended July 30, 2016 and have been expensed as incurred within "operating expenses" in the Consolidated Statements of Income. The results of the acquired businesses' operations have been included in the consolidated financial statements since the applicable date of acquisitions.
Tony's Fine Foods. During the fourth quarter of fiscal 2015, the Company finalized its purchase accounting related to the Company's acquisition of all of the outstanding capital stock of Tony's Fine Foods (“Tony’s”) in the fourth quarter of fiscal 2014. Of the total purchase price of approximately $202.7 million, approximately $196.5 million was paid in cash. The remaining portion of the purchase price for Tony's was paid with approximately 112,000 shares of the Company’s common stock.
The fair value of identifiable intangible assets acquired was determined primarily by using an income approach. Identifiable intangible assets include customer relationships with an estimated fair value as of the acquisition date of $54.8 million, the Tony's tradename with an estimated fair value as of the acquisition date of approximately $25.2 million, and non-competition agreements with an estimated fair value as of the acquisition date of $1.7 million. The customer relationship intangible asset is currently being amortized on a straight-line basis over an estimated useful life of approximately 20 years, the non-competition agreements that the Company received from the owners of Tony's are being amortized over the 5-year terms of the agreements, and the Tony's tradename is estimated to have an indefinite useful life. Significant assumptions utilized in the income approach were based on certain information and projections, which are not observable in the market and are thus considered Level 3 measurements as defined by authoritative guidance. The goodwill of $61.5 million represents the future economic benefits expected to arise that could not be individually identified and separately recognized, including expansion of the Company's sales in natural protein and specialty cheeses.
59
The following table summarizes the consideration paid for the Tony's acquisition and the amounts of assets acquired and liabilities assumed recognized at the acquisition date:
(in thousands) | Final Opening Balance Sheet | |||
Accounts receivable | $ | 40,577 | ||
Inventory | 31,807 | |||
Property and equipment | 41,983 | |||
Other assets | 5,815 | |||
Customer relationships | 54,800 | |||
Tradename and other intangible assets | 26,900 | |||
Goodwill | 61,487 | |||
Total assets | $ | 263,369 | ||
Liabilities | 60,698 | |||
Total purchase price | $ | 202,671 | ||
Acquisition costs related to the Tony's acquisition were approximately $0.3 million and $1.5 million for the fiscal years ended August 1, 2015 and August 2, 2014, respectively, and have been expensed as incurred and are included within "Operating Expenses" in the Consolidated Statements of Income. The results of Tony's operations have been included in the consolidated financial statements since the date of acquisition.
During the first quarter of fiscal 2014, the Company, within its wholesale segment, completed a business combination related to the acquisition of all of the equity interests of Trudeau Foods, LLC from Trudeau Holdings, LLC, a portfolio company of Arbor Investments II, LP. The total cash consideration related to this acquisition was approximately $23.0 million. The fair value of the identifiable intangible assets acquired was determined by using an income approach. The identifiable intangible assets recorded based on the valuation consist of customer lists of $9.5 million, which are being amortized on a straight-line basis over an estimated useful life of approximately ten years. Significant assumptions utilized in the income approach were based on company-specific information and projections which are not observable in the market and are thus considered Level 3 measurements as defined by authoritative guidance. The results of the acquired operations of Trudeau have been included in the Company's results since September 26, 2013.
3. | EQUITY PLANS |
The Company recognized total share-based compensation expense of $15.3 million for the fiscal year ended July 30, 2016, compared to $14.0 million and $14.6 million for the fiscal years ended August 1, 2015 and August 2, 2014, respectively. For the fiscal year ended July 30, 2016, the Company did not record share-based compensation expense related to performance-based share awards, including compensation expense related to performance units with vestings tied to Company's performance in fiscal 2016, as a result of performance measures not being attained at the end of the fiscal year and the resulting forfeiture of these awards. The Company recognized a benefit of $1.0 million related to performance-based share awards for the fiscal year ended August 1, 2015 due to the reversal of share-based compensation expense recorded in fiscal 2014 caused by performance measures not being attained as of the end of fiscal 2015 and the resulting forfeiture of these awards. The Company recorded $1.0 million share-based compensation expense related to performance-based share awards for the fiscal year ended August 2, 2014.
As of July 30, 2016, there was $28.7 million of total unrecognized compensation cost related to outstanding share-based compensation arrangements (including stock options, restricted stock units and performance-based restricted stock units). This cost is expected to be recognized over a weighted-average period of 2.6 years.
For stock options, the fair value of each grant was estimated at the date of grant using the Black-Scholes option pricing model. Black-Scholes utilizes assumptions related to volatility, the risk-free interest rate, the dividend yield and expected life. Expected volatilities utilized in the model are based on the historical volatility of the Company's stock price. The risk-free interest rate is derived from the U.S. Treasury yield curve in effect at the time of grant. The model incorporates exercise and post-vesting forfeiture assumptions based on an analysis of historical data. The expected term is derived from historical information and other factors. The fair value of restricted stock awards, restricted stock units, and performance share units are determined based on the number of shares or units, as applicable, granted and the quoted price of the Company's common stock as of the grant date.
The following summary presents the weighted average assumptions used for stock options granted in fiscal 2016, 2015 and 2014:
60
Fiscal year ended | ||||||||
July 30, 2016 | August 1, 2015 | August 2, 2014 | ||||||
Expected volatility | 27.5 | % | 26.2 | % | 28.5 | % | ||
Dividend yield | — | % | — | % | — | % | ||
Risk free interest rate | 1.3 | % | 1.4 | % | 1.2 | % | ||
Expected term (in years) | 4.0 | 4.0 | 3.0 | |||||
The Company has four equity incentive plans that provide for the issuance of stock options: the 1996 Stock Option Plan (the "1996 Plan"), the 2002 Stock Incentive Plan (the "2002 Plan"), the 2004 Equity Incentive Plan, as amended (the "2004 Plan"), and the 2012 Equity Incentive Plan, as amended and restated (the "2012 Plan") (collectively, the "Plans"). The Plans provide, or prior to their expiration, in the case of the 1996, 2002, and 2004 Plans, provided, for grants of stock options to employees, officers, directors and others. Since fiscal 2010, the Company has not granted stock options intended to qualify as incentive stock options within the meaning of Section 422 of the Internal Revenue Code. Vesting requirements for awards under the Plans are at the discretion of the Company's Board of Directors, or Compensation Committee of the Board of Directors. Typically, awards granted to employees vest ratably over 4 years. The Company did not grant options to directors in fiscal 2014, fiscal 2015 or fiscal 2016. The maximum term of all incentive and non-statutory stock options granted under the Plans is 10 years. There were 7,800,000 shares authorized for grant under the 1996 Plan and 2002 Plan and 1,250,000 under the 2012 Plan prior to December 16, 2015, when the 2012 Plan was amended to increase shares available for issuance by 2,000,000. There were 1,054,267 remaining shares authorized for grant under the 2004 Plan as of December 16, 2010, the effective date when the 2004 Plan was amended to allow for the award of stock options. Prior to the expiration of the applicable plan, these shares may be used to issue stock options, restricted stock, restricted stock units or performance based awards. As of July 30, 2016, 2,354,570 shares were available for grant under the 2012 Plan. The authorization for new grants under the 1996 Plan, 2002 Plan and 2004 Plan has expired.
The following summary presents information regarding outstanding stock options as of July 30, 2016 and changes during the fiscal year then ended with regard to options under the Plans:
Number of Options | Weighted Average Exercise Price | Weighted Average Remaining Contractual Term | Aggregate Intrinsic Value | |||||||||
Outstanding at beginning of year | 444,516 | $ | 46.97 | |||||||||
Granted | 33,030 | $ | 51.52 | |||||||||
Exercised | (84,110 | ) | $ | 30.51 | ||||||||
Forfeited | (27,005 | ) | $ | 64.43 | ||||||||
Cancelled | (22,802 | ) | $ | 61.01 | ||||||||
Outstanding at end of year | 343,629 | $ | 49.13 | 5.8 years | $ | 2,586,141 | ||||||
Exercisable at end of year | 223,711 | $ | 42.99 | 4.7 years | $ | 2,586,141 | ||||||
The weighted average grant-date fair value of options granted during the fiscal years ended July 30, 2016, August 1, 2015, and August 2, 2014 was $15.59, $14.82 and $16.48, respectively. The aggregate intrinsic value of options exercised during the fiscal years ended July 30, 2016, August 1, 2015, and August 2, 2014, was $2.6 million, $3.1 million and $2.5 million, respectively.
Vesting requirements for awards under the Plans are at the discretion of the Company's Board of Directors, or the Compensation Committee thereof, and for time vesting awards are typically four equal annual installments for employees and two equal installments for non-employee directors with the first installment on the date of grant and the second installment on the six month anniversary of the grant date.
The following summary presents information regarding restricted stock awards, restricted stock units, performance shares and performance units under the Plans as of July 30, 2016 and changes during the fiscal year then ended:
61
Number of Shares | Weighted Average Grant-Date Fair Value | |||||
Outstanding at August 1, 2015 | 621,232 | $ | 61.60 | |||
Granted | 571,638 | $ | 50.44 | |||
Vested | (256,210 | ) | $ | 56.72 | ||
Forfeited | (202,863 | ) | $ | 58.19 | ||
Outstanding at July 30, 2016 | 733,797 | $ | 55.55 | |||
The total intrinsic value of restricted stock awards and restricted stock units vested was $12.3 million, $17.3 million and $16.9 million during the fiscal years ended July 30, 2016, August 1, 2015 and August 2, 2014, respectively. The total intrinsic value of performance share awards and performance units vested was $1.3 million during the fiscal year ended August 2, 2014, respectively. No performance share awards or performance units vested during the fiscal years ended July 30, 2016 or August 1, 2015.
During the fiscal year ended July 30, 2016, 29,115 performance units were granted (subject to the issuance of an additional 29,115 shares if the Company's performance exceeded specified targeted levels) to the Company's President and CEO, the vesting of which was contingent on the attainment of specific levels of earnings before interest and taxes and return on invested capital for fiscal 2016. The per share grant-date fair value of these awards was $51.52. Effective July 30, 2016, all of these performance units were forfeited as the underlying performance criteria that were required to be achieved in order for the units to vest were not achieved.
During the fiscal year ended August 1, 2015, 23,238 performance units were granted (subject to the issuance of an additional 23,238 shares if the Company's performance exceeded specified targeted levels), to the Company's President and CEO, the vesting of which was contingent on the attainment of specific levels of earnings before interest and taxes and return on invested capital. The per share grant-date fair value of these awards was $64.55. Effective August 1, 2015, all of these performance units were forfeited as the underlying performance criteria that were required to be achieved in order for the units to vest were not achieved.
During the fiscal year ended August 2, 2014, 22,229 performance shares were granted (subject to the issuance of an additional 22,229 shares if the Company's performance exceeded specified targeted levels) to the Company's President and CEO, the vesting of which was contingent on the attainment of specific levels of earnings before interest and taxes and return on invested capital. The per share grant-date fair value of these grants was $67.48. Effective August 2, 2014, a total of 19,396 performance shares for fiscal 2014 vested with a corresponding intrinsic value and fair value of $1.3 million and $1.1 million, respectively. The remainder of the performance shares were forfeited.
The Company has a performance-based equity compensation arrangement with a 2-year performance-based vesting component that was established for members of the Company's executive leadership team. Under this arrangement, for the 2-year performance periods ended July 30, 2016, August 1, 2015 and August 2, 2014, the executives were awarded performance-based stock units with a grant-date fair value equal to approximately 30% of the sum of 125% of their annual base salary and 50% of their cash-based performance award earned in the prior fiscal year. Similar to the performance awards granted to the Company's President and CEO, if the Company's performance exceeded specified targeted levels, the grants could be increased up to an additional 100%. For the 2-year performance periods ended July 30, 2016, August 1, 2015, and August 2, 2014, it was determined that targeted levels of performance were not met and therefore, the Company did not issue shares to the executive leadership team in settlement of the performance units and all the units were forfeited.
4. | ALLOWANCE FOR DOUBTFUL ACCOUNTS AND NOTES RECEIVABLE |
The allowance for doubtful accounts and notes receivable consists of the following:
62
Fiscal year ended | ||||||||||||
July 30, 2016 | August 1, 2015 | August 2, 2014 | ||||||||||
(In thousands) | ||||||||||||
Balance at beginning of year | $ | 8,493 | $ | 8,294 | $ | 10,026 | ||||||
Additions charged to costs and expenses | 6,426 | 5,059 | 3,152 | |||||||||
Deductions | (3,689 | ) | (4,590 | ) | (5,743 | ) | ||||||
Charged to Other Accounts (1) | — | (270 | ) | 859 | ||||||||
Balance at end of year | $ | 11,230 | $ | 8,493 | $ | 8,294 | ||||||
(1) Relates to acquisitions.
5. | RESTRUCTURING ACTIVITIES |
2016 Cost-Saving Measures. During the fourth quarter of fiscal 2015, the Company announced that its contract as a distributor to Albertsons Companies, Inc., which includes the Albertsons, Safeway and Eastern Supermarket chains, would terminate on September 20, 2015 rather than upon the original contract end date of July 31, 2016. During fiscal 2016, the Company implemented Company-wide cost-saving measures in response to this lost business which resulted in total restructuring costs of $4.4 million, all of which was recorded during the first six months of fiscal 2016. There were no additional costs recorded related to these cost-savings initiatives in fiscal 2016. These initiatives resulted in a reduction of employees, the majority of which were terminated during the first quarter of fiscal 2016, across the Company. The total work-force reduction charge of $3.4 million recorded during fiscal 2016 was primarily related to severance and fringe benefits. In addition to workforce reduction charges, the Company recorded $0.9 million during fiscal 2016 for costs due to an early lease termination and facility closure and operational transfer costs associated with these initiatives.
Earth Origins Market. During the fourth quarter of fiscal 2016, the Company recorded restructuring and impairment charges of $0.8 million related to the Company's Earth Origins Market ("Earth Origins") retail business. The Company made the decision during the fourth quarter of fiscal 2016 to close two of its stores, one store located in Florida and the other located in Maryland, which resulted in restructuring costs of $0.5 million primarily related to severance and closure costs. The stores were closed during the first quarter of fiscal 2017. In addition, the Company recorded a total impairment charge of $0.3 million on long-lived assets.
Canadian facility closure. During fiscal 2015, the Company ceased operations at its Canadian facility located in Scotstown, Quebec which was acquired in 2010. In connection with this closure, the Company recognized an impairment of $0.6 million during the first quarter of fiscal 2015 representing the remaining unamortized balance of an intangible asset. During the second quarter of fiscal 2015, the Company recognized a restructuring charge of $0.2 million in connection with this closure. Additionally, during the second quarter of fiscal 2016, the Company recognized an additional impairment charge of $0.4 million related to the long lived assets at the facility.
The following is a summary of the restructuring costs the Company recorded in fiscal 2016, as well as the remaining liability as of the fiscal year ended July 30, 2016 (in thousands):
Restructuring Costs | Cash Payments | Restructuring Cost Liability as of July 30, 2016 | |||||||||
Cost saving measures: | |||||||||||
Severance | $ | 3,443 | $ | (3,087 | ) | $ | 356 | ||||
Early lease termination and facility closing costs | 368 | (368 | ) | — | |||||||
Operational transfer costs | 570 | (570 | ) | — | |||||||
Earth Origins: | |||||||||||
Severance | 41 | — | 41 | ||||||||
Store closing costs | 443 | — | 443 | ||||||||
Total | $ | 4,865 | $ | (4,025 | ) | $ | 840 | ||||
63
The following is a summary of the impairment costs the Company recorded in fiscal 2016 (in thousands):
Impairment Costs | |||
Canadian facility closure | $ | 413 | |
Earth Origins store | 274 | ||
Total | $ | 687 | |
6. | ACCRUED EXPENSES AND OTHER CURRENT LIABILITIES |
Accrued expenses and other current liabilities as of July 30, 2016 and August 1, 2015 consisted of the following (in thousands):
July 30, 2016 | August 1, 2015 | ||||||
Accrued salaries and employee benefits | $ | 58,832 | $ | 45,778 | |||
Workers' compensation and automobile liabilities | 23,448 | 18,782 | |||||
Customer incentives | 16,410 | 15,011 | |||||
Accrued freight | 12,046 | 9,242 | |||||
Interest rate swap liability | 5,917 | 726 | |||||
Other | 45,785 | 36,654 | |||||
Total accrued expenses and other current liabilities | $ | 162,438 | $ | 126,193 | |||
7. | NOTES PAYABLE |
On April 29, 2016, the Company entered into the Third Amended and Restated Loan and Security Agreement (the "Third A&R Credit Agreement") amending and restating certain terms and provisions of its revolving credit facility which increased the maximum borrowings under the amended and restated revolving credit facility and extended the maturity date to April 29, 2021. Up to $850.0 million is available to the Company's U.S. subsidiaries and up to $50.0 million is available to UNFI Canada. After giving effect to the Third A&R Credit Agreement, the amended and restated revolving credit facility provides an option to increase the U.S. or Canadian revolving commitments by up to an additional $600.0 million (but in not less than $10.0 million increments) subject to certain customary conditions and the lenders committing to provide the increase in funding.
The borrowings of the U.S. portion of the amended and restated revolving credit facility, after giving effect to the Third A&R Credit Agreement, accrue interest, at the base rate plus an applicable margin of 0.25% or LIBOR rate plus an applicable margin of 1.25% for the twelve month period ending April 29, 2017. After this period, the interest on the U.S. borrowings is accrued at the Company's option, at either (i) a base rate (generally defined as the highest of (x) the Bank of America Business Capital prime rate, (y) the average overnight federal funds effective rate plus one-half percent (0.50%) per annum and (z) one-month LIBOR plus one percent (1%) per annum) plus an applicable margin that varies depending on daily average aggregate availability, or (ii) the LIBOR rate plus an applicable margin that varies depending on daily average aggregate availability. The borrowings on the Canadian portion of the credit facility accrue interest at the Canadian prime rate plus an applicable margin of 0.25% or a bankers' acceptance equivalent rate plus an applicable margin of 1.25% for the twelve month period ending April 29, 2017. After this period, the borrowings on the Canadian portion of the credit facility accrue interest, at the Company's option, at either (i) a Canadian prime rate (generally defined as the highest of (x) 0.50% over 30-day Reuters Canadian Deposit Offering Rate ("CDOR") for bankers' acceptances, (y) the prime rate of Bank of America, N.A.'s Canada branch, and (z) a bankers' acceptance equivalent rate for a one month interest period plus 1.00%) plus an applicable margin that varies depending on daily average aggregate availability, or (ii) a bankers' acceptance equivalent rate of the rate of interest per annum equal to the annual rates applicable to Canadian Dollar bankers' acceptances on the "CDOR Page" of Reuter Monitor Money Rates Service, plus five basis points, and an applicable margin that varies depending on daily average aggregate availability. Unutilized commitments are subject to an annual fee in the amount of 0.30% if the total outstanding borrowings are less than 25% of the aggregate commitments, or a per annum fee of 0.25% if such total outstanding borrowings are 25% or more of the aggregate commitments. The Company is also required to pay a letter of credit fronting fee to each letter of credit issuer equal to 0.125% per annum of the stated amount of each such letter of credit (or such other amount as may be mutually agreed by the borrowers under the facility and the applicable letter of credit issuer), as well as a fee to all lenders equal to the applicable margin for LIBOR or bankers’ acceptance equivalent rate loans, as applicable, times the average daily stated amount of all outstanding letters of credit.
As of July 30, 2016, the Company's borrowing base, which is calculated based on eligible accounts receivable and inventory levels, net of $7.4 million of reserves, was $832.7 million. As of July 30, 2016, the Company had $426.5 million of borrowings
64
outstanding under the Company's amended and restated revolving credit facility and $37.4 million in letter of credit commitments which reduced the Company's available borrowing capacity under its revolving credit facility on a dollar for dollar basis. The Company's resulting remaining availability was $368.7 million as of July 30, 2016.
The amended and restated revolving credit facility, as amended by the Third A&R Credit Agreement, subjects the Company to a springing minimum fixed charge coverage ratio (as defined in the Third A&R Credit Agreement) of 1.0 to 1.0 calculated at the end of each of our fiscal quarters on a rolling four quarter basis when the adjusted aggregate availability (as defined in the Third A&R Credit Agreement) is less than the greater of (i) $60.0 million and (ii) 10% of the aggregate borrowing base. The Company was not subject to the fixed charge coverage ratio covenant under the amended and restated credit agreement during the fiscal year ended July 30, 2016.
The credit facility also allows for the lenders thereunder to syndicate the credit facility to other banks and lending institutions. The Company has pledged the majority of its and its subsidiaries' accounts receivable and inventory for its obligations under the amended and restated revolving credit facility.
8.LONG-TERM DEBT
On August 14, 2014, the Company and certain of its subsidiaries entered into a real estate backed term loan agreement (the "Term Loan Agreement"). The total initial borrowings under the Term Loan Agreement were $150.0 million. The Company is required to make $2.5 million principal payments quarterly, which began on November 1, 2014. Under the Term Loan Agreement, the Company at its option may request the establishment of one or more new term loan commitments in increments of at least $10.0 million, but not to exceed $50.0 million in total, subject to the approval of the lenders electing to participate in such incremental loans and the satisfaction of the conditions required by the Term Loan Agreement. The Company will be required to make quarterly principal payments on these incremental borrowings in accordance with the terms of the Term Loan Agreement. Proceeds from this Term Loan Agreement were used to pay down borrowings on the Company's amended and restated revolving credit facility.
On April 29, 2016, the Company entered into a First Amendment Agreement (the “Term Loan Amendment”) to the Term Loan Agreement which amends the Term Loan Agreement. The Term Loan Amendment was entered into to reflect the changes to the amended and restated revolving credit facility reflected in the Amendment. The Term Loan Agreement will terminate on the earlier of (a) August 14, 2022 and (b) the date that is ninety days prior to the termination date of the Company’s amended and restated revolving credit agreement. Under the Term Loan Agreement, the borrowers at their option may request the establishment of one or more new term loan commitments in increments of at least $10.0 million, but not to exceed $50.0 million in total, subject to the approval of the lenders electing to participate in such incremental loans and the satisfaction of the conditions required by the Term Loan Agreement. The borrowers will be required to make quarterly principal payments on these incremental borrowings in accordance with the terms of the Term Loan Agreement.
On September 1, 2016, the Company entered into a Second Amendment Agreement (the "Second Amendment") to the Term Loan Agreement which amends the Term Loan Agreement. The Second Amendment was entered into to adjust the applicable margin charged to borrowings under the Term Loan Agreement. As amended by the Second Amendment, borrowings under the Term Loan Agreement bear interest at rates that, at the Company's option, can be either: (1) a base rate generally defined as the sum of (i) the highest of (x) the administrative agent's prime rate, (y) the average overnight federal funds effective rate plus 0.50% and (z) one-month LIBOR plus one percent (1%) per annum and (ii) a margin of 0.75%; or, (2) a LIBOR rate generally defined as the sum of (i) LIBOR (as published by Reuters or other commercially available sources) for one, two, three or six months or, if approved by all affected lenders, nine months (all as selected by the Company), and (ii) a margin of 1.75%. Interest accrued on borrowings under the Term Loan Agreement is payable in arrears. Interest accrued on any LIBOR loan is payable on the last day of the interest period applicable to the loan and, with respect to any LIBOR loan of more than three (3) months, on the last day of every three (3) months of such interest period. Interest accrued on base rate loans is payable on the first day of every month. The Company is also required to pay certain customary fees to the administrative agent. The borrowers' obligations under the Term Loan Agreement are secured by certain parcels of the borrowers' real property.
The Term Loan Agreement includes financial covenants that require (i) the ratio of the Company’s consolidated EBITDA (as defined in the Term Loan Agreement) minus the unfinanced portion of Capital Expenditures (as defined in the Term Loan Agreement) to the Company’s consolidated Fixed Charges (as defined in the Term Loan Agreement) to be at least 1.20 to 1.00 as of the end of any period of four fiscal quarters, (ii) the ratio of the Company’s Consolidated Funded Debt (as defined in the Term Loan Agreement) to the Company’s EBITDA for the four fiscal quarters most recently ended to be not more than 3.00 to 1.00 as of the end of any fiscal quarter and (iii) the ratio, expressed as a percentage, of the Company’s outstanding principal balance under the Loans (as defined in the Term Loan Agreement), divided by the Mortgaged Property Value (as defined in the Term Loan Agreement) to be not more than 75% at any time.
65
During the fiscal year ended August 1, 2015, the Company entered into an amendment to an existing lease agreement for the office space utilized as the Company's corporate headquarters in Providence, Rhode Island. The amendment provides for additional office space to be utilized by the Company and extends the lease term for an additional 10 years. The lease qualifies for capital lease treatment pursuant to ASC 840, Leases, and the estimated fair value of the building is recorded on the balance sheet with the capital lease obligation included in long-term debt. A portion of each lease payment reduces the amount of the lease obligation, and a portion is recorded as interest expense at an effective rate of approximately 12.38%.
During the fiscal year ended July 28, 2012, the Company entered into a lease agreement for a new distribution facility in Aurora, Colorado. As of the fiscal year ended August 3, 2013, actual construction costs exceeded the construction allowance as defined by the lease agreement, and therefore, the Company determined it met the criteria for continuing involvement pursuant to ASC 840, Leases, and applied the financing method to account for this transaction. Under the financing method, the book value of the distribution facility and related accumulated depreciation remains on the balance sheet. The construction allowance is recorded as a financing obligation in long-term debt. A portion of each lease payment will reduce the amount of the financing obligation, and a portion will be recorded as interest expense at an effective rate of approximately 7.32%.
As of July 30, 2016 and August 1, 2015, the Company's long-term debt consisted of the following:
July 30, 2016 | August 1, 2015 | ||||||
(In thousands) | |||||||
Financing obligation, due monthly, and maturing in October 2028 at an effective interest rate of 7.32% | $ | 31,502 | $ | 32,510 | |||
Capital lease, Providence, Rhode Island corporate headquarters, due monthly, and maturing in April 2025 at an effective interest rate of 12.38% | 13,643 | 13,883 | |||||
Real-estate backed Term Loan Agreement, due quarterly (1) | 128,448 | 138,169 | |||||
$ | 173,593 | $ | 184,562 | ||||
Less: current installments | 11,854 | 11,613 | |||||
Long-term debt, excluding current installments | $ | 161,739 | $ | 172,949 | |||
(1) Real-estate backed Term Loan Agreement balance is shown net of debt issuance costs of $1.6 million and $1.8 million as of July 30, 2016 and August 1, 2015, respectively, due to the Company's adoption of ASU No. 2015-03 in the fourth quarter of fiscal 2016.
Aggregate maturities of long-term debt for the next five years and thereafter are as follows at July 30, 2016:
Year | (In thousands) | |||
2017 | $ | 11,854 | ||
2018 | 12,103 | |||
2019 | 12,515 | |||
2020 | 12,693 | |||
2021 | 93,181 | |||
2022 and thereafter | 32,799 | |||
$ | 175,145 | |||
9. | FAIR VALUE MEASUREMENTS |
The Company utilizes ASC 820, Fair Value Measurements and Disclosures ("ASC 820"), for financial assets and liabilities and for non-financial assets and liabilities that are recognized or disclosed at fair value on at least an annual basis. ASC 820 defines fair value as the price that would be received from selling an asset or paid to transfer a liability in an orderly transaction between market participants at the measurement date. When determining the fair value measurements for assets and liabilities required or permitted to be recorded at fair value, the Company considers the principal or most advantageous market in which it would transact and considers assumptions that market participants would use when pricing the asset or liability, such as inherent risk, transfer restrictions, and risk of nonperformance. ASC 820 establishes a fair value hierarchy that requires an entity to maximize the use of observable inputs and minimize the use of unobservable inputs when measuring fair value. ASC 820 establishes three levels of inputs that may be used to measure fair value:
• | Level 1 Inputs—Unadjusted quoted prices in active markets for identical assets or liabilities. |
66
• | Level 2 Inputs—Inputs other than quoted prices included in Level 1 that are either directly or indirectly observable through correlation with market data. These include quoted prices for similar assets or liabilities in active markets; quoted prices for identical or similar assets or liabilities in markets that are not active; and inputs to valuation models or other pricing methodologies that do not require significant judgment because the inputs used in the model, such as interest rates and volatility, can be corroborated by readily observable market data. |
• | Level 3 Inputs—One or more significant inputs that are unobservable and supported by little or no market activity, and that reflect the use of significant management judgment. Level 3 assets and liabilities include those whose fair value measurements are determined using pricing models, discounted cash flow methodologies or similar valuation techniques, and significant management judgment or estimation. |
Interest Rate Swap Agreements
On January 23, 2015, the Company entered into a forward starting interest rate swap agreement with an effective date of August 3, 2015. The agreement provides for the Company to pay interest for a seven-year period at a fixed rate of 1.795% on an initial amortizing principal amount of $140.0 million while receiving interest for the same period at the one-month LIBOR on the same notional amount. The interest rate swap has been entered into as a hedge against LIBOR movements on the current variable rate related to the Company’s real-estate backed Term Loan Agreement entered into on August 14, 2014, explained in more detail in Note 8 "Long-Term Debt," to protect against rising interest rates. We expect that the interest rate swap will effectively fix the Company’s interest rate payments on the $140.0 million of debt under the Company's Term Loan Agreement. The swap agreement qualifies as an “effective” hedge under ASC 815, Derivatives and Hedging ("ASC 815").
On June 7, 2016, the Company entered into two pay fixed and receive float interest rate swap agreements to effectively fix the underlying variable rate debt on the Company’s amended and restated revolving credit facility. The first agreement has an effective date of June 9, 2016 and expires in June of 2019. This interest rate swap agreement has a notional principal amount of $50.0 million and provides for the Company to pay interest for a three-year period at a fixed annual rate of 0.8725% while receiving interest for the same period at one-month LIBOR on the same notional principal amount. This swap, in conjunction with the amended and restated revolving credit facility, effectively fixes the interest rate on the $50.0 million notional amount. The second agreement has an effective date of June 9, 2016 and expires concurrent with the scheduled maturity of our amended and restated revolving credit facility in April of 2021. This interest rate swap agreement has a notional principal amount of $25.0 million and provides for the Company to pay interest for a five-year period at a fixed rate of 1.065% while receiving interest for the same period at one-month LIBOR on the same notional principal amount. This swap, in conjunction with the amended and restated revolving credit facility, effectively fixes the interest rate on the $25.0 million notional amount.
On June 24, 2016, the Company entered into two additional pay fixed and receive float interest rate swap agreements to effectively fix the underlying variable rate debt on the Company’s amended and restated revolving credit facility. The first agreement has an effective date of June 24, 2016 and expires in June of 2019. This interest rate swap agreement has a notional principal amount of $50.0 million and provides for the Company to pay interest for a three-year period at a fixed annual rate of 0.7265% while receiving interest for the same period at one-month LIBOR on the same notional principal amount. This swap, in conjunction with the amended and restated revolving credit facility, effectively fixes the interest rate on the $50.0 million notional amount. The second agreement has an effective date of June 24, 2016 and expires concurrent with the scheduled maturity of our amended and restated revolving credit facility in April of 2021. This interest rate swap agreement has a notional principal amount of $25.0 million and provides for the Company to pay interest for a five-year period at a fixed rate of 0.9260% while receiving interest for the same period at one-month LIBOR on the same notional principal amount. This swap, in conjunction with the amended and restated revolving credit facility, effectively fixes the interest rate on the $25.0 million notional amount.
Interest rate swap agreements are entered into for periods consistent with related underlying exposures and do not constitute positions independent of those exposures. The Company’s interest rate swap agreements are designated as a cash flow hedges at July 30, 2016 and are reflected at their fair value of $5.9 million in the consolidated balance sheet.
The Company uses the “Hypothetical Derivative Method” described in ASC 815 for quarterly prospective and retrospective assessments of hedge effectiveness, as well as for measurements of hedge ineffectiveness. Under this method, the Company assesses the effectiveness of each hedging relationship by comparing the changes in cash flows of the derivative hedging instrument with the changes in cash flows of the designated hedged transactions. The effective portion of changes in the fair value of the derivative is initially reported in other comprehensive income (outside of earnings) and subsequently reclassified to earnings in interest income when the hedged transactions affect earnings. Ineffectiveness resulting from the hedge is recorded as a gain or loss in the consolidated statement of income as part of other income. The Company did not have any material hedge ineffectiveness recognized in earnings during the fiscal year ended July 30, 2016. The Company also monitors the risk of counterparty default on an ongoing basis and noted that the counterparties are reputable financial institutions.
Fuel Supply Agreements
67
From time to time the Company is a party to fixed price fuel supply agreements. During the fiscal years ended July 30, 2016 and August 1, 2015, the Company entered into several agreements which required it to purchase a portion of its diesel fuel each month at fixed prices through December 2016. These fixed price fuel agreements qualify for the "normal purchase" exception under ASC 815; therefore, the fuel purchases under these contracts are expensed as incurred and included within operating expenses.
Financial Instruments
The following table provides the fair value hierarchy for financial assets and liabilities measured on a recurring basis as of July 30, 2016 and August 1, 2015:
Fair Value at July 30, 2016 | Fair Value at August 1, 2015 | |||||||||||||||||||
(In thousands) | Level 1 | Level 2 | Level 3 | Level 1 | Level 2 | Level 3 | ||||||||||||||
Liabilities: | ||||||||||||||||||||
Interest Rate Swap | — | $ | (5,917 | ) | — | — | $ | (726 | ) | — | ||||||||||
The fair value of the Company's other financial instruments including cash and cash equivalents, accounts receivable, notes receivable, accounts payable and certain accrued expenses are derived using Level 2 inputs and approximate carrying amounts due to the short-term nature of these instruments. The fair value of notes payable approximate carrying amounts as they are variable rate instruments. The carrying amount of notes payable approximates fair value as interest rates on the credit facility approximates current market rates (level 2 criteria).
The following estimated fair value amounts have been determined by the Company using available market information and appropriate valuation methodologies taking into account the instruments' interest rate, terms, maturity date and collateral, if any, in comparison to the Company's incremental borrowing rate for similar financial instruments and are therefore deemed Level 2 inputs. However, considerable judgment is required in interpreting market data to develop the estimates of fair value. Accordingly, the estimates presented herein are not necessarily indicative of the amounts that the Company could realize in a current market exchange.
July 30, 2016 | August 1, 2015 | |||||||||||||||
(In thousands) | Carrying Value | Fair Value | Carrying Value | Fair Value | ||||||||||||
Liabilities | ||||||||||||||||
Long term debt, including current portion | $ | 173,593 | $ | 182,790 | $ | 184,562 | $ | 192,679 | ||||||||
10. | COMMITMENTS AND CONTINGENCIES |
The Company leases various facilities and equipment under operating lease agreements with varying terms. Most of the leases contain renewal options and purchase options at several specific dates throughout the terms of the leases.
Rent and other lease expense for the fiscal years ended July 30, 2016, August 1, 2015 and August 2, 2014 totaled approximately $65.4 million, $74.8 million and $65.1 million, respectively.
Future minimum annual fixed payments required under non-cancelable operating leases having an original term of more than one year as of July 30, 2016 are as follows:
Fiscal Year | (In thousands) | |||
2017 | $ | 56,269 | ||
2018 | 51,181 | |||
2019 | 44,632 | |||
2020 | 34,452 | |||
2021 | 22,734 | |||
2022 and thereafter | 55,364 | |||
$ | 264,632 | |||
As of July 30, 2016, outstanding commitments for the purchase of inventory were approximately $18.9 million. The Company had outstanding letters of credit of approximately $37.4 million at July 30, 2016.
As of July 30, 2016, outstanding commitments for the purchase of diesel fuel were approximately $2.6 million.
68
The Company may from time to time be involved in various claims and legal actions arising in the ordinary course of business. In the opinion of management, amounts accrued, as well as the total amount of reasonably possible losses with respect to such matters, individually and in the aggregate, are not deemed to be material to the Company's consolidated financial position or results of operations. Legal expenses incurred in connection with claims and legal actions are expensed as incurred.
11. | RETIREMENT PLANS |
Retirement Plan
The Company has a defined contribution retirement plan under Section 401(k) of the Internal Revenue Code, the United Natural Foods, Inc. Retirement Plan (the "Retirement Plan"). In order to become a participant in the Retirement Plan, employees must meet certain eligibility requirements as described in the Retirement Plan document. In addition to amounts contributed to the Retirement Plan by employees, the Company makes contributions to the Retirement Plan on behalf of the employees. The Company also has the Millbrook Distribution Services Union Retirement Plan, which was assumed as part of an acquisition during fiscal 2008 and the Western Conference of Teamsters Pension Trust Fund, which was assumed as part of the Nor-Cal acquisition in March 2016. The Company's contributions to these plans were approximately $7.3 million, $6.4 million, and $5.8 million for the fiscal years ended July 30, 2016, August 1, 2015 and August 2, 2014, respectively.
Deferred Compensation and Supplemental Retirement Plans
The Company's non-employee directors and certain of its employees are eligible to participate in the United Natural Foods Deferred Compensation Plan and the United Natural Foods Deferred Stock Plan (collectively the "Deferral Plans"). The Deferral Plans are nonqualified deferred compensation plans which are administered by the Company's Compensation Committee of the Board of Directors. The Deferral Plans were established to provide participants with the opportunity to defer the receipt of all or a portion of their compensation to a non-qualified retirement plan in amounts greater than the amount permitted to be deferred under the Company's 401(k) Plan. The Company believes that this is an appropriate benefit because (i) it operates to place employees and non-employee directors in the same position as other employees who are not affected by Internal Revenue Code limits placed on plans such as the Company's 401(k) Plan; (ii) does not substantially increase the Company's financial obligations to its employees and directors (there are no employer matching contributions, only a crediting of deemed earnings); and (iii) provides additional incentives to the Company's employees and directors, since amounts set aside by the employees and directors are subject to the claims of the Company's creditors until paid. Under the Deferral Plans, only the payment of the compensation earned by the participant is deferred and there is no deferral of the expense in the Company's financial statements related to the participants' earnings; the Company records the related compensation expense in the year in which the compensation is earned by the participants.
Under the Deferred Stock Plan, which was frozen to new deferrals effective January 1, 2007, each eligible participant could elect to defer between 0% and 100% of restricted stock awards granted during the election calendar year. Effective January 1, 2007, each participant may elect to defer up to 100% of their restricted share unit awards, performance shares and performance units under the Deferred Compensation Plan. Under the Deferred Compensation Plan, each participant may also elect to defer a minimum of $1,000 and a maximum of 90% of base salary and 100% of director fees, employee bonuses and commissions, as applicable, earned by the participants for the calendar year. Participants' cash-derived deferrals accrue earnings and appreciation based on the performance of mutual funds selected by the participant. The value of equity-based awards deferred under the Deferred Compensation and Deferred Stock Plans are based upon the performance of the Company's common stock.
The Millbrook Deferred Compensation Plan and the Millbrook Supplemental Retirement Plan were assumed by the Company as part of an acquisition during fiscal 2008. Deferred compensation relates to a compensation arrangement implemented in 1984 by a predecessor of the acquired company in the form of a non-qualified defined benefit plan and a supplemental retirement plan which permitted former officers and certain management employees, at the time, to defer portions of their compensation to earn specified maximum benefits upon retirement. The future obligations, which are fixed in accordance with the plans, have been recorded at a discount rate of 5.7%. These plans do not allow new participants, and there are no active employees subject to these plans.
In an effort to provide for the benefits associated with these plans, the acquired company's predecessor purchased whole-life insurance contracts on the plan participants. The cash surrender value of these policies included in Other Assets in the Consolidated Balance Sheet was $12.2 million and $11.5 million at July 30, 2016 and August 1, 2015, respectively. At July 30, 2016, total future obligations including interest, assuming commencement of payments at an individual's retirement age, as defined under the deferred compensation arrangement, were as follows:
69
Fiscal Year | (In thousands) | |||
2017 | $ | 1,248 | ||
2018 | 1,067 | |||
2019 | 1,147 | |||
2020 | 940 | |||
2021 | 785 | |||
2022 and thereafter | 3,837 | |||
$ | 9,024 | |||
12. | EMPLOYEE STOCK OWNERSHIP PLAN |
The Company adopted the UNFI Employee Stock Ownership Plan (the "ESOP") for the purpose of acquiring outstanding shares of the Company for the benefit of eligible employees. The ESOP was effective as of November 1, 1988 and received notice of qualification by the Internal Revenue Service.
In connection with the adoption of the ESOP, a Trust was established to hold the shares acquired. On November 1, 1988, the Trust purchased 40% of the then outstanding common stock of the Company at a price of $4.1 million. The trustees funded this purchase by issuing promissory notes to the initial stockholders, with the Trust shares pledged as collateral. These notes bore interest at 1.33% and were payable through May 2015. As the debt was repaid, the shares were released from collateral and allocated to active employees, based on the proportion of principal and interest paid in the year.
All shares held by the ESOP were purchased prior to December 31, 1992, except that 9,393 shares were purchased during the fourth quarter of fiscal 2015 to fund the final allocation of shares under the ESOP and during the first quarter of fiscal 2016, the Company purchased an additional 324 shares to correct a share shortage as the ESOP was merged with the Retirement Plan effective October 30, 2015. Prior to the final release of the shares in the ESOP, the Company considered unreleased shares of the ESOP to be outstanding for purposes of calculating both basic and diluted earnings per share, whether or not the shares had been committed to be released. Prior to the repayments, the debt of the ESOP was recorded as debt and the shares pledged as collateral are reported as unearned ESOP shares in the consolidated balance sheets. The debt was fully repaid as of August 1, 2015, and no contributions were made during fiscal 2016. During the fiscal year ended August 1, 2015, contributions totaling approximately $0.1 million were made to the Trust, less than $0.1 million of which represented interest.
The ESOP shares were classified as follows:
July 30, 2016 | August 1, 2015 | ||||
(In thousands) | |||||
Total ESOP shares—beginning of year | 1,057 | 1,595 | |||
Shares distributed to employees | (1,057 | ) | (538 | ) | |
Total ESOP shares—end of year | — | 1,057 | |||
Allocated shares | 1,057 | ||||
Unreleased shares | — | — | |||
Total ESOP shares | — | 1,057 | |||
During the fiscal year ended August 1, 2015, 24,512 shares were released for allocation based on note payments. All shares were released as of August 1, 2015.
13. | INCOME TAXES |
For the fiscal year ended July 30, 2016, income (loss) before income taxes consists of $208.8 million from U.S. operations and $(0.6) million from foreign operations. For the fiscal year ended August 1, 2015, income before income taxes consists of $227.4 million from U.S. operations and $2.4 million from foreign operations. For the fiscal year ended August 2, 2014, income before income taxes consists of $201.1 million from U.S. operations and $6.3 million from foreign operations.
70
Total federal and state income tax (benefit) expense consists of the following:
Current | Deferred | Total | |||||||||
(In thousands) | |||||||||||
Fiscal year ended July 30, 2016 | |||||||||||
U.S. Federal | $ | 57,157 | $ | 11,383 | $ | 68,540 | |||||
State & Local | 12,718 | 1,310 | $ | 14,028 | |||||||
Foreign | 101 | (213 | ) | $ | (112 | ) | |||||
$ | 69,976 | $ | 12,480 | $ | 82,456 | ||||||
Fiscal year ended August 1, 2015 | |||||||||||
U.S. Federal | $ | 60,848 | $ | 13,209 | $ | 74,057 | |||||
State & Local | 14,119 | 2,098 | 16,217 | ||||||||
Foreign | 729 | 32 | 761 | ||||||||
$ | 75,696 | $ | 15,339 | $ | 91,035 | ||||||
Fiscal year ended August 2, 2014 | |||||||||||
U.S. Federal | $ | 66,953 | $ | (894 | ) | $ | 66,059 | ||||
State & Local | 12,660 | 1,452 | 14,112 | ||||||||
Foreign | 1,432 | 323 | 1,755 | ||||||||
$ | 81,045 | $ | 881 | $ | 81,926 | ||||||
Total income tax expense (benefit) was different than the amounts computed using the United States statutory income tax rate of 35% applied to income before income taxes as a result of the following:
Fiscal year ended | |||||||||||
July 30, 2016 | August 1, 2015 | August 2, 2014 | |||||||||
(In thousands) | |||||||||||
Computed "expected" tax expense | $ | 72,878 | $ | 80,419 | $ | 72,593 | |||||
State and local income tax, net of Federal income tax benefit | 9,412 | 10,547 | 9,135 | ||||||||
Non-deductible expenses | 1,549 | 1,551 | 1,333 | ||||||||
Tax effect of share-based compensation | 86 | 165 | 160 | ||||||||
General business credits | (135 | ) | (365 | ) | (114 | ) | |||||
Other, net | (1,334 | ) | (1,282 | ) | (1,181 | ) | |||||
Total income tax expense | $ | 82,456 | $ | 91,035 | $ | 81,926 | |||||
The income tax expense (benefit) for the years ended July 30, 2016 and August 1, 2015 and August 2, 2014 was allocated as follows:
July 30, 2016 | August 1, 2015 | August 2, 2014 | |||||||||
(In thousands) | |||||||||||
Income tax expense | $ | 82,456 | $ | 91,035 | $ | 81,926 | |||||
Stockholders' equity, difference between compensation expense for tax purposes and amounts recognized for financial statement purposes | 83 | (2,746 | ) | (2,601 | ) | ||||||
Other comprehensive income | (2,050 | ) | (293 | ) | — | ||||||
$ | 80,489 | $ | 87,996 | $ | 79,325 | ||||||
71
The tax effects of temporary differences that give rise to significant portions of the net deferred tax assets and deferred tax liabilities at July 30, 2016 and August 1, 2015 are presented below:
2016 | 2015 | ||||||
(In thousands) | |||||||
Deferred tax assets: | |||||||
Inventories, principally due to additional costs inventoried for tax purposes | $ | 10,682 | $ | 9,034 | |||
Compensation and benefits related | 25,453 | 23,651 | |||||
Accounts receivable, principally due to allowances for uncollectible accounts | 4,734 | 3,279 | |||||
Accrued expenses | 7,519 | 9,077 | |||||
Net operating loss carryforwards | 1,059 | 1,177 | |||||
Interest rate swap agreements | 2,343 | 293 | |||||
Other deferred tax assets | 29 | 20 | |||||
Total gross deferred tax assets | 51,819 | 46,531 | |||||
Less valuation allowance | — | — | |||||
Net deferred tax assets | $ | 51,819 | $ | 46,531 | |||
Deferred tax liabilities: | |||||||
Plant and equipment, principally due to differences in depreciation | $ | 62,030 | $ | 47,872 | |||
Intangible assets | 48,996 | 31,955 | |||||
Other | 785 | 15 | |||||
Total deferred tax liabilities | 111,811 | 79,842 | |||||
Net deferred tax liabilities | $ | (59,992 | ) | $ | (33,311 | ) | |
Current deferred income tax assets | $ | 35,228 | $ | 32,333 | |||
Non-current deferred income tax liabilities | (95,220 | ) | (65,644 | ) | |||
$ | (59,992 | ) | $ | (33,311 | ) | ||
In assessing the need to establish a valuation reserve for the recoverability of deferred tax assets, the Company considers whether it is more likely than not that some portion or all of the deferred tax assets will not be realized. The Company considers relevant evidence, both positive and negative, to determine the need for a valuation allowance. Information evaluated includes the Company's financial position and results of operations for the current and preceding years, the availability of deferred tax liabilities and tax carrybacks, as well as an evaluation of currently available information about future years. As of July 30, 2016, the Company has sufficient taxable income in the federal carryback period and anticipates sufficient future taxable income over the periods in which the deferred tax assets are deductible. The Company also has the availability of future reversals of taxable temporary differences that are expected to generate taxable income in the future. Therefore, the ultimate realization of deferred tax assets for federal and state tax purposes appears more likely than not at July 30, 2016 and correspondingly no valuation allowance has been established.
At July 30, 2016, the Company had net operating loss carryforwards of approximately $3.0 million for federal income tax purposes. The federal carryforwards are subject to an annual limitation of approximately $0.3 million under Internal Revenue Code Section 382. The carryforwards expire at various times between fiscal years 2017 and 2027.
The Company and its subsidiaries file income tax returns in the United States federal jurisdiction and in various state jurisdictions. UNFI Canada files income tax returns in Canada and certain of its provinces. U.S. federal income tax examination years prior to 2013 have either statutorily or administratively been closed with the Internal Revenue Service, and with limited exception, the fiscal tax years that remain subject to examination by state jurisdictions range from the Company's fiscal 2012 to fiscal 2015.
The Company records interest and penalties related to unrecognized tax benefits as a component of income tax expense. For the fiscal year ended July 30, 2016, the net tax benefit realized in the consolidated statement of income was de minimis. For the fiscal year ended August 1, 2015, the Company recognized net tax benefits of $0.5 million in its consolidated statement of income. For the fiscal year ended August 2, 2014, the Company recognized net tax benefits of $0.3 million in its consolidated statement of income related to tax examinations closed during the fiscal year.
72
The retained earnings of the Company's non-U.S. subsidiaries that have not been subject to U.S. tax are $15.6 million at July 30, 2016. The Company considers these unremitted earnings to be indefinitely reinvested; therefore, we have not provided a deferred tax liability for any residual U.S. tax that may be due upon repatriation of these earnings. Because of the effect of U.S. foreign tax credits, it is not practicable to estimate the amount of tax that might be payable on these earnings in the event they no longer are indefinitely reinvested.
14. | BUSINESS SEGMENTS |
The Company has several operating divisions aggregated under the wholesale segment, which is the Company's only reportable segment. These operating divisions have similar products and services, customer channels, distribution methods and historical margins. The wholesale segment is engaged in the national distribution of natural, organic and specialty foods, produce and related products in the United States and Canada.
The Company has additional operating divisions that do not meet the quantitative thresholds for reportable segments and are therefore aggregated under the caption of "Other". "Other" includes a retail division, which engages in the sale of natural foods and related products to the general public through retail storefronts on the east coast of the United States, a manufacturing division, which engages in importing, roasting and packaging of nuts, seeds, dried fruit and snack items, and the Company's branded product lines. "Other" also includes certain corporate operating expenses that are not allocated to operating divisions, which consist of depreciation, salaries, retainers, and other related expenses of officers, directors, corporate finance (including professional services), information technology, governance, legal, human resources and internal audit that are necessary to operate the Company's headquarters located in Providence, Rhode Island. As the Company continues to expand its business and serve its customers through a new national platform, these corporate expense amounts have increased, which is the primary driver behind the increasing operating losses within the "Other" category below. Non-operating expenses that are not allocated to the operating divisions are under the caption of "Unallocated Expenses". The Company does not record its revenues for financial reporting purposes by product group, and it is therefore impracticable for the Company to report them accordingly.
73
Following is business segment information for the periods indicated:
Wholesale | Other | Eliminations | Unallocated Expenses | Consolidated | |||||||||||
(In thousands) | |||||||||||||||
Fiscal year ended July 30, 2016 | |||||||||||||||
Net sales | 8,395,821 | 238,691 | (164,226 | ) | — | $ | 8,470,286 | ||||||||
Restructuring and asset impairment expenses | 2,811 | 2,741 | — | — | 5,552 | ||||||||||
Operating income (loss) | 240,068 | (15,080 | ) | (879 | ) | — | 224,109 | ||||||||
Interest expense | — | — | — | 16,259 | 16,259 | ||||||||||
Interest income | — | — | — | (1,115 | ) | (1,115 | ) | ||||||||
Other, net | — | — | — | 743 | 743 | ||||||||||
Income before income taxes | 208,222 | ||||||||||||||
Depreciation and amortization | 68,278 | 2,728 | — | — | 71,006 | ||||||||||
Capital expenditures | 39,464 | 1,911 | — | — | 41,375 | ||||||||||
Goodwill | 348,143 | 18,025 | — | — | 366,168 | ||||||||||
Total assets | 2,672,620 | 201,603 | (22,068 | ) | — | 2,852,155 | |||||||||
Fiscal year ended August 1, 2015 | |||||||||||||||
Net sales | 8,099,818 | 225,520 | (140,360 | ) | — | $ | 8,184,978 | ||||||||
Restructuring and asset impairment expenses | 803 | — | — | — | 803 | ||||||||||
Operating income (loss) | 259,214 | (16,295 | ) | (962 | ) | 241,957 | |||||||||
Interest expense | — | — | — | 14,498 | 14,498 | ||||||||||
Interest income | — | — | — | (356 | ) | (356 | ) | ||||||||
Other, net | — | — | — | (1,954 | ) | (1,954 | ) | ||||||||
Income before income taxes | 229,769 | ||||||||||||||
Depreciation and amortization | 64,452 | (652 | ) | — | — | 63,800 | |||||||||
Capital expenditures | 125,217 | 3,917 | — | — | 129,134 | ||||||||||
Goodwill | 248,909 | 17,731 | — | — | 266,640 | ||||||||||
Total assets | 2,369,490 | 189,149 | (17,645 | ) | — | 2,540,994 | |||||||||
Fiscal year ended August 2, 2014 | |||||||||||||||
Net sales | 6,709,119 | 206,618 | (121,290 | ) | — | $ | 6,794,447 | ||||||||
Operating income (loss) | 236,062 | (24,542 | ) | (732 | ) | — | 210,788 | ||||||||
Interest expense | — | — | — | 7,753 | 7,753 | ||||||||||
Interest income | — | — | — | (508 | ) | (508 | ) | ||||||||
Other, net | — | — | — | (3,865 | ) | (3,865 | ) | ||||||||
Income before income taxes | 207,408 | ||||||||||||||
Depreciation and amortization | 46,516 | 2,242 | — | — | 48,758 | ||||||||||
Capital expenditures | 145,875 | 1,428 | — | — | 147,303 | ||||||||||
Goodwill | 256,817 | 17,731 | — | — | 274,548 | ||||||||||
Total assets | 2,146,114 | 156,053 | (13,276 | ) | — | 2,288,891 | |||||||||
15. | IMMATERIAL CORRECTION TO PRIOR PERIOD FINANCIAL STATEMENTS |
During the fourth quarter of fiscal 2016, the Company revised previously reported amounts for identified errors in accounting for early payment discounts on inventory purchases. Management considered both the quantitative and qualitative factors within the provisions of SEC Staff Accounting Bulletin No. 99, Materiality, and Staff Accounting Bulletin No. 108, Considering the Effects of Prior Year Misstatements when Quantifying Misstatements in Current Year Financial Statements. Based on evaluation
74
of the errors, management has concluded that the prior period errors were immaterial to the previously issued financial statements. As such, management has elected to correct the identified error in the prior periods. In doing so, balances in the consolidated financial statements included to which this footnote relates have been adjusted to reflect the correction in the proper periods. Future filings that include prior periods will be corrected, as needed, when filed.
The effect of recording the immaterial correction in the consolidated financial statements as of August 1, 2015 and August 2, 2014 is as follows (amounts in thousands, except per share amounts):
As of and for the fiscal year ended August 1, 2015 | ||||||||||
As Reported | As Revised | |||||||||
Consolidated Balance Sheet | ||||||||||
Inventories | $ | 982,559 | $ | 975,194 | ||||||
Total current assets | 1,553,742 | 1,546,377 | ||||||||
Total assets | 2,550,190 | 2,540,994 | (1) | |||||||
Accrued expenses and other current liabilities | 129,113 | 126,193 | ||||||||
Total current liabilities | 530,860 | 527,940 | ||||||||
Total liabilities | 1,164,657 | 1,159,906 | (1) | |||||||
Retained earnings | 983,891 | 979,446 | ||||||||
Total stockholders’ equity | 1,385,533 | 1,381,088 | ||||||||
Total liabilities and stockholders’ equity | 2,550,190 | 2,540,994 | (1) | |||||||
Consolidated Statement of Stockholders' Equity | ||||||||||
Retained earnings beginning of year | $ | 845,157 | $ | 840,712 | ||||||
Retained earnings end of year | 983,891 | 979,446 | ||||||||
As of and for the fiscal year ended August 2, 2014 | ||||||||||
As Reported | As Revised | |||||||||
Consolidated Statement of Stockholders' Equity | ||||||||||
Retained Earnings beginning of year | $ | 719,675 | $ | 715,230 | ||||||
Retained earnings end of year | 845,157 | 840,712 | ||||||||
(1) Amounts are also reflective of a reclassification of debt issuance costs of $1.8 million as the Company early adopted ASU No. 2015-03 during the fourth quarter of fiscal 2016. Refer to Note 1 "Significant Accounting Policies" for further detail.
75
16. | QUARTERLY FINANCIAL DATA (UNAUDITED) |
The following table sets forth certain key interim financial information for the fiscal years ended July 30, 2016 and August 1, 2015:
First Quarter | Second Quarter | Third Quarter | Fourth Quarter | Full Year | ||||||||||||||||
(In thousands except per share data) | ||||||||||||||||||||
2016 | ||||||||||||||||||||
Net sales | $ | 2,076,649 | $ | 2,047,712 | $ | 2,132,104 | $ | 2,213,821 | $ | 8,470,286 | ||||||||||
Gross profit | 313,937 | 297,518 | 322,433 | 345,463 | 1,279,351 | |||||||||||||||
Income before income taxes | 50,135 | 37,742 | 62,676 | 57,669 | 208,222 | |||||||||||||||
Net income | 30,131 | 22,683 | 38,271 | 34,681 | 125,766 | |||||||||||||||
Per common share income | ||||||||||||||||||||
Basic: | $ | 0.60 | $ | 0.45 | $ | 0.76 | $ | 0.69 | $ | 2.50 | ||||||||||
Diluted: | $ | 0.60 | $ | 0.45 | $ | 0.76 | $ | 0.69 | $ | 2.50 | ||||||||||
Weighted average basic | ||||||||||||||||||||
Shares outstanding | 50,194 | 50,326 | 50,350 | 50,381 | 50,313 | |||||||||||||||
Weighted average diluted | ||||||||||||||||||||
Shares outstanding | 50,313 | 50,388 | 50,379 | 50,516 | 50,399 | |||||||||||||||
Market Price | ||||||||||||||||||||
High | $ | 55.69 | $ | 52.07 | $ | 43.02 | $ | 52.18 | $ | 55.69 | ||||||||||
Low | $ | 44.05 | $ | 33.85 | $ | 29.75 | $ | 33.16 | $ | 29.75 | ||||||||||
First Quarter | Second Quarter | Third Quarter | Fourth Quarter | Full Year | ||||||||||||||||
(In thousands except per share data) | ||||||||||||||||||||
2015 | ||||||||||||||||||||
Net sales | $ | 1,992,476 | $ | 2,016,546 | $ | 2,114,643 | $ | 2,061,313 | $ | 8,184,978 | ||||||||||
Gross profit | 318,996 | 299,199 | 325,914 | 316,406 | 1,260,515 | |||||||||||||||
Income before income taxes | 54,615 | 46,023 | 69,571 | 59,560 | 229,769 | |||||||||||||||
Net income | 33,042 | 27,844 | 41,750 | 36,098 | 138,734 | |||||||||||||||
Per common share income | ||||||||||||||||||||
Basic: | $ | 0.66 | $ | 0.56 | $ | 0.83 | $ | 0.72 | $ | 2.77 | ||||||||||
Diluted: | $ | 0.66 | $ | 0.55 | $ | 0.83 | $ | 0.72 | $ | 2.76 | ||||||||||
Weighted average basic | ||||||||||||||||||||
Shares outstanding | 49,889 | 50,025 | 50,079 | 50,091 | 50,021 | |||||||||||||||
Weighted average diluted | ||||||||||||||||||||
Shares outstanding | 50,113 | 50,277 | 50,348 | 50,330 | 50,267 | |||||||||||||||
Market Price | ||||||||||||||||||||
High | $ | 69.51 | $ | 80.77 | $ | 83.91 | $ | 69.26 | $ | 83.91 | ||||||||||
Low | $ | 58.48 | $ | 67.71 | $ | 66.34 | $ | 45.26 | $ | 45.26 | ||||||||||
17. SUBSEQUENT EVENTS
Acquisition of Gourmet Guru
Subsequent to the fiscal year ended July 30, 2016, the Company acquired all of the outstanding stock of Gourmet Guru. Founded in 1996, Gourmet Guru is a distributor and merchandiser of fresh and organic food focusing on new and emerging brands.
76
ITEM 9. CHANGES IN AND DISAGREEMENTS WITH ACCOUNTANTS ON ACCOUNTING AND FINANCIAL DISCLOSURE
Not applicable.
ITEM 9A. CONTROLS AND PROCEDURES
Evaluation of Disclosure Controls and Procedures.
We carried out an evaluation, under the supervision and with the participation of our Chief Executive Officer and Chief Financial Officer, of the effectiveness of the design and operation of our disclosure controls and procedures (as defined in Rules 13a-15(e) and 15d-15(e) of the Exchange Act as of the end of the period covered by this Annual Report on Form 10-K (the "Evaluation Date"). Based on this evaluation, our Chief Executive Officer and Chief Financial Officer concluded that, as of the Evaluation Date, our disclosure controls and procedures were effective.
Management's Annual Report on Internal Control Over Financial Reporting.
Our management is responsible for establishing and maintaining adequate internal control over financial reporting. Internal control over financial reporting is defined in Rules 13a-15(f) or 15d-15(f) promulgated under the Exchange Act as a process designed by, or under the supervision of, our principal executive and principal financial officers and effected by our Board of Directors, management and other personnel, to provide reasonable assurance regarding the reliability of financial reporting and the preparation of financial statements for external purposes in accordance with generally accepted accounting principles and includes those policies and procedures that:
• | Pertain to the maintenance of records that in reasonable detail accurately and fairly reflect the transactions and dispositions of our assets; |
• | Provide reasonable assurance that transactions are recorded as necessary to permit preparation of financial statements in accordance with generally accepted accounting principles, and that receipts and expenditures are being made only in accordance with authorizations of our management and directors; and |
• | Provide reasonable assurance regarding prevention or timely detection of unauthorized acquisition, use or disposition of our assets that could have a material effect on the financial statements. |
Because of its inherent limitations, internal control over financial reporting may not prevent or detect misstatements. Projections of any evaluation of effectiveness to future periods are subject to the risk that controls may become inadequate because of changes in conditions, or that the degree of compliance with the policies or procedures may deteriorate.
Our management, including our Chief Executive Officer and Chief Financial Officer, assessed the effectiveness of our internal control over financial reporting as of July 30, 2016. In making this assessment, our management used the criteria set forth by the Committee of Sponsoring Organizations of the Treadway Commission (COSO) in the Internal Control-Integrated Framework (2013 framework). On March 31, 2016, the Company acquired all of the outstanding stock of Nor-Cal, and management excluded from its assessment of the effectiveness of the Company's internal control over financial reporting as of July 30, 2016, Nor-Cal's internal control over financial reporting with associated assets of approximately $92.5 million (of which approximately $71.4 million represents goodwill and intangible assets included within the scope of the assessment) and total revenue of approximately $51.4 million generated by Nor-Cal that was included in the Company's consolidated financial statements as of and for the fiscal year ended July 30, 2016. In addition, On May 13, 2016, the Company acquired all of the outstanding stock of Haddon, and management excluded from its assessment of the effectiveness of the Company's internal control over financial reporting as of July 30, 2016, Haddon's internal control over financial reporting with associated assets of approximately $254.9 million (of which approximately $110.9 million represents goodwill and intangible assets included within the scope of the assessment) and total revenue of approximately $100.4 million generated by Haddon that was included in the Company's consolidated financial statements as of and for the fiscal year ended July 30, 2016. Based on its assessment, our management concluded that, as of July 30, 2016, our internal control over financial reporting was effective based on those criteria at the reasonable assurance level.
Report of the Independent Registered Public Accounting Firm.
The effectiveness of our internal control over financial reporting as of July 30, 2016 has been audited by KPMG LLP, an independent registered public accounting firm, as stated in its attestation report which is included in "Item 8. Financial Statements and Supplementary Data" of this Annual Report on Form 10-K.
Changes in Internal Controls Over Financial Reporting
77
No change in our internal control over financial reporting (as such term is defined in Exchange Act Rule 13a-15(f)or 15d-15(f)) occurred during the fiscal quarter ended July 30, 2016 that materially affected, or is reasonably likely to materially affect, our internal control over financial reporting.
ITEM 9B. OTHER INFORMATION
None.
78
PART III.
ITEM 10. DIRECTORS, EXECUTIVE OFFICERS AND CORPORATE GOVERNANCE
The information required by this item will be contained, in part, in our Definitive Proxy Statement on Schedule 14A for our Annual Meeting of Stockholders to be held on December 15, 2016 (the "2016 Proxy Statement") under the captions "Directors and Nominees for Director," "Section 16(a) Beneficial Ownership Reporting Compliance," and "Committees of the Board of Directors—Audit Committee" and is incorporated herein by this reference. Pursuant to Item 401(b) of Regulation S-K, our executive officers are reported under the caption "Executive Officers of the Registrant" in Part I, Item I of this Annual Report on Form 10-K.
We have adopted a code of conduct and ethics that applies to our Chief Executive Officer, Chief Financial Officer, and employees within our finance, operations, and sales departments. Our code of conduct and ethics is publicly available on our website at www.unfi.com and is available free of charge by writing to United Natural Foods, Inc., 313 Iron Horse Way, Providence, Rhode Island 02908, Attn: Investor Relations. We intend to make any legally required disclosures regarding amendments to, or waivers of, the provisions of the code of conduct and ethics on our website at www.unfi.com. Please note that our website address is provided as an inactive textual reference only.
ITEM 11. EXECUTIVE COMPENSATION
The information required by this item will be contained in the 2016 Proxy Statement under the captions "Non-employee Director Compensation," "Executive Compensation", "Compensation Discussion and Analysis", "Compensation Committee Interlocks and Insider Participation" and "Report of the Compensation Committee" and is incorporated herein by this reference.
ITEM 12. SECURITY OWNERSHIP OF CERTAIN BENEFICIAL OWNERS AND MANAGEMENT AND RELATED STOCKHOLDER MATTERS
The information required by this item will be contained, in part, in the 2016 Proxy Statement under the caption "Stock Ownership of Certain Beneficial Owners and Management", and is incorporated herein by this reference.
The following table provides certain information with respect to equity awards under our equity compensation plans as of July 30, 2016.
Plan Category | Number of securities to be issued upon exercise of outstanding options, warrants and rights | Weighted-average exercise price of outstanding options, warrants and rights | Number of securities remaining available for future issuance under equity compensation plans (excluding securities reflected in the second column) | ||||||||
Plans approved by stockholders | 1,077,426 | (1) | $ | 49.13 | (1) | 2,354,570 | (2) | ||||
Plans not approved by stockholders | 63,148 | (3) | — | (3) | — | ||||||
Total | 1,140,574 | $ | 49.13 | 2,354,570 | |||||||
(1) | Includes 514,371 restricted stock units under the 2012 Plan, 52,680 performance-based restricted stock units under the 2012 Plan and 133,887 stock options under the 2012 Plan, 166,746 restricted stock units under the 2004 Plan, 80,070 stock options under the 2004 Plan and 129,672 stock options under the 2002 Plan. Restricted stock units and performance stock units do not have an exercise price because their value is dependent upon continued employment over a period of time or the achievement of certain performance goals, and are to be settled for shares of common stock. Accordingly, they have been disregarded for purposes of computing the weighted-average exercise price. |
(2) | All shares were available for issuance under the 2012 Plan. The 2012 Plan authorizes grants in the form of stock options, stock appreciation rights, restricted stock, restricted stock units, performance shares, performance units or a combination thereof but includes limits on the number of awards that may be issued in the form of restricted shares or units. The number of shares remaining available for future issuances assumes that, with respect to outstanding performance-based restricted stock units, the vesting criteria will be achieved at the target level. |
(3) | Consists of phantom stock units outstanding under the United Natural Foods Inc. Deferred Compensation Plan. See note 11 "Retirement Plans" to our Consolidated Financial Statements included in "Item 8. Financial Statements and Supplementary Data" of this Annual Report on Form 10-K for more information. Phantom stock units do not have an exercise price because the units may be settled only for shares of common stock on a one-for-one basis at a future date as outlined in the plan. |
ITEM 13. CERTAIN RELATIONSHIPS AND RELATED TRANSACTIONS, AND DIRECTOR INDEPENDENCE
79
The information required by this item will be contained in the 2016 Proxy Statement under the caption "Certain Relationships and Related Transactions" and "Director Independence" and is incorporated herein by this reference.
ITEM 14. PRINCIPAL ACCOUNTANT FEES AND SERVICES
The information required by this item will be contained in the 2016 Proxy Statement under the caption "Fees Paid to KPMG LLP" and is incorporated herein by this reference.
80
PART IV.
ITEM 15. EXHIBITS AND FINANCIAL STATEMENT SCHEDULES
(a) | Documents filed as a part of this Annual Report on Form 10-K. |
1.Financial Statements. The Financial Statements listed in the Index to Financial Statements in Item 8 hereof are filed as part of this Annual Report on Form 10-K.
2.Financial Statement Schedules. All schedules have been omitted because they are either not required or the information required is included in our consolidated financial statements or the notes thereto included in Item 8 hereof.
3.Exhibits. The Exhibits listed in the Exhibit Index immediately preceding such Exhibits are filed as part of this Annual Report on Form 10-K.
81
SIGNATURES
Pursuant to the requirements of Section 13 or 15 (d) of the Securities Exchange Act of 1934, the registrant has duly caused this report to be signed on its behalf by the undersigned thereunto duly authorized.
UNITED NATURAL FOODS, INC. | ||
/s/ MICHAEL P. ZECHMEISTER | ||
Michael P. Zechmeister Chief Financial Officer (Principal Financial and Accounting Officer) | ||
Dated: September 28, 2016 | ||
Pursuant to the requirements of the Securities Exchange Act of 1934, this report has been signed below by the following persons on behalf of the registrant and in the capacities and on the dates indicated.
Name | Title | Date | ||
/s/ STEVEN L. SPINNER | President, Chief Executive Officer and Director (Principal Executive Officer) | September 28, 2016 | ||
Steven L. Spinner | ||||
/s/ MICHAEL S. FUNK | Chair of the Board | September 28, 2016 | ||
Michael S. Funk | ||||
/s/ MICHAEL P. ZECHMEISTER | Senior Vice President, Chief Financial Officer (Principal Financial and Accounting Officer) | September 28, 2016 | ||
Michael P. Zechmeister | ||||
/s/ ERIC F. ARTZ | Director | September 28, 2016 | ||
Eric F. Artz | ||||
/s/ ANN TORRE BATES | Director | September 28, 2016 | ||
Ann Torre Bates | ||||
/s/ DENISE M. CLARK | Director | September 28, 2016 | ||
Denise M. Clark | ||||
/s/ GAIL A. GRAHAM | Director | September 28, 2016 | ||
Gail A. Graham | ||||
/s/ JAMES P. HEFFERNAN | Director | September 28, 2016 | ||
James P. Heffernan | ||||
/s/ PETER ROY | Director | September 28, 2016 | ||
Peter Roy | ||||
82
EXHIBIT INDEX
Exhibit No. | Description | |
2.1 | Asset Purchase Agreement, dated May 10, 2010, by and among UNFI Canada, Inc., a subsidiary of the Registrant, with SunOpta Inc. and its wholly owned subsidiary, Drive Organics Corp. (incorporated by reference to the Registrant's Current Report on Form 8-K, filed on May 11, 2010 (File No. 1-15723)). (Pursuant to Item 601(b)(2) of Regulation S-K, the schedules and exhibits have been omitted from this filing.) | |
2.2 | Amendment No 1., dated June 4, 2010, to the Asset Purchase Agreement dated May 10, 2010, by and among UNFI Canada, Inc., a subsidiary of the Registrant, with SunOpta Inc. and its wholly owned subsidiary, Drive Organics Corp. (incorporated by reference to the Registrant's Current Report on Form 8-K, filed on June 10, 2010 (File No. 1-15723)). | |
3.1 | Certificate of Incorporation of the Registrant, as amended (restated for SEC filing purposes only) (incorporated by reference to the Registrant's Quarterly Report on Form 10-Q for the quarter ended January 1, 2015 (File No. 1-15723)). | |
3.2 | Third Amended and Restated Bylaws of the Registrant (incorporated by reference to the Registrant's Current Report on Form 8-K, filed on September 12, 2016 (File No. 1-15723)). | |
4.1 | Specimen Certificate for shares of Common Stock, $0.01 par value, of the Registrant (incorporated by reference to the Registrant's Annual Report on Form 10-K for the year ended August 1, 2009 (File No. 1-15723)). | |
10.1** | Amended and Restated 1996 Stock Option Plan (incorporated by reference to the Registrant's Definitive Proxy Statement for the year ended July 31, 2000 (File No. 1-15723)). | |
10.2** | Amendment No. 1 to Amended and Restated 1996 Stock Option Plan (incorporated by reference to the Registrant's Definitive Proxy Statement for the year ended July 31, 2000 (File No. 1-15723)). | |
10.3** | Amendment No. 2 to Amended and Restated 1996 Stock Option Plan (incorporated by reference to the Registrant's Definitive Proxy Statement for the year ended July 31, 2000 (File No. 1-15723)). | |
10.4** | 2002 Stock Incentive Plan (incorporated by reference to the Registrant's Annual Report on Form 10-K for the year ended July 31, 2003 (File No. 1-15723)). | |
10.5** | United Natural Foods, Inc. Amended and Restated 2004 Equity Incentive Plan (incorporated by reference to the Registrant's Current Report on Form 8-K, filed on December 21, 2010 (File No. 1-15723)). | |
10.6** | Form of Restricted Stock Agreement, pursuant to the Amended and Restated 2004 Equity Incentive Plan (incorporated by reference to the Registrant's Registration Statement on Form S-8 POS (File No. 333-123462)). | |
10.7** | Form of Restricted Unit Award Agreement, pursuant to the Amended and Restated 2004 Equity Incentive Plan (incorporated by reference to the Registrant's Annual Report on Form 10-K for the year ended July 31, 2010 (File No. 1-15723)). | |
10.8** | Form of Non-Statutory Stock Option Award Agreement, pursuant to the Amended and Restated 2004 Equity Incentive Plan (incorporated by reference to the Registrant's Annual Report on Form 10-K for the year ended July 31, 2010 (File No. 1-15723)). | |
10.9** | Form of Performance Share Agreement, pursuant to the Amended and Restated 2004 Equity Incentive Plan (incorporated by reference to the Registrant's Current Report on Form 8-K, filed on March 18, 2011 (File No. 1-15723)). | |
10.10** | Form of Performance Share Award Agreement, pursuant to the Amended and Restated 2004 Equity Incentive Plan (incorporated by reference to the Registrant's Annual Report on Form 10-K for the year ended July 30, 2011 (File No. 1-15723)). | |
83
Exhibit No. | Description | |
10.11** | Form of Performance Unit Award Agreement, pursuant to the Amended and Restated 2004 Equity Incentive Plan (incorporated by reference to the Registrant's Annual Report on Form 10-K for the year ended July 30, 2011(File No. 1-15723)). | |
10.12** | Form of Restricted Stock Unit Award Agreement, pursuant to the Amended and Restated 2004 Equity Incentive Plan (Employee) (incorporated by reference to the Registrant’s Annual Report on Form 10-K for the year ended July 28, 2012 (File No. 1-15723)). | |
10.13** | Form of Restricted Stock Unit Award Agreement, pursuant to the Amended and Restated 2004 Equity Incentive Plan (Director) (incorporated by reference to the Registrant’s Annual Report on Form 10-K for the year ended July 28, 2012 (File No. 1-15723)). | |
10.14** | Form of Non-Statutory Stock Option Award Agreement, pursuant to the 2002 Stock Incentive Plan (Employee) (incorporated by reference to the Registrant’s Annual Report on Form 10-K for the year ended July 28, 2012 (File No. 1-15723)). | |
10.15** | Form of Non-Statutory Stock Option Award Agreement, pursuant to the Amended and Restated 2004 Equity Incentive Plan (Director) (incorporated by reference to the Registrant’s Annual Report on Form 10-K for the year ended July 28, 2012 (File No. 1-15723)). | |
10.16** | Form of Non-Statutory Stock Option Award Agreement, pursuant to the Amended and Restated 2004 Equity Incentive Plan (Employee) (incorporated by reference to the Registrant’s Annual Report on Form 10-K for the year ended July 28, 2012 (File No. 1-15723)). | |
10.17** | United Natural Foods, Inc. 2012 Equity Incentive Plan (incorporated by reference to the Registrant's Current Report on Form 8-K filed on December 18, 2012 (File No. 1-15723)) (the “2012 Equity Plan”). | |
10.18** | Form of Terms and Conditions of Grant of Non-Statutory Stock Options to Employee, pursuant to the 2012 Equity Plan (incorporated by reference to the Registrant's Quarterly Report on Form 10-Q for the quarter ended January 26, 2013 (File No. 1-15723)). | |
10.19** | Form of Terms and Conditions of Grant of Non-Statutory Stock Options to Director, pursuant to the 2012 Equity Plan (incorporated by reference to the Registrant's Quarterly Report on Form 10-Q for the quarter ended January 26, 2013 (File No. 1-15723)). | |
10.20** | Form of Terms and Conditions of Grant of Restricted Share Units to Employee, pursuant to the 2012 Equity Plan (incorporated by reference to the Registrant's Quarterly Report on Form 10-Q for the quarter ended January 26, 2013) (File No. 1-15723). | |
10.21** | Form of Terms and Conditions of Grant of Restricted Share Units to Director, pursuant to the 2012 Equity Plan (incorporated by reference to the Registrant's Quarterly Report on Form 10-Q for the quarter ended January 26, 2013) (File No. 1-15723). | |
10.22** | Form of Performance-Based Vesting Restricted Share Unit Award Agreement, pursuant to the 2012 Equity Plan (incorporated by reference to the Registrant's Quarterly Report on Form 10-Q for the quarter ended January 26, 2013) (File No. 1-15723). | |
10.23** | Form of Performance-Based Vesting Restricted Share Award Agreement, pursuant to the 2012 Equity Plan (incorporated by reference to the Registrant's Quarterly Report on Form 10-Q for the quarter ended January 26, 2013) (File No. 1-15723). | |
84
Exhibit No. | Description | |
10.24** | Terms and Conditions of Grant of Non-Statutory Stock Options to Employee, pursuant to the 2012 Equity Plan, effective September 17, 2015, between Michael P. Zechmeister, Senior Vice President and Chief Financial Officer , and the Registrant (incorporated by reference to the Registrant's Quarterly Report on Form 10-Q for the quarter ended October 30, 2015 (File No. 1-15723)). | |
10.25** | Terms and Conditions of Grant of Restricted Share Units to Employee, pursuant to the 2012 Equity Plan, effective September 17, 2015, between Michael P. Zechmeister, Senior Vice President and Chief Financial Officer, and the Registrant (incorporated by reference to the Registrant’s Quarterly Report on Form 10-Q for the quarter ended October 31, 2015 (File No. 1-15723)). | |
10.26** | United Natural Foods, Inc. Amended and Restated 2012 Equity Incentive Plan (incorporated by reference to the Registrant’s Definitive Proxy Statement on Schedule 14A for the Registrant’s Annual Meeting of Stockholders held on December 16, 2015 (File No. 1-15723)) (the “A&R 2012 Equity Plan”). | |
10.27* ** | Form of Terms and Conditions of Grant of (Pro-Rata Vesting) Restricted Share Units to Employee, pursuant to the A&R 2012 Equity Plan. | |
10.28* ** | Form of Terms and Conditions of Grant of (Cliff Vesting) Restricted Share Units to Employee, pursuant to the A&R 2012 Equity Plan. | |
10.29* ** | Form of Terms and Conditions of Grant of Restricted Share Units to Director, pursuant to the A&R 2012 Equity Plan. | |
10.30** | Fiscal 2015 Senior Management Cash Incentive Plan (incorporated by reference to the Registrant's Annual Report on Form 10-K for the year ended August 2, 2014 (File No. 1-15723)). | |
10.31** | Fiscal 2016 Senior Management Cash Incentive Plan (incorporated by reference to the Registrant’s Annual Report on Form 10-K for the year ended August 1, 2015 (File No. 1-15723)). | |
10.32** | United Natural Foods, Inc. Deferred Compensation Plan (incorporated by reference to the Registrant's Annual Report on Form 10-K for the year ended July 30, 2011 (File No. 1-15723)). | |
10.33** | United Natural Foods, Inc. Deferred Stock Plan (incorporated by reference to the Registrant's Annual Report on Form 10-K for the year ended July 30, 2011(File No. 1-15723)). | |
10.34** | Offer Letter between Steven L. Spinner, President and CEO, and the Registrant, dated August 27, 2008 (incorporated by reference to the Registrant's Quarterly Report on Form 10-Q for the quarter ended November 1, 2008 (File No. 1-15723)). | |
10.35** | Amendment to Offer Letter between Steven L. Spinner, President and CEO, and the Registrant, dated August 27, 2008 to include application of Incentive Compensation Recoupment Policy of UNFI (incorporated by reference to the Registrant's Quarterly Report on Form 10-Q for the quarter ended October 31, 2009 (File No. 1-15723)). | |
10.36** | Offer Letter, dated August 7, 2015, between Michael P. Zechmeister, Senior Vice President and Chief Financial Officer, and the Registrant (incorporated by reference to the Registrant’s Quarterly Report on Form 10-Q for the quarter ended October 31, 2015 (File No. 1-15723)). | |
10.37** | Severance Agreement between Steven L. Spinner, President and CEO, and the Registrant, effective as of September 16, 2008 (included within Exhibit 10.34, which is incorporated by reference to the Registrant's Quarterly Report on Form 10-Q for the quarter ended November 1, 2008 (File No. 1-15723)). | |
10.38 | Form Indemnification Agreement for Directors and Officers (incorporated by reference to the Registrant's Quarterly Report on Form 10-Q for the quarter ended May 2, 2009 (File No. 1-15723)). | |
10.39 | Form of Modification of Indemnification Agreement (incorporated by reference to the Registrant's Annual Report on Form 10-K for the year ended August 3, 2013 (File No. 1-15723)). | |
85
Exhibit No. | Description | |
10.40 | Revised Form Indemnification Agreement for Directors and Officers (incorporated by reference to the Registrant's Annual Report on Form 10-K for the year ended August 3, 2013 (File No. 1-15723)). | |
10.41** | Form of Change in Control Agreement between the Registrant and Joseph J. Traficanti (incorporated by reference to the Registrant's Annual Report on Form 10-K for the year ended July 31, 2010 (File No. 1-15723)). | |
10.42** | Form of Change in Control Agreement between the Registrant and each of Eric Dorne, Sean Griffin, Craig Smith, and Christopher Testa (incorporated by reference to the Registrant's Annual Report on Form 10-K for the year ended July 31, 2010 (File No. 1-15723)). | |
10.43** | Severance Agreement between the Registrant and each of Eric Dorne, Michael Funk, Sean Griffin, Craig Smith, Christopher Testa, and Joseph J. Traficanti (incorporated by reference to the Registrant's Current Report on Form 8-K, filed on April 7, 2008 (File No. 1-15723)). | |
10.44* ** | Severance Agreement between the Registrant and Michael P. Zechmeister, Senior Vice President and Chief Financial Officer, dated April 20, 2016. | |
10.45* ** | Change in Control Agreement between the Registrant and Michael P. Zechmeister, Senior Vice President and Chief Financial Officer, dated April 20, 2016. | |
10.46 | Real Estate Term Notes between the Registrant and City National Bank, dated April 28, 2000 (incorporated by reference to the Registrant's Annual Report on Form 10-K for the year ended July 31, 2000 (File No. 1-15723)). | |
10.47+ | Agreement for the Distribution of Products between the Registrant and Whole Foods Market Distribution, Inc., effective September 28, 2015 (incorporated by reference to the Registrant's Quarterly Report on Form 10-Q for the quarter ended October 31, 2015 (File No. 1-15723)). | |
10.48+ | Third Amended and Restated Loan and Security Agreement dated April 29, 2016, by and among United Natural Foods, Inc. and United Natural Foods West, Inc. as U.S. Borrowers, UNFI Canada, Inc., as Canadian Borrowers, the Lenders party thereto, Bank of America, N.A. as Administrative Agent for the Lenders, Bank of America, N.A. (acting through its Canada branch), as Canadian Agent for the Lenders and the other parties thereto (incorporated by reference to the Registrant's Current Report on Form 8-K, filed on April 29, 2016 (File No. 1-15723)). | |
10.49+ | Term Loan Agreement dated August 12, 2014, by and among United Natural Foods, Inc. and Albert's Organics, Inc., as Borrowers, the Lenders party thereto, Bank of America, N.A. as Administrative Agent for the Lenders, and the other parties thereto (incorporated by reference to the Registrant's Current Report on Form 8-K, filed on August 20, 2014 (File No. 1-15723)). | |
10.50+ | First Amendment Agreement dated April 29, 2016, by and among United Natural Foods, Inc. and Albert’s Organics, Inc. as Borrowers, the Lenders that are party to the Term Loan Agreement dated August 14, 2014, and Bank of America, N.A., as Administrative Agent, and the other parties thereto (incorporated by reference to the Registrant's Current Report on Form 8-K, filed on April 29, 2016 (File No. 1-15723)). | |
10.51* | Second Amendment Agreement dated September 1, 2016, by and among United Natural Foods, Inc. and Albert’s Organics, Inc. as Borrowers, the Lenders that are party to the Term Loan Agreement dated August 14, 2014, and Bank of America, N.A., as Administrative Agent, and the other parties thereto. | |
10.52 ** | Form of Performance-Based Vesting Restricted Share Unit Award Agreement, pursuant to the 2012 Equity Plan (incorporated by reference to the Registrant’s Annual Report on Form 10-K for the year ended August 2, 2014 (File No. 1-15723)). | |
10.53** | Form of Two-Year Performance-Based Vesting Restricted Share Unit Award Agreement, pursuant to the 2012 Equity Plan (incorporated by reference to the Registrant’s Annual Report on Form 10-K for the year ended August 1, 2015 (File No. 1-15723)). | |
10.54** | Form of One-Year Performance-Based Vesting Restricted Share Unit Award Agreement, pursuant to the 2012 Equity Plan (incorporated by reference to the Registrant’s Annual Report on Form 10-K for the year ended August 1, 2015 (File No. 1-15723)). | |
10.55* ** | Form of Two-Year Performance-Based Vesting Restricted Share Unit Award Agreement, pursuant to the A&R 2012 Equity Plan. | |
10.56* ** | Form of One-Year CEO Performance-Based Restricted Share Unit Award Agreement, pursuant to the A&R 2012 Equity Plan. | |
86
Exhibit No. | Description | |
10.57* ** | Form of One-Year Performance-Based Vesting Restricted Share Unit Award Agreement, pursuant to the A&R 2012 Equity Plan. | |
10.58 | Lease between ALCO Cityside Federal LLC, and the Registrant, dated October 14, 2008 (incorporated by reference to the Registrant’s Quarterly Report on Form 10-Q for the quarter ended May 1, 2010 (File No. 1-15723)). | |
10.59 | Amendment to Lease between ALCO Cityside Federal LLC, and the Registrant, dated May 12, 2009 (incorporated by reference to the Registrant’s Quarterly Report on Form 10-Q for the quarter ended May 1, 2010 (File No. 1-15723)). | |
10.60 | Second Amendment to Lease between ALCO Cityside Federal LLC and the Registrant, dated May 10, 2011 (incorporated by reference to the Registrant’s Quarterly Report on Form 10-Q for the quarter ended January 31, 2015 (File No. 1-15723)). | |
10.61 | Third Amendment to Lease between ALCO Cityside Federal LLC and the Registrant, dated August 7, 2013 (incorporated by reference to the Registrant’s Quarterly Report on Form 10-Q for the quarter ended January 31, 2015 (File No. 1-15723)). | |
10.62 | Fourth Amendment to Lease between ALCO Cityside Federal LLC and the Registrant, dated October 20, 2014 (incorporated by reference to the Registrant’s Quarterly Report on Form 10-Q for the quarter ended January 31, 2015 (File No. 1-15723)). | |
21* | Subsidiaries of the Registrant. | |
23.1* | Consent of Independent Registered Public Accounting Firm. | |
31.1* | Certification of CEO pursuant to Section 302 of the Sarbanes-Oxley Act of 2002. | |
31.2* | Certification of CFO pursuant to Section 302 of the Sarbanes-Oxley Act of 2002. | |
32.1* | Certification of CEO pursuant to 18 U.S.C. Section 1350, as adopted pursuant to Section 906 of the Sarbanes-Oxley Act of 2002. | |
32.2* | Certification of CFO pursuant to 18 U.S.C. Section 1350, as adopted pursuant to Section 906 of the Sarbanes-Oxley Act of 2002. | |
101* | The following materials from the United Natural Foods, Inc.'s Annual Report on Form 10-K for the fiscal year ended July 30, 2016, formatted in XBRL (eXtensible Business Reporting Language): (i) Consolidated Balance Sheets, (ii) Consolidated Statements of Income, (iii) Consolidated Statements of Comprehensive Income, (iv) Consolidated Statement of Stockholders' Equity, (v) Consolidated Statements of Cash Flows, and (vi) Notes to Consolidated Financial Statements. | |
* Filed herewith.
** Denotes a management contract or compensatory plan or arrangement.
+ Confidential treatment has been requested and granted with respect to certain portions of this exhibit pursuant to Rule 24b-2 of the Securities Exchange Act of 1934, as amended. Omitted portions have been filed separately with the United States Securities and Exchange Commission.
87