Attached files
| file | filename |
|---|---|
| 8-K - FORM 8-K - Global Indemnity Group, LLC | d620029d8k.htm |
Exhibit 99.1

INVESTOR REVIEW SEPTEMBER 2018

Forward Looking Statements This presentation may include forward -looking statements, both with respect to Global Indemnity Limited (the “Company”) and its industry, that reflect our current views with respect to future events and financial performance. These statements are made pursuant to the safe harbor provisions of the Private Securities Litigation Reform act of 1995. Forward -looking statements include all statements that do not relate solely to historical or current facts, and can be identified by the use of words such as “expect,” “intend,” “plan,” “believe,” “trends,” and similar expressions of a future or forward -looking nature. All forward -looking statements address matters that involve risks and uncertainties, many of which are beyond the Company’s control. Accordingly, there are or will be important factors that could cause actual results to differ materially from those indicated in such statements 2018 and, therefore, you should not place undue reliance on any such statements. In addition, any estimates relating to loss events involve the exercise of considerable judgments and reflect a combination of ground-up evaluations, information available to date from brokers and cedents, market intelligence, initial tentative loss reports, and other sources. The REVIEW actuarial range of reserves and management’s best estimate is based on our then-current state of knowledge including explicit and implicit assumptions relating to the pattern of claim development, the expected ultimate settlement amount, inflation and dependencies between lines of business. However, due to the complexity of factors contributing to the losses and preliminary nature of the information used to prepare these estimates, there can be no assurance that the Company’s ultimate losses will remain within the stated amount. The foregoing review of important factors should not be construed as exhaustive and should be read in conjunction with the other cautionary INVESTOR statements that are included herein and elsewhere, including the risk factors included in our most recent reports on Form 10-K and Form 10-Q and other documents of the Company’s on file with or furnished to the U.S. Securities and Exchange Commissions (“SEC”) . Any forward -looking statements made in this presentation are qualified by these cautionary statements, and there can be no assurance that the actual results or developments will be realized, or even if substantially realized, that they will have the expected consequences to, or effects on, or its business or operations. Except as required by law, the Company undertakes no obligation to update publicly or revise forward -looking statements, whether as a result of new information, future developments or otherwise. 2
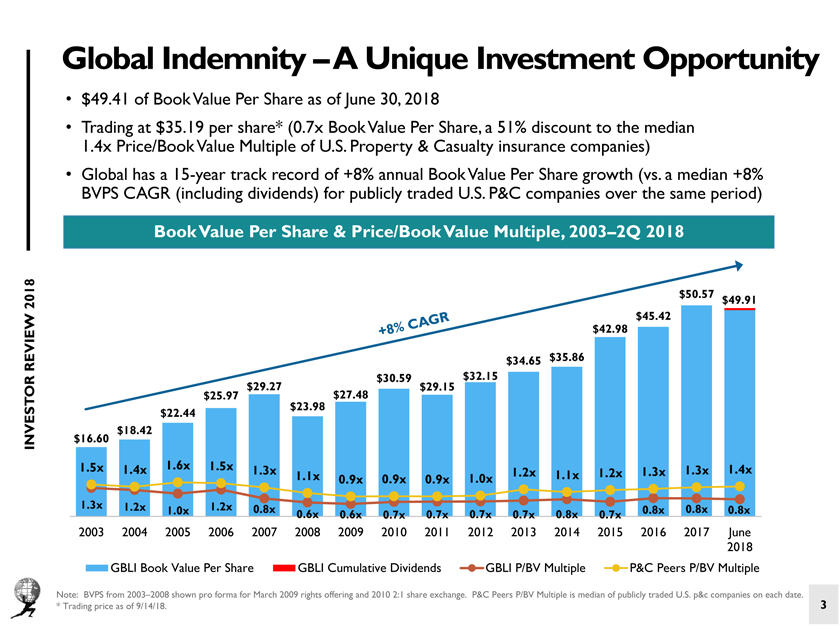
Global Indemnity –A Unique Investment Opportunity • $49.41 of Book Value Per Share as of June 30, 2018 • Trading at $35.19 per share* (0.7x Book Value Per Share, a 51% discount to the median 1.4x Price/Book Value Multiple of U.S. Property & Casualty insurance companies) • Global has a 15-year track record of +8% annual Book Value Per Share growth (vs. a median +8% BVPS CAGR (including dividends) for publicly traded U.S. P&C companies over the same period) Book Value Per Share & Price/Book Value Multiple, 2003–2Q 2018 $50.57 2018 $49.91 $45.42 $42.98 REVIEW $34.65 $35.86 $30.59 $32.15 $29.27 $29.15 $25.97 $27.48 $23.98 $22.44 $18.42 INVESTOR $16.60 1.5x 1.4x 1.6x 1.5x 1.3x 1.3x 1.4x 1.1x 1.2x 1.1x 1.2x 1.3x 0.9x 0.9x 0.9x 1.0x 1.3x 1.2x 1.2x 0.8x 0.8x 0.8x 0.8x 1.0x 0.6x 0.6x 0.7x 0.7x 0.7x 0.7x 0.8x 0.7x 2003 2004 2005 2006 2007 2008 2009 2010 2011 2012 2013 2014 2015 2016 2017 June 2018 GBLI Book Value Per Share GBLI Cumulative Dividends GBLI P/BV Multiple P&C Peers P/BV Multiple Note: BVPS from 2003–2008 shown pro forma for March 2009 rights offering and 2010 2:1 share exchange. P&C Peers P/BV Multiple is median of publicly traded U.S. p&c companies on each date. 3 * Trading price as of 9/14/18.
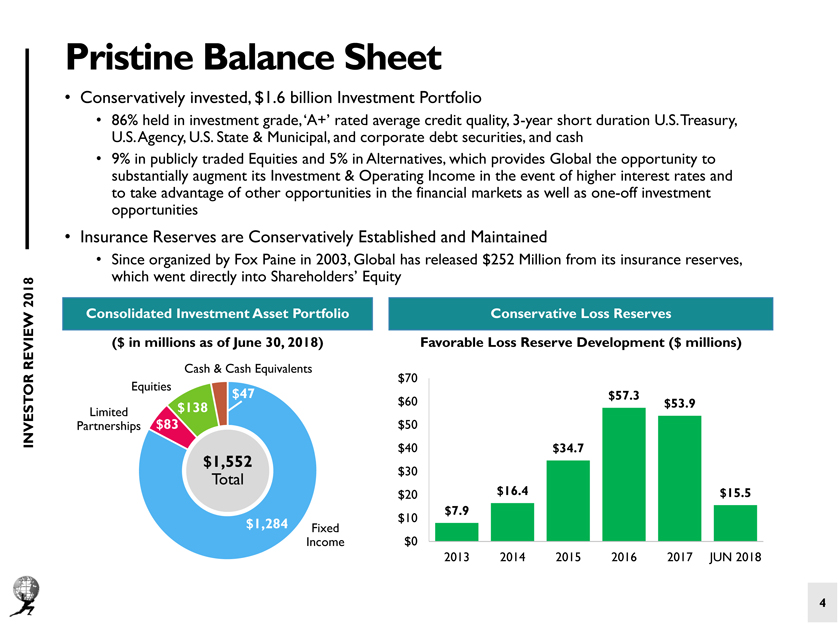
Pristine Balance Sheet • Conservatively invested, $1.6 billion Investment Portfolio • 86% held in investment grade, ‘A+’ rated average credit quality, 3-year short duration U.S. Treasury, U.S. Agency, U.S. State & Municipal, and corporate debt securities, and cash • 9% in publicly traded Equities and 5% in Alternatives, which provides Global the opportunity to substantially augment its Investment & Operating Income in the event of higher interest rates and to take advantage of other opportunities in the financial markets as well as one-off investment opportunities • Insurance Reserves are Conservatively Established and Maintained • Since organized by Fox Paine in 2003, Global has released $252 Million from its insurance reserves, which went directly into Shareholders’ Equity 2018 Consolidated Investment Asset Portfolio Conservative Loss Reserves REVIEW ($ in millions as of June 30, 2018) Favorable Loss Reserve Development ($ millions) Cash & Cash Equivalents $70 Equities $47 $57.3 $138 $60 $53.9 Limited $83 INVESTOR Partnerships $50 $1,552 $40 $34.7 Total $30 $20 $16.4 $15.5 $7.9 $1,284 $10 Fixed Income $0 2013 2014 2015 2016 2017 JUN 2018 4
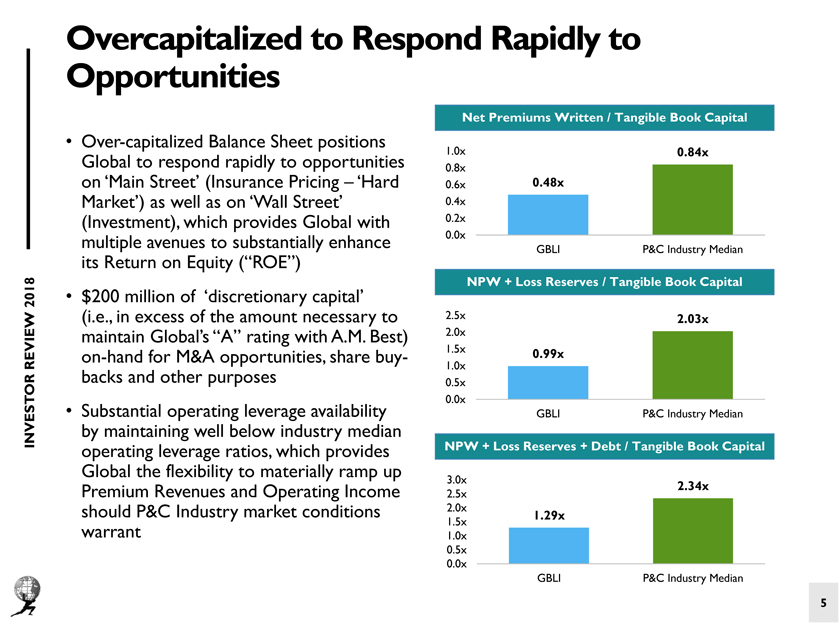
Overcapitalized to Respond Rapidly to Opportunities Net Premiums Written / Tangible Book Capital • Over-capitalized Balance Sheet positions 1.0x 0.84x Global to respond rapidly to opportunities 0.8x on ‘Main Street’ (Insurance Pricing –‘Hard 0.6x 0.48x Market’) as well as on ‘Wall Street’ 0.4x (Investment), which provides Global with 0.2x multiple avenues to substantially enhance 0.0x GBLI P&C Industry Median its Return on Equity (“ROE”) NPW + Loss Reserves / Tangible Book Capital 2018 • $200 million of ‘discretionary capital’ (i.e., in excess of the amount necessary to 2.5x 2.03x maintain Global’s “A” rating with A.M. Best) 2.0x on-hand for M&A opportunities, share buy- 1.5x 0.99x REVIEW 1.0x backs and other purposes 0.5x 0.0x • Substantial operating leverage availability GBLI P&C Industry Median INVESTOR by maintaining well below industry median operating leverage ratios, which provides NPW + Loss Reserves + Debt / Tangible Book Capital Global the flexibility to materially ramp up 3.0x Premium Revenues and Operating Income 2.34x 2.5x should P&C Industry market conditions 2.0x 1.29x 1.5x warrant 1.0x 0.5x 0.0x GBLI P&C Industry Median 5
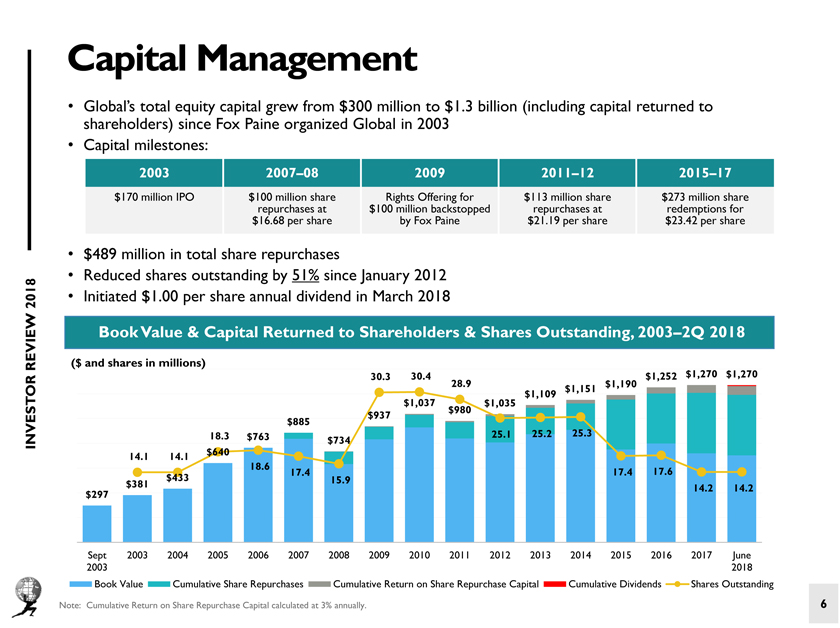
Capital Management • Global’s total equity capital grew from $300 million to $1.3 billion (including capital returned to shareholders) since Fox Paine organized Global in 2003 • Capital milestones: 2003 2007–08 2009 2011–12 2015–17 $170 million IPO $100 million share Rights Offering for $113 million share $273 million share repurchases at $100 million backstopped repurchases at redemptions for $16.68 per share by Fox Paine $21.19 per share $23.42 per share • $489 million in total share repurchases • Reduced shares outstanding by 51% since January 2012 2018 • Initiated $1.00 per share annual dividend in March 2018 Book Value & Capital Returned to Shareholders & Shares Outstanding, 2003 –2Q 2018 REVIEW ($ and shares in millions) 30.3 30.4 $1,190 $1,252 $1,270 $1,270 28.9 $1,151 $1,109 $1,035 $1,037 $980 $937 $885 18.3 $763 25.1 25.2 25.3 INVESTOR $734 14.1 14.1 $640 18.6 17.4 17.4 17.6 $433 15.9 $381 14.2 14.2 $297 Sept 2003 2004 2005 2006 2007 2008 2009 2010 2011 2012 2013 2014 2015 2016 2017 June 2003 2018 Book Value Cumulative Share Repurchases Cumulative Return on Share Repurchase Capital Cumulative Dividends Shares Outstanding Note: Cumulative Return on Share Repurchase Capital calculated at 3% annually. 6
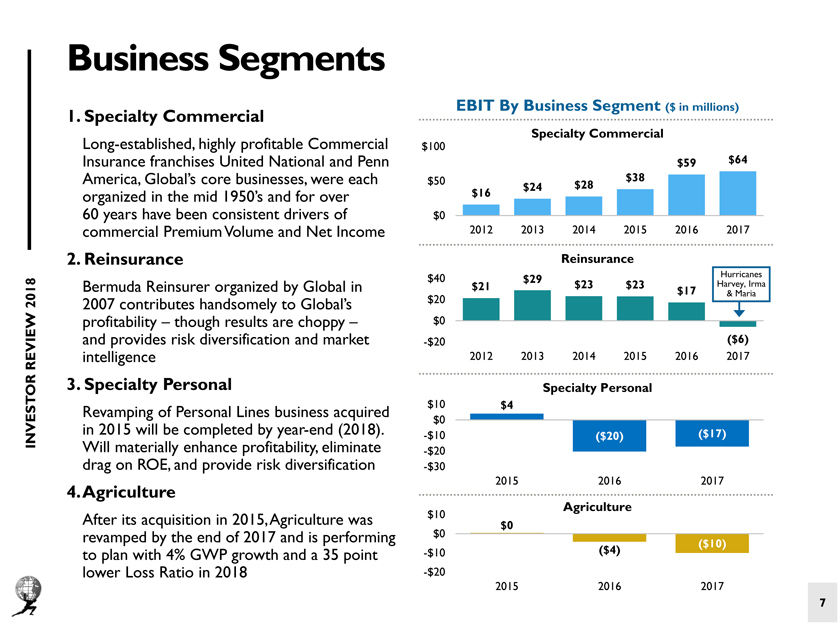
Business Segments EBIT By Business Segment ($ in millions) 1. Specialty Commercial Specialty Commercial Long-established, highly profitable Commercial $100 Insurance franchises United National and Penn $59 $64 America, Global’s core businesses, were each $50 $38 $24 $28 organized in the mid 1950’s and for over $16 60 years have been consistent drivers of $0 commercial Premium Volume and Net Income 2012 2013 2014 2015 2016 2017 2. Reinsurance Reinsurance $40 $29 Hurricanes Bermuda Reinsurer organized by Global in $21 $23 $23 Harvey, Irma $17 & Maria 2018 2007 contributes handsomely to Global’s $20 profitability – though results are choppy – $0 and provides risk diversification and market -$20 ($6) REVIEW intelligence 2012 2013 2014 2015 2016 2017 3. Specialty Personal Specialty Personal Revamping of Personal Lines business acquired $10 $4 $0 INVESTOR in 2015 will be completed by year-end (2018). -$10 ($20) ($17) Will materially enhance profitability, eliminate -$20 drag on ROE, and provide risk diversification -$30 2015 2016 2017 4. Agriculture Agriculture After its acquisition in 2015, Agriculture was $10 $0 revamped by the end of 2017 and is performing $0 ($10) to plan with 4% GWP growth and a 35 point -$10 ($4) lower Loss Ratio in 2018 -$20 2015 2016 2017 7
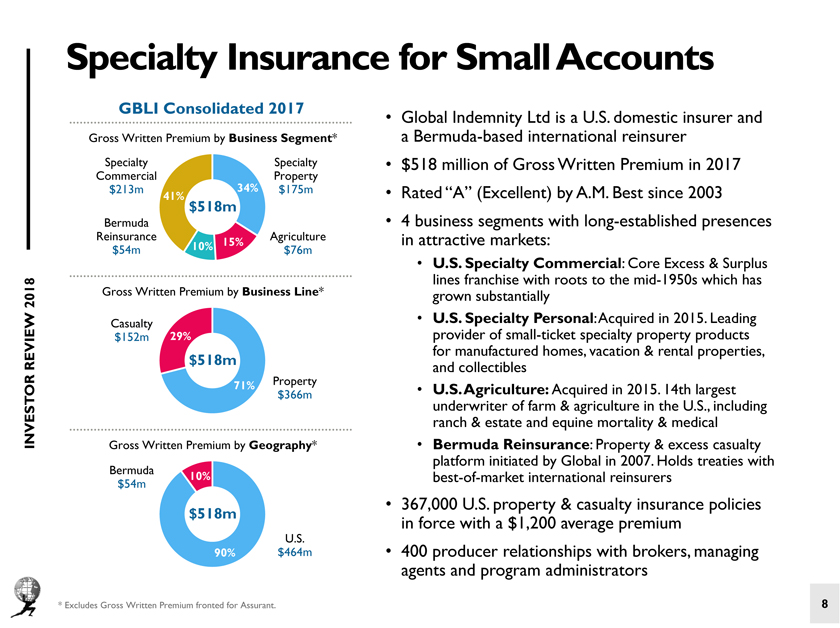
Specialty Insurance for Small Accounts GBLI Consolidated 2017 • Global Indemnity Ltd is a U.S. domestic insurer and Gross Written Premium by* Segment Business a Bermuda -based international reinsurer Specialty Specialty • $518 million of Gross Written Premium in 2017 Commercial Property $213m 34% $175m • Rated “A” (Excellent) by A.M. Best since 2003 41% $518m Bermuda • 4 business segments with long-established presences Reinsurance Agriculture in attractive markets: 10% 15% $54m $76m • U.S. Specialty Commercial : Core Excess & Surplus Gross Written Premium by Business Line* lines franchise with roots to the mid-1950s which has 2018 grown substantially • U.S. Specialty Personal : Acquired in 2015. Leading Casualty $152m 29% provider of small-ticket specialty property products for manufactured homes, vacation & rental properties, REVIEW $518m and collectibles 71% Property $366m • U.S. Agriculture: Acquired in 2015. 14th largest underwriter of farm & agriculture in the U.S., including ranch & estate and equine mortality & medical INVESTOR Gross Written Premium by Geography * • Bermuda Reinsurance : Property & excess casualty platform initiated by Global in 2007. Holds treaties with Bermuda 10% best-of-market international reinsurers $54m • 367,000 U.S. property & casualty insurance policies $518m in force with a $1,200 average premium U.S. 90% $464m • 400 producer relationships with brokers, managing agents and program administrators * Excludes Gross Written Premium fronted for Assurant. 8
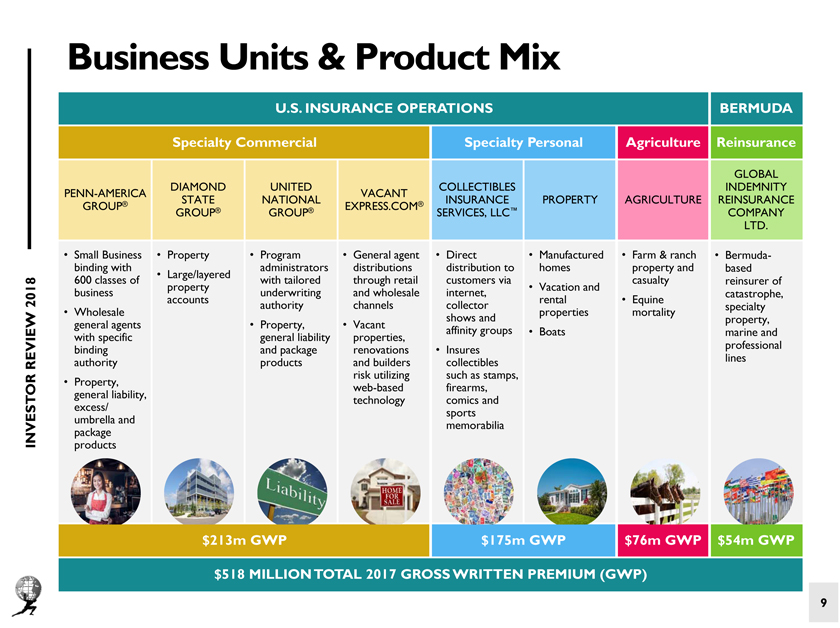
Business Units & Product Mix U.S. INSURANCE OPERATIONS BERMUDA Specialty Commercial Specialty Personal Agriculture Reinsurance GLOBAL DIAMOND UNITED COLLECTIBLES INDEMNITY PENN-AMERICA VACANT ® STATE NATIONAL ® INSURANCE PROPERTY AGRICULTURE REINSURANCE GROUP ® ® EXPRESS. COM ™ GROUP GROUP SERVICES, LLC COMPANY LTD. • Small Business • Property • Program • General agent • Direct • Manufactured • Farm & ranch • Bermuda -binding with administrators distributions distribution to homes property and based • Large/layered 600 classes of with tailored through retail customers via casualty reinsurer of property • Vacation and business underwriting and wholesale internet, catastrophe, 2018 accounts rental • Equine authority channels collector specialty • Wholesale properties mortality shows and property, general agents • Property, • Vacant affinity groups • Boats marine and with specific general liability properties, binding and package renovations • Insures professional REVIEW authority products and builders collectibles lines risk utilizing such as stamps, • Property, web-based firearms, general liability, technology comics and excess/ sports umbrella and memorabilia INVESTOR package products $213m GWP $175m GWP $76m GWP $54m GWP $518 MILLION TOTAL 2017 GROSS WRITTEN PREMIUM (GWP) 9
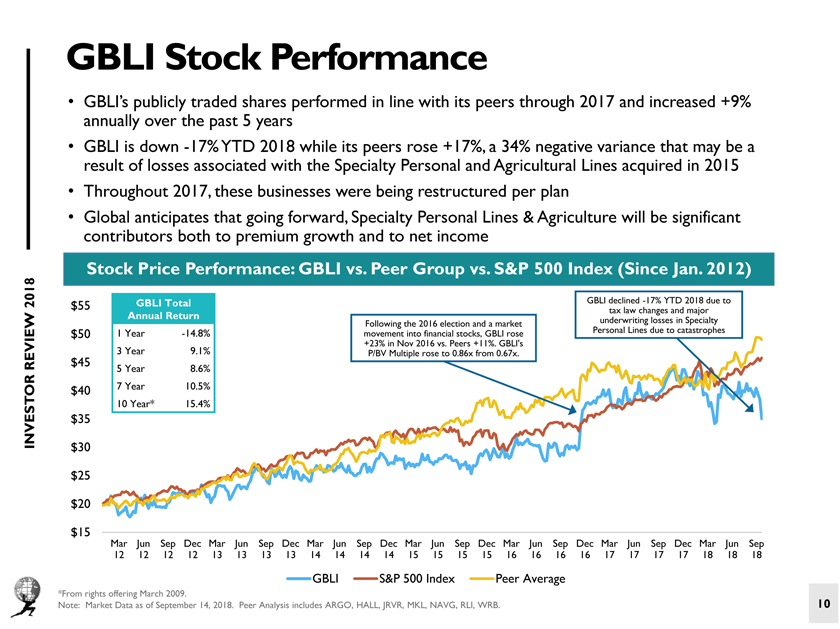
GBLI Stock Performance • GBLI’s publicly traded shares performed in line with its peers through 2017 and increased +9% annually over the past 5 years • GBLI is down -17% YTD 2018 while its peers rose +17%, a 34% negative variance that may be a result of losses associated with the Specialty Personal and Agricultural Lines acquired in 2015 • Throughout 2017, these businesses were being restructured per plan • Global anticipates that going forward, Specialty Personal Lines & Agriculture will be significant contributors both to premium growth and to net income Stock Price Performance: GBLI vs. Peer Group vs. S&P 500 Index (Since Jan. 2012) 2018 $55 GBLI Total GBLI declined -17% YTD 2018 due to AnnualReturn tax law changes and major Following the 2016 election and a market underwriting losses in Specialty $50 1 Year -14.8% movement into financial stocks, GBLI rose Personal Lines due to catastrophes +23% in Nov 2016 vs. Peers +11%. GBLI’s REVIEW $45 3 Year 9.1% P/BV Multiple rose to 0.86x from 0.67x. 5 Year 8.6% $40 7 Year 10.5% 10 Year* 15.4% INVESTOR $35 $30 $25 $20 $15 Mar Jun Sep Dec Mar Jun Sep Dec Mar Jun Sep Dec Mar Jun Sep Dec Mar Jun Sep Dec Mar Jun Sep Dec Mar Jun Sep 12 12 12 12 13 13 13 13 14 14 14 14 15 15 15 15 16 16 16 16 17 17 17 17 18 18 18 GBLI S&P 500 Index Peer Average *From rights offering March 2009. 10 Note: Market Data as of September 14, 2018. Peer Analysis includes ARGO, HALL, JRVR, MKL, NAVG, RLI, WRB.
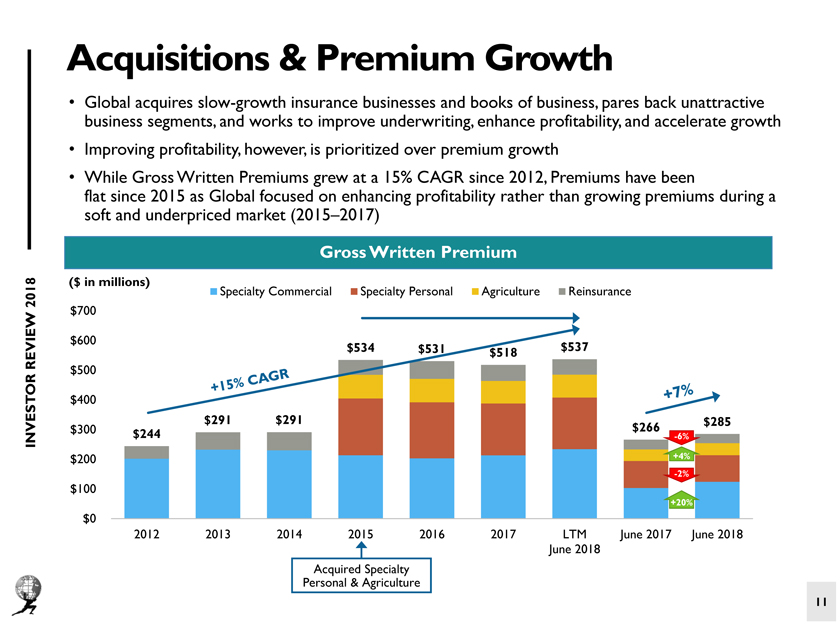
Acquisitions & Premium Growth • Global acquires slow-growth insurance businesses and books of business, pares back unattractive business segments, and works to improve underwriting, enhance profitability, and accelerate growth • Improving profitability, however, is prioritized over premium growth • While Gross Written Premiums grew at a 15% CAGR since 2012, Premiums have been flat since 2015 as Global focused on enhancing profitability rather than growing premiums during a soft and underpriced market (2015–2017) Gross Written Premium ($ in millions) 2018 Specialty Commercial Specialty Personal Agriculture Reinsurance $700 $600 REVIEW $534 $531 $518 $537 $500 $400 $291 $291 $285 $300 $266 INVESTOR $244 -6% $200 +4% -2% $100 +20% $0 2012 2013 2014 2015 2016 2017 LTM June 2017 June 2018 June 2018 Acquired Specialty Personal & Agriculture 11
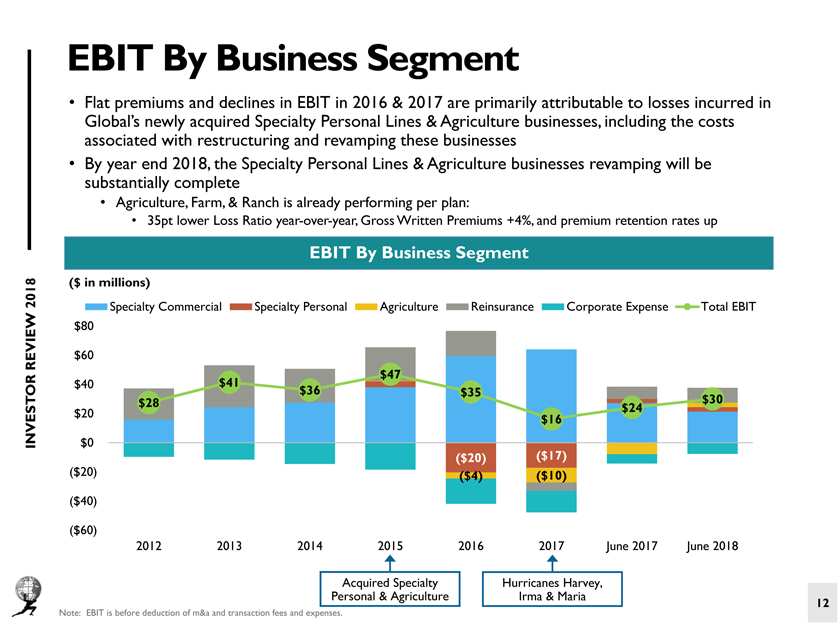
EBIT By Business Segment • Flat premiums and declines in EBIT in 2016 & 2017 are primarily attributable to losses incurred in Global’s newly acquired Specialty Personal Lines & Agriculture businesses, including the costs associated with restructuring and revamping these businesses • By year end 2018, the Specialty Personal Lines & Agriculture businesses revamping will be substantially complete • Agriculture, Farm, & Ranch is already performing per plan: • 35pt lower Loss Ratio year-over-year, Gross Written Premiums +4%, and premium retention rates up EBIT By Business Segment 2018 ($ in millions) Specialty Commercial Specialty Personal Agriculture Reinsurance Corporate Expense Total EBIT $80 REVIEW $60 $41 $47 $40 $36 $35 $28 $30 $20 $16 $24 INVESTOR $0 ($20) ($17) ($20) ($4) ($10) ($40) ($60) 2012 2013 2014 2015 2016 2017 June 2017 June 2018 Acquired Specialty Hurricanes Harvey, Personal & Agriculture Irma & Maria Note: EBIT is before deduction of m&a and transaction fees and expenses. 12
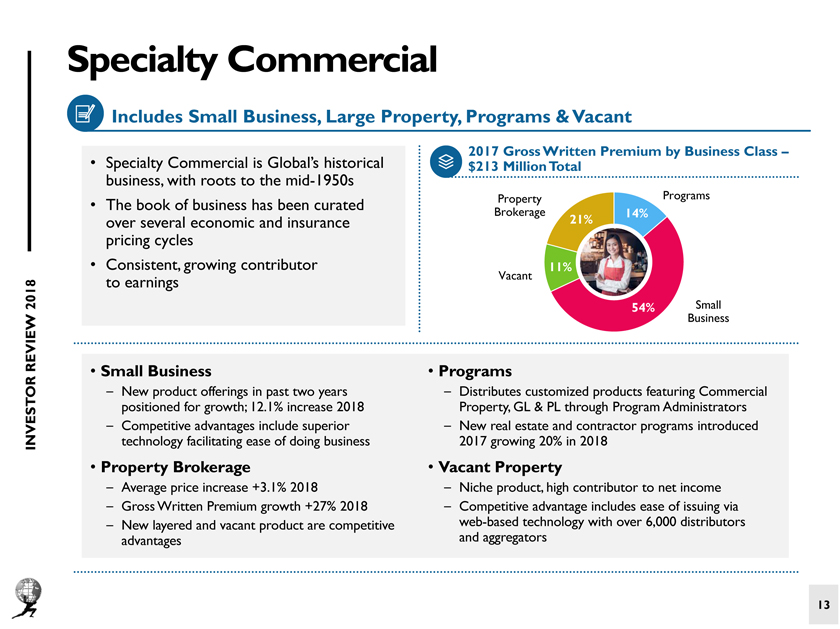
Specialty Commercial Includes Small Business, Large Property, Programs & Vacant 2017 Gross Written Premium by Business Class – • Specialty Commercial is Global’s historical $213 Million Total business, with roots to the mid-1950s Property Programs • The book of business has been curated Brokerage 14% over several economic and insurance 21% pricing cycles • Consistent, growing contributor 11% to earnings Vacant 2018 54% Small REVIEW Business • Small Business • Programs – New product offerings in past two years – Distributes customized products featuring Commercial positioned for growth; 12.1% increase 2018 Property, GL & PL through Program Administrators – Competitive advantages include superior – New real estate and contractor programs introduced INVESTOR technology facilitating ease of doing business 2017 growing 20% in 2018 • Property Brokerage • Vacant Property – Average price increase +3.1% 2018 – Niche product, high contributor to net income – Gross Written Premium growth +27% 2018 – Competitive advantage includes ease of issuing via – New layered and vacant product are competitive web-based technology with over 6,000 distributors advantages and aggregators 13
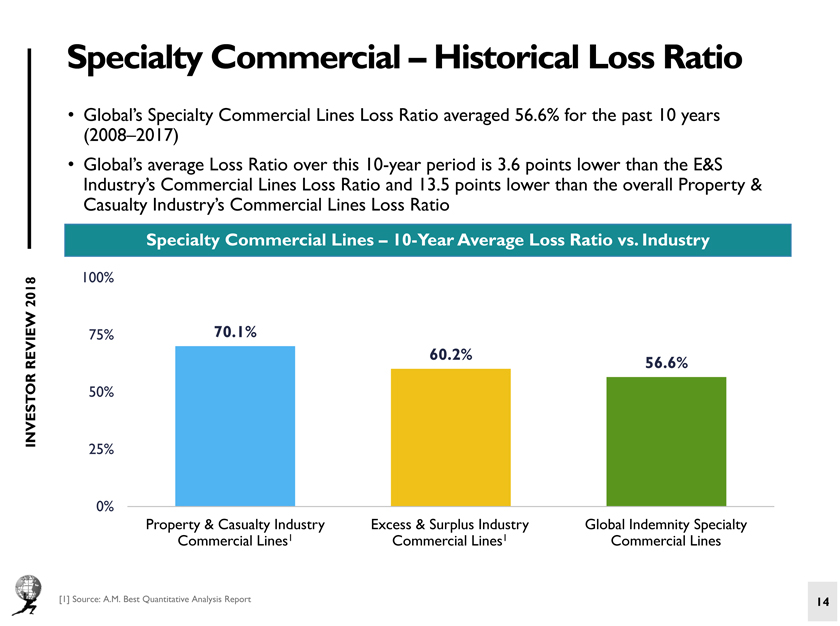
Specialty Commercial – Historical Loss Ratio • Global’s Specialty Commercial Lines Loss Ratio averaged 56.6% for the past 10 years (2008–2017) • Global’s average Loss Ratio over this 10-year period is 3.6 points lower than the E&S Industry’s Commercial Lines Loss Ratio and 13.5 points lower than the overall Property & Casualty Industry’s Commercial Lines Loss Ratio Specialty Commercial Lines –10-Year Average Loss Ratio vs. Industry 100% 2018 75% 70.1% 60.2% REVIEW 56.6% INVESTOR 50% 25% 0% Property & Casualty Industry Excess & Surplus Industry Global Indemnity Specialty Commercial Lines1 Commercial Lines1 Commercial Lines [1] Source: A.M. Best Quantitative Analysis Report 14
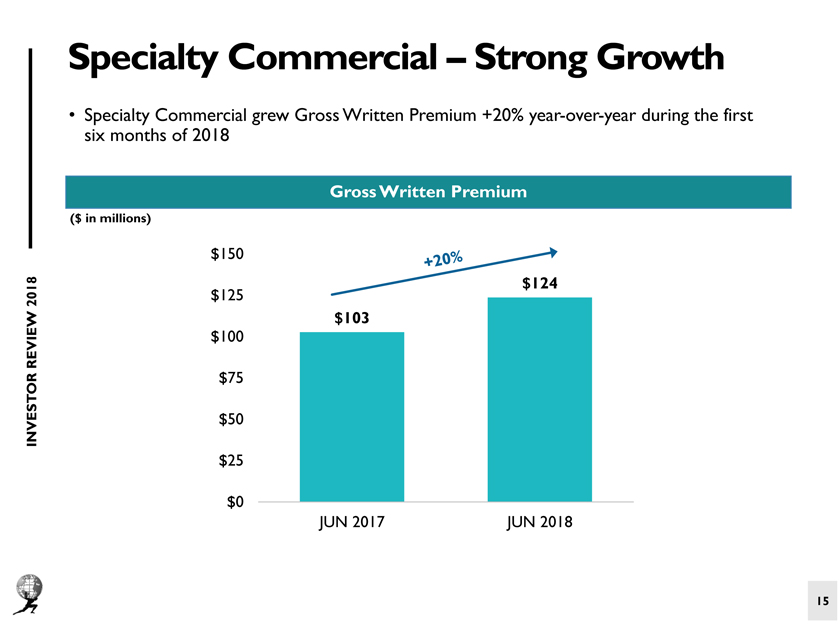
Specialty Commercial – Strong Growth • Specialty Commercial grew Gross Written Premium +20% year-over-year during the first six months of 2018 Gross Written Premium ($ in millions) $150 $124 2018 $125 $103 REVIEW $100 $75 INVESTOR $50 $25 $0 JUN 2017 JUN 2018 15
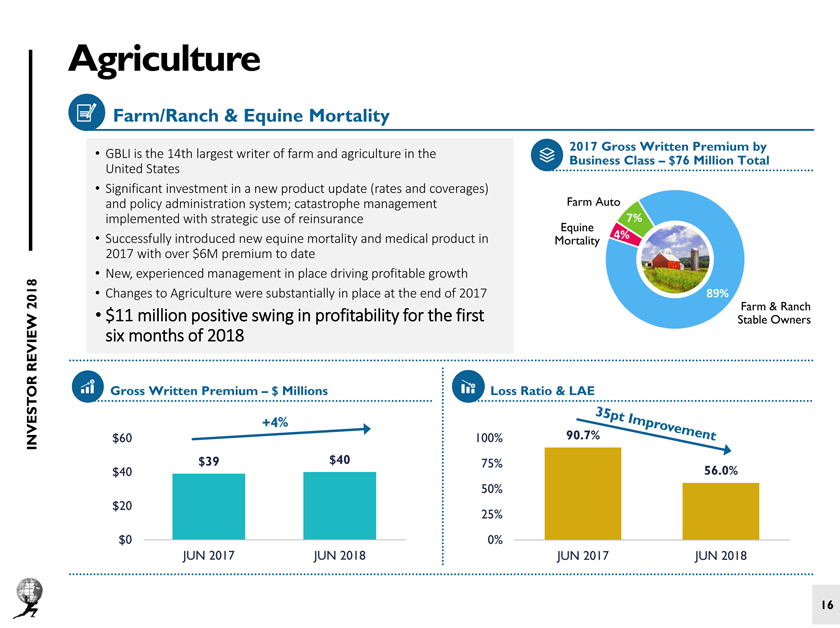
Agriculture Farm/Ranch & Equine Mortality 2017 Gross Written Premium by • GBLI is the 14th largest writer of farm and agriculture in the Business Class –$76 Million Total United States • Significant investment in a new product update (rates and coverages) and policy administration system; catastrophe management Farm Auto implemented with strategic use of reinsurance 7% Equine • Successfully introduced new equine mortality and medical product in Mortality 4% 2017 with over $6M premium to date • New, experienced management in place driving profitable growth 2018 • Changes to Agriculture were substantially in place at the end of 2017 89% Farm & Ranch • $11 million positive swing in profitability for the first Stable Owners REVIEW six months of 2018 Gross Written Premium –$ Millions Loss Ratio & LAE INVESTOR $60 100% 90.7% $39 $40 75% $40 56.0% 50% $20 25% $0 0% JUN 2017 JUN 2018 JUN 2017 JUN 2018 16
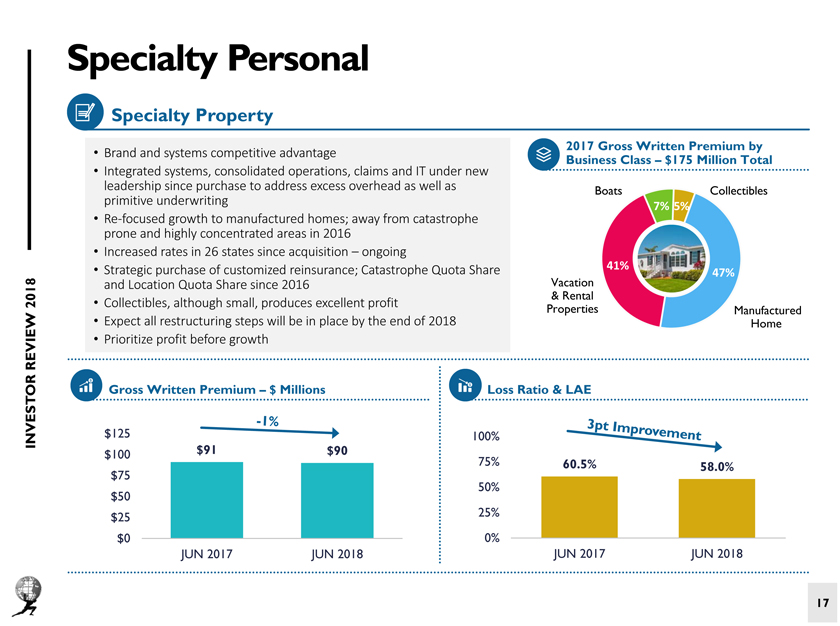
Specialty Personal Specialty Property 2017 Gross Written Premium by • Brand and systems competitive advantage Business Class –$175 Million Total • Integrated systems, consolidated operations, claims and IT under new leadership since purchase to address excess overhead as well as Boats Collectibles primitive underwriting 7% 5% • Re-focused growth to manufactured homes; away from catastrophe prone and highly concentrated areas in 2016 • Increased rates in 26 states since acquisition – ongoing • Strategic purchase of customized reinsurance; Catastrophe Quota Share 41% 47% and Location Quota Share since 2016 Vacation & Rental 2018 • Collectibles, although small, produces excellent profit Properties Manufactured • Expect all restructuring steps will be in place by the end of 2018 Home REVIEW • Prioritize profit before growth Gross Written Premium –$ Millions Loss Ratio & LAE INVESTOR $125 100% $100 $91 $90 75% 60.5% 58.0% $75 50% $50 $25 25% $0 0% JUN 2017 JUN 2018 JUN 2017 JUN 2018 17
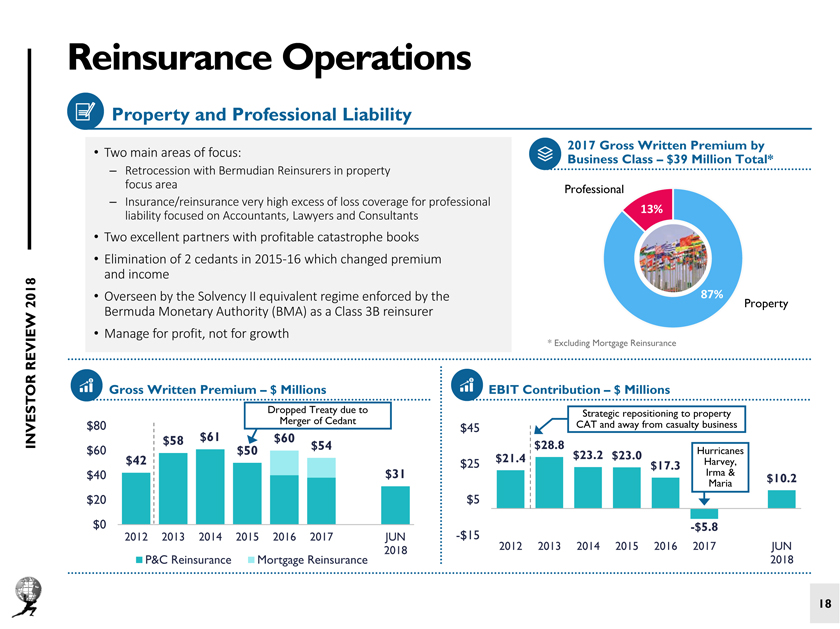
Reinsurance Operations Property and Professional Liability 2017 Gross Written Premium by • Two main areas of focus: Business Class –$39 Million Total* – Retrocession with Bermudian Reinsurers in property focus area Professional – Insurance/reinsurance very high excess of loss coverage for professional 13% liability focused on Accountants, Lawyers and Consultants • Two excellent partners with profitable catastrophe books • Elimination of 2 cedants in 2015-16 which changed premium and income • Overseen by the Solvency II equivalent regime enforced by the 87% 2018 Property Bermuda Monetary Authority (BMA) as a Class 3B reinsurer REVIEW • Manage for profit, not for growth * Excluding Mortgage Reinsurance Gross Written Premium –$ Millions EBIT Contribution –$ Millions Dropped Treaty due to Strategic repositioning to property $80 Merger of Cedant CAT and away from casualty business $45 $58 $61 $60 INVESTOR $54 $28.8 $60 $50 $23.2 $23.0 Hurricanes $42 $25 $21.4 Harvey, $17.3 $40 $31 Irma & Maria $10.2 $20 $5 $0 -$5.8 2012 2013 2014 2015 2016 2017 JUN -$15 2012 2013 2014 2015 2016 2017 JUN 2018 P&C Reinsurance Mortgage Reinsurance 2018 18
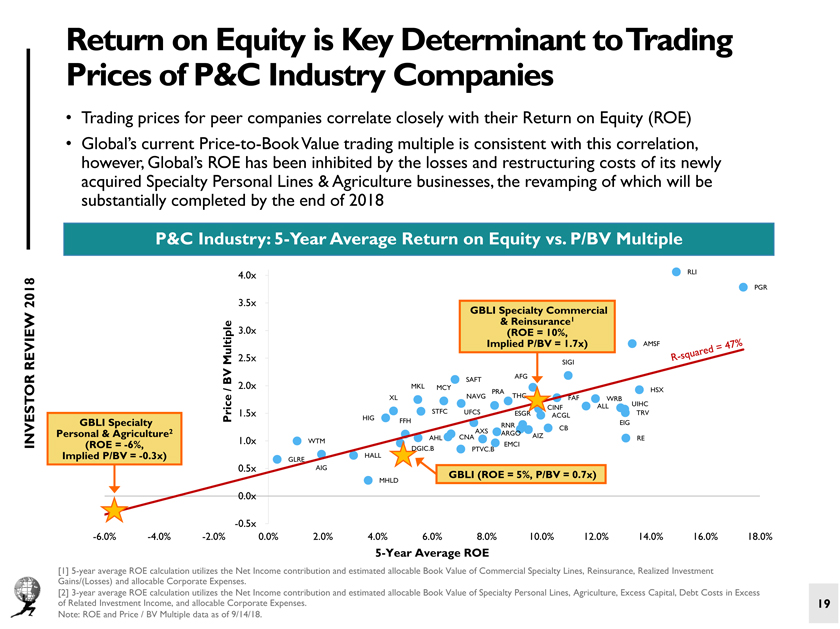
Return on Equity is Key Determinant toTrading Prices of P&C Industry Companies • Trading prices for peer companies correlate closely with their Return on Equity (ROE) • Global’s current Price -to-Book Value trading multiple is consistent with this correlation, however, Global’s ROE has been inhibited by the losses and restructuring costs of its newly acquired Specialty Personal Lines & Agriculture businesses, the revamping of which will be substantially completed by the end of 2018 P&C Industry: 5-Year Average Return on Equity vs. P/BV Multiple 4.0x RLI PGR 2018 3.5x GBLI Specialty Commercial & Reinsurance 1 3.0x (ROE = 10%, Implied P/BV = 1.7x) AMSF Multiple 2.5x SIGI REVIEW AFG BV SAFT / 2.0x MKL MCY PRA HSX NAVG THG XL FAF WRB UIHC CINF ALL 1.5x STFC UFCS ESGR TRV Price HIG ACGL GBLI Specialty FFH EIG RNR CB Personal & Agriculture 2 AXS ARGO AHL CNA AIZ RE INVESTOR (ROE = -6%, 1.0x WTM EMCI HALL DGIC.B PTVC.B Implied P/BV = -0.3x) GLRE 0.5x AIG GBLI (ROE = 5%, P/BV = 0.7x) MHLD 0.0x -0.5x -6.0% -4.0% -2.0% 0.0% 2.0% 4.0% 6.0% 8.0% 10.0% 12.0% 14.0% 16.0% 18.0% 5-Year Average ROE [1] 5-year average ROE calculation utilizes the Net Income contribution and estimated allocable Book Value of Commercial Specialty Lines, Reinsurance, Realized Investment Gains/(Losses) and allocable Corporate Expenses. [2] 3-year average ROE calculation utilizes the Net Income contribution and estimated allocable Book Value of Specialty Personal Lines, Agriculture, Excess Capital, Debt Costs in Excess of Related Investment Income, and allocable Corporate Expenses. 19 Note: ROE and Price / BV Multiple data as of 9/14/18.
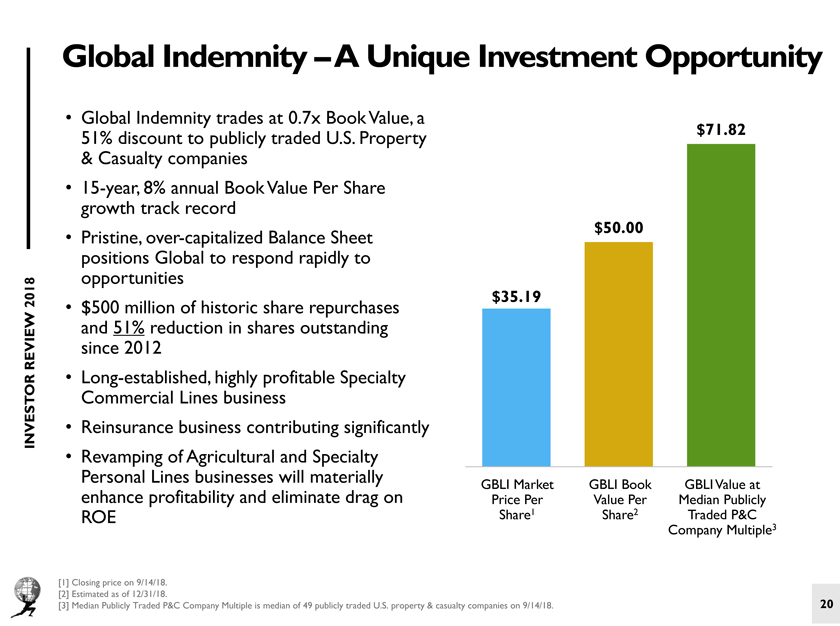
Global Indemnity –A Unique Investment Opportunity • Global Indemnity trades at 0.7x Book Value, a 51% discount to publicly traded U.S. Property $71.82 & Casualty companies • 15-year, 8% annual Book Value Per Share growth track record $50.00 • Pristine, over-capitalized Balance Sheet positions Global to respond rapidly to opportunities 2018 $35.19 • $500 million of historic share repurchases and 51% reduction in shares outstanding REVIEW since 2012 • Long-established, highly profitable Specialty Commercial Lines business INVESTOR • Reinsurance business contributing significantly • Revamping of Agricultural and Specialty Personal Lines businesses will materially GBLI Market GBLI Book GBLI Value at enhance profitability and eliminate drag on Price Per Value Per Median Publicly ROE Share1 Share2 Traded P&C Company Multiple3 [1] Closing price on 9/14/18. [2] Estimated as of 12/31/18. 20 [3] Median Publicly Traded P&C Company Multiple is median of 49 publicly traded U.S. property & casualty companies on 9/14/18.