Attached files
| file | filename |
|---|---|
| EX-32.2 - EX-32.2 - Global Indemnity Group, LLC | d509228dex322.htm |
| EX-32.1 - EX-32.1 - Global Indemnity Group, LLC | d509228dex321.htm |
| EX-31.2 - EX-31.2 - Global Indemnity Group, LLC | d509228dex312.htm |
| EX-31.1 - EX-31.1 - Global Indemnity Group, LLC | d509228dex311.htm |
| EX-23.1 - EX-23.1 - Global Indemnity Group, LLC | d509228dex231.htm |
| EX-21.1 - EX-21.1 - Global Indemnity Group, LLC | d509228dex211.htm |
| EX-10.41 - EX-10.41 - Global Indemnity Group, LLC | d509228dex1041.htm |
Table of Contents
UNITED STATES
SECURITIES AND EXCHANGE COMMISSION
Washington, D.C. 20549
FORM 10-K
| ☒ | ANNUAL REPORT PURSUANT TO SECTION 13 OR 15(d) OF THE SECURITIES EXCHANGE ACT OF 1934 |
For the Fiscal Year Ended December 31, 2017
OR
| ☐ | TRANSITION REPORT PURSUANT TO SECTION 13 OR 15(d) OF THE SECURITIES EXCHANGE ACT OF 1934 |
For the Transition Period from to
001-34809
Commission File Number
GLOBAL INDEMNITY LIMITED
(Exact name of registrant as specified in its charter)
| Cayman Islands | 98-1304287 | |
| (State or other jurisdiction of incorporation or organization) |
(I.R.S. Employer Identification No.) |
27 HOSPITAL ROAD
GEORGE TOWN, GRAND CAYMAN
KY1-9008
CAYMAN ISLANDS
(Address of principal executive office including zip code)
Registrant’s telephone number, including area code: (345) 949-0100
SECURITIES REGISTERED PURSUANT TO SECTION 12(b) OF THE ACT:
| Title of Each Class |
Name of Exchange on Which Registered | |
| A Ordinary shares, $0.0001 Par Value 7.75% Subordinated Notes due 2045 7.875% Subordinated Notes due 2047 |
The Nasdaq Global Select Market The Nasdaq Global Select Market The Nasdaq Global Select Market |
SECURITIES REGISTERED PURSUANT TO SECTION 12(g) OF THE ACT:
NONE
Indicate by check mark if the registrant is a well-known seasoned issuer, as defined in Rule 405 of the Securities Act. YES ☐ NO ☒
Indicate by check mark if the registrant is not required to file reports pursuant to Section 13 or Section 15(d) of the Act. YES ☐ NO ☒
Indicate by check mark whether the registrant (1) has filed all reports required to be filed by Section 13 or 15(d) of the Securities Exchange Act of 1934 during the preceding 12 months (or for such shorter period that the registrant was required to file such reports), and (2) has been subject to such filing requirements for the past 90 days. YES ☒ NO ☐
Indicate by check mark whether the registrant has submitted electronically and posted on its corporate Web site, if any, every Interactive Data File required to be submitted and posted pursuant to Rule 405 of Regulation S-T during the preceding 12 months (or for such shorter period that the registrant was required to submit and post such files). YES ☒ NO ☐
Indicate by check mark if disclosure of delinquent filers pursuant to Item 405 of Regulation S-K is not contained herein, and will not be contained, to the best of registrant’s knowledge, in definitive proxy or information statements incorporated by reference in Part III of this Form 10-K or any amendment to this Form 10-K. ☒
Indicate by check mark whether the registrant is a large accelerated filer, an accelerated filer, a non-accelerated filer, smaller reporting company, or emerging growth company. See definitions of “large accelerated filer,” “accelerated filer,” “smaller reporting company” and “emerging growth company” in Rule 12b-2 of the Exchange Act.:
| Large accelerated filer | ☐; | Accelerated filer | ☒; | |||
| Non-accelerated filer | ☐; | Smaller reporting company | ☐; | |||
| Emerging growth company | ☐ |
If an emerging growth company, indicate by check mark if the registrant has elected not to use the extended transition period for complying with any new or revised financial accounting standards provided pursuant to Section 13(a) of the Exchange Act. ☐
Indicate by check mark whether the registrant is a shell company (as defined in Rule 12b-2 of the Act). YES ☐ NO ☒
The aggregate market value of the common equity held by non-affiliates of the registrant, computed by reference to the price of the registrant’s A ordinary shares as of the last business day of the registrant’s most recently completed second fiscal quarter (based on the last reported sale price on the Nasdaq Global Select Market as of such date), was $334,185,769. There are no B ordinary shares held by non-affiliates of the registrant.
As of February 27, 2018, the registrant had outstanding 10,046,737 A ordinary shares and 4,133,366 B ordinary shares.
DOCUMENTS INCORPORATED BY REFERENCE
Portions of the Registrant’s Proxy Statement relating to the 2017 Annual Meeting of Shareholders to be filed with the SEC within 120 days of the fiscal year ended December 31, 2017 are incorporated by reference into Part III of this report.
Table of Contents
1
Table of Contents
| Item 1. | BUSINESS |
Some of the information contained in this Item 1 or set forth elsewhere in this report, including information with respect to the Company’s plans and strategy, constitutes forward-looking statements that involve risks and uncertainties. Please see “Cautionary Note Regarding Forward-Looking Statements” at the end of Item 7 of Part II and “Risk Factors” in Item 1A of Part I for a discussion of important factors that could cause actual results to differ materially from the results described in or implied by the forward-looking statements contained herein.
References to the Company refer to Global Indemnity Limited and its subsidiaries or, prior to November 7, 2016, to Global Indemnity plc and its subsidiaries.
References to the acquisition of American Reliable refer to the January 1, 2015 acquisition of American Reliable Insurance Company (“American Reliable”).
History
Global Indemnity Limited (“Global Indemnity”) is a holding company formed on February 9, 2016 under the laws of the Cayman Islands. On November 7, 2016, Global Indemnity Limited replaced Global Indemnity plc, an Irish company, as the ultimate parent company pursuant to a scheme of arrangement whereby all of Global Indemnity plc’s A ordinary shares were cancelled and replaced with one A ordinary share of Global Indemnity Limited on a one for one basis and each B ordinary share of Global Indemnity plc was cancelled and replaced with one B ordinary share of Global Indemnity Limited on a one for one basis. Global Indemnity’s A ordinary shares are publicly traded on the NASDAQ Global Select Market under the trading symbol “GBLI.” Please see Note 13 of the notes to consolidated financial statements in Item 8 of Part II of this report for additional information on the cancellation of Global Indemnity plc ordinary shares and the replacement of these shares with ordinary shares of Global Indemnity Limited.
Subsequent to the completion of the redomestication, several of the Company’s subsidiaries, including Global Indemnity plc, were placed into liquidation, liquidated, or merged out of existence. In addition, substantially all of the assets of these companies, including intellectual property, were transferred to Global Indemnity Limited.
On September 30, 2016, one of the Company’s indirect wholly owned subsidiaries, Diamond State Insurance Company, sold all the outstanding shares of capital stock of one of its wholly owned subsidiaries, United National Specialty Insurance Company, to an unrelated party. Diamond State Insurance Company received a one-time payment of $18.7 million and recognized a pretax gain of $6.9 million which is reflected in other income in 2016. This transaction did not have an impact on the Company’s ongoing business operations. Subsequent to the sale, any business previously written by United National Specialty Insurance Company is being written by other companies within the Company’s U.S. Insurance Operations.
On January 1, 2015, Global Indemnity Group, Inc., a subsidiary of the Company, acquired 100% of the voting equity interest of American Reliable Insurance Company from American Bankers Insurance Group, Inc., a subsidiary of Assurant,Inc., by paying $113.7 million in cash and assuming $283.9 million of customary insurance related liabilities, obligations, and mandates. Per the American Reliable Stock Purchase Agreement (“American Reliable SPA”), the ultimate purchase price is subject to (i) accounting procedures that were performed in 2015 to determine GAAP book value and (ii) indemnification on future development on recorded loss and loss adjustment expenses as of December 31, 2014. In accordance with the American Reliable SPA, on the third calendar year following the calendar year of the closing, if loss and loss adjustment expenses for accident years 2014 and prior are lower than recorded unpaid loss and loss adjustment expenses as of December 31, 2014, Global Indemnity Group, Inc. will pay the variance to American Bankers Group, Inc. Conversely, if loss and loss adjustment expenses for accident years 2014 and prior exceed recorded unpaid loss
2
Table of Contents
and loss adjustment expenses as of December 31, 2014, American Bankers Group, Inc. will pay the variance to Global Indemnity Group, Inc. In accordance with a dispute resolution agreement between Global Indemnity Group, Inc. and American Bankers Group, Inc., any variance paid related to the loss indemnification will be subject to interest of 5% compounded semi-annually. The Company’s current estimate of the purchase price, based on available financial information, is approximately $99.8 million. Final settlement of the purchase price occurred in March, 2018. Please see Note 24 of the notes to consolidated financial statements in Item 8 of Part II of this report for additional information on the final settlement of the purchase price.
Please see Note 4 of the notes to consolidated financial statements in Item 8 of Part II of this report for additional information on the acquisition of American Reliable.
General
Global Indemnity provides its insurance products across a distribution network that includes binding authority, program, brokerage, and reinsurance. The Company manages the distribution of these products through three business segments: Commercial Lines offers specialty property and casualty products designed for product lines such as Small Business Binding Authority, Property Brokerage, Vacant Express, and Programs; Personal Lines offers specialty personal lines and agricultural coverage; and Reinsurance Operations provides reinsurance solutions through brokers and primary writers including insurance and reinsurance companies. The Commercial Lines and Personal Lines segments comprise the Company’s U.S. Insurance Operations (“Insurance Operations”).
Business Segments
See Note 20 of the notes to consolidated financial statements in Item 8 of Part II of this report for gross and net premiums written, income and total assets of each operating segment for the years ended December 31, 2017, 2016 and 2015. For a discussion of the variances between years, see “Results of Operations” in Item 7 of Part II of this report.
During the 1st quarter of 2017, the Company re-evaluated its Commercial Lines and Personal Lines segments and determined that certain portions of business will be managed, operated and reported by including them in the other segment. As a result, the composition of the Company’s reportable segments changed slightly. Premium that is written through a wholly owned agency that mainly sells to individuals, which was previously included as part of the Commercial Lines segment, is now included within the Personal Lines segment. In addition, one of the small commercial programs written by American Reliable Insurance Company, which was previously included within the Personal Lines segment, is now aggregated within the Commercial Lines segment. Accordingly, the segment results for 2016 and 2015 have been revised to reflect these changes.
Personal Lines
The Company’s Personal Lines distribute property and casualty insurance products and operate primarily in the admitted markets. In the standard property and casualty insurance market, insurance rates and forms are highly regulated; products and coverage are largely uniform and have relatively predictable exposures. In the standard market, policies must be written by insurance companies that are admitted to transact business in the state in which the policy is issued. As a result, in the standard property and casualty insurance market, insurance companies tend to compete for customers primarily on the basis of price, coverage, value-added service, and financial strength.
The Company’s Personal Lines writes specialty products such as agriculture, mobile homes, manufactured homes, homeowners, collectibles, and watersports via American Reliable. These products are distributed through retail agents, wholesale general agents, and brokers. The insurance products are either underwritten via specific binding authority or by internal personnel.
See “Underwriting” below for additional discussion on how the Company’s insurance products are underwritten.
3
Table of Contents
In 2017 and 2016, gross premiums written for the Personal Lines were $249.8 million and $302.9 million, respectively, and includes business written by American Reliable that is ceded to insurance companies owned by Assurant under a 100% quota share reinsurance agreement in the amount of ($1.3) million and $35.3 million, respectively.
Commercial Lines
The Company’s Commercial Lines distribute property and casualty insurance products and operate predominantly in the excess and surplus lines marketplace. The excess and surplus lines market differs significantly from the standard property and casualty insurance market.
The excess and surplus lines market provides coverage for businesses that often do not fit the underwriting criteria of an insurance company operating in the standard markets due to their relatively greater unpredictable loss patterns and unique niches of exposure requiring rate and policy form flexibility. Without the excess and surplus lines market, certain businesses would have to self-insure their exposures, or seek coverage outside the U.S. market.
Competition in the excess and surplus lines market tends to focus less on price and more on availability, service, and other considerations. While excess and surplus lines market exposures may have higher perceived insurance risk than their standard market counterparts, excess and surplus lines market underwriters historically have been able to generate underwriting profitability superior to standard market underwriters.
A portion of the Company’s Commercial Lines is written on a specialty admitted basis. When writing on a specialty admitted basis, the Company’s focus is on writing insurance for insureds that engage in similar but often highly specialized types of activities. The specialty admitted market is subject to greater state regulation than the surplus lines market, particularly with regard to rate and form filing requirements and the ability to enter and exit lines of business. Insureds purchasing coverage from specialty admitted insurance companies do so because the insurance product is not otherwise available from standard market insurers. Yet, for regulatory or marketing reasons, these insureds require products that are written by an admitted insurance company.
The Commercial Lines’ insurance products target specific, defined groups of insureds with customized coverage to meet their needs. To manage operations, the Commercial Lines segment differentiates its products by product classification. These product classifications are as follows:
| • | Penn-America Group distributes property and general liability products for small commercial businesses through a select network of wholesale general agents with specific binding authority; |
| • | United National Group distributes property, general liability, and professional lines products through program administrators with specific binding authority; and |
| • | Diamond State Group distributes property, casualty, and professional lines products through wholesale brokers that are underwritten by the Company’s personnel and selected brokers with specific binding authority. |
| • | Vacant Express primarily distributes products for dwellings which are currently vacant, undergoing renovations, or are under construction through aggregators, brokers, and retail agents. |
These product classifications comprise the Commercial Lines business segment and are not considered individual business segments because each product has similar economic characteristics, distribution, and coverage.
The Company’s Commercial Lines provide property, casualty, and professional liability products utilizing customized guidelines, rates, and forms tailored to the Company’s risk and underwriting philosophy. See “Underwriting” below for a discussion on how the Company’s insurance products are underwritten.
4
Table of Contents
In 2017, gross premiums written for the Commercial Lines were $212.7 million compared to $203.1 million for 2016. For 2017, surplus lines business accounts for approximately 83.7% of the business written while specialty admitted business accounts for the remaining 16.3%.
Reinsurance Operations
Global Indemnity Reinsurance Company, Ltd. (“Global Indemnity Reinsurance”), a direct subsidiary of the Company, is a Bermuda based treaty reinsurer of specialty property and casualty insurance and reinsurance companies. The Company’s Reinsurance Operations segment provides reinsurance solutions through brokers and primary writers including insurance and reinsurance companies, and consists solely of the operations of Global Indemnity Reinsurance.
The reinsurance markets face many of the same issues confronted in the primary insurance markets including excess capital capacity, low investment returns and increased pressure on generating acceptable return on investment.
The increased availability of capacity in the market has continued to put pressure on pricing levels and new opportunities. Global Indemnity Reinsurance is focused on using its capital capacity to write catastrophe-oriented placements and other niche or specialty-focused excess of loss contracts meeting the Company’s risk tolerance and return thresholds.
In 2017, gross premiums written from third parties were $53.9 million compared to $59.8 million for 2016.
Products and Product Development
The Company’s U.S. Insurance Operations distribute property and casualty insurance products. Its Personal Lines operate primarily in the admitted marketplace; whereas, its Commercial Lines operate predominantly in the excess and surplus lines marketplace. To manage its operations, the Company seeks to differentiate its products by product classification. See “Personal Lines” and “Commercial Lines” above for a description of these product classifications. The U.S. Insurance Operations are licensed to write on a surplus lines (non-admitted) basis and/or an admitted basis in all 50 U.S. States, the District of Columbia, Puerto Rico, and the U.S. Virgin Islands, which provides the Company with flexibility in designing products and programs, and in determining rates to meet emerging risks and discontinuities in the marketplace.
The Company’s Reinsurance Operations offer third party treaty reinsurance for specialty property and casualty insurance and reinsurance companies as well as professional liability products to companies. The Company’s Reinsurance Operations also provide reinsurance to its Insurance Operations in the form of quota share arrangements. As a result of the enactment of the Tax Cuts and Jobs Act (“TCJA”), effective January 1, 2018, premiums being ceded under the quota share arrangement may potentially be subject to a 10% base erosion minimum tax (“BEAT”). As a result, Global Indemnity Reinsurance and the Company’s U.S. insurance companies have agreed to terminate the quota share arrangement effective January 1, 2018. Regulatory approval is still pending.
5
Table of Contents
Geographic Concentration
The following table sets forth the geographic distribution of gross premiums written for the periods indicated:
| For the Years Ended December 31, | ||||||||||||||||||||||||
| (Dollars in thousands) | 2017 | 2016 | 2015 | |||||||||||||||||||||
| Amount | Percent | Amount | Percent | Amount | Percent | |||||||||||||||||||
| California |
$ | 58,669 | 11.4 | % | $ | 62,010 | 11.0 | % | $ | 56,142 | 9.5 | % | ||||||||||||
| Texas |
44,420 | 8.6 | 48,183 | 8.5 | 52,913 | 9.0 | ||||||||||||||||||
| Florida |
36,922 | 7.1 | 36,683 | 6.5 | 37,725 | 6.5 | ||||||||||||||||||
| Louisiana |
25,121 | 4.9 | 28,437 | 5.0 | 28,274 | 4.8 | ||||||||||||||||||
| New York |
24,317 | 4.7 | 26,040 | 4.6 | 28,329 | 4.8 | ||||||||||||||||||
| Arizona |
20,593 | 4.0 | 19,883 | 3.5 | 21,199 | 3.6 | ||||||||||||||||||
| North Carolina |
18,476 | 3.6 | 21,613 | 3.8 | 26,245 | 4.4 | ||||||||||||||||||
| Massachusetts |
14,909 | 2.9 | 14,352 | 2.5 | 15,352 | 2.6 | ||||||||||||||||||
| Georgia |
12,669 | 2.5 | 13,605 | 2.4 | 14,364 | 2.4 | ||||||||||||||||||
| New Jersey |
12,541 | 2.4 | 14,797 | 2.6 | 16,602 | 2.8 | ||||||||||||||||||
|
|
|
|
|
|
|
|
|
|
|
|
|
|||||||||||||
| Subtotal |
268,637 | 52.1 | 285,603 | 50.4 | 297,145 | 50.4 | ||||||||||||||||||
| All other states |
193,810 | 37.5 | 220,405 | 39.0 | 243,355 | 41.2 | ||||||||||||||||||
| Reinsurance Operations |
53,887 | 10.4 | 59,837 | 10.6 | 49,733 | 8.4 | ||||||||||||||||||
|
|
|
|
|
|
|
|
|
|
|
|
|
|||||||||||||
| Total |
$ | 516,334 | 100.0 | % | $ | 565,845 | 100.0 | % | $ | 590,233 | 100.0 | % | ||||||||||||
|
|
|
|
|
|
|
|
|
|
|
|
|
|||||||||||||
Marketing and Distribution
The Company provides its insurance products across a full distribution network — binding authority, program, brokerage, direct, and reinsurance. For its binding authority and program product classifications, the Company distributes its insurance products primarily through a group of wholesale general agents and program administrators that have specific quoting and binding authority. For its brokerage business, the Company distributes its insurance products through wholesale insurance brokers who in turn sell the Company’s insurance products to insureds through retail insurance brokers. For its reinsurance business, the Company distributes its products through brokers and on a direct basis.
The Company’s Commercial Lines distributes its insurance products primarily through a group of approximately 120 wholesale general agents and program administrators. Of the Commercial Lines’ non-affiliated professional wholesale general agents and program administrators, the top five accounted for 32.1% of the Commercial Lines’ gross premiums written for the year ended December 31, 2017. One agency represented 10.8% of the Commercial Lines’ gross premiums written.
The Company’s Personal Lines distributes specialty personal and agricultural insurance products through a group of approximately 275 agents, primarily comprised of wholesale general agents. It also distributes its specialty personal insurance products on a retail basis in New Mexico and Arizona. Of the Personal Lines’ non-affiliated professional wholesale general agents and retail agents, the top five accounted for 21.9% of the Personal Lines’ gross premiums written for the year ended December 31, 2017. No one agency represented more than 10% of the Personal Lines’ gross premiums written.
There is no agency which accounts for more than 10% of the Company’s consolidated revenues for the year ended December 31, 2017.
Global Indemnity Reinsurance assumed premiums on four treaties from two cedants which accounted for 90% of the Reinsurance Operations’ 2017 gross premiums written. There is no treaty that accounted for 10% or more of the Company’s consolidated revenues for the year ended December 31, 2017.
6
Table of Contents
The Company’s primary distribution strategy is to seek to maintain strong relationships with a limited number of high-quality wholesale professional general agents and wholesale insurance brokers. The Company carefully selects distribution sources based on their expertise, experience and reputation. The Company believes that its distribution strategy enables it to effectively access numerous markets through the marketing, underwriting, and administrative support of the Company’s professional general agencies and wholesale insurance brokers. The Company believes these wholesale general agents and wholesale insurance brokers have local market knowledge and expertise that enables them to access business in these markets more effectively.
Underwriting
For Commercial Lines, the Company’s insurance products are primarily underwritten via specific binding authority in which the Company grants underwriting authority to its wholesale general agents and program administrators and via brokerage in which the Company’s internal personnel underwrites business submitted by wholesale insurance brokers.
For Personal Lines, the Company’s insurance products are distributed through retail agents, wholesale general agents, and brokers. The insurance products are either underwritten via specific binding authority or by internal personnel. Some of the Company’s specialized property business is submitted by retail agents or directly from insureds and is also underwritten by internal personnel.
Specific Binding Authority — Several of the Company’s wholesale general agents, retail agents, and program administrators for both Commercial Lines and Personal Lines have specific quoting and binding authority with respect to the lines they write and some have limited quoting and binding authority with respect to multiple products.
The Company’s wholesale general agents, retail agents, and program administrators will either utilize company administered policy systems with the Company’s underwriting guidelines embedded within the system or the agents will use their own proprietary systems. When the agents use their own proprietary systems, the Company provides its wholesale general agents, retail agents, and program administrators with a comprehensive, regularly updated underwriting manual that specifically outlines risk eligibility which is developed based on the type of insured, nature of exposure and overall expected profitability. This manual also outlines (a) premium pricing, (b) underwriting guidelines, including but not limited to policy forms, terms and conditions, and (c) policy issuance instructions.
The Company’s wholesale general agents, retail agents, and program administrators are appointed to underwrite submissions received in accordance with the Company’s underwriting manual. Risks that are not within the specific binding authority must be submitted to the Company’s underwriting personnel directly for underwriting review and approval or denial of the application of the insured. The Company’s wholesale general agents provide all policy issuance services in accordance with the Company’s underwriting manuals.
Agricultural partners are not provided with underwriting manuals. Rather, they are provided with letters of authority; whereby, policies and endorsement issuance rights are extended.
The Company regularly monitors the underwriting quality of its wholesale general agents, retail agents, and program administrators through a disciplined system of controls, which includes the following:
| • | automated system criteria edits and exception reports; |
| • | individual policy reviews to measure adherence to the Company’s underwriting manual including: risk selection, underwriting compliance, policy issuance and pricing; |
| • | periodic on-site comprehensive audits to evaluate processes, controls, profitability and adherence to all aspects of the Company’s underwriting manual including: risk selection, underwriting compliance, policy issuance and pricing; |
7
Table of Contents
| • | internal quarterly actuarial analysis of loss ratios produced by business underwritten by the Company’s wholesale general agents, retail agents, and program administrators; and |
| • | internal quarterly analysis of financial results, including premium growth and overall profitability of business produced by the Company’s wholesale general agents, retail agents, and program administrators. |
The Company provides incentives to certain of its wholesale general agents and program administrators to produce profitable business through contingent profit commission structures that are tied directly to the achievement of profitability targets.
Brokerage — The wholesale insurance brokers are within the Company’s Commercial Lines and are subject to the same guidelines and monitoring as discussed above. The majority of the Company’s wholesale insurance brokers do not have specific binding authority; therefore, these risks are submitted to the Company’s underwriting personnel for review and processing. There is only one wholesale insurance broker with specific binding authority.
The Company provides its underwriters with a comprehensive, regularly updated underwriting manual that outlines risk eligibility which is developed based on the type of insured, nature of exposure and overall expected profitability. This manual also outlines (a) premium pricing, (b) underwriting guidelines, including but not limited to policy forms, terms and conditions.
The Company’s underwriting personnel review submissions, issue all quotes and perform all policy issuance functions. The Company regularly monitors the underwriting quality of its underwriters through a disciplined system of controls, which includes the following:
| • | individual policy reviews to measure the Company’s underwriters’ adherence to the underwriting manual including: risk selection, underwriting compliance, policy issuance and pricing; |
| • | periodic underwriting review to evaluate adherence to all aspects of the Company’s underwriting manual including: risk selection, underwriting compliance, policy issuance and pricing; |
| • | internal quarterly actuarial analysis of loss ratios produced by business underwritten by the Company’s underwriters; and |
| • | internal quarterly analysis of financial results, including premium growth and overall profitability of business produced by the Company’s underwriters. |
Reinsurance — The Company’s Global Indemnity Reinsurance subsidiary primarily offers retrocessional coverage to Bermuda based reinsurance companies. The business assumed is primarily quota share treaties on property catastrophe, marine business and mortgage insurance. The Company also writes a small amount of professional lines excess liability business. Prior to entering into any agreement, the Company evaluates a number of factors for each cedent including, but not limited to, reputation and financial condition, underwriting and claims practices and historical claims experience. The Company also models proposed treaties for both the catastrophe exposure and the marginal impact on the Company’s existing catastrophe portfolio.
Contingent Commissions
Certain professional general agencies of the U.S. Insurance Operations are paid special incentives, referred to as contingent commissions, when results of business produced by these agencies are more favorable than predetermined thresholds. Similarly, in some circumstances, companies that cede business to the Reinsurance Operations are paid a profit commission based on the profitability of the ceded portfolio. These commissions are charged to other underwriting expenses when incurred.
8
Table of Contents
Pricing
Actuaries establish pricing tailored to each specific product the Company underwrites, taking into account historical loss experience, historical rate level changes, property catastrophe modeling output, and individual risk and coverage characteristics. The Company generally uses the actuarial loss costs promulgated by the Insurance Services Office as a benchmark in the development of pricing for most products. Specific products will utilize proprietary rating when deemed appropriate. The Company will seek to only write business if it believes it can achieve an adequate risk adjusted rate of return.
Reinsurance of Underwriting Risk
The Company’s philosophy is to purchase reinsurance from third parties to limit its liability on individual risks and to protect against property catastrophe and casualty clash losses. Reinsurance assists the Company in controlling exposure to severe losses and protecting capital resources. The type, cost and limits of reinsurance it purchases can vary from year to year based upon the Company’s desired retention levels and the availability of quality reinsurance at an acceptable price. Although reinsurance does not legally discharge an insurer from its primary liability for the full amount of limits on the policies it has written, it does make the assuming reinsurer liable to the insurer to the extent of the insurance ceded. The Company’s reinsurance contracts renew throughout the year and all of its reinsurance is purchased following guidelines established by management. The Company primarily utilizes treaty reinsurance products made up of proportional and excess of loss reinsurance. Additionally, the Company may purchase facultative reinsurance protection on single risks when deemed necessary.
The Company purchases specific types and structures of reinsurance depending upon the characteristics of the lines of business and specialty products underwritten. The Company will typically seek to place proportional reinsurance for umbrella and excess products, certain specialty products, or new products in the development stage. The Company believes that this approach allows it to control net exposure in these product areas most cost effectively.
The Company purchases reinsurance on an excess of loss basis to cover individual risk severity. These structures are utilized to protect the Company’s primary positions on property and casualty products. The excess of loss structures allow the Company to maximize underwriting profits over time by retaining a greater portion of the risk in these products, while helping to protect against the possibility of unforeseen volatility.
The Company analyzes its reinsurance contracts to ensure that they meet the risk transfer requirements of applicable accounting guidance, which requires that the reinsurer must assume significant insurance risk under the reinsured portions of the underlying insurance contracts and that there must be a reasonably possible chance that the reinsurer may realize a significant loss from the transaction.
The Company continually evaluates its retention levels across its entire line of business and specialty product portfolio seeking to ensure that the ultimate reinsurance structures are aligned with the Company’s corporate risk tolerance levels associated with such products. Any decision to decrease the Company’s reliance upon proportional reinsurance or to increase the Company’s excess of loss retentions could increase the Company’s earnings volatility. In cases where the Company decides to increase its excess of loss retentions, such decisions will be a result of a change or progression in the Company’s risk tolerance level. The Company endeavors to purchase reinsurance from financially strong reinsurers with which it has long-standing relationships. In addition, in certain circumstances, the Company holds collateral, including letters of credit, under reinsurance agreements.
The Company’s Insurance Operations’ material reinsurance treaties are as follows:
Property Catastrophe Excess of Loss — The Company’s current property writings create exposure to catastrophic events. To protect against these exposures, the Company purchases a property catastrophe
9
Table of Contents
treaty. Effective June 1, 2017, the Company renewed the top two layers of its property catastrophe excess of loss treaty, which provided occurrence coverage for losses of $260 million in excess of $40 million. The treaty provides for one full reinstatement of coverage at 100% additional premium as to time and pro rata as to the amount of limit reinstated. This replaced the treaty which expired on May 31, 2017 and provided occurrence coverage for losses of $280 million in excess of $20 million. The expiring treaty was made up of three layers: $20 million in excess of $20 million, which the Company participated in 25% of the placement, $60 million in excess of $40 million, and $200 million in excess of $100 million. The expiring treaty provided for one full reinstatement of coverage at 100% additional premium as to time and pro rata as to amount of limit reinstated.
Location-Specific Quota Share — Effective May 1, 2016, the Company entered into an agreement, which is still in effect, to cede 50% of the net underwriting results for certain Personal Lines products in certain states, subject to an occurrence limit of $50 million for property coverages and $1.5 million for casualty coverages.
Catastrophe Quota Share — Effective April 15, 2017, the Company entered into an agreement to cede 50% of its catastrophe losses which are above $3 million, subject to an occurrence limit of $40 million and an aggregate limit of $120 million.
Property Per Risk Excess of Loss — Effective January 1, 2018, the Company renewed its property per risk excess of loss treaty. This treaty provides coverage in two sections: $4 million per risk in excess of $1 million per risk for all business except the Property Brokerage unit, and $8 million per risk in excess of $2 million per risk for Property Brokerage business, of which the Company participated on 25% of the placement. This treaty also provides coverage of $20 million per risk in excess of $10 million per risk and $20 million per risk in excess of $30 million per risk for Property Brokerage business. This replaced the treaty which expired on December 31, 2017 and provided coverage in three sections: 80% of $4 million per risk in excess of $1 million per risk for all business except the Property Brokerage unit and business written by American Reliable, 100% of $4 million per risk in excess of $1 million per risk for American Reliable business, and 75% of $8 million per risk in excess of $2 million per risk for Property Brokerage business. The expiring treaty also provided coverage of 100% of $20 million per risk in excess of $10 million per risk and 100% of $20 million per risk in excess of $30 million per risk for Property Brokerage business.
Casualty and Professional Liability Excess of Loss — Effective October 1, 2016, the Company renewed its casualty and professional liability excess of loss treaty. The casualty section provides coverage for 50% of $2 million per occurrence in excess of $1 million per occurrence for general liability and auto liability. The professional liability section provides coverage for 50% of $4 million per policy/occurrence in excess of $1 million per policy/occurrence. For both sections, allocated loss adjustment expenses are included within limits. This treaty was terminated effective December 31, 2017 and replaced with the Casualty Excess of Loss.
Casualty Clash Excess of Loss — Effective October 1, 2016, the Company renewed its casualty clash excess of loss treaty which provides coverage of $10 million per occurrence in excess of $3 million per occurrence, subject to a $20 million limit for all loss occurrences. This treaty was terminated effective December 31, 2017 and replaced with the Casualty Excess of Loss.
Casualty Excess of Loss — Effective January 1, 2018, the Company entered into a casualty excess of loss treaty which provides coverage of $10 million per occurrence in excess of $2 million per occurrence for all casualty lines of business. The treaty is subject to an aggregate limit of $20 million.
100% Ceded Quota Share to American Bankers — Effective December 1, 2014, American Reliable entered into four treaties to cede 100% of its liabilities related to certain businesses to American Bankers Insurance Company that were not included in the acquisition of American Reliable. These treaties are still in effect at December 31, 2017. American Reliable recorded ceded written premiums of ($1.3) million and $35.3 million, and ceded earned premiums of $13.5 million and $43.2 million to American Bankers Insurance Company for the years ended December 31, 2017 and 2016, respectively.
10
Table of Contents
100% Assumed Quota Share from American Bankers — Effective December 1, 2014, American Reliable entered into two treaties to assume 100% of its liabilities from various insurers owned by Assurant, Inc. for business included in the acquisition but not written directly by American Reliable. These treaties are still in effect at December 31, 2017. American Reliable recorded assumed written premiums of $28.5 million and $38.1 million, and assumed earned premiums of $33.9 million and $55.8 million from insurance companies owned by Assurant, Inc. for the years ended December 31, 2017 and 2016, respectively.
To the extent that there may be an increase or decrease in catastrophe or casualty clash exposure in the future, the Company may increase or decrease its reinsurance protection for these exposures commensurately. There were no other significant changes to any of the Company’s Insurance Operations’ reinsurance treaties during 2017.
The following table sets forth the ten reinsurers for which the Company has the largest reinsurance receivables as of December 31, 2017. Also shown are the amounts of premiums ceded by the Company to these reinsurers during the year ended December 31, 2017.
| (Dollars in millions) | A.M. Best Rating |
Gross Reinsurance Receivables |
Percent of Total |
Ceded Premiums Written |
Percent of Total |
|||||||||||||||
| Munich Re America Corp. |
A+ | $ | 48.2 | 42.2 | % | $ | 25.8 | 39.0 | % | |||||||||||
| General Reinsurance Corp. |
A++ | 11.4 | 10.0 | 7.5 | 11.3 | |||||||||||||||
| Transatlantic Reinsurance |
A+ | 8.2 | 7.2 | 1.1 | 1.7 | |||||||||||||||
| Westport Insurance Corporation |
A+ | 6.4 | 5.6 | — | — | |||||||||||||||
| Fl Hurricane Cat Fund |
NR | 3.8 | 3.3 | 0.6 | 0.9 | |||||||||||||||
| Scor Switzerland AG |
A- | 2.7 | 2.4 | — | — | |||||||||||||||
| American Bankers Insurance Company |
A | 2.6 | 2.3 | (1.3 | ) | (2.0 | ) | |||||||||||||
| Swiss Reinsurance America Corp. |
A+ | 2.5 | 2.2 | 1.0 | 1.5 | |||||||||||||||
| Everest Reinsurance Company |
A+ | 2.5 | 2.2 | 1.3 | 2.0 | |||||||||||||||
| Hartford Fire Insurance Company |
A+ | 2.2 | 1.8 | — | — | |||||||||||||||
|
|
|
|
|
|
|
|
|
|||||||||||||
| Subtotal |
90.5 | 79.2 | 36.0 | 54.4 | ||||||||||||||||
| All other reinsurers |
23.8 | 20.8 | 30.2 | 45.6 | ||||||||||||||||
|
|
|
|
|
|
|
|
|
|||||||||||||
| Total reinsurance receivables before purchase accounting adjustments and allowance for uncollectible reinsurance |
114.3 | 100.0 | % | $ | 66.2 | 100.0 | % | |||||||||||||
|
|
|
|
|
|
|
|
|
|||||||||||||
| Purchase accounting adjustments and allowance for uncollectible reinsurance |
(9.2 | ) | ||||||||||||||||||
|
|
|
|||||||||||||||||||
| Total receivables, net of purchase accounting adjustments and allowance for uncollectible reinsurance |
105.1 | |||||||||||||||||||
| Collateral held in trust from reinsurers |
6.6 | |||||||||||||||||||
|
|
|
|||||||||||||||||||
| Net receivables |
$ | 111.7 | ||||||||||||||||||
|
|
|
|||||||||||||||||||
At December 31, 2017, the Company carried reinsurance receivables, net of collateral held in trust, of $111.7 million. This amount is net of a purchase accounting adjustment and an allowance for uncollectible reinsurance receivables. The purchase accounting adjustment resulted from the Company’s acquisition of Wind River Investment Corporation on September 5, 2003 and is related to discounting the acquired loss reserves to their present value and applying a risk margin to the discounted reserves. This adjustment was $1.2 million at December 31, 2017. The allowance for uncollectible reinsurance receivables was $8.0 million at December 31, 2017.
Historically, there have been insolvencies following a period of competitive pricing in the industry. While the Company has recorded allowances for reinsurance receivables based on currently available information,
11
Table of Contents
conditions may change or additional information might be obtained that may require the Company to record additional allowances. On a quarterly basis, the Company reviews its financial exposure to the reinsurance market and assesses the adequacy of its collateral and allowance for uncollectible reinsurance. The Company continues to take actions to mitigate its exposure to possible loss.
Claims Management and Administration
The Company’s approach to claims management is designed to investigate reported incidents at the earliest juncture, to select, manage, and supervise all legal and adjustment aspects of claims, including settlement, for the mutual benefit of the Company, its professional general agents, wholesale brokers, reinsurers and insureds. The Company’s professional general agents and wholesale brokers have no authority to settle claims or otherwise exercise control over the claims process, with the exception of one statutory managing general agent and one general agent. The Insurance Operations’ claims management staff supervises or processes all claims. The Company’s Insurance Operations has a formal claims review process, and all claims greater than $200,000 for Personal Lines and $250,000 for Commercial Lines, gross of reinsurance, are reviewed by senior claims management and certain senior executives. Large loss trends and analysis are reviewed by a Large Loss committee.
To handle claims, the Company’s Insurance Operations utilizes its own in-house claims department as well as third-party claims administrators (“TPAs”) and assuming reinsurers, to whom it delegates limited claims handling authority. The Insurance Operations’ experienced in-house staff of claims management professionals are assigned to one of five dedicated claim units: casualty and automobile claims, latent exposure claims, property claims, TPA oversight, and a wholly owned subsidiary that administers construction defect claims. The dedicated claims units meet regularly to communicate current developments within their assigned areas of specialty.
As of December 31, 2017, the Company had $155.6 million of direct outstanding loss and loss adjustment expense case reserves at its Insurance Operations. Claims relating to approximately 91% of those reserves are handled by in-house claims management professionals, while claims relating to approximately 0.3% of those reserves are handled by TPAs, which send the Company detailed financial and claims information on a monthly basis. The Company also individually supervises in-house any significant or complicated TPA handled claims, and conducts on-site audits of material TPAs at least twice a year. Approximately 9% of its reserves are handled by the Company’s assuming reinsurers. The Company reviews and supervises the claims handled by its reinsurers seeking to protect its reputation and minimize exposure.
Reserves for Unpaid Losses and Loss Adjustment Expenses
Applicable insurance laws require the Company to maintain reserves to cover its estimated ultimate losses under insurance policies and reinsurance treaties that it writes and for loss adjustment expenses relating to the investigation and settlement of claims.
The Company establishes loss and loss adjustment expense reserves for individual claims by evaluating reported claims on the basis of:
| • | knowledge of the circumstances surrounding the claim; |
| • | the severity of injury or damage; |
| • | jurisdiction of the occurrence; |
| • | the potential for ultimate exposure; |
| • | litigation related developments; |
| • | the type of loss; and |
12
Table of Contents
| • | the Company’s experience with the insured and the line of business and policy provisions relating to the particular type of claim. |
The Company generally estimates such losses and claims costs through an evaluation of individual reported claims. The Company also establishes reserves for incurred but not reported losses (“IBNR”). IBNR reserves are based in part on statistical information and in part on industry experience with respect to the expected number and nature of claims arising from occurrences that have not been reported. The Company also establishes its reserves based on estimates of future trends in claims severity and other subjective factors. Insurance companies are not permitted to reserve for a catastrophe until it has occurred. Reserves are recorded on an undiscounted basis other than fair value adjustments recorded under purchase accounting. The Company’s Insurance Operations’ reserves are reviewed quarterly by the in-house actuarial staff. Loss reserve estimates for the Company’s Reinsurance Operations are developed by independent, external actuaries; however management is responsible for the final determination of loss reserve selections. The data for this analysis is organized by treaty and treaty year. Reviews for both Insurance Operations and Reinsurance Operations are generally performed both gross and net of reinsurance and ceded reviews are also completed for most reserve categories.
In addition to the Company’s internal reserve analysis, independent external actuaries perform a full, detailed review of the Insurance Operations’ reserves annually. The Company does not rely upon the review by the independent actuaries to develop its reserves; however, the data is used to corroborate the analysis performed by the in-house actuarial staff. The Company’s independent external actuaries also perform a full, detailed review of the Reinsurance Operations’ reserves annually. The results of the detailed reserve reviews by internal and external actuaries are summarized and discussed with the Company’s senior management to determine the best estimate of reserves.
With respect to some classes of risks, the period of time between the occurrence of an insured event and the final resolution of a claim may be many years, and during this period it often becomes necessary to adjust the claim estimates either upward or downward. Certain classes of umbrella and excess liability that the Company underwrites have historically had longer intervals between the occurrence of an insured event, reporting of the claim and final resolution. In such cases, the Company must estimate reserves over long periods of time with the possibility of several adjustments to reserves. Other classes of insurance that the Company underwrites, such as most property insurance, historically have shorter intervals between the occurrence of an insured event, reporting of the claim and final resolution. Reserves with respect to these classes are therefore inherently less likely to be adjusted.
The loss and loss adjustment expense reserving process is intended to reflect the impact of inflation and other factors affecting loss payments by taking into account changes in historical payment patterns and perceived trends. However, there is no precise method for the subsequent evaluation of the adequacy of the consideration given to inflation, or to any other specific factor, or to the way one factor may affect another.
See of the notes to consolidated financial statements in Item 8 of Part II of this report for a reconciliation of the Company’s liability for losses and loss adjustment expenses, net of reinsurance ceded, as well as further discussion surrounding changes to reserves for prior accident years.
Asbestos and Environmental (“A&E”) Exposure
The Company’s environmental exposure arises from the sale of general liability and commercial multi-peril insurance. Currently, the Company’s policies continue to exclude classic environmental contamination claims. However, in some states, the Company is required, depending on the circumstances, to provide coverage for certain bodily injury claims, such as an individual’s exposure to a release of chemicals. The Company has also issued policies that were intended to provide limited pollution and environmental coverage. These policies were specific to certain types of products underwritten by the Company. The Company has also received a number of asbestos-related claims, the majority of which are declined based on well-established exclusions. In establishing
13
Table of Contents
the liability for unpaid losses and loss adjustment expenses related to A&E exposures, management considers facts currently known and the current state of the law and coverage litigations. Estimates of these liabilities are reviewed and updated continually.
Uncertainty remains as to the Company’s ultimate liability for asbestos-related claims due to such factors as the long latency period between asbestos exposure and disease manifestation and the resulting potential for involvement of multiple policy periods for individual claims, the increase in the volume of claims made by plaintiffs who claim exposure but who have no symptoms of asbestos-related disease, and an increase in claims subject to coverage under general liability policies that do not contain aggregate limits of liability.
The liability for unpaid losses and loss adjustment expenses, inclusive of A&E reserves, reflects the Company’s best estimates for future amounts needed to pay losses and related loss adjustment expenses as of each of the balance sheet dates reflected in the financial statements herein in accordance with GAAP. As of December 31, 2017, the Company had $15.8 million of net loss reserves for asbestos-related claims and $14.3 million for environmental claims. The Company attempts to estimate the full impact of the A&E exposures by establishing specific case reserves on all known losses. See Note 11 of the notes to the consolidated financial statements in Item 8 of Part II of this report for tables showing the Company’s gross and net reserves for A&E losses.
In addition to the factors referenced above, establishing reserves for A&E and other mass tort claims involves considerably more judgment than other types of claims due to, among other things, inconsistent court decisions, an increase in bankruptcy filings as a result of asbestos related liabilities, and judicial interpretations that often expand theories of recovery and broaden the scope of coverage.
See Note 11 of the notes to the consolidated financial statements in Item 8 of Part II of this report for the survival ratios on a gross and net basis for the Company’s A&E claims.
Investments
The Company’s investment policy is determined by the Investment Committee of the Board of Directors. The Company engages third-party investment advisors to oversee its investments and to make recommendations to the Investment Committee. The Company’s investment policy allows it to invest in taxable and tax-exempt fixed income investments including corporate bonds as well as publicly traded and private equity investments. With respect to fixed income investments, the maximum exposure per issuer varies as a function of the credit quality of the security. The allocation between taxable and tax-exempt bonds is determined based on market conditions and tax considerations. The maximum allowable investment in equity securities under the Company’s investment policy is 30% of the Company’s GAAP equity, or $215.5 million at December 31, 2017. As of December 31, 2017, the Company had $1,535.4 million of investments and cash and cash equivalent assets, including $140.2 million of equity investments and $77.8 million of limited partnership investments plus a $1.5 million receivable for securities sold.
Insurance company investments must comply with applicable statutory regulations that prescribe the type, quality and concentration of investments. These regulations permit investments, within specified limits and subject to certain qualifications, in federal, state, and municipal obligations, corporate bonds and loans, and preferred and common equity securities.
14
Table of Contents
The following table summarizes by type the estimated fair value of Global Indemnity’s investments and cash and cash equivalents as of December 31, 2017, 2016, and 2015:
| December 31, 2017 | December 31, 2016 | December 31, 2015 | ||||||||||||||||||||||
| (Dollars in thousands) | Estimated Fair Value |
Percent of Total |
Estimated Fair Value |
Percent of Total |
Estimated Fair Value |
Percent of Total |
||||||||||||||||||
| Cash and cash equivalents |
$ | 74,414 | 4.8 | % | $ | 75,110 | 5.0 | % | $ | 67,037 | 4.4 | % | ||||||||||||
|
|
|
|
|
|
|
|
|
|
|
|
|
|||||||||||||
| U.S. treasury and agency obligations |
104,680 | 6.8 | 72,047 | 4.8 | 107,122 | 7.1 | ||||||||||||||||||
| Obligations of states and political subdivisions |
95,114 | 6.2 | 156,446 | 10.4 | 205,240 | 13.5 | ||||||||||||||||||
| Mortgage-backed securities (1) |
149,350 | 9.7 | 88,468 | 5.9 | 159,123 | 10.5 | ||||||||||||||||||
| Asset-backed securities |
203,701 | 13.3 | 233,991 | 15.6 | 260,022 | 17.2 | ||||||||||||||||||
| Commercial mortgage-backed securities |
139,795 | 9.1 | 183,192 | 12.2 | 140,390 | 9.3 | ||||||||||||||||||
| Corporate bonds and loans |
425,410 | 27.8 | 380,027 | 25.3 | 332,111 | 21.9 | ||||||||||||||||||
| Foreign corporate bonds |
123,387 | 8.0 | 125,860 | 8.4 | 102,141 | 6.7 | ||||||||||||||||||
|
|
|
|
|
|
|
|
|
|
|
|
|
|||||||||||||
| Total fixed maturities |
1,241,437 | 80.9 | 1,240,031 | 82.6 | 1,306,149 | 86.2 | ||||||||||||||||||
| Common stock |
140,229 | 9.2 | 120,557 | 8.0 | 110,315 | 7.3 | ||||||||||||||||||
| Other invested assets |
77,820 | 5.1 | 66,121 | 4.4 | 32,592 | 2.1 | ||||||||||||||||||
|
|
|
|
|
|
|
|
|
|
|
|
|
|||||||||||||
| Total investments and cash and cash equivalents (2) |
$ | 1,533,900 | 100.0 | % | $ | 1,501,819 | 100.0 | % | $ | 1,516,093 | 100.0 | % | ||||||||||||
|
|
|
|
|
|
|
|
|
|
|
|
|
|||||||||||||
| (1) | Includes collateralized mortgage obligations of $68,183, $28,608, and $57,330 for 2017, 2016, and 2015, respectively. |
| (2) | Does not include net receivable (payable) for securities sold (purchased) of $1,543, ($3,717), and $172 for 2017, 2016, and 2015, respectively. |
Although the Company generally intends to hold fixed maturities to recovery and/or maturity, the Company regularly re-evaluates its position based upon market conditions. As of December 31, 2017, the Company’s fixed maturities, excluding the mortgage-backed, commercial mortgage-backed and collateralized mortgage obligations, had a weighted average maturity of 4.7 years and a weighted average duration, excluding mortgage-backed, commercial mortgage-backed and collateralized mortgage obligations and including cash and short-term investments, of 2.7 years. The Company’s financial statements reflect a net unrealized loss on fixed maturities available for sale as of December 31, 2017 of $1.7 million on a pre-tax basis.
The following table shows the average amount of fixed maturities, income earned on fixed maturities, and the book yield thereon, as well as unrealized gains for the periods indicated:
| Years Ended December 31, | ||||||||||||
| (Dollars in thousands) | 2017 | 2016 | 2015 | |||||||||
| Average fixed maturities at book value |
$ | 1,242,242 | $ | 1,274,836 | $ | 1,290,641 | ||||||
| Gross income on fixed maturities (1) |
33,020 | 30,337 | 32,091 | |||||||||
| Book yield |
2.66 | % | 2.38 | % | 2.49 | % | ||||||
| Fixed maturities at book value |
$ | 1,243,144 | $ | 1,241,339 | $ | 1,308,333 | ||||||
| Unrealized gain (loss) |
(1,707 | ) | (1,308 | ) | (2,184 | ) | ||||||
| (1) | Represents income earned by fixed maturities, gross of investment expenses and excluding realized gains and losses. |
The Company has sought to structure its portfolio to reduce the risk of default on collateralized commercial real estate obligations and asset-backed securities. Of the $149.4 million of mortgage-backed securities, $81.2 million
15
Table of Contents
is invested in U.S. agency paper and $68.2 million is invested in collateralized mortgage obligations, of which $67.8 million, or 99.4%, are rated AA+ or better. In addition, the Company holds $203.7 million in asset-backed securities, of which 84.0% are rated AA or better and $139.8 million in commercial mortgaged-backed securities, of which 97.6% are rated A- or better. The weighted average credit enhancement for the Company’s asset-backed securities is 23.4. The Company also faces liquidity risk. Liquidity risk is when the fair value of an investment is not able to be realized due to lack of interest by outside parties in the marketplace. The Company attempts to diversify its investment holdings to minimize this risk. The Company’s investment managers run periodic analysis of liquidity costs to the fixed income portfolio. The Company also faces credit risk. 96.5% of the Company’s fixed income securities are investment grade securities. 17.2% of the Company’s fixed maturities are rated AAA. See “Quantitative and Qualitative Disclosures about Market Risk” in Item 7A of Part II of this report for a more detailed discussion of the credit market and the Company’s investment strategy.
The following table summarizes, by Standard & Poor’s rating classifications, the estimated fair value of Global Indemnity’s investments in fixed maturities, as of December 31, 2017 and 2016:
| December 31, 2017 | December 31, 2016 | |||||||||||||||
| (Dollars in thousands) | Estimated Fair Value |
Percent of Total |
Estimated Fair Value |
Percent of Total |
||||||||||||
| AAA |
$ | 213,943 | 17.2 | % | $ | 232,176 | 18.7 | % | ||||||||
| AA |
403,723 | 32.5 | 432,595 | 35.0 | ||||||||||||
| A |
229,381 | 18.5 | 346,606 | 28.0 | ||||||||||||
| BBB |
350,849 | 28.3 | 197,449 | 15.9 | ||||||||||||
| BB |
24,363 | 2.0 | 15,967 | 1.3 | ||||||||||||
| B |
10,730 | 0.9 | 7,866 | 0.6 | ||||||||||||
| CCC |
383 | — | 447 | — | ||||||||||||
| CC |
138 | — | 241 | — | ||||||||||||
| C |
— | — | — | — | ||||||||||||
| Not rated |
7,927 | 0.6 | 6,684 | 0.5 | ||||||||||||
|
|
|
|
|
|
|
|
|
|||||||||
| Total fixed maturities |
$ | 1,241,437 | 100.0 | % | $ | 1,240,031 | 100.0 | % | ||||||||
|
|
|
|
|
|
|
|
|
|||||||||
The following table sets forth the expected maturity distribution of Global Indemnity’s fixed maturities portfolio at their estimated market value as of December 31, 2017 and 2016:
| December 31, 2017 | December 31, 2016 | |||||||||||||||
| (Dollars in thousands) | Estimated Market Value |
Percent of Total |
Estimated Market Value |
Percent of Total |
||||||||||||
| Due in one year or less |
$ | 70,165 | 5.6 | % | $ | 80,982 | 6.5 | % | ||||||||
| Due in one year through five years |
434,078 | 35.0 | 622,926 | 50.2 | ||||||||||||
| Due in five years through ten years |
236,552 | 19.0 | 20,770 | 1.7 | ||||||||||||
| Due in ten years through fifteen years |
2,205 | 0.2 | 3,252 | 0.3 | ||||||||||||
| Due after fifteen years |
5,591 | 0.5 | 6,450 | 0.5 | ||||||||||||
|
|
|
|
|
|
|
|
|
|||||||||
| Securities with fixed maturities |
748,591 | 60.3 | % | 734,380 | 59.2 | % | ||||||||||
| Mortgaged-backed securities |
149,350 | 12.0 | 88,468 | 7.1 | ||||||||||||
| Commercial mortgage-backed securities |
139,795 | 11.3 | 183,192 | 14.8 | ||||||||||||
| Asset-backed securities |
203,701 | 16.4 | 233,991 | 18.9 | ||||||||||||
|
|
|
|
|
|
|
|
|
|||||||||
| Total fixed maturities |
$ | 1,241,437 | 100.0 | % | $ | 1,240,031 | 100.0 | % | ||||||||
|
|
|
|
|
|
|
|
|
|||||||||
The expected weighted average duration of the Company’s asset-backed, mortgage-backed and commercial mortgage-backed securities is 3.1 years.
The value of the Company’s portfolio of bonds is inversely correlated to changes in market interest rates. In addition, some of the Company’s bonds have call or prepayment options. This could subject the Company to
16
Table of Contents
reinvestment risk should interest rates fall and issuers call their securities and the Company is forced to invest the proceeds at lower interest rates. The Company seeks to mitigate its reinvestment risk by investing in securities with varied maturity dates, so that only a portion of the portfolio will mature, be called, or be prepaid at any point in time.
As of December 31, 2017, the Company had aggregate equity securities of $140.2 million that consisted entirely of common stocks.
The Company’s investments in other invested assets is comprised of a limited liability partnership investment where the partnership invests in distressed securities and assets, which was valued at $26.3 million at December 31, 2017, a limited liability partnership investment that invests in real estate, which was valued at zero at December 31, 2017, a limited liability partnership that provides financing for middle market companies, which was valued at $33.8 million at December 31, 2017, and a limited liability partnership investment that invests in stressed and distressed debt instruments, which was valued at $17.8 million at December 31, 2017. There is no readily available independent market price for these limited liability partnership investments. The Company does not have access to daily valuations; therefore, the estimated fair value of these limited partnerships is based on the net asset value as a practical expedient for each limited partnership. The Company receives annual audited financial statements from each of the partnership investments it owns.
Net realized investment gains (losses), including other than temporary impairments, for the year ended December 31, 2017 were $1.6 million compared with gains of $21.7 million and losses of $3.4 million for the years ended December 31, 2016 and 2015, respectively.
Competition
The Company competes with numerous domestic and international insurance and reinsurance companies, mutual companies, specialty insurance companies, underwriting agencies, diversified financial services companies, Lloyd’s syndicates, risk retention groups, insurance buying groups, risk securitization products and alternative self-insurance mechanisms. In particular, the Company competes against insurance subsidiaries of the groups in the specialty insurance market noted below, insurance companies, and others, including:
| • | American International Group; |
| • | American Modern Insurance Group |
| • | Argo Group International Holdings, Ltd.; |
| • | Berkshire Hathaway; |
| • | Everest Re Group, Ltd.; |
| • | Foremost Insurance Group |
| • | Great American Insurance Group; |
| • | HCC Insurance Holdings, Inc.; |
| • | IFG Companies; |
| • | Markel Corporation; |
| • | Nationwide Insurance; |
| • | Navigators Insurance Group; |
| • | RLI Corporation; |
| • | Selective Insurance Group, Inc.; |
| • | The Travelers Companies, Inc.; |
17
Table of Contents
| • | Validus Group; and |
| • | W.R. Berkley Corporation. |
In addition to the companies mentioned above, the Company is facing competition from standard line companies who are continuing to write risks that traditionally had been written by excess and surplus lines carriers, Bermuda companies who are establishing relationships with wholesale brokers and purchasing carriers, and other excess and surplus lines competitors.
Competition may take the form of lower prices, broader coverage, greater product flexibility, higher quality services, reputation and financial strength or higher ratings by independent rating agencies. In all of the Company’s markets, it competes by developing insurance products to satisfy well-defined market needs and by maintaining relationships with brokers and insureds that rely on the Company’s expertise. For its program and specialty wholesale products, offerings and underwriting products that are not readily available is the Company’s principal means of differentiating itself from its competition. Each of the Company’s products has its own distinct competitive environment. The Company seeks to compete through innovative products, appropriate pricing, niche underwriting expertise, and quality service to policyholders, general agencies and brokers.
Employees
At December 31, 2017, the Company had approximately 420 employees. None of the Company’s employees are covered by collective bargaining agreements as of December 31, 2017.
Ratings
A.M. Best ratings for the industry range from “A++” (Superior) to “F” (In Liquidation) with some companies not being rated. The Company’s Insurance Operations, which consist of its United States based insurance companies and Global Indemnity Reinsurance, are currently rated “A” (Excellent) by A.M. Best, the third highest of sixteen rating categories.
Publications of A.M. Best indicate that “A” (Excellent) ratings are assigned to those companies that, in A.M. Best’s opinion, have an excellent ability to meet their ongoing obligations to policyholders. In evaluating a company’s financial and operating performance, A.M. Best reviews its profitability, leverage and liquidity, as well as its spread of risk, the quality and appropriateness of its reinsurance, the quality and diversification of its assets, the adequacy of its policy and loss reserves, the adequacy of its surplus, its capital structure and the experience and objectives of its management. These ratings are based on factors relevant to policyholders, general agencies, insurance brokers and intermediaries and are not directed to the protection of investors.
Regulation
General
The business of insurance is regulated in most countries, although the degree and type of regulation varies significantly from one jurisdiction to another. As a holding company, Global Indemnity is not subject to any insurance regulation in the Cayman Islands which the Company redomesticated to in 2016. However, Global Indemnity is subject to various Cayman Island laws and regulations, including, but not limited to, laws and regulations governing interested directors, mergers and acquisitions, shareholder lawsuits and indemnification of directors.
U.S. Regulation
At December 31, 2017, the Company had six operating insurance subsidiaries domiciled in the United States; United National Insurance Company, Penn-America Insurance Company, and Penn-Star Insurance Company,
18
Table of Contents
which are domiciled in Pennsylvania; Diamond State Insurance Company which is domiciled in Indiana; Penn-Patriot Insurance Company, which is domiciled in Virginia; and American Reliable Insurance Company, which is domiciled in Arizona.
As the indirect parent of these U.S. insurance companies, Global Indemnity is subject to the insurance holding company laws of Pennsylvania, Indiana, Virginia, and Arizona. These laws generally require each of the U.S. insurance companies to register with its respective domestic state insurance department and to annually furnish financial and other information about the operations of the companies within the insurance holding company system. Generally, all material transactions among affiliated companies in the holding company system to which any of the U.S. insurance companies is a party must be fair, and, if material or of a specified category, require prior notice and approval or absence of disapproval by the insurance department where the subsidiary is domiciled. Material transactions include sales, loans, reinsurance agreements, certain types of dividends, and service agreements with the non-insurance companies within Global Indemnity’s family of companies, the Insurance Operations, or the Reinsurance Operations.
State Insurance Regulation
State insurance authorities have broad regulatory powers with respect to various aspects of the business of U.S. insurance companies, including, but not limited to, licensing companies to transact admitted business or determining eligibility to write surplus lines business, accreditation of reinsurers, admittance of assets to statutory surplus, regulating unfair trade and claims practices, establishing reserve requirements and solvency standards, management of enterprise risk, regulating investments and dividends, approving policy forms and related materials in certain instances and approving premium rates in certain instances. State insurance laws and regulations may require the Company’s U.S. insurance companies to file financial statements with insurance departments everywhere they will be licensed or eligible or accredited to conduct insurance business, and their operations are subject to review by those departments at any time. The Company’s U.S. insurance companies prepare statutory financial statements in accordance with statutory accounting principles (“SAP”) and procedures prescribed or permitted by these departments. State insurance departments also conduct periodic examinations of the books and records, financial reporting, policy filings and market conduct of insurance companies domiciled in their states, generally once every three to five years, although market conduct examinations may take place at any time. These examinations are generally carried out in cooperation with the insurance departments of other states under guidelines promulgated by the NAIC. In addition, admitted insurers are subject to targeted market conduct examinations involving specific insurers by state insurance regulators in any state in which the insurer is admitted. The insurance departments for the states of Indiana and Virginia completed their most recent financial examinations of the Company’s U.S. insurance subsidiaries, excluding American Reliable, for the period ended December 31, 2012. Their final reports were issued in 2014, and there were no materially adverse findings. The insurance department for the state of Arizona completed its most recent financial examination of American Reliable for the period ending December 31, 2013. Their final report was issued in 2015, and there were no materially adverse findings. The Company has been notified by the Pennsylvania Insurance Department that the financial examination for the period ended December 31, 2017 will begin in 2018. The Company expect the examination to continue into 2019.
Before a person can acquire control of a U.S. insurance company, prior written approval must be obtained from the insurance commissioner of the state where the insurer is domiciled. Prior to granting approval of an application to acquire control of a domestic insurer, the state insurance commissioner will consider factors such as the financial strength of the applicant, the integrity and management of the applicant’s Board of Directors and executive officers, the acquirer’s plans for the management, Board of Directors, executive officers, and employees of the company being acquired, the acquirer’s plans for the future operations of the domestic insurer and any anti-competitive results that may arise from the consummation of the acquisition of control. Generally, state statutes provide that control over a domestic insurer is presumed to exist if any person, directly or indirectly, owns, controls, holds with the power to vote, or holds proxies representing 10% or more of the voting securities of the domestic insurer. Because a person acquiring 10% or more of the Company’s ordinary shares would
19
Table of Contents
indirectly control the same percentage of the stock of the U.S. insurance companies, the insurance change of control laws of Pennsylvania, Indiana, Virginia and Arizona would likely apply to such a transaction. While the Company’s articles of association limit the voting power of any U.S. shareholder to less than 9.5%, there can be no assurance that the applicable state insurance regulator would agree that any shareholder did not control the applicable insurance company.
These laws may discourage potential acquisition proposals and may delay, deter or prevent a change of control of Global Indemnity, including through transactions, and in particular unsolicited transactions, that some or all of the shareholders of Global Indemnity might consider desirable.
Insurance Regulatory Information System Ratios
The NAIC Insurance Regulatory Information System (“IRIS”) was developed by a committee of the state insurance regulators and is intended primarily to assist state insurance departments in executing their statutory mandates to oversee the financial condition of insurance companies operating in their respective states. IRIS identifies twelve industry ratios and specifies “usual values” for each ratio. Departure from the usual values of the ratios can lead to inquiries from individual state insurance commissioners as to certain aspects of an insurer’s business. Insurers that report four or more ratios that fall outside the range of usual values are generally targeted for increased regulatory review.
The U.S. insurance subsidiaries have strong risk capital scores. The Company’s U.S. insurance subsidiaries have acceptable results for the IRIS ratios with the exception of the following:
| • | Two-year operating ratio for Penn-America Insurance Company, Penn-Star Insurance Company, Penn-Patriot Insurance Company and American Reliable Insurance Company were outside of IRIS range due to catastrophe losses in 2016 and 2017. |
| • | Investment yields were lower than the IRIS range for Diamond State Insurance Company, Penn-America Insurance Company, Penn-Star Insurance Company and Penn-Patriot Insurance Company. The investment portfolios of these companies are invested in high quality short duration bonds. |
| • | Investment yields were higher than the IRIS range for United National Insurance Company due to dividends from affiliates |
| • | Change in Surplus and Adjusted Surplus ratios for United National Insurance Company, Diamond State Insurance Company, Penn-America Insurance Company, Penn-Star Insurance Company and Penn-Patriot Insurance Company were outside of the IRIS range due to dividends to affiliates and catastrophe losses in 2017. |
| • | Asset to liability liquidity ratio for Penn-America Insurance Company was outside of the IRIS range mainly due to intercompany payables to parents and affiliates that will be settled in the 1st quarter of 2018. |
| • | Estimated current reserve deficiency was outside of the range for Penn-Patriot Insurance Company due to changes in the intercompany pooling agreement in 2016. |
Risk-Based Capital Regulations
The state insurance departments of Pennsylvania, Indiana, Virginia and Arizona require that each domestic insurer report its risk-based capital based on a formula calculated by applying factors to various asset, premium and reserve items. The formula takes into account the risk characteristics of the insurer, including asset risk, insurance risk, interest rate risk and business risk. The respective state insurance regulators use the formula as an early warning regulatory tool to identify possible inadequately capitalized insurers for purposes of initiating regulatory action, and generally not as a means to rank insurers. State insurance laws impose broad confidentiality requirements on those engaged in the insurance business (including insurers, general agencies,
20
Table of Contents
brokers and others) and on state insurance departments as to the use and publication of risk-based capital data. The respective state insurance regulators have explicit regulatory authority to require various actions by, or to take various actions against, insurers whose total adjusted capital does not exceed certain company action level risk-based capital levels.
Based on the standards currently adopted, the U.S. insurance companies reported in their 2017 statutory filings that their capital and surplus are above the prescribed risk-based capital requirements. The cancellation of the Quota Share arrangement between Global Indemnity Reinsurance and the U.S. Insurance Companies will increase the capital requirements of its U.S. Insurance Companies and additional capital may need to be allocated to these companies in the future. The Company will continue to manage capital levels in its U.S. Insurance Companies to ensure its capital and surplus will remain above the prescribed risk-based capital requirements. See Note 19 of the notes to the consolidated financial statements in Item 8 of Part II of this report for additional information on the NAIC’s risk-based capital model for determining the levels of statutory capital and surplus an insurer must maintain.
Statutory Accounting Principles (“SAP”)
SAP is a basis of accounting developed to assist insurance regulators in monitoring and regulating the solvency of insurance companies. SAP is primarily concerned with measuring an insurer’s surplus. Accordingly, statutory accounting focuses on valuing assets and liabilities of insurers at financial reporting dates in accordance with appropriate insurance laws, regulatory provisions, and practices prescribed or permitted by each insurer’s domiciliary state.
GAAP is concerned with a company’s solvency, but it is also concerned with other financial measurements, such as income and cash flows. As a direct result, different line item groupings of assets and liabilities and different amounts of assets and liabilities are reflected in financial statements prepared in accordance with GAAP than financial statements prepared in accordance with SAP.
Statutory accounting practices established by the NAIC and adopted in part by the Pennsylvania, Indiana, Virginia, and Arizona regulators determine, among other things, the amount of statutory surplus and statutory net income of the U.S. insurance companies and thus determine, in part, the amount of funds these subsidiaries have available to pay dividends.
State Dividend Limitations
The U.S. insurance companies are restricted by statute as to the amount of dividends that they may pay without the prior approval of the applicable state regulatory authorities. Dividends may be paid without advanced regulatory approval only out of unassigned surplus. The dividend limitations imposed by the applicable state laws are based on the statutory financial results of each company within the Insurance Operations that are determined using statutory accounting practices that differ in various respects from accounting principles used in financial statements prepared in conformity with GAAP. See “Regulation — Statutory Accounting Principles.” Key differences relate to, among other items, deferred acquisition costs, limitations on deferred income taxes, reserve calculation assumptions and surplus notes, if any.
See the “Liquidity and Capital Resources” section in Item 7 of Part II of this report for a more complete description of the state dividend limitations. See Note 19 of the notes to consolidated financial statements in Item 8 of Part II of this report for the dividends declared and paid by Global Indemnity’s U.S. insurance companies in 2017 and the maximum amount of distributions that U.S. insurance companies could pay as dividends in 2018.
Guaranty Associations and Similar Arrangements
Most of the jurisdictions in which the U.S. insurance companies are admitted to transact business require property and casualty insurers doing business within that jurisdiction to participate in guaranty associations.
21
Table of Contents
These associations are organized to pay contractual benefits owed pursuant to insurance policies issued by impaired, insolvent or failed insurers. These associations levy assessments, up to prescribed limits, on all member insurers in a particular state on the basis of the proportionate share of the premiums written by member insurers in the lines of business in which the impaired, insolvent, or failed insurer is engaged. Some states permit member insurers to recover assessments paid through full or partial premium tax offsets or in limited circumstances by surcharging policyholders.
Federal Insurance Regulation
The Dodd-Frank Wall Street Reform and Consumer Protection Act (the “Dodd-Frank Act”) includes a number of provisions having a direct impact on the insurance industry, most notably, the creation of a Federal Insurance Office to monitor the insurance industry, streamlining of surplus lines insurance, credit for reinsurance, and systemic risk regulation. The Federal Insurance Office is empowered to gather data and information regarding the insurance industry and insurers, including conducting a study for submission to the U.S. Congress on how to modernize and improve insurance regulation in the United States. With respect to surplus lines insurance, the Dodd-Frank Act gives exclusive authority to regulate surplus lines transactions to the home state of the insured, and the requirement that a surplus lines broker must first attempt to place coverage in the admitted market is substantially softened with respect to large commercial policyholders. Significantly, the Dodd-Frank Act provides that a state may not prevent a surplus lines broker from placing surplus lines insurance with a non-U.S. insurer that appears on the quarterly listing of non-admitted insurers maintained by the International Insurers Department of the National Association of Insurance Commissioners (“NAIC”). Regarding credit for reinsurance, the Dodd-Frank Act generally provides that the state of domicile of the ceding company (and no other state) may regulate financial statement credit for the ceded risk. The Dodd-Frank Act also provides the U.S. Federal Reserve with supervisory authority over insurance companies that are deemed to be “systemically important.” The Company continues to monitor the impact the Dodd-Frank Act or any changes thereto may have on operations.
Operations of Global Indemnity Reinsurance
The insurance laws of the United States regulate or prohibit the sale of insurance and reinsurance within their jurisdictions by non-domestic insurers and reinsurers that are not admitted to do business within such jurisdictions. Global Indemnity Reinsurance is not admitted to do business in the United States. The Company does not intend for Global Indemnity Reinsurance to maintain offices or solicit, advertise, settle claims or conduct other insurance and reinsurance underwriting activities in any jurisdiction in the United States where the conduct of such activities would require that Global Indemnity Reinsurance be admitted or authorized.
As a reinsurer that is not licensed, accredited, or approved in any state in the United States, Global Indemnity Reinsurance is required to post collateral security with respect to the reinsurance liabilities it assumes from the Company’s Insurance Operations as well as other U.S. ceding companies. The posting of collateral security is generally required in order for U.S. ceding companies to obtain credit on their U.S. statutory financial statements with respect to reinsurance liabilities ceded to unlicensed or unaccredited reinsurers. Under applicable United States “credit for reinsurance” statutory provisions, the security arrangements generally may be in the form of letters of credit, reinsurance trusts maintained by third-party trustees or funds-withheld arrangements whereby the ceded premium is held by the ceding company. If “credit for reinsurance” laws or regulations are made more stringent in Pennsylvania, Indiana, Virginia and Arizona or other applicable states or any of the U.S. insurance companies re-domesticate to one of the few states that do not allow credit for reinsurance ceded to non-licensed reinsurers, the Company may be unable to realize some of the benefits expected from its business plan. Accordingly, Global Indemnity Reinsurance could be adversely affected.
Global Indemnity Reinsurance generally is not subject to regulation by U.S. jurisdictions. Specifically, rate and form regulations otherwise applicable to authorized insurers generally do not apply to Global Indemnity Reinsurance’s transactions.
22
Table of Contents
Bermuda Insurance Regulation
The Bermuda Insurance Act 1978 and related regulations, as amended (the “Insurance Act”), regulates the insurance business of Global Indemnity Reinsurance and provides that no person may carry on any such business in or from within Bermuda unless registered as an insurer by the Bermuda Monetary Authority (the “BMA”) under the Insurance Act. Global Indemnity Reinsurance, which is incorporated to carry on general insurance and reinsurance business, is registered as a Class 3B insurer in Bermuda. A corporate body is registrable as a Class 3B insurer if it intends to carry on insurance business in circumstances where 50% or more of the net premiums written or 50% or more of the loss and loss expense provisions represent unrelated business, or its total net premiums written from unrelated business are $50.0 million or more. The continued registration of an applicant as an insurer is subject to it complying with the terms of its registration and such other conditions as the BMA may impose from time to time. An insurer’s registration may be canceled by the BMA on certain grounds specified in the Insurance Act, including failure of the insurer to comply with its obligations under the Insurance Act.
The Insurance Act imposes solvency and liquidity standards, auditing and reporting requirements, and grants the BMA powers to supervise, investigate, require information and the production of documents, and to intervene in the affairs of Bermuda insurance companies. The BMA continues to make amendments to the Insurance Act with a view to enhancing Bermuda’s insurance regulatory regime.
The BMA utilizes a risk-based approach when it comes to licensing and supervising insurance companies. As part of the BMA’s risk-based system, an assessment of the inherent risks within each particular class of insurer is used to determine the limitations and specific requirements which may be imposed. Thereafter the BMA keeps its analysis of relative risk within individual institutions under review on an ongoing basis, including through the scrutiny of regular audited statutory financial statements, and, as appropriate, meeting with senior management during onsite visits.
On March 25, 2016, Bermuda’s prudential framework for (re)insurance and group supervision was confirmed as being fully equivalent to the regulatory standards applied to European reinsurance companies and insurance groups in accordance with the requirements of the Solvency II Directive. Bermuda was granted this full “Solvency II equivalence” for an unlimited period by the European Commission based on an assessment conducted by the European Insurance and Occupational Pensions Authority, and the equivalence decision was applied retroactively to January 1, 2016.
Certain significant aspects of the Bermuda insurance regulatory framework are set forth as follows:
Cancellation of Insurer’s Registration
An insurer’s registration may be canceled by the BMA on certain grounds specified in the Bermuda Insurance Act, including failure of the insurer to comply with its obligations under the Bermuda Insurance Act or if, in the opinion of the BMA, the insurer has not been carrying on business in accordance with sound insurance principles.
Principal Representative and Principal Office
Every registered insurer or reinsurer is required to maintain a principal office in Bermuda and to appoint and maintain a principal representative in Bermuda, subject to certain prescribed requirements under the Bermuda Insurance Act. Further, any registered insurer that is a Class 3A insurer or above is required to maintain a head office in Bermuda and direct and manage its insurance business from Bermuda. The recent amendments to the Bermuda Insurance Act provide that in considering whether an insurer satisfies the requirements of having its head office in Bermuda, the BMA may consider (a) where the underwriting, risk management, and operational decision making occurs; (b) whether the presence of senior executives who are responsible for, and involved in,
23
Table of Contents
the decision making are located in Bermuda; and (c) where meetings of the board of directors occur. The BMA will also consider (a) the location where management meets to effect policy decisions; (b) the residence of the officers, insurance managers or employees; and (c) the residence of one or more directors in Bermuda.
Global Indemnity Reinsurance maintains its principal office in Hamilton, Bermuda and its external management firm has been appointed as its principal representative.
It is the duty of the principal representative upon reaching the view that there is a likelihood of the insurer for which the principal representative acts becoming insolvent or that a reportable “event” has, to the principal representative’s knowledge, occurred or is believed to have occurred, to immediately notify the BMA and to make a report in writing to the BMA within 14 days of the prior notification setting out all the particulars of the case that are available to the principal representative.
Where there has been a significant loss which is reasonably likely to cause the insurer to fail to comply with its enhanced capital requirement (in respect of its general business, as described below under the Enhanced Capital Requirement (“ECR”) and Minimum Solvency Margin (“MSM”) section), the principal representative must also furnish the BMA with a capital and solvency return reflecting an enhanced capital requirement prepared using post-loss data. The principal representative must provide this within 45 days of notifying the BMA regarding the loss.
Furthermore, where a notification has been made to the BMA regarding a material change to an insurer’s business or structure (including a merger or amalgamation), the principal representative has 30 days from the date of such notification to furnish the BMA with unaudited interim statutory financial statements in relation to such period if so requested by the BMA, together with a general business solvency certificate in respect to those statements.
Independent Approved Auditor
Every registered insurer, such as Global Indemnity Reinsurance, must appoint independent auditors who will audit and report annually on the statutory financial statements, the statutory financial return of the insurer and U.S. GAAP statements, which are required to be filed annually with the BMA.
Loss Reserve Specialist
As a registered Class 3B insurer, Global Indemnity Reinsurance is required to submit an opinion of its approved loss reserve specialist in respect of its technical provisions contained within its Economic Balance Sheet (see below).
Annual Financial Statements and Annual Statutory Financial Return
As prescribed by the Insurance Act, Global Indemnity Reinsurance, a Class 3B insurer, must prepare annual statutory financial statements. The statutory financial return shall consist of an insurer information sheet, a report of the approved independent auditor on the GAAP financial statements, a statutory balance sheet, a statutory statement of income, a statutory statement of capital and surplus, notes to the statutory financial statements and a statutory declaration of compliance.
In addition to preparing statutory financial statements, Global Indemnity Reinsurance must file financial statements prepared in accordance with GAAP in respect of each financial year. Such statements must be filed with the BMA within a period of four months from the end of the financial year or such longer period, not exceeding seven months, as the BMA may determine. The audited financial statements will be published by the BMA.
24
Table of Contents
For financial years after January 1, 2016, commercial insurers will also be required to prepare a Financial Condition Report providing details of, among other things, measures governing the business operations, corporate governance framework, solvency and financial performance of the insurer.
Enhanced Capital Requirement (“ECR”) and Minimum Solvency Margin (“MSM”)
The BMA has promulgated the Insurance (Prudential Standards) (Class 4 and Class 3B Solvency Requirement) Amendment Rules 2008, as amended (the “Rules”) which, among other things, mandate that a Class 3B insurer’s ECR be calculated by either (a) the model set out in Schedule I to the Rules, or (b) an internal capital model which the BMA has approved for use for this purpose. For 2017, Global Indemnity Reinsurance used the BMA’s model to calculate its capital and solvency requirements.
The risk-based regulatory capital adequacy and solvency requirements implemented with effect from December 31, 2008 (termed the Bermuda Solvency Capital Requirement or “BSCR”) provide a risk-based capital model as a tool to assist the BMA both in measuring risk and in determining appropriate levels of capitalization. BSCR employs a standard mathematical model that correlates the risk underwritten by Bermuda insurers to the capital that is dedicated to their business. The framework that has been developed applies a standard measurement format to the risk associated with an insurer’s assets, liabilities and premiums, including a formula to take account of catastrophe risk exposure.
Where an insurer believes that its own internal model for measuring risk and determining appropriate levels of capital better reflects the inherent risk of its business, it may apply to the BMA for approval to use its internal capital model in substitution for the BSCR model. The BMA may approve an insurer’s internal model, provided certain conditions have been established, and may revoke approval of an internal model in the event that the conditions are no longer met or where it feels that the revocation is appropriate. The BMA will review the internal model regularly to confirm that the model continues to meet the conditions.
In order to minimize the risk of a shortfall in capital arising from an unexpected adverse deviation, the BMA seeks that insurers operate at or above a threshold capital level (termed the Target Capital Level or “TCL”), which exceeds the BSCR or approved internal model minimum amounts. The Rules provide prudential standards in relation to the ECR and Capital and Solvency Return (“CSR”). The ECR is determined using the BSCR or an approved internal model, provided that at all times the ECR must be an amount equal to, or exceeding the MSM. The CSR is the return setting out the insurer’s risk management practices and other information used by the insurer to calculate its approved internal model ECR. The capital requirements require Class 3B insurers to hold available statutory capital and surplus equal to, or exceeding ECR and set TCL at 120% of ECR. In circumstances where an insurer has failed to comply with an ECR given by the BMA, such insurer is prohibited from declaring or paying any dividends until the failure is rectified.
The risk-based solvency capital framework referred to above represents a modification of the minimum solvency margin test set out in the Insurance Returns and Solvency Amendment Regulations 1980 (as amended). While it must calculate its ECR annually by reference to either the BSCR or an approved internal model, Global Indemnity Reinsurance must also ensure at all times that its ECR is at least equal to the MSM for a Class 3B insurer in respect of its general business, which is the greater of:
| (i) | $1.0 million; |
| (ii) | 50% of net premiums written; |
| (iii) | 15% of net loss and loss adjustment expense reserves and other general business insurance reserves. |
| (iv) | 25% of the insurer’s enhanced capital requirement. |
The BMA has also introduced a three-tiered capital system for Class 3B insurers designed to assess the quality of capital resources that an insurer has available to meet its capital requirements. The tiered capital system classifies
25
Table of Contents
all capital instruments into one of three tiers based on their “loss absorbency” characteristics, with the highest quality capital classified as Tier 1 Capital and lesser quality capital classified as either Tier 2 or Tier 3 Capital. Only Tier 1 and Tier 2 Capital may be used to support an insurer’s MSM. Certain percentages of each of Tier 1, 2 and 3 Capital may be used to satisfy an insurer’s ECR. Any combination of Tier 1, 2 or 3 Capital may be used to meet the TCL.
The Rules introduced a regime that requires Class 3B insurers to perform an assessment of their own risk and solvency requirements, referred to as a Commercial Insurer’s Solvency Self Assessment (“CISSA”). The CISSA will allow the BMA to obtain an insurer’s view of the capital resources required to achieve its business objectives and to assess the company’s governance, risk management and controls surrounding this process. The Rules also introduced a Catastrophe Risk Return, which must be filed with the BMA, which assesses an insurer’s reliance on vendor models in assessing catastrophe exposure.
Economic Balance Sheet Framework
The Economic Balance Sheet (“EBS”) framework is an accounting balance sheet approach using market consistent values for all current assets and current obligations relating to in-force business which applies to Class 3B and 4 insurers and has been in effect since the 2016 financial year end. The EBS framework is embedded as part of the Capital and Solvency Return and forms the basis for the insurer’s ECR.
Minimum Liquidity Ratio
The Insurance Act provides a minimum liquidity ratio for general business insurers, such as Global Indemnity Reinsurance. An insurer engaged in general business is required to maintain the value of its relevant assets at not less than 75% of the amount of its relevant liabilities; as such terms are defined in the Insurance Act.
Restrictions on Dividends and Distributions
Global Indemnity Reinsurance is prohibited from declaring or paying any dividends during any financial year if it is in breach of its minimum solvency margin or minimum liquidity ratio or if the declaration or payment of such dividends would cause it to fail to meet such margin or ratio. In addition, if it has failed to meet its minimum solvency margin or minimum liquidity ratio on the last day of any financial year, Global Indemnity Reinsurance will be prohibited, without the approval of the BMA, from declaring or paying any dividends during the next financial year.
Global Indemnity Reinsurance is prohibited, without the approval of the BMA, from reducing by 15% or more its total statutory capital or 25% or more of its total statutory capital and surplus as set out in its previous year’s financial statements, and any application for such approval must include such information as the BMA may require. In addition, if at any time it fails to meet its minimum margin of solvency, Global Indemnity Reinsurance is required within 30 days after becoming aware of such failure or having reason to believe that such failure has occurred, to file with the BMA a written report containing certain information.
Additionally, under the Companies Act, Global Indemnity Reinsurance may not declare or pay a dividend, or make a distribution from contributed surplus, if there are reasonable grounds for believing that it is, or would after the payment be, unable to pay its liabilities as they become due, or if the realizable value of its assets would be less than the aggregate of its liabilities and its issued share capital and share premium accounts.
Supervision, Investigation and Intervention
The BMA has wide powers of investigation and document production in relation to Bermuda insurers under the Insurance Act. For example, the BMA may appoint an inspector with extensive powers to investigate the affairs of Global Indemnity Reinsurance if the BMA believes that such an investigation is in the best interests of its
26
Table of Contents
policyholders or persons who may become policyholders. Further, the BMA has the power to appoint a professional person to prepare a report on any aspect of any matter about which the BMA has or could require information. If it appears to the BMA that there is a risk of Global Indemnity Reinsurance becoming insolvent, or that Global Indemnity Reinsurance is in breach of the Insurance Act or any conditions imposed upon its registration, the BMA may, among other things, direct Global Indemnity Reinsurance not to take on any new business, not to vary any current treaties if the effect would be to increase its liabilities, not to make certain investments, to realize or not realize certain investments, to maintain in, or transfer to, the custody of a specified bank, certain assets, not to declare or pay any dividends or other distributions or to restrict the making of such payments, or to limit its premium income or remove an officer.
The BMA may also make additional rules prescribing prudential standards in relation to the ECR, CSR, insurance reserves and eligible capital which Global Indemnity Reinsurance must comply with.
Bermuda Code of Conduct
The BMA has implemented the Insurance Code of Conduct (the “Bermuda Code of Conduct”) which came into effect on July 1, 2010. The BMA established July 1, 2011 as the date of compliance for commercial insurers. The Bermuda Code of Conduct is divided into six categories: (i) Proportionality Principal, (ii) Corporate Governance, (iii) Risk Management, (iv) Governance Mechanism, (v) Outsourcing, and (vi) Market Discipline and Disclosure. These categories contain the duties, requirements and compliance standards to which all insurers must adhere. It stipulates that in order to achieve compliance with the Bermuda Code of Conduct, insurers are to develop and apply policies and procedures capable of assessment by the BMA. Global Indemnity Reinsurance is in compliance with the Bermuda Code of Conduct.
Group Supervision
Emerging international norms in the regulation of global insurance groups are trending increasingly towards the imposition of group-wide supervisory regimes by one principal “home” regulator over all the legal entities in the group, no matter where incorporated. Amendments to the Insurance Act in 2010 introduced such a regime into Bermuda insurance regulation.
The Insurance Act contains provisions regarding group supervision, the authority to exclude specified entities from group supervision, the power for the BMA to withdraw as a group supervisor, the functions of the BMA as group supervisor and the power of the BMA to make rules regarding group supervision.
The BMA has issued the Insurance (Group Supervision) Rules 2011 (the “Group Supervision Rules”) and the Insurance (Prudential Standards) (Insurance Group Solvency Requirement) Rules 2011 (the “Group Solvency Rules”) each effective December 31, 2011. The Group Supervision Rules set out the rules in respect of the assessment of the financial situation and solvency of an insurance group, the system of governance and risk management of the insurance group, and supervisory reporting and disclosures of the insurance group. The Group Solvency Rules set out the rules in respect of the capital and solvency return and enhanced capital requirements for an insurance group. The BMA also intends to publish an insurance code of conduct in relation to group supervision.
Global Indemnity Reinsurance was notified by the BMA that, having considered the matters set out in the 2010 amendments to the Insurance Act, it had determined that it would not be Global Indemnity Reinsurance’s group supervisor.
Notifications to the BMA
In the event that the share capital of an insurer (or its parent) is traded on any stock exchange recognized by the BMA, then any shareholder must notify the BMA within 45 days of becoming a 10%, 20%, 33% or 50%
27
Table of Contents
shareholder of such insurer. An insurer must also provide written notice to the BMA that a person has become, or ceased to be, a “Controller” of that insurer. A Controller for this purpose means a managing director, chief executive or other person in accordance with whose directions or instructions the Directors of Global Indemnity Reinsurance are accustomed to act, including any person who holds, or is entitled to exercise, 10% or more of the voting shares or voting power or is otherwise able to exercise significant influence over the management of Global Indemnity Reinsurance.
Global Indemnity Reinsurance is also required to notify the BMA in writing in the event any person has become or ceased to be an officer of it, an officer being a director, chief executive or senior executive performing duties of underwriting, actuarial, risk management, compliance, internal audit, finance or investment matters. Failure to give required notice is an offense under the Insurance Act.
An insurer, or designated insurer in respect of the group of which it is a member, must notify the BMA in writing that it proposes to take measures that are likely to be of material significance for the discharge, in relation to the insurer or the group, of the BMA’s functions under the Insurance Act. Measures that are likely to be of material significance include:
| • | acquisition or transfer of insurance business being part of a scheme falling within section 25 of the Insurance Act or section 99 of the Companies Act; |
| • | amalgamation with or acquisition of another firm; and |
| • | a material change in the insurer’s business plan not otherwise reported to the BMA. |
In respect of the forgoing, the BMA will typically object to the material change unless it is satisfied that:
| • | the interest of the policyholders and potential policyholders of the insurer or the group would not in any manner be threatened by the material change; and |
| • | without prejudice to the first point, that, having regard to the material change, the requirements of the Insurance Act would continue to be complied with, or, if any of those requirements are not complied with, that the insurer concerned is likely to undertake adequate remedial action. |
Failure to give such notice constitutes an offence under the Insurance Act. It is possible to appeal a notice of objection served by the BMA.
Disclosure of Information
The BMA may assist other regulatory authorities, including foreign insurance regulatory authorities, with their investigations involving insurance and reinsurance companies in Bermuda, but subject to restrictions. For example, the BMA must be satisfied that the assistance being requested is in connection with the discharge of regulatory responsibilities of the foreign regulatory authority. Further, the BMA must consider whether cooperation is in the public interest. The grounds for disclosure are limited and the Insurance Act provides sanctions for breach of the statutory duty of confidentiality.
Under the Companies Act, the Minister of Finance may assist a foreign regulatory authority that has requested assistance in connection with inquiries being carried out by it in the performance of its regulatory functions. The Minster of Finance’s powers include requiring a person to furnish information to the Minister of Finance, to produce documents to the Minister of Finance, to attend and answer questions and to give assistance to the Minister of Finance in relation to inquiries. The Minister of Finance must be satisfied that the assistance requested by the foreign regulatory authority is for the purpose of its regulatory functions and that the request is in relation to information in Bermuda that a person has in his possession or under his control. The Minister of Finance must consider, among other things, whether it is in the public interest to give the information sought.
28
Table of Contents
Certain Other Bermuda Law Considerations
Although Global Indemnity Reinsurance is incorporated in Bermuda, it is classified as a non-resident of Bermuda for exchange control purposes by the BMA. Pursuant to the non-resident status, Global Indemnity Reinsurance may engage in transactions in currencies other than Bermuda dollars, and there are no restrictions on its ability to transfer funds (other than funds denominated in Bermuda dollars) in and out of Bermuda or to pay dividends to United States residents that are holders of its ordinary shares.
Under Bermuda law, exempted companies are companies formed for the purpose of conducting business outside Bermuda from a principal place of business in Bermuda. As an “exempted” company, Global Indemnity Reinsurance may not, without the express authorization of the Bermuda legislature or under a license or consent granted by the Minister of Finance, participate in certain business transactions, including transactions involving Bermuda landholding rights and the carrying on of business of any kind for which it is not licensed in Bermuda.
Taxation of Global Indemnity and Subsidiaries
Cayman Islands
The Cayman Islands currently have no form of income, corporate or capital gains tax and no estate duty, inheritance tax or gift tax.
Global Indemnity is an exempted company incorporated with limited liability under the laws of the Cayman Islands. Global Indemnity has received an undertaking from the Governor in Cabinet of the Cayman Islands to the effect that, for a period of twenty years from the date of the undertaking, which is February 9, 2016, no law that thereafter is enacted in the Cayman Islands imposing any tax or duty to be levied on profits, income or on gains or appreciation, or any tax in the nature of estate duty or inheritance tax, will apply to any property comprised in or any income arising in respect of Global Indemnity, or to the shareholders thereof, in respect of any such property or income.
Ireland
Global Indemnity Services Ltd., a direct wholly-owned subsidiary, is a company limited by shares incorporated under the laws of Ireland. The company is a resident taxpayer fully subject to Irish corporate income tax laws. Global Indemnity Services Ltd. has only trading income and is subject to corporate income tax of 12.5%.
U.A.I. (Ireland) Limited, U.A.I. (Ireland) II Unlimited Company, GBLI (Ireland) Limited, and Global Indemnity Group Limited, all indirect wholly-owned subsidiaries, are companies incorporated under the laws of Ireland. Each company is a resident taxpayer fully subject to Irish corporate income tax laws.
Bermuda
Under current Bermuda law, the Company and its Bermuda subsidiaries are not required to pay any taxes in Bermuda on income or capital gains. Currently, there is no Bermuda income, corporation or profits tax, withholding tax, capital gains tax, capital transfer tax, estate duty or inheritance tax payable by Global Indemnity Reinsurance or its shareholders, or GBLI (Bermuda) Limited, or its shareholders, other than shareholders ordinarily resident in Bermuda, if any. Currently, there is no Bermuda withholding or other tax on principal, interest, or dividends paid to holders of the ordinary shares of Global Indemnity Reinsurance or GBLI (Bermuda) Limited, other than holders ordinarily resident in Bermuda, if any. There can be no assurance that Global Indemnity Reinsurance or its shareholders or GBLI (Bermuda) Limited or its shareholders will not be subject to any such tax in the future.
The Company has received a written assurance from the Bermuda Minister of Finance under the Exempted Undertakings Tax Protection Act of 1966 of Bermuda, that if any legislation is enacted in Bermuda that would
29
Table of Contents
impose tax computed on profits or income, or computed on any capital asset, gain or appreciation, or any tax in the nature of estate duty or inheritance tax, then the imposition of that tax would not be applicable to Global Indemnity Reinsurance or GBLI (Bermuda) Limited or to any of its operations, shares, debentures or obligations through March 31, 2035; provided that such assurance is subject to the condition that it will not be construed to prevent the application of such tax to people ordinarily resident in Bermuda, or to prevent the application of any taxes payable by Global Indemnity Reinsurance or GBLI (Bermuda) Limited in respect of real property or leasehold interests in Bermuda held by them. Given the limited duration of the assurance, the Company cannot be certain that the Company will not be subject to any Bermuda tax after March 31, 2035.
Luxembourg
U.A.I. (Luxembourg) I S.à.r.l., U.A.I. (Luxembourg) II S.à.r.l., U.A.I. (Luxembourg) III S.à.r.l., U.A.I. (Luxembourg) IV S.à.r.l., U.A.I. (Luxembourg) Investment S.à.r.l., and Wind River (Luxembourg) S.à.r.l. (the “Luxembourg Companies”) are indirect wholly-owned subsidiaries and private limited liability companies incorporated under the laws of Luxembourg. These are taxable companies, which may carry out any activities that fall within the scope of their corporate object clause. In accordance with Luxembourg regulations, the companies are resident taxpayers fully subject to Luxembourg corporate income tax at a rate of 27.08% and net worth tax at a rate of 0.5%. The companies are entitled to benefits of the tax treaties concluded between Luxembourg and other countries and European Union Directives.
Profit distributions (not in respect to liquidations) by the companies are generally subject to Luxembourg dividend withholding tax at a rate of 15%, unless a domestic law exemption or a lower tax treaty rate applies. Dividends paid by any of the Luxembourg Companies to their Luxembourg resident parent company are exempt from Luxembourg dividend withholding tax, provided that at the time of the dividend distribution, the resident parent company has held (or commits itself to continue to hold) 10% or more of the nominal paid up capital of the distributing entity or, in the event of a lower percentage participation, a participation having an acquisition price of Euro 1.2 million or more for a period of at least 12 months.
The Luxembourg Companies have received advance tax confirmations (“ATCs”) from the Luxembourg Administration des Contributions Directes (the “Luxembourg tax authorities”) that the financing activities of the Luxembourg Companies do not lead to taxation in Luxembourg except for the taxation as provided in the ATCs. Based on these confirmations received, the current financing activities of the Luxembourg Companies should not lead to taxation in Luxembourg other than for such tax as provided for in the financial statements. The Luxembourg Companies have in their files transfer pricing documentation substantiating the arm’s length nature of the financing activities. It is however not guaranteed that the Luxembourg Companies cannot be subject to higher Luxembourg taxes.
Barbados
GBLI (Barbados) Limited, an indirect wholly owned subsidiary, is incorporated under the Companies Act, Cap. 308 of the Laws of Barbados. It is a duly licensed international business company under the International Business Companies Act, Cap. 77 of the Laws of Barbados and subject to a corporate income tax rate as follows:
| • | 2.5% on all profits and gains up to $5,000,000; |
| • | 2% on all profits and gains exceeding $5,000,000 but not exceeding $10,000,000; |
| • | 1.5% on all profits and gains exceeding $10,000,000 but not exceeding $15,000,000; and |
| • | 0.25% on all profits and gains exceeding $15,000,000. |
United States
The following discussion is a summary of the material U.S. federal income tax considerations relating to the Company’s operations. The Company manages its business in a manner that seeks to mitigate the risk that either
30
Table of Contents
Global Indemnity or Global Indemnity Reinsurance will be treated as engaged in a U.S. trade or business for U.S. federal income tax purposes. However, whether business is being conducted in the United States is an inherently factual determination. Because the United States Internal Revenue Code (the “Code”), regulations and court decisions fail to identify definitively activities that constitute being engaged in a trade or business in the United States, the Company cannot be certain that the Internal Revenue Service (“IRS”) will not contend successfully that Global Indemnity or Global Indemnity Reinsurance is or has been engaged in a trade or business in the United States. A non-U.S. corporation deemed to be so engaged would be subject to U.S. income tax at regular corporate rates, as well as the branch profits tax, on its income that is treated as effectively connected with the conduct of that trade or business unless the corporation is entitled to relief under the permanent establishment provision of an applicable tax treaty, as discussed below. Such income tax, if imposed, would be based on effectively connected income computed in a manner generally analogous to that applied to the income of a U.S. corporation, except that a non-U.S. corporation is generally entitled to deductions and credits only if it timely files a U.S. federal income tax return. Global Indemnity and Global Indemnity Reinsurance are filing protective U.S. federal income tax returns on a timely basis in order to preserve the right to claim income tax deductions and credits if it is ever determined that it is subject to U.S. federal income tax. The highest marginal federal income tax rates to take effect in 2018 are 21% for a corporation’s effectively connected income and 30% for the branch profits tax.
If Global Indemnity Reinsurance is entitled to the benefits under the tax treaty between Bermuda and the United States (the “Bermuda Treaty”), Global Indemnity Reinsurance would not be subject to U.S. income tax on any business profits of its insurance enterprise found to be effectively connected with a U.S. trade or business, unless that trade or business is conducted through a permanent establishment in the United States. No regulations interpreting the Bermuda Treaty have been issued. Global Indemnity Reinsurance currently conducts its activities to reduce the risk that it will have a permanent establishment in the United States, although the Company cannot be certain that it will achieve this result.
An insurance enterprise resident in Bermuda generally will be entitled to the benefits of the Bermuda Treaty if (1) more than 50% of its shares are owned beneficially, directly or indirectly, by individual residents of the United States or Bermuda or U.S. citizens and (2) its income is not used in substantial part, directly or indirectly, to make disproportionate distributions to, or to meet certain liabilities to, persons who are neither residents of either the United States or Bermuda nor U.S. citizens. The Company cannot be certain that Global Indemnity Reinsurance will be eligible for Bermuda Treaty benefits in the future because of factual and legal uncertainties regarding the residency and citizenship of the Company’s shareholders.
Foreign insurance companies carrying on an insurance business within the United States have a certain minimum amount of effectively connected net investment income, determined in accordance with a formula that depends, in part, on the amount of U.S. risk insured or reinsured by such companies. If Global Indemnity Reinsurance is considered to be engaged in the conduct of an insurance business in the United States and it is not entitled to the benefits of the Bermuda Treaty in general (because it fails to qualify under the limitations on treaty benefits discussed above), the Code could subject a significant portion of Global Indemnity Reinsurance’s investment income to U.S. income tax. In addition, while the Bermuda Treaty clearly applies to premium income, it is uncertain whether the Bermuda Treaty applies to other income such as investment income. If Global Indemnity Reinsurance is considered engaged in the conduct of an insurance business in the United States and is entitled to the benefits of the Bermuda Treaty in general, but the Bermuda Treaty is interpreted to not apply to investment income, a significant portion of Global Indemnity Reinsurance’s investment income could be subject to U.S. federal income tax.
The United States also imposes an excise tax on insurance and reinsurance premiums paid to foreign insurers or reinsurers with respect to risks located in the United States. The rates of tax applicable to premiums paid to Global Indemnity Reinsurance on such business are 4% for direct insurance premiums and 1% for reinsurance premiums. Foreign corporations not engaged in a trade or business in the United States are subject to 30% U.S. income tax imposed by withholding on the gross amount of certain “fixed or determinable annual or periodic
31
Table of Contents
gains, profits and income” derived from sources within the United States (such as dividends and certain interest on investments), subject to exemption under the Code or reduction by applicable treaties. The Bermuda Treaty does not reduce the rate of tax in such circumstances.
Global Indemnity Group, Inc. is a Delaware corporation wholly owned by U.A.I. (Luxembourg) Investment S.à.r.l. Under U.S. federal income tax law, dividends and interest paid by a U.S. corporation to a non-U.S. shareholder are generally subject to a 30% withholding tax, unless reduced by treaty. The income tax treaty between Luxembourg and the United States (the “Luxembourg Treaty”) reduces the rate of withholding tax on interest payments to 0% and on dividends to 15%, or 5% (if the shareholder owns 10% or more of the company’s voting stock). There is a risk that interest paid by the Company’s U.S. subsidiary to a Luxembourg affiliate may be subject to a 30% withholding tax.
The Company’s U.S. subsidiaries are each subject to taxation in the United States at regular corporate rates. On December 22, 2017, the United States enacted the TCJA, which contains provisions that can materially affect the tax treatment of the Company’s U.S. subsidiaries. Although the TCJA reduced the U.S. corporate income tax rate to 21 percent, it also imposed a 10 percent base erosion minimum tax, or BEAT, on a U.S. corporation’s modified taxable income, which generally is the corporation’s taxable income calculated without regard to certain otherwise deductible payments made to certain foreign affiliates (including interest payments as well as gross premium or other consideration paid or accrued to a related foreign reinsurance company for reinsurance). In addition to BEAT, the TCJA limits the deductibility of interest expense and executive compensation by the Company’s U.S. subsidiaries. The Company is continuing to study the full extent of the impact of these and other provisions of the TCJA.
Available Information
The Company maintains a website at www.globalindemnity.ky. The information on the Company’s website is not incorporated herein by reference. The Company will make available, free of charge on its website, the most recent annual report on Form 10-K and subsequently filed quarterly reports on Form 10-Q, current reports on Form 8-K and amendments to those reports filed or furnished pursuant to Section 13(a) or 15(d) of the Securities Exchange Act of 1934, as amended, as soon as reasonably practicable after the Company files such material with, or furnishes it to, the United States Securities and Exchange Commission.
The public may also read and copy any materials the Company files with the U.S. Securities and Exchange Commission (“SEC”) at the SEC’s Public Reference Room at 100 F Street, NE, Washington, DC 20549 or by calling the SEC at 1-800-SEC-0330. The SEC maintains, free of charge, an Internet site (www.sec.gov) that contains reports, proxy and information statements, and other information regarding issuers that file electronically with the SEC.
| Item 1A. | RISK FACTORS |
The risks and uncertainties described below are those the Company believes to be material. If any of the following actually occur, the Company’s business, prospects, financial condition, results of operations and cash flows could be materially and adversely affected.
Risks Related to the Company’s Business
If actual claims payments exceed the Company’s reserves for losses and loss adjustment expenses, the Company’s financial condition and results of operations could be adversely affected.
The Company’s success depends upon its ability to accurately assess the risks associated with the insurance and reinsurance policies that it writes. The Company establishes reserves on an undiscounted basis to cover its estimated liability for the payment of all losses and loss adjustment expenses incurred with respect to premiums
32
Table of Contents
earned on the insurance policies that it writes. Reserves do not represent an exact calculation of liability. Rather, reserves are estimates of what the Company expects to be the ultimate cost of resolution and administration of claims under the insurance policies that it writes. These estimates are based upon actuarial and statistical projections, the Company’s assessment of currently available data, as well as estimates and assumptions as to future trends in claims severity and frequency, judicial theories of liability and other factors. The Company continually refines its reserve estimates in an ongoing process as experience develops and claims are reported and settled. The Company’s insurance subsidiaries obtain an annual statement of opinion from an independent actuarial firm on the reasonableness of these reserves.
Establishing an appropriate level of reserves is an inherently uncertain process. The following factors may have a substantial impact on the Company’s future actual losses and loss adjustment experience:
| • | claim and expense payments; |
| • | frequency and severity of claims; |
| • | legislative and judicial developments; and |
| • | changes in economic conditions, including the effect of inflation. |
For example, as industry practices and legal, judicial, social and other conditions change, unexpected and unintended exposures related to claims and coverage may emerge. Examples include claims relating to mold, asbestos and construction defects, as well as larger settlements and jury awards against professionals and corporate directors and officers. In addition, there is a growing trend of plaintiffs targeting property and casualty insurers in purported class action litigations relating to claims handling, insurance sales practices and other practices. These exposures may either extend coverage beyond the Company’s underwriting intent or increase the frequency or severity of claims. As a result, such developments could cause the Company’s level of reserves to be inadequate.
Actual losses and loss adjustment expenses the Company incurs under insurance policies that it writes may be different from the amount of reserves it establishes, and to the extent that actual losses and loss adjustment expenses exceed the Company’s expectations and the reserves reflected on its financial statements, the Company will be required to immediately reflect those changes by increasing its reserves. In addition, regulators could require that the Company increase its reserves if they determine that the reserves were understated in the past. When the Company increases reserves, pre-tax income for the period in which it does so will decrease by a corresponding amount. In addition to having an effect on reserves and pre-tax income, increasing or “strengthening” reserves causes a reduction in the Company’s insurance companies’ surplus and could cause the rating of its insurance company subsidiaries to be downgraded or placed on credit watch. Such a downgrade could, in turn, adversely affect the Company’s ability to sell insurance policies.
Catastrophic events can have a significant impact on the Company’s financial and operational condition.
Results of operations of property and casualty insurers are subject to man-made and natural catastrophes. The Company has experienced, and expects to experience in the future, catastrophe losses. It is possible that a catastrophic event or a series of multiple catastrophic events could have a material adverse effect on the Company’s operating results and financial condition. The Company’s operating results could be negatively impacted if it experiences losses from catastrophes that are in excess of the catastrophe reinsurance coverage of its Insurance Operations. The Company’s Reinsurance Operations also have exposure to losses from catastrophes as a result of the reinsurance treaties that it writes. Operating results could be negatively impacted if losses and expenses related to property catastrophe events exceed premiums assumed. Catastrophes include windstorms, hurricanes, typhoons, floods, earthquakes, tornadoes, tsunamis, hail, severe winter weather, fires and may include terrorist events such as the attacks of September 11, 2001. The Company cannot predict how severe a particular catastrophe may be until after it occurs. The extent of losses from catastrophes is a function of the total amount and type of losses incurred, the number of insureds affected, the frequency of the events and the severity of the
33
Table of Contents
particular catastrophe. Most catastrophes occur in small geographic areas. However, some catastrophes may produce significant damage in large, heavily populated areas.
The benefits of acquiring American Reliable may not be realized which could have a material adverse effect on the Company’s business operations and financial results.
There may be difficulties in the continued integration of American Reliable business, which could result in a failure to realize the potential benefits of the acquisition. Achieving the anticipated benefits of the acquisition will depend in part upon whether the common aspects of the business can continue to be integrated in an efficient and effective manner with Global Indemnity’s existing businesses. Furthermore, the risk that the Company’s or American Reliable’s prospective insurance premiums, investment yield, or net earnings are less than anticipated (including as a result of unexpected events, competition, costs, charges or outlays whether as a consequence of the transaction or otherwise) could negatively impact the Company’s profitability and results of operations.
A failure in the Company’s operational systems or infrastructure or those of third parties, including security breaches or cyber-attacks, could disrupt the Company’s business, its reputation, and / or cause losses which would have a material effect on the Company’s business operations and financial results.
The Company’s business is dependent upon the secure processing, storage, and transmission of information over computer networks using applications, systems and other technologies. The business depends on effective information security and systems to perform accounting, policy administration, claims, underwriting, actuarial and all aspects of day to day operations necessary to service the Company’s customers and agents, to value the Company’s investments and to timely and accurately report the Company’s financial results.
The information systems the Company relies upon must ensure confidentiality, integrity and availability of the data, including systems maintained by the Company as well as data in and assets held through third-party service providers and systems. The Company employs various measures, systems, applications and software to address the data security. The Company reviews its existing security measures and systems on a continuing basis through internal and independent evaluations. The Company has implemented administrative and technical controls and takes protective actions in an attempt to reduce the risk of cyber incidents.
The Company’s internal and external controls, processes, and the vendors used to protect networks, systems and applications, individually or together, may be insufficient to prevent a security incident. Employee or third party vendor errors, malicious acts, unauthorized access, computer viruses, malware, the introduction of malicious code, system failures and disruptions and or cyber-attacks can result in business interruption, compromise of data and loss of assets and that could have security consequences. Complexity of the Company’s technology increases regularly and has increased the risk of a security incident involving data, network, systems and applications.
The Company has, from time to time, experienced security incidents, none of which had a material adverse impact on the Company’s business, results of operations, or financial condition. Security incidents have the potential to interrupt business, cause delays in processes and procedures directly affecting the Company, and jeopardize the Company’s, insureds, claimants, agents and others confidential data resulting in data loss and loss of assets and reputational damages. If this occurs it could have a material adverse effect on the Company’s business operations and financial results.
Security incidents could require significant resources, both internal and external, to resolve or remediate and could result in financial losses that may not be covered by insurance or not fully recoverable under any insurance. The Company may be subject to litigation and damages or regulatory action under data protection and privacy laws and regulations enacted by federal, state and foreign governments, or other regulatory bodies. As a result, the Company’s ability to conduct its business and its results of operations might be materially and adversely affected.
34
Table of Contents
The Company’s failure to adequately protect personal information could have a material adverse effect on its business.
A wide variety of local, state, national, and international laws and regulations apply to the collection, use, retention, protection, disclosure, transfer and other processing of personal data, including laws mandating the privacy and security of personal health and financial data. These data protection and privacy-related laws and regulations are evolving and may result in ever-increasing regulatory and public scrutiny and escalating levels of enforcement and sanctions. The Company’s failure to comply with applicable laws and regulations, or to protect such data, could result in enforcement action against it, including fines, imprisonment of company officials and public censure, claims for damages by customers and other affected individuals, damage to the Company’s reputation and loss of goodwill (both in relation to existing customers and prospective customers), any of which could have a material adverse effect on its operations, financial performance and business.
Evolving and changing definitions of personal data and personal information within the European Union, the United States, and elsewhere may limit or inhibit the Company’s ability to operate or expand its business, including limiting technology alliance partners that may involve the sharing of data. Additionally, there is a risk that failures in systems designed to protect private, personal or proprietary data held by the Company will allow such data to be disclosed to or acquired or seen by others, resulting in potential regulatory investigations, enforcement actions, or penalties, remediation obligations and/or private litigation by parties whose data were improperly disclosed. There is also a risk that the Company could be found to have failed to comply with U.S. or foreign laws or regulations regarding the collection, consent, handling, transfer, or disposal of such privacy, personal or proprietary data, which could subject it to fines or other sanctions, as well as adverse reputational impact. Even the perception of privacy concerns, whether or not valid, may harm the Company’s reputation, inhibit adoption of its products by current and future customers, or adversely impact its ability to attract and retain workforce talent.
A decline in rating for any of the Company’s insurance or reinsurance subsidiaries could adversely affect its position in the insurance market; making it more difficult to market its insurance products and cause premiums and earnings to decrease.
If the rating of any of the companies in its Insurance Operations or Reinsurance Operations is reduced from its current level of “A” (Excellent) by A.M. Best, the Company’s competitive position in the insurance industry could suffer, and it could be more difficult to market its insurance products. A downgrade could result in a significant reduction in the number of insurance contracts the Company writes and in a substantial loss of business; as such business could move to other competitors with higher ratings, thus causing premiums and earnings to decrease.
Ratings have become an increasingly important factor in establishing the competitive position for insurance companies. A.M. Best ratings currently range from “A++” (Superior) to “F” (In Liquidation), with a total of 16 separate ratings categories. A.M. Best currently assigns the companies in the Insurance Operations and Reinsurance Operations a financial strength rating of “A” (Excellent), the third highest of their 16 rating categories. The objective of A.M. Best’s rating system is to provide potential policyholders an opinion of an insurer’s financial strength and its ability to meet ongoing obligations, including paying claims. In evaluating a company’s financial and operating performance, A.M. Best reviews its profitability, leverage and liquidity, its spread of risk, the quality and appropriateness of its reinsurance, the quality and diversification of its assets, the adequacy of its policy and loss reserves, the adequacy of its surplus, its capital structure, and the experience and objectives of its management. These ratings are based on factors relevant to policyholders, general agencies, insurance brokers, reinsurers, and intermediaries and are not directed to the protection of investors. These ratings are not an evaluation of, nor are they directed to, investors in the Company’s A ordinary shares and are not a recommendation to buy, sell or hold the Company’s A ordinary shares. Publications of A.M. Best indicate that companies are assigned “A” (Excellent) ratings if, in A.M. Best’s opinion, they have an excellent ability to meet their ongoing obligations to policyholders. These ratings are subject to periodic review by, and may be revised downward or revoked at the sole discretion of A.M. Best.
35
Table of Contents
The Company cannot guarantee that its reinsurers will pay in a timely fashion, if at all, and as a result, the Company could experience losses.
The Company cedes a portion of gross premiums written to third party reinsurers under reinsurance contracts. Although reinsurance makes the reinsurer liable to the Company to the extent the risk is transferred, it does not relieve the Company of its liability to its policyholders. Upon payment of claims, the Company will bill its reinsurers for their share of such claims. The reinsurers may not pay the reinsurance receivables that they owe to the Company or they may not pay such receivables on a timely basis. If the reinsurers fail to pay it or fail to pay on a timely basis, the Company’s financial results would be adversely affected. Lack of reinsurer liquidity, perceived improper underwriting, or claim handling by the Company, and other factors could cause a reinsurer not to pay. See “Business — Reinsurance of Underwriting Risk” in Item 1 of Part I of this report.
See Note 9 of the notes to consolidated financial statements in Item 8 of Part II of this report for further information surrounding the Company’s reinsurance receivable balances as of December 31, 2017 and 2016.
The Company’s investment performance may suffer as a result of adverse capital market developments or other factors, which would in turn adversely affect its financial condition and results of operations.
The Company derives a significant portion of its income from its invested assets. As a result, the Company’s operating results depend in part on the performance of its investment portfolio. The Company’s operating results are subject to a variety of investment risks, including risks relating to general economic conditions, market volatility, interest rate fluctuations, liquidity risk and credit and default risk. The fair value of fixed income investments can fluctuate depending on changes in interest rates and the credit quality of underlying issuers. Generally, the fair market value of these investments has an inverse relationship with changes in interest rates, while net investment income earned by the Company from future investments in fixed maturities will generally increase or decrease with changes in interest rates. Additionally, with respect to certain of its investments, the Company is subject to pre-payment or reinvestment risk.
Credit tightening could negatively impact the Company’s future investment returns and limit the ability to invest in certain classes of investments. Credit tightening may cause opportunities that are marginally attractive to not be financed, which could cause a decrease in the number of bond issuances. If marginally attractive opportunities are financed, they may be at higher interest rates, which would cause credit risk of such opportunities to increase. If new debt supply is curtailed, it could cause interest rates on securities that are deemed to be credit-worthy to decline. Funds generated by operations, sales, and maturities will need to be invested. If the Company invests during a tight credit market, investment returns could be lower than the returns the Company is currently realizing and/or it may have to invest in higher risk securities.
With respect to its longer-term liabilities, the Company strives to structure its investments in a manner that recognizes liquidity needs for its future liabilities. However, if the Company’s liquidity needs or general and specific liability profile unexpectedly changes, it may not be successful in continuing to structure its investment portfolio in that manner. To the extent that the Company is unsuccessful in correlating its investment portfolio with its expected liabilities, the Company may be forced to liquidate its investments at times and prices that are not optimal, which could have a material adverse effect on the performance of its investment portfolio. The Company refers to this risk as liquidity risk, which is when the fair value of an investment is not able to be realized due to low demand by outside parties in the marketplace.
The Company is also subject to credit risk due to non-payment of principal or interest. Several classes of securities that the Company holds have default risk. As interest rates rise for companies that are deemed to be less creditworthy, there is a greater risk that they will be unable to pay contractual interest or principal on their debt obligations.
Interest rates are highly sensitive to many factors, including governmental monetary policies, domestic and international economic and political conditions and other factors beyond the Company’s control. Although the
36
Table of Contents
Company attempts to take measures to manage the risks of investing in a changing interest rate environment, the Company may not be able to mitigate interest rate sensitivity effectively. A significant increase in interest rates could have a material adverse effect on the market value of the Company’s fixed maturities securities.
The Company also has an equity portfolio. The performance of the Company’s equity portfolio is dependent upon a number of factors, including many of the same factors that affect the performance of its fixed income investments, although those factors sometimes have the opposite effect on the performance of the equity portfolio. Individual equity securities have unsystemic risk. The Company could experience market declines on these investments. The Company also has systemic risk, which is the risk inherent in the general market due to broad macroeconomic factors that affect all companies in the market. If the market indexes were to decline, the Company anticipates that the value of its portfolio would be negatively affected.
The Company has investments in limited partnerships which are not liquid. The Company does not have the contractual option to redeem its limited partnership interests but receives distributions based on the liquidation of the underlying assets. The Company does not have the ability to sell or transfer its limited partnership interests without consent from the general partner. The Company’s returns could be negatively affected if the market value of the partnerships declines. If the Company needs liquidity, it might be forced to liquidate other investments at a time when prices are not optimal.
See Note 5 of the notes to consolidated financial statements in Item 8 of Part II of this report for further information surrounding the Company’s investments as of December 31, 2017 and 2016.
Deterioration in the debt and equity markets could result in a margin call which could have a material adverse effect on the Company’s financial condition and/or results of operations.
The collateral backing the Company’s margin borrowing facility currently consist of equity securities but could also include fixed income securities in the future. Declines in financial markets could negatively impact the value of the Company’s collateral. Adverse changes in market value could result in a margin call which would require the posting of additional collateral thereby reducing liquidity. Additionally, if such a margin call is not met, the Company could be required to liquidate securities and incur realized losses or it could potentially decrease the Company’s borrowing capacity.
Borrowings under the Company’s margin borrowing facility are based upon a variable rate of interest, which could result in higher expense in the event of increases in interest rates.
As of December 31, 2017, $72.2 million of the Company’s outstanding indebtedness bore interest at a rate that varies depending upon the Fed Funds Effective rate. If Fed Funds Effective rate rises, the interest rates on outstanding debt will increase resulting in increased interest payment obligations under the Company’s margin borrowing facility. This could have a negative effect on the Company’s cash flow and financial condition.
The Company’s outstanding indebtedness could adversely affect its financial flexibility and a failure to make periodic payments related to the Subordinated Notes could adversely affect the Company.
In 2015, the Company sold $100 million aggregate principal amount of its 7.75% Subordinated Notes due in 2045. In 2017, the Company sold $130 million aggregate principal amount of its 7.875% Subordinated Notes due in 2047. The level of debt outstanding could adversely affect the Company’s financial flexibility, including:
| • | increasing vulnerability to changing economic, regulatory and industry conditions; |
| • | limiting the ability to borrow additional funds; and |
| • | requiring the Company to dedicate a substantial portion of cash flow from operations to debt payments, thereby, reducing funds available for working capital, capital expenditures, acquisitions and other purposes. |
37
Table of Contents
Furthermore, failure by the Company to make periodic payments related to its outstanding indebtedness could impact rating agencies and regulators assessment of the Company’s capital position, adequacy and flexibility and therefore, the financial strength ratings of rating agencies, and regulators’ assessment of the solvency of the Company and its subsidiaries.
The Company is dependent on its senior executives and the loss of any of these executives or the Company’s inability to attract and retain other key personnel could adversely affect its business.
The Company’s success depends upon its ability to attract and retain qualified employees and upon the ability of senior management and other key employees to implement the Company’s business strategy. The Company believes there are a limited number of available, qualified executives in the business lines in which it competes. The success of the Company’s initiatives and future performance depend, in significant part, upon the continued service of the senior management team. The future loss of any of the services of members of the Company’s senior management team or the inability to attract and retain other talented personnel could impede the further implementation of the Company’s business strategy, which could have a material adverse effect on its business. In addition, the Company does not currently maintain key man life insurance policies with respect to any of its employees.
Employee error and misconduct may be difficult to detect and prevent and could adversely affect the Company’s business, results of operations, financial condition and reputation.
Losses may result from, among other things, fraud, errors, failure to document transactions properly, failure to obtain proper internal authorization, or failure to comply with regulatory requirements. It is not always possible to deter or prevent employee misconduct and the precautions the Company takes to prevent and detect this activity may not be effective in all cases. Resultant losses could adversely affect the Company’s business, results of operations, financial condition and reputation.
Since the Company depends on professional general agencies, brokers, other insurance companies and other reinsurance companies for a significant portion of its revenue, a loss of any one of them could adversely affect the Company.
The Company markets and distributes its insurance products through a group of approximately 395 professional general agencies that have specific quoting and binding authority and that in turn sell the Company’s insurance products to insureds through retail insurance brokers. The Company also markets and distributes its reinsurance products through third-party brokers, insurance companies and reinsurance companies. A loss of all or substantially all of the business produced by any one of these general agencies, brokers, insurance companies or reinsurance companies could have an adverse effect on the Company’s results of operations.
If market conditions cause reinsurance to be more costly or unavailable, the Company may be required to bear increased risks or reduce the level of its underwriting commitments.
As part of the Company’s overall strategy of risk and capacity management, it purchases reinsurance for a portion of the risk underwritten by its insurance subsidiaries. Market conditions beyond the Company’s control determine the availability and cost of the reinsurance it purchases, which may affect the level of its business and profitability. The Company’s third party reinsurance facilities are generally subject to annual renewal. The Company may be unable to maintain its current reinsurance facilities or obtain other reinsurance facilities in adequate amounts and at favorable rates. If the Company is unable to renew expiring facilities or obtain new reinsurance facilities, either the net exposure to risk would increase or, if the Company is unwilling to bear an increase in net risk exposures, it would have to reduce the amount of risk it underwrites.
38
Table of Contents
The Company’s financial and business results may fluctuate as a result of many factors, including cyclical changes in the insurance industry.
Historically, the results of companies in the property and casualty insurance industry have been subject to significant fluctuations and uncertainties. The industry’s profitability can be affected significantly by:
| • | competition; |
| • | capital capacity; |
| • | rising levels of actual costs that are not foreseen by companies at the time they price their products; |
| • | volatile and unpredictable developments, including man-made, weather-related and other natural catastrophes or terrorist attacks; |
| • | changes in loss reserves resulting from the general claims and legal environments as different types of claims arise and judicial interpretations relating to the scope of insurers’ liability develop; and |
| • | fluctuations in interest rates, inflationary pressures and other changes in the investment environment, which affect returns on invested assets and may affect the ultimate payout of losses. |
The demand for property and casualty insurance and reinsurance can also vary significantly, rising as the overall level of economic activity increases and falling as that activity decreases. The property and casualty insurance industry historically is cyclical in nature. These fluctuations in demand and competition could produce underwriting results that would have a negative impact on the Company’s consolidated results of operations and financial condition.
The Company faces significant competitive pressures in its business that could cause demand for its products to fall and adversely affect the Company’s profitability.
The Company competes with a large number of other companies in its selected lines of business. The Company competes, and will continue to compete, with major U.S. and non-U.S. insurers and other regional companies, as well as mutual companies, specialty insurance companies, reinsurance companies, underwriting agencies and diversified financial services companies. The Company’s competitors include, among others: American International Group, American Modern Insurance Group, Argo Group International Holdings, Ltd., Berkshire Hathaway, Everest Re Group, Ltd., Foremost Insurance Group, Great American Insurance Group, HCC Insurance Holdings, Inc., IFG Companies, Markel Corporation, Nationwide Insurance, Navigators Insurance Group, RLI Corporation, Selective Insurance Group, Inc., The Travelers Companies, Inc., Validus Group, and W.R. Berkley Corporation. Some of the Company’s competitors have greater financial and marketing resources than the Company does. The Company’s profitability could be adversely affected if it loses business to competitors offering similar products at or below the Company’s prices.
The Company’s general agencies typically pay the insurance premiums on business they have bound to the Company on a monthly basis. This accumulation of balances due to the Company exposes it to credit risk.
Insurance premiums generally flow from the insured to their retail broker, then into a trust account controlled by the Company’s professional general agencies. The Company’s professional general agencies are typically required to forward funds, net of commissions, to the Company following the end of each month. Consequently, the Company assumes a degree of credit risk on the aggregate amount of these balances that have been paid by the insured but have yet to reach the Company.
Brokers, insurance companies and reinsurance companies typically pay premiums on reinsurance treaties written with the Company on a quarterly basis. This accumulation of balances due to the Company exposes it to credit risk.
Assumed premiums on reinsurance treaties generally flow from the ceding companies to the Company on a quarterly basis. In some instances, the reinsurance treaties allow for funds to be withheld for longer periods as
39
Table of Contents
specified in the treaties. Consequently, the Company assumes a degree of credit risk on the aggregate amount of these balances that have been collected by the reinsured but have yet to reach the Company.
Because the Company provides its general agencies with specific quoting and binding authority, if any of them fail to comply with pre-established guidelines, the Company’s results of operations could be adversely affected.
The Company markets and distributes its insurance products through professional general agencies that have limited quoting and binding authority and that in turn sell the Company’s insurance products to insureds through retail insurance brokers. These professional general agencies can bind certain risks without the Company’s initial approval. If any of these wholesale professional general agencies fail to comply with the Company’s underwriting guidelines and the terms of their appointment, the Company could be bound on a particular risk or number of risks that were not anticipated when it developed the insurance products or estimated loss and loss adjustment expenses. Such actions could adversely affect the Company’s results of operations.
The Company’s holding company structure and regulatory constraints limit its ability to receive dividends from subsidiaries in order to meet its cash requirements.
Global Indemnity is a holding company and, as such, has no substantial operations of its own. The Company’s assets primarily consist of cash and ownership of the shares of its direct and indirect subsidiaries. Dividends and other permitted distributions from insurance subsidiaries, which include payment for equity awards granted by Global Indemnity to employees of such subsidiaries, are expected to be Global Indemnity’s sole source of funds to meet ongoing cash requirements, including debt service payments and other expenses.
Due to its corporate structure, most of the dividends that Global Indemnity receives from its subsidiaries must pass through Global Indemnity Reinsurance. The inability of Global Indemnity Reinsurance to pay dividends in an amount sufficient to enable Global Indemnity to meet its cash requirements at the holding company level could have a material adverse effect on its operations.
Bermuda law does not permit payment of dividends or distributions of contributed surplus by a company if there are reasonable grounds for believing that the company, after the payment is made, would be unable to pay its liabilities as they become due, or the realizable value of the company’s assets would be less, as a result of the payment, than the aggregate of its liabilities and its issued share capital and share premium accounts. Furthermore, pursuant to the Bermuda Insurance Act 1978, an insurance company is prohibited from declaring or paying a dividend during the financial year if it is in breach of its minimum solvency margin or minimum liquidity ratio or if the declaration or payment of such dividends would cause it to fail to meet such margin or ratio. See “Regulation — Bermuda Insurance Regulation” in Item 1 of Part I of this report.
In addition, the Company’s U.S. insurance subsidiaries, which are indirect subsidiaries of Global Indemnity Reinsurance, are subject to significant regulatory restrictions limiting their ability to declare and pay dividends, which must first pass through Global Indemnity Reinsurance before being paid to Global Indemnity. See “Regulation — U.S. Regulation” in Item 1 of Part I of this report. Also, see Note 19 of the notes to consolidated financial statements in Item 8 of Part II of this report for the maximum amount of dividends that could be paid by the Company’s U.S. insurance subsidiaries in 2017.
The Company’s businesses are heavily regulated and changes in regulation may limit the way it operates.
The Company is subject to extensive supervision and regulation in the U.S. states in which the Insurance Operations operate. This is particularly true in those states in which the Company’s insurance subsidiaries are licensed, as opposed to those states where its insurance subsidiaries write business on a surplus lines basis. The supervision and regulation relate to numerous aspects of the Company’s business and financial condition. The primary purpose of the supervision and regulation is the protection of the Company’s insurance policyholders and not its investors. The extent of regulation varies, but generally is governed by state statutes. These statutes
40
Table of Contents
delegate regulatory, supervisory, and administrative authority to state insurance departments. This system of regulation covers, among other things:
| • | standards of solvency, including risk-based capital measurements; |
| • | restrictions on the nature, quality and concentration of investments; |
| • | restrictions on the types of terms that the Company can include or exclude in the insurance policies it offers; |
| • | restrictions on the way rates are developed and the premiums the Company may charge; |
| • | standards for the manner in which general agencies may be appointed or terminated; |
| • | credit for reinsurance; |
| • | certain required methods of accounting; |
| • | reserves for unearned premiums, losses and other purposes; and |
| • | potential assessments for the provision of funds necessary for the settlement of covered claims under certain insurance policies provided by impaired, insolvent or failed insurance companies. |
The statutes or the state insurance department regulations may affect the cost or demand for the Company’s products and may impede the Company from obtaining rate increases or taking other actions it might wish to take to increase profitability. Further, the Company may be unable to maintain all required licenses and approvals and its business may not fully comply with the wide variety of applicable laws and regulations or the relevant authority’s interpretation of the laws and regulations. Also, regulatory authorities have discretion to grant, renew or revoke licenses and approvals subject to the applicable state statutes and appeal process. If the Company does not have the requisite licenses and approvals (including in some states the requisite secretary of state registration) or do not comply with applicable regulatory requirements, the insurance regulatory authorities could stop or temporarily suspend the Company from carrying on some or all of its activities or monetarily penalize the Company.
The U.S. insurance regulatory framework has come under increased federal scrutiny and some state legislators have considered or enacted laws that may alter or increase state regulation of insurance and reinsurance companies and holding companies. Moreover, the NAIC, which is an association of the insurance commissioners of all 50 U.S. States and the District of Columbia, and state insurance regulators regularly re-examine existing laws and regulations. Changes in these laws and regulations or the interpretation of these laws and regulations could have a material adverse effect on the Company’s business.
Although the U.S. federal government has not historically regulated the insurance business, there have been proposals from time to time to impose federal regulation on the insurance industry. In 2010, the President signed into law the Dodd-Frank Act. Among other things, the Dodd-Frank Act establishes a Federal Insurance Office within the U.S. Department of the Treasury. The Federal Insurance Office initially has limited regulatory authority and is empowered to gather data and information regarding the insurance industry and insurers, including conducting a study for submission to the U.S. Congress on how to modernize and improve insurance regulation in the U.S. Further, the Dodd-Frank Act gives the Federal Reserve supervisory authority over a number of financial services companies, including insurance companies, if they are designated by a two-thirds vote of a Financial Stability Oversight Council as “systemically important.” While the Company does not believe that it is “systemically important,” as defined in the Dodd-Frank Act, it is possible that the Financial Stability Oversight Council may conclude that it is. If the Company were designated as “systemically important,” the Federal Reserve’s supervisory authority could include the ability to impose heightened financial regulation and could impact requirements regarding the Company’s capital, liquidity, leverage, business and investment conduct. As a result of the foregoing, the Dodd-Frank Act, or other additional federal regulation that is adopted in the future, could impose significant burdens on the Company, including impacting the ways in which it conducts business, increasing compliance costs and duplicating state regulation, and could result in a competitive disadvantage, particularly relative to smaller insurers who may not be subject to the same level of regulation.
41
Table of Contents
The interests of holders of A ordinary shares may conflict with the interests of the Company’s controlling shareholder.
Fox Paine & Company, LLC (“Fox Paine & Company”) beneficially owns shares having approximately 83% of the Company’s total voting power. The percentage of the Company’s total voting power that Fox Paine & Company may exercise is greater than the percentage of the Company’s total shares that Fox Paine & Company beneficially owns because Fox Paine & Company beneficially owns all of the Company’s B ordinary shares, which have ten votes per share as opposed to A ordinary shares, which have one vote per share. The A ordinary shares and the B ordinary shares generally vote together as a single class on matters presented to the Company’s shareholders. Based on the ownership structure of the affiliates of Fox Paine & Company that own these shares, these affiliates are not subject to the voting restriction contained in the Company’s articles of association. As a result, Fox Paine & Company has and will continue to have control over the outcome of certain matters requiring shareholder approval, including the power to, among other things:
| • | elect all of the Company’s directors; |
| • | amend the Company’s articles of association (as long as their voting power is greater than 66%); |
| • | ratify the appointment of the Company’s auditors; |
| • | increase the Company’s share capital; and |
| • | resolve to pay dividends or distributions; |
Subject to certain exceptions, Fox Paine & Company may also be able to prevent or cause a change of control. Fox Paine & Company’s control over the Company, and Fox Paine & Company’s ability in certain circumstances to prevent or cause a change of control, may delay or prevent a change of control, or cause a change of control to occur at a time when it is not favored by other shareholders. As a result, the trading price of the Company’s A ordinary shares could be adversely affected.
In addition, the Company has agreed to pay Fox Paine & Company an annual management fee of $1.9 million, adjusted annually to reflect change in the consumer price index published by the US Department of Labor Bureau of Labor Statistics “CPI-U”, in exchange for management services. The Company has also agreed to pay a termination fee of cash in an amount to be agreed upon, plus reimbursement of expenses, upon the termination of Fox Paine & Company’s management services in connection with the consummation of a change of control transaction that does not involve Fox Paine & Company and its affiliates. The Company has also agreed to pay Fox Paine & Company a transaction advisory fee of cash in an amount to be agreed upon, plus reimbursement of expenses upon the consummation of a change of control transaction that does not involve Fox Paine & Company and its affiliates in exchange for advisory services to be provided by Fox Paine & Company in connection therewith. Fox Paine & Company may in the future make significant investments in other insurance or reinsurance companies. Some of these companies may compete with the Company or its subsidiaries. Fox Paine & Company is not obligated to advise the Company of any investment or business opportunities of which they are aware, and they are not prohibited or restricted from competing with the Company or its subsidiaries.
The Company’s controlling shareholder has the contractual right to nominate a certain number of the members of the Board of Directors and also otherwise controls the election of Directors due to its ownership.
While Fox Paine & Company has the right under the terms of the memorandum and articles of association to nominate a certain number of directors of the Board of Directors, dependent on Fox Paine & Company’s percentage ownership of voting shares in the Company for so long as Fox Paine & Company hold an aggregate 25% or more of the voting power in the Company, it also controls the election of all directors to the Board of Directors due to its controlling share ownership. The Company’s Board of Directors currently consists of nine directors, all of whom were identified and proposed for consideration for the Board of Directors by Fox Paine & Company.
42
Table of Contents
The Company’s Board of Directors, in turn, and subject to its fiduciary duties under Cayman Island law, appoints the members of the Company’s senior management, who also have fiduciary duties to the Company. As a result, Fox Paine & Company effectively has the ability to control the appointment of the members of the Company’s senior management and to prevent any changes in senior management that other shareholders or other members of the Board of Directors may deem advisable.
Because the Company relies on certain services provided by Fox Paine & Company, the loss of such services could adversely affect its business.
Fox Paine & Company provides certain management services to the Company. To the extent that Fox Paine & Company is unable or unwilling to provide similar services in the future, and the Company is unable to perform those services itself or is unable to secure replacement services, the Company’s business could be adversely affected.
The U.S. and global economic and financial industry downturns could harm the Company’s business, its liquidity and financial condition, and its stock price.
In past years, global market and economic conditions were severely disrupted. New disruptions may potentially affect (among other aspects of the Company’s business) the demand for and claims made under the Company’s products, the ability of customers, counterparties and others to establish or maintain their relationships with the Company, its ability to access and efficiently use internal and external capital resources, the availability of reinsurance protection, the risks the Company assumes under reinsurance programs, and the Company’s investment performance. Continued volatility in the U.S. and other securities markets may adversely affect the Company’s stock price.
If the Company is unable to maintain effective internal control over financial reporting, the Company’s business may be adversely affected, investors may lose confidence in the accuracy and completeness of the Company’s financial reports and the market price of the Company’s common stock could be adversely affected.
Global Indemnity is required to maintain internal control over financial reporting and to report any material weaknesses in such internal control. The Sarbanes-Oxley Act requires that the Company evaluate and determine the effectiveness of its internal control over financial reporting,provide a management report on internal control over financial reporting and requires that the Company’s internal control over financial reporting be attested to by its independent registered public accounting firm. In 2014, the Company identified a material weakness in internal control over financial reporting, which was remediated in 2015.
Global Indemnity may discover other material weaknesses in the future which may lead to its financial statements being materially misstated. As a result, , the market price of the Company’s common stock could be adversely affected, and the Company could become subject to investigations by the stock exchange on which its securities are listed, the SEC, or other regulatory authorities, which could require additional financial and management resources. The cost of remediating a potential material weakness could materially adversely affect the Company’s business and financial condition.
The Company’s operating results and shareholders’ equity may be adversely affected by currency fluctuations.
The Company’s functional currency is the U.S. dollar. The Reinsurance Operations conducts business with some customers in foreign currencies and several of the Company’s U.S. and non-U.S. subsidiaries maintains investments and cash accounts in foreign currencies. At period-end, the Company re-measures non-U.S. currency financial assets to their current U.S. dollar equivalent. The resulting gain or loss for foreign denominated investments is reflected in accumulated other comprehensive income in shareholders’ equity; whereas, the gain or loss on foreign denominated cash accounts is reflected in income during the period. Financial liabilities, if any,
43
Table of Contents
are generally adjusted within the reserving process. However, for known losses on claims to be paid in foreign currencies, the Company re-measures the liabilities to their current U.S. dollar equivalent each period end with the resulting gain or loss reflected in income during the period. Foreign exchange risk is reviewed as part of the Company’s risk management process. The Company may experience losses resulting from fluctuations in the values of non-U.S. currencies relative to the strength of the U.S. dollar, which could adversely impact the Company’s results of operations and financial condition.
The Company is incorporated in the Cayman Islands and some of its assets are located outside the United States. As a result, it might not be possible for shareholders to enforce civil liability provisions of the federal or state securities laws of the United States.
The Company is organized under the laws of the Cayman Islands and some of its assets are located outside the United States. A judgment for the payment of money rendered by a court in the United States based on civil liability would not be automatically enforceable in the Cayman Islands. There is no treaty between the Cayman Islands, or the United Kingdom (of which the Cayman Islands is an Overseas Territory) and the United States providing for the reciprocal enforcement of foreign judgments. Similarly, judgments might not be enforceable in countries other than the United States where the Company has assets.
Cayman Islands law differs from the laws in effect in the United States and might afford less protection to shareholders.
The Company’s shareholders could have more difficulty protecting their interests than would shareholders of a corporation incorporated in a jurisdiction of the United States. It may be difficult for a shareholder to effect service of process within the U.S. or to enforce judgments obtained against the Company in U.S. courts. The Company has irrevocably agreed that it may be served with process with respect to actions based on offers and sales of securities made in the U.S. by having Global Indemnity Group, Inc. be the Company’s U.S. agent appointed for that purpose. A Cayman court may impose civil liability on the Company or its directors or officers in a suit brought in the Cayman courts against the Company or such persons with respect to a violation of U.S. federal securities laws, provided that the facts surrounding such violation would constitute or give rise to a cause of action under Cayman law.
Risks Related to Taxation
Legislative and regulatory action by the U.S. Congress could materially and adversely affect the Company.
The Company’s tax position could be adversely impacted by changes in tax laws, tax treaties or tax regulations or the interpretation or enforcement thereof. Legislative action may be taken by the U.S. Congress which, if ultimately enacted, could, among other things, override tax treaties upon which the Company relies or could broaden the circumstances under which the Company would be considered a U.S. resident, any of which could materially and adversely affect the Company’s effective tax rate and cash tax position.
Recent changes in U.S. tax law may increase taxes of the Company’s U.S. Subsidiaries.
On December 22, 2017, the United States enacted a budget reconciliation act amending the Internal Revenue Code of 1986. The TCJA contains provisions that can materially affect the tax treatment of the Company’s U.S. subsidiaries. Among other things, the TCJA reduces the U.S. corporate income tax rate to 21 percent, imposes a 10 percent base erosion minimum tax (“BEAT”) on income of a U.S. corporation determined without regard to certain otherwise deductible payments made to certain foreign affiliates (including interest payments as well as gross premium or other consideration paid or accrued to a related foreign reinsurance company for reinsurance), and limits the deductibility of interest expense and executive compensation.
While the Company is continuing to study the impact of the TCJA, it is possible that the TCJA may reduce the benefits of lower effective tax rates enjoyed as a non-U.S. company, add expense and have an adverse effect on
44
Table of Contents
the Company’s results of operations. Further, in absence of guidance on various uncertainties and ambiguities in the application of certain provisions of the TCJA, the Company will use what it believes are reasonable interpretations and assumptions in applying the TCJA, but it is possible that the Treasury or the IRS could issue subsequent regulations or guidance that differ from the Company’s prior interpretations and assumptions, which could materially affect the Company’s effective tax rate and cash tax position.
Interest paid by the Company’s U.S. subsidiaries to their foreign affiliates is subject to multiple tax-related risks including risks that the interest may become subject to a minimum U.S. federal income tax under BEAT, subject to a 30% U.S. withholding tax, subject to foreign income tax, and non-deductible in whole or in part for U.S. federal income tax purposes.
The TCJA has created new rules that limit the deductibility of interest for U.S. federal income tax purposes, which may cause some or all of the deduction for interest paid by the Company’s U.S. subsidiaries to be denied for U.S. federal income tax purposes. Second, to the extent interest paid is deductible by the Company’s U.S. Subsidiaries, such U.S. subsidiaries may become subject to a minimum U.S. federal income tax charge under BEAT. Third, should interest paid by the Company’s U.S. subsidiaries to their foreign affiliates become ineligible under an applicable income tax treaty between the United States and the recipient’s jurisdiction of tax residence, such interest could become subject to a 30% U.S. withholding tax. Finally, interest paid by the Company’s U.S. subsidiaries to their foreign affiliates may become subject to income tax in the recipient’s jurisdiction of tax residence, without regard to whether there is any corresponding tax deduction in the United States, potentially subjecting such interest payments to double taxation.
Global Indemnity or Global Indemnity Reinsurance may be subject to U.S. tax that may have a material adverse effect on Global Indemnity’s or Global Indemnity Reinsurance’s results of operations.
Global Indemnity is a Cayman company and Global Indemnity Reinsurance is a Bermuda company. The Company seeks to manage its business in a manner designed to reduce the risk that Global Indemnity and Global Indemnity Reinsurance will be treated as being engaged in a U.S. trade or business for U.S. federal income tax purposes. However, because there is considerable uncertainty as to the activities that constitute being engaged in a trade or business within the United States, the Company cannot be certain that the U.S. Internal Revenue Service will not contend successfully that Global Indemnity or Global Indemnity Reinsurance is or has been engaged in a trade or business in the United States. If Global Indemnity or Global Indemnity Reinsurance were considered to be engaged in a business in the United States, the Company could be subject to U.S. corporate income and branch profits taxes on the portion of its earnings effectively connected to such U.S. business, in which case its results of operations could be materially adversely affected.
U.S. persons who hold shares in the Company may be subject to U.S. income taxation at ordinary income rates on the Company’s undistributed earnings and profits.
Controlled Foreign Corporation (“CFC”) Status: The Company’s organizational documents provide, subject to certain exceptions applicable to Fox Paine Company and its affiliates, that if the shares owned, directly, indirectly or by attribution, by any person would otherwise represent more than 9.5% of the aggregate voting power of all the Company’s shares, the voting rights attached to those shares will be reduced so that such person may not exercise and is not attributed more than 9.5% of the total voting power of the shares. These provisions were intended to reduce the likelihood that a shareholder of the Company would be a “10 % U.S. Shareholder” as defined below, and that the Company and its non-US subsidiaries are treated as CFCs in any taxable year.
Prior to the enactment of the TCJA a “10 % U.S. Shareholder” was any shareholder that is a U.S. person that owns directly, indirectly or by attribution, 10% or more of the total voting power of the Company. However, for
45
Table of Contents
taxable years beginning after December 31, 2017, the TCJA expands the definition of a “10 % U.S. Shareholder” to include U.S. persons that own directly, indirectly or by attribution, 10% or more of either the total voting power of the Company or total value of the stock of the Company. By expanding the definition to also reference value, the TCJA will increase the likelihood that the Company and its non-U.S. subsidiaries will be treated as CFCs in 2018 and in any subsequent taxable years.
If the Company were considered a CFC, any 10 % U.S. Shareholder may be subject to current U.S. income taxation at ordinary income tax rates on all or a portion of the Company’s undistributed earnings and profits attributable to the Company’s insurance and reinsurance income, including underwriting and investment income. Any gain realized on a sale of common shares by such shareholder may also be taxed as a dividend to the extent of the Company’s earnings and profits attributed to such shares during the period that the shareholder held the shares and while the Company was a CFC (with certain adjustments).
Related Person Insurance Income: If the related person insurance income (“RPII”) of any of the Company’s non-U.S. insurance subsidiaries were to equal or exceed 20% of that subsidiary’s gross insurance income in any taxable year, and U.S. persons were treated as owning 25% or more of the subsidiary’s stock, by vote or value, a U.S. person who directly or indirectly owns any common shares on the last day of such taxable year on which the 25% threshold is met would be required to include in income for U.S. federal income tax purposes that person’s ratable share of that subsidiary’s RPII for the taxable year. The amount to be included in income is determined as if the RPII were distributed proportionately to U.S. shareholders on that date, regardless of whether that income is distributed. The amount of RPII to be included in income is limited by such shareholder’s share of the subsidiary’s current-year earnings and profits, and possibly reduced by the shareholder’s share of prior year deficits in earnings and profits. The amount of RPII earned by a subsidiary will depend on several factors, including the identity of persons directly or indirectly insured or reinsured by that subsidiary. Although the Company does not believe that the 20% threshold will be met for its non-U.S. insurance subsidiaries, some of the factors that might affect that determination in any period may be beyond the Company’s control. Consequently, the Company cannot assure that it will not exceed the RPII threshold in any taxable year.
If a U.S. person disposes of shares in a non-U.S. insurance corporation that had RPII (even if the 20% threshold was not met) and the 25% threshold is met at any time during the five-year period ending on the date of disposition, and the U.S. person owned any shares at such time, any gain from the disposition will generally be treated as a dividend to the extent of the holder’s share of the corporation’s undistributed earnings and profits that were accumulated during the period that the holder owned the shares (possibly whether or not those earnings and profits are attributable to RPII). In addition, the shareholder will be required to comply with specified reporting requirements, regardless of the amount of shares owned. The Company believes that those rules should not apply to a disposition of common shares because the Company is not itself directly engaged in the insurance business. The Company cannot assure, however, that the IRS will not successfully assert that those rules apply to a disposition of its shares.
U.S. persons who hold shares in the Company could be subject to adverse tax consequences if the Company is considered a passive foreign investment company for U.S. federal income tax purposes.
If the Company is considered a passive foreign investment company (“PFIC”) for U.S. federal income tax purposes, a U.S. holder who owns shares in the Company could be subject to adverse tax consequences, including a greater tax liability than might otherwise apply and an interest charge on certain taxes that are deferred as a result of the Company’s non-U.S. status. The Company does not believe that the it was a PFIC for U.S. federal income tax purposes for the taxable year ending on December 31, 2017 because the Company believes that it should be considered, through Global Indemnity Reinsurance Company, Ltd., to be engaged in the active conduct of a global insurance and reinsurance business. The Company cannot provide assurance that the Company will not be deemed to be a PFIC by the IRS.
Further, TCJA limited the exception applicable to corporations engaged in the active conduct of an insurance business by requiring that the applicable insurance liabilities of such corporation exceed 25 percent of its total
46
Table of Contents
assets for the exception to apply. It is unclear regarding how liability reserves are measured and taken into account for purposes of determining the applicable insurance liabilities. In addition, there are no currently effective Treasury Regulations regarding the application of the PFIC provisions to an insurance company, although proposed regulations were published in April 2015, which do not take into account the recent changes to the PFIC provisions by the TCJA. Due to ambiguities in the application of the relevant provisions of the TCJA and the PFIC provisions in general, there can be no assurance with respect to the Company’s status as a PFIC for the current or any future taxable years of the Company.
The Organization for Economic Cooperation and Development (“OECD”) and the European Union (“EU”) are considering measures that might encourage countries to change their tax laws which could have a negative impact on the Company.
The OECD has published an action plan to address base erosion and profit shifting (“BEPS”) impacting its member countries and other jurisdictions. It is possible that jurisdictions in which the Company does business could react to the BEPS initiative or their own concerns by enacting tax legislation that could adversely affect the Company or its shareholders. In addition, the EU issued its Anti-Tax Avoidance Directive in 2016, which requires its member states to adopt specific tax reform measures by 2019. The implementation of these measures could have a negative impact on the Company.
A number of multilateral organizations, including the EU and the OECD have, in recent years, expressed concern about some countries not participating in adequate tax information exchange arrangements and have threatened those that do not agree to cooperate with punitive sanctions by member countries. It is as yet unclear what all of these sanctions might be, which countries might adopt them, and when or if they might be imposed. The Company cannot assure, however, that the Tax Information Exchange Agreements (TIEAs) that have been or will be entered into by the countries where the Company and its subsidiaries are located will be sufficient to preclude all of the sanctions described above, which, if ultimately adopted, could adversely affect the Company or its shareholders.
The Company may become subject to taxes in the Cayman Islands or Bermuda in the future, which may have a material adverse effect on its results of operations.
The Company and its subsidiaries which have been incorporated under the laws of the Cayman Islands as exempted companies and, as such, obtained an undertaking from the Governor in Council of the Cayman Islands substantially that, for a period of 20 years from the date of such undertaking, which is February 9, 2016, no law that is enacted in the Cayman Islands imposing any tax to be levied on profit or income or gains or appreciation shall apply to the Company and no such tax and no tax in the nature of estate duty or inheritance tax will be payable, either directly or by way of withholding, on the Company’s ordinary shares. This undertaking would not, however, prevent the imposition of taxes on any person ordinarily resident in the Cayman Islands or any company in respect of its ownership of real property or leasehold interests in the Cayman Islands. Given the limited duration of the undertaking, the Company cannot be certain that it will not be subject to Cayman Islands tax after the expiration of the 20-year period.
Global Indemnity Reinsurance was formed in 2006 through the amalgamation of the Company’s non-U.S. operations. The Company received an assurance from the Bermuda Minister of Finance, under the Bermuda Exempted Undertakings Tax Protection Act of 1966, as amended, that if any legislation is enacted in Bermuda that would impose tax computed on profits or income, or computed on any capital asset, gain or appreciation, or any tax in the nature of estate duty or inheritance tax, then the imposition of any such tax will not be applicable to Global Indemnity Reinsurance or any of its operations, shares, debentures or other obligations through March 31, 2035. Given the limited duration of the assurance, the Company cannot be certain that it will not be subject to any Bermuda tax after March 31, 2035.
Following the expiration of the periods described above, the Company may become subject to taxes in the Cayman Islands or Bermuda, which may have a material adverse effect on its results of operations.
47
Table of Contents
Global Indemnity or Global Indemnity Reinsurance may be subject to U.S. tax that may have a material adverse effect on Global Indemnity’s or Global Indemnity Reinsurance’s results of operations.
Global Indemnity is a Cayman company and Global Indemnity Reinsurance is a Bermuda company. The Company seeks to manage its business in a manner designed to reduce the risk that Global Indemnity and Global Indemnity Reinsurance will be treated as being engaged in a U.S. trade or business for U.S. federal income tax purposes. However, because there is considerable uncertainty as to the activities that constitute being engaged in a trade or business within the United States, the Company cannot be certain that the U.S. Internal Revenue Service will not contend successfully that Global Indemnity or Global Indemnity Reinsurance is or has been engaged in a trade or business in the United States. If Global Indemnity or Global Indemnity Reinsurance were considered to be engaged in a business in the United States, the Company could be subject to U.S. corporate income and branch profits taxes on the portion of its earnings effectively connected to such U.S. business, in which case its results of operations could be materially adversely affected.
The impact of the Letters of Commitment by the Cayman Islands and Bermuda or other concessions to the Organization for Economic Co-operation and Development to eliminate harmful tax practices is uncertain and could adversely affect the tax status of the Company’s subsidiaries in the Cayman Islands or Bermuda.
The Organization for Economic Co-operation and Development, which is commonly referred to as the OECD, has published reports and launched a global dialogue among member and non-member countries on measures to limit harmful tax competition. These measures are largely directed at counteracting the effects of tax havens and preferential tax regimes in countries around the world. The Cayman Islands and Bermuda are not listed as uncooperative tax haven jurisdictions because each had previously committed itself to eliminate harmful tax practices and to embrace international tax standards for transparency, exchange of information and the elimination of any aspects of the regimes for financial and other services that attract business with no substantial domestic activity. The Company is not able to predict what changes will arise from the OECD in the future or whether such changes will subject it to additional taxes.
There is a risk that interest paid by the Company’s U.S. subsidiary to a Luxembourg affiliate may be subject to 30% U.S. withholding tax.
U.A.I. (Luxembourg) Investment, S.à.r.l., an indirectly owned Luxembourg subsidiary of Global Indemnity Reinsurance, owns certain loans and notes issued by Global Indemnity Group, Inc., a Delaware corporation. Under U.S. federal income tax law, interest paid by a U.S. corporation to a non-U.S. shareholder is generally subject to a 30% withholding tax, unless reduced by treaty. The income tax treaty between the United States and Luxembourg (the “Luxembourg Treaty”) generally eliminates the withholding tax on interest paid to qualified residents of Luxembourg. Were the IRS to contend successfully that U.A.I. (Luxembourg) Investment, S.à.r.l. is not eligible for benefits under the Luxembourg Treaty, interest paid to U.A.I. (Luxembourg) Investment, S.à.r.l. by Global Indemnity Group, Inc. would be subject to the 30% withholding tax. Such tax may be applied retroactively to all previous years for which the statute of limitations has not expired, with interest and penalties. Such a result may have a material adverse effect on the Company’s financial condition and results of operation.
There is a risk that interest income imputed to the Company’s Irish affiliates may be subject to 25% Irish income tax.
U.A.I. (Ireland) Limited, U.A.I. (Ireland) II Unlimited Company, GBLI (Ireland) Limited, and Global Indemnity Group Limited are companies incorporated under the laws of Ireland. The companies are resident taxpayers fully subject to Irish corporate income tax of 12.5% on any trading income and 25.0% on any non-trading income, including interest and dividends from foreign companies. The Company believes it has, to date, managed its operations in such way that there will not be any material taxable income generated in Ireland under Irish law for these entities. However, there can be no assurance from the Irish authorities that a law may not be enacted that would impute income to U.A.I. (Ireland) Limited and U.A.I. (Ireland) II Unlimited Company in the future or retroactively arising out of the Companies’ current operations.
48
Table of Contents
| Item 1B. | UNRESOLVED STAFF COMMENTS |
None.
| Item 2. | PROPERTIES |
At December 31, 2017, office space leased in Bala Cynwyd, Pennsylvania, holds the Commercial Lines’ principal executive offices and headquarters. Additional office space leased in California, Georgia, Illinois, and Texas, serve as field offices for Commercial Lines. Some of the office space in California also serves as office space for Commercial Lines’ claims operations. Office space in Hamilton, Bermuda used by Reinsurance Operations is shared with one of Global Indemnity Reinsurance’s service providers per an agreement between the two. Office space leased in Arizona, and Nebraska, is used by Personal Lines. Office space leased in Cavan, Ireland is used to support the operating needs of the Insurance and Reinsurance Operations. The leases for the properties listed are held by various Company subsidiaries. The Company believes the properties listed are suitable and adequate to meet its needs.
| Item 3. | LEGAL PROCEEDINGS |
The Company is, from time to time, involved in various legal proceedings in the ordinary course of business. The Company purchased insurance and reinsurance coverage for risks in amounts that it considers adequate. However, there can be no assurance that the insurance and reinsurance coverage that the Company maintains is sufficient or will be available in adequate amounts or at a reasonable cost. The Company does not believe that the resolution of any currently pending legal proceedings, either individually or taken as a whole, will have a material adverse effect on its business, results of operations, cash flows, or financial condition.
There is a greater potential for disputes with reinsurers who are in runoff. Some of the Company’s reinsurers’ have operations that are in runoff, and therefore, the Company closely monitors those relationships. The Company anticipates that, similar to the rest of the insurance and reinsurance industry, it will continue to be subject to litigation and arbitration proceedings in the ordinary course of business.
| Item 4. | MINE SAFETY DISCLOSURES |
None.
49
Table of Contents
| Item 5. | MARKET FOR REGISTRANT’S COMMON EQUITY, RELATED STOCKHOLDER MATTERS AND ISSUER PURCHASES OF EQUITY SECURITIES |
Market for the Company’s A Ordinary Shares
The Company’s A ordinary shares, par value $0.0001 per share, began trading on the NASDAQ Global Select Market, formerly the NASDAQ National Market, under the symbol “UNGL” on December 16, 2003. On March 14, 2005 the Company changed its symbol to “INDM.” On July 6, 2010, the Company changed its symbol to “GBLI” as part of a redomestication transaction whereby all shares of “INDM” were replaced with shares of “GBLI” on a one-for-two basis. On November 7, 2016, in connection with a redomestication from Ireland to Cayman Islands, all of Global Indemnity plc’s ordinary shares were cancelled and replaced with one ordinary share of Global Indemnity Limited on a one for one basis. The ordinary shares of Global Indemnity Limited continue to trade under the symbol “GBLI”. The following table sets forth, for the periods indicated, the high and low intraday sales prices of the Company’s A ordinary shares as reported by the NASDAQ Global Select Market.
| High | Low | |||||||
| Fiscal Year Ended December 31, 2017: |
||||||||
| First Quarter |
$ | 40.96 | $ | 34.00 | ||||
| Second Quarter |
41.55 | 36.04 | ||||||
| Third Quarter |
42.96 | 37.27 | ||||||
| Fourth Quarter |
49.91 | 40.11 | ||||||
| Fiscal Year Ended December 31, 2016: |
||||||||
| First Quarter |
$ | 32.07 | $ | 27.39 | ||||
| Second Quarter |
32.09 | 20.96 | ||||||
| Third Quarter |
31.77 | 26.55 | ||||||
| Fourth Quarter |
38.97 | 29.00 | ||||||
There is no established public trading market for the Company’s B ordinary shares, par value $0.0001 per share.
As of February 27, 2018, there were 4 holders of record of the Company’s B ordinary shares, all of whom are affiliates of Fox Paine & Company, LLC. The number of holders of record, including individual owners of the Company’s A ordinary shares, was 622 as of February 27, 2018. The Company believes that the actual number of beneficial owners of the Company’s A ordinary shares is much higher than the number of record holders as shares are held in “street name” by brokers and others on behalf of individual owners.
See Note 16 to the consolidated financial statements in Item 8 of Part II of this report for information regarding securities authorized under the Company’s equity compensation plans.
50
Table of Contents
Performance of the Company’s A Ordinary Shares
The following graph represents a five-year comparison of the cumulative total return to shareholders for the Company’s A ordinary shares and stock of companies included in the NASDAQ Insurance Index and NASDAQ Composite Index, which the Company believes are the most comparative indexes.
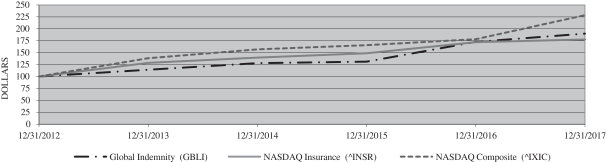
| 12/31/12 | 12/31/13 | 12/31/14 | 12/31/15 | 12/31/16 | 12/31/17 | |||||||||||||||||||
| Global Indemnity Limited |
$ | 100.0 | $ | 114.3 | $ | 128.2 | $ | 131.1 | $ | 172.7 | $ | 189.9 | ||||||||||||
| NASDAQ Insurance Index |
100.0 | 128.8 | 139.8 | 148.8 | 172.1 | 177.6 | ||||||||||||||||||
| NASDAQ Composite Index |
100.0 | 138.3 | 156.8 | 165.8 | 178.3 | 228.6 | ||||||||||||||||||
Recent Sales of Unregistered Securities
None.
Company Purchases of Ordinary Shares
The Company’s Share Incentive Plan allows employees to surrender A ordinary shares as payment for the tax liability incurred upon the vesting of restricted stock that was issued under the Share Incentive Plan. During 2017, the Company purchased an aggregate 29,551 of surrendered A ordinary shares from employees for $1.2 million. All shares purchased from employees are held as treasury stock and recorded at cost until formally retired.
On December 29, 2017, Global Indemnity acquired 3,397,031 of its A ordinary shares for approximately $83.0 million in the aggregate (approximately $24.44 per share) from former investors in vehicles managed by Fox Paine & Company, LLC.
See Note 13 to the consolidated financial statements in Item 8 of Part II of this report for additional information on the retirement of the Company’s A ordinary shares as well as a tabular disclosure of the Company’s share repurchases by month.
Dividend Policy
On December 27, 2017, the Company announced the adoption of a dividend program with an anticipated initial dividend rate of $0.25 per share per quarter ($1.00 per share per year). Payment of dividends is subject to future determinations by the Board of Directors based on the Company’s results, financial conditions, amounts required to grow the Company’s business, and other factors deemed relevant by the Board.
The Company did not declare or pay cash dividends on any class of its ordinary shares in 2017 or 2016.
The Company is a holding company and has no direct operations. The ability of Global Indemnity Limited to pay dividends is subject to Cayman Islands regulations and depends, in part, on the ability of its subsidiaries to pay
51
Table of Contents
dividends. Global Indemnity Reinsurance and the U.S. insurance subsidiaries are subject to significant regulatory restrictions limiting their ability to declare and pay dividends. See “Management’s Discussion and Analysis of Financial Condition — Liquidity and Capital Resources — Sources and Uses of Funds” in Item 7 of Part II of this report for dividend limitation and Note 19 of the notes to the consolidated financial statement in Item 8 of Part II of this report for the dividends declared and paid by the U.S. insurance subsidiaries and Global Indemnity Reinsurance in 2017 and the maximum amount of distributions that they could pay as dividends in 2018.
Under the Companies Act, Global Indemnity Reinsurance may only declare or pay a dividend if it has no reasonable grounds for believing that it is, or would after the payment be, unable to pay its liabilities as they become due, or if the realizable value of its assets would not be less than the aggregate of its liabilities and its issued share capital and share premium accounts.
For 2018, the Company believes that Global Indemnity Reinsurance should have sufficient liquidity and solvency to pay dividends. In the future, the Company anticipates using dividends from Global Indemnity Reinsurance to fund obligations of Global Indemnity. Global Indemnity Reinsurance is prohibited, without the approval of the BMA, from reducing by 15% or more its total statutory capital or 25% or more of its total statutory capital and surplus as set out in its previous year’s statutory financial statements, and any application for such approval must include such information as the BMA may require. Based upon the total statutory capital plus the statutory surplus as set out in its 2017 statutory financial statements that will be filed in 2018, Global Indemnity Reinsurance could pay a dividend of up to $227.1 million in 2018 without requesting BMA approval. Global Indemnity Reinsurance is dependent on receiving distributions from its subsidiaries in order to pay the full dividend in cash. In 2017, Global Indemnity Reinsurance declared a dividend of $120.0 million to its parent, Global Indemnity. Of this amount, $100.0 million was paid to Global Indemnity in December, 2017. As of December 31, 2017, accrued dividends were $20.0 million.
Barbados resident companies are subject to a 15% withholding tax on dividends to a nonresident company or individual, with a 25% rate for dividends paid out of tax-exempt profits. Dividends paid by Barbados resident companies classified as International Business Companies (“IBCs”) to nonresidents are exempt from withholding tax. GBLI (Barbados) Limited is an IBC.
In 2017, profit distributions (not in respect to liquidations) by the Luxembourg Companies were generally subject to Luxembourg dividend withholding tax at a rate of 15%, unless a domestic law exemption or a lower tax treaty rate applies. Dividends paid by any of the Luxembourg Companies to their Luxembourg resident parent company are exempt from Luxembourg dividend withholding tax, provided that at the time of the dividend distribution, the resident parent company has held (or commits itself to continue to hold) 10% or more of the nominal paid up capital of the distributing entity or, in the event of a lower percentage participation, a participation having an acquisition price of EUR 1.2 million or more for a period of at least twelve months.
For a discussion of factors affecting the Company’s ability to pay dividends, see “Business — Regulation” in Item 1 of Part I, “Management’s Discussion and Analysis of Financial Condition and Results of Operations — Liquidity and Capital Resources — Sources and Uses of Funds” in Item 7 of Part II, and Note 19 of the notes to the consolidated financial statements in Item 8 of Part II of this report.
52
Table of Contents
| Item 6. | SELECTED FINANCIAL DATA |
The following table sets forth selected consolidated historical financial data for the Company and should be read together with the consolidated financial statements and accompanying notes and “Management’s Discussion and Analysis of Financial Condition and Results of Operations” included elsewhere in this report. No cash dividends were declared on common stock in any year presented in the table.
| (Dollars in thousands, except shares and per |
For the Years Ended December 31, | |||||||||||||||||||
| 2017 | 2016 | 2015 | 2014 | 2013 | ||||||||||||||||
| Consolidated Statements of Operations Data: |
||||||||||||||||||||
| Gross premiums written |
$ | 516,334 | $ | 565,845 | $ | 590,233 | $ | 291,253 | $ | 290,723 | ||||||||||
| Net premiums written |
450,180 | 470,940 | 501,244 | 273,181 | 271,984 | |||||||||||||||
| Net premiums earned |
438,034 | 468,465 | 504,143 | 268,519 | 248,722 | |||||||||||||||
| Net realized investment gains (losses) |
1,576 | 21,721 | (3,374 | ) | 35,860 | 27,412 | ||||||||||||||
| Total revenues |
485,515 | 534,514 | 538,778 | 333,755 | 319,134 | |||||||||||||||
| Net income (loss) |
(9,551 | ) | 49,868 | 41,469 | 62,856 | 61,690 | ||||||||||||||
| Per share data: |
||||||||||||||||||||
| Net income (loss) available to common shareholders (1) |
$ | (9,551 | ) | $ | 49,868 | $ | 41,469 | $ | 62,856 | $ | 61,690 | |||||||||
| Basic |
(0.55 | ) | 2.89 | 1.71 | 2.50 | 2.46 | ||||||||||||||
| Diluted |
(0.55 | ) | 2.84 | 1.69 | 2.48 | 2.45 | ||||||||||||||
| Weighted-average number of shares outstanding |
||||||||||||||||||||
| Basic |
17,308,663 | 17,246,717 | 24,253,657 | 25,131,811 | 25,072,712 | |||||||||||||||
| Diluted |
17,308,663 | 17,547,061 | 24,505,851 | 25,331,420 | 25,174,015 | |||||||||||||||
| (1) | For the year ended December 31, 2017, “diluted” loss per share is the same as “basic” loss per share since there was a net loss for the period. |
| Consolidated Insurance Operating Ratios based on the Company’s GAAP Results: (1) |
2017 | 2016 | 2015 | 2014 | 2013 | |||||||||||||||
| Loss ratio (2) (3) |
61.5 | 56.4 | 54.6 | 51.2 | 53.5 | |||||||||||||||
| Expense ratio |
41.9 | 42.0 | 39.9 | 40.8 | 42.5 | |||||||||||||||
|
|
|
|
|
|
|
|
|
|
|
|||||||||||
| Combined ratio (2) (3) |
103.4 | 98.4 | 94.5 | 92.0 | 96.0 | |||||||||||||||
|
|
|
|
|
|
|
|
|
|
|
|||||||||||
| Net / gross premiums written |
87.2 | 83.2 | 84.9 | 93.8 | 93.6 | |||||||||||||||
|
|
|
|
|
|
|
|
|
|
|
|||||||||||
| Financial Position as of Last Day of Period: |
||||||||||||||||||||
| Total investments and cash and cash equivalents |
$ | 1,533,900 | $ | 1,501,819 | $ | 1,516,093 | $ | 1,498,009 | $ | 1,567,415 | ||||||||||
| Reinsurance receivables, net of allowance |
105,060 | 143,774 | 115,594 | 125,718 | 197,887 | |||||||||||||||
| Total assets |
2,001,669 | 1,972,946 | 1,957,294 | 1,930,033 | 1,911,779 | |||||||||||||||
| 7.75% Subordinated notes payable |
96,619 | 96,497 | 96,388 | — | — | |||||||||||||||
| 7.875% Subordinated notes payable |
125,864 | — | — | — | — | |||||||||||||||
| Margin borrowing facility |
72,230 | 66,646 | 75,646 | 174,673 | 100,000 | |||||||||||||||
| Unpaid losses and loss adjustment expenses |
634,664 | 651,042 | 680,047 | 675,472 | 779,466 | |||||||||||||||
| Total shareholders’ equity |
718,394 | 797,951 | 749,926 | 908,290 | 873,280 | |||||||||||||||
| Book value per share |
50.57 | 45.42 | 42.98 | 35.86 | 34.65 | |||||||||||||||
53
Table of Contents
| (1) | The Company’s insurance operating ratios are GAAP financial measures that are generally viewed in the insurance industry as indicators of underwriting profitability. The loss ratio is the ratio of net losses and loss adjustment expenses to net premiums earned. The expense ratio is the ratio of acquisition costs and other underwriting expenses to net premiums earned. The combined ratio is the sum of the loss and expense ratios. The ratios presented here represent the consolidated results of the Company’s Commercial Lines, Personal Lines, and Reinsurance Operations. |
| (2) | A summary of prior accident year adjustments is summarized as follows: |
| • | 2017 loss and combined ratios reflect a $53.9 million reduction of net losses and loss adjustment expenses |
| • | 2016 loss and combined ratios reflect a $57.3 million reduction of net losses and loss adjustment expenses |
| • | 2015 loss and combined ratios reflect a $34.7 million reduction of net losses and loss adjustment expenses |
| • | 2014 loss and combined ratios reflect a $16.4 million reduction of net losses and loss adjustment expenses |
| • | 2013 loss and combined ratios reflect a $7.9 million reduction of net losses and loss adjustment expenses |
See “Results of Operations” in Item 7 of Part II of this report for details of these items and their impact on the loss and combined ratios.
| (3) | The Company’s loss and combined ratios for 2017, 2016, 2015, 2014, and 2013 include $61.1 million, $72.1 million, $45.0 million, $14.0 million, and $10.0 million, respectively, of catastrophic losses on a current accident year basis from the Insurance Operations. See “Results of Operations” in Item 7 of Part II of this report for a discussion of the impact of these losses on the loss and combined ratios. |
| Item 7. | MANAGEMENT’S DISCUSSION AND ANALYSIS OF FINANCIAL CONDITION AND RESULTS OF OPERATIONS |
The following discussion and analysis of the Company’s financial condition and results of operations should be read in conjunction with the consolidated financial statements and accompanying notes of Global Indemnity included elsewhere in this report. Some of the information contained in this discussion and analysis or set forth elsewhere in this report, including information with respect to the Company’s plans and strategy, constitutes forward-looking statements that involve risks and uncertainties. Please see “Cautionary Note Regarding Forward-Looking Statements” at the end of this Item 7 and “Risk Factors” in Item 1A above for more information. You should review “Risk Factors” in Item 1A above for a discussion of important factors that could cause actual results to differ materially from the results described in or implied by the forward-looking statements contained herein.
Recent Developments
On March 23, 2017, the Company issued Subordinated Notes due in 2047 in the aggregate principal amount of $130.0 million through an underwritten public offering. See Note 12 of the notes to the consolidated financial statements in Item 8 of Part II of this report for additional information on this debt issuance.
In April, 2017, the Company entered into a $50 million commitment to purchase an alternative investment vehicle comprised of stressed and distressed debt instruments. As of December 31, 2017, the Company has funded $16.5 million of this commitment leaving $33.5 million as unfunded.
54
Table of Contents
The Company was impacted by losses from Hurricanes Harvey, Irma, and Maria as well as the California wildfires during the third and fourth quarter of 2017. The Company’s current estimate of net loss is approximately $58.7 million from Hurricanes Harvey, Irma, and Maria and the California wildfires. Actual losses from these events may vary materially from the Company’s current estimate due to the inherent uncertainties resulting from several factors, including the preliminary nature of the loss data available and potential inaccuracies and inadequacies of the data provided.
Effective September 16, 2017, David J.W. Bruce, Jason B. Hurwitz, and Arik Rashkes were appointed to the Company’s Board of Directors.
On December 29, 2017, Global Indemnity acquired 3,397,031 of its A ordinary shares for approximately $83.0 million in the aggregate (approximately $24.44 per share) from former investors in vehicles managed by Fox Paine & Company, LLC. The Company paid an $11.0 million advisory fee to Fox Paine in connection with the redemption as well as other services performed. The Company sold $99.0 million of securities from its consolidated investment portfolio during December, 2017 to provide funding for the redemption and other obligations.
During the fourth quarter of 2017, Global Indemnity announced the adoption of a dividend program. Although subject to the absolute discretion of the Board of Directors and factors, conditions, and prospects as such may exist from time to time when the Board of Directors considers the advisability of declaring a quarterly dividend, the Company currently anticipates an initial dividend rate of $0.25 per share per quarter ($1.00 per share per year).
On December 21, 2017, A.M. Best affirmed the financial strength rating of “A” (Excellent) for Global Indemnity Reinsurance and its U.S. insurance subsidiaries.
On December 22, 2017, the United States enacted a budget reconciliation act amending the Internal Revenue Code of 1986. The TCJA contains provisions that can materially affect the tax treatment of the Company’s U.S. subsidiaries. Among other things, the TCJA reduces the U.S. corporate income tax rate to 21 percent, imposes a 10 percent base erosion minimum tax on income of a U.S. corporation determined without regard to certain otherwise deductible payments made to certain foreign affiliates (including interest payments as well as gross premium or other consideration paid or accrued to a related foreign reinsurance company for reinsurance), and significantly limits the deductibility of interest expenses.
As a result of the enactment of the TCJA, effective January 1, 2018, premiums being ceded under the quota share arrangement may potentially be subject to a 10% BEAT tax. As a result, Global Indemnity Reinsurance and the Company’s U.S. insurance companies have agreed to terminate the quota share arrangement effective January 1, 2018. Regulatory approval is still pending.
Overview
The Company operates and manages its business through three business segments: Commercial Lines, Personal Lines, and Reinsurance Operations.
The Company’s Commercial Lines segment distribute property and casualty insurance products through a group of approximately 120 professional general agencies that have limited quoting and binding authority, as well as a number of wholesale insurance brokers who in turn sell the Company’s insurance products to insureds through retail insurance brokers. Commercial Lines operates predominantly in the excess and surplus lines marketplace. The Company manages its Commercial Lines segment via product classification. These product classifications are: 1) Penn-America, which includes property and general liability products for small commercial businesses
55
Table of Contents
distributed through a select network of wholesale general agents with specific binding authority; 2) United National, which includes property, general liability, and professional lines products distributed through program administrators with specific binding authority; 3) Diamond State, which includes property, casualty, and professional lines products distributed through wholesale brokers and program administrators with specific binding authority; and 4) Vacant Express, which primarily insures dwellings which are currently vacant, undergoing renovation, or are under construction and is distributed through aggregators, brokers, and retail agents.
The Company’s Personal Lines segment, via American Reliable, offers specialty personal lines and agricultural coverage through a group of approximately 275 agents, primarily comprised of wholesale general agents, with specific binding authority in the admitted marketplace.
The Company’s Reinsurance Operations, consisting solely of the operations of Global Indemnity Reinsurance, currently provides reinsurance solutions through brokers and on a direct basis. Global Indemnity Reinsurance is a Bermuda based treaty reinsurer for specialty property and casualty insurance and reinsurance companies. Global Indemnity Reinsurance conducts business in Bermuda and is focused on using its capital capacity to write catastrophe-oriented placements and other niche or specialty-focused treaties meeting the Company’s risk tolerance and return thresholds.
The Company derives its revenues primarily from premiums paid on insurance policies that it writes and from income generated by its investment portfolio, net of fees paid for investment management services. The amount of insurance premiums that the Company receives is a function of the amount and type of policies it writes, as well as prevailing market prices.
The Company’s expenses include losses and loss adjustment expenses, acquisition costs and other underwriting expenses, corporate and other operating expenses, interest, investment expenses, and income taxes. Losses and loss adjustment expenses are estimated by management and reflect the Company’s best estimate of ultimate losses and costs arising during the reporting period and revisions of prior period estimates. The Company records its best estimate of losses and loss adjustment expenses considering both internal and external actuarial analyses of the estimated losses the Company expects to incur on the insurance policies it writes. The ultimate losses and loss adjustment expenses will depend on the actual costs to resolve claims. Acquisition costs consist principally of commissions and premium taxes that are typically a percentage of the premiums on the insurance policies the Company writes, net of ceding commissions earned from reinsurers. Other underwriting expenses consist primarily of personnel expenses and general operating expenses related to underwriting activities. Corporate and other operating expenses are comprised primarily of outside legal fees, other professional and accounting fees, directors’ fees, management fees & advisory fees, and salaries and benefits for company personnel whose services relate to the support of corporate activities. Interest expense is primarily comprised of amounts due on outstanding debt.
Critical Accounting Estimates and Policies
The Company’s consolidated financial statements are prepared in conformity with GAAP, which require it to make estimates and assumptions that affect the reported amounts of assets and liabilities at the date of the financial statements and the reported amounts of revenues and expenses during the reporting periods. See Note 3 of the notes to consolidated financial statements contained in Item 8 of Part II of this report. Actual results could differ from those estimates and assumptions.
The Company believes that of the Company’s significant accounting policies, the following may involve a higher degree of judgment and estimation.
56
Table of Contents
Liability for Unpaid Losses and Loss Adjustment Expenses
Although variability is inherent in estimates, the Company believes that the liability for unpaid losses and loss adjustment expenses reflects Management’s best estimate for future amounts needed to pay losses and related loss adjustment expenses and the impact of its reinsurance coverage with respect to insured events.
In developing loss and loss adjustment expense (“loss” or “losses”) reserve estimates for the U.S. Insurance Operations, the Company’s actuaries perform detailed reserve analyses each quarter. To perform the analysis, the data is organized at a “reserve category” level. A reserve category can be a line of business such as commercial automobile liability, or it can be a particular type of claim such as construction defect. The reserves within a reserve category level are characterized as long-tail or short-tail. For long-tail business, it will generally be several years between the time the business is written and the time when all claims are settled. The Company’s long-tail exposures include general liability, professional liability, products liability, commercial automobile liability, and excess and umbrella. Short-tail exposures include property, commercial automobile physical damage, and equine mortality. To manage its insurance operations, the Company differentiates by product classifications, which are Penn-America, United National, Diamond State, American Reliable, and Vacant Express. For further discussion about the Company’s product classifications, see “General – Business Segments – Insurance Operations” in Item 1 of Part I of this report. Each of the Company’s product classifications contain both long-tail and short-tail exposures. Every reserve category is analyzed by the Company’s actuaries each quarter. Management is responsible for the final determination of loss reserve selections.
Loss reserve estimates for the Company’s Reinsurance Operations are developed by independent, external actuaries; at least annually; however, management is responsible for the final determination of loss reserve selections. The data for this analysis is organized by treaty and treaty year. As with the Company’s reserves for its Insurance Operations, reserves for its Reinsurance Operations are characterized as long-tail or short-tail. Long-tail exposures include workers compensation, professional liability, and excess and umbrella liability. Short-tail exposures are primarily catastrophe exposed property and marine accounts.
In addition to the Company’s internal reserve analysis, independent external actuaries perform a full, detailed review of the Insurance and Reinsurance Operations’ reserves annually. The Company reviews both the internal and external actuarial analyses in determining its reserve position.
The actuarial methods used to project ultimate losses for both long-tail and short-tail reserve categories include, but are not limited to, the following:
| • | Paid Development method; |
| • | Incurred Development method; |
| • | Expected Loss Ratio method; |
| • | Bornhuetter-Ferguson method using premiums and paid loss; |
| • | Bornhuetter-Ferguson method using premiums and incurred loss; and |
| • | Average Loss method. |
The Paid Development method estimates ultimate losses by reviewing paid loss patterns and applying them to accident years with further expected changes in paid loss. Selection of the paid loss pattern requires analysis of several factors including the impact of inflation on claims costs, the rate at which claims professionals make claim payments and close claims, the impact of judicial decisions, the impact of underwriting changes, the impact of large claim payments and other factors. Claim cost inflation itself requires evaluation of changes in the cost of repairing or replacing property, changes in the cost of medical care, changes in the cost of wage replacement, judicial decisions, legislative changes and other factors. Because this method assumes that losses are paid at a consistent rate, changes in any of these factors can impact the results. Since the method does not rely on case reserves, it is not directly influenced by changes in the adequacy of case reserves.
57
Table of Contents
For many reserve categories, paid loss data for recent periods may be too immature or erratic for reliable loss projections. This situation often exists for long-tail exposures. In addition, changes in the factors described above may result in inconsistent payment patterns. Finally, estimating the paid loss pattern subsequent to the most mature point available in the data analyzed often involves considerable uncertainty for long-tail reserve categories.
The Incurred Development method is similar to the Paid Development method, but it uses case incurred losses instead of paid losses. Since this method uses more data (case reserves in addition to paid losses) than the Paid Development method, the incurred development patterns may be less variable than paid development patterns. However, selection of the incurred loss pattern requires analysis of all of the factors listed in the description of the Paid Development method. In addition, the inclusion of case reserves can lead to distortions if changes in case reserving practices have taken place and the use of case incurred losses may not eliminate the issues associated with estimating the incurred loss pattern subsequent to the most mature point available.
The Expected Loss Ratio method multiplies premiums by an expected loss ratio to produce ultimate loss estimates for each accident year. This method may be useful if loss development patterns are inconsistent, losses emerge very slowly, or there is relatively little loss history from which to estimate future losses. The selection of the expected loss ratio requires analysis of loss ratios from earlier accident years or pricing studies and analysis of inflationary trends, frequency trends, rate changes, underwriting changes, and other applicable factors.
The Bornhuetter-Ferguson method using premiums and paid losses is a combination of the Paid Development method and the Expected Loss Ratio method. This method normally determines expected loss ratios similar to the method used for the Expected Loss Ratio method and requires analysis of the same factors described above. The method assumes that only future losses will develop at the expected loss ratio level. The percent of paid loss to ultimate loss implied from the Paid Development method is used to determine what percentage of ultimate loss is yet to be paid. The use of the pattern from the Paid Development method requires consideration of all factors listed in the description of the Paid Development method. The estimate of losses yet to be paid is added to current paid losses to estimate the ultimate loss for each accident year. This method will react very slowly if actual ultimate loss ratios are different from expectations due to changes not accounted for by the Expected Loss Ratio calculation.
The Bornhuetter-Ferguson method using premiums and incurred losses is similar to the Bornhuetter-Ferguson method using premiums and paid losses except that it uses case incurred losses. The use of case incurred losses instead of paid losses can result in development patterns that are less variable than paid development patterns. However, the inclusion of case reserves can lead to distortions if changes in case reserving practices have taken place. The method requires analysis of all the factors that need to be reviewed for the Expected Loss Ratio and Incurred Development methods.
The Average Loss method multiplies a projected number of ultimate incurred claims by an estimated ultimate average loss for each accident year to produce ultimate loss estimates. Since projections of the ultimate number of claims are often less variable than projections of ultimate loss, this method can provide more reliable results for reserve categories where loss development patterns are inconsistent or too variable to be relied on exclusively. In addition, this method can more directly account for changes in coverage that impact the number and size of claims. However, this method can be difficult to apply to situations where very large claims or a substantial number of unusual claims result in volatile average claim sizes. Projecting the ultimate number of claims requires analysis of several factors including the rate at which policyholders report claims to the Company, the impact of judicial decisions, the impact of underwriting changes and other factors. Estimating the ultimate average loss requires analysis of the impact of large losses and claim cost trends based on changes in the cost of repairing or replacing property, changes in the cost of medical care, changes in the cost of wage replacement, judicial decisions, legislative changes and other factors.
For many reserve categories, especially those that can be considered long-tail, a particular accident year may not have a sufficient volume of paid losses to produce a statistically reliable estimate of ultimate losses. In such a
58
Table of Contents
case, the Company’s actuaries typically assign more weight to the Incurred Development method than to the Paid Development method. As claims continue to settle and the volume of paid losses increases, the actuaries may assign additional weight to the Paid Development method. For most of the Company’s reserve categories, even the case incurred losses for accident years that are early in the claim settlement process will not be of sufficient volume to produce a reliable estimate of ultimate losses. In these cases, the Company will not assign any weight to the Paid and Incurred Development methods and will use the Bornhuetter-Ferguson and Expected Loss Ratio methods. For short-tail exposures, the Paid and Incurred Development methods can often be relied on sooner primarily because the Company’s history includes a sufficient number of accident years to cover the entire period over which paid and incurred losses are expected to change. However, the Company may also assign weights to the Expected Loss Ratio, Bornhuetter-Ferguson and Average Loss methods for short-tail exposures when developing estimates of ultimate losses.
Generally, reserves for long-tail lines give more weight to the Expected Loss Ratio method in the more recent immature years. As the accident years mature, weight shifts to the Bornhuetter-Ferguson methods and eventually to the Incurred and/or Paid Development method. Claims related to umbrella business are usually reported later than claims for other long-tail lines. For umbrella business, the shift from the Expected Loss Ratio method to the Bornhuetter-Ferguson methods to the Loss Development method may be more protracted than for most long-tailed lines. Reserves for short-tail lines tend to make the shift across methods more quickly than the long-tail lines.
For other more complex reserve categories where the above methods may not produce reliable indications, the Company uses additional methods tailored to the characteristics of the specific situation. Such reserve categories include losses from construction defect and A&E claims.
For construction defect losses, the Company’s actuaries organize losses by the year in which they were reported to develop an IBNR provision for development on known cases. To estimate losses from claims that have occurred but have not yet been reported to the Company (pure IBNR), various extrapolation techniques are applied to the pattern of claims that have been reported to estimate the number of claims yet to be reported. This process requires analysis of several factors including the rate at which policyholders report claims to the Company, the impact of judicial decisions, the impact of underwriting changes and other factors. An average claim size is determined from past experience and applied to the number of unreported claims to estimate reserves for these claims.
Establishing reserves for A&E and other mass tort claims involves considerably more judgment than other types of claims due to, among other things, inconsistent court decisions, bankruptcy filings as a result of asbestos-related liabilities, and judicial interpretations that often expand theories of recovery and broaden the scope of coverage. The insurance industry continues to receive a substantial number of asbestos-related bodily injury claims, with an increasing focus being directed toward other parties, including installers of products containing asbestos rather than against asbestos manufacturers. This shift has resulted in significant insurance coverage litigation implicating applicable coverage defenses or determinations, if any, including but not limited to, determinations as to whether or not an asbestos-related bodily injury claim is subject to aggregate limits of liability found in most comprehensive general liability policies. The Company continues to closely monitor its asbestos exposure and make adjustments where they are warranted.
Reserve analyses performed by the Company’s internal and external actuaries result in actuarial point estimates. The results of the detailed reserve reviews were summarized and discussed with the Company’s senior management to determine the best estimate of reserves. This group considered many factors in making this decision. The factors included, but were not limited to, the historical pattern and volatility of the actuarial indications, the sensitivity of the actuarial indications to changes in paid and incurred loss patterns, the consistency of claims handling processes, the consistency of case reserving practices, changes in the Company’s pricing and underwriting, and overall pricing and underwriting trends in the insurance market.
59
Table of Contents
Management’s best estimate at December 31, 2017 was recorded as the loss reserve. Management’s best estimate is as of a particular point in time and is based upon known facts, the Company’s actuarial analyses, current law, and the Company’s judgment. This resulted in carried gross and net reserves of $634.7 million and $537.4 million, respectively, as of December 31, 2017. A breakout of the Company’s gross and net reserves, excluding the effects of the Company’s intercompany pooling arrangements and intercompany stop loss and quota share reinsurance agreements, as of December 31, 2017 is as follows:
| Gross Reserves | ||||||||||||
| (Dollars in thousands) | Case | IBNR (1) | Total | |||||||||
| Commercial Lines |
$ | 116,222 | $ | 302,820 | $ | 419,042 | ||||||
| Personal Lines |
40,443 | 79,812 | 120,255 | |||||||||
| Reinsurance Operations |
31,100 | 64,267 | 95,367 | |||||||||
|
|
|
|
|
|
|
|||||||
| Total |
$ | 187,765 | $ | 446,899 | $ | 634,664 | ||||||
|
|
|
|
|
|
|
|||||||
| Net Reserves (2) | ||||||||||||
| (Dollars in thousands) | Case | IBNR (1) | Total | |||||||||
| Commercial Lines |
$ | 92,313 | $ | 250,636 | $ | 342,949 | ||||||
| Personal Lines |
32,792 | 66,384 | 99,176 | |||||||||
| Reinsurance Operations |
31,099 | 64,197 | 95,296 | |||||||||
|
|
|
|
|
|
|
|||||||
| Total |
$ | 156,204 | $ | 381,217 | $ | 537,421 | ||||||
|
|
|
|
|
|
|
|||||||
| (1) | Losses incurred but not reported, including the expected future emergence of case reserves. |
| (2) | Does not include reinsurance receivable on paid losses. |
The Company continually reviews these estimates and, based on new developments and information, includes adjustments of the estimated ultimate liability in the operating results for the periods in which the adjustments are made. The establishment of loss and loss adjustment expense reserves makes no provision for the possible broadening of coverage by legislative action or judicial interpretation, or the emergence of new types of losses not sufficiently represented in the Company’s historical experience or that cannot yet be quantified or estimated. The Company regularly analyzes its reserves and reviews reserving methodologies so that future adjustments to prior accident year reserves can be minimized. However, given the complexity of this process, reserves require continual updates and the ultimate liability may be higher or lower than previously indicated. Changes in estimates for loss and loss adjustment expense reserves are recorded in the period that the change in these estimates is made. See Note 11 to the consolidated financial statements in Item 8 of Part II of this report for details concerning the changes in the estimate for incurred loss and loss adjustment expenses related to prior accident years.
The detailed reserve analyses that the Company’s internal and external actuaries complete use a variety of generally accepted actuarial methods and techniques to produce a number of estimates of ultimate loss. The Company determines its best estimate of ultimate loss by reviewing the various estimates provided by its actuaries and other relevant information. The reserve estimate is the difference between the estimated ultimate loss and the losses paid to date. The difference between the estimated ultimate loss and the case incurred loss (paid loss plus case reserve) is considered to be IBNR. IBNR calculated as such includes a provision for development on known cases (supplemental development) as well as a provision for claims that have occurred but have not yet been reported to the Company (pure IBNR).
In light of the many uncertainties associated with establishing the estimates and making the assumptions necessary to establish reserve levels, the Company reviews its reserve estimates on a regular basis and makes adjustments in the period that the need for such adjustments is determined.
60
Table of Contents
The key assumptions fundamental to the reserving process are often different for various reserve categories and accident years. Some of these assumptions are explicit assumptions that are required of a particular method, but most of the assumptions are implicit and cannot be precisely quantified. An example of an explicit assumption is the pattern employed in the Paid Development method. However, the assumed pattern is itself based on several implicit assumptions such as the impact of inflation on medical costs and the rate at which claim professionals close claims. Loss frequency is a measure of the number of claims per unit of insured exposure, and loss severity is a measure of the average size of claims. Each reserve category has an implicit frequency and severity for each accident year as a result of the various assumptions made.
Previous reserve analyses have resulted in the Company’s identification of information and trends that have caused it to increase or decrease frequency and severity assumptions in prior periods and could lead to the identification of a need for additional material changes in loss and loss adjustment expense reserves, which could materially affect results of operations, equity, business and insurer financial strength and debt ratings. Factors affecting loss frequency include, among other things, the effectiveness of loss controls and safety programs and changes in economic activity or weather patterns. Factors affecting loss severity include, among other things, changes in policy limits and deductibles, rate of inflation and judicial interpretations. Another factor affecting estimates of loss frequency and severity is the loss reporting lag, which is the period of time between the occurrence of a loss and the date the loss is reported to the Company. The length of the loss reporting lag affects the Company’s ability to accurately predict loss frequency (loss frequencies are more predictable for short-tail lines) as well as the amount of reserves needed for IBNR.
If the actual levels of loss frequency and severity are higher or lower than expected, the ultimate losses will be different than management’s best estimate. For most of its reserve categories, the Company believes that frequency can be predicted with greater accuracy than severity. Therefore, the Company believes management’s best estimate is more likely influenced by changes in severity than frequency. The following table, which the Company believes reflects a reasonable range of variability around its best estimate based on historical loss experience and management’s judgment, reflects the impact of changes (which could be favorable or unfavorable) in frequency and severity on the Company’s current accident year net loss estimate of $323.1 million for claims occurring during the year ended December 31, 2017:
| Severity Change | ||||||||||||||||||||||||
| (Dollars in thousands) | -10% | -5% | 0% | 5% | 10% | |||||||||||||||||||
| Frequency Change |
-5 | % | $ | (46,850 | ) | $ | (31,502 | ) | $ | (16,155 | ) | $ | (808 | ) | $ | 14,540 | ||||||||
| -3 | % | (41,034 | ) | (25,363 | ) | (9,693 | ) | 5,977 | 21,648 | |||||||||||||||
| -2 | % | (38,126 | ) | (22,294 | ) | (6,462 | ) | 9,370 | 25,202 | |||||||||||||||
| -1 | % | (35,218 | ) | (19,224 | ) | (3,231 | ) | 12,762 | 28,756 | |||||||||||||||
| 0 | % | (32,310 | ) | (16,155 | ) | — | 16,155 | 32,310 | ||||||||||||||||
| 1 | % | (29,402 | ) | (13,086 | ) | 3,231 | 19,548 | 35,864 | ||||||||||||||||
| 2 | % | (26,494 | ) | (10,016 | ) | 6,462 | 22,940 | 39,418 | ||||||||||||||||
| 3 | % | (23,586 | ) | (6,947 | ) | 9,693 | 26,333 | 42,972 | ||||||||||||||||
| 5 | % | (17,771 | ) | (808 | ) | 16,155 | 33,118 | 50,081 | ||||||||||||||||
The Company’s net reserves for losses and loss adjustment expenses of $537.4 million as of December 31, 2017 relate to multiple accident years. Therefore, the impact of changes in frequency and severity for more than one accident year could be higher or lower than the amounts reflected above.
Recoverability of Reinsurance Receivables
The Company regularly reviews the collectability of its reinsurance receivables, and includes adjustments resulting from this review in earnings in the period in which the adjustment arises. A.M. Best ratings, financial history, available collateral, and payment history with the reinsurers are several of the factors that the Company considers when judging collectability. Changes in loss reserves can also affect the valuation of reinsurance
61
Table of Contents
receivables if the change is related to loss reserves that are ceded to reinsurers. Certain amounts may be uncollectible if the Company’s reinsurers dispute a loss or if the reinsurer is unable to pay. If its reinsurers do not pay, the Company remains legally obligated to pay the loss.
See Note 9 of the notes to consolidated financial statements in Item 8 of Part II of this report for further information surrounding the Company’s reinsurance receivable balances and collectability as of December 31, 2017 and 2016. For a listing of the ten reinsurers for which the Company has the largest reinsurance asset amounts as of December 31, 2017, see “Reinsurance of Underwriting Risk” in Item 1 of Part I of this report.
Investments
The carrying amount of the Company’s investments approximates their fair value. The Company regularly performs various analytical valuation procedures with respect to investments, including reviewing each fixed maturity security in an unrealized loss position to determine the amount of unrealized loss related to credit loss and the amount related to all other factors, such as changes in interest rates. The credit loss represents the portion of the amortized book value in excess of the net present value of the projected future cash flows discounted at the effective interest rate implicit in the debt security prior to impairment. The credit loss component of the other than temporary impairment is recorded through earnings, whereas the amount relating to factors other than credit losses are recorded in other comprehensive income, net of taxes. During its review, the Company considers credit rating, market price, and issuer specific financial information, among other factors, to assess the likelihood of collection of all principal and interest as contractually due. Securities for which the Company determines that a credit loss is likely are subjected to further analysis to estimate the credit loss to be recognized in earnings, if any. See Note 3 of the notes to consolidated financial statements in Item 8 of Part II of this report for the specific methodologies and significant assumptions used by asset class. Upon identification of such securities and periodically thereafter, a detailed review is performed to determine whether the decline is considered other than temporary. This review includes an analysis of several factors, including but not limited to, the credit ratings and cash flows of the securities, and the magnitude and length of time that the fair value of such securities is below cost.
For an analysis of the Company’s securities with gross unrealized losses as of December 31, 2017 and 2016, and for other than temporary impairment losses that the Company recorded for the years ended December 31, 2017, 2016, and 2015, please see Note 5 of the notes to the consolidated financial statements in Item 8 of Part II of this report.
Fair Value Measurements
The Company categorizes its invested assets and derivative instruments that are accounted for at fair value in the consolidated statements into a fair value hierarchy. The fair value hierarchy is directly related to the amount of subjectivity associated with the inputs utilized to determine the fair value of these assets. The reported value of financial instruments not carried at fair value, principally cash and cash equivalents and margin borrowing facility approximate fair value. See Note 7 of the notes to the consolidated financial statements in Item 8 of Part II of this report for further information about the fair value hierarchy and the Company’s assets that are accounted for at fair value.
Goodwill and Intangible Assets
The Company tests for impairment of goodwill at least annually and more frequently as circumstances warrant in accordance with applicable accounting guidance. Accounting guidance allows for the testing of goodwill for impairment using both qualitative and quantitative factors. Impairment of goodwill is recognized only if the carrying amount of the reporting unit, including goodwill, exceeds the fair value of the reporting unit. The amount of the impairment loss would be equal to the excess carrying value of the goodwill over the implied fair value of the reporting unit goodwill. Based on the qualitative assessment performed, there was no impairment of goodwill as of December 31, 2017.
62
Table of Contents
Impairment of intangible assets with indefinite useful lives is tested at least annually and more frequently as circumstances warrant in accordance with applicable accounting guidance. Accounting guidance allows for the testing of intangible assets for impairment using both qualitative and quantitative factors. Impairment of indefinite lived intangible assets is recognized only if the carrying amount of the intangible assets exceeds the fair value of said assets. The amount of the impairment loss would be equal to the excess carrying value of the assets over the fair value of said assets. Based on the qualitative assessment performed, there were no impairments of indefinite lived intangible assets as of December 31, 2017.
Intangible assets that are not deemed to have an indefinite useful life are amortized over their estimated useful lives. The carrying amounts of definite lived intangible assets are regularly reviewed for indicators of impairment in accordance with applicable accounting guidance. Impairment is recognized only if the carrying amount of the intangible asset is in excess of its undiscounted projected cash flows. The impairment is measured as the difference between the carrying amount and the estimated fair value of the asset. As of December 31, 2017, there were no triggering events that occurred during the year that would result in an impairment of definite lived intangible assets.
See Note 8 of the notes to the consolidated financial statements in Item 8 of Part II of this report for more details concerning the Company’s goodwill and intangible assets.
Deferred Acquisition Costs
The costs of acquiring new and renewal insurance and reinsurance contracts include commissions, premium taxes and certain other costs that are directly related to the successful acquisition of new and renewal insurance and reinsurance contracts. The excess of the Company’s costs of acquiring new and renewal insurance and reinsurance contracts over the related ceding commissions earned from reinsurers is capitalized as deferred acquisition costs and amortized over the period in which the related premiums are earned.
In accordance with accounting guidance for insurance enterprises, the method followed in computing such amounts limits them to amounts recoverable from premium to be earned, related investment income, losses and loss adjustment expenses, and certain other costs expected to be incurred as the premium is earned. A premium deficiency is recognized if the sum of expected loss and loss adjustment expenses and unamortized acquisition costs exceeds related unearned premium. This evaluation is done at a product line level in Insurance Operations and at a treaty level in Reinsurance Operations. Any future expected loss on the related unearned premium is recorded first by impairing the unamortized acquisition costs on the related unearned premium followed by an increase to loss and loss adjustment expense reserves on additional expected loss in excess of unamortized acquisition costs. The Company calculates deferred acquisition costs for Insurance Operations separately by product lines and for its Reinsurance Operations separately for each treaty.
Taxation
The Company provides for income taxes in accordance with applicable accounting guidance. The Company’s deferred tax assets and liabilities primarily result from temporary differences between the amounts recorded in the consolidated financial statements and the tax basis of the Company’s assets and liabilities.
At each balance sheet date, management assesses the need to establish a valuation allowance that reduces deferred tax assets when it is more likely than not that all, or some portion, of the deferred tax assets will not be realized. A valuation allowance would be based on all available information including the Company’s assessment of uncertain tax positions and projections of future taxable income from each tax-paying component in each jurisdiction, principally derived from business plans and available tax planning strategies. There are no valuation allowances as of December 31, 2017 and 2016. The deferred tax asset balance is analyzed regularly by management. This assessment requires significant judgment and considers, among other matters, the nature, frequency and severity of current and cumulative losses, forecasts of future profitability, the duration of
63
Table of Contents
carryforward periods, and tax planning strategies and/or actions. Based on these analyses, the Company has determined that its deferred tax asset is recoverable. Projections of future taxable income incorporate several assumptions of future business and operations that are apt to differ from actual experience. If, in the future, the Company’s assumptions and estimates that resulted in the forecast of future taxable income for each tax-paying component prove to be incorrect, a valuation allowance may be required. This could have a material adverse effect on the Company’s financial condition, results of operations, and liquidity.
The Company applies a more likely than not recognition threshold for all tax uncertainties, only allowing the recognition of those tax benefits that have a greater than 50% likelihood of being sustained upon examination by the taxing authorities. Please see Note 10 of the notes to the consolidated financial statements in Item 8 of Part II of this report for a discussion of the Company’s tax uncertainties.
Business Segments
The Company manages its business through three business segments: Personal Lines, Commercial Lines, and Reinsurance Operations. The Personal Lines and Commercial Lines segments comprise the Company’s U.S. Insurance Operations, which currently includes the operations of United National Insurance Company, Diamond State Insurance Company, Penn-America Insurance Company, Penn-Star Insurance Company, Penn-Patriot Insurance Company, American Reliable Insurance Company, American Insurance Adjustment Agency, Inc., Collectibles Insurance Services, LLC, Global Indemnity Insurance Agency, LLC, and J.H. Ferguson & Associates, LLC. Reinsurance Operations includes the operations of Global Indemnity Reinsurance Company, Ltd.
The Company evaluates the performance of these three segments based on gross and net premiums written, revenues in the form of net premiums earned, and expenses in the form of (1) net losses and loss adjustment expenses, (2) acquisition costs, and (3) other underwriting expenses.
During the 1st quarter of 2017, the Company re-evaluated its Commercial Lines and Personal Lines segments and determined that certain portions of business will be managed, operated and reported by including them in the other segment. As a result, the composition of the Company’s reportable segments changed slightly. Premium that is written through a wholly owned agency that mainly sells to individuals, which was previously included as part of the Commercial Lines segment, is now included within the Personal Lines segment. In addition, one of the small commercial programs written by American Reliable Insurance Company, which was previously included within the Personal Lines segment, is now aggregated within the Commercial Lines segment. Accordingly, the segment results for the years ended December 31, 2016 and 2015 have been revised to reflect these changes.
See “Business Segments” in Item 1 of Part I of this report for a description of the Company’s segments.
64
Table of Contents
Results of Operations
The following table summarizes the Company’s results for the years ended December 31, 2017, 2016, and 2015:
| Years Ended December 31, |
% Change |
Years Ended December 31, |
% Change |
|||||||||||||||||||||
| (Dollars in thousands) | 2017 | 2016 (4) | 2016 (4) | 2015 (4) | ||||||||||||||||||||
| Gross premiums written |
$ | 516,334 | $ | 565,845 | (8.7 | %) | $ | 565,845 | $ | 590,233 | (4.1 | %) | ||||||||||||
|
|
|
|
|
|
|
|
|
|
|
|
|
|||||||||||||
| Net premiums written |
$ | 450,180 | $ | 470,940 | (4.4 | %) | $ | 470,940 | $ | 501,244 | (6.0 | %) | ||||||||||||
|
|
|
|
|
|
|
|
|
|
|
|
|
|||||||||||||
| Net premiums earned |
$ | 438,034 | $ | 468,465 | (6.5 | %) | $ | 468,465 | $ | 504,143 | (7.1 | %) | ||||||||||||
| Other income |
6,582 | 10,345 | (36.4 | %) | 10,345 | 3,400 | 204.3 | % | ||||||||||||||||
|
|
|
|
|
|
|
|
|
|
|
|
|
|||||||||||||
| Total revenues |
444,616 | 478,810 | (7.1 | %) | 478,810 | 507,543 | (5.7 | %) | ||||||||||||||||
| Losses and expenses: |
||||||||||||||||||||||||
| Net losses and loss adjustment expenses |
269,212 | 264,003 | 2.0 | % | 264,003 | 275,368 | (4.1 | %) | ||||||||||||||||
| Acquisition costs and other underwriting expenses |
183,733 | 196,650 | (6.6 | %) | 196,650 | 201,303 | (2.3 | %) | ||||||||||||||||
|
|
|
|
|
|
|
|
|
|
|
|
|
|||||||||||||
| Underwriting income (loss) |
(8,329 | ) | 18,157 | (145.9 | %) | 18,157 | 30,872 | (41.2 | %) | |||||||||||||||
| Net investment income |
39,323 | 33,983 | 15.7 | % | 33,983 | 34,609 | (1.8 | %) | ||||||||||||||||
| Net realized investment gains (losses) |
1,576 | 21,721 | (92.7 | %) | 21,721 | (3,374 | ) | NM | ||||||||||||||||
| Corporate and other operating expenses |
(25,714 | ) | (17,338 | ) | 48.3 | % | (17,338 | ) | (24,448 | ) | (29.1 | %) | ||||||||||||
| Interest expense |
(16,906 | ) | (8,905 | ) | 89.8 | % | (8,905 | ) | (4,913 | ) | 81.3 | % | ||||||||||||
|
|
|
|
|
|
|
|
|
|
|
|
|
|||||||||||||
| Income (loss) before income taxes |
(10,050 | ) | 47,618 | (121.1 | %) | 47,618 | 32,746 | 45.4 | % | |||||||||||||||
| Income tax benefit |
499 | 2,250 | (77.8 | %) | 2,250 | 8,723 | (74.2 | %) | ||||||||||||||||
|
|
|
|
|
|
|
|
|
|
|
|
|
|||||||||||||
| Net income (loss) |
$ | (9,551 | ) | $ | 49,868 | (119.2 | %) | $ | 49,868 | $ | 41,469 | 20.3 | % | |||||||||||
|
|
|
|
|
|
|
|
|
|
|
|
|
|||||||||||||
| Underwriting Ratios: |
||||||||||||||||||||||||
| Loss ratio (1): |
61.5 | % | 56.4 | % | 56.4 | % | 54.6 | % | ||||||||||||||||
| Expense ratio (2) |
41.9 | % | 42.0 | % | 42.0 | % | 39.9 | % | ||||||||||||||||
|
|
|
|
|
|
|
|
|
|||||||||||||||||
| Combined ratio (3) |
103.4 | % | 98.4 | % | 98.4 | % | 94.5 | % | ||||||||||||||||
|
|
|
|
|
|
|
|
|
|||||||||||||||||
NM — not meaningful
| (1) | The loss ratio is a GAAP financial measure that is generally viewed in the insurance industry as an indicator of underwriting profitability and is calculated by dividing net losses and loss adjustment expenses by net premiums earned. |
| (2) | The expense ratio is a GAAP financial measure that is calculated by dividing the sum of acquisition costs and other underwriting expenses by net premiums earned. |
| (3) | The combined ratio is a GAAP financial measure and is the sum of the Company’s loss and expense ratios. |
| (4) | On September 30, 2016, Diamond State Insurance Company sold all the outstanding shares of capital stock of one of its wholly owned subsidiaries, United National Specialty Insurance Company. Financial results for 2016 and 2015 include United National Specialty Insurance. Company. This transaction did not have a significant impact on the Company’s ongoing business operations. Subsequent to the sale, any business previously written by United National Specialty Insurance Company is being written by other companies within the Company’s U.S. Insurance Operations. |
65
Table of Contents
Premiums
The following table summarizes the change in premium volume by business segment:
| Years Ended December 31, |
% Change |
Years Ended December 31, |
% Change |
|||||||||||||||||||||
| (Dollars in thousands) | 2017 | 2016 | 2016 | 2015 | ||||||||||||||||||||
| Gross premiums written (1) |
||||||||||||||||||||||||
| Personal Lines (3) (4) |
$ | 249,777 | $ | 302,947 | (17.6 | %) | $ | 302,947 | $ | 327,147 | (7.4 | %) | ||||||||||||
| Commercial Lines (4) |
212,670 | 203,061 | 4.7 | % | 203,061 | 213,353 | (4.8 | %) | ||||||||||||||||
| Reinsurance (5) |
53,887 | 59,837 | (9.9 | %) | 59,837 | 49,733 | 20.3 | % | ||||||||||||||||
|
|
|
|
|
|
|
|
|
|
|
|
|
|||||||||||||
| Total gross premiums written |
$ | 516,334 | $ | 565,845 | (8.7 | %) | $ | 565,845 | $ | 590,233 | (4.1 | %) | ||||||||||||
|
|
|
|
|
|
|
|
|
|
|
|
|
|||||||||||||
| Ceded premiums written |
||||||||||||||||||||||||
| Personal Lines (4) |
$ | 39,978 | $ | 74,764 | (46.5 | %) | $ | 74,764 | $ | 73,990 | 1.0 | % | ||||||||||||
| Commercial Lines (4) |
26,222 | 20,105 | 30.4 | % | 20,105 | 14,949 | 34.5 | % | ||||||||||||||||
| Reinsurance (5) |
(46 | ) | 36 | (227.8 | %) | 36 | 50 | (28.0 | %) | |||||||||||||||
|
|
|
|
|
|
|
|
|
|
|
|
|
|||||||||||||
| Total ceded premiums written |
$ | 66,154 | $ | 94,905 | (30.3 | %) | $ | 94,905 | $ | 88,989 | 6.6 | % | ||||||||||||
|
|
|
|
|
|
|
|
|
|
|
|
|
|||||||||||||
| Net premiums written (2) |
||||||||||||||||||||||||
| Personal Lines (4) |
$ | 209,799 | $ | 228,183 | (8.1 | %) | $ | 228,183 | $ | 253,157 | (9.9 | %) | ||||||||||||
| Commercial Lines (4) |
186,448 | 182,956 | 1.9 | % | 182,956 | 198,404 | (7.8 | %) | ||||||||||||||||
| Reinsurance (5) |
53,933 | 59,801 | (9.8 | %) | 59,801 | 49,683 | 20.4 | % | ||||||||||||||||
|
|
|
|
|
|
|
|
|
|
|
|
|
|||||||||||||
| Total net premiums written |
$ | 450,180 | $ | 470,940 | (4.4 | %) | $ | 470,940 | $ | 501,244 | (6.0 | %) | ||||||||||||
|
|
|
|
|
|
|
|
|
|
|
|
|
|||||||||||||
| Net premiums earned |
||||||||||||||||||||||||
| Personal Lines (4) |
$ | 215,983 | $ | 237,555 | (9.1 | %) | $ | 237,555 | $ | 253,948 | (6.5 | %) | ||||||||||||
| Commercial Lines (4) |
178,798 | 189,342 | (5.6 | %) | 189,342 | 198,404 | (4.6 | %) | ||||||||||||||||
| Reinsurance (5) |
43,253 | 41,568 | 4.1 | % | 41,568 | 51,791 | (19.7 | %) | ||||||||||||||||
|
|
|
|
|
|
|
|
|
|
|
|
|
|||||||||||||
| Total net premiums earned |
$ | 438,034 | $ | 468,465 | (6.5 | %) | $ | 468,465 | $ | 504,143 | (7.1 | %) | ||||||||||||
|
|
|
|
|
|
|
|
|
|
|
|
|
|||||||||||||
NM — not meaningful
| (1) | Gross premiums written represent the amount received or to be received for insurance policies written without reduction for reinsurance costs or other deductions. |
| (2) | Net premiums written equal gross premiums written less ceded premiums written. |
| (3) | Includes business written by American Reliable that is ceded to insurance companies owned by Assurant under a 100% quota share reinsurance agreement of ($1.3) million, $35.3 million, and $55.8 million during the years ended December 31, 2017, 2016, and 2015, respectively. |
| (4) | Includes business ceded to the Company’s Reinsurance Operations. |
| (5) | External business only, excluding business assumed from affiliates. |
Gross premiums written decreased by 8.7% for year ended December 31, 2017 as compared to 2016. Gross premiums written include business written by American Reliable that is ceded to insurance entities owned by Assurant under a 100% quota share reinsurance agreement in the amount of ($1.3) million and $35.3 million for the years ended December 31, 2017 and 2016, respectively. Excluding the business that is ceded 100% to insurance entities owned by Assurant, gross premiums written decreased by 2.4% for the year ended December 31, 2017 as compared to 2016. The decline is mainly due to the discontinuance of one unprofitable program within the Company’s Commercial Lines, underwriting actions taken within the Company’s Personal Lines to improve profitability, and a reduction in premiums written within the Company’s Reinsurance Operations related to cancellation of a treaty. This decline was partially offset by an increase in gross premiums written within the Company’s Commercial Lines due to the introduction of a new program as well as increased production as a result of providing additional commission incentives for increased business.
66
Table of Contents
Gross premiums written decreased by 4.1% for year ended December 31, 2016 as compared to 2015. Gross premiums written include business written by American Reliable that is ceded to insurance entities owned by Assurant under a 100% quota share reinsurance agreement in the amount of $35.3 million and $55.8 million for the years ended December 31, 2016 and 2015, respectively. Excluding the business that is ceded 100% to insurance entities owned by Assurant, gross premiums written decreased by 0.7% for the year ended December 31, 2016 as compared to 2015. The decline is mainly due to targeted reductions in catastrophe exposed business within the Company’s U.S. Insurance Operations offset by an increase in gross premiums written within the Company’s Reinsurance Operations due to a new mortgage insurance treaty written in the fourth quarter of 2016. This new mortgage insurance treaty contributed $22.4 million to gross premiums written in 2016 and is expected to earn over an eight year period.
Net Retention
The ratio of net premiums written to gross premiums written is referred to as the Company’s net premium retention. The Company’s net premium retention is summarized by segments as follows:
| Years Ended December 31, |
Change | Years Ended December 31, |
Change | |||||||||||||||||||||
| (Dollars in thousands) | 2017 | 2016 | 2016 | 2015 | ||||||||||||||||||||
| Personal Lines (1) |
83.5 | % | 85.3 | % | (1.8 | %) | 85.3 | % | 93.3 | % | (8.0 | %) | ||||||||||||
| Commercial Lines |
87.7 | % | 90.1 | % | (2.4 | %) | 90.1 | % | 93.0 | % | (2.9 | %) | ||||||||||||
| Reinsurance |
100.1 | % | 99.9 | % | 0.2 | % | 99.9 | % | 99.9 | % | 0.0 | % | ||||||||||||
|
|
|
|
|
|
|
|
|
|||||||||||||||||
| Total (1) |
87.0 | % | 88.8 | % | (1.8 | %) | 88.8 | % | 93.8 | % | (5.0 | %) | ||||||||||||
|
|
|
|
|
|
|
|
|
|||||||||||||||||
| (1) | Excludes business written by American Reliable that is ceded to insurance companies owned by Assurant under a 100% quota share reinsurance agreement of ($1.3) million and $35.3 million during the years ended December 31, 2017 and 2016, respectively. |
The net premium retention for the year ended December 31, 2017 decreased by 1.7 points for Personal Lines and decreased by 2.4 points for Commercial Lines as compared to 2016 primarily due to the Property Catastrophe Quota Share Treaty that became effective on April 15, 2017. Please see the Liquidity and Capital Resource section below for additional information on the Property Catastrophe Quota Share.
The net premium retention for the Personal Lines segment for the year ended December 31, 2016 decreased by 8.0 points compared to the same period in 2015. The reduction in the Personal Lines’ retention rate for the year ended December 31, 2016 was primarily due to an increase in catastrophe reinsurance as well as the quota share arrangement that was put in place during the second quarter of 2016.
Net Premiums earned
Net premiums earned within the Personal Lines segment decreased by 9.1% for the year ended December 31, 2017 as compared to the same period in 2016 primarily due to a decline in gross premiums written as well as the ceding of additional premiums under the property catastrophe treaties. Property net premiums earned were $183.5 million and $203.1 million for the years ended December 31, 2017 and 2016, respectively. Casualty net premiums earned were $32.5 million and $34.4 million for the years ended December 31, 2017 and 2016, respectively.
Net premiums earned within the Personal Lines segment decreased by 6.5% for the year ended December 31, 2016 as compared to the same period in 2015. This decline was due to the purchase of additional catastrophe
reinsurance. In addition, net premiums earned also decreased due to incurring a reinstatement premium of
67
Table of Contents
$7.1 million in connection with wildfires that occurred in Tennessee during the 4th quarter of 2016 . These wildfires resulted in the Company incurring $25.0 million in net losses in 2016. Property net premiums earned were $203.1 million and $223.6 million for the years ended December 31, 2016 and 2015, respectively. Casualty net premiums earned were $34.4 million and $30.3 million for the years ended December 31, 2016 and 2015, respectively.
Net premiums earned within the Commercial Lines segment decreased by 5.6% for the year ended December 31, 2017 as compared to the same period in 2016. The decline in net premiums earned was primarily due to the Company discontinuing one of its programs within the Commercial Lines as well as the Company ceding additional premiums under the new Property Catastrophe Quota Share Treaty which was effective April 15, 2017. This decline was partially offset by an increase in gross premiums due to the introduction of a new program. Property net premiums earned were $90.0 million and $102.4 million for the years ended December 31, 2017 and 2016, respectively. Casualty net premiums earned were $88.8 million and $87.0 million for the years ended December 31, 2017 and 2016, respectively.
Net premiums earned within the Commercial Lines segment decreased by 4.6% for the year ended December 31, 2016 as compared to the same period in 2015. The decline in net premiums earned was primarily due to decreasing the Company’s property retention, the purchase of additional property excess of loss reinsurance, and a slight reduction in gross premiums written. Property net premiums earned were $102.4 million and $112.6 million for the years ended December 31, 2016 and 2015, respectively. Casualty net premiums earned were $87.0 million and $85.8 million for the years ended December 31, 2016 and 2015, respectively.
Net premiums earned within the Reinsurance Operations segment increased by 4.1% for the year ended December 31, 2017 as compared to the same period in 2016. This increase was primarily due to a new mortgage treaty written in the fourth quarter of 2016 which is expected to earn out over an eight year period. This new mortgage insurance treaty will not be renewed. Property net premiums earned were $38.4 million and $37.6 million for the years ended December 31, 2017 and 2016, respectively. Casualty net premiums earned were $4.8 million and $4.0 million for the years ended December 31, 2017 and 2016, respectively.
Net premiums earned within the Reinsurance Operations segment decreased by 19.7% for the year ended December 31, 2016 as compared to the same period in 2015. The decline in net premiums earned was primarily due to one treaty being non-renewed in 2016 in an effort to reduce catastrophe exposure. Property net premiums earned were $37.6 million and $49.5 million for the years ended December 31, 2016 and 2015, respectively. Casualty net premiums earned were $4.0 million and $2.3 million for the years ended December 31, 2016 and 2015, respectively.
68
Table of Contents
Underwriting Results
Personal Lines
The components of income from the Company’s Personal Lines segment and corresponding underwriting ratios are as follows:
| Years Ended December 31, |
% Change |
Years Ended December 31, |
% Change |
|||||||||||||||||||||
| (Dollars in thousands) | 2017 (3) | 2016 (3) | 2016 (3) | 2015 (3) | ||||||||||||||||||||
| Gross premiums written (1) |
$ | 249,777 | $ | 302,947 | (17.6 | %) | $ | 302,947 | $ | 327,147 | (7.4 | %) | ||||||||||||
|
|
|
|
|
|
|
|
|
|
|
|
|
|||||||||||||
| Net premiums written |
$ | 209,799 | $ | 228,183 | (8.1 | %) | $ | 228,183 | $ | 253,157 | (9.9 | %) | ||||||||||||
|
|
|
|
|
|
|
|
|
|
|
|
|
|||||||||||||
| Net premiums earned |
$ | 215,983 | $ | 237,555 | (9.1 | %) | $ | 237,555 | $ | 253,948 | (6.5 | %) | ||||||||||||
| Other income |
6,288 | 3,712 | 69.4 | % | 3,712 | 3,493 | 6.3 | % | ||||||||||||||||
|
|
|
|
|
|
|
|
|
|
|
|
|
|||||||||||||
| Total revenues |
222,271 | 241,267 | (7.9 | %) | 241,267 | 257,441 | (6.3 | %) | ||||||||||||||||
| Losses and expenses: |
||||||||||||||||||||||||
| Net losses and loss adjustment expenses |
165,798 | 174,528 | (5.0 | %) | 174,528 | 163,045 | 7.0 | % | ||||||||||||||||
| Acquisition costs and other underwriting expenses (2) |
93,113 | 99,109 | (6.0 | %) | 99,109 | 97,687 | 1.5 | % | ||||||||||||||||
|
|
|
|
|
|
|
|
|
|
|
|
|
|||||||||||||
| Underwriting income (loss) |
$ | (36,640 | ) | $ | (32,370 | ) | (13.2 | %) | $ | (32,370 | ) | $ | (3,291 | ) | NM | |||||||||
|
|
|
|
|
|
|
|
|
|
|
|
|
|||||||||||||
| Years Ended December 31, |
Point Change |
Years Ended December 31, |
Point Change |
|||||||||||||||||||||
| 2017 (3) | 2016 (3) | 2016 (3) | 2015 (3) | |||||||||||||||||||||
| Underwriting Ratios: |
||||||||||||||||||||||||
| Loss ratio: |
||||||||||||||||||||||||
| Current accident year |
79.8 | % | 73.5 | % | 6.3 | 73.5 | % | 64.4 | % | 9.1 | ||||||||||||||
| Prior accident year |
(3.1 | %) | 0.0 | % | (3.1 | ) | 0.0 | % | (0.2 | %) | 0.2 | |||||||||||||
|
|
|
|
|
|
|
|
|
|
|
|
|
|||||||||||||
| Calendar year loss ratio |
76.7 | % | 73.5 | % | 3.2 | 73.5 | % | 64.2 | % | 9.3 | ||||||||||||||
| Expense ratio |
43.1 | % | 41.7 | % | 1.4 | 41.7 | % | 38.5 | % | 3.2 | ||||||||||||||
|
|
|
|
|
|
|
|
|
|
|
|
|
|||||||||||||
| Combined ratio |
119.8 | % | 115.2 | % | 4.6 | 115.2 | % | 102.7 | % | 12.5 | ||||||||||||||
|
|
|
|
|
|
|
|
|
|
|
|
|
|||||||||||||
NM — not meaningful
| (1) | Includes business written by American Reliable that is ceded to insurance companies owned by Assurant under a 100% quota share reinsurance agreement of ($1.3) million, $35.3 million, and $55.8 during the years ended December 31, 2017, 2016, and 2015, respectively. |
| (2) | Includes excise tax related to cessions from the Company’s Personal Lines to its Reinsurance Operations of $0.9 million, $0.9 million, and $1.3 million for the years ended December 31, 2017, 2016, and 2015, respectively. |
| (3) | Includes business ceded to the Company’s Reinsurance Operations. |
Premiums
See “Result of Operations” above for a discussion on consolidated premiums for 2017.
Other Income
Other income was $6.3 million, $3.7 million and $3.5 million for the years ended December 31, 2017, 2016, and 2015, respectively. Other income is primarily comprised of fee income on installments, commission income, and accrued interest on the anticipated indemnification of unpaid loss and loss adjustment expense reserves. In accordance with a dispute resolution agreement between Global Indemnity Group, Inc. and American Bankers Group, Inc., any variance paid related to the loss indemnification will be subject to interest of 5% compounded
69
Table of Contents
semi-annually. The increase in other income is primarily the result of the Company increasing its estimate of unpaid losses and loss adjustment expenses that would be indemnified by $19.4 million and $1.5 million during 2017 and 2016, respectively.
Loss Ratio
The current accident year losses and loss ratio is summarized as follows:
| Years Ended December 31, |
% Change |
Years Ended December 31, |
% Change |
|||||||||||||||||||||
| (Dollars in thousands) | 2017 | 2016 | 2016 | 2015 | ||||||||||||||||||||
| Property losses |
||||||||||||||||||||||||
| Catastrophe |
$ | 51,015 | $ | 58,590 | (12.9 | %) | $ | 58,590 | $ | 33,961 | 72.5 | % | ||||||||||||
| Non-catastrophe |
98,676 | 91,521 | 7.8 | % | 91,521 | 110,225 | (17.0 | %) | ||||||||||||||||
|
|
|
|
|
|
|
|
|
|
|
|
|
|||||||||||||
| Property losses |
149,691 | 150,111 | (0.3 | %) | 150,111 | 144,186 | 4.1 | % | ||||||||||||||||
| Casualty losses |
22,711 | 24,398 | (6.9 | %) | 24,398 | 19,285 | 26.5 | % | ||||||||||||||||
|
|
|
|
|
|
|
|
|
|
|
|
|
|||||||||||||
| Total accident year losses |
$ | 172,402 | $ | 174,509 | (1.2 | %) | $ | 174,509 | $ | 163,471 | 6.8 | % | ||||||||||||
|
|
|
|
|
|
|
|
|
|
|
|
|
|||||||||||||
| Years Ended December 31, |
Point Change |
Years Ended December 31, |
Point Change |
|||||||||||||||||||||
| 2017 | 2016 | 2016 | 2015 | |||||||||||||||||||||
| Current accident year loss ratio: |
||||||||||||||||||||||||
| Property |
||||||||||||||||||||||||
| Catastrophe |
27.8 | % | 28.8 | % | (1.0 | ) | 28.8 | % | 15.2 | % | 13.6 | |||||||||||||
| Non-catastrophe |
53.8 | % | 45.1 | % | 8.7 | 45.1 | % | 49.3 | % | (4.2 | ) | |||||||||||||
|
|
|
|
|
|
|
|
|
|
|
|
|
|||||||||||||
| Property loss ratio |
81.6 | % | 73.9 | % | 7.7 | 73.9 | % | 64.5 | % | 9.4 | ||||||||||||||
| Casualty loss ratio |
69.8 | % | 70.9 | % | (1.1 | ) | 70.9 | % | 63.6 | % | 7.3 | |||||||||||||
|
|
|
|
|
|
|
|
|
|
|
|
|
|||||||||||||
| Total accident year loss ratio |
79.8 | % | 73.5 | % | 6.3 | 73.5 | % | 64.4 | % | 9.1 | ||||||||||||||
|
|
|
|
|
|
|
|
|
|
|
|
|
|||||||||||||
The current accident year catastrophe loss ratio for 2017 improved by 1.0 point compared to 2016. 2016 included net losses from the Tennessee wildfires as well as some smaller catastrophes. 2017 included catastrophe losses from hurricanes Harvey, Irma, and Maria as well as losses from the California wildfires. The current accident year catastrophe loss ratio for 2016 increased by 13.6 points compared to 2015 primarily due to the higher catastrophe losses experienced during the fourth accident quarter of 2016, particularly from the Tennessee Wildfires.
The current accident year non-catastrophe loss ratio for 2017 increased by 8.7 point compared to 2016 mainly due to higher claims frequency and severity compared to last year. The current accident year non-catastrophe loss ratio for 2016 improved by 4.2 point compared to 2015 mainly due to lower case incurred emergence resulting from a decrease in reported claim frequency.
The current accident year casualty loss ratio for 2017 improved by 1.1 points compared to 2016 driven primarily by lower reported claims frequency as compared to the same period last year. The current accident year casualty loss ratio for 2016 increased by 7.3 points compared to 2015 mainly due to an increase in claims severity compared to the previous year.
The calendar year loss ratio for the years ended December 31, 2017, 2016, and 2015 includes a decrease of $6.6 million, or 3.1 percentage points, an increase of $0.02 million, or less than 0.1 percentage points, and a decrease of $0.4 million, or 0.2 percentage points, respectively, related to reserve development on prior accident years. There were no changes to net prior accident year losses during the year ended December 31, 2015. Please see Note 11 of the notes to the consolidated financial statements in Item 8 of Part II of this report for further discussion on prior accident year development.
70
Table of Contents
Reconciliation of non-GAAP financial measures and ratios
The table below reconciles the non-GAAP measures or ratios to its most directly comparable GAAP measure or ratio. The Company believes the non-GAAP measures or ratios are useful to investors when evaluating the Company’s underwriting performance as trends in the Company’s Personal Lines may be obscured by prior accident year adjustments. These non-GAAP measures or ratios should not be considered as a substitute for its most directly comparable GAAP measure or ratio and does not reflect the overall underwriting profitability of the Company.
| Years Ended December 31, | ||||||||||||||||||||||||
| 2017 | 2016 | 2015 | ||||||||||||||||||||||
| Losses $ | Loss Ratio |
Losses $ | Loss Ratio |
Losses $ | Loss Ratio |
|||||||||||||||||||
| Property |
||||||||||||||||||||||||
| Non catastrophe property losses and ratio excluding the effect of prior accident year (1) |
$ | 98,676 | 53.8 | % | $ | 91,521 | 45.1 | % | $ | 110,225 | 49.3 | % | ||||||||||||
| Effect of prior accident year |
(3,933 | ) | (2.1 | %) | 39 | — | (314 | ) | (0.1 | %) | ||||||||||||||
|
|
|
|
|
|
|
|
|
|
|
|
|
|||||||||||||
| Non catastrophe property losses and ratio (2) |
$ | 94,743 | 51.6 | % | $ | 91,560 | 45.1 | % | $ | 109,911 | 49.2 | % | ||||||||||||
|
|
|
|
|
|
|
|
|
|
|
|
|
|||||||||||||
| Catastrophe losses and ratio excluding the effect of prior accident year (1) |
$ | 51,015 | 27.8 | % | $ | 58,590 | 28.8 | % | $ | 33,961 | 15.2 | % | ||||||||||||
| Effect of prior accident year |
(2,188 | ) | (1.2 | %) | (20 | ) | — | (112 | ) | (0.1 | %) | |||||||||||||
|
|
|
|
|
|
|
|
|
|
|
|
|
|||||||||||||
| Catastrophe losses and ratio (2) |
$ | 48,827 | 26.6 | % | $ | 58,570 | 28.8 | % | $ | 33,849 | 15.1 | % | ||||||||||||
|
|
|
|
|
|
|
|
|
|
|
|
|
|||||||||||||
| Total property losses and ratio excluding the effect of prior accident year (1) |
$ | 149,691 | 81.6 | % | $ | 150,111 | 73.9 | % | $ | 144,186 | 64.5 | % | ||||||||||||
| Effect of prior accident year |
(6,121 | ) | (3.3 | %) | 19 | — | (426 | ) | (0.2 | %) | ||||||||||||||
|
|
|
|
|
|
|
|
|
|
|
|
|
|||||||||||||
| Total property losses and ratio (2) |
$ | 143,570 | 78.3 | % | $ | 150,130 | 73.9 | % | $ | 143,760 | 64.3 | % | ||||||||||||
|
|
|
|
|
|
|
|
|
|
|
|
|
|||||||||||||
| Casualty |
||||||||||||||||||||||||
| Total Casualty losses and ratio excluding the effect of prior accident year (1) |
$ | 22,711 | 69.8 | % | $ | 24,398 | 70.9 | % | $ | 19,285 | 63.6 | % | ||||||||||||
| Effect of prior accident year |
(483 | ) | (1.5 | %) | — | — | — | — | ||||||||||||||||
|
|
|
|
|
|
|
|
|
|
|
|
|
|||||||||||||
| Total Casualty losses and ratio (2) |
$ | 22,228 | 68.4 | % | $ | 24,398 | 70.9 | % | $ | 19,285 | 63.6 | % | ||||||||||||
|
|
|
|
|
|
|
|
|
|
|
|
|
|||||||||||||
| Total |
||||||||||||||||||||||||
| Total net losses and loss adjustment expense and total loss ratio excluding the effect of prior accident year (1) |
$ | 172,402 | 79.8 | % | $ | 174,509 | 73.5 | % | $ | 163,471 | 64.4 | % | ||||||||||||
| Effect of prior accident year |
(6,604 | ) | (3.1 | %) | 19 | — | (426 | ) | (0.2 | %) | ||||||||||||||
|
|
|
|
|
|
|
|
|
|
|
|
|
|||||||||||||
| Total net losses and loss adjustment expense and total loss ratio (2) |
$ | 165,798 | 76.7 | % | $ | 174,528 | 73.5 | % | $ | 163,045 | 64.2 | % | ||||||||||||
|
|
|
|
|
|
|
|
|
|
|
|
|
|||||||||||||
| (1) | Non-GAAP measure / ratio |
| (2) | Most directly comparable GAAP measure / ratio |
Expense Ratios
The expense ratio increased 1.4 points from 41.7% for 2016 to 43.1% for 2017 mainly due to a reduction in Personal Lines’ net premiums earned in 2017 as compared to 2016; as a result of underwriting actions taken to improve profitability.
The expense ratio increased 3.2 points from 38.5% for 2015 to 41.7% for 2016 primarily due to the reduction in earned premiums in 2016 as a result of the quota share arrangement and the purchase of additional reinsurance.
71
Table of Contents
The increase in the expense ratio was also due to the 2015 expense ratio benefitting from accounting adjustments related to the purchase of American Reliable.
Commercial Lines
The components of income from the Company’s Commercial Lines segment and corresponding underwriting ratios are as follows:
| Years Ended December 31, |
% Change |
Years Ended December 31, |
% Change |
|||||||||||||||||||||
| (Dollars in thousands) | 2017 (2) | 2016 (2) | 2016 (2) | 2015 (2) | ||||||||||||||||||||
| Gross premiums written |
$ | 212,670 | $ | 203,061 | 4.7 | % | $ | 203,061 | $ | 213,353 | (4.8 | %) | ||||||||||||
|
|
|
|
|
|
|
|
|
|
|
|
|
|||||||||||||
| Net premiums written |
$ | 186,448 | $ | 182,956 | 1.9 | % | $ | 182,956 | $ | 198,404 | (7.8 | %) | ||||||||||||
|
|
|
|
|
|
|
|
|
|
|
|
|
|||||||||||||
| Net premiums earned |
$ | 178,798 | $ | 189,342 | (5.6 | %) | $ | 189,342 | $ | 198,404 | (4.6 | %) | ||||||||||||
| Other income |
78 | 6,857 | (98.9 | %) | 6,857 | — | NM | |||||||||||||||||
|
|
|
|
|
|
|
|
|
|
|
|
|
|||||||||||||
| Total revenues |
178,876 | 196,199 | (8.8 | %) | 196,199 | 198,404 | (1.1 | %) | ||||||||||||||||
| Losses and expenses: |
||||||||||||||||||||||||
| Net losses and loss adjustment expenses |
62,834 | 75,401 | (16.7 | %) | 75,401 | 98,471 | (23.4 | %) | ||||||||||||||||
| Acquisition costs and other underwriting expenses (1) |
75,990 | 81,477 | (6.7 | %) | 81,477 | 84,623 | (3.7 | %) | ||||||||||||||||
|
|
|
|
|
|
|
|
|
|
|
|
|
|||||||||||||
| Underwriting income (loss) |
$ | 40,052 | $ | 39,321 | 1.9 | % | $ | 39,321 | $ | 15,310 | 156.8 | % | ||||||||||||
|
|
|
|
|
|
|
|
|
|
|
|
|
|||||||||||||
| Years Ended December 31, |
Point Change |
Years Ended December 31, |
Point Change |
|||||||||||||||||||||
| 2017 (2) | 2016 (2) | 2016 (2) | 2015 (2) | |||||||||||||||||||||
| Underwriting Ratios: |
||||||||||||||||||||||||
| Loss ratio: |
||||||||||||||||||||||||
| Current accident year |
57.2 | % | 63.0 | % | (5.8 | ) | 63.0 | % | 62.3 | % | 0.7 | |||||||||||||
| Prior accident year |
(22.0 | %) | (23.1 | %) | 1.1 | (23.1 | %) | (12.7 | %) | (10.4 | ) | |||||||||||||
|
|
|
|
|
|
|
|
|
|
|
|
|
|||||||||||||
| Calendar year loss ratio |
35.2 | % | 39.9 | % | (4.7 | ) | 39.9 | % | 49.6 | % | (9.7 | ) | ||||||||||||
| Expense ratio |
42.5 | % | 43.0 | % | (0.5 | ) | 43.0 | % | 42.7 | % | 0.3 | |||||||||||||
|
|
|
|
|
|
|
|
|
|
|
|
|
|||||||||||||
| Combined ratio |
77.7 | % | 82.9 | % | (5.2 | ) | 82.9 | % | 92.3 | % | (9.4 | ) | ||||||||||||
|
|
|
|
|
|
|
|
|
|
|
|
|
|||||||||||||
NM — not meaningful
| (1) | Includes excise tax related to cessions from the Company’s Commercial Lines to its Reinsurance Operations of $0.7 million, $0.8 million, and $1.0 million for the years ended December 31, 2017, 2016, and 2015, respectively. |
| (2) | Includes business ceded to the Company’s Reinsurance Operations. |
Premiums
See “Result of Operations” above for a discussion on consolidated premiums.
Other Income
Other income was $0.1 million and $6.9 million for the years ended December 31, 2017 and 2016, respectively. There was no other income in 2015. For the years ended December 31, 2017, other income is primarily comprised of fee income. For the year ended December 31, 2016, other income is comprised of the net gain on the asset sale of the Company’s wholly owned subsidiary, United National Specialty Insurance Company.
72
Table of Contents
Loss Ratio
The current accident year losses and loss ratio is summarized as follows:
| Years Ended December 31, |
% Change |
Years Ended December 31, |
% Change |
|||||||||||||||||||||
| (Dollars in thousands) | 2017 | 2016 | 2016 | 2015 | ||||||||||||||||||||
| Property losses |
||||||||||||||||||||||||
| Catastrophe |
$ | 10,081 | $ | 13,550 | (25.6 | %) | $ | 13,550 | $ | 11,037 | 22.8 | % | ||||||||||||
| Non-catastrophe |
35,879 | 49,812 | (28.0 | %) | 49,812 | 53,865 | (7.5 | %) | ||||||||||||||||
|
|
|
|
|
|
|
|
|
|
|
|
|
|||||||||||||
| Property losses |
45,960 | 63,362 | (27.5 | %) | 63,362 | 64,902 | (2.4 | %) | ||||||||||||||||
| Casualty losses |
56,229 | 55,842 | 0.7 | % | 55,842 | 58,771 | (5.0 | %) | ||||||||||||||||
|
|
|
|
|
|
|
|
|
|
|
|
|
|||||||||||||
| Total accident year losses |
$ | 102,189 | $ | 119,204 | (14.3 | %) | $ | 119,204 | $ | 123,673 | (3.6 | %) | ||||||||||||
|
|
|
|
|
|
|
|
|
|
|
|
|
|||||||||||||
| Years Ended December 31, |
Point Change |
Years Ended December 31, |
Point Change |
|||||||||||||||||||||
| 2017 | 2016 | 2016 | 2015 | |||||||||||||||||||||
| Current accident year loss ratio: |
||||||||||||||||||||||||
| Property |
||||||||||||||||||||||||
| Catastrophe |
11.2 | % | 13.2 | % | (2.0 | ) | 13.2 | % | 9.8 | % | 3.4 | |||||||||||||
| Non-catastrophe |
39.8 | % | 48.7 | % | (8.9 | ) | 48.7 | % | 47.9 | % | 0.8 | |||||||||||||
|
|
|
|
|
|
|
|
|
|
|
|
|
|||||||||||||
| Property loss ratio |
51.0 | % | 61.9 | % | (10.9 | ) | 61.9 | % | 57.7 | % | 4.2 | |||||||||||||
| Casualty loss ratio |
63.4 | % | 64.2 | % | (0.8 | ) | 64.2 | % | 68.5 | % | (4.3 | ) | ||||||||||||
|
|
|
|
|
|
|
|
|
|
|
|
|
|||||||||||||
| Total accident year loss ratio |
57.2 | % | 63.0 | % | (5.8 | ) | 63.0 | % | 62.3 | % | 0.7 | |||||||||||||
|
|
|
|
|
|
|
|
|
|
|
|
|
|||||||||||||
The current accident year catastrophe loss ratio for 2017 improved by 2.0 points compared to 2016 primarily due to lower claims severity in 2017. The current accident year catastrophe loss ratio for 2016 increased by 3.4 points compared to 2015 primarily due to losses from convective storms occurring during the first six months of the year.
The current accident year property non-catastrophe loss ratio for 2017 improved by 8.9 points compared to 2016 primarily due to Property Brokerage having several large losses in 2016. The current accident year property non-catastrophe loss ratio for 2016 increased by 0.8 points compared to 2015.
The current accident year casualty loss ratio for 2017 improved by 0.8 points compared to 2016 driven primarily by lower reported claims frequency as compared to the same period last year. The current accident year casualty loss ratio for 2016 improved by 4.3 points compared to 2015 mainly due to the decrease in reported claim frequency which reflects the milder winter weather experienced during 2016. Also, underwriting actions and rate increases over the past several years have contributed to the improvement experienced to date.
The calendar year loss ratio for the years ended December 31, 2017, 2016, and 2015 includes a decrease of $39.4 million, or 22.0 percentage points, a decrease of $43.8 million or 23.1 percentage points, and a decrease of $25.2 million or 12.7 percentage points, respectively, related to reserve development on prior accident years. Please see Note 11 of the notes to the consolidated financial statements in Item 8 of Part II of this report for further discussion on prior accident year development.
Reconciliation of non-GAAP financial measures and ratios
The table below reconciles the non-GAAP measures or ratios, which excludes the impact of prior accident year adjustments, to its most directly comparable GAAP measure or ratio. The Company believes the non-GAAP measures or ratios are useful to investors when evaluating the Company’s underwriting performance as trends in
73
Table of Contents
the Company’s Commercial Lines may be obscured by prior accident year adjustments. These non-GAAP measures or ratios should not be considered as a substitute for its most directly comparable GAAP measure or ratio and does not reflect the overall underwriting profitability of the Company.
| Years Ended December 31, | ||||||||||||||||||||||||
| 2017 | 2016 | 2015 | ||||||||||||||||||||||
| Losses $ | Loss Ratio |
Losses $ | Loss Ratio |
Losses $ | Loss Ratio |
|||||||||||||||||||
| Property |
||||||||||||||||||||||||
| Non catastrophe property losses and ratio excluding the effect of prior accident year (1) |
$ | 35,879 | 39.8 | % | $ | 49,812 | 48.7 | % | $ | 53,865 | 47.9 | % | ||||||||||||
| Effect of prior accident year |
(4,903 | ) | (5.4 | %) | 926 | 0.9 | % | (887 | ) | (0.8 | %) | |||||||||||||
|
|
|
|
|
|
|
|
|
|
|
|
|
|||||||||||||
| Non catastrophe property losses and ratio (2) |
$ | 30,976 | 34.4 | % | $ | 50,738 | 49.6 | % | $ | 52,978 | 47.1 | % | ||||||||||||
|
|
|
|
|
|
|
|
|
|
|
|
|
|||||||||||||
| Catastrophe losses and ratio excluding the effect of prior accident year (1) |
$ | 10,081 | 11.2 | % | $ | 13,550 | 13.2 | % | $ | 11,037 | 9.8 | % | ||||||||||||
| Effect of prior accident year |
(1,351 | ) | (1.5 | %) | (482 | ) | (0.5 | %) | 361 | 0.3 | % | |||||||||||||
|
|
|
|
|
|
|
|
|
|
|
|
|
|||||||||||||
| Catastrophe losses and ratio (2) |
$ | 8,730 | 9.7 | % | $ | 13,068 | 12.7 | % | $ | 11,398 | 10.1 | % | ||||||||||||
|
|
|
|
|
|
|
|
|
|
|
|
|
|||||||||||||
| Total property losses and ratio excluding the effect of prior accident year (1) |
$ | 45,960 | 51.0 | % | $ | 63,362 | 61.9 | % | $ | 64,902 | 57.7 | % | ||||||||||||
| Effect of prior accident year |
(6,255 | ) | (6.9 | %) | 444 | 0.4 | % | (526 | ) | (0.5 | %) | |||||||||||||
|
|
|
|
|
|
|
|
|
|
|
|
|
|||||||||||||
| Total property losses and ratio (2) |
$ | 39,705 | 44.1 | % | $ | 63,806 | 62.3 | % | $ | 64,376 | 57.2 | % | ||||||||||||
|
|
|
|
|
|
|
|
|
|
|
|
|
|||||||||||||
| Casualty |
||||||||||||||||||||||||
| Total Casualty losses and ratio excluding the effect of prior accident year (1) |
$ | 56,229 | 63.4 | % | $ | 55,842 | 64.2 | % | $ | 58,771 | 68.5 | % | ||||||||||||
| Effect of prior accident year |
(33,100 | ) | (37.3 | %) | (44,247 | ) | (50.9 | %) | (24,676 | ) | (28.7 | %) | ||||||||||||
|
|
|
|
|
|
|
|
|
|
|
|
|
|||||||||||||
| Total Casualty losses and ratio (2) |
$ | 23,129 | 26.1 | % | $ | 11,595 | 13.3 | % | $ | 34,095 | 39.8 | % | ||||||||||||
|
|
|
|
|
|
|
|
|
|
|
|
|
|||||||||||||
| Total |
||||||||||||||||||||||||
| Total net losses and loss adjustment expense and total loss ratio excluding the effect of prior accident year (1) |
$ | 102,189 | 57.2 | % | $ | 119,204 | 63.0 | % | $ | 123,673 | 62.3 | % | ||||||||||||
| Effect of prior accident year |
(39,355 | ) | (22.0 | %) | (43,803 | ) | (23.1 | %) | (25,202 | ) | (12.7 | %) | ||||||||||||
|
|
|
|
|
|
|
|
|
|
|
|
|
|||||||||||||
| Total net losses and loss adjustment expense and total loss ratio (2) |
$ | 62,834 | 35.2 | % | $ | 75,401 | 39.9 | % | $ | 98,471 | 49.6 | % | ||||||||||||
|
|
|
|
|
|
|
|
|
|
|
|
|
|||||||||||||
| (3) | Non-GAAP measure / ratio |
| (4) | Most directly comparable GAAP measure / ratio |
Expense Ratios
The expense ratio improved 0.5 points from 43.0% for 2016 to 42.5% for 2017.
The expense ratio increased 0.3 points from 42.7% for 2015 to 43.0% for 2016.
74
Table of Contents
Reinsurance Operations
The components of income from the Company’s Reinsurance Operations segment and corresponding underwriting ratios are as follows:
| Years Ended December 31, |
% Change |
Years Ended December 31, |
% Change |
|||||||||||||||||||||
| (Dollars in thousands) | 2017 (1) | 2016 (1) | 2016 (1) | 2015 (1) | ||||||||||||||||||||
| Gross premiums written |
$ | 53,887 | $ | 59,837 | (9.9 | %) | $ | 59,837 | $ | 49,733 | 20.3 | % | ||||||||||||
|
|
|
|
|
|
|
|
|
|
|
|
|
|||||||||||||
| Net premiums written |
$ | 53,933 | $ | 59,801 | (9.8 | %) | $ | 59,801 | $ | 49,683 | 20.4 | % | ||||||||||||
|
|
|
|
|
|
|
|
|
|
|
|
|
|||||||||||||
| Net premiums earned |
$ | 43,253 | $ | 41,568 | 4.1 | % | $ | 41,568 | $ | 51,791 | (19.7 | %) | ||||||||||||
| Other income (loss) |
216 | (224 | ) | (196.4 | %) | (224 | ) | (93 | ) | 140.9 | % | |||||||||||||
|
|
|
|
|
|
|
|
|
|
|
|
|
|||||||||||||
| Total revenues |
43,469 | 41,344 | 5.1 | % | 41,344 | 51,698 | (20.0 | %) | ||||||||||||||||
| Losses and expenses: |
||||||||||||||||||||||||
| Net losses and loss adjustment expenses |
40,580 | 14,074 | 188.3 | % | 14,074 | 13,852 | 1.6 | % | ||||||||||||||||
| Acquisition costs and other underwriting expenses |
14,630 | 16,064 | (8.9 | %) | 16,064 | 18,993 | (15.4 | %) | ||||||||||||||||
|
|
|
|
|
|
|
|
|
|
|
|
|
|||||||||||||
| Underwriting income (loss) |
$ | (11,741 | ) | $ | 11,206 | (204.8 | %) | $ | 11,206 | $ | 18,853 | (40.6 | %) | |||||||||||
|
|
|
|
|
|
|
|
|
|
|
|
|
|||||||||||||
| Years Ended December 31, |
Point Change |
Years Ended December 31, |
Point Change |
|||||||||||||||||||||
| 2017 (1) | 2016 (1) | 2016 (1) | 2015 (1) | |||||||||||||||||||||
| Underwriting Ratios: |
||||||||||||||||||||||||
| Loss ratio: |
||||||||||||||||||||||||
| Current accident year (2) |
112.2 | % | 66.3 | % | 45.9 | 66.3 | % | 44.3 | % | 22.0 | ||||||||||||||
| Prior accident year |
(18.4 | %) | (32.4 | %) | 14.0 | (32.4 | %) | (17.5 | %) | (14.9 | ) | |||||||||||||
|
|
|
|
|
|
|
|
|
|
|
|
|
|||||||||||||
| Calendar year loss ratio (3) |
93.8 | % | 33.9 | % | 59.9 | 33.9 | % | 26.8 | % | 7.1 | ||||||||||||||
| Expense ratio |
33.8 | % | 38.6 | % | (4.8 | ) | 38.6 | % | 36.7 | % | 1.9 | |||||||||||||
|
|
|
|
|
|
|
|
|
|
|
|
|
|||||||||||||
| Combined ratio |
127.6 | % | 72.5 | % | 55.1 | 72.5 | % | 63.5 | % | 9.0 | ||||||||||||||
|
|
|
|
|
|
|
|
|
|
|
|
|
|||||||||||||
| (1) | External business only, excluding business assumed from affiliates |
| (2) | Non-GAAP ratio |
| (3) | Most directly comparable GAAP ratio |
Reconciliation of non-GAAP financial ratios
The table above includes a reconciliation of the current accident year loss ratio, which is a non-GAAP ratio, to its calendar year loss ratio, which is its most directly comparable GAAP ratio. The Company believes this non-GAAP ratio is useful to investors when evaluating the Company’s underwriting performance as trends in the Company’s Reinsurance Operations may be obscured by prior accident year adjustments. This non-GAAP ratio should not be considered as a substitute for its most directly comparable GAAP ratio and does not reflect the overall underwriting profitability of the Company.
Premiums
See “Result of Operations” above for a discussion on consolidated premiums.
Other Income (Loss)
Reinsurance Operations recognized other income of $0.2 million in 2017, a loss of $0.2 million in 2016, and a loss of $0.1 million in 2015. Other income (loss) is comprised of foreign exchange gains and losses.
75
Table of Contents
Loss Ratio
The current accident year loss ratio for 2017 increased by 45.9 points compared to 2016. The increase in the loss ratio was mainly attributable to the higher impact from catastrophes, primarily hurricanes Harvey, Irma, and Maria as well as the California wildfires, as compared to the same period last year. The current accident year loss ratio for 2016 increased by 22.0 points compared to 2015 primarily in the property lines for both catastrophe and non-catastrophe contracts. The higher catastrophe losses were being driven by the Fort McMurray fires in Canada, Hurricane Matthew, and the New Zealand earthquake. The higher non-catastrophe experience reflects the impact of the Jubilee platform breakdown in Africa.
The calendar year loss ratio for the years ended December 31, 2017, 2016, and 2015 includes a decrease of $7.9 million, or 18.4 percentage points, a decrease of $13.5 million or 32.4 percentage points, and a decrease of $9.1 million or 17.5 percentage points, respectively, related to reserve development on prior accident years. Please see Note 11 of the notes to the consolidated financial statements in Item 8 of Part II of this report for further discussion on prior accident year development.
Expense Ratio
The expense ratio improved 4.8 points from 38.6% for 2016 to 33.8% for 2017. The improvement in the expense ratio is primarily due to receiving a federal excise tax refund related to prior years as well as lower contingent commission.
The expense ratio increased 1.9 points from 36.7% for 2015 to 38.6% for 2016. The increase is primarily due to higher ceding commission on business written as well as improvements in prior year losses resulting in higher contingent commission partially offset by a reduction in profit sharing commissions and a recovery of prior year cascading excise tax.
Unallocated Corporate Items
The Company’s investments are managed distinctly according to assets supporting future insurance obligations and assets in excess of those supporting future insurance obligations. Assets supporting insurance obligations are referred to as the Insurance Obligations Portfolio. The Insurance Obligations Portfolio consists of cash and high-quality fixed income investments. Assets in excess of insurance obligations are referred to as the Surplus Portfolio. The Surplus Portfolio targets higher returns and is comprised of cash, fixed income, common stocks, and alternative investments.
The Insurance Obligations Portfolio has a market value of $845.2 million. Of this amount, $845.2 million are fixed income securities with a credit quality of AA- and duration of 3.1 years. The Surplus Portfolio has a market value of $690.2 million. Of this amount, $425.7 million are fixed income securities with a credit quality of A- and duration of 3.5 years.
Since the Company began managing its investments as two portfolios during the 2nd quarter of 2017, year to date
performance metrics are an approximation. The Insurance Obligations Portfolio returned 2.2% for the year ended December 31, 2017 with net investment income of $18.7 million and realized gains of $0.8 million. The Surplus Portfolio returned 4.7% for the year ended December 31, 2017 with net investment income of $20.6 million and realized gains of $0.9 million.
76
Table of Contents
Net Investment Income
| Years Ended December 31, |
% Change |
Years Ended December 31, |
% Change |
|||||||||||||||||||||
| (Dollars in thousands) | 2017 | 2016 | 2016 | 2015 | ||||||||||||||||||||
| Gross investment income (1) |
$ | 42,250 | $ | 39,151 | 7.9 | % | $ | 39,151 | $ | 37,918 | 3.3 | % | ||||||||||||
| Investment expenses |
(2,927 | ) | (5,168 | ) | (43.4 | %) | (5,168 | ) | (3,309 | ) | 56.2 | % | ||||||||||||
|
|
|
|
|
|
|
|
|
|
|
|
|
|||||||||||||
| Net investment income |
$ | 39,323 | $ | 33,983 | 15.7 | % | $ | 33,983 | $ | 34,609 | (1.8 | %) | ||||||||||||
|
|
|
|
|
|
|
|
|
|
|
|
|
|||||||||||||
| (1) | Excludes realized gains and losses |
Gross investment income for 2017 increased by 7.9% compared to 2016. The increase was primarily due to an increase in yield and a larger fixed maturities portfolio resulting from $130.0 million in borrowings offset by a reduction in the investment portfolio of $83.0 million for the redemption in December, 2017. Gross investment income for 2016 increased by 3.3% compared to 2015. The increase was primarily due to the increase in income related to the Company’s limited liability investments during 2016 partially offset by a reduction in the size of the investment portfolio due to redeeming $190.0 million of A ordinary shares during the fourth quarter of 2015.
Investment expenses for 2017 decreased by 43.4% compared to 2016. Investment expenses for 2016 increased by 56.2% compared to 2015. The increase in investment expense in 2016 and subsequent decrease in 2017 is mainly attributable to $1.5 million in upfront fees paid in 2016 to enter into a new investment in middle market corporate debt and equity investments in limited liability companies.
At December 31, 2017, the Company held agency mortgage-backed securities with a market value of $81.2 million. Excluding the agency mortgage-backed securities, the average duration of the Company’s fixed maturities portfolio was 3.2 years as of December 31, 2017, compared with 1.9 years as of December 31, 2016. Including cash and short-term investments, the average duration of the Company’s fixed maturities portfolio, excluding agency mortgage-backed securities, was 3.0 years as of December 31, 2017 compared with 1.8 years as of December 31, 2016. Changes in interest rates can cause principal payments on certain investments to extend or shorten which can impact duration. At December 31, 2017, the Company’s embedded book yield on its fixed maturities, not including cash, was 2.7% compared with 2.1% at December 31, 2016. The embedded book yield on the $95.1 million of municipal bonds in the Company’s portfolio, which includes $93.5 million of taxable municipal bonds, was 3.0% at December 31, 2017, compared to an embedded book yield of 2.7% on the Company’s municipal bond portfolio of $156.4 million at December 31, 2016.
At December 31, 2016, the Company held agency mortgage-backed securities with a market value of $59.9 million. Excluding the agency mortgage-backed securities, the average duration of the Company’s fixed maturities portfolio was 1.9 years as of December 31, 2016, compared with 2.4 years as of December 31, 2015. Including cash and short-term investments, the average duration of the Company’s fixed maturities portfolio, excluding agency mortgage-backed securities, was 1.8 years as of December 31, 2016 compared with 2.3 years as of December 31, 2015. Changes in interest rates can cause principal payments on certain investments to extend or shorten which can impact duration. At December 31, 2016, the Company’s embedded book yield on its fixed maturities, not including cash, was 2.1% compared with 2.2% at December 31, 2015. The embedded book yield on the $156.4 million of municipal bonds in the Company’s portfolio, which includes $103.6 million of taxable municipal bonds, was 2.7% at December 31, 2016, compared to an embedded book yield of 2.7% on the Company’s municipal bond portfolio of $205.2 million at December 31, 2015.
77
Table of Contents
Net Realized Investment Gains (Losses)
The components of net realized investment gains (losses) for the years ended December 31, 2017, 2016, and 2015 were as follows:
| Years Ended December 31, | ||||||||||||
| (Dollars in thousands) | 2017 | 2016 | 2015 | |||||||||
| Common stock |
$ | 3,547 | $ | 27,049 | $ | 9,444 | ||||||
| Fixed maturities |
710 | 2,515 | 1,505 | |||||||||
| Interest rate swap |
(75 | ) | (1,110 | ) | (6,988 | ) | ||||||
| Other than temporary impairment losses |
(2,606 | ) | (6,733 | ) | (7,335 | ) | ||||||
|
|
|
|
|
|
|
|||||||
| Net realized investment gains (losses) |
$ | 1,576 | $ | 21,721 | $ | (3,374 | ) | |||||
|
|
|
|
|
|
|
|||||||
See Note 4 of the notes to the consolidated financial statements in Item 8 of Part II of this report for an analysis of total investment return on a pre-tax basis for the years ended December 31, 2017, 2016, and 2015.
Corporate and Other Operating Expenses
Corporate and other operating expenses consist of outside legal fees, other professional fees, directors’ fees, management fees & advisory fees, salaries and benefits for holding company personnel, development costs for new products, and taxes incurred which are not directly related to operations. Corporate and other operating expenses were $25.7 million, $17.3 million, and $24.4 million during the years ended December 31, 2017, 2016, and 2015, respectively. The increase in 2017 as compared to 2016 is primarily due to incurring a $11.0 million advisory fee related to the redemption and other services performed, whereas, 2016 included cost incurred in connection with the re-domestication in 2016 of $4.2 million. The decrease in 2016 as compared to 2015 is primarily due to 2015 including costs incurred in connection with the American Reliable acquisition of $8.3 million; whereas, 2016 included costs incurred in connection with the redomestication of $4.2 million.
Interest Expense
Interest expense was $16.9 million, $8.9 million, and $4.9 million during the years ended December 31, 2017, 2016, and 2015, respectively. The increase in 2017 as compared to 2016 is primarily due to the Company’s $130 million debt offering in March, 2017. The increase in 2016 as compared to 2015 is primarily due to the Company’s $100 million debt offering in August 2015 offset by a reduction in interest expense on margin borrowing facility due to decreased borrowings.
See Note 12 of the notes to the consolidated financial statements in Item 8 of Part II of this report for details on the Company’s debt.
Income Tax Benefit/Expense
The income tax benefit was $0.5 million for the year ended December 31, 2017 compared with income tax benefit of $2.3 million for the year ended December 31, 2016. The decrease in the income tax benefit is primarily due to incurring a provisional tax expense of $17.5 million related to the reduction in the deferred tax asset as a result of the TCJA enacted on December 22, 2017 which lowered the U.S. tax rate from 35% to 21% offset by a $18.4 million tax benefit primarily due to an increase in losses incurred in the Company’s U.S. operations for 2017 compared to 2016. The income tax benefit was $2.3 million for the year ended December 31, 2016 compared with income tax benefit of $8.7 million for the year ended December 31, 2015. The decrease in income tax benefit is primarily due to capital gains and the gain on the sale of United National Specialty Insurance Company during the year ended December 31, 2016.
See Note 10 of the notes to the consolidated financial statements in Item 8 of Part II of this report for a comparison of income tax between periods.
78
Table of Contents
Net Income (Loss)
The factors described above resulted in a net loss of $9.6 million, net income of $49.9 million, and net income of $41.5 million for the years ended December 31, 2017, 2016, and 2015, respectively.
Liquidity and Capital Resources
Sources and Uses of Funds
Global Indemnity is a holding company. Its principal asset is its ownership of the shares of its direct and indirect subsidiaries, including those of its U.S. insurance companies: United National Insurance Company, Diamond State Insurance Company, Penn-America Insurance Company, Penn-Star Insurance Company, Penn-Patriot Insurance Company, and American Reliable Insurance Company; and its Reinsurance Operations: Global Indemnity Reinsurance.
The principal sources of cash that Global Indemnity requires to meet its short term and long term liquidity needs, including the payment of corporate expenses, debt service payments, and share repurchases, includes dividends, other permitted disbursements from its direct and indirect subsidiaries, reimbursement for equity awards granted to employees and intercompany borrowings. The principal sources of funds at these direct and indirect subsidiaries include underwriting operations, investment income, and proceeds from sales and redemptions of investments. Funds are used principally by these operating subsidiaries to pay claims and operating expenses, to make debt payments, fund margin requirements on interest rate swap agreements, to purchase investments, and to make dividend payments. In addition, the Company periodically reviews opportunities related to business acquisitions and as a result, liquidity may be needed in the future.
On March 23, 2017, the Company issued 7.875% Subordinated Notes due in 2047 in the aggregate principal amount of $130.0 million through an underwritten public offering. See Note 12 of the notes to consolidated financial statements in Item 8 of Part II of this report for additional information on this debt issuance.
On December 29, 2017, Global Indemnity acquired 3,397,031 of its A ordinary shares for approximately $83.0 million in the aggregate (approximately $24.44 per share) from former investors in vehicles managed by Fox Paine & Company, LLC. The Company sold $99.0 million of securities from its consolidated investment portfolio during December, 2017 to provide funding for the redemption and other obligations.
During the fourth quarter of 2017, Global Indemnity announced the adoption of a dividend program. Although subject to the absolute discretion of the Board of Directors and factors, conditions, and prospects as such may exist from time to time when the Board of Directors considers the advisability of declaring a quarterly dividend, the Company currently anticipates an initial dividend rate of $0.25 per share per quarter ($1.00 per share per year). As of December 31, 2017, there are currently 14,206,742 shares issued and outstanding.
As of December 31, 2017, the Company also had future funding commitments of $57.7 million related to investments. The timing of commitments related to investments is uncertain.
The future liquidity of Global Indemnity is dependent on the ability of its subsidiaries to pay dividends. Global Indemnity’s U.S. insurance companies are restricted by statute as to the amount of dividends that they may pay without the prior approval of regulatory authorities. The dividend limitations imposed by state laws are based on the statutory financial results of each insurance company within the Insurance Operations that are determined by using statutory accounting practices that differ in various respects from accounting principles used in financial statements prepared in conformity with GAAP. See “Regulation — Statutory Accounting Principles.” Key differences relate to, among other items, deferred acquisition costs, limitations on deferred income taxes, reserve calculation assumptions and surplus notes.
79
Table of Contents
Under Indiana law, Diamond State Insurance Company may not pay any dividend or make any distribution of cash or other property, the fair market value of which, together with that of any other dividends or distributions made within the 12 consecutive months ending on the date on which the proposed dividend or distribution is scheduled to be made, exceeds the greater of (1) 10% of its surplus as of the 31st day of December of the last preceding year, or (2) its net income for the 12 month period ending on the 31st day of December of the last preceding year, unless the commissioner approves the proposed payment or fails to disapprove such payment within 30 days after receiving notice of such payment. An additional limitation is that Indiana does not permit a domestic insurer to declare or pay a dividend except out of unassigned surplus unless otherwise approved by the commissioner before the dividend is paid.
Under Pennsylvania law, United National Insurance Company, Penn-America Insurance Company, and Penn-Star Insurance Company may not pay any dividend or make any distribution that, together with other dividends or distributions made within the preceding 12 consecutive months, exceeds the greater of (1) 10% of its surplus as shown on its last annual statement on file with the commissioner or (2) its net income for the period covered by such statement, not including pro rata distributions of any class of its own securities, unless the commissioner has received notice from the insurer of the declaration of the dividend and the commissioner approves the proposed payment or fails to disapprove such payment within 30 days after receiving notice of such payment. An additional limitation is that Pennsylvania does not permit a domestic insurer to declare or pay a dividend except out of unassigned funds (surplus) unless otherwise approved by the commissioner before the dividend is paid. Furthermore, no dividend or other distribution may be declared or paid by a Pennsylvania insurance company that would reduce its total capital and surplus to an amount that is less than the amount required by the Insurance Department for the kind or kinds of business that it is authorized to transact. Pennsylvania law allows loans to affiliates up to 10% of statutory surplus without prior regulatory approval.
Under Virginia law, Penn-Patriot Insurance Company may not pay any dividend or make any distribution of cash or other property, the fair market value of which, together with that of any other dividends or distributions made within the preceding 12 consecutive months exceeds the lesser of either (1) 10% of its surplus as of the 31st day of December of the last preceding year, or (2) its net income, not including net realized capital gains, for the 12 month period ending on the 31st day of December of the last preceding year, not including pro rata distributions of any class of its securities, unless the commissioner approves the proposed payment or fails to disapprove such payment within 30 days after receiving notice of such payment. In determining whether the dividend must be approved, undistributed net income from the second and third preceding years, not including net realized capital gains, may be carried forward.
Under Arizona law, American Reliable Insurance Company may not pay any dividend or make any distribution of cash or other property, the fair market value of which, together with that of any other dividends or distributions made within the preceding 12 months exceeds the lesser of either (1) 10% of its surplus as of the 31st day of December of the last preceding year, or (2) its net income for the 12 month period ending on the 31st day of December of the last preceding year, not including pro rata distributions of any class of its securities, unless the commissioner approves the proposed payment or fails to disapprove such payment within 30 days after receiving notice of such payment.
See Note 19 of the notes to consolidated financial statements in Item 8 of Part II of this report for the dividends declared and paid by Global Indemnity’s U.S. insurance companies in 2017 and the maximum amount of distributions that U.S. insurance companies could pay as dividends in 2018.
Global Indemnity Reinsurance is prohibited, without the approval of the BMA, from reducing by 15% or more its total statutory capital or 25% or more of its total statutory capital and surplus as set out in its previous year’s statutory financial statements, and any application for such approval must include such information as the BMA may require. Based upon the total statutory capital plus the statutory surplus as set out in its 2017 statutory financial statements that will be filed in 2018, the Company believes Global Indemnity Reinsurance could pay a dividend of up to $227.1 million without requesting BMA approval. For 2018, the Company believes that Global
80
Table of Contents
Indemnity Reinsurance, including distributions it could receive from its subsidiaries, should have sufficient liquidity and solvency to pay dividends. In 2017, Global Indemnity Reinsurance declared a dividend of $120.0 million to its parent, Global Indemnity. Of this amount, $100.0 million was paid to Global Indemnity in December, 2017. As of December 31, 2017, accrued dividends were $20.0 million.
Surplus Levels
Global Indemnity’s U.S. insurance companies are required by law to maintain a certain minimum level of policyholders’ surplus on a statutory basis. Policyholders’ surplus is calculated by subtracting total liabilities from total assets. The NAIC has risk-based capital standards that are designed to identify property and casualty insurers that may be inadequately capitalized based on the inherent risks of each insurer’s assets and liabilities and mix of net premiums written. Insurers falling below a calculated threshold may be subject to varying degrees of regulatory action. Based on the standards currently adopted, the policyholders’ surplus of each of the U.S. insurance companies is in excess of the prescribed minimum company action level risk-based capital requirements.
Sources of operating funds consist primarily of net premiums written and investment income. Funds are used primarily to pay claims and operating expenses and to purchase investments. As a result of the new dividend policy, funds may also be used in the future to pay dividends to shareholders of Global Indemnity Limited.
The Company’s reconciliation of net income to cash provided from (used for) operations is generally influenced by the following:
| • | the fact that the Company collect premiums, net of commission, in advance of losses paid; |
| • | the timing of the Company’s settlements with its reinsurers; and |
| • | the timing of the Company’s loss payments. |
Net cash provided by (used for) operating activities in 2017, 2016, and 2015 was ($23.7) million, ($24.4) million and $3.8 million, respectively.
In 2017, the increase in operating cash flows of approximately $0.7 million from the prior year was primarily a net result of the following items:
| 2017 | 2016 | Change | ||||||||||
| Net premiums collected |
$ | 422,075 | $ | 480,799 | $ | (58,724 | ) | |||||
| Net losses paid |
(266,238 | ) | (321,188 | ) | 54,950 | |||||||
| Underwriting and corporate expenses |
(202,055 | ) | (217,845 | ) | 15,790 | |||||||
| Net investment income |
37,186 | 37,915 | (729 | ) | ||||||||
| Net federal income taxes recovered (paid) |
(114 | ) | 4,694 | (4,808 | ) | |||||||
| Interest paid |
(14,504 | ) | (8,771 | ) | (5,733 | ) | ||||||
|
|
|
|
|
|
|
|||||||
| Net cash provided by (used for) operating activities |
$ | (23,650 | ) | $ | (24,396 | ) | $ | 746 | ||||
|
|
|
|
|
|
|
|||||||
81
Table of Contents
In 2016, the decrease in operating cash flows of approximately $28.1 million from the prior year was primarily a net result of the following items:
| 2016 | 2015 | Change | ||||||||||
| Net premiums collected |
$ | 480,799 | $ | 527,123 | $ | (46,324 | ) | |||||
| Net losses paid |
(321,188 | ) | (336,316 | ) | 15,128 | |||||||
| Underwriting and corporate expenses |
(217,845 | ) | (229,738 | ) | 11,893 | |||||||
| Net investment income |
37,915 | 46,709 | (8,794 | ) | ||||||||
| Net federal income taxes recovered (paid) |
4,694 | (102 | ) | 4,796 | ||||||||
| Interest paid |
(8,771 | ) | (3,926 | ) | (4,845 | ) | ||||||
|
|
|
|
|
|
|
|||||||
| Net cash provided by (used for) operating activities |
$ | (24,396 | ) | $ | 3,750 | $ | (28,146 | ) | ||||
|
|
|
|
|
|
|
|||||||
See the consolidated statements of cash flows in the financial statements in Item 8 of Part II of this report for details concerning the Company’s investing and financing activities.
Liquidity
Currently, the Company believes each company in its Insurance Operations and Reinsurance Operations maintains sufficient liquidity to pay claims through cash generated by operations and liquid investments. The holding companies also maintain sufficient liquidity to meet their obligations. The Company monitors its investment portfolios to assure liability and investment durations are closely matched.
Prospectively, as fixed income investments mature and new cash is obtained, the cash available to invest will be invested in accordance with the Company’s investment policy. The Company’s investment policy allows the Company to invest in taxable and tax-exempt fixed income investments as well as publicly traded and private equity investments. With respect to bonds, the Company’s credit exposure limit for each issuer varies with the issuer’s credit quality. The allocation between taxable and tax-exempt bonds is determined based on market conditions and tax considerations. The fixed income portfolio currently has a duration of 3.23 years which allows the Company to defensively position itself during the current low interest rate environment.
The Company has access to various capital sources including dividends from insurance subsidiaries, invested assets in its non-U.S. subsidiaries, and access to the debt and equity capital markets. The Company believes it has sufficient liquidity to meet its capital needs. See Note 19 of the notes to the consolidated financial statements in Item 8 of Part II of this report for a discussion of the Company’s dividend capacity. However, the Company’s future capital requirements depend on many factors, including the amount of premium it writes, the amount of loss reserves by lines of business, and catastrophe exposure. To the extent that the Company needs to raise additional funds, any equity or debt financing for this purpose, if available at all, may be on terms that are not favorable to the Company. If the Company cannot obtain adequate capital, its business, results of operations and financial condition could be adversely affected.
On December 29, 2017, Global Indemnity acquired 3,397,031 of its A ordinary shares for approximately $83.0 million in the aggregate (approximately $24.44 per share) from former investors in vehicles managed by Fox Paine & Company, LLC. The Company sold $99.0 million of securities from its consolidated investment portfolio during December, 2017 to provide funding for the redemption and other obligations.
During the fourth quarter of 2017, Global Indemnity announced the adoption of a dividend program. Although subject to the absolute discretion of the Board of Directors and factors, conditions, and prospects as such may exist from time to time when the Board of Directors considers the advisability of declaring a quarterly dividend, the Company currently anticipates an initial dividend rate of $0.25 per share per quarter ($1.00 per share per year). As of December 31, 2017, there are currently 14,206,742 shares issued and outstanding.
82
Table of Contents
On March 23, 2017, the Company issued 7.875% Subordinated Notes due in 2047 in the aggregate principal amount of $130.0 million through an underwritten public offering. See Note 12 of the notes to consolidated financial statements in Item 8 of Part II of this report for additional information on this debt issuance.
Property Catastrophe Quota Share
Effective April 15, 2017, the Company entered into an agreement to cede 50% of its property catastrophe losses for all single occurrences over $3 million up to a loss of $40 million. This treaty has an aggregate limit of $60 million and will expire on June 1, 2018.
As a result of entering into this treaty, the Company did not renew the $20 million in excess of $20 million layer of its property catastrophe treaty on June 1, 2017.
Stop Loss Agreement, Quota Share Arrangements and Intercompany Pooling Arrangement
Global Indemnity’s U.S. insurance companies, excluding Personal Lines, and Global Indemnity Reinsurance participated in a stop loss agreement that provided protection to the U.S. insurance companies, excluding Personal Lines, in a loss corridor from 70% to 90% subject to certain restrictions. This agreement was terminated on a prospective basis on January 1, 2016.
During 2015, the Company’s U.S. insurance companies participated in quota share reinsurance agreements with Global Indemnity Reinsurance whereby 50% of the net retained business of the U.S. insurance companies was ceded to Global Indemnity Reinsurance. Effective January 1, 2016, the cession percentage was lowered to 40% from 50%. These agreements exclude named storms. As a result of the enactment of the TCJA, effective January 1, 2018, premiums being ceded under the quota share arrangement may potentially be subject to a 10% BEAT tax. As a result, Global Indemnity Reinsurance and the Company’s U.S. insurance companies have agreed to terminate the quota share arrangement effective January 1, 2018. Regulatory approval is still pending.
Global Indemnity Reinsurance is an unauthorized reinsurer. As a result, any losses and unearned premiums that are ceded to Global Indemnity Reinsurance by the U.S. insurance companies must be collateralized. To satisfy this requirement, Global Indemnity Reinsurance has set up custodial trust accounts on behalf of the U.S. insurance companies.
Global Indemnity Reinsurance also has established trust accounts to collateralize exposure it has to certain third party ceding companies. The Company invests the funds in securities that have durations that closely match the expected duration of the liabilities assumed. The Company believes that Global Indemnity Reinsurance will have sufficient liquidity to pay claims prospectively.
Global Indemnity’s U.S. insurance companies participate in an intercompany pooling arrangement whereby premiums, losses, and expenses are shared pro rata amongst the U.S. insurance companies.
Capital Resources
As a result of the changes in the worldwide tax environment, several of the intercompany financing structures are expected to be restructured.
On January 18, 2006, U.A.I. (Luxembourg) Investment S.à.r.l. loaned $6.0 million to United America Indemnity, Ltd. The loan was used to pay operating expenses that arise in the normal course of business. The loan is a demand loan and bears interest at 4.38%. Due to the liquidation of United America Indemnity, Ltd. in 2016, this loan was assumed by Global Indemnity Limited. At December 31, 2017, there was $1.0 million outstanding on this loan with accrued interest of $1.9 million. Global Indemnity Limited is dependent on its subsidiaries to pay its dividends and operating expenses.
83
Table of Contents
In February, 2010, the line of credit between Global Indemnity Reinsurance and United America Indemnity, Limited was converted to a non-interest bearing note payable for the full amount of principal and accrued interest to date totaling $53.0 million. In May, 2014, United America Indemnity, Ltd. repaid $20 million of the outstanding balance due under this note. In November, 2016, this note was assumed by Global Indemnity Limited. As of December 31, 2017, there was $33.0 million outstanding on the note payable.
U.A.I. (Luxembourg) Investment S.à.r.l. holds two promissory notes in the amounts of $175.0 million and $110.0 million and three loans in the amount of $125.0 million, $100.0 million, and $120.0 million from Global Indemnity Group, Inc. The $175.0 million and $110.0 million notes bear interest at a rate of 6.64% and 6.20%, respectively, and mature in 2018 and 2020, respectively. The $125.0 million, $100.0 million, and $120.0 million loans bears interest at 5.78%, 8.06%, and 8.15%, respectively, and matures in 2024, 2045, and 2047, respectively. Interest on these agreements is paid annually. At December 31, 2017, accrued interest on these notes and loans was $19.6 million. Other than its investment portfolio, Global Indemnity Group, Inc. has no income producing operations. The ability of Global Indemnity Group, Inc. to generate cash to repay the notes and loan is dependent on dividends that it receives from its subsidiaries or using other assets it holds.
In November, 2011, U.A.I. (Luxembourg) Investment S.à.r.l. issued a $100.0 million demand line of credit to Global Indemnity (Cayman) Ltd. which bears interest at 1.2%. The proceeds of the line were loaned from Global Indemnity (Cayman) Ltd. to Global Indemnity plc, bearing interest at 1.2%, to fund purchases of the Company’s A ordinary shares as part of the $100.0 million share repurchase program announced in September, 2011. In August, 2012, the demand line of credit was increased to $125.0 million to fund additional purchases under the Company’s $25.0 million share repurchase authorization. In September, 2015, U.A.I. (Luxembourg) Investment S.à.r.l. increased the demand line of credit that it previously issued to Global Indemnity (Cayman) Limited from $125.0 million to $225.0 million. In 2016, the amounts owed by Global Indemnity plc were assigned to Global Indemnity Limited. On May 5, 2017, Global Indemnity (Cayman) Limited was merged into Global Indemnity Limited. As a result, the loan between Global Indemnity (Cayman) Limited and Global Indemnity Limited was expunged and Global Indemnity Limited assumed the loan payable to U.A.I. (Luxembourg) Investment S.à.r.l. As of December 31, 2017, Global Indemnity Limited had $181.5 million outstanding on the line of credit with U.A.I. (Luxembourg) Investment S.à.r.l., with accrued interest of $9.1 million.
In November, 2012, American Insurance Service, Inc. (“AIS”) issued a $35.0 million loan to Global Indemnity Reinsurance, bearing interest at the six month London Interbank Offered Rate (“LIBOR”) plus 3.5%. The proceeds of the loan were used to fund trust accounts in the normal course of business. Effective October 31, 2013, American Insurance Service, Inc. (“AIS”) assigned all of its rights, obligations, duties, and liabilities under the note to Global Indemnity Group, Inc. As of December 31, 2017, there was $5.0 million outstanding on the note payable, with accrued interest of $0.2 million payable to AIS and $1.3 million payable to Global Indemnity Group, Inc.
As of December 31, 2017, the Company had available a margin borrowing facility. At December 31, 2017, the borrowing rate for this facility was tied to the Fed Funds Effective rate and was approximately 1.6%. At December 31, 2016, the borrowing rate for this facility was tied to LIBOR and was approximately 1.6%. This facility is due on demand. The borrowings are subject to maintenance margin, which is a minimum account balance that must be maintained. A decline in market conditions could require an additional deposit of collateral. As of December 31, 2017, approximately $88.0 million in securities were deposited as collateral to support borrowings. The amount borrowed against the margin account may fluctuate as routine investment transactions, such as dividends received, investment income received, maturities and pay-downs, impact cash balances. The margin facility contains customary events of default, including, without limitation, insolvency, failure to make required payments, failure to comply with any representations or warranties, failure to adequately assure future performance, and failure of a guarantor to perform under its guarantee. The amount outstanding on the Company’s margin borrowing facility was $72.2 million and $66.6 million as of December 31, 2017 and 2016, respectively.
84
Table of Contents
On May 12, 2014, Global Indemnity Group, Inc. entered into an agreement to loan $200 million to Global Indemnity (Cayman) Limited. In December, 2014, Global Indemnity (Cayman) Limited repaid $125.0 million of the outstanding principal. On May 5, 2017, Global Indemnity (Cayman) Limited was merged into Global Indemnity Limited. In 2017, this note was refinanced at the Applicable Federal Rate of 1.11%. As of December 31, 2017, Global Indemnity Limited owed $75.0 million under this loan agreement with accrued interest of $1.4 million.
The Company entered into two $100 million derivative instruments. Due to fluctuations in interest rates, the Company received $1.5 million and paid $1.0 million in connection with these derivative instruments for the years ended December 31, 2017 and 2016, respectively.
During the first quarter of 2017, Global Indemnity made a capital contribution in the amount of $96.0 million to its subsidiary, Global Indemnity (Gibraltar) Limited. Through a series of additional capital contributions and repayment of certain intercompany balances, U.A.I. (Luxembourg) IV S.à.r.l. was the ultimate recipient of this capital contribution in the amount of $93.5 million.
Contractual Obligations
The Company has commitments in the form of operating leases, commitments to fund limited liability investments, subordinated notes, and unpaid losses and loss expense obligations. As of December 31, 2017, contractual obligations related to Global Indemnity’s commitments, including any principal and interest payments, were as follows:
| Payment Due by Period | ||||||||||||||||||||
| (Dollars in thousands) | Total | Less than 1 year |
1 – 3 years | 3 – 5 years | More than 5 years |
|||||||||||||||
| Operating leases (1) |
$ | 5,466 | $ | 3,147 | $ | 2,319 | $ | — | $ | — | ||||||||||
| Commitments to fund limited liability investments (2) |
57,714 | 57,714 | — | — | — | |||||||||||||||
| Subordinated notes due 2045 (3) |
315,063 | 7,750 | 15,500 | 15,500 | 276,313 | |||||||||||||||
| Subordinated notes due 2047 (4) |
432,006 | 10,238 | 20,475 | 20,475 | 380,818 | |||||||||||||||
| Unpaid losses and loss adjustment expenses obligations (5) |
634,664 | 281,791 | 219,593 | 74,256 | 59,024 | |||||||||||||||
|
|
|
|
|
|
|
|
|
|
|
|||||||||||
| Total |
$ | 1,444,913 | $ | 360,640 | $ | 257,887 | $ | 110,231 | $ | 716,155 | ||||||||||
|
|
|
|
|
|
|
|
|
|
|
|||||||||||
| (1) | The Company leases office space and equipment as part of its normal operations. The amounts shown above represent future commitments under such operating leases. |
| (2) | Represents future funding commitment of the Company’s participation in three separate limited partnership investments. See Note 10 of the notes to the consolidated financial statements in Item 8 of Part II of this report for additional information on these commitments. |
| (3) | Represents the Subordinated Notes due in 2045 in the aggregate principal amount of $100.0 million through an underwritten public offering. The notes bear interest at an annual rate equal to 7.75% payable quarterly. See Note 12 of the notes to the consolidated financial statements in Item 8 of Part II of this report for additional information on the 2045 Subordinated Notes. |
| (4) | Represents the Subordinated Notes due in 2047 in the aggregate principal amount of $130.0 million through an underwritten public offering. The notes bear interest at an annual rate equal to 7.875% payable quarterly. See Note 12 of the notes to the consolidated financial statements in Item 8 of Part II of this report for additional information on the 2047 Subordinated Notes. |
| (5) | These amounts represent the gross future amounts needed to pay losses and related loss adjustment expenses and do not reflect amounts that are expected to be recovered from the Company’s reinsurers. See discussion in “Liability for Unpaid Losses and Loss Adjustment Expenses” for more details. |
85
Table of Contents
Off Balance Sheet Arrangements
The Company has no off balance sheet arrangements.
Inflation
Property and casualty insurance premiums are established before the Company knows the amount of losses and loss adjustment expenses or the extent to which inflation may affect such amounts. The Company attempts to anticipate the potential impact of inflation in establishing its reserves.
Future increases in inflation could result in future increases in interest rates, which in turn are likely to result in a decline in the market value of the investment portfolio and resulting in unrealized losses and reductions in shareholders’ equity.
Cautionary Note Regarding Forward-Looking Statements
Some of the statements under “Business,” “Management’s Discussion and Analysis of Financial Condition and Results of Operations” and elsewhere in this report may include forward-looking statements within the meaning of Section 21E of the Security Exchange Act of 1934, as amended, that reflect the Company’s current views with respect to future events and financial performance. Forward-looking statements are statements that are not historical facts. These statements can be identified by the use of forward-looking terminology such as “believe,” “expect,” “may,” “will,” “should,” “project,” “plan,” “seek,” “intend,” or “anticipate” or the negative thereof or comparable terminology, and include discussions of strategy, financial projections and estimates and their underlying assumptions, statements regarding plans, objectives, expectations or consequences of identified transactions or natural disasters, and statements about the future performance, operations, products and services of the companies.
The Company’s business and operations are and will be subject to a variety of risks, uncertainties and other factors. Consequently, actual results and experience may materially differ from those contained in any forward-looking statements. See “Risk Factors” in Item 1A of Part I of this report for risks, uncertainties and other factors that could cause actual results and experience to differ from those projected.
The forward-looking statements contained in this report are primarily based on the Company’s current expectations and projections about future events and trends that it believes may affect the Company’s business, financial condition, results of operations, prospects, business strategy and financial needs. The outcome of the events described in these forward-looking statements is subject to risks, uncertainties, assumptions and other factors described in the section captioned “Risk Factors” and elsewhere in this report. These risks are not exhaustive. Other sections of this report include additional factors that could adversely impact the Company’s business and financial performance. Moreover, the Company operates in a very competitive environment. New risks and uncertainties emerge from time to time and it is not possible for the Company to predict all risks and uncertainties that could have an impact on the forward-looking statements contained in this report. The Company cannot provide assurance that the results, events and circumstances reflected in the forward-looking statements will be achieved or occur, and actual results, events or circumstances could differ materially from those described in the forward-looking statements.
In addition, statements that “the Company believes” and similar statements reflect the Company’s beliefs and opinions on the relevant subject. These statements are based upon information available to the Company as of the date of this report, and while the Company believes such information forms a reasonable basis for such statements, such information may be limited or incomplete, and these statements should not be read to indicate that the Company have conducted an exhaustive inquiry into, or review of, all potentially available relevant information. These statements are inherently uncertain and investors are cautioned not to unduly rely upon these statements.
86
Table of Contents
This report and the documents that are referenced in this report and have filed as exhibits to this report should be read with the understanding that actual future results, levels of activity, performance and achievements may be materially different from what the Company expects. The Company qualifies all of its forward-looking statements by these cautionary statements.
The Company’s forward-looking statements speak only as of the date of this report or as of the date they were made. The Company undertake no obligation to publicly update or review any forward-looking statement, whether as a result of new information, future developments or otherwise.
| Item 7A. | QUANTITATIVE AND QUALITATIVE DISCLOSURES ABOUT MARKET RISK |
Market Risk
Market risk is the risk of economic losses due to adverse changes in the estimated fair value of a financial instrument as the result of changes in interest rates, equity prices, credit risk, illiquidity, foreign exchange rates and commodity prices. The Company’s consolidated balance sheet includes the estimated fair values of assets that are subject to market risk. The Company’s primary market risks are interest rate risk and credit risks associated with investments in fixed maturities, equity price risk associated with investments in equity securities, and foreign exchange risk associated with premium received that is denominated in foreign currencies. Each of these risks is discussed in more detail below. The Company has no commodity risk.
Interest Rate Risk
The Company’s primary market risk exposure is to changes in interest rates. The Company’s fixed income investments are exposed to interest rate risk. Fluctuations in interest rates have a direct impact on the market valuation of these securities. As interest rates rise, the market value of the Company’s fixed income investments fall, and the converse is also true. The Company seeks to manage interest rate risk through an active portfolio management strategy that involves the selection, by the Company’s managers, of investments with appropriate characteristics, such as duration, yield, currency, and liquidity that are tailored to the anticipated cash outflow characteristics of the Company’s liabilities. The Company’s strategy for managing interest rate risk also includes maintaining a high quality bond portfolio with a relatively short duration to reduce the effect of interest rate changes on book value. A significant portion of the Company’s investment portfolio matures each year, allowing for reinvestment at current market rates.
As of December 31, 2017, assuming identical shifts in interest rates for securities of all maturities, the table below illustrates the sensitivity of market value in Global Indemnity’s bonds to selected hypothetical changes in basis point increases and decreases:
| (Dollars in thousands) | Change in Market Value | |||||||||||
| Basis Point Change |
Market Value | $ | % | |||||||||
| (200) |
$ | 1,317,538 | $ | 76,101 | 6.1 | % | ||||||
| (100) |
1,279,357 | 37,920 | 3.1 | % | ||||||||
| No change |
1,241,437 | — | 0 | % | ||||||||
| 100 |
1,204,561 | (36,876 | ) | (3.0 | %) | |||||||
| 200 |
1,168,582 | (72,855 | ) | (5.9 | %) | |||||||
The Company’s interest rate swaps are also exposed to interest rate risk. Fluctuations in interest rates have a direct impact on the market valuation of these financial instruments. As interest rates decline, the market value of the Company’s interest rate swaps fall, and the converse is also true. Since the Company has designated the
87
Table of Contents
interest rate swaps as non-hedge instruments, the changes in the fair value is recognized as net realized investment gains / losses in the consolidated statements of operations. Therefore, changes in interest rates will have a direct impact to the Company’s results of operations. In addition, on a daily basis, a margin requirement is calculated. If interest rates decline, the Company is required to pay a margin call equal to the change in the fair market value of the interest rate swap. When interest rates rise, the counterparty is required to pay to the Company a margin call equal to the change in fair market value of the interest rate swap.
As of December 31, 2017, the table below illustrates the sensitivity of market value of the Company’s interest rate swaps as well as the impact on the consolidated statements of operation to selected hypothetical changes in basis point increases and decreases:
| (Dollars in thousands) | ||||||||
| Basis Point Change |
Market Value | Change in Market Value and Impact to Consolidated Statements of Operations |
||||||
| (200) |
$ | (32,108 | ) | $ | (24,140 | ) | ||
| (100) |
(19,645 | ) | (11,677 | ) | ||||
| No change |
(7,968 | ) | — | |||||
| 100 |
2,973 | 10,941 | ||||||
| 200 |
13,225 | 21,193 | ||||||
Credit Risk
The Company’s investment policy requires that its investments in debt instruments are of high credit quality issuers and limit the amount of credit exposure to any one issuer based upon the rating of the security.
As of December 31, 2017, the Company had approximately $29.6 million worth of investment exposure to subprime and Alt-A investments. As of December 31, 2017, approximately $29.2 million of those investments have been rated BBB+ to AAA by Standard & Poor’s and $0.4 million were rated below investment grade. As of December 31, 2016, the Company had approximately $25.7 million worth of investment exposure to subprime and Alt-A investments. As of December 31, 2016, approximately $25.2 million of those investments have been rated BBB+ to AAA by Standard & Poor’s and $0.5 million were rated below investment grade. There were no impairments recognized on these investments during the years ended December 31, 2017 or 2016.
In addition, the Company has credit risk exposure to its general agencies and reinsurers. The Company seeks to mitigate and control its risks to producers by typically requiring its general agencies to render payments within no more than 45 days after the month in which a policy is effective and including provisions within the Company’s general agency contracts that allow it to terminate a general agency’s authority in the event of non-payment.
With respect to its credit exposure to reinsurers, the Company seeks to mitigate and control its risk by ceding business to only those reinsurers having adequate financial strength and sufficient capital to fund their obligation. In addition, the Company seeks to mitigate credit risk to reinsurers through the use of trusts and letters of credit for collateral.
Equity Price Risk
In 2017, the strategy for the Company’s equity portfolio followed a large cap value approach. This investment style placed primary emphasis on selecting the best relative values from those issues having a projected normalized price-earnings ratio at a discount to the market multiple.
88
Table of Contents
The Company compares the results of the Company’s equity portfolio to a customized benchmark which is the S&P 500 Value excluding financials. To protect against equity price risk, the sector exposures within the Company’s equity portfolio closely correlate to the sector exposures within the custom benchmark index. In 2017, the Company’s common stock portfolio returned a total return of 15.0%, not including investment advisor fees, compared to the benchmark gain of 13.3%.
The carrying values of investments subject to equity price risk are based on quoted market prices as of the balance sheet dates. Market prices are subject to fluctuation and thus the amount realized in the subsequent sale of an investment may differ from the reported market value. Fluctuation in the market price of an equity security results from perceived changes in the underlying economic makeup of a stock, the price of alternative investments and overall market conditions.
The Company attempts to mitigate its unsystemic risk, which is the risk that is associated with holding a particular security, by holding a large number of securities in that market. At year end, no security represented more than 5.2% of the market value of the equity portfolio. The Company continues to have systemic risk, which is the risk inherent in the general market due to broad macroeconomic factors that affect all companies in the market.
As of December 31, 2017, the table below summarizes the Company’s equity price risk and reflects the effect of a hypothetical 10% and 20% increase or decrease in market prices. The selected hypothetical changes do not indicate what could be the potential best or worst scenarios.
| (Dollars in thousands) | ||||||||
| Hypothetical Price Change |
Estimated Fair Value after Hypothetical Change in Prices |
Hypothetical Percentage Increase (Decrease) in Shareholders’ Equity (1) |
||||||
| (20%) |
$ | 112,183 | (2.5 | %) | ||||
| (10%) |
126,206 | (1.3 | %) | |||||
| No change |
140,229 | — | ||||||
| 10% |
154,252 | 1.3 | % | |||||
| 20% |
168,274 | 2.5 | % | |||||
| (1) | Net of 35% tax |
Foreign Currency Exchange Risk
The Company has foreign currency exchange risk associated with a portion of the business written at Global Indemnity Reinsurance, as well as a small portion of expenses related to corporate overhead in its Ireland and Luxembourg offices. The Company also maintains investments in foreign denominated securities and cash accounts in foreign currencies in order to pay expenses in foreign countries. At period-end, the Company re-measures those non-U.S. currency financial assets to their current U.S. dollar equivalent. Financial liabilities, if any, are generally adjusted within the reserving process. However, for known losses on claims to be paid in foreign currencies, the Company re-measures the liabilities to their current U.S. dollar equivalent each period end.
89
Table of Contents
| Item 8. | FINANCIAL STATEMENTS AND SUPPLEMENTARY DATA |
GLOBAL INDEMNITY LIMITED
| 91 | ||||
| 92 | ||||
| 93 | ||||
| 94 | ||||
| 95 | ||||
| 96 | ||||
| 97 |
Index to Financial Statement Schedules
| Schedule I |
Summary of Investments — Other Than Investments in Related Parties |
S-1 | ||||
| Schedule II |
S-2 | |||||
| Schedule III |
S-7 | |||||
| Schedule IV |
S-8 | |||||
| Schedule V |
S-9 | |||||
| Schedule VI |
Supplementary Information for Property Casualty Underwriters |
S-10 |
90
Table of Contents
Report of Independent Registered Public Accounting Firm
To the Shareholders and the Board of Directors of Global Indemnity Limited
Opinion on the Financial Statements
We have audited the accompanying consolidated balance sheets of Global Indemnity Limited (the Company) as of December 31, 2017 and 2016, the related consolidated statements of operations, comprehensive income, shareholders’ equity and cash flows for each of the three years in the period ended December 31, 2017, and the related notes and the financial statement schedules listed in the Index at Item 15 (collectively referred to as the “financial statements”). In our opinion, the financial statements present fairly, in all material respects, the financial position of the Company at December 31, 2017 and 2016, and the results of its operations and its cash flows for each of the three years in the period ended December 31, 2017, in conformity with U.S. generally accepted accounting principles.
We also have audited, in accordance with the standards of the Public Company Accounting Oversight Board (United States) (PCAOB), the Company’s internal control over financial reporting as of December 31, 2017, based on criteria established in Internal Control-Integrated Framework issued by the Committee of Sponsoring Organizations of the Treadway Commission (2013 framework), and our report dated March 9, 2018, expressed an unqualified opinion thereon.
Basis for Opinion
These financial statements are the responsibility of the Company’s management. Our responsibility is to express an opinion on the Company’s financial statements based on our audits. We are a public accounting firm registered with the PCAOB and are required to be independent with respect to the Company in accordance with the U.S. federal securities laws and the applicable rules and regulations of the Securities and Exchange Commission and the PCAOB.
We conducted our audits in accordance with the standards of the PCAOB. Those standards require that we plan and perform the audit to obtain reasonable assurance about whether the financial statements are free of material misstatement, whether due to error or fraud. Our audits included performing procedures to assess the risks of material misstatement of the financial statements, whether due to error or fraud, and performing procedures that respond to those risks. Such procedures included examining, on a test basis, evidence regarding the amounts and disclosures in the financial statements. Our audits also included evaluating the accounting principles used and significant estimates made by management, as well as evaluating the overall presentation of the financial statements. We believe that our audits provide a reasonable basis for our opinion.
/s/ Ernst & Young LLP
We have served as the Company’s auditor since 2015.
Philadelphia, PA
March 9, 2018
91
Table of Contents
GLOBAL INDEMNITY LIMITED
(In thousands, except share amounts)
| December 31, 2017 |
December 31, 2016 |
|||||||
| ASSETS |
||||||||
| Fixed maturities: |
||||||||
| Available for sale, at fair value (amortized cost: $1,243,144 and $1,241,339) |
$ | 1,241,437 | $ | 1,240,031 | ||||
| Equity securities: |
||||||||
| Available for sale, at fair value (cost: $124,915 and $119,515) |
140,229 | 120,557 | ||||||
| Other invested assets |
77,820 | 66,121 | ||||||
|
|
|
|
|
|||||
| Total investments |
1,459,486 | 1,426,709 | ||||||
| Cash and cash equivalents |
74,414 | 75,110 | ||||||
| Premiums receivable, net |
84,386 | 92,094 | ||||||
| Reinsurance receivables, net |
105,060 | 143,774 | ||||||
| Funds held by ceding insurers |
45,300 | 13,114 | ||||||
| Federal income taxes receivable |
10,332 | — | ||||||
| Deferred federal income taxes |
26,196 | 40,957 | ||||||
| Deferred acquisition costs |
61,647 | 57,901 | ||||||
| Intangible assets |
22,549 | 23,079 | ||||||
| Goodwill |
6,521 | 6,521 | ||||||
| Prepaid reinsurance premiums |
28,851 | 42,583 | ||||||
| Receivable for securities sold |
1,543 | — | ||||||
| Other assets |
75,384 | 51,104 | ||||||
|
|
|
|
|
|||||
| Total assets |
$ | 2,001,669 | $ | 1,972,946 | ||||
|
|
|
|
|
|||||
| LIABILITIES AND SHAREHOLDERS’ EQUITY |
||||||||
| Liabilities: |
||||||||
| Unpaid losses and loss adjustment expenses |
$ | 634,664 | $ | 651,042 | ||||
| Unearned premiums |
285,397 | 286,984 | ||||||
| Federal income taxes payable |
— | 219 | ||||||
| Ceded balances payable |
10,851 | 14,675 | ||||||
| Payable for securities purchased |
— | 3,717 | ||||||
| Contingent commissions |
7,984 | 9,454 | ||||||
| Debt |
294,713 | 163,143 | ||||||
| Other liabilities |
49,666 | 45,761 | ||||||
|
|
|
|
|
|||||
| Total liabilities |
1,283,275 | $ | 1,174,995 | |||||
|
|
|
|
|
|||||
| Commitments and contingencies (Note 15) |
— | — | ||||||
| Shareholders’ equity: |
||||||||
| Ordinary shares, $0.0001 par value, 900,000,000 ordinary shares authorized; A ordinary shares issued: 10,102,927 and 13,436,548, respectively; A ordinary shares outstanding: 10,073,376 and 13,436,548, respectively; B ordinary shares issued and outstanding: 4,133,366 and 4,133,366, respectively |
2 | 2 | ||||||
| Additional paid-in capital |
434,730 | 430,283 | ||||||
| Accumulated other comprehensive income, net of taxes |
8,983 | (618 | ) | |||||
| Retained earnings |
275,838 | 368,284 | ||||||
| A ordinary shares in treasury, at cost: 29,551 and 0 shares, respectively |
(1,159 | ) | — | |||||
|
|
|
|
|
|||||
| Total shareholders’ equity |
718,394 | 797,951 | ||||||
|
|
|
|
|
|||||
| Total liabilities and shareholders’ equity |
$ | 2,001,669 | $ | 1,972,946 | ||||
|
|
|
|
|
|||||
See accompanying notes to consolidated financial statements.
92
Table of Contents
GLOBAL INDEMNITY LIMITED
Consolidated Statements of Operations
(In thousands, except shares and per share data)
| Years Ended December 31, | ||||||||||||
| 2017 | 2016 | 2015 | ||||||||||
| Revenues: |
||||||||||||
| Gross premiums written |
$ | 516,334 | $ | 565,845 | $ | 590,233 | ||||||
|
|
|
|
|
|
|
|||||||
| Net premiums written |
$ | 450,180 | $ | 470,940 | $ | 501,244 | ||||||
|
|
|
|
|
|
|
|||||||
| Net premiums earned |
$ | 438,034 | $ | 468,465 | $ | 504,143 | ||||||
| Net investment income |
39,323 | 33,983 | 34,609 | |||||||||
| Net realized investment gains (losses): |
||||||||||||
| Other than temporary impairment losses on investments |
(2,606 | ) | (6,733 | ) | (7,335 | ) | ||||||
| Other net realized investment gains |
4,182 | 28,454 | 3,961 | |||||||||
|
|
|
|
|
|
|
|||||||
| Total net realized investment gains (losses) |
1,576 | 21,721 | (3,374 | ) | ||||||||
| Other income |
6,582 | 10,345 | 3,400 | |||||||||
|
|
|
|
|
|
|
|||||||
| Total revenues |
485,515 | 534,514 | 538,778 | |||||||||
| Losses and Expenses: |
||||||||||||
| Net losses and loss adjustment expenses |
269,212 | 264,003 | 275,368 | |||||||||
| Acquisition costs and other underwriting expenses |
183,733 | 196,650 | 201,303 | |||||||||
| Corporate and other operating expenses |
25,714 | 17,338 | 24,448 | |||||||||
| Interest expense |
16,906 | 8,905 | 4,913 | |||||||||
|
|
|
|
|
|
|
|||||||
| Income (loss) before income taxes |
(10,050 | ) | 47,618 | 32,746 | ||||||||
| Income tax benefit |
(499 | ) | (2,250 | ) | (8,723 | ) | ||||||
|
|
|
|
|
|
|
|||||||
| Net income (loss) |
$ | (9,551 | ) | $ | 49,868 | $ | 41,469 | |||||
|
|
|
|
|
|
|
|||||||
| Per share data: |
||||||||||||
| Net income (loss) (1) |
||||||||||||
| Basic |
$ | (0.55 | ) | $ | 2.89 | $ | 1.71 | |||||
|
|
|
|
|
|
|
|||||||
| Diluted |
$ | (0.55 | ) | $ | 2.84 | $ | 1.69 | |||||
|
|
|
|
|
|
|
|||||||
| Weighted-average number of shares outstanding |
||||||||||||
| Basic |
17,308,663 | 17,246,717 | 24,253,657 | |||||||||
|
|
|
|
|
|
|
|||||||
| Diluted |
17,308,663 | 17,547,061 | 24,505,851 | |||||||||
|
|
|
|
|
|
|
|||||||
| (1) | For the year ended December 31, 2017, “diluted” loss per share is the same as “basic” loss per share since there was a net loss for the period. |
See accompanying notes to consolidated financial statements.
93
Table of Contents
GLOBAL INDEMNITY LIMITED
Consolidated Statements of Comprehensive Income
(In thousands)
| Years Ended December 31, | ||||||||||||
| 2017 | 2016 | 2015 | ||||||||||
| Net income (loss) |
$ | (9,551 | ) | $ | 49,868 | $ | 41,469 | |||||
|
|
|
|
|
|
|
|||||||
| Other comprehensive income (loss), net of tax: |
||||||||||||
| Unrealized holding gains (losses) |
9,677 | 10,058 | (17,457 | ) | ||||||||
| Portion of other than temporary impairment losses recognized in other comprehensive income (loss) |
(3 | ) | (3 | ) | (4 | ) | ||||||
| Reclassification adjustment for gains included in net income |
(848 | ) | (14,809 | ) | (1,985 | ) | ||||||
| Unrealized foreign currency translation gains |
775 | 58 | 140 | |||||||||
|
|
|
|
|
|
|
|||||||
| Other comprehensive income (loss), net of tax |
9,601 | (4,696 | ) | (19,306 | ) | |||||||
|
|
|
|
|
|
|
|||||||
| Comprehensive income, net of tax |
$ | 50 | $ | 45,172 | $ | 22,163 | ||||||
|
|
|
|
|
|
|
|||||||
See accompanying notes to consolidated financial statements.
94
Table of Contents
GLOBAL INDEMNITY LIMITED
Consolidated Statements of Changes in Shareholders’ Equity
(In thousands, except share amounts)
| Years Ended December 31, | ||||||||||||
| 2017 | 2016 | 2015 | ||||||||||
| Number of A ordinary shares issued: |
||||||||||||
| Number at beginning of period |
13,436,548 | 16,424,546 | 16,331,577 | |||||||||
| Ordinary shares issued under share incentive plans |
2,204 | 115,711 | 121,812 | |||||||||
| Ordinary shares issued to directors |
27,121 | 35,185 | 36,321 | |||||||||
| B ordinary shares converted to A ordinary shares |
— | — | 7,928,004 | |||||||||
| Ordinary shares redeemed |
(3,397,031 | ) | — | (8,260,870 | ) | |||||||
| Adjustment for shares redeemed indirectly owned by subsidiary |
34,085 | |||||||||||
| Ordinary shares issued in connection with American Reliable acquisition |
— | — | 267,702 | |||||||||
| Reduction in treasury shares due to redomestication |
— | (3,138,894 | ) | — | ||||||||
|
|
|
|
|
|
|
|||||||
| Number at end of period |
10,102,927 | 13,436,548 | 16,424,546 | |||||||||
|
|
|
|
|
|
|
|||||||
| Number of B ordinary shares issued: |
||||||||||||
| Number at beginning and end of period |
4,133,366 | 4,133,366 | 12,061,370 | |||||||||
| B Ordinary shares converted to A ordinary shares |
— | — | (7,928,004 | ) | ||||||||
|
|
|
|
|
|
|
|||||||
| Number at end of period |
4,133,366 | 4,133,366 | 4,133,366 | |||||||||
|
|
|
|
|
|
|
|||||||
| Par value of A ordinary shares: |
||||||||||||
| Balance at beginning of period |
$ | 1 | $ | 2 | $ | 2 | ||||||
| Reduction in treasury shares due to redomestication |
— | (1 | ) | — | ||||||||
|
|
|
|
|
|
|
|||||||
| Balance at end of period |
$ | 1 | $ | 1 | $ | 2 | ||||||
|
|
|
|
|
|
|
|||||||
| Par value of B ordinary shares: |
||||||||||||
| Balance at beginning and end of period |
$ | 1 | $ | 1 | $ | 1 | ||||||
|
|
|
|
|
|
|
|||||||
| Additional paid-in capital: |
||||||||||||
| Balance at beginning of period |
$ | 430,283 | $ | 529,872 | $ | 519,590 | ||||||
| Reduction in treasury shares due to redomestication |
— | (103,248 | ) | — | ||||||||
| Adjustment for shares redeemed indirectly owned by subsidiary |
706 | |||||||||||
| Share compensation plans |
3,741 | 3,532 | 10,272 | |||||||||
| Tax benefit on share-based compensation expense |
— | 127 | 10 | |||||||||
|
|
|
|
|
|
|
|||||||
| Balance at end of period |
$ | 434,730 | $ | 430,283 | $ | 529,872 | ||||||
|
|
|
|
|
|
|
|||||||
| Accumulated other comprehensive income, net of deferred income tax: |
||||||||||||
| Balance at beginning of period |
$ | (618 | ) | $ | 4,078 | $ | 23,384 | |||||
| Other comprehensive income (loss): |
||||||||||||
| Change in unrealized holding gains (losses) |
8,829 | (4,751 | ) | (19,436 | ) | |||||||
| Change in other than temporary impairment losses recognized in other comprehensive income (loss) |
(3 | ) | (3 | ) | (10 | ) | ||||||
| Unrealized foreign currency translation gains |
775 | 58 | 140 | |||||||||
|
|
|
|
|
|
|
|||||||
| Other comprehensive income (loss) |
9,601 | (4,696 | ) | (19,306 | ) | |||||||
|
|
|
|
|
|
|
|||||||
| Balance at end of period |
$ | 8,983 | $ | (618 | ) | $ | 4,078 | |||||
|
|
|
|
|
|
|
|||||||
| Retained earnings: |
||||||||||||
| Balance at beginning of period |
$ | 368,284 | $ | 318,416 | $ | 466,717 | ||||||
| Ordinary shares redeemed |
(83,015 | ) | — | (189,770 | ) | |||||||
| Adjustment for gain on shares redeemed indirectly owned by subsidiary |
120 | |||||||||||
| Net income (loss) |
(9,551 | ) | 49,868 | 41,469 | ||||||||
|
|
|
|
|
|
|
|||||||
| Balance at end of period |
$ | 275,838 | $ | 368,284 | $ | 318,416 | ||||||
|
|
|
|
|
|
|
|||||||
| Number of treasury shares: |
||||||||||||
| Number at beginning of period |
— | 3,110,795 | 3,064,815 | |||||||||
| A ordinary shares purchased |
29,551 | 28,099 | 11,895 | |||||||||
| Elimination of shares indirectly owned by subsidiary |
— | — | 34,085 | |||||||||
| Reduction in treasury shares due to redomestication |
— | (3,138,894 | ) | — | ||||||||
|
|
|
|
|
|
|
|||||||
| Number at end of period |
29,551 | — | 3,110,795 | |||||||||
|
|
|
|
|
|
|
|||||||
| Treasury shares, at cost: |
||||||||||||
| Balance at beginning of period |
$ | — | $ | (102,443 | ) | $ | (101,404 | ) | ||||
| A ordinary shares purchased, at cost |
(1,159 | ) | (805 | ) | (333 | ) | ||||||
| Elimination of shares indirectly owned by subsidiary |
— | — | (706 | ) | ||||||||
| Reduction in treasury shares due to redomestication |
— | 103,248 | — | |||||||||
|
|
|
|
|
|
|
|||||||
| Balance at end of period |
$ | (1,159 | ) | $ | — | $ | (102,443 | ) | ||||
|
|
|
|
|
|
|
|||||||
| Total shareholders’ equity |
$ | 718,394 | $ | 797,951 | $ | 749,926 | ||||||
|
|
|
|
|
|
|
|||||||
See accompanying notes to consolidated financial statements.
95
Table of Contents
GLOBAL INDEMNITY LIMITED
Consolidated Statements of Cash Flows
(In thousands)
| Years Ended December 31, | ||||||||||||
| 2017 | 2016 | 2015 | ||||||||||
| Cash flows from operating activities: |
||||||||||||
| Net income (loss) |
$ | (9,551 | ) | $ | 49,868 | $ | 41,469 | |||||
| Adjustments to reconcile net income (loss) to net cash provided by (used for) operating activities: |
||||||||||||
| Amortization of the value of business acquired |
— | — | 25,500 | |||||||||
| Amortization and depreciation |
6,505 | 6,312 | 5,284 | |||||||||
| Amortization of debt issuance costs |
232 | 123 | 47 | |||||||||
| Restricted stock and stock option expense |
3,741 | 3,531 | 10,271 | |||||||||
| Deferred federal income taxes |
(1,018 | ) | (2,727 | ) | (7,201 | ) | ||||||
| Amortization of bond premium and discount, net |
7,899 | 9,828 | 13,643 | |||||||||
| Net realized investment (gains) losses |
(1,576 | ) | (21,721 | ) | 3,374 | |||||||
| Equity in the earnings of equity method limited liability investments |
(4,741 | ) | (5,190 | ) | (2,533 | ) | ||||||
| Gain on the disposition of subsidiary |
— | (6,857 | ) | — | ||||||||
| Changes in: |
||||||||||||
| Premiums receivable, net |
7,708 | (2,849 | ) | 25,325 | ||||||||
| Reinsurance receivables, net |
38,714 | (28,180 | ) | 23,966 | ||||||||
| Funds held by ceding insurers |
(31,635 | ) | 2,923 | 9,147 | ||||||||
| Unpaid losses and loss adjustment expenses |
(16,378 | ) | (29,005 | ) | (84,914 | ) | ||||||
| Unearned premiums |
(1,587 | ) | 699 | (6,764 | ) | |||||||
| Ceded balances payable |
(3,824 | ) | 10,086 | (11,430 | ) | |||||||
| Other assets and liabilities, net |
(27,061 | ) | (15,065 | ) | (6,070 | ) | ||||||
| Contingent commissions |
(1,470 | ) | (1,615 | ) | (6,264 | ) | ||||||
| Federal income tax receivable/payable |
406 | 5,047 | (1,689 | ) | ||||||||
| Deferred acquisition costs, net |
(3,746 | ) | (1,384 | ) | (31,279 | ) | ||||||
| Prepaid reinsurance premiums |
13,732 | 1,780 | 3,868 | |||||||||
|
|
|
|
|
|
|
|||||||
| Net cash provided by (used for) operating activities |
(23,650 | ) | (24,396 | ) | 3,750 | |||||||
|
|
|
|
|
|
|
|||||||
| Cash flows from investing activities: |
||||||||||||
| Cash release from escrow for business acquisition |
— | — | 113,696 | |||||||||
| Acquisition of business, net of cash acquired |
— | — | (92,336 | ) | ||||||||
| Proceeds from sale of fixed maturities |
918,439 | 381,389 | 647,404 | |||||||||
| Proceeds from sale of equity securities |
32,218 | 111,156 | 39,723 | |||||||||
| Proceeds from sale of preferred stock |
— | — | 1,540 | |||||||||
| Proceeds from maturity of fixed maturities |
145,475 | 86,009 | 157,845 | |||||||||
| Proceeds from limited partnership distribution |
17,040 | 9,450 | 5,959 | |||||||||
| Proceeds from disposition of subsidiary, net of cash and cash equivalents disposed of $1,269 |
— | 16,922 | — | |||||||||
| Amount received (paid) in connection with derivatives |
1,464 | (1,010 | ) | (6,604 | ) | |||||||
| Purchases of fixed maturities |
(1,078,199 | ) | (437,690 | ) | (627,983 | ) | ||||||
| Purchases of equity securities |
(36,647 | ) | (109,940 | ) | (38,451 | ) | ||||||
| Purchases of other invested assets |
(24,000 | ) | (14,125 | ) | (3,550 | ) | ||||||
|
|
|
|
|
|
|
|||||||
| Net cash provided by (used for) investing activities |
(24,210 | ) | 42,161 | 197,243 | ||||||||
|
|
|
|
|
|
|
|||||||
| Cash flows from financing activities: |
||||||||||||
| Net borrowings (repayments) under margin borrowing facility |
5,584 | (9,000 | ) | (99,027 | ) | |||||||
| Redemption of ordinary shares |
(83,015 | ) | — | (189,770 | ) | |||||||
| Proceeds from issuance of subordinated notes |
130,000 | — | 100,000 | |||||||||
| Debt issuance cost |
(4,246 | ) | (14 | ) | (3,659 | ) | ||||||
| Purchases of A ordinary shares |
(1,159 | ) | (805 | ) | (333 | ) | ||||||
| Tax benefit on share-based compensation expense |
— | 127 | 10 | |||||||||
|
|
|
|
|
|
|
|||||||
| Net cash provided by (used for) financing activities |
47,164 | (9,692 | ) | (192,779 | ) | |||||||
|
|
|
|
|
|
|
|||||||
| Net change in cash and cash equivalents |
(696 | ) | 8,073 | 8,214 | ||||||||
| Cash and cash equivalents at beginning of period |
75,110 | 67,037 | 58,823 | |||||||||
|
|
|
|
|
|
|
|||||||
| Cash and cash equivalents at end of period |
$ | 74,414 | $ | 75,110 | $ | 67,037 | ||||||
|
|
|
|
|
|
|
|||||||
See accompanying notes to consolidated financial statements.
96
Table of Contents
1. Principles of Consolidation and Basis of Presentation
Global Indemnity Limited (“Global Indemnity” or “the Company”), incorporated on February 9, 2016, is domiciled in the Cayman Islands. On November 7, 2016, Global Indemnity replaced Global Indemnity plc as the ultimate parent company as a result of a redomestication transaction. The Company’s A ordinary shares are publicly traded on the NASDAQ Global Select Market under the ticker symbol GBLI. See Note 2 below for details regarding the redomestication. In connection with the redomestication, Global Indemnity plc was converted to a private unlimited company and was placed into liquidation. The liquidation was finalized in 2017.
The Company manages its business through three business segments: Commercial Lines, Personal Lines, and Reinsurance Operations. The Company’s Commercial Lines offers specialty property and casualty insurance products in the excess and surplus lines marketplace. The Company manages its Commercial Lines by differentiating them into four product classifications: Penn-America, which markets property and general liability products to small commercial businesses through a select network of wholesale general agents with specific binding authority; United National, which markets insurance products for targeted insured segments, including specialty products, such as property, general liability, and professional lines through program administrators with specific binding authority; Diamond State, which markets property, casualty, and professional lines products, which are developed by the Company’s underwriting department by individuals with expertise in those lines of business, through wholesale brokers and also markets through program administrators having specific binding authority; and Vacant Express, which primarily insures dwellings which are currently vacant, undergoing renovation, or are under construction and is distributed through aggregators, brokers, and retail agents. These product classifications comprise the Company’s Commercial Lines business segment and are not considered individual business segments because each product has similar economic characteristics, distribution, and coverage. The Company’s Personal Lines segment offers specialty personal lines and agricultural coverage through general and specialty agents with specific binding authority on an admitted basis. Collectively, the Company’s U.S. insurance subsidiaries are licensed in all 50 states, the District of Columbia, Puerto Rico, and the U.S. Virgin Islands. The Company’s Reinsurance Operations consist solely of the operations of its Bermuda-based wholly-owned subsidiary, Global Indemnity Reinsurance. Global Indemnity Reinsurance is a treaty reinsurer of specialty property and casualty insurance and reinsurance companies. The Company’s Reinsurance Operations segment provides reinsurance solutions through brokers and primary writers including insurance and reinsurance companies.
During the 1st quarter of 2017, the Company re-evaluated its Commercial Lines and Personal Lines segments and determined that certain portions of business will be managed, operated and reported by including them in the other segment. As a result, the composition of the Company’s reportable segments changed slightly. Premium that is written through a wholly owned agency that mainly sells to individuals, which was previously included as part of the Commercial Lines segment, is now included within the Personal Lines segment. In addition, one of the small commercial programs written by American Reliable Insurance Company (“American Reliable”), which was previously included within the Personal Lines segment, is now aggregated within the Commercial Lines segment. Accordingly, the segment results for 2016 and 2015 have been revised to reflect these changes. See Note 20 for additional information regarding segments.
The consolidated financial statements have been prepared in conformity with United States of America generally accepted accounting principles (“GAAP”), which differs in certain respects from those principles followed in reports to insurance regulatory authorities. The preparation of consolidated financial statements in conformity with GAAP requires management to make estimates and assumptions that affect the reported amounts of assets and liabilities and disclosure of contingent assets and liabilities at the date of the consolidated financial statements and the reported amounts of revenues and expenses during the reporting period. Actual results could differ from those estimates.
The consolidated financial statements include the accounts of Global Indemnity and its wholly owned subsidiaries. All intercompany balances and transactions have been eliminated in consolidation.
97
Table of Contents
2. Redomestication
On June 20, 2016, the Company’s Board of Directors unanimously approved a plan for the Company to redomicile from Ireland to the Cayman Islands. On September 14, 2016, the Company held a special meeting of the holders of its A ordinary shares and B ordinary shares and an extraordinary general meeting of its shareholders. All resolutions required to effectuate the redomestication were approved by the requisite shareholder vote. On October 21, 2016, the High Court of Ireland sanctioned Global Indemnity plc’s scheme of arrangement related to the redomestication from Ireland to Cayman Islands. The redomestication transaction was completed on November 7, 2016 and as a result, Global Indemnity Limited, a Cayman Islands exempted company, replaced Global Indemnity plc as the ultimate holding company of the Global Indemnity group of companies.
In connection with the redomestication to the Cayman Islands, each A ordinary share of Global Indemnity plc was cancelled and replaced with one A ordinary share of Global Indemnity Limited and each B ordinary share of Global Indemnity plc was cancelled and replaced with one B ordinary share of Global Indemnity Limited. The Global Indemnity Limited A ordinary shares trade on the NASDAQ Global Select Market (“NASDAQ”) under the ticker symbol GBLI, the same symbol under which Global Indemnity plc’s A ordinary shares were previously listed.
3. Summary of Significant Accounting Policies
Investments
The Company’s investments in fixed maturities and equity securities are classified as available for sale and are carried at their fair value. Fair value is defined as the price that would be received to sell an asset or paid to transfer a liability in an orderly transaction between market participants at the measurement date. The fair values of the Company’s available for sale portfolio, excluding interests in limited liability companies and limited partnerships, are determined on the basis of quoted market prices where available. If quoted market prices are not available, the Company uses third party pricing services to assist in determining fair value. In many instances, these services examine the pricing of similar instruments to estimate fair value. The Company purchases bonds with the expectation of holding them to their maturity; however, changes to the portfolio are sometimes required to assure it is appropriately matched to liabilities. In addition, changes in financial market conditions and tax considerations may cause the Company to sell an investment before it matures. The difference between amortized cost and fair value of the Company’s available for sale investments, net of the effect of deferred income taxes, is reflected in accumulated other comprehensive income in shareholders’ equity and, accordingly, has no effect on net income other than for the credit loss component of impairments deemed to be other than temporary.
For investments in limited liability companies and limited partnerships where the ownership interest is less than 3%, the Company carries these investments at fair value, and the change in the difference between cost and the fair value of the partnership interests, net of the effect of deferred income taxes, is reflected in accumulated other comprehensive income in shareholders’ equity and, accordingly, has no effect on net income other than for impairments deemed to be other than temporary. The Company uses the equity method to account for an investments in limited liability companies and limited partnerships where its ownership interest exceeds 3%. The equity method of accounting for an investment in a limited liability company or limited partnership requires that its cost basis be updated to account for the income or loss earned on the investment. The income or loss associated with the limited liability companies or limited partnerships is reflected in the consolidated statements of operations, and the adjusted cost basis approximates fair value.
The Company’s investments in other invested assets were valued at $77.8 million and $66.1 million as of December 31, 2017 and 2016, respectively. These amounts relate to investments in limited liability companies and limited partnerships. The Company does not have access to daily valuations, therefore; the estimated fair value of the limited liability companies and limited partnerships are based on net asset value as a practical expedient for the limited liability companies and limited partnerships.
98
Table of Contents
Net realized gains and losses on investments are determined based on the first-in, first-out method.
The Company regularly performs various analytical valuation procedures with respect to its investments, including reviewing each fixed maturity security in an unrealized loss position to assess whether the security has a credit loss. Specifically, the Company considers credit rating, market price, and issuer specific financial information, among other factors, to assess the likelihood of collection of all principal and interest as contractually due. Securities for which the Company determines that a credit loss is likely are subjected to further analysis through discounted cash flow testing to estimate the credit loss to be recognized in earnings, if any. The specific methodologies and significant assumptions used by asset class are discussed below. Upon identification of such securities and periodically thereafter, a detailed review is performed to determine whether the decline is considered other than temporary. This review includes an analysis of several factors, including but not limited to, the credit ratings and cash flows of the securities and the magnitude and length of time that the fair value of such securities is below cost.
For fixed maturities, the factors considered in reaching the conclusion that a decline below cost is other than temporary include, among others, whether:
| (1) | the issuer is in financial distress; |
| (2) | the investment is secured; |
| (3) | a significant credit rating action occurred; |
| (4) | scheduled interest payments were delayed or missed; |
| (5) | changes in laws or regulations have affected an issuer or industry; |
| (6) | the investment has an unrealized loss and was identified by the Company’s investment manager as an investment to be sold before recovery or maturity; and |
| (7) | the investment failed cash flow projection testing to determine if anticipated principal and interest payments will be realized. |
According to accounting guidance for debt securities in an unrealized loss position, the Company is required to assess whether it has the intent to sell the debt security or more likely than not will be required to sell the debt security before the anticipated recovery. If either of these conditions is met, the Company must recognize an other than temporary impairment with the entire unrealized loss being recorded through earnings. For debt securities in an unrealized loss position not meeting these conditions, the Company assesses whether the impairment of a security is other than temporary. If the impairment is deemed to be other than temporary, the Company must separate the other than temporary impairment into two components: the amount representing the credit loss and the amount related to all other factors, such as changes in interest rates. The credit loss represents the portion of the amortized book value in excess of the net present value of the projected future cash flows discounted at the effective interest rate implicit in the debt security prior to impairment. The credit loss component of the other than temporary impairment is recorded through earnings, whereas the amount relating to factors other than credit losses is recorded in other comprehensive income, net of taxes.
For equity securities, management carefully reviews all securities with unrealized losses to determine if a security should be impaired and further focuses on securities that have either:
| (1) | persisted with unrealized losses for more than twelve consecutive months or |
| (2) | the value of the investment has been 20% or more below cost for six continuous months or more. |
The amount of any write-down, including those that are deemed to be other than temporary, is included in earnings as a realized loss in the period in which the impairment arose.
For an analysis of other than temporary losses that were recorded for the years ended December 31, 2017, 2016, and 2015, please see Note 5 below.
99
Table of Contents
Variable Interest Entities
A Variable Interest Entity (“VIE”) refers to an investment in which an investor holds a controlling interest that is not based on the majority of voting rights. Under the VIE model, the party that has the power to exercise significant management influence and maintain a controlling financial interest in the entity’s economics is said to be the primary beneficiary, and is required to consolidate the entity within their results. Other entities that participate in a VIE, for which their financial interests fluctuate with changes in the fair value of the investment entity’s net assets but do not have significant management influence and the ability to direct the VIE’s significant economic activities are said to have a variable interest in the VIE but do not consolidate the VIE in their financial results.
The Company has variable interests in three VIEs for which it is not the primary beneficiary. These investments are accounted for under the equity method of accounting as their ownership interest exceeds 3% of their respective investments.
Cash and Cash Equivalents
For the purpose of the statements of cash flows, the Company considers all liquid instruments with an original maturity of three months or less to be cash equivalents. The Company has a cash management program that provides for the investment of excess cash balances primarily in short-term money market instruments. Generally, bank balances exceed federally insured limits. The carrying amount of cash and cash equivalents approximates fair value.
At December 31, 2017 and 2016, the Company had approximately $67.1 million and $52.0 million, respectively, of cash and cash equivalents that was invested in a diversified portfolio of high quality short-term debt securities.
Valuation of Premium Receivable
The Company evaluates the collectability of premium receivable based on a combination of factors. In instances in which the Company is aware of a specific circumstance where a party may be unable to meet its financial obligations to the Company, a specific allowance for bad debts against amounts due is recorded to reduce the net receivable to the amount reasonably believed by management to be collectible. For all remaining balances, allowances are recognized for bad debts based on the length of time the receivables are past due. The allowance for bad debts was $2.2 million and $1.9 million as of December 31, 2017 and 2016, respectively.
Goodwill and Intangible Assets
The Company tests for impairment of goodwill at least annually and more frequently as circumstances warrant in accordance with applicable accounting guidance. Accounting guidance allows for the testing of goodwill for impairment using both qualitative and quantitative factors. Impairment of goodwill is recognized only if the carrying amount of the reporting unit, including goodwill, exceeds the fair value of the reporting unit. The amount of the impairment loss would be equal to the excess carrying value of the goodwill over the implied fair value of the reporting unit goodwill. Based on the qualitative assessment performed, there was no impairment of goodwill as of December 31, 2017.
Impairment of intangible assets with an indefinite useful life is tested at least annually and more frequently as circumstances warrant in accordance with applicable accounting guidance. Accounting guidance allows for the testing of indefinite lived intangible assets for impairment using both qualitative and quantitative factors. Impairment of indefinite lived intangible assets is recognized only if the carrying amount of the intangible assets exceeds the fair value of said assets. The amount of the impairment loss would be equal to the excess carrying value of the assets over the fair value of said assets. Based on the qualitative assessment performed, there were no impairments of indefinite lived intangible assets as of December 31, 2017.
100
Table of Contents
Intangible assets that are not deemed to have an indefinite useful life are amortized over their estimated useful lives. The carrying amounts of definite lived intangible assets are regularly reviewed for indicators of impairment in accordance with applicable accounting guidance. Impairment is recognized only if the carrying amount of the intangible asset is in excess of its undiscounted projected cash flows. The impairment is measured as the difference between the carrying amount and the estimated fair value of the asset. As of December 31, 2017, there were no triggering events that occurred during the year that would result in an impairment of definite lived intangible assets.
See Note 8 for additional information on goodwill and intangible assets.
Reinsurance
In the normal course of business, the Company seeks to reduce the loss that may arise from events that cause unfavorable underwriting results by reinsuring certain levels of risk from various areas of exposure with reinsurers. Amounts receivable from reinsurers are estimated in a manner consistent with the reinsured policy and the reinsurance contract.
The Company regularly reviews the collectability of reinsurance receivables. An allowance for uncollectible reinsurance receivable is recognized based on the financial strength of the reinsurers and the length of time any balances are past due. Any changes in the allowance resulting from this review are included in net losses and loss adjustment expenses on the consolidated statements of operations during the period in which the determination is
made. The allowance for uncollectible reinsurance was $8.0 million as of December 31, 2017 and 2016.
The applicable accounting guidance requires that the reinsurer must assume significant insurance risk under the reinsured portions of the underlying insurance contracts and that there must be a reasonably possible chance that the reinsurer may realize a significant loss from the transaction. The Company has evaluated its reinsurance contracts and concluded that each contract qualifies for reinsurance accounting treatment pursuant to this guidance.
Income Taxes
Deferred tax assets and liabilities are recognized for the future tax consequences attributable to differences between the financial statement carrying amounts of existing assets and liabilities and their respective tax bases. Deferred tax assets and liabilities are measured using enacted tax rates expected to apply to taxable income in the years in which those temporary differences are expected to be recovered or settled. The effect on deferred tax assets and liabilities of a change in tax rates is recognized in income in the period that includes the enactment date.
A valuation allowance is provided when it is more likely than not that some portion of the deferred tax assets will not be realized. The deferred tax asset balance is analyzed regularly by management. This assessment requires significant judgment and considers, among other matters, the nature, frequency and severity of current and cumulative losses, forecasts of future profitability, the duration of carryforward periods, and tax planning strategies and/or actions. Management believes that it is more likely than not that the results of future operations can generate sufficient taxable income to realize the remaining deferred income tax assets, and accordingly, the Company has not established any valuation allowances.
Deferred Acquisition Costs
The costs of acquiring new and renewal insurance and reinsurance contracts include commissions, premium taxes and certain other costs that are directly related to the successful acquisition of new and renewal insurance and reinsurance contracts. The excess of the Company’s costs of acquiring new and renewal insurance and reinsurance contracts over the related ceding commissions earned from reinsurers is capitalized as deferred acquisition costs and amortized over the period in which the related premiums are earned.
101
Table of Contents
The amortization of deferred acquisition costs for the years ended December 31, 2017, 2016, and 2015 was $109.0 million, $114.3 million, and $86.2 million, respectively.
Premium Deficiency
A premium deficiency is recognized if the sum of expected loss and loss adjustment expenses and unamortized acquisition costs exceeds related unearned premium after consideration of investment income. This evaluation is done at a product line level in Insurance Operations and at a treaty level in Reinsurance Operations. Any future expected loss on the related unearned premium is recorded first by impairing the unamortized acquisition costs on the related unearned premium followed by an increase to loss and loss adjustment expense reserves on additional expected loss in excess of unamortized acquisition costs.
For the years ended December 31, 2017, 2016, and 2015, the total premium deficiency charges were $0.3 million, $0.3 million, and $0.2 million, respectively, comprised solely of reductions to unamortized deferred acquisition costs within the commercial automobile lines in the Commercial Lines Segment. Based on the Company’s analysis, the Company expensed acquisition cost as incurred for the remainder of 2017, 2016 and 2015 for the commercial automobile lines in the Commercial Lines Segment. As the charges were a reduction of unamortized deferred acquisition costs in each respective period, no premium deficiency reserve existed as of December 31, 2017 or 2016.
Derivative Instruments
The Company uses derivative instruments to manage its exposure to cash flow variability from interest rate risk. The derivative instruments are carried on the balance sheet at fair value and included in other assets and other liabilities. Changes in the fair value of the derivative instruments and the periodic net interest settlements under the derivatives instruments are recognized as net realized investment gains (losses) on the consolidated statements of operations.
Margin Borrowing Facility
The carrying amounts reported in the balance sheet represent the outstanding borrowings. The outstanding borrowings are due on demand; therefore, the cash receipts and cash payments related to the margin borrowing facility are shown net in the consolidated statements of cash flows.
Subordinated Notes
The carrying amounts reported in the balance sheet represent the outstanding balances, net of deferred issuance cost. See Note 12 for details.
Unpaid Losses and Loss Adjustment Expenses
The liability for unpaid losses and loss adjustment expenses represents the Company’s best estimate of future amounts needed to pay losses and related settlement expenses with respect to events insured by the Company. This liability is based upon the accumulation of individual case estimates for losses reported prior to the close of the accounting period with respect to direct business, estimates received from ceding companies with respect to assumed reinsurance, and estimates of unreported losses.
The process of establishing the liability for unpaid losses and loss adjustment is complex, requiring the use of informed actuarially based estimates and management’s judgment. In some cases, significant periods of time, up to several years or more, may elapse between the occurrence of an insured loss and the reporting of that loss to the Company. To establish this liability, the Company regularly reviews and updates the methods of making such estimates and establishing the resulting liabilities. Any resulting adjustments are recorded in consolidated statements of operations during the period in which the determination is made.
102
Table of Contents
Retirement of Treasury Stock
Upon the formal retirement of treasury stock, the Company offsets the par value of the treasury stock that is being retired against Ordinary Shares and reflects any excess of cost over par value as a deduction from Additional Paid-in Capital.
Share Redemptions
When shares are redeemed, the Company offsets the par value of the redeemed shares against Ordinary Shares and reflects any excess of cost over par value as a deduction from Retained Earnings.
Premiums
Premiums are recognized as revenue ratably over the term of the respective policies and treaties. Unearned premiums are computed on a pro rata basis to the day of expiration.
Mandatory reinstatement premiums assessed on reinsurance policies are earned in the period of the loss event that gave rise to the reinstatement premiums.
Contingent Commissions
Certain professional general agencies of the Insurance Operations are paid special incentives, referred to as contingent commissions, when results of business produced by these agencies are more favorable than predetermined thresholds. Similarly, in some circumstances, companies that cede business to the Reinsurance Operations are paid profit commissions based on the profitability of the ceded portfolio. These commissions are charged to other underwriting expenses when incurred.
Share-Based Compensation
The Company accounts for stock options and other equity based compensation using the modified prospective application of the fair value-based method permitted by the appropriate accounting guidance. See Note 16 for details.
Earnings per Share
Basic earnings per share have been calculated by dividing net income available to common shareholders by the weighted-average ordinary shares outstanding. In periods of net income, diluted earnings per share have been calculated by dividing net income available to common shareholders by the sum of the weighted-average ordinary shares outstanding and the weighted-average common share equivalents outstanding, which include options and other equity awards. In periods of net loss, diluted earnings per share is the same as basic earnings per share. See Note 18 for details.
Foreign Currency
The Company maintains investments and cash accounts in foreign currencies related to the operations of its business. At period-end, the Company re-measures non-U.S. currency financial assets to their current U.S. dollar equivalent. The resulting gain or loss for foreign denominated investments is reflected in accumulated other comprehensive income in shareholders’ equity; whereas, the gain or loss on foreign denominated cash accounts is reflected in income during the period. Financial liabilities, if any, are generally adjusted within the reserving process. However, for known losses on claims to be paid in foreign currencies, the Company re-measures the liabilities to their current U.S. dollar equivalent each period end with the resulting gain or loss reflected in income during the period. Net transaction gains and losses, primarily comprised of re-measurement of known losses on claims to be paid in foreign currencies, were a gain of $2.1 million and $0.4 million for the years ended December 31, 2017 and 2015, respectively, and a loss $0.7 million for the year ended December 31, 2016.
103
Table of Contents
Other Income
On September 30, 2016, Diamond State Insurance Company sold all the outstanding shares of capital stock of one of its wholly owned subsidiaries, United National Specialty Insurance Company, to an unrelated party. Diamond State Insurance Company received a one-time payment of $18.7 million and recognized a pretax gain of $6.9 million which is reflected in other income in 2016. This transaction did not have an impact on the Company’s ongoing business operations. Subsequent to the sale, any business previously written by United National Specialty Insurance Company is being written by other companies within the Company’s U.S. Insurance Operations.
In addition, other income is comprised of fee income on policies issued, commission income, accrued interest on the anticipated indemnification of unpaid loss and loss adjustment expense reserve, and foreign exchange gains and losses.
4. Acquisition
On January 1, 2015, Global Indemnity Group, Inc., a subsidiary of the Company, acquired 100% of the voting equity interest of American Reliable from American Bankers Insurance Group, Inc. by paying $113.7 million in cash and assuming $283.9 million of customary insurance related liabilities, obligations, and mandates. Per the American Reliable Share Purchase Agreement (“SPA”), the ultimate purchase price is subject to (i) accounting procedures that were performed in 2015 to determine GAAP book value and (ii) indemnification on future development on recorded loss and loss adjustment expenses as of December 31, 2014. In accordance with the SPA, on the third calendar year following the calendar year of the closing, if loss and loss adjustment expenses for accident years 2014 and prior are lower than recorded unpaid loss and loss adjustment expenses as of December 31, 2014, Global Indemnity Group, Inc. will pay the variance to American Bankers Group, Inc. Conversely, if loss and loss adjustment expenses for accident years 2014 and prior exceed recorded unpaid loss and loss adjustment expenses as of December 31, 2014, American Bankers Group, Inc. will pay the variance to Global Indemnity Group, Inc. In accordance with a dispute resolution agreement between Global Indemnity Group, Inc. and American Bankers Group, Inc., any variance paid related to the loss indemnification will be subject to interest of 5% compounded semi-annually. The Company’s purchase price, based on available financial information at the date of acquisition, was $99.8 million.
The results of American Reliable’s operations have been included in the Company’s consolidated financial statements since the date of the acquisition on January 1, 2015.
The purchase of American Reliable expanded Global Indemnity’s product offerings. American Reliable is a specialty company that distributes personal lines products written on an admitted basis that are unusual and harder to place. It complements Global Indemnity’s existing U.S. Insurance Operations that primarily distribute commercial lines products on an excess and surplus lines basis.
American Reliable is domiciled in Arizona and as such is subject to its state insurance department regulations.
For the year ended December 31, 2015, American Reliable had total revenues of $259.0 million and pre-tax loss of $4.2 million. These amounts are included in the Company’s results of operations for the year ended December 31, 2015.
104
Table of Contents
The Company has finalized its process of valuing the assets acquired and liabilities assumed. The following table summarizes the estimated fair value of the assets acquired and liabilities assumed at the date of the acquisition.
| (Dollars in thousands) | ||||
| ASSETS: |
||||
| Investments |
$ | 226,458 | ||
| Cash and cash equivalents |
21,360 | |||
| Premiums receivables, net |
26,102 | |||
| Accounts receivable |
11,311 | |||
| Reinsurance receivables |
13,842 | |||
| Prepaid reinsurance premiums |
43,506 | |||
| Intangible assets |
32,000 | |||
| Deferred federal income taxes |
915 | |||
| Other assets |
6,473 | |||
|
|
|
|||
| Total assets |
381,967 | |||
|
|
|
|||
| LIABILITIES: |
||||
| Unearned premiums |
172,234 | |||
| Unpaid losses and loss adjustment expenses |
89,489 | |||
| Reinsurance balances payable |
13,219 | |||
| Contingent commissions |
3,903 | |||
| Other liabilities |
5,026 | |||
|
|
|
|||
| Total liabilities |
283,871 | |||
|
|
|
|||
| Estimated fair value of net assets acquired |
98,096 | |||
| Purchase price |
99,797 | |||
|
|
|
|||
| Goodwill |
$ | 1,701 | ||
|
|
|
|||
The transaction was accounted for using the purchase method of accounting. The assets and liabilities acquired by the Company were adjusted to estimated fair value. The $1.7 million excess of cash and acquisition cost over the estimated fair value of assets acquired was recognized as goodwill. Under the purchase method of accounting, goodwill is not amortized but is tested for impairment at least annually.
Goodwill of $1.7 million, arising from the acquisition, consists largely of the synergies and economies of scales expected from combining the operations of Global Indemnity and American Reliable. The Company has assigned goodwill of $1.7 million to the Personal Lines segment. There is no tax goodwill.
An identification and valuation of intangible assets was performed that resulted in the recognition of intangible assets of $32.0 million with values assigned as follows:
| (Dollars in thousands) Description |
Useful Life | Amount | ||||||
| State insurance licenses |
Indefinite | $ | 5,000 | |||||
| Value of business acquired |
< 1 year | 25,500 | ||||||
| Agent relationships |
10 years | 900 | ||||||
| Trade name |
7 years | 600 | ||||||
|
|
|
|||||||
| $ | 32,000 | |||||||
|
|
|
|||||||
Intangible assets arising from the acquisition are deductible for income tax purposes over 15 years.
105
Table of Contents
The following table presents details of the Company’s intangible assets arising from the American Reliable acquisition as of December 31, 2015:
| (Dollars in thousands) Description |
Useful Life | Cost | Accumulated Amortization |
Net Value |
||||||||||||
| State insurance licenses |
Indefinite | $ | 5,000 | $ | — | $ | 5,000 | |||||||||
| Value of business acquired |
< 1 year | 25,500 | 25,500 | 0 | ||||||||||||
| Agent relationships |
10 years | 900 | 90 | 810 | ||||||||||||
| Trade name |
7 years | 600 | 86 | 514 | ||||||||||||
|
|
|
|
|
|
|
|||||||||||
| $ | 32,000 | $ | 25,676 | $ | 6,324 | |||||||||||
|
|
|
|
|
|
|
|||||||||||
Amortization related to the Company’s definite lived intangible assets resulting from American Reliable acquisition was $25.7 million for the year ended December 31, 2015.
As of December 31, 2015, the Company expected that amortization expense for the next five years related to the American Reliable acquisition will be as follows:
| (Dollars in thousands) | ||||
| 2016 |
$ | 176 | ||
| 2017 |
176 | |||
| 2018 |
176 | |||
| 2019 |
176 | |||
| 2020 |
176 | |||
As of December 31, 2015, the fair value, gross contractual amounts due, and contractual cash flows not expected to be collected of acquired receivables were as follows:
| (Dollars in thousands) | Fair Value | Gross Contractual Amounts Due |
Contractual cash flows not expected to be collected |
|||||||||
| Premium receivables |
$ | 26,102 | $ | 26,896 | $ | 794 | ||||||
| Accounts receivable |
11,311 | 11,311 | — | |||||||||
| Reinsurance receivables |
13,842 | 13,842 | — | |||||||||
In connection with the acquisition, the Company agreed to pay to Fox Paine & Company an investment banking fee of 3% of the amount paid plus the additional capital required to operate American Reliable on a standalone basis and a $1.5 million investment advisory fee, which in the aggregate, totaled $6.5 million. This amount was included in corporate and other operating expenses on the Company’s Consolidated Statements of Operations during the year ended December 31, 2015. As payment for these fees, 267,702 A ordinary shares of Global Indemnity were issued under the Global Indemnity plc Share Incentive Plan in May, 2015. These shares were registered but cannot be sold until the earlier of five years or a change of control. See Note 16 for additional information on the Company’s share incentive plan, including the Global Indemnity plc Share Incentive Plan.
Additional costs, mainly professional fees, of $5.1 million were incurred in connection with the acquisition of American Reliable. Of this amount, $1.8 million and $3.3 million was recorded as corporate and other operating expenses on the Company’s Consolidated Statements of Operations during the years ended December 31, 2015 and 2014, respectively.
During the year ended December 31, 2015, the Company paid approximately $1.6 million in employee compensation related costs, which were related to periods prior to the Acquisition. These costs were accrued by American Reliable and were included in the fair value of net assets acquired by Global Indemnity Group, Inc. on January 1, 2015.
106
Table of Contents
5. Investments
The amortized cost and estimated fair value of investments were as follows as of December 31, 2017 and 2016:
| (Dollars in thousands) | Amortized Cost |
Gross Unrealized Gains |
Gross Unrealized Losses |
Estimated Fair Value |
Other than temporary impairments recognized in AOCI (1) |
|||||||||||||||
| As of December 31, 2017 |
||||||||||||||||||||
| Fixed maturities: |
||||||||||||||||||||
| U.S. treasury and agency obligations |
$ | 105,311 | $ | 562 | $ | (1,193 | ) | $ | 104,680 | $ | — | |||||||||
| Obligations of states and political subdivisions |
94,947 | 441 | (274 | ) | 95,114 | — | ||||||||||||||
| Mortgage-backed securities |
150,237 | 404 | (1,291 | ) | 149,350 | — | ||||||||||||||
| Asset-backed securities |
203,827 | 267 | (393 | ) | 203,701 | (1 | ) | |||||||||||||
| Commercial mortgage-backed securities |
140,761 | 101 | (1,067 | ) | 139,795 | — | ||||||||||||||
| Corporate bonds |
422,486 | 2,295 | (1,391 | ) | 423,390 | — | ||||||||||||||
| Foreign corporate bonds |
125,575 | 377 | (545 | ) | 125,407 | — | ||||||||||||||
|
|
|
|
|
|
|
|
|
|
|
|||||||||||
| Total fixed maturities |
1,243,144 | 4,447 | (6,154 | ) | 1,241,437 | (1 | ) | |||||||||||||
| Common stock |
124,915 | 18,574 | (3,260 | ) | 140,229 | — | ||||||||||||||
| Other invested assets |
77,820 | — | — | 77,820 | — | |||||||||||||||
|
|
|
|
|
|
|
|
|
|
|
|||||||||||
| Total |
$ | 1,445,879 | $ | 23,021 | $ | (9,414 | ) | $ | 1,459,486 | $ | (1 | ) | ||||||||
|
|
|
|
|
|
|
|
|
|
|
|||||||||||
| (1) | Represents the total amount of other than temporary impairment losses relating to factors other than credit losses recognized in accumulated other comprehensive income (“AOCI”). |
| (Dollars in thousands) | Amortized Cost |
Gross Unrealized Gains |
Gross Unrealized Losses |
Estimated Fair Value |
Other than temporary impairments recognized in AOCI (1) |
|||||||||||||||
| As of December 31, 2016 |
||||||||||||||||||||
| Fixed maturities: |
||||||||||||||||||||
| U.S. treasury and agency obligations |
$ | 71,517 | $ | 763 | $ | (233 | ) | $ | 72,047 | $ | — | |||||||||
| Obligations of states and political subdivisions |
155,402 | 1,423 | (379 | ) | 156,446 | — | ||||||||||||||
| Mortgage-backed securities |
88,131 | 895 | (558 | ) | 88,468 | — | ||||||||||||||
| Asset-backed securities |
233,890 | 684 | (583 | ) | 233,991 | (4 | ) | |||||||||||||
| Commercial mortgage-backed securities |
184,821 | 118 | (1,747 | ) | 183,192 | — | ||||||||||||||
| Corporate bonds |
381,209 | 1,666 | (2,848 | ) | 380,027 | — | ||||||||||||||
| Foreign corporate bonds |
126,369 | 164 | (673 | ) | 125,860 | — | ||||||||||||||
|
|
|
|
|
|
|
|
|
|
|
|||||||||||
| Total fixed maturities |
1,241,339 | 5,713 | (7,021 | ) | 1,240,031 | (4 | ) | |||||||||||||
| Common stock |
119,515 | 3,445 | (2,403 | ) | 120,557 | — | ||||||||||||||
| Other invested assets |
66,121 | — | — | 66,121 | — | |||||||||||||||
|
|
|
|
|
|
|
|
|
|
|
|||||||||||
| Total |
$ | 1,426,975 | $ | 9,158 | $ | (9,424 | ) | $ | 1,426,709 | $ | (4 | ) | ||||||||
|
|
|
|
|
|
|
|
|
|
|
|||||||||||
| (1) | Represents the total amount of other than temporary impairment losses relating to factors other than credit losses recognized in accumulated other comprehensive income (“AOCI”). |
Excluding U.S. treasuries and agency bonds, the Company did not hold any debt or equity investments in a single issuer that was in excess of 5% of shareholders’ equity at December 31, 2017 and 2016.
107
Table of Contents
The amortized cost and estimated fair value of the Company’s fixed maturities portfolio classified as available for sale at December 31, 2017, by contractual maturity, are shown below. Actual maturities may differ from contractual maturities because borrowers may have the right to call or prepay obligations with or without call or prepayment penalties.
| (Dollars in thousands) | Amortized Cost |
Estimated Fair Value |
||||||
| Due in one year or less |
$ | 70,222 | $ | 70,165 | ||||
| Due in one year through five years |
435,122 | 434,078 | ||||||
| Due in five years through ten years |
235,233 | 236,552 | ||||||
| Due in ten years through fifteen years |
2,187 | 2,205 | ||||||
| Due after fifteen years |
5,555 | 5,591 | ||||||
| Mortgage-backed securities |
150,237 | 149,350 | ||||||
| Asset-backed securities |
203,827 | 203,701 | ||||||
| Commercial mortgage-backed securities |
140,761 | 139,795 | ||||||
|
|
|
|
|
|||||
| Total |
$ | 1,243,144 | $ | 1,241,437 | ||||
|
|
|
|
|
|||||
The following table contains an analysis of the Company’s securities with gross unrealized losses, categorized by the period that the securities were in a continuous loss position as of December 31, 2017:
| Less than 12 months | 12 months or longer (1) | Total | ||||||||||||||||||||||
| (Dollars in thousands) | Fair Value | Gross Unrealized Losses |
Fair Value | Gross Unrealized Losses |
Fair Value | Gross Unrealized Losses |
||||||||||||||||||
| Fixed maturities: |
||||||||||||||||||||||||
| U.S. treasury and agency obligations |
$ | 79,403 | $ | (962 | ) | $ | 17,469 | $ | (231 | ) | $ | 96,872 | $ | (1,193 | ) | |||||||||
| Obligations of states and political subdivisions |
34,537 | (149 | ) | 12,060 | (125 | ) | 46,597 | (274 | ) | |||||||||||||||
| Mortgage-backed securities |
127,991 | (1,247 | ) | 1,866 | (44 | ) | 129,857 | (1,291 | ) | |||||||||||||||
| Asset-backed securities |
97,817 | (371 | ) | 6,423 | (22 | ) | 104,240 | (393 | ) | |||||||||||||||
| Commercial mortgage-backed securities |
83,051 | (523 | ) | 27,976 | (544 | ) | 111,027 | (1,067 | ) | |||||||||||||||
| Corporate bonds |
147,064 | (754 | ) | 53,024 | (637 | ) | 200,088 | (1,391 | ) | |||||||||||||||
| Foreign corporate bonds |
53,320 | (305 | ) | 20,582 | (240 | ) | 73,902 | (545 | ) | |||||||||||||||
|
|
|
|
|
|
|
|
|
|
|
|
|
|||||||||||||
| Total fixed maturities |
623,183 | (4,311 | ) | 139,400 | (1,843 | ) | 762,583 | (6,154 | ) | |||||||||||||||
| Common stock |
32,759 | (3,260 | ) | — | — | 32,759 | (3,260 | ) | ||||||||||||||||
|
|
|
|
|
|
|
|
|
|
|
|
|
|||||||||||||
| Total |
$ | 655,942 | $ | (7,571 | ) | $ | 139,400 | $ | (1,843 | ) | $ | 795,342 | $ | (9,414 | ) | |||||||||
|
|
|
|
|
|
|
|
|
|
|
|
|
|||||||||||||
| (1) | Fixed maturities in a gross unrealized loss position for twelve months or longer are primarily comprised of non-credit losses on investment grade securities where management does not intend to sell, and it is more likely than not that the Company will not be forced to sell the security before recovery. The Company has analyzed these securities and has determined that they are not other than temporarily impaired. |
108
Table of Contents
The following table contains an analysis of the Company’s securities with gross unrealized losses, categorized by the period that the securities were in a continuous loss position as of December 31, 2016:
| Less than 12 months | 12 months or longer (1) | Total | ||||||||||||||||||||||
| (Dollars in thousands) | Fair Value | Gross Unrealized Losses |
Fair Value | Gross Unrealized Losses |
Fair Value | Gross Unrealized Losses |
||||||||||||||||||
| Fixed maturities: |
||||||||||||||||||||||||
| U.S. treasury and agency obligations |
$ | 39,570 | $ | (233 | ) | $ | — | $ | — | $ | 39,570 | $ | (233 | ) | ||||||||||
| Obligations of states and political subdivisions |
46,861 | (369 | ) | 670 | (10 | ) | 47,531 | (379 | ) | |||||||||||||||
| Mortgage-backed securities |
52,780 | (541 | ) | 298 | (17 | ) | 53,078 | (558 | ) | |||||||||||||||
| Asset-backed securities |
62,737 | (493 | ) | 23,937 | (90 | ) | 86,674 | (583 | ) | |||||||||||||||
| Commercial mortgage-backed securities |
94,366 | (1,090 | ) | 69,747 | (657 | ) | 164,113 | (1,747 | ) | |||||||||||||||
| Corporate bonds |
171,621 | (2,731 | ) | 9,218 | (117 | ) | 180,839 | (2,848 | ) | |||||||||||||||
| Foreign corporate bonds |
76,036 | (673 | ) | — | — | 76,036 | (673 | ) | ||||||||||||||||
|
|
|
|
|
|
|
|
|
|
|
|
|
|||||||||||||
| Total fixed maturities |
543,971 | (6,130 | ) | 103,870 | (891 | ) | 647,841 | (7,021 | ) | |||||||||||||||
| Common stock |
57,439 | (2,403 | ) | — | — | 57,439 | (2,403 | ) | ||||||||||||||||
|
|
|
|
|
|
|
|
|
|
|
|
|
|||||||||||||
| Total |
$ | 601,410 | $ | (8,533 | ) | $ | 103,870 | $ | (891 | ) | $ | 705,280 | $ | (9,424 | ) | |||||||||
|
|
|
|
|
|
|
|
|
|
|
|
|
|||||||||||||
| (1) | Fixed maturities in a gross unrealized loss position for twelve months or longer are primarily comprised of non-credit losses on investment grade securities where management does not intend to sell, and it is more likely than not that the Company will not be forced to sell the security before recovery. The Company has analyzed these securities and has determined that they are not other than temporarily impaired. |
Subject to the risks and uncertainties in evaluating the potential impairment of a security’s value, the impairment evaluation conducted by the Company as of December 31, 2017 concluded the unrealized losses discussed above are not other than temporary impairments. The impairment evaluation process is discussed in the “Investment” section of Note 3 (“Summary of Significant Accounting Policies”).
The following is a description, by asset type, of the methodology and significant inputs that the Company used to measure the amount of credit loss recognized in earnings, if any:
U.S. treasury and agency obligations — As of December 31, 2017, gross unrealized losses related to U.S. treasury and agency obligations were $1.193 million. Of this amount, $0.231 million have been in an unrealized loss position for twelve months or greater and rated AA+. Macroeconomic and market analysis is conducted in evaluating these securities. Consideration is given to the interest rate environment, duration and yield curve management of the portfolio, sector allocation and security selection.
Obligations of states and political subdivisions — As of December 31, 2017, gross unrealized losses related to obligations of states and political subdivisions were $0.274 million. Of this amount, $0.125 million have been in an unrealized loss position for twelve months or greater and are rated investment grade or better. All factors that influence performance of the municipal bond market are considered in evaluating these securities. The aforementioned factors include investor expectations, supply and demand patterns, and current versus historical yield and spread relationships. The analysis relies on the output of fixed income credit analysts, as well as dedicated municipal bond analysts who perform extensive in-house fundamental analysis on each issuer, regardless of their rating by the major agencies.
Mortgage-backed securities (“MBS”) — As of December 31, 2017, gross unrealized losses related to mortgage-backed securities were $1.291 million. Of this amount, $0.044 million have been in an unrealized loss
109
Table of Contents
position for twelve months or greater. 95.5% of the unrealized losses for twelve months or greater are related to securities rated AA+ or better. Mortgage-backed securities are modeled to project principal losses under downside, base, and upside scenarios for the economy and home prices. The primary assumption that drives the security and loan level modeling is the Home Price Index (“HPI”) projection. These forecasts incorporate not just national macro-economic trends, but also regional impacts to arrive at the most granular and accurate projections. These assumptions are incorporated into the model as a basis to generate delinquency probabilities, default curves, loss severity curves, and voluntary prepayment curves at the loan level within each deal. The model utilizes HPI-adjusted current LTV, payment history, loan terms, loan modification history, and borrower characteristics as inputs to generate expected cash flows and principal loss for each bond under various scenarios.
Asset backed securities (“ABS”) — As of December 31, 2017, gross unrealized losses related to asset backed securities were $0.393 million. Of this amount, $0.022 million have been in an unrealized loss position for twelve months or greater and are rated AA or better. The weighted average credit enhancement for the Company’s asset backed portfolio is 23.4. This represents the percentage of pool losses that can occur before an asset backed security will incur its first dollar of principal losses. Every ABS transaction is analyzed on a stand-alone basis. This analysis involves a thorough review of the collateral, prepayment, and structural risk in each transaction. Additionally, the analysis includes an in-depth credit analysis of the originator and servicer of the collateral. The analysis projects an expected loss for a deal given a set of assumptions specific to the asset type. These assumptions are used to calculate at what level of losses the deal will incur its first dollar of principal loss. The major assumptions used to calculate this ratio are loss severities, recovery lags, and no advances on principal and interest.
Commercial mortgage-backed securities (“CMBS”) — As of December 31, 2017, gross unrealized losses related to the CMBS portfolio were $1.067 million. Of this amount, $0.544 million have been in an unrealized loss position for twelve months or greater and are rated AA+ or better. The weighted average credit enhancement for the Company’s CMBS portfolio is 24.7. This represents the percentage of pool losses that can occur before a mortgage-backed security will incur its first dollar of principal loss. For the Company’s CMBS portfolio, a loan level analysis is utilized where every underlying CMBS loan is re-underwritten based on a set of assumptions reflecting expectations for the future path of the economy. Each loan is analyzed over time using a series of tests to determine if a credit event will occur during the life of the loan. Inherent in this process are several economic scenarios and their corresponding rent/vacancy and capital market states. The five primary credit events that frame the analysis include loan modifications, term default, balloon default, extension, and ability to pay off at balloon. The resulting output is the expected loss adjusted cash flows for each bond under the base case and distressed scenarios.
Corporate bonds — As of December 31, 2017, gross unrealized losses related to corporate bonds were $1.391 million. Of this amount, $0.637 million have been in an unrealized loss position for twelve months or greater and are rated investment grade or better. The analysis for this asset class includes maintaining detailed financial models that include a projection of each issuer’s future financial performance, including prospective debt servicing capabilities, capital structure composition, and the value of the collateral. The analysis incorporates the macroeconomic environment, industry conditions in which the issuer operates, the issuer’s current competitive position, its vulnerability to changes in the competitive and regulatory environment, issuer liquidity, issuer commitment to bondholders, issuer creditworthiness, and asset protection. Part of the process also includes running downside scenarios to evaluate the expected likelihood of default as well as potential losses in the event of default.
Foreign bonds — As of December 31, 2017, gross unrealized losses related to foreign bonds were $0.545 million. Of this amount, $0.240 million have been in an unrealized loss position for twelve months or greater and are rated investment grade or better. For this asset class, detailed financial models are maintained that include a projection of each issuer’s future financial performance, including prospective debt servicing capabilities, capital structure composition, and the value of the collateral. The analysis incorporates the macroeconomic environment, industry conditions in which the issuer operates, the issuer’s current competitive
110
Table of Contents
position, its vulnerability to changes in the competitive and regulatory environment, issuer liquidity, issuer commitment to bondholders, issuer creditworthiness, and asset protection. Part of the process also includes running downside scenarios to evaluate the expected likelihood of default as well as potential losses in the event of default.
Common stock — As of December 31, 2017, gross unrealized losses related to common stock were $3.260 million. All unrealized losses have been in an unrealized loss position for less than twelve months. To determine if an other than temporary impairment of an equity security has occurred, the Company considers, among other things, the severity and duration of the decline in fair value of the equity security. The Company also examines other factors to determine if the equity security could recover its value in a reasonable period of time.
The Company recorded the following other than temporary impairments (“OTTI”) on its investment portfolio for the years ended December 31, 2017, 2016, and 2015:
| Years Ended December 31, | ||||||||||||
| (Dollars in thousands) | 2017 | 2016 | 2015 | |||||||||
| Fixed maturities: |
||||||||||||
| OTTI losses, gross |
$ | (31 | ) | $ | (259 | ) | $ | (24 | ) | |||
| Portion of loss recognized in other comprehensive income (pre-tax) |
— | — | — | |||||||||
|
|
|
|
|
|
|
|||||||
| Net impairment losses on fixed maturities recognized in earnings |
(31 | ) | (259 | ) | (24 | ) | ||||||
| Equity securities |
(2,575 | ) | (6,474 | ) | (7,311 | ) | ||||||
|
|
|
|
|
|
|
|||||||
| Total |
$ | (2,606 | ) | $ | (6,733 | ) | $ | (7,335 | ) | |||
|
|
|
|
|
|
|
|||||||
The following table is an analysis of the credit losses recognized in earnings on fixed maturities held by the Company as of December 31, 2017, 2016, and 2015 for which a portion of the OTTI loss was recognized in other comprehensive income.
| Years Ended December 31, |
||||||||||||
| (Dollars in thousands) | 2017 | 2016 | 2015 | |||||||||
| Balance at beginning of period |
$ | 31 | $ | 31 | $ | 50 | ||||||
| Additions where no OTTI was previously recorded |
— | — | — | |||||||||
| Additions where an OTTI was previously recorded |
— | — | — | |||||||||
| Reductions for securities for which the company intends to sell or more likely than not will be required to sell before recovery |
— | — | — | |||||||||
| Reductions reflecting increases in expected cash flows to be collected |
— | — | — | |||||||||
| Reductions for securities sold during the period |
(18 | ) | — | (19 | ) | |||||||
|
|
|
|
|
|
|
|||||||
| Balance at end of period |
$ | 13 | $ | 31 | $ | 31 | ||||||
|
|
|
|
|
|
|
|||||||
111
Table of Contents
Accumulated Other Comprehensive Income, Net of Tax
Accumulated other comprehensive income, net of tax, as of December 31, 2017 and 2016 was as follows:
| December 31, | ||||||||
| (Dollars in thousands) | 2017 | 2016 | ||||||
| Net unrealized gains (losses) from: |
||||||||
| Fixed maturities |
$ | (1,707 | ) | $ | (1,308 | ) | ||
| Common stock |
15,314 | 1,042 | ||||||
| Foreign currency fluctuations |
551 | — | ||||||
| Deferred taxes |
(5,175 | ) | (352 | ) | ||||
|
|
|
|
|
|||||
| Accumulated other comprehensive income, net of tax |
$ | 8,983 | $ | (618 | ) | |||
|
|
|
|
|
|||||
The following tables present the changes in accumulated other comprehensive income, net of tax, by component for the years ended December 31, 2017 and 2016:
| Year Ended December 31, 2017 (Dollars in thousands) |
Unrealized Gains and Losses on Available for Sale Securities, Net of Tax |
Foreign Currency Items, Net of Tax |
Accumulated Other Comprehensive Income, Net of Tax |
|||||||||
| Beginning balance |
$ | (554 | ) | $ | (64 | ) | $ | (618 | ) | |||
| Other comprehensive income (loss) before reclassification |
9,455 | 994 | 10,449 | |||||||||
| Amounts reclassified from accumulated other comprehensive income (loss) |
(629 | ) | (219 | ) | (848 | ) | ||||||
|
|
|
|
|
|
|
|||||||
| Other comprehensive income (loss) |
8,826 | 775 | 9,601 | |||||||||
|
|
|
|
|
|
|
|||||||
| Ending balance |
$ | 8,272 | $ | 711 | $ | 8,983 | ||||||
|
|
|
|
|
|
|
|||||||
| Year Ended December 31, 2016 (Dollars in thousands) |
Unrealized Gains and Losses on Available for Sale Securities, Net of Tax |
Foreign Currency Items, Net of Tax |
Accumulated Other Comprehensive Income, Net of Tax |
|||||||||
| Beginning balance |
$ | 4,200 | $ | (122 | ) | $ | 4,078 | |||||
| Other comprehensive income (loss) before reclassification |
10,374 | (261 | ) | 10,113 | ||||||||
| Amounts reclassified from accumulated other comprehensive income (loss) |
(15,128 | ) | 319 | (14,809 | ) | |||||||
|
|
|
|
|
|
|
|||||||
| Other comprehensive income (loss) |
(4,754 | ) | 58 | (4,696 | ) | |||||||
|
|
|
|
|
|
|
|||||||
| Ending balance |
$ | (554 | ) | $ | (64 | ) | $ | (618 | ) | |||
|
|
|
|
|
|
|
|||||||
112
Table of Contents
The reclassifications out of accumulated other comprehensive income for the years ended December 31, 2017 and 2016 were as follows:
| (Dollars in thousands) | Amounts Reclassified from Accumulated Other Comprehensive Income Years Ended December 31, |
|||||||||
| Details about Accumulated Other Comprehensive Income Components |
Affected Line Item in the Consolidated |
2017 | 2016 | |||||||
| Unrealized gains and losses on available for sale securities |
Other net realized investment (gains) | $ | (3,921 | ) | $ | (30,055 | ) | |||
| Other than temporary impairment losses on investments | 2,606 | 6,733 | ||||||||
|
|
|
|
|
|||||||
| Total before tax | (1,315 | ) | (23,322 | ) | ||||||
| Income tax expense | 686 | 8,194 | ||||||||
|
|
|
|
|
|||||||
| Unrealized gains and losses on available for sale securities, net of tax | (629 | ) | (15,128 | ) | ||||||
|
|
|
|
|
|||||||
| Foreign currency items |
Other net realized investment (gains) losses | (336 | ) | 491 | ||||||
| Income tax expense (benefit) | 117 | (172 | ) | |||||||
|
|
|
|
|
|||||||
| Foreign currency items, net of tax | (219 | ) | 319 | |||||||
|
|
|
|
|
|||||||
| Total reclassifications |
Total reclassifications, net of tax | $ | (848 | ) | $ | (14,809 | ) | |||
|
|
|
|
|
|||||||
Net Realized Investment Gains (Losses)
The components of net realized investment gains (losses) for the years ended December 31, 2017, 2016, and 2015 were as follows:
| Years Ended December 31, | ||||||||||||
| (Dollars in thousands) | 2017 | 2016 | 2015 | |||||||||
| Fixed maturities: |
||||||||||||
| Gross realized gains |
$ | 4,066 | $ | 2,947 | $ | 3,565 | ||||||
| Gross realized losses |
(3,387 | ) | (691 | ) | (2,180 | ) | ||||||
|
|
|
|
|
|
|
|||||||
| Net realized gains |
679 | 2,256 | 1,385 | |||||||||
|
|
|
|
|
|
|
|||||||
| Common stock: |
||||||||||||
| Gross realized gains |
4,178 | 28,785 | 10,379 | |||||||||
| Gross realized losses |
(3,206 | ) | (8,210 | ) | (8,246 | ) | ||||||
|
|
|
|
|
|
|
|||||||
| Net realized gains |
972 | 20,575 | 2,133 | |||||||||
|
|
|
|
|
|
|
|||||||
| Preferred stock: |
||||||||||||
| Gross realized gains |
— | — | 96 | |||||||||
| Gross realized losses |
— | — | — | |||||||||
|
|
|
|
|
|
|
|||||||
| Net realized gains |
— | — | 96 | |||||||||
|
|
|
|
|
|
|
|||||||
| Derivatives: |
||||||||||||
| Gross realized gains |
3,555 | 3,733 | — | |||||||||
| Gross realized losses |
(3,630 | ) | (4,843 | ) | (6,988 | ) | ||||||
|
|
|
|
|
|
|
|||||||
| Net realized gains (losses) (1) |
(75 | ) | (1,110 | ) | (6,988 | ) | ||||||
|
|
|
|
|
|
|
|||||||
| Total net realized investment gains (losses) |
$ | 1,576 | $ | 21,721 | $ | (3,374 | ) | |||||
|
|
|
|
|
|
|
|||||||
113
Table of Contents
| (1) | Includes $3.6 million, $4.8 million, and $5.4 million of periodic net interest settlements related to the derivatives for the years ended December 31, 2017, 2016, and 2015, respectively. |
The proceeds from sales and redemptions of available for sale securities resulting in net realized investment gains (losses) for the years ended December 31, 2017, 2016, and 2015 were as follows:
| Years Ended December 31, | ||||||||||||
| (Dollars in thousands) | 2017 | 2016 | 2015 | |||||||||
| Fixed maturities |
$ | 918,439 | $ | 381,389 | $ | 647,404 | ||||||
| Equity securities |
32,218 | 111,156 | 39,723 | |||||||||
| Preferred stock |
— | — | 1,540 | |||||||||
Net Investment Income
The sources of net investment income for the years ended December 31, 2017, 2016, and 2015 were as follows:
| Years Ended December 31, | ||||||||||||
| (Dollars in thousands) | 2017 | 2016 | 2015 | |||||||||
| Fixed maturities |
$ | 33,020 | $ | 30,337 | $ | 32,091 | ||||||
| Equity securities |
3,595 | 3,302 | 3,125 | |||||||||
| Cash and cash equivalents |
894 | 217 | 82 | |||||||||
| Other invested assets |
4,741 | 5,295 | 2,620 | |||||||||
|
|
|
|
|
|
|
|||||||
| Total investment income |
42,250 | 39,151 | 37,918 | |||||||||
| Investment expense (1) |
(2,927 | ) | (5,168 | ) | (3,309 | ) | ||||||
|
|
|
|
|
|
|
|||||||
| Net investment income |
$ | 39,323 | $ | 33,983 | $ | 34,609 | ||||||
|
|
|
|
|
|
|
|||||||
| (1) | Investment expense for the year ended December 31, 2016 includes $1.5 million in upfront fees necessary to enter into a new investment. See Note 15 for additional information on the Company’s $40 million commitment related to this investment. |
The Company’s total investment return on a pre-tax basis for the years ended December 31, 2017, 2016, and 2015 were as follows:
| Years Ended December 31, | ||||||||||||
| (Dollars in thousands) | 2017 | 2016 | 2015 | |||||||||
| Net investment income |
$ | 39,323 | $ | 33,983 | $ | 34,609 | ||||||
|
|
|
|
|
|
|
|||||||
| Net realized investment gains (losses) |
1,576 | 21,721 | (3,374 | ) | ||||||||
| Change in unrealized holding gains and losses |
14,424 | (8,240 | ) | (25,673 | ) | |||||||
|
|
|
|
|
|
|
|||||||
| Net realized and unrealized investment returns |
16,000 | 13,481 | (29,047 | ) | ||||||||
|
|
|
|
|
|
|
|||||||
| Total investment return |
$ | 55,323 | $ | 47,464 | $ | 5,562 | ||||||
|
|
|
|
|
|
|
|||||||
| Total investment return % |
3.5 | % | 3.1 | % | 0.3 | % | ||||||
|
|
|
|
|
|
|
|||||||
| Average investment portfolio |
$ | 1,597,487 | $ | 1,507,184 | $ | 1,752,785 | ||||||
|
|
|
|
|
|
|
|||||||
Insurance Enhanced Asset-Backed and Credit Securities
As of December 31, 2017, the Company held insurance enhanced asset-backed, commercial mortgage-backed, and credit securities with a market value of approximately $33.9 million. Approximately $1.6 million of these
114
Table of Contents
securities were tax-free municipal bonds, which represented approximately 0.1% of the Company’s total cash and invested assets, net of payable/ receivable for securities purchased and sold. These securities had an average rating of “AA.” None of these bonds are pre-refunded with U.S. treasury securities, nor would they have carried a lower credit rating had they not been insured.
A summary of the Company’s insurance enhanced municipal bonds that are backed by financial guarantors, including the pre-refunded bonds that are escrowed in U.S. government obligations, as of December 31, 2017, is as follows:
| (Dollars in thousands) Financial Guarantor |
Total | Pre-refunded Securities |
Government Guaranteed Securities |
Exposure Net of Pre-refunded & Government Guaranteed Securities |
||||||||||||
| Municipal Bond Insurance Association |
$ | 1,157 | $ | — | $ | — | $ | 1,157 | ||||||||
| Gov’t National Housing Association |
425 | — | 425 | — | ||||||||||||
|
|
|
|
|
|
|
|
|
|||||||||
| Total backed by financial guarantors |
1,582 | — | 425 | 1,157 | ||||||||||||
| Other credit enhanced municipal bonds |
— | — | — | — | ||||||||||||
|
|
|
|
|
|
|
|
|
|||||||||
| Total |
1,582 | — | 425 | 1,157 | ||||||||||||
|
|
|
|
|
|
|
|
|
|||||||||
In addition to the tax-free municipal bonds, the Company held $32.3 million of insurance enhanced bonds, which represented approximately 2.1% of the Company’s total invested assets, net of receivable/payable for securities purchased and sold. The insurance enhanced bonds are comprised of $21.8 million of taxable municipal bonds, $10.4 million of commercial mortgage-backed securities, and $0.1 million of asset-backed securities. The financial guarantors of the Company’s $32.3 million of insurance enhanced asset-backed, commercial-mortgage-backed, and taxable municipal securities include Municipal Bond Insurance Association ($6.4 million), Assured Guaranty Corporation ($15.5 million), and Federal Home Loan Mortgage Corporation ($10.4 million).
The Company had no direct investments in the entities that have provided financial guarantees or other credit support to any security held by the Company at December 31, 2017.
Bonds Held on Deposit
Certain cash balances, cash equivalents, equity securities, and bonds available for sale were deposited with various governmental authorities in accordance with statutory requirements, were held as collateral pursuant to borrowing arrangements, or were held in trust pursuant to intercompany reinsurance agreements. The fair values were as follows as of December 31, 2017 and 2016:
| Estimated Fair Value | ||||||||
| (Dollars in thousands) | December 31, 2017 |
December 31, 2016 |
||||||
| On deposit with governmental authorities |
$ | 26,852 | $ | 29,079 | ||||
| Intercompany trusts held for the benefit of U.S. policyholders |
328,494 | 351,002 | ||||||
| Held in trust pursuant to third party requirements |
94,098 | 88,178 | ||||||
| Letter of credit held for third party requirements |
3,944 | 4,871 | ||||||
| Securities held as collateral for borrowing arrangements (1) |
88,040 | 85,939 | ||||||
|
|
|
|
|
|||||
| Total |
$ | 541,428 | $ | 559,069 | ||||
|
|
|
|
|
|||||
| (1) | Amount required to collateralize margin borrowing facility. |
115
Table of Contents
Variable Interest Entities
A Variable Interest Entity (VIE) refers to an investment in which an investor holds a controlling interest that is not based on the majority of voting rights. Under the VIE model, the party that has the power to exercise significant management influence and maintain a controlling financial interest in the entity’s economics is said to be the primary beneficiary, and is required to consolidate the entity within their results. Other entities that participate in a VIE, for which their financial interests fluctuate with changes in the fair value of the investment entity’s net assets but do not have significant management influence and the ability to direct the VIE’s significant economic activities are said to have a variable interest in the VIE but do not consolidate the VIE in their financial results.
The Company has variable interests in three VIE’s for which it is not the primary beneficiary. These investments are accounted for under the equity method of accounting as their ownership interest exceeds 3% of their respective investments.
The fair value of one of the Company’s VIE’s, which invests in distressed securities and assets, was $26.3 million and $32.9 million as of December 31, 2017 and 2016, respectively. The Company’s maximum exposure to loss from this VIE, which factors in future funding commitments, was $40.5 million and $48.6 million at December 31, 2017 and 2016, respectively. The fair value of a second VIE that provides financing for middle market companies, was $33.8 million and $33.2 million at December 31, 2017 and 2016, respectively. The Company’s maximum exposure to loss from this VIE, which factors in future funding commitments, was $43.8 million and $42.3 million at December 31, 2017 and 2016, respectively. During the 2nd quarter of 2017, the Company invested in a new limited partnership that also invests in distressed securities and assets and is considered a VIE. The Company’s investment in this partnership has a fair value of $17.8 million as of December 31, 2017. The Company’s maximum exposure to loss from this VIE, which factors in future funding commitments, was $51.3 million at December 31, 2017. The Company’s investment in VIEs is included in other invested assets on the consolidated balance sheet with changes in fair value recorded in the consolidated statements of operations.
6. Derivative Instruments
Interest rate swaps are used by the Company primarily to reduce risks from changes in interest rates. Under the terms of the interest rate swaps, the Company agrees with another party to exchange, at specified intervals, the difference between fixed rate and floating rate interest amounts as calculated by reference to an agreed notional amount.
The Company accounts for the interest rate swaps as non-hedge instruments and recognizes the fair value of the interest rate swaps in other assets or other liabilities on the consolidated balance sheets with the changes in fair value recognized as net realized investment gains in the consolidated statements of operations. The Company is ultimately responsible for the valuation of the interest rate swaps. To aid in determining the estimated fair value of the interest rate swaps, the Company relies on the forward interest rate curve and information obtained from a third party financial institution.
The following table summarizes information on the location and the gross amount of the derivatives’ fair value on the consolidated balance sheets as of December 31, 2017 and 2016:
| (Dollars in thousands) | December 31, 2017 | December 31, 2016 | ||||||||||||||||||
| Derivatives Not Designated as Hedging Instruments under ASC 815 |
Balance Sheet Location |
Notional Amount |
Fair Value | Notional Amount |
Fair Value | |||||||||||||||
| Interest rate swap agreements |
Other liabilities | $ | 200,000 | $ | (7,968 | ) | $ | 200,000 | $ | (11,524 | ) | |||||||||
116
Table of Contents
The following table summarizes the net gains (losses) included in the consolidated statements of operations for changes in the fair value of the derivatives and the periodic net interest settlements under the derivatives for the years ended December 31, 2017, 2016, and 2015:
| Years Ended December 31, | ||||||||||||||
| (Dollars in thousands) | Consolidated Statements of Operations Line |
2017 | 2016 | 2015 | ||||||||||
| Interest rate swap agreements |
Net realized investment gains (losses) |
$ | (75 | ) | $ | (1,110 | ) | $ | (6,988 | ) | ||||
As of December 31, 2017 and 2016, the Company is due $3.1 million and $5.3 million, respectively, for funds it needed to post to execute the swap transaction and $9.5 million and $12.6 million, respectively, for margin calls made in connection with the interest rate swaps. These amounts are included in other assets on the consolidated balance sheets.
| 7. | Fair Value Measurements |
The accounting standards related to fair value measurements define fair value, establish a framework for measuring fair value, outline a fair value hierarchy based on inputs used to measure fair value, and enhance disclosure requirements for fair value measurements. These standards do not change existing guidance as to whether or not an instrument is carried at fair value. The Company has determined that its fair value measurements are in accordance with the requirements of these accounting standards.
The Company’s invested assets and derivative instruments are carried at their fair value and are categorized based upon a fair value hierarchy:
| • | Level 1 — inputs utilize quoted prices (unadjusted) in active markets for identical assets that the Company has the ability to access at the measurement date. |
| • | Level 2 — inputs utilize other than quoted prices included in Level 1 that are observable for similar assets, either directly or indirectly. |
| • | Level 3 — inputs are unobservable for the asset, and include situations where there is little, if any, market activity for the asset. |
In certain cases, the inputs used to measure fair value may fall into different levels of the fair value hierarchy. In such cases, the level in the fair value hierarchy within which the fair value measurement falls has been determined based on the lowest level input that is significant to the fair value measurement in its entirety. The Company’s assessment of the significance of a particular input to the fair value measurement in its entirety requires judgment, and considers factors specific to the asset.
117
Table of Contents
The following table presents information about the Company’s invested assets and derivative instruments measured at fair value on a recurring basis as of December 31, 2017 and 2016, and indicates the fair value hierarchy of the valuation techniques utilized by the Company to determine such fair value.
| As of December 31, 2017 | Fair Value Measurements | |||||||||||||||
| (Dollars in thousands) | Level 1 | Level 2 | Level 3 | Total | ||||||||||||
| Assets: |
||||||||||||||||
| Fixed maturities: |
||||||||||||||||
| U.S. treasury and agency obligations |
$ | 104,680 | $ | — | $ | — | $ | 104,680 | ||||||||
| Obligations of states and political subdivisions |
— | 95,114 | — | 95,114 | ||||||||||||
| Mortgage-backed securities |
— | 149,350 | — | 149,350 | ||||||||||||
| Commercial mortgage-backed securities |
— | 139,795 | — | 139,795 | ||||||||||||
| Asset-backed securities |
— | 203,701 | — | 203,701 | ||||||||||||
| Corporate bonds |
— | 423,390 | — | 423,390 | ||||||||||||
| Foreign corporate bonds |
— | 125,407 | — | 125,407 | ||||||||||||
|
|
|
|
|
|
|
|
|
|||||||||
| Total fixed maturities |
104,680 | 1,136,757 | — | 1,241,437 | ||||||||||||
| Common stock |
140,229 | — | — | 140,229 | ||||||||||||
|
|
|
|
|
|
|
|
|
|||||||||
| Total assets measured at fair value (1) |
$ | 244,909 | $ | 1,136,757 | $ | — | $ | 1,381,666 | ||||||||
|
|
|
|
|
|
|
|
|
|||||||||
| Liabilities: |
||||||||||||||||
| Derivative instruments |
$ | — | $ | 7,968 | $ | — | $ | 7,968 | ||||||||
|
|
|
|
|
|
|
|
|
|||||||||
| Total liabilities measured at fair value |
$ | — | $ | 7,968 | $ | — | $ | 7,968 | ||||||||
|
|
|
|
|
|
|
|
|
|||||||||
| (1) | Excluded from the table above are limited partnerships of $77.8 million at December 31, 2017 whose fair value is based on net asset value as a practical expedient. |
| As of December 31, 2016 | Fair Value Measurements | |||||||||||||||
| (Dollars in thousands) | Level 1 | Level 2 | Level 3 | Total | ||||||||||||
| Assets: |
||||||||||||||||
| Fixed maturities: |
||||||||||||||||
| U.S. treasury and agency obligations |
$ | 72,047 | $ | — | $ | — | $ | 72,047 | ||||||||
| Obligations of states and political subdivisions |
— | 156,446 | — | 156,446 | ||||||||||||
| Mortgage-backed securities |
— | 88,468 | — | 88,468 | ||||||||||||
| Commercial mortgage-backed securities |
— | 183,192 | — | 183,192 | ||||||||||||
| Asset-backed securities |
— | 233,991 | — | 233,991 | ||||||||||||
| Corporate bonds |
— | 380,027 | — | 380,027 | ||||||||||||
| Foreign corporate bonds |
— | 125,860 | — | 125,860 | ||||||||||||
|
|
|
|
|
|
|
|
|
|||||||||
| Total fixed maturities |
72,047 | 1,167,984 | — | 1,240,031 | ||||||||||||
| Common stock |
120,557 | — | — | 120,557 | ||||||||||||
|
|
|
|
|
|
|
|
|
|||||||||
| Total assets measured at fair value (1) |
$ | 192,604 | $ | 1,167,984 | $ | — | $ | 1,360,588 | ||||||||
|
|
|
|
|
|
|
|
|
|||||||||
| Liabilities: |
||||||||||||||||
| Derivative instruments |
$ | — | $ | 11,524 | $ | — | $ | 11,524 | ||||||||
|
|
|
|
|
|
|
|
|
|||||||||
| Total liabilities measured at fair value |
$ | — | $ | 11,524 | $ | — | $ | 11,524 | ||||||||
|
|
|
|
|
|
|
|
|
|||||||||
| (1) | Excluded from the table above are limited partnerships of $66.1 million at December 31, 2016 whose fair value is based on net asset value as a practical expedient. |
The securities classified as Level 1 in the above table consist of U.S. Treasuries and equity securities actively traded on an exchange.
118
Table of Contents
The securities classified as Level 2 in the above table consist primarily of fixed maturity securities and derivative instruments. Based on the typical trading volumes and the lack of quoted market prices for fixed maturities, security prices are derived through recent reported trades for identical or similar securities making adjustments through the reporting date based upon available market observable information. If there are no recent reported trades, matrix or model processes are used to develop a security price where future cash flow expectations are developed based upon collateral performance and discounted at an estimated market rate. Included in the pricing of asset-backed securities, collateralized mortgage obligations, and mortgage-backed securities are estimates of the rate of future prepayments of principal over the remaining life of the securities. Such estimates are derived based on the characteristics of the underlying structure and prepayment speeds previously experienced at the interest rate levels projected for the underlying collateral. The estimated fair value of the derivative instruments, consisting of interest rate swaps, is obtained from a third party financial institution that utilizes observable inputs such as the forward interest rate curve.
For the Company’s material debt arrangements, the current fair value of the Company’s debt at December 31, 2017 and 2016 was as follows:
| December 31, 2017 | December 31, 2016 | |||||||||||||||
| (Dollars in thousands) | Carrying Value |
Fair Value | Carrying Value |
Fair Value | ||||||||||||
| Margin Borrowing Facility |
$ | 72,230 | $ | 72,230 | $ | 66,646 | $ | 66,646 | ||||||||
| 7.75% Subordinated Notes due 2045 (1) |
96,619 | 100,059 | 96,497 | 95,697 | ||||||||||||
| 7.875% Subordinated Notes due 2047 (2) |
125,864 | 130,429 | — | — | ||||||||||||
|
|
|
|
|
|
|
|
|
|||||||||
| Total |
$ | 294,713 | $ | 302,718 | $ | 163,143 | $ | 162,343 | ||||||||
|
|
|
|
|
|
|
|
|
|||||||||
| (1) | As of December 31,2017 and 2016, the carrying value and fair value of the 7.75% Subordinated Notes due 2045 are net of unamortized debt issuance cost of $3.4 million and $3.5 million, respectively. |
| (2) | As of December 31, 2017, the carrying value and fair value of the 7.875% Subordinated Notes due 2047 are net of unamortized debt issuance cost of $4.1 million. |
The fair value of the margin borrowing facility approximates its carrying value due to the facility being due on demand. The subordinated notes due 2045 and 2047 are publicly traded instruments and are classified as Level 1 in the fair value hierarchy.
There were no transfers between Level 1 and Level 2 during the years ended December 31, 2017, 2016, and 2015.
The following table presents changes in Level 3 investments measured at fair value on a recurring basis for the year ended December 31, 2017 and 2016:
| Years Ended December 31, |
||||||||
| (Dollars in thousands) | 2017 | 2016 | ||||||
| Beginning balance |
$ | — | $ | — | ||||
| Total gains (realized / unrealized): |
||||||||
| Amortization of bond premium and discount, net |
— | 75 | ||||||
| Included in realized gains (losses) |
— | 486 | ||||||
| Purchases |
— | 27,303 | ||||||
| Sales |
— | (27,864 | ) | |||||
|
|
|
|
|
|||||
| Ending balance |
$ | — | $ | — | ||||
|
|
|
|
|
|||||
The investments classified as Level 3 in the above table consist of privately placed debt instruments purchased in 2017 with unobservable inputs. The Company does not have access to daily valuations; therefore, market trades,
119
Table of Contents
performance of the underlying assets, and key risks are considered in order to estimate fair values of these middle market corporate debt instruments. In the fourth quarter of 2016, the Company exchanged the debt instruments purchased in previous quarters of 2016, along with cash and equity related to the debt instruments, for a single interest in the Private Middle Market Loan Fund, LP, which is considered a VIE. As this investment is priced using a Net Asset Value (“NAV”) it is excluded from the level 3 investment table above. See Note 4 of the notes to the consolidated financial statements in Item 8 of Part II of this report for further information regarding the Company’s investment in VIEs for the years ended December 31, 2017 and 2016.
Fair Value of Alternative Investments
Other invested assets consist of limited liability partnerships whose fair value is based on net asset value per share practical expedient. The following table provides the fair value and future funding commitments related to these investments at December 31, 2017 and 2016.
| December 31, 2017 | December 31, 2016 | |||||||||||||||
| (Dollars in thousands) | Fair Value |
Future Funding Commitment |
Fair Value |
Future Funding Commitment |
||||||||||||
| Real Estate Fund, LP (1) |
$ | — | $ | — | $ | — | $ | — | ||||||||
| European Non-Performing Loan Fund, LP (2) |
26,262 | 14,214 | 32,922 | 15,714 | ||||||||||||
| Private Middle Market Loan Fund, LP (3) |
33,760 | 10,000 | 33,199 | 9,054 | ||||||||||||
| Distressed Debt Fund, LP (4) |
17,798 | 33,500 | — | — | ||||||||||||
|
|
|
|
|
|
|
|
|
|||||||||
| Total |
$ | 77,820 | $ | 57,714 | $ | 66,121 | $ | 24,768 | ||||||||
|
|
|
|
|
|
|
|
|
|||||||||
| (1) | This limited partnership invests in real estate assets through a combination of direct or indirect investments in partnerships, limited liability companies, mortgage loans, and lines of credit. The Company does not have the contractual option to redeem its limited partnership interest but receives distributions based on the liquidation of the underlying assets. The Company does not have the ability to sell or transfer its limited partnership interest without consent from the general partner. The Company continues to hold an investment in this limited partnership and has written the fair value down to zero. |
| (2) | This limited partnership invests in distressed securities and assets through senior and subordinated, secured and unsecured debt and equity, in both public and private large-cap and middle-market companies. The Company does not have the ability to sell or transfer its limited partnership interest without consent from the general partner. The Company does not have the contractual option to redeem its limited partnership interest but receives distributions based on the liquidation of the underlying assets. Based on the terms of the partnership agreement, the Company anticipates its interest in this partnership to be redeemed by 2020. |
| (3) | This limited partnership provides financing for middle market companies. The Company does not have the ability to sell or transfer its limited partnership interest without consent from the general partner. The Company does not have the contractual option to redeem its limited partnership interest but receives distributions based on the liquidation of the underlying assets. Based on the terms of the investment management agreement, the Company anticipates its interest to be redeemed no later than 2024. |
| (4) | This limited partnership invests in stressed and distressed debt instruments. The Company does not have the ability to sell or transfer its limited partnership interest without consent from the general partner. The Company does not have the contractual option to redeem its limited partnership interest but receives distributions based on the liquidation of the underlying assets. Based on the terms of the partnership agreement, the Company anticipates its interest to be redeemed no later than 2027. |
Limited Liability Companies and Limited Partnerships with ownership interest exceeding 3%
The Company uses the equity method to account for investments in limited liability companies and limited partnerships where its ownership interest exceeds 3%. The equity method of accounting for an investment in a limited liability company and limited partnership requires that its cost basis be updated to account for the income
120
Table of Contents
or loss earned on the investment. The investment income associated with these limited liability companies or limited partnerships, which is reflected in the consolidated statements of operations, was $4.7 million, $5.2 million, and $2.5 million for the years ended December 31, 2017, 2016, and 2015, respectively.
Pricing
The Company’s pricing vendors provide prices for all investment categories except for investments in limited partnerships whose fair value is based on net asset values as a practical expedient. Two primary vendors are utilized to provide prices for equity and fixed maturity securities.
The following is a description of the valuation methodologies used by the Company’s pricing vendors for investment securities carried at fair value:
| • | Common stock prices are received from all primary and secondary exchanges. |
| • | Corporate and agency bonds are evaluated by utilizing terms and conditions sourced from commercial vendors. Bonds with similar characteristics are grouped into specific sectors. Both asset classes use standard inputs and utilize bid price or spread, quotes, benchmark yields, discount rates, market data feeds, and financial statements. |
| • | Data from commercial vendors is aggregated with market information, then converted into a prepayment/spread/LIBOR curve model used for commercial mortgage obligations (“CMO”). CMOs are categorized with mortgage-backed securities in the tables listed above. For asset-backed securities, data derived from market information along with trustee and servicer reports is converted into spreads to interpolated benchmark curve. For both asset classes, evaluations utilize standard inputs plus new issue data, monthly payment information, and collateral performance. The evaluated pricing models incorporate discount rates, loan level information, prepayment speeds, treasury benchmarks, and LIBOR and swap curves. |
| • | For obligations of state and political subdivisions, an integrated evaluation system is used. The pricing models incorporate trades, spreads, benchmark curves, market data feeds, new issue data, and trustee reports. |
| • | U.S. treasuries are evaluated by obtaining feeds from a number of live data sources including active market makers and inter-dealer brokers. |
| • | For mortgage-backed securities, various external analytical products are utilized and purchased from commercial vendors. |
The Company performs certain procedures to validate whether the pricing information received from the pricing vendors is reasonable, to ensure that the fair value determination is consistent with accounting guidance, and to ensure that its assets are properly classified in the fair value hierarchy. The Company’s procedures include, but are not limited to:
| • | Reviewing periodic reports provided by the Investment Manager that provides information regarding rating changes and securities placed on watch. This procedure allows the Company to understand why a particular security’s market value may have changed or may potentially change. |
| • | Understanding and periodically evaluating the various pricing methods and procedures used by the Company’s pricing vendors to ensure that investments are properly classified within the fair value hierarchy. |
| • | On a quarterly basis, the Company corroborates investment security prices received from its pricing vendors by obtaining pricing from a second pricing vendor for a sample of securities. |
During 2017 and 2016, the Company has not adjusted quotes or prices obtained from the pricing vendors.
121
Table of Contents
| 8. | Goodwill and Intangible Assets |
Goodwill
As a result of acquisitions in 2015 and 2010, the Company has goodwill, within the Personal Lines segment, of $6.5 million as of December 31, 2017 and 2016. The goodwill represents the excess purchase price over the Company’s best estimate of the fair value of the assets acquired. Impairment testing performed in 2017 and 2016 did not result in impairment of the goodwill acquired.
Intangible assets
The following table presents details of the Company’s intangible assets as of December 31, 2017:
| (Dollars in thousands) Description |
Useful Life | Cost | Accumulated Amortization |
Net Value |
||||||||||||
| Trademarks |
Indefinite | $ | 4,800 | $ | — | $ | 4,800 | |||||||||
| Tradenames |
Indefinite | 4,200 | — | 4,200 | ||||||||||||
| State insurance licenses |
Indefinite | 10,000 | — | 10,000 | ||||||||||||
| Customer relationships |
15 years | 5,300 | 2,724 | 2,576 | ||||||||||||
| Agent relationships |
10 years | 900 | 270 | 630 | ||||||||||||
| Trade names |
7 years | 600 | 257 | 343 | ||||||||||||
|
|
|
|
|
|
|
|||||||||||
| $ | 25,800 | $ | 3,251 | $ | 22,549 | |||||||||||
|
|
|
|
|
|
|
|||||||||||
The following table presents details of the Company’s intangible assets as of December 31, 2016:
| (Dollars in thousands) Description |
Useful Life | Cost | Accumulated Amortization |
Net Value |
||||||||||||
| Trademarks |
Indefinite | $ | 4,800 | $ | — | $ | 4,800 | |||||||||
| Tradenames |
Indefinite | 4,200 | — | 4,200 | ||||||||||||
| State insurance licenses |
Indefinite | 10,000 | — | 10,000 | ||||||||||||
| Customer relationships |
15 years | 5,300 | 2,369 | 2,931 | ||||||||||||
| Agent relationships |
10 years | 900 | 179 | 721 | ||||||||||||
| Trade names |
7 years | 600 | 173 | 427 | ||||||||||||
|
|
|
|
|
|
|
|||||||||||
| $ | 25,800 | $ | 2,721 | $ | 23,079 | |||||||||||
|
|
|
|
|
|
|
|||||||||||
Amortization related to the Company’s definite lived intangible assets, other than VOBA, was $0.5 million, for each of the years ended December 31, 2017, 2016 and 2015. Amortization related to the Value of Business Added (“VOBA”) was $25.5 million for the year ended December 31, 2015. The Company did not have any amortization related to VOBA during the years ended December 31, 2017 or 2016.
The Company expects that amortization expense for the next five years will be as follows:
| (Dollars in thousands) | ||||
| 2018 |
$ | 529 | ||
| 2019 |
529 | |||
| 2020 |
529 | |||
| 2021 |
529 | |||
| 2022 |
443 | |||
Intangible assets with indefinite lives
As of December 31, 2017 and 2016, indefinite lived intangible assets, which are comprised of tradenames, trademarks, and state insurance licenses, were $19.0 million. The Company reviewed internal business unit
122
Table of Contents
results, the growth of competitors and the overall property and casualty insurance market for indicators of impairment of its indefinite lived intangible assets. Impairment testing performed in 2017 and 2016 indicated that there was no impairment of these assets.
Intangible assets with definite lives
As of December 31, 2017 and 2016, definite lived intangible assets, net of accumulated amortization, were $3.5 million and $4.1 million, respectively, and were comprised of customer relationships, agent relationships, and tradenames. The Company reviewed internal business unit results, the growth of competitors and the overall property and casualty insurance market for indicators of impairment of its definite lived intangible assets. There was no impairment of these assets in 2017 or 2016.
| 9. | Reinsurance |
The Company cedes risk to unrelated reinsurers on a pro rata (“quota share”) and excess of loss basis in the ordinary course of business to limit its net loss exposure on insurance contracts. Reinsurance ceded arrangements do not discharge the Company of primary liability. Moreover, reinsurers may fail to pay the Company due to a lack of reinsurer liquidity, perceived improper underwriting, and losses for risks that are excluded from reinsurance coverage and other similar factors, all of which could adversely affect the Company’s financial results.
The Company had the following reinsurance balances as of December 31, 2017 and 2016:
| (Dollars in thousands) | December 31, 2017 |
December 31, 2016 |
||||||
| Reinsurance receivables, net |
$ | 105,060 | $ | 143,774 | ||||
| Collateral securing reinsurance receivables |
(6,584 | ) | (13,865 | ) | ||||
|
|
|
|
|
|||||
| Reinsurance receivables, net of collateral |
$ | 98,476 | $ | 129,909 | ||||
|
|
|
|
|
|||||
| Allowance for uncollectible reinsurance receivables |
$ | 8,040 | $ | 8,040 | ||||
| Prepaid reinsurance premiums |
28,851 | 42,583 | ||||||
The reinsurance receivables above are net of a purchase accounting adjustment related to discounting acquired loss reserves to their present value and applying a risk margin to the discounted reserves. This adjustment was $1.2 million and $2.0 million at December 31, 2017 and 2016, respectively.
As of December 31, 2017, the Company had one aggregate unsecured reinsurance receivable that exceeded 3% of shareholders’ equity from the following reinsurer. Unsecured reinsurance receivables include amounts receivable for paid and unpaid losses and loss adjustment expenses, less amounts secured by collateral.
| (Dollars in thousands) | Reinsurance Receivables |
A.M. Best Ratings (As of December 31, 2017) |
||||||
| Munich Re America Corporation |
$ | 48,222 | A+ | |||||
123
Table of Contents
The effect of reinsurance on premiums written and earned is as follows:
| (Dollars in thousands) | Written | Earned | ||||||
| For the year ended December 31, 2017: |
||||||||
| Direct business |
$ | 433,922 | $ | 440,109 | ||||
| Reinsurance assumed |
82,412 | 77,811 | ||||||
| Reinsurance ceded (1) |
(66,154 | ) | (79,886 | ) | ||||
|
|
|
|
|
|||||
| Net premiums |
$ | 450,180 | $ | 438,034 | ||||
|
|
|
|
|
|||||
| For the year ended December 31, 2016: |
||||||||
| Direct business |
$ | 468,046 | $ | 466,750 | ||||
| Reinsurance assumed |
97,799 | 98,267 | ||||||
| Reinsurance ceded (1) |
(94,905 | ) | (96,552 | ) | ||||
|
|
|
|
|
|||||
| Net premiums |
$ | 470,940 | $ | 468,465 | ||||
|
|
|
|
|
|||||
| For the year ended December 31, 2015: |
||||||||
| Direct business |
$ | 458,185 | $ | 452,441 | ||||
| Reinsurance assumed |
132,048 | 144,554 | ||||||
| Reinsurance ceded (1) |
(88,989 | ) | (92,852 | ) | ||||
|
|
|
|
|
|||||
| Net premiums |
$ | 501,244 | $ | 504,143 | ||||
|
|
|
|
|
|||||
| (1) | Includes ceded written premiums of ($1.3) million, $35.3 million, and $55.8 million and ceded earned premiums of $13.5 million, $43.2 million and $59.5 million to American Bankers Insurance Company for the years ended December 31, 2017, 2016, and 2015, respectively. |
| 10. | Income Taxes |
As of December 31, 2017, the statutory income tax rates of the countries where the Company conducts or conducted business are 35% in the United States, 0% in Bermuda, 0% in the Cayman Islands, 0% in Gibraltar, 27.08% in the Duchy of Luxembourg (for Luxembourg City), 0.25% to 2.5% in Barbados, and 25% on non-trading income, 33% on capital gains and 12.5% on trading income in the Republic of Ireland. The statutory income tax rate of each country is applied against the annual taxable income of each country to calculate the annual income tax expense.
124
Table of Contents
The Company’s income before income taxes from its non-U.S. subsidiaries and U.S. subsidiaries, including the results of the quota share between Global Indemnity Reinsurance and the Insurance Operations, for the years ended December 31, 2017, 2016, and 2015 were as follows:
| Year Ended December 31, 2017: (Dollars in thousands) |
Non-U.S. Subsidiaries |
U.S. Subsidiaries |
Eliminations | Total | ||||||||||||
| Revenues: |
||||||||||||||||
| Gross premiums written |
$ | 212,386 | $ | 462,453 | $ | (158,505 | ) | $ | 516,334 | |||||||
|
|
|
|
|
|
|
|
|
|||||||||
| Net premiums written |
$ | 212,432 | $ | 237,748 | $ | — | $ | 450,180 | ||||||||
|
|
|
|
|
|
|
|
|
|||||||||
| Net premiums earned |
$ | 201,165 | $ | 236,869 | $ | — | $ | 438,034 | ||||||||
| Net investment income |
56,890 | 24,609 | (42,176 | ) | 39,323 | |||||||||||
| Net realized investment gains (losses) |
(641 | ) | 2,217 | — | 1,576 | |||||||||||
| Other income |
216 | 6,366 | — | 6,582 | ||||||||||||
|
|
|
|
|
|
|
|
|
|||||||||
| Total revenues |
257,630 | 270,061 | (42,176 | ) | 485,515 | |||||||||||
| Losses and Expenses: |
||||||||||||||||
| Net losses and loss adjustment expenses |
94,903 | 174,309 | — | 269,212 | ||||||||||||
| Acquisition costs and other underwriting expenses |
89,153 | 94,580 | — | 183,733 | ||||||||||||
| Corporate and other operating expenses |
17,399 | 8,315 | — | 25,714 | ||||||||||||
| Interest expense |
16,740 | 42,342 | (42,176 | ) | 16,906 | |||||||||||
|
|
|
|
|
|
|
|
|
|||||||||
| Income (loss) before income taxes |
$ | 39,435 | $ | (49,485 | ) | $ | — | $ | (10,050 | ) | ||||||
|
|
|
|
|
|
|
|
|
|||||||||
| Year Ended December 31, 2016: (Dollars in thousands) |
Non-U.S. Subsidiaries |
U.S. Subsidiaries |
Eliminations | Total | ||||||||||||
| Revenues: |
||||||||||||||||
| Gross premiums written |
$ | 201,726 | $ | 506,061 | $ | (141,942 | ) | $ | 565,845 | |||||||
|
|
|
|
|
|
|
|
|
|||||||||
| Net premiums written |
$ | 201,690 | $ | 269,250 | $ | — | $ | 470,940 | ||||||||
|
|
|
|
|
|
|
|
|
|||||||||
| Net premiums earned |
$ | 212,325 | $ | 256,140 | $ | — | $ | 468,465 | ||||||||
| Net investment income |
48,807 | 19,341 | (34,165 | ) | 33,983 | |||||||||||
| Net realized investment gains (losses) |
(89 | ) | 21,810 | — | 21,721 | |||||||||||
| Other income (loss) |
(224 | ) | 10,569 | — | 10,345 | |||||||||||
|
|
|
|
|
|
|
|
|
|||||||||
| Total revenues |
260,819 | 307,860 | (34,165 | ) | 534,514 | |||||||||||
| Losses and Expenses: |
||||||||||||||||
| Net losses and loss adjustment expenses |
95,812 | 168,191 | — | 264,003 | ||||||||||||
| Acquisition costs and other underwriting expenses |
94,749 | 101,901 | — | 196,650 | ||||||||||||
| Corporate and other operating expenses |
9,035 | 8,303 | — | 17,338 | ||||||||||||
| Interest expense |
8,312 | 34,758 | (34,165 | ) | 8,905 | |||||||||||
|
|
|
|
|
|
|
|
|
|||||||||
| Income (loss) before income taxes |
$ | 52,911 | $ | (5,293 | ) | $ | — | $ | 47,618 | |||||||
|
|
|
|
|
|
|
|
|
|||||||||
125
Table of Contents
| Year Ended December 31, 2015: (Dollars in thousands) |
Non-U.S. Subsidiaries |
U.S. Subsidiaries |
Eliminations | Total | ||||||||||||
| Revenues: |
||||||||||||||||
| Gross premiums written |
$ | 345,392 | $ | 540,500 | $ | (295,659 | ) | $ | 590,233 | |||||||
|
|
|
|
|
|
|
|
|
|||||||||
| Net premiums written |
$ | 345,342 | $ | 155,902 | $ | — | $ | 501,244 | ||||||||
|
|
|
|
|
|
|
|
|
|||||||||
| Net premiums earned |
$ | 283,448 | $ | 220,695 | $ | — | $ | 504,143 | ||||||||
| Net investment income |
44,534 | 18,011 | (27,936 | ) | 34,609 | |||||||||||
| Net realized investment losses |
(1,039 | ) | (2,335 | ) | — | (3,374 | ) | |||||||||
| Other income (loss) |
(93 | ) | 3,493 | — | 3,400 | |||||||||||
|
|
|
|
|
|
|
|
|
|||||||||
| Total revenues |
326,850 | 239,864 | (27,936 | ) | 538,778 | |||||||||||
| Losses and Expenses: |
||||||||||||||||
| Net losses and loss adjustment expenses |
141,444 | 133,924 | — | 275,368 | ||||||||||||
| Acquisition costs and other underwriting expenses |
122,999 | 78,304 | — | 201,303 | ||||||||||||
| Corporate and other operating expenses |
5,928 | 18,520 | — | 24,448 | ||||||||||||
| Interest expense |
4,492 | 28,357 | (27,936 | ) | 4,913 | |||||||||||
|
|
|
|
|
|
|
|
|
|||||||||
| Income (loss) before income taxes |
$ | 51,987 | $ | (19,241 | ) | $ | — | $ | 32,746 | |||||||
|
|
|
|
|
|
|
|
|
|||||||||
The following table summarizes the components of income tax expense (benefit):
| Years Ended December 31, | ||||||||||||
| (Dollars in thousands) | 2017 | 2016 | 2015 | |||||||||
| Current income tax expense (benefit): |
||||||||||||
| Foreign |
$ | 392 | $ | 330 | $ | 263 | ||||||
| U.S. Federal |
127 | 147 | (1,785 | ) | ||||||||
|
|
|
|
|
|
|
|||||||
| Total current income tax expense (benefit) |
519 | 477 | (1,522 | ) | ||||||||
| Deferred income tax expense (benefit): |
||||||||||||
| U.S. tax rate change |
17,524 | — | — | |||||||||
| U.S. Federal |
(18,542 | ) | (2,727 | ) | (7,201 | ) | ||||||
|
|
|
|
|
|
|
|||||||
| Total deferred income tax (benefit) |
(1,018 | ) | (2,727 | ) | (7,201 | ) | ||||||
|
|
|
|
|
|
|
|||||||
| Total income tax (benefit) |
$ | (499 | ) | $ | (2,250 | ) | $ | (8,723 | ) | |||
|
|
|
|
|
|
|
|||||||
The weighted average expected tax provision has been calculated using income (loss) before income taxes in each jurisdiction multiplied by that jurisdiction’s applicable statutory tax rate.
126
Table of Contents
The following table summarizes the differences between the tax provision for financial statement purposes and the expected tax provision at the weighted average tax rate:
| Years Ended December 31, | ||||||||||||||||||||||||
| 2017 | 2016 | 2015 | ||||||||||||||||||||||
| (Dollars in thousands) | Amount | % of Pre- Tax Income |
Amount | % of Pre- Tax Income |
Amount | % of Pre- Tax Income |
||||||||||||||||||
| Expected tax provision at weighted average |
$ | (16,928 | ) | (168.4 | %) | $ | (1,496 | ) | (3.1 | %) | $ | (6,434 | ) | (19.6 | %) | |||||||||
| Adjustments: |
||||||||||||||||||||||||
| Tax exempt interest |
(213 | ) | (2.1 | ) | (394 | ) | (0.8 | ) | (441 | ) | (1.3 | ) | ||||||||||||
| Dividend exclusion |
(571 | ) | (5.7 | ) | (617 | ) | (1.3 | ) | (784 | ) | (2.4 | ) | ||||||||||||
| Tax rate change |
17,524 | 174.4 | — | — | — | — | ||||||||||||||||||
| Other |
(311 | ) | (3.2 | ) | 257 | 0.5 | (1,064 | ) | (3.3 | ) | ||||||||||||||
|
|
|
|
|
|
|
|
|
|
|
|
|
|||||||||||||
| Effective income tax benefit |
$ | (499 | ) | (5.0 | %) | $ | (2,250 | ) | (4.7 | %) | $ | (8,723 | ) | (26.6 | %) | |||||||||
|
|
|
|
|
|
|
|
|
|
|
|
|
|||||||||||||
The effective income tax benefit rate for 2017 was 5.0%, compared with an effective income tax benefit rate of 4.7% and 26.6% for 2016 and 2015, respectively. The increase in the effective income tax benefit rate in 2017 compared to 2016 is due to incurring a provisional tax expense of $17.5 million related to the reduction in the deferred tax asset as a result of the TCJA enacted on December 22, 2017 which lowered the U.S. tax rate from 35% to 21% offset by $18.4 million tax benefit due to an increase in losses incurred in the Company’s U.S. operations for 2017 compared to 2016. The decrease in the effective income tax benefit rate in 2016 compared to 2015 is primarily due to capital gains in 2016.
Financial results for the year ended December 31, 2017 reflect provisional amounts related to the December 22, 2017 enactment of the TCJA. These provisional estimates are based on the Company’s initial analysis and current interpretation of the legislation. Given the complexity of the legislation, anticipated guidance from the U.S. Treasury, and the potential for additional guidance from the Securities and Exchange Commission or the Financial Accounting Standards Board, these estimates may be adjusted during 2018.
127
Table of Contents
The tax effects of temporary differences that give rise to significant portions of the net deferred tax assets at December 31, 2017 and 2016 are presented below:
| (Dollars in thousands) | 2017 | 2016 | ||||||
| Deferred tax assets: |
||||||||
| Discounted unpaid losses and loss adjustment expenses |
$ | 3,625 | $ | 7,015 | ||||
| Unearned premiums |
5,318 | 8,802 | ||||||
| Section 163(j) carryforward |
7,906 | 8,075 | ||||||
| Alternative minimum tax credit carryover |
— | 10,957 | ||||||
| Net operating loss carryforward |
16,323 | 3,205 | ||||||
| Partnership K1 basis differences |
130 | 238 | ||||||
| Capital gain on derivative instruments |
1,673 | 4,033 | ||||||
| Investment impairments |
1,742 | 3,419 | ||||||
| Stock options |
1,740 | 2,820 | ||||||
| Stat-to-GAAP reinsurance reserve |
1,014 | 1,337 | ||||||
| Intercompany transfers |
317 | 808 | ||||||
| Other |
3,249 | 4,986 | ||||||
|
|
|
|
|
|||||
| Total deferred tax assets |
43,037 | 55,695 | ||||||
|
|
|
|
|
|||||
| Deferred tax liabilities: |
||||||||
| Purchase accounting adjustment for American Reliable |
7,723 | 6,095 | ||||||
| Intangible assets |
2,394 | 3,942 | ||||||
| Unrealized gain on securities available-for-sale and investments in limited partnerships included in accumulated other comprehensive income |
3,105 | 352 | ||||||
| Investment basis differences |
211 | 484 | ||||||
| Deferred acquisition costs |
1,921 | 2,941 | ||||||
| Depreciation and amortization |
285 | 119 | ||||||
| Other |
1,202 | 805 | ||||||
|
|
|
|
|
|||||
| Total deferred tax liabilities |
16,841 | 14,738 | ||||||
|
|
|
|
|
|||||
| Total net deferred tax assets |
$ | 26,196 | $ | 40,957 | ||||
|
|
|
|
|
|||||
The deferred tax assets and deferred tax liabilities listed in the table above relate to temporary differences between the Company’s accounting and tax carrying values and carryforwards for its companies in the United States. The net deferred tax asset at December 31, 2017 includes a $17.5 million reduction as a result of the TCJA enacted on December 22, 2017. The new tax law reduces the Company’s U.S. corporate income tax rate from 35% to 21% effective January 1, 2018. As a result, the Company reduced its net deferred tax assets at December 31, 2017 and recorded a provisional deferred tax expense of $17.5 million increasing the effective tax rate for the year ending December 31, 2017 by 174.4%.
Management believes it is more likely than not that the remaining deferred tax assets will be completely utilized in future years. As a result, the Company has not recorded a valuation allowance at December 31, 2017 and 2016.
The Company has an alternative minimum tax (“AMT”) credit carryforward of $11.0 million as of December 31, 2017 and 2016. The TCJA repealed the corporate AMT. The AMT credit carryforward of $11.0 million was reclassed to federal income taxes receivable at December 31, 2017 and will be fully refunded by the end of 2021. The Company has a net operating loss (“NOL”) carryforward of $16.3 million as of December 31, 2017, which begins to expire in 2035 based on when the original NOL was generated. The Company’s NOL carryforward as of December 31, 2016 was $3.2 million. The Company has a Section 163(j) (“163(j)”) carryforward of
128
Table of Contents
$7.9 million and $8.1 million as of December 31, 2017 and 2016, respectively, which can be carried forward indefinitely. The 163(j) carryforward is for disqualified interest paid or accrued to a related entity that is not subject to U.S. tax.
The Company and some of its subsidiaries file income tax returns in the U.S. federal jurisdiction, and various states and foreign jurisdictions. The Company is no longer subject to U.S. federal tax examinations by tax authorities for tax years before 2014.
Should the Company’s subsidiaries that are subject to income taxes imposed by the U.S. authorities pay a dividend to their foreign affiliates, withholding taxes would apply. The Company has not recorded deferred taxes for potential withholding tax on undistributed earnings. The Company believes, although there can be no assurances, that it qualifies for treaty benefits under the Tax Convention with Luxembourg and would be subject to a 5% withholding tax if it were to pay a dividend. Determination of the unrecognized deferred tax liability related to these undistributed earnings is not practicable because of the complexities with its hypothetical calculation. The Company did not pay any dividends from a U.S. subsidiary to a foreign affiliate during 2017, 2016, or 2015.
The Company applies a more-likely-than-not recognition threshold for all tax uncertainties whereby it only recognizes those tax benefits that have a greater than 50% likelihood of being sustained upon examination by the taxing authorities. The Company had no unrecognized tax benefits during 2017 or 2016.
The Company classifies all interest and penalties related to uncertain tax positions as income tax expense. The Company did not incur any interest and penalties related to uncertain tax positions during the years ended December 31, 2017, 2016 and 2015. As of December 31, 2017, the Company did not record any liabilities for tax-related interest and penalties on its consolidated balance sheets.
129
Table of Contents
| 11. | Liability for Unpaid Losses and Loss Adjustment Expenses |
Consolidated Activity
Activity in the liability for unpaid losses and loss adjustment expenses is summarized as follows:
| Years Ended December 31, | ||||||||||||
| (Dollars in thousands) | 2017 | 2016 | 2015 | |||||||||
| Balance at beginning of period |
$ | 651,042 | $ | 680,047 | $ | 675,472 | ||||||
| Less: Ceded reinsurance receivables |
130,439 | 108,130 | 123,201 | |||||||||
|
|
|
|
|
|
|
|||||||
| Net balance at beginning of period |
520,603 | 571,917 | 552,271 | |||||||||
| Purchased reserves, gross |
19,333 | 2,007 | 89,489 | |||||||||
| Less: Purchased reserves ceded |
(29 | ) | (45 | ) | 12,800 | |||||||
|
|
|
|
|
|
|
|||||||
| Purchase reserves, net of third party reinsurance |
19,362 | 2,052 | 76,689 | |||||||||
|
|
|
|
|
|
|
|||||||
| Incurred losses and loss adjustment expenses related to: |
||||||||||||
| Current year |
323,112 | 321,255 | 310,066 | |||||||||
| Prior years |
(53,900 | ) | (57,252 | ) | (34,698 | ) | ||||||
|
|
|
|
|
|
|
|||||||
| Total incurred losses and loss adjustment expenses |
269,212 | 264,003 | 275,368 | |||||||||
|
|
|
|
|
|
|
|||||||
| Paid losses and loss adjustment expenses related to: |
||||||||||||
| Current year |
156,325 | 177,006 | 164,058 | |||||||||
| Prior years |
115,431 | 140,363 | 168,353 | |||||||||
|
|
|
|
|
|
|
|||||||
| Total paid losses and loss adjustment expenses |
271,756 | 317,369 | 332,411 | |||||||||
|
|
|
|
|
|
|
|||||||
| Net balance at end of period |
537,421 | 520,603 | 571,917 | |||||||||
| Plus: Ceded reinsurance receivables |
97,243 | 130,439 | 108,130 | |||||||||
|
|
|
|
|
|
|
|||||||
| Balance at end of period |
$ | 634,664 | $ | 651,042 | $ | 680,047 | ||||||
|
|
|
|
|
|
|
|||||||
When analyzing loss reserves and prior year development, the Company considers many factors, including the frequency and severity of claims, loss trends, case reserve settlements that may have resulted in significant development, and any other additional or pertinent factors that may impact reserve estimates.
During 2017, the Company reduced its prior accident year loss reserves by $53.9 million, which consisted of a $39.4 million decrease related to Commercial Lines, $6.6 million decrease related to Personal Lines, and a $7.9 million decrease related to Reinsurance Operations.
The $39.4 million reduction of prior accident year loss reserves related to Commercial Lines primarily consisted of the following:
| • | General Liability: A $26.9 million reduction in aggregate with $6.9 million of favorable development in the construction defect reserve category and $20.0 million of favorable development in the other general liability reserve categories. The favorable development in the construction defect reserve category recognizes lower than anticipated claims frequency and severity which led to reductions primarily in the 2005 through 2016 accident years. For the other general liability reserve categories, lower than expected claims severity was the primary driver of the favorable development mainly in the 2005 through 2014 accident years. |
| • | Professional Liability: A $5.8 million decrease in aggregate primarily reflects lower than expected claims severity in the 2006 through 2008 and 2011 through 2012 accident years. |
| • | Property: A $6.3 million reduction in aggregate with $4.0 million of favorable development in the property excluding catastrophe reserve categories and $2.3 million of favorable development in the |
130
Table of Contents
| property catastrophe reserve categories. The favorable development in the reserve categories excluding catastrophe experience reflects lower than expected claims severity in the 2011 through 2015 accident years. For the property catastrophe reserve categories, lower than anticipated claims severity was the driver of the favorable development in the 2011 through 2016 accident years. |
| • | Workers Compensation: A $0.5 million reduction primarily due to lower than expected case incurred emergence in the 2011 accident year. |
The $6.6 million reduction of prior accident year loss reserves related to Personal Lines primarily consisted of the following:
| • | Property: A $6.1 million reduction in the property reserve categories. The decrease reflects lower than expected case incurred emergence primarily in the 2016 accident year and favorable development from the Butte wildfire subrogation recovery in the 2015 accident year. |
| • | General Liability: A $0.5 million reduction reflects lower than expected case incurred emergence in the 2016 accident year, primarily in the agriculture reserve category, partially offset by adverse development in the 2015 accident year reflecting higher than anticipated case incurred emergence mainly in the dwelling reserve category. |
The $7.9 million reduction of prior accident year loss reserves related to Reinsurance Operations was primarily from the property lines for accident years 2008 through 2016. Ultimate losses were lowered in these accident years based on review of the experience reported from cedants.
During 2016, the Company reduced its prior accident year loss reserves by $57.3 million, which consisted of a $43.8 million decrease related to Commercial Lines and a $13.5 million decrease related to Reinsurance Operations.
The $43.8 million reduction of prior accident year loss reserves related to Commercial Lines primarily consisted of the following:
| • | Property: A $0.8 million increase in aggregate with a $0.5 million increase in the non-catastrophe segments and $0.3 million increase in the catastrophe segments. The increases reflect higher than expected case incurred emergence, primarily in the 2009, 2012, and 2015 accident years. The increases were partially offset by decreases in the 2008, 2011, and 2013 accident years due to better than expected case incurred emergence in those accident years. |
| • | General Liability: A $43.8 million reduction in aggregate, within the casualty lines, with $9.4 million of favorable development in the construction defect reserve category and $34.4 million of favorable development in the other general liability reserve categories. For the construction defect reserve category, lower than expected frequency and severity led to favorable development in accident years 2005 through 2015. Lower than expected claims severity was the driver of the favorable development in the other general liability reserve categories, primarily in the 2004 through 2014 accident years. |
| • | Marine: A $1.4 million decrease in accident years 2010 through 2012 was driven by less than expected case incurred emergence in these years which is primarily within the casualty lines. |
The $13.5 million reduction of prior accident year loss reserves related to Reinsurance Operations was primarily from the property lines for accident years 2010 through 2015. Ultimate losses were lowered in these accident years based on reviews of the experience reported from cedants.
During 2015, the Company reduced its prior accident year loss reserves by $34.7 million, which consisted of a $25.2 million decrease related to Commercial Lines, a $0.4 million decrease related to Personal Lines, and a $9.1 million decrease related to Reinsurance Operations.
131
Table of Contents
The $25.2 million reduction of prior accident year loss reserves related to Commercial Lines primarily consisted of the following:
| • | General Liability: A $20.4 million reduction in aggregate, within the casualty lines, with $5.9 million of favorable development in the construction defect reserve category and $14.5 million of favorable development in the other general liability reserve categories. In the construction defect reserve category, a reduction in both claims frequency and severity was observed across several accident years which contributed to the recognition of favorable development primarily in accident years 2008 through 2014. For general liability excluding construction defect, lower than expected claims severity was experienced across multiple accident years leading to the recognition of favorable development in accident years 2004 through 2014. |
| • | Professional: A $6.2 million decrease in aggregate primarily related to better than anticipated claims frequency and severity in accident years 2006 through 2011 which is within the casualty lines. |
| • | Umbrella: A $1.6 million increase related to late case incurred emergence which contributed to the recognition of adverse development primarily in accident years 1990, 1995, 2001, 2007, and 2013. There is a small portion that is related to accidents years prior to 1990. |
The $0.4 million reduction of prior accident year loss reserves related to Personal Lines primarily consisted of lower than expected case incurred emergence in the 2013 accident year.
The $9.1 million reduction of prior accident year loss reserves related to Reinsurance Operations was primarily driven by $6.8 million of favorable development in property mainly due to accident years 2011 through 2014 and $2.8 million of favorable development in the marine product mainly due to accident years 2010 and 2011, partially offset by adverse development of $1.0 million in workers compensation mainly due to accident year 2010. Ultimate losses from quota share underwriting years 2013 and prior were booked to the amount reported from cedants and reserve releases on legacy contracts due to better than anticipated case incurred emergence led to the recognition of favorable development.
Prior to 2001, the Company underwrote multi-peril business insuring general contractors, developers, and sub-contractors primarily involved in residential construction that has resulted in significant exposure to construction defect (“CD”) claims. The Company’s reserves for CD claims are established based upon management’s best estimate in consideration of known facts, existing case law and generally accepted actuarial methodologies. However, due to the inherent uncertainty concerning this type of business, the ultimate exposure for these claims may vary significantly from the amounts currently recorded. As of December 31, 2017 and 2016, gross reserves for CD claims were $43.8 million and $54.5 million, respectively, and net reserves for CD claims were $40.2 million and $48.6 million, respectively.
The Company has exposure to asbestos and environmental (“A&E”) claims. The asbestos exposure primarily arises from the sale of product liability insurance, and the environmental exposure arises from the sale of general liability and commercial multi-peril insurance. In establishing the liability for unpaid losses and loss adjustment expenses related to A&E exposures, management considers facts currently known and the current state of the law and coverage litigation. Liabilities are recognized for known claims (including the cost of related litigation) when sufficient information has been developed to indicate the involvement of a specific insurance policy, and management can reasonably estimate its liability. In addition, liabilities have been established to cover additional exposures on both known and unasserted claims. Estimates of the liabilities are reviewed and updated regularly. Case law continues to evolve for such claims, and uncertainty exists about the outcome of coverage litigation and whether past claim experience will be representative of future claim experience. Included in net unpaid losses and loss adjustment expenses as of December 31, 2017, 2016, and 2015 were IBNR reserves of $26.9 million, $26.7 million, and $26.0 million, respectively, and case reserves of approximately $3.3 million, $3.2 million, and $4.5 million, respectively, for known A&E-related claims.
132
Table of Contents
The following table shows the Company’s gross reserves for A&E losses:
| Years Ended December 31, | ||||||||||||
| (Dollars in thousands) | 2017 | 2016 | 2015 | |||||||||
| Gross reserve for A&E losses and loss adjustment expenses — beginning of period |
$ | 51,919 | $ | 53,824 | $ | 56,535 | ||||||
| Plus: Incurred losses and loss adjustment expenses — case reserves |
542 | (669 | ) | 2,666 | ||||||||
| Plus: Incurred losses and loss adjustment expenses — IBNR |
928 | 2,064 | (2,663 | ) | ||||||||
| Less: Payments |
1,516 | 3,300 | 2,714 | |||||||||
|
|
|
|
|
|
|
|||||||
| Gross reserves for A&E losses and loss adjustment expenses — end of period |
$ | 51,873 | $ | 51,919 | $ | 53,824 | ||||||
|
|
|
|
|
|
|
|||||||
The following table shows the Company’s net reserves for A&E losses:
| Years Ended December 31, | ||||||||||||
| (Dollars in thousands) | 2017 | 2016 | 2015 | |||||||||
| Net reserve for A&E losses and loss adjustment expenses — beginning of period |
$ | 29,890 | $ | 30,529 | $ | 31,185 | ||||||
| Plus: Incurred losses and loss adjustment expenses — case reserves |
769 | (125 | ) | 395 | ||||||||
| Plus: Incurred losses and loss adjustment expenses — IBNR |
198 | 631 | (394 | ) | ||||||||
| Less: Payments |
733 | 1,145 | 657 | |||||||||
|
|
|
|
|
|
|
|||||||
| Net reserves for A&E losses and loss adjustment expenses — end of period |
$ | 30,124 | $ | 29,890 | $ | 30,529 | ||||||
|
|
|
|
|
|
|
|||||||
Establishing reserves for A&E and other mass tort claims involves more judgment than other types of claims due to, among other things, inconsistent court decisions, an increase in bankruptcy filings as a result of asbestos-related liabilities, and judicial interpretations that often expand theories of recovery and broaden the scope of coverage. The insurance industry continues to receive a substantial number of asbestos-related bodily injury claims, with an increasing focus being directed toward other parties, including installers of products containing asbestos rather than against asbestos manufacturers. This shift has resulted in significant insurance coverage litigation implicating applicable coverage defenses or determinations, if any, including but not limited to, determinations as to whether or not an asbestos-related bodily injury claim is subject to aggregate limits of liability found in most comprehensive general liability policies.
As of December 31, 2017, 2016, and 2015, the survival ratio on a gross basis for the Company’s open A&E claims was 20.7 years, 13.8 years, and 15.0 years, respectively. As of December 31, 2017, 2016, and 2015, the survival ratio on a net basis for the Company’s open A&E claims was 35.6 years, 19.3 years, and 16.8 years, respectively. The survival ratio, which is the ratio of gross or net reserves to the 3-year average of annual paid claims, is a financial measure that indicates how long the current amount of gross or net reserves are expected to last based on the current rate of paid claims.
Line of Business Categories
The following is information, presented by lines of business with similar characteristics including similar payout patterns, about incurred and paid claims development as of December 31, 2017, net of reinsurance, as well as cumulative claim frequency and the total of incurred-but-not-reported liabilities included within the net incurred claims amounts. The years included represent the number of years for which claims incurred typically remain outstanding but need not exceed 10 years including the most recent report period presented.
133
Table of Contents
The information about incurred and paid claims development for the years ended December 31, 2008 to 2015, is presented as required supplementary unaudited information.
Commercial Lines
Property and Casualty Methodologies
Commercial Lines internal actuarial reserve reviews were completed for loss and allocated loss adjustment expenses (“ALAE”) separately for property excluding catastrophe experience, property catastrophes, and casualty reserve categories. The internal actuarial reserve reviews were completed with data through December, 2017. Actuarial methodologies, such as the Loss Development and Bornhuetter-Ferguson methods, were employed to develop estimates of ultimate Loss & ALAE for most reserve categories. Additional actuarial methodologies were employed to develop estimates of ultimate Loss & ALAE for mass tort and constructions defect reserve categories due to the unique characteristics of the exposures involved. Management’s ultimate selections were based on the internal actuarial review and a third party actuarial review completed during the 4th quarter of 2017. Case incurred is subtracted from the management selected ultimates to obtain the booked IBNR reserves. These methodologies are consistent with last year.
Commercial Lines cumulative claim frequency has been calculated at the claim level and includes claims closed without payment.
Commercial Lines — Property
(Dollars in thousands)
| Incurred Claims and Allocated Claims Adjustment Expenses, Net of Reinsurance For the Years Ended December 31, |
As of December 31, 2017 | |||||||||||||||||||
| Accident Year |
2015 | 2016 | 2017 | IBNR (1) | Cumulative Number of Reported Claims |
|||||||||||||||
| (unaudited) | ||||||||||||||||||||
| 2015 |
$ | 63,574 | $ | 64,722 | $ | 62,575 | $ | 2,868 | 4,649 | |||||||||||
| 2016 |
61,990 | 61,014 | 5,097 | 4,104 | ||||||||||||||||
| 2017 |
44,785 | 8,583 | 2,778 | |||||||||||||||||
|
|
|
|||||||||||||||||||
| Total |
$ | 168,374 | ||||||||||||||||||
|
|
|
|||||||||||||||||||
| (1) | Incurred-but-not-reported liabilities plus expected development on reported claims |
134
Table of Contents
Commercial Lines — Property
(Dollars in thousands)
| Cumulative Paid Claims and Allocated Claims Adjustment Expenses, Net of Reinsurance For the Years Ended December 31, |
||||||||||||
| Accident Year |
2015 | 2016 | 2017 | |||||||||
| (unaudited) | ||||||||||||
| 2015 |
$ | 41,942 | $ | 57,653 | $ | 58,926 | ||||||
| 2016 |
39,643 | 51,967 | ||||||||||
| 2017 |
28,541 | |||||||||||
|
|
|
|||||||||||
| Total |
139,434 | |||||||||||
| All outstanding liabilities before 2015, net of reinsurance |
7,635 | |||||||||||
|
|
|
|||||||||||
| Liabilities for unpaid losses and loss adjustment expenses, net of reinsurance |
$ | 36,575 | ||||||||||
|
|
|
|||||||||||
The following is required supplementary information about average historical claims duration as of December 31, 2017:
| Average Annual Percentage Payout of Incurred Claims by Age, Net of Reinsurance (Unaudited) |
||||||||||||
| Year |
1 | 2 | 3 | |||||||||
| Commercial Lines — Property |
65.2 | % | 22.7 | % | 2.0 | % | ||||||
Commercial Lines — Casualty
(Dollars in thousands)
| Incurred Claims and Allocated Claim Adjustment Expenses, Net of Reinsurance For the Years Ended December 31, |
As of December 31, 2017 |
|||||||||||||||||||||||||||||||||||||||||||||||
| Accident Year |
2008 | 2009 | 2010 | 2011 | 2012 | 2013 | 2014 | 2015 | 2016 | 2017 | IBNR (1) | Cumulative Number of Reported Claims |
||||||||||||||||||||||||||||||||||||
| (unaudited) | (unaudited) | (unaudited) | (unaudited) | (unaudited) | (unaudited) | (unaudited) | (unaudited) | |||||||||||||||||||||||||||||||||||||||||
| 2008 |
$ | 138,417 | $ | 170,855 | $ | 160,325 | $ | 149,564 | $ | 148,019 | $ | 146,142 | $ | 138,558 | $ | 134,514 | $ | 129,894 | $ | 126,924 | $ | 7,096 | 6,191 | |||||||||||||||||||||||||
| 2009 |
93,748 | 96,956 | 104,518 | 104,803 | 104,392 | 96,206 | 94,016 | 91,297 | 88,384 | 7,444 | 3,896 | |||||||||||||||||||||||||||||||||||||
| 2010 |
79,188 | 101,830 | 102,252 | 101,113 | 94,484 | 91,368 | 84,681 | 82,824 | 10,785 | 3,503 | ||||||||||||||||||||||||||||||||||||||
| 2011 |
115,441 | 117,602 | 117,288 | 115,193 | 108,720 | 96,361 | 84,269 | 5,701 | 3,741 | |||||||||||||||||||||||||||||||||||||||
| 2012 |
61,340 | 65,911 | 65,637 | 63,359 | 55,137 | 52,504 | 11,346 | 2,379 | ||||||||||||||||||||||||||||||||||||||||
| 2013 |
63,807 | 68,089 | 67,702 | 66,301 | 64,877 | 11,435 | 2,519 | |||||||||||||||||||||||||||||||||||||||||
| 2014 |
61,325 | 60,227 | 58,042 | 56,837 | 15,139 | 2,307 | ||||||||||||||||||||||||||||||||||||||||||
| 2015 |
57,262 | 56,620 | 57,775 | 17,359 | 2,010 | |||||||||||||||||||||||||||||||||||||||||||
| 2016 |
54,130 | 53,776 | 25,895 | 1,750 | ||||||||||||||||||||||||||||||||||||||||||||
| 2017 |
54,338 | 37,994 | 1,283 | |||||||||||||||||||||||||||||||||||||||||||||
|
|
|
|||||||||||||||||||||||||||||||||||||||||||||||
| Total |
$ | 722,508 | ||||||||||||||||||||||||||||||||||||||||||||||
|
|
|
|||||||||||||||||||||||||||||||||||||||||||||||
| (1) | Incurred-but-not-reported liabilities plus expected development on reported claims |
135
Table of Contents
Commercial Lines — Casualty
(Dollars in thousands)
| Cumulative Paid Claims and Allocated Claims Adjustment Expenses, Net of Reinsurance For the Years Ended December 31, |
||||||||||||||||||||||||||||||||||||||||
| Accident Year |
2008 | 2009 | 2010 | 2011 | 2012 | 2013 | 2014 | 2015 | 2016 | 2017 | ||||||||||||||||||||||||||||||
| (unaudited) | (unaudited) | (unaudited) | (unaudited) | (unaudited) | (unaudited) | (unaudited) | (unaudited) | |||||||||||||||||||||||||||||||||
| 2008 |
$ | 7,844 | $ | 34,172 | $ | 65,700 | $ | 86,889 | $ | 100,369 | $ | 110,145 | $ | 114,546 | $ | 116,246 | $ | 117,797 | $ | 118,254 | ||||||||||||||||||||
| 2009 |
5,564 | 19,154 | 37,653 | 53,738 | 65,721 | 71,108 | 75,181 | 77,771 | 79,896 | |||||||||||||||||||||||||||||||
| 2010 |
5,503 | 19,926 | 34,659 | 50,520 | 58,913 | 65,377 | 67,277 | 69,615 | ||||||||||||||||||||||||||||||||
| 2011 |
5,451 | 21,325 | 41,282 | 56,562 | 64,722 | 72,087 | 74,839 | |||||||||||||||||||||||||||||||||
| 2012 |
3,500 | 11,884 | 22,456 | 31,231 | 36,360 | 39,596 | ||||||||||||||||||||||||||||||||||
| 2013 |
6,400 | 17,881 | 29,510 | 38,438 | 46,272 | |||||||||||||||||||||||||||||||||||
| 2014 |
3,968 | 15,690 | 26,268 | 33,697 | ||||||||||||||||||||||||||||||||||||
| 2015 |
3,336 | 14,584 | 25,147 | |||||||||||||||||||||||||||||||||||||
| 2016 |
4,135 | 14,027 | ||||||||||||||||||||||||||||||||||||||
| 2017 |
4,914 | |||||||||||||||||||||||||||||||||||||||
|
|
|
|||||||||||||||||||||||||||||||||||||||
| Total |
506,257 | |||||||||||||||||||||||||||||||||||||||
| All outstanding liabilities before 2008, net of reinsurance |
|
64,830 | ||||||||||||||||||||||||||||||||||||||
|
|
|
|||||||||||||||||||||||||||||||||||||||
| Liabilities for unpaid losses and loss adjustment expenses, net of reinsurance |
|
$ | 281,081 | |||||||||||||||||||||||||||||||||||||
|
|
|
|||||||||||||||||||||||||||||||||||||||
The following is required supplementary information about average historical claims duration as of December 31, 2017:
| Average Annual Percentage Payout of Incurred Claims by Age, Net of Reinsurance (Unaudited) |
||||||||||||||||||||||||||||||||||||||||
| Year |
1 | 2 | 3 | 4 | 5 | 6 | 7 | 8 | 9 | 10 | ||||||||||||||||||||||||||||||
| Commercial Lines — Casualty |
7.2 | % | 18.3 | % | 20.3 | % | 16.5 | % | 11.0 | % | 7.3 | % | 3.4 | % | 2.4 | % | 1.8 | % | 0.4 | % | ||||||||||||||||||||
Personal Lines
Property and Casualty Methodologies
Personal Lines internal actuarial reserve reviews were completed for loss and allocated loss adjustment expenses (ALAE) separately for property excluding catastrophe experience, property catastrophes, and casualty reserve categories. The internal actuarial reserve reviews were completed with data through December, 2017. Actuarial methodologies, such as the Loss Development and Bornhuetter-Ferguson methods, were employed to develop estimates of ultimate Loss & ALAE. Management’s ultimate selections were based on the internal actuarial review and a third party actuarial review completed during the 4th quarter of 2017. Case incurred is subtracted from the management selected ultimates to obtain the booked IBNR reserves. These methodologies are consistent with last year.
Personal lines are primarily comprised of business acquired in the purchase of American Reliable, which occurred on January 1, 2015. The acquisition included the purchase of the business of the legal entity as well as additional books of business written by other Assurant entities. In addition, ceding arrangements subsequent to the date of the acquisition are not consistent with years prior to the acquisition. As a result, it is not practical, nor would it be consistent, to include information for years prior to 2015 in the development tables for Personal Lines.
Personal Lines cumulative claim frequency has been calculated at the claim level and includes claims closed without payment.
136
Table of Contents
Personal Lines — Property
(Dollars in thousands)
| Incurred Claims and Allocated Claims Adjustment Expenses, Net of Reinsurance For the Years Ended December 31, |
As of December 31, 2017 | |||||||||||||||
| Accident Year |
2016 | 2017 | IBNR (1) | Cumulative Number of Reported Claims |
||||||||||||
| 2016 |
$ | 146,571 | $ | 144,787 | 5,418 | 17,356 | ||||||||||
| 2017 |
148,016 | 15,743 | 16,384 | |||||||||||||
|
|
|
|||||||||||||||
| Total |
$ | 292,803 | ||||||||||||||
|
|
|
|||||||||||||||
| (1) | Incurred-but-not-reported liabilities plus expected development on reported claims |
Personal Lines — Property
(Dollars in thousands)
| Cumulative Paid Claims and Allocated Claims Adjustment Expenses, Net of Reinsurance |
||||||||
| For the Years Ended December 31, |
||||||||
| Accident Year |
2016 | 2017 | ||||||
| 2016 |
$ | 121,899 | $ | 138,289 | ||||
| 2017 |
114,360 | |||||||
|
|
|
|||||||
| Total |
252,649 | |||||||
| All outstanding liabilities before 2016, net of reinsurance |
4,206 | |||||||
|
|
|
|||||||
| Liabilities for unpaid losses and loss adjustment expenses, net of reinsurance |
$ | 44,360 | ||||||
|
|
|
|||||||
The following is required supplementary information about average historical claims duration as of December 31, 2017.
| Average Annual Percentage Payout of Incurred Claims by Age, Net of Reinsurance (Unaudited) |
||||||||
| Year |
1 | 2 | ||||||
| Personal Lines — Property |
80.7 | % | 11.3 | % | ||||
137
Table of Contents
Personal Lines — Casualty
(Dollars in thousands)
| Incurred Claims and Allocated Claims Adjustment Expenses, Net of Reinsurance For the Years Ended December 31, |
As of December 31, 2017 | |||||||||||||||||||
| Accident Year |
2015 | 2016 | 2017 | IBNR (1) | Cumulative Number of Reported Claims |
|||||||||||||||
| (unaudited) | ||||||||||||||||||||
| 2015 |
$ | 18,930 | $ | 20,506 | $ | 21,850 | $ | 5,059 | 1,317 | |||||||||||
| 2016 |
21,476 | 21,073 | 11,345 | 1,370 | ||||||||||||||||
| 2017 |
19,999 | 15,334 | 878 | |||||||||||||||||
|
|
|
|||||||||||||||||||
| Total |
$ | 62,922 | ||||||||||||||||||
|
|
|
|||||||||||||||||||
| (1) | Incurred-but-not-reported liabilities plus expected development on reported claims |
Personal Lines — Casualty
(Dollars in thousands)
| Cumulative Paid Claims and Allocated Claims Adjustment Expenses, Net of Reinsurance |
||||||||||||
| For the Years Ended December 31, | ||||||||||||
| Accident Year |
2015 | 2016 | 2017 | |||||||||
| (unaudited) | ||||||||||||
| 2015 |
$ | 3,439 | $ | 8,757 | $ | 12,926 | ||||||
| 2016 |
3,507 | 6,885 | ||||||||||
| 2017 |
2,132 | |||||||||||
|
|
|
|||||||||||
| Total |
21,943 | |||||||||||
| All outstanding liabilities before 2015, net of reinsurance |
11,672 | |||||||||||
|
|
|
|||||||||||
| Liabilities for unpaid losses and loss adjustment expenses, net of reinsurance |
$ | 52,651 | ||||||||||
|
|
|
|||||||||||
The following is required supplementary information about average historical claims duration as of December 31, 2017:
| Average Annual Percentage Payout of Incurred Claims by Age, Net of Reinsurance (Unaudited) |
||||||||||||
| Year |
1 | 2 | 3 | |||||||||
| Personal Lines — Casualty |
14.3 | % | 20.2 | % | 19.1 | % | ||||||
Reinsurance Lines
Property & Casualty Methodologies
Reinsurance Operations internal reserve reviews were completed for loss and allocated loss adjustment expenses (ALAE) combined for run off treaties and the current book of business. The current book of business is constituted of professional liability portfolios and retrocessions from Bermuda based companies for property
138
Table of Contents
catastrophe, marine business, and mortgage insurance. The reserve reviews were completed based on the latest data reported from the cedants which is typically on a quarter lag. Paid loss, ALAE and Case reserves, shown in the reinsurance category tables below, which are originally based in a foreign currency, are remeasured in U.S. dollars based on the Foreign Exchange (FX) rate at the date the cedant’s report. Management’s ultimate selections were based on a review of ultimates reported from the cedants, including loss emergence during the reporting period, and a third party actuarial review completed during the 4th quarter of 2017. Case incurred is subtracted from the management selected ultimates to obtain the booked IBNR reserves. These methodologies are consistent with last year.
The Company does not have direct access to claim frequency information underlying certain reinsurance contracts. As a result, the Company does not believe providing claim frequency information is practicable.
Reinsurance Lines — Property
(Dollars in thousands)
| Incurred Claims and Allocated Claim Adjustment Expenses, Net of Reinsurance For the Years Ended December 31, |
As of December 31, 2017 |
|||||||||||||||||||||||||||||||||||
| Accident Year |
2011 | 2012 | 2013 | 2014 | 2015 | 2016 | 2017 | IBNR (1) | Cumulative Number of Reported Claims |
|||||||||||||||||||||||||||
| (unaudited) | (unaudited) | (unaudited) | (unaudited) | (unaudited) | ||||||||||||||||||||||||||||||||
| 2011 |
$ | 30,963 | $ | 28,547 | $ | 26,916 | $ | 25,994 | $ | 24,994 | $ | 24,912 | $ | 24,786 | $ | 1,028 | — | |||||||||||||||||||
| 2012 |
10,388 | 10,578 | 9,279 | 8,579 | 8,497 | 8,397 | 539 | — | ||||||||||||||||||||||||||||
| 2013 |
15,153 | 9,948 | 8,197 | 6,698 | 6,345 | 753 | — | |||||||||||||||||||||||||||||
| 2014 |
21,787 | 18,861 | 14,139 | 13,590 | 1,264 | — | ||||||||||||||||||||||||||||||
| 2015 |
19,877 | 16,738 | 12,526 | 2,977 | — | |||||||||||||||||||||||||||||||
| 2016 |
23,646 | 22,485 | 10,433 | — | ||||||||||||||||||||||||||||||||
| 2017 |
43,782 | 26,239 | — | |||||||||||||||||||||||||||||||||
|
|
|
|||||||||||||||||||||||||||||||||||
| Total |
$ | 131,911 | ||||||||||||||||||||||||||||||||||
|
|
|
|||||||||||||||||||||||||||||||||||
| (1) | Incurred-but-not-reported liabilities plus expected development on reported claims |
139
Table of Contents
Reinsurance Lines — Property
(Dollars in thousands)
| Cumulative Paid Claims and Allocated Claims Adjustment Expenses, Net of Reinsurance | ||||||||||||||||||||||||||||
| For the Years Ended December 31, | ||||||||||||||||||||||||||||
| Accident Year |
2011 | 2012 | 2013 | 2014 | 2015 | 2016 | 2017 | |||||||||||||||||||||
| (unaudited) | (unaudited) | (unaudited) | (unaudited) | (unaudited) | ||||||||||||||||||||||||
| 2011 |
$ | 12,044 | $ | 19,274 | $ | 20,698 | $ | 22,060 | $ | 22,426 | $ | 22,771 | $ | 23,096 | ||||||||||||||
| 2012 |
1,127 | 5,481 | 7,221 | 7,648 | 7,527 | 7,584 | ||||||||||||||||||||||
| 2013 |
723 | 4,008 | 5,835 | 5,111 | 5,255 | |||||||||||||||||||||||
| 2014 |
2,243 | 9,035 | 10,460 | 11,182 | ||||||||||||||||||||||||
| 2015 |
742 | 5,163 | 6,768 | |||||||||||||||||||||||||
| 2016 |
2,071 | 5,704 | ||||||||||||||||||||||||||
| 2017 |
2,152 | |||||||||||||||||||||||||||
|
|
|
|||||||||||||||||||||||||||
| Total |
61,741 | |||||||||||||||||||||||||||
| All outstanding liabilities before 2011, net of reinsurance |
322 | |||||||||||||||||||||||||||
|
|
|
|||||||||||||||||||||||||||
| Liabilities for unpaid losses and loss adjustment expenses, net of reinsurance |
$ | 70,492 | ||||||||||||||||||||||||||
|
|
|
|||||||||||||||||||||||||||
The following is required supplementary information about average historical claims duration as of December 31, 2017:
| Average Annual Percentage Payout of Incurred Claims by Age, Net of Reinsurance (Unaudited) |
||||||||||||||||||||||||||||
| Year |
1 | 2 | 3 | 4 | 5 | 6 | 7 | |||||||||||||||||||||
| Reinsurance Lines — Property |
15.7 | % | 39.0 | % | 15.7 | % | 1.1 | % | 0.8 | % | 1.0 | % | 1.3 | % | ||||||||||||||
Reinsurance Lines — Casualty
(Dollars in thousands)
| Incurred Claims and Allocated Claim Adjustment Expenses, Net of Reinsurance For the Years Ended December 31, |
As of December 31, 2017 |
|||||||||||||||||||||||||||||||||||||||||||||||
| Accident Year |
2008 | 2009 | 2010 | 2011 | 2012 | 2013 | 2014 | 2015 | 2016 | 2017 | IBNR (1) | Cumulative Number of Reported Claims |
||||||||||||||||||||||||||||||||||||
| (unaudited) | (unaudited) | (unaudited) | (unaudited) | (unaudited) | (unaudited) | (unaudited) | (unaudited) | |||||||||||||||||||||||||||||||||||||||||
| 2008 |
$ | 8,906 | $ | 8,758 | $ | 8,988 | $ | 8,997 | $ | 10,167 | $ | 10,340 | $ | 10,340 | $ | 9,435 | $ | 9,835 | $ | 9,768 | $ | 291 | — | |||||||||||||||||||||||||
| 2009 |
20,706 | 23,818 | 25,444 | 30,533 | 30,850 | 31,340 | 31,419 | 31,453 | 31,514 | 386 | — | |||||||||||||||||||||||||||||||||||||
| 2010 |
41,831 | 53,279 | 57,916 | 62,628 | 61,062 | 61,792 | 60,701 | 60,573 | 2,015 | — | ||||||||||||||||||||||||||||||||||||||
| 2011 |
45,726 | 48,846 | 44,692 | 47,980 | 46,510 | 43,657 | 42,968 | 2,122 | — | |||||||||||||||||||||||||||||||||||||||
| 2012 |
15,865 | 15,624 | 17,123 | 17,579 | 17,360 | 17,348 | 1,113 | — | ||||||||||||||||||||||||||||||||||||||||
| 2013 |
1,224 | 1,262 | 1,172 | 1,013 | 974 | 870 | — | |||||||||||||||||||||||||||||||||||||||||
| 2014 |
1,988 | 2,095 | 2,060 | 1,957 | 1,954 | — | ||||||||||||||||||||||||||||||||||||||||||
| 2015 |
2,908 | 2,911 | 2,780 | 2,779 | — | |||||||||||||||||||||||||||||||||||||||||||
| 2016 |
3,627 | 3,627 | 3,627 | — | ||||||||||||||||||||||||||||||||||||||||||||
| 2017 |
4,358 | 4,358 | — | |||||||||||||||||||||||||||||||||||||||||||||
|
|
|
|||||||||||||||||||||||||||||||||||||||||||||||
| Total |
$ | 175,867 | ||||||||||||||||||||||||||||||||||||||||||||||
|
|
|
|||||||||||||||||||||||||||||||||||||||||||||||
| (1) | Incurred-but-not-reported liabilities plus expected development on reported claims |
140
Table of Contents
Reinsurance Lines — Casualty
(Dollars in thousands)
| Cumulative Paid Claims and Allocated Claims Adjustment Expenses, Net of Reinsurance For the Years Ended December 31, |
||||||||||||||||||||||||||||||||||||||||
| Accident Year |
2008 | 2009 | 2010 | 2011 | 2012 | 2013 | 2014 | 2015 | 2016 | 2017 | ||||||||||||||||||||||||||||||
| (unaudited) | (unaudited) | (unaudited) | (unaudited) | (unaudited) | (unaudited) | (unaudited) | (unaudited) | |||||||||||||||||||||||||||||||||
| 2008 |
$ | — | $ | 627 | $ | 1,955 | $ | 5,149 | $ | 5,648 | $ | 6,832 | $ | 8,713 | $ | 8,875 | $ | 8,919 | $ | 8,981 | ||||||||||||||||||||
| 2009 |
1,986 | 9,759 | 11,064 | 12,597 | 13,652 | 15,104 | 30,141 | 31,019 | 31,128 | |||||||||||||||||||||||||||||||
| 2010 |
10,185 | 21,447 | 30,754 | 36,090 | 39,123 | 55,315 | 55,848 | 56,960 | ||||||||||||||||||||||||||||||||
| 2011 |
7,968 | 20,072 | 28,495 | 36,020 | 38,907 | 39,815 | 40,079 | |||||||||||||||||||||||||||||||||
| 2012 |
5,312 | 9,435 | 11,658 | 15,534 | 15,696 | 15,790 | ||||||||||||||||||||||||||||||||||
| 2013 |
123 | 50 | 62 | 65 | 65 | |||||||||||||||||||||||||||||||||||
| 2014 |
88 | 47 | 50 | 1 | ||||||||||||||||||||||||||||||||||||
| 2015 |
107 | 128 | 1 | |||||||||||||||||||||||||||||||||||||
| 2016 |
— | — | ||||||||||||||||||||||||||||||||||||||
| 2017 |
— | |||||||||||||||||||||||||||||||||||||||
|
|
|
|||||||||||||||||||||||||||||||||||||||
| Total |
153,005 | |||||||||||||||||||||||||||||||||||||||
| All outstanding liabilities before 2008, net of reinsurance |
1,210 | |||||||||||||||||||||||||||||||||||||||
|
|
|
|||||||||||||||||||||||||||||||||||||||
| Liabilities for unpaid losses and loss adjustment expenses, net of reinsurance |
$ | 24,072 | ||||||||||||||||||||||||||||||||||||||
|
|
|
|||||||||||||||||||||||||||||||||||||||
The following is required supplementary information about average historical claims duration as of December 31, 2017:
| Average Annual Percentage Payout of Incurred Claims by Age, Net of Reinsurance (Unaudited) |
||||||||||||||||||||||||||||||||||||||||
| Year |
1 | 2 | 3 | 4 | 5 | 6 | 7 | 8 | 9 | 10 | ||||||||||||||||||||||||||||||
| Reinsurance Lines — Casualty |
9.3 | % | 10.3 | % | 7.8 | % | 12.0 | % | 3.5 | % | 9.2 | % | 17.1 | % | 2.1 | % | 0.4 | % | 0.6 | % | ||||||||||||||||||||
141
Table of Contents
The reconciliation of the net incurred and paid claims development tables to the liability for unpaid losses and loss adjustment expenses in the consolidated balance sheets as of December 31, 2017 is as follows:
| Net outstanding liabilities |
||||
| Commercial Lines — Property |
$ | 36,575 | ||
| Commercial Lines — Casualty |
281,081 | |||
| Personal Lines — Property |
44,360 | |||
| Personal Lines — Casualty |
52,651 | |||
| Reinsurance Lines — Property |
70,492 | |||
| Reinsurance Lines — Casualty |
24,072 | |||
|
|
|
|||
| Liabilities for unpaid losses and loss adjustment expenses, net of reinsurance |
509,231 | |||
|
|
|
|||
| Reinsurance recoverable on unpaid claims |
||||
| Commercial Lines — Property |
8,508 | |||
| Commercial Lines — Casualty |
68,786 | |||
| Personal Lines — Property |
10,608 | |||
| Personal Lines — Casualty |
7,718 | |||
| Reinsurance Lines — Property |
— | |||
| Reinsurance Lines — Casualty |
71 | |||
|
|
|
|||
| Total reinsurance recoverable on unpaid claims |
95,691 | |||
|
|
|
|||
| Other outstanding liabilities |
||||
| Commercial Lines |
||||
| Ceded Allowance |
8,040 | |||
| Unallocated claims adjustment expenses |
16,930 | |||
| Purchase accounting adjustment |
(1,200 | ) | ||
| Loss Clearing |
322 | |||
| Personal Lines |
||||
| Fronted business ceded to Assurant |
2,752 | |||
| Unallocated claims adjustment expenses |
2,190 | |||
| Loss Clearing |
(25 | ) | ||
| Reinsurance Lines |
||||
| Unallocated claims adjustment expenses |
987 | |||
| Other |
(254 | ) | ||
|
|
|
|||
| Total other outstanding liabilities |
29,742 | |||
|
|
|
|||
| Total gross liability for unpaid losses and loss adjustment expenses |
$ | 634,664 | ||
|
|
|
| 12. | Debt |
The Company’s outstanding debt consisted of the following at December 31, 2017 and 2016:
| December 31, | ||||||||
| (Dollars in thousands) | 2017 | 2016 | ||||||
| Margin Borrowing Facility |
$ | 72,230 | $ | 66,646 | ||||
| 7.75% Subordinated Notes due 2045 |
96,619 | 96,497 | ||||||
| 7.875% Subordinated Notes due 2047 |
125,864 | — | ||||||
|
|
|
|
|
|||||
| Total |
$ | 294,713 | $ | 163,143 | ||||
|
|
|
|
|
|||||
142
Table of Contents
Margin Borrowing Facility
The Company has available a margin borrowing facility. At December 31, 2017, the borrowing rate for this facility was tied to the Fed Funds Effective rate and was approximately 1.6%. At December 31, 2016, the borrowing rate for this facility was tied to LIBOR and was approximately 1.6%. This facility is due on demand. The borrowings are subject to maintenance margin, which is a minimum account balance that must be maintained. A decline in market conditions could require an additional deposit of collateral. As of December 31, 2017, approximately $88.0 million in securities were deposited as collateral to support borrowings. The amount borrowed against the margin account may fluctuate as routine investment transactions, such as dividends received, investment income received, maturities and pay-downs, impact cash balances. The margin facility contains customary events of default, including, without limitation, insolvency, failure to make required payments, failure to comply with any representations or warranties, failure to adequately assure future performance, and failure of a guarantor to perform under its guarantee. The amount outstanding on the Company’s margin borrowing facility was $72.2 million and $66.6 million as of December 31, 2017 and 2016, respectively.
The Company recorded interest expense related to the Margin Borrowing Facility of approximately $1.0 million, $1.0 million, and $1.9 million for the years ended December 31, 2017, 2016, and 2015, respectively.
7.75% Subordinated Notes due 2045
On August 12, 2015, the Company issued $100.0 million in aggregate principal amount of its 2045 Subordinated Notes through an underwritten public offering (the “2045 Notes”).
The 2045 Notes bear interest at an annual rate equal to 7.75%, payable quarterly in arrears on February 15, May 15, August 15, and November 15 of each year, commencing November 15, 2015. The 2045 Notes mature on August 15, 2045. The Company has the right to redeem the 2045 Notes in $25 increments, in whole or in part, on and after August 15, 2020, or on any interest payment date thereafter, at a redemption price equal to 100% of the principal amount of the 2045 Notes being redeemed plus accrued and unpaid interest to, but not including, the date of redemption.
The 2045 Notes are subordinated unsecured obligations and rank (i) senior to the Company’s existing and future capital stock, (ii) senior in right of payment to future junior subordinated debt, (iii) equally in right of payment with any unsecured, subordinated debt that the Company incurs in the future that ranks equally with the 2045 Notes, and (iv) subordinate in right of payment to any of the Company’s existing and future senior debt. In addition, the 2045 Notes are structurally subordinated to all existing and future indebtedness, liabilities and other obligations of the Company’s subsidiaries.
The 2045 Notes do not require the maintenance of any financial ratios or specified levels of net worth or liquidity, and do not contain provisions that would afford holders of the 2045 Notes protection in the event of a sudden and dramatic decline in the Company’s credit quality resulting from any highly leveraged transaction, reorganization, restructuring, merger or similar transaction involving the Company that may adversely affect holders. The 2045 Notes do not restrict the Company in any way, now or in the future, from incurring additional indebtedness, including senior indebtedness that would rank senior in right of payment to the 2045 Notes. There is no right of acceleration of maturity of the 2045 Notes in the case of default in the payment of principal, premium, if any, or interest on, the 2045 Notes or in the performance of any other obligation of the Company under the 2045 Notes or if the Company defaults on any other debt securities. Holders may accelerate payment of indebtedness on the 2045 Notes only upon the Company’s bankruptcy, insolvency or reorganization.
The Company incurred $3.7 million in deferred issuance costs associated with the 2045 Notes, which is being amortized over the term of the 2045 Notes. Interest expense, including amortization of deferred issuance costs, recognized on the 2045 Notes was $7.9 million, $7.9 million, and $3.0 million for the years ended December 31, 2017, 2016, and 2015, respectively.
143
Table of Contents
7.875% Subordinated Notes due 2047
On March 23, 2017, the Company issued Subordinated Notes due in 2047 in the aggregate principal amount of $120.0 million through an underwritten public offering (the “2047 Notes”). Pursuant to the underwriting agreement, the Company granted the underwriters a 30 day option to purchase up to an additional $18 million aggregate principal amount of the 2047 Notes solely to cover over-allotments, if any. On March 30, 2017, the underwriters exercised their over-allotment option in the amount of $10 million principal amount of the 2047 Notes. As a result, the aggregate principal amount of the 2047 Notes increased to $130.0 million. The sale of the 2047 Notes pursuant to the over-allotment option closed on March 30, 2017.
The 2047 Notes bear interest at an annual rate equal to 7.875%, payable quarterly in arrears on January 15, April 15, July 15, and October 15 of each year, commencing July 15, 2017. The 2047 Notes mature on April 15, 2047. The Company has the right to redeem the 2047 Notes in $25 increments, in whole or in part, on and after April 15, 2022, or on any interest payment date thereafter, at a redemption price equal to 100% of the principal amount of the 2047 Notes being redeemed plus accrued and unpaid interest to, but not including, the date of redemption. If the Company redeems only a portion of the 2047 Notes on any date of redemption, the Company may subsequently redeem additional 2047 Notes.
The 2047 Notes are subordinated unsecured obligations and rank (i) senior to the Company’s existing and future capital stock, (ii) senior in right of payment to future junior subordinated debt, (iii) equally in right of payment with any existing unsecured, subordinated debt that the Company has issued or may issue in the future that ranks equally with the 2047 Notes, including the Company’s 2045 Notes and (iv) subordinate in right of payment to any of the Company’s future senior debt. In addition, the 2047 Notes are structurally subordinated to all existing and future indebtedness, liabilities and other obligations of the Company’s subsidiaries including the Company’s margin borrowing facility.
The 2047 Notes do not require the maintenance of any financial ratios or specified levels of net worth or liquidity, and do not contain provisions that would afford holders of the 2047 Notes protection in the event of a sudden and dramatic decline in the Company’s credit quality resulting from any highly leveraged transaction, reorganization, restructuring, merger or similar transaction involving the Company that may adversely affect holders. The 2047 Notes do not restrict the Company in any way, now or in the future, from incurring additional indebtedness, including senior indebtedness that would rank senior in right of payment to the 2047 Notes. There is no right of acceleration of maturity of the 2047 Notes in the case of default in the payment of principal, premium, if any, or interest on, the 2047 Notes or in the performance of any other obligation of the Company under the notes or if the Company defaults on any other debt securities. Holders may accelerate payment of indebtedness on the 2047 Notes only upon the Company’s bankruptcy, insolvency or reorganization.
The Company incurred $4.2 million in deferred issuance costs associated with the 2047 Notes, which is being amortized over the term of the 2047 Notes. Interest expense, including amortization of deferred issuance costs, recognized on the 2047 Notes was $8.0 million for the year ended December 31, 2017.
144
Table of Contents
The following table represents the amounts recorded for the subordinated notes as of December 31, 2017 and 2016:
| December 31, 2017 | ||||||||||||
| Outstanding Principal |
Unamortized Debt Issuance Costs |
Net Carrying Amount |
||||||||||
| 7.75% Subordinated Notes due 2045 |
$ | 100,000 | $ | (3,381 | ) | $ | 96,619 | |||||
| 7.875% Subordinated Notes due 2047 |
130,000 | (4,136 | ) | 125,864 | ||||||||
|
|
|
|
|
|
|
|||||||
| $ | 230,000 | $ | (7,517 | ) | $ | 222,483 | ||||||
|
|
|
|
|
|
|
|||||||
| December 31, 2016 | ||||||||||||
| Outstanding Principal |
Unamortized Debt Issuance Costs |
Net Carrying Amount |
||||||||||
| 7.75% Subordinated Notes due 2045 |
$ | 100,000 | $ | (3,503 | ) | $ | 96,497 | |||||
|
|
|
|
|
|
|
|||||||
| 13. | Shareholders’ Equity |
On November 7, 2016, Global Indemnity plc, an Irish public limited company, and Global Indemnity Limited, a Cayman Islands exempted company, completed the previously disclosed scheme of arrangement under Irish law (the “Scheme of Arrangement”) that effected a transaction (the “Redomestication”) that resulted in the shareholders of Global Indemnity plc becoming shareholders of Global Indemnity Limited, and Global Indemnity plc becoming a subsidiary of Global Indemnity Limited until it was liquidated in 2017. In accordance with the terms of the Scheme of Arrangement, the following steps occurred effectively simultaneously on November 7, 2016:
| 1. | 13,463,864 shares of Global Indemnity plc A ordinary shares, par value $0.0001 per share, which represent all of the existing A ordinary shares excluding the treasury shares held by Global Indemnity plc and A shares held by Global Indemnity Limited, and 4,133,366 Global Indemnity plc B ordinary shares, par value $0.0001 per share, (together, the “Global Indemnity plc ordinary shares”) were cancelled. The treasury shares of Global Indemnity plc were not subject to the scheme. The carrying value of the Global Indemnity plc treasury shares, $103.2 million, were offset against the Additional Paid-in Capital account of Global Indemnity Limited, according to the Company’s policy regarding the treatment of treasury shares; |
| 2. | the reserves created on the cancellation of the Global Indemnity plc ordinary shares were used to issue 17,597,230 Global Indemnity plc ordinary shares to Global Indemnity Limited; and |
| 3. | in return for such issuance of new Global Indemnity plc ordinary shares to Global Indemnity Limited, Global Indemnity Limited issued 13,463,864 A ordinary shares, par value $0.0001 per share, and 4,133,366 Global Indemnity Limited B ordinary shares, par value $0.0001 per share (together the “Global Indemnity Limited ordinary shares”), to the former stockholders of Global Indemnity plc. Each shareholder received one Global Indemnity Limited A ordinary share for each Global Indemnity plc A ordinary share owned by such shareholder prior to the Scheme of Arrangement and one Global Indemnity Limited B ordinary share for each Global Indemnity plc B ordinary share owned by such shareholder prior to the Scheme of Arrangement. |
Prior to the Redomestication, the Global Indemnity plc A ordinary shares were listed on the Nasdaq Global Select Market (“Nasdaq”) under the symbol “GBLI” and registered under the Securities Exchange Act of 1934, as amended (the “Exchange Act”). In connection with the Redomestication, Global Indemnity plc requested that Nasdaq file with the U.S. Securities and Exchange Commission (the “SEC”) an application to strike the Global Indemnity plc A ordinary shares from listing on Nasdaq and the Global Indemnity plc A ordinary shares from registration under the Exchange Act.
145
Table of Contents
The Global Indemnity Limited ordinary shares are deemed registered under the Exchange Act. The Global Indemnity Limited A ordinary shares began trading on Nasdaq under the symbol “GBLI,” the same symbol under which the Global Indemnity plc ordinary shares previously traded, at the opening of Nasdaq on November 7, 2016.
Dividend Restriction
The ability of Global Indemnity Limited to pay dividends is subject to Cayman Island regulations. Under Cayman Islands law, dividends and distributions may only be made from distributable reserves or from amounts standing to the credit of the Company’s share premium account, together with any reserve established by the revaluation of the Company’s asset, subject to the ability of the Company to meet its obligations in the ordinary course as they fall due. Distributable reserves represents the accumulated realized profits and losses of Global Indemnity Limited on a standalone basis, which is $275.8 million as of December 31, 2017. Share premium represents the excess of the consideration paid upon the initial issuance of any share over the par value. As of December 31, 2017, share premium was $434.7 million. Reserves established by the revaluation of the Company’s asset were $9.0 million as of December 31, 2017. As of December 31, 2017, the maximum dividends and distributions allowable under Cayman Island law is $719.6 million.
Since the Company is a holding company and has no direct operations, its ability to pay dividends depends, in part, on the ability of its subsidiaries to pay dividends. Global Indemnity Reinsurance and the U.S. insurance subsidiaries are subject to significant regulatory restrictions limiting their ability to declare and pay dividends. See Note 19 for additional information regarding dividend limitations imposed on Global Indemnity Reinsurance and the U.S. insurance subsidiaries.
Dividend Program
During the fourth quarter of 2017, Global Indemnity announced the adoption of a dividend program. Although subject to the absolute discretion of the Board of Directors and factors, conditions, and prospects as such may exist from time to time when the Board of Directors considers the advisability of declaring a quarterly dividend, the Company currently anticipates an initial dividend rate of $0.25 per share per quarter ($1.00 per share per year).
Repurchases and Redemptions of the Company’s Ordinary Shares
The Company allows employees to surrender A ordinary shares as payment for the tax liability incurred upon the vesting of restricted stock that was issued under the Company’s share incentive plan in effect at the time of issuance. During 2017, 2016, and 2015, the Company purchased an aggregate of 29,551, 28,099 and 11,895, respectively, of surrendered A ordinary shares from its employees for $1.2 million, $0.8 million and $0.3 million, respectively. All shares purchased from employees by the Company are held as treasury stock and recorded at cost until formally retired by the company.
In 2015, the Company entered into a redemption agreement with certain affiliates of Fox Paine & Company to redeem 8,260,870 of its ordinary shares. In conjunction with the 2015 redemption, the Company acquired rights, expiring year end 2019, to redeem an additional 3,397,031 ordinary shares for $78.1 million, which amount was subject to an annual 3% increase. On December 29, 2017, Global Indemnity acquired 3,397,031 of its A ordinary shares for approximately $83.0 million in the aggregate (approximately $24.44 per share) from former investors in vehicles managed by Fox Paine & Company, LLC. See Note 12 of the notes to the consolidated financial statements in Item 8 of Part II of the Company’s 2015 Annual Report on Form 10-K for more information on the 2015 redemption.
146
Table of Contents
The following table provides information with respect to the A ordinary shares that were surrendered, repurchased, or redeemed in 2017:
| Period (1) |
Total Number of Shares Purchased or Redeemed |
Average Price Paid Per Share |
Total Number of Shares Purchased as Part of Publicly Announced Plan or Program |
Approximate Dollar Value of Shares that May Yet Be Purchased Under the Plans or Programs |
||||||||||||
| A ordinary shares: |
||||||||||||||||
| January 1-31, 2017 |
13,656 | (2) | $ | 38.21 | — | — | ||||||||||
| February 1-28, 2017 |
15,309 | (2) | $ | 40.18 | — | — | ||||||||||
| May 1-31, 2017 |
586 | (2) | $ | 38.49 | — | — | ||||||||||
| December 1-31, 2017 |
3,397,031 | $ | 24.44 | |||||||||||||
|
|
|
|
|
|
|
|
|
|||||||||
| Total |
3,426,582 | $ | 24.57 | — | ||||||||||||
|
|
|
|
|
|
|
|||||||||||
| (1) | Based on settlement date. |
| (2) | Surrendered by employees as payment of taxes withheld on the vesting of restricted stock. |
There were no B ordinary shares that were surrendered or repurchased in 2017.
The following table provides information with respect to the A ordinary shares that were surrendered or repurchased in 2016:
| Period (1) |
Total Number of Shares Purchased |
Average Price Paid Per Share |
Total Number of Shares Purchased as Part of Publicly Announced Plan or Program |
Approximate Dollar Value of Shares that May Yet Be Purchased Under the Plans or Programs |
||||||||||||
| A ordinary shares: |
||||||||||||||||
| January 1-31, 2016 |
12,410 | (2) | $ | 29.02 | — | — | ||||||||||
| February 1-29, 2016 |
15,093 | (2) | $ | 28.25 | — | — | ||||||||||
| May 1-31, 2016 |
596 | (2) | $ | 30.56 | — | — | ||||||||||
|
|
|
|
|
|
|
|||||||||||
| Total |
28,099 | $ | 28.64 | — | ||||||||||||
|
|
|
|
|
|
|
|||||||||||
| (1) | Based on settlement date. |
| (2) | Surrendered by employees as payment of taxes withheld on the vesting of restricted stock. |
There were no B ordinary shares that were surrendered or repurchased in 2016.
| 14. | Related Party Transactions |
Fox Paine & Company
As of December 31, 2017, Fox Paine & Company beneficially owned shares having approximately 83% of the Company’s total outstanding voting power. Fox Paine & Company has the right to appoint a number of the Company’s Directors equal in aggregate to the pro rata percentage of the voting shares of the Company beneficially held by Fox Paine & Company for so long as Fox Paine & Company holds an aggregate of 25% or more of the voting power in the Company. Fox Paine & Company controls the election of all of the Company’s Directors due to its controlling share ownership. The Company’s Chairman is a member of Fox Paine & Company.
The Company relies on Fox Paine & Company to provide management services and other services related to the operations of the Company. Starting in 2014, this fee is adjusted annually to reflect the percentage change in the CPI-U. Payment of the annual management fee will be deferred until a change of control or September, 2018, whichever occurs first, and is subject to an annual adjustment equal to the rate of return the Company earns on its investment portfolio. In addition, Fox Paine may propose and negotiate transaction fees with the Company
147
Table of Contents
subject to the provisions of the Company’s related party transaction policies including approval of the Company’s Audit Committee of the Board of Directors, for those services from time to time. Management fee expense of $2.2 million, $2.1 million, and $1.9 million was incurred during the years ended December 31, 2017, 2016, and 2015, respectively. As of December 31, 2017 and 2016, unpaid management fees, which were included in other liabilities on the consolidated balance sheets, were $6.8 million and $4.6 million, respectively. In addition, the Company paid an $11.0 million advisory fee to Fox Paine in connection with the redemption of 3,397,031 shares on December 29, 2017 as well as other services performed. See Note 13 for additional information on the share redemption.
During 2015, the Company reimbursed Fox Paine & Company $1.2 million for expenses related to the 2015 redemption of the Company’s ordinary shares. See Note 12 of the notes to the consolidated financial statements in Item 8 of Part II of the Company’s 2015 Annual Report on Form 10-K for more information on the 2015 redemption.
On September 17, 2017, the Company and Fox Paine entered into a confidentiality agreement whereby Fox Paine agrees to keep confidential proprietary information, as defined in the confidentiality agreement, it receives regarding the Company from time to time, including proprietary information it may receive from director or director nominees appointed by Fox Paine.
In connection with the acquisition of American Reliable, the Company agreed to pay to Fox Paine & Company an investment banking fee of 3% of the amount paid plus the additional capital required to operate American Reliable on a standalone basis and a $1.5 million investment advisory fee, which in the aggregate, totaled $6.5 million. This amount was included in corporate and other operating expenses on the Company’s Consolidated Statements of Operations during the year ended December 31, 2015. As payment for these fees, 267,702 A ordinary shares of Global Indemnity were issued under the Global Indemnity plc Share Incentive Plan in May, 2015. These shares cannot be sold until the earlier of five years after January 1, 2015 or a change of control. See Note 16 for additional information on the Company’s share incentive plans including the Global Indemnity plc Share Incentive Plan which was replaced with the Global Indemnity Limited Share Incentive Plan.
Cozen O’Connor
The Company incurred $0.7 million for legal services rendered by Cozen O’Connor during the year ended December 31, 2015. Stephen A. Cozen, the chairman of Cozen O’Connor, was a member of the Company’s Board of Directors until he resigned on December 31, 2015.
Crystal & Company
During each of the years ended December 31, 2016 and 2015, the Company incurred $0.2 million in brokerage fees to Crystal & Company, an insurance broker. James W. Crystal, the chairman and chief executive officer of Crystal & Company, was a member of the Company’s Board of Directors until he resigned on July 24, 2016.
Hiscox Insurance Company (Bermuda) Ltd.
Global Indemnity Reinsurance is a participant in two reinsurance agreements with Hiscox Insurance Company (Bermuda) Ltd. (“Hiscox Bermuda”) while Steve Green, the President of Global Indemnity Reinsurance, was a member of Hiscox Bermuda’s Board of Directors. Steve Green was a member of the Hiscox Bermuda’s Board of Directors until May, 2014. The Company estimated that the following earned premium and incurred losses related to these agreements have been assumed by Global Indemnity Reinsurance from Hiscox Bermuda:
| Years Ended December 31, | ||||||||||||
| (Dollars in thousands) | 2017 | 2016 | 2015 | |||||||||
| Assumed earned premium |
$ | 4 | $ | 27 | $ | 2,266 | ||||||
| Assumed losses and loss adjustment expenses |
(130 | ) | (527 | ) | 509 | |||||||
148
Table of Contents
Net payable balances due from Global Indemnity Reinsurance under this agreement are as follows:
| As of December 31, | ||||||||
| (Dollars in thousands) | 2017 | 2016 | ||||||
| Net payable balance |
$ | (10 | ) | $ | (107 | ) | ||
| 15. | Commitments and Contingencies |
Legal Proceedings
The Company is, from time to time, involved in various legal proceedings in the ordinary course of business. The Company maintains insurance and reinsurance coverage for such risks in amounts that it considers adequate. However, there can be no assurance that the insurance and reinsurance coverage that the Company maintains is sufficient or will be available in adequate amounts or at a reasonable cost. The Company does not believe that the resolution of any currently pending legal proceedings, either individually or taken as a whole, will have a material adverse effect on its business, results of operations, cash flows, or financial condition.
There is a greater potential for disputes with reinsurers who are in runoff. Some of the Company’s reinsurers’ have operations that are in runoff, and therefore, the Company closely monitors those relationships. The Company anticipates that, similar to the rest of the insurance and reinsurance industry, it will continue to be subject to litigation and arbitration proceedings in the ordinary course of business.
Commitments
In 2014, the Company entered into a $50 million commitment to purchase an alternative investment vehicle which is comprised of European non-performing loans. As of December 31, 2017, the Company has funded $35.8 million of this commitment leaving $14.2 million as unfunded.
In 2016, the Company entered into a $40 million commitment with an investment manager that provides financing for middle market companies. As of December 31, 2017, the Company has funded $30.0 million of this commitment leaving $10.0 million as unfunded.
In 2017, the Company entered into a $50 million commitment to purchase an alternative investment vehicle comprised of stressed and distressed debt instruments. As of December 31, 2017, the Company has funded $16.5 million of this commitment leaving $33.5 million as unfunded.
Lease Commitments
Total rental expense under operating leases for the years ended December 31, 2017, 2016, and 2015 was $3.5 million, $3.7 million, and $3.5 million, respectively. Rent expense was net of sublease income of $0.02 million and $0.07 million for the years ended December 31, 2016 and 2015, respectively. There was no sublease income for the year ended December 31, 2017. At December 31, 2017, future minimum cash payments under non-cancelable operating leases were as follows:
| (Dollars in thousands) | ||||
| 2018 |
$ | 3,147 | ||
| 2019 |
2,192 | |||
| 2020 |
127 | |||
|
|
|
|||
| Total |
$ | 5,466 | ||
|
|
|
|||
Other Commitments
The Company is party to a Management Agreement, as amended, with Fox Paine & Company, whereby in connection with certain management services provided to it by Fox Paine & Company, the Company agreed to
149
Table of Contents
pay an annual management fee to Fox Paine & Company. See Note 14 above for additional information pertaining to this management agreement.
| 16. | Share-Based Compensation Plans |
Effective January 1, 2017, the Company adopted new accounting guidance which changed several aspects of the accounting for share-based payment transactions. Under the new guidance, all excess tax benefits and tax deficiencies associated with share-based payment awards are required to be recognized as an income tax benefit or expense in net income with the corresponding cash flows recognized as an operating activity in the Consolidated Statement of Cash Flow as opposed to being reported separately as a financing activity. Excess tax benefits and deficiencies are no longer recognized in additional paid-in-capital. The new guidance removes the requirement to delay recognition of any excess tax benefit when there is no current taxes payable to which the benefit would be applied. The new guidance also allows an employer to repurchase more of an employee’s shares for tax withholding purposes without triggering liability accounting and to make a policy election to account for forfeitures as they occur, rather than estimating forfeitures upon issuance of the award.
Upon adoption of this new accounting guidance, the Company elected to retain its policy of accruing the compensation cost based on the number of awards that are expected to vest. The adoption of this accounting guidance did not result in any cumulative adjustment or restatement. The provisions of this new guidance were adopted on a prospective basis and did not have a material impact on the Company’s financial position, results of operations or cash flows.
The fair value method of accounting recognizes share-based compensation to employees and non-employee directors in the consolidated statements of operations using the grant-date fair value of the stock options and other equity-based compensation expensed over the requisite service and vesting period.
For the purpose of determining the fair value of stock option awards, the Company uses the Black-Scholes option-pricing model. An estimation of forfeitures is required when recognizing compensation expense which is then adjusted over the requisite service period should actual forfeitures differ from such estimates. Changes in estimated forfeitures are recognized through a cumulative adjustment to compensation in the period of change.
Prior to January 1, 2017, the prescribed accounting guidance required tax benefits relating to excess stock-based compensation deductions to be prospectively presented in the consolidated statements of cash flows as financing cash inflows. The tax benefit resulting from stock-based compensation deductions in excess of amounts reported for financial reporting purposes was $0.1 million and $0.05 million for the years ended December 31, 2016 and 2015, respectively.
Share Incentive Plan
On June 11, 2014, the Company’s Shareholders approved the Global Indemnity plc Share Incentive Plan (the “Plan”). The previous share incentive plan, which became effective in 2003, expired per its terms on September 5, 2013. As a result of the redomestication, the Global Indemnity plc Share Incentive Plan’s sponsorship and existing obligations with respect to awards granted and outstanding were assumed by the Company and the Global Indemnity plc Share Incentive Plan was replaced with the Global Indemnity Limited Share Incentive Plan (collectively, the “Plan”). The purpose of the Plan is to give the Company a competitive advantage in attracting and retaining officers, employees, consultants and non-employee directors by offering stock options, restricted shares and other stock-based awards. Under the Plan, the Company may grant up to 2.0 million A ordinary shares pursuant to grants under the Plan.
150
Table of Contents
Options
Award activity for stock options granted under the Plan and the weighted average exercise price per share are summarized as follows:
| Time-Based Options |
Performance- Based Options |
Total Options |
Weighted Average Exercise Price Per Share |
|||||||||||||
| Options outstanding at January 1, 2015 |
612,500 | — | 612,500 | $ | 25.38 | |||||||||||
| Options issued |
— | 200,000 | 200,000 | $ | 28.37 | |||||||||||
| Options forfeited |
— | — | — | — | ||||||||||||
| Options exercised |
— | — | — | — | ||||||||||||
| Options expired |
(12,500 | ) | — | (12,500 | ) | $ | 37.70 | |||||||||
| Options purchased by the Company |
— | — | — | — | ||||||||||||
|
|
|
|
|
|
|
|
|
|||||||||
| Options outstanding at December 31, 2015 |
600,000 | 200,000 | 800,000 | $ | 25.94 | |||||||||||
| Options issued |
— | — | — | — | ||||||||||||
| Options forfeited |
— | (200,000 | ) | (200,000 | ) | $ | 28.37 | |||||||||
| Options exercised |
— | — | — | — | ||||||||||||
| Options expired |
— | — | — | — | ||||||||||||
| Options purchased by the Company |
— | — | — | — | ||||||||||||
|
|
|
|
|
|
|
|
|
|||||||||
| Options outstanding at December 31, 2016 |
600,000 | — | 600,000 | $ | 25.13 | |||||||||||
| Options issued |
— | — | — | — | ||||||||||||
| Options forfeited |
— | — | — | — | ||||||||||||
| Options exercised |
— | — | — | — | ||||||||||||
| Options expired |
— | — | — | — | ||||||||||||
| Options purchased by the Company |
— | — | — | — | ||||||||||||
|
|
|
|
|
|
|
|
|
|||||||||
| Options outstanding at December 31, 2017 |
600,000 | — | 600,000 | 25.13 | ||||||||||||
|
|
|
|
|
|
|
|
|
|||||||||
| Options exercisable at December 31, 2017 |
300,000 | — | 300,000 | 17.87 | ||||||||||||
|
|
|
|
|
|
|
|
|
|||||||||
Of the options outstanding, there are 300,000 options that are not yet exercisable. Vesting of the options is dependent on meeting or exceeding underwriting targets. 60,000 options are related to the 2015 accident year. These options are subject to remeasurement of 2015 accident year results on December 31, 2018. As of December 31, 2017, the written premium target was not met but the targeted 2015 accident year results were met. 90,000 options are related to the 2016 accident year and are subject to remeasurement of accident year results on December 31, 2019. 150,000 options are related to the 2017 accident year and are subject to remeasurement of accident year results on December 31, 2020. As of December 31, 2017 the targeted accident year results for 2016 and 2017 were not met.
During the year ended December 31, 2015, the Company awarded 200,000 options with a strike price of $28.37 which were subsequently forfeited during the year ended December 31, 2016. There were no stock options issued in 2016 or 2017.
The Company recorded ($0.4) million, $0.3 million, and $0.4 million of compensation expense for stock options outstanding under the Plan during the years ended December 31, 2017, 2016, and 2015, respectively.
The Company did not receive any proceeds from the exercise of options during 2017, 2016 or 2015 under the Plan.
All options outstanding are fully amortized as of December 31, 2017.
151
Table of Contents
Option intrinsic values, which are the differences between the fair value of $42.02 at December 31, 2017 and the strike price of the option, are as follows:
| Number of Shares |
Weighted Average Strike Price |
Intrinsic Value | ||||||||||
| Outstanding |
600,000 | 25.13 | 10.1 million | |||||||||
| Exercisable |
300,000 | 17.87 | (1) | 7.2 million | ||||||||
| Exercised (1) |
— | — | — | |||||||||
| (1) | The intrinsic value of the exercised options is the difference between the fair market value at time of exercise and the strike price of the option. |
The options exercisable at December 31, 2017 include the following:
| Option Price |
Number of options exercisable |
|||
| $17.87 |
300,000 | |||
|
|
|
|||
| Options exercisable at December 31, 2017 |
300,000 | |||
|
|
|
|||
There were no options granted under the Plan in 2017 or 2016. The weighted average fair value of options granted under the Plan was $8.69 in 2015 using a Black-Scholes option-pricing model and the following weighted average assumptions.
| 2015 | ||||
| Dividend yield |
0.0% | |||
| Expected volatility |
31.59% | |||
| Risk-free interest rate |
1.7% | |||
| Expected option life |
5.0 years | |||
The following tables summarize the range of exercise prices of options outstanding at December 31, 2017, 2016, and 2015:
| Ranges of Exercise Prices |
Outstanding at December 31, 2017 |
Weighted Average Per Share Exercise Price |
Weighted Average Remaining Life | |||
| $17.87 — $19.99 |
300,000 | $17.87 | 3.7 years | |||
| $30.00 — $37.70 |
300,000 (1) | $32.38 | 6.1 years | |||
|
|
||||||
| Total |
600,000 | |||||
|
|
| (1) | — the weighted average per share exercise price on these shares outstanding is variable. See note below under Chief Executive Officer for additional information. |
| Ranges of Exercise Prices |
Outstanding at December 31, 2016 |
Weighted Average Per Share Exercise Price |
Weighted Average Remaining Life | |||||
| $17.87 — $19.99 |
300,000 | $17.87 | 4.7 years | |||||
| $30.00 — $37.70 |
300,000 | (1) | $32.38 | 7.1 years | ||||
|
|
|
|||||||
| Total |
600,000 | |||||||
|
|
|
|||||||
152
Table of Contents
| (1) | — the weighted average per share exercise price on these shares outstanding is variable. See note below under Chief Executive Officer for additional information. |
| Ranges of Exercise Prices |
Outstanding at December 31, 2015 |
Weighted Average Per Share Exercise Price |
Weighted Average Remaining Life | |||
| $17.87 — $19.99 |
300,000 | $17.87 | 5.7 years | |||
| $20.00 — $29.99 |
200,000 | $28.37 | 9.0 years | |||
| $30.00 — $37.70 |
300,000 (1) | $32.38 | 8.1 years | |||
|
|
||||||
| Total |
800,000 | |||||
|
|
| (1) | — the weighted average per share exercise price on these shares outstanding is variable. See note below under Chief Executive Officer for additional information. |
Restricted Shares
In addition to stock option grants, the Plan also provides for the granting of restricted shares to employees and non-employee Directors. The Company recognized compensation expense for restricted stock of $4.1 million, $3.2 million and $3.5 million for 2017, 2016, and 2015, respectively. The total unrecognized compensation expense for the non-vested restricted stock is $1.7 million at December 31, 2017, which will be recognized over a weighted average life of 1.5 years.
The following table summarizes the restricted stock grants since the 2003 inception of the original share incentive plan.
| Restricted Stock Awards | ||||||||||||
| Year |
Employees | Directors | Total | |||||||||
| Inception through 2014 |
806,762 | 441,888 | 1,248,650 | |||||||||
| 2015 |
138,507 | 36,321 | 174,828 | |||||||||
| 2016 |
121,346 | 35,185 | 156,531 | |||||||||
| 2017 |
22,503 | 27,121 | 49,624 | |||||||||
|
|
|
|
|
|
|
|||||||
| 1,089,118 | 540,515 | 1,629,633 | ||||||||||
|
|
|
|
|
|
|
|||||||
The following table summarizes the non-vested restricted shares activity for the years ended December 31, 2017, 2016, and 2015:
| Number of Shares |
Weighted Average Price Per Share |
|||||||
| Non-vested Restricted Shares at January 1, 2015 |
172,275 | $ | 23.76 | |||||
| Shares issued |
174,828 | $ | 28.24 | |||||
| Shares vested |
(70,503 | ) | $ | 25.31 | ||||
| Shares forfeited |
(16,695 | ) | $ | 24.11 | ||||
|
|
|
|||||||
| Non-vested Restricted Shares at December 31, 2015 |
259,905 | $ | 26.33 | |||||
| Shares issued |
156,531 | $ | 29.44 | |||||
| Shares vested |
(111,205 | ) | $ | 26.11 | ||||
| Shares forfeited |
(5,633 | ) | $ | 27.25 | ||||
|
|
|
|||||||
| Non-vested Restricted Shares at December 31, 2016 |
299,598 | $ | 28.02 | |||||
| Shares issued |
49,624 | $ | 39.42 | |||||
| Shares vested |
(116,111 | ) | $ | 29.75 | ||||
| Shares forfeited |
(20,299 | ) | $ | 28.63 | ||||
|
|
|
|||||||
| Non-vested Restricted Shares at December 31, 2017 |
212,812 | $ | 29.67 | |||||
|
|
|
|||||||
153
Table of Contents
Based on the terms of the Restricted Share grants, all forfeited shares revert back to the Company.
During 2015, the Company granted an aggregate of 138,507 A ordinary shares to key employees at a weighted average grant date fair value of $28.37 per share under the Plan. Of the shares granted in 2015, 10,574 were granted to the Company’s Chief Executive Officer and vest 33 1/3% on each subsequent anniversary date of the grant for a period of three years subject to an accident year true-up of bonus year underwriting results as of the third anniversary of the grant and an additional 44,058 shares were granted to the Company’s Chief Executive Officer and other key employees which vest 100% on January 1, 2018. The remaining 83,875 shares were granted to key employees and will vest as follows:
| • | 16.5% vested on January 1, 2016, 16.5% vested on January 1, 2017, and 17.0% of the granted stock will vest on January 1, 2018. |
| • | Subject to Board approval, 50% of granted stock vests 100%, no later than March 15, 2018, following a re-measurement of 2014 results as of December 31, 2017. |
During 2015, the Company granted 36,321 A ordinary shares, at a weighted average grant date fair value of $27.73 per share, to non-employee directors of the Company under the Plan.
During 2016, the Company granted an aggregate of 121,346 A ordinary shares to key employees at a weighted average grant date fair value of $28.97 per share under the Plan. Of the shares granted in 2016, 11,199 were granted to the Company’s Chief Executive Officer and vest 33 1/3% on each subsequent anniversary date of the grant for a period of three years subject to a true-up of bonus year underwriting results as of the third anniversary of the grant. 5,309 shares were granted to another key employee and were due to vest 100% on February 7, 2019. These shares were forfeited during 2017 as the key employee is no longer employed by the company. 8,253 shares were granted to other key employees and vest 33% on the first and second anniversary of the grant and vest 34% on the third anniversary of the grant contingent on meeting certain performance objectives and subject to Board approval. The remaining 96,585 shares were granted to key employees and will vest as follows:
| • | 16.5% vested on January 1, 2017. 16.5% and 17.0% of the granted stock will vest on January 1, 2018 and January 1, 2019, respectively. |
| • | Subject to Board approval, 50% of granted stock vests 100%, no later than March 15, 2019, following a re-measurement of 2015 results as of December 31, 2018. |
During 2016, the Company granted 35,185 A ordinary shares, at a weighted average grant date fair value of $31.05 per share, to non-employee directors of the Company under the Plan.
During 2017, the Company granted an aggregate of 22,503 A ordinary shares to key employees at a weighted average grant date fair value of $38.21 per share under the Plan. These shares will vest as follows:
| • | 16.5%, 16.5%, and 17.0% of the granted stock vest on January 1, 2018, January 1, 2019, and January 1, 2020, respectively. |
| • | Subject to Board approval, 50% of granted stock vests 100%, no later than March 15, 2020, following a re-measurement of 2016 results as of December 31, 2019. |
During 2017, the Company granted 27,121 A ordinary shares, at a weighted average grant date fair value of $40.42 per share, to non-employee directors of the Company under the Plan.
All of the shares granted to non-employee directors in 2017, 2016, and 2015 were fully vested but subject to certain restrictions.
Chief Executive Officer
Effective September 19, 2011, Cynthia Y. Valko was hired as the Company’s Chief Executive Officer.
154
Table of Contents
Ms. Valko’s terms of employment included two equity components including the granting of 300,000 stock options with a strike price equal to the closing price of the Company’s shares on the trading day preceding the start date, or $17.87 per share, and an annual bonus opportunity of which 50% shall be paid in restricted shares based on the market value of the Company’s shares as of December 31 of the subject bonus year. The stock options vested 33 1/3% on December 31, 2012, 2013, and 2014. The restricted shares vest 33 1/3% on each anniversary of the subject bonus year. All equity components based on performance are subject to accident year true-up of bonus year underwriting results and are subject to Board approval.
In 2014, Ms. Valko was awarded an additional 300,000 stock options. The stock options which vested as follows: 20% vested on December 31, 2015, 30% vested on December 31, 2016, and the remaining 50% vested on December 31, 2017 were based on achieving underwriting income, premium volume, and underwriting profitability targets, subject to an accident year true up on the 3rd anniversary of each such year. Vesting of the stock options is subject to continued employment. The exercise price applicable to the Stock Options is $25.00 subject to adjustment based on the Company’s average year-end tangible book value per share, the average interest rate of certain Treasury bonds and the time period elapsed between January 1, 2014 and the date the stock options are exercised. The stock options were granted under and are subject to the terms of the Plan, as amended, subject to shareholder approval of such plan to the extent required to affect such grant under the plan.
| 17. | 401(k) Plan |
The Company maintains a 401(k) defined contribution plan that covers all eligible U.S. employees. Under this plan, the Company matches 100% of the first 6% contributed by an employee. Vesting on contributions made by the Company is immediate. Total expenses for the plan were $1.9 million, $1.9 million, and $2.0 million for the years ended December 31, 2017, 2016, and 2015, respectively.
| 18. | Earnings Per Share |
Earnings per share have been computed using the weighted average number of ordinary shares and ordinary share equivalents outstanding during the period.
The following table sets forth the computation of basic and diluted earnings per share.
| Years Ended December 31, | ||||||||||||
| (Dollars in thousands, except share and per share data) |
2017 | 2016 | 2015 | |||||||||
| Net income (loss) |
$ | (9,551 | ) | $ | 49,868 | $ | 41,469 | |||||
|
|
|
|
|
|
|
|||||||
| Basic earnings per share: |
||||||||||||
| Weighted average shares outstanding — basic |
17,308,663 | 17,246,717 | 24,253,657 | |||||||||
|
|
|
|
|
|
|
|||||||
| Net income (loss) per share |
$ | (0.55 | ) | $ | 2.89 | $ | 1.71 | |||||
|
|
|
|
|
|
|
|||||||
| Diluted earnings per share: |
||||||||||||
| Weighted average shares outstanding — diluted (1) |
17,308,663 | 17,547,061 | 24,505,851 | |||||||||
|
|
|
|
|
|
|
|||||||
| Net income (loss) per share |
$ | (0.55 | ) | $ | 2.84 | $ | 1.69 | |||||
|
|
|
|
|
|
|
|||||||
| (1) | For the year ended December 31, 2017, “weighted average shares outstanding — basic” was used to calculate “diluted earnings per share” due to a net loss for the period. |
155
Table of Contents
A reconciliation of weighted average shares for basic earnings per share to weighted average shares for diluted earnings per share is as follows:
| Years Ended December 31, | ||||||||||||
| 2017 | 2016 | 2015 | ||||||||||
| Weighted average shares for basic earnings per share |
17,308,663 | 17,246,717 | 24,253,657 | |||||||||
| Non-vested restricted stock |
— | 187,526 | 148,669 | |||||||||
| Options |
— | 112,818 | 103,525 | |||||||||
|
|
|
|
|
|
|
|||||||
| Weighted average shares for diluted earnings per share |
17,308,663 | 17,547,061 | 24,505,851 | |||||||||
|
|
|
|
|
|
|
|||||||
If the Company had not incurred a loss in the year ended December 31, 2017, 17,680,209 weighted average shares would have been used to compute the diluted loss per share calculation. In addition to the basic shares, weighted average shares for the diluted calculation would have included 157,441 shares of non-vested restricted stock and 214,105 share equivalents for options.
The weighted average shares outstanding used to determine dilutive earnings per share for the years ended December 31, 2016 and 2015 do not include 300,000 and 500,000 options, respectively, which were deemed to be anti-dilutive. The year ended December 31, 2017 did not have any options that were deemed to be anti-dilutive.
| 19. | Statutory Financial Information |
GAAP differs in certain respects from Statutory Accounting Principles (“SAP”) as prescribed or permitted by the various U.S. state insurance departments. The principal differences between SAP and GAAP are as follows:
| • | Under SAP, investments in debt securities are primarily carried at amortized cost, while under GAAP the Company records its debt securities at estimated fair value. |
| • | Under SAP, policy acquisition costs, such as commissions, premium taxes, fees and other costs of underwriting policies are charged to current operations as incurred, while under GAAP such costs are deferred and amortized on a pro rata basis over the period covered by the policy. |
| • | Under SAP, certain assets designated as “Non-admitted assets” (such as prepaid expenses) are charged against surplus. |
| • | Under SAP, net deferred income tax assets are admitted following the application of specified criteria, with the resulting admitted deferred tax amount being credited directly to surplus. |
| • | Under SAP, certain premium receivables are non-admitted and are charged against surplus based upon aging criteria. |
| • | Under SAP, the costs and related receivables for guaranty funds and other assessments are recorded based on management’s estimate of the ultimate liability and related receivable settlement, while under GAAP such costs are accrued when the liability is probable and reasonably estimable and the related receivable amount is based on future premium collections or policy surcharges from in-force policies. |
| • | Under SAP, unpaid losses and loss adjustment expenses and unearned premiums are reported net of the effects of reinsurance transactions, whereas under GAAP, unpaid losses and loss adjustment expenses and unearned premiums are reported gross of reinsurance. |
| • | Under SAP, a provision for reinsurance is charged to surplus based on the authorized status of reinsurers, available collateral, and certain aging criteria, whereas under GAAP, an allowance for uncollectible reinsurance is established based on management’s best estimate of the collectability of reinsurance receivables. |
156
Table of Contents
| • | Under SAP, the tax impact of the Tax Cuts and Jobs Act enacted on December 22, 2017 is recorded through surplus, whereas under GAAP, the tax impact is recorded in the Consolidated Statements of Operations. |
The National Association of Insurance Commissioners (“NAIC”) issues model laws and regulations, many of which have been adopted by state insurance regulators, relating to: (a) risk-based capital (“RBC”) standards; (b) codification of insurance accounting principles; (c) investment restrictions; and (d) restrictions on the ability of insurance companies to pay dividends.
The Company’s U.S. insurance subsidiaries are required by law to maintain certain minimum surplus on a statutory basis, and are subject to regulations under which payment of a dividend from statutory surplus is restricted and may require prior approval of regulatory authorities. Applying the current regulatory restrictions as of December 31, 2017, the maximum amount of distributions that could be paid in 2018 by the United National insurance companies and the Penn-America insurance companies under applicable laws and regulations without regulatory approval is approximately $21.0 million and $6.3 million, respectively. The Penn-America insurance companies limitation includes $2.1 million that would be distributed to United National Insurance Company or its subsidiary Penn Independent Corporation based on the December 31, 2017 ownership percentages. American Reliable is unable to pay a distribution in 2018 without regulatory approval. During 2017, the United National Insurance Company, the Penn-America Insurance Company, and American Reliable declared and paid dividends of $17.8 million, $7.9 million, and $3.3 million, respectively. In addition, United National Insurance Company paid a $35.0 million dividend, which was previously declared in 2015, to its parent company, American Insurance Services, Inc. during the year ended December 31, 2017.
The NAIC’s RBC model provides a tool for insurance regulators to determine the levels of statutory capital and surplus an insurer must maintain in relation to its insurance and investment risks, as well as its reinsurance exposures, to assess the potential need for regulatory attention. The model provides four levels of regulatory attention, varying with the ratio of an insurance company’s total adjusted capital to its authorized control level RBC (“ACLRBC”). If a company’s total adjusted capital is:
| (a) | less than or equal to 200%, but greater than 150% of its ACLRBC (the “Company Action Level”), the company must submit a comprehensive plan to the regulatory authority proposing corrective actions aimed at improving its capital position; |
| (b) | less than or equal to 150%, but greater than 100% of its ACLRBC (the “Regulatory Action Level”), the regulatory authority will perform a special examination of the company and issue an order specifying the corrective actions that must be followed; |
| (c) | less than or equal to 100%, but greater than 70% of its ACLRBC (the “Authorized Control Level”), the regulatory authority may take any action it deems necessary, including placing the company under regulatory control; and |
| (d) | less than or equal to 70% of its ACLRBC (the “Mandatory Control Level”), the regulatory authority must place the company under its control. |
Based on the standards currently adopted, the Company reported in its 2017 statutory filings that the capital and surplus of the U.S. insurance companies are above the prescribed Company Action Level RBC requirements.
The following is selected information for the Company’s U.S. insurance companies, net of intercompany eliminations, where applicable, as determined in accordance with SAP:
| Years Ended December 31, | ||||||||||||
| (Dollars in thousands) | 2017 | 2016 | 2015 | |||||||||
| Statutory capital and surplus, as of end of period |
$ | 274,586 | $ | 323,144 | $ | 318,101 | ||||||
| Statutory net income (loss) |
($ | 19,019 | ) | 35,618 | 48,633 | |||||||
157
Table of Contents
Global Indemnity Reinsurance must also prepare annual statutory financial statements. The Bermuda Insurance Act 1978 (the “Insurance Act”) prescribes rules for the preparation and substance of these statutory financial statements which include, in statutory form, a balance sheet, an income statement, a statement of capital and surplus and notes thereto. The statutory financial statements are not prepared in accordance with GAAP or SAP and are distinct from the financial statements prepared for presentation to Global Indemnity Reinsurance’s shareholders and under the Bermuda Companies Act 1981 (the “Companies Act”), which financial statements will be prepared in accordance with GAAP.
The principal differences between statutory financial statements prepared under the Insurance Act and GAAP are as follows:
| • | Under the Insurance Act, policy acquisition costs, such as commissions, premium taxes, fees and other costs of underwriting policies are charged to current operations as incurred, while under GAAP such costs are deferred and amortized on a pro rata basis over the period covered by the policy. |
| • | Under the Insurance Act, prepaid expenses and intangible assets are charged to current operations as incurred, while under GAAP such costs are deferred and amortized on a pro rata basis. |
| • | Under the Insurance Act, unpaid losses and loss adjustment expenses and unearned premiums are reported net of the effects of reinsurance transactions, whereas under GAAP, unpaid losses and loss adjustment expenses and unearned premiums are reported gross of reinsurance. |
Under the Companies Act, Global Indemnity Reinsurance may only declare or pay a dividend if it has no reasonable grounds for believing that it is, or would after the payment be, unable to pay its liabilities as they become due, or if the realizable value of its assets would not be less than the aggregate of its liabilities and its issued share capital and share premium accounts. Global Indemnity Reinsurance is also prohibited, without the approval of the BMA, from reducing by 15% or more its total statutory capital or 25% or more of its total statutory capital and surplus as set out in its previous year’s statutory financial statements, and any application for such approval must include such information as the BMA may require. Based upon the total statutory capital plus the statutory surplus as set out in its 2017 statutory financial statements that will be filed in 2018, Global Indemnity Reinsurance could pay a dividend of up to $227.1 million without requesting BMA approval. Global Indemnity Reinsurance is dependent on receiving distributions from its subsidiaries in order to pay the full dividend in cash. In 2017, Global Indemnity Reinsurance declared a dividend of $120.0 million to its parent, Global Indemnity. Of this amount, $100.0 million was paid to Global Indemnity in December, 2017. As of December 31, 2017, accrued dividends were $20.0 million.
The following is selected information for Global Indemnity Reinsurance, net of intercompany eliminations, where applicable, as determined in accordance with the Bermuda Insurance Act 1978:
| Years Ended December 31, | ||||||||||||
| (Dollars in thousands) | 2017 | 2016 | 2015 | |||||||||
| Statutory capital and surplus, as of end of period |
$ | 908,433 | $ | 838,923 | $ | 713,842 | ||||||
| Statutory net income |
29,647 | 32,768 | 864 | |||||||||
| 20. | Segment Information |
The Company manages its business through three business segments. Commercial Lines offers specialty property and casualty products designed for product lines such as Small Business Binding Authority, Property Brokerage, and Programs. Personal Lines offers specialty personal lines and agricultural coverage. Reinsurance Operations provides reinsurance solutions through brokers and primary writers including insurance and reinsurance companies.
All three segments follow the same accounting policies used for the Company’s consolidated financial statements. For further disclosure regarding the Company’s accounting policies, please see Note 3.
158
Table of Contents
During the 1st quarter of 2017, the Company re-evaluated its Commercial Lines and Personal Lines segments and determined that certain portions of business will be managed, operated and reported by including them in the other segment. As a result, the composition of the Company’s reportable segments changed slightly. Premium that is written through a wholly owned agency that mainly sells to individuals, which was previously included as part of the Commercial Lines segment, is now included within the Personal Lines segment. In addition, one of the small commercial programs written by American Reliable Insurance Company, which was previously included within the Personal Lines segment, is now aggregated within the Commercial Lines segment. Accordingly, the segment results for 2016 and 2015 have been revised to reflect these changes.
On September 30, 2016, Diamond State Insurance Company sold all the outstanding shares of capital stock of one of its wholly owned subsidiaries, United National Specialty Insurance Company, to an unrelated party. Diamond State Insurance Company received a one-time payment of $18.7 million and recognized a pretax gain of $6.9 million which is reflected in other income in 2016. This transaction did not have an impact on the Company’s ongoing business operations. Subsequent to the sale, any business previously written by United National Specialty Insurance Company is being written by other companies within the Company’s U.S. Insurance Operations.
The following are tabulations of business segment information for the years ended December 31, 2017, 2016, and 2015. Corporate information is included to reconcile segment data to the consolidated financial statements.
| 2017: (Dollars in thousands) |
Commercial Lines (1) |
Personal Lines (1) |
Reinsurance Operations (2) |
Total | ||||||||||||
| Revenues: |
||||||||||||||||
| Gross premiums written |
$ | 212,670 | $ | 249,777 | (6) | $ | 53,887 | $ | 516,334 | |||||||
|
|
|
|
|
|
|
|
|
|||||||||
| Net premiums written |
$ | 186,448 | $ | 209,799 | $ | 53,933 | $ | 450,180 | ||||||||
|
|
|
|
|
|
|
|
|
|||||||||
| Net premiums earned |
$ | 178,798 | $ | 215,983 | $ | 43,253 | $ | 438,034 | ||||||||
| Other income |
78 | 6,288 | 216 | 6,582 | ||||||||||||
|
|
|
|
|
|
|
|
|
|||||||||
| Total revenues |
178,876 | 222,271 | 43,469 | 444,616 | ||||||||||||
|
|
|
|
|
|
|
|
|
|||||||||
| Losses and Expenses: |
||||||||||||||||
| Net losses and loss adjustment expenses |
62,834 | 165,798 | 40,580 | 269,212 | ||||||||||||
| Acquisition costs and other underwriting expenses |
75,990 | (3) | 93,113 | (4) | 14,630 | 183,733 | ||||||||||
|
|
|
|
|
|
|
|
|
|||||||||
| Income (loss) from segments |
$ | 40,052 | $ | (36,640 | ) | $ | (11,741 | ) | (8,329 | ) | ||||||
|
|
|
|
|
|
|
|||||||||||
| Unallocated Items: |
||||||||||||||||
| Net investment income |
39,323 | |||||||||||||||
| Net realized investment gains |
1,576 | |||||||||||||||
| Corporate and other operating expenses |
(25,714 | ) | ||||||||||||||
| Interest expense |
(16,906 | ) | ||||||||||||||
|
|
|
|||||||||||||||
| Loss before income taxes |
(10,050 | ) | ||||||||||||||
| Income tax benefit |
499 | |||||||||||||||
|
|
|
|||||||||||||||
| Net loss |
$ | (9,551 | ) | |||||||||||||
|
|
|
|||||||||||||||
| Total assets |
$ | 905,184 | $ | 467,525 | $ | 628,960 | (5) | $ | 2,001,669 | |||||||
|
|
|
|
|
|
|
|
|
|||||||||
| (1) | Includes business ceded to the Company’s Reinsurance Operations. |
| (2) | External business only, excluding business assumed from affiliates. |
| (3) | Includes federal excise tax of $714 relating to cessions from Commercial Lines to Reinsurance Operations. |
| (4) | Includes federal excise tax of $862 relating to cessions from Personal Lines to Reinsurance Operations. |
| (5) | Comprised of Global Indemnity Reinsurance’s total assets less its investment in subsidiaries |
159
Table of Contents
| (6) | Includes ($1,338) of business written by American Reliable that is ceded to insurance companies owned by Assurant under a 100% quota share reinsurance agreement. |
| 2016: (Dollars in thousands) |
Commercial Lines (1) |
Personal Lines (1) |
Reinsurance Operations (2) |
Total | ||||||||||||
| Revenues: |
||||||||||||||||
| Gross premiums written |
$ | 203,061 | $ | 302,947 | (6) | $ | 59,837 | $ | 565,845 | |||||||
|
|
|
|
|
|
|
|
|
|||||||||
| Net premiums written |
$ | 182,956 | $ | 228,183 | $ | 59,801 | $ | 470,940 | ||||||||
|
|
|
|
|
|
|
|
|
|||||||||
| Net premiums earned |
$ | 189,342 | $ | 237,555 | $ | 41,568 | $ | 468,465 | ||||||||
| Other income (loss) |
6,857 | 3,712 | (224 | ) | 10,345 | |||||||||||
|
|
|
|
|
|
|
|
|
|||||||||
| Total revenues |
196,199 | 241,267 | 41,344 | 478,810 | ||||||||||||
|
|
|
|
|
|
|
|
|
|||||||||
| Losses and Expenses: |
||||||||||||||||
| Net losses and loss adjustment expenses |
75,401 | 174,528 | 14,074 | 264,003 | ||||||||||||
| Acquisition costs and other underwriting expenses |
81,477 | (3) | 99,109 | (4) | 16,064 | 196,650 | ||||||||||
|
|
|
|
|
|
|
|
|
|||||||||
| Income (loss) from segments |
$ | 39,321 | $ | (32,370 | ) | $ | 11,206 | 18,157 | ||||||||
|
|
|
|
|
|
|
|||||||||||
| Unallocated Items: |
||||||||||||||||
| Net investment income |
33,983 | |||||||||||||||
| Net realized investment gains |
21,721 | |||||||||||||||
| Corporate and other operating expenses |
(17,338 | ) | ||||||||||||||
| Interest expense |
(8,905 | ) | ||||||||||||||
|
|
|
|||||||||||||||
| Income before income taxes |
47,618 | |||||||||||||||
| Income tax benefit |
2,250 | |||||||||||||||
|
|
|
|||||||||||||||
| Net income |
$ | 49,868 | ||||||||||||||
|
|
|
|||||||||||||||
| Total assets |
$ | 790,564 | $ | 470,508 | $ | 711,874 | (5) | $ | 1,972,946 | |||||||
|
|
|
|
|
|
|
|
|
|||||||||
| (1) | Includes business ceded to the Company’s Reinsurance Operations. |
| (2) | External business only, excluding business assumed from affiliates. |
| (3) | Includes federal excise tax of $756 relating to cessions from Commercial Lines to Reinsurance Operations. |
| (4) | Includes federal excise tax of $948 relating to cessions from Personal Lines to Reinsurance Operations. |
| (5) | Comprised of Global Indemnity Reinsurance’s total assets less its investment in subsidiaries |
160
Table of Contents
| (6) | Includes $35,334 of business written by American Reliable that is ceded to insurance companies owned by Assurant under a 100% quota share reinsurance agreement. |
| 2015: (Dollars in thousands) |
Commercial Lines (1) |
Personal Lines (1) |
Reinsurance Operations (2) |
Total | ||||||||||||
| Revenues: |
||||||||||||||||
| Gross premiums written |
$ | 213,353 | $ | 327,147 | (6) | $ | 49,733 | $ | 590,233 | |||||||
|
|
|
|
|
|
|
|
|
|||||||||
| Net premiums written |
$ | 198,404 | $ | 253,157 | $ | 49,683 | $ | 501,244 | ||||||||
|
|
|
|
|
|
|
|
|
|||||||||
| Net premiums earned |
$ | 198,404 | $ | 253,948 | $ | 51,791 | $ | 504,143 | ||||||||
| Other income (loss) |
— | 3,493 | (93 | ) | 3,400 | |||||||||||
|
|
|
|
|
|
|
|
|
|||||||||
| Total revenues |
198,404 | 257,441 | 51,698 | 507,543 | ||||||||||||
|
|
|
|
|
|
|
|
|
|||||||||
| Losses and Expenses: |
||||||||||||||||
| Net losses and loss adjustment expenses |
98,471 | 163,045 | 13,852 | 275,368 | ||||||||||||
| Acquisition costs and other underwriting expenses |
84,623 | (3) | 97,687 | (4) | 18,993 | 201,303 | ||||||||||
|
|
|
|
|
|
|
|
|
|||||||||
| Income (loss) from segments |
$ | 15,310 | $ | (3,291 | ) | $ | 18,853 | 30,872 | ||||||||
|
|
|
|
|
|
|
|||||||||||
| Unallocated Items: |
||||||||||||||||
| Net investment income |
34,609 | |||||||||||||||
| Net realized investment losses |
(3,374 | ) | ||||||||||||||
| Corporate and other operating expenses |
(24,448 | ) | ||||||||||||||
| Interest expense |
(4,913 | ) | ||||||||||||||
|
|
|
|||||||||||||||
| Income before income taxes |
32,746 | |||||||||||||||
| Income tax benefit |
8,723 | |||||||||||||||
|
|
|
|||||||||||||||
| Net income |
$ | 41,469 | ||||||||||||||
|
|
|
|||||||||||||||
| Total assets |
$ | 714,688 | $ | 524,912 | $ | 717,694 | (5) | $ | 1,957,294 | |||||||
|
|
|
|
|
|
|
|
|
|||||||||
| (1) | Includes business ceded to the Company’s Reinsurance Operations. |
| (2) | External business only, excluding business assumed from affiliates. |
| (3) | Includes federal excise tax of $1,047 relating to cessions from Commercial Lines to Reinsurance Operations. |
| (4) | Includes federal excise tax of $1,270 relating to cessions from Personal Lines to Reinsurance Operations. |
| (5) | Comprised of Global Indemnity Reinsurance’s total assets less its investment in subsidiaries |
| (6) | Includes $55,829 of business written by American Reliable that is ceded to insurance companies owned by Assurant under a 100% quota share reinsurance agreement. |
| 21. | Supplemental Cash Flow Information |
Taxes and Interest Paid
The Company paid the following net federal income taxes and interest for 2017, 2016, and 2015:
| Years Ended December 31, | ||||||||||||
| (Dollars in thousands) | 2017 | 2016 | 2015 | |||||||||
| Federal income taxes paid |
$ | 133 | $ | 195 | $ | 104 | ||||||
| Federal income taxes recovered |
19 | 4,889 | 2 | |||||||||
| Interest paid |
14,504 | 8,771 | 3,926 | |||||||||
161
Table of Contents
Non-Cash Activities
On January 1, 2015, Global Indemnity Group, Inc. acquired 100% of the voting equity interest of American Reliable. In conjunction with the acquisition, fair value of assets acquired and liabilities assumed by the Company were as follows:
| (Dollars in thousands) | ||||
| Fair value of assets acquired (including goodwill) |
$ | 383,668 | ||
| Liabilities assumed |
283,871 | |||
| 22. | New Accounting Pronouncements |
The following are new accounting guidance which have not yet been adopted.
In May, 2017, the Financial Accounting Standards Board (“FASB”) issued updated accounting guidance which clarifies whether changes to the terms or conditions of a share-based payment award require an entity to apply modification accounting. This guidance is effective for all entities for annual periods, and interim periods within those annual periods, beginning after December 15, 2017. Early adoption is permitted. Although the Company is still evaluating the impact of this new guidance, the Company does not anticipate it will have a material impact on its financial condition, results of operations, or cash flows.
In March, 2017, the FASB issued new accounting guidance which amends the amortization period for certain purchased callable debt securities held at a premium. Under current generally accepted accounting principles, entities generally amortize the premium as an adjustment of yield over the contractual life of the instruments. Under the new guidance, the amortization period would be shortened to the earliest call date. This guidance is effective for public business entities for fiscal years, and interim periods within those fiscal years, beginning after December 15, 2018. Early adoption is permitted. The Company is still evaluating the impact of this guidance on its financial condition, results of operations, and cash flows.
In January, 2017, the FASB issued updated guidance that simplifies how an entity is required to test goodwill for impairment by eliminating the requirement to calculate the implied fair value of goodwill (i.e. Step 2 of the current goodwill impairment test). Under the new amendments, an entity may still first assess qualitative factors to determine whether it is necessary to perform a quantitative goodwill impairment test. If determined to be necessary, the quantitative impairment test shall be used to identify goodwill impairment and measure the amount of a goodwill impairment loss to be recognized, if any. A goodwill impairment loss is recognized for the amount that the carrying amount of a reporting unit, including goodwill, exceeds its fair value, limited to the total amount of goodwill allocated to that reporting unit. This guidance is effective for public business entities’ annual or interim goodwill impairment testing in fiscal years beginning after December 15, 2019. Early adoption is permitted for interim or annual goodwill impairment tests performed on testing dates after January 1, 2017. Although the Company is still evaluating the impact of this new guidance, the Company does not anticipate it will have a material impact on its financial condition, results of operations, or cash flows.
In October, 2016, the FASB issued new accounting guidance regarding intra-entity transfers of assets other than inventory. Under current GAAP, the tax effects of intra-entity asset transfers (intercompany sales) are deferred until the transferred asset is sold to a third party or otherwise recovered through use. This is an exception to the principle in ASC 740, Income Taxes, that generally requires comprehensive recognition of current and deferred income taxes. The new guidance eliminates the exception for all intra-entity sales of assets other than inventory. As a result, a reporting entity would recognize the tax expense from the sale of the asset in the seller’s tax jurisdiction when the transfer occurs, even though the pre-tax effects of that transaction are eliminated in consolidation. Any deferred tax asset that arises in the buyer’s jurisdiction would also be recognized at the time of the transfer. The new guidance does not apply to intra-entity transfers of inventory. The income tax consequences from the sale of inventory from one member of a consolidated entity to another will continue to be deferred until the inventory is sold to a third party. Upon adoption on January 1, 2018, there will be a cumulative
162
Table of Contents
adjustment to retained earnings which the Company does not expect to be material to its overall financial condition.
In August, 2016, the FASB issued new accounting guidance regarding the classification of certain cash receipts and cash payments within the statements of cash flows. The new guidance addresses eight specific cash flow issues with the objective of reducing the existing diversity in practice. This guidance is effective for public business entities for fiscal periods beginning after December 15, 2017, and interim periods within those fiscal years. Early adoption is permitted. Although the Company is still evaluating the impact of this new guidance, the Company does not anticipate it will have a material impact on its financial condition, results of operations, or cash flows.
In June, 2016, the FASB issued new accounting guidance addressing the measurement of credit losses on financial instruments. For assets held at amortized cost basis, the new guidance replaces the incurred loss impairment methodology in current GAAP with a methodology that reflects expected credit losses and requires consideration of a broader range of information for credit loss estimates. For available for sale debt securities, credit losses should be measured similar to current GAAP; however, the new guidance requires that credit losses be presented as an allowance rather than as a write-down and allows for the reversal of credit losses in the current period net income. This guidance is effective for public business entities for fiscal years beginning after December 15, 2019, including interim periods within those fiscal years. Early application of this new guidance is permitted as of the fiscal years beginning after December 15, 2018 including interim periods within those fiscal years. This guidance will be applied using a modified-retrospective approach through a cumulative effect adjustment to retained earnings as of the beginning of the first reporting period in which the guidance is effective. The Company is still evaluating the impact of this guidance on its financial condition, results of operations, and cash flows.
In February, 2016, the FASB issued new accounting guidance regarding leases. The new guidance increases transparency and comparability among organizations by recognizing lease assets and lease liabilities on the balance sheet and disclosing key information about leasing arrangements. This guidance is effective for public business entities for fiscal years beginning after December 15, 2018, including interim periods within those fiscal years. Early adoption is permitted. Upon adoption, the Company expects to report higher assets and liabilities as a result of recognizing right-of-use assets and corresponding lease liabilities on the Consolidated Balance Sheets. The Company expects the new guidance to have minimal impact on the Consolidated Statement of Operations or Consolidated Statement of Cash Flows.
In January, 2016, the FASB issued new accounting guidance surrounding the accounting for financial instruments. The new guidance addresses certain aspects of recognition, measurement, presentation, and disclosure of financial instruments. In particular, the guidance requires equity investments, except for those accounted for under the equity method of accounting or those that result in consolidation of the investee, to be measured at fair value with the changes in fair value recognized in net income. It also simplifies the impairment assessment of equity investments without readily determinable fair values by requiring a qualitative assessment to identify impairment. This guidance is effective for public business entities for fiscal years beginning after December 15, 2017, including interim periods within those fiscal years. Early application of this new guidance is permitted as of the beginning of the fiscal year of adoption. Upon adoption on January 1, 2018, the Company estimates that a cumulative effect adjustment, net of tax, of approximately $10.0 million will be reclassified from accumulated other comprehensive income and increase retained earnings. However, there will be no net impact to overall equity.
In May, 2014, the FASB issued new accounting guidance regarding the recognition of revenue from customers arising from the transfer of goods and services. The core principle of the guidance is that an entity should recognize revenue to depict the transfer of promised goods or services to customers in an amount that reflects the consideration to which the entity expects to be entitled in exchange for those goods or services. Long and short duration insurance contracts, which comprise the majority of the Company’s revenues, are excluded from this
163
Table of Contents
accounting guidance. While insurance contracts are not within the scope of this guidance, the Company reviewed the requirement of the new guidance to determine whether its revenue recognition policy for fee income will be impacted by this updated guidance. Based on this review, the Company does not believe its accounting policies will be impacted by this new revenue recognition guidance. This guidance is effective for public business entities for annual reporting periods beginning after December 15, 2017, including interim periods within that reporting period. Early application is permitted only as of annual reporting periods beginning after December 15, 2016, including interim periods within that reporting period.
| 23. | Summary of Quarterly Financial Information (Unaudited) |
An unaudited summary of the Company’s 2017 and 2016 quarterly performance is as follows:
| Year Ended December 31, 2017 | ||||||||||||||||
| (Dollars in thousands, except per share data) | First Quarter |
Second Quarter |
Third Quarter |
Fourth Quarter |
||||||||||||
| Net premiums earned |
$ | 113,126 | $ | 107,073 | $ | 108,619 | $ | 109,216 | ||||||||
| Net investment income |
8,644 | 8,840 | 10,134 | 11,705 | ||||||||||||
| Net realized investment gains (losses) |
775 | (662 | ) | (963 | ) | 2,426 | ||||||||||
| Net losses and loss adjustment expenses |
62,561 | 57,700 | 82,395 | 66,556 | ||||||||||||
| Acquisition costs and other underwriting expenses |
46,551 | 43,457 | 45,002 | 48,723 | ||||||||||||
| Income (loss) before income taxes |
9,280 | 7,753 | (16,779 | ) | (10,304 | ) | ||||||||||
| Net income (loss) |
12,282 | 10,089 | (8,924 | ) | (22,998 | ) | ||||||||||
| Per share data — Diluted: |
||||||||||||||||
| Net income (loss) |
$ | 0.70 | $ | 0.57 | $ | (0.51 | ) | $ | (1.33 | ) | ||||||
| Year Ended December 31, 2016 | ||||||||||||||||
| (Dollars in thousands, except per share data) | First Quarter |
Second Quarter |
Third Quarter |
Fourth Quarter |
||||||||||||
| Net premiums earned |
$ | 121,636 | $ | 117,804 | $ | 119,553 | $ | 109,472 | ||||||||
| Net investment income |
9,746 | 6,562 | 8,795 | 8,880 | ||||||||||||
| Net realized investment gains (losses) |
(7,493 | ) | (3,492 | ) | 1,928 | 30,778 | ||||||||||
| Net losses and loss adjustment expenses |
64,784 | 78,111 | 72,162 | 48,946 | ||||||||||||
| Acquisition costs and other underwriting expenses |
52,090 | 48,542 | 48,129 | 47,889 | ||||||||||||
| Income (loss) before income taxes |
1,953 | (11,468 | ) | 10,598 | 46,535 | |||||||||||
| Net income (loss) |
7,125 | (5,165 | ) | 9,535 | 38,373 | |||||||||||
| Per share data — Diluted: |
||||||||||||||||
| Net income (loss) |
$ | 0.41 | $ | ( 0.30 | ) | $ | 0.54 | $ | 2.18 | |||||||
| 24. | Subsequent events |
On March 4, 2018, the Company’s Board of Directors approved a dividend payment of $0.25 per ordinary share to be paid on March 29, 2018 to all shareholders of record as of the close of business on March 21, 2018.
On March 8, 2018, the Company settled its final reserve calculation which resulted in $41.5 million being due to Global Indemnity Group, Inc. in accordance with the Stock Purchase Agreement between Global Indemnity Group, Inc. and American Bankers Insurance Group, Inc. for the purchase of American Reliable. The settlement is comprised of (i) receipt of $38.8 million for loss and loss adjustment expenses paid on or after January 1, 2015 or payable as of December 31, 2017 with respect to losses incurred prior to January 1, 2015, (ii) receipt of $6.2 million for accrued interest and (iii) payment of $3.5 million for the difference between the agreed upon purchase price and actual settlement on January 1, 2015. These amounts are included in other assets on the consolidated balance sheets as of December 31, 2017.
164
Table of Contents
| Item 9. | CHANGES IN AND DISAGREEMENTS WITH ACCOUNTANTS ON ACCOUNTING AND FINANCIAL DISCLOSURE |
None
| Item 9A. | CONTROLS AND PROCEDURES |
Evaluation of Disclosure Controls and Procedures
The Company maintains disclosure controls and procedures (as that term is defined in Rules 13a-15(e) and 15d-15(e) under the Securities Exchange Act of 1934, as amended (the “Exchange Act”)) that are designed to ensure that information required to be disclosed in the Company’s reports under the Exchange Act is recorded, processed, summarized and reported within the time periods specified in the Securities and Exchange Commission’s rules and forms, and that such information is accumulated and communicated to the Company’s management, including its Chief Executive Officer and Chief Financial Officer, as appropriate, to allow timely decisions regarding required disclosures. Any controls and procedures, no matter how well designed and operated, can provide only reasonable assurance of achieving the desired control objectives. The Company’s management, with the participation of its Chief Executive Officer and Chief Financial Officer, has evaluated the effectiveness of the design and operation of disclosure controls and procedures as of December 31, 2017. Based upon that evaluation and subject to the foregoing, the Chief Executive Officer and Chief Financial Officer concluded that, as of December 31, 2017, the design and operation of the Company’s disclosure controls and procedures were effective to accomplish their objectives at the reasonable assurance level.
Management’s Report on Internal Control over Financial Reporting
Management of the Company is responsible for establishing and maintaining adequate internal control over financial reporting. The Company’s internal control over financial reporting is designed to provide reasonable assurances regarding the reliability of financial reporting and the preparation of the consolidated financial statements of the Company in accordance with U.S. generally accepted accounting principles.
The Company’s internal control over financial reporting includes those policies and procedures that:
| • | pertain to the maintenance of records that, in reasonable detail, accurately and fairly reflect the transactions and dispositions of the assets of the Company; |
| • | provide reasonable assurance that transactions are recorded as necessary to permit preparation of financial statements in accordance with U.S. generally accepted accounting principles, and that receipts and expenditures are being made only in accordance with authorizations of the Company’s management and Directors; and |
| • | provide reasonable assurance regarding prevention or timely detection of unauthorized acquisition, use or disposition of assets that could have a material effect on the financial statements. |
Because of its inherent limitations, internal control over financial reporting may not prevent or detect misstatements. Also, projections of any evaluation of effectiveness to future periods are subject to the risk that controls may become inadequate because of changes in conditions, or that the degree of compliance with the policies or procedures may deteriorate.
Management has assessed the Company’s internal control over financial reporting as of December 31, 2017. The standard measures adopted by management in making its evaluation are the measures in the Internal Control Integrated Framework published by the Committee of Sponsoring Organizations of the Treadway Commission in 2013.
Based upon its assessment, management has concluded that the Company’s internal control over financial reporting was effective at December 31, 2017, and that there were no material weaknesses in the Company’s internal control over financial reporting as of that date.
165
Table of Contents
Ernst & Young, LLP, an independent registered public accounting firm, which has audited and reported on the consolidated financial statements contained in this Form 10-K, has issued its report on the effectiveness of the Company’s internal control over financial reporting. See “Report of Independent Registered Public Accounting Firm” on page 167.
Changes in Internal Control over Financial Reporting
There have been no changes in the Company’s internal controls over financial reporting that occurred during the quarter ended December 31, 2017 that have materially affected, or are reasonably likely to materially affect, the Company’s internal controls over financial reporting.
166
Table of Contents
Report of Independent Registered Public Accounting Firm
To the Shareholders and the Board of Directors of Global Indemnity Limited
Opinion on Internal Control over Financial Reporting
We have audited Global Indemnity Limited’s internal control over financial reporting as of December 31, 2017, based on criteria established in Internal Control — Integrated Framework issued by the Committee of Sponsoring Organizations of the Treadway Commission (2013 framework), (the COSO criteria). In our opinion, Global Indemnity Limited (the Company) maintained, in all material respects, effective internal control over financial reporting as of December 31, 2017, based on the COSO criteria.
We also have audited, in accordance with the standards of the Public Company Accounting Oversight Board (United States) (PCAOB), the consolidated balance sheets of the Company as of December 31, 2017 and 2016, the related consolidated statements of operations, comprehensive income, shareholders’ equity and cash flows for each of the three years in the period ended December 31, 2017, and the related notes and the financial statement schedules listed in the Index at Item 15 and our report dated March 9, 2018 expressed an unqualified opinion thereon.
Basis for Opinion
The Company’s management is responsible for maintaining effective internal control over financial reporting and for its assessment of the effectiveness of internal control over financial reporting included in the accompanying Management’s Report on Internal Control over Financial Reporting. Our responsibility is to express an opinion on the Company’s internal control over financial reporting based on our audit. We are a public accounting firm registered with the PCAOB and are required to be independent with respect to the Company in accordance with the U.S. federal securities laws and the applicable rules and regulations of the Securities and Exchange Commission and the PCAOB.
We conducted our audit in accordance with the standards of the PCAOB. Those standards require that we plan and perform the audit to obtain reasonable assurance about whether effective internal control over financial reporting was maintained in all material respects.
Our audit included obtaining an understanding of internal control over financial reporting, assessing the risk that a material weakness exists, testing and evaluating the design and operating effectiveness of internal control based on the assessed risk, and performing such other procedures as we considered necessary in the circumstances. We believe that our audit provides a reasonable basis for our opinion.
Definition and Limitations of Internal Control Over Financial Reporting
A company’s internal control over financial reporting is a process designed to provide reasonable assurance regarding the reliability of financial reporting and the preparation of financial statements for external purposes in accordance with generally accepted accounting principles. A company’s internal control over financial reporting includes those policies and procedures that (1) pertain to the maintenance of records that, in reasonable detail, accurately and fairly reflect the transactions and dispositions of the assets of the company; (2) provide reasonable assurance that transactions are recorded as necessary to permit preparation of financial statements in accordance with generally accepted accounting principles, and that receipts and expenditures of the company are being made only in accordance with authorizations of management and directors of the company; and (3) provide reasonable assurance regarding prevention or timely detection of unauthorized acquisition, use, or disposition of the company’s assets that could have a material effect on the financial statements.
Because of its inherent limitations, internal control over financial reporting may not prevent or detect misstatements. Also, projections of any evaluation of effectiveness to future periods are subject to the risk that controls may become inadequate because of changes in conditions, or that the degree of compliance with the policies or procedures may deteriorate.
/s/ Ernst & Young LLP
Philadelphia, PA
March 9, 2018
167
Table of Contents
| Item 9B. | OTHER INFORMATION |
CEO Employment Agreement.
On March 6, 2018 Global Indemnity entered into a Chief Executive Agreement (the “Employment Agreement”) with Cynthia Y. Valko, the Chief Executive Officer (“CEO”). The Employment Agreement provides for an employment term of three years, from January 1, 2018 through December 31, 2020.
Under the Employment Agreement, Ms. Valko is eligible to receive a cash Return on Equity Bonus of up to $600,000 for each fiscal year of the Employment Agreement that Ms. Valko served as the CEO (the “ROE Bonus”). Ms. Valko is eligible to receive a preliminary ROE Bonus (the “Preliminary ROE Bonus”) for each such fiscal year if Global Indemnity’s return on equity percentage for such fiscal year exceeds 85% of the targeted return on equity percentage (as established by the Company’s Compensation Committee) for such fiscal year. If Ms. Valko is still employed by the Company and in good standing through the date of payment she will receive 50% of the Preliminary ROE Bonus, payable no later than April 1 of the calendar year immediately following the year to which such Preliminary ROE Bonus relates. Global Indemnity will retain the remaining 50% unpaid balance of the Preliminary ROE Bonus, which will be paid to Ms. Valko within 90 days after the end of the third full calendar year following a Bonus Year (as defined in the Employment Agreement), regardless of Ms. Valko’s then-current employment status with the Company, but subject to adjustment based on an actuarial assessment of incurred but not reported underwriting losses and loss adjustment expenses and actual underwriting losses and loss adjustment expenses.
Additionally, under the Employment Agreement, Ms. Valko is eligible to receive an annual cash Performance Incentive Bonus of up to $200,000, based on an assessment of her performance during the Bonus Year (as defined by the Employment Agreement) by the Company’s Compensation Committee, in its sole discretion, based upon the assessment of the Company’s Chairman of the Board of Directors, in his sole discretion.
Under the Employment Agreement, Ms. Valko is restricted from selling any A Ordinary Shares of Global Indemnity unless Ms. Valko retains vested Global Indemnity stock options and shares having an aggregate value of at least equal to the lesser of (i) $5,000,000 or (ii) $5,000,000 multiplied by a fraction, the numerator of which is the volume weighted trading price of Global Indemnity’s shares for the 30-day period ending on the relevant measurement date and the denominator of which is $50, and Ms. Valko retains at least 75% of the Global Indemnity options and restricted shares granted to her. Ms. Valko must provide Global Indemnity’s Chairman with advance notice, and receive approval of, any proposed sale.
In addition, Ms. Valko will be granted 300,000 options (“Tranche 3 Options”) to buy Global Indemnity A Ordinary Shares with an exercise price of $50.00 per share. Tranche 3 Options vest 1/3 on December 31 of 2018, 2019 and 2020, if Ms. Valko remains employed and in good standing as of such date. Tranche 3 Options expire on the earlier of December 31, 2027 and 90 calendar days after Ms. Valko is neither employed by Global Indemnity nor a member of the Board of Directors. In 2014, Ms. Valko was granted 300,000 options to buy Global A Ordinary Shares (“Tranche 2 Options”). The Tranche 2 Options will vest on each December 31 of 2018, 2019 and 2020 in an amount based on Ms. Valko’s attainment of the ROE Bonus criteria described above.
In the event of Ms. Valko’s termination by the Company (other than for a Cause Event, as defined in the Employment Agreement), before the expiration of the term, she will receive one month of then-current Base Salary for every completed 12 months of employment prior to the date of termination.
The foregoing description of the Employment Agreement is qualified by reference to the full text of the Chief Executive Agreement, which is filed as Exhibit 10.41 to this Annual Report on Form 10-K and incorporated herein by reference.
168
Table of Contents
| Item 10. | DIRECTORS, EXECUTIVE OFFICERS, AND CORPORATE GOVERNANCE |
The information required by this Item is incorporated by reference to, and will be contained in, the Company’s definitive proxy statement relating to the 2018 Annual Meeting of Shareholders to be filed with the SEC within 120 days of the fiscal year ended December 31, 2017 (“2018 Proxy Statement”).
| Item 11. | EXECUTIVE COMPENSATION |
The information required by this Item is incorporated by reference to, and will be contained in, the Company’s 2018 Proxy Statement.
| Item 12. | SECURITY OWNERSHIP OF CERTAIN BENEFICIAL OWNERS AND MANAGEMENT, AND RELATED STOCKHOLDER MATTERS |
The information required by this Item is incorporated by reference to, and will be contained in, the Company’s 2018 Proxy Statement.
| Item 13. | CERTAIN RELATIONSHIPS AND RELATED TRANSACTIONS, AND DIRECTOR INDEPENDENCE |
The information required by this Item is incorporated by reference to, and will be contained in, the Company’s 2018 Proxy Statement.
| Item 14. | PRINCIPAL ACCOUNTANT FEES AND SERVICES |
The information required by this Item is incorporated by reference to, and will be contained in, the Company’s 2018 Proxy Statement.
169
Table of Contents
| Item 15. | EXHIBITS, FINANCIAL STATEMENT SCHEDULES |
The agreements and other documents filed as exhibits to this report are not intended to provide factual information or other disclosure other than with respect to the terms of the agreements or other documents themselves, and you should not rely on them for that purpose. In particular, any representations and warranties made by the Company in these agreements or other documents were made solely within the specific context of the relevant agreement or document and may not describe the actual state of affairs as of the date they were made or at any other time.
The following documents are filed as part of this report:
(1) The Financial Statements listed in the accompanying index on page 90 are filed as part of this report.
(2) The Financial Statement Schedules listed in the accompanying index on page 90 are filed as part of this report.
170
Table of Contents
171
Table of Contents
172
Table of Contents
173
Table of Contents
| + | Filed or furnished herewith. |
| * | Management contract or compensatory plan or arrangement required to be filed as an exhibit to this Form 10-K. |
| Item 16. | Form 10-K Summary |
None.
174
Table of Contents
SIGNATURES
Pursuant to the requirements of the Section 13 or 15 (d) of the Securities Exchange Act of 1934, Global Indemnity has duly caused this report to be signed on its behalf by the undersigned, thereunto duly authorized.
GLOBAL INDEMNITY LIMITED
| By: |
/s/ Cynthia Y. Valko | |
| Name: |
Cynthia Y. Valko | |
| Title: |
Chief Executive Officer | |
| Date: |
March 9, 2018 |
Pursuant to the requirements of the Securities Exchange Act of 1934, this report has been signed by the following persons on behalf of the registrant and in the capacities indicated below on March 9, 2018.
| SIGNATURE |
TITLE | |
| /s/ Saul A. Fox Saul A. Fox |
Chairman and Director | |
| /s/ Cynthia Y. Valko Cynthia Y. Valko |
Chief Executive Officer (Principal Executive Officer) and Director | |
| /s/ Thomas M. McGeehan Thomas M. McGeehan |
Chief Financial Officer (Principal Financial and Accounting Officer) | |
| /s/ Seth J. Gersch Seth J. Gersch |
Director | |
| /s/ John H. Howes John H. Howes |
Director | |
| /s/ Bruce Lederman Bruce Lederman |
Director | |
| /s/ Raphael de Balmann Raphael de Balmann |
Director | |
| /s/ Joseph W. Brown Joseph W. Brown |
Director | |
| /s/ David J. W. Bruce David J. W. Bruce |
Director | |
| /s/ Jason B. Hurwitz Jason B. Hurwitz |
Director | |
| /s/ Arik Rashkes Arik Rashkes |
Director | |
175
Table of Contents
GLOBAL INDEMNITY LIMITED
SCHEDULE I — SUMMARY OF INVESTMENTS — OTHER THAN INVESTMENTS
IN RELATED PARTIES
(In thousands)
| As of December 31, 2017 | ||||||||||||
| Cost* | Value | Amount Included in the Balance Sheet |
||||||||||
| Type of Investment: |
||||||||||||
| Fixed maturities: |
||||||||||||
| United States government and government agencies and authorities |
$ | 105,311 | $ | 104,680 | $ | 104,680 | ||||||
| States, municipalities, and political subdivisions |
94,947 | 95,114 | 95,114 | |||||||||
| Mortgage-backed and asset-backed securities |
494,825 | 492,846 | 492,846 | |||||||||
| Public utilities |
23,467 | 23,504 | 23,504 | |||||||||
| All other corporate bonds |
524,594 | 525,293 | 525,293 | |||||||||
|
|
|
|
|
|
|
|||||||
| Total fixed maturities |
1,243,144 | 1,241,437 | 1,241,437 | |||||||||
|
|
|
|
|
|
|
|||||||
| Equity securities: |
||||||||||||
| Common stocks: |
||||||||||||
| Public utilities |
9,444 | 9,748 | 9,748 | |||||||||
| Industrial and miscellaneous |
115,471 | 130,481 | 130,481 | |||||||||
|
|
|
|
|
|
|
|||||||
| Total equity securities |
124,915 | 140,229 | 140,229 | |||||||||
|
|
|
|
|
|
|
|||||||
| Other long-term investments |
77,820 | 77,820 | 77,820 | |||||||||
|
|
|
|
|
|
|
|||||||
| Total investments |
$ | 1,445,879 | $ | 1,459,486 | $ | 1,459,486 | ||||||
|
|
|
|
|
|
|
|||||||
| * | Original cost of equity securities; original cost of fixed maturities adjusted for amortization of premiums and accretion of discounts; original cost for other long-term investments adjusted for income or loss earned on investments in accordance with equity method of accounting. All amounts are shown net of impairment losses. |
S-1
Table of Contents
GLOBAL INDEMNITY LIMITED
SCHEDULE II — Condensed Financial Information of Registrant
(Parent Only)
Balance Sheets
(Dollars in thousands, except share data)
| Years Ended December 31, | ||||||||
| 2017 | 2016 | |||||||
| ASSETS |
||||||||
| Fixed maturities |
$ | 13,118 | $ | 3,770 | ||||
| Cash and cash equivalents |
11,089 | 91 | ||||||
| Intercompany note receivable (1) |
— | 750,397 | ||||||
| Equity in unconsolidated subsidiaries (1) |
1,207,590 | 292,195 | ||||||
| Receivable for securities (1) |
— | 1 | ||||||
| Due from affiliates |
4,618 | — | ||||||
| Other assets |
20,681 | 59 | ||||||
|
|
|
|
|
|||||
| Total assets |
$ | 1,257,096 | $ | 1,046,513 | ||||
|
|
|
|
|
|||||
| LIABILITIES AND SHAREHOLDERS’ EQUITY |
||||||||
| Liabilities: |
||||||||
| Debt |
$ | 222,483 | $ | 96,497 | ||||
| Intercompany notes payable (1) |
290,498 | 141,998 | ||||||
| Interest payable |
3,152 | 990 | ||||||
| Due to affiliates (1) |
12,465 | 8,759 | ||||||
| Other liabilities |
10,104 | 318 | ||||||
|
|
|
|
|
|||||
| Total liabilities |
538,702 | 248,562 | ||||||
|
|
|
|
|
|||||
| Commitments and contingencies |
— | — | ||||||
| Shareholders’ equity: |
||||||||
| Ordinary shares, $0.0001 par value, 900,000,000 ordinary shares authorized; A ordinary shares issued: 10,102,927 and 13,436,548, respectively; A ordinary shares outstanding: 10,073,376 and 13,436,548, respectively; B ordinary shares issued and outstanding: 4,133,366 and 4,133,366, respectively |
2 | 2 | ||||||
| Preferred shares, $0.0001 par value, 100,000,000 shares authorized, none issued and outstanding |
— | — | ||||||
| Additional paid-in capital |
434,730 | 430,283 | ||||||
| Accumulated other comprehensive income, net of tax |
8,983 | (618 | ) | |||||
| Retained earnings |
275,838 | 368,284 | ||||||
| A ordinary shares in treasury, at cost: 29,551 and 0 shares, respectively |
(1,159 | ) | — | |||||
|
|
|
|
|
|||||
| Total shareholders’ equity |
718,394 | 797,951 | ||||||
|
|
|
|
|
|||||
| Total liabilities and shareholders’ equity |
$ | 1,257,096 | $ | 1,046,513 | ||||
|
|
|
|
|
|||||
| (1) | This item has been eliminated in the Company’s Consolidated Financial Statements. |
See Notes to Consolidated Financial Statements included in Item 8.
S-2
Table of Contents
GLOBAL INDEMNITY LIMITED
SCHEDULE II — Condensed Financial Information of Registrant (continued)
(Parent Only)
Statement of Operations and Comprehensive Income
(Dollars in thousands)
| Years Ended December 31, |
||||||||
| 2017 | 2016 | |||||||
| Revenues: |
||||||||
| Net investment income |
$ | 361 | $ | 28 | ||||
| Net realized investment losses |
(368 | ) | — | |||||
|
|
|
|
|
|||||
| Total revenues |
(7 | ) | 28 | |||||
| Expenses: |
||||||||
| Intercompany interest expense (1) |
2,477 | 198 | ||||||
| Interest expense |
15,872 | 1,172 | ||||||
| Other expenses |
16,801 | 661 | ||||||
|
|
|
|
|
|||||
| Loss before equity in earnings of unconsolidated subsidiaries |
(35,157 | ) | (2,003 | ) | ||||
| Equity in earnings of unconsolidated subsidiaries (1) |
25,606 | 51,871 | ||||||
|
|
|
|
|
|||||
| Net income |
(9,551 | ) | 49,868 | |||||
|
|
|
|
|
|||||
| Other comprehensive income (loss), net of tax: |
||||||||
| Unrealized holding gains (losses) |
43 | (17 | ) | |||||
| Equity in other comprehensive loss of unconsolidated subsidiaries (1) |
9,558 | (4,679 | ) | |||||
|
|
|
|
|
|||||
| Other comprehensive loss, net of tax |
9,601 | (4,696 | ) | |||||
|
|
|
|
|
|||||
| Comprehensive income, net of tax |
$ | 50 | $ | 45,172 | ||||
|
|
|
|
|
|||||
| (1) | This item has been eliminated in the Company’s Consolidated Financial Statements. |
See Notes to Consolidated Financial Statements included in Item 8.
S-3
Table of Contents
GLOBAL INDEMNITY PLC
SCHEDULE II — Condensed Financial Information of Registrant (continued)
(Parent Only)
Statements of Operations and Comprehensive Income
(Dollars in thousands)
| Year Ended December 31, 2015 |
||||
| Revenues: |
||||
| Total revenues |
$ | — | ||
| Expenses: |
||||
| Intercompany interest expense (1) |
1,296 | |||
| Other expenses |
8,203 | |||
|
|
|
|||
| Loss before equity in earnings of unconsolidated subsidiaries |
(9,499 | ) | ||
| Equity in earnings of unconsolidated subsidiaries (1) |
50,968 | |||
|
|
|
|||
| Net income |
41,469 | |||
|
|
|
|||
| Other comprehensive income (loss), net of tax: |
||||
| Equity in other comprehensive loss of unconsolidated subsidiaries (1) |
(19,306 | ) | ||
|
|
|
|||
| Other comprehensive loss, net of tax |
(19,306 | ) | ||
|
|
|
|||
| Comprehensive income, net of tax |
$ | 22,163 | ||
|
|
|
|||
| (1) | This item has been eliminated in the Company’s Consolidated Financial Statements. |
See Notes to Consolidated Financial Statements included in Item 8.
S-4
Table of Contents
GLOBAL INDEMNITY LIMITED
SCHEDULE II — Condensed Financial Information of Registrant — (continued)
(Parent Only)
Statements of Cash Flows
(Dollars in thousands)
| Years Ended December 31, |
||||||||
| 2017 | 2016 | |||||||
| Net cash provided by (used in) operating activities |
$ | (24,927 | ) | $ | 1 | |||
|
|
|
|
|
|||||
| Cash flows from investing activities: |
||||||||
| Proceeds from disposition of subsidiaries |
— | 456 | ||||||
| Dividend received from subsidiary |
100,000 | — | ||||||
| Capital contribution to a subsidiary |
(96,000 | ) | (450 | ) | ||||
| Proceeds from sale of fixed maturities |
12,389 | 84 | ||||||
| Proceeds from maturity of fixed maturities |
10,000 | — | ||||||
| Purchase of fixed maturities |
(32,044 | ) | — | |||||
|
|
|
|
|
|||||
| Net cash provided by (used in) investing activities |
(5,655 | ) | 90 | |||||
|
|
|
|
|
|||||
| Cash flows from financing activities: |
||||||||
| Redemption of ordinary shares |
(83,015 | ) | — | |||||
| Proceeds from issuance of subordinated notes |
130,000 | — | ||||||
| Debt issuance cost |
(4,246 | ) | — | |||||
| Purchase of A ordinary shares |
(1,159 | ) | — | |||||
|
|
|
|
|
|||||
| Net cash provided by financing activities |
41,580 | — | ||||||
|
|
|
|
|
|||||
| Net change in cash and equivalents |
10,998 | 91 | ||||||
| Cash and cash equivalents at beginning of period |
91 | — | ||||||
|
|
|
|
|
|||||
| Cash and cash equivalents at end of period |
$ | 11,089 | $ | 91 | ||||
|
|
|
|
|
|||||
See Notes to Consolidated Financial Statements included in Item 8.
S-5
Table of Contents
GLOBAL INDEMNITY PLC
SCHEDULE II — Condensed Financial Information of Registrant — (continued)
(Parent Only)
Statement of Cash Flows
(Dollars in thousands)
| Year Ended December 31, 2015 |
||||
| Net cash provided by operating activities |
$ | 95,891 | ||
|
|
|
|||
| Cash flows from financing activities: |
||||
| Proceeds from issuance of subordinated notes |
100,000 | |||
| Debt issuance cost |
(3,659 | ) | ||
| Purchases of A ordinary shares |
(333 | ) | ||
| Tax benefit on share-based compensation expense |
10 | |||
| Redemption of ordinary shares |
(189,770 | ) | ||
|
|
|
|||
| Net cash used for financing activities |
(93,752 | ) | ||
|
|
|
|||
| Net change in cash and equivalents |
2,139 | |||
| Cash and cash equivalents at beginning of period |
46 | |||
|
|
|
|||
| Cash and cash equivalents at end of period |
$ | 2,185 | ||
|
|
|
|||
See Notes to Consolidated Financial Statements included in Item 8.
S-6
Table of Contents
GLOBAL INDEMNITY LIMITED
SCHEDULE III — SUPPLEMENTARY INSURANCE INFORMATION
(Dollars in thousands)
| Segment |
Deferred Policy Acquisition Costs |
Future Policy Benefits, Losses, Claims And Loss Expenses |
Unearned Premiums |
Other Policy and Benefits Payable |
||||||||||||
| At December 31, 2017: |
||||||||||||||||
| Commercial Lines |
$ | 21,222 | $ | 419,042 | $ | 102,191 | $ | — | ||||||||
| Personal Lines |
27,563 | 120,255 | 137,704 | — | ||||||||||||
| Reinsurance Operations |
12,862 | 95,367 | 45,502 | — | ||||||||||||
| At December 31, 2016: |
||||||||||||||||
| Commercial Lines |
$ | 19,755 | $ | 458,645 | $ | 94,698 | $ | — | ||||||||
| Personal Lines |
28,381 | 127,350 | 157,464 | — | ||||||||||||
| Reinsurance Operations |
9,765 | 65,047 | 34,822 | — | ||||||||||||
| At December 31, 2015: |
||||||||||||||||
| Commercial Lines |
$ | 20,784 | $ | 524,607 | $ | 100,027 | $ | — | ||||||||
| Personal Lines |
31,900 | 94,359 | 169,669 | — | ||||||||||||
| Reinsurance Operations |
3,833 | 61,081 | 16,589 | — | ||||||||||||
| Segment |
Premium Revenue |
Benefits, Claims, Losses And Settlement Expenses |
Amortization of Deferred Policy Acquisition Costs |
Net Written Premium |
||||||||||||
| For the year ended December 31, 2017: |
||||||||||||||||
| Commercial Lines |
$ | 178,798 | $ | 62,834 | $ | 42,008 | $ | 186,448 | ||||||||
| Personal Lines |
215,983 | 165,798 | 56,616 | 209,799 | ||||||||||||
| Reinsurance Operations |
43,253 | 40,580 | 10,340 | 53,933 | ||||||||||||
|
|
|
|
|
|
|
|
|
|||||||||
| Total |
$ | 438,034 | $ | 269,212 | $ | 108,964 | $ | 450,180 | ||||||||
|
|
|
|
|
|
|
|
|
|||||||||
| For the year ended December 31, 2016: |
||||||||||||||||
| Commercial Lines |
$ | 189,342 | $ | 75,401 | $ | 42,361 | $ | 182,956 | ||||||||
| Personal Lines |
237,555 | 174,528 | 61,416 | 228,183 | ||||||||||||
| Reinsurance Operations |
41,568 | 14,074 | 10,540 | 59,801 | ||||||||||||
|
|
|
|
|
|
|
|
|
|||||||||
| Total |
$ | 468,465 | $ | 264,003 | $ | 114,317 | $ | 470,940 | ||||||||
|
|
|
|
|
|
|
|
|
|||||||||
| For the year ended December 31, 2015: |
||||||||||||||||
| Commercial Lines |
$ | 198,404 | $ | 98,471 | $ | 43,821 | $ | 198,404 | ||||||||
| Personal Lines |
253,948 | 163,045 | 31,291 | 253,157 | ||||||||||||
| Reinsurance Operations |
51,791 | 13,852 | 11,058 | 49,683 | ||||||||||||
|
|
|
|
|
|
|
|
|
|||||||||
| Total |
$ | 504,143 | $ | 275,368 | $ | 86,170 | $ | 501,244 | ||||||||
|
|
|
|
|
|
|
|
|
|||||||||
| Unallocated Corporate Items |
Net Investment Income |
Corporate and Other Operating Expenses |
||||||
| For the year ended December 31, 2017 |
$ | 39,323 | $ | 25,714 | ||||
| For the year ended December 31, 2016 |
33,983 | 17,338 | ||||||
| For the year ended December 31, 2015 |
34,609 | 24,448 | ||||||
S-7
Table of Contents
GLOBAL INDEMNITY LIMITED
EARNED PREMIUMS
(Dollars in thousands)
| Direct Amount |
Ceded to Other Companies |
Assumed from Other Companies |
Net Amount | Percentage of Amount Assumed to Net |
||||||||||||||||
| For the year ended December 31, 2017: |
||||||||||||||||||||
| Property & Liability Insurance |
$ | 440,109 | $ | 79,886 | $ | 77,811 | $ | 438,034 | 17.8 | % | ||||||||||
| For the year ended December 31, 2016: |
||||||||||||||||||||
| Property & Liability Insurance |
$ | 466,750 | $ | 96,552 | $ | 98,267 | $ | 468,465 | 21.0 | % | ||||||||||
| For the year ended December 31, 2015: |
||||||||||||||||||||
| Property & Liability Insurance |
$ | 452,441 | $ | 92,852 | $ | 144,554 | $ | 504,143 | 28.7 | % | ||||||||||
S-8
Table of Contents
GLOBAL INDEMNITY LIMITED
SCHEDULE V—VALUATION AND QUALIFYING ACCOUNTS AND RESERVES
(Dollars in thousands)
| Description |
Balance at Beginning of Period |
Charged (Credited) to Costs and Expenses |
Charged (Credited) to Other Accounts |
Other Deductions |
Balance at End of Period |
|||||||||||||||
| For the year ended December 31, 2017: |
||||||||||||||||||||
| Investment asset valuation reserves: |
||||||||||||||||||||
| Mortgage loans |
$ | — | $ | — | $ | — | $ | — | $ | — | ||||||||||
| Real estate |
— | — | — | — | — | |||||||||||||||
| Allowance for doubtful accounts: |
||||||||||||||||||||
| Premiums, accounts and notes receivable |
$ | 1,928 | $ | 251 | $ | — | $ | — | $ | 2,179 | ||||||||||
| Deferred tax asset valuation allowance |
— | — | — | — | — | |||||||||||||||
| Reinsurance receivables |
8,040 | — | — | — | 8,040 | |||||||||||||||
| For the year ended December 31, 2016: |
||||||||||||||||||||
| Investment asset valuation reserves: |
||||||||||||||||||||
| Mortgage loans |
$ | — | $ | — | $ | — | $ | — | $ | — | ||||||||||
| Real estate |
— | — | — | — | — | |||||||||||||||
| Allowance for doubtful accounts: |
||||||||||||||||||||
| Premiums, accounts and notes receivable |
$ | 1,646 | $ | 282 | $ | — | $ | — | $ | 1,928 | ||||||||||
| Deferred tax asset valuation allowance |
— | — | — | — | — | |||||||||||||||
| Reinsurance receivables |
9,675 | (1,635 | ) | — | — | 8,040 | ||||||||||||||
| For the year ended December 31, 2015: |
||||||||||||||||||||
| Investment asset valuation reserves: |
||||||||||||||||||||
| Mortgage loans |
$ | — | $ | — | $ | — | $ | — | $ | — | ||||||||||
| Real estate |
— | — | — | — | — | |||||||||||||||
| Allowance for doubtful accounts: |
||||||||||||||||||||
| Premiums, accounts and notes receivable |
$ | 1,518 | $ | 128 | $ | — | $ | — | $ | 1,646 | ||||||||||
| Deferred tax asset valuation allowance |
— | — | — | — | — | |||||||||||||||
| Reinsurance receivables |
9,350 | 325 | — | — | 9,675 | |||||||||||||||
S-9
Table of Contents
GLOBAL INDEMNITY LIMITED
SCHEDULE VI — SUPPLEMENTARY INFORMATION FOR PROPERTY CASUALTY UNDERWRITERS
(Dollars in thousands)
| Deferred Policy Acquisition Costs |
Reserves for Unpaid Claims and Claim Adjustment Expenses |
Discount If Any Deducted |
Unearned Premiums |
|||||||||||||
| Consolidated Property & Casualty Entities: |
||||||||||||||||
| As of December 31, 2017 |
$ | 61,647 | $ | 634,664 | $ | 1,200 | $ | 285,397 | ||||||||
| As of December 31, 2016 |
57,901 | 651,042 | 2,000 | 286,984 | ||||||||||||
| As of December 31, 2015 |
56,517 | 680,047 | 3,000 | 286,285 | ||||||||||||
| Earned Premiums |
Net Investment Income |
Claims and Claim Adjustment Expense Incurred Related To |
Amortization Of Deferred Policy Acquisition Costs |
Paid Claims and Claim Adjustment Expenses |
Premiums Written |
|||||||||||||||||||||||
| Current Year | Prior Year | |||||||||||||||||||||||||||
| Consolidated Property & Casualty Entities: |
||||||||||||||||||||||||||||
| For the year ended December 31, 2017 |
$ | 438,034 | $ | 39,323 | $ | 323,112 | $ | (53,900 | ) | $ | 108,964 | $ | 271,756 | $ | 450,180 | |||||||||||||
| For the year ended December 31, 2016 |
468,465 | 33,983 | 321,255 | (57,252 | ) | 114,317 | 317,369 | 470,940 | ||||||||||||||||||||
| For the year ended December 31, 2015 |
504,143 | 34,609 | 310,066 | (34,698 | ) | 86,170 | 332,417 | 501,244 | ||||||||||||||||||||
Note: All of the Company’s insurance subsidiaries are 100% owned and consolidated.
S-10