Attached files
| file | filename |
|---|---|
| EX-32.2 - KIMBALL ELECTRONICS, INC. EXHIBIT 32.2 - Kimball Electronics, Inc. | exhibit32206302018q410k.htm |
| EX-32.1 - KIMBALL ELECTRONICS, INC. EXHIBIT 32.1 - Kimball Electronics, Inc. | exhibit32106302018q410k.htm |
| EX-31.2 - KIMBALL ELECTRONICS, INC. EXHIBIT 31.2 - Kimball Electronics, Inc. | exhibit31206302018q410k.htm |
| EX-31.1 - KIMBALL ELECTRONICS, INC. EXHIBIT 31.1 - Kimball Electronics, Inc. | exhibit31106302018q410k.htm |
| EX-24 - KIMBALL ELECTRONICS, INC. EXHIBIT 24 - Kimball Electronics, Inc. | a10kexhibit2406302018q410k.htm |
| EX-23 - KIMBALL ELECTRONICS, INC. EXHIBIT 23 - Kimball Electronics, Inc. | a10kexhibit2306302018q410k.htm |
| EX-21 - KIMBALL ELECTRONICS, INC. EXHIBIT 21 - Kimball Electronics, Inc. | a10kexhibit2106302018q410k.htm |
| EX-10.1 - KIMBALL ELECTRONICS, INC. EXHIBIT 10.1 - Kimball Electronics, Inc. | exhibit101summarycompensat.htm |
| EX-2.2 - KIMBALL ELECTRONICS, INC. EXHIBIT 2.2 - Kimball Electronics, Inc. | exhibit22gesassetpurchasea.htm |
UNITED STATES
SECURITIES AND EXCHANGE COMMISSION
WASHINGTON, D.C. 20549
FORM 10-K
(Mark One)
x ANNUAL REPORT PURSUANT TO SECTION 13 OR 15(d) OF THE SECURITIES EXCHANGE ACT OF 1934
For the fiscal year ended June 30, 2018
OR
o TRANSITION REPORT PURSUANT TO SECTION 13 OR 15(d) OF THE SECURITIES EXCHANGE ACT OF 1934
For the transition period from to
Commission File Number 001-36454

KIMBALL ELECTRONICS, INC. | ||
(Exact name of registrant as specified in its charter) | ||
Indiana | 35-2047713 | |
(State or other jurisdiction of | (I.R.S. Employer Identification No.) | |
incorporation or organization) | ||
1205 Kimball Boulevard, Jasper, Indiana | 47546 | |
(Address of principal executive offices) | (Zip Code) | |
(812) 634-4000 | ||
Registrant’s telephone number, including area code | ||
Securities registered pursuant to Section 12(b) of the Act: | ||
Title of each Class | Name of each exchange on which registered | |
Common Stock, no par value | The NASDAQ Stock Market LLC | |
Securities registered pursuant to Section 12(g) of the Act: None | ||
Indicate by check mark if the registrant is a well-known seasoned issuer, as defined in Rule 405 of the Securities Act. Yes o No x | |
Indicate by check mark if the registrant is not required to file reports pursuant to Section 13 or 15(d) of the Act. Yes o No x | |
Indicate by check mark whether the registrant (1) has filed all reports required to be filed by Section 13 or 15(d) of the Securities Exchange Act of 1934 during the preceding 12 months (or for such shorter period that the registrant was required to file such reports), and (2) has been subject to such filing requirements for the past 90 days. Yes x No o | |
Indicate by check mark whether the registrant has submitted electronically and posted on its corporate Website, if any, every Interactive Data File required to be submitted and posted pursuant to Rule 405 of Regulation S-T (Section 232.405 of this chapter) during the preceding 12 months (or for such shorter period that the registrant was required to submit and post such files). Yes x No o | |
Indicate by check mark if disclosure of delinquent filers pursuant to Item 405 of Regulation S-K (Section 229.405 of this chapter) is not contained herein, and will not be contained, to the best of registrant’s knowledge, in definitive proxy or information statements incorporated by reference in Part III of this Form 10-K or any amendment to this Form 10-K. x | |
Indicate by check mark whether the registrant is a large accelerated filer, an accelerated filer, a non-accelerated filer, smaller reporting company, or an emerging growth company. See the definitions of “large accelerated filer,” “accelerated filer,” “smaller reporting company,” and “emerging growth company” in Rule 12b-2 of the Exchange Act. | |
Large accelerated filer o | Accelerated filer x |
Non-accelerated filer o | Smaller reporting company o |
(Do not check if a smaller reporting company) | Emerging growth company o |
If an emerging growth company, indicate by check mark if the registrant has elected not to use the extended transition period for complying with any new or revised financial accounting standards provided pursuant to Section 13(a) of the Exchange Act. o | |
Indicate by check mark whether the registrant is a shell company (as defined in Rule 12b-2 of the Exchange Act). Yes o No x | |
The aggregate market value of the common stock held by non-affiliates, as of December 29, 2017 (the last business day of the Registrant’s most recently completed second fiscal quarter), was $473.5 million based on 96.3% of common stock held by non-affiliates.
The number of shares outstanding of the Registrant’s common stock as of August 15, 2018 was 26,381,318 shares.
DOCUMENTS INCORPORATED BY REFERENCE
Portions of the Proxy Statement for the Annual Meeting of Share Owners to be held on November 8, 2018, are incorporated by reference into Part III.
KIMBALL ELECTRONICS, INC.
FORM 10-K INDEX
Page No. | ||
PART I | ||
PART II | ||
PART III | ||
PART IV | ||
2
PART I
Item 1 - Business
General
As used herein, the terms “Company,” “Kimball Electronics,” “we,” “us,” or “our” refer to Kimball Electronics, Inc., the Registrant, and its subsidiaries. Reference to a year relates to a fiscal year, ended June 30 of the year indicated, rather than a calendar year unless the context indicates otherwise. Additionally, references to the first, second, third, and fourth quarters refer to those respective quarters of the fiscal year indicated.
Forward-Looking Statements
This document contains certain forward-looking statements. These are statements made by management, using their best business judgment based upon facts known at the time of the statements or reasonable estimates, about future results, plans, or future performance and business of the Company. Such statements involve risk and uncertainty, and their ultimate validity is affected by a number of factors, both specific and general. They should not be construed as a guarantee that such results or events will, in fact, occur or be realized as actual results may differ materially from those expressed in these forward-looking statements. The statements may be identified by the use of words such as “believes,” “anticipates,” “expects,” “intends,” “plans,” “projects,” “estimates,” “forecasts,” “seeks,” “likely,” “future,” “may,” “might,” “should,” “would,” “will,” and similar expressions. It is not possible to foresee or identify all factors that could cause actual results to differ from expected or historical results. We make no commitment to update these factors or to revise any forward-looking statements for events or circumstances occurring after the statement is issued, except as required by law.
The risk factors discussed in Item 1A - Risk Factors of this report could cause our results to differ materially from those expressed in forward-looking statements. There may be other risks and uncertainties that we are unable to predict at this time or that we currently do not expect to have a material adverse effect on our business. Any such risks could cause our results to differ materially from those expressed in forward-looking statements.
At any time when we make forward-looking statements, we desire to take advantage of the “safe harbor” which is afforded such statements under the Private Securities Litigation Reform Act of 1995 where factors could cause actual results to differ materially from forward-looking statements.
Overview
Kimball Electronics was founded in 1961 and was incorporated in 1998. We are a global provider of contract electronic manufacturing services, including engineering and supply chain support, to customers in the automotive, medical, industrial, and public safety end markets. We offer a package of value that begins with our core competency of producing “durable electronics” and have expanded into diversified contract manufacturing services for non-electronic components, medical disposables, plastics, and metal fabrication. This package of value includes our set of robust processes and procedures that help us ensure that we deliver the highest levels of quality, reliability, and service throughout the entire life cycle of our customers’ products. We believe our customers appreciate our body of knowledge as it relates to the design and manufacture of their products that require durability, reliability, the highest levels of quality control, and regulatory compliance. We deliver award-winning service from our highly integrated global footprint which is enabled by a largely common operating system, a standardization strategy, global procedures, and teamwork. Our Customer Relationship Management (“CRM”) model is key to providing our customers convenient access to our global footprint and all of our services throughout the entire product life cycle, making us easy to do business with. Because our customers are in businesses where engineering changes must be tightly controlled and long product life cycles are common, our track record of quality, financial stability, social responsibility, and commitment to long-term relationships is important to them.
We have been producing safety critical electronic assemblies for our automotive customers for over 30 years. During this time, we have built up a body of knowledge that has not only proven to be valuable to our automotive customers, but to our medical, industrial, and public safety customers as well. We have been successful in growing and diversifying our business by leveraging our automotive experience and know-how in the areas of design and process validation, traceability, process and change control, and lean manufacturing to create valuable and innovative solutions for new customers in the medical, industrial, and public safety end market verticals. These solutions include diversified contract manufacturing services as we now offer our customers design engineering and manufacturing expertise in precision metals and plastics. We have harmonized our quality systems to be compliant with various important industry certifications and regulatory requirements. This allows us to take advantage of other strategic points of leverage in the supply chain and within our operations so we can cost-effectively manufacture electronic and non-electronic products in the same production facility for customers from all four of our end market verticals.
3
Many of our customers are multinational companies that sell their products in multiple regions of the world. For these customers, it is important for them to be able to leverage their investment in their supply partner relationships such that the same partner provides them with engineering, manufacturing, and supply chain support in multiple regions of the world. It is common for us to manufacture the same product for the same customer in multiple locations. Our strategy for expanding our global footprint has aligned us with the preferences of the customers in our four end market verticals and has positioned us well to support their global growth initiatives. Our global systems, procedures, processes, and teamwork combined with our CRM model have allowed us to accomplish this goal for many of our largest customers.
Our global processes and central functions that support component sourcing, procurement, quoting, and customer pricing provide commonality and consistency among the various regions in which we operate. We have a central, global sourcing organization that utilizes procurement processes and practices to help secure sources from around the world and to ensure sufficient availability of components and a uniform approach to pricing while leveraging the purchase volume of the entire organization. Customer pricing for all of the products we produce is managed centrally utilizing a standardized quoting model regardless of where our customers request their products to be produced.
Our CRM model combines members of our team from within our manufacturing facilities and members of our business development team who reside remotely and nearer to our customers around the world. We also have cross functional teams in the areas of quality, operational excellence, quoting, and design engineering with representatives from our various locations that provide support to our teams on a global basis. The skill sets of these team members and the clarity in their roles and responsibilities help provide our customers with a strong conduit that is critical to execution and forming a strong relationship. We have institutionalized a customer scorecard process that provides all levels of our company with valuable feedback that helps us drive the actions for continuous improvement. Our customer scorecard process has helped us deliver award-winning service and build loyalty with our customers.
Our corporate headquarters is located at 1205 Kimball Boulevard, Jasper, Indiana. Production occurs in our facilities located in the United States, China, Mexico, Poland, Romania, and Thailand.
Our services are sold globally on a contract basis, and we produce products to our customers’ specifications. Our manufacturing services primarily include:
• | Design services and support; |
• | Supply chain services and support; |
• | Rapid prototyping and new product introduction support; |
• | Product design and process validation and qualification; |
• | Industrialization and automation of manufacturing processes; |
• | Reliability testing (testing of products under a series of extreme environmental conditions); |
• | Production and testing of printed circuit board assemblies (PCBAs); |
• | Assembly, production, and packaging of medical disposables and other non-electronic products; |
• | Design engineering and production of precision plastics and metal fabrication; and |
• | Complete product life cycle management. |
We pride ourselves on the fact that we pay close attention to the evolving needs and preferences of our customers. As we have done in the past, we will continue to look for opportunities to grow and diversify our business by expanding our package of value and our global footprint.
Spin-Off
Kimball Electronics, Inc. was a wholly owned subsidiary of Kimball International, Inc. (“former Parent” or “Kimball International”) and on October 31, 2014 became a stand-alone public company upon the completion of a spin-off from former Parent. In conjunction with the spin-off, on October 31, 2014, Kimball International distributed 29.1 million shares of Kimball Electronics common stock to Kimball International Share Owners. Holders of Kimball International common stock received three shares of Kimball Electronics common stock for every four shares of Kimball International common stock held on October 22, 2014. Kimball International structured the distribution to be tax free to its U.S. Share Owners for U.S. federal income tax purposes.
4
Reporting Segment
Operating segments are defined as components of an enterprise for which separate financial information is available that is evaluated regularly by the chief operating decision maker, or decision making group, in deciding how to allocate resources and in assessing performance. Each of our business units qualifies as an operating segment with its results regularly reviewed by our chief operating decision maker. Our chief operating decision maker is our Chief Executive Officer. Our business units meet the aggregation criteria under the current accounting guidance for segment reporting. As of June 30, 2018, all of our business units operate in the electronic manufacturing services industry that provide electronic assemblies and/or components primarily in automotive, medical, industrial, and public safety applications, all to the specifications and designs of our customers. The nature of the products, the production process, the type of customers, and the methods used to distribute the products, all have similar characteristics. Each of our business units service customers in multiple markets and many of our customers’ programs are manufactured and serviced by multiple business units. Our global processes such as component procurement and customer pricing provide commonality and consistency among the various regions in which we operate. All of our business units have similar long-term economic characteristics. As such, our business units have been aggregated into one reportable segment. See Item 6 - Selected Financial Data for more information regarding the Company’s financial results.
Our Business Strategy
We intend to achieve sustained, profitable growth in the markets we serve by supporting the global growth initiatives of our customers, and we will continue our development beyond the electronic manufacturing services (“EMS”) market to become a multifaceted manufacturing solutions company. Key elements of executing our strategy include:
• | Leveraging Our Global Footprint – continue our strategy of utilizing our presence in key global regions, including new potential country locations and/or facility expansion as our customer demands dictate; |
• | Expanding Our Package of Value – enhance our core strengths and expand upon our package of value through diversified contract manufacturing services in areas such as complex system assembly, specialized processes, precision metals, and plastics; and |
• | Expanding Our Markets - explore opportunities that will establish new markets, platforms, and technologies beyond the EMS market such as the automation, test, and measurement systems market. |
To expand our markets and implement our new platform strategy, we expect to make investments that will help us develop beyond the EMS market, including through acquisitions. As part of this strategy, we entered into an agreement on May 11, 2018 with GES Holdings, Inc., Global Equipment Services and Manufacturing, Inc., and its subsidiaries (collectively referred to as “GES”) to acquire substantially all of the assets and assume certain liabilities of GES. We will pay a cash purchase price of approximately $50 million plus the assumed liabilities, and the transaction price is subject to certain post-closing working capital adjustments. The GES acquisition is expected to close in the first quarter of our fiscal year 2019, subject to customary closing conditions, including regulatory requirements and governmental approvals. The GES acquisition supports our new platform strategy as GES specializes in production processing and test equipment design, volume manufacturing, and global services for the semiconductor and electronics product manufacturing industry. See Item 1A - Risk Factors for risks associated with this acquisition and Note 2 - Acquisitions of Notes to Consolidated Financial Statements for more information on this pending acquisition.
Our Business Offerings
We offer contract electronic manufacturing services, including engineering and supply chain support, to customers in the automotive, medical, industrial, and public safety end market verticals. We also offer diversified contract manufacturing services for non-electronic components, medical disposables, plastics, and metal fabrication. Our services support the complete product life cycle of our customers’ products, and our processes and capabilities cover a range of products from high volume-low mix to high mix-low volume. We collaborate with third-party design services companies to bring innovative, complete design solutions to our customers. We offer Design for Excellence input to our customers as a part of our standard package of value. We use sophisticated software tools to integrate the supply chain in a way that provides our customers with the flexibility their business requires. Our robust new product introduction process and our extensive manufacturing capabilities give us the ability to execute to the quality and reliability expectations in the electronics manufacturing industry.
We value our customers and their unique needs and expectations. Our customer focus and dedication to unparalleled excellence in engineering and manufacturing has resulted in proven success in the contract manufacturing industry. Personal relationships are important to us. We strive to build long-term global partnerships. Our commitment to support our customers is backed by our history and demonstrated performance over the past 50 years.
5
Marketing Channels
Manufacturing services, including engineering and supply chain support, are marketed by our business development team. We use a CRM model to provide our customers with convenient access to our global footprint and all of our services throughout the entire product life cycle.
Major Competitive Factors
Key competitive factors in the EMS market include competitive pricing, quality and reliability, engineering design services, production flexibility, on-time delivery, customer lead time, test capability, and global presence. Growth in the EMS industry is created through the proliferation of electronic components in today’s advanced products and the continuing trend of original equipment manufacturers in the electronics industry subcontracting the assembly process to companies with a core competency in this area. The nature of the EMS industry is such that the start-up of new customers and new programs to replace expiring programs occurs frequently. New customer and program start-ups generally cause losses early in the life of a program, which are generally recovered as the program becomes established and matures. We continue to experience margin pressures related to an overall excess capacity position in the electronics subcontracting services market and from our customers’ own capacity and capabilities to in-source production. Our continuing success depends upon our ability to replace expiring customers/programs with new customers/programs.
We do not believe that we, or the industry in general, have any special practices or special conditions affecting working capital items that are significant for understanding our EMS business other than fluctuating inventory levels which may increase in conjunction with transfers of production among facilities and start-up of new programs.
Our Competitive Strengths
Our competitive strengths derive from our experience of producing safety critical electronic assemblies for automotive customers for over 30 years and leveraging this experience to create valuable and innovative solutions for customers in different industries. Our core strengths include:
• | Our core competency of producing durable electronics; |
• | Our body of knowledge as it relates to the design and manufacture of products that require high levels of quality control, reliability, and durability; |
• | Our highly integrated, global footprint; |
• | Our capability to provide our customers diversified contract manufacturing services for non-electronic components, medical disposables, plastics, and metal fabrication; |
• | Our CRM model and our customer scorecard process; |
• | Our ability to provide our customers with valuable input regarding designs for improved manufacturability, reliability, and cost; |
• | Our quality systems, industry certifications, and regulatory compliance; |
• | Our integrated supply chain solutions and competitive bid process resulting in competitive raw material pricing; and |
• | Complete product life cycle management. |
Competitors
The EMS industry is very competitive as numerous manufacturers compete for business from existing and potential customers. Our competition includes EMS companies such as Benchmark Electronics, Inc., Jabil Inc., and Plexus Corp. We do not have a significant share of the EMS market and were ranked the 19th largest global EMS provider for calendar year 2017 by Manufacturing Market Insider in the March 2018 edition published by New Venture Research.
Locations
As of June 30, 2018, we have nine manufacturing facilities with three located in Indiana and one located in each of Florida, China, Mexico, Poland, Romania, and Thailand. We continually assess our capacity needs and evaluate our operations to optimize our service levels for supporting our customers’ needs around the globe. During fiscal year 2016, the construction of our greenfield facility in Romania was completed. We recently acquired certain assets and assumed certain liabilities of two contract manufacturing companies located in Indiana, one during fiscal year 2017 and one during fiscal year 2016. See Item 1A - Risk Factors for information regarding financial and operational risks related to our international operations, acquisitions, and start-up operations. Financial information by geographic area for each of the three years in the period ended June 30, 2018 is included in Note 15 - Geographic Information of Notes to Consolidated Financial Statements.
6
Seasonality
Sales revenue of our EMS business is generally not affected by seasonality.
Customers
While the total electronic assemblies market has broad applications, our customers are concentrated in the automotive, medical, industrial, and public safety industries.
Sales by industry as a percent of net sales for each of the three years in the period ended June 30, 2018 were as follows:
Year Ended June 30 | |||||
2018 | 2017 | 2016 | |||
Automotive | 44% | 41% | 39% | ||
Medical | 29% | 28% | 30% | ||
Industrial | 20% | 22% | 22% | ||
Public Safety | 6% | 7% | 7% | ||
Other | 1% | 2% | 2% | ||
Total | 100% | 100% | 100% | ||
See Note 15 - Geographic Information of Notes to Consolidated Financial Statements for financial information reported by geographic area.
Included in our sales were a significant amount to ZF, Philips, and Nexteer Automotive, which accounted for the following portions of net sales:
Year Ended June 30 | |||||
2018 | 2017 | 2016 | |||
ZF | 15% | 12% | 11% | ||
Philips | 13% | 14% | 15% | ||
Nexteer Automotive | 13% | 12% | * | ||
* amount is less than 10% of total | |||||
The nature of the contract business is such that start-up of new customers to replace expiring customers occurs frequently. Our agreements with customers are often not for a definitive term and are amended and extended, but generally continue for the relevant product’s life cycle, which can be difficult to predict at the beginning of a program. Typically, our customer agreements do not commit the customer to purchase our services until a purchase order is provided, which are generally short-term in nature. Our customers generally have the right to cancel a particular program subject to contractual provisions governing termination, the final product runs, excess or obsolete inventory, and end-of-life pricing, which reduces the additional costs that we incur when a manufacturing services agreement is terminated.
Backlog
The aggregate sales price of production pursuant to worldwide open orders, which in certain cases may be canceled by the customer subject to contractual termination provisions, was $293.1 million and $214.3 million as of June 30, 2018 and 2017, respectively. Substantially all of the open orders as of June 30, 2018 are expected to be filled within the next fiscal year. Open orders may not be indicative of future sales trends.
Raw Materials
Raw materials utilized in the manufacture of contract electronic products are generally readily available from both domestic and foreign sources, although from time to time the industry experiences shortages of certain components due to supply and demand forces, combined with rapid product life cycles of certain components. In addition, unforeseen events such as natural disasters can and have disrupted portions of the supply chain. We believe that maintaining close communication with suppliers helps minimize potential disruption in our supply chain.
Raw materials are normally acquired for specific customer orders and may or may not be interchangeable among products. Inherent risks associated with rapid technological changes within this contract industry are mitigated by procuring raw materials, for the most part, based on firm orders. In certain instances, such as when lead times dictate, we enter into contractual agreements for material in excess of the levels required to fulfill customer orders. In turn, material authorization agreements with customers cover a portion of the exposure for material which is purchased prior to having a firm order. We may also purchase additional inventory to support new product introductions and transfers of production between manufacturing facilities.
7
Research and Development
Research and development activities include the development of manufacturing processes, engineering and testing procedures, major process improvements, and information technology initiatives.
Research and development costs were approximately:
Year Ended June 30 | |||||
(Amounts in Millions) | 2018 | 2017 | 2016 | ||
Research and Development Costs | $11 | $10 | $9 | ||
Intellectual Property
Our primary intellectual property is our proprietary manufacturing technology and processes which allow us to provide very competitive electronic manufacturing services to our customers. As such, this intellectual property is complex and normally contained within our facilities. The nature of this know-how does not lend itself well to traditional patent protection. In addition, we feel the best protection strategy involves maintaining our intellectual property as trade secrets because there is no disclosure of the information to outside parties, and there is no expiration on the length of protection. For these reasons, we do not own any patents that we consider significant to our business, and our only registered trademark is the “Kimball” name as registered in certain categories relating to our electronics manufacturing and design services, which were assigned to us by former Parent.
Environment and Energy Matters
Our operations are subject to various foreign, federal, state, and local laws and regulations with respect to environmental matters. We believe that we are in substantial compliance with present laws and regulations and that there are no material liabilities related to such items.
We are dedicated to excellence, leadership, and stewardship in protecting the environment and communities in which we have operations. We believe that continued compliance with foreign, federal, state, and local laws and regulations which have been enacted relating to the protection of the environment will not have a material effect on our capital expenditures, earnings, or competitive position. Management believes capital expenditures for environmental control equipment during the two fiscal years ending June 30, 2020 will not represent a material portion of total capital expenditures during those years.
Our operations require significant amounts of energy, including natural gas and electricity. Federal, foreign, and state regulations may control the allocation of fuels available to us, but to date we have experienced no interruption of production due to such regulations.
Employees
As of June 30, 2018, Kimball Electronics employed approximately 5,700 people worldwide, with approximately 1,100 located in the United States and approximately 4,600 located in foreign countries. Our U.S. operations are not subject to collective bargaining arrangements. Most of our foreign operations are subject to collective bargaining arrangements, many mandated by government regulation or customs of the particular countries. We believe that our employee relations are good.
Available Information
The Company makes available free of charge through its website, http://investors.kimballelectronics.com, its annual reports on Form 10-K, quarterly reports on Form 10-Q, current reports on Form 8-K, proxy statements, and all amendments to those reports as soon as reasonably practicable after such material is electronically filed with, or furnished to, the Securities and Exchange Commission (“SEC”). All reports the Company files with the SEC are also available via the SEC website, http://www.sec.gov, or may be read and copied at the SEC Public Reference Room located at 100 F Street, N.E., Washington, D.C. 20549. Information on the operation of the Public Reference Room may be obtained by calling the SEC at 1-800-SEC-0330. The Company’s website and the information contained therein, or incorporated therein, are not intended to be incorporated into this Annual Report on Form 10-K.
Item 1A - Risk Factors
The following important risk factors, among others, could affect future results and events, causing results and events to differ materially from those expressed or implied in forward-looking statements made in this report and presented elsewhere by management from time to time. Such factors, among others, may have a material adverse effect on our business, financial
8
condition, and results of operations and should be carefully considered. Additional risks and uncertainties that we do not currently know about, we currently believe are immaterial, or we have not predicted may also affect our business, financial condition, or results of operations. Because of these and other factors, past performance should not be considered an indication of future performance.
Risks Relating to Our Business
Uncertain macroeconomic and industry conditions could adversely impact demand for our products and services and adversely affect operating results.
Market demand for our products and services, which impacts revenues and gross profit, is influenced by a variety of economic and industry factors such as:
• | instability of the global financial markets; |
• | uncertainty of worldwide economic conditions; |
• | volatile energy costs; |
• | erosion of global consumer confidence; |
• | general corporate profitability of our end markets; |
• | credit availability to our customers and our customers’ end markets; |
• | demand fluctuations in the industries we currently serve, including automotive, medical, industrial, and public safety; |
• | demand for end-user products which include electronic assembly components produced by us; |
• | excess capacity in the industries in which we compete; and |
• | changes in customer order patterns, including changes in product quantities, delays in orders, or cancellation of orders. |
We must make decisions based on order volumes in order to achieve efficiency in manufacturing capacities. These decisions include determining what level of additional business to accept, production schedules, component procurement commitments, and personnel requirements, among various other considerations. We must constantly monitor the changing economic landscape and may modify our strategic direction based upon the changing business environment. If we do not react quickly enough to the changes in market or economic conditions, it could result in lost customers, decreased market share, and increased operating costs.
Many countries, including certain of those in North America, Europe, and Asia in which we operate, have in the recent past experienced economic uncertainty, slow economic growth, or recession. The economic recovery of recent years may slow and recessionary conditions may return, which could result in our customers or potential customers reducing or delaying orders as well as a number of other negative effects on our business, such as increased pricing pressures, the insolvency of suppliers, which could cause production delays, the inability of customers to obtain credit, or the insolvency of customers. In addition, the uncertainties of the market and economic conditions, both in Europe and worldwide, caused by the United Kingdom’s pending exit from the European Union could also have an adverse effect on our business and results of operations.
We are exposed to the credit risk of our customers.
The instability of market conditions drives an elevated risk of potential bankruptcy of customers resulting in a greater risk of uncollectible outstanding accounts receivable. Accordingly, we intensely monitor our receivables and related credit risks. The realization of these risks could have a negative impact on our profitability.
Reduction of purchases by or the loss of one or more key customers could reduce revenues and profitability.
Losses of key contract customers within specific industries or significant volume reductions from key contract customers are both risks. If one of our current customers merges with or is acquired by a party that currently is aligned with a competitor, or the combination creates excess capacity, we could lose future revenues. Our continuing success is dependent upon replacing expiring contract customers/programs with new customers/programs. See “Customers” in Item 1 - Business for disclosure of the net sales as a percentage of consolidated net sales for each of our significant customers during fiscal years 2018, 2017, and 2016. Regardless of whether our agreements with our customers, including our significant customers, have a definite term, our customers typically do not have an obligation to purchase a minimum quantity of products or services as individual purchase orders or other product or project specific documentation are typically entered into from time to time. Our customers generally have the right to cancel a particular product, subject to contractual provisions governing the final product runs, excess or obsolete inventory, and end-of-life pricing. As such, our ability to continue the relationships with such customers is uncertain.
9
Significant declines in the level of purchases by key customers or the loss of a significant number of customers could have a material adverse effect on our business. In addition, the nature of the contract electronics manufacturing industry is such that the start-up of new customers and new programs to replace expiring programs occurs frequently, and new customer and program start-ups generally cause losses early in the life of a program. We can provide no assurance that we will be able to fully replace any lost sales, which could have an adverse effect on our financial position, results of operations, or cash flows.
We operate in a highly competitive environment and may not be able to compete successfully.
Numerous manufacturers within the EMS industry compete globally for business from existing and potential customers. Some of our competitors have greater resources and more geographically diversified international operations than we do. We also face competition from the manufacturing operations of our customers, who are continually evaluating the merits of manufacturing products internally against the advantages of outsourcing to EMS providers. In the past, some of our customers have decided to in-source a portion of their electronics manufacturing from us in order to utilize their excess internal manufacturing capacity. The competition may further intensify as more companies enter the markets in which we operate, as existing competitors expand capacity and as the industry consolidates.
In relation to customer pricing pressures, if we cannot achieve the proportionate reductions in costs, profit margins may suffer. The high level of competition in the industry impacts our ability to implement price increases or, in some cases, even maintain prices, which also could lower profit margins. In addition, as end markets dictate, we are continually assessing excess capacity and developing plans to better utilize manufacturing operations, including consolidating and shifting manufacturing capacity to lower cost venues as necessary.
As of June 30, 2018, we are no longer an “emerging growth company” and are therefore subject to the auditor attestation requirement in the assessment of our internal control over financial reporting and certain other increased disclosure and governance requirements.
Because our total annual gross revenues exceed $1.07 billion as of June 30, 2018, we are no longer an “emerging growth company,” as defined in the JOBS Act. Therefore, we are now subject to certain requirements that apply to other public companies but did not previously apply to us due to our status as an emerging growth company. These requirements include:
• | compliance with the auditor attestation requirement in the assessment of our internal control over financial reporting pursuant to Section 404 of the Sarbanes-Oxley Act; |
• | compliance with any new rules that may be adopted by the Public Company Accounting Oversight Board; |
• | compliance with any new or revised financial accounting standards applicable to public companies without an extended transition period; |
• | full disclosure regarding executive compensation required of larger public companies; and |
• | compliance with the requirement of holding a nonbinding advisory vote on executive compensation and obtaining Share Owner approval of any golden parachute payments not previously approved. |
Failure to comply with these requirements could subject us to enforcement actions by the SEC, divert management’s attention, damage our reputation, and adversely affect our business, results of operations, or financial condition. In particular, if our independent registered public accounting firm is not able to render the required attestation, it could result in lost investor confidence in the accuracy, reliability, and completeness of our financial reports. We expect that the loss of “emerging growth company” status and compliance with these increased requirements will require management to expend additional time while also condensing the time frame available to comply with certain requirements, which may further increase our legal and financial compliance costs.
We may be unable to purchase a sufficient amount of materials, parts, and components for use in our products at competitive prices, in a timely manner, or at all.
We depend on suppliers globally to provide timely delivery of materials, parts, and components for use in our products. The financial stability of suppliers is monitored by us when feasible as the loss of a significant supplier could have an adverse impact on our operations. Suppliers adjust their capacity as demand fluctuates, and component shortages and/or component allocations could occur. Certain components purchased by us are primarily manufactured in select regions of the world and issues in those regions could cause manufacturing delays. Maintaining strong relationships with key suppliers of components critical to the manufacturing process is essential. Price increases of commodity components could have an adverse impact on our profitability if we cannot offset such increases with other cost reductions or by price increases to customers. Materials utilized in our manufacturing process are generally available, but future availability is unknown and could impact our ability to meet customer order requirements. If suppliers fail to meet commitments to us in terms of price, delivery, or quality, it could interrupt our operations and negatively impact our ability to meet commitments to customers.
10
Our operating results could be adversely affected by increases in the cost of fuel and other energy sources.
The cost of energy is a critical component of freight expense and the cost of operating manufacturing facilities. Increases in the cost of energy could reduce our profitability.
We are subject to manufacturing inefficiencies due to start-up of new programs, transfer of production, and other factors.
At times, we may experience labor or other manufacturing inefficiencies due to factors such as start-up of new programs, transfers of production among our manufacturing facilities, a sudden decline in sales, a new operating system, or turnover in personnel. Manufacturing inefficiencies could have an adverse impact on our financial position, results of operations, or cash flows.
A change in our sales mix among various products could have a negative impact on our gross profit margin.
Changes in product sales mix could negatively impact our gross margin as margins of different products vary. We strive to improve the margins of all products, but certain products have lower margins in order to price the product competitively or in connection with the start-up of a new program. An increase in the proportion of sales of products with lower margins could have an adverse impact on our financial position, results of operations, or cash flows.
We may implement future restructuring efforts and those efforts may not be successful.
We continually evaluate our manufacturing capabilities and capacities in relation to current and anticipated market conditions. We may implement restructuring plans in the future, and the successful execution of those restructuring initiatives will be dependent on various factors and may not be accomplished as quickly or effectively as anticipated.
We will face risks commonly encountered with growth through acquisitions.
Our sales growth plans may occur through both organic growth and acquisitions. Acquisitions involve many risks, including:
• | difficulties in identifying suitable acquisition candidates and in negotiating and consummating acquisitions on terms attractive to us; |
• | difficulties in the assimilation of the operations of the acquired company; |
• | the diversion of resources, including diverting management’s attention from our current operations; |
• | risks of entering new geographic or product markets in which we have limited or no direct prior experience; |
• | the potential loss of key customers of the acquired company; |
• | the potential loss of key employees of the acquired company; |
• | the potential incurrence of indebtedness to fund the acquisition; |
• | the potential issuance of common stock for some or all of the purchase price, which could dilute ownership interests of our current Share Owners; |
• | the acquired business not achieving anticipated revenues, earnings, cash flow, or market share; |
• | excess capacity; |
• | the assumption of undisclosed liabilities; |
• | potential adverse tax effects; and |
• | dilution of earnings. |
We may not be successful in launching start-up operations.
We are committed to growing our business, and therefore from time to time, we may determine that it would be in our best interest to start up a new operation. Start-up operations involve a number of risks and uncertainties, such as funding the capital expenditures related to the start-up operation, developing a management team for the new operation, diversion of management focus away from current operations, and creation of excess capacity. Any of these risks could have a material adverse effect on our financial position, results of operations, or cash flows.
11
If efforts to start-up new programs are not successful, this could limit sales growth or cause sales to decline.
As we depend on industries that utilize technologically advanced electronic components which often have short life cycles, we must continue to invest in advanced equipment and product development to remain competitive in this area. The start-up of new programs requires the coordination of the design and manufacturing processes. The design and engineering required for certain new programs can take an extended period of time, and further time may be required to achieve customer acceptance. Accordingly, the launch of any particular program may be delayed, less successful than we originally anticipated, or not successful at all. Difficulties or delays in starting up new programs or lack of customer acceptance of such programs could limit sales growth or cause sales to decline and adversely impact our operating results.
Our international operations involve financial and operational risks.
We have operations outside the United States, primarily in China, Mexico, Poland, Romania, and Thailand. Our international operations are subject to a number of risks, which may include the following:
• | economic and political instability, including the uncertainties caused by the United Kingdom’s pending exit from the European Union; |
• | warfare, riots, terrorism, and other forms of violence or geopolitical disruption; |
• | compliance with laws, such as the Foreign Corrupt Practices Act, applicable to U.S. companies doing business outside the United States; |
• | changes in U.S. or foreign policies, regulatory requirements, and laws; |
• | tariffs and other trade barriers, including tariffs recently imposed by the United States as well as responsive tariffs imposed by China and the European Union; |
• | potentially adverse tax consequences, including changes in tax rates and the manner in which multinational companies are taxed in the United States and other countries; and |
• | foreign labor practices. |
These risks could have an adverse effect on our financial position, results of operations, or cash flows. In addition, fluctuations in exchange rates could impact our operating results. Our risk management strategy includes the use of derivative financial instruments to hedge certain foreign currency exposures. Any hedging techniques we implement contain risks and may not be entirely effective. Exchange rate fluctuations could also make our products more expensive than competitors’ products not subject to these fluctuations, which could adversely affect our revenues and profitability in international markets.
Certain foreign jurisdictions restrict the amount of cash that can be transferred to the United States or impose taxes and penalties on such transfers of cash. To the extent we have excess cash in foreign locations that could be used in, or is needed by, our operations in the United States, we may incur significant penalties and/or taxes to repatriate these funds.
If customers do not perceive our engineering and manufacturing services to be innovative and of high quality, our reputation could suffer.
We believe that establishing and maintaining a good reputation is critical to our business. Promotion and enhancement of our name will depend on the effectiveness of marketing and advertising efforts and on successfully providing innovative and high quality electronic engineering and manufacturing services. If customers do not perceive our services to be innovative and of high quality, our reputation could suffer, which could have a material adverse effect on our business.
Failure to effectively manage working capital may adversely affect our cash flow from operations.
We closely monitor inventory and receivable efficiencies and continuously strive to improve these measures of working capital, but customer financial difficulties, cancellation or delay of customer orders, shifts in customer payment practices, transfers of production among our manufacturing facilities, or manufacturing delays could adversely affect our cash flow from operations.
We may not be able to achieve maximum utilization of our manufacturing capacity.
Most of our customers do not commit to long-term production schedules, and we are unable to forecast the level of customer orders with certainty over a given period of time. As a result, at times it can be difficult for us to schedule production and maximize utilization of our manufacturing capacity. Fluctuations and deferrals of customer orders may have a material adverse effect on our ability to utilize our fixed capacity and thus negatively impact our operating margins.
12
We could incur losses due to asset impairment.
As business conditions change, we must continually evaluate and work toward the optimum asset base. It is possible that certain assets such as, but not limited to, facilities, equipment, intangible assets, or goodwill could be impaired at some point in the future depending on changing business conditions. Such impairment could have an adverse impact on our financial position and results of operations.
Fluctuations in our effective tax rate could have a significant impact on our financial position, results of operations, or cash flows.
Our effective tax rate is highly dependent upon the geographic mix of earnings across the jurisdictions where we operate. Changes in tax laws or tax rates in those jurisdictions could have a material impact on our operating results. Judgment is required in determining the worldwide provision for income taxes, other tax liabilities, interest, and penalties. We base our tax position upon the anticipated nature and conduct of our business and upon our understanding of the tax laws of the various countries in which we have assets or conduct activities. Our tax position, however, is subject to review and possible challenge by taxing authorities and to possible changes in law (including adverse changes to the manner in which the United States and other countries tax multinational companies or interpret their tax laws). We cannot determine in advance the extent to which some jurisdictions may assess additional tax or interest and penalties on such additional taxes. In addition, our effective tax rate may be increased by changes in the valuation of deferred tax assets and liabilities, changes in our cash management strategies, changes in local tax rates, or countries adopting more aggressive interpretations of tax laws.
Several countries where we operate provide tax incentives to attract and retain business. We have obtained incentives where available and practicable. Our taxes could increase if: certain incentives were retracted, they were not renewed upon expiration, we no longer qualify for such programs, or tax rates applicable to us in such jurisdictions were otherwise increased. In addition, further acquisitions may cause our effective tax rate to increase. Given the scope of our international operations and our international tax arrangements, changes in tax rates and the manner in which multinational companies are taxed in the United States and other countries could have a material impact on our financial results and competitiveness. For example, on December 22, 2017, the United States enacted the Tax Cuts and Jobs Act (“Tax Reform”), which includes a number of significant changes to previous U.S. tax laws that impact us, including provisions for a one-time transition tax on deemed repatriation of undistributed foreign earnings and a reduction in the corporate tax rate from 35% to 21%, among other changes. Tax Reform also transitions U.S. international taxation from a worldwide system to a modified territorial system and includes base erosion prevention measures on non-U.S. earnings.
Certain of our subsidiaries provide financing, products, and services to, and may undertake certain significant transactions with, other subsidiaries in different jurisdictions. Moreover, several jurisdictions in which we operate have tax laws with detailed transfer pricing rules which require that all transactions with non-resident related parties be priced using arm’s length pricing principles and that contemporaneous documentation must exist to support such pricing. Due to inconsistencies among jurisdictions in the application of the arm’s length standard, our transfer pricing methods may be challenged and, if not upheld, could increase our income tax expense. Risks associated with transfer pricing adjustments are further highlighted by the global initiative from the Organization for Economic Cooperation and Development (“OECD”) known as the Base Erosion and Profit Shifting (“BEPS”) project. The BEPS project is challenging longstanding international tax norms regarding the taxation of profits from cross-border business. Given the scope of our international operations and the fluid and uncertain nature of how the BEPS project might ultimately lead to future legislation, it is difficult to assess how any changes in tax laws would impact our income tax expense.
A failure to comply with the financial covenants under our primary credit facility could adversely impact us.
Our primary credit facility requires us to comply with certain financial covenants. We believe the most significant covenants under this credit facility are the ratio of consolidated indebtedness minus unencumbered U.S. cash on hand in the United States in excess of $15 million to adjusted consolidated EBITDA, as defined in the credit facility, and the fixed charge coverage ratio. More detail on these financial covenants is discussed in Item 7 - Management’s Discussion and Analysis of Financial Condition and Results of Operations. As of June 30, 2018, we had $6.0 million in short-term borrowings under this credit facility and had total cash and cash equivalents of $46.4 million. In the future, a default on the financial covenants under our credit facility could cause an increase in the borrowing rates or make it more difficult for us to secure future financing, which could adversely affect our financial condition.
13
Our business may be harmed due to failure to successfully implement information technology solutions or a lack of reasonable safeguards to maintain data security, including adherence to data privacy laws and physical security measures.
The operation of our business depends on effective information technology systems, which are subject to the risk of security breach or cybersecurity threat, including misappropriation of assets or other sensitive information, such as confidential business information and personally identifiable data relating to employees, customers, and other business partners, or data corruption which could cause operational disruption. As we could be the target of cyber and other security threats, we must continuously monitor and develop our information technology networks and infrastructure to prevent, detect, address, and mitigate the risk of unauthorized access, misuse, computer viruses, and other events that could have a security impact. Information systems require an ongoing commitment of significant resources to maintain and enhance existing systems and to develop new systems in order to keep pace with changes in information processing technology and evolving industry standards as well as to protect against cyber risks and security breaches. While we provide employee awareness training around phishing, malware, and other cyber threats to help protect against these cyber and security risks, we cannot ensure the success of such training.
Implementation delays, poor execution, or a breach of information technology systems could disrupt our operations, damage our reputation, or increase costs related to the mitigation of, response to, or litigation arising from any such issue. Similar risks exist with our third-party vendors. Any problems caused by these third parties, including those resulting from disruption in communications services, cyber attacks, or security breaches, have the potential to hinder our ability to conduct business. In addition, new data privacy laws and regulations, including the new European Union General Data Protection Regulation (“GDPR”), effective May 25, 2018, pose increasingly complex compliance challenges and potentially elevate costs, and any failure to comply with these laws and regulations could result in significant penalties.
Failure to protect our intellectual property could undermine our competitive position.
Competing effectively depends, to a significant extent, on maintaining the proprietary nature of our intellectual property. We attempt to protect our intellectual property rights worldwide through a combination of trademark, copyright, and trade secret laws, as well as licensing agreements and third-party non-disclosure and assignment agreements. Because of the differences in foreign laws concerning proprietary rights, our intellectual property rights do not generally receive the same degree of protection in foreign countries as they do in the United States, and therefore in some parts of the world, we have limited protections, if any, for our intellectual property. If we are unable to adequately protect our intellectual property embodied in our solutions, designs, processes, and products, the competitive advantages of our proprietary technology could be reduced or eliminated, which would harm our business and could have a material adverse effect on our results of operations and financial position.
We may be sued by third parties for alleged infringement of their intellectual property rights and incur substantial litigation or other costs.
We may be sued by third parties who allege that our products or services infringe their intellectual property rights. Such claims, regardless of their merits, could result in substantial costs and diversion of resources in the defense or settlement of such claims. In the event of a claim upheld against us, we may be required to spend a significant amount of money and effort to develop non-infringing alternatives or obtain and maintain licenses. We may not be successful in developing such alternatives or obtaining or maintaining such licenses on reasonable terms or at all, which could have a material adverse effect on our results of operations, financial position, and cash flows.
Our insurance may not adequately protect us from liabilities related to product defects.
We maintain product liability and other insurance coverage that we believe to be generally in accordance with industry practices. However, our insurance coverage may not be adequate to protect us fully against substantial claims and costs that may arise from liabilities related to product defects, particularly if we have a large number of defective products or if the root cause is disputed.
Our failure to maintain Food and Drug Administration (FDA) registration of one or more of our registered manufacturing facilities could negatively impact our ability to produce products for our customers in the medical industry.
To maintain FDA registration, Kimball Electronics is subject to FDA audits of the manufacturing process. FDA audit failure could result in a partial or total suspension of production, fines, or criminal prosecution. Failure or noncompliance could have an adverse effect on our reputation in addition to an adverse impact on our financial position, results of operations, or cash flows.
14
We are subject to extensive environmental regulation and significant potential environmental liabilities.
The past and present operation and ownership by Kimball Electronics of manufacturing plants and real property are subject to extensive and changing federal, state, local, and foreign environmental laws and regulations, including those relating to discharges in air, water, and land, the handling and disposal of solid and hazardous waste, the use of certain hazardous materials in the production of select products, and the remediation of contamination associated with releases of hazardous substances. In addition, the increased prevalence of global climate change concerns may result in new regulations that may negatively impact us. We cannot predict what environmental legislation or regulations will be enacted in the future, how existing or future laws or regulations will be administered or interpreted, or what environmental conditions may be found to exist. Compliance with more stringent laws or regulations, or stricter interpretation of existing laws, may require additional expenditures, some of which could be material. In addition, any investigations or remedial efforts relating to environmental matters could involve material costs or otherwise result in material liabilities.
Our failure to retain the existing management team, maintain our engineering, technical, and manufacturing process expertise, or continue to attract qualified personnel could adversely affect our business.
We depend significantly on our executive officers and other key personnel. The unexpected loss of the services of any one of these executive officers or other key personnel may have an adverse effect on us.
Our success also depends on keeping pace with technological advancements and adapting services to provide manufacturing capabilities which meet customers’ changing needs. Therefore, we must retain our qualified engineering and technical personnel and successfully anticipate and respond to technological changes in a cost effective and timely manner. Our culture and guiding principles focus on continuous training, motivating, and development of employees, and we strive to attract, motivate, and retain qualified personnel. Failure to retain and attract qualified personnel could adversely affect our business.
Availability of manufacturing labor and turnover in personnel could cause manufacturing inefficiencies and increase operating costs.
The demand for manufacturing labor and the low unemployment rate in certain geographic areas in which we operate makes recruiting new production employees and retaining experienced production employees difficult. Shortage of production workers could adversely impact our ability to complete our customers’ orders on a timely basis, which could adversely affect our relations with customers, potentially resulting in reduction in orders from customers or loss of customers. Turnover in personnel could result in additional training and inefficiencies that could adversely impact our operating results.
Natural disasters or other catastrophic events may impact our production schedules and, in turn, negatively impact profitability.
Natural disasters or other catastrophic events, including severe weather, terrorist attacks, power interruptions, and fires, could disrupt operations and likewise our ability to produce or deliver products. Our manufacturing operations require significant amounts of energy, including natural gas and oil, and governmental regulations may control the allocation of such fuels to Kimball Electronics. Employees are an integral part of our business, and events such as a pandemic could reduce the availability of employees reporting for work. In the event we experience a temporary or permanent interruption in our ability to produce or deliver product, revenues could be reduced, and business could be materially adversely affected. In addition, catastrophic events, or the threat thereof, can adversely affect U.S. and world economies, and could result in delayed or lost revenue for our services. In addition, any continuing disruption in our computer systems could adversely affect the ability to receive and process customer orders, manufacture products, and ship products on a timely basis, and could adversely affect relations with customers, potentially resulting in reduction in orders from customers or loss of customers. We maintain insurance to help protect us from costs relating to some of these matters, but such may not be sufficient or paid in a timely manner to us in the event of such an interruption.
Imposition of government regulations may significantly increase our operating costs in the United States and abroad.
Legislative and regulatory reforms by the U.S. federal and foreign governments could significantly impact the profitability of Kimball Electronics by burdening us with forced cost choices that cannot be recovered by increased pricing or, if we increase our pricing, this could negatively impact demand for our products. For example:
• | International Traffic in Arms Regulations (ITAR) must be followed when producing defense related products for the U.S. government. A breach of these regulations could have an adverse impact on our financial condition, results of operations, or cash flows. |
• | Foreign regulations are increasing in many areas such as data privacy, hazardous waste disposal, labor relations, and employment practices. |
15
• | Changes in policies by the U.S. or other governments could negatively affect our operating results due to changes in duties, tariffs or taxes, or limitations on currency or fund transfers, as well as government-imposed restrictions on producing certain products in, or shipping them to, specific countries. For example, our facility in Mexico operates under the Mexican Maquiladora (“IMMEX”) program. This program provides for reduced tariffs and eased import regulations. We could be adversely affected by changes in the IMMEX program or our failure to comply with its requirements. As another example, the U.S. government has recently imposed tariffs on certain products imported from China as well as steel and aluminum imported from the European Union, Mexico, and Canada. China and the European Union have imposed tariffs on U.S. products in retaliation. These tariffs could force our customers or us to consider various strategic options including, but not limited to, looking for different suppliers, shifting production to facilities in different geographic regions, absorbing the additional costs, or passing the cost on to customers. Ultimately, these tariffs could adversely affect the competitiveness of our domestic operations, which could lead to the reduction or exit of certain U.S. manufacturing capacity. The U.S. government has also indicated its intent to renegotiate certain existing trade agreements and impose additional tariffs on automotive imports. Depending on the types of changes made, demand for our foreign manufacturing facilities could be reduced, or operating costs in our U.S. manufacturing facilities could be increased, which could negatively impact our financial performance. Moreover, any retaliatory actions by other countries where we operate could also negatively impact our financial performance. |
SEC “Conflict Minerals” regulation may increase our costs and reduce our sales levels.
As a result of the Dodd-Frank Act, the SEC adopted rules establishing due diligence, disclosure, and reporting requirements for public companies which manufacture products that include components containing certain minerals referred to as “conflict minerals.” Since certain products we manufacture for our customers contain such minerals, we are required to determine, disclose, and report whether or not such minerals in our products originate from the Democratic Republic of Congo (“DRC”) and adjoining countries. Such regulations could decrease the availability and increase the prices of components used in our products, particularly if we choose (or are required by our customers) to source such components from different suppliers. In addition, as our supply chain is complex and the process to comply with the SEC rules is cumbersome, the ongoing compliance process is both time-consuming and costly. We may face reduced sales if we are unable to timely verify the origins of minerals contained in the components included in our products, or supply disruptions if our due diligence process reveals that materials we source contain minerals that originated in the DRC or adjoining countries.
Risks Relating to the Spin-Off
If the distribution pursuant to the spin-off does not qualify as a tax-free transaction, tax could be imposed on the Share Owners and former Parent, and we may be required to indemnify former Parent for its tax.
In connection with the spin-off, former Parent received (i) a ruling from the Internal Revenue Service (the “IRS”) that the Parent stock unification will not cause Parent to recognize income or gain as a result of the distribution; and (ii) an opinion of Squire Patton Boggs (US) LLP to the effect that the distribution satisfies the requirements to qualify as a tax-free transaction for U.S. federal income tax purposes under Section 355 of the Code. However, the validity of both the IRS ruling and the tax opinion is subject to the accuracy of factual representations and assumptions provided by former Parent and us in connection with obtaining the IRS ruling and the tax opinion, including with respect to post-spin-off operations and conduct of the parties. Neither former Parent nor we are aware of any facts or circumstances that would cause these statements or representations to be incomplete or untrue or cause the facts on which the opinion is based to be materially different from the facts at the time of the spin-off. However, if these representations and assumptions are inaccurate or incomplete in any material respect, including those relating to the past and future conduct of the business, then we will not be able to rely on the IRS ruling or the tax opinion.
Furthermore, the tax opinion is not binding on the Internal Revenue Service or the courts. Accordingly, the IRS or the courts may reach conclusions with respect to the spin-off that are different from the conclusions reached in the opinion. If, notwithstanding our receipt of the tax opinion, the spin-off is determined to be taxable, then (i) former Parent would be subject to tax as if it sold the Kimball Electronics common stock in a taxable sale for its fair market value; and (ii) each Share Owner who received Kimball Electronics common stock would be treated as receiving a distribution of property in an amount equal to the fair market value of the Kimball Electronics common stock that would generally result in varied tax liabilities for each Share Owner depending on the facts and circumstances.
Pursuant to the Tax Matters Agreement entered into in connection with the spin-off, (i) we agreed (a) not to enter into any transaction that could cause any portion of the spin-off to be taxable to former Parent, including under Section 355(e) of the Code; and (b) to indemnify former Parent for any tax liabilities resulting from such transactions; and (ii) former Parent agreed to indemnify us for any tax liabilities resulting from such transactions entered into by former Parent. In addition, under U.S. Treasury regulations, each member of former Parent’s consolidated group at the time of the spin-off (including us and our
16
subsidiaries) is jointly and severally liable for the resulting U.S. federal income tax liability if all or a portion of the spin-off does not qualify as a tax-free transaction, and we have agreed to indemnify former Parent for a portion of certain tax liabilities incurred in connection with the spin-off under certain circumstances. These obligations may discourage, delay, or prevent a change of control of our company.
We currently share directors with former Parent, which means the overlap may give rise to conflicts.
Certain members of our Board of Directors serve as directors of former Parent, but the overlapping directors do not constitute a majority of our Board members. These directors may have actual or apparent conflicts of interest with respect to matters involving or affecting us or former Parent. For example, there could be the potential for a conflict of interest when we or former Parent look at acquisitions and other corporate opportunities that may be suitable for both companies. Also, conflicts may arise if there are issues or disputes under the commercial arrangements that may exist between former Parent and us. Our Board of Directors and the Board of Directors of former Parent will review and address any potential conflict of interests that may arise between former Parent and us. Although no specific measures to resolve such conflicts of interest have been formulated, our Board of Directors and the Board of Directors of former Parent have a fiduciary obligation to deal fairly and in good faith. Our Board of Directors exercises reasonable judgment and takes such steps as they deem necessary under all of the circumstances in resolving any specific conflict of interest which may occur and will determine what, if any, specific measures, such as retention of an independent advisor, independent counsel, or special committee, may be necessary or appropriate. Any such conflict could have a material adverse effect on our business.
Risks Relating to Our Common Stock
Our stock price may fluctuate significantly.
The market price of our common stock may fluctuate widely, depending on many factors, some of which may be beyond our control, including:
• | actual or anticipated fluctuations in our operating results due to factors related to our business; |
• | wins and losses on contract competitions and new business pursuits; |
• | success or failure of our business strategy; |
• | our quarterly or annual earnings, or those of other companies in our industry; |
• | our ability to obtain financing as needed; |
• | announcements by us or our competitors of significant acquisitions or dispositions; |
• | changes in accounting standards, policies, guidance, interpretations or principles; |
• | the failure of securities analysts to cover our common stock; |
• | changes in earnings estimates by securities analysts or our ability to meet those estimates; |
• | the operating and stock price performance of other comparable companies; |
• | the changes in customer requirements for our products and services; |
• | natural or environmental disasters that investors believe may affect us; |
• | overall market fluctuations; |
• | results from any material litigation or government investigation; |
• | changes in laws and regulations affecting our business; and |
• | general economic conditions and other external factors. |
Stock markets in general have experienced volatility that has often been unrelated to the operating performance of a particular company. These broad market fluctuations, coupled with changes in results of operations and general economic, political, and market conditions, could adversely affect the trading price of our common stock.
Anti-takeover provisions in our organizational documents, the Tax Matters Agreement, and Indiana law could delay or prevent a change in control.
We have adopted the Amended and Restated Articles of Incorporation and the Amended and Restated Bylaws. Certain provisions of the Amended and Restated Articles of Incorporation and the Amended and Restated Bylaws may delay or prevent a merger or acquisition that a Share Owner may consider favorable. For example, the Amended and Restated Articles of Incorporation authorizes our Board of Directors to issue one or more series of preferred stock, prevents Share Owners from acting by written consent, and requires a supermajority Share Owner approval for certain business combinations with related persons. These provisions may discourage acquisition proposals or delay or prevent a change in control, which could harm our stock price. Indiana law also imposes some restrictions on potential acquirers.
17
Under the Tax Matters Agreement entered into in connection with the spin-off, we have agreed not to enter into any transaction involving an acquisition (including issuance) of our common stock or any other transaction (or, to the extent we have the right to prohibit it, to permit any such transaction) that could cause the distribution pursuant to the spin-off to be taxable to former Parent. We have also agreed to indemnify former Parent for any tax resulting from any such transactions. Generally, former Parent will recognize taxable gain on the distribution if there are one or more acquisitions (including issuances) of our capital stock, directly or indirectly, representing 50% or more, measured by vote or value, of our then-outstanding capital stock, and the acquisitions or issuances are deemed to be part of a plan or series of related transactions that include the distribution. As a result, our obligations may limit our ability to pursue strategic transactions or engage in new business or other transactions that may maximize our business and might discourage, delay, or prevent a change of control of our company.
We cannot assure you that we will pay dividends on our stock in the future.
We have not paid any dividends on our common stock since the spin-off. The timing, declaration, amount, and payment of future dividends to our Share Owners will fall within the discretion of our Board of Directors and will depend on many factors, including our financial condition, results of operations and capital requirements, industry practice, and other business considerations that our Board of Directors considers relevant from time to time. In addition, our ability to declare or the amount of any future dividends may be restricted by the provisions of Indiana law and covenants in our primary credit facility. We do not have a plan to pay future dividends at this time. There can be no assurance that we will pay a dividend in the future or continue to pay any dividend if we do commence the payment of dividends. To the extent that expectations by market participants regarding the potential payment, or amount, of any dividend prove to be incorrect, the price of our common stock may be materially and negatively affected, and investors that bought shares of our common stock based on those expectations may suffer a loss on their investment.
Item 1B - Unresolved Staff Comments
None.
Item 2 - Properties
As of June 30, 2018, we had nine manufacturing facilities with three located in Indiana and one located in each of Florida, China, Mexico, Poland, Romania, and Thailand. These facilities occupy approximately 1,221,000 square feet in aggregate, all of which are owned. In addition, we own two administration facilities in Indiana occupying approximately 48,000 square feet, which include our headquarters located in Jasper, Indiana. See Note 15 - Geographic Information of Notes to Consolidated Financial Statements for additional information.
Generally, our manufacturing facilities are utilized at normal capacity levels on a multiple shift basis. At times, certain facilities utilize reduced shifts. Due to demand and sales fluctuations, not all facilities were utilized at normal capacity during fiscal year 2018. We continually assess our capacity needs and evaluate our operations to optimize our service levels by geographic region. See Item 1A - Risk Factors for information regarding financial and operational risks related to our international operations.
Significant loss of income resulting from a facility catastrophe would be partially offset by business interruption insurance coverage.
The Company holds land leases for our facilities in China and Thailand and a warehouse facility lease in Indiana, with these leases expiring from fiscal year 2021 to 2056. See Note 5 - Commitments and Contingent Liabilities of Notes to Consolidated Financial Statements for additional information concerning leases. In addition, we own approximately 97 acres of land which includes land where our facilities reside.
Item 3 - Legal Proceedings
We and our subsidiaries are not parties to any pending legal proceedings, other than ordinary routine litigation incidental to the business. The outcome of current routine pending litigation, individually and in the aggregate, is not expected to have a material adverse impact on our business or financial condition.
Item 4 - Mine Safety Disclosures
Not applicable.
18
Executive Officers of the Registrant
Our executive officers as of August 28, 2018 are as follows:
(Age as of August 28, 2018)
Name | Age | Office and Area of Responsibility | ||
Donald D. Charron | 54 | Chairman of the Board and Chief Executive Officer | ||
Michael K. Sergesketter | 58 | Vice President, Chief Financial Officer | ||
John H. Kahle | 61 | Vice President, General Counsel, Chief Compliance Officer, and Secretary | ||
Christopher J. Thyen | 55 | Vice President, New Platforms | ||
Jessica L. DeLorenzo | 33 | Vice President, Human Resources | ||
Sandy A. Smith | 55 | Vice President, Information Technology | ||
Janusz F. Kasprzyk | 58 | Vice President, European Operations | ||
Steven T. Korn | 54 | Vice President, North American Operations | ||
Roger Chang (Chang Shang Yu) | 61 | Vice President, Asian Operations | ||
Desiree L. Castillejos | 47 | Vice President, Corporate Development and M&A, and Chief Strategy Officer | ||
Kathy R. Thomson | 49 | Vice President, Global Business Development and Design Services | ||
Executive officers are appointed annually by the Board of Directors. The following is a brief description of the business experience during the past five or more years of each of our executive officers.
Mr. Charron is our Chairman of the Board and Chief Executive Officer. Prior to the spin-off, he served as an Executive Vice President of former Parent, a member of the Board of Directors of former Parent, and the President of the Kimball Electronics Group that now comprises Kimball Electronics following the spin-off. Mr. Charron had led the EMS segment of former Parent since joining former Parent in 1999. Mr. Charron’s extensive contract electronics industry experience prior to joining former Parent, as well as his intimate knowledge of former Parent’s EMS operations, provides valuable operational, strategic, and global market insights.
Mr. Sergesketter is our Vice President, Chief Financial Officer. Prior to the spin-off, he served as Vice President, Chief Financial Officer for Kimball Electronics Group that now comprises Kimball Electronics following the spin-off. Mr. Sergesketter had served in this role with former Parent since 1996.
Mr. Kahle is our Vice President, General Counsel, Chief Compliance Officer, and Secretary. Mr. Kahle was appointed Chief Compliance Officer in April 2016 in addition to his Vice President, General Counsel, and Secretary role. Prior to the spin-off, he served as Executive Vice President, General Counsel and Secretary of former Parent and had served in this role with former Parent since 2001.
Mr. Thyen was appointed our Vice President, New Platforms, in August 2018. Prior to this, he served as Vice President, Business Development since 2008.
Ms. DeLorenzo was appointed Vice President, Human Resources, effective June 29, 2018. Ms. DeLorenzo joined Kimball Electronics in 2015 in the position of Director, Organizational Development. Before joining Kimball Electronics, she held the position of Director, Student Services at Vincennes University since 2011.
Ms. Smith is our Vice President, Information Technology and has served in this role since 2004.
Mr. Kasprzyk is our Vice President, European Operations and has served in this role since 2008.
Mr. Korn is our Vice President, North American Operations and has served in this role since 2007.
Mr. Chang is our Vice President, Asian Operations and has served in this role since 2004.
Ms. Castillejos was appointed Vice President, Corporate Development and M&A, and Chief Strategy Officer effective August 13, 2018. Prior to joining Kimball Electronics, she held the position of Vice President, Corporate Development for Nokia Technology since 2016. Prior to Nokia Technology, she served as the Vice President, Corporate Development for Persistent Systems since 2010.
Ms. Thomson was appointed Vice President, Global Business Development and Design Services effective August 20, 2018. Previously Ms. Thomson held the position of Vice President of Business Development for Creation Technologies since 2012.
19
PART II
Item 5 - Market for Registrant’s Common Equity, Related Share Owner Matters and Issuer Purchases of Equity Securities
Market Prices
The Company’s common stock trades on the NASDAQ Global Select Market of The NASDAQ Stock Market LLC (“NASDAQ”) under the symbol: KE. High and low sales prices by quarter for the last two fiscal years, as quoted by the NASDAQ system, were as follows:
2018 | 2017 | ||||||||||||||
High | Low | High | Low | ||||||||||||
First Quarter | $ | 22.05 | $ | 17.46 | $ | 14.28 | $ | 11.54 | |||||||
Second Quarter | $ | 22.45 | $ | 18.14 | $ | 19.00 | $ | 13.38 | |||||||
Third Quarter | $ | 19.70 | $ | 15.75 | $ | 18.45 | $ | 15.05 | |||||||
Fourth Quarter | $ | 19.70 | $ | 15.80 | $ | 18.90 | $ | 15.90 | |||||||
The last reported sales price of our common stock on August 15, 2018, as reported by NASDAQ, was $19.95.
Dividends
We have not paid any dividends on our common stock since the spin-off. We do not have a plan to pay future dividends at this time.
Share Owners
On August 15, 2018, the Company’s common stock was owned by approximately 1,294 Share Owners of record.
Securities Authorized for Issuance Under Equity Compensation Plans
The information required by this item concerning securities authorized for issuance under equity compensation plans is incorporated by reference to Item 12 - Security Ownership of Certain Beneficial Owners and Management and Related Share Owner Matters of Part III.
Issuer Purchases of Equity Securities
On October 21, 2015, our Board of Directors (the “Board”) approved an 18-month stock repurchase plan, authorizing the repurchase of up to $20 million worth of our common stock. On September 26, 2016, the Board extended the stock repurchase plan authorizing the repurchase of up to an additional $20 million worth of common stock with no expiration date. On August 23, 2017, the Board increased the Plan to allow the repurchase of up to an additional $20 million worth of common stock with no expiration date. This latest increase brings the total authorized stock repurchases under the Plan to $60 million. At June 30, 2018, $15.5 million remained available under the repurchase program.
During fiscal year 2018, the Company has repurchased $9.4 million of common stock under the Plan. The following table contains information about our purchases of equity securities during the three months ended June 30, 2018.
Period | Total Number of Shares Purchased | Average Price Paid per Share | Total Number of Shares Purchased as Part of Publicly Announced Plan | Maximum Dollar Value of Shares that May Yet Be Purchased Under the Plan | ||||
April 1, 2018 - April 30, 2018 | — | $ | — | — | $ | 18,608,701 | ||
May 1, 2018 - May 31, 2018 | 52,177 | $ | 18.61 | 52,177 | $ | 17,637,743 | ||
June 1, 2018 - June 30, 2018 | 110,794 | $ | 19.15 | 110,794 | $ | 15,516,025 | ||
Total | 162,971 | $ | 18.98 | 162,971 | ||||
20
Performance Graph
The following performance graph is not deemed to be “soliciting material” or to be “filed” with the SEC or subject to Regulation 14A or 14C under the Exchange Act or to the liabilities of Section 18 of the Exchange Act and will not be deemed to be incorporated by reference into any filing under the Securities Act or the Exchange Act, except to the extent the Company specifically incorporates it by reference into such a filing.
The graph below compares the cumulative total return to Share Owners of the Company’s common stock from November 3, 2014, the first day of trading in the Company’s common stock, through June 30, 2018, the last business day of the fiscal year, to the cumulative total return of the NASDAQ Stock Market (U.S.) and a peer group index for the same period of time. The peer group index is comprised of publicly traded companies in the EMS industry and includes: Benchmark Electronics, Inc., Flex Ltd., Jabil Inc., Plexus Corp., and Sanmina Corporation. The public companies included in the peer group each have a larger revenue base than we do.
The graph assumes $100 is invested in the Company’s stock and each of the two indexes at the closing market quotations on November 3, 2014, the first day of trading in Kimball Electronics common stock, and that dividends, if any, are reinvested. The performances shown on the graph are not necessarily indicative of future price performance.
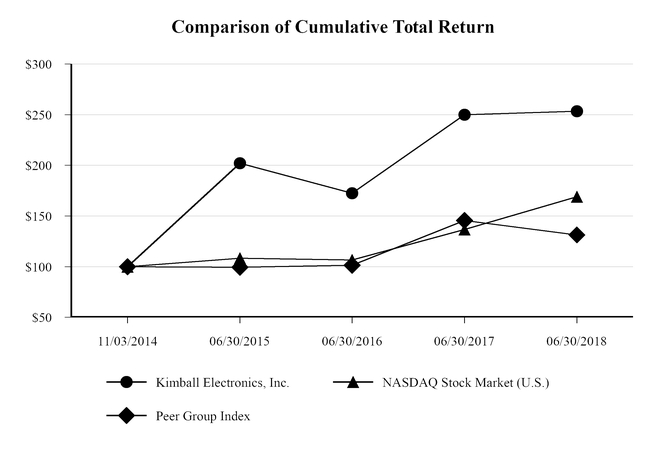
11/03/2014 | 06/30/2015 | 06/30/2016 | 06/30/2017 | 06/30/2018 | |||||||||||
Kimball Electronics, Inc. | $ | 100.00 | $ | 202.08 | $ | 172.44 | $ | 250.00 | $ | 253.46 | |||||
NASDAQ Stock Market (U.S.) | $ | 100.00 | $ | 108.38 | $ | 106.56 | $ | 136.71 | $ | 168.97 | |||||
Peer Group Index | $ | 100.00 | $ | 99.49 | $ | 101.36 | $ | 145.47 | $ | 131.37 | |||||
21
Item 6 - Selected Financial Data
This information should be read in conjunction with Item 8 - Financial Statements and Supplementary Data and Item 7 - Management’s Discussion and Analysis of Financial Condition and Results of Operations. The Consolidated Financial Statements for periods prior to the spin-off, which occurred on October 31, 2014, were derived from the accounting records of former Parent as if we operated on a stand-alone basis. Our historical results of operations, financial position, or cash flows presented in the Consolidated Financial Statements for periods prior to the spin-off may not be indicative of what they would have been had the Company operated as a stand-alone public company for the entirety of the periods presented.
Year Ended June 30 | |||||||||||||||||||
(Amounts in Thousands, Except for Per Share Data) | 2018 | 2017 | 2016 | 2015 | 2014 | ||||||||||||||
Consolidated Statements of Income Data: | |||||||||||||||||||
Net Sales | $ | 1,072,061 | $ | 930,914 | $ | 842,060 | $ | 819,350 | $ | 741,530 | |||||||||
Net Income (1) | $ | 16,752 | $ | 34,179 | $ | 22,287 | $ | 26,205 | $ | 24,613 | |||||||||
Earnings Per Share: (2) | |||||||||||||||||||
Basic | $ | 0.63 | $ | 1.25 | $ | 0.77 | $ | 0.90 | $ | 0.84 | |||||||||
Diluted | $ | 0.62 | $ | 1.24 | $ | 0.76 | $ | 0.89 | $ | 0.84 | |||||||||
As of June 30 | |||||||||||||||||||
(Amounts in Thousands) | 2018 | 2017 | 2016 | 2015 | 2014 | ||||||||||||||
Consolidated Balance Sheet Data: | |||||||||||||||||||
Total Assets | $ | 608,758 | $ | 554,944 | $ | 510,565 | $ | 483,257 | $ | 408,730 | |||||||||
Long-Term Debt, Less Current Maturities | $ | — | $ | — | $ | — | $ | — | $ | — | |||||||||
(1) Fiscal year 2018 net income included income tax expense of $17.9 million ($0.66 per diluted share) due to the U.S. Tax Cuts and Jobs Act (“Tax Reform”) that was enacted into law in December 2017 and relates to the deemed repatriation of unremitted foreign earnings and the revaluation of net deferred tax assets.
Fiscal year 2017 net income included $2.5 million ($0.09 per diluted share) of after-tax income resulting from settlements received related to an antitrust class action lawsuit in which the Company was a member and $0.9 million ($0.03 per diluted share) of after-tax income resulting from the bargain purchase gain recognized in the acquisition of Aircom Manufacturing, Inc. See Note 2 - Acquisitions of Notes to Consolidated Financial Statements for more information regarding the acquisition and bargain purchase gain.
Fiscal year 2016 net income included a foreign income tax benefit of $1.8 million ($0.06 per diluted share) as a result of a favorable tax ruling related to the fiscal year 2015 capitalization of the Company’s Romania subsidiary and $0.1 million ($0.01 per diluted share) of after-tax expense related to the spin-off.
Fiscal year 2015 net income included $2.4 million ($0.08 per diluted share) of after-tax expense related to the spin-off.
Fiscal year 2014 net income included $0.3 million ($0.01 per diluted share) of after-tax restructuring expenses, $3.5 million ($0.12 per diluted share) of after-tax income resulting from settlements received related to two antitrust class action lawsuits in which the Company was a member, and $2.2 million ($0.08 per diluted share) of after-tax expense related to the spin-off.
(2) Basic and diluted earnings per share for the period ended prior to the spin-off on October 31, 2014 were retrospectively restated adjusting the number of Kimball Electronics shares outstanding for the stock split effective on October 16, 2014 to 29.1 million shares.
22
Item 7 - Management’s Discussion and Analysis of Financial Condition and Results of Operations
Business Overview
We are a global contract electronic manufacturing services (“EMS”) company that specializes in producing durable electronics for the automotive, medical, industrial, and public safety markets. We also offer diversified contract manufacturing services for non-electronic components, medical disposables, plastics, and metal fabrication. Our manufacturing services, including engineering and supply chain support, utilize common production and support capabilities globally. We are well recognized by our customers and the EMS industry for our excellent quality, reliability, and innovative service, and we were named the 2016 EMS Company of the Year by CIRCUITS ASSEMBLY, a leading brand and technical publication for electronics manufacturers worldwide. In 2018, we were recognized for achieving the Highest Overall Customer Rating in CIRCUITS ASSEMBLY’s 2018 Service Excellence Awards.
The EMS industry is very competitive. As a mid-sized player in the EMS market, we can expect to be challenged by the agility and flexibility of the smaller, regional players, and we can expect to be challenged by the scale and price competitiveness of the larger, global players. We enjoy a unique market position between these extremes which allows us to compete with the larger scale players for high-volume projects, but also maintain our competitive position in the generally lower volume durable electronics market space. We expect to continue to effectively operate in this market space; however, one significant challenge will be maintaining our profit margins while we continue our revenue growth. Price increases are uncommon in the market as production efficiencies and material pricing advantages for most projects drive costs and prices down over the life of the projects. This characteristic of the contract electronics marketplace is expected to continue.
Key economic indicators currently point toward continued strengthening in the overall economy. However, uncertainties still exist and may pose a threat to our future growth as they have the tendency to cause disruption in business strategy, execution, and timing in many of the markets in which we compete. One such trend that the EMS industry is beginning to experience is component shortages and component allocations. Component shortages or allocations could increase component costs and potentially interrupt our operations and negatively impact our ability to meet commitments to customers. We are taking various actions to mitigate the risk and minimize the adverse effect the component shortages or allocations could have on our results and the impact to our customers. In addition, the impact from the recently imposed and additional proposed tariffs on components we utilize in our domestic manufacturing process, of which many currently can only be sourced via China, may adversely affect the competitiveness of our domestic operations.
The March 2018 edition of the Manufacturing Market Insider published by New Venture Research indicated the group of leading EMS companies that comprise its annual list of the 50 largest EMS providers for 2017, of which we are a member, experienced revenue growth of 11.4% in calendar year 2017. Excluding the two largest EMS providers, there was revenue growth of 8.0% in calendar year 2017. During calendar year 2017, we experienced growth of approximately 11%.
Our overall expectation for the EMS market is moderate growth with mixed demand. Our focus is on the four key vertical markets of automotive, medical, industrial, and public safety. Our current goal is to grow at an 8% annual organic growth rate.
The automotive end market has improved from both new product introductions and increased demand on existing products, and it continues to benefit from the trend of increasing electronic content that is placed in automobiles. The industrial market is showing improvement with increased end market demand for smart metering and climate control products. Overall in the public safety market, we have experienced mixed demand and may continue to see demand fluctuations as we wind down our International Traffic in Arms Regulations (ITAR) compliance programs and turn our focus to growth in our non-defense related business. Sales in the current fiscal year in the public safety market declined compared to the prior fiscal year resulting from programs reaching end of life, which more than offset increased volumes from new product introductions. In the medical market, growth was driven largely from new program launches in addition to an overall strengthening of the market. We continue to monitor the current economic environment and its potential impact on our customers.
We invest in capital expenditures prudently for projects in support of both organic growth and potential acquisitions that would enhance our capabilities and diversification while providing an opportunity for growth and improved profitability. For example, the acquisitions of Medivative Technologies, LLC (“Medivative”) and Aircom Manufacturing, Inc. (“Aircom”) within the last several fiscal years provide capabilities that will enhance our medical end market as well as support our mechanical assembly needs in all four key vertical markets by offering our customers design engineering and manufacturing expertise in precision metals and plastics. We have a strong focus on cost control and closely monitor market changes and our liquidity in order to proactively adjust our operating costs and discretionary capital spending as needed. Managing working capital in conjunction with fluctuating demand levels is likewise key. In addition, a long-standing component of our profit sharing incentive bonus plan is that it is linked to our financial performance which results in varying amounts of compensation expense as profits change.
23
As discussed in Item 1 - Business, we entered into an agreement on May 11, 2018 with GES Holdings, Inc., Global Equipment Services and Manufacturing, Inc., and its subsidiaries (collectively referred to as “GES”) to acquire substantially all of the assets and assume certain liabilities of GES. The pending GES acquisition supports our new platform strategy as GES specializes in production processing and test equipment design, volume manufacturing, and global services for the semiconductor and electronics product manufacturing industry. See Item 1A - Risk Factors for risks associated with this acquisition and Note 2 - Acquisitions of Notes to Consolidated Financial Statements for more information on this pending acquisition.
We continue to maintain a strong balance sheet as of the end of fiscal year 2018, which included no long-term debt and Share Owners’ equity of $356 million. Our short-term liquidity available, represented as cash and cash equivalents plus the unused amount of our credit facilities, totaled $108.7 million at June 30, 2018.
In addition to the above discussion related to the current market conditions, management currently considers the following events, trends, and uncertainties to be most important to understanding our financial condition and operating performance:
• | Due to the contract and project nature of the EMS industry, fluctuation in the demand for our products and variation in the gross margin on those projects is inherent to our business. Effective management of manufacturing capacity is, and will continue to be, critical to our success. |
• | The nature of the EMS industry is such that the start-up of new customers and new programs to replace expiring programs occurs frequently. While our agreements with customers generally do not have a definitive term and thus could be canceled at any time with little or no notice, we generally realize relatively few cancellations prior to the end of the product’s life cycle. We attribute this to our focus on long-term customer relationships, meeting customer expectations, required capital investment, and product qualification cycle times. As such, our ability to continue contractual relationships with our customers, including our principal customers, is not certain. New customers and program start-ups generally cause losses early in the life of a program, which are generally recovered as the program becomes established and matures. Risk factors within our business include, but are not limited to, general economic and market conditions, customer order delays, globalization, impact related to tariffs and other trade barriers, foreign currency exchange rate fluctuations, rapid technological changes, component availability, supplier and customer financial stability, the contract nature of this industry, the concentration of sales to large customers, and the potential for customers to choose a dual sourcing strategy or to in-source a greater portion of their electronics manufacturing. The continuing success of our business is dependent upon our ability to replace expiring customers/programs with new customers/programs. We monitor our success in this area by tracking the number of customers and the percentage of our net sales generated from them by years of service as depicted in the table below. While variation in the size of program award makes it difficult to directly correlate this data to our sales trends, we believe it does provide useful information regarding our customer loyalty and new business growth. Additional risk factors that could have an effect on our performance are located within Item 1A - Risk Factors. |
Year End | |||||||||
Customer Service Years | 2018 | 2017 | 2016 | ||||||
More than 10 Years | |||||||||
% of Net Sales | 61 | % | 56 | % | 56 | % | |||
# of Customers | 28 | 28 | 25 | ||||||
5 to 10 Years | |||||||||
% of Net Sales | 28 | % | 36 | % | 38 | % | |||
# of Customers | 18 | 22 | 29 | ||||||
Less than 5 Years | |||||||||
% of Net Sales | 11 | % | 8 | % | 6 | % | |||
# of Customers | 30 | 32 | 32 | ||||||
Total | |||||||||
% of Net Sales | 100 | % | 100 | % | 100 | % | |||
# of Customers | 76 | 82 | 86 | ||||||
• | Globalization continues to be a factor not only in the industries in which we operate but also for our key customers, suppliers, and competitors. |
• | Employees throughout our business operations are an integral part of our ability to compete successfully, and the stability of the management team is critical to long-term Share Owner value. Our talent management and succession planning processes help to maintain stability in management. |
Certain preceding statements could be considered forward-looking statements under the Private Securities Litigation Reform Act of 1995 and are subject to certain risks and uncertainties including, but not limited to, successful integration of acquisitions and new operations, adverse changes in the global economic conditions, the geopolitical environment, loss of key customers or suppliers, or similar unforeseen events. Additional risk factors that could have an effect on our performance are located within Item 1A - Risk Factors.
24
Results of Operations - Fiscal Year 2018 Compared with Fiscal Year 2017
At or For the Year Ended | ||||||||||||||||
June 30 | ||||||||||||||||
(Amounts in Millions, Except for Per Share Data) | 2018 | as a % of Net Sales | 2017 | as a % of Net Sales | % Change | |||||||||||
Net Sales | $ | 1,072.1 | $ | 930.9 | 15 | % | ||||||||||
Gross Profit | $ | 86.2 | 8.0 | % | $ | 75.6 | 8.1 | % | 14 | % | ||||||
Selling and Administrative Expenses | $ | 43.9 | 4.0 | % | $ | 36.5 | 3.9 | % | 20 | % | ||||||
Other General Income | $ | — | $ | 4.0 | ||||||||||||
Operating Income | $ | 42.3 | 4.0 | % | $ | 43.1 | 4.6 | % | (2 | )% | ||||||
Provision for Income Taxes | $ | 28.0 | $ | 10.1 | 178 | % | ||||||||||
Net Income | $ | 16.8 | $ | 34.2 | (51 | )% | ||||||||||
Diluted Earnings per Share | $ | 0.62 | $ | 1.24 | ||||||||||||
Open Orders | $ | 293.1 | $ | 214.3 | 37 | % | ||||||||||
Net Sales by Vertical Market | For the Year Ended | |||||||||
June 30 | ||||||||||
(Amounts in Millions) | 2018 | 2017 | % Change | |||||||
Automotive | $ | 469.3 | $ | 378.7 | 24 | % | ||||
Medical | 313.3 | 256.5 | 22 | % | ||||||
Industrial | 217.0 | 205.6 | 6 | % | ||||||
Public Safety | 61.3 | 70.1 | (13 | )% | ||||||
Other | 11.2 | 20.0 | (44 | )% | ||||||
Total Net Sales | $ | 1,072.1 | $ | 930.9 | 15 | % | ||||
Net sales in fiscal year 2018 increased 15% compared to net sales in fiscal year 2017 primarily due to the ramp-up of new product introductions, an overall increase in demand, and the favorable effect of foreign exchange fluctuations on sales. By end market vertical, the increase in net sales was driven by double-digit sales growth to customers in the automotive and medical end markets, in addition to an increase in sales to customers in the industrial market vertical. Sales to customers in the automotive and the industrial markets both experienced record sales in the current fiscal year.
Sales to customers in the automotive market improved as demand in all of the Company’s geographic markets increased compared to the prior fiscal year, which included the ramp-up of new product introductions and increased demand for existing programs. Sales to customers in the medical market increased due to new program launches and stronger demand on existing products. Sales to customers in the industrial market improved largely due to new product launches related to smart metering and increased end market demand for climate control products, which more than offset decreases from the exit of certain programs. Sales to customers in the public safety market declined due to lower overall demand and certain programs reaching end of life.
A significant amount of sales to ZF, Philips, and Nexteer Automotive accounted for the following portions of our net sales:
Year Ended June 30 | |||
2018 | 2017 | ||
ZF | 15% | 12% | |
Philips | 13% | 14% | |
Nexteer Automotive | 13% | 12% | |
Open orders were up 37% as of June 30, 2018 compared to June 30, 2017 primarily as a result of a large increase of orders in the automotive market, which was in part due to new product introductions. Open orders are the aggregate sales price of production pursuant to unfulfilled customer orders, which may be canceled by the customer subject to contractual termination provisions. Substantially all of the open orders as of June 30, 2018 are expected to be filled within the next twelve months. Open orders at a point in time may not be indicative of future sales trends due to the contract nature of our business.
25
Gross profit as a percent of net sales declined slightly to 8.0% in fiscal year 2018 from 8.1% in fiscal year 2017 primarily due to an unfavorable impact on yields and higher costs associated with the support of new product introductions in addition to unfavorable product mix, which were partially offset by the positive impact from leverage gained on higher revenue.
For fiscal year 2018, selling and administrative expenses increased slightly as a percent of net sales and increased in absolute dollars compared to fiscal year 2017. The current fiscal year selling and administrative expenses increased in absolute dollars from the prior fiscal year primarily due to higher salary and related payroll costs, which were largely due to an increase in the number of employees, higher incentive-based compensation, and higher factoring fees from our accounts receivable factoring arrangements. In addition, during fiscal year 2018, we incurred $0.9 million of incremental costs directly related to the pending acquisition of GES, which were expensed as incurred. This increase was partially offset by the lower expense from the supplemental employee retirement plan (“SERP”) in the current year. The SERP expense is a result of the revaluation of the SERP liability and is offset by the revaluation to fair value of the SERP investments recorded in Other Income (Expense).
Other General Income in fiscal year 2017 of $4.0 million resulted from a payment received related to the settlement of a class action lawsuit in which Kimball Electronics was a class member. The lawsuit alleged that certain suppliers to the EMS industry conspired over a number of years to raise and fix the prices of electronic components, resulting in overcharges to purchasers of those components. No Other General Income was recorded during fiscal year 2018.
Other Income (Expense) consisted of the following:
Other Income (Expense) | Year Ended | ||||||
June 30 | |||||||
(Amounts in Thousands) | 2018 | 2017 | |||||
Interest Income | $ | 73 | $ | 64 | |||
Interest Expense | (527 | ) | (271 | ) | |||
Foreign Currency/Derivative Gain (Loss) | 2,358 | (453 | ) | ||||
Gain on Supplemental Employee Retirement Plan Investment | 712 | 1,006 | |||||
Bargain Purchase Gain on Acquisition | — | 925 | |||||
Other | (189 | ) | (73 | ) | |||
Other Income (Expense), net | $ | 2,427 | $ | 1,198 | |||
The revaluation to fair value of the SERP investments recorded in Other Income (Expense) is offset by the revaluation of the SERP liability recorded in Selling and Administrative Expenses, and thus there was no effect on net income. The Foreign Currency/Derivative Gain (Loss) resulted from net foreign currency exchange rate movements. The Bargain Purchase Gain on Acquisition for fiscal year 2017 resulted from the Aircom acquisition as the consideration paid for Aircom was less than the estimated fair values of the assets acquired and liabilities assumed. See Note 2 - Acquisitions of Notes to Consolidated Financial Statements for more information regarding the Aircom acquisition.
Our income before income taxes and effective tax rate were comprised of the following U.S. and foreign components:
Year Ended June 30, 2018 | Year Ended June 30, 2017 | ||||||||||||
(Amounts in Thousands) | Income Before Taxes | Effective Tax Rate | Income Before Taxes | Effective Tax Rate | |||||||||
United States | $ | 5,609 | 329.2 | % | $ | 10,051 | 25.6 | % | |||||
Foreign | $ | 39,166 | 24.4 | % | $ | 34,204 | 21.9 | % | |||||
Total | $ | 44,775 | 62.6 | % | $ | 44,255 | 22.8 | % | |||||
In December 2017, the United States enacted the Tax Cuts and Jobs Act (“Tax Reform”), which lowered the U.S. corporate statutory tax rate from 35% to 21%. For fiscal year companies with a June 30 year end, the blended federal statutory tax rate for the current fiscal year ending June 30, 2018 is 28.1%. Due to the enactment of Tax Reform, we revalued our net deferred tax assets at the new applicable rates as of December 31, 2017, with measurement period adjustments subsequently recorded during the six-month period ended June 30, 2018, and we estimated and recorded tax on the one-time deemed repatriation on our accumulated unremitted foreign earnings during fiscal year 2018. While we expect the lower U.S. corporate statutory tax rate will lower our consolidated effective tax rate and have a favorable impact on our net income in the future, Tax Reform did have a significant unfavorable impact to our effective tax rate and our net income for fiscal year 2018 as the total provisional tax adjustments resulting from Tax Reform were $17.9 million, or $0.66 per diluted share.
26
The consolidated effective tax rate for fiscal year 2018 of 62.6% and the domestic effective tax rate were unfavorably impacted by Tax Reform, primarily driven by income tax expense of approximately $13.4 million for the deemed repatriation tax and approximately $4.4 million for the revaluation of our net deferred tax assets, which were both treated as provisional tax adjustments and recognized in Provision for Income Taxes on the Consolidated Statements of Income for fiscal year 2018. The Company considers these provisional recorded amounts to be reasonable estimates as of June 30, 2018. As a result, these amounts could be adjusted during the measurement period ending December 2018. Items partially offsetting the unfavorable impact from Tax Reform on the effective tax rate included the income tax adjustment related to the excess tax benefit on stock-based compensation granted during fiscal year 2018, which was recognized in accordance with the new accounting standard for share-based payment transactions, the high mix of earnings in foreign jurisdictions that have generally lower statutory rates than the United States, and the U.S. research and development tax credit.
When compared to the statutory rate, the effective tax rate for fiscal year 2017 of 22.8% was favorably impacted by a high mix of earnings in foreign jurisdictions, which have lower statutory rates than the United States, foreign exchange rates on foreign income taxes, and domestic tax credits. Also favorably impacting the effective tax rate for fiscal year 2017 was the $0.9 million bargain purchase gain from the Aircom acquisition, which is not taxable.
Our overall effective tax rate will fluctuate depending on the geographic distribution of our worldwide earnings. See Note 9 - Income Taxes of Notes to Consolidated Financial Statements for more information, including additional information on Tax Reform. See Note 1 - Business Description and Summary of Significant Accounting Policies for information related to the excess tax benefit recognized in accordance with the new accounting standard for share-based payment transactions.
We recorded net income of $16.8 million in fiscal year 2018, or $0.62 per diluted share, a decrease of 51% from fiscal year 2017 net income of $34.2 million, or $1.24 per diluted share, due to the reasons previously discussed.
Comparing the balance sheet as of June 30, 2018 to June 30, 2017, our inventory balance increased $57.0 million primarily to support increased open orders and production volumes, the implementation of an inventory management program for one of our largest customers in the medical market, and additional purchases to help mitigate the potential impact from component shortages. Prepaid expenses and other current assets declined by $13.8 million primarily due to the new accounting standard that was prospectively adopted in the fourth quarter of our fiscal year 2018 which requires all deferred tax assets and liabilities to be classified as noncurrent on our balance sheet; this adoption reclassified $8.3 million from Prepaid expenses and other current assets to Other Assets as of June 30, 2018. Accounts payable increased $33.2 million largely from the increased inventory purchases to support increased production volumes. Long-term income taxes payable has a balance of $12.4 million at June 30, 2018 for the long-term portion of the deemed repatriation tax that is allowed to be paid over an eight-year period. Treasury stock, at cost increased $7.4 million due to stock repurchases under an authorized stock repurchase plan. See Note 1 - Business Description and Summary of Significant Accounting Policies for information related to the new accounting standard on the classification of deferred tax assets and liabilities.
Results of Operations - Fiscal Year 2017 Compared with Fiscal Year 2016
At or For the Year Ended | ||||||||||||||||
June 30 | ||||||||||||||||
(Amounts in Millions, Except for Per Share Data) | 2017 | as a % of Net Sales | 2016 | as a % of Net Sales | % Change | |||||||||||
Net Sales | $ | 930.9 | $ | 842.1 | 11 | % | ||||||||||
Gross Profit | $ | 75.6 | 8.1 | % | $ | 64.5 | 7.7 | % | 17 | % | ||||||
Selling and Administrative Expenses | $ | 36.5 | 3.9 | % | $ | 34.8 | 4.2 | % | 5 | % | ||||||
Other General Income | $ | 4.0 | $ | — | ||||||||||||
Operating Income | $ | 43.1 | 4.6 | % | $ | 29.7 | 3.5 | % | 45 | % | ||||||
Net Income | $ | 34.2 | $ | 22.3 | 53 | % | ||||||||||
Diluted Earnings per Share | $ | 1.24 | $ | 0.76 | ||||||||||||
Open Orders | $ | 214.3 | $ | 171.0 | 25 | % | ||||||||||
27
Net Sales by Vertical Market | For the Year Ended | |||||||||
June 30 | ||||||||||
(Amounts in Millions) | 2017 | 2016 | % Change | |||||||
Automotive | $ | 378.7 | $ | 326.7 | 16 | % | ||||
Medical | 256.5 | 249.2 | 3 | % | ||||||
Industrial | 205.6 | 186.6 | 10 | % | ||||||
Public Safety | 70.1 | 61.1 | 15 | % | ||||||
Other | 20.0 | 18.5 | 8 | % | ||||||
Total Net Sales | $ | 930.9 | $ | 842.1 | 11 | % | ||||
Net sales in fiscal year 2017 increased 11% compared to net sales in fiscal year 2016 primarily due to increased sales from new product awards and overall increased demand. The fiscal year 2017 increase in net sales over fiscal year 2016 was driven by sales growth to customers in all four of our end market verticals, with the sales to customers in the automotive market, industrial market, and public safety market experiencing double-digit growth.
Sales to customers in the automotive market improved as demand in all markets increased compared to fiscal year 2016, although we did experience a slow-down in the China market within the second half of fiscal year 2017. The increase in the automotive market demand over fiscal year 2016 was driven by the ramp-up of new product introductions and increased demand from existing customers. Sales to customers in the medical market increased as the sales from the recent acquisitions and new product introductions more than offset declines from existing products. Sales to customers in the industrial market improved largely due to increased end market demand for climate control products as well as new product launches related to smart metering. Sales to customers in the public safety market increased primarily due to new product awards and increased demand for existing products.
A significant amount of sales to Philips, ZF, and Nexteer Automotive accounted for the following portions of our net sales:
Year Ended June 30 | |||
2017 | 2016 | ||
Philips | 14% | 15% | |
ZF | 12% | 11% | |
Nexteer Automotive | 12% | * | |
* amount is less than 10% of total | |||
Open orders were up 25% as of June 30, 2017 compared to June 30, 2016 as open orders in each of the four vertical markets increased. Open orders at a point in time may not be indicative of future sales trends due to the contract nature of our business.
Gross profit as a percent of net sales improved to 8.1% in fiscal year 2017 from 7.7% in fiscal year 2016 primarily due to the positive impact from leverage gained on higher revenue, cost productivity, and favorable product mix, which were partially offset by the costs related to the ramp-up of the Romania operation and new product introductions.
For fiscal year 2017, selling and administrative expenses decreased as a percent of net sales and increased in absolute dollars compared to fiscal year 2016. Selling and administrative expenses benefited in fiscal year 2017 from not having the incremental start-up costs related to our Romania operation, which was partially offset by higher expense from the supplemental employee retirement plan (“SERP”) in fiscal year 2017. The SERP expense is a result of the revaluation of the SERP liability and is offset by the revaluation to fair value of the SERP investments recorded in Other Income (Expense).
Other General Income in fiscal year 2017 of $4.0 million resulted from a payment received related to the settlement of a class action lawsuit in which Kimball Electronics was a class member. The lawsuit alleged that certain suppliers to the EMS industry conspired over a number of years to raise and fix the prices of electronic components, resulting in overcharges to purchasers of those components. No Other General Income was recorded during fiscal year 2016.
28
Other Income (Expense) consisted of the following:
Other Income (Expense) | Year Ended | ||||||
June 30 | |||||||
(Amounts in Thousands) | 2017 | 2016 | |||||
Interest Income | $ | 64 | $ | 79 | |||
Interest Expense | (271 | ) | (80 | ) | |||
Foreign Currency/Derivative Loss | (453 | ) | (1,292 | ) | |||
Gain (Loss) on Supplemental Employee Retirement Plan Investment | 1,006 | (67 | ) | ||||
Bargain Purchase Gain on Acquisition | 925 | — | |||||
Other | (73 | ) | (386 | ) | |||
Other Income (Expense), net | $ | 1,198 | $ | (1,746 | ) | ||
The revaluation to fair value of the SERP investments recorded in Other Income (Expense) is offset by the revaluation of the SERP liability recorded in Selling and Administrative Expenses, and thus there was no effect on net income. The Foreign Currency/Derivative Loss resulted from net foreign currency exchange rate movements. The Bargain Purchase Gain on Acquisition for fiscal year 2017 resulted from the Aircom acquisition as the consideration paid for Aircom was less than the estimated fair values of the assets acquired and liabilities assumed. See Note 2 - Acquisitions of Notes to Consolidated Financial Statements for more information regarding the Aircom acquisition.
Our income before income taxes and effective tax rate were comprised of the following U.S. and foreign components:
Year Ended June 30, 2017 | Year Ended June 30, 2016 | ||||||||||||
(Amounts in Thousands) | Income Before Taxes | Effective Tax Rate | Income Before Taxes | Effective Tax Rate | |||||||||
United States | $ | 10,051 | 25.6 | % | $ | 1,919 | 17.8 | % | |||||
Foreign | $ | 34,204 | 21.9 | % | $ | 26,057 | 20.5 | % | |||||
Total | $ | 44,255 | 22.8 | % | $ | 27,976 | 20.3 | % | |||||
When compared to the statutory rate, the effective tax rate for fiscal year 2017 of 22.8% was favorably impacted by a high mix of earnings in foreign jurisdictions, which have lower statutory rates than the United States, foreign exchange rates on foreign income taxes, and domestic tax credits. Also favorably impacting the effective tax rate for fiscal year 2017 was the $0.9 million bargain purchase gain from the Aircom acquisition, which is not taxable. The effective tax rate for fiscal year 2016 of 20.3% was favorably impacted by a high mix of earnings in foreign jurisdictions, which have lower statutory rates than the United States, a foreign income tax benefit of $1.8 million recognized as a result of a favorable tax ruling related to the fiscal year 2015 capitalization of the Company’s Romania subsidiary, and adjustments for domestic tax credits.
We recorded net income of $34.2 million in fiscal year 2017, or $1.24 per diluted share, an increase of 53% from fiscal year 2016 net income of $22.3 million, or $0.76 per diluted share, due to the reasons previously discussed.
29
Liquidity and Capital Resources
Working capital at June 30, 2018 was $208.4 million compared to working capital of $188.9 million at June 30, 2017. The current ratio was 1.9 at both June 30, 2018 and June 30, 2017. Our short-term liquidity available, represented as cash and cash equivalents plus the unused amount of our credit facilities, totaled $108.7 million at June 30, 2018 and $104.8 million at June 30, 2017.
Cash Conversion Days (“CCD”) are calculated as the sum of Days Sales Outstanding (“DSO”) plus Production Days Supply on Hand (“PDSOH”) less Accounts Payable Days (“APD”). CCD is a metric used to measure the efficiency of managing working capital. CCD for the quarter ended June 30, 2018 was 63 days, which increased slightly from 60 days for the quarter ended June 30, 2017. The following table summarizes our CCD for the quarterly periods indicated.
Three Months Ended | ||||||||||
June 30, 2018 | March 31, 2018 | December 31, 2017 | September 30, 2017 | June 30, 2017 | ||||||
DSO | 57 | 58 | 62 | 60 | 62 | |||||
PDSOH | 72 | 66 | 66 | 61 | 59 | |||||
APD | 66 | 62 | 68 | 62 | 61 | |||||
CCD | 63 | 62 | 60 | 59 | 60 | |||||
We define DSO as the average of monthly trade accounts and notes receivable divided by an average day’s net sales, PDSOH as the average of monthly gross inventory divided by an average day’s cost of sales, and APD as the average of monthly accounts payable divided by an average day’s cost of sales. Our PDSOH trend has increased during fiscal year 2018 as a result of the higher inventory balance to support increased open orders and production volumes, the implementation of an inventory management program for one of our largest customers in the medical market, and additional purchases to help mitigate the potential impact from component shortages. The higher PDSOH trend was partially offset by improvement in both our DSO and APD trend during the current fiscal year.
Cash Flows
The following table reflects the major categories of cash flows for the fiscal years ended June 30, 2018, 2017, and 2016.
Year Ended June 30 | ||||||||||||
(Amounts in Millions) | 2018 | 2017 | 2016 | |||||||||
Net cash provided by operating activities | $ | 40.2 | $ | 46.8 | $ | 36.8 | ||||||
Net cash used for investing activities | $ | (26.2 | ) | $ | (35.7 | ) | $ | (42.6 | ) | |||
Net cash used for financing activities | $ | (12.6 | ) | $ | (22.0 | ) | $ | (4.3 | ) | |||
Cash Flows from Operating Activities
Net cash provided by operating activities for the fiscal years ended June 30, 2018, 2017, and 2016 was primarily driven by net income adjusted for non-cash items. Cash provided by operating activities for the fiscal year ended June 30, 2018 included the adjustment for income tax expense resulting from Tax Reform reflected in Deferred income tax and other deferred charges and Accrued expenses and taxes payable. Cash provided by operating activities for fiscal year ended June 30, 2017 included $4.0 million of cash proceeds related to the settlement of a class action lawsuit. Changes in working capital used $9.3 million, $14.1 million, and $10.0 million of cash for the fiscal years ended June 30, 2018, 2017, and 2016, respectively.
The $9.3 million usage of cash from changes in working capital balances in fiscal year 2018 was largely due to an increase in inventory, which used cash of $55.8 million primarily to support increased open orders and production volumes, the implementation of an inventory management program for one of our largest customers in the medical market, and additional purchases to help mitigate the potential impact from component shortages. Partially offsetting these usages was an increase in accounts payable which provided cash of $33.3 million, largely resulting from the increased inventory purchases. In addition, an increase in accrued expenses and taxes payable provided cash of $11.0 million primarily from the increase in income taxes payable related to the deemed repatriation tax net of income taxes paid, which was partially offset by a reduction in other accrued expenses.
30
The $14.1 million usage of cash from changes in working capital balances in fiscal year 2017 was primarily due to fluctuations in our accounts receivable and inventory. An increase in accounts receivable used cash of $19.3 million which resulted primarily from increased sales volumes. An increase in inventory used cash of $8.5 million primarily to support increased open orders and production volumes. Partially offsetting these usages was an increase in accounts payable which provided cash of $9.5 million largely resulting from inventory purchases to support higher volumes and an increase in accrued expenses which provided cash of $8.2 million primarily related to taxes payable and accrued compensation.
The $10.0 million usage of cash from changes in working capital balances in fiscal year 2016 was primarily due to fluctuations in our accounts receivable, inventory, and prepaid expenses and other current assets. An increase in accounts receivable used cash of $9.2 million which resulted primarily from increased sales volumes. An increase in inventory used cash of $3.5 million primarily to support increased production volumes. An increase in certain prepaid expenses and other current assets used cash of $3.7 million primarily due to an increase in taxes refundable. Partially offsetting these usages was an increase in accounts payable which provided cash of $8.3 million primarily related to the increased inventory purchases.
Cash Flows from Investing Activities
For each period shown in the previous table, net cash used for investing activities primarily represents cash used for capital investments. During fiscal years 2018, 2017, and 2016, we reinvested $26.5 million, $34.3 million, and $34.6 million, respectively, into capital investments for the future with the largest expenditures in each period being for manufacturing equipment.
During fiscal year 2018, the capital expenditures were primarily for capacity purposes and to support new business awards. During fiscal year 2017, a large amount of our capital expenditures were to support new business awards, capacity purposes, and for the purchase of the previously leased facility that housed the former Medivative operation. Also during fiscal year 2017, we invested $2.1 million for the Aircom acquisition. During fiscal year 2016, a large amount of our expenditures included equipment to support new business awards and our greenfield start-up facility in Romania. Also during fiscal year 2016, we invested $8.3 million for the Medivative acquisition. See Note 2 - Acquisitions of Notes to Consolidated Financial Statements for more information on the acquisitions.
Cash Flows from Financing Activities
Net cash used for financing activities for the fiscal year ended June 30, 2018 resulted from repurchases of our common stock under an authorized stock repurchase plan, net payments on our revolving credit facilities, and the remittance of tax withholdings on share-based payments. Net cash used for financing activities for the fiscal year ended June 30, 2017 resulted from repurchases of our common stock under an authorized stock repurchase plan, payments on our primary credit facility borrowings, and the remittance of tax withholdings on share-based payments, partially offset by the borrowings on our primary credit facility for domestic cash needs. During fiscal year 2016, net cash used for financing activities resulted primarily from repurchases of our common stock under an authorized stock repurchase plan, which was partially offset by net borrowings on our credit facilities.
Credit Facilities
At June 30, 2018, the Company maintained a U.S. primary credit facility (the “primary facility”), dated as of October 31, 2014 and amended on October 3, 2016, with JPMorgan Chase Bank National Association, as administrative agent, and other lenders party thereto. The credit facility was scheduled to mature on October 31, 2019 and allowed for $50 million in borrowings, with an option to increase the amount available for borrowing to $75 million at the Company’s request, subject to participating banks’ consent.
The proceeds of the revolving credit loans were to be used for general corporate purposes of the Company including potential acquisitions and stock repurchases. A portion of the credit facility, not to exceed $15 million of the principal amount, was available for the issuance of letters of credit. A commitment fee on the unused portion of the principal amount of the credit facility was payable at a rate that ranged from 20.0 to 25.0 basis points per annum as determined by the Company’s ratio of consolidated total indebtedness to adjusted consolidated EBITDA, as defined in the primary facility. The interest rate on borrowings was dependent on the type of borrowings.
At June 30, 2018, we had $6.0 million in short-term borrowings under the primary facility and $0.4 million in letters of credit against the primary credit facility. At June 30, 2017, we had $10.0 million in short-term borrowings under the primary facility and $0.4 million in letters of credit against the primary credit facility. The short-term borrowings under the primary facility were used for domestic cash needs, including stock repurchases.
31
The Company’s financial covenants under the primary credit facility required:
• | a ratio of consolidated total indebtedness minus unencumbered U.S. cash on hand in the United States in excess of $15 million to adjusted consolidated EBITDA, determined as of the end of each of its fiscal quarters for the then most recently ended four fiscal quarters, to not be greater than 3.0 to 1.0, and |
• | a fixed charge coverage ratio, determined as of the end of each of its fiscal quarters for the then most recently ended four fiscal quarters, to not be less than 1.10 to 1.00. |
We were in compliance with the financial covenants during the fiscal year ended June 30, 2018. Subsequent to June 30, 2018, we amended and restated the primary facility. See section titled “Future Liquidity” below for more information on this amended and restated primary credit facility.
Kimball Electronics utilizes foreign credit facilities to satisfy short-term cash needs at specific foreign locations rather than funding from intercompany sources. As of June 30, 2018, we maintained a Thailand overdraft credit facility which allows for borrowings up to 90 million Thai Baht (approximately $2.7 million at June 30, 2018 exchange rates). We had no borrowings outstanding under this foreign credit facility as of June 30, 2018 or June 30, 2017. As of June 30, 2018, we also maintained a credit facility for our China operation, which allows for borrowings up to $7.5 million that can be drawn in either U.S. dollars or China Renminbi. We had no borrowings outstanding under this foreign credit facility as of June 30, 2018 or June 30, 2017. During fiscal year 2017, we established an uncommitted revolving credit facility for our Netherlands subsidiary, which allows for borrowings of up to 9.2 million Euro (approximately $10.8 million at June 30, 2018 exchange rates) that can be drawn in Euro, U.S. dollars, or other optional currency. At June 30, 2018, we had $2.3 million in borrowings under this Netherlands revolving credit facility, and we had no borrowings outstanding under this foreign credit facility as of June 30, 2017. These foreign credit facilities can be canceled at any time by either the bank or us.
Factoring Arrangements
The Company may utilize accounts receivable factoring arrangements with third-party financial institutions in order to extend terms for the customer without negatively impacting our cash flow. These arrangements in all cases do not contain recourse provisions which would obligate us in the event of our customers’ failure to pay. Receivables are considered sold when they are transferred beyond the reach of Kimball Electronics and its creditors, the purchaser has the right to pledge or exchange the receivables, and we have surrendered control over the transferred receivables. During the fiscal years ended June 30, 2018 and 2017, we sold, without recourse, $181.5 million and $145.3 million of accounts receivable, respectively. See Note 1 - Business Description and Summary of Significant Accounting Policies of Notes to Consolidated Financial Statements for more information regarding the factoring arrangements.
Future Liquidity
On July 27, 2018, we amended and restated our existing primary credit facility. The amended and restated primary credit facility has a maturity date of June 27, 2023; allows for $150 million in borrowings (up from $50 million), with an option to increase to $225 million (up from $75 million) at the Company’s request, subject to the consent of each lender participating in such increase; allows a portion of the credit facility (not to exceed $15 million of the principal amount) to be available for the issuance of letters of credit; offers borrowings in the form of revolving credit loans or swingline loans; and is to be used for working capital and general corporate purposes including capital expenditures and acquisitions. As with the primary credit facility entered into on October 31, 2014, under the amended and restated primary credit facility, the interest rate on the borrowings is dependent on the type of borrowings, we are subject to financial covenants, and a commitment fee is payable on the unused portion of the principal amount. See Note 19 - Subsequent Events of Notes to Consolidated Financial Statements for more detail on the amended and restated primary facility.
The availability to borrow under all of our existing credit facilities in USD equivalent as of June 30, 2018 totaled $62.3 million. We believe our principal sources of liquidity from available funds on hand, cash generated from operations, and the availability of borrowing under our credit facilities, including the increased borrowing limit on the amended and restated primary credit facility, will be sufficient to meet our working capital and other operating needs for at least the next 12 months. We expect to continue to invest in capital expenditures prudently and make investments that will help us develop beyond the EMS market, including through acquisitions such as the pending GES acquisition. We intend to fund the pending GES acquisition with proceeds from the amended and restated primary credit facility, and on August 1, 2018, we borrowed $20.2 million on the amended and restated primary credit facility to fund a portion of the pending GES acquisition to be held in escrow until closing. See Note 2 - Acquisitions of Notes to Consolidated Financial Statements for more information regarding the pending GES acquisition.
We are growing our business in Europe through the expansion of our manufacturing capabilities in the region. We completed the construction of our greenfield facility in Romania in fiscal year 2016 and have begun operations. Capacity at this facility will continue to ramp up during fiscal year 2019.
32
At June 30, 2018, our capital expenditure commitments were approximately $6 million, consisting primarily of commitments for capacity purposes in anticipation of future growth, including new program wins, replacement of older machinery and equipment, and improvements to our facilities. We anticipate our funds on hand and funds provided by operations will be sufficient to fund these capital expenditures.
At June 30, 2018, our foreign operations held cash totaling $45.3 million. Tax Reform imposed a one-time deemed repatriation tax on accumulated unremitted foreign earnings of 15.5% for the accumulated unremitted foreign earnings held in foreign cash and other liquid assets and 8.0% of the residual accumulated unremitted foreign earnings. The Company estimated and recorded approximately $13.4 million for the deemed repatriation tax, of which approximately $1.0 million of the tax payable will be paid in the next 12 months with the remaining balance to be paid over an eight-year period. The Company expects to pay this tax payable with available liquidity. Most of these accumulated unremitted foreign earnings have been invested in active non-U.S. business operations, and it is not anticipated such earnings will be remitted to the United States. Our intent is to permanently reinvest these funds outside of the United States. However, if such funds were repatriated, a portion of the funds remitted may be subject to applicable non-U.S. income and withholding taxes. See Note 9 - Income Taxes of Notes to Consolidated Financial Statements for additional information on the deemed repatriation tax and Tax Reform.
On October 21, 2015, the Company’s Board of Directors approved a resolution to authorize an 18-month stock repurchase plan (the “Plan”) to allow the repurchase of up to $20 million of common stock. Then on September 29, 2016, the Board extended the Plan to allow the repurchase of up to an additional $20 million worth of common stock with no expiration date. On August 23, 2017, the Board increased the Plan to allow the repurchase of up to an additional $20 million worth of common stock with no expiration date. This latest increase brings the total authorized stock repurchases under the Plan to $60 million. The Plan may be suspended or discontinued at any time. The extent to which the Company repurchases its shares, and the timing of such repurchases, will depend upon a variety of factors, including market conditions, regulatory requirements, and other corporate considerations, as determined by the Company’s management team. The Company expects to finance the purchases with existing liquidity. The Company has repurchased $44.5 million of common stock under the Plan through June 30, 2018.
Our ability to generate cash from operations to meet our liquidity obligations could be adversely affected in the future by factors such as general economic and market conditions, lack of availability of raw material components in the supply chain, a decline in demand for our services, loss of key contract customers, unsuccessful integration of acquisitions and new operations, the ability of Kimball Electronics to generate profits, and other unforeseen circumstances. In particular, should demand for our customers’ products and, in turn, our services decrease significantly over the next 12 months, the available cash provided by operations could be adversely impacted.
The preceding statements include forward-looking statements under the Private Securities Litigation Reform Act of 1995. Certain factors could cause actual results to differ materially from forward-looking statements.
Fair Value
During fiscal year 2018, no level 1 or level 2 financial instruments were affected by a lack of market liquidity. For level 1 financial assets, readily available market pricing was used to value the financial instruments. Our foreign currency derivative assets and liabilities, which were classified as level 2, were independently valued using observable market inputs such as forward interest rate yield curves, current spot rates, and time value calculations. To verify the reasonableness of the independently determined fair values, these derivative fair values were compared to fair values calculated by the counterparty banks. Our own credit risk and counterparty credit risk had an immaterial impact on the valuation of the foreign currency derivatives. See Note 11 - Fair Value of Notes to Consolidated Financial Statements for more information.
33
Contractual Obligations
The following table summarizes the Company’s contractual obligations as of June 30, 2018.
Payments Due During Fiscal Years Ending June 30 | ||||||||||||||||||||||
(Amounts in Millions) | Total | 2019 | 2020-2021 | 2022-2023 | Thereafter | |||||||||||||||||
Recorded Contractual Obligations: (a) | ||||||||||||||||||||||
Long-Term Debt Obligations (b) | $ | 8.4 | $ | 8.4 | $ | — | $ | — | $ | — | ||||||||||||
Long-Term Income Taxes Payable (c) | 13.4 | 1.0 | 2.1 | 2.1 | 8.2 | |||||||||||||||||
Other Long-Term Liabilities Reflected on the Balance Sheet (d) (e) (f) | 13.0 | 0.9 | 2.8 | 1.2 | 8.1 | |||||||||||||||||
Unrecorded Contractual Obligations: | ||||||||||||||||||||||
Operating Leases (f) | 1.5 | 0.3 | 0.4 | 0.2 | 0.6 | |||||||||||||||||
Purchase Obligations (g) | 521.1 | 495.1 | 24.3 | 1.7 | — | |||||||||||||||||
Total | $ | 557.4 | $ | 505.7 | $ | 29.6 | $ | 5.2 | $ | 16.9 | ||||||||||||
(a) | As of June 30, 2018, we had no Capital Lease Obligations. |
(b) | Amounts outstanding on our credit facilities and the accrued interest for these amounts are included on the Long-Term Debt Obligations line. Refer to Note 6 - Credit Facilities of Notes to Consolidated Financial Statements for more information regarding our credit facilities. The fiscal year 2019 amount was recorded as a current liability. |
(c) | U.S. federal income taxes payable for the one-time deemed repatriation tax on certain unremitted earnings of foreign subsidiaries. The fiscal year 2019 amount includes $1.0 million for short-term income taxes payable on the deemed repatriation tax recorded as a current liability. Refer to Note 9 - Income Taxes of Notes to Consolidated Financial Statements for more information regarding the deemed repatriation tax. |
(d) | The timing of payments of certain items included on the Other Long-Term Liabilities Reflected on the Balance Sheet line above is estimated based on the following assumptions: |
• | The timing of SERP payments is estimated based on an assumed retirement age of 62 with payout based on the prior distribution elections of participants. The fiscal year 2019 amount includes $0.3 million for SERP payments recorded as current liabilities. |
• | The timing of severance plan payments is estimated based on the average remaining service life of employees. The fiscal year 2019 amount includes $0.4 million for severance payments recorded as a current liability. |
• | The timing of warranty payments is estimated based on historical data. The fiscal year 2019 amount includes $0.2 million for short-term warranty payments recorded as a current liability. |
(e) | Excludes $0.2 million of deferred tax liabilities and long-term unrecognized tax benefits which are not tied to a contractual obligation and for which we cannot make a reasonably reliable estimate of the period of future payments. |
(f) | Refer to Note 5 - Commitments and Contingent Liabilities of Notes to Consolidated Financial Statements for more information regarding Operating Leases and certain Other Long-Term Liabilities. |
(g) | Purchase Obligations are defined as agreements to purchase goods or services that are enforceable and legally binding and that specify all significant terms. The amounts listed above for purchase obligations include contractual commitments for items such as raw materials, supplies, capital expenditures, services, and software acquisitions/license commitments. Cancellable purchase obligations that we intend to fulfill are also included in the purchase obligations amount listed. In certain instances, such as when lead times dictate, we enter into contractual agreements for material in excess of the levels required to fulfill customer orders. Purchase obligations as of June 30, 2018 include the placement of orders to help mitigate the potential impact related to component shortages, which requires longer lead times. In turn, material authorization agreements with customers cover a portion of the exposure for material which is purchased prior to having a firm order. |
Off-Balance Sheet Arrangements
In limited circumstances, we receive banker’s acceptance drafts from customers in our China operation. In turn, we may transfer the acceptance drafts to a supplier in settlement of current accounts payable. These drafts contain certain recourse provisions afforded to the transferee under laws of The People’s Republic of China, and if exercised, the draft would revert back to our China operation and we would be required to satisfy the obligation with the transferee. At June 30, 2018, the drafts transferred and outstanding totaled $2.0 million. No transferee has exercised their recourse rights against us.
34
We also have standby letters of credit and operating leases entered into in the normal course of business. These arrangements do not have a material current effect and are not reasonably likely to have a material future effect on our financial condition, results of operations, liquidity, capital expenditures, or capital resources.
See Note 1 - Business Description and Summary of Significant Accounting Policies of Notes to Consolidated Financial Statements for more information on the banker’s acceptance drafts and Note 5 - Commitments and Contingent Liabilities of Notes to Consolidated Financial Statements for more information on standby letters of credit. We do not have material exposures to trading activities of non-exchange traded contracts.
Critical Accounting Policies
Kimball Electronics’ Consolidated Financial Statements have been prepared in accordance with accounting principles generally accepted in the United States of America. These principles require the use of estimates and assumptions that affect amounts reported and disclosed in the Consolidated Financial Statements and related notes. Actual results could differ from these estimates and assumptions. Management uses its best judgment in the assumptions used to value these estimates, which are based on current facts and circumstances, prior experience, and other assumptions that are believed to be reasonable. Management believes the following critical accounting policies reflect the more significant judgments and estimates used in preparation of our Consolidated Financial Statements and are the policies that are most critical in the portrayal of our financial position and results of operations. Management has discussed these critical accounting policies and estimates with the Audit Committee of the Company’s Board of Directors and with the Company’s independent registered public accounting firm.
Revenue recognition - Kimball Electronics recognizes revenue when persuasive evidence of an arrangement exists, delivery has occurred, the sales price is fixed or determinable, and collectability is reasonably assured. Delivery is not considered to have occurred until the title and the risk of loss passes to the customer according to the terms of the contract. Title and risk of loss are transferred upon shipment to or receipt at our customers’ locations, or in limited circumstances, as determined by other specific sales terms of the transaction. Shipping and handling fees billed to customers are recorded as sales while the related shipping and handling costs are included in cost of sales. We recognize sales net of applicable sales tax.
Taxes - Deferred income tax assets and liabilities are recognized for the estimated future tax consequences attributable to temporary differences between the financial statement carrying amounts of existing assets and liabilities and their respective tax bases. These assets and liabilities are measured using enacted tax rates expected to apply to taxable income in the years in which the temporary differences are expected to reverse. In connection with Tax Reform, we remeasured our net deferred tax assets and recorded provisional adjustments using the new U.S. corporate statutory tax rate of 21% for fiscal years beyond 2018. We evaluate the recoverability of our deferred tax assets each quarter by assessing the likelihood of future taxable income and available tax planning strategies that could be implemented to realize our deferred tax assets. If recovery is not likely, we provide a valuation allowance based on our best estimate of future taxable income in the various taxing jurisdictions and the amount of deferred taxes ultimately realizable. Future events could change management’s assessment.
Tax Reform required a one-time transition tax, or deemed repatriation tax, on certain unremitted earnings of foreign subsidiaries. The deemed repatriation tax is based on 15.5% of the accumulated unremitted foreign earnings held in foreign cash and other liquid assets and 8.0% of the residual accumulated foreign earnings, less a portion of foreign taxes paid which are creditable for U.S. federal income tax purposes. We have recorded a provisional tax expense for deemed repatriation on our unremitted foreign earnings. The Company considers the provisional adjustments related to Tax Reform to be reasonable estimates as of June 30, 2018, and these amounts could be affected by additional information and further analysis. As a result, these amounts could be adjusted during the measurement period ending December 2018.
We operate within multiple taxing jurisdictions and are subject to tax audits in these jurisdictions. These audits can involve complex issues, which may require an extended period of time to resolve. However, we believe we have made adequate provision for income and other taxes for all years that are subject to audit. As tax positions are effectively settled, the tax provision will be adjusted accordingly. The liability for uncertain income tax and other tax positions, including accrued interest and penalties on those positions, was $0.2 million at both June 30, 2018 and June 30, 2017.
New Accounting Standards
See Note 1 - Business Description and Summary of Significant Accounting Policies of Notes to Consolidated Financial Statements for information regarding New Accounting Standards.
Item 7A - Quantitative and Qualitative Disclosures About Market Risk
Foreign Exchange Rate Risk: Kimball Electronics operates internationally and thus is subject to potentially adverse movements in foreign currency rate changes. Our risk management strategy includes the use of derivative financial instruments to hedge certain foreign currency exposures. Derivatives are used only to manage underlying exposures and are not used in a speculative manner. Further information on derivative financial instruments is provided in Note 12 - Derivative Instruments of Notes to Consolidated Financial Statements. We estimate that a hypothetical 10% adverse change in foreign currency exchange rates from levels at June 30, 2018 and 2017 relative to non-functional currency balances of monetary instruments, to the extent not hedged by derivative instruments, would not have a material impact on profitability in an annual period.
35
Item 8 - Financial Statements and Supplementary Data
INDEX TO CONSOLIDATED FINANCIAL STATEMENTS | |
Page No. | |
36
MANAGEMENT’S REPORT ON INTERNAL CONTROL OVER FINANCIAL REPORTING
The management of Kimball Electronics, Inc. is responsible for establishing and maintaining adequate internal control over financial reporting and for the preparation and integrity of the accompanying financial statements and other related information in this report. The consolidated financial statements of the Company and its subsidiaries, including the footnotes, were prepared in accordance with accounting principles generally accepted in the United States of America and include judgments and estimates, which in the opinion of management are applied on an appropriately conservative basis. We maintain a system of internal and disclosure controls intended to provide reasonable assurance that assets are safeguarded from loss or material misuse, transactions are authorized and recorded properly, and that the accounting records may be relied upon for the preparation of the financial statements. This system is tested and evaluated regularly for adherence and effectiveness by employees who work within the internal control processes and by our staff of internal auditors.
The Audit Committee of the Board of Directors, which is comprised of directors who are not employees of the Company, meets regularly with management, our internal auditors, and the independent registered public accounting firm to review our financial policies and procedures, our internal control structure, the objectivity of our financial reporting, and the independence of the independent registered public accounting firm. The internal auditors and the independent registered public accounting firm have free and direct access to the Audit Committee, and they meet periodically, without management present, to discuss appropriate matters.
Because of inherent limitations, a system of internal control over financial reporting may not prevent or detect misstatements and even when determined to be effective, can only provide reasonable assurance with respect to financial statement preparation and presentation.
These consolidated financial statements are subject to an evaluation of internal control over financial reporting conducted under the supervision and with the participation of management, including the Chief Executive Officer and Chief Financial Officer. Based on that evaluation, conducted under the criteria established in Internal Control — Integrated Framework (2013) issued by the Committee of Sponsoring Organizations of the Treadway Commission, management concluded that our internal control over financial reporting was effective as of June 30, 2018.
/s/ DONALD D. CHARRON | |
Donald D. Charron | |
Chairman of the Board, | |
Chief Executive Officer | |
August 28, 2018 | |
/s/ MICHAEL K. SERGESKETTER | |
Michael K. Sergesketter | |
Vice President, | |
Chief Financial Officer | |
August 28, 2018 | |
37
REPORT OF INDEPENDENT REGISTERED PUBLIC ACCOUNTING FIRM
To the Board of Directors and Share Owners of
Kimball Electronics, Inc.
Opinions on the Financial Statements and Internal Control over Financial Reporting
We have audited the accompanying consolidated balance sheets of Kimball Electronics, Inc. and subsidiaries (the “Company”) as of June 30, 2018 and 2017, the related consolidated statements of income, comprehensive income, share owners’ equity, and cash flows for each of the three years in the period ended June 30, 2018 and the related notes and the schedules listed in the Index at Item 15 (collectively referred to as the “financial statements”). We also have audited the Company’s internal control over financial reporting as of June 30, 2018, based on criteria established in Internal Control - Integrated Framework (2013) issued by the Committee of Sponsoring Organizations of the Treadway Commission (COSO).
In our opinion, the financial statements referred to above present fairly, in all material respects, the financial position of the Company as of June 30, 2018 and 2017, and the results of its operations and its cash flows for each of the three years in the period ended June 30, 2018, in conformity with accounting principles generally accepted in the United States of America. Also, in our opinion, the Company maintained, in all material respects, effective internal control over financial reporting as of June 30, 2018, based on criteria established in Internal Control - Integrated Framework (2013) issued by COSO.
Basis for Opinions
The Company’s management is responsible for these financial statements, for maintaining effective internal control over financial reporting, and for its assessment of the effectiveness of internal control over financial reporting, included in the accompanying Management’s Report on Internal Control over Financial Reporting. Our responsibility is to express an opinion on these financial statements and an opinion on the Company’s internal control over financial reporting based on our audits. We are a public accounting firm registered with the Public Company Accounting Oversight Board (United States) (PCAOB) and are required to be independent with respect to the Company in accordance with the U.S. federal securities laws and the applicable rules and regulations of the Securities and Exchange Commission and the PCAOB.
We conducted our audits in accordance with the standards of the PCAOB. Those standards require that we plan and perform the audits to obtain reasonable assurance about whether the financial statements are free of material misstatement, whether due to error or fraud, and whether effective internal control over financial reporting was maintained in all material respects.
Our audits of the financial statements included performing procedures to assess the risks of material misstatement of the financial statements, whether due to error or fraud, and performing procedures to respond to those risks. Such procedures included examining, on a test basis, evidence regarding the amounts and disclosures in the financial statements. Our audits also included evaluating the accounting principles used and significant estimates made by management, as well as evaluating the overall presentation of the financial statements. Our audit of internal control over financial reporting included obtaining an understanding of internal control over financial reporting, assessing the risk that a material weakness exists, and testing and evaluating the design and operating effectiveness of internal control based on the assessed risk. Our audits also included performing such other procedures as we considered necessary in the circumstances. We believe that our audits provide a reasonable basis for our opinions.
Definition and Limitations of Internal Control over Financial Reporting
A company’s internal control over financial reporting is a process designed to provide reasonable assurance regarding the reliability of financial reporting and the preparation of financial statements for external purposes in accordance with generally accepted accounting principles. A company’s internal control over financial reporting includes those policies and procedures that (1) pertain to the maintenance of records that, in reasonable detail, accurately and fairly reflect the transactions and dispositions of the assets of the company; (2) provide reasonable assurance that transactions are recorded as necessary to permit preparation of financial statements in accordance with generally accepted accounting principles, and that receipts and expenditures of the company are being made only in accordance with authorizations of management and directors of the company; and (3) provide reasonable assurance regarding prevention or timely detection of unauthorized acquisition, use, or disposition of the company’s assets that could have a material effect on the financial statements.
38
Because of its inherent limitations, internal control over financial reporting may not prevent or detect misstatements. Also, projections of any evaluation of effectiveness to future periods are subject to the risk that controls may become inadequate because of changes in conditions, or that the degree of compliance with the policies or procedures may deteriorate.
/s/ Deloitte & Touche LLP |
DELOITTE & TOUCHE LLP |
Indianapolis, Indiana |
August 28, 2018 |
We have served as the Company’s auditor since 2014.
39
KIMBALL ELECTRONICS, INC.
CONSOLIDATED BALANCE SHEETS
(Amounts in Thousands, Except for Share Data)
June 30, 2018 | June 30, 2017 | ||||||
ASSETS | |||||||
Current Assets: | |||||||
Cash and cash equivalents | $ | 46,428 | $ | 44,555 | |||
Receivables, net of allowances of $482 and $284, respectively | 173,559 | 169,785 | |||||
Inventories | 201,596 | 144,606 | |||||
Prepaid expenses and other current assets | 15,405 | 29,219 | |||||
Total current assets | 436,988 | 388,165 | |||||
Property and Equipment, net of accumulated depreciation of $198,672 and $180,028, respectively | 137,210 | 137,549 | |||||
Goodwill | 6,191 | 6,191 | |||||
Other Intangible Assets, net of accumulated amortization of $27,276 and $26,392, respectively | 4,375 | 4,581 | |||||
Other Assets | 23,994 | 18,458 | |||||
Total Assets | $ | 608,758 | $ | 554,944 | |||
LIABILITIES AND SHARE OWNERS’ EQUITY | |||||||
Current Liabilities: | |||||||
Borrowings under credit facilities | $ | 8,337 | $ | 10,000 | |||
Accounts payable | 187,788 | 154,619 | |||||
Accrued expenses | 32,446 | 34,630 | |||||
Total current liabilities | 228,571 | 199,249 | |||||
Other Liabilities: | |||||||
Long-term income taxes payable | 12,361 | — | |||||
Other long-term liabilities | 12,299 | 13,423 | |||||
Total other liabilities | 24,660 | 13,423 | |||||
Share Owners’ Equity: | |||||||
Preferred stock-no par value | |||||||
Shares authorized: 15,000,000 Shares issued: none | — | — | |||||
Common stock-no par value | |||||||
Shares authorized: 150,000,000 Shares issued: 29,430,000 | — | — | |||||
Additional paid-in capital | 304,215 | 302,483 | |||||
Retained earnings | 99,374 | 82,671 | |||||
Accumulated other comprehensive loss | (6,899 | ) | (9,084 | ) | |||
Treasury stock, at cost: | |||||||
Shares: 2,898,000 and 2,592,000, respectively | (41,163 | ) | (33,798 | ) | |||
Total Share Owners’ Equity | 355,527 | 342,272 | |||||
Total Liabilities and Share Owners’ Equity | $ | 608,758 | $ | 554,944 | |||
40
KIMBALL ELECTRONICS, INC.
CONSOLIDATED STATEMENTS OF INCOME
(Amounts in Thousands, Except for Per Share Data)
Year Ended June 30 | |||||||||||
2018 | 2017 | 2016 | |||||||||
Net Sales | $ | 1,072,061 | $ | 930,914 | $ | 842,060 | |||||
Cost of Sales | 985,859 | 855,319 | 777,522 | ||||||||
Gross Profit | 86,202 | 75,595 | 64,538 | ||||||||
Selling and Administrative Expenses | 43,854 | 36,543 | 34,816 | ||||||||
Other General Income | — | (4,005 | ) | — | |||||||
Operating Income | 42,348 | 43,057 | 29,722 | ||||||||
Other Income (Expense): | |||||||||||
Interest income | 73 | 64 | 79 | ||||||||
Interest expense | (527 | ) | (271 | ) | (80 | ) | |||||
Non-operating income | 3,337 | 2,319 | 166 | ||||||||
Non-operating expense | (456 | ) | (914 | ) | (1,911 | ) | |||||
Other income (expense), net | 2,427 | 1,198 | (1,746 | ) | |||||||
Income Before Taxes on Income | 44,775 | 44,255 | 27,976 | ||||||||
Provision for Income Taxes | 28,023 | 10,076 | 5,689 | ||||||||
Net Income | $ | 16,752 | $ | 34,179 | $ | 22,287 | |||||
Earnings Per Share of Common Stock: | |||||||||||
Basic | $ | 0.63 | $ | 1.25 | $ | 0.77 | |||||
Diluted | $ | 0.62 | $ | 1.24 | $ | 0.76 | |||||
Average Number of Shares Outstanding: | |||||||||||
Basic | 26,745 | 27,413 | 28,916 | ||||||||
Diluted | 27,007 | 27,530 | 29,176 | ||||||||
41
KIMBALL ELECTRONICS, INC.
CONSOLIDATED STATEMENTS OF COMPREHENSIVE INCOME
(Amounts in Thousands)
Year Ended June 30, 2018 | Year Ended June 30, 2017 | Year Ended June 30, 2016 | |||||||||||||||||||||||||||||||||
Pre-tax | Tax | Net of Tax | Pre-tax | Tax | Net of Tax | Pre-tax | Tax | Net of Tax | |||||||||||||||||||||||||||
Net Income | $ | 16,752 | $ | 34,179 | $ | 22,287 | |||||||||||||||||||||||||||||
Other Comprehensive Income (Loss): | |||||||||||||||||||||||||||||||||||
Foreign currency translation adjustments | $ | 2,519 | $ | — | $ | 2,519 | $ | 2,777 | $ | — | $ | 2,777 | $ | (540 | ) | $ | — | $ | (540 | ) | |||||||||||||||
Postemployment severance actuarial change | 533 | (188 | ) | 345 | 285 | (107 | ) | 178 | 507 | (195 | ) | 312 | |||||||||||||||||||||||
Derivative gain (loss) | (2,669 | ) | 704 | (1,965 | ) | 779 | (256 | ) | 523 | (2,869 | ) | 937 | (1,932 | ) | |||||||||||||||||||||
Reclassification to (earnings) loss: | |||||||||||||||||||||||||||||||||||
Derivatives | 1,668 | (213 | ) | 1,455 | (13 | ) | (161 | ) | (174 | ) | 3,537 | (1,185 | ) | 2,352 | |||||||||||||||||||||
Amortization of prior service costs | — | — | — | — | — | — | 28 | (10 | ) | 18 | |||||||||||||||||||||||||
Amortization of actuarial change | (358 | ) | 140 | (218 | ) | (317 | ) | 119 | (198 | ) | (254 | ) | 101 | (153 | ) | ||||||||||||||||||||
Other Comprehensive Income (Loss) | $ | 1,693 | $ | 443 | $ | 2,136 | $ | 3,511 | $ | (405 | ) | $ | 3,106 | $ | 409 | $ | (352 | ) | $ | 57 | |||||||||||||||
Total Comprehensive Income | $ | 18,888 | $ | 37,285 | $ | 22,344 | |||||||||||||||||||||||||||||
42
KIMBALL ELECTRONICS, INC.
CONSOLIDATED STATEMENTS OF CASH FLOWS
(Amounts in Thousands)
Year Ended June 30 | |||||||||||
2018 | 2017 | 2016 | |||||||||
Cash Flows From Operating Activities: | |||||||||||
Net income | $ | 16,752 | $ | 34,179 | $ | 22,287 | |||||
Adjustments to reconcile net income to net cash provided by operating activities: | |||||||||||
Depreciation and amortization | 26,376 | 23,904 | 19,869 | ||||||||
Gain on sales of assets | (7 | ) | (33 | ) | (145 | ) | |||||
Deferred income tax and other deferred charges | 1,213 | (115 | ) | 1,449 | |||||||
Deferred tax valuation allowance | (638 | ) | — | — | |||||||
Stock-based compensation | 5,299 | 3,484 | 3,406 | ||||||||
Excess tax benefits from stock-based compensation | — | — | (203 | ) | |||||||
Bargain purchase gain | — | (925 | ) | — | |||||||
Other, net | 487 | 359 | 137 | ||||||||
Change in operating assets and liabilities: | |||||||||||
Receivables | (2,876 | ) | (19,267 | ) | (9,192 | ) | |||||
Inventories | (55,769 | ) | (8,549 | ) | (3,513 | ) | |||||
Prepaid expenses and other current assets | 5,092 | (3,976 | ) | (3,713 | ) | ||||||
Accounts payable | 33,272 | 9,486 | 8,270 | ||||||||
Accrued expenses and taxes payable | 10,999 | 8,207 | (1,820 | ) | |||||||
Net cash provided by operating activities | 40,200 | 46,754 | 36,832 | ||||||||
Cash Flows From Investing Activities: | |||||||||||
Capital expenditures | (25,876 | ) | (33,254 | ) | (33,664 | ) | |||||
Proceeds from sales of assets | 261 | 490 | 209 | ||||||||
Payments for acquisitions, net of cash acquired | — | (2,138 | ) | (8,267 | ) | ||||||
Purchases of capitalized software | (643 | ) | (1,018 | ) | (968 | ) | |||||
Other, net | 44 | 211 | 100 | ||||||||
Net cash used for investing activities | (26,214 | ) | (35,709 | ) | (42,590 | ) | |||||
Cash Flows From Financing Activities: | |||||||||||
Proceeds from credit facilities | — | 4,000 | 12,000 | ||||||||
Payments on credit facilities | — | (13,000 | ) | (3,000 | ) | ||||||
Net change in revolving credit facilities | (1,542 | ) | 10,000 | — | |||||||
Excess tax benefits from stock-based compensation | — | — | 203 | ||||||||
Repurchases of common stock | (9,553 | ) | (22,325 | ) | (12,606 | ) | |||||
Payments related to tax withholding for stock-based compensation | (1,508 | ) | (709 | ) | (897 | ) | |||||
Net cash used for financing activities | (12,603 | ) | (22,034 | ) | (4,300 | ) | |||||
Effect of Exchange Rate Change on Cash and Cash Equivalents | 490 | 806 | (384 | ) | |||||||
Net Increase (Decrease) in Cash and Cash Equivalents | 1,873 | (10,183 | ) | (10,442 | ) | ||||||
Cash and Cash Equivalents at Beginning of Year | 44,555 | 54,738 | 65,180 | ||||||||
Cash and Cash Equivalents at End of Year | $ | 46,428 | $ | 44,555 | $ | 54,738 | |||||
43
KIMBALL ELECTRONICS, INC.
CONSOLIDATED STATEMENTS OF SHARE OWNERS’ EQUITY
(Amounts in Thousands, Except for Share Data)
Additional Paid-In Capital | Retained Earnings | Accumulated Other Comprehensive Income (Loss) | Treasury Stock | Total Share Owners’ Equity | |||||||||||||||
Amounts at June 30, 2015 | $ | 298,491 | $ | 26,205 | $ | (12,247 | ) | $ | — | $ | 312,449 | ||||||||
Net income | 22,287 | 22,287 | |||||||||||||||||
Other comprehensive income | 57 | 57 | |||||||||||||||||
Issuance of non-restricted stock (47,000 shares) | (28 | ) | 545 | 517 | |||||||||||||||
Compensation expense related to stock compensation plans | 2,915 | 2,915 | |||||||||||||||||
Performance share issuance (258,000 shares) | 203 | 203 | |||||||||||||||||
Repurchase of employee shares for tax withholding (78,000 shares) | (897 | ) | (897 | ) | |||||||||||||||
Repurchase of Common Stock (1,179,000 shares) | (13,162 | ) | (13,162 | ) | |||||||||||||||
Amounts at June 30, 2016 | $ | 301,581 | $ | 48,492 | $ | (12,190 | ) | $ | (13,514 | ) | $ | 324,369 | |||||||
Net income | 34,179 | 34,179 | |||||||||||||||||
Other comprehensive income | 3,106 | 3,106 | |||||||||||||||||
Issuance of non-restricted stock (10,000 shares) | 46 | 119 | 165 | ||||||||||||||||
Compensation expense related to stock compensation plans | 3,246 | 3,246 | |||||||||||||||||
Performance share issuance (136,000 shares) | (2,390 | ) | 1,502 | (888 | ) | ||||||||||||||
Repurchase of Common Stock (1,528,000 shares) | (21,905 | ) | (21,905 | ) | |||||||||||||||
Amounts at June 30, 2017 | $ | 302,483 | $ | 82,671 | $ | (9,084 | ) | $ | (33,798 | ) | $ | 342,272 | |||||||
Net income | 16,752 | 16,752 | |||||||||||||||||
Other comprehensive income | 2,136 | 2,136 | |||||||||||||||||
Tax Reform impact | (49 | ) | 49 | — | |||||||||||||||
Issuance of non-restricted stock (8,000 shares) | 65 | 90 | 155 | ||||||||||||||||
Compensation expense related to stock compensation plans | 5,138 | 5,138 | |||||||||||||||||
Performance share issuance (174,000 shares) | (3,471 | ) | 1,963 | (1,508 | ) | ||||||||||||||
Repurchase of Common Stock (488,000 shares) | (9,418 | ) | (9,418 | ) | |||||||||||||||
Amounts at June 30, 2018 | $ | 304,215 | $ | 99,374 | $ | (6,899 | ) | $ | (41,163 | ) | $ | 355,527 | |||||||
44
KIMBALL ELECTRONICS, INC.
NOTES TO CONSOLIDATED FINANCIAL STATEMENTS
Note 1 Business Description and Summary of Significant Accounting Policies
Business Description:
Kimball Electronics, Inc. (also referred to herein as “Kimball Electronics,” the “Company,” “we,” “us,” or “our”) is a global contract electronic manufacturing services (“EMS”) company that specializes in producing durable electronics for the automotive, medical, industrial, and public safety markets. We offer a package of value that begins with our core competency of producing “durable electronics” and includes our set of robust processes and procedures that help us ensure that we deliver the highest levels of quality, reliability, and service throughout the entire life cycle of our customers’ products. We have been producing safety critical electronic assemblies for our automotive customers for over 30 years. We also offer diversified contract manufacturing services for non-electronic components, medical disposables, plastics, and metal fabrication. We are well recognized by customers and industry trade publications for our excellent quality, reliability, and innovative service.
Kimball Electronics was a wholly owned subsidiary of Kimball International, Inc. (“former Parent” or “Kimball International”) and on October 31, 2014 became a stand-alone public company upon the completion of a spin-off from former Parent.
Principles of Consolidation:
The Consolidated Financial Statements include the accounts of all domestic and foreign subsidiaries. All significant intercompany balances and transactions have been eliminated in the consolidation.
Use of Estimates:
The preparation of financial statements in conformity with accounting principles generally accepted in the United States of America (“U.S. GAAP”) requires management to make estimates and assumptions that affect the reported amounts included in the Consolidated Financial Statements and related note disclosures. While efforts are made to assure estimates used are reasonably accurate based on management’s knowledge of current events, actual results could differ from those estimates.
Segment Information:
Kimball Electronics has business units located in the United States, China, Mexico, Poland, Romania, and Thailand. Each of our business units qualifies as an operating segment with its results regularly reviewed by our chief operating decision maker. Our chief operating decision maker is our Chief Executive Officer. Our business units meet the aggregation criteria under the current accounting guidance for segment reporting. As of June 30, 2018, all of our business units operated in the EMS industry with engineering, manufacturing, and supply chain services that provide electronic assemblies and/or components primarily in automotive, medical, industrial, and public safety applications, all to the specifications and designs of our customers. The nature of the products, the production process, the type of customers, and the methods used to distribute the products have similar characteristics. Each of our business units service customers in multiple markets, and many of our customers’ programs are manufactured and serviced by multiple business units. Our global processes such as component procurement and customer pricing provide commonality and consistency among the various regions in which we operate. All of our business units have similar long-term economic characteristics. As such, our business units have been aggregated into one reportable segment.
Revenue Recognition:
Our net sales are principally from the manufacturing of electronic assemblies, medical disposables, and components all built to customer specifications. We recognize revenue when persuasive evidence of an arrangement exists, delivery has occurred, the sales price is fixed or determinable, and collectability is reasonably assured. Delivery is not considered to have occurred until the title and the risk of loss passes to the customer according to the terms of the contract. Title and risk of loss are transferred upon shipment to or receipt at our customers’ locations, or in limited circumstances, as determined by other specific sales terms of the transaction. Shipping and handling fees billed to customers are recorded as sales while the related shipping and handling costs are included in cost of sales. We recognize sales net of applicable sales tax. Based on estimated product returns and price concessions, a reserve for returns and allowances is recorded at the time of the sale, resulting in a reduction of revenue.
Cash and Cash Equivalents:
Cash equivalents consist primarily of highly liquid investments with original maturities of three months or less at the time of acquisition. Cash and cash equivalents consist of bank accounts and money market funds. Bank accounts are stated at cost, which approximates fair value, and money market funds are stated at fair value.
45
Notes Receivable and Trade Accounts Receivable:
The Company’s notes receivable and trade accounts receivable are recorded per the terms of the agreement or sale, and accrued interest is recognized when earned. We determine on a case-by-case basis the cessation of accruing interest, the resumption of accruing interest, the method of recording payments received on nonaccrual receivables, and the delinquency status for our limited number of notes receivable.
Our policy for estimating the allowance for credit losses on trade accounts receivable and notes receivable includes analysis of such items as aging, credit worthiness, payment history, and historical bad debt experience. Management uses these specific analyses in conjunction with an evaluation of the general economic and market conditions to determine the final allowance for credit losses on the trade accounts receivable and notes receivable. Trade accounts receivable and notes receivable are written off after exhaustive collection efforts occur and the receivable is deemed uncollectible. Our limited amount of notes receivable allows management to monitor the risks, credit quality indicators, collectability, and probability of impairment on an individual basis. Adjustments to the allowance for credit losses are recorded in selling and administrative expenses.
In the ordinary course of business, customers periodically negotiate extended payment terms on trade accounts receivable. Customary terms require payment within 30 to 45 days, with any terms beyond 45 days being considered extended payment terms. We may utilize accounts receivable factoring arrangements with third-party financial institutions in order to extend terms for the customer without negatively impacting our cash flow. These arrangements in all cases do not contain recourse provisions which would obligate us in the event of our customers’ failure to pay. Receivables are considered sold when they are transferred beyond the reach of Kimball Electronics and its creditors, the purchaser has the right to pledge or exchange the receivables, and we have surrendered control over the transferred receivables. During the fiscal years ended June 30, 2018 and 2017, we sold, without recourse, $181.5 million and $145.3 million of accounts receivable, respectively. Factoring fees were $1.1 million during fiscal year 2018 and were included Selling and Administrative Expense on the Consolidated Statements of Income. Factoring fees were not material in fiscal years 2017 and 2016.
The Company’s China operation, in limited circumstances, may receive banker’s acceptance drafts from customers as payment for their trade accounts receivable. The banker’s acceptance drafts are non-interest bearing and primarily mature within six months from the origination date. The Company has the ability to sell the drafts at a discount or transfer the drafts in settlement of current accounts payable prior to the scheduled maturity date. These drafts, which totaled $3.8 million and $5.3 million at June 30, 2018 and 2017, respectively, are reflected in Receivables on the Consolidated Balance Sheets until the banker’s drafts are sold at a discount, transferred in settlement of current accounts payable, or cash is received at maturity. Banker’s acceptance drafts sold at a discount or transferred in settlement of current accounts payable during fiscal years 2018 and 2017 were $5.5 million and $8.1 million, respectively. See Note 5 - Commitments and Contingent Liabilities of Notes to Consolidated Financial Statements for more information on banker’s acceptance drafts.
Inventories:
Inventories are stated at the lower of cost and net realizable value at June 30, 2018 and lower of cost or market value at June 30, 2017. See section entitled “New Accounting Standards” below for more information on the adoption of new accounting guidance on simplifying the measurement of inventory. Cost includes material, labor, and applicable manufacturing overhead. Costs associated with underutilization of capacity are expensed as incurred. Inventories are valued using the first-in, first-out (“FIFO”) method. Inventories are adjusted for excess and obsolete inventory. Evaluation of excess inventory includes such factors as anticipated usage, inventory turnover, inventory levels, and product demand levels. Factors considered when evaluating obsolescence include the age of on-hand inventory and reduction in value due to damage, design changes, or cessation of product lines.
Property, Equipment, and Depreciation:
Property and equipment are stated at cost less accumulated depreciation. Depreciation is provided over the estimated useful life of the assets using the straight-line method for financial reporting purposes. Major maintenance activities and improvements are capitalized; other maintenance and repairs are expensed. Depreciation and expenses for maintenance and repairs are included in both Cost of Sales and Selling and Administrative Expense on the Consolidated Statements of Income.
Impairment of Long-Lived Assets:
We perform reviews for impairment of long-lived assets whenever events or changes in circumstances indicate that the carrying value of an asset may not be recoverable. Impairment is recognized when estimated future cash flows expected to result from the use of the asset and its eventual disposition are less than its carrying amount. When an impairment is identified, the carrying amount of the asset is reduced to its estimated fair value. Assets to be disposed of are recorded at the lower of net book value or fair market value less cost to sell at the date management commits to a plan of disposal. Impairment of long-lived assets was not material during fiscal years 2018, 2017, and 2016.
46
Goodwill and Other Intangible Assets:
Goodwill represents the difference between the purchase price and the related underlying tangible and intangible net asset fair values resulting from business acquisitions. Annually, or if conditions indicate an earlier review is necessary, we may assess qualitative factors to determine if it is more likely than not that the fair value is less than its carrying amount and if it is necessary to perform the quantitative two-step goodwill impairment test. We also have the option to bypass the qualitative assessment and proceed directly to performing the first step of the quantitative goodwill impairment test. If the first step is determined to be necessary, we compare the carrying value of the reporting unit to an estimate of the reporting unit’s fair value to identify potential impairment. If the estimated fair value of the reporting unit is less than the carrying value, a second step is performed to determine the amount of potential goodwill impairment. If impaired, goodwill is written down to its estimated implied fair value. Goodwill is assigned to and the fair value is tested at the reporting unit level. The fair value is established primarily using a discounted cash flow analysis and secondarily a market approach utilizing current industry information. The calculation of the fair value of the reporting units considers current market conditions existing at the assessment date. During fiscal years 2018, 2017, and 2016, no goodwill impairment was recognized. At both June 30, 2018 and 2017, gross goodwill was $19.0 million, accumulated impairment was $12.8 million, and goodwill, net was $6.2 million.
In addition to performing the required annual testing, we will continue to monitor circumstances and events in future periods to determine whether additional goodwill impairment testing is warranted on an interim basis.
Other Intangible Assets reported on the Consolidated Balance Sheets consist of capitalized software and customer relationships. Intangible assets are reviewed for impairment when events or circumstances indicate that the carrying value may not be recoverable over the remaining lives of the assets.
A summary of other intangible assets subject to amortization is as follows:
June 30, 2018 | June 30, 2017 | ||||||||||||||||||||||
(Amounts in Thousands) | Cost | Accumulated Amortization | Net Value | Cost | Accumulated Amortization | Net Value | |||||||||||||||||
Capitalized Software | $ | 30,484 | $ | 26,154 | $ | 4,330 | $ | 29,806 | $ | 25,294 | $ | 4,512 | |||||||||||
Customer Relationships | 1,167 | 1,122 | 45 | 1,167 | 1,098 | 69 | |||||||||||||||||
Other Intangible Assets | $ | 31,651 | $ | 27,276 | $ | 4,375 | $ | 30,973 | $ | 26,392 | $ | 4,581 | |||||||||||
During fiscal years 2018, 2017, and 2016, amortization expense of other intangible assets was, in thousands, $899, $924, and $883, respectively. Amortization expense in future periods is expected to be, in thousands, $831, $699, $640, $561, and $548 in the five years ending June 30, 2023, and $1,096 thereafter. The amortization period for the customer relationship intangible asset is 15 years. The estimated useful life of internal-use software ranges from 3 to 10 years.
Internal-use software is stated at cost less accumulated amortization and is amortized using the straight-line method. During the software application development stage, capitalized costs include external consulting costs, cost of software licenses, and internal payroll and payroll-related costs for employees who are directly associated with a software project. Upgrades and enhancements are capitalized if they result in added functionality which enable the software to perform tasks it was previously incapable of performing. Software maintenance, training, data conversion, and business process reengineering costs are expensed in the period in which they are incurred.
Capitalized customer relationships are amortized on estimated attrition rate of customers. We have no intangible assets with indefinite useful lives which are not subject to amortization.
Research and Development:
The costs of research and development are expensed as incurred. Research and development costs were approximately, in millions, $11, $10, and $9 in fiscal years 2018, 2017, and 2016, respectively.
47
Insurance and Self-insurance:
We are self-insured up to certain limits for general liability, workers’ compensation, and certain employee health benefits including medical, short-term disability, and dental, with the related liabilities included in the accompanying financial statements. Our policy is to estimate reserves based upon a number of factors including known claims, estimated incurred but not reported claims, and other analyses, which are based on historical information along with certain assumptions about future events. Approximately 20% of the workforce is covered under self-insured medical and short-term disability plans. At both June 30, 2018 and 2017, accrued liabilities for self-insurance exposure were $1.4 million.
We carry external medical and disability insurance coverage for the remainder of our eligible workforce not covered by self-insured plans. Insurance benefits are not provided to retired employees.
Income Taxes:
Deferred income tax assets and liabilities are recognized for the estimated future tax consequences attributable to temporary differences between the financial statement carrying amounts of existing assets and liabilities and their respective tax bases. These assets and liabilities are measured using enacted tax rates expected to apply to taxable income in the years in which the temporary differences are expected to reverse. We evaluate the recoverability of deferred tax assets each quarter by assessing the likelihood of future taxable income and available tax planning strategies that could be implemented to realize our deferred tax assets. If recovery is not likely, we provide a valuation allowance based on our best estimate of future taxable income in the various taxing jurisdictions and the amount of deferred taxes ultimately realizable. Future events could change management’s assessment.
We operate within multiple taxing jurisdictions and are subject to tax audits in these jurisdictions. These audits can involve complex uncertain tax positions, which may require an extended period of time to resolve. A tax benefit from an uncertain tax position may be recognized only if it is more likely than not that the tax position will be sustained on examination by taxing authorities, based on the technical merits of the position. We maintain a liability for uncertain income tax and other tax positions, including accrued interest and penalties on those positions. As tax positions are effectively settled, the tax liability is adjusted accordingly. We recognize interest and penalties related to unrecognized tax benefits in Provision for Income Taxes on the Consolidated Statements of Income.
The Company entered into a Tax Matters Agreement with former Parent that governs the Company’s rights and obligations after the spin-off with respect to tax liabilities and benefits, tax attributes, tax contests, and other tax sharing regarding income taxes, other tax matters, and related tax returns. The Company will continue to have joint and several liabilities with former Parent with the IRS and certain U.S. state tax authorities for U.S. federal income and state taxes for the taxable periods in which the Company was a part of former Parent’s consolidated group. The tax matters agreement specifies the portion, if any, of this liability for which the Company bears responsibility, and former Parent has agreed to indemnify the Company against any amounts for which the Company is not responsible. As of June 30, 2018 and 2017, the Company has a receivable from Kimball International recorded for $0.5 million and $0.6 million, respectively. As of June 30, 2018 and 2017, $0.4 million and $0.5 million, respectively, of the receivable from Kimball International is a long-term receivable and was recorded in Other Assets on the Consolidated Balance Sheets, relating to benefits from domestic research and development tax credits.
Concentrations of Credit Risk:
We have business and credit risks concentrated in the automotive, medical, industrial, and public safety industries. The Company monitors credit quality and associated risks of notes receivable on an individual basis based on criteria such as financial stability of the party and collection experience in conjunction with general economic and market conditions. At June 30, 2018 and 2017, amounts outstanding under notes receivables were $0.5 million and $0.7 million, respectively.
48
A summary of significant customers’ net sales and trade receivables as a percentage of consolidated net sales and consolidated trade receivables is as follows:
At or For the Year Ended | At or For the Year Ended | ||||||
June 30, 2018 | June 30, 2017 | ||||||
Net Sales | Trade Receivables | Net Sales | Trade Receivables | ||||
ZF | 15% | 17% | 12% | 17% | |||
Philips | 13% | * | 14% | * | |||
Nexteer Automotive | 13% | 16% | 12% | 13% | |||
Regal Beloit Corporation | * | 11% | * | 11% | |||
* amount is less than 10% of total | |||||||
Off-Balance Sheet Risk:
Off-balance sheet arrangements are limited to banker’s acceptance drafts transferred with recourse provisions at the Company’s China operation, standby letters of credit, and operating leases entered into in the normal course of business as described in Note 5 - Commitments and Contingent Liabilities of Notes to Consolidated Financial Statements.
Other General Income:
Other General Income in fiscal year 2017 consisted of $4.0 million resulting from a payment received related to a class action lawsuit in which Kimball Electronics was a class member. The lawsuit alleged that certain suppliers to the EMS industry conspired over a number of years to raise and fix the prices of electronic components, resulting in overcharges to purchasers of those components. We recorded no Other General Income during fiscal years 2018 and 2016.
Non-operating Income and Expense:
Non-operating income and expense include the impact of such items as foreign currency rate movements and related derivative gain or loss, fair value adjustments on supplemental employee retirement plan (“SERP”) investments, bank charges, bargain purchase gain on acquisition, and other miscellaneous non-operating income and expense items that are not directly related to operations. The gain or loss on SERP investments is offset by a change in the SERP liability that is recognized in Selling and Administrative Expense.
Foreign Currency Translation:
The Company predominantly uses the U.S. dollar and Euro as its functional currencies. Foreign currency assets and liabilities are remeasured into functional currencies at end-of-period exchange rates, except for nonmonetary assets and equity, which are remeasured at historical exchange rates. Revenue and expenses are remeasured at the weighted average exchange rate during the fiscal year, except for expenses related to nonmonetary assets, which are remeasured at historical exchange rates. Gains and losses from foreign currency remeasurement are reported in Non-operating income or expense on the Consolidated Statements of Income.
For business units whose functional currency is other than the U.S. dollar, the translation of functional currency statements to U.S. dollar statements uses end-of-period exchange rates for assets and liabilities, weighted average exchange rates for revenue and expenses, and historical rates for equity. The resulting currency translation adjustment is recorded in Accumulated Other Comprehensive Income (Loss), as a component of Share Owners’ Equity.
Derivative Instruments and Hedging Activities:
Derivative financial instruments are recognized on the balance sheet as assets and liabilities and are measured at fair value. Changes in the fair value of derivatives are recorded each period in earnings or Accumulated Other Comprehensive Income (Loss), depending on whether a derivative is designated and effective as part of a hedge transaction, and if it is, the type of hedge transaction. Hedge accounting is utilized when a derivative is expected to be highly effective upon execution and continues to be highly effective over the duration of the hedge transaction. Hedge accounting permits gains and losses on derivative instruments to be deferred in Accumulated Other Comprehensive Income (Loss) and subsequently included in earnings in the periods in which earnings are affected by the hedged item, or when the derivative is determined to be ineffective. We use derivatives primarily for forward purchases of foreign currency to manage exposure to the variability of cash flows, primarily related to the foreign exchange rate risks inherent in forecasted transactions denominated in foreign currency. Cash receipts and cash payments related to derivative instruments are recorded in the same category as the cash flows from the items being hedged on the Consolidated Statements of Cash Flows. See Note 12 - Derivative Instruments of Notes to Consolidated Financial Statements for more information on derivative instruments and hedging activities.
49
Stock-Based Compensation:
As described in Note 8 - Stock Compensation Plans of Notes to Consolidated Financial Statements, the Company maintains the 2014 Stock Option and Incentive Plan, which allows for the issuance of incentive stock options, stock appreciation rights, restricted shares, unrestricted shares, restricted share units, or performance shares and performance units for grant to officers and other key employees, and to members of the Board of Directors who are not employees. The Company established in fiscal year 2017 the Kimball Electronics, Inc. Non-Employee Directors Stock Compensation Deferral Plan (the “Deferral Plan”), which allows Non-Employee Directors to elect to defer all, or a portion of, their retainer fees in stock. We recognize the cost resulting from share-based payment transactions using a fair-value-based method. The estimated fair value of outstanding performance shares is based on the stock price at the date of the grant. Stock-based compensation expense is recognized for the portion of the award that is ultimately expected to vest. The Company has elected to account for forfeitures by reversing the compensation costs at the time a forfeiture occurs. See section entitled “New Accounting Standards” below for more information on the adoption of new accounting guidance on accounting for share-based payment transactions.
New Accounting Standards:
Adopted in fiscal year 2018:
In November 2015, the Financial Accounting Standards Board (“FASB”) issued guidance on the balance sheet classification of deferred taxes. Under the previous guidance, deferred tax assets and liabilities must be separated into current and noncurrent amounts in a classified statement of financial position. The new guidance requires deferred tax assets and liabilities be classified as noncurrent in a classified statement of financial position. The new guidance does not change the requirement that deferred tax assets and liabilities of a tax-paying component of an entity be offset and presented as a single amount. We adopted this standard on a prospective basis in the fourth quarter of fiscal year 2018 to all deferred tax assets and liabilities. The prior periods were not retrospectively adjusted. The effect was a decrease in Prepaid expenses and other current assets and an increase in Other Assets of $8.3 million on the Consolidated Balance Sheet as of June 30, 2018. There was no impact on our consolidated financial position, results of operations, or cash flows.
In July 2015, the FASB issued guidance on Simplifying the Measurement of Inventory. The guidance amends the subsequent measurement of inventory from the lower of cost or market to the lower of cost and net realizable value. Under the current guidance, market value could be replacement cost, net realizable value, or net realizable value less an approximately normal profit margin. Within the scope of the new guidance, an entity should measure inventory at the lower of cost and net realizable value. Net realizable value is the estimated selling prices in the ordinary course of business, less reasonably predictable costs of completion, disposal, and transportation. We adopted this standard on a prospective basis in the fourth quarter of fiscal year 2018. Prior periods were not retrospectively adjusted. The adoption of this standard did not have a material effect on our consolidated financial statements.
In February 2018, the FASB issued guidance on accounting for the reclassification of certain tax effects from accumulated other comprehensive income. The objective of this guidance is to allow a reclassification from accumulated other comprehensive income to retained earnings for stranded tax effects resulting from the U.S. Tax Cuts and Jobs Act (“Tax Reform”) enacted into law on December 22, 2017. If a company elects to reclassify the stranded tax effects, the guidance offers two acceptable adoption methods: (i) at the beginning of the period, annual or interim, of adoption; or (ii) retrospectively to each period or periods in which the tax effects of Tax Reform related to items remaining in accumulated other comprehensive income are recognized. The Company elected to adopt this guidance at the beginning of its third quarter of fiscal year 2018 and reclassified its stranded tax effects from accumulated other comprehensive income to retained earnings as of January 1, 2018. The components of the Company’s accumulated other comprehensive income that had stranded tax effects as a result of the change in the federal corporate tax rate due to Tax Reform were derivative gain (loss) and postemployment benefits net actuarial gain. Upon adoption of this guidance, a net cumulative-effect adjustment of, in thousands, $49 was recorded to the Company’s retained earnings as of January 1, 2018. This cumulative-effect adjustment decreased Retained earnings and decreased Accumulated other comprehensive loss on the Consolidated Balance Sheet. There was no impact to results of operations or cash flows as a result of the adoption of this guidance.
In March 2016, the FASB issued guidance on accounting for share-based payment transactions. The objective of this guidance is to simplify certain aspects of the accounting for share-based payment transactions, including the treatment of excess income tax benefits and deficiencies, allowing an election to account for forfeitures as they occur, and classification of excess tax benefits on the statement of cash flows. The Company adopted this guidance effective July 1, 2017. There was no impact on the Company’s financial statements upon the initial adoption as there were no tax benefits that were not previously recognized because the related tax deduction had not reduced taxes payable, and therefore no cumulative-effect adjustment to the Company’s beginning retained earnings was required. The Company has elected to reverse the compensation cost of any forfeited awards at the time they occur and will classify the cash flows related to excess tax benefits for share-based payment arrangements as cash flows from operating activities on a prospective basis. The new guidance requires prospective application of the tax effects of differences recognized on or after the effective date between the deduction for an award for tax purposes
50
and the compensation costs of that award recognized for financial reporting purposes. As a result, during fiscal year 2018, the Company recorded an income tax adjustment related to the excess tax benefit on performance shares granted of $0.6 million in Provision for Income Taxes on the Consolidated Statements of Income, or $0.02 per diluted share. Due to including the income tax effects from excess tax benefits in the provision for income taxes, the effects of the excess tax benefits are no longer included in the calculation of diluted shares outstanding, which generally will result in an increase in the number of diluted shares outstanding. The Company adopted this change in the method of calculating diluted shares outstanding on a prospective basis.
Not Yet Adopted:
In March 2017, the FASB issued guidance on improving the presentation of net periodic pension cost and net periodic postretirement benefit cost. The new guidance changes how employers that sponsor defined benefit pension plans and other postretirement plans present net periodic benefit costs in the income statement. An employer is required to report the service cost component in the same line item as other compensation costs arising from services rendered by the affected employees during the period. Other components of net benefit cost are required to be presented in the income statement separately from the service cost component and outside of income from operations. The update also allows only the service cost component to be eligible for capitalization, when applicable. The new guidance will be effective for us in our first quarter of fiscal year 2019. The amendments in this guidance must be applied retrospectively for the presentation of the service cost component and the other components of the net benefit cost in the income statement, and prospectively for the capitalization of the service cost component in assets. We do not expect the adoption of this standard to have a material effect on our consolidated financial position, results of operations, or cash flows.
In February 2016, the FASB issued guidance on leases. The new guidance requires lessees to recognize assets and liabilities on the balance sheet for the rights and obligations created by those leases with terms of more than 12 months. Under the current guidance, only capital leases are recognized on the balance sheet. The new guidance requires additional qualitative and quantitative disclosures. The new guidance will be effective for our fiscal year 2020 interim and annual financial statements. Early application is permitted. The guidance is to be adopted using a modified retrospective transition method, with the option to recognize a cumulative effect adjustment to the opening balance of retained earnings in the period of adoption. We are currently evaluating the optional transition method and the impact of the adoption of this guidance on our consolidated financial statements.
In May 2014, the FASB issued guidance on the recognition of revenue from contracts with customers. The core principle of the guidance is that a company should recognize revenue to depict the transfer of promised goods or services to customers in an amount that reflects the consideration which the company expects to receive in exchange for those goods or services. To achieve this core principle, the guidance provides a five-step analysis of transactions to determine when and how revenue is recognized. The guidance addresses several areas including transfer of control, contracts with multiple performance obligations, and costs to obtain and fulfill contracts. The guidance also requires additional disclosure about the nature, amount, timing, and uncertainty of revenue and cash flows arising from customer contracts, including significant judgments and changes in judgments and assets recognized from costs incurred to obtain or fulfill a contract. The guidance is effective for us as of July 1, 2018, the beginning of our first quarter of fiscal year 2019. Under the guidance there are two acceptable adoption methods: (i) full retrospective adoption to each prior reporting period presented with the option to elect certain practical expedients; or (ii) modified retrospective adoption with the cumulative effect of initially applying the guidance recognized at the date of initial application and providing certain additional disclosures. The Company will adopt this new guidance utilizing the modified retrospective approach. The Company has completed its preliminary assessment of the new guidance and anticipates, for the majority of its contracts for manufacturing services, it will change from a point-in-time recognition method upon transfer of title to recognize revenue earlier using an over-time model based on the progress of completing customer orders. We expect the adoption of the guidance will have a material effect on the Company’s consolidated balance sheets primarily from the recognition of contract assets for unbilled receivables and a corresponding reduction in inventories. Upon adoption, the Company expects to recognize a contract asset for unbilled receivables of approximately $43 million, a reduction in work-in-process and finished goods inventories of approximately $39 million, and an after-tax adjustment to the beginning balance of retained earnings in fiscal year 2019 of approximately $3 million. The Company does not expect the new guidance to materially impact its revenue or results of operations for the periods after adoption, however the Company continues to assess the full impact of adopting the new guidance on its consolidated financial statements. The Company is also continuing to modify its accounting policies, financial reporting processes, and relevant internal controls related to adoption of the new revenue guidance.
51
Note 2 Acquisitions
Pending Acquisition:
On May 11, 2018, the Company entered into a definitive agreement to acquire substantially all of the assets and assume certain liabilities of GES Holdings, Inc., Global Equipment Services and Manufacturing, Inc., and its subsidiaries (collectively referred to as “GES”). The Company agreed to pay a total cash purchase price of approximately $50 million plus the assumed liabilities. The transaction price is subject to certain post-closing working capital adjustments. The acquisition is anticipated to be funded with the Company’s primary credit facility and is expected to close in early fiscal year 2019, subject to customary closing conditions, including regulatory requirements and governmental approvals.
Conditions precedent to close include entering into local country purchase agreements for each of Vietnam, China, India, and Japan, each in a form acceptable to both parties. The Asset Purchase Agreement contains representations, warranties, indemnification provisions, termination provisions, and other clauses and provisions usual and customary for agreements of this type.
This acquisition supports the Company’s new platform strategy and plans to continue its development beyond the electronic manufacturing services (“EMS”) market. GES specializes in production processing and test equipment design, volume manufacturing, and global services for the semiconductor and electronics product manufacturing industry.
Fiscal Year 2017 Acquisition:
On July 18, 2016, the Company acquired certain assets and assumed certain liabilities of Aircom Manufacturing, Inc. (“Aircom”), located in Indianapolis, Indiana, for consideration of $3.5 million, which consisted of $2.5 million in cash payments and the settlement of a $1.0 million receivable. The Aircom acquisition was accounted for as a business combination and included assets acquired of $6.4 million and liabilities assumed of $1.4 million based on their estimated fair values as of the acquisition date.
Consideration paid for Aircom was less than the estimated fair values of the assets acquired and liabilities assumed, which resulted in a bargain purchase gain of $0.9 million and was recorded in Non-operating income on the Consolidated Statements of Income. The bargain purchase gain resulted from the financial distress of Aircom as they were unable to secure sufficient capital to continue operations and service their existing debt.
The Aircom acquisition added expertise in the manufacturing of precision metals and plastics to our package of value. Operating results are included in the Company’s consolidated financial statements beginning from the date of acquisition and had an immaterial effect on the Company’s consolidated financial results for the fiscal year ended June 30, 2017. Direct transaction costs of the Aircom acquisition were not material and were expensed as incurred.
Fiscal Year 2016 Acquisition:
On May 2, 2016, the Company acquired certain assets and assumed certain liabilities of Medivative Technologies, LLC, (“Medivative”) located in Indianapolis, Indiana, a wholly owned subsidiary of privately held Aircom Manufacturing, Inc. The Medivative acquisition adds capabilities in mechanical design, precision plastics, combination devices, instruments, and complex system assembly to our package of value. The Medivative acquisition positions us to better serve both existing and new customers in the medical end market vertical.
The Medivative acquisition was accounted for as a business combination with a total purchase price of $7.3 million, which included a cash payment of $8.3 million less a working capital adjustment of $1.0 million. Assets acquired were $11.6 million, which included $3.6 million of tax deductible goodwill, and liabilities assumed were $4.3 million. The allocation of the purchase price to the assets acquired and liabilities assumed was based on their estimated fair values as of the date of acquisition. Operating results are included in the Company’s consolidated financial statements beginning from the date of acquisition and had an immaterial effect on the Company’s consolidated financial results for the fiscal year ended June 30, 2016. Direct transaction costs of the acquisition were not material and were expensed as incurred.
52
Note 3 Inventories
Inventories were valued using the lower of first-in, first-out (“FIFO”) cost and net realizable value at June 30, 2018 and lower of FIFO cost or market value at June 30, 2017. See Note 1 – Business Description and Summary of Significant Accounting Policies for information on the adoption of new accounting guidance on simplifying the measurement of inventory. Following are inventory components at June 30:
(Amounts in Thousands) | 2018 | 2017 | |||||
Finished products | $ | 25,552 | $ | 18,916 | |||
Work-in-process | 17,254 | 15,480 | |||||
Raw materials | 158,790 | 110,210 | |||||
Total inventory | $ | 201,596 | $ | 144,606 | |||
Note 4 Property and Equipment
Major classes of property and equipment consist of the following at June 30:
(Amounts in Thousands) | 2018 | 2017 | |||||
Land | $ | 10,321 | $ | 9,331 | |||
Buildings and improvements | 71,385 | 63,996 | |||||
Machinery and equipment | 246,758 | 230,142 | |||||
Construction-in-progress | 7,418 | 14,108 | |||||
Total | $ | 335,882 | $ | 317,577 | |||
Less: Accumulated depreciation | (198,672 | ) | (180,028 | ) | |||
Property and equipment, net | $ | 137,210 | $ | 137,549 | |||
The useful lives used in computing depreciation are based on estimated service lives for classes of property, as follows:
Years | |
Buildings and improvements | 3 to 40 |
Machinery and equipment | 3 to 11 |
Leasehold improvements | Lesser of Useful Life or Term of Lease |
Depreciation of property and equipment totaled, in millions, $25.5 for fiscal year 2018, $23.0 for fiscal year 2017, and $19.5 for fiscal year 2016.
53
Note 5 Commitments and Contingent Liabilities
Leases:
Operating leases for land on which certain office and manufacturing facilities reside, a warehouse facility, and certain equipment, which expire from fiscal year 2020 to 2056, contain provisions under which minimum annual lease payments are, in millions, $0.3, $0.3, $0.1, $0.1, and $0.1 for the five years ending June 30, 2023, respectively, and aggregate $0.6 million from fiscal year 2024 to the expiration of the leases in fiscal year 2056. We are obligated under certain real estate leases to maintain the properties and pay real estate taxes. Certain leases include renewal options and escalation clauses. Total rental expense amounted to, in millions, $0.7, $0.7, and $0.5 in fiscal years 2018, 2017, and 2016, respectively.
As of June 30, 2018 and 2017, the Company had no capital leases.
Guarantees:
As of June 30, 2018 and 2017, we had no guarantees issued which were contingent on the future performance of another entity. Standby letters of credit may be issued to third-party suppliers and insurance institutions and can only be drawn upon in the event of the Company’s failure to pay its obligations to the beneficiary. We had a maximum financial exposure from unused standby letters of credit totaling $0.4 million as of both June 30, 2018 and 2017. We don’t expect circumstances to arise that would require us to perform under any of these arrangements and believe that the resolution of any claims that might arise in the future, either individually or in the aggregate, would not materially affect our consolidated financial statements. Accordingly, no liability has been recorded as of June 30, 2018 and 2017 with respect to the standby letters of credit. We also may enter into commercial letters of credit to facilitate payments to vendors and from customers.
Banker’s Acceptance Drafts:
The Company’s China operation, in limited circumstances, receives banker’s acceptance drafts from customers as settlement for their trade accounts receivable. We in turn may transfer the acceptance drafts to a supplier of ours in settlement of current accounts payable. These drafts contain certain recourse provisions afforded to the transferee under laws of The People’s Republic of China. If a transferee were to exercise its available recourse rights, the draft would revert back to our China operation and we would be required to satisfy the obligation with the transferee. At June 30, 2018 and 2017, the drafts transferred and outstanding totaled $2.0 million and $2.1 million, respectively. No transferee has exercised their recourse rights against us. For additional information on banker’s acceptance drafts, see Note 1 – Business Description and Summary of Significant Accounting Policies of Notes to Consolidated Financial Statements.
Product Warranties:
The Company provides only assurance-type warranties for a limited time period, which cover workmanship and assures the product complies with specifications provided by or agreed upon with the customer. We maintain a provision for limited warranty repair or replacement of products manufactured and sold, which has been established in specific manufacturing contract agreements. We estimate product warranty liability at the time of sale based on historical repair or replacement cost trends in conjunction with the length of the warranty offered. Management refines the warranty liability periodically based on changes in historical cost trends and in certain cases where specific warranty issues become known.
Changes in the product warranty accrual during fiscal years 2018, 2017, and 2016 were as follows:
(Amounts in Thousands) | 2018 | 2017 | 2016 | ||||||||
Product Warranty Liability at the beginning of the year | $ | 593 | $ | 605 | $ | 621 | |||||
Additions to warranty accrual (including changes in estimates) | 346 | 415 | 160 | ||||||||
Settlements made (in cash or in kind) | (283 | ) | (427 | ) | (176 | ) | |||||
Product Warranty Liability at the end of the year | $ | 656 | $ | 593 | $ | 605 | |||||
54
Note 6 Credit Facilities
Credit facilities consisted of the following:
Availability to Borrow at | Borrowings Outstanding at | Borrowings Outstanding at | |||||||||
(Amounts in Millions, in U.S Dollar Equivalents) | June 30, 2018 | June 30, 2018 | June 30, 2017 | ||||||||
Primary credit facility (1) | $ | 43.6 | $ | 6.0 | $ | 10.0 | |||||
Thailand overdraft credit facility (2) | 2.7 | — | — | ||||||||
China revolving credit facility (3) | 7.5 | — | — | ||||||||
Netherlands revolving credit facility (4) | 8.5 | 2.3 | — | ||||||||
Total | $ | 62.3 | $ | 8.3 | $ | 10.0 | |||||
(1) | At June 30, 2018, the Company maintained a U.S. primary credit facility (the “primary facility”) dated as of October 31, 2014 and scheduled to mature in October 2019. The primary facility provided for $50 million in borrowings, with an option to increase the amount available for borrowing to $75 million upon request, subject to participating banks’ consent. This facility was maintained for acquisitions and general corporate purposes. A commitment fee was payable on the unused portion of the credit facility which was immaterial to our operating results in fiscal years 2018, 2017, and 2016. The commitment fee on the unused portion of principal amount of the credit facility was payable at a rate that ranges from 20.0 to 25.0 basis points per annum as determined by the Company’s ratio of consolidated total indebtedness to adjusted consolidated EBITDA, as defined in the primary facility. Types of borrowings available on the primary facility included revolving loans, multi-currency term loans, and swingline loans. The interest rate on borrowings was dependent on the type of borrowings. |
The Company’s financial covenants under the primary credit facility required:
• | a ratio of consolidated total indebtedness minus unencumbered U.S. cash on hand in the United States in excess of $15 million to adjusted consolidated EBITDA, determined as of the end of each of its fiscal quarters for the then most recently ended four fiscal quarters, to not be greater than 3.0 to 1.0, and |
• | a fixed charge coverage ratio, determined as of the end of each of its fiscal quarters for the then most recently ended four fiscal quarters, to not be less than 1.10 to 1.00. |
The Company had $0.4 million in letters of credit contingently committed against the credit facility at June 30, 2018. |
Subsequent to June 30, 2018, the Company amended and restated this primary facility. See Note 19 - Subsequent Events of Notes to Consolidated Financial Statements for more detail on the amended and restated primary facility.
(2) | The Company also maintains a foreign credit facility for its operation in Thailand which allows for borrowings of up to 90.0 million Thai Baht (approximately $2.7 million at June 30, 2018 exchange rates). This credit facility can be terminated at any time by either the Company or the bank by giving prior written notice of at least 15 days to the other party. Interest on borrowing under this facility is charged at a rate of interest determined by the bank in accordance with relevant laws and regulations for charging interest on an overdraft facility. |
(3) | The Company also maintains a foreign revolving credit facility for its China operation. The China credit facility allows for borrowings of up to $7.5 million, which borrowings can be made in either Chinese Renminbi (RMB) or U.S. dollars. The availability of this uncommitted facility is at the sole discretion of the bank and is subject to the availability of funds and other relevant conditions. The bank may, at its sole discretion, agree to provide the facility on such terms and conditions as the bank deems appropriate. Further, the availability of the facility is also subject to the determination by the bank of the borrower’s actual need for such facility. Proceeds from the facility are to be used for general working capital purposes. Interest on borrowing under this facility is charged at a rate of interest determined by the bank and is dependent on the denomination of the currency borrowed. The facility matures on May 31, 2019. |
(4) The Company established an uncommitted revolving credit facility in fiscal year 2017 for our Netherlands subsidiary. The Netherlands credit facility allows for borrowings of up to 9.2 million Euro (approximately $10.8 million at June 30, 2018 exchange rates), which borrowings can be made in Euro, U.S. dollars, or other optional currency. The availability of funds under this facility is at the sole discretion of the bank. Proceeds from the facility are to be used for general corporate purposes. Interest on borrowing under this facility is charged at a rate of interest dependent on the denomination of the currency borrowed. The facility matures on June 21, 2019.
The weighted-average interest rate on short-term borrowings outstanding under the credit facilities at June 30, 2018 and June 30, 2017 were 2.67% and 4.50%, respectively. Cash payments for interest on borrowings in fiscal years 2018, 2017, and 2016 were, in thousands, $410, $294, and $44, respectively. Capitalized interest expense was immaterial during fiscal years 2018, 2017, and 2016.
55
Note 7 Employee Benefit Plans
Retirement Plans:
The Company maintains a trusteed defined contribution retirement plan which is in effect for substantially all domestic employees meeting the eligibility requirements. The Company also maintains a supplemental employee retirement plan (“SERP”) for executives and other key employees which enables them to defer cash compensation on a pre-tax basis in excess of IRS limitations. The SERP is structured as a rabbi trust, and therefore assets in the SERP portfolio are subject to creditor claims in the event of bankruptcy.
The discretionary employer contribution for domestic employees is determined annually by the Compensation and Governance Committee of the Company’s Board of Directors. Total expense related to employer contributions to the domestic retirement plans was, in millions, $2.0, $1.7, and $1.4 for fiscal years 2018, 2017, and 2016, respectively.
Employees of certain foreign subsidiaries are covered by local pension or retirement plans. Total expense related to these foreign plans was, in millions, $0.4, $0.2, and $0.3 for fiscal years 2018, 2017, and 2016, respectively.
Severance Plans:
The Company established and maintains severance plans for all domestic employees. These plans provide severance benefits to eligible employees meeting the plans’ qualifications, primarily involuntary termination without cause. There are no statutory requirements for the Company to contribute to the plans, nor do employees contribute to the plans. The plans hold no assets. Benefits are paid using available cash on hand when eligible employees meet plan qualifications for payment. Benefits are based upon an employee’s years of service and accumulate up to certain limits specified in the plans and include both salary and an allowance for medical benefits.
The components and changes in the Benefit Obligation, Accumulated Other Comprehensive Income (Loss), and Net Periodic Benefit Cost, for the domestic severance plans, are as follows:
June 30 | |||||||
(Amounts in Thousands) | 2018 | 2017 | |||||
Changes and Components of Benefit Obligation: | |||||||
Benefit obligation at beginning of year | $ | 1,808 | $ | 1,805 | |||
Service cost | 364 | 302 | |||||
Interest cost | 49 | 39 | |||||
Actuarial gain for the period | (533 | ) | (285 | ) | |||
Benefits paid | (30 | ) | (53 | ) | |||
Benefit obligation at end of year | $ | 1,658 | $ | 1,808 | |||
Balance in current liabilities | $ | 353 | $ | 385 | |||
Balance in noncurrent liabilities | 1,305 | 1,423 | |||||
Total benefit obligation recognized in the Consolidated Balance Sheets | $ | 1,658 | $ | 1,808 | |||
June 30 | |||||||
(Amounts in Thousands) | 2018 | 2017 | |||||
Changes and Components in Accumulated Other Comprehensive Income (Loss) (before tax): | |||||||
Accumulated Other Comprehensive Income (Loss) at beginning of year | $ | (929 | ) | $ | (961 | ) | |
Net change in unrecognized actuarial (gain) loss | (175 | ) | 32 | ||||
Accumulated Other Comprehensive Income (Loss) at end of year | $ | (1,104 | ) | $ | (929 | ) | |
56
(Amounts in Thousands) | Year Ended June 30 | ||||||||||
Components of Net Periodic Benefit Cost (before tax): | 2018 | 2017 | 2016 | ||||||||
Service cost | $ | 364 | $ | 302 | $ | 328 | |||||
Interest cost | 49 | 39 | 50 | ||||||||
Amortization of prior service cost | — | — | 28 | ||||||||
Amortization of actuarial (gain) loss | (358 | ) | (317 | ) | (254 | ) | |||||
Net periodic benefit cost recognized in the Consolidated Statements of Income | $ | 55 | $ | 24 | $ | 152 | |||||
The benefit cost in the above table includes only normal recurring levels of severance activity, as estimated using an actuarial method. Unusual or non-recurring severance actions are not estimable using actuarial methods and are expensed in accordance with other applicable U.S. GAAP.
Prior service cost was amortized on a straight-line basis over the average remaining service period of employees that were active at the time of the plan initiation, and actuarial (gain) loss is amortized on a straight-line basis over the average remaining service period of employees expected to receive benefits under the plan.
The estimated actuarial net (gain) loss for the severance plans that will be amortized from accumulated other comprehensive income (loss) into net periodic benefit cost over the next fiscal year is $(400) thousand. No prior service cost remains to be amortized for next fiscal year.
Assumptions used to determine fiscal year end benefit obligations for both fiscal year 2018 and 2017 included a discount rate of 2.8% and a compensation growth rate of 3.0%. Weighted average assumptions used to determine fiscal year net periodic benefit costs included a discount rate of 2.8%, 2.4%, and 2.7% for fiscal years 2018, 2017, 2016, respectively, and a compensation growth rate of 3.0% for each of the fiscal years 2018, 2017, and 2016.
Note 8 Stock Compensation Plans
A stock compensation plan was created and adopted by the Company’s Board of Directors (the “Board”) on October 3, 2014. The Kimball Electronics, Inc. 2014 Stock Option and Incentive Plan (the “Plan”) allows for the issuance of up to 4.5 million shares and may be awarded in the form of incentive stock options, stock appreciation rights, restricted shares, unrestricted shares, restricted share units, or performance shares and performance units. The Plan is a ten-year plan with no further awards allowed to be made under the Plan after October 1, 2024.
Prior to the spin-off, former Parent maintained stock compensation plans in which our executives and certain key employees participated. All awards granted under the former Parent plans were based on former Parent’s Common Stock. Performance share awards issued and outstanding to Kimball Electronics employees under the former Parent plans as of the spin-off date were amended, in accordance with the terms of the plans, to provide an equitable adjustment as a result of the spin-off.
On October 20, 2016, the Board approved a nonqualified deferred stock compensation plan, the Kimball Electronics, Inc. Non-Employee Directors Stock Compensation Deferral Plan (the “Deferral Plan”), which allows Non-Employee Directors to elect to defer all, or a portion of, their retainer fees in stock until retirement or termination from the Board or death. The Deferral Plan allows for issuance of up to 1.0 million shares of the Company’s common stock.
Pre-tax stock compensation charged against income in fiscal years 2018, 2017, and 2016 was $5.3 million, $3.5 million, and $3.4 million, respectively. These costs are included in Selling and Administrative Expenses.
Performance Shares:
The Company awards performance shares to officers and other key employees. Under these awards granted prior to fiscal year 2016, a number of shares will be issued to each participant based upon the attainment of the applicable bonus percentage calculated under the Company’s profit sharing incentive bonus plan as applied to a total potential share award made and approved by the Compensation and Governance Committee of the Board. Under these awards granted in and subsequent to fiscal year 2016, a number of shares will be issued to each participant based upon a combination of the bonus percentage attainment component above, adjusted to a three-year average bonus percentage, and a growth attainment component, which is the Company’s growth in sales revenue based on comparison of its three-year compounded annual growth rate (“CAGR”) with the Electronics Manufacturing Services Industry’s three-year CAGR.
57
Performance shares are vested when shares of the Company’s Common Stock are issued shortly after the end of the fiscal year in which the performance measurement period is complete. Certain outstanding performance shares are applicable to performance measurement periods in future fiscal years and will be measured at fair value when the performance targets are established in future fiscal years. The contractual life of performance shares ranges from one year to five years. If a participant is not employed on the date shares are issued, the performance share award is forfeited, except in the case of death, retirement at age 62 or older, total permanent disability, or certain other circumstances described in the Plan.
On December 2, 2014, Performance Share Awards issued and outstanding to Kimball Electronics employees under the former Parent plans were amended, in accordance with the terms of the plans, to provide an equitable adjustment as a result of the spin-off. The awards have been or will be granted in shares of the Company’s Common Stock, instead of Kimball International, Inc. shares, under the Kimball Electronics Plan. The amended awards retained the same terms and conditions, vesting schedule, issuance dates, and expiration dates of the original Kimball International awards.
A summary of the Company’s performance share activity during fiscal year 2018 is presented below:
Number of Shares | Weighted Average Grant Date Fair Value | |||||
Performance shares outstanding at July 1, 2017 | 603,114 | $ | 11.46 | |||
Granted | 209,821 | $ | 18.30 | |||
Vested | (255,757 | ) | $ | 11.30 | ||
Forfeited | (750 | ) | $ | 12.07 | ||
Performance shares outstanding at June 30, 2018 | 556,428 | $ | 14.11 | |||
As of June 30, 2018, there was approximately $4.6 million of unrecognized compensation cost related to performance shares, based on the latest estimated attainment of performance goals. That cost is expected to be recognized over annual performance periods ending August 2018 through August 2020, with a weighted average vesting period of nine months. The fair value of performance shares is based on the stock price at the date of grant. During fiscal years 2018, 2017, and 2016, respectively, 255,757, 194,624, and 279,923 performance shares vested at a fair value of $2.9 million, $2.0 million, and 2.7 million. The performance shares vested represent the total number of shares vested prior to the reduction of shares withheld to satisfy tax withholding obligations. The number of shares presented in the above table, the amounts of unrecognized compensation, and the weighted average period include performance shares awarded that are applicable to future performance measurement periods and will be measured at fair value when the performance targets are established in future fiscal years.
Unrestricted Share Grants:
Unrestricted shares may be granted to employees and members of the Board as consideration for services rendered. Unrestricted share grants do not have vesting periods, holding periods, restrictions on sale, or other restrictions. The fair value of unrestricted shares is based on the stock price at the date of the award. During fiscal years 2018, 2017, and 2016, respectively, the Company granted a total of 7,694, 10,477, and 47,262 unrestricted shares at an average grant date fair value of $20.15, $15.75, and $10.94 for a total fair value of $0.2 million, $0.2 million, and $0.5 million. Unrestricted shares were awarded to non-employee members of the Board as compensation for director’s fees, including directors’ elections to receive unrestricted shares in lieu of cash payment. Director’s fees are expensed over the period that directors earn the compensation.
Deferred Share Units:
Deferred share units may be granted to non-employee members of the Board under the Deferral Plan as compensation for the portion of their annual retainer fees resulting from their election to receive deferred share units in lieu of cash payment or unrestricted shares. Director’s fees are expensed over the period that directors earn the compensation. Deferred share units are participating securities and are payable in common stock upon a director’s retirement or termination from the Board or death. During fiscal years 2018 and 2017, respectively, 12,159 and 19,207 deferred share units were granted to non-employee members of the Board at an average grant date fair value of $20.15 and $15.79 for a total fair value of $0.2 million and $0.3 million.
Note 9 Income Taxes
The U.S. Tax Cuts and Jobs Act (“Tax Reform”) was enacted into law on December 22, 2017. Tax Reform makes broad and complex changes to the U.S. tax code, for which complete guidance may have not yet been issued. Tax Reform affected our fiscal year ended June 30, 2018, including, but not limited to, (i) reducing the U.S. corporate statutory tax rate, (ii) requiring a
58
one-time transition tax on certain unremitted earnings of foreign subsidiaries that is payable over an eight-year period, (iii) eliminating U.S. federal income taxes on dividends from foreign subsidiaries, and (iv) bonus depreciation that will allow for full expensing of qualifying property. Tax Reform reduces the U.S. corporate statutory tax rate from 35% to 21%. For our fiscal year ended June 30, 2018, we had a blended corporate tax rate of 28.1%, which was based on the applicable tax rates before and after Tax Reform and the number of days in the fiscal year.
The Company made reasonable estimates of certain effects and, therefore, recorded provisional adjustments including the revaluation of its net deferred tax assets at the new applicable rates and the one-time deemed repatriation tax on accumulated unremitted foreign earnings. Approximately $4.4 million of additional tax expense was recorded for fiscal year 2018 for the revaluation of the net deferred tax assets. The Company also recorded during fiscal year 2018 approximately $13.4 million of tax expense for the deemed repatriation tax, of which $12.4 million of the tax payable was recorded in Long-term income taxes payable on the Consolidated Balance Sheet. The one-time deemed repatriation tax is based on 15.5% of the accumulated unremitted foreign earnings held in foreign cash and other liquid assets and 8.0% of the residual accumulated unremitted foreign earnings, less a portion of foreign taxes paid which are creditable for U.S. federal income tax purposes. Both the revaluation of the net deferred tax assets and the deemed repatriation tax were recognized in Provision for Income Taxes on the Consolidated Statement of Income for fiscal year 2018. The Company considers these provisional recorded amounts to be reasonable estimates as of June 30, 2018, and these amounts could be affected by additional information and further analysis related to Tax Reform. As a result, these amounts could be adjusted during the measurement period ending December 2018.
Tax Reform also subjects U.S. corporations to tax on Global Intangible Low-Taxed Income (“GILTI”), which imposes tax on foreign earnings in excess of a deemed return on tangible assets. Due to the complexity of the new GILTI tax rules, the Company is continuing to evaluate this provision for which no provisional amounts have been recorded in the Company’s Consolidated Financial Statements. An accounting policy election can be made to either record deferred taxes related to GILTI or to record the related taxes in the period in which they occur. The Company has not yet elected an accounting policy related to GILTI and will only do so after completion of further evaluation and analysis. The provisions related to GILTI are subject to adjustment during the measurement period ending December 2018.
Deferred income taxes reflect the net tax effect of temporary differences between the carrying amounts of assets and liabilities for financial reporting purposes and the amounts used for income tax purposes.
The components of the deferred tax assets and liabilities as of June 30, 2018 and 2017, were as follows:
(Amounts in Thousands) | 2018 | 2017 | |||||
Deferred Tax Assets: | |||||||
Receivables | $ | 158 | $ | 112 | |||
Inventory | 1,153 | 1,792 | |||||
Employee benefits | 194 | 190 | |||||
Deferred compensation | 6,496 | 8,226 | |||||
Other current liabilities | 830 | 727 | |||||
Tax credit carryforwards | 1,251 | 749 | |||||
Goodwill | 655 | 1,421 | |||||
Net operating loss carryforward | 2,376 | 1,597 | |||||
Net foreign currency losses | — | 75 | |||||
Property and equipment | — | 1,774 | |||||
Miscellaneous | 2,394 | 1,387 | |||||
Valuation Allowance | (638 | ) | — | ||||
Total asset | $ | 14,869 | $ | 18,050 | |||
Deferred Tax Liabilities: | |||||||
Property and equipment | $ | 565 | $ | — | |||
Net foreign currency gains | $ | 12 | $ | — | |||
Miscellaneous | 300 | 1,962 | |||||
Total liability | $ | 877 | $ | 1,962 | |||
Net Deferred Income Taxes | $ | 13,992 | $ | 16,088 | |||
59
Income tax benefits associated with the net operating loss carryforwards expire from fiscal year 2023 to 2038. Income tax benefits associated with tax credit carryforwards primarily expire from fiscal year 2020 to 2027. A valuation allowance was provided as of June 30, 2018 for deferred tax assets related to certain state credits of, in thousands, $638 that we currently believe are more likely than not to remain unrealized in the future.
The components of income before taxes on income are as follows:
Year Ended June 30 | |||||||||||
(Amounts in Thousands) | 2018 | 2017 | 2016 | ||||||||
United States | $ | 5,609 | $ | 10,051 | $ | 1,919 | |||||
Foreign | 39,166 | 34,204 | 26,057 | ||||||||
Total income before taxes on income | $ | 44,775 | $ | 44,255 | $ | 27,976 | |||||
Tax Reform affected our fiscal year ended June 30, 2018, including, but not limited to, (i) requiring a one-time transition tax on certain unremitted earnings of foreign subsidiaries that is payable over an eight-year period, and (ii) eliminating U.S. federal income taxes on dividends from foreign subsidiaries. The aggregate unremitted earnings of the Company’s foreign subsidiaries was approximately $224 million as of June 30, 2018. Most of these accumulated unremitted foreign earnings have been invested in active non-U.S. business operations, and it is not anticipated such earnings will be remitted to the United States. Our intent is to permanently reinvest these funds outside of the United States. However, if such funds were repatriated, a portion of the funds remitted may be subject to applicable non-U.S. income and withholding taxes.
The provision for income taxes is composed of the following items:
Year Ended June 30 | |||||||||||
(Amounts in Thousands) | 2018 | 2017 | 2016 | ||||||||
Current Taxes: | |||||||||||
Federal | $ | 13,132 | $ | 2,696 | $ | 280 | |||||
Foreign | 11,982 | 8,130 | 5,848 | ||||||||
State | 459 | 134 | 50 | ||||||||
Total payable | $ | 25,573 | $ | 10,960 | $ | 6,178 | |||||
Deferred Taxes: | |||||||||||
Federal | $ | 5,015 | $ | 6 | $ | 153 | |||||
Foreign | (2,427 | ) | (631 | ) | (501 | ) | |||||
State | (776 | ) | (259 | ) | (141 | ) | |||||
Valuation allowance | 638 | — | — | ||||||||
Total deferred | $ | 2,450 | $ | (884 | ) | $ | (489 | ) | |||
Total provision for income taxes | $ | 28,023 | $ | 10,076 | $ | 5,689 | |||||
60
A reconciliation of the statutory U.S. income tax rate to the Company’s effective income tax rate follows:
Year Ended June 30 | ||||||||||||||||||||
2018 | 2017 | 2016 | ||||||||||||||||||
(Amounts in Thousands) | Amount | % | Amount | % | Amount | % | ||||||||||||||
Tax computed at U.S. federal statutory rate | $ | 12,582 | 28.1 | % | $ | 15,489 | 35.0 | % | $ | 9,791 | 35.0 | % | ||||||||
State income taxes, net of federal income tax benefit | (408 | ) | (0.9 | ) | (81 | ) | (0.2 | ) | (59 | ) | (0.2 | ) | ||||||||
Foreign tax rate differential | (1,615 | ) | (3.6 | ) | (3,832 | ) | (8.7 | ) | (2,998 | ) | (10.7 | ) | ||||||||
Impact of foreign exchange rates on foreign income taxes | 180 | 0.4 | (613 | ) | (1.4 | ) | 1,026 | 3.7 | ||||||||||||
Foreign subsidiary capitalization | — | — | — | — | (1,801 | ) | (6.4 | ) | ||||||||||||
Valuation allowance | 638 | 1.4 | — | — | — | — | ||||||||||||||
Research credit | (378 | ) | (0.8 | ) | (348 | ) | (0.8 | ) | (320 | ) | (1.2 | ) | ||||||||
Deemed repatriation | 13,436 | 30.0 | — | — | — | — | ||||||||||||||
Revaluation of net deferred tax assets | 4,357 | 9.7 | — | — | — | — | ||||||||||||||
Other - net | (769 | ) | (1.7 | ) | (539 | ) | (1.1 | ) | 50 | 0.1 | ||||||||||
Total provision for income taxes | $ | 28,023 | 62.6 | % | $ | 10,076 | 22.8 | % | $ | 5,689 | 20.3 | % | ||||||||
During the year ended June 30, 2016, we recognized a foreign tax benefit, in thousands, of $1,801 as a result of a favorable tax ruling related to the fiscal year 2015 capitalization of our Romania subsidiary.
Net cash payments for income taxes were, in thousands, $14,724, $5,896 and $8,975 in fiscal years 2018, 2017, and 2016, respectively.
Changes in the unrecognized tax benefit, excluding accrued interest and penalties, during fiscal years 2018, 2017, and 2016 were as follows:
(Amounts in Thousands) | 2018 | 2017 | 2016 | ||||||||
Beginning balance - July 1 | $ | 102 | $ | 46 | $ | — | |||||
Tax positions related to prior fiscal years: | |||||||||||
Additions | 78 | 56 | 46 | ||||||||
Reductions | (20 | ) | — | — | |||||||
Tax positions related to current fiscal year: | |||||||||||
Additions | — | — | — | ||||||||
Reductions | — | — | — | ||||||||
Settlements | — | — | — | ||||||||
Lapses in statute of limitations | — | — | — | ||||||||
Ending balance - June 30 | $ | 160 | $ | 102 | $ | 46 | |||||
Portion that, if recognized, would reduce tax expense and effective tax rate | $ | 137 | $ | 85 | $ | 37 | |||||
We do not expect the change in the amount of unrecognized tax benefits in the next 12 months to have a significant impact on our results of operations or financial position. We recognize interest and penalties related to unrecognized tax benefits in Provision for Income Taxes on the Consolidated Statements of Income.
Interest and penalties accrued for unrecognized tax benefits as of June 30, 2018, 2017, and 2016 and expenses related to interest and penalties in fiscal years 2018, 2017, and 2016 were not material.
In connection with the spin-off, the Company entered into a Tax Matters Agreement with former Parent that governs the Company’s rights and obligations after the spin-off with respect to tax liabilities and benefits, tax attributes, tax contests, and other tax sharing regarding income taxes, other tax matters, and related tax returns. The Company will continue to have joint and several liabilities with former Parent with the IRS and certain U.S. state tax authorities for U.S. federal income and state taxes for the taxable periods in which the Company was a part of former Parent’s consolidated group. For additional information, see Note 1 – Business Description and Summary of Significant Accounting Policies of Notes to Consolidated Financial Statements. The Company, former Parent, or one of our wholly-owned subsidiaries files U.S. federal income tax returns and income tax returns in various state, local, and foreign jurisdictions. Former Parent is no longer subject to any significant U.S. federal tax examinations by tax authorities for years before fiscal year 2015. We or former Parent are subject to various state and local income tax examinations by tax authorities for years after June 30, 2014 and various foreign jurisdictions for years after June 30, 2013.
61
Note 10 Share Owners’ Equity
On October 21, 2015, the Company’s Board of Directors (the “Board”) authorized an 18-month stock repurchase plan (the “Plan”) allowing a repurchase of up to $20 million worth of common stock. On September 29, 2016, the Board extended the Plan to allow the repurchase of up to an additional $20 million worth of common stock with no expiration date. On August 23, 2017, the Board increased the Plan to allow the repurchase of up to an additional $20 million worth of common stock with no expiration date. This latest increase brings the total authorized stock repurchases under the Plan to $60 million. Purchases may be made under various programs, including in open-market transactions, block transactions on or off an exchange, or in privately negotiated transactions, all in accordance with applicable securities laws and regulations. The Plan may be suspended or discontinued at any time.
During fiscal year 2018, the Company repurchased $9.4 million of common stock under the Plan at an average price of $19.29 per share, which was recorded as Treasury stock, at cost in the Consolidated Balance Sheet. Since the inception of the Plan, the Company has repurchased $44.5 million of common stock under that Plan at an average cost of $13.92 per share.
During fiscal year 2016, the Company acquired an additional 78,000 shares of its common stock, recorded as Treasury stock, at cost. These shares were not acquired in open market purchases as part of the Plan but were acquired in connection with automatically withholding shares from employees upon the vesting of performance share awards to satisfy minimum statutory withholding tax obligations.
Note 11 Fair Value
The Company categorizes assets and liabilities measured at fair value into three levels based upon the assumptions (inputs) used to price the assets or liabilities. Level 1 provides the most reliable measure of fair value, whereas level 3 generally requires significant management judgment. The three levels are defined as follows:
• | Level 1: Unadjusted quoted prices in active markets for identical assets and liabilities. |
• | Level 2: Observable inputs other than those included in level 1. For example, quoted prices for similar assets or liabilities in active markets or quoted prices for identical assets or liabilities in inactive markets. |
• | Level 3: Unobservable inputs reflecting management’s own assumptions about the inputs used in pricing the asset or liability. |
Our policy is to recognize transfers between these levels as of the end of each quarterly reporting period. There were no transfers between these levels during fiscal years 2018 and 2017. There were also no changes in the inputs or valuation techniques used to measure fair values during fiscal year 2018.
Financial Instruments Recognized at Fair Value:
The following methods and assumptions were used to measure fair value:
Financial Instrument | Level | Valuation Technique/Inputs Used | ||
Cash Equivalents | 1 | Market - Quoted market prices | ||
Derivative Assets: Foreign exchange contracts | 2 | Market - Based on observable market inputs using standard calculations, such as time value, forward interest rate yield curves, and current spot rates, considering counterparty credit risk | ||
Trading securities: Mutual funds held in SERP | 1 | Market - Quoted market prices | ||
Derivative Liabilities: Foreign exchange contracts | 2 | Market - Based on observable market inputs using standard calculations, such as time value, forward interest rate yield curves, and current spot rates adjusted for Kimball Electronics’ non-performance risk | ||
62
Recurring Fair Value Measurements:
As of June 30, 2018 and 2017, the fair values of financial assets and liabilities that are measured at fair value on a recurring basis using the market approach are categorized as follows:
June 30, 2018 | |||||||||||
(Amounts in Thousands) | Level 1 | Level 2 | Total | ||||||||
Assets | |||||||||||
Cash equivalents | $ | 1,099 | $ | — | $ | 1,099 | |||||
Derivatives: foreign exchange contracts | — | 1,713 | 1,713 | ||||||||
Trading securities: mutual funds held in nonqualified SERP | 8,769 | — | 8,769 | ||||||||
Total assets at fair value | $ | 9,868 | $ | 1,713 | $ | 11,581 | |||||
Liabilities | |||||||||||
Derivatives: foreign exchange contracts | $ | — | $ | 1,867 | $ | 1,867 | |||||
Total liabilities at fair value | $ | — | $ | 1,867 | $ | 1,867 | |||||
June 30, 2017 | |||||||||||
(Amounts in Thousands) | Level 1 | Level 2 | Total | ||||||||
Assets | |||||||||||
Cash equivalents | $ | 1,087 | $ | — | $ | 1,087 | |||||
Derivatives: foreign exchange contracts | — | 1,810 | 1,810 | ||||||||
Trading securities: mutual funds held in nonqualified SERP | 7,607 | — | 7,607 | ||||||||
Total assets at fair value | $ | 8,694 | $ | 1,810 | $ | 10,504 | |||||
Liabilities | |||||||||||
Derivatives: foreign exchange contracts | $ | — | $ | 2,928 | $ | 2,928 | |||||
Total liabilities at fair value | $ | — | $ | 2,928 | $ | 2,928 | |||||
We had no Level 3 assets or liabilities during fiscal years 2018 and 2017.
The nonqualified supplemental employee retirement plan (“SERP”) assets consist primarily of equity funds, balanced funds, bond funds, and a money market fund. The SERP investment assets are offset by a SERP liability which represents the Company’s obligation to distribute SERP funds to participants. See Note 13 - Investments of Notes to Consolidated Financial Statements for further information regarding the SERP.
Financial Instruments Not Carried At Fair Value:
Financial instruments that are not reflected in the Consolidated Balance Sheets at fair value that have carrying amounts which approximate fair value include the following:
Financial Instrument | Level | Valuation Technique/Inputs Used | ||
Notes receivable | 2 | Market - Price approximated based on the assumed collection of receivables in the normal course of business, taking into account non-performance risk | ||
Borrowings under credit facilities | 2 | Market - Based on observable market rates, taking into account Kimball Electronics’ non-performance risk | ||
The carrying values of our cash deposit accounts, trade accounts receivable, and trade accounts payable approximate fair value due to their relatively short maturity and immaterial non-performance risk.
63
Note 12 Derivative Instruments
Foreign Exchange Contracts:
We operate internationally and are therefore exposed to foreign currency exchange rate fluctuations in the normal course of our business. Our primary means of managing this exposure is to utilize natural hedges, such as aligning currencies used in the supply chain with the sale currency. To the extent natural hedging techniques do not fully offset currency risk, we use derivative instruments with the objective of reducing the residual exposure to certain foreign currency rate movements. Factors considered in the decision to hedge an underlying market exposure include the materiality of the risk, the volatility of the market, the duration of the hedge, the degree to which the underlying exposure is committed to, and the availability, effectiveness, and cost of derivative instruments. Derivative instruments are only utilized for risk management purposes and are not used for speculative or trading purposes.
We use forward contracts designated as cash flow hedges to protect against foreign currency exchange rate risks inherent in forecasted transactions denominated in a foreign currency. Foreign exchange contracts are also used to hedge against foreign currency exchange rate risks related to intercompany balances denominated in currencies other than the functional currencies. As of June 30, 2018, we had outstanding foreign exchange contracts to hedge currencies against the U.S. dollar in the aggregate notional amount of $29.9 million and to hedge currencies against the Euro in the aggregate notional amount of 75.6 million Euro. The notional amounts are indicators of the volume of derivative activities but may not be indicators of the potential gain or loss on the derivatives.
In limited cases due to unexpected changes in forecasted transactions, cash flow hedges may cease to meet the criteria to be designated as cash flow hedges. Depending on the type of exposure hedged, we may either purchase a derivative contract in the opposite position of the undesignated hedge or may retain the hedge until it matures if the hedge continues to provide an adequate offset in earnings against the currency revaluation impact of foreign currency denominated liabilities.
The fair value of outstanding derivative instruments is recognized on the balance sheet as a derivative asset or liability. When derivatives are settled with the counterparty, the derivative asset or liability is relieved and cash flow is impacted for the net settlement. For derivative instruments that meet the criteria of hedging instruments under FASB guidance, the effective portions of the gain or loss on the derivative instrument are initially recorded net of related tax effect in Accumulated Other Comprehensive Income (Loss), a component of Share Owners’ Equity, and are subsequently reclassified into earnings in the period or periods during which the hedged transaction is recognized in earnings. The ineffective portion of the derivative gain or loss is reported in Non-operating income or expense on the Consolidated Statements of Income immediately. The gain or loss associated with derivative instruments that are not designated as hedging instruments or that cease to meet the criteria for hedging under FASB guidance is also reported in Non-operating income or expense on the Consolidated Statements of Income immediately.
Based on fair values as of June 30, 2018, we estimate that approximately $1.4 million of pre-tax derivative loss deferred in Accumulated Other Comprehensive Income (Loss) will be reclassified into earnings, along with the earnings effects of related forecasted transactions, within the fiscal year ending June 30, 2019. Losses on foreign exchange contracts are generally offset by gains in operating costs in the income statement when the underlying hedged transaction is recognized in earnings. Because gains or losses on foreign exchange contracts fluctuate partially based on currency spot rates, the future effect on earnings of the cash flow hedges alone is not determinable, but in conjunction with the underlying hedged transactions, the result is expected to be a decline in currency risk. The maximum length of time we had hedged our exposure to the variability in future cash flows was 12 months as of both June 30, 2018 and June 30, 2017.
See Note 11 - Fair Value of Notes to Consolidated Financial Statements for further information regarding the fair value of derivative assets and liabilities and Note 17 - Accumulated Other Comprehensive Income (Loss) of Notes to Consolidated Financial Statements for the amount and changes in derivative gains and losses deferred in Accumulated Other Comprehensive Income (Loss).
64
Information on the location and amounts of derivative fair values in the Consolidated Balance Sheets and derivative gains and losses in the Consolidated Statements of Income are presented below.
Fair Values of Derivative Instruments on the Consolidated Balance Sheets | |||||||||||||||||||
Asset Derivatives | Liability Derivatives | ||||||||||||||||||
Fair Value As of | Fair Value As of | ||||||||||||||||||
(Amounts in Thousands) | Balance Sheet Location | June 30 2018 | June 30 2017 | Balance Sheet Location | June 30 2018 | June 30 2017 | |||||||||||||
Derivatives Designated as Hedging Instruments: | |||||||||||||||||||
Foreign exchange contracts | Prepaid expenses and other current assets | $ | 758 | $ | 1,810 | Accrued expenses | $ | 1,857 | $ | 2,009 | |||||||||
Derivatives Not Designated as Hedging Instruments: | |||||||||||||||||||
Foreign exchange contracts | Prepaid expenses and other current assets | 955 | — | Accrued expenses | 10 | 919 | |||||||||||||
Total derivatives | $ | 1,713 | $ | 1,810 | $ | 1,867 | $ | 2,928 | |||||||||||
The Effect of Derivative Instruments on Other Comprehensive Income (Loss) | ||||||||||||||
June 30 | ||||||||||||||
(Amounts in Thousands) | 2018 | 2017 | 2016 | |||||||||||
Amount of Pre-Tax Gain or (Loss) Recognized in Other Comprehensive Income (Loss) (OCI) on Derivatives (Effective Portion): | ||||||||||||||
Foreign exchange contracts | $ | (2,669 | ) | $ | 779 | $ | (2,869 | ) | ||||||
The Effect of Derivative Instruments on Consolidated Statements of Income | ||||||||||||||
(Amounts in Thousands) | Year Ended June 30 | |||||||||||||
Derivatives in Cash Flow Hedging Relationships | Location of Gain or (Loss) | 2018 | 2017 | 2016 | ||||||||||
Amount of Pre-Tax Gain or (Loss) Reclassified from Accumulated OCI into Income (Effective Portion): | ||||||||||||||
Foreign exchange contracts | Cost of Sales | $ | (1,648 | ) | $ | 18 | $ | (3,535 | ) | |||||
Foreign exchange contracts | Non-operating income (expense) | (11 | ) | (5 | ) | (1 | ) | |||||||
Total | $ | (1,659 | ) | $ | 13 | $ | (3,536 | ) | ||||||
Amount of Pre-Tax Gain or (Loss) Reclassified from Accumulated OCI into Income (Ineffective Portion): | ||||||||||||||
Foreign exchange contracts | Non-operating income (expense) | $ | (9 | ) | $ | — | $ | (1 | ) | |||||
Derivatives Not Designated as Hedging Instruments | ||||||||||||||
Amount of Pre-Tax Gain or (Loss) Recognized in Income on Derivatives: | ||||||||||||||
Foreign exchange contracts | Non-operating income (expense) | $ | 796 | $ | (42 | ) | $ | 381 | ||||||
Total Derivative Pre-Tax Gain (Loss) Recognized in Income | $ | (872 | ) | $ | (29 | ) | $ | (3,156 | ) | |||||
65
Note 13 Investments
Supplemental Employee Retirement Plan Investments:
The Company maintains a self-directed supplemental employee retirement plan (“SERP”) for executive and other key employees. The Company SERP utilizes a rabbi trust, and therefore assets in the SERP portfolio are subject to creditor claims in the event of bankruptcy. We recognize SERP investment assets on the balance sheet at current fair value. A SERP liability of the same amount is recorded on the balance sheet representing an obligation to distribute SERP funds to participants. The SERP investment assets are classified as trading, and accordingly, realized and unrealized gains and losses are recognized in income in the Other Income (Expense) category. Adjustments made to revalue the SERP liability are also recognized in income as selling and administrative expenses and offset valuation adjustments on SERP investment assets. The change in net unrealized holding gains (losses) for the fiscal years ended June 30, 2018, 2017, and 2016 was, in thousands, $552, $789, and $(321), respectively.
SERP asset and liability balances applicable to Kimball Electronics participants were as follows:
June 30 | |||||||
(Amounts in Thousands) | 2018 | 2017 | |||||
SERP investments - current asset | $ | 294 | $ | 258 | |||
SERP investments - other long-term asset | 8,475 | 7,349 | |||||
Total SERP investments | $ | 8,769 | $ | 7,607 | |||
SERP obligation - current liability | $ | 294 | $ | 258 | |||
SERP obligation - other long-term liability | 8,475 | 7,349 | |||||
Total SERP obligation | $ | 8,769 | $ | 7,607 | |||
Note 14 Accrued Expenses
Accrued expenses consisted of:
June 30 | |||||||
(Amounts in Thousands) | 2018 | 2017 | |||||
Taxes | $ | 2,803 | $ | 6,412 | |||
Compensation | 18,008 | 16,670 | |||||
Derivatives | 1,867 | 2,928 | |||||
Retirement plan | 1,791 | 1,506 | |||||
Insurance | 1,375 | 1,426 | |||||
Other expenses | 6,602 | 5,688 | |||||
Total accrued expenses | $ | 32,446 | $ | 34,630 | |||
66
Note 15 Geographic Information
The following geographic area data includes net sales based on the destination of the product shipped and long-lived assets based on physical location. Long-lived assets include property and equipment and other long-term assets such as software.
At or For the Year Ended June 30 | |||||||||||
(Amounts in Thousands) | 2018 | 2017 | 2016 | ||||||||
Net Sales: | |||||||||||
United States | $ | 448,785 | $ | 403,830 | $ | 383,678 | |||||
China | 160,175 | 152,817 | 150,080 | ||||||||
Mexico | 117,327 | 94,726 | 76,499 | ||||||||
Other Foreign | 345,774 | 279,541 | 231,803 | ||||||||
Total net sales | $ | 1,072,061 | $ | 930,914 | $ | 842,060 | |||||
Long-Lived Assets: | |||||||||||
United States | $ | 66,660 | $ | 67,817 | $ | 53,596 | |||||
Poland | 33,629 | 32,315 | 34,588 | ||||||||
China | 14,546 | 17,106 | 15,922 | ||||||||
Romania | 19,394 | 16,468 | 12,249 | ||||||||
Other Foreign | 7,311 | 8,355 | 8,839 | ||||||||
Total long-lived assets | $ | 141,540 | $ | 142,061 | $ | 125,194 | |||||
Note 16 Earnings Per Share
Basic and diluted earnings per share were calculated as follows under the two-class method:
(Amounts in thousands, except per share data) | Year Ended June 30 | ||||||||||
2018 | 2017 | 2016 | |||||||||
Basic and Diluted Earnings Per Share: | |||||||||||
Net Income | $ | 16,752 | $ | 34,179 | $ | 22,287 | |||||
Less: Net Income allocated to participating securities | 9 | 15 | — | ||||||||
Net Income allocated to common Share Owners | $ | 16,743 | $ | 34,164 | $ | 22,287 | |||||
Basic weighted average common shares outstanding | 26,745 | 27,413 | 28,916 | ||||||||
Dilutive effect of average outstanding performance shares | 255 | 110 | 260 | ||||||||
Dilutive effect of average outstanding deferred stock units | 7 | 7 | — | ||||||||
Dilutive weighted average shares outstanding | 27,007 | 27,530 | 29,176 | ||||||||
Earnings Per Share of Common Stock: | |||||||||||
Basic | $ | 0.63 | $ | 1.25 | $ | 0.77 | |||||
Diluted | $ | 0.62 | $ | 1.24 | $ | 0.76 | |||||
67
Note 17 Accumulated Other Comprehensive Income (Loss)
The changes in the balances of each component of Accumulated Other Comprehensive Income (Loss), net of tax, were as follows:
(Amounts in Thousands) | Foreign Currency Translation Adjustments | Derivative Gain (Loss) | Postemployment Benefits Net Actuarial Gain (Loss) | Accumulated Other Comprehensive Income (Loss) | |||||||||||
Balance at June 30, 2016 | $ | (9,653 | ) | $ | (3,137 | ) | $ | 600 | $ | (12,190 | ) | ||||
Other comprehensive income (loss) before reclassifications | 2,777 | 523 | 178 | 3,478 | |||||||||||
Reclassification to (earnings) loss | — | (174 | ) | (198 | ) | (372 | ) | ||||||||
Net current-period other comprehensive income (loss) | $ | 2,777 | $ | 349 | $ | (20 | ) | $ | 3,106 | ||||||
Balance at June 30, 2017 | $ | (6,876 | ) | $ | (2,788 | ) | $ | 580 | $ | (9,084 | ) | ||||
Other comprehensive income (loss) before reclassifications | 2,519 | (1,965 | ) | 345 | 899 | ||||||||||
Reclassification to (earnings) loss | — | 1,455 | (218 | ) | 1,237 | ||||||||||
Net current-period other comprehensive income (loss) | 2,519 | (510 | ) | 127 | 2,136 | ||||||||||
Tax Reform impact (1) | — | (81 | ) | 130 | 49 | ||||||||||
Balance at June 30, 2018 | $ | (4,357 | ) | $ | (3,379 | ) | $ | 837 | $ | (6,899 | ) | ||||
(1) During fiscal year 2018, the Company adopted a new accounting standard on accounting for the reclassification of certain tax effects from accumulated other comprehensive income related to Tax Reform. See Note 1 – Business Description and Summary of Significant Accounting Policies of Notes to Consolidated Financial Statements for further information on the adoption of new accounting standards and Tax Reform.
The following reclassifications were made from Accumulated Other Comprehensive Income (Loss) to the Consolidated Statements of Income:
Reclassifications from Accumulated Other Comprehensive Income (Loss) | Affected Line Item in the Consolidated Statements of Income | |||||||||
Year Ended June 30 | ||||||||||
(Amounts in Thousands) | 2018 | 2017 | ||||||||
Derivative Gain (Loss) (1) | $ | (1,648 | ) | $ | 18 | Cost of Sales | ||||
(20 | ) | (5 | ) | Non-operating income (expense), net | ||||||
213 | 161 | Benefit (Provision) for Income Taxes | ||||||||
$ | (1,455 | ) | $ | 174 | Net of Tax | |||||
Postemployment Benefits: | ||||||||||
Amortization of Actuarial Gain (Loss) (2) | $ | 200 | $ | 181 | Cost of Sales | |||||
158 | 136 | Selling and Administrative Expenses | ||||||||
(140 | ) | (119 | ) | Benefit (Provision) for Income Taxes | ||||||
$ | 218 | $ | 198 | Net of Tax | ||||||
Total Reclassifications for the Period | $ | (1,237 | ) | $ | 372 | Net of Tax | ||||
Amounts in parentheses indicate reductions to income.
(1) See Note 12 - Derivative Instruments of Notes to Consolidated Financial Statements for further information on derivative instruments.
(2) See Note 7 - Employee Benefit Plans of Notes to Consolidated Financial Statements for further information on postemployment benefit plans.
68
Note 18 Quarterly Financial Information (Unaudited)
Three Months Ended | |||||||||||||||
(Amounts in Thousands, Except for Per Share Data) | September 30 | December 31 | March 31 | June 30 | |||||||||||
Fiscal Year 2018: | |||||||||||||||
Net Sales | $ | 253,204 | $ | 258,151 | $ | 283,938 | $ | 276,768 | |||||||
Gross Profit | 19,490 | 20,962 | 22,927 | 22,823 | |||||||||||
Net Income (1) | 8,480 | (8,347 | ) | 10,835 | 5,784 | ||||||||||
Basic Earnings Per Share | $ | 0.32 | $ | (0.31 | ) | $ | 0.41 | $ | 0.22 | ||||||
Diluted Earnings Per Share | $ | 0.31 | $ | (0.31 | ) | $ | 0.40 | $ | 0.22 | ||||||
Fiscal Year 2017: | |||||||||||||||
Net Sales | $ | 226,451 | $ | 230,265 | $ | 232,930 | $ | 241,268 | |||||||
Gross Profit | 18,322 | 20,553 | 18,718 | 18,002 | |||||||||||
Other General Income (2) | (4,005 | ) | — | — | — | ||||||||||
Net Income | 10,122 | 7,812 | 8,117 | 8,128 | |||||||||||
Basic Earnings Per Share | $ | 0.36 | $ | 0.29 | $ | 0.30 | $ | 0.30 | |||||||
Diluted Earnings Per Share | $ | 0.36 | $ | 0.28 | $ | 0.30 | $ | 0.30 | |||||||
(1) Net income for the quarter ended December 31, 2017 included income tax expense of $16.6 million ($0.62 per diluted share) due to the U.S. Tax Cuts and Jobs Act (“Tax Reform”) that was enacted into law in December 2017 and relates to the deemed repatriation of unremitted foreign earnings and the revaluation of net deferred tax assets.
(2) Other General Income of $4.0 million resulted from a payment received related to a class action lawsuit in which Kimball Electronics was a class member.
Note 19 Subsequent Events
On July 27, 2018, the Company entered into an amended and restated credit agreement (the “Credit Agreement”) among the Company, the lenders party thereto, and JPMorgan Chase Bank, National Association, as Administrative Agent, and Bank of America, N.A., as Documentation Agent. The Credit Agreement amends and restates the Company’s primary credit facility, which was scheduled to mature on October 31, 2019. The Credit Agreement has a maturity date of July 27, 2023 and allows for $150 million in borrowings, with an option to increase the amount available for borrowing to $225 million at the Company’s request, subject to the consent of each lender participating in such increase.
A commitment fee on the unused portion of principal amount of the credit facility is payable at a rate that ranges from 20.0 to 25.0 basis points per annum as determined by the Company’s ratio of consolidated total indebtedness to adjusted consolidated EBITDA, as defined in the Credit Agreement. The types of borrowings available, the interest rates on the borrowings, and the financial covenants under the amended and restated credit agreement were unchanged. The proceeds of the loans are to be used for working capital and general corporate purposes of the Company including capital expenditures and acquisitions. We intend to fund the pending GES acquisition with proceeds from the Credit Agreement, and on August 1, 2018, we borrowed $20.2 million on the Credit Agreement to fund a portion of the pending GES acquisition to be held in escrow until closing.
69
Item 9 - Changes in and Disagreements With Accountants on Accounting and Financial Disclosure
None.
Item 9A - Controls and Procedures
(a) Evaluation of disclosure controls and procedures.
Kimball Electronics maintains controls and procedures designed to ensure that information required to be disclosed in the reports that the Company files or submits under the Securities Exchange Act of 1934 is recorded, processed, summarized, and reported within the time periods specified in the rules and forms of the Securities and Exchange Commission and that such information is accumulated and communicated to the Company’s management, including its Chief Executive Officer and Chief Financial Officer, as appropriate, to allow timely decisions regarding required disclosure. Based upon their evaluation of those controls and procedures performed, the Chief Executive Officer and Chief Financial Officer of the Company concluded that its disclosure controls and procedures were effective as of June 30, 2018.
(b) Management’s report on internal control over financial reporting.
Pursuant to Section 404 of the Sarbanes-Oxley Act of 2002 and the rules and regulations adopted pursuant thereto, the Company included a report of management’s assessment of the effectiveness of its internal control over financial reporting as part of this report. The effectiveness of the Company’s internal control over financial reporting as of June 30, 2018 has been audited by the Company’s independent registered public accounting firm. Management’s report and the independent registered public accounting firm’s attestation report are included in the Company’s Consolidated Financial Statements under the caption entitled “Management’s Report on Internal Control Over Financial Reporting” and “Report of Independent Registered Public Accounting Firm” and are incorporated herein by reference.
(c) Changes in internal control over financial reporting.
There have been no changes in our internal control over financial reporting that occurred during the quarter ended June 30, 2018 that have materially affected, or that are reasonably likely to materially affect, our internal control over financial reporting.
Item 9B - Other Information
None.
70
PART III
Item 10 - Directors, Executive Officers and Corporate Governance
Directors
The information required by this item with respect to Directors is incorporated by reference to the material contained in the Company’s Proxy Statement for its annual meeting of Share Owners to be held November 8, 2018 under the caption “Election of Directors.”
Committees
The information required by this item with respect to the Audit Committee and its financial expert and with respect to the Compensation and Governance Committee’s responsibility for establishing procedures by which Share Owners may recommend nominees to the Board of Directors is incorporated by reference to the material contained in the Company’s Proxy Statement for its annual meeting of Share Owners to be held November 8, 2018 under the caption “Corporate Governance at Kimball Electronics.”
Executive Officers of the Registrant
The information required by this item with respect to Executive Officers of the Registrant is included at the end of Part I of this Annual Report on Form 10-K and is incorporated herein by reference.
Compliance with Section 16(a) of the Exchange Act
The information required by this item with respect to compliance with Section 16(a) of the Securities Exchange Act of 1934 is incorporated by reference to the material contained in the Company’s Proxy Statement for its annual meeting of Share Owners to be held November 8, 2018 under the caption “Section 16(a) Beneficial Ownership Reporting Compliance.”
Code of Ethics
Kimball Electronics has a code of ethics that applies to all of its employees, including the Chief Executive Officer, the Chief Financial Officer, and the Corporate Controller (functioning as Principal Accounting Officer). The code of ethics is posted on the Company’s website at investors.kimballelectronics.com. It is our intention to disclose any amendments to the code of ethics on this website. In addition, any waivers of the code of ethics for directors or executive officers of the Company will be disclosed in a Current Report on Form 8-K.
Item 11 - Executive Compensation
The information required by this item for companies in their first year post emerging growth company status is incorporated by reference to the material contained in the Company’s Proxy Statement for its annual meeting of Share Owners to be held November 8, 2018 under the captions “Corporate Governance at Kimball Electronics” and “Executive Compensation.”
Item 12 - Security Ownership of Certain Beneficial Owners and Management and Related Share Owner Matters
Security Ownership
The information required by this item is incorporated by reference to the material contained in the Company’s Proxy Statement for its annual meeting of Share Owners to be held November 8, 2018 under the caption “Share Ownership Information.”
Securities Authorized for Issuance Under Equity Compensation Plans
The information required by this item is incorporated by reference to the material contained in the Company’s Proxy Statement for its annual meeting of Share Owners to be held November 8, 2018 under the captions “Equity Compensation Plan Information” and “Share Ownership Information.”
71
Item 13 - Certain Relationships and Related Transactions, and Director Independence
Relationships and Related Transactions
The information required by this item is incorporated by reference to the material contained in the Company’s Proxy Statement for its annual meeting of Share Owners to be held November 8, 2018 under the caption “Review and Approval of Transactions with Related Persons.”
Director Independence
The information required by this item is incorporated by reference to the material contained in the Company’s Proxy Statement for its annual meeting of Share Owners to be held November 8, 2018 under the caption “Corporate Governance at Kimball Electronics.”
Item 14 - Principal Accounting Fees and Services
The information required by this item is incorporated by reference to the material contained in the Company’s Proxy Statement for its annual meeting of Share Owners to be held November 8, 2018 under the caption “Selection of Independent Registered Public Accounting Firm” and “Appendix A — Approval Process for Services Performed by the Independent Registered Public Accounting Firm.”
72
PART IV
Item 15 - Exhibits, Financial Statement Schedules
(a) | The following documents are filed as part of this report: |
(1) Financial Statements:
The following consolidated financial statements of the Company are found in Item 8 and incorporated herein. | |||
(2) Financial Statement Schedules:
Schedules other than those listed above are omitted because they are either not required or not applicable, or the required information is presented in the Consolidated Financial Statements. | |||
(3) Exhibits
See the Index of Exhibits which immediately precedes the Signatures page in this Annual Report on Form 10-K for a list of the exhibits filed or incorporated herein as a part of this report.
Item 16 - Form 10-K Summary
None.
73
KIMBALL ELECTRONICS, INC.
INDEX OF EXHIBITS
Exhibit No. | Description | |
2.1 | ||
2.2(b)(d)(e) | ||
3.1 | ||
3.2 | ||
10.1(a)(b) | ||
10.2(a) | ||
10.3(a) | ||
10.4(a) | ||
10.5(a) | ||
10.6 | ||
10.7 | ||
10.8 | ||
10.9 | ||
10.10(a) | ||
10.11(a) | ||
10.12(a) | ||
10.13(a) | ||
10.14 | ||
10.15(a) | ||
74
10.16(a) | ||
10.17 | ||
21(b) | ||
23(b) | ||
24(b) | ||
31.1(b) | ||
31.2(b) | ||
32.1(b)(c) | ||
32.2(b)(c) | ||
101.INS(b) | XBRL Instance Document | |
101.SCH(b) | XBRL Taxonomy Extension Schema Document | |
101.CAL(b) | XBRL Taxonomy Extension Calculation Linkbase Document | |
101.DEF(b) | XBRL Taxonomy Extension Definition Linkbase Document | |
101.LAB(b) | XBRL Taxonomy Extension Label Linkbase Document | |
101.PRE(b) | XBRL Taxonomy Extension Presentation Linkbase Document | |
(a) | Constitutes management contract or compensatory arrangement |
(b) | Filed herewith |
(c) | In accordance with Item 601(b)(32)(ii) of Regulation S-K, the certifications furnished in Exhibit 32.1 and 32.2 will not be deemed “filed” for purposes of Section 18 of the Exchange Act. Such certifications will not be deemed to be incorporated by reference into any filing under the Securities Act or the Exchange Act, except to the extent that the registrant specifically incorporates it by reference. |
(d) | Schedules and exhibits have been omitted pursuant to Item 601(b)(2) of Regulation S-K. The Registrant will supplementally furnish any of the omitted schedules or exhibits to the Securities and Exchange Commission upon request. |
(e) | Confidential treatment has been requested as to certain portions of this Exhibit. |
75
SIGNATURES
Pursuant to the requirements of Section 13 or 15(d) of the Securities Exchange Act of 1934, the Registrant has duly caused this report to be signed on its behalf by the undersigned, thereunto duly authorized.
KIMBALL ELECTRONICS, INC. | ||
By: | /s/ MICHAEL K. SERGESKETTER | |
Michael K. Sergesketter | ||
Vice President, | ||
Chief Financial Officer | ||
August 28, 2018 | ||
Pursuant to the requirements of the Securities Exchange Act of 1934, this report has been signed below by the following persons on behalf of the Registrant and in the capacities and on the dates indicated:
/s/ DONALD D. CHARRON | ||
Donald D. Charron | ||
Chairman of the Board, | ||
Chief Executive Officer | ||
August 28, 2018 | ||
/s/ MICHAEL K. SERGESKETTER | ||
Michael K. Sergesketter | ||
Vice President, | ||
Chief Financial Officer | ||
August 28, 2018 | ||
/s/ MARK D. HODELL | ||
Mark D. Hodell | ||
Corporate Controller, | ||
(functioning as Principal Accounting Officer) | ||
August 28, 2018 | ||
76
Signature | Signature | |
GREGORY J. LAMPERT * | COLLEEN C. REPPLIER * | |
Gregory J. Lampert | Colleen C. Repplier | |
Director | Director | |
GEOFFREY L. STRINGER * | GREGORY A. THAXTON * | |
Geoffrey L. Stringer | Gregory A. Thaxton | |
Director | Director | |
THOMAS J. TISCHHAUSER * | CHRISTINE M. VUJOVICH * | |
Thomas J. Tischhauser | Christine M. Vujovich | |
Director | Director | |
* | The undersigned does hereby sign this document on my behalf pursuant to powers of attorney duly executed and filed with the Securities and Exchange Commission, all in the capacities as indicated: |
Date | ||
August 28, 2018 | /s/ DONALD D. CHARRON | |
Donald D. Charron | ||
As Attorney-In-Fact | ||
77
KIMBALL ELECTRONICS, INC.
Schedule II. - Valuation and Qualifying Accounts
Description | Balance at Beginning of Year | Additions (Reductions) to Expense | Adjustments to Other Accounts | Write-offs and Recoveries | Balance at End of Year | |||||||||||||||||||
(Amounts in Thousands) | ||||||||||||||||||||||||
Year Ended June 30, 2018 | ||||||||||||||||||||||||
Valuation Allowances: | ||||||||||||||||||||||||
Short-Term Receivables | $ | 284 | $ | 259 | $ | (51 | ) | $ | (10 | ) | $ | 482 | ||||||||||||
Deferred Tax Asset | $ | — | $ | 638 | $ | — | $ | — | $ | 638 | ||||||||||||||
Year Ended June 30, 2017 | ||||||||||||||||||||||||
Valuation Allowances: | ||||||||||||||||||||||||
Short-Term Receivables | $ | 192 | $ | 129 | $ | (37 | ) | $ | — | $ | 284 | |||||||||||||
Year Ended June 30, 2016 | ||||||||||||||||||||||||
Valuation Allowances: | ||||||||||||||||||||||||
Short-Term Receivables | $ | 236 | $ | 67 | $ | (96 | ) | $ | (15 | ) | $ | 192 | ||||||||||||
78