Attached files
| file | filename |
|---|---|
| 8-K - FORM 8-K - PREMIER FINANCIAL CORP | tv499617_8k.htm |
Exhibit 99
KBW Community Bank Investor Conference July 2018 Donald P. Hileman President & CEO Kevin T. Thompson Executive Vice President & CFO

Forward Looking Statements The issuer has filed a registration statement including a prospectus, and will file a related supplement with the Securities and Exchange Commission (“SEC”), for the offering to which this communication relates . Before you invest, you should read the prospectus, the prospectus supplement and any other documents the issuer has filed or will file with the SEC for more complete information about the issuer and this offering . This presentation may contain certain forward - looking statements within the meaning of Section 27 A of the Securities Act of 1933 , as amended, and Section 21 B of the Securities Exchange Act of 1934 , as amended, which are intended to be safe harbors created thereby . Those statements may include, but are not limited to, all statements regarding intent, beliefs, expectations, projections, forecasts and plans of First Defiance Financial Corp . and its management, and specifically include statements regarding : changes in economic conditions, the nature, extent and timing of governmental actions and reforms, future movements of interest rates, the production levels of mortgage loan generation, the ability to grow loans and deposits, the ability to benefit from a changing interest rate environment, the ability to sustain credit quality ratios at current or improved levels, the ability to sell OREO properties, the continued strength of First Federal Bank of the Midwest in its market area, and the ability of First Defiance to grow in existing and adjacent markets . These forward - looking statements involve numerous risks and uncertainties, including those inherent in general and local banking, insurance and mortgage conditions, competitive factors specific to markets in which First Defiance and its subsidiaries operate, future interest rate levels, legislative and regulatory decisions or capital market conditions and other risks and uncertainties detailed from time to time in the First Defiance’s SEC filings, including First Defiance’s Annual Report on Form 10 - K for the year ended December 31 , 2017 . One or more of these factors have affected or could in the future affect First Defiance’s business and financial results and could cause actual results to differ materially from plans and projections . Therefore, there can be no assurances that the forward - looking statements included in this investor presentation will prove to be accurate . In light of significant uncertainties in the forward - looking statements included herein, the inclusion of such information should not be regarded as a representation by First Defiance or any other persons, that the objectives and plans of First Defiance will be achieved . All forward - looking statement made in this investor presentation are based on information presently available to the management of First Defiance . First Defiance assumes no obligation to update any forward - looking statements . 2
Company Overview 3

Company Profile Unwavering focus for over 90 years: Community Financial Services • Consolidated Assets of $3.0 billion (6/30/18) • 43 branches in 3 states; 2 LPOs; 52 ATM locations • Enhanced Columbus, OH LPO to a full - service branch in 2017 • New branch in Sylvania, OH, in 2017 • Opened Ann Arbor, MI, LPO in 2017 • Trust & Wealth Management services - AUM $386 million • Acquired Commercial Savings Bank (2/24/17 ) - $342 million • 9 locations throughout the bank’s footprint • Built from agencies acquired – 1998 - 2017 • $13.2 million in commissions – LTM • Specializes in property & casualty and group health & life insurance • Acquired Corporate One Benefits Agency , Inc. (4/1/17) 4

Investment Highlights • Market leader in northwest Ohio deeply rooted in the communities we have served since the 1920s • Growing presence in metro markets • Experienced, disciplined management team • Strong and diversified loan mix and stable deposit base • Historically stable and strong net interest margin • Strong tangible capital levels 5

Executive Leadership Management Position Age Years with Company Years in Financial Services Donald P. Hileman President & CEO 65 10 43 Kevin T. Thompson Executive Vice President, CFO 64 4 40 John R. Reisner EVP, Chief Risk Officer, Legal Counsel 62 4 37 Sharon L. Davis EVP, Director of Human Resources 36 2 13 Gregory R. Allen EVP, Fort Wayne Market Area Executive 54 19 30 Joel Jerger EVP, Toledo Market Area Executive 40 <1 18 David D. Dygert EVP, Columbus Market Area Executive 53 4 27 Amy L. Hackenberg EVP, Southern Market Area Executive 47 2 21 James R. Williams III EVP, Northern Market Area Executive 50 20 27 Marybeth Shunck EVP, Director of Sales 48 12 29 Dennis E. Rose, Jr. EVP, Director of Strategy Management 49 21 27 Paul D. Nungester EVP, Director of Accounting & Finance 44 <1 17 Timothy K. Harris EVP, Chief Credit Officer 59 17 38 Michael D. Mulford EVP, Chief Credit Administration Officer 53 13 30 Michael R. Klein President & COO, First Insurance Group 65 5 43 6
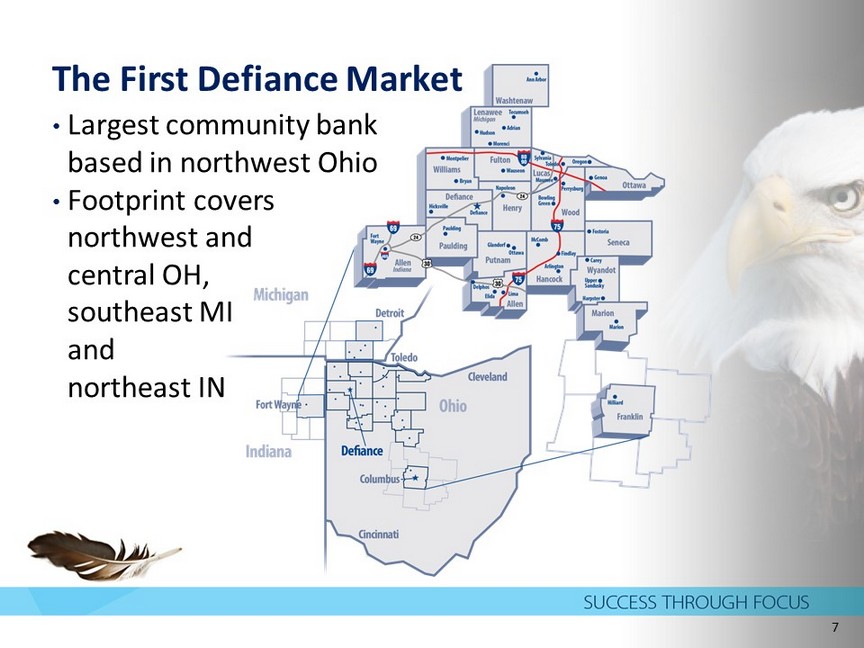
The First Defiance Market • Largest community bank based in northwest Ohio • Footprint covers northwest and c entral OH, southeast MI and northeast IN 7

Our Footprint – Local Economy 8 • Fort to Port Growth Corridor • Logistics and Transportation • Regional distribution centers • Food processing and production • Metro Markets • Toledo, OH – reinventing itself with growth in technology and research businesses; has become a national leader in solar technology and manufacturing. • Fort Wayne, IN – diversifying beyond manufacturing with strength in healthcare, professional services, travel and leisure; is a center for the defense industry. • Columbus, OH - strong and diverse economy based on education, insurance, banking, fashion, defense, aviation, food, logistics, steel, energy, medical research, health care, hospitality, retail, technology.

Strategic Focus • Profitability • High performance objectives for revenue growth, expense control and maintaining strong asset quality • Growth • Organic and through acquisitions, targeting newer markets, new relationships, enhanced delivery and deeper relationships in more established markets • Shareholder Value Enhancement • Effective capital management supporting growth, dividend increases and share repurchases 9 Emphasis on the Community Bank Difference

Consistent Profitability Source : Press R eleases 10 3Q17 4Q17 1Q18 2Q18 Diluted Earnings per Share $0.46 $0.46 $0.58 $0.54 Return on Average Assets 1.28% 1.26% 1.60% 1.48% Return on Average Equity 10.24% 10.10% 12.73% 11.69% Net Interest Margin - TE 3.91% 3.88% 3.95% 3.95% Efficiency Ratio 58.70% 59.37% 63.48% 61.24% KBW Honor Roll for 2017 • Based on 8 consecutive years of increases in reported EPS results • Only 16 banks admitted from nearly 370 bank universe
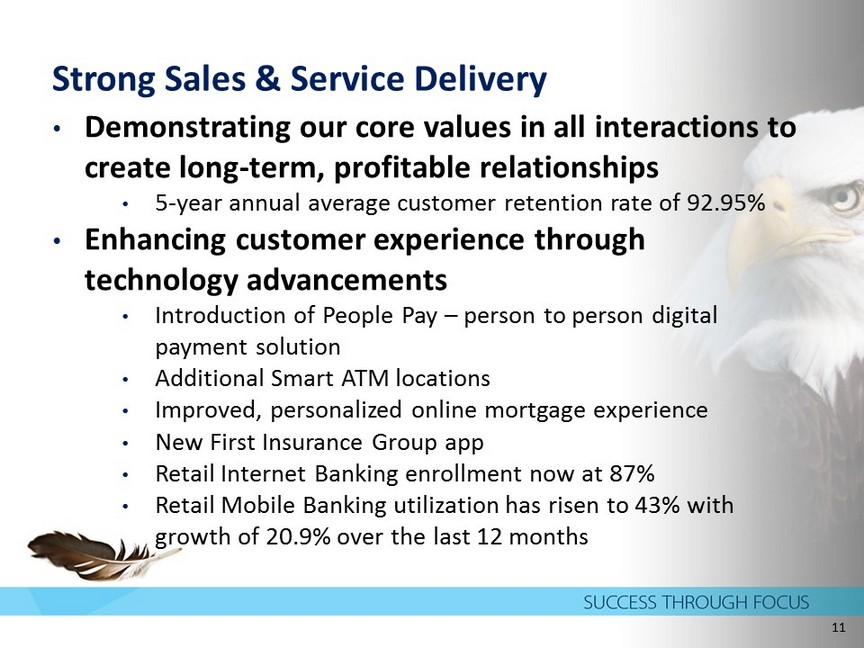
Strong Sales & Service Delivery • Demonstrating our core values in all interactions to create long - term, profitable relationships • 5 - year annual average customer retention rate of 92.95% • Enhancing customer experience through technology advancements • Introduction of People Pay – person to person digital payment solution • Additional Smart ATM locations • Improved, personalized online mortgage experience • New First Insurance Group app • Retail Internet Banking enrollment now at 87% • Retail Mobile Banking utilization has risen to 43% with growth of 20.9% over the last 12 months 11

Strong Sales & Service Delivery • Reaching more customers through digital channel development • Over 50 % of our transactions are now outside of the branch (as of 6/30/18) • Growing our communities through our people • Financial literacy champions • Sponsor EverFi TM reaching nearly 1,026 students in 14 schools for over 3,476 hours of financial education; numerous non - profit partnerships • Pay it Forward - A nnual event since 2014 • Every employee performs random acts of kindness • Fund over $10,000 worth of grants annually • Building Better Communities - First annual event • In celebration of National Homeownership Month • 633 volunteer hours donated; executive level – part - time employees participated • 50 homes assisted with home maintenance projects; • 70 individuals reached through homeownership seminars 12
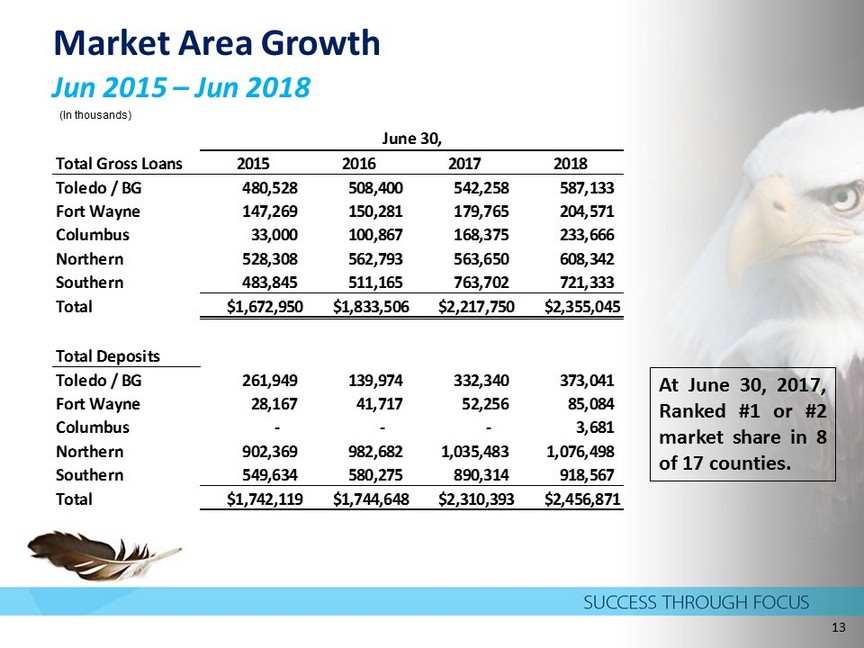
Market Area Growth Jun 2015 – Jun 2018 13 (In thousands) Total Gross Loans 2015 2016 2017 2018 Toledo / BG 480,528 508,400 542,258 587,133 Fort Wayne 147,269 150,281 179,765 204,571 Columbus 33,000 100,867 168,375 233,666 Northern 528,308 562,793 563,650 608,342 Southern 483,845 511,165 763,702 721,333 Total $1,672,950 $1,833,506 $2,217,750 $2,355,045 Total Deposits Toledo / BG 261,949 139,974 332,340 373,041 Fort Wayne 28,167 41,717 52,256 85,084 Columbus - - - 3,681 Northern 902,369 982,682 1,035,483 1,076,498 Southern 549,634 580,275 890,314 918,567 Total $1,742,119 $1,744,648 $2,310,393 $2,456,871 June 30, At June 30 , 2017 , Ranked # 1 or # 2 market share in 8 of 17 counties .

Emerging Growth Profile Source: Press releases As of June 30, $ in thousands 2018 2017 % Total Assets 3,039,589 2,890,507 5.2% Net Loans 2,358,023 2,228,520 5.8% Deposits 2,489,128 2,326,702 7.0 % 14 Second Quarter Results

Strong Shareholder Returns First Defiance Financial Corp. – Total Return (%) Source: SNL data as of 07/23/18 – Five year 15 Total Return 5 Year 176.61% 3 Year 96.94% YTD 29.30%

16 Financial Highlights
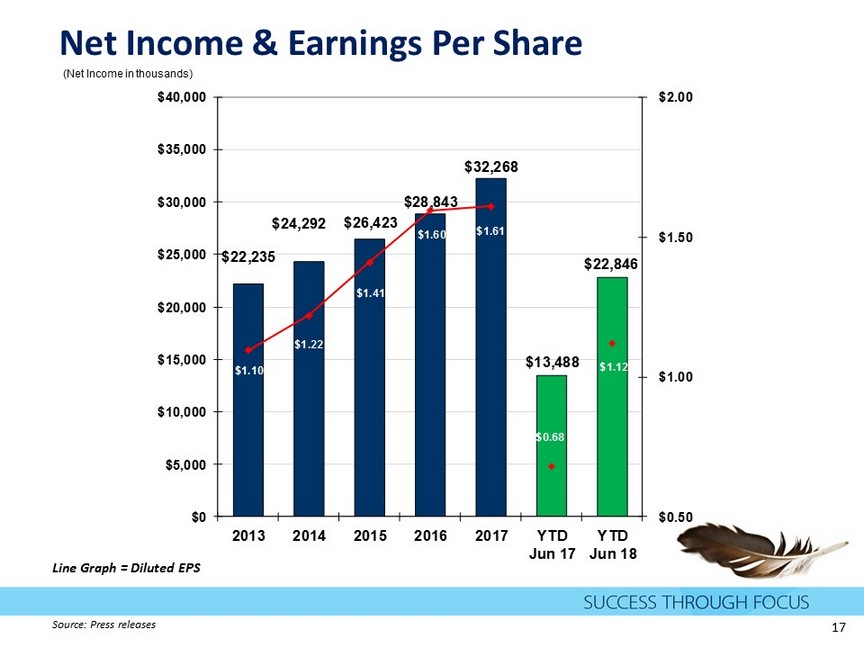
Net Income & Earnings Per Share (Net Income in thousands) $22,235 $24,292 $26,423 $28,843 $32,268 $13,488 $22,846 $1.10 $1.22 $1.41 $1.60 $1.61 $0.68 $1.12 $0.50 $1.00 $1.50 $2.00 $0 $5,000 $10,000 $15,000 $20,000 $25,000 $30,000 $35,000 $40,000 2013 2014 2015 2016 2017 YTD Jun 17 YTD Jun 18 Line Graph = Diluted EPS Source : Press r eleases 17

Total Assets & Return on Assets (In millions) $2,137 $2,179 $2,298 $2,477 $2,993 $3,040 1.08% 1.12% 1.19% 1.20% 1.13% 1.54% 0.00% 0.25% 0.50% 0.75% 1.00% 1.25% 1.50% 1.75% $0 $500 $1,000 $1,500 $2,000 $2,500 $3,000 $3,500 2013 2014 2015 2016 2017 YTD Jun 18 Source : Press r eleases 18 Line Graph = ROA

Loan Portfolio Composition Commercial and Industrial 20% Non-Residential Real Estate Loans 41% Multi-Family Residential Real Estate Loans 10% Consumer 1% Construction Loans 11% 1-4 Family Residential Real Estate Loans 12% Home Equity and Improvement 5% Total = $2.524 billion 2Q18 Average Yield on Loans 4.75% Source : 10 - Q Data as of 06/30/18 (includes Agricultural Loans 11%) 19

Non - performing Assets & NPAs/Assets (In thousands) $33,706 $30,311 $17,582 $14,803 $32,247 $20,135 1.58% 1.39% 0.77% 0.60% 1.08% 0.66% 0.00% 0.50% 1.00% 1.50% 2.00% 2.50% 3.00% 3.50% $0 $10,000 $20,000 $30,000 $40,000 $50,000 $60,000 2013 2014 2015 2016 2017 2Q2018 Source : Press releases Line Graph = NPA/Total Assets 20

Net Charge - Offs/Average Loans (annualized) ALLL/Total Loans 0.23% 0.08% - 0.03% - 0.01% 0.10% - 0.06% 1.58% 1.50% 1.41% 1.33% 1.14% 1.15% 0.00% 0.50% 1.00% 1.50% 2.00% -0.50% 0.00% 0.50% 1.00% 1.50% 2.00% 2013 2014 2015 2016 2017 YTD Jun 18 Source : Press r eleases Line Graph = ALLL/Total Loans 21
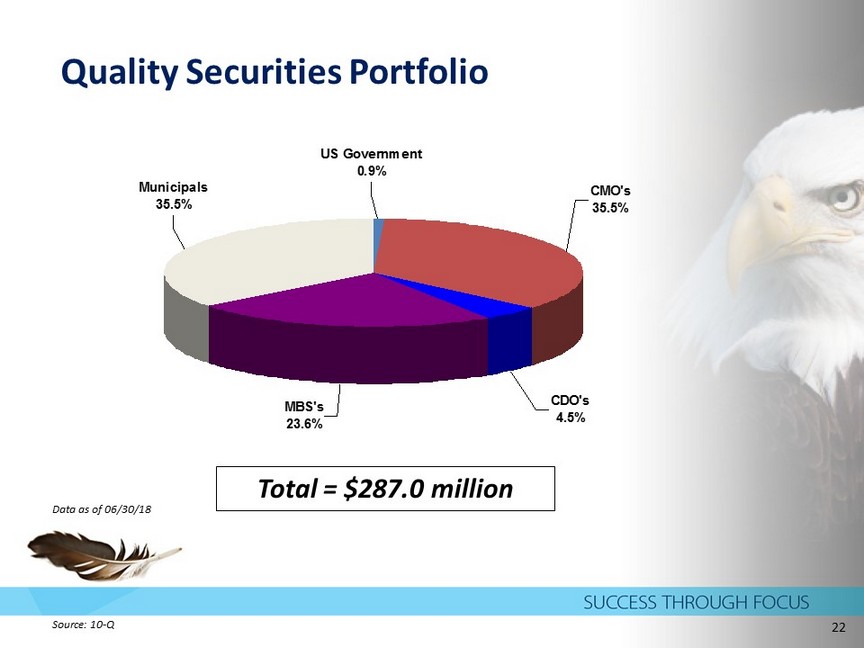
Quality Securities Portfolio US Government 0.9% CMO's 35.5% CDO's 4.5% MBS's 23.6% Municipals 35.5% Total = $287.0 million Source : 10 - Q Data as of 06/30/18 22
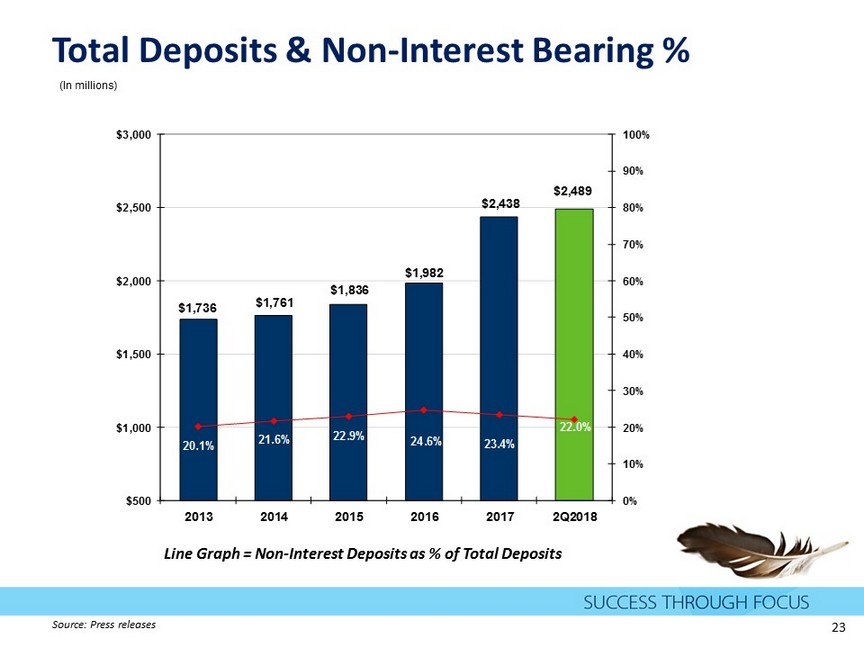
Total Deposits & Non - Interest Bearing % (In millions) $1,736 $1,761 $1,836 $1,982 $2,438 $2,489 21.6% 22.0% 20.1% 22.9% 24.6% 23.4% 0% 10% 20% 30% 40% 50% 60% 70% 80% 90% 100% $500 $1,000 $1,500 $2,000 $2,500 $3,000 2013 2014 2015 2016 2017 2Q2018 Source : Press releases Line Graph = Non - Interest Deposits as % of Total Deposits 23

Deposit Base Composition Non - Interest Bearing Checking Accounts 22% Interest Bearing Checking & Money Market Accounts 41% Savings Accounts 12% CDs under $250,000 22% CDs over $250,000 3% Total Deposits= $2.489 billion 2Q18 Average Cost of Interest - Bearing Deposits: 0.65% Source : Press release Data as of 06/30/18 24
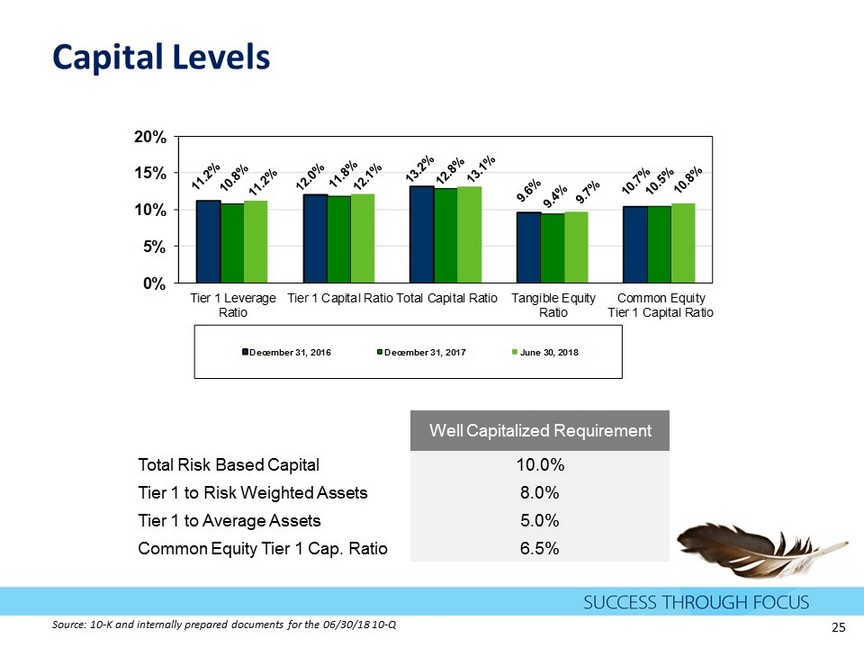
Capital Levels 0% 5% 10% 15% 20% Tier 1 Leverage Ratio Tier 1 Capital Ratio Total Capital Ratio Tangible Equity Ratio Common Equity Tier 1 Capital Ratio December 31, 2016 December 31, 2017 June 30, 2018 Well Capitalized Requirement Total Risk Based Capital 10.0% Tier 1 to Risk Weighted Assets 8.0% Tier 1 to Average Assets 5.0% Common Equity Tier 1 Cap. Ratio 6.5% Source : 10 - K and internally prepared documents for the 06/30/18 10 - Q 25

Net Interest Income & Margin (In thousands) $69,243 $71,487 $75,960 $80,773 $98,585 $47,233 $52,723 3.76% 3.68% 3.81% 3.74% 3.88% 3.86% 3.95% 2.50% 3.00% 3.50% 4.00% 4.50% $0 $10,000 $20,000 $30,000 $40,000 $50,000 $60,000 $70,000 $80,000 $90,000 $100,000 $110,000 2013 2014 2015 2016 2017 YTD Jun 17 YTD Jun 18 Bar Graph = Tax - Equivalent Net Interest Income; Line Graph = Net Interest Margin Source : Press releases 26

Non - Interest Income & Percent of Total Revenue (In thousands) $31,018 $30,709 $31,781 $33,521 $37,569 $18,922 $20,917 31.4% 30.6% 30.0% 29.8% 28.0% 30.0% 28.3% 0.0% 10.0% 20.0% 30.0% 40.0% 50.0% 60.0% 70.0% 80.0% 90.0% 100.0% $0 $5,000 $10,000 $15,000 $20,000 $25,000 $30,000 $35,000 $40,000 $45,000 2013 2014 2015 2016 2017 YTD Jun 17 YTD Jne 18 Non - Interest Income excluding securities gains/losses and impairment on securities/BOLI enhancement gain/trust fee accrual Line Graph = Non - Interest Income as a % of Revenue Source : Press releases 27

Non - Interest Expense & Efficiency Ratio (In thousands) $65,052 $66,758 $67,889 $71,093 $85,351 $43,772 $45,916 64.8% 65.3% 63.0% 62.2% 61.8% 64.7% 62.4% 10% 20% 30% 40% 50% 60% 70% 80% 90% $0 $10,000 $20,000 $30,000 $40,000 $50,000 $60,000 $70,000 $80,000 $90,000 2013 2014 2015 2016 2017 YTD Jun 17 YTD Jun 18 Line Graph = Efficiency Ratio Source : Press releases 28
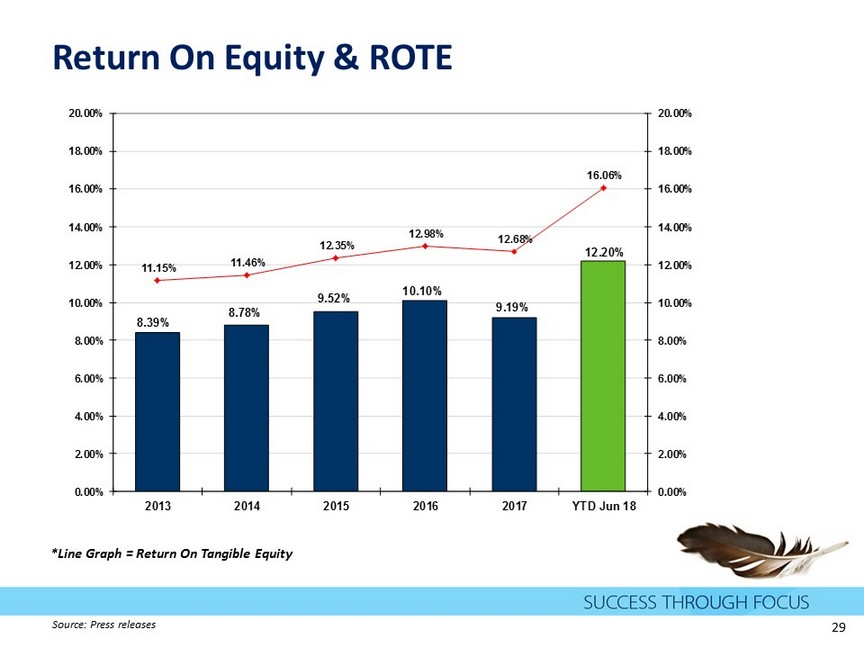
Return On Equity & ROTE 8.39% 8.78% 9.52% 10.10% 9.19% 12.20% 11.15% 11.46% 12.35% 12.98% 12.68% 16.06% 0.00% 2.00% 4.00% 6.00% 8.00% 10.00% 12.00% 14.00% 16.00% 18.00% 20.00% 0.00% 2.00% 4.00% 6.00% 8.00% 10.00% 12.00% 14.00% 16.00% 18.00% 20.00% 2013 2014 2015 2016 2017 YTD Jun 18 * Line Graph = Return On Tangible Equity Source : Press releases 29

30 Shareholder Value

Maximizing Shareholder Value EPS, Dividends and Stock Price Source: Press releases 31
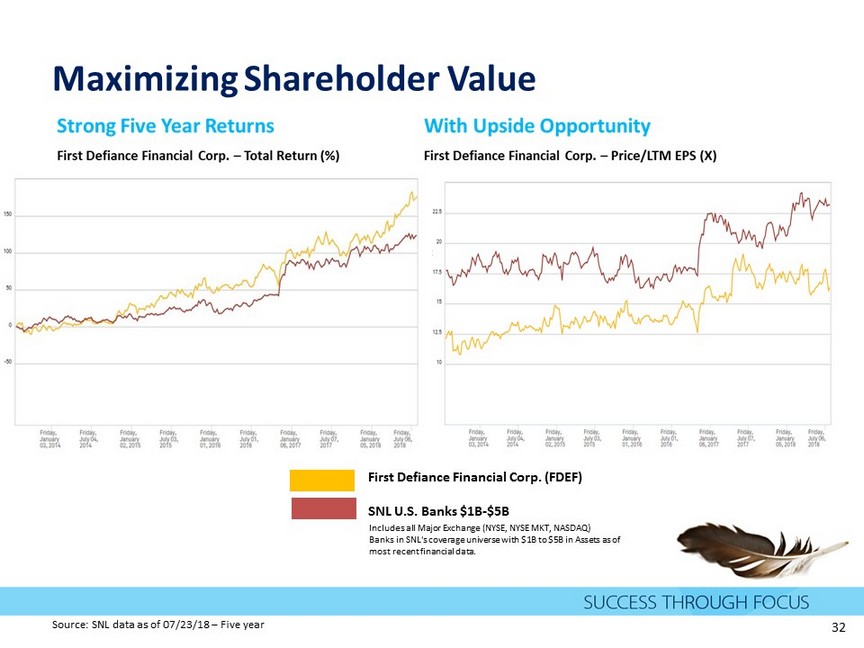
Maximizing Shareholder Value First Defiance Financial Corp. (FDEF) SNL U.S. Banks $1B - $5B Includes all Major Exchange (NYSE, NYSE MKT, NASDAQ) Banks in SNL's coverage universe with $1B to $5B in Assets as of most recent financial data. Source: SNL data as of 07/23/18 – Five year 32

Maximizing Shareholder Value Investment Opportunity Source: SNL data as of 07/13/18 33 SNL Index FDEF $1B - $5B Price / Earnings 14.2x 18.3x Price / Book 175.2% 182.6% Price / Tangible Book 241.4% 213.6% Dividend Yield 1.8% 1.5%

• Disciplined management team with proven track record • Reputation of focusing on fundamentals • Strong capital levels • Balance sheet strength – attractive core deposit base • Balanced loan portfolio with a disciplined approach to lending • Well - positioned to grow our balance sheet and geographic footprint, enhancing long - term shareholder value Summary 34
Thank you. Donald P. Hileman | President & CEO 419 - 785 - 2210 | dhileman@first - fed.com Kevin T. Thompson | EVP & CFO 419 - 783 - 1098 | kthompson@first - fed.com 35