Attached files
| file | filename |
|---|---|
| EX-99.1 - EX-99.1 - Cotiviti Holdings, Inc. | ex-99d1.htm |
| 8-K - 8-K - Cotiviti Holdings, Inc. | f8-k.htm |
Exhibit 99.2
|
|
Analytics. Insight. Value. 2018 Second Quarter Financial Supplement As of June 30, 2018 1 |
|
|
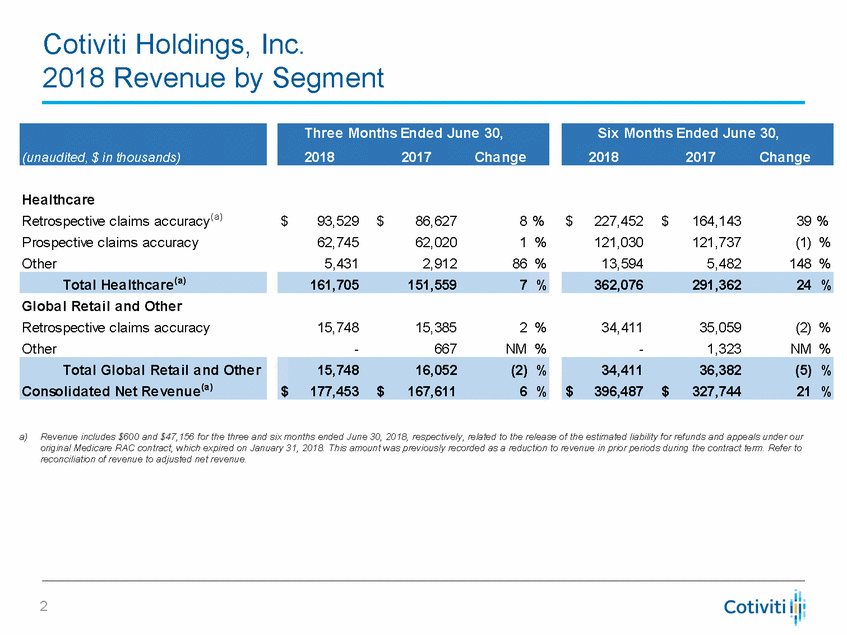
Cotiviti Holdings, Inc. 2018 Revenue by Segment Healthcare Retrospective claims accuracy(a) Prospective claims accuracy Other $ 93,529 62,745 5,431 $ 86,627 62,020 2,912 8 % $ 227,452 121,030 13,594 $ 164,143 121,737 5,482 39 % 1 86 % % (1) 148 % % Global Retail and Other Retrospective claims accuracy Other 15,748 - 15,385 667 2 NM % % 34,411 - 35,059 1,323 (2) NM % % a)Revenue includes $600 and $47,156 for the three and six months ended June 30, 2018, respectively, related to the release of the estimated liability for refunds and appeals under our original Medicare RAC contract, which expired on January 31, 2018. This amount was previously recorded as a reduction to revenue in prior periods during the contract term. Refer to reconciliation of revenue to adjusted net revenue. 2 Total Global Retail and Other Consolidated Net Revenue(a) $ 15,748 16,052 (2) 177,453 $ 167,611 6 % % 34,411 36,382 (5) % $ 396,487 $ 327,744 21 % 362,076 291,362 24 % 161,705 151,559 7 % Total Healthcare(a) Six Months Ended June 30, 2018 2017 Change Three Months Ended June 30, 2018 2017 Change (unaudited, $ in thousands) |
|
|
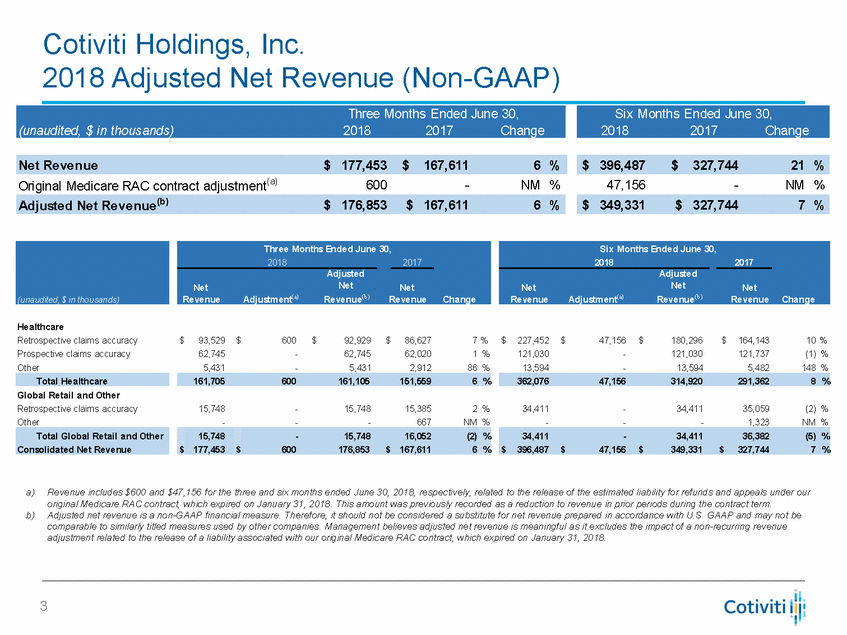
Cotiviti Holdings, Inc. 2018 Adjusted Net Revenue (Non-GAAP) Original Medicare RAC contract adjustment(a) 600 - NM % 47,156 - NM % Healthcare Retrospective claims accuracy Prospective claims accuracy Other $ 93,529 62,745 5,431 $ 600 - - $ 92,929 62,745 5,431 $ 86,627 62,020 2,912 7 % 1 % 86 % $ 227,452 121,030 13,594 $ 47,156 - - $ 180,296 121,030 13,594 $ 164,143 121,737 5,482 10 % (1) % 148 % Global Retail and Other Retrospective claims accuracy Other 15,748 - - - 15,748 - 15,385 667 2 % NM % 34,411 - - - 34,411 - 35,059 1,323 (2) % NM % a) Revenue includes $600 and $47,156 for the three and six months ended June 30, 2018, respectively, related to the release of the estimated liability for refunds and appeals under our original Medicare RAC contract, which expired on January 31, 2018. This amount was previously recorded as a reduction to revenue in prior periods during the contract term. Adjusted net revenue is a non-GAAP financial measure. Therefore, it should not be considered a substitute for net revenue prepared in accordance with U.S. GAAP and may not be comparable to similarly titled measures used by other companies. Management believes adjusted net revenue is meaningful as it excludes the impact of a non-recurring revenue adjustment related to the release of a liability associated with our original Medicare RAC contract, which expired on January 31, 2018. b) 3 Total Global Retail and Other Consolidated Net Revenue $ 15,748 177,453 $ -15,74816,052(2) 600176,853$ 167,6116 % % 34,411-34,41136,382(5) % $ 396,487 $47,156$349,331$327,7447 % 362,07647,156314,920291,3628 % 161,705600161,105151,5596 % Total Healthcare Six Months Ended June 30, 20182017 Adjusted NetNetNet RevenueAdjustment(a) Revenue(b) RevenueChange Three Months Ended June 30, 20182017 Adjusted NetNetNet RevenueAdjustment(a) Revenue(b) RevenueChange (unaudited, $ in thousands) Adjusted Net Revenue(b)$ 176,853$ 167,6116 % $ 349,331$ 327,7447 % $ 396,487$327,74421 % Net Revenue$ 177,453$167,6116 % Six Months Ended June 30, 20182017Change Three Months Ended June 30, (unaudited, $ in thousands)20182017Change |
|
|
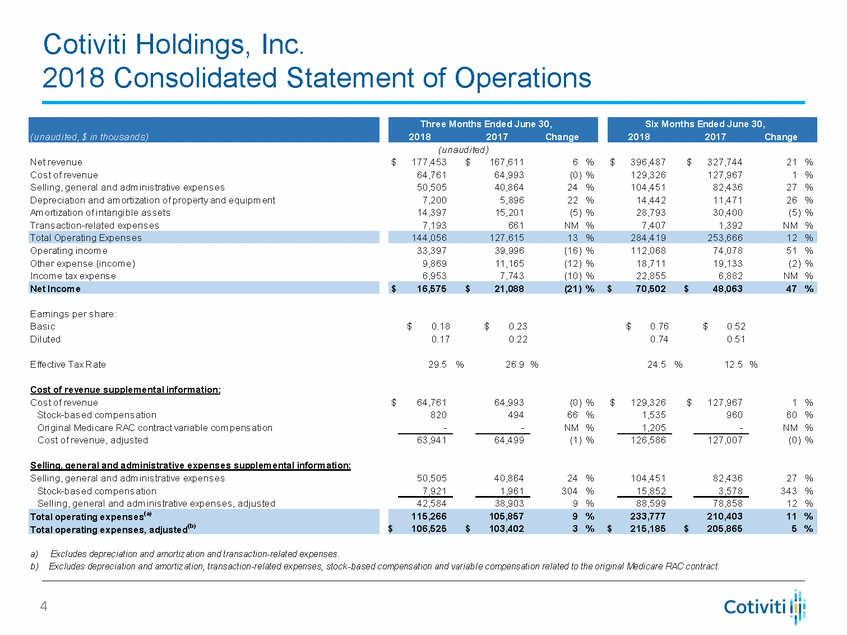
Cotiviti Holdings, Inc. 2018 Consolidated Statement of Operations (unaudited) Net revenue Cos t of revenue Selling, general and adm inis trative expens es Depreciation and am ortization of property and equipm ent Am ortization of intangible as s ets Trans action-related expens es $ 177,453 64,761 50,505 7,200 14,397 7,193 $ 167,611 64,993 40,864 5,896 15,201 661 6 % (0) % 24 % 22 % (5) % NM % $ 396,487 129,326 104,451 14,442 28,793 7,407 $ 327,744 127,967 82,436 11,471 30,400 1,392 21 1 27 26 % % % % (5) % NM % Operating incom e Other expens e (incom e) Incom e tax expens e 33,397 9,869 6,953 39,996 11,165 7,743 (16) % (12) % (10) % 112,068 18,711 22,855 74,078 19,133 6,882 51 % (2) % NM % Earnings per s hare: Bas ic Diluted $ 0.18 0.17 $ 0.23 0.22 $ 0.76 0.74 $ 0.52 0.51 Effective Tax Rate 29.5 % 26.9 % 24.5 % 12.5 % Cost of revenue supplemental information: Cos t of revenue Stock-bas ed com pens ation Original Medicare RAC contract variable com pens ation Cos t of revenue, adjus ted $ 64,761 820 - 64,993 494 - (0) % 66 % NM % (1) % $ 129,326 1,535 1,205 $ 127,967 960 - 1 60 NM % % % 63,941 64,499 126,586 127,007 (0) % Selling, general and administrative expenses supplemental information: Selling, general and adm inis trative expens es Stock-bas ed com pens ation Selling, general and adm inis trative expens es , adjus ted 50,505 7,921 40,864 1,961 24 304 9 % % % 104,451 15,852 82,436 3,578 27 343 12 % % % 42,584 38,903 88,599 78,858 a) Excludes depreciation and amortization and transaction-related expenses. b ) Excludes depreciation and amortization, transaction-related expenses, stock-b ased compensation and variab le compensation related to the original Medicare RAC contract. 4 115,266105,8579 %233,777210,40311 % $106,525$103,4023 %$215,185$205,8655 % Total operating expenses(a) Total operating expenses, adjusted(b) $16,575$21,088(21) %$70,502$48,06347 % Net Income 144,056127,61513 %284,419253,66612 % Total Operating Expens es Six Months Ended June 30, 20182017Change Three Months Ended June 30, 20182017Change (unaudited, $ in thousands) |
|
|
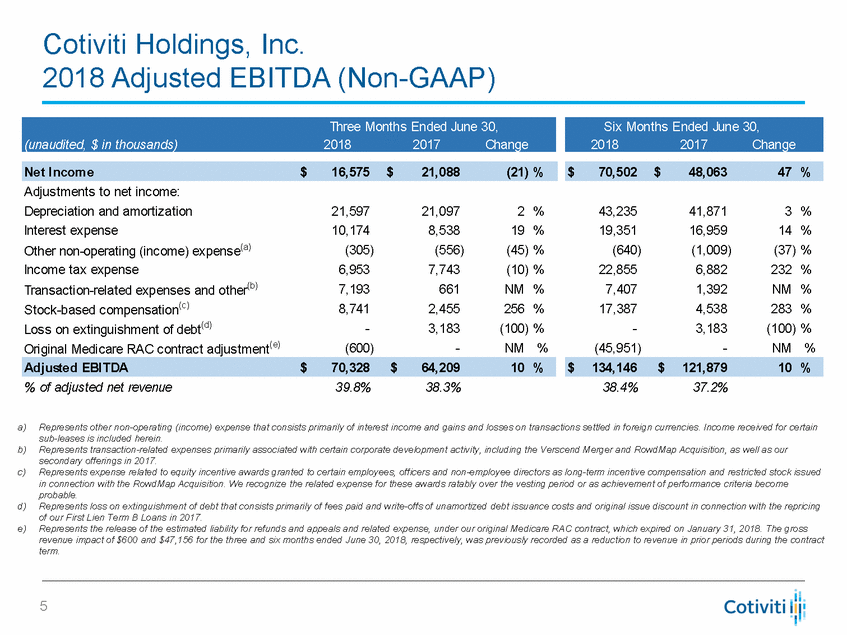
Cotiviti Holdings, Inc. 2018 Adjusted EBITDA (Non-GAAP) Adjustments to net income: Depreciation and amortization Interest expense Other non-operating (income) expense(a) Income tax expense Transaction-related expenses and other(b) Stock-based compensation(c) Loss on extinguishment of debt(d) Original Medicare RAC contract adjustment(e) 21,597 10,174 (305) 6,953 7,193 8,741 - (600) 21,097 8,538 (556) 7,743 661 2,455 3,183 - 2 % 19 % (45) % (10) % NM % 256 % (100) % NM % 43,235 19,351 (640) 22,855 7,407 17,387 - (45,951) 41,871 16,959 (1,009) 6,882 1,392 4,538 3,183 - 3 % 14 % (37) % 232 NM 283 % % % (100) % NM % % of adjusted net revenue 39.8% 38.3% 38.4% 37.2% a) Represents other non-operating (income) expense that consists primarily of interest income and gains and losses on transactions settled in foreign currencies. Income received for certain sub-leases is included herein. Represents transaction-related expenses primarily associated with certain corporate development activity, including the Verscend Merger and RowdMap Acquisition, as well as our secondary offerings in 2017. Represents expense related to equity incentive awards granted to certain employees, officers and non-employee directors as long-term incentive compensation and restricted stock issued in connection with the RowdMap Acquisition. We recognize the related expense for these awards ratably over the vesting period or as achievement of performance criteria become probable. Represents loss on extinguishment of debt that consists primarily of fees paid and write-offs of unamortized debt issuance costs and original issue discount in connection with the repricing of our First Lien Term B Loans in 2017. Represents the release of the estimated liability for refunds and appeals and related expense, under our original Medicare RAC contract, which expired on January 31, 2018. The gross revenue impact of $600 and $47,156 for the three and six months ended June 30, 2018, respectively, was previously recorded as a reduction to revenue in prior periods during the contract term. b) c) d) e) 5 $ 134,146 $ 121,879 10 % Adjusted EBITDA $ 70,328 $ 64,209 10 % $ 70,502 $ 48,063 47 % Net Income $ 16,575 $ 21,088 (21) % Six Months Ended June 30, 2018 2017 Change Three Months Ended June 30, (unaudited, $ in thousands) 2018 2017 Change |
|
|
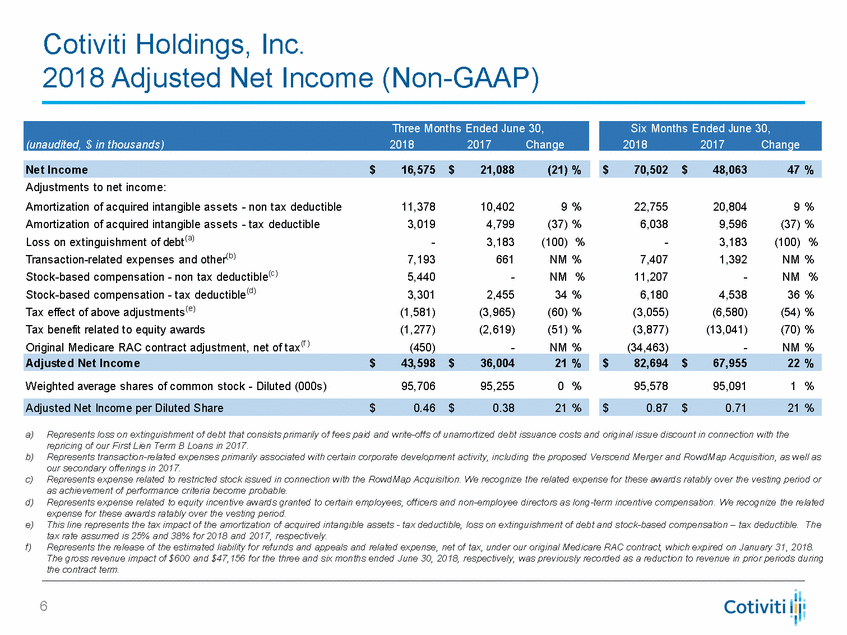
Cotiviti Holdings, Inc. 2018 Adjusted Net Income (Non-GAAP) Adjustments to net income: Amortization of acquired intangible assets - non tax deductible Amortization of acquired intangible assets - tax deductible Loss on extinguishment of debt(a) Transaction-related expenses and other(b) Stock-based compensation - non tax deductible(c) Stock-based compensation - tax deductible(d) Tax effect of above adjustments(e) Tax benefit related to equity awards Original Medicare RAC contract adjustment, net of tax(f ) 11,378 3,019 - 7,193 5,440 3,301 (1,581) (1,277) (450) 10,402 4,799 3,183 661 - 2,455 (3,965) (2,619) - 9 % (37) % (100) % NM % NM % 34 % (60) % (51) % NM % 22,755 6,038 - 7,407 11,207 6,180 (3,055) (3,877) (34,463) 20,804 9,596 3,183 1,392 - 4,538 (6,580) (13,041) - 9 % (37) % (100) % NM % NM % 36 % (54) % (70) % NM % Weighted average shares of common stock - Diluted (000s) 95,706 95,255 0 % 95,578 95,091 1 % a) Represents loss on extinguishment of debt that consists primarily of fees paid and write-offs of unamortized debt issuance costs and original issue discount in connection with the repricing of our First Lien Term B Loans in 2017. Represents transaction-related expenses primarily associated with certain corporate development activity, including the proposed Verscend Merger and RowdMap Acquisition, as well as our secondary offerings in 2017. Represents expense related to restricted stock issued in connection with the RowdMap Acquisition. We recognize the related expense for these awards ratably over the vesting period or as achievement of performance criteria become probable. Represents expense related to equity incentive awards granted to certain employees, officers and non-employee directors as long-term incentive compensation. We recognize the related expense for these awards ratably over the vesting period. This line represents the tax impact of the amortization of acquired intangible assets - tax deductible, loss on extinguishment of debt and stock-based compensation – tax deductible. The tax rate assumed is 25% and 38% for 2018 and 2017, respectively. Represents the release of the estimated liability for refunds and appeals and related expense, net of tax, under our original Medicare RAC contract, which expired on January 31, 2018. The gross revenue impact of $600 and $47,156 for the three and six months ended June 30, 2018, respectively, was previously recorded as a reduction to revenue in prior periods during the contract term. b) c) d) e) f) 6 Adjusted Net Income per Diluted Share $ 0.46 $ 0.38 21 % $ 0.87 $ 0.71 21 % $ 82,694 $ 67,955 22 % Adjusted Net Income $ 43,598 $ 36,004 21 % $ 70,502 $ 48,063 47 % Net Income $ 16,575 $ 21,088 (21) % Six Months Ended June 30, 2018 2017 Change Three Months Ended June 30, (unaudited, $ in thousands) 2018 2017 Change |
|
|
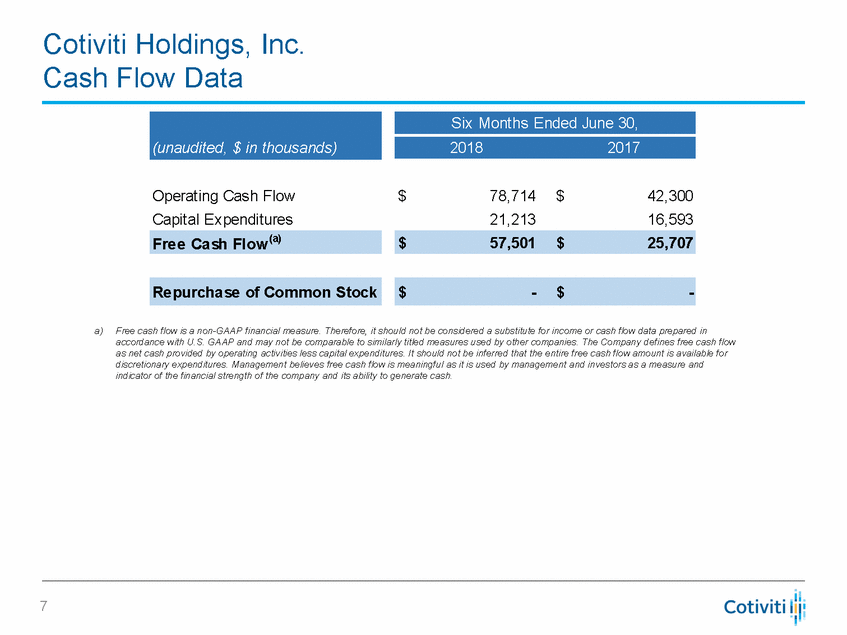
Cotiviti Holdings, Inc. Cash Flow Data Operating Cash Flow Capital Expenditures $ 78,714 21,213 $ 42,300 16,593 a) Free cash flow is a non-GAAP financial measure. Therefore, it should not be considered a substitute for income or cash flow data prepared in accordance with U.S. GAAP and may not be comparable to similarly titled measures used by other companies. The Company defines free cash flow as net cash provided by operating activities less capital expenditures. It should not be inferred that the entire free cash flow amount is available for discretionary expenditures. Management believes free cash flow is meaningful as it is used by management and investors as a measure and indicator of the financial strength of the company and its ability to generate cash. 7 Repurchase of Common Stock $-$-$57,501$25,707 Free Cash Flow(a) Six Months Ended June 30, 20182017 (unaudited, $ in thousands) |
|
|
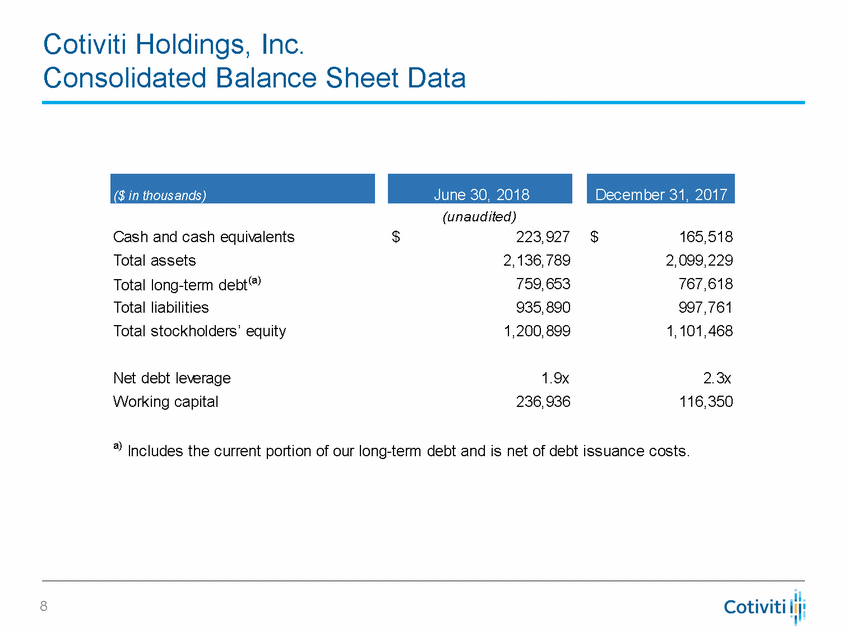
Cotiviti Holdings, Inc. Consolidated Balance Sheet Data (unaudited) 223,927 2,136,789 759,653 935,890 1,200,899 Cash and cash equivalents Total assets Total long-term debt(a) Total liabilities Total stockholders’ equity $ $ 165,518 2,099,229 767,618 997,761 1,101,468 Net debt leverage Working capital 1.9x 236,936 2.3x 116,350 a) Includes the current portion of our long-term debt and is net of debt issuance costs. 8 December 31, 2017 June 30, 2018 ($ in thousands) |
|
|
0 Analytics. Insight. Value. 9 |

