Attached files
| file | filename |
|---|---|
| EX-32.2 - EX-32.2 - Cotiviti Holdings, Inc. | cotv-20161231ex322f25b4c.htm |
| EX-32.1 - EX-32.1 - Cotiviti Holdings, Inc. | cotv-20161231ex321e58905.htm |
| EX-31.2 - EX-31.2 - Cotiviti Holdings, Inc. | cotv-20161231ex31210ec6c.htm |
| EX-31.1 - EX-31.1 - Cotiviti Holdings, Inc. | cotv-20161231ex31115647f.htm |
| EX-23.1 - EX-23.1 - Cotiviti Holdings, Inc. | cotv-20161231ex231390c9b.htm |
| EX-21.1 - EX-21.1 - Cotiviti Holdings, Inc. | cotv-20161231ex21105345f.htm |
UNITED STATES
SECURITIES AND EXCHANGE COMMISSION
WASHINGTON, DC 20549
Form 10-K
(Mark One)
|
☑ |
ANNUAL REPORT PURSUANT TO SECTION 13 OR 15(d) OF THE SECURITIES EXCHANGE ACT OF 1934 |
For the fiscal year ended December 31, 2016
|
☐ |
TRANSITION REPORT PURSUANT TO SECTION 13 OR 15(d) OF THE SECURITIES EXCHANGE ACT OF 1934 |
For the transition period from to
Commission file number: 001-37787
Cotiviti Holdings, Inc.
(Exact name of registrant as specified in its charter)
|
Delaware (State or other jurisdiction of incorporation or organization) |
46-0595918 |
|
115 Perimeter Center Place |
30346 |
|
(Address of principal executive offices) |
(Zip Code) |
(770) 379-2800
(Registrant’s telephone number, including area code)
Securities registered pursuant to Section 12(b) of the Act:
|
Title of each class |
|
Name of each exchange on which registered |
|
Common Stock, $0.001 par value per share |
|
The New York Stock Exchange |
Securities registered pursuant to Section 12(g) of the Act: None
Indicate by check mark if the registrant is a well-known seasoned issuer, as defined in Rule 405 of the Securities Act. Yes ☐ No ☒
Indicate by check mark if the registrant is not required to file reports pursuant to Section 13 or Section 15(d) of the Act. Yes ☐ No ☒
Indicate by check mark whether the registrant (1) has filed all reports required to be filed by Section 13 or 15(d) of the Securities Exchange Act of 1934 during the preceding 12 months (or for such shorter period that the registrant was required to file such reports), and (2) has been subject to such filing requirements for the past 90 days. Yes ☒ No ☐
Indicate by check mark whether the registrant has submitted electronically and posted on its corporate Web site, if any, every Interactive Data File required to be submitted and posted pursuant to Rule 405 of Regulation S-T (§232.405 of this chapter) during the preceding 12 months (or for such shorter period that the registrant was required to submit and post such files). Yes ☒ No ☐
Indicate by check mark if disclosure of delinquent filers in response to Item 405 of Regulation S-K (§229.405 of this chapter) is not contained herein, and will not be contained, to the best of registrant’s knowledge, in definitive proxy or information statements incorporated by reference in Part III of this Form 10-K or any amendment to this Form 10-K ☒
Indicate by check mark whether the registrant is a large accelerated filer, an accelerated filer, a non-accelerated filer, or a smaller reporting company. See the definitions of “large accelerated filer,” “accelerated filer” and “smaller reporting company” in Rule 12b‑2 of the Exchange Act. (Check one):
|
|
Large accelerated filer |
☐ |
Accelerated filer |
☐ |
|
|
Non-accelerated filer |
☒ (Do not check if a smaller reporting company) |
Smaller reporting company |
☐ |
Indicate by check mark whether the registrant is a shell company (as defined in Rule 12b-2 of the Exchange Act). Yes ☐ No ☒
As of June 30, 2016, the last business day of the Registrant’s most recently completed second fiscal quarter, the aggregate market value of the shares of voting and non-voting common stock of the Registrant held by non-affiliates was $343.2 million based on the last sales price of the Registrant’s common stock as reported by the New York Stock Exchange on that day.
The number of issued and outstanding shares of the registrant’s common stock, $0.001 par value, as of January 31, 2017 was 90,870,825.
DOCUMENTS INCORPORATED BY REFERENCE
Portions of the Registrant’s Proxy Statement for the 2017 Annual Meeting of Stockholders are incorporated by reference into Part III, Item 14 of this Form 10-K.
i
Definitions
As used in this Annual Report on Form 10-K for the year ended December 31, 2016 (this “Annual Report on Form 10‑K” or this “Annual Report”), the following abbreviations and terms have the meanings as listed below. Additionally, the terms “Cotiviti,” “we,” “us” and “our” refer to Cotiviti Holdings, Inc. and its consolidated subsidiaries, unless the context clearly indicates otherwise. The term “Cotiviti Holdings” refers only to Cotiviti Holdings, Inc. and not to any of its subsidiaries. Unless and as otherwise stated, any references in this Annual Report to any agreement means such agreement and all schedules, exhibits and attachments in each case as amended, restated, supplemented or otherwise modified to the date of filing this Annual Report.
2012 Plan: refers to the Cotiviti Holdings, Inc. 2012 Equity Incentive Plan.
2016 Plan: refers to the Cotiviti Holdings, Inc. 2016 Equity Incentive Plan.
ABR: refers to Alternate Base Rate as defined under the Restated Credit Agreement (with respect to borrowings under the First Lien Credit Facilities) or the Initial Secured Credit Facilities (with respect to borrowings under the Initial First Lien Credit Facilities and the Initial Second Lien Credit Facility).
Adjusted EBITDA: refers to net income (loss) to Cotiviti before depreciation and amortization, impairment of intangible assets, interest expense, other non-operating (income) expense, income tax expense (benefit), gain on discontinued operations, transaction-related expenses and other, stock-based compensation and loss on extinguishment of debt.
Advent: refers to Advent International Corporation, which controls funds that hold an aggregate of 64.7% of the combined voting power of our outstanding common stock as of December 31, 2016.
Affordable Care Act: refers to the Patient Protection and Affordable Care Act of 2010.
AROs: refers to asset retirement obligations.
ASC: refers to the FASB Accounting Standards Codification.
ASU: refers to Accounting Standards Update issued by the FASB.
Board: refers to the Board of Directors of Cotiviti Holdings, Inc.
Connolly: refers to Connolly Superholdings, Inc.
Connolly iHealth Merger: refers to the May 2014 merger of Connolly and iHealth Technologies.
CMS: refers to the Centers for Medicare and Medicaid Services, the United States federal agency which administers Medicare and Medicaid.
DGCL: refers to the Delaware General Corporation Law.
Equity Plans: refers, collectively, to the 2012 Plan and the 2016 Plan.
EPS: refers to earnings per share.
Exchange Act: refers to the United States Securities Exchange Act of 1934, as amended.
FASB: refers to the Financial Accounting Standards Board.
FCPA: refers to the United States Foreign Corrupt Practices Act of 1977.
ii
First Lien Credit Facilities: refers to the First Lien Term A Loans in the original principal amount of $250.0 million, the First Lien Term B Loans in the original principal amount of $550.0 million and the $100.0 million Revolver under the Restated Credit Agreement.
First Lien Term A Loans: refers to the first lien term A loans in the original principal amount of $250.0 million under our Restated Credit Agreement.
First Lien Term B Loans: refers to the first lien term B loans in the original principal amount of $550.0 million under our Restated Credit Agreement.
First Lien Term Loans: refers, collectively, to the First Lien Term A Loans and the First Lien Term B Loans under our Restated Credit Agreement.
GAAP: refers to generally accepted accounting principles in the United States.
HHS: refers to the United States Department of Health and Human Services.
HIPAA: we collectively refer to the United States Health Insurance Portability and Accountability Act of 1996, as amended by the HITECH Act, together with their implementing regulations including the Omnibus Final Rule, as “HIPAA”.
HITECH: refers to the United States Health Information Technology for Economic and Clinical Health Act of 2009, enacted as part of the American Recovery and Reinvestment Act of 2009, which amended HIPAA.
ICD-10: refers to the 10th revision of the International Statistical Classification of Diseases and Related Health Problems, a medical classification list adopted by the World Health Organization containing codes for, among other things, diseases, signs and symptoms, abnormal findings, complaints, social circumstances and external causes of injury or diseases.
iHealth Technologies: refers to iHealth Technologies, Inc.
Initial First Lien Credit Facilities: refers to the Initial First Lien Term Loan and the Initial First Lien Revolver.
Initial First Lien Term Loan: refers to the first lien term loan in the original principal amount of $810.0 million under our Initial Secured Credit Facilities.
Initial First Lien Revolver: refers to the $75.0 million first lien revolving facility under our Initial Secured Credit Facilities.
Initial Second Lien Credit Facility: refers to the second lien term loan in the original principal amount of $265.0 million under our Initial Secured Credit Facilities.
Initial Secured Credit Facilities: refers to the loans provided pursuant to the First Lien Credit Agreement, dated as of May 14, 2014, entered into by our subsidiary Cotiviti Corporation and certain of our other subsidiaries, as borrowers and/or guarantors, the lenders named therein, as lenders, and the agents named therein, pursuant to which the lenders agreed to provide the Initial First Lien Credit Facilities, comprising the $810.0 million Initial First Lien Term Loan and the $75.0 million Initial First Lien Revolver, and the $265.0 million Initial Second Lien Credit Facility. The Initial Secured Credit Facilities were refinanced in September 2016 with the First Lien Credit Facilities pursuant to the Restated Credit Agreement.
IPO: refers to an initial public offering of common equity.
IT: refers to information technology.
JOBS Act: refers to the United States Jumpstart Our Business Startups Act of 2012.
LIBOR: refers to the London inter-bank offered rate.
iii
Medicaid: refers to the means-tested United States government health care insurance program for people of all ages, jointly funded by state and federal governments and managed by the states. The Social Security Amendments of 1965 created Medicaid by adding Title XIX to the Social Security Act of 1935.
Medicare: refers to the United States government health care insurance program providing health insurance to people age 65 and older, regardless of income or medical history, as well as people of all ages with disabilities and certain medical conditions. The Social Security Amendments of 1965 created Medicare by adding Title XVIII to the Social Security Act of 1935.
Medicare Advantage: refers to a type of health insurance program within Part C of Medicare. Medicare Advantage plans generally provide a managed health care plan that is paid based on a monthly capitated fee.
Medicare RAC: refers to a Medicare Recovery Audit Contractor; we are one of the Medicare RACs for CMS under the Medicare Recovery Audit Program.
NYSE: refers to the New York Stock Exchange, on which our shares are listed under the symbol “COTV.”
Omnibus Final Rule: refers to the Final Omnibus Privacy, Security, Breach Notification and Enforcement Rules, implemented in 2013, which amended the original Privacy, Security, Breach Notification and Enforcement Rules under HIPAA, as directed pursuant to the HITECH Act.
PHI: refers to protected health information as defined under HIPAA as an individual’s health information that is created or received by a health care provider, health plan, employer, or health care clearinghouse and is related to the individual’s health condition, provision of health care, or payment for the provision of health care and that identifies, or could reasonably identify, the individual.
PII: refers to personally identifiable information, which is information that permits the identity of an individual to whom the information applies to be reasonably inferred by either direct or indirect means.
Restated Credit Agreement: refers to the Amended and Restated First Lien Credit Agreement, dated as of September 28, 2016, entered into by our subsidiary Cotiviti Corporation and certain other of our subsidiaries, as borrowers and/or guarantors, the lenders named therein, as lenders, and the agents named therein, pursuant to which the lenders agreed to provide the First Lien Credit Facilities comprising the First Lien Term A Loans in the original principal amount of $250.0 million, the First Lien Term B Loans in the original principal amount of $550.0 million and the $100.0 million Revolver.
Revolver: refers to the $100.0 million first lien revolving credit facility under our Restated Credit Agreement.
Regulation FD: refers to Regulation Fair Disclosure promulgated by the SEC under the Exchange Act.
RSUs: refers to restricted stock units.
Sarbanes-Oxley Act: refers to the United States Sarbanes-Oxley Act of 2002.
SEC: refers to the United States Securities and Exchange Commission.
SG&A: refers to selling, general and administrative.
Special Cash Dividend: On May 25, 2016 we paid a Special Cash Dividend of $150,000, or $1.94 per share of common stock outstanding prior to the IPO, to holders of record of our common stock on the dividend record date. In connection with the Special Cash Dividend we lowered the exercise price of then outstanding stock options by $1.94 per share in order to preserve the intrinsic value of the options giving effect to the Special Cash Dividend.
iv
Cautionary note regarding forward-looking statements
This Annual Report on Form 10-K contains forward-looking statements within the meaning of the U.S. Private Securities Litigation Reform Act of 1995, Section 27A of the Securities Act and Section 21E of the Exchange Act. Forward-looking statements can be identified by words such as “anticipate,” estimate,” “expect,” “project,” “seek,” “plan,” “intend,” “believe,” “will,” “may,” “could,” “continue,” “likely,” “should” and similar references to future periods, or by the inclusion of forecasts or projections. Examples of forward-looking statements include, but are not limited to, statements we make regarding the outlook for our future business and financial performance.
Forward-looking statements are based on our current expectations and assumptions regarding our business, the economy and other future conditions. Because forward-looking statements relate to the future, by their nature, they are subject to inherent uncertainties, risks and changes in circumstances that are difficult to predict. As a result, our actual results may differ materially from those contemplated by the forward-looking statements. Important factors that could cause actual results to differ materially from those in the forward-looking statements include regional, national or global political, economic, business, competitive, market and regulatory conditions and the following:
|
· |
our inability to successfully leverage our existing client base by expanding the volume of claims reviewed and cross-selling additional solutions; |
|
· |
improvements to healthcare claims and retail billing processes reducing the demand for our solutions or rendering our solutions unnecessary; |
|
· |
healthcare spending fluctuations; |
|
· |
our clients declining to renew their agreements with us or renewing at lower performance fee levels; |
|
· |
inability to develop new clients; |
|
· |
delays in implementing our solutions; |
|
· |
system interruptions or failures, including cyber-security breaches, identity theft or other disruptions that could compromise our information; |
|
· |
our failure to innovate and develop new solutions for our clients; |
|
· |
our failure to comply with applicable privacy, security and data laws, regulations and standards; |
|
· |
changes in regulations governing healthcare administration and policies, including governmental restrictions on the outsourcing of functions such as those that we provide; |
|
· |
loss of a large client; |
|
· |
consolidation among healthcare payers or retailers; |
|
· |
slow development of the healthcare payment accuracy market; |
|
· |
negative publicity concerning the healthcare payment industry or patient confidentiality and privacy; |
|
· |
significant competition for our solutions; |
|
· |
our inability to protect our intellectual property rights, proprietary technology, information, processes and know-how; |
|
· |
compliance with current and future regulatory requirements; |
v
|
· |
declines in contracts awarded through competitive bidding or our inability to re-procure contracts through the competitive bidding process; |
|
· |
our failure to accurately estimate the factors upon which we base our contract pricing; |
|
· |
our inability to manage our growth; |
|
· |
our inability to successfully integrate and realize synergies from the Connolly iHealth Merger or any future acquisitions or strategic partnerships; |
|
· |
our failure to maintain or upgrade our operational platforms; |
|
· |
if the terms of our Medicare RAC program contracts are substantially changed or CMS seeks significant refunds under our original Medicare RAC program contract; |
|
· |
our inability to expand our retail business; |
|
· |
our rebranding may not be successful; |
|
· |
litigation, regulatory or dispute resolution proceedings, including claims or proceedings related to intellectual property infringements; |
|
· |
our inability to manage our relationships with information suppliers, software vendors or utility providers; |
|
· |
fluctuations in our results of operations; |
|
· |
changes in tax rules; |
|
· |
risks associated with international operations; |
|
· |
our inability to realize the book value of intangible assets; |
|
· |
our success in attracting and retaining qualified employees and key personnel; |
|
· |
general economic, political and market forces and dislocations beyond our control; |
|
· |
risks related to our substantial indebtedness and holding company structure; |
|
· |
volatility in bank and capital markets; |
|
· |
our status as a controlled company and as an emerging growth company; and |
|
· |
provisions in our amended and restated certificate of incorporation. |
See “Item 1A, Risk Factors” for a further description of these and other factors. For the reasons described above, we caution you against relying on any forward-looking statements, which should also be read in conjunction with the other cautionary statements that are included elsewhere in this Annual Report on Form 10-K. Any forward-looking statement made by us in this Annual Report speaks only as of the date on which it is made. Factors or events that could cause our actual results to differ may emerge from time to time, and it is not possible for us to predict all of them. We undertake no obligation to publicly update or revise any forward-looking statement, whether as a result of new information, future developments or otherwise, except as may be required by law.
Available information
Our website address is www.cotiviti.com. Information that we furnish to or file with the SEC, including our annual reports on Form 10-K, quarterly reports on Form 10-Q, current reports on Form 8-K, proxy statements, and any
vi
amendments to, or exhibits included in, those reports or statements are available for download, free of charge, on our website as soon as reasonably practicable after such materials are filed with or furnished to the SEC. From time to time, we also post announcements, updates, events, investor information and presentations on our website at http://investors.cotiviti.com in addition to copies of all recent press releases as means of disclosing material non-public information and for complying with our disclosure obligations under Regulation FD.
Reports and statements that we file with or furnish to the SEC, including related exhibits, are also available on the SEC’s website at www.sec.gov. In addition, you may obtain and copy materials we furnish to or file with the SEC at the SEC’s public reference room at 100 F Street, NE, Room 1580, Washington, D.C. 20549. Information on the operation of the SEC’s public reference facilities may be obtained by calling the SEC at 1-800-SEC-0330. You may request copies of these documents, upon payment of a duplicating fee, by writing to the SEC at its principal office at 100 F Street, NE, Room 1580, Washington, D.C. 20549.
The contents of the websites referred to above are not incorporated into this filing. References to the URLs for these websites are intended to be inactive textual references only.
vii
Overview
Cotiviti is a leading provider of analytics-driven payment accuracy solutions, focused primarily on the healthcare sector (88% of 2016 revenue). Our integrated solutions help clients enhance payment accuracy in an increasingly complex healthcare environment. We leverage our robust technology platform, configurable analytics, proprietary information assets and expertise in healthcare reimbursement to help our clients enhance their claims payment accuracy. We help our healthcare clients identify and correct payment inaccuracies, which resulted in approximately $3.3 billion in savings in 2016. We work with over 40 healthcare organizations, including 20 of the 25 largest U.S. commercial, Medicare and Medicaid managed health plans, as well as CMS. We are also a leading provider of payment accuracy solutions to over 35 retail clients (12% of 2016 revenue), including eight of the ten largest retailers in the United States.
Timely and accurate healthcare claims processing is critical to the U.S. healthcare system. The administration of healthcare claims is complex and payment inaccuracies can occur for many reasons. Changes in the healthcare industry, such as increasingly complex reimbursement models, increased coding complexity, changing demographics and potential changes to the Affordable Care Act are expected to further increase the need for our solutions. We support healthcare payers in managing the complexities in the claims payment process. Our analytics-driven solutions review claims for accuracy with respect to billing, contract compliance, payment responsibility and clinical appropriateness before and after claims are paid.
Cotiviti was formed in May 2014 through the merger of Connolly, a leader in retrospective payment accuracy solutions for the healthcare and retail sectors and iHealth Technologies, a leader in prospective payment accuracy solutions for the healthcare sector. Through the Connolly iHealth Merger, we significantly broadened our suite of payment accuracy solutions, expanded our client base, enhanced our subject matter expertise and positioned ourselves for significant growth opportunities.
Our growth strategy for healthcare includes:
|
· |
expand within our existing client base by increasing the volume of claims we review with our solutions; expanding utilization across the depth and breadth of our solutions; and cross-selling our prospective and retrospective solutions; |
|
· |
expand our client base; |
|
· |
innovate to improve and develop new solutions to expand the scope of our services; and |
|
· |
pursue opportunistic acquisitions and strategic partnerships in payment accuracy and adjacent markets. |
As a result of the meaningful savings we deliver to our clients, we have increased our client base and strengthened our long-standing relationships with many of the leading healthcare payers in the United States. In 2016, we generated revenue from six new clients and four cross-sell clients which we believe will drive revenue growth in 2017 and beyond. The average length of our relationships with our ten largest healthcare clients is over ten years. We have also substantially increased the annual savings captured by our healthcare clients over time. As a result, we believe our revenue is highly recurring and we have strong visibility into future revenue.
We are also a leading provider of payment accuracy solutions to the retail market. Retailers process and validate extremely high volumes of transactions with disparate suppliers on varying terms. We work with retail clients in the United States, Canada and the United Kingdom to realize their negotiated allowances, concessions, rebates and other incentives associated with merchandise procurement, logistics and other service transactions. In 2016, we generated over $500 million in savings for our retail clients.
1
For a further discussion of our two operating segments: (i) Healthcare and (ii) Global Retail and Other, refer to “Item 7, Management’s Discussion and Analysis of Financial Condition and Results of Operations—Our Segments” and Note 17 to the Consolidated Financial Statements.
Our track record of consistently delivering value for our clients has enabled strong growth in our revenue and profitability, especially within our core healthcare payer client base. For the years ended December 31, 2016, 2015 and 2014, our total revenue was $625.2 million, $541.3 million and $441.4 million, respectively. In these same periods, we generated net income (loss) of $48.9 million, $13.9 million and $(25.8) million, respectively, representing 7.8%, 2.6% and (5.9)% of revenue, respectively, and Adjusted EBITDA of $239.7 million, $203.4 million and $172.2 million, respectively, representing 38.3%, 37.6% and 39.0% of revenue, respectively. For a reconciliation of net income (loss) to Adjusted EBITDA, a measure not calculated in accordance with GAAP, see “Item 7, Management’s Discussion and Analysis of Financial Condition and Results of Operations—How we Assess Our Performance—Adjusted EBITDA.”
The Payment Process
Timely and accurate healthcare claims processing is critical to the U.S. healthcare system. This process is complicated and involves applying specific codes, policies and contracts, cross-referencing disparate data sources and, in many cases, adhering to regulatory requirements. To ensure prompt and accurate claims reimbursement, payers utilize internal processes and systems and third party solutions to review claims and apply analytics throughout the claims payment process. The following graphic represents the healthcare claims payment process.
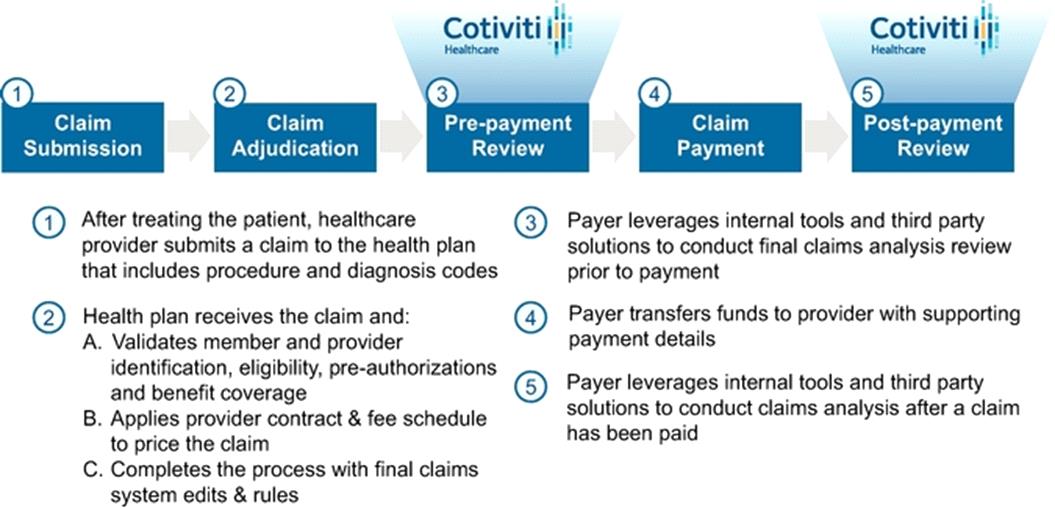
After delivering care, a provider initiates the claims payment process by submitting a claim for reimbursement to the patient's health insurance carrier (Step 1). After the insurance carrier (payer) uses internal and external tools to conform the claim to its claims processing system: it validates that the patient is a member; that the services provided were eligible under the member's benefits; and that appropriate prior authorizations were in place. The payer then adjudicates the claim by applying the provider's contract and fee schedule to the claim along with any claim system edits (Step 2). During this adjudication process, the payer uses payment accuracy solutions to perform claim reviews for information discrepancies between the provider's submission and the payer's payment policies. These reviews range in complexity and can be executed by the payer or by third party solutions. After the claim has been adjudicated but before the claim is paid, the payer may utilize the advanced, automated analytical solutions that we provide to review the claim to identify additional discrepancies (Step 3). If the prepayment review identifies a claim inaccuracy, the payer makes the correction and pays the corrected claim (Step 4).
After payment is made and additional information becomes available, the payer and third party solutions such as Cotiviti's continue to identify, select and evaluate claims for payment accuracy (Step 5). If this retrospective payment
2
review identifies a payment inaccuracy, the payer makes the correction and recovers overpayments through offsets against future claims or by seeking reimbursement from the provider.
Our Solutions
We apply our analytics-driven payment accuracy solutions at multiple points across the client's claims processing cycle. Our extensive library of complex payment analytics is designed to identify, select and make recommendations for correct application of contracts and coding to meet client payment policies. Following is a description of our payment accuracy solutions:
Prospective Claims Accuracy Solutions. Our prospective claims accuracy solutions help our healthcare clients identify and address claim discrepancies immediately following claim adjudication and before a claim is paid to a healthcare provider. We help our clients ensure that claims payments meet regulatory, compliance, industry and health plan requirements based on correct coding and clinical guidelines. We customize, configure and integrate our payment policy algorithms to enhance our clients' claims payment systems and automatically and efficiently review our clients' adjudicated claims. By directly interfacing with our clients' systems, our solutions analyze claims either in real-time or in batch processes. Our algorithms apply our proprietary library of current payment policies including industry, regulatory and medical specialty coding requirements as well as customized health plan rules. We review claims on a transactional as well as longitudinal basis, evaluating against our accumulated claims data, to make accurate payment policy recommendations. We believe that our differentiated content library, configurable algorithms and other post-adjudication software tools provide our clients with a more thorough and client-specific analysis of claims than other claims adjudication systems, creating more value for our clients. In 2016, our prospective claims accuracy solutions analyzed over $75 billion in claims.
Retrospective Claims Accuracy Solutions. Our retrospective claims accuracy solutions help health insurers identify and resolve payment inaccuracies after a claim has been paid to a healthcare provider. These solutions utilize sophisticated analytics and data mining tools to identify potential inaccuracies. Our claim analytics include longitudinal reviews of data to identify discrepancies that may span multiple claims and time periods. Our analytics are configurable to our clients' claims payment processes and enable us to prioritize areas of review based on our clients' operational and financial objectives. If expert validation is required, our claims analysts conduct a deeper review of more complex reimbursement issues. In analyzing claims retrospectively, we leverage additional information sources and broader data sets beyond the claims files, many of which only become accessible post-payment. These data and retrospective analytics enable reviews of a variety of payment accuracy categories, including issues relating to coordination of benefits, member eligibility and provider adherence to complex contract conditions. We also can provide clinical chart validation for our clients, in which our certified clinical and coding specialists review the clinical documentation associated with a claim. Clinical chart validation provides our clients with broader payment accuracy reviews beyond claims files analysis, including more complex clinical appropriateness and payment policies. We believe that our combination of retrospective analytics and clinical and coding expertise provides our clients with more thorough and configurable solutions than they are able to develop on their own, leading to increased savings for our clients. In 2016, our retrospective claims accuracy solutions analyzed over $485 billion in claims.
Other Services. Beyond our prospective and retrospective claims accuracy solutions, we provide analytics and support to our clients in optimizing their operations and enterprise-wide claims payments and trends. These offerings include selective anti-fraud, waste and abuse analytics to identify abnormal patterns in coding and billing practices. We also provide our clients with ongoing surveillance and longitudinal analytics, by reviewing claims submissions and payments across multiple dimensions, including provider, plan-type, procedure and others. In addition, clients engage us for comprehensive claims history analytics to identify necessary areas for direct interaction, as well as to identify policy and program changes that can improve future payment accuracy.
3
The examples below are simplified representations from our extensive library of complex payment analytics.
|
Solution Area |
Example #1 |
Example #2 |
|
Billing Accuracy
Was the claim coded correctly? Are the code reimbursements consistent with the payer's payment policy? |
Under ICD‑10 coding guidelines, asthma and bronchitis have different codes. However, there is a single code for patients diagnosed with both asthma and bronchitis Our solutions identify situations where a provider submitted separate claims for simultaneous asthma and bronchitis diagnoses and recommends claim modification and reimbursement to reflect use of a single code |
Reimbursement for many episodes of care is evolving from separate payments for each service to a bundled payment for the full episode and relevant services For example, bundled payments for surgical procedures should include the surgical procedure and post-operative follow-up visits Our solutions perform longitudinal claim reviews to determine if an office visit is related to a previous surgical procedure and should be bundled according to our client's policy |
|
Contract Compliance Is the claim submitted and calculated in accordance with payer / provider contract terms? Is this payment calculated appropriately based on bundles, quality or value-based care? |
Tests and procedures may be conducted under the supervision both of a general practitioner and a specialist (e.g. a radiologist) Depending on the provider's contract, reimbursement may be covered either under a global payment or separate payments to each provider Our solutions cross-reference claims from multiple providers to identify circumstances where a combined reimbursement should be applied |
Increasingly, payers participate in value-based reimbursement arrangements with strategic provider networks These contractual arrangements are complex and it can be difficult to determine coverage and capitated or fee-for-service reimbursement terms Our solutions assess claims submissions and support our clients in administering the appropriate contracted liability, coverage and payments terms with the provider network |
|
Payment Responsibility Does the client have responsibility for this claim? Does any other party share in the liability? |
Many employer-sponsored benefit plans stipulate that Medicare is the primary payer for beneficiaries who are at least 65 years of age In such instances, our solutions identify the appropriate payer and we support our clients in working with the provider to bill Medicare |
If both of the dependent's parents are insured by separate health plans, the health plan of the parent whose birthday comes first in the calendar year is designated as the primary insurer Our solutions determine the health plan liable for dependent claims and support our clients in remedying the inaccurate billing |
4
|
Solution Area |
Example #1 |
Example #2 |
|
Clinical Appropriateness Was care delivered in accordance with industry association and payer guidelines? Does chart documentation support treatment and claim submission? |
The initial symptoms for Acute Renal Failure and Dehydration are very similar and may result in incorrect coding The level of care, tests and procedures required to treat Acute Renal Failure are significantly higher than for Dehydration Our solutions and clinical experts identify claims in which treatment details in the medical chart do not support a diagnosis of Acute Renal Failure and, where appropriate, recommend chart edits and revised payment levels to reflect a Dehydration diagnosis |
Many of our health plan clients elect to administer the ABIM Foundation's Choosing Wisely® guidelines to reduce unnecessary tests and procedures For example, electrocardiograms are measurements of heart activity that are recommended for patients with heart disease but have minimal usefulness for healthy patients When our clients elect to follow the Choosing Wisely® guidelines in setting policy, we support them in identifying claims that are not deemed clinically appropriate |
Healthcare Industry Overview
The market for payment accuracy solutions is large and growing, driven by increasing healthcare costs and payment complexities. From 2004 to 2014, healthcare costs in the United States grew at a 4.8% compounded annual growth rate to $3.0 trillion and increased 5.8% in 2015 to $3.2 trillion. According to CMS, healthcare costs are expected to continue to grow at an average annual rate of 5.6% through 2025. The introduction of new reimbursement models, the increase in coding complexity and the shift to managed care plans within government healthcare are expected to further increase the complexity of healthcare payments.
5
We believe that there is substantial opportunity for continued growth in the payment accuracy solutions market. We estimate that there was over $900 billion in unnecessary or wasteful spending in the U.S. healthcare system in 2016. The U.S. federal government estimates that inaccurate provider claim submissions totaled between 3% and 10% of annual healthcare spend and we estimate that there were approximately $170 billion of inaccurate provider claim submissions in 2016. Healthcare payers will continue to invest in payment accuracy solutions in an effort to identify and resolve these inaccurate billings. We estimate that the relevant savings opportunity addressable by our current payment accuracy solutions is approximately $35 billion, for a total addressable market of approximately $5.0 billion. Of this addressable market, approximately 75% of the opportunity is within our existing client base and the balance is new client prospects across the 100 largest health plans.
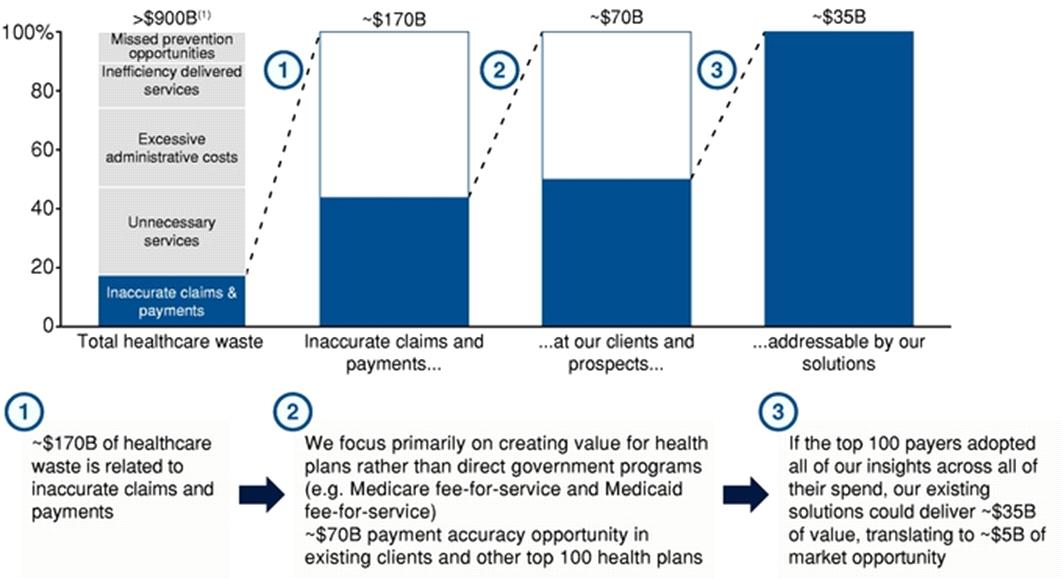
(1)Source: U.S. National Academy of Sciences’ Institute of Medicine and CMS
The principal drivers of growth in the payment accuracy solutions market are as follows:
|
· |
Increasingly complex reimbursement models. We believe that reimbursement models will continue to become more complex as healthcare payers accommodate new markets and new lines of business. A broader focus on value-based reimbursement and consumer engagement programs, which are designed to reduce costs and improve patient outcomes, adds an additional layer of complexity as payments are migrated from a fee-for-service basis to value-based and risk sharing models. As a result, healthcare payers must reconcile additional data sources, contracts with multiple provider networks and longitudinal episodes of care over time, driving demand for payment accuracy solutions. |
|
· |
Increased coding complexity. Advancements in medical technology, procedures and medications have resulted in an increasing number of testing and treatment options for providers to utilize. Scientific advancements also have led to an increase in the discovery of treatable or curable diseases. As the acceleration of medical science continues, the way in which health claims are processed is evolving to keep pace. For example, ICD‑10, the 10th revision of the International Classification of Disease and Related Health Problems, contains diagnosis codes which are used for reimbursement. With the adoption of ICD‑10 in October 2015, the total number of diagnosis codes has increased nearly five times to approximately 68,000, resulting in significantly greater coding complexity and an increasing need for payment accuracy review. |
|
· |
Changing demographics. An aging and sicker population is driving rising healthcare costs, increased utilization of prescription drugs and increased co-morbidities within patient populations. As the population |
6
ages, the number of higher-cost Medicare beneficiaries has increased from 41.5 million in 2005 to 54.3 million in 2015 and is estimated to grow to 72.0 million in 2025. As a result of both high and growing costs, healthcare insurers, the federal government and each of the state governments are under pressure to reduce costs while improving access to care and the quality of patient outcomes, creating a greater demand for highly efficient payment review solutions. |
|
· |
Shift to managed care plans within government healthcare. Individuals who receive government sponsored healthcare are transitioning from direct fee-for-service coverage to managed care network models through Medicare Advantage and managed Medicaid plans. The percentage of Medicare eligible patients enrolled in a Medicare Advantage plan has steadily increased from 22% in 2008 to 34% as of December 2016. Additionally, many state-administered Medicaid programs are alleviating budget constraints by contracting with private health insurers to manage a growing number of Medicaid eligible enrollees. The shift to managed care networks and increase in individuals covered by private health insurers increases the opportunity for commercially focused payment accuracy solutions such as ours. |
|
· |
Consolidation of managed care companies. Managed care providers are going through a period of consolidation driven by regulatory and competitive dynamics. Larger plans have historically been strong adopters of payment accuracy solutions. With a client base including over 40 healthcare organizations, including 20 of the 25 largest U.S. commercial, Medicare and Medicaid managed health plans, we believe we are well positioned to benefit from managed care consolidation. |
We believe we are well positioned to benefit from these trends.
Our Strengths
Our operational and financial success is based on the following key strengths:
|
· |
Broad suite of specialized solutions. We offer a broad suite of analytics-driven payment accuracy solutions that deliver measurable value to our clients and are highly configurable across provider settings and claim types. Our suite of solutions includes prospective and retrospective analytics that review billing accuracy, contract compliance, payment responsibility and clinical appropriateness. We believe that the breadth of our solutions across multiple points in the claims payment process and the depth of our expertise and capabilities are difficult for any single healthcare payer to replicate. |
|
· |
Large and expanding library of information and knowledge assets. Our robust library of information assets includes proprietary algorithms and concepts developed by our research teams over 15 years. We believe that our library of accumulated information and unique knowledge assets is a differentiator that is difficult to replicate by current or potential competitors and provides a competitive advantage. We continuously expand and improve the quality of our library by regularly incorporating new claims data and up-to-date algorithms and concepts. We also have a team of full-time, dedicated, doctors, nurses, claims coders, forensic auditors and other experts focused on developing new proprietary algorithms and analytics assets for our payment accuracy solutions. Additionally, our team of specialists monitors hundreds of content sources on medical and payment policy to ensure our algorithms and concepts incorporate the latest standards. |
|
· |
Advanced and proprietary technology platform and analytics capabilities. Our advanced proprietary platform and analytics capabilities are the result of significant investment in our technology infrastructure and applications. We are continually developing and improving our scalable technology platform to deliver the speed, integrity and quality necessary for client-specific business solutions. In addition, our focus on analytics, automation and knowledge-sharing allows us to quickly and accurately implement existing algorithms and concepts as well as solutions for newly identified reimbursement discrepancies. We believe that our proprietary technology platform is a key driver of our leading market position. |
|
· |
Aligned financial model that delivers measureable return. Our financial performance is directly tied to the savings we deliver to our clients. The majority of our contracts are structured such that we receive a percentage of the savings that we help our clients achieve. We have consistently generated a high return on investment for our clients of approximately 5 to 1 as a result of our aligned financial model. The savings we deliver are incremental to our clients' internal payment accuracy capabilities. As a result, we can provide a substantial |
7
contribution to our clients' earnings and create strong alignment and durability in our client relationships. In 2016, 2015 and 2014, our commercial healthcare clients realized approximately $3.2 billion, over $2.5 billion and over $2.0 billion, respectively, in savings using our solutions. |
|
· |
Long-standing and expanding client relationships. Our client base includes the largest and most recognized healthcare plan organizations in the United States, including 20 of the 25 largest U.S. commercial, Medicaid and Medicare managed health plans, as well as CMS. The average length of our relationships with our top ten healthcare clients is over ten years. We also have strong, long-standing relationships with over 35 retail clients, including eight of the ten largest U.S. retailers. We believe our robust client relationships and strong client retention rates reflect a high level of satisfaction with our solutions. Our clients’ satisfaction results from how we deliver solutions by configuring our algorithms and analyses to align with their operational, financial and network management priorities. |
|
· |
Attractive operating model. We believe we have an attractive operating model due to the recurring nature of our revenue, the scalability of our solutions and the low capital intensity/high free cash flow conversion of our business. Our information asset and technology platform is highly scalable, which allows us to accommodate significant additional transaction volumes with limited incremental costs. We have low capital needs that allow us to generate strong cash flow. Our capital expenditures as a percentage of revenue were 5.6%, 4.2% and 4.3% during the years ended December 31, 2016, 2015 and 2014, respectively. We believe our recurring revenue, combined with our scalable solutions and low capital needs, will continue to contribute to our long-term growth, strong operating margins and flexibility in allocating capital. |
|
· |
History of innovation. We have a long history of developing innovative solutions which we continuously incorporate into our suite of offerings. Many of our solutions have been generated as a response to complex client issues. This development process has continually enhanced our solutions, thereby optimizing the value we deliver to our clients over time and allowing us to thrive in an ever-changing and increasingly complex healthcare environment. Our track record of innovation is strengthened by the diverse backgrounds of our clinical and coding specialists who continually and consistently update and develop our content library and analytical algorithms and identify new ways to accelerate our value creation for our clients. |
|
· |
Experienced management team with a track record of performance. Our leadership team brings extensive and relevant expertise in the payment accuracy market. Our management has a proven track record in adapting to clients' needs and developing innovative analytical solutions to drive growth and profitability. |
Our Growth Strategies
We believe we are well positioned to benefit from the expected growth in claims processing complexity and healthcare spend, which we expect will drive continued demand for payment accuracy solutions among healthcare payers. Our strategies for achieving growth include:
Expand within our existing client base. We have significant opportunities to expand our business within our existing client base through the following strategies:
|
· |
Increase the volume of claims reviewed by our solutions. When our clients initially implement our solutions, they typically start by having us review a subset of their claims. As we demonstrate success and deliver value, our clients often increase the volume of claims we review. We have significant opportunities to evaluate additional claim types, plan types, geographic regions and/or provider settings. |
|
· |
Expand the utilization of our solutions. When our clients initially implement our solutions, they typically start with a subset of our algorithms and analytical tools. As we demonstrate success and deliver value, our clients often expand the utilization of our algorithms and analytical tools. The opportunity to expand the utilization of our solutions is significant. |
|
· |
Cross-sell between prospective and retrospective solutions. We believe we have a significant opportunity to further cross-sell our solutions to existing clients as we have cross-sell opportunities across more than half of our healthcare client base. We continue to actively engage with existing clients to cross-sell our solutions. In 2016, we generated revenue from four successful cross-sells with existing clients. |
8
Expand our client base. There is a significant opportunity to increase our client base of healthcare payers by targeting new relationships. The top 100 healthcare payers that are not our existing clients made approximately $240 billion in payments in 2016. We are pursuing these healthcare payers as potential new clients by leveraging our proven value proposition, leadership position, track record of performance and the strong references provided by our diversified client base of leading health plans. The addition of new clients creates revenue growth opportunities for future periods. In 2016, we generated revenue from six new healthcare clients.
Continue to innovate. We plan to enhance our existing solutions by developing new concepts and analytical algorithms and improving our information assets to allow us to expand our value creation for our clients. We also plan to continue to improve our processes and upgrade our technology infrastructure to improve the efficiency with which we deliver our solutions. Additionally, we will continue to monitor the evolution of the healthcare environment and develop new solutions in anticipation of increasing complexity in reimbursement models to supplement our core payment accuracy solutions.
Selectively pursue acquisitions and strategic partnerships. We plan to selectively pursue acquisitions and strategic partnerships to (i) accelerate the pace of innovation and expansion of our core solutions, (ii) provide cross-sell opportunities, (iii) offer complementary data, technologies or industry expertise to our existing analytics-driven payment accuracy solutions or (iv) expand our addressable market beyond payment accuracy to address other dimensions of healthcare waste, potentially including missed prevention opportunities, inefficiently delivered services, excessive administrative costs and unnecessary services. We have a successful track record of identifying, acquiring and integrating high-quality solutions providers that complement and enhance the value of our existing solutions.
Retail Payment Accuracy Solutions
We are a leading provider of payment accuracy solutions to retailers in the United States, Canada and the United Kingdom, with over 35 years of experience. We serve over 35 retail clients, including eight of the ten largest retailers in the United States. Our relationships with these clients tend to be long-term, with an average tenure of more than ten years.
The retail industry faces significant cost containment challenges as retailers process and validate extremely high volumes of transactions with disparate suppliers on varying terms. The retail payment accuracy market continues to grow in complexity due to shifts in consumer spending habits, such as the increasing adoption of internet-based shopping, as well as newer pricing strategies, such as dynamic pricing and promotional activities.
We provide value to retailers by helping them identify and recover payments to suppliers of goods and services that are inconsistent with contractual or agreed upon terms. We use automated analytics capabilities and experienced teams to review supplier agreements, invoices, purchase orders, promotions and other transactions and identify discrepancies in merchandise procurement, logistics and other services transactions. In 2016, we generated over $500 million in savings for our retail clients.
Seasonality
Historically, there has been a seasonal pattern to our healthcare revenue with the revenues in the first quarter generally lower than the other quarters and revenues in the fourth quarter generally being higher than the other quarters. Accordingly, the comparison of revenue from quarter to quarter may fluctuate and is dependent on various factors, including, but not limited to, reset of member liability, timing of special projects and timing of inaccurate payments being prevented or recovered as well as the aforementioned seasonal considerations. Consequently, you should not rely on our revenue for any one quarter as an indication of our future performance.
Sales and Marketing
Our sales and marketing activities are focused on increasing the scope of claims reviewed by our solutions, cross-selling our solutions to our existing clients and generating new clients. Our sales and client services professionals sell our solutions directly to clients and manage our ongoing client relationships. Marketing activities for our healthcare and retail solutions include targeted direct marketing, advertising, tradeshow participation, workshops, web-based marketing activities, e-newsletters and customer and industry conferences.
9
Competition
The payment accuracy solutions business is highly competitive. Competitive factors in the payment accuracy industry include the amount of savings identified, quality of the technology-based solution or service, application features and functions, ease of delivery and integration, ability of the payment accuracy partner to maintain, enhance and support the applications or services, industry experience and expertise, sensitivity to maintaining provider and supplier relationships and pricing. In the healthcare payment accuracy market, we compete primarily with other payment accuracy vendors, fraud, waste and abuse claim edit and predictive analysis companies, Medicare RACs, healthcare consulting firms and other third party liability services providers. Competitors for our healthcare solutions include Optum, Inc., Verscend Technologies, Inc. (f/k/a Verisk Health, Inc.), McKesson Corporation, Change Healthcare Corporation, HMS Holdings Corp., The Rawlings Group, Equian, LLC, Zelis Healthcare Corporation and other, smaller companies. In addition, most healthcare payers, including a number of our clients, also have the ability to perform some or all payment accuracy functions in-house.
In the retail payment accuracy market, we compete primarily with PRGX Global, Inc. as well as a number of smaller companies that do not have a material market share of the retail payment accuracy market.
Intellectual Property
We rely on a combination of confidentiality agreements with our clients, employees, consultants, subcontractors and other parties as well as other security measures, such as information access and distribution controls, to establish and protect our proprietary technology, information, processes and know-how that comprise our solutions. We also have brands that have goodwill in the markets that we serve and we rely on trademarks to protect our related rights.
Research & Development
Our research and development activities relate primarily to the design, development and enhancement of our payment accuracy solutions. We expect to continue investing significant resources to maintain, enhance and extend the functionality of our proprietary systems and existing solutions, to develop new solutions in response to the needs of our clients, and to enhance the capabilities surrounding our infrastructure.
Government Regulation
A majority of our business is directly or indirectly related to the healthcare industry and is affected by changes in the healthcare industry, including political, legislative and regulatory changes and fluctuations in healthcare spending. Participants in the healthcare industry, including our clients, are required to comply with extensive and complex federal and state laws and regulations including fraud and abuse, false claims, anti-kickback and privacy and security laws and regulations. Although many of the regulatory and governmental requirements do not directly apply to our operations, many of our clients are required to comply with these requirements, which may impact our business and the demand for our services and solutions. Many of the laws and regulations, including federal and state false claims laws that affect us as a result of some of our services and solutions, are complex and may be subject to varying interpretations by courts and other governmental authorities. Our failure to comply with any applicable laws and regulations could result in restrictions on our ability to provide certain services and solutions, as well as the possible imposition of civil and criminal penalties, damages, fines and exclusion from participation in federal and state healthcare programs.
The Patient Protection and Affordable Care Act
In the United States, federal and state legislatures and agencies periodically consider healthcare reform measures that may contain proposals to increase governmental involvement in healthcare, lower reimbursement rates or otherwise change the environment in which healthcare industry participants operate. Our business could be affected by changes in healthcare laws including the Affordable Care Act, which was signed into law in March 2010 and is currently under consideration for repeal or restructuring by the current administration. The Affordable Care Act has changed how healthcare services are covered, delivered and reimbursed through expanded coverage of uninsured individuals, reduced Medicare program spending and insurance market reforms. The Affordable Care Act has created major changes in how healthcare is delivered and reimbursed and generally increased access to health insurance benefits to the uninsured and
10
underinsured population of the United States. Among other things, the Affordable Care Act has increased the number of individuals with Medicaid and private insurance coverage, implemented reimbursement policies that tie payment to quality, facilitated the creation of accountable care organizations that may use capitation and other alternative payment methodologies, strengthened enforcement of fraud and abuse laws and encouraged the use of information technology.
While many of the provisions of Affordable Care Act will not be directly applicable to us, the Affordable Care Act, as enacted, will affect the business of our healthcare clients and also will affect the Medicaid programs of the states with which we have contracts, which may in turn affect our business. Many of the changes promulgated by the Affordable Care Act require implementing regulations which have not yet been drafted or have been released only as proposed rules. Until the Affordable Care Act is fully implemented, or there is more certainty concerning the future of the Affordable Care Act, it will be difficult to predict its full impact and influence on the healthcare industry.
Additionally, the Affordable Care Act has been subject to a number of challenges to its constitutionality. On June 28, 2012, the United States Supreme Court upheld challenges to the constitutionality of the “individual mandate” provision of the Affordable Care Act, which generally requires all individuals to purchase healthcare insurance or pay a penalty, but struck down as unconstitutional the provision that would have allowed the federal government to revoke all federal Medicaid funding to any state that did not expand its Medicaid program. As a result, many states have refused to extend Medicaid eligibility. On June 25, 2015, the United States Supreme Court upheld the legality of premium subsidies made available by the federal government to individuals residing in the 36 states that have federally-run health insurance exchanges. The subsidies are provided to low-income individuals to assist with the cost of purchasing health insurance through federally-run health insurance exchanges. Other legal challenges to the Affordable Care Act are pending. On January 12, 2017, Congress voted in favor of a budget resolution to produce legislation that, if passed, would repeal certain aspects of the Affordable Care Act. Congress is also considering subsequent legislation to replace or repeal elements of or all of the Affordable Care Act. In addition, there have been recent public announcements by members of Congress and the new presidential administration regarding potential plans to repeal and replace all or a portion of the Affordable Care Act. As a result, it is difficult to predict the impact the Affordable Care Act will have on our business given the threats to and uncertainty surrounding the Affordable Care Act.
HIPAA and other Health Information Laws
A significant portion of our business is regulated by HIPAA. Among other things, HIPAA requires business associates and covered entities to comply with certain privacy and security requirements relating to PHI and PII and mandates the way certain types of healthcare services are coded and processed. We frequently act as a business associate to our covered entity clients and, as a result, collect, use, disclose and maintain PHI and PII of individuals, as well as other financial, confidential and proprietary information belonging to our clients and certain third parties from whom we obtain information (e.g., private insurance companies, financial institutions). HIPAA and other state, industry and international laws and regulations require us to establish and maintain reasonable and appropriate administrative, technical and physical safeguards to ensure the integrity, confidentiality and availability of electronic protected health information, which also includes information about the payment for healthcare services. The laws and rules promulgated by these acts are changed frequently by legislation, regulatory issuances and/or administrative interpretation. For instance, in January 2013, HHS issued the Omnibus Final Rule modifying and supplementing many of the standards and regulations under HIPAA. The Omnibus Final Rule significantly lowered the disclosure standards required for notifications of breaches in patient privacy and expanded the universe of available liability under certain of HIPAA's requirements, including expanding direct liability for HIPAA's requirements to companies such as ours, which act as business associates to covered entities.
HIPAA establishes privacy and security standards that limit the use and disclosure of PHI and require the implementation of administrative, physical and technical safeguards to ensure the confidentiality, integrity and availability of individually identifiable health information in electronic form, as well as breach notification procedures for breaches of PHI and penalties for violation of HIPAA's requirements for entities subject to its regulation. Violations of HIPAA's requirements may result in civil and criminal penalties. Civil penalties may be up to $50,000 per violation with a maximum civil penalty of $1.5 million in a calendar year for violations of the same requirement. However, a single breach incident can result in violations of multiple requirements, resulting in possible penalties well in excess of $1.5 million. In addition, the Federal Civil Penalties Inflation Adjustment Improvements Act of 2015 required all federal agencies to adjust their civil monetary penalties to inflation, no later than August 1, 2016. As a result, the maximum annual penalties for each HIPAA violation which occurs later than February 17, 2009, are now $1.7 million. Recent enforcement actions by HHS for HIPAA violations have imposed penalties of up to $5.6 million. State attorneys general
11
also have the right to prosecute HIPAA violations committed against residents of their states. While HIPAA does not create a private right of action that would allow individuals to sue in civil court for HIPAA violations, its standards have been used as the basis for the duty of care in state civil suits, such as those for negligence or recklessness in misusing individuals' health information. HHS is currently conducting audits to assess HIPAA compliance efforts by covered entities and business associates and is authorized to establish a permanent program for the future.
In addition to HIPAA, numerous other federal and state laws govern the collection, maintenance, protection, use, transmission, disclosure and disposal of PHI and PII and these laws can be more restrictive than HIPAA, which means that entities subject to them must comply with the more restrictive state law in addition to complying with HIPAA. Not only may some of these state laws impose fines and penalties upon violators, but some, unlike HIPAA, may also afford private rights of action to individuals who believe their personal information has been misused. State laws are changing rapidly, and there is discussion of a new federal privacy law or federal breach notification law. Further, the United States Congress and a number of states have considered or are considering additional prohibitions or limitations on the disclosure of medical or other information to individuals or entities located outside of the United States.
Healthcare Administrative Simplification
HIPAA mandates a package of interlocking administrative simplification rules to establish standards and requirements for the electronic transmission of certain healthcare claims and payment transactions, to encourage electronic commerce in the healthcare industry. The standard transaction regulations established under HIPAA mandate certain format and data content standards for the most common electronic healthcare transactions, using technical standards promulgated by recognized standards publishing organizations.
In January 2009, CMS published a final rule adopting updated standard code sets for diagnoses and procedures known as the ICD-10 code sets, which contain significantly more diagnostic and procedural codes than the existing ICD-9 coding system. All Medicare claims with a date of service after October 1, 2015, must contain the new ICD-10 codes. As a result, we have adapted our solutions to the new coding system.
Reductions in Government Healthcare Spending
In recent years, legislative and regulatory changes have limited, and in some cases reduced, the levels of payment that healthcare payers receive for various services under the Medicare, Medicaid and other federal healthcare programs. In some cases, healthcare payers base their payment rates on Medicare policy, and therefore, adjustments that negatively impact Medicare payments also may negatively impact payments received by healthcare providers from other payers. The Affordable Care Act provides for significant federal healthcare program spending reductions, including reductions in Medicare payments to most healthcare providers and Medicare Advantage plans. In addition to reductions required by the Affordable Care Act, the Budget Control Act of 2011 requires automatic spending reductions of $1.2 trillion for federal fiscal years 2013 through 2021, minus any deficit reductions enacted by Congress and debt service costs. Under the Budget Control Act, the percentage reduction for most Medicare programs may not be more than 2% for a fiscal year, with a uniform percentage reduction across those Medicare programs. Due to subsequent legislation, the reductions have been extended through 2025. The Medicaid program, however, is not included in the reductions. Federal healthcare program spending continues to be a “hot-button” issue in the United States and the federal government continues to consider deficit reduction measures and other changes to government healthcare programs, including a possible repeal or restructuring of the Affordable Care Act.
Employees
As of the fiscal year ended December 31, 2016, we had approximately 3,000 employees. None of our employees are represented by labor unions. We have not experienced any work stoppages and we consider our relationship with our employees to be good.
12
Investing in our common stock involves a high degree of risk. You should consider carefully the following risks and all of the information in this Annual Report on Form 10-K, before purchasing our common stock. If any of the following risks actually occur, our business, financial condition and results of operations could be materially adversely affected. In that case, the trading price of our common stock could decline, perhaps significantly, and you may lose all or part of your investment.
Risks Relating to Our Business
Our business and future growth depend on our ability to successfully expand the scope of claims reviewed for, and cross-sell additional solutions to, our existing client base.
We expect a significant portion of our future revenue growth to come from expanding the scope of claims we review for, and cross-selling additional solutions to, our existing clients. Our efforts to do so may not be successful. If we are unable to successfully expand the scope of payments reviewed by our solutions for or cross-sell additional solutions to our existing clients, it could have a material adverse effect on our growth and on our business, financial condition and results of operations.
Internal improvements to healthcare claims and retail billing processes by our clients could reduce the need for, and revenue generated by, our solutions, which could have a material adverse effect on our business, financial condition and results of operations.
We provide solutions that help our clients enhance payment accuracy in an increasingly complex environment. If our clients improve their healthcare claims and retail billing processes, demand for our solutions could be reduced. Since most of our contracts are performance fee-based, enhancement of client internal billing processes could reduce the revenue generated by our solutions. With enough time and investment, many of our clients may be able to reduce or resolve recurring payment process complexities and resulting payment inaccuracies. In addition, many of our clients also utilize third party or internal technology, systems and personnel that review transactions before we do, all of which are constantly updated and improved. As the skills, experience and resources of such technology, systems and personnel improve, they may be able to identify payment inaccuracies before using our solutions, which would reduce the payment inaccuracies identified by our solutions and our ability to generate related revenue, which could have a material adverse effect on our business, financial condition and results of operations.
Healthcare spending fluctuations, simplification of the healthcare delivery and reimbursement system, programmatic changes to the scope of benefits and limitations to payment integrity initiatives could reduce the need for and the price of our solutions, which could have a material adverse effect on our business, financial condition and results of operations.
Our solutions improve our clients’ ability to accurately pay healthcare claims and prevent or recover inaccurate payments, which often are a result of complexities in the healthcare claims payment system. Although the healthcare benefit and payment system continues to grow in complexity due to factors such as increased regulation and increased healthcare enrollment, the need for our solutions, the price clients are willing to pay for them and/or the scope and profitability of the solutions that we provide to our clients could be negatively affected by, among other things:
|
· |
simplification of the U.S. healthcare delivery and reimbursement systems, either through shifts in the commercial healthcare marketplace or through legislative or regulatory changes at the federal or state level; |
|
· |
reductions in the scope of private sector or government healthcare benefits (for example, decisions to eliminate coverage of certain services) or the possible repeal or restructuring of the Affordable Care Act; |
|
· |
the transition of healthcare beneficiaries from fee-for-service plans to value-based plans; |
|
· |
the adoption of healthcare plans with significantly higher deductibles; |
|
· |
limits placed on payment integrity initiatives, including the Medicare RAC program; and |
13
|
· |
lower than projected growth in private health insurance or the various Medicare and Medicaid programs, including Medicare Advantage. |
Any of these developments could have a material adverse effect on our business, financial condition and results of operations.
If our existing clients do not renew their agreements with us, renew at lower performance fee levels, choose to reduce the number of claims reviewed by our solutions, or prematurely terminate their agreement with us, and we are unable to replace any related lost revenue, it could have a material adverse effect on our business, financial condition and results of operation.
We historically have derived, and expect in the future to derive, a significant portion of our revenue from our existing clients and, accordingly, we are reliant on ongoing renewals of our agreements with existing clients. As a result, maintaining a high renewal rate is critical to our future growth and our business, financial condition and results of operations. We may experience significantly more difficulty than we anticipate in renewing our existing client agreements. Factors that may affect the renewal rate for our services and our ability to sell additional solutions include:
|
· |
the price, performance and functionality of our solutions; |
|
· |
the availability, price, performance and functionality of competing solutions; |
|
· |
our clients’ perceived ability to review claims accurately using their internal resources; |
|
· |
our ability to develop complementary solutions; |
|
· |
our continued ability to access the data necessary to enable us to effectively develop and deliver new solutions to clients; |
|
· |
the stability and security of our platform; |
|
· |
changes in healthcare laws, regulations or trends; and |
|
· |
the business environment of our clients. |
Contracts with our clients generally have stated terms of one to five years. Our clients have no obligation to renew their contracts for our services after the term expires. In addition, our clients may negotiate terms less advantageous to us upon renewal, may renew with a reduced scope of services, may choose to discontinue one or more services under an existing contract, may exercise flexibilities within their contracts to adjust service volumes, or may terminate the agreement prior to its contracted completion date, if any, which could reduce our revenue from these clients. If our clients fail to renew their agreements, renew their agreements upon less favorable terms, at lower performance fee levels or for fewer services, fail to purchase new services from us, or terminate their agreements with us, and we are unsuccessful in generating significant revenue from new or other existing clients to replace any lost revenue, our growth may be constrained and our revenue may decline which could have a material adverse effect on our business, financial condition and results of operations.
If we are unable to develop new client relationships, it could have a material adverse effect on our business, financial condition and results of operations.
As part of our strategy, we seek to develop new client relationships, principally among healthcare payers. Our ability to develop new relationships depends on a variety of factors, including the quality and performance of our solutions, as well as the ability to market and sell our solutions effectively and differentiate ourselves from our competitors. We may not be successful in developing new client relationships. If we are unable to develop new client relationships, it could have a material adverse effect on our business, financial condition and results of operations.
14
We have long sales and implementation cycles for many of our solutions and if we fail to close sales after expending time and resources on the sales process, or if we experience delays in implementing the solutions we sell, it could have a material adverse effect on our business, financial condition and results of operations.
Potential clients generally perform a thorough evaluation of available payment accuracy solutions and require us to expend time, effort and money educating them as to the value of our solutions prior to entering into a contract with them. We may expend significant funds and management resources during the sales cycle and ultimately fail to close the sale. Our sales cycle may be extended due to our clients’ budgetary constraints or for other reasons. In addition, following a successful sale, the implementation of our systems frequently involves a lengthy process, as we integrate our technology with the new client’s technology and learn the new client’s business, operations and billing processes and preferences. If we are unsuccessful in closing sales after expending funds and management resources or if we experience delays in such sales or in implementing our solutions, it could have a material adverse effect on our business, financial condition and results of operations.
System interruptions or failures could expose us to liability and have a material adverse effect on our business, financial condition and results of operations.
Our data and operations centers are essential to our business, which depends on our ability to maintain and protect our information systems. In addition, our operations are spread across the United States, Canada, the United Kingdom and India and we rely heavily on technology to communicate internally and efficiently perform our services. We have implemented measures that are designed to mitigate the potential adverse effects of a disruption, relocation or change in operating environment; however, we cannot provide assurance that the situations we plan for and the amount of insurance coverage that we maintain will be adequate in any particular case. In addition, despite system redundancy and security measures, our systems and operations are vulnerable to damage or interruption from, among other sources:
|
· |
power loss, transmission cable cuts and telecommunications failures; |
|
· |
damage or interruption caused by fire, earthquake and other natural disasters; |
|
· |
attacks by hackers or nefarious actors; |
|
· |
human error; |
|
· |
computer viruses and other malware, or software defects; and |
|
· |
physical break-ins, sabotage, intentional acts of vandalism, terrorist attacks and other events beyond our control. |
If we encounter a business interruption, if we fail to effectively maintain our information systems, if it takes longer than we anticipate to complete required upgrades, enhancements or integrations or if our business continuity plans and business interruption insurance do not effectively compensate on a timely basis, we could suffer operational disruptions, disputes with clients, civil or criminal penalties, regulatory problems, increases in administrative expenses, loss of our ability to produce timely and accurate financial and other reports or other adverse consequences, any of which could have a material adverse effect on our business, financial condition and results of operations.
If we fail to innovate and develop new solutions, or if these new solutions are not adopted by existing and potential clients, it could have a material adverse effect on our business, financial condition and results of operations.
Our results of operations and continued growth will depend on our ability to successfully develop and market new solutions that our existing and potential clients are willing to adopt. We cannot provide assurance that our new or modified solutions will be responsive to client preferences or industry changes, or that the product and service development initiatives we prioritize will yield the gains that we anticipate, if any.
If we are unable to predict market preferences or if our industry changes, or if we are unable to modify our solutions on a timely basis, we may lose clients or fail to attract new clients. If existing clients are not willing to adopt
15
new solutions, or if potential clients do not value such new solutions, it could have a material adverse effect on our business, financial condition and results of operations.
We obtain and process a large amount of sensitive data. Our systems and networks may be subject to cyber-security breaches and other disruptions that could compromise our information. Any real or perceived improper use of, disclosure of, or access to such data could harm our reputation as a trusted brand, as well as have a material adverse effect on our business, financial condition and results of operations.
We use, obtain and process large amounts of confidential, sensitive and proprietary data, including PHI subject to regulation under HIPAA and PII subject to state and federal privacy, security and breach notification laws. The secure processing and maintenance of this information is critical to our operations and business strategy. We face risks associated with new personnel, as well as with new processes and technologies which are implemented from time to time to augment our security and privacy management programs. Our databases and systems, as well as those of our third party vendors, have been, and likely will continue to be, subject to computer viruses or other malicious codes, unauthorized access attempts, denial of service attacks, phishing and other cyber attacks. To date, we have seen no material impact on our business or operations from these attacks, however, we cannot guarantee that our security efforts or the security efforts of our third party vendors will prevent breaches or breakdowns to our or their databases or systems. If our security measures or those of the third party vendors we use who have access to this information are inadequate or are breached as a result of third party action, employee error, malfeasance, malware, phishing, hacking attacks, system error, trickery or otherwise, and, as a result, someone obtains unauthorized access to sensitive information, including PHI and PII, on our systems or our providers’ systems, our reputation and business could be damaged. We cannot guarantee that our security efforts will prevent breaches or breakdowns to our or our third party vendors’ databases or systems. The occurrence of any of these events could cause our solutions to be perceived as vulnerable, cause our clients to lose confidence in our solutions, negatively affect our ability to attract new clients and cause existing clients to terminate or not renew their use of our services and solutions. If the information is lost, improperly disclosed or threatened to be disclosed, we could incur significant liability and be subject to regulatory scrutiny and penalties. Furthermore, we could be forced to expend significant resources in response to a security breach, including investigating the cause of the breach, repairing system damage, increasing cyber-security protection costs by deploying additional personnel and protection technologies, notifying and providing credit monitoring to affected individuals, paying regulatory fines and litigating and resolving legal claims and regulatory actions, all of which could increase our expenses and divert the attention of our management and key personnel away from our business operations.
In addition, if our own confidential business information were improperly disclosed, our business could be materially adversely affected. A core aspect of our business is the reliability and security of our technology platform. Any perceived or actual breach of security could have a significant impact on our reputation as a trusted brand, cause us to lose existing clients, prevent us from obtaining new clients, require us to expend significant funds to remedy problems caused by breaches and to implement measures to prevent further breaches, and expose us to legal risk and potential liability. Any security breach at a third party vendor providing services to us could have similar effects. Any breach or disruption of any systems or networks on which we rely could have a material adverse effect on our business, financial condition and results of operations.
Certain of our activities present the potential for identity theft or similar illegal behavior by our employees or contractors with respect to third parties, which could have a material adverse effect on our business, financial condition and results of operations.
Our solutions involve the use and disclosure of personal information that in some cases could be used to impersonate third parties or otherwise improperly gain access to their data or funds. If any of our employees or contractors take, convert or misuse such information, or we experience a data breach creating a risk of identity theft, we could be liable for damages and our business reputation could be damaged. In addition, we could be perceived to have facilitated or participated in illegal misappropriation of documents or data and, therefore, be subject to civil or criminal liability. Federal and state regulators may take the position that a data breach or misdirection of data constitutes an unfair or deceptive act or trade practice. We also may be required to notify individuals affected by any data breaches. Further, a data breach or similar incident could impact the ability of our clients that are creditors to comply with the federal “red flags” rules, which require the implementation of identity theft prevention programs to detect, prevent and mitigate identity theft in connection with client accounts, which could be costly to our clients and to us. If data utilized in our solutions are misappropriated for the purposes of identity theft or similar illegal behavior, it could have a material adverse effect on our reputation, business, financial condition and results of operations.
16
If we fail to comply with applicable privacy, security and data laws, regulations and standards, including with respect to third party service providers that utilize sensitive personal information on our behalf, it could have a material adverse effect on our reputation, business, financial condition and results of operations.
In order to provide our services and solutions, we often receive, process, transmit and store PHI and PII of individuals, as well as other financial, confidential and proprietary information belonging to our clients and third parties (e.g., private insurance companies, financial institutions, etc.). The receipt, maintenance, protection, use, transmission, disclosure and disposal of this information is regulated at the federal, state, international and industry levels. We are also obligated under our contractual requirements with customers, who are themselves subject to extensive regulatory obligations and oversight. These laws, rules and requirements are subject to frequent change. Compliance with new privacy and security laws, regulations and requirements may result in increased operating costs and may constrain or require us to alter our business model or operations. For example, as a result of the Omnibus Final Rule promulgated in 2013 pursuant to the HITECH Act, we became subject to direct federal regulation under HIPAA, which provides for governmental investigations, audits, enforcement actions and penalties.
HIPAA establishes privacy and security standards that limit our use and disclosure of PHI and requires us to implement administrative, physical and technical safeguards to ensure the confidentiality, integrity and availability of PHI, as well as notify our covered entity customers of breaches of unsecured PHI and security incidents. HIPAA also imposes direct penalties on us for violations of its requirements. In addition to HIPAA, we are subject to varying state laws governing the use and disclosure of PII, including medical record information, as well as state laws requiring notification in case of a breach of such information. The Omnibus Final Rule significantly increased the risk of liability to us and our business associate subcontractors both by making us directly subject to many of HIPAA’s requirements and by broadening the breach notification standard to make more incidents of inadvertent disclosure reportable and subject to penalties.
We act as a HIPAA “business associate” to our covered entity customers because we collect, use, disclose and maintain PHI in order to provide services to these customers. HIPAA requires us to enter into satisfactory written business associate agreements with our covered entity customers, which contain specified written assurances that we will safeguard PHI that we create or access and will fulfill other material obligations. Under the Omnibus Final Rule, we may be held directly liable under our business associate agreements and HIPAA for any violations of HIPAA. Therefore, we could face liability to our customers under our contracts with them as well as liability to the government under HIPAA if we do not comply with our business associate obligations and those provisions of HIPAA that are applicable to us. While we take measures to comply with applicable laws and regulations as well as our own internally disseminated privacy and security policies, such laws, regulations and related legal standards for privacy and security continue to evolve and any failure or perceived failure to comply with applicable laws, regulations and standards may result in threatened or actual proceedings, actions and public statements against us by government entities, private parties, consumer advocacy groups or others, or could cause us to lose clients, which could have a material adverse effect on our business, financial condition and results of operations. The penalties for a violation of HIPAA are significant and, if imposed, could have a material adverse effect on our business, financial condition and results of operations. While we have included protections in our contracts with our third party service providers as required by the Omnibus Final Rule, we have limited oversight or control over their actions and practices. In addition, we could also be exposed to data breach risk if there is unauthorized access to one of our or our subcontractors’ facilities or servers, or from lost or stolen laptops or other portable media, current or former employee theft of data containing PHI, misdirected mailings containing PHI, or other forms of administrative or operational error. HHS is currently conducting audits to assess HIPAA compliance efforts by covered entities and business associates and is authorized to establish a permanent program for future audits. An audit of us or our business associate subcontractors resulting in findings or allegations of noncompliance could have a material adverse effect on our results of operations, financial position and cash flows.
Noncompliance or findings of noncompliance with applicable laws, regulations or requirements, or the occurrence of any privacy or security breach involving the misappropriation, loss or other unauthorized disclosure of sensitive personal information, whether by us or by one of our third party service providers, could have a material adverse effect on our reputation and business, including, among other consequences, mandatory disclosure to the media, public and regulators, loss of existing or new customers, significant increases in the cost of managing and remediating privacy or security incidents and material fines, penalties and litigation awards, any of which could have a material adverse effect on our results of operations, financial position and cash flows. Further, if such laws and regulations are not enforced equally against other competitors in a particular market, our compliance with such laws may put us at a competitive disadvantage vis-à-vis competitors who do not comply with such requirements.
17
We have clients throughout all 50 states and our solutions may contain healthcare information of patients located across all 50 states. Therefore, we may be subject to state privacy laws, which vary from state to state and, in some cases, can impose more restrictive requirements than federal law. Where state laws are more protective, we have to comply with the stricter provisions. In addition to fines and penalties imposed upon violators, some of these state laws also afford private rights of action to individuals who believe their personal information has been misused. California’s patient privacy laws, for example, provide for penalties of up to $250,000 and permit injured parties to sue for damages. The interplay of federal and state laws may be subject to varying interpretations by courts and government agencies, creating complex compliance issues for us and our clients and potentially exposing us to additional expense, adverse publicity and liability. Further, as regulatory focus on privacy issues continues to increase and laws and regulations concerning the protection of personal information expand and become more complex, these potential risks to our business could intensify. Changes in laws or regulations associated with the enhanced protection of certain types of sensitive data, such as PHI or PII, along with increased customer demands for enhanced data security infrastructure, could greatly increase our cost of providing our services, decrease demand for our services, reduce our revenue and/or subject us to additional liabilities.
The following legal and regulatory developments also could have a material adverse effect on our business, financial condition and results of operations:
|
· |
amendment, enactment, or interpretation of laws and regulations that restrict the access and use of personal information and reduce the supply of data available to clients; |
|
· |
changes in cultural and consumer attitudes to favor further restrictions on information collection and sharing, which may lead to regulations that prevent full utilization of our solutions; |
|
· |
failure of our solutions to comply with current laws and regulations; and |
|
· |
failure of our solutions to adapt to changes in the regulatory environment in an efficient, cost-effective manner. |
Changes in the United States healthcare environment, or in laws relating to healthcare programs and policies, and steps we take in anticipation of such changes, particularly as they relate to the Affordable Care Act and Medicare and Medicaid programs, could have a material adverse effect on our business, financial condition and results of operations.
The healthcare industry in the United States is subject to a multitude of changing political, economic and regulatory influences that affect every aspect of our healthcare system. The Affordable Care Act made major changes in how healthcare is delivered and reimbursed, and generally increased access to health insurance benefits to the uninsured and underinsured population of the United States. Among other things, the Affordable Care Act increased the number of individuals with Medicaid and private insurance coverage, implemented reimbursement policies that tie payment to quality, facilitated the creation of accountable care organizations that may use capitation and other alternative payment methodologies, strengthened enforcement of fraud and abuse laws and encouraged the use of information technology. However, many of these changes require implementing regulations which have not yet been drafted or have been released only as proposed rules. Moreover, it is possible that the Affordable Care Act will be repealed or restructured, or that implementation will be suspended under the current administration. Until the Affordable Care Act is fully implemented or there is more certainty concerning the future of the Affordable Care Act, it will be difficult to predict its full impact and influence on the healthcare industry. In addition, there have been and continue to be a number of legislative and regulatory initiatives to contain healthcare costs, reduce federal and state government spending on healthcare products and services and limit or restrict the scope of the Medicare RAC program and other program integrity initiatives.
We have made and intend to continue to make investments in personnel, infrastructure and product development, as well as in the overall expansion of the services that we offer to support existing and new clients as they implement the requirements of the Affordable Care Act. However, future changes to the Affordable Care Act and to the Medicare and Medicaid programs and other federal or state healthcare reform measures may lower reimbursement rates, establish new payment models, increase or decrease government involvement in healthcare, decrease the Medicare RAC program and otherwise change the operating environment for us and our clients. There have been judicial and Congressional challenges to certain aspects of the Affordable Care Act, and we expect there will be additional challenges and amendments to, or possibly repeal or restructure of the Affordable Care Act in the future. On
18
January 12, 2017, Congress voted in favor of a budget resolution to produce legislation that, if passed, would repeal certain aspects of the Affordable Care Act. Congress is also considering subsequent legislation to replace or repeal elements of or all of the Affordable Care Act. In addition, there have been recent public announcements by members of Congress and the new presidential administration regarding potential plans to repeal and replace all or a portion of the Affordable Care Act. If efforts to waive, modify, restructure or otherwise change or repeal the Affordable Care Act, in whole or in part, are successful, if we are unable to adapt our solutions to meet changing requirements or expand service delivery into new areas, or the demand for our solutions is reduced as a result of healthcare organizations’ reactions to changed circumstances and financial pressures, it could have a material adverse effect on our business, financial condition and results of operations.
Healthcare organizations may react to such changed circumstances and financial pressures, including those surrounding the implementation of the Affordable Care Act, by taking actions such as curtailing or deferring their retention of service providers like us, which could reduce the demand for our solutions and, in turn, have a material adverse effect on our business, financial condition and results of operations.
A significant portion of our revenue comes from a limited number of clients, and the loss of one or more of these clients could have a material adverse effect on our business, financial condition and results of operations.
We generate a significant portion of our revenue from a limited number of large clients. Our first-, second- and third-largest clients accounted for approximately 15%, 11% and 8% of our revenue for the year ended December 31, 2016. In addition, our ten largest clients, in the aggregate, accounted for approximately 59% of our revenue for the year ended December 31, 2016. The engagement between these clients and us generally is covered through a master services agreement with multiple separate statements of work, each with different and/or staggered terms, generally ranging from one to three years. In addition, we also rely on our reputation and recommendations from key clients to promote our solutions to potential new clients. Accordingly, if any of these clients fail to renew or terminate their existing contracts or their statements of work with us, or cease to provide us with statements of work under existing master services agreements, it could have a material adverse effect on our business, financial condition and results of operations.
Consolidation among healthcare payers or retailers could have a material adverse effect on our business, financial condition and results of operations.
The healthcare and retail industries have recently undergone significant consolidation and further consolidation could occur in the future. When companies consolidate, services provided by more than one provider may be consolidated and purchased from a single provider or they may renegotiate or not renew their existing contractual arrangements, which could lead to the loss of a client. Overlapping services that were previously purchased separately typically are purchased only once by the combined entity, resulting in loss of revenue for the service provider. If our clients merge with or are acquired by other entities that are not our clients, they may discontinue their use of our services or renegotiate the terms of our agreements. In addition, if an existing client of ours merges with or is acquired by a company that does not use payment accuracy solutions, we could lose our existing client, which could have a material adverse effect on our business, financial condition and results of operations.
The healthcare payment accuracy market is relatively new and unpenetrated, and if it does not develop or if it develops more slowly than we expect, it could have a material adverse effect on our business, financial condition and results of operations.
The healthcare payment accuracy market is relatively new and the overall market opportunity remains relatively unpenetrated. It is uncertain whether the healthcare payment accuracy market will achieve and sustain high levels of demand, client acceptance and market adoption. Our success will depend to a substantial extent on the willingness of our clients to use, and to increase the frequency and extent of their utilization of, our solutions, as well as on our ability to demonstrate the value of payment accuracy solutions to healthcare payers and government agencies. If our clients do not perceive the benefits of our solutions, then our market may not continue to develop, or it may develop more slowly than we expect. If any of these events occurs, it could have a material adverse effect on our business, financial condition and results of operations.
19
Negative publicity concerning the healthcare payment accuracy industry or patient confidentiality and privacy could limit the future growth of the healthcare payment accuracy market.
Our payment accuracy solutions help prevent and recover improper payments made to healthcare providers. As a result, healthcare providers and others have criticized the healthcare payment accuracy industry and have hired lobbyists to discredit the reported success that payment accuracy solutions have had in improving the accuracy of payments. Further, negative publicity regarding patient confidentiality and privacy could limit market acceptance of our healthcare solutions. Many consumer advocates, privacy advocates and government regulators believe that the existing laws and regulations do not adequately protect privacy. They have become increasingly concerned with the use of personal information. As a result, they are lobbying for further restrictions on the dissemination or commercial use of personal information to the public and private sectors. If healthcare providers, privacy advocates and others are successful in creating negative publicity for the healthcare payment accuracy industry, government and private healthcare payers could hesitate to contract with payment accuracy providers, such as us, which could have a material adverse effect on our reputation, business, financial condition and results of operations.
We face significant competition for our solutions and we expect competition to increase.
Competition among providers of healthcare payment accuracy solutions to U.S. healthcare insurance companies is strong and we may encounter additional competition as new competitors enter this area.
Our current healthcare solutions competitors include:
|
· |
other payment accuracy vendors, including vendors focused on discrete aspects of the healthcare payment accuracy process; |
|
· |
fraud, waste and abuse claim edit and predictive analysis companies; |
|
· |
primary claims processors; |
|
· |
numerous regional utilization management companies; |
|
· |
in-house payment accuracy capabilities; |
|
· |
Medicare RACs; and |
|
· |
healthcare consulting firms and other third party liability service providers. |
In addition, our competition for retail solutions consists of one main competitor, PRGX Global, Inc. and a number of smaller companies that do not have a material market share of the retail payment accuracy market.
Many of the payment accuracy solutions we provide may potentially be provided by competitors, and their success in attracting business or winning contract bids could adversely affect our business. In certain cases, our competitors and potential competitors have significantly greater resources and market recognition than we have and may be in a position to bundle services that compete with our product and services offerings, or may be able to devote greater resources to the sale of their services and to developing and implementing new and improved systems and solutions for the clients that we serve.
We cannot provide assurance that we will be able to compete successfully against existing or new competitors. In addition, we may be forced to lower our pricing or the demand for our solutions may decrease as a result of increased competition. Further, a failure to be responsive to our existing and potential clients’ needs could hinder our ability to maintain or expand our client base, hire and retain new employees, pursue new business opportunities, complete future acquisitions and operate our business effectively. Any inability to compete effectively could have a material adverse effect on our business, financial condition and results of operations.
20
If we are unable to protect our proprietary technology, information, processes and know-how, the value of our solutions may be diminished, which could have a material adverse effect on our business, financial condition and results of operations.
We rely significantly on proprietary technology, information, processes and know-how that are not subject to patent or copyright protection. We seek to protect this information through trade secret or confidentiality agreements with our employees, consultants, subcontractors or other parties, as well as through other security measures. These agreements and security measures may be inadequate to protect our intellectual property or other proprietary information or deter its misappropriation. Misappropriation of our intellectual property or other proprietary information by third parties, or any disclosure or dissemination of our business intelligence, queries, algorithms and other proprietary information by any means, could undermine competitive advantages we currently derive or may derive therefrom. Any of these situations could result in our expending significant time and incurring expense to enforce our intellectual property rights. Although we have taken measures to protect our proprietary rights, others may compete with our business by offering solutions or services that are substantially similar to ours. If the protection of our proprietary rights is inadequate to prevent unauthorized use or misappropriation by third parties or our employees, the value of our solutions, brand and other intangible assets may be diminished and competitors may be able to more effectively offer solutions that have the same or similar functionality as our solutions, which could have a material adverse effect on our business, financial condition and results of operations.
Our success depends on our ability to protect our intellectual property rights.
Our success depends in part on our ability to protect our proprietary software, confidential information and know-how, technology and other intellectual property and intellectual property rights. To do so, we rely generally on copyright, trademark and trade secret laws, confidentiality and invention assignment agreements with employees and third parties, and license and other agreements with consultants, vendors and clients. There can be no assurance that all of our employees, consultants, vendors and clients have executed such agreements or have not breached or will not breach their agreements with us, that we will have adequate remedies for any breach, or that our trade secrets will not otherwise become known or independently developed by competitors. Additionally, we monitor our use of open source software to avoid uses that would require us to disclose our proprietary source code or violate applicable open source licenses, but if we engaged in such uses inadvertently, we could be required to take remedial action or release certain of our proprietary source code. These scenarios could have a material adverse effect on our business, financial condition and results of operations. In addition, despite the protections we place on our intellectual property, a third party could, without authorization, copy or otherwise obtain and use our products or technology, or develop similar technology. In addition, agreement terms that address non-competition are difficult to enforce in many jurisdictions and might not be enforceable in certain cases.
Pursuant to our initial strategy regarding intellectual property protection, we currently hold one patent that does not apply to our current solutions. As we begin to pursue additional patents, we might not be able to obtain meaningful patent protection for our technology. In addition, if any additional patents are issued to us in the future, they might not provide us with any competitive advantages or might be successfully challenged by third parties.
We rely on unpatented proprietary technology. It is possible that others will independently develop the same or similar technology or otherwise obtain access to our unpatented technology. To protect our trade secrets and other proprietary information, we require employees, consultants, advisors and collaborators to enter into confidentiality agreements. We cannot assure you that these agreements will provide meaningful protection for our trade secrets, know-how or other proprietary information in the event of any unauthorized use, misappropriation, or disclosure of such trade secrets, know-how or other proprietary information. Further, the theft or unauthorized use or publication of our trade secrets and other confidential business information could reduce the differentiation of our services and harm our business, reduce the value of our investment in development or business acquisitions or result in third parties making claims against us related to losses of their confidential or proprietary information.
We rely on our trademarks, service marks, trade names and brand names to distinguish our services from the services of our competitors and have registered or applied to register many of these trademarks. We cannot assure you that our trademark applications will be approved. Third parties may also oppose our trademark applications, or otherwise challenge our use of the trademarks. In the event that our trademarks were successfully challenged, we could be forced to rebrand our services, which could result in loss of brand recognition and could require us to devote resources advertising and marketing new brands. Further, we cannot assure you that competitors will not infringe our trademarks
21
or that we will have adequate resources to enforce our trademarks. Additionally, if we expand our focus to the international payment accuracy market, there is no guarantee that our trademarks, service marks, trade names and brand names will be adequately protected.
Our ability to obtain, protect and enforce our intellectual property rights is subject to uncertainty as to the scope of protection, registerability, patentability, validity and enforceability of our intellectual property rights in each applicable jurisdiction, as well as the risk of general litigation or third party oppositions.
Existing U.S. federal and state intellectual property laws offer only limited protection. Moreover, if we expand our business into markets outside of the United States, our intellectual property rights may not receive the same degree of protection as they would in the United States because of the differences in foreign trademark and other laws concerning proprietary rights. Governments may adopt regulations, and government agencies or courts may render decisions, requiring compulsory licensing of intellectual property rights. When we seek to enforce our intellectual property rights we may be subject to claims that the intellectual property rights are invalid or unenforceable. Litigation may be necessary in the future to enforce our intellectual property rights and to protect our trade secrets. Litigation brought to protect and enforce our intellectual property rights could be costly, time consuming and distracting to management and could result in the impairment or loss of portions of our intellectual property rights. Furthermore, our efforts to enforce our intellectual property rights may be met with defenses, counterclaims and countersuits attacking the validity and enforceability of our intellectual property rights. Our inability to protect our proprietary technology against unauthorized copying or use, as well as any costly litigation or diversion of our management’s attention and resources, could delay further sales or the implementation of our solutions, impair the functionality of our solutions, delay introductions of new solutions, result in our substituting inferior or more costly technologies into our solutions, or have a material adverse effect on our business, financial condition and results of operations.
We are subject to extensive government regulation and our contracts with our clients are subject to governmental audit and investigation. Any violation of the laws and regulations applicable to us or a negative audit or investigation finding could have a material adverse effect on our business, financial condition and results of operations.
Much of our business is regulated by the federal government and the states in which we operate. The laws and regulations governing our operations generally are intended to benefit and protect individual citizens, including government program beneficiaries, health plan members and healthcare providers, rather than stockholders. The government agencies administering these laws and regulations have broad latitude to enforce them. These laws and regulations, along with the terms of our government contracts, regulate how we do business, what services we offer and how we interact with our clients, providers, other healthcare payers and the public. We are subject, on an ongoing basis, to various governmental reviews, audits and investigations to verify our compliance with our contracts and with applicable laws and regulations. Increased involvement by us in analytic or audit work that can have an impact on the eligibility of individuals for medical coverage or specific benefits could increase the likelihood and incidence of our being subjected to scrutiny or legal actions by parties other than our clients, based on alleged mistakes or deficiencies in our work, with significant resulting costs and strain on our resources.
In addition, because we receive payments from federal and state governmental agencies, we are subject to various laws, including the Federal False Claims Act and similar state statutes, which permit government law enforcement agencies to institute suits against us for violations and, in some cases, to seek double or treble damages, penalties and assessments. In addition, private citizens, acting as whistleblowers, can sue on behalf of the government under the “qui tam” provisions of the Federal False Claims Act and similar statutory provisions in many states.
The expansion of our operations into new products and services may further expose us to requirements and potential liabilities under additional statutes and legislative schemes that previously have not been relevant to our business, such as banking statutes, that may both increase demands on our resources for compliance activities and subject us to potential penalties for noncompliance with statutory and regulatory standards.
If the government discovers improper or illegal activities in the course of audits or investigations, we may be subject to various civil and criminal penalties and administrative sanctions, which may include termination of contracts, forfeiture of profits, suspension of payments, fines and suspensions and debarment from doing business with the government. Such risks, particularly under the Federal False Claims Act and similar state fraud statutes, have increased in recent years due to legislative changes that have (among other impacts) expanded the definition of a false claim to include, potentially, any unreimbursed overpayment received from, or other monetary debt owed to, a government
22
agency. If we are found to be in violation of any applicable law or regulation, or if we receive an adverse review, audit or investigation, any resulting negative publicity, penalties or sanctions could have an adverse effect on our reputation in the industry, cause clients to terminate their contracts with us or impair our ability to compete for new contracts and have a material adverse effect on our business, financial condition and results of operations.
Federal or state governments may limit or prohibit the outsourcing of certain services or functions, or may refuse to grant consents and/or waivers necessary to permit private entities, such as us, to perform certain elements of government programs or functions, such as healthcare claim auditing, or there may be state or federal limitations placed on the ability of the government to award contracts to private companies that use non-U.S. personnel, such as us, which could have a material adverse effect on our business, financial condition and results of operations.
Federal or state governments could limit or prohibit private contractors like us from operating or performing elements of certain government functions or programs. State or local governments could be required to operate such programs with government employees as a condition of receiving federal funding. Moreover, under current law, in order to privatize certain functions of government programs, the federal government must grant a consent and/or waiver to the petitioning state or local agency. If the federal government does not grant a necessary consent or waiver, the state or local agency will be unable to outsource that function to a private entity. Such a situation could eliminate a contracting opportunity or reduce the value of an existing contract.
In addition, the federal government and a number of states have considered laws and/or issued rules and orders that would limit, restrict or wholly prohibit the use of non-U.S. labor in performance of government contracts, or impose sanctions for the use of such resources. Some of our clients have already chosen to contractually limit or restrict our ability to use non-U.S. resources. We employ personnel and occasionally engage vendors located outside of the United States, and while we endeavor to only employ non-U.S. personnel and vendors where appropriate and permissible, any such limitations or restrictions could require us to repatriate work currently being done outside the U.S. or prevent us from having additional work done outside the United States, raise our costs of doing business, expose us to unexpected fines or penalties, increase the prices we must charge to clients to realize a profit and eliminate or significantly reduce the value of existing contracts or potential contract opportunities, any of which could have a material adverse effect on our business, financial condition and results of operations.
Our business depends on effective information processing systems that are compliant with current HIPAA transaction and code set standards and the integrity of the data in, and operations of, our information systems, as well as those of other entities that provide us with data or receive data from us.
Our ability to conduct our operations and accurately report our financial results depends on the integrity of the data in our information systems and the integrity of the processes performed by those systems. These information systems and applications require continual maintenance, upgrading and enhancement to meet our operational needs, satisfy client requests and handle and enable our expansion and growth. Despite our testing and quality control measures, we cannot be certain that errors or system deficiencies will not be found and that any necessary remediation can be done in a timeframe that is acceptable to our clients or that client relationships will not be impaired by the occurrence of errors or the need for remediation. In addition, implementation of upgrades and enhancements may cost more, take longer or require more testing than originally expected. Given the large amount of data we collect and manage, it is possible that hardware failures, errors or technical deficiencies in our systems could result in data loss or corruption or cause the information that we collect, utilize or disseminate to be incomplete or contain inaccuracies that our clients regard as significant.
Moreover, because many of the services we furnish to clients involve submitting high volumes of monetary claims to third parties and processing payments from them, the efficiency and effectiveness of our own operations are to some degree dependent on the claims processing systems of these third parties and their compliance with any new transaction and code set standards. Since October 1, 2015, health plans, commercial payers and healthcare providers have been required to transition to the new ICD-10 coding system, which greatly expands the number and detail of diagnosis codes used for inpatient, outpatient and physician claims. The transition to the new transaction and code set standard entailed time and expense, and it is possible that it could initially result in disruptions or delays as we and other affected parties, including clients make necessary system adjustments to be fully compliant and capable of exchanging data.
23
In addition, we may experience delays in processing claims and therefore earning our fees if the third parties with whom we work are not in full compliance with these new standards in the required timeframe. Claims processing systems failures, incapacities or deficiencies internal to these third parties could significantly delay or obstruct our ability to recover money for our clients, and thereby interfere with our performance under our contracts and our ability to generate revenue from those contracts in the timeframe we anticipate, which in turn could have a material adverse effect on our business, financial condition and results of operations.
Our services could become subject to new, revised or enhanced regulatory requirements in the future, which could result in increased costs, could delay or prevent our introduction of new solutions or could impair the function or value of our existing solutions, which could have a material adverse effect on our business, financial condition and results of operations.
The healthcare industry is highly regulated on the federal, state and local levels, and is subject to changing legislative, regulatory, political and other influences. Changes to existing laws and regulations, or the enactment of new federal and state laws and regulations affecting the healthcare industry, could create unexpected liabilities for us, could cause us or our clients to incur additional costs and could restrict our or our clients’ operations. Many healthcare laws are complex, subject to frequent change and dependent on interpretation and enforcement decisions from government agencies with broad discretion. The application of these laws to us or our clients, or to the specific services and relationships we have with our clients, is not always clear. In addition, federal and state legislatures periodically have considered or passed programs to reform or amend the U.S. healthcare system at both the federal and state level, such as the enactment of the Affordable Care Act. Our failure to anticipate accurately the application of these laws and similar or future laws and regulations, or our failure to comply with them, could create liability for us, result in adverse publicity and have a material adverse effect on our business, financial condition and results of operations.
Our services may become subject to new or enhanced regulatory requirements and we may be required to change or adapt our services in order to comply with these regulations. For example, the introduction of the ICD‑10 coding framework in 2015 presented challenges for our business, including requiring us to allocate resources to training and upgrading our systems. If we fail to successfully implement the ICD‑10 coding framework or other new regulatory requirements, it could adversely affect our ability to offer services deemed critical by our clients, which could have a material adverse effect on our business, financial condition and results of operations. New or enhanced regulatory requirements may render our solutions obsolete or prevent us from performing certain services. Further, new or enhanced regulatory requirements could impose additional costs on us, thereby making existing solutions unprofitable, and could make the introduction of new solutions more costly or time consuming than we anticipate, which could have a material adverse effect on our business, financial condition and results of operations.
We may be precluded from bidding on and/or performing certain work due to other work that we perform, which could have a material adverse effect on our business, financial condition and results of operations.
Various laws, regulations and administrative policies prohibit companies from performing work for government agencies in capacities that might be viewed as creating an actual or perceived conflict of interest. In particular, CMS has stringent conflict of interest rules, which limit our bidding for work that might conflict, or be perceived by CMS to conflict, with contractual work for CMS. State governments and managed care organizations also have conflict of interest restrictions that could limit our ability to bid for certain work. Conflict of interest rules and standards change frequently and are subject to varying interpretations and varying degrees and consistency of enforcement at the federal, state and municipal levels, and we cannot provide assurance that we will be successful in navigating these restrictions.
The expansion and diversification of our business operations increases the possibility that clients or potential clients will perceive conflicts of interest between our various subsidiaries, products, services, activities and client relationships. Such conflicts, whether real or perceived, could result in loss of contracts or require us to divest ourselves of certain existing business in order to qualify for new contract awards. We may be required to adjust our current management and personnel structure, as well as our corporate organization and entity structure, in order to appropriately mitigate conflicts and otherwise accommodate our needs as a company that is expanding in size and complexity. Our failure to devote sufficient care, attention and resources to managing these adjustments may result in technical or administrative errors that could expose us to potential liability or adverse regulatory action. If we are prevented from expanding our business due to real or perceived conflicts of interest, it could have a material adverse effect on our business, financial condition and results of operations.
24
We obtain a portion of our business through submitting responses to requests for proposals (“RFPs”). Future contracts may not be awarded through this process on the same level and we may not re-procure certain contracts.
In order to market our solutions to clients, we sometimes are required to respond to RFPs to compete for a contract. This requires that we accurately estimate our cost structure for servicing a proposed contract, the time required to establish operations and the likely terms of any proposals submitted by our competitors. We also must assemble and submit a large volume of information within a RFP’s rigid timetable. Our ability to provide timely and complete responses to RFPs will greatly impact our business. Should any part of our business suffer a negative event, for example, a client dispute or a government inquiry, we may be required to disclose the occurrence of that event in a RFP, which could impact our ability to win the contract at issue. We cannot provide assurance that we will continue to obtain contracts in response to RFPs, that we will be successful in reentering into contracts after they expire or that our proposals will result in profitable contracts. In addition, if we are unable to win particular contracts, we may be precluded from entering certain markets for a number of years. If we are unable to consistently win new contract awards or renew expiring contracts over any extended period, it could have a material adverse effect on our business, financial condition and results of operations.
If we fail to accurately estimate the factors upon which we base our contract pricing, we may generate less profit than expected or incur losses on those contracts, which could have a material adverse effect on our business, financial condition and results of operations.
Our client contracts are generally performance fee-based. We receive a fee for such contracts based on the payment inaccuracies that we prevent for our prospective solutions clients, or the recoveries received by our retrospective solutions and retail clients. Our ability to earn a profit on a performance fee contract requires that we accurately estimate the costs involved and outcomes likely to be achieved and assess the probability of completing multiple tasks and transactions within the contracted time period.
We derive a relatively small portion of our revenue on a “fee-for-service” basis whereby billing is based upon a flat fee or a fee per hour. To earn a profit on these contracts, we must accurately estimate costs involved and assess the probability of achieving certain milestones within the contracted time period. If we do not accurately estimate the costs and timing for completing projects, or if we encounter increased or unexpected costs, delays, failures, liabilities or risks, including those outside of our control, our contracts could prove unprofitable for us or yield lower profit margins than anticipated. Although we believe that we have recorded adequate provisions in our financial statements for losses on our fee-for-service contracts where applicable, as required under GAAP, we cannot provide assurance that our contract provisions will be adequate to cover all actual future losses. The inability to accurately estimate the factors upon which we base our contract pricing could have a material adverse effect on our business, financial condition and results of operations.
In addition, some of our client contracts guarantee that we will achieve certain performance levels. If we are unsuccessful in reaching these performance levels, we may have to provide the client with service credits or reduce our fees, which could have a material adverse effect on our business, financial condition and results of operations.
Our ability to execute on our business plans will be negatively impacted if we fail to properly manage our growth, which could have a material adverse effect on our business, financial condition and results of operations.
In recent years, our size and the scope of our business operations have expanded rapidly, particularly as a result of the Connolly iHealth Merger, and we expect that we will continue to grow and expand into new areas within the healthcare industry; however, such growth and expansion carries costs and risks that, if not properly managed, could have a material adverse effect on our business, financial condition and results of operations. To effectively manage our business plans, we must continue to improve our operations, while remaining competitive. We must also be flexible and responsive to our clients’ needs and to changes in the political, economic and regulatory environment in which we operate. The greater size and complexity of our expanding business puts additional strain on our administrative, operational and financial resources and makes the determination of optimal resource allocation more difficult. A failure to anticipate or properly address the demands that our growth and diversification may have on our resources and existing infrastructure may result in unanticipated costs and inefficiencies and could negatively impact our ability to execute on our business plans and growth goals, which could have a material adverse effect on our business, financial condition and results of operations.
25
We may be unable to successfully complete the integration of the Connolly and iHealth Technologies businesses and realize any synergies that we anticipate, which could have a material adverse effect on our business, financial condition and results of operations.
Our ability to achieve the anticipated benefits of the Connolly iHealth Merger and the success of our combined companies will depend in part upon whether we can complete the integration of the predecessor businesses in an effective and efficient manner. Our ability to integrate the predecessor businesses and realize the long-term synergies that we anticipate is subject to a number of uncertainties, many of which are related to conditions beyond our control, such as general economic trends, changes to regulations and competition. We may also encounter ongoing difficulties in effectively implementing our combined business plan and in implementing operational, accounting and technology policies, processes and systems for the combined business, in integrating the cultures of each of the predecessor businesses, in cross-selling our solutions to the existing clients of the predecessor businesses and in the impairment of acquired intangible assets, including goodwill. An inability to effectively deal with any of those difficulties in a timely and effective manner may result in our failing to fully realize the anticipated benefits of the Connolly iHealth Merger, including anticipated synergies, and could have a material adverse effect on our business, financial condition and results of operations. Further, the time and energy management has spent and will continue to spend in integrating Connolly and iHealth Technologies may divert the attention of management away from the core operations of the business.
If we do not successfully integrate future acquisitions or strategic partnerships that we may enter into, we may not realize the anticipated benefits of any such acquisitions or partnerships, which could have a material adverse effect on our business, financial condition and results of operations.
We expect to pursue future acquisitions in order to expand and diversify our business. We may also form strategic partnerships with third parties that we believe will complement or augment our existing business. We cannot, however, provide assurance that we will be able to identify any potential acquisition or strategic partnership candidates, consummate any additional acquisitions or enter into any strategic partnerships or that any future acquisitions or strategic partnerships will be successfully integrated or will be advantageous to us. Entities we acquire may not achieve the revenue and earnings we anticipate or their liabilities may exceed our expectations. We could face integration issues pertaining to the internal controls and operational functions of the acquired companies and we also could fail to realize cost efficiencies or synergies that we anticipated when selecting our acquisition candidates. Client dissatisfaction or performance problems with a particular acquired entity or resulting from a strategic partnership could have a material adverse effect on our reputation as a whole. We may be unable to profitably manage any acquired entities, or we may fail to integrate them successfully without incurring substantial expenses, delays or other problems. We may not achieve the anticipated benefits from any strategic partnerships we form.
If we fail to successfully integrate the businesses that we acquire or strategic partnerships that we enter into, we may not realize any of the benefits we anticipate in connection with the acquisitions or partnerships, which could have a material adverse effect on our business, financial condition and results of operations.
If we fail to maintain or upgrade our operational platforms, it could have a material adverse effect on our business, financial condition and results of operation.
We expect to make substantial investments in and changes to our operational platforms, systems and applications to compete effectively and keep up with technological advances. We may face difficulties in integrating any upgraded platforms into our current technology infrastructure. In addition, significant technological changes could render our existing solutions obsolete. Although we have invested, and will continue to invest, significant resources in developing and enhancing our solutions and platforms, any failure to keep up with technological advances or to integrate upgraded operational platforms and solutions into our existing technology infrastructure could have a material adverse effect on our business, financial condition and results of operations.
Our business, financial condition and results of operations could be adversely affected if the terms of our Medicare RAC program contracts are substantially changed or if Medicare seeks significant refunds under our original Medicare RAC program contract.
Historically, CMS has been a significant client. Net revenue under our Medicare RAC contract was $14.0 million, $18.5 million and $44.3 million for the years ended December 31, 2016, 2015 and 2014, respectively.
26
In February 2013, CMS began the reprocurement process for its Medicare RAC program contracts and issued a Request for Quote (“RFQ”). After a protest was filed by potential bidders on the terms of this initial RFQ, CMS issued a group of five new RFQs for the Medicare RAC program. The terms of these new RFQs were also protested by potential bidders, causing CMS to withdraw the new RFQs and resulting in further delays in the reprocurement process. In response to these delays, CMS allowed the current Medicare RAC contractors, including us, to continue active recovery auditing through July 29, 2016. Since this date, our activities under our Medicare RAC program contract have been limited to administrative matters, including collections, related to findings through July 29, 2016. Our existing Medicare RAC program contract, including any liability for appeals, ends on January 31, 2018.
In October 2016, CMS announced that we were awarded two Medicare RAC program contracts to provide retrospective payment accuracy services for Medicare Parts A and B (other than durable medical equipment, prosthetics, orthotics and supplies claims and home health and hospice claims). Pursuant to these awards, we are the Medicare RAC for Region 2 (Central U.S.) and Region 3 (Southeast U.S.). The new Medicare RAC program contracts have a one year initial term, with multiple one-year renewal options at the election of CMS. We do not yet know all of the terms of the new Medicare RAC program contracts but CMS has indicated that we may be able to request medical charts in the second quarter of 2017.
Under Medicare RAC program contracts, we are permitted to review only a small subset of CMS’s claims for potential payment inaccuracies. CMS exercises its discretion with respect to the number of claims and types of concepts that Medicare RAC contractors may audit. CMS has suspended the review of certain types of claims, and, effective October 1, 2015, shifted the responsibility for initial medical reviews for certain claims, many of which were profitable to us, to Quality Improvement Organizations. There can be no assurance that CMS will lift its suspension of such reviews and CMS may determine to restrict the types of claims its payment accuracy providers review even further. The continued suspensions of these reviews by the Medicare RACs, changes to the review strategies and any other changes to the Medicare RAC program could have a material impact on our future revenue.
On August 29, 2014, CMS announced that it would settle with hospitals willing to withdraw inpatient status claims currently pending in the Medicare RAC appeals process by offering to pay hospitals 68% for all eligible claims that they have billed to Medicare. On July 1, 2015, CMS issued a Technical Direction Letter to us and the other Medicare RACs indicating that we will only be entitled to the contract contingency fee on the settled amounts of the claims, or 32% of the original inpatient claim amounts. Based on the initial lists of finalized settlements provided by CMS, we would be required to refund CMS approximately $22.3 million in Medicare RAC contingency fees due to these adjustments, which is in excess of the amount we have accrued for these settlements. CMS further advised that as the hospital settlement project continues, additional settlement lists will be matched to Medicare RAC claims which may result in updated refund amounts to those initially provided. While there are uncertainties in any dispute resolution and results are uncertain, we have disputed CMS’s findings based on our interpretation of the terms of the Medicare RAC contract and our belief that the backup data provided by CMS is inaccurate and/or incomplete. In addition, on September 28, 2016, CMS announced a second settlement process to allow eligible providers to settle their inpatient status claims currently under appeal beginning December 1, 2016. This second settlement process could result in additional amounts owed to CMS. The amount of any such additional claims cannot presently be determined. Although we accrue an estimated liability for appeals based on the amount of fees that are subject to appeals, closures or other adjustments, which we estimate are probable of being returned to providers following a successful appeal, and we similarly accrue an allowance against accounts receivables related to fees yet to be collected, the impact of CMS’ settlement offer to hospitals remains uncertain. Our financial condition and results of operations could be adversely affected if we are required to return certain fees we have already been paid under our existing Medicare RAC contract, any final determination of amounts owed by us to CMS under the current Medicare RAC contract materially exceeds our estimated liability for appeals, or we are unable to collect fees for audits we have already performed. There could be a material adverse impact on our revenue, results of operations and cash flows if we are unable to obtain full payments for properly provided services, are required to repay a portion of prior fees associated with the hospital settlement program or if future fees payable to us by CMS are reduced.
Although we do not anticipate our Medicare RAC contract will represent a significant portion of our business going forward, our Medicare RAC contract with CMS still represents a future business opportunity for us. If our new Medicare RAC program contracts contain substantially different terms from our original contract, if the implementation of the new contracts is significantly delayed, if CMS fails to renew the new contracts at the end of any term, if CMS seeks significant refunds from us in connection with its settlement process, or if CMS imposes or implements other changes to the Medicare RAC program that materially reduce our revenue or profitability associated with the Medicare
27
RAC program, any such change, action or delay could have a material adverse effect on our business, financial condition and results of operations.
The U.S. government’s determination to award us a Medicare RAC contract may be challenged by an interested party. As a result, the Medicare RAC contract may be delayed or may never be implemented if such a challenge is successful, which could have a material adverse effect on our business, financial condition and results of operations.
The laws and regulations governing the procurement of goods and services by the U.S. government provide procedures by which other bidders and other interested parties may challenge the award of a government contract. If any such protests are filed, the government agency may decide to withhold a contract award or suspend performance under the contract while the protest is being considered, potentially delaying the start of the contract. If we are the original awardee of a protested contract, we could be forced to expend considerable funds to defend a potential award, while also incurring expenses to maintain our ability to timely start implementation in case the protest is resolved in our favor. In addition, a contract award may be terminated or the government agency may opt to solicit new bids and award a new contract if a protest is successful or the government agency chooses not to uphold its original award. We cannot provide assurance that we will prevail if a contract we have been awarded is protested. Extended implementation delays or successful challenges of our contract awards could have a material adverse effect on our business, financial condition and results of operations.
If we are not able to expand our retail business or reduce costs of implementing our retail solutions, revenue and profitability for our retail business could remain flat or decline, which could have a material adverse effect on our business, financial condition and results of operations.
The domestic retail payment accuracy market is a highly developed market with limited potential for growth. We have payment accuracy solution contracts with eight of the ten largest U.S. retailers and longer than ten year relationships with many of our top retail clients, which represents a significant share of the retail payment accuracy market and, therefore, the opportunity to grow our share of the existing domestic retail market is limited. In addition, some of our clients have an internal staff that reviews the transactions before we do. As the skills, experience and resources of our retail clients’ internal recovery staff improve, they will identify many overpayments themselves and reduce some of our opportunities to identify payment inaccuracies and generate related revenue. If we are not able to reduce the costs of implementing our payment accuracy solutions, our domestic retail business revenue may remain flat or decline, which could have a material adverse effect on our business, financial condition and results of operations.
Our client contracts generally contain provisions under which the client may terminate the use of our solutions prior to the completion of the agreement.
Many of our client contracts provide that the client may terminate the contract without cause prior to the end of the term of the agreement by providing us with relatively short prior written notice of the termination. As a result, the existence of contractual relationships with our clients is not an assurance that we will continue to provide our solutions to any of our clients through the entire term of their respective agreements. If clients representing a significant portion of our revenue terminated their agreements unexpectedly, we may not, in the short-term, be able to replace the revenue and income from such contracts and this could have a material adverse effect on our business, financial condition and results of operations. In addition, client contract terminations also could harm our reputation within the industry which could negatively impact our ability to obtain new clients.
Our recent rebranding may not be successful.
Beginning September 24, 2015, we launched a significant rebranding initiative to change our brand and corporate name to Cotiviti. There is no assurance that our rebranding initiative will be successful or result in a positive return on investment. In addition, while the Connolly and iHealth Technologies brand names had established themselves as premium brands in the payment accuracy market, we have virtually no operating history under the Cotiviti brand. We could be required to devote significant additional resources to advertising and marketing in order to increase the awareness of the Cotiviti brand. If we are unable to establish Cotiviti as a premium brand name in the payment accuracy market, or if we expend significant resources in an effort to do so, it could have a material adverse effect on our business, financial condition and results of operations.
28
We may be a party to litigation, regulatory actions or other dispute resolution proceedings. Adverse judgments or settlements in any of these proceedings could have a material adverse effect on our business, financial condition and results of operations.
We are subject and may be a party to lawsuits and other claims that arise from time to time in the ordinary course of our business. These may include lawsuits and claims related to, for example, contracts, subcontracts, protection of confidential information or trade secrets, wage and benefits, employment of our workforce or compliance with any of a wide array of state and federal statutes, rules and regulations that pertain to different aspects of our business. We also may be required to initiate expensive litigation or other proceedings to protect our business interests. In addition, because of the payments we receive from government clients, we may be subject to unexpected inquiries, investigations, legal actions or enforcement proceedings pursuant to the Federal False Claims Act, healthcare fraud, waste and abuse laws or similar legislation. Any investigations, settlements or adverse judgments stemming from such legal disputes or other claims may result in significant monetary damages or injunctive relief against us, as well as reputational injury that could adversely affect us. In addition, litigation and other legal claims are subject to inherent uncertainties and management’s view of currently pending legal matters may change in the future. Those uncertainties include, but are not limited to, costs of litigation, unpredictable judicial or jury decisions and the differing laws and judicial proclivities regarding damage awards among the states in which we operate. Unexpected outcomes in such legal proceedings, or changes in management’s evaluation or predictions of the likely outcomes of such proceedings (possibly resulting in changes in established reserves), could have a material adverse effect on our business, financial condition and results of operations.
We depend on many different entities to supply information. If we are unable to successfully manage our relationships with any of these suppliers, it may harm the quality and availability of our solutions, which could have a material adverse effect on our business, financial condition and results of operations.
We obtain data used in our solutions from many sources, including commercial insurance plans, financial institutions, managed care organizations, government entities and non-government entities. From time to time, challenges arise in managing and maintaining our relationships with entities that are not our clients and that furnish information to us pursuant to a combination of voluntary cooperation and legal obligation under laws and regulations that are often subject to differing interpretation. Our data suppliers may determine that some uses of data for our clients are not permitted by our agreements and seek to limit or end our access and use of certain data for particular purposes or clients. They may also make errors in compiling, transmitting or accurately characterizing data, or may have technological limitations that interfere with our receipt or use of the data we are relying upon them to provide. If a number of information sources or suppliers become unable or unwilling to provide us with certain data under terms of use that are acceptable to us and our clients, or if the applicable regulatory and law enforcement regime for use and protection of this data changes in a way that imposes unacceptable or unreasonable conditions or risks on us or disincentivizes our suppliers to continue to provide us with data, we cannot provide assurance that we will be able to obtain new agreements with alternative data suppliers on terms favorable to us, or at all. If we lose our data sources or access to certain data; are unable to identify and reach the requisite agreements with suitable alternative suppliers and integrate these data sources into our service offerings; or there is a lack of integrity of data that our suppliers provide, we could experience service disruptions, increased costs, reduced quality of our solutions and/or performance penalties under our client contracts, which could have a material adverse effect on our business, financial condition and results of operations.
We use software vendors, utility providers and network providers in our business and if they cannot deliver or perform as expected or if our relationships with them are terminated or otherwise change it could have a material adverse effect on our business, financial condition and results of operations.
Our ability to service our clients and deliver and implement solutions requires that we work with certain third party providers, including software vendors, utility providers and network providers, and depends on such third parties meeting our expectations in both timeliness and quality. We might incur significant additional liabilities if the services provided by these third parties do not meet our expectations, if they terminate or refuse to renew their relationships with us or if they were to offer their services to us on less advantageous terms, which could have a material adverse effect on our business, financial condition and results of operations. In addition, while there are backup systems in many of our operating facilities, an extended outage of utility or network services supplied by these vendors or providers could impair our ability to deliver our solutions, which could have a material adverse effect on our business, financial condition and results of operations.
29
Third parties may claim that we are infringing their intellectual property, and we could suffer significant litigation or licensing expenses or be prevented from selling certain solutions, which could have a material adverse effect on our business, financial condition and results of operations.
We could be subject to claims that we are misappropriating or infringing intellectual property or other proprietary rights of others. These claims, even if not meritorious, could be expensive to defend and divert management’s attention from our operations. If we become liable to third parties for infringing these rights, we could be required to pay a substantial damage award and develop non-infringing technology, cease using the solutions or providing the services that use or contain the infringing intellectual property or obtain a license. We may be unable to develop non-infringing solutions or obtain a license on commercially reasonable terms, or at all. We may also be required to indemnify our clients if they become subject to third party claims relating to intellectual property that we license or otherwise provide to them, which could be costly. If we are subject to claims of misappropriating or infringing the intellectual property or other proprietary rights of others, it could have a material adverse effect on our business, financial condition and results of operations.
Our results of operations are subject to significant fluctuations due to a variety of factors, some of which are outside of our control. As a result, you will not be able to rely on our results of operations in any particular period as an indication of our future performance.
Our results of operations may fluctuate and may fail to match our past or projected performance. Because we generally provide solutions under contracts that contain performance fee arrangements and generally recognize revenue only when our clients have received the economic value of the payment inaccuracies discovered using our solutions, we have experienced significant variations in our revenue between reporting periods due to the timing and delays in resolving these inaccuracies. We also occasionally face challenges in obtaining full payments for our properly provided solutions from clients and parties to whom we provide solutions, despite our right to prompt and full payment under the terms of our contracts.
Our revenue and results of operations also have been impacted from period to period as a result of a number of factors, including:
|
· |
number of payments reviewed and changes in scope of payments reviewed; |
|
· |
amount of inaccurate payments identified using our solutions and the amount of related recoveries; |
|
· |
the success of our cross-selling efforts; |
|
· |
fluctuations in sales activity given our lengthy sales cycle; |
|
· |
the commencement, completion or termination of contracts during any particular period; |
|
· |
expenses related to contracts that are incurred in periods prior to revenue being recognized; |
|
· |
the timing of government contract awards; |
|
· |
the time required to resolve bid protests related to government contract awards; |
|
· |
contract renewal discussions, which may result in delayed payments for previously provided services; |
|
· |
the intermittent timing of periodic revenue recovery projects, particularly for our retail clients; |
|
· |
non-recurring retail recovery projects; |
|
· |
technological and operational issues affecting our clients, including delays in payment receipt for previously recognized revenue due to delays in certain clients processing our findings through their systems; |
30
|
· |
adjustments to age/quality of receivables and accruals as a result of delays involving contract limitations and changes, subcontractor performance deficiencies or internal managerial decisions not to pursue identified claim revenue from clients; |
|
· |
seasonality in our business; and |
|
· |
regulatory changes or general economic conditions as they affect healthcare providers and payers and retailers. |
In addition, as we seek to expand the scope of solutions used by our existing clients, cross-sell our solutions to existing clients and introduce enhancements to our existing solutions or new solutions, we may not be able to accurately estimate the timing for implementing and completing contracts, making it difficult to reliably forecast revenue under those contracts. We cannot predict the extent to which future revenue variations could occur due to these or other factors. Consequently, our results of operations are subject to significant fluctuation and our results of operations for any particular quarter or fiscal year may not be indicative of results of operations for future periods.
Changes in, or interpretations of, tax rules and regulations may adversely affect our effective tax rates.
We have operations in many states within the United States as well as in Canada, the United Kingdom and India. Accordingly, we are subject to taxation in many jurisdictions with increasingly complex tax laws, the application of which can be uncertain.
Unanticipated changes in our tax rates could affect our future financial condition and results of operations. Our future effective tax rates could be unfavorably affected by changes in the tax rates in jurisdictions where our income is earned and taxed, by changes in, or our interpretation of, tax rules and regulations in the jurisdictions in which we do business, by increases in expenses not deductible for tax purposes including impairments of goodwill, by changes in GAAP or other applicable accounting standards or by changes in the valuation of our deferred tax assets and liabilities.
In addition, we are subject to periodic examination of our income tax returns by the U.S. Internal Revenue Service and other domestic and international tax authorities. Tax authorities in various jurisdictions may disagree with and subsequently challenge the amount of profits taxed in their state or country, which may result in increased tax liability, including accrued interest and penalties, which would cause our tax expense to increase. We regularly assess the likelihood of outcomes resulting from these examinations to determine the adequacy of our provision for income taxes and have reserved for potential adjustments that may result. There can be no assurance that the final determination of any of these examinations will not have a material adverse effect on our financial condition and results of operations.
Because we may expand the sales of our solutions to retail clients located outside of the United States, our business is susceptible to risks associated with international operations.
We maintain operations outside of the United States which we may expand in the future. Conducting and expanding international operations subjects us to new risks that we have not generally faced in the United States. These include:
|
· |
exposure to foreign currency exchange rate risk; |
|
· |
difficulties in collecting payments internationally and managing and staffing international operations; |
|
· |
establishing relationships with subcontractors and suppliers in international locations; |
|
· |
increased travel, infrastructure and legal compliance costs associated with international locations; |
|
· |
burdens of complying with a wide variety of laws associated with international operations, including data privacy and security, taxes and customs and intellectual property; |
|
· |
significant fines, penalties and collateral consequences if we fail to comply with anti-bribery laws; |
|
· |
heightened risk of improper, unfair or corrupt business practices in certain geographies; |
31
|
· |
potentially adverse tax consequences, including repatriation of earnings; |
|
· |
increased financial accounting and reporting burdens and complexities; |
|
· |
political, social and economic instability abroad, terrorist attacks and security concerns in general; and |
|
· |
reduced or varied protection for intellectual property rights in some countries. |
The occurrence of any one of these risks could negatively affect our international operations and, consequently, have a material adverse effect on our business, financial condition and results of operations.
We have operations and customer relationships outside of the United States and we could be materially adversely affected by violations of the FCPA and similar anti-bribery laws in non-U.S. jurisdictions.
The FCPA and similar anti-bribery laws in non-U.S. jurisdictions generally prohibit companies and their intermediaries from making improper payments to non-U.S. officials for the purpose of obtaining or retaining business. As we expand our international presence, we may operate in many parts of the world that have experienced governmental corruption and, in certain circumstances, strict compliance with anti-bribery laws may be at variance with local customs and practices. While our policies mandate compliance with these anti-bribery laws and we have training and compliance programs related to such laws, such policies, programs and our internal control policies and procedures may not protect us from reckless or criminal acts committed by our employees, subcontractors or agents. Violations of the FCPA or other anti-bribery laws, or allegations of such violations, could have a material adverse impact on our business, financial condition and results of operations.
We may not be able to realize the entire book value of goodwill and other intangible assets from the Connolly iHealth Merger or from other acquisitions.
As of December 31, 2016, we have $1,196.0 million of goodwill and $533.3 million of net intangible assets, primarily related to the Connolly iHealth Merger and from other acquisitions. We assess goodwill and other intangible assets for impairment at least annually and more frequently if certain events or circumstances warrant. In the event that the book value of goodwill or other intangible assets is impaired, any such impairment would be charged to earnings in the period of impairment. In the event that we determine that goodwill and other intangible assets are impaired in the future, it could have a material adverse effect on our business, financial condition and results of operations.
Our success may depend on the continued service and availability of key personnel.
Our success and future growth is dependent upon the ability of our executive officers, senior managers and other key personnel to operate and manage our business and execute on our growth strategies successfully. We cannot provide assurance that we will be able to continue to retain our executive officers, senior managers or other key personnel or attract additional key personnel. We may incur increased expenses in connection with the hiring, promotion, retention or replacement of any of these individuals. The loss of the services of any of our key personnel could have a material adverse effect on our business, financial condition and results of operations.
Our business is dependent on our ability to attract and retain qualified employees.
Our ability to operate our business and provide our solutions is dependent on our ability to recruit, employ, train and retain the skilled personnel who have relevant experience in the healthcare and retail industries as well as information technology professionals who can design, implement, operate and maintain complex information technology systems. For example, certain of our employees in our healthcare division must either have or rapidly develop a significant amount of technical knowledge with regard to medical insurance coding and procedures. In addition, certain of our retrospective claims accuracy solutions rely on a team of trained registered nurses or medical coding professionals to review medical information and provide feedback with respect to the medical appropriateness of care provided. Innovative, experienced and technologically proficient professionals, qualified nurses and experienced medical coding professionals are in great demand and are likely to remain a limited resource. Our ability to recruit and retain such individuals depends on a number of factors, including the competitive demands for employees having, or able to rapidly develop, the specialized skills we need and the level and structure of compensation required to hire and retain such employees. We may not be able to recruit or retain the personnel necessary to efficiently operate and support our
32
business. Even if our recruitment and retention strategies are successful, our labor costs may increase significantly. In addition, our internal training programs may not be successful in providing inexperienced personnel with the specialized skills required to perform their duties. If we are unable to hire, train and retain sufficient personnel with the requisite skills without significantly increasing our labor costs, it could have a material adverse effect on our business, financial condition and results of operations.
General economic, political and market forces and dislocations beyond our control could reduce demand for our solutions, which could have a material adverse effect on our business, financial condition and results of operations.
The demand for our solutions may be impacted by factors that are beyond our control, including macroeconomic, political and market conditions, the availability of short-term and long-term funding and capital, the level and volatility of interest rates, currency exchange rates and inflation. For example, the United States economy recently experienced periods of contraction and both the future domestic and global economic environments may continue to be less favorable than those of prior years. In addition, the United Kingdom electorate voted on June 23, 2016 to exit the European Union (which has popularly been referred to as “Brexit”), resulting in market volatility that may continue during the Brexit negotiation process. Any one or more of these factors may contribute to reduced activity and prices in the securities markets generally and could result in a reduction in demand for our solutions, which could have a material adverse effect on our business, results of operations and financial condition.
Risks Relating to Our Indebtedness
We are a holding company and rely on dividends, distributions and other payments, advances and transfers of funds from our subsidiaries to meet our obligations.
We are a holding company that does not conduct any business operations of our own. As a result, we are largely dependent upon cash dividends and distributions and other transfers from our subsidiaries to meet our obligations. The agreements governing the indebtedness of our subsidiaries impose restrictions on our subsidiaries’ ability to pay dividends or other distributions to us. The deterioration of the earnings from, or other available assets of, our subsidiaries for any reason also could limit or impair their ability to pay dividends or other distributions to us.
Our outstanding indebtedness could adversely affect our financial condition and our ability to operate our business, and we may not be able to generate sufficient cash flows to meet our debt service obligations.
On September 28, 2016, our subsidiary Cotiviti Corporation and certain other of our subsidiaries entered into the Restated Credit Agreement, pursuant to which the lenders party thereto agreed to provide the First Lien Credit Facilities consisting of the (a) First Lien Term A Loans in the original principal amount of $250.0 million, (b) the First Lien Term B Loans in the original principal amount of $550.0 million and (c) the $100.0 million Revolver, of which $25.0 million may, at our option, be made available for letters of credit and $20.0 million may, at our option, be made available for swingline loans. In connection with entering into the Restated Credit Agreement, we refinanced our previously outstanding Initial Secured Credit Facilities, comprising the Initial First Lien Credit Facilities and the Initial Second Lien Credit Facility.
As of December 31, 2016, we had $795.5 million outstanding principal amount under our First Lien Term Loans and availability under the Revolver of $99.5 million. Our outstanding indebtedness and any additional indebtedness we incur may have important consequences for us, including, without limitation, that:
|
· |
we may be required to use a substantial portion of our cash flow to pay the principal of and interest on our indebtedness; |
|
· |
our indebtedness and leverage may increase our vulnerability to adverse changes in general economic and industry conditions, as well as to competitive pressures; |
|
· |
our ability to obtain additional financing for working capital, capital expenditures, acquisitions and for general corporate and other purposes may be limited; |
|
· |
expose us to the risk of increased interest rates because certain of our borrowings, including and most significantly our borrowings under our First Lien Credit Facilities, are at variable rates of interest; |
33
|
· |
prevent us from taking advantage of business opportunities as they arise or successfully carrying out our plans to expand our business; and |
|
· |
our flexibility in planning for, or reacting to, changes in our business and our industry may be limited. |
Under the terms of the agreements governing our First Lien Credit Facilities, we are required to comply with specified financial and operating covenants, which may limit our ability to operate our business as we otherwise might operate it. For example, the obligations under the First Lien Credit Facilities may be accelerated upon the occurrence of an event of default, which includes customary events of default including, without limitation, payment defaults, cross-defaults to certain material indebtedness, covenant defaults, material inaccuracy of representations and warranties, bankruptcy events, material judgments, certain ERISA-related events, material defects with respect to guarantees and collateral, invalidity of subordination provisions and change of control. If not cured, an event of default could result in any amounts outstanding, including any accrued interest and unpaid fees, becoming immediately due and payable, which would require us to, among other things, seek additional financing in the debt or equity markets, refinance or restructure all or a portion of our indebtedness, sell selected assets and/or reduce or delay planned capital or operating expenditures. Such measures might not be sufficient to enable us to service our debt and any such financing or refinancing might not be available on economically favorable terms or at all. If we are not able to generate sufficient cash flows to meet our debt service obligations or are forced to take additional measures to be able to service our indebtedness, it could have a material adverse effect on our business, financial condition and results of operations.
Despite our substantial indebtedness, we and our subsidiaries may still be able to incur substantially more debt. This could further exacerbate the risks associated with our substantial leverage.
We may incur substantial additional indebtedness in the future. Although the agreements governing our First Lien Credit Facilities contain restrictions on the incurrence of additional indebtedness, these restrictions are subject to a number of qualifications and exceptions and the indebtedness we can incur in compliance with these restrictions could be substantial. For example, pursuant to incremental facilities under the First Lien Credit Facilities, we may incur up to (i) an aggregate amount of the greater of $230.0 million and 75.0% of Consolidated Adjusted EBITDA (as defined in the First Lien Credit Facilities) of additional secured or unsecured debt plus (ii) an unlimited additional amount of secured debt, subject to compliance with certain leverage-based tests, as described in the agreements governing our First Lien Credit Facilities. If we incur additional debt, the risks associated with our substantial leverage would increase.
Restrictive covenants in the agreements governing our First Lien Credit Facilities impose significant operating and financial restrictions on us that may restrict our ability to pursue our business strategies.
The agreements governing our First Lien Credit Facilities contain a number of restrictive covenants that impose significant operating and financial restrictions on us and may limit our ability to engage in acts that may be in our long-term best interests. These include covenants restricting, among other things, our ability to:
|
· |
incur additional indebtedness or other contingent obligations; |
|
· |
grant liens; |
|
· |
enter into certain agreements with negative pledge clauses or restrictions on subsidiary distributions; |
|
· |
pay dividends or other distributions from our subsidiaries to us; |
|
· |
make payments in respect of junior liens or subordinated debt; |
|
· |
make investments, acquisitions, loans and advances; |
|
· |
consolidate, merge, liquidate or dissolve; |
|
· |
sell, transfer or otherwise dispose of assets; |
|
· |
engage in sale-leaseback transactions; |
34
|
· |
engage in transactions with affiliates; |
|
· |
materially alter the business that we conduct; |
|
· |
modify organizational documents in a manner that is materially adverse to the lenders under the agreements governing our First Lien Credit Facilities; and |
|
· |
amend or otherwise change the terms of the documentation governing certain restricted debt. |
The Restated Credit Agreement contains a financial covenant that requires compliance with a secured leverage ratio test set at 5.50:1.00, with stepdowns to 5.25:1.00 and 5.00:1.00 after September 30, 2018 and September 30, 2019, respectively, as of the period of four consecutive fiscal quarters recently ended, on the last day of any fiscal quarter, commencing with the fiscal quarter ending December 31, 2016. Our ability to meet that financial ratio can be affected by events beyond our control and we cannot assure you that we will be able to meet that ratio. We were in compliance with this covenant as of December 31, 2016, but there can be no assurance that we will be in compliance with such covenant in the future.
A breach of any covenant or restriction contained in the agreements governing our First Lien Credit Facilities could result in a default under those agreements. If any such default occurs, the lenders under the First Lien Term Loans or Revolver may elect (after the expiration of any applicable notice or grace periods) to declare all outstanding borrowings, together with accrued and unpaid interest and other amounts payable thereunder, to be immediately due and payable, but in the case of a breach of the financial covenant, the holders of the First Lien Term B Loans may only exercise such rights after a majority of the lenders under the Revolver have terminated the commitments under the Revolver and accelerated the revolving loans thereunder, and the lenders holding a majority of the First Lien Term A Loans have accelerated the First Lien Term A Loans. The lenders under the First Lien Term Loans and Revolver also have the right upon an event of default thereunder to terminate any commitments they have to provide further borrowings. Further, following an event of default under the agreements governing our First Lien Credit Facilities, the lenders under the First Lien Term Loans and Revolver will have the right to proceed against the collateral granted to them to secure that debt. If the debt under the First Lien Term Loans or the Revolver was to be accelerated, our assets may not be sufficient to repay in full that debt or any other debt that may become due as a result of that acceleration.
We are dependent upon our lenders for financing to execute our business strategy and meet our liquidity needs. If our lenders are unable to fund borrowings under their credit commitments or we are unable to borrow, it could have a material adverse effect on our business, financial condition and results of operations.
During periods of volatile credit markets, there is risk that lenders, even those with strong balance sheets and sound lending practices, could fail or refuse to honor their legal commitments and obligations under existing credit commitments, including but not limited to extending credit up to the maximum permitted by the Revolver. If our lenders are unable to fund borrowings under their revolving credit commitments or we are unable to borrow, it could be difficult to obtain sufficient funding to execute our business strategy or meet our liquidity needs, which could have a material adverse effect on our business, financial condition and results of operations.
Our debt may be downgraded, which could adversely affect our ability to manage our operations and respond to changes in our business.
A decrease in the ratings that rating agencies assign to our short and long-term debt may negatively impact our access to the debt capital markets and increase our cost of borrowing, which could have a material adverse effect on our business, financial condition and results of operations.
Volatility and weakness in bank and capital markets may adversely affect credit availability and related financing costs for us.
Bank and capital markets can experience periods of volatility and disruption. If the disruption in these markets is prolonged, our ability to refinance, and the related cost of refinancing, some or all of our debt could be adversely affected. Although we currently can access the bank and capital markets, there is no assurance that such markets will continue to be a reliable source of financing for us. These factors, including the tightening of credit markets, could adversely affect our ability to obtain cost-effective financing. Increased volatility and disruptions in the financial markets
35
also could make it more difficult and more expensive for us to refinance outstanding indebtedness and obtain financing. In addition, the adoption of new statutes and regulations, the implementation of recently enacted laws or new interpretations or the enforcement of older laws and regulations applicable to the financial markets or the financial services industry could result in a reduction in the amount of available credit or an increase in the cost of credit. Disruptions in the financial markets can also adversely affect our lenders, insurers, customers and other counterparties. Any of these could result in a material adverse effect to our business, financial condition and results of operations.
Risks Relating to Ownership of Our Common Stock
The price of our common stock may be volatile and you could lose all or part of your investment.
Securities markets worldwide have experienced in the past, and are likely to experience in the future, significant price and volume fluctuations. This market volatility, as well as general economic, market or political conditions could reduce the market price of our common stock regardless of our results of operations. The trading price of our common stock may become highly volatile and could be subject to wide price fluctuations in response to various factors, including, among other things, the risk factors described herein and other factors beyond our control. Factors affecting the trading price of our common stock could include:
|
· |
market conditions in the broader stock market; |
|
· |
actual or anticipated variations in our quarterly financial and operating results; |
|
· |
developments in the healthcare industry in general or in the healthcare payment or claims processing markets in particular; |
|
· |
variations in operating results of similar companies; |
|
· |
introduction of new services by us, our competitors or our clients; |
|
· |
issuance of new, negative or changed securities analysts’ reports, recommendations or estimates; |
|
· |
investor perceptions of us and the industries in which we or our clients operate; |
|
· |
sales, or anticipated sales, of our stock, including sales by our officers, directors and significant stockholders; |
|
· |
additions or departures of key personnel; |
|
· |
regulatory or political developments; |
|
· |
the public’s response to press releases or other public announcements by us or third parties, including our filings with the SEC; |
|
· |
announcements, media reports or other public forum comments related to litigation, claims or reputational charges against us; |
|
· |
guidance, if any, that we provide to the public, any changes in this guidance or our failure to meet this guidance; |
|
· |
the sustainability of an active trading market for our common stock; |
|
· |
investor perceptions of the investment opportunity associated with our common stock relative to other investment alternatives; |
|
· |
other events or factors, including those resulting from system failures and disruptions, earthquakes, hurricanes, war, acts of terrorism, other natural disasters or responses to these events; |
36
|
· |
changes in accounting principles; |
|
· |
stock-based compensation expense under GAAP or other applicable accounting standards; |
|
· |
litigation and governmental investigations; and |
|
· |
changing economic conditions. |
These and other factors may cause the market price and demand for shares of our common stock to fluctuate substantially, which may limit or prevent investors from readily selling their shares of common stock and may otherwise negatively affect the liquidity of our common stock. In addition, in the past, when the market price of a stock has been volatile, holders of that stock sometimes have instituted securities class action litigation against the company that issued the stock. Securities litigation against us, regardless of the merits or outcome, could result in substantial costs and divert the time and attention of our management from our business, which could significantly harm our business, profitability and reputation.
We are controlled by Advent, whose interests may differ from those of our public stockholders.
We are controlled by Advent, which beneficially owns in the aggregate 64.7% of the combined voting power of our outstanding common stock as of December 31, 2016. As a result of this ownership, Advent has effective control over the outcome of votes on all matters requiring approval by our stockholders, including the election of directors, the adoption of amendments to our charter and bylaws, mergers, consolidations, acquisitions and other significant corporate transactions, and our winding up and dissolution.
In addition, persons associated with Advent currently serve on our Board. The interests of Advent may not always coincide with the interests of our other stockholders and the concentration of effective control in Advent will limit other stockholders’ ability to influence corporate matters. The concentration of ownership and voting power of Advent also may delay, defer or even prevent an acquisition by a third party or other change of control and may make some transactions more difficult or impossible without their support, even if such events are in the best interests of our other stockholders.
Further, Advent may have an interest in having us pursue acquisitions, divestitures, financing or other transactions, including, but not limited to, the issuance of additional debt or equity and the declaration and payment of dividends, that, in its judgment, could enhance Advent’s equity investments, even though such transactions may involve risk to us or to our creditors. Additionally, Advent may make investments in businesses that directly or indirectly compete with us, or may pursue acquisition opportunities that may be complementary to our business and, as a result, those acquisition opportunities may not be available to us.
Advent may take actions that our other stockholders do not view as beneficial, which may adversely affect our business, financial condition and results of operations and cause the value of your investment to decline.
Our directors and stockholders, with certain exceptions, do not have obligations to present business opportunities to us and may compete with us.
Our amended and restated certificate of incorporation provides that our directors and stockholders do not have any obligation to offer us an opportunity to participate in business opportunities presented to them even if the opportunity is one that we might reasonably have pursued (and therefore may be free to compete with us in the same business or similar businesses), and that, to the extent permitted by law, such directors and stockholders will not be liable to us or our stockholders for breach of any duty by reason of any such activities.
As a result, our directors and stockholders and their respective affiliates will not be prohibited from investing in competing businesses or doing business with our clients. Therefore, we may be in competition with our directors and stockholders or their respective affiliates, and we may not have knowledge of, or be able to pursue, transactions that could potentially be beneficial to us. Accordingly, we may lose certain corporate opportunities or suffer competitive harm, which could have a material adverse effect on our business, financial condition, results of operation or prospects.
37
We have elected to take advantage of the “controlled company” exemption to the corporate governance rules for publicly-listed companies, which could make our common stock less attractive to some investors or otherwise harm our stock price.
Because we qualify as a “controlled company” under the corporate governance rules for publicly-listed companies due to Advent’s majority ownership of our outstanding common stock, we are not required to have a majority of our Board be independent under the applicable rules of the NYSE, nor are we required to have a compensation committee or a nominating and corporate governance committee comprised entirely of independent directors. As permitted by our status as a controlled company, our Board has established a compensation committee and a nominating and corporate governance committee that is not comprised solely of independent members. In addition, we may choose to change our Board composition. Accordingly, should the interests of Advent differ from those of other stockholders, the other stockholders may not have the same protections afforded to stockholders of companies that are subject to all of the corporate governance rules for publicly-listed companies. Our status as a controlled company could make our common stock less attractive to some investors or otherwise harm our stock price.
Anti-takeover protections in our amended and restated certificate of incorporation, our amended and restated bylaws or our contractual obligations may discourage or prevent a takeover of our company, even if an acquisition would be beneficial to our stockholders.
Provisions contained in our amended and restated certificate of incorporation and amended and restated bylaws, as amended, as well as provisions of the DGCL, could delay or make it more difficult to remove incumbent directors or could impede a merger, takeover or other business combination involving us or the replacement of our management or discourage a potential investor from making a tender offer for our common stock, which, under certain circumstances, could reduce the market value of our common stock, even if it would benefit our stockholders.
In addition, our Board has the authority to cause us to issue, without any further vote or action by the stockholders, up to 50,000,000 shares of preferred stock, par value $0.001 per share, in one or more series, to designate the number of shares constituting any series, and to fix the rights, preferences, privileges and restrictions thereof, including dividend rights, voting rights, rights and terms of redemption, redemption price or prices and liquidation preferences of such series. The issuance of shares of preferred stock or the adoption of a stockholder rights plan may have the effect of delaying, deferring or preventing a change in control of our company without further action by the stockholders, even where stockholders are offered a premium for their shares.
In addition, under the Restated Credit Agreement, a “change of control” (as defined in the Restated Credit Agreement) would cause us to be in default and the lenders would have the right to terminate the commitments to provide loans under the Revolver and accelerate all outstanding loans, and if so accelerated, we would be required to repay all of our outstanding obligations under our First Lien Credit Facilities. From time to time we may enter into other contracts that contain change of control provisions that limit the value of, or even terminate, the contract upon a change of control. These change of control provisions may discourage a takeover of our company, even if an acquisition would be beneficial to our stockholders.
We have and will continue to incur increased costs and obligations as a result of being a public company.
As a publicly traded company, we have incurred and will continue to incur additional legal, accounting and other expenses that we were not required to incur in the past, and will incur additional expenses after we cease to be an emerging growth company (to the extent that we take advantage of certain exceptions from reporting requirements that are available to us as an emerging growth company under the JOBS Act). We are required to file with the SEC annual and quarterly information and other reports that are specified in Section 13 of the Exchange Act. We are also subject to other reporting and corporate governance requirements, including the requirements of the NYSE and certain provisions of the Sarbanes-Oxley Act and the regulations promulgated thereunder, which impose additional compliance obligations upon us. Among other things, as a public company:
|
· |
we prepare and distribute periodic public reports and other stockholder communications in compliance with our obligations under the federal securities laws and applicable NYSE rules; |
|
· |
the roles and duties of our Board and committees of the Board are expanded; |
38
|
· |
we comply with more comprehensive financial reporting and disclosure compliance functions; |
|
· |
we manage enhanced investor relations functions; and |
|
· |
we involve and retain to a greater degree outside counsel and accountants in the activities listed above. |
These changes require a commitment of additional resources and many of our competitors also comply with these obligations. We may not be successful in complying with these obligations in the future and the commitment of resources required for complying with them could adversely affect our business, financial condition and results of operations.
The changes necessitated by becoming a public company require a significant commitment of resources and management supervision that has increased and may continue to increase our costs and might place a strain on our systems and resources. As a result, our management’s attention might be diverted from other business concerns. If we fail to maintain an effective internal control environment or to comply with the numerous legal and regulatory requirements imposed on public companies, we could make material errors in, and be required to restate, our financial statements. Any such restatement could result in a loss of public confidence in the reliability of our financial statements and sanctions imposed on us by the SEC. If we are unable to satisfy our obligations as a public company, we could be subject to delisting of our common stock, fines, sanctions and other regulatory action and potentially civil litigation.
Our management team historically managed a private company and the transition to managing a public company presents new challenges.
Since our IPO in May 2016 we have been subject to various regulatory requirements, including those of the SEC and the NYSE. These requirements include record keeping, financial reporting and corporate governance rules and regulations. We have not historically had the resources typically found in a public company. Our internal infrastructure may not be adequate to support our increased reporting obligations, and we may be unable to hire, train or retain necessary staff and may be reliant on engaging outside consultants or professionals to overcome our lack of experience or employees. If our internal infrastructure is inadequate, we are unable to engage outside consultants or are otherwise unable to fulfill our public company obligations, it could have a material adverse effect on our business, financial condition and results of operations.
We are an “emerging growth company” and may elect to comply with reduced reporting requirements applicable to emerging growth companies, which could make our common stock less attractive to investors.
We are an emerging growth company and we may take advantage of certain exemptions from various reporting requirements that are applicable to other public companies that are not emerging growth companies, including, but not limited to, not being required to comply with the auditor attestation requirements of Section 404 of the Sarbanes-Oxley Act, reduced disclosure obligations regarding executive compensation in our periodic reports and proxy statements and exemptions from the requirements of holding a nonbinding advisory vote on executive compensation and stockholder approval of any golden parachute payments not previously approved. In addition, even if we choose to comply with certain of the greater obligations of public companies that are not emerging growth companies, we may avail ourselves of the reduced requirements applicable to emerging growth companies from time to time in the future. We cannot predict if investors will find our common stock less attractive if we choose to rely on these exemptions. If some investors find our common stock less attractive as a result, there may be a less active trading market for our common stock and our stock price may be more volatile.
We will remain an emerging growth company until December 31, 2021, or until the earliest of (i) the last day of the first fiscal year in which our annual gross revenue exceeds $1 billion, (ii) the date that we become a “large accelerated filer” as defined in Rule 12b-2 under the Exchange Act, which would occur if the market value of our common stock that is held by non-affiliates exceeds $700 million as of the last business day of our most recently completed second fiscal quarter, or (iii) the date on which we have issued more than $1 billion in non-convertible debt during the preceding three-year period, whether or not issued in a registered offering.
39
Our failure to maintain effective internal control over financial reporting in accordance with Section 404 of the Sarbanes-Oxley Act could have a material adverse effect on our business, financial condition and results of operations.
Section 404 of the Sarbanes-Oxley Act requires annual management assessments of the effectiveness of our internal control over financial reporting, starting with the second annual report that we file with the SEC as a public company, and generally requires in the same report a report by our independent registered public accounting firm on the effectiveness of our internal control over financial reporting. However, under the JOBS Act, our independent registered public accounting firm will not be required to attest to the effectiveness of our internal control over financial reporting pursuant to Section 404 of the Sarbanes-Oxley Act until we are no longer an emerging growth company. We could be an emerging growth company until December 31, 2021. Once we are no longer an emerging growth company, our independent registered public accounting firm will be required to attest to the effectiveness of our internal control over financial reporting on an annual basis. At such time, our independent registered public accounting firm may issue a report that is adverse in the event it is not satisfied with the level at which our controls are documented, designed or operating.
The rules governing the standards that must be met for our management to assess our internal control over financial reporting are complex and require significant documentation, testing and possible remediation and the incurrence of significant additional expenditures.
To comply with the requirements of being a public company, we have undertaken various actions, and may need to take additional actions, such as implementing new internal controls and procedures and hiring additional accounting or internal audit staff. In connection with the implementation of the necessary procedures and practices related to internal control over financial reporting, we may identify deficiencies that we may not be able to remediate in time to meet the deadline imposed by the Sarbanes-Oxley Act for compliance with the requirements of Section 404. In addition, we may encounter problems or delays in completing the implementation of any requested improvements and receiving a favorable attestation in connection with the attestation provided by our independent registered public accounting firm.
If we are unable to maintain adequate internal control over financial reporting, we may be unable to report our financial information accurately on a timely basis, may suffer adverse regulatory consequences or violations of applicable stock exchange listing rules, may breach the covenants under our credit facilities and incur additional costs. There could also be a negative reaction in the financial markets due to a loss of investor confidence in us and the reliability of our financial statements, which could have a material adverse effect on our business, financial condition and results of operations.
Because we do not intend to pay cash dividends in the foreseeable future, you may not receive any return on investment unless you are able to sell your common stock for a price greater than your purchase price.
We do not intend in the foreseeable future to pay any dividends to holders of our common stock. We currently intend to retain our future earnings, if any, for the foreseeable future, to repay indebtedness and to support our general corporate purposes. Therefore, you are not likely to receive any dividends on your common stock for the foreseeable future and the success of any investment in shares of our common stock will depend upon any future appreciation in their value. There is no guarantee that shares of our common stock will appreciate in value or even maintain the price at which investors have purchased their shares. The payment of future dividends, if any, will be at the discretion of our Board, subject to applicable law, and will depend on, among other things, our earnings, financial condition, capital requirements, level of indebtedness, statutory and contractual restrictions that apply to the payment of dividends and other considerations that our Board deems relevant. The agreements governing our First Lien Credit Facilities limit the amounts available to us to pay cash dividends, and, to the extent that we require additional funding, financing sources may prohibit the payment of a dividend. As a consequence of these limitations and restrictions, we may not be able to make the payment of dividends on our common stock.
If securities or industry analysts publish unfavorable research about our business, the price of our common stock and our trading volume could decline.
The trading market for our common stock depends in part on the research and reports that securities or industry analysts publish about us or our business and industry. If one or more of the analysts who cover us downgrade our
40
common stock or publish unfavorable research about our business, the price of our common stock likely would decline. If one or more of these analysts cease coverage of our company or fail to publish reports on us regularly, demand for our common stock could decrease, which might cause the price of our common stock and trading volume to decline.
Claims for indemnification by our directors and officers may reduce our available funds to satisfy successful third party claims against us and may reduce the amount of money available to us.
Our amended and restated certificate of incorporation and bylaws provide that we will indemnify our directors and officers, in each case, to the fullest extent permitted by Delaware law. Pursuant to our charter, our directors will not be liable to us or any stockholders for monetary damages for any breach of fiduciary duty, except (i) acts that breach his or her duty of loyalty to us or our stockholders, (ii) acts or omissions without good faith or involving intentional misconduct or knowing violation of the law, (iii) pursuant to Section 174 of the DGCL or (iv) for any transaction from which the director derived an improper personal benefit. The bylaws also require us, if so requested, to advance expenses that such director or officer incurred in defending or investigating a threatened or pending action, suit or proceeding, provided that such person will return any such advance if it is ultimately determined that such person is not entitled to indemnification by us. Any claims for indemnification by our directors and officers may reduce our available funds to satisfy successful third party claims against us and may reduce the amount of money available to us.
Our amended and restated certificate of incorporation provides, subject to certain exceptions, that the Court of Chancery of the State of Delaware will be the sole and exclusive forum for certain stockholder litigation matters, which could limit our stockholders’ ability to obtain a favorable judicial forum for disputes with us or our directors, officers, employees or stockholders.
Our amended and restated certificate of incorporation provides, subject to limited exceptions, that the Court of Chancery of the State of Delaware will, to the fullest extent permitted by law, be the sole and exclusive forum for (i) any derivative action or proceeding brought on our behalf; (ii) any action asserting a claim of breach of a fiduciary duty owed by any of our directors, officers or other employees to us or our stockholders; (iii) any action asserting a claim against us, any director or our officers or employees arising pursuant to any provision of the DGCL, our certificate or our amended and restated by-laws; or (iv) any action asserting a claim against us, any director or our officers or employees that is governed by the internal affairs doctrine. Any person or entity purchasing or otherwise acquiring any interest in shares of our capital stock shall be deemed to have notice of and to have consented to the provisions of our certificate described above. This choice of forum provision may limit a stockholder’s ability to bring a claim in a judicial forum that it finds favorable for disputes with us or any of our directors, officers, other employees or stockholders which may discourage lawsuits with respect to such claims. Alternatively, if a court were to find the choice of forum provision that will be contained in our certificate to be inapplicable or unenforceable in an action, we may incur additional costs associated with resolving such action in other jurisdictions, which could materially adversely affect our business, financial condition and results of operations.
Item 1B. Unresolved Staff Comments
None.
41
Our corporate headquarters is located at The Terraces South, 115 Perimeter Center Place, Suite 700, Atlanta, GA 30346. We do not own any of our facilities. As of the fiscal year ended December 31, 2016, we had the following leased facilities:
|
|
|
Number of |
|
|
Location |
|
Facilities: |
|
|
Connecticut |
|
3 |
|
|
Pennsylvania |
|
3 |
|
|
Georgia |
|
2 |
|
|
Massachusetts |
|
2 |
|
|
Texas |
|
2 |
|
|
Arkansas |
|
1 |
|
|
Illinois |
|
1 |
|
|
Kentucky |
|
1 |
|
|
Minnesota |
|
1 |
|
|
North Carolina |
|
1 |
|
|
Utah |
|
1 |
|
|
Washington, DC |
|
1 |
|
|
Non-U.S. Locations(1) |
|
6 |
|
|
(1) |
We lease one facility in Canada, two facilities in India, one facility in Switzerland and two facilities in the United Kingdom. |
We are subject to various legal proceedings and claims arising in the ordinary course of business. Our management currently does not expect that the results of any of these legal proceedings, either individually or in the aggregate, would have a material adverse effect on our financial position, results of operations or cash flows.
Item 4. Mine Safety Disclosures
Not applicable.
42
Item 5. Market for Registrant’s Common Equity, Related Stockholder Matters and Issuer Purchases of Equity Securities
Our common stock has traded on the NYSE under the symbol “COTV” since May 26, 2016. Prior to that time, there was no public market for our shares. As of December 31, 2016, there were 44 holders of record of our common stock. The actual number of stockholders is considerably greater than this number of record holders, and includes stockholders who are beneficial owners but whose shares are held in street name by brokers and other nominees. The following table sets forth for the periods indicated the high and low sales prices of our common stock on the NYSE.
|
Fiscal Year 2016: |
|
High |
|
Low |
|
||
|
Second Quarter (May 26, 2016 (first trading date after IPO) through June 30, 2016) |
|
$ |
21.47 |
|
$ |
17.00 |
|
|
Third Quarter (July 1, 2016 through September 30, 2016) |
|
$ |
34.36 |
|
$ |
20.65 |
|
|
Fourth Quarter (October 1, 2016 through December 31, 2016) |
|
$ |
36.44 |
|
$ |
29.19 |
|
On February 21, 2017, the closing price of our common stock on the NYSE was $37.04 per share.
Dividends
Prior to the consummation of our IPO, we paid a Special Cash Dividend of $150.0 million or $1.94 per share of common stock outstanding, to holders of record of our common stock on May 24, 2016. We do not currently intend to declare or pay any similar special dividends in the future and do not intend to pay cash dividends on our common stock in the foreseeable future. However, in the future we may change this policy and choose to pay dividends.
We are a holding company that does not conduct any business operations of our own. As a result, our ability to pay cash dividends on our common stock is dependent upon cash dividends and distributions and other transfers from our subsidiaries. The ability of our subsidiaries to pay dividends is currently restricted by the terms of our Restated Credit Agreement and may be further restricted by any future indebtedness we or our subsidiaries incur.
In addition, Delaware law may restrict our Board’s ability to declare dividends.
Recent Sales of Unregistered Securities
The following sets forth information regarding all unregistered securities sold by us in transactions that were exempt from the requirements of the Securities Act in the last three years:
|
· |
In January 2014, we granted options to purchase an aggregate of 61,000 shares of common stock at a strike price of $6.26 per share (as adjusted for stock split and Special Cash Dividend) to certain members of management and certain employees pursuant to the 2012 Plan. |
|
· |
In May 2014, in connection with the Connolly iHealth Merger, we issued to certain stockholders of iHealth Technologies a total of 5,271,622 shares of common stock in exchange for a pro rata equity interest in iHealth Technologies common stock. |
|
· |
In May 2014, in connection with the Connolly iHealth Merger, we issued to certain of our stockholders and members of management a total of 27,518,701 shares of common stock in exchange for $13.27 per share. |
|
· |
In September 2014, we granted options to purchase an aggregate of 1,704,950 shares of common stock at a strike price of $11.33 per share (as adjusted for stock split and Special Cash Dividend) to certain members of management and certain employees pursuant to the 2012 Plan. |
|
· |
In June 2015, we granted options to purchase an aggregate of 24,584 shares of common stock at a strike price of $11.33 per share (as adjusted for stock split and Special Cash Dividend) to a member of our Board pursuant to the 2012 Plan. |
43
|
· |
In November 2015, we granted options to purchase an aggregate of 1,948,844 shares of common stock at a strike price of $13.79 per share (as adjusted for stock split and Special Cash Dividend) to certain members of management and certain employees pursuant to the 2012 Plan. |
|
· |
In December 2015, we granted options to purchase an aggregate of 24,584 shares of common stock at a strike price of $13.79 per share (as adjusted for stock split and Special Cash Dividend) to a member of our Board pursuant to the 2012 Plan. |
The shares of common stock in all of the transactions listed above were issued or will be issued in reliance upon Section 4(a)(2) of the Securities Act or Rule 701 promulgated under Section 3(b) of the Securities Act as the sale of such securities did not or will not involve a public offering. The recipients of the securities in each of these transactions represented their intentions to acquire the securities for investment only and not with a view to or for sale in connection with any distribution thereof, and appropriate legends were placed upon the stock certificates issued in these transactions. All recipients had adequate access, through their relationships with us, to information about us.
Securities Authorized for Issuance Under Equity Compensation Plans
The information required is set forth in Item 12 of Part III of this Annual Report on Form 10-K.
Purchases of Equity Securities
None.
Item 6. Selected Historical Consolidated Financial Data
The following tables set forth our selected historical consolidated financial data for the periods as of the dates indicated. We derived the consolidated statement of operations data for the years ended December 31, 2016, 2015 and 2014 and the balance sheet data as of December 31, 2016 and 2015 from our audited consolidated financial statements included elsewhere in this Annual Report on Form 10-K.
On May 14, 2014, we acquired the stock of iHealth Technologies, resulting in the Connolly iHealth Merger. The results of operations of iHealth Technologies have been included in our consolidated financial statements as of and since the date of the Connolly iHealth Merger. As a result, the consolidated financial statements for periods prior to such date are not comparable to subsequent periods. For further details, see “Item 7, Management's Discussion and Analysis of Financial Condition and Results of Operations—Factors Affecting the Comparability of our Results of Operations—Connolly iHealth Merger,” and Note 1 to our consolidated financial statements included elsewhere in this Annual Report on Form 10-K.
44
Our historical results are not necessarily indicative of future operating results. You should read the information set forth below together with “Item 7, Management's Discussion and Analysis of Financial Condition and Results of Operations” and our consolidated financial statements and the related notes thereto included elsewhere in this Annual Report on Form 10-K.
|
|
|
For the Years Ended December 31, |
|
|||||||
|
(in thousands, except share and per share amounts) |
|
2016 |
|
2015 |
|
2014 |
|
|||
|
|
|
|
|
|
|
|
|
|
|
|
|
Consolidated Statement of Operations Data: |
|
|
|
|
|
|
|
|
|
|
|
Net revenue |
|
$ |
625,162 |
|
$ |
541,343 |
|
$ |
441,372 |
|
|
Cost of revenue |
|
|
251,768 |
|
|
204,617 |
|
|
179,088 |
|
|
Selling, general and administrative expenses |
|
|
156,684 |
|
|
136,745 |
|
|
92,537 |
|
|
Depreciation and amortization |
|
|
80,969 |
|
|
74,162 |
|
|
59,771 |
|
|
Transaction-related expenses |
|
|
1,788 |
|
|
1,469 |
|
|
5,745 |
|
|
Impairment of intangible assets |
|
|
— |
|
|
27,826 |
|
|
74,034 |
|
|
Operating income |
|
|
133,953 |
|
|
96,524 |
|
|
30,197 |
|
|
Other expense (income) |
|
|
64,131 |
|
|
68,819 |
|
|
72,826 |
|
|
Income tax expense (benefit) |
|
|
20,970 |
|
|
14,401 |
|
|
(16,804) |
|
|
Gain on discontinued operations, net of tax |
|
|
— |
|
|
(559) |
|
|
— |
|
|
Net income (loss) |
|
$ |
48,852 |
|
$ |
13,863 |
|
$ |
(25,825) |
|
|
Total earnings (loss) per share: |
|
|
|
|
|
|
|
|
|
|
|
Basic |
|
$ |
0.57 |
|
$ |
0.18 |
|
$ |
(0.40) |
|
|
Diluted |
|
$ |
0.55 |
|
$ |
0.18 |
|
$ |
(0.40) |
|
|
Weighted average shares outstanding: |
|
|
|
|
|
|
|
|
|
|
|
Basic |
|
|
85,053,890 |
|
|
77,216,133 |
|
|
65,253,954 |
|
|
Diluted |
|
|
88,578,192 |
|
|
77,641,388 |
|
|
65,253,954 |
|
|
|
|
December 31, |
|
||||
|
(in thousands) |
|
2016 |
|
2015 |
|
||
|
|
|
|
|
|
|
|
|
|
Consolidated balance sheet data: |
|
|
|
|
|
|
|
|
Cash and cash equivalents |
|
$ |
110,635 |
|
$ |
149,365 |
|
|
Total assets |
|
|
2,002,263 |
|
|
2,114,088 |
|
|
Total long-term debt(1) |
|
|
780,202 |
|
|
1,034,070 |
|
|
Total liabilities |
|
|
1,062,927 |
|
|
1,326,492 |
|
|
Working capital |
|
|
31,037 |
|
|
90,968 |
|
|
Total stockholders' equity |
|
|
939,336 |
|
|
787,596 |
|
|
(1) |
Includes the current portion of our long-term debt and is net of debt issuance costs. |
45
Item 7. Management’s Discussion and Analysis of Financial Condition and Results of Operations
The following is a discussion and analysis of our financial condition and results of operations as of, and for, the periods presented. You should read the following discussion and analysis of our financial condition and results of operations together with the sections entitled “Item 1A, Risk Factors,” “Cautionary note regarding forward-looking statements,” “Item 6, Selected Historical Consolidated Financial Data” and our Consolidated Financial Statements and related Notes thereto included elsewhere in this Annual Report on Form 10-K. The following discussion and analysis of our historical financial statements includes periods before the Connolly iHealth Merger. See “—Factors Affecting the Comparability of our Results of Operations.” As a result, our historical results of operations may not be comparable and may not be indicative of our future results of operations. In addition, this discussion and analysis contains forward-looking statements regarding the industry outlook, our expectations for the performance of our business, our liquidity and capital resources and the other non-historical statements. These forward-looking statements are subject to numerous risks and uncertainties, including but not limited to the risks and uncertainties described in “Item 1A, Risk Factors” and “Cautionary Note Regarding Forward-Looking Statements.” Our actual results may differ materially from those contained in or implied by these forward-looking statements.
Overview
We are a leading provider of analytics-driven payment accuracy solutions, focused primarily on the healthcare sector. Our integrated solutions help clients enhance payment accuracy in an increasingly complex healthcare environment. We leverage our robust technology platform, configurable analytics, proprietary information assets and expertise in healthcare reimbursement to help our clients enhance their claims payment accuracy. We help our healthcare clients identify and correct payment inaccuracies, which resulted in approximately $3.3 billion in savings in 2016. We work with over 40 healthcare organizations, including 20 of the 25 largest U.S. commercial, Medicare and Medicaid managed health plans, as well as CMS. We are also a leading provider of payment accuracy solutions to over 35 retail clients, including eight of the ten largest retailers in the United States. We operate in two segments, Healthcare and Global Retail and Other.
Our growth strategy for healthcare includes:
|
· |
expand within our existing client base by increasing the volume of claims we review with our solutions; expanding the utilization across the depth and breadth of solutions; and cross-selling our prospective and retrospective solutions; |
|
· |
expand our client base; |
|
· |
innovate to improve and develop new solutions to expand the scope of our services; and |
|
· |
pursue opportunistic acquisitions and strategic partnerships in payment accuracy and adjacent markets. |
As a result of the meaningful savings we deliver to our clients, we have increased our client base and strengthened our long-standing relationships with many of the leading healthcare payers in the United States. In 2016, we generated revenue from six new clients and four cross-sell clients which we believe will drive revenue growth in 2017 and beyond. The average length of our relationships with our ten largest healthcare clients is over ten years. We have also substantially increased the annual savings captured by our healthcare clients over time. As a result, we believe our revenue is highly recurring and we have strong visibility into future revenue.
We are also a leading provider of payment accuracy solutions to the retail market. Retailers process and validate extremely high volumes of transactions with disparate suppliers on varying terms. We work with retail clients in the United States, Canada and the United Kingdom to realize their negotiated allowances, concessions, rebates and other incentives associated with merchandise procurement, logistics and other service transactions. In 2016, we generated over $500 million in savings for our retail clients.
For a further discussion of our two operating segments, (i) Healthcare and (ii) Global Retail and Other, refer to “—Our Segments” and Note 17 to the Consolidated Financial Statements.
46
Our History
We were founded as Connolly in 1979 as a provider of payment accuracy solutions to the retail industry and launched our retrospective claims accuracy solutions to the healthcare industry in 1998. Connolly was acquired by the funds managed by Advent in 2012 (the “Advent Acquisition”). In May 2014, Connolly merged with iHealth Technologies, which was founded in 2001. At the time of the merger, Connolly was a leading provider of retrospective claims accuracy solutions to U.S. healthcare providers and retailers and iHealth Technologies was a leading provider of prospective claims accuracy solutions to U.S. healthcare providers. We rebranded our company as Cotiviti in September 2015.
Recent Developments
In 2016, total revenue increased 15% compared to 2015. Key drivers of our performance are as follows:
|
· |
Healthcare segment revenue increased 18% as we continued to execute on our strategy, increasing volume and expanding the adoption of our solutions within our existing healthcare clients for the year ended December 31, 2016 as compared to 2015. |
|
· |
Growth in our healthcare business has also benefitted from the addition of new clients and our successful cross-sell efforts. During the year ended December 31, 2016, we generated $18.2 million in revenue from six new clients added within the past year and from an additional four existing clients who have adopted either prospective or retrospective solutions. |
|
· |
During the second quarter 2016, we generated approximately $5.0 million in healthcare revenue from special projects that did not reoccur in the second half of the year. |
|
· |
The strengthening U.S. dollar has resulted in a negative impact on growth in our Global Retail and Other segment for the year ended December 31, 2016 as compared to 2015 due to our foreign operations in the United Kingdom and Canada. |
In addition, as a result of the early adoption during the third quarter 2016 of ASU 2016-09, Improvements to Employee Share-Based Payment Accounting, the exercise of stock options results in excess tax benefits directly impacting income tax expense. During the fourth quarter 2016, employees exercised approximately 500,000 stock options, which resulted in an excess tax benefit of $4.0 million and thereby contributed to the reduction in our effective tax rate for the year to 30.0%.
In October 2016, CMS announced that we were awarded two Medicare RACs to provide retrospective payment accuracy services for Medicare Parts A and B (other than durable medical equipment, prosthetics, orthotics, and supplies claims and home health and hospice claims). Pursuant to these awards we are the Medicare RAC for Region 2 (Central U.S.) and Region 3 (Southeast U.S.). The announcement represents the conclusion of CMS’s Medicare RAC reprocurement process. We do not yet know all of the terms of the new Medicare RAC program contracts but CMS has indicated that we may be able to request medical charts in the second quarter of 2017.
In September 2016, we refinanced our then outstanding Initial Secured Credit Facilities and entered into the Restated Credit Agreement. This refinancing lowered our interest rates applicable to our long-term debt. As a result of the refinancing, we recognized a loss on extinguishment of debt totaling $9.3 million during the year ended December 31, 2016.
In September 2016, the vesting criteria associated with outstanding performance-based stock options were satisfied, which resulted in approximately $15.9 million in stock-based compensation expense during the year ended December 31, 2016.
In May 2016, we launched our IPO, issuing 12,500,000 shares at $19.00 per share. Subsequently, in June 2016, the IPO underwriters partially exercised their option to purchase additional shares from us and we issued an additional 436,038 shares at the IPO price. We received net proceeds from our IPO after the underwriters’ discount and other offering expenses of approximately $227.0 million.
47
Also in June 2016, we repaid $223.0 million in outstanding principal under our then outstanding Initial Second Lien Credit Facility using the net proceeds from our IPO. We also made a voluntary prepayment of $13.1 million of outstanding principal under the Initial Second Lien Credit Facility. As a result of these payments, we recognized a loss on extinguishment of debt totaling $7.1 million during the year ended December 31, 2016.
In May 2016, we paid a Special Cash Dividend to pre-IPO shareholders of $150.0 million.
Factors Affecting Our Results of Operations
Dollar Amount of Claims Reviewed
Revenue in our Healthcare segment in a given period is impacted by the dollar amount of claims we review for our clients, which impacts inaccurate payments that we identify for our clients and the amount of revenue we receive under our performance fee-based contracts. The dollar amount of claims that we review is driven by the scope of claims submitted to us by our clients. The dollar amount of inaccurate payments we identify is also dependent upon the type and number of our solutions used by our clients. As a result of our long-standing relationships with our clients, we have a highly recurring revenue base.
The following table presents the dollar amount of claims reviewed in our Healthcare segment for the periods presented (in thousands):
|
|
|
|
|
|
|
|
|
|
|
|
||||
|
|
|
Year Ended |
|
|||||||||||
|
|
|
December 31, |
|
|||||||||||
|
|
|
2016 |
|
2015 |
|
2014 |
|
|||||||
|
Amount of claims/payments reviewed by our retrospective claims accuracy solutions(1)(2) |
|
$ |
485,831,730 |
|
$ |
442,280,513 |
|
$ |
387,899,243 |
|
||||
|
Amount of claims/payments reviewed by our prospective claims accuracy solutions(2) |
|
$ |
75,995,140 |
|
$ |
65,504,316 |
|
$ |
51,418,642 |
|
||||
|
(1) |
Excludes our Medicare RAC contract, for which we do not track the dollar amount of claims reviewed. |
|
(2) |
Amounts of claims/payments reviewed for prior periods are reported on a rolling basis. Accordingly, amounts reflected for prior periods are subject to change. |
In our Global Retail and Other segment, our revenue is dependent on (i) the amount of payments that we review for our retail clients and (ii) the timing of our payment reviews, which typically are completed on a batch processing basis following the lapse of a period of time after payment. We do not track the dollar amount of claims reviewed in our Global Retail and Other segment.
Healthcare Industry and General Economic Conditions
A majority of our business is directly related to the healthcare industry and is affected by healthcare spending and complexity in the healthcare industry, as follows:
|
· |
Healthcare Spending by Payers. Changing demographics, the shift to managed care plans within government healthcare and increased healthcare coverage may lead to an increase in healthcare spending by our payer clients. From 2004 to 2014, healthcare costs in the United States grew at a 4.8% CAGR to $3.0 trillion and increased 5.8% in 2015 to $3.2 trillion. According to CMS, healthcare costs are expected to continue to grow at an average annual rate of 5.6% through 2025. Our revenue is impacted by the expansion or contraction of healthcare coverage and spending, which directly affects the number of payments available for our review. |
|
· |
Complexity in the Healthcare Industry. We believe that reimbursement models will continue to become more complex as healthcare payers accommodate new markets and lines of business and as advancements in medical care increase the number of testing and treatment options available. The adoption of the ICD-10 coding framework in October 2015 has resulted in a nearly five times increase of possible diagnosis codes to approximately 68,000, further complicating the claims process. As reimbursement models grow more complex and healthcare coverage increases, the complexity and number of claims may also increase, which could impact the demand for our payment accuracy solutions. Also, many of the changes promulgated by the Affordable |
48
Care Act, which may be repealed or restructured under the current administration, require implementing regulations that have not yet been drafted or have been released only as proposed rules. Such changes could have a further impact on our results of operations. |
In addition, our Global Retail and Other segment is impacted by general economic conditions. For example, in a difficult economy, consumers may be willing to spend less and retailers may reduce their purchasing accordingly, thereby reducing their overall payments available for review. Alternatively, in an expanding economy, retailers may increase their purchasing to meet expected increasing demand resulting in increased payments subject to review using our solutions.
Components of Results of Operations
Net revenue
Our net revenue is generated from contracts with our clients. Our client contracts generally provide for performance fees that are based on a percentage of the inaccurate payments that we prevent through our prospective claims accuracy solutions or the payment recoveries received by our clients that use our retrospective claims accuracy solutions. We derive less than 3% of our revenue on a “fee-for-service” basis whereby billing is based upon a flat fee or a fee per hour. Our clients may request a refund or offset if their providers or vendors ultimately reject the payment inaccuracies we find or if our clients determine not to pursue reimbursement from their providers or vendors even though we may have collected fees. We record an estimate for refund liabilities at any given time based on actual historical refund data by client type. In such cases, we record any such refund as a reduction of revenue. See “—Critical Accounting Policies—Revenue Recognition, Unbilled Receivables and Estimated Liability for Refunds and Appeals.”
Historically, there has been a seasonal pattern to our healthcare revenue with the revenues in the first quarter generally lower than the other quarters and revenues in the fourth quarter generally being higher than the other quarters. Accordingly, the comparison of revenue from quarter to quarter may fluctuate and is dependent on various factors, including, but not limited to, reset of member liability, timing of special projects and timing of inaccurate payments being prevented or recovered as well as the aforementioned seasonal considerations. Consequently, you should not rely on our revenue for any one quarter as an indication of our future performance.
Cost of revenue
Our cost of revenue is comprised of:
|
· |
Compensation, which includes the total compensation and benefit-related expenses, including stock-based compensation expense, for employees who provide direct revenue generating services to clients; and |
|
· |
Other costs of revenue, which primarily include expenses related to the use of subcontractors and professional services firms, costs associated with the retrieval of medical records and facilities-related costs associated with locations that are used strictly for revenue generating activities. Cost of revenue does not include depreciation and amortization, which is stated separately in our consolidated statement of operations. |
Selling, general and administrative expenses
Our selling, general and administrative expenses are comprised of:
|
· |
Compensation, which includes total compensation and benefit-related expenses, including stock-based compensation expense, for our employees who are not directly involved in revenue generating activities including those involved with developing new service offerings; and |
|
· |
Other selling, general and administrative expenses, which include all of our general operating costs. These costs include, but are not limited to, rent and occupancy costs for facilities associated with locations that are used for employees not serving in revenue generating roles, telecommunications costs, information technology infrastructure costs, software licensing costs, advertising and marketing expenses, costs associated with developing new service offerings and expenses related to the use of certain subcontractors and professional services firms. Selling, general and administrative expenses do not include depreciation and amortization, |
49
which is stated separately in our consolidated statement of operations. |
We incur significant legal, accounting and other expenses associated with being a public company, including costs associated with our compliance with the Sarbanes-Oxley Act.
Depreciation and amortization of property and equipment
Depreciation and amortization of property and equipment consists of depreciation related to our investments in property and equipment, including claims accuracy solutions software, as well as amortization of capitalized internal-use software and software development costs.
Amortization of intangible assets
Amortization of intangible assets includes amortization of customer relationships, acquired software and certain trademarks.
Transaction-related expenses
Transaction-related expenses consist primarily of professional services associated with the Connolly iHealth Merger, expenses associated with the preparation for our IPO and other offerings as well as certain expenses associated with corporate development activity.
Impairment of intangible assets
Impairment of intangible assets results from when the carrying value of certain intangible assets exceeds their fair value. We incurred an impairment of a customer relationship asset in 2014 and of certain trademarks in 2015.
Interest expense
Interest expense consists of accrued interest and related payments on our outstanding long-term debt as well as the amortization of debt issuance costs. Additionally, interest expense includes any effective portion of realized interest rate hedging derivative gains and losses previously recorded in accumulated other comprehensive (loss) income when the actual interest payments are made on our variable rate debt and the related derivate contract settles. See “—Credit Facilities.”
Loss on extinguishment of debt
Loss on extinguishment of debt consists of fees paid and write-offs of unamortized debt issuance costs and original issue discount in connection with the 2014 refinancings, 2015 repricing of our long-term debt, the 2016 early repayment of a portion of our long-term debt and the 2016 refinancing of our long-term debt.
Other non-operating (income) expense
Other non-operating (income) expense primarily consists of foreign exchange gains and losses. In addition, income received for certain sub-leases, interest income and realized gains and losses, interest and dividends on available-for-sale securities are included in other non-operating (income) expense.
Income tax expense (benefit)
Income tax expense (benefit) consists of federal, state, local and foreign taxes based on earnings in multiple jurisdictions. Our income tax expense is impacted by the pre-tax earnings in jurisdictions with varying tax rates and any related foreign tax credits or deductions that may be available to us. Our current and future provision for income taxes will vary from statutory rates due to the impact of income tax incentives and holidays, certain non-deductible expenses, valuation allowances in certain countries, withholding taxes, excess tax benefits on the exercise of stock options and other discrete items.
50
Stock-based compensation expense
We grant equity incentive awards to certain employees, officers and non-employee directors as long-term incentive compensation. We recognize the related expense for these awards ratably over the applicable vesting period. Such expense is recognized in either cost of revenue or selling, general and administrative expenses based upon the function of the optionee. The following table shows the allocation of stock-based compensation expense among our expense line items for the periods presented (in thousands):
|
|
|
Year Ended |
|
|||||||
|
|
|
December 31, |
|
|||||||
|
|
|
2016 |
|
2015 |
|
2014 |
|
|||
|
|
|
|
|
|
|
|
|
|
|
|
|
Cost of revenue |
|
$ |
5,026 |
|
$ |
963 |
|
$ |
630 |
|
|
Selling, general and administrative expenses |
|
|
17,928 |
|
|
2,436 |
|
|
1,862 |
|
|
Total |
|
$ |
22,954 |
|
$ |
3,399 |
|
$ |
2,492 |
|
As of December 31, 2016, we had total unrecognized stock-based compensation expense related to unvested service-based awards of $13.3 million, which we expect to recognize over the next 3.1 years. Stock-based compensation expense for the year ended December 31, 2016 includes approximately $15.9 million as a result of the vesting of performance awards, of which approximately $3.9 million is included in cost of revenue above and the remaining $12.0 million is included in selling, general and administrative expenses above. Additionally, for the year ended December 31, 2016, stock-based compensation expense included in selling, general and administrative expenses includes approximately $2.3 million related to the accelerated vesting of certain stock options as the result of our IPO.
Foreign currency translation adjustments
The assets and liabilities of our foreign subsidiaries with a functional currency other than the U.S. Dollar are translated into U.S. Dollars using applicable exchange rates at the balance sheet date. Revenue and expenses are translated at average exchange rates effective during the year. The resulting foreign currency translation gains and losses are included as a component of other comprehensive (loss) income. We had downward foreign currency translation adjustments of $0.9 million, $0.7 million and $1.3 million for the years ended December 31, 2016, 2015 and 2014, respectively. The downward translation adjustments were the result of the strengthening of the U.S. Dollar against the Canadian Dollar and British Pound over the corresponding period.
Change in fair value of derivative instruments, net of related taxes
We are a party to interest rate cap agreements that hedge the potential impact fluctuations in interest rates may have on payments we make pursuant to our long-term debt. We had a downward net change in fair value of derivative instruments, net of related taxes of approximately $0.4 million, $2.3 million and $0.6 million for the years ended December 31, 2016, 2015 and 2014, respectively. The downward changes were the result of fluctuations in three-month LIBOR.
How We Assess Our Performance
Adjusted EBITDA
We believe Adjusted EBITDA (a non-GAAP measure) is useful to investors as a supplemental measure to evaluate our overall operating performance. Management uses Adjusted EBITDA as a measurement to compare our operating performance to our peers and competitors. We define Adjusted EBITDA as net income (loss) before depreciation and amortization, impairment of intangible assets, interest expense, other non-operating (income) expense such as foreign currency translation, income tax expense (benefit), gain on discontinued operations, transaction-related expenses and other, stock-based compensation and loss on extinguishment of debt. See the notes to our consolidated financial statements included elsewhere in this Annual Report on Form 10-K for additional information regarding these adjustments. Management believes Adjusted EBITDA is useful because it provides meaningful supplemental information about our operating performance and facilitates period-to-period comparisons without regard to our financing methods, capital structure or other items that we believe are not indicative of our ongoing operating performance. By providing this non-GAAP financial measure, management believes we are enhancing investors' understanding of our business and our results of operations, as well as assisting investors in evaluating how well we are
51
executing our strategic initiatives. Management believes that Adjusted EBITDA is frequently used by securities analysts, investors and other interested parties as a supplemental measure of financial performance within our industry. In addition, the determination of Adjusted EBITDA is consistent with the definition of a similar measure in our First Lien Credit Facilities other than adjustments for severance costs and non-income based taxes permitted by the First Lien Credit Facilities but not considered by management in evaluating our performance using Adjusted EBITDA.
Adjusted EBITDA has important limitations as an analytical tool and you should not consider it in isolation
or as a substitute for analysis of our results as reported under GAAP. Some of these limitations are:
|
· |
Adjusted EBITDA does not reflect our cash expenditures or future requirements for capital expenditures or contractual commitments; |
|
· |
Adjusted EBITDA does not reflect changes in, or cash requirements for, our working capital needs; |
|
· |
Although depreciation is a non-cash charge, the assets being depreciated will often have to be replaced in the future, and Adjusted EBITDA does not reflect any cash requirements for such replacements; |
|
· |
Adjusted EBITDA does not reflect the impact of stock-based compensation upon our results of operations; |
|
· |
Adjusted EBITDA does not reflect the significant interest expense, or the cash requirements necessary to service interest or principal payments on our debt; |
|
· |
Adjusted EBITDA does not reflect our income tax expense (benefit) or the cash requirements to pay our |
income taxes; and
|
· |
Other companies in our industry may calculate Adjusted EBITDA differently than we do, limiting its |
usefulness as a comparative measure.
In evaluating Adjusted EBITDA, you should be aware that in the future we may incur expenses similar to those eliminated in this presentation.
The following table presents a reconciliation of Adjusted EBITDA to net income (loss), the most directly comparable GAAP measure, for the periods presented:
|
|
|
|
|
|
|
|
|
|
|
|
|
|
|
Year Ended |
|
|||||||
|
|
|
December 31, |
|
|||||||
|
|
|
2016 |
|
2015 |
|
2014 |
|
|||
|
(in thousands) |
|
|
|
|||||||
|
Net income (loss) |
|
$ |
48,852 |
|
$ |
13,863 |
|
$ |
(25,825) |
|
|
Depreciation and amortization |
|
|
80,969 |
|
|
74,162 |
|
|
59,771 |
|
|
Impairment of intangible assets(a) |
|
|
— |
|
|
27,826 |
|
|
74,034 |
|
|
Interest expense |
|
|
48,653 |
|
|
65,561 |
|
|
51,717 |
|
|
Other non-operating (income) expense(b) |
|
|
(939) |
|
|
(826) |
|
|
(415) |
|
|
Income tax expense (benefit) |
|
|
20,970 |
|
|
14,401 |
|
|
(16,804) |
|
|
Gain on discontinued operations, net of tax(c) |
|
|
— |
|
|
(559) |
|
|
— |
|
|
Transaction-related expenses and other(d) |
|
|
1,788 |
|
|
1,469 |
|
|
5,745 |
|
|
Stock-based compensation(e) |
|
|
22,954 |
|
|
3,399 |
|
|
2,492 |
|
|
Loss on extinguishment of debt(f) |
|
|
16,417 |
|
|
4,084 |
|
|
21,524 |
|
|
Adjusted EBITDA |
|
$ |
239,664 |
|
$ |
203,380 |
|
$ |
172,239 |
|
|
(a) |
Represents a $27,826 impairment charge during the year ended December 31, 2015 as a result of our rebranding and the related impact to our trademarks. Also represents a $74,034 impairment charge for the year ended December 31, 2014 due to the change in estimated fair value of our customer relationship intangible asset related to our Medicare RAC contract. Refer to the notes to our consolidated financial statements included elsewhere in this Annual Report on Form 10-K for further discussion. |
52
|
(b) |
Represents other non‑operating (income) expense that consists primarily of gains and losses on transactions settled in foreign currencies. Income received for certain sub‑leases is included herein. |
|
(c) |
Represents payment on a $900 note receivable ($559 net of taxes) related to a business that was disposed of in 2012. This note receivable had been reported in the loss on discontinued operations in 2012 upon the sale of that business. Since the date of sale, we had elected to fully reserve the note receivable as the collectability was determined to be uncertain. |
|
(d) |
Represents transaction‑related expenses that consist primarily of professional services associated with the Connolly iHealth Merger in 2014, certain expenses associated with the preparation for our IPO and other offering costs as well as certain corporate development activity in 2015 and 2016. |
|
(e) |
Represents expense related to stock‑based compensation awards granted to certain employees, officers and non‑employee directors as long‑term incentive compensation. We recognize the related expense for these awards ratably over the vesting period. During the year ended December 31, 2016, performance awards vested resulting in stock compensation expense of $15,898. |
|
(f) |
Represents loss on extinguishment of debt that consists primarily of fees paid and write‑offs of unamortized debt issuance costs and original issue discount in connection with the refinancings of our long-term debt in 2014, the repricing of our long‑term debt in 2015, the early repayment of a portion of our long-term debt in 2016 and the refinancing of our long-term debt in 2016. |
Dollar Amount of Inaccurate Payments Prevented or Recovered
The majority of our net revenue consists of performance fees earned under our client contracts. Our performance fees generally represent a specified percentage of inaccurate payments that are either prevented prior to payment using our prospective claims accuracy solutions or recovered by our clients after they are identified using our retrospective claims accuracy solutions. For those clients where we identify any payment inaccuracies in advance of payment to the providers, the clients reduce the amount paid to the providers based upon the inaccuracies that we have identified. For those clients where we identify payment inaccuracies using our retrospective claims accuracy solutions after the client has made payment, clients generally recover claims either by taking credits against outstanding payables to healthcare providers or retail vendors, or future purchases from the related retail vendors, or receiving refund checks directly from those healthcare providers or retail vendors.
The dollar amount of inaccurate payments prevented or recovered in a given period is impacted by the dollar amount of claims or payments reviewed, the scope of claims or payments that we review, the success of our cross-selling efforts, our ability to retain existing clients and obtain new clients and our ability to enhance our existing solutions or create new solutions.
We believe the dollar amount of inaccurate payments prevented or recovered is useful to measure our overall operating performance and how well we are executing on our client contracts.
The following table presents the combined dollar amount of inaccurate payments prevented or recovered in our Healthcare and Global Retail and Other segments for the periods presented (in thousands):
|
|
|
|
|
|
|
|
|
|
|
|
|
|
|
Year Ended |
|
|||||||
|
|
|
December 31, |
|
|||||||
|
|
|
2016 |
|
2015 |
|
2014 |
|
|||
|
Amount of inaccurate payments prevented or recovered(1) |
|
$ |
3,837,710 |
|
$ |
3,244,535 |
|
$ |
3,133,763 |
|
|
Amount of inaccurate payments prevented or recovered, excluding our Medicare RAC contract(1) |
|
$ |
3,721,514 |
|
$ |
3,070,738 |
|
$ |
2,534,884 |
|
|
(1) |
Inaccurate payments prevented or recovered for prior periods are reported to us on a rolling basis. Accordingly, amounts reflected for prior periods are subject to change. |
Factors Affecting the Comparability of our Results of Operations
As a result of a number of factors, our historical results of operations may not be comparable to our results of operations in future periods and our results of operations may not be directly comparable from period to period. Set forth below is a brief discussion of the key factors impacting the comparability of our results of operations.
53
Connolly iHealth Merger
Our results of operations prior to the Connolly iHealth Merger, which was consummated in May 2014, do not include the iHealth Technologies business and, accordingly, are not comparable to subsequent periods. The following is a discussion of the major factors affecting the comparability of our results of operations resulting from the Connolly iHealth Merger:
|
· |
Net Revenue. The periods after the Connolly iHealth Merger include net revenue from the combined businesses. |
|
· |
Cost of Revenue. The periods after the Connolly iHealth Merger include cost of revenue from the combined businesses. |
|
· |
Selling, General and Administrative Expenses. The periods after the Connolly iHealth Merger include selling, general and administrative expenses from the combined businesses. |
|
· |
Transaction-related Expenses. In connection with the Connolly iHealth Merger, we incurred significant transaction costs, primarily diligence-related costs and professional fees. |
|
· |
Amortization and Depreciation Expenses. As part of the Connolly iHealth Merger, we assigned values to the iHealth Technologies assets we acquired and the liabilities we assumed based upon their fair values at the acquisition date. In the merger, we acquired intangible assets, consisting primarily of client relationships, with a value of $543.2 million. Due to the significant increase in the amount of intangible assets, our amortization expense is significantly higher for the periods following the merger. |
|
· |
Goodwill. As a result of the Connolly iHealth Merger, we recorded $829.1 million in goodwill, which represents the amount that the $1.2 billion purchase price exceeded the fair value of the net assets acquired. |
|
· |
Income Taxes. In connection with the Connolly iHealth Merger, significant book and tax differences were accounted for in deferred taxes primarily related to business combination accounting for stock acquisitions. These differences include intangible assets and transaction costs. Notwithstanding these differences, the Connolly iHealth Merger did not have a material impact on our income tax expense. |
|
· |
Interest Expense and Debt Extinguishment Costs. In May 2014, we refinanced our indebtedness and entered into the Initial Secured Credit Facilities in connection with the Connolly iHealth Merger, which increased our total outstanding long-term debt from $319.2 million to $1.08 billion, resulting in a significant increase in interest expense. In addition, we recognized a loss of $9.8 million in debt extinguishment costs primarily associated with the write-off of unamortized fees related to indebtedness that was repaid to certain lenders. |
Debt Refinancings, Repayments and Repricing
In connection with our various debt refinancings, including those associated with the Advent Acquisition and the Connolly iHealth Merger in May 2014, we incurred significant debt issuance costs, primarily associated with the new indebtedness incurred under the Initial Secured Credit Facilities. These debt issuance costs are amortized utilizing the effective interest method over the associated life of the related indebtedness and recorded as interest expense. Unamortized debt issuance costs were $10.8 million and $21.0 million as of December 31, 2016 and 2015, respectively. We incurred $9.8 million and $11.7 million in debt extinguishment costs related to the May 2014 and January 2014 refinancings, respectively, primarily related to indebtedness that was repaid to certain lenders.
In May 2015, we repriced our Initial First Lien Credit Facilities, which reduced the related interest rates. We incurred $4.1 million in debt extinguishment costs for the year ended December 31, 2015 in connection with the repricing primarily related to accelerated recognition of the unamortized portion of debt issuance costs and original issue discount related to indebtedness that was repaid to certain lenders.
In June 2016, we repaid $223.0 million in outstanding principal under our then outstanding Initial Second Lien Credit Facility using proceeds from our IPO. We also made a voluntary prepayment of $13.1 million of outstanding principal under the Initial Second Lien Credit Facility. As a result of these repayments, we recognized a loss on extinguishment of debt totaling $7.1 million for the year ended December 31, 2016 primarily related to the accelerated
54
recognition of the unamortized portion of debt issuance costs and original issue discount. See “—Liquidity and Capital Resources—First Lien Credit Facilities.”
In September 2016, we completed a refinancing of our Initial First and Second Lien Credit Facilities and entered into the Restated Credit Agreement, which provides for the First Lien Credit Facilities consisting of (a) the First Lien Term A Loans in the original principal amount of $250.0 million, (b) the First Lien Term B Loans in the original principal amount of $550.0 million and (c) the $100.0 million Revolver, reducing our total debt principal outstanding by $22.7 million and reducing the interest rates we pay on our outstanding debt. As a result of this refinancing, we recognized a loss on extinguishment of debt of $9.3 million for the year ended December 31, 2016, primarily related to the payment of certain fees and the accelerated recognition of the unamortized portion of debt issuance costs and original issue discount related to indebtedness that was repaid to certain lenders.
Medicare RAC Contract
Historically, one of our largest clients was CMS under our original Medicare RAC contract. However, as a result of the cessation of the submission of claims for review by CMS for a period of two months in 2014, the continuing reduction of the scope of claims that we review (in particular the ongoing suspension of review of certain of inpatient hospital claims discussed below), the subsequent delays with the contract renewal process and active auditing under the original contract ending on July 29, 2016, net revenue under our original Medicare RAC contract has declined. Net revenue under our original Medicare RAC contract was $14.0 million, $18.5 million and $44.3 million for the years ended December 31, 2016, 2015 and 2014, respectively.
Our original Medicare RAC contract for one region was originally set to expire in February 2014. In November 2015, CMS announced that it would begin to close out the original contracts so the Medicare RACs could complete all outstanding claim reviews and other processes by December 31, 2015 (subsequently extended through July 2016). Since this date, activities under our original Medicare RAC program contract have been limited to administrative matters, including collections, related to findings through July 29, 2016. Our original Medicare RAC program contract, including any liability for appeals, ends on January 31, 2018.
In October 2016, CMS announced that we were awarded two new Medicare RAC program contracts to provide retrospective payment accuracy services for Medicare Parts A and B (other than durable medical equipment, prosthetics, orthotics, and supplies claims and home health and hospice claims). Pursuant to these awards, we are the Medicare RAC for Region 2 (Central U.S.) and Region 3 (Southeast U.S.). The new Medicare RAC program contracts have a one year initial term, with multiple one year renewal options at the election of CMS. We do not yet know all of the terms of the new Medicare RAC program contracts but CMS has indicated that we may be able to request medical charts in the second quarter of 2017.
In late 2013, CMS suspended the review by Medicare RACs of inpatient hospital claims for a determination of whether the inpatient hospital admission and patient status was appropriate. This type of improper medical inpatient claim historically accounted for a substantial portion of the claims we had identified related to our original Medicare RAC contract. Under our new contracts with CMS for two regions, the continued suspensions of these reviews and additional limitations or restrictions on the type of claims reviewed by Medicare RACs, if implemented, likely will result in a reduction of net revenue compared to prior experience under our original Medicare RAC contract and may impact results of operations in the future.
In August 2014, CMS announced that it would allow hospitals to remove all eligible inpatient status claims then pending in the appeals process by offering to pay hospitals 68% of the original claim amount. On July 1, 2015, CMS issued a Technical Direction Letter to us and the other Medicare RACs, indicating that we will only be entitled to the contract contingency fee on the settled amounts of the claims, or 32% of the original inpatient claim amounts. Based on the initial lists of finalized settlements provided by CMS, we would be required to refund CMS approximately $22.3 million in Medicare RAC contingency fees due to these adjustments. CMS further advised that as the hospital settlement project continues, additional settlement lists will be matched to Medicare RAC claims which may result in updated refund amounts to those initially provided. While there are uncertainties in any dispute resolution and results are uncertain, we have disputed CMS's findings based on our interpretation of the terms of the Medicare RAC contract and our belief that the backup data provided by CMS is inaccurate and/or incomplete. Our liability for estimated refunds and appeals includes amounts for these settled claims based on our best estimates of the amount we believe will be ultimately payable to CMS based on our interpretation of the terms of the original Medicare RAC contract. We believe that it is
55
possible that we could be required to pay an additional amount up to approximately $13.0 million in excess of the amount we accrued as of December 31, 2016, based on the claims data we have received from CMS to date. As CMS completes its settlement process with the providers and updated files are provided to us, the potential amount owed by us may change. On September 28, 2016, CMS announced a second settlement process to allow eligible providers to settle their inpatient status claims currently under appeal, which began on December 1, 2016. This second settlement process could result in additional amounts owed to CMS. The amount of any such additional claims cannot presently be determined. We do not anticipate our Medicare RAC contract will represent a significant portion of our business going forward.
Impairment of Intangible Assets
As a result of our Cotiviti rebranding, we recorded an impairment of intangible assets of $27.8 million related to our Connolly and iHealth trademarks during the year ended December 31, 2015. The remaining trademark value of $4.2 million as of December 31, 2016 is related to our retail business that will continue to operate as Connolly, a division of Cotiviti.
Based on the facts and circumstances surrounding our original Medicare RAC contract, including delays with the contract renewal process, as well as scope reductions that resulted in a decrease to our future revenue projections, we performed an impairment review of our customer relationship intangible asset related to our original Medicare RAC contract with CMS during the year ended December 31, 2014. As a result of this review, we recognized a $74.0 million impairment charge for the year ended December 31, 2014 due to a change in the estimated fair value of the original Medicare RAC contract, a customer relationship intangible asset.
Stock-based compensation
Stock-based compensation expense for the year ended December 31, 2016 includes approximately $15.9 million as a result of the vesting of performance awards. Additionally, for the year ended December 31, 2016, stock-based compensation expense includes approximately $2.3 million related to the accelerated vesting of certain stock options as the result of our IPO.
Our Segments
We report our results of operations in two segments, (i) Healthcare and (ii) Global Retail and Other. Through our Healthcare segment, we offer prospective and retrospective claims accuracy solutions to healthcare payers in the United States. We also provide analytics-based solutions unrelated to our healthcare payment accuracy solutions, on a limited basis in the United States. Through our Global Retail and Other segment, we provide retrospective claims accuracy solutions to retailers primarily in the United States, Canada and the United Kingdom, as well as solutions that improve efficiency and effectiveness of payment networks for a limited number of clients.
56
We evaluate the performance of each segment based on segment net revenue and segment operating income. The cost of revenue for each segment is based on direct expenses associated with revenue generating activities of each segment. We allocate selling, general and administrative expenses and depreciation and amortization to each segment based on the segments' proportionate share of revenue and expenses directly related to the operation of the segment as determined by management. The following table sets forth the net revenue and operating income for our Healthcare and Global Retail and Other segments for the periods presented (in thousands).
|
|
|
|
|
|
|
|
|
|
|
|
|
|
|
Year Ended |
|
|||||||
|
|
|
December 31, |
|
|||||||
|
|
|
2016 |
|
2015 |
|
2014 |
|
|||
|
|
|
|
|
|
|
|
|
|
|
|
|
Net Revenue |
|
|
|
|
|
|
|
|
|
|
|
Healthcare |
|
$ |
552,041 |
|
$ |
467,044 |
|
$ |
359,842 |
|
|
Global Retail and Other |
|
|
73,121 |
|
|
74,299 |
|
|
81,530 |
|
|
Consolidated net revenue |
|
$ |
625,162 |
|
$ |
541,343 |
|
$ |
441,372 |
|
|
Operating Income |
|
|
|
|
|
|
|
|
|
|
|
Healthcare |
|
$ |
123,917 |
|
$ |
84,240 |
|
$ |
23,713 |
|
|
Global Retail and Other |
|
|
10,036 |
|
|
12,284 |
|
|
6,484 |
|
|
Consolidated operating income |
|
$ |
133,953 |
|
$ |
96,524 |
|
$ |
30,197 |
|
The following table sets forth our segment net revenue and percentage of consolidated net revenue by product type for the periods presented (in thousands):
|
|
|
Year Ended December 31, |
|
|||||||||||||
|
|
|
2016 |
|
% |
|
2015 |
|
% |
|
2014 |
|
% |
|
|||
|
|
|
|
|
|
|
|
|
|
|
|
|
|
|
|
|
|
|
Healthcare |
|
|
|
|
|
|
|
|
|
|
|
|
|
|
|
|
|
Retrospective claims accuracy |
|
$ |
310,496 |
|
49.7 |
|
$ |
251,288 |
|
46.4 |
|
$ |
240,544 |
|
54.5 |
|
|
Prospective claims accuracy |
|
|
229,491 |
|
36.7 |
|
|
201,899 |
|
37.3 |
|
|
108,828 |
|
24.7 |
|
|
Transaction services |
|
|
12,054 |
|
1.9 |
|
|
13,857 |
|
2.6 |
|
|
10,470 |
|
2.4 |
|
|
Total Healthcare |
|
|
552,041 |
|
88.3 |
|
|
467,044 |
|
86.3 |
|
|
359,842 |
|
81.6 |
|
|
Global Retail and Other |
|
|
|
|
|
|
|
|
|
|
|
|
|
|
|
|
|
Retrospective claims accuracy |
|
|
70,656 |
|
11.3 |
|
|
72,060 |
|
13.3 |
|
|
80,075 |
|
18.1 |
|
|
Other |
|
|
2,465 |
|
0.4 |
|
|
2,239 |
|
0.4 |
|
|
1,455 |
|
0.3 |
|
|
Total Global Retail and Other |
|
|
73,121 |
|
11.7 |
|
|
74,299 |
|
13.7 |
|
|
81,530 |
|
18.4 |
|
|
Consolidated net revenue |
|
$ |
625,162 |
|
100.0 |
|
$ |
541,343 |
|
100.0 |
|
$ |
441,372 |
|
100.0 |
|
57
Results of Operations
Year Ended December 31, 2016 Compared to Year Ended December 31, 2015
The following table sets forth our consolidated statement of operations for the periods presented (in thousands):
|
|
|
Year Ended December 31, |
|
Percentage |
|
||||||||
|
|
|
|
|
|
Percentage of |
|
|
|
|
Percentage of |
|
Change |
|
|
|
|
|
|
|
Net Revenue |
|
|
|
|
Net Revenue |
|
Period to |
|
|
|
|
2016 |
|
(%) |
|
2015 |
|
(%) |
|
Period (%) |
|
||
|
Net revenue |
|
$ |
625,162 |
|
100.0 |
|
$ |
541,343 |
|
100.0 |
|
15.5 |
|
|
Cost of revenue (exclusive of depreciation and amortization, stated separately below): |
|
|
|
|
|
|
|
|
|
|
|
|
|
|
Compensation |
|
|
229,601 |
|
36.7 |
|
|
183,817 |
|
34.0 |
|
24.9 |
|
|
Other costs of revenue |
|
|
22,167 |
|
3.5 |
|
|
20,800 |
|
3.8 |
|
6.6 |
|
|
Total cost of revenue |
|
|
251,768 |
|
40.2 |
|
|
204,617 |
|
37.8 |
|
23.0 |
|
|
Selling, general and administrative expenses (exclusive of depreciation and amortization, stated separately below): |
|
|
|
|
|
|
|
|
|
|
|
|
|
|
Compensation |
|
|
97,123 |
|
15.6 |
|
|
70,802 |
|
13.1 |
|
37.2 |
|
|
Other selling, general and administrative expenses |
|
|
59,561 |
|
9.5 |
|
|
65,943 |
|
12.2 |
|
(9.7) |
|
|
Total selling, general and administrative expenses |
|
|
156,684 |
|
25.1 |
|
|
136,745 |
|
25.3 |
|
14.6 |
|
|
Depreciation and amortization of property and equipment |
|
|
20,151 |
|
3.2 |
|
|
12,695 |
|
2.3 |
|
58.7 |
|
|
Amortization of intangible assets |
|
|
60,818 |
|
9.7 |
|
|
61,467 |
|
11.4 |
|
(1.1) |
|
|
Transaction-related expenses |
|
|
1,788 |
|
0.3 |
|
|
1,469 |
|
0.3 |
|
21.7 |
|
|
Impairment of intangible assets |
|
|
— |
|
— |
|
|
27,826 |
|
5.1 |
|
(100.0) |
|
|
Total operating expenses |
|
|
491,209 |
|
78.5 |
|
|
444,819 |
|
82.2 |
|
10.4 |
|
|
Operating income |
|
|
133,953 |
|
21.5 |
|
|
96,524 |
|
17.8 |
|
38.8 |
|
|
Other expense (income): |
|
|
|
|
|
|
|
|
|
|
|
|
|
|
Interest expense |
|
|
48,653 |
|
7.8 |
|
|
65,561 |
|
12.1 |
|
(25.8) |
|
|
Loss on extinguishment of debt |
|
|
16,417 |
|
2.6 |
|
|
4,084 |
|
0.8 |
|
302.0 |
|
|
Other non-operating (income) expense |
|
|
(939) |
|
(0.1) |
|
|
(826) |
|
(0.2) |
|
13.7 |
|
|
Total other expense (income) |
|
|
64,131 |
|
10.3 |
|
|
68,819 |
|
12.7 |
|
(6.8) |
|
|
|
|
|
|
|
|
|
|
|
|
|
|
|
|
|
Income from continuing operations before income taxes |
|
|
69,822 |
|
11.2 |
|
|
27,705 |
|
5.1 |
|
152.0 |
|
|
Income tax expense |
|
|
20,970 |
|
3.3 |
|
|
14,401 |
|
2.6 |
|
45.6 |
|
|
Income from continuing operations |
|
|
48,852 |
|
7.9 |
|
|
13,304 |
|
2.5 |
|
267.2 |
|
|
Gain on discontinued operations, net of tax |
|
|
— |
|
— |
|
|
559 |
|
0.1 |
|
(100.0) |
|
|
Net income |
|
$ |
48,852 |
|
7.9 |
|
$ |
13,863 |
|
2.6 |
|
252.4 |
|
Net revenue
Net revenue was $625.2 million for the year ended December 31, 2016 as compared to $541.3 million for the year ended December 31, 2015. The increase of $83.9 million was the result of increased Healthcare segment revenue of $85.0 million and decreased Global Retail and Other segment revenue of $1.2 million. See “—Segment net revenue and operating income.”
Cost of revenue
Cost of revenue related to compensation was $229.6 million for the year ended December 31, 2016 as compared to $183.8 million for the year ended December 31, 2015. The increase of $45.8 million was primarily the result of approximately $34.8 million in additional payroll related expenses due to increased headcount and growth of our Healthcare segment. Stock-based compensation increased by approximately $4.1 million due to the vesting of performance-based stock options during the year ended December 31, 2016 as well as additional stock option grants.
58
Employee benefit costs increased approximately $3.7 million due to rising healthcare coverage costs and the increase in the number of our employees. Additionally, we made changes to some of our variable compensation programs in 2016 in order to better align our compensation structure with our business strategy which resulted in additional expense of approximately $3.2 million.
Other costs of revenue were $22.2 million for the year ended December 31, 2016 as compared to $20.8 million for the year ended December 31, 2015. The increase of $1.4 million was primarily the result of a $2.1 million increase in facilities related costs and a $1.9 million increase in variable costs to support our growing operations partially offset by a $2.6 million decrease in the cost to retrieve medical records due to reduced volume.
Selling, general and administrative expenses
Selling, general and administrative expenses related to compensation were $97.1 million for the year ended December 31, 2016 as compared to $70.8 million for the year ended December 31, 2015. The increase of $26.3 million was primarily related to a $15.5 million increase in stock-based compensation due to the vesting of performance-based stock options and the accelerated vesting of certain stock options as a result of the IPO during the year ended December 31, 2016 as well as additional stock option grants. Compensation related expenses increased $8.9 million primarily due to an increase in the number of employees to support our growing operations, including the enhancement of key corporate functions in connection with being a public company. Employee benefit costs increased approximately $1.9 million due to rising healthcare coverage costs and the increase in number of employees.
Other selling, general and administrative expenses were $59.6 million for the year ended December 31, 2016 as compared to $65.9 million for the year ended December 31, 2015. The decrease of $6.3 million was primarily due to a decrease of $9.1 million in other costs including professional and consulting fees as our current need to leverage external resources in support of our strategic initiatives has been reduced. This decrease was partially offset by a $2.8 million increase in IT infrastructure and telecommunications costs to support our growing operations.
Depreciation and amortization of property and equipment
Depreciation and amortization of property and equipment was $20.2 million for the year ended December 31, 2016 as compared to $12.7 million for the year ended December 31, 2015. The increase of $7.5 million was due to continued investments in capital expenditures over the prior year.
Amortization of intangible assets
Amortization of intangible assets was $60.8 million for the year ended December 31, 2016 as compared to $61.5 million for the year ended December 31, 2015. The decrease of $0.7 million was the result of the impairment of our legacy trademarks related to the Cotiviti rebranding in September 2015.
Transaction-related expenses
Transaction-related expenses were $1.8 million for the year ended December 31, 2016 primarily related to expenses incurred in connection with our IPO and other offering costs as well as certain expenses related to corporate development activity. Transaction-related expenses were $1.5 million for the year ended December 31, 2015 primarily related to expenses incurred in connection with our IPO.
Impairment of Intangible Assets
Impairment of intangible assets was $27.8 million for the year ended December 31, 2015 related to our Connolly and iHealth trademarks as a result of our Cotiviti rebranding in September 2015. We had no impairment of intangible assets for the year ended December 31, 2016.
Interest expense
Interest expense was $48.7 million for the year ended December 31, 2016 as compared to $65.6 million for the year ended December 31, 2015. In May 2015 we repriced our then outstanding Initial First Lien Term Loan, lowering the interest rate by 50 basis points. In June 2016, we repaid $236.1 million of outstanding borrowings under our then
59
outstanding Initial Second Lien Credit Facility. In September 2016, we entered into the Restated Credit Agreement pursuant to which we refinanced our long-term debt under our Initial Secured Credit Facilities, reducing our outstanding principal by $22.7 million and reducing our overall interest rates. The total decrease in interest expense of $16.9 million was the result of the reduction in principal, which contributed approximately $8.2 million of the interest expense decrease, and the lower interest rates, which contributed the remaining $8.7 million interest expense decrease.
Loss on extinguishment of debt
Loss on extinguishment of debt was $16.4 million for the year ended December 31, 2016 related to the payment of fees and write-off of unamortized debt issuance costs and original issue discount as a result of the refinancing of our long-term debt in September 2016 pursuant to the Restated Credit Agreement and the early payment on our outstanding borrowings under our then outstanding Initial Second Lien Credit Facility in June 2016. During the year ended December 31, 2015 we recognized a loss on extinguishment of $4.1 million related to the write-off of unamortized debt issuance costs and original issue discount as a result of the repricing of our then outstanding Initial First Lien Term Loan.
Other non-operating income (expense)
Other non-operating income (expense) was $0.9 million for the year ended December 31, 2016 as compared to $0.8 million for the year ended December 31, 2015. The increase of $0.1 million was primarily the result of foreign exchange gains related to our operations in India.
Income tax expense
Income tax expense was $21.0 million for the year ended December 31, 2016 as compared to $14.4 million for the year ended December 31, 2015. The increase in income tax expense for the year ended December 31, 2016 as compared to the year ended December 31, 2015 was primarily a result of the increase in pre-tax income. The effective tax rate for the year ended December 31, 2016 was 30.0% compared to 52.0% for the year ended December 31, 2015. The decrease in the effective tax rate is primarily due to a $1.3 million tax benefit related to the settlement of an uncertain tax position recorded in a prior period, a $4.0 million excess tax benefit related to stock option exercises due to the early adoption of ASU 2016-09, Improvements to Employee Share-Based Payment Accounting, and a $1.1 million tax benefit related to the impact of certain tax planning.
Segment net revenue and operating income
Healthcare segment net revenue was $552.0 million for the year ended December 31, 2016 as compared to $467.0 million for the year ended December 31, 2015. The increase of $85.0 million was primarily the result of a net increase of $66.8 million due to increased penetration and extended scope of services provided to our existing client base which includes approximately $5.0 million relating to special projects that we do not expect to reoccur and a $18.2 million increase due to the addition of new clients and the success of our cross-sell efforts.
Global Retail and Other segment net revenue was $73.1 million for the year ended December 31, 2016 as compared to $74.3 million for the year ended December 31, 2015. The decrease of $1.2 million was primarily related to foreign currency fluctuations due to the strengthening U.S. dollar and the negative impact of certain regulatory changes in the U.K.
Healthcare segment operating income was $123.9 million for the year ended December 31, 2016 as compared to $84.2 million for the year ended December 31, 2015. The increase in operating income of $39.7 million was the result of an increase in net revenue noted above. This was partially offset by an increase in compensation expense of $50.8 million related to an increase in the number of employees in our growing Healthcare segment. Additionally, stock-based compensation expense increased approximately $18.1 million due to the vesting of performance-based stock options and the accelerated vesting of certain stock options upon our IPO. Our ongoing investment in strategic initiatives contributed an additional $2.9 million in expense primarily related to an increase in IT infrastructure costs. Rent and occupancy related costs increased $2.1 million as a result of additional leased office space needed to support our growing operations. Depreciation and amortization expenses increased by $6.7 million due to our continued investments in capital expenditures. Transaction-related expenses increased $0.3 million primarily related to the costs associated with the IPO and other offerings. These increased expenses were offset by an impairment of intangible assets of $26.3 million
60
for the year ended December 31, 2015 related to our Connolly and iHealth trademarks as a result of our Cotiviti rebranding in September 2015, a $5.6 million decrease in professional and consulting fees as our current need to leverage external resources in support of our strategic initiatives has been reduced and a $2.6 million decrease in the costs to retrieve medical records due to reduced volume. Additionally, certain variable costs decreased approximately $1.1 million.
Global Retail and Other segment operating income was $10.0 million for the year ended December 31, 2016 as compared to $12.3 million for the year ended December 31, 2015. The decrease in operating income of $2.3 million was the result of the decrease in net revenue noted above, a $1.5 million increase in stock-based compensation primarily related to the vesting of performance-based stock options and a $1.7 million increase in compensation related expenses. Additionally there was a $0.2 million increase in expenses related to the ongoing costs associated with our IT infrastructure initiatives. Depreciation and amortization expenses increased $0.1 million due to our continued investments in capital expenditures. These increased expenses were partially offset by a $1.5 million impairment of intangible assets for the year ended December 31, 2015 related to our Connolly trademark as a result of our Cotiviti rebranding in September 2015 and a decrease of $0.9 million in certain variable costs.
Year Ended December 31, 2015 Compared to Year Ended December 31, 2014
The following table sets forth our consolidated statement of operations for the periods presented (in thousands):
|
|
|
Year Ended December 31, |
|
Percentage |
|
||||||||
|
|
|
|
|
|
Percentage of |
|
|
|
|
Percentage of |
|
Change |
|
|
|
|
|
|
|
Net Revenue |
|
|
|
|
Net Revenue |
|
Period to |
|
|
|
|
2015 |
|
(%) |
|
2014 |
|
(%) |
|
Period (%) |
|
||
|
Net revenue |
|
$ |
541,343 |
|
100.0 |
|
$ |
441,372 |
|
100.0 |
|
22.7 |
|
|
Cost of revenue (exclusive of depreciation and amortization, stated separately below): |
|
|
|
|
|
|
|
|
|
|
|
|
|
|
Compensation |
|
|
183,817 |
|
34.0 |
|
|
164,552 |
|
37.3 |
|
11.7 |
|
|
Other costs of revenue |
|
|
20,800 |
|
3.8 |
|
|
14,536 |
|
3.3 |
|
43.1 |
|
|
Total cost of revenue |
|
|
204,617 |
|
37.8 |
|
|
179,088 |
|
40.6 |
|
14.3 |
|
|
Selling, general and administrative expenses (exclusive of depreciation and amortization, stated separately below): |
|
|
|
|
|
|
|
|
|
|
|
|
|
|
Compensation |
|
|
70,802 |
|
13.1 |
|
|
49,777 |
|
11.3 |
|
42.2 |
|
|
Other selling, general and administrative expenses |
|
|
65,943 |
|
12.2 |
|
|
42,760 |
|
9.7 |
|
54.2 |
|
|
Total selling, general and administrative expenses |
|
|
136,745 |
|
25.3 |
|
|
92,537 |
|
21.0 |
|
47.8 |
|
|
Depreciation and amortization of property and equipment |
|
|
12,695 |
|
2.3 |
|
|
7,416 |
|
1.7 |
|
71.2 |
|
|
Amortization of intangible assets |
|
|
61,467 |
|
11.4 |
|
|
52,355 |
|
11.8 |
|
17.4 |
|
|
Transaction-related expenses |
|
|
1,469 |
|
0.3 |
|
|
5,745 |
|
1.3 |
|
(74.4) |
|
|
Impairment of intangible assets |
|
|
27,826 |
|
5.1 |
|
|
74,034 |
|
16.8 |
|
(62.4) |
|
|
Total operating expenses |
|
|
444,819 |
|
82.2 |
|
|
411,175 |
|
93.2 |
|
8.2 |
|
|
Operating income |
|
|
96,524 |
|
17.8 |
|
|
30,197 |
|
6.8 |
|
219.6 |
|
|
Other expense (income): |
|
|
|
|
|
|
|
|
|
|
|
|
|
|
Interest expense |
|
|
65,561 |
|
12.1 |
|
|
51,717 |
|
11.7 |
|
26.8 |
|
|
Loss on extinguishment of debt |
|
|
4,084 |
|
0.8 |
|
|
21,524 |
|
4.9 |
|
(81.0) |
|
|
Other non-operating (income) expense |
|
|
(826) |
|
(0.2) |
|
|
(415) |
|
(0.1) |
|
98.9 |
|
|
Total other expense (income) |
|
|
68,819 |
|
12.7 |
|
|
72,826 |
|
16.5 |
|
(5.5) |
|
|
|
|
|
|
|
|
|
|
|
|
|
|
|
|
|
Income (loss) from continuing operations before income taxes |
|
|
27,705 |
|
5.1 |
|
|
(42,629) |
|
(9.7) |
|
165.0 |
|
|
Income tax expense (benefit) |
|
|
14,401 |
|
2.6 |
|
|
(16,804) |
|
(3.8) |
|
185.7 |
|
|
Income (loss) from continuing operations |
|
|
13,304 |
|
2.5 |
|
|
(25,825) |
|
(5.9) |
|
151.5 |
|
|
Gain on discontinued operations, net of tax |
|
|
559 |
|
0.1 |
|
|
— |
|
— |
|
100.0 |
|
|
Net income (loss) |
|
$ |
13,863 |
|
2.6 |
|
$ |
(25,825) |
|
(5.9) |
|
153.7 |
|
61
Net revenue
Net revenue was $541.3 million for the year ended December 31, 2015 as compared to $441.4 million for the year ended December 31, 2014. The increase was the result of increased Healthcare segment revenue of $107.1 million, partially offset by decreased Global Retail and Other segment revenue of $7.2 million. See “—Segment net revenue and operating income.”
Cost of revenue
Cost of revenue related to compensation was $183.8 million for the year ended December 31, 2015 as compared to $164.6 million for the year ended December 31, 2014. The increase of $19.2 million was primarily the result of approximately $12.2 million in additional compensation expense related to the timing of the Connolly iHealth Merger, which occurred in May 2014 and therefore there was only a partial year of expense in the prior year. Additionally, compensation expense increased $3.7 million due to a change in our variable compensation program in the fourth quarter of 2015 which resulted in additional expense. Payroll-related expenses also increased approximately $0.8 million due to increased headcount partially offset by savings due to changes made to our variable compensation programs. Employee benefit costs increased approximately $2.2 million due to rising healthcare coverage costs and the increase in number of employees. Stock-based compensation also increased by approximately $0.3 million due to additional stock option grants.
Other costs of revenue were $20.8 million for the year ended December 31, 2015 as compared to $14.5 million for the year ended December 31, 2014. The increase of $6.3 million was primarily the result of a $3.1 million increase in costs associated with the retrieval of medical records related to an increase in volume in our Healthcare business. Additionally we had an increase of $0.8 million in rent and occupancy as we expanded into additional facilities and an increase of $0.5 million in other variable costs to support our growing operations. The remaining increase of $1.9 million was primarily the result of the growth in operating costs associated with the timing of the Connolly iHealth Merger.
Selling, general and administrative expenses
Selling, general and administrative expenses related to compensation were $70.8 million for the year ended December 31, 2015 as compared to $49.8 million for the year ended December 31, 2014. The increase of $21.0 million was due to a $6.8 million increase in payroll-related expenses due to an increase in the number of employees to support our growing operations, a $1.5 million increase in our discretionary match contributions to our employee retirement plans, a $1.0 million increase in employee benefit costs due to rising healthcare coverage costs and the increase in number of employees, a $1.0 million increase in severance costs as we eliminated certain positions and a $0.6 million increase in stock-based compensation due to additional stock option grants. The remaining increase of $10.1 million was primarily the result of the timing of the Connolly iHealth Merger.
Other selling, general and administrative expenses were $65.9 million for the year ended December 31, 2015 as compared to $42.8 million for the year ended December 31, 2014. The increase of $23.1 million was partially due to ongoing investments to support our ability to grow, including an $8.3 million increase in professional and consulting fees as we have leveraged external resources and expertise and a $6.2 million increase in IT infrastructure and telecommunications costs. The remaining increase of $8.6 million was primarily the result of the timing of the Connolly iHealth Merger.
Depreciation and amortization of property and equipment
Depreciation and amortization of property and equipment was $12.7 million for the year ended December 31, 2015 as compared to $7.4 million for the year ended December 31, 2014. The increase of $5.3 million was due to the timing of the Connolly iHealth Merger which increased our property and equipment by $7.6 million as well as capital expenditures of $23.0 million during the year ended December 31, 2015.
Amortization of intangible assets
Amortization of intangible assets was $61.5 million for the year ended December 31, 2015 as compared to $52.4 million for the year ended December 31, 2014. The increase of $9.1 million was the result of the Connolly iHealth Merger which contributed amortization expense of $42.2 million and $26.8 million for the year ended December 31,
62
2015 and 2014, respectively. This increase was partially offset by the impairment of our CMS customer relationship intangible asset during the fourth quarter of 2014, which reduced amortization expense by $6.3 million for the year ended December 31, 2015 as compared to the prior year.
Transaction-related expenses
Transaction-related expenses were $1.5 million for the year ended December 31, 2015 related to expenses incurred in connection with our IPO. Transaction-related expenses were $5.7 million for the year ended December 31, 2014 and primarily related to diligence and other professional services fees associated with the Connolly iHealth Merger.
Impairment of intangible assets
Impairment of intangible assets was $27.8 million for the year ended December 31, 2015 related to our Connolly and iHealth trademarks as a result of our Cotiviti rebranding in September 2015. Impairment of intangible assets was $74.0 million for the year ended December 31, 2014 related to our CMS customer relationship due to the change in estimated fair value of our Medicare RAC contract based on revised expectations of future cash flows from the Medicare RAC program.
Interest expense
Interest expense was $65.6 million for the year ended December 31, 2015 as compared to $51.7 million for the year ended December 31, 2014. In connection with the Connolly iHealth Merger, we issued long-term debt of $1.08 billion associated with our Initial Secured Credit Facilities to fund a portion of the Connolly iHealth Merger. Proceeds were also used to refinance our then outstanding debt under our Initial Secured Credit Facilities, which had an outstanding principal balance of $319.2 million. In May 2015, we repriced our Initial First Lien Credit Facilities, lowering the interest rate by 50 basis points. The combination of these transactions, increasing the outstanding principal partially offset by a lower interest rate, resulted in an interest expense increase of $13.9 million.
Loss on extinguishment of debt
Loss on extinguishment of debt was $4.1 million for the year ended December 31, 2015 related to the repricing of our Initial First Lien Credit Facilities. During the year ended December 31, 2014 we recognized a loss on extinguishment of debt of $9.8 million as a result of refinancing our debt in connection with the Connolly iHealth Merger in May 2014 and $11.7 million as a result of our debt refinancing in January 2014.
Other non-operating (income) expense
We had other non-operating (income) expense of $0.8 million for the year ended December 31, 2015 as compared to $0.4 million for the year ended December 31, 2014. The increase was primarily the result of an increase in sublease income.
Income tax expense
We had total income tax expense of $14.4 million for the year ended December 31, 2015 as compared to an income tax benefit of $16.8 million for the year ended December 31, 2014. The effective tax rate for the year ended December 31, 2015 was 52.0% as compared to 39.4% for the year ended December 31, 2014. The increase in income tax expense and the effective tax rate are due to changes in uncertain tax positions, an increase in nondeductible costs, an increase in the valuation allowance and the impact of a state deferred tax remeasurement as a result of enacted statutory regulations.
Segment net revenue and operating income
Healthcare segment net revenue was $467.0 million for the year ended December 31, 2015 as compared to $359.9 million for the year ended December 31, 2014. The increase of $107.1 million was the result of the timing of the Connolly iHealth Merger which contributed $63.3 million in Healthcare segment net revenue, a $68.3 million increase due to the increased penetration and expanded scope of services provided to our existing client base and a $1.3 million increase due to net new clients, offset by a $25.8 million decrease in net revenue from our Medicare RAC contract due to
63
a significant reduction of claim submissions for review, the continued delays with the contract renewal process, as well as reductions of the scope of claims that we review.
Global Retail and Other segment net revenue was $74.3 million for the year ended December 31, 2015 as compared to $81.5 million for the year ended December 31, 2014. The decrease of $7.2 million was the result of a $6.6 million decrease in revenue from our existing retail client base primarily related to several non-recurring claims in the prior year that did not repeat in 2015 and a $1.4 million decrease as a result of foreign currency fluctuations due to the strengthening of the U.S. dollar. This decrease was partially offset by a $0.8 million increase due to the timing of the Connolly iHealth Merger.
Healthcare segment operating income was $84.2 million for the year ended December 31, 2015 as compared to $23.7 million for the year ended December 31, 2014. The increase in operating income of $60.5 million was the result of the increase in net revenue noted above, offset by an increase in compensation expense of $51.4 million, of which approximately $22.0 million related to the timing of the Connolly iHealth Merger and approximately $29.4 million related to increases in headcount partially offset by changes in our variable compensation plans in support of our growing operations. Additionally, the costs to retrieve medical records and the costs associated with the use of certain subcontractors increased by $4.3 million, primarily attributed to increased activity on our Medicare RAC contract. Costs to retrieve medical records occur in advance of the related revenue and we incurred fewer costs during the year ended December 31, 2014 as there was a temporary pause in the Medicare RAC contract. Rent and occupancy related costs increased $2.5 million as a result of additional leased office space needed to support our growing operations. Our ongoing investment in strategic initiatives contributed an additional $23.8 million in expense primarily related to an increase in professional fees as we leverage external resources and other costs as we build our information technology infrastructure. Impairment of intangible assets decreased $47.7 million as we had a $26.3 million impairment in 2015 as a result of our rebranding to Cotiviti as compared to a $74.0 million impairment in 2014 related to our CMS customer relationship intangible asset. Depreciation and amortization expenses increased by $15.6 million due to the acquisition of $7.6 million of property and equipment and $543.2 million in intangible assets from the Connolly iHealth Merger. Transaction-related expenses decreased $3.2 million as the costs in 2015 relate to our preparation of our IPO compared to expenses in 2014 related to the Connolly iHealth merger.
Global Retail and Other segment operating income was $12.3 million for the year ended December 31, 2015 as compared to $6.5 million for the year ended December 31, 2014. The increase in operating income of $5.8 million was the result of decreases in compensation expense of $11.1 million due to changes in our variable compensation structure partially offset by the decreased revenue discussed above. We incurred $1.5 million in impairment charges during the year ended December 31, 2015 due to our rebranding to Cotiviti and a reduction in the value of the remaining Connolly trade name. The remaining difference of $3.4 million relates to a decrease in the allocation of selling, general and administrative expenses as a result of the reduction in the segments proportionate share of the business.
64
Quarterly Results of Operations
The following table sets forth statement of operations data for each of the quarters presented. We have prepared the quarterly statement of operations data on a basis consistent with the consolidated financial statements included elsewhere in this Annual Report on Form 10-K. In the opinion of management, the financial information reflects all adjustments, consisting of normal recurring adjustments, which we consider necessary for a fair presentation of this data. This information should be read in conjunction with the consolidated financial statements and related notes included elsewhere in this Annual Report on Form 10-K. The results of historical periods are not necessarily indicative of the results for any future period.
|
|
|
|
|
|
|
|
|
|
|
|
|
|
|
|
|
|
|
|
|
|
|
|
|
|
|
|
|
Three Months Ended |
||||||||||||||||||||||
|
|
|
December 31, |
|
September 30, |
|
June 30, |
|
March 31, |
|
December 31, |
|
September 30, |
|
June 30, |
|
March 31, |
||||||||
|
|
|
2016 |
|
2016 |
|
2016 |
|
2016 |
|
2015 |
|
2015 |
|
2015 |
|
2015 |
||||||||
|
(unaudited) |
|
|
|
|
|
|
|
|
|
|
|
|
|
|
|
|
|
|
|
|
|
|
|
|
|
(dollars in thousands) |
|
|
|
|
|
|
|
|
|
|
|
|
|
|
|
|
|
|
|
|
|
|
|
|
|
Net revenue |
|
$ |
167,912 |
|
$ |
156,241 |
|
$ |
158,291 |
|
$ |
142,718 |
|
$ |
151,463 |
|
$ |
136,936 |
|
$ |
133,306 |
|
$ |
119,638 |
|
Cost of revenue (exclusive of depreciation and amortization, stated separately below): |
|
|
|
|
|
|
|
|
|
|
|
|
|
|
|
|
|
|
|
|
|
|
|
|
|
Compensation |
|
|
62,338 |
|
|
58,517 |
|
|
55,285 |
|
|
53,461 |
|
|
50,889 |
|
|
46,424 |
|
|
44,528 |
|
|
41,976 |
|
Other costs of revenue |
|
|
4,836 |
|
|
6,658 |
|
|
5,275 |
|
|
5,398 |
|
|
6,171 |
|
|
5,646 |
|
|
4,621 |
|
|
4,362 |
|
Total cost of revenue |
|
|
67,174 |
|
|
65,175 |
|
|
60,560 |
|
|
58,859 |
|
|
57,060 |
|
|
52,070 |
|
|
49,149 |
|
|
46,338 |
|
Selling, general and administrative expenses (exclusive of depreciation and amortization, stated separately below): |
|
|
|
|
|
|
|
|
|
|
|
|
|
|
|
|
|
|
|
|
|
|
|
|
|
Compensation |
|
|
22,341 |
|
|
32,496 |
|
|
23,176 |
|
|
19,110 |
|
|
18,216 |
|
|
16,997 |
|
|
17,443 |
|
|
18,146 |
|
Other selling, general and administrative expenses |
|
|
15,409 |
|
|
13,978 |
|
|
14,945 |
|
|
15,229 |
|
|
21,520 |
|
|
16,351 |
|
|
14,756 |
|
|
13,316 |
|
Total selling, general and administrative expenses |
|
|
37,750 |
|
|
46,474 |
|
|
38,121 |
|
|
34,339 |
|
|
39,736 |
|
|
33,348 |
|
|
32,199 |
|
|
31,462 |
|
Depreciation and amortization of property and equipment |
|
|
5,287 |
|
|
5,218 |
|
|
4,811 |
|
|
4,835 |
|
|
3,425 |
|
|
3,773 |
|
|
2,775 |
|
|
2,722 |
|
Amortization of intangible assets |
|
|
15,200 |
|
|
15,203 |
|
|
15,208 |
|
|
15,207 |
|
|
15,211 |
|
|
15,437 |
|
|
15,410 |
|
|
15,409 |
|
Transaction-related expenses |
|
|
879 |
|
|
16 |
|
|
653 |
|
|
240 |
|
|
1,115 |
|
|
354 |
|
|
— |
|
|
— |
|
Impairment of intangible assets |
|
|
— |
|
|
— |
|
|
— |
|
|
— |
|
|
— |
|
|
27,826 |
|
|
— |
|
|
— |
|
Total operating expenses |
|
|
126,290 |
|
|
132,086 |
|
|
119,353 |
|
|
113,480 |
|
|
116,547 |
|
|
132,808 |
|
|
99,533 |
|
|
95,931 |
|
Operating income |
|
|
41,622 |
|
|
24,155 |
|
|
38,938 |
|
|
29,238 |
|
|
34,916 |
|
|
4,128 |
|
|
33,773 |
|
|
23,707 |
|
Other expense (income): |
|
|
|
|
|
|
|
|
|
|
|
|
|
|
|
|
|
|
|
|
|
|
|
|
|
Interest expense |
|
|
8,308 |
|
|
9,625 |
|
|
14,660 |
|
|
16,060 |
|
|
15,706 |
|
|
16,180 |
|
|
16,753 |
|
|
16,922 |
|
Loss on extinguishment of debt |
|
|
— |
|
|
9,349 |
|
|
7,068 |
|
|
— |
|
|
— |
|
|
— |
|
|
4,084 |
|
|
— |
|
Other non-operating (income) expense |
|
|
(168) |
|
|
(113) |
|
|
(359) |
|
|
(299) |
|
|
(442) |
|
|
(187) |
|
|
(21) |
|
|
(176) |
|
Total other expense (income) |
|
|
8,140 |
|
|
18,861 |
|
|
21,369 |
|
|
15,761 |
|
|
15,264 |
|
|
15,993 |
|
|
20,816 |
|
|
16,746 |
|
Income (loss) from continuing operations before income taxes |
|
|
33,482 |
|
|
5,294 |
|
|
17,569 |
|
|
13,477 |
|
|
19,652 |
|
|
(11,865) |
|
|
12,957 |
|
|
6,961 |
|
Income tax expense (benefit) |
|
|
8,190 |
|
|
711 |
|
|
6,676 |
|
|
5,393 |
|
|
10,469 |
|
|
(4,571) |
|
|
5,177 |
|
|
3,326 |
|
Income (loss) from continuing operations |
|
|
25,292 |
|
|
4,583 |
|
|
10,893 |
|
|
8,084 |
|
|
9,183 |
|
|
(7,294) |
|
|
7,780 |
|
|
3,635 |
|
Gain on discontinued operations, net of tax |
|
|
— |
|
|
— |
|
|
— |
|
|
— |
|
|
— |
|
|
— |
|
|
— |
|
|
559 |
|
Net income (loss) |
|
$ |
25,292 |
|
$ |
4,583 |
|
$ |
10,893 |
|
$ |
8,084 |
|
$ |
9,183 |
|
$ |
(7,294) |
|
$ |
7,780 |
|
$ |
4,194 |
Liquidity and Capital Resources
Our primary sources of liquidity are our existing cash and cash equivalents, cash provided by operating activities and borrowings under credit facilities. As of December 31, 2016, we had cash and cash equivalents of $110.6 million and availability under the Revolver of $99.5 million. Our total indebtedness was $795.5 million as of December 31, 2016. See “—Credit Facilities.”
On September 28, 2016, our subsidiary Cotiviti Corporation and certain other of our subsidiaries entered into the Restated Credit Agreement pursuant to which the lenders party thereto agreed to provide the First Lien Credit Facilities consisting of (a) the First Lien Term A Loans in the original principal amount of $250.0 million, (b) the First Lien Term B Loans in the original principal amount of $550.0 million and (c) the $100.0 million Revolver. In connection with entering into the Restated Credit Agreement, we refinanced the Initial Secured Credit Facilities.
Our principal liquidity needs have been, and we expect them to continue to be, debt service, capital expenditures, working capital and potential mergers and acquisitions. Our capital expenditures support investments in our underlying infrastructure to enhance our solutions and technology for future growth. Our capital expenditures were $35.2 million, $23.0 million and $19.0 million for the years ended December 31, 2016, 2015 and 2014, respectively. The increase is primarily due to expenditures associated with enhancing our IT platform. We do not expect our capital expenditures to continue to increase. However, our strategy includes the expansion of our existing solutions and the development of new solutions, which will require cash expenditures over the next few years and will be funded primarily
65
with cash provided by operating activities. Accordingly, we expect our annual capital expenditures to continue to remain high as compared to the year ended December 31, 2015.
We believe that our cash flow from operations, availability under our First Lien Credit Facilities and available cash and cash equivalents will be sufficient to meet our liquidity needs for at least the foreseeable future. We anticipate that to the extent that we require additional liquidity, it will be funded through the incurrence of additional indebtedness, the issuance of equity financings, or a combination thereof. We cannot assure you that we will be able to obtain this additional liquidity on reasonable terms, or at all. Additionally, our liquidity and our ability to meet our obligations and fund our capital requirements are also dependent on our future financial performance, which is subject to general economic, financial and other factors that are beyond our control. Accordingly, we cannot assure that our business will generate sufficient cash flow from operations or that future borrowings will be available from additional indebtedness or otherwise to meet our liquidity needs. If we decide to pursue one or more significant acquisitions, we may incur additional debt or sell additional equity to finance such acquisitions, which could possibly result in additional expenses or dilution.
Cash Flows
The following table provides a summary of cash flows from operating, investing and financing activities for the periods presented (in thousands):
|
|
|
Year Ended |
|
|||||||
|
|
|
December 31, |
|
|||||||
|
|
|
2016 |
|
2015 |
|
2014 |
|
|||
|
|
|
|
|
|||||||
|
Net cash provided by operating activities |
|
$ |
189,171 |
|
$ |
63,154 |
|
$ |
95,728 |
|
|
Net cash used in investing activities |
|
|
(34,032) |
|
|
(22,581) |
|
|
(1,091,520) |
|
|
Net cash (used in) provided by financing activities |
|
|
(193,275) |
|
|
(8,976) |
|
|
1,025,872 |
|
Operating Activities
Net cash provided by operating activities was $189.2 million and $63.2 million for the year ended December 31, 2016 and 2015, respectively. The increase in cash provided by operating activities for the year ended December 31, 2016, as compared to the year ended December 31, 2015 primarily was due to a $48.4 million increase in net income adjusted for the exclusion of non-cash expenses, a $0.9 million gain on discontinued operations in the prior year and approximately a $76.7 million increase related to the effect of changes in operating assets and liabilities.
Net income adjusted for the exclusion of non-cash expenses was approximately $165.1 million for the year ended December 31, 2016, as compared to $116.7 million for the year ended December 31, 2015. The increase was primarily due to the growth in our Healthcare operations.
The effect of changes in operating assets and liabilities was an increase of $24.1 million for the year ended December 31, 2016, compared to a decrease of $52.7 million for the year ended December 31, 2015. The most significant drivers contributing to this increase relate to the following:
|
· |
prior year tax payments of approximately $10.0 million were applied to our tax liabilities for the year ended December 31, 2016; |
|
· |
a payment of $22.3 million to the former stockholders of iHealth Technologies during the year ended December 31, 2015 which had been recorded as a liability in accounts payable and accrued other expenses; |
|
· |
changes in accounts receivable primarily driven by increased revenue and timing of collections. Accounts receivable, net of the allowance for doubtful accounts, decreased $3.5 million during the year ended December 31, 2016 as compared to an increase of $28.8 million during the year ended December 31, 2015; and |
|
· |
changes in accrued compensation primarily driven by an increase in the number of employees and timing of payments. Accrued compensation increased $15.7 million during the year ended December 31, 2016 as compared to an increase of $0.3 million during the year ended December 31, 2015. |
66
Net cash provided by operating activities was $63.2 million and $95.7 million for the years ended December 31, 2015 and December 31, 2014, respectively. The decrease in cash provided by operating activities for the year ended December 31, 2015 as compared to the year ended December 31, 2014 primarily was due to a $26.9 million increase in net income adjusted for the exclusion of non-cash expenses, a $0.9 million gain on discontinued operations in 2015 and approximately a $58.6 million decrease related to the effect of changes in operating assets and liabilities.
Net income adjusted for the exclusion of non-cash expenses was approximately $116.7 million for the year ended December 31, 2015 as compared to $89.8 million for the year ended December 31, 2014. The increase was primarily due to the growth in our Healthcare operations.
The effect of changes in operating assets and liabilities was a decrease of $52.7 million for the year ended December 31, 2015 as compared to an increase of $5.9 million for the year ended December 31, 2014. The most significant drivers contributing to this decrease relate to the following:
|
· |
a payment of $22.3 million to the former stockholders of iHealth Technologies during the year ended December 31, 2015 which had been recorded as a liability in accounts payable and accrued other expenses; |
|
· |
a $13.7 million increase in taxes paid in the current year compared to the prior year; |
|
· |
changes in accounts receivable primarily driven by increased revenue and timing of collections. Accounts receivable, net of the allowance for doubtful accounts, increased $28.8 million during the year ended December 31, 2015 as compared to an increase of $25.5 million during the year ended December 31, 2014; |
|
· |
changes in accrued compensation primarily driven by an increase in the number of employees and timing of payments. Accrued compensation increased $0.3 million during the year ended December 31, 2015 as compared to a decrease of $38.8 million during the year ended December 31, 2014 primarily related to the payment of certain incentive compensation to former employees of iHealth Technologies as a result of the change in control from the Connolly iHealth Merger during the year ended December 31, 2014; and |
|
· |
changes in the estimated liability for refunds and appeals related to refunds or offsets made to our clients as well as changes in refund liabilities assumed from the Connolly iHealth Merger. The gross estimated liability for refunds and appeals increased $3.0 million during the year ended December 31, 2015 as compared to an increase of $45.1 million during the year ended December 31, 2014. |
Investing Activities
Net cash used in investing activities was $34.0 million and $22.6 million for the years ended December 31, 2016 and December 31, 2015, respectively. The increase in cash used in investing activities during the year ended December 31, 2016 as compared to the year ended December 31, 2015 primarily was due to an increase in capital expenditures due to our ongoing investments, particularly as it relates to enhancing our information technology infrastructure and platforms to support our growing operations.
Net cash used in investing activities was $22.6 million and $1.09 billion for the years ended December 31, 2015 and December 31, 2014, respectively. The decrease in cash used in investing activities during the year ended December 31, 2015 as compared to the year ended December 31, 2014 primarily was due to $1.07 billion in business combination costs related to the Connolly iHealth Merger in 2014.
Financing Activities
Net cash used in financing activities was $193.3 million for the year ended December 31, 2016 compared to $9.0 million for the year ended December 31, 2015. The increase in cash used in financing activities during the year ended December 31, 2016 as compared to the year ended December 31, 2015 was primarily due to (a) the payment of a Special Cash Dividend of $150.0 million on May 26, 2016; (b) the repayment of $236.1 million of outstanding borrowings under our then outstanding Initial Second Lien Credit Facility in June 2016; (c) the net payment of $22.7 million of outstanding indebtedness as a result of the September 2016 refinancing of our long-term debt; (d) scheduled debt principal payments of $8.6 million; and (e) payment of $7.1 million in financing fees related to the September 2016
67
refinancing partially offset by net cash proceeds from our IPO of $227.0 million and proceeds of $4.2 million related to stock option exercises.
Net cash used in financing activities was $9.0 million for the year ended December 31, 2015 and net cash provided by financing activities was $1.03 billion for the year ended December 31, 2014. The decrease in cash provided by financing activities during the year ended December 31, 2015 as compared to the year ended December 31, 2014 was primarily due to $1.40 billion in proceeds from the issuance of debt pursuant to our Initial Secured Credit Facilities and $365.2 million in proceeds from the issuance of common stock related to the Connolly iHealth Merger during the year ended December 31, 2014. During the year ended December 31, 2014 we had $683.9 million in repayments of debt associated with debt refinancings and scheduled principal payments and the payment of $49.6 million in financing fees related to debt refinancings as compared to scheduled principal payments of $8.1 million and payment of $1.1 million in financing fees related to the debt repricing during the year ended December 31, 2015.
Credit Facilities
Initial Secured Credit Facilities
On May 14, 2014, in connection with the Connolly iHealth Merger, we entered into the Initial Secured Credit Facilities, consisting of the Initial First Lien Credit Facilities and the Initial Second Lien Credit Facility. The Initial First Lien Credit Facilities consisted of an Initial First Lien Term Loan in the original principal amount of $810.0 million and a $75.0 million Initial First Lien Revolver, of which $25.0 million could, at our option, be made available for letters of credit and $20.0 million could, at our option, be made available for swingline loans. The Initial Second Lien Credit Facility consisted of an Initial Second Lien Term Loan in the original principal amount of $265.0 million.
The Initial First Lien Term Loan was set to mature on May 14, 2021 and the Initial First Lien Revolver was set to mature on May 14, 2019. We were required to make annual amortization payments in respect of the Initial First Lien Term Loan in an amount equal to 1.00% of the original principal amount thereof, payable in equal quarterly installments of 0.25% of the original principal amount of the Initial First Lien Term Loan. Such quarterly amortization payments would have been reduced ratably by any mandatory or voluntary prepayments. The Initial Second Lien Credit Facility was set to mature on May 14, 2022 and did not require amortization payments.
The obligations under the Initial First Lien Credit Facilities were secured by first priority security interests in substantially all of the assets of the borrowers and the guarantors party thereto, subject to permitted liens and other exceptions. The obligations under the Initial Second Lien Credit Facility were secured by second priority security interests in substantially all of the assets of the borrowers and the guarantors party thereto, subject to permitted liens and other exceptions. All of our subsidiaries were guarantors under the Initial Secured Credit Facilities. The Initial Secured Credit Facilities contained financial covenants and certain business covenants, including restrictions on dividend payments, which we were required to comply with during the term of the agreement.
Borrowings under the Initial Secured Credit Facilities bore interest at a rate per annum equal to the applicable margin, plus, at our election, either (a) a base rate determined by reference to the highest of (i) the federal funds effective rate in effect on such date plus 0.50%, (ii) LIBOR plus 1.00%, (iii) the prime commercial lending rate of the administrative agent as in effect on the relevant day and (iv) with respect to the Initial First Lien Term Loan and the Initial Second Lien Credit Facility only, 2.00% or (b) LIBOR determined by reference to the applicable Reuters screen page two business days prior to the commencement of the interest period relevant to the subject borrowing, adjusted for certain additional costs, which could not, in the case of borrowings of Initial First Lien Term Loans and loans under the Initial Second Lien Credit Facility, be less than 1.00%.
The applicable margin for the Initial First Lien Term Loan was originally 3.00% for base rate borrowings and 4.00% for LIBOR borrowings. On May 27, 2015, the credit agreement governing our Initial First Lien Credit Facilities was amended to reduce the applicable margin for the Initial First Lien Term Loan to 2.50% for base rate borrowings and 3.50% for LIBOR borrowings. We were also required to pay a customary annual administration fee to the administrative agent under the Initial First Lien Credit Facilities.
68
Prior to our IPO, the applicable margin for loans under the Initial First Lien Revolver was determined in accordance with the table set forth below, with the first lien leverage ratio determined in accordance with the terms of the documentation governing the Initial First Lien Credit Facilities:
|
|
|
Applicable Margin |
|
Applicable Margin |
|
|
First Lien Leverage Ratio |
|
for Base Rate Loans |
|
for LIBOR Loans |
|
|
Greater than 4.00:1.00 |
|
2.25 |
% |
3.25 |
% |
|
Less than or equal to 4.00:1.00 and greater than 3.50:1.00 |
|
2.00 |
% |
3.00 |
% |
|
Less than or equal to 3.50:1.00 |
|
1.75 |
% |
2.75 |
% |
Following our IPO, the applicable margin for loans under the Initial First Lien Revolver was determined in accordance with the table set forth below:
|
|
|
Applicable Margin |
|
Applicable Margin |
|
|
First Lien Leverage Ratio |
|
for Base Rate Loans |
|
for LIBOR Loans |
|
|
Greater than 4.00:1.00 |
|
2.00 |
% |
3.00 |
% |
|
Less than or equal to 4.00:1.00 and greater than 3.50:1.00 |
|
1.75 |
% |
2.75 |
% |
|
Less than or equal to 3.50:1.00 |
|
1.50 |
% |
2.50 |
% |
The applicable margin for the term loan under the Initial Second Lien Credit Facility was 5.75% for base rate loans and 6.75% for LIBOR loans. We were also required to pay a customary annual administration fee to the administrative agent under the Initial Second Lien Credit Facility.
First Lien Credit Facilities
On September 28, 2016, we entered into the Restated Credit Agreement, pursuant to which the lenders party thereto agreed to provide the First Lien Credit Facilities, consisting of First Lien Term A Loans in the original principal amount of $250.0 million, First Lien Term B Loans in the original principal amount of $550.0 million and the $100.0 million Revolver, of which $25.0 million may, at our option, be made available for letters of credit and $20.0 million may, at our option, be made available for swingline loans.
In connection with entering into the Restated Credit Agreement, we refinanced the Initial Secured Credit Facilities.
The First Lien Term A Loans will mature on September 28, 2021. We are required to make annual amortization payments in respect of the First Lien Term A Loans in an amount equal to 5.00% of the original principal amount thereof, with step-ups to 7.50%, 10.00% and 15.00% of the original principal amount of the First Lien Term A Loans after December 2018, December 2019 and December 2020, respectively, payable in equal quarterly installments of 1.25%, 1.875%, 2.50% and 3.75%, respectively, of the original principal amount of the First Lien Term A Loans. Such quarterly amortization payments are reduced by any mandatory or voluntary prepayments in a manner determined by our subsidiary, Cotiviti Corporation.
The First Lien Term B Loans will mature on September 28, 2023. We are required to make annual amortization payments in respect of the First Lien Term B Loans in an amount equal to 1.00% of the original principal amount thereof, payable in equal quarterly installments of 0.25% of the original principal amount of the First Lien Term B Loans. Such quarterly amortization payments are reduced ratably by any mandatory or voluntary prepayments.
The Revolver will mature on September 28, 2021 and does not require amortization payments.
The obligations under the First Lien Credit Facilities are secured by first priority security interests in substantially all of the assets of the borrowers and the guarantors thereto, subject to permitted liens and other exceptions. Certain of our subsidiaries are guarantors under the First Lien Credit Facilities. The Restated Credit Agreement contains financial covenants (for the benefit of the holders of the First Lien Term A Loans and the lenders under the Revolver) and certain business covenants, including restrictions on dividend payments, with which we must comply during the term of the agreement. As of December 31, 2016, we were in compliance with the Restated Credit Agreement.
69
Borrowings under the First Lien Credit Facilities bear interest at a rate per annum equal to the applicable margin, plus, at our election, either (a) a base rate determined by reference to the highest of (i) the New York Federal Reserve Bank effective rate in effect on such date plus 0.50%, (ii) LIBOR plus 1.00%, (iii) the prime commercial lending rate of the administrative agent as in effect on the relevant day and (iv) with respect to the First Lien Term B Loans only, 1.75% or (b) LIBOR determined by reference to the applicable Reuters screen page two business days prior to the commencement of the interest period relevant to the subject borrowing, adjusted for certain additional costs, which may not, (i) with respect to the First Lien Term B Loans only, be less than 0.75% and (ii) with respect to the First Lien Term A Loans and Revolver only, be less than 0.00%.
The applicable margin for the First Lien Term B Loans is 1.75% for base rate borrowings and 2.75% for LIBOR borrowings. If Cotiviti Corporation's corporate credit rating from Moody's is Ba3 or better and its corporate family rating from S&P is BB– or better, the applicable margins for the First Lien Term B Loans will be reduced by 0.25% for so long as such ratings are maintained. As of December 31, 2016, Cotiviti Corporation’s corporate credit rating from Moody's was B1 and its corporate family rating from S&P was BB–.
The applicable margin for the First Lien Term A Loans and Revolver is determined in accordance with the table set forth below:
|
|
|
|
|
Applicable Margin for |
|
Applicable Margin for |
|
|
|
|
Secured |
|
Base Rate Loans of |
|
LIBOR Loans of |
|
|
|
|
Leverage |
|
First Lien Term A |
|
First Lien Term A Loans |
|
|
|
|
Ratio |
|
and Revolver |
|
and Revolver |
|
|
Category 1 |
|
Greater than 4.00:1.00 |
|
2.00% |
|
3.00% |
|
|
Category 2 |
|
Less than or equal to 4.00:1.00 and greater than 3.50:1.00 |
|
1.75% |
|
2.75% |
|
|
Category 3 |
|
Less than or equal to 3.50:1.00 and greater than 3.00:1.00 |
|
1.50% |
|
2.50% |
|
|
Category 4 |
|
Less than or equal to 3.00:1.00 |
|
1.25% |
|
2.25% |
|
For an additional description of the First Lien Credit Facilities, see “—Credit Facilities.”
Contractual Obligations
As of December 31, 2016, our contractual obligations and other commitments were as follows:
|
|
|
Payments due by period |
|
|||||||||||||
|
|
|
Less than |
|
|
|
|
|
|
|
|
|
|
|
|
|
|
|
|
|
1 Year |
|
1 - 3 Years |
|
3 - 5 Years |
|
Thereafter |
|
Total |
|
|||||
|
|
|
(in millions) |
|
|||||||||||||
|
Principal payments of debt |
|
$ |
18.0 |
|
$ |
42.3 |
|
$ |
214.1 |
|
$ |
521.1 |
|
$ |
795.5 |
|
|
Interest on long-term debt(1) |
|
|
30.4 |
|
|
58.6 |
|
|
53.0 |
|
|
34.2 |
|
|
176.2 |
|
|
Asset retirement obligations(2) |
|
|
0.1 |
|
|
2.6 |
|
|
0.6 |
|
|
— |
|
|
3.3 |
|
|
Operating lease payments(3) |
|
|
9.3 |
|
|
11.2 |
|
|
4.9 |
|
|
8.3 |
|
|
33.7 |
|
|
Purchase obligations(4) |
|
|
11.1 |
|
|
8.5 |
|
|
— |
|
|
— |
|
|
19.6 |
|
|
Interest rate cap agreements(5) |
|
|
1.4 |
|
|
2.4 |
|
|
— |
|
|
— |
|
|
3.8 |
|
|
Total |
|
$ |
70.3 |
|
$ |
125.6 |
|
$ |
272.6 |
|
$ |
563.6 |
|
$ |
1,032.1 |
|
|
(1) |
Represents the expected cash payments for interest on our long-term debt based on interest rates in place and the amounts outstanding as of December 31, 2016. Because the interest rates under the Initial Secured Credit Facilities are variable, actual payments may differ. |
|
(2) |
Represents asset retirement obligations arising from contractual requirements to perform specified activities at the time of disposition of certain leasehold improvements and equipment at certain of our facilities. |
|
(3) |
Represents amounts due under existing operating leases related to our offices and other facilities. |
|
(4) |
Represents noncancelable commitments for the purchase of software, goods and services. |
|
(5) |
Represents amounts due under our existing interest rate cap agreements. |
70
Critical Accounting Policies
Our discussion and analysis of our financial condition and results of operations is based upon our financial statements, which have been prepared in accordance with GAAP. The preparation of these financial statements requires us to make estimates and judgments that affect the reported amounts of assets, liabilities, revenue and expenses. Certain of our accounting policies require the application of significant judgment by management in selecting the appropriate assumptions for calculating financial estimates. By their nature, these judgments are subject to an inherent degree of uncertainty. These judgments are based on our historical experience, terms of existing contracts, our evaluation of trends in the industry, information provided by our clients and information available from other outside sources, as appropriate. Our actual results may differ from these estimates. The accounting policies that we believe to be the most critical to an understanding of our financial condition and results of operations and that require the most complex and subjective management judgments are discussed below.
Revenue Recognition, Unbilled Receivables and Estimated Liability for Refunds and Appeals
We base our net revenue on specific contracts with our clients. These contracts generally specify: (a) time periods covered by the work to be performed; (b) nature and extent of services we are to provide; (c) the client's duties in assisting and cooperating with us; and (d) fees payable to us. Our fees earned are most often expressed as a specified percentage of our findings and, in limited cases, as a flat fee. For those clients where we identify any payment errors in advance of payment to the providers, the clients reduce the amount paid to the providers based upon the savings we have identified. For those clients where we identify payment errors after the client has made payment, clients generally recover claims either by taking credits against outstanding payables or future purchases from the related providers or vendors or receiving refund checks directly from those vendors. The manner in which a claim is recovered by a client often is dictated by industry practice. In addition, many clients establish specific procedural guidelines that we must satisfy prior to submitting claims for client approval, and these guidelines are unique to each client.
We generally recognize revenue for performance fee-based contracts when we have determined our clients have received economic value. This is determined generally through credits taken against existing accounts payable due to the providers or vendors, refund checks received from those vendors, or evidence of reduced payments to providers based upon savings identified by us. Additionally, the following criteria must be met: (a) persuasive evidence of an arrangement exists; (b) services have been rendered; (c) the fee billed to the client is fixed or determinable and (d) collectability is reasonably assured.
We derive a relatively small portion of revenue on a “fee-for-service” basis whereby billing is based upon a flat fee or a fee per hour. We recognize revenue for these types of services ratably over the contract term, and when criteria (a) through (d) as set forth above are met.
Historically, there has been a certain amount of revenue with respect to which, even though we had met the requirements of our revenue recognition policy, the claim is ultimately rejected. In such cases, our clients may request a refund or offset if their providers or vendors ultimately reject the payment inaccuracies we find or if our clients determine not to pursue reimbursement from their providers or vendors even though we may have collected fees. We record any such refunds as a reduction of revenue. We compute an estimate of our refund liabilities at any given time based on actual historical refund data by type of client. We satisfy such refund liabilities either by offsets to amounts otherwise due from clients or by cash refunds to clients.
In addition to the refund liabilities, we calculate client specific reserves where we determine an additional reserve may be necessary.
The appeal process established by CMS under our Medicare RAC contract includes five levels of appeals which can extend in excess of two years. Healthcare providers have the right to appeal a claim and may pursue additional appeals if the initial appeal is found in favor of CMS. We accrue an estimated liability for appeals based on the amount of fees that are subject to appeals, closures or other adjustments and those which we estimate are probable of being returned to CMS following a successful appeal by the providers. Our estimates are based on our historical experience with the Medicare RAC appeal process.
At December 31, 2016 and December 31, 2015, a total of $41.0 million and $33.4 million, respectively, was presented as an estimated allowance for refunds and appeals, representing our estimate of claims that may be overturned related to amounts in accounts receivable. At December 31, 2016 and December 31, 2015, a total of $62.5 million and
71
$67.8 million, respectively, was presented as an estimated liability for refunds and appeals, representing our estimate of claims that may be overturned related to revenue which had already been collected.
Our assumptions are based on historical refund data by our clients. We do not believe that we face a risk of significant loss in excess of the amounts accrued, other than a contingent liability of up to $13.0 million for refunds and appeals under our original Medicare RAC contract. Any future changes to our customer contracts, including further modifications to our original and/or new Medicare RAC contract, may require us to apply different estimates and assumptions, which in turn could impact both our revenue and our estimated liability for refunds and appeals in future periods.
Unbilled receivables represent revenue recognized related to claims for which clients have received economic value that were not invoiced at the balance sheet date. As of December 31, 2016 and December 31, 2015, approximately $51.6 million and $51.8 million, respectively, related to unbilled receivables were included in accounts receivable on our Consolidated Balance Sheets.
Certain unbilled receivables arise when a portion of our earned fee is deferred at the time of the initial invoice. At a later date (which can be up to a year after original invoice, and at other times, a year after completion of the audit period based on contractual terms or as agreed with our client), we invoice the unbilled receivable amount. Notwithstanding the deferred due date, our clients acknowledge we have earned this unbilled receivable at the time of the original invoice, but we have agreed to defer billing the client for the related services. As of December 31, 2016 and December 31, 2015, approximately $6.1 million and $6.4 million, respectively, related to unbilled receivables of this nature were included in accounts receivable on our Consolidated Balance Sheets.
We record periodic changes in unbilled receivables and refund liabilities as adjustments to revenue.
Impairment of Long-Lived Assets
We review long-lived assets, including property and equipment and intangible assets with definite lives, for impairment whenever events or changes in circumstances indicate the carrying amount of an asset may not be recoverable. If circumstances require the asset or asset group be tested for possible impairment, we first compare undiscounted cash flows expected to be generated by the asset or asset group to its carrying value. If the carrying value of the asset or asset group is not recoverable on an undiscounted cash flow basis, an impairment loss is recognized to the extent the carrying value exceeds its fair value. We determine fair value through various valuation techniques including discounted cash flow models, quoted market values and third party independent appraisals, as considered necessary. See Note 2 to our audited consolidated financial statements included elsewhere in this Annual Report on Form 10-K for additional information on impairment testing results.
We estimate the fair value of long-lived intangible assets using the excess earnings approach. The excess earnings approach considers factors such as the wasting nature of intangible assets and the allowance of a fair return on the net tangible assets and other intangible assets employed in determining an appropriate fair value. This approach also includes performing discounted cash flow analyses which utilize projected cash flows as well as a residual value, which is discounted to the present value in order to arrive at fair value. We rely on the following key assumptions in our discounted cash flows analysis:
|
· |
Projected revenues based on our estimates; |
|
· |
Discount rate applied to forecasted future cash flows to calculate the present value of those cash flows; and |
|
· |
Long-term growth rate applied to our last year forecasted cash flows to calculate the residual value of our future cash flows. |
The determination of the above inputs involves significant estimates and assumptions about several highly subjective variables. Our estimates and assumptions may be based, in part, on the availability of market data. We base our fair value estimates on assumptions we believe are reasonable, but recognize that the assumptions are inherently uncertain.
72
Based on the facts and circumstances surrounding our Medicare RAC contract, including continued delays with the contract renewal process, as well as scope reductions that have resulted in a decrease to future revenue projections (see Note 8 to our consolidated financial statements included elsewhere in this Annual Report on Form 10-K for additional information), we performed an impairment review of our customer relationship intangible asset related to our Medicare RAC contract with CMS during the year ended December 31, 2014.
The discount rate and long-term growth rates used were 10.5% and 2.3%, respectively. As a result of this review, we recognized a $74.0 million impairment charge for the year ended December 31, 2014 due to a change in the estimated fair value of this customer relationship intangible asset associated with the Medicare RAC contract, bringing its carrying value to $4.7 million at the time of the impairment. Unfavorable changes in the above key assumptions may impact future testing results and could lead to further impairment of our customer relationship intangible asset related to our Medicare RAC contract with CMS, which had a remaining value of $3.5 million as of December 31, 2016.
Goodwill and Indefinite — Lived Intangible Assets
Goodwill is an asset representing the future economic benefits arising from other assets acquired in a business combination which are not individually identified and separately recognized. We do not amortize goodwill. Goodwill has resulted from the Advent Acquisition in 2012 and from the Connolly iHealth Merger in 2014 as described in Note 4 to our audited consolidated financial statements included elsewhere in this Annual Report on Form 10-K. As of December 31, 2016, we had goodwill of approximately $1.2 billion, which represented approximately 60% of our consolidated total assets.
We review goodwill for impairment at least annually. An entity is permitted to make a qualitative assessment of whether it is more likely than not that a reporting unit's fair value is less than its carrying amount before applying the two-step goodwill impairment test. If an entity concludes it is not more likely than not that the fair value of a reporting unit is less than its carrying amount, it need not perform the two-step quantitative impairment test as required in FASB ASC Topic 350, Intangibles—Goodwill and Other. Otherwise, the entity must perform the two-step quantitative impairment test. Under the first step, the fair value of the reporting unit is compared with its carrying value (including goodwill). If the fair value of the reporting unit is less than its carrying value, an indication of goodwill impairment exists for the reporting unit and the entity must perform step two of the impairment test (measurement). Under step two, an impairment loss is recognized for any excess of the carrying amount of the reporting unit's goodwill over the implied fair value of related goodwill. The implied fair value of goodwill is determined by allocating the fair value of the reporting unit in a manner similar to a purchase price allocation and the residual fair value after this allocation is the implied fair value of the reporting unit goodwill. Fair value of the reporting unit is determined using a discounted cash flow analysis. If the fair value of the reporting unit exceeds its carrying value, step two does not need to be performed.
We estimate reporting unit fair value using the income approach. We perform discounted cash flow analyses which utilize projected cash flows as well as a residual value, which is discounted to the present value in order to arrive at reporting unit fair value. The determination of whether or not goodwill has become impaired involves a significant level of judgment in the assumptions and estimates underlying the approach used to determine the value of our reporting units. Actual results could differ from management's estimates, and such differences could be material to our consolidated financial position and results of operations. We rely on the following key assumptions, which require significant judgment and estimates, in our discounted cash flows analysis:
|
· |
Reporting unit projected revenues based on our best estimates; |
|
· |
Discount rate applied to forecasted future cash flows to calculate the present value of those cash flows; and |
|
· |
Long-term growth rate applied to our last year forecasted cash flows to calculate the residual value of our future cash flows. |
Our annual impairment analysis is completed as of October 1 of each year. In our October 1, 2016 analysis, we performed the qualitative assessment for our Healthcare reporting unit and concluded it was not more likely than not that the reporting unit’s fair value was less than its carrying amount. For our Global Retail and Other reporting unit, the results of the Step 1 test indicated the excess of the estimated fair value of the reporting unit compared to its carrying value was 27%. Our analysis included the use of a discount rate for our Global Retail and Other reporting unit of 13.0%. The long-term growth rate used for our Global Retail and Other reporting unit was 0.0%. Unfavorable changes in these
73
key assumptions could impact testing results and could lead to a potential failure in the first step of the goodwill impairment testing process. Given the significant excess of the fair value over the carrying value for our Global Retail and Other reporting unit, we do not believe an inconsequential change in the discount rate or long-term growth rate assumption would have a significant impact.
Intangible assets with indefinite lives which are not being amortized, including certain trademarks, are tested for impairment at least annually. An entity is allowed to first assess qualitative factors to determine whether the existence of events and circumstances indicates it is more likely than not that an indefinite-lived intangible asset is impaired. If it is determined a quantitative assessment is necessary, then the fair value of the intangible asset is compared to its carrying value. If the carrying value is greater than the implied fair value of the intangible asset, an impairment is recognized for the excess amount.
We perform our annual impairment review of indefinite-lived intangible assets at October 1, or when a triggering event occurs between annual impairment tests. A $27.8 million impairment related to our trademarks was recorded during the year ended December 31, 2015 as a result of our Cotiviti rebranding in September 2015. No impairment charges for goodwill and indefinite-lived intangible assets were recorded for the years ended December 31, 2016 and December 31, 2014. See Notes 6 and 7 to our audited consolidated financial statements included elsewhere in this Annual Report on Form 10-K for additional information on impairment testing results.
Income Taxes
We account for income taxes using the asset and liability method. We recognize deferred tax assets and liabilities for the future tax consequences attributable to differences between the financial statement carrying amounts of existing assets and liabilities and their respective tax bases, as well as for tax attributes such as operating loss and tax credit carryforwards. Deferred tax assets and liabilities are measured using enacted tax rates expected to apply to taxable income in the years in which those temporary differences are expected to be recovered or settled. The effect on deferred tax assets and liabilities of a change in tax rates is recognized in income in the period that includes the enactment date.
We recognize net deferred tax assets to the extent that we believe these assets are more likely than not to be realized. In making such a determination, we consider all available positive and negative evidence, including future reversals of existing taxable temporary differences, projected future taxable income, tax-planning strategies and results of recent operations. In the event we determine that we would be able to realize our deferred tax assets in the future in excess of their net recorded amount, we reduce the deferred tax asset valuation allowance and record a benefit in our provision for income taxes in the Consolidated Statements of Comprehensive Income (Loss).
We record liabilities related to uncertain tax positions in accordance with ASC 740, Income Taxes, on the basis of a two-step process whereby (1) we determine whether it is more likely than not that the tax positions will be sustained on the basis of the technical merits of the position and (2) for those tax positions that meet the more likely than not recognition threshold, we recognize the largest amount of tax benefit that is more than 50% likely to be realized upon ultimate settlement with the related tax authority. We recognize interest and penalties related to unrecognized tax benefits within the income tax provision in the accompanying Consolidated Statements of Comprehensive Income (Loss). Accrued interest and penalties are included within accounts payable and accrued other expenses in the Consolidated Balance Sheets.
Stock-Based Compensation
Equity Incentive Plans
We grant options to purchase shares of our common stock, restricted stock and certain other equity awards to directors, officers and key employees under our 2012 Plan. The issuance of up to 7,243,330 shares of our common stock was authorized under the 2012 Plan. Upon completion of our IPO, issuances under the 2012 Plan were suspended. At that time, we adopted our 2016 Plan. The 2016 Plan was established with the authorization for grants of up to 5,490,000 shares of authorized but unissued shares of common stock.
No stock options were granted under the 2012 Plan after December 31, 2015. Awards granted under the 2012 Plan will remain outstanding until the earlier of exercise, forfeiture, cancellation or expiration. To the extent outstanding options under the 2012 Plan are forfeited, cancelled or terminated, the common stock subject to such options will be
74
available for future issuance under the 2016 Plan. As of December 31, 2016, there are no shares available for future issuance under the 2012 Plan as it was discontinued upon adoption of the 2016 Plan. As of December 31, 2016 the total number of shares available for future issuance under the 2016 Plan is 5,277,451.
Stock Options
Under the terms of the 2016 Plan, we may issue options to purchase shares of our common stock at a price equal to 100% of the market price on the date of grant. Issuances under the 2012 Plan, prior to its suspension, were under terms similar to issuances under the 2016 Plan. Stock options granted are subject to either time of service (service-based awards) or performance (performance-based awards) criteria. Service-based awards typically vest ratably over a five year service period from the date of grant under the 2012 Plan and typically vest ratably over a four year service period from the date of grant under the 2016 Plan. In the event of a change in control, any outstanding, unvested service-based awards will vest immediately. Performance-based awards vest in accordance with the specific performance criteria espoused in the executed award agreements. The term of any stock option shall not exceed ten years from the date of grant. However, an incentive stock option granted to an employee who, at the time of grant, owns stock possessing more than 10% of the total combined voting power of all classes of our stock may not have a term exceeding five years from the date of grant.
The following table sets forth the options granted, exercised, forfeited or expired under the Equity Plans for the periods presented:
|
|
|
Year Ended December 31, |
|
||||||||
|
|
|
2016 |
|
2015 |
|
||||||
|
|
|
|
|
Weighted |
|
|
|
Weighted |
|
||
|
|
|
|
|
average |
|
|
|
average |
|
||
|
|
|
|
|
exercise |
|
|
|
exercise |
|
||
|
|
|
Shares |
|
price |
|
Shares |
|
price |
|
||
|
Outstanding at beginning of period |
|
6,441,527 |
|
$ |
9.59 |
|
5,024,234 |
|
$ |
7.98 |
|
|
Granted |
|
273,759 |
|
|
19.59 |
|
1,997,964 |
|
|
13.76 |
|
|
Exercised |
|
(574,991) |
|
|
7.41 |
|
(25,620) |
|
|
6.26 |
|
|
Forfeited |
|
(127,233) |
|
|
12.92 |
|
(555,051) |
|
|
10.16 |
|
|
Expired |
|
(15,690) |
|
|
13.60 |
|
— |
|
|
— |
|
|
Outstanding at end of period |
|
5,997,372 |
|
$ |
10.18 |
|
6,441,527 |
|
$ |
9.59 |
|
The criteria associated with 2,746,592 of our outstanding performance-based stock options as defined in the terms of the award agreements, was satisfied as of September 30, 2016 and therefore these stock options all became vested and exercisable.
Aggregate intrinsic value represents the difference between our estimated fair value of common stock and the exercise price of outstanding in-the-money options. The fair value of common stock was $34.40 as of December 30, 2016 based upon the closing price of our common stock on the NYSE. The total intrinsic value of options exercised was $15.5 million for the year ended December 31, 2016 and was insignificant for the year ended December 31, 2015. The total fair value of stock options vested was $22.5 million, $2.5 million and $2.0 million during the years ended December 31, 2016, 2015 and 2014, respectively.
Restricted Stock Units
We may also issue restricted stock units “RSUs”, which provide participants the right to receive shares of our common stock on the vesting date of the underlying RSUs. RSUs may be subject to vesting requirements, restrictions and conditions to payment. Such requirements may be based on the continued service for a specified time period or on the attainment of specified performance goals as specified in the award agreements. RSUs are payable in cash or in shares or a combination of both. We began issuing RSUs upon adoption of the 2016 Plan; no RSUs were issued under the 2012 Plan. Under the terms of the 2016 Plan, RSUs have a grant date fair value equal to the closing price of our stock on the grant date. The units typically vest ratably over a four year service period.
75
The following is a summary of RSU activity under the 2016 Plan:
|
|
|
Year Ended December 31, |
|
|||
|
|
|
2016 |
|
|||
|
|
|
|
|
Weighted |
|
|
|
|
|
|
|
average |
|
|
|
|
|
|
|
grant date |
|
|
|
|
|
Shares |
|
fair value |
|
|
|
Nonvested at beginning of period |
|
— |
|
$ |
— |
|
|
Granted |
|
67,295 |
|
|
25.88 |
|
|
Vested |
|
— |
|
|
— |
|
|
Forfeited |
|
— |
|
|
— |
|
|
Nonvested at end of period |
|
67,295 |
|
$ |
25.88 |
|
Stock-Based Compensation Expense
The fair value of each stock option award is estimated on the date of grant using a Black-Scholes-Merton option pricing model. The expected term of the option represents the period the stock-based awards are expected to be outstanding. We use the simplified method under the provisions of ASC 718, Compensation – Stock Compensation, for estimating the expected term of the options. Since our shares were not publicly traded until May 2016 and were rarely traded privately, at the time of each grant, there was insufficient volatility data available. Accordingly, we calculate expected volatility using comparable peer companies with publicly traded shares over a term similar to the expected term of the options issued. We do not intend to pay dividends on our common shares, and therefore, the dividend yield percentage is zero. The risk free interest rate is based on the U.S. Treasury constant maturity interest rate whose term is consistent with the expected life of our stock options.
We used the following weighted average assumptions to estimate the fair value of stock options granted for the periods presented:
|
|
|
Year Ended December 31, |
|
||||
|
|
|
2016 |
|
2015 |
|
||
|
Expected term (years) |
|
|
6.25 |
|
|
6.25 |
|
|
Expected volatility |
|
|
50.00 |
% |
|
50.00 |
% |
|
Expected dividend yield |
|
|
0.00 |
% |
|
0.00 |
% |
|
Weighted average risk-free interest rate |
|
|
1.36 |
% |
|
1.70 |
% |
|
Weighted average grant date fair value |
|
$ |
9.53 |
|
$ |
7.77 |
|
We recorded total stock-based compensation expense of $23.0 million, $3.4 million and $2.5 million for the years ended December 31, 2016, 2015 and 2014, respectively. Stock-based compensation expense during the year ended December 31, 2016 includes $15.9 million related to the vesting of all outstanding performance-based stock options. Stock-based compensation expense during the year ended December 31, 2016 also includes $2.3 million related to the accelerated vesting of certain stock options as the result of our IPO. We had not previously adjusted stock-based compensation expense for estimated forfeitures as there has been insignificant forfeiture activity to date. We account for forfeitures as they occur. As of December 31, 2016, we had total unrecognized compensation cost related to 1,784,212 unvested service-based stock options and RSUs under the Equity Plans of $13.3 million which we expect to recognize over the next 3.1 years.
The valuation of our common stock was determined in accordance with the guidelines set forth in the AICPA Practice Aid, Valuation of Privately-Held Company Equity Securities Issued as Compensation. Since our shares were not publicly traded until May 2016, we considered numerous objective and subjective factors to determine our best estimate of the fair value of our common stock, including but not limited to:
|
· |
Our historical financial results and estimated trends and prospects for future financial performance; and |
|
· |
Third party valuations in connection with our annual goodwill impairment testing. |
76
Since 2014, we issued options to purchase shares of our common stock at the following exercise prices (as adjusted to reflect stock split and Special Cash Dividend):
|
|
|
|
|
|
|
|
Grant Date |
|
|
|
|
|
Options |
|
Exercise |
|
Fair Value |
|
||
|
Option Grant Date |
|
Granted |
|
Price |
|
Common Stock |
|
||
|
January 2, 2014 |
|
61,000 |
|
$ |
6.26 |
|
$ |
9.73 |
|
|
September 26, 2014 |
|
1,704,950 |
|
$ |
11.33 |
|
$ |
13.27 |
|
|
June 2, 2015 |
|
24,584 |
|
$ |
11.33 |
|
$ |
11.83 |
|
|
November 23, 2015 |
|
1,948,844 |
|
$ |
13.79 |
|
$ |
15.73 |
|
|
December 1, 2015 |
|
24,584 |
|
$ |
13.79 |
|
$ |
15.73 |
|
|
May 25, 2016 |
|
258,877 |
|
$ |
19.00 |
|
$ |
19.00 |
|
|
July 1, 2016 |
|
3,356 |
|
$ |
21.32 |
|
$ |
21.32 |
|
|
September 1, 2016 |
|
1,848 |
|
$ |
32.53 |
|
$ |
32.53 |
|
|
December 1, 2016 |
|
9,678 |
|
$ |
32.24 |
|
$ |
32.24 |
|
Since 2014, we have issued the following RSUs:
|
|
|
|
|
Grant Date |
|
|
|
|
|
RSUs |
|
Fair Value |
|
|
|
RSU Grant Date |
|
Granted |
|
RSUs |
|
|
|
May 25, 2016 |
|
31,588 |
|
$ |
19.00 |
|
|
July 1, 2016 |
|
1,678 |
|
$ |
21.32 |
|
|
September 1, 2016 |
|
29,190 |
|
$ |
32.53 |
|
|
December 1, 2016 |
|
4,839 |
|
$ |
32.24 |
|
We estimated the fair value of our common stock prior to our IPO using the market approach and income approach, in order to assist our Board in assigning an exercise price to future stock grants. We believe both of these approaches were appropriate methodologies given our stage of development at that time. For the market approach, we utilized the guideline company method by analyzing a population of comparable companies and selected those companies that we considered to be the most comparable to us in terms of size, growth, profitability, risk and return on investment, among others. We then used these guideline companies to develop relevant market multiples and ratios, which were applied to our corresponding financial projections to estimate our total enterprise value. We also included a lack of marketability discount given we were not publicly traded and there was not an active market for our common stock. We relied on the following key assumptions for the market approach:
|
· |
Our projected revenue determined as of the valuation date based on our estimates; and |
|
· |
Multiples of market value to expected future revenue, determined as of the valuation date, based on a group of comparable companies. |
For the income approach, we performed discounted cash flow analyses which utilized projected cash flows as well as a residual value, which were discounted to the present value in order to arrive at an enterprise value. We relied on the following key assumptions for the income approach in addition to management projections discussed above:
|
· |
Discount rate applied to forecasted future cash flows to calculate the present value of those cash flows; and |
|
· |
Terminal value multiple applied to our last year forecasted cash flows to calculate the residual value of our future cash flows. |
The fair value of options and RSUs issued subsequent to our IPO is based on the closing price of our common stock on the NYSE on the grant date.
Off-Balance Sheet Arrangements
Except for operating leases and certain letters of credit entered into in the normal course of business, we do not have any off-balance sheet arrangements that have or are reasonably likely to have a current or future effect on our
77
financial condition, changes in financial condition, revenue or expenses, results of operations, liquidity, capital expenditures or capital resources that is material to investors.
Jumpstart Our Business Startups Act of 2012
We qualify as an “emerging growth company” pursuant to the provisions of the JOBS Act. For as long as we are an “emerging growth company,” we may take advantage of certain exemptions from various reporting requirements that are applicable to other public companies that are not “emerging growth companies,” including, but not limited to, not being required to comply with the auditor attestation requirements of Section 404(b) of the Sarbanes-Oxley Act, reduced disclosure obligations regarding executive compensation in our periodic reports and proxy statements, and exemptions from the requirements of holding advisory “say-on-pay” votes on executive compensation and stockholder advisory votes on golden parachute compensation. Under the JOBS Act, we will remain an “emerging growth company” until the earliest of:
|
· |
the last day of the fiscal year during which we have total annual gross revenues of $1 billion or more; |
|
· |
the last day of the fiscal year following the fifth anniversary of the completion of our IPO; |
|
· |
the date on which we have, during the previous three-year period, issued more than $1 billion in non-convertible debt; and |
|
· |
the date on which we are deemed to be a “large accelerated filer” under the Exchange Act, which will be the first day of the first fiscal year after we have (i) more than $700 million in outstanding common equity held by our non-affiliates as of the last day of our most recently completed second fiscal quarter, (ii) been a public company for at least 12 months and (iii) filed at least one annual report with the SEC. The value of our outstanding common equity will be measured each year on the last day of our second fiscal quarter. |
The JOBS Act also provides that an “emerging growth company” can utilize the extended transition period provided in Section 7(a)(2)(B) of the Securities Act for complying with new or revised accounting standards. However, we chose to opt out of that extended transition period, and, as a result, we will comply with new or revised accounting standards on the relevant dates on which adoption of such standards is required for companies that are not “emerging growth companies.” Under Section 107 of the JOBS Act, our decision to opt out of the extended transition period for complying with the new or revised accounting standards is irrevocable.
Recently Issued Accounting Pronouncements
In January 2017, the FASB issued ASU 2017-04, Simplifying the Test for Goodwill Impairment (“ASU 2017-04”), which is intended to simplify how an entity is required to test goodwill for impairment by eliminating Step 2 from the goodwill impairment test. Step 2 measures a goodwill impairment loss by comparing the implied fair value of a reporting unit’s goodwill with the carrying amount of the goodwill. Instead, an entity should compare the fair value of a reporting unit with its carrying amount and recognize an impairment charge for the amount by which the carrying amount exceeds the reporting unit’s fair value and should not exceed the total amount of goodwill allocated to that reporting unit. The guidance is effective for public companies with annual reporting periods beginning after December 15, 2019, and interim periods within those annual periods. Early adoption is permitted. We are evaluating this new guidance and do not believe it will have a material impact on our consolidated financial statements and related disclosures as the fair values of our reporting units exceed their carrying values.
In November 2016, the FASB issued ASU 2016-18, Restricted Cash (“ASU 2016-18”), which requires that restricted cash be included with cash and cash equivalents when reconciling the beginning and end of period total amounts shown on the statement of cash flows. The guidance is effective for public companies with annual reporting periods beginning after December 15, 2017, and interim periods within those annual periods. Early adoption is permitted. We are evaluating this guidance and its impact on our consolidated financial statements and related disclosures and expect the adoption of this ASU could impact the disclosure of our cash flows from operations.
In August 2016, the FASB issued ASU 2016-15, Classification of Certain Cash Receipts and Cash Payments (“ASU 2016-15”), which addresses eight specific cash flow issues in order to reduce diversity in practice. The guidance is effective for public companies with annual reporting periods beginning after December 15, 2017, and interim periods
78
within those annual periods. Early adoption is permitted. We are evaluating this guidance and its impact on our consolidated financial statements and related disclosures.
In March 2016, the FASB issued ASU 2016-09, Improvements to Employee Share-Based Payment Accounting (“ASU 2016-09”), which simplifies several aspects of the accounting for share based compensation. ASU 2016-09 changes several aspects of the accounting for share based payment award transactions, including 1) accounting for income taxes, 2) classification of excess tax benefits on the statement of cash flows, 3) forfeitures, 4) minimum statutory tax withholding requirements and 5) classification of employee taxes paid on the statement of cash flows when an employer withholds shares for tax-withholding purposes. We early adopted ASU 2016-09 during the third quarter of 2016, which did not result in any significant changes to our current or prior period consolidated financial statements. As a result of this adoption, we recorded an excess tax benefit of approximately $4.0 million during the fourth quarter 2016 related to stock option exercises. In conjunction with adopting ASU 2016-09 we also made an accounting policy election to account for forfeitures as they occur.
In February 2016, the FASB issued ASU 2016-02, Leases (“ASU 2016-02”), which changes the accounting recognition, measurement and disclosure for leases in order to increase transparency. ASU 2016-02 requires lease assets and liabilities to be recognized on the balance sheet and key information about leasing arrangements to be disclosed. The guidance is effective for public companies with annual reporting periods beginning after December 15, 2018, including interim periods within that reporting period. Early adoption is permitted. We are evaluating this new guidance and its impact on our consolidated financial statements and related disclosures.
In January 2016, the FASB issued ASU 2016-01, Recognition and Measurement of Financial Assets and Financial Liabilities (“ASU 2016-01”), which changes the current financial instruments model primarily impacting the accounting for equity investments, financial liabilities under the fair value option, and the presentation and disclosure requirements for financial instruments. The guidance is effective for public companies with annual reporting periods beginning after December 15, 2017, including interim periods within that reporting period. We are evaluating this new guidance and do not believe it will have a material impact on our consolidated financial statements and related disclosures.
In November 2015, the FASB issued ASU 2015‑17, Balance Sheet Classification of Deferred Taxes, (“ASU 2015‑17”), which requires entities with a classified balance sheet to present all deferred tax assets and liabilities as noncurrent. The guidance is effective for public companies with annual and interim periods beginning after December 15, 2016. We early adopted the provisions of ASU 2015-17 as of December 31, 2016 and prior period amounts have been reclassified to conform to the current period presentation. As of December 31, 2015, $32.9 million of current deferred tax assets have been to long-term deferred tax liabilities in the consolidated balance sheet. The adoption of ASU 2015-17 did not materially impact our consolidated financial position, results of operations or cash flows but did reduce our calculation of working capital.
In April 2015, the FASB issued ASU 2015-05, Customer’s Accounting for Fees Paid in a Cloud Computing Arrangement (“ASU 2015-05”), which established guidance regarding the accounting for software licenses. ASU 2015‑05 was effective for annual reporting periods, including interim periods, beginning after December 15, 2015. We prospectively adopted the provisions of ASU 2015-05 as of January 1, 2016 and have not yet had any material contracts that were impacted by this new guidance.
In April 2015, the FASB issued ASU 2015‑03, Simplifying the Presentation of Debt and Issuance Costs (“ASU 2015‑03”), which establishes guidance to simplify the presentation of debt issuance costs by requiring debt issuance costs related to a recognized debt liability be presented in the balance sheet as a direct deduction from the carrying amount of that liability, consistent with debt discounts. Prior to the issuance of ASU 2015-03, debt issuance costs were required to be presented as an asset in the balance sheet. The guidance is effective for annual reporting periods beginning after December 15, 2015, and interim periods within that reporting period. We adopted the provisions of ASU 2015-03 as of January 1, 2016 and prior period amounts have been reclassified to conform to the current period presentation. As of December 31, 2015, $21.0 million of debt issuance costs were reclassified in the consolidated balance sheet from debt issuance costs, net to long-term debt. The adoption of ASU 2015-03 did not materially impact our consolidated financial position, results of operations or cash flows.
In May 2014, the FASB issued ASU 2014‑09, Revenue from Contracts with Customers (Topic 606) (“ASU 2014‑09”), which supersedes existing revenue recognition guidance and provides clarification of principles for
79
recognizing revenue from contracts with customers. ASU 2014-09 sets forth a five-step model for determining when and how revenue is recognized. The core principle of the new standard is that a company should recognize revenue to depict the transfer of promised goods or services to customers in an amount that reflects the consideration to which the company expects to be entitled in exchange for those goods or services. Additional disclosures will be required to describe the nature, amount, timing and uncertainty of revenue and cash flows arising from customer contracts. The two permitted transition methods under ASU 2014-09 are the full retrospective method, in which case the new guidance would be applied to each prior reporting period presented and the cumulative effect of applying the standard would be recognized at the earliest period shown, or the modified retrospective method, in which case the cumulative effect of applying the standard would be recognized at the date of the initial application. The guidance is effective for public companies with annual periods beginning after December 15, 2017 and interim periods within that reporting period. Early adoption is permitted, but not before the original effective date of annual reporting periods beginning after December 15, 2016.
We have formed an internal team to evaluate and quantify the potential impact of this new revenue guidance. As of the date of this filing, we have made significant progress on our contract reviews and policy drafting. We will continue to evaluate this new guidance and plan to provide additional information about our method of adoption and the impact, if any, on our consolidated financial statements and related disclosures in future filings.
Item 7A. Quantitative and Qualitative Disclosures About Market Risks
We are exposed to market risks relating to interest rate fluctuations and inflation.
Interest Rate Risk
We are exposed to interest rate risk on our First Lien Credit Facilities, which bear interest at variable rates. As of December 31, 2016, we had $795.5 million outstanding principal amount under our First Lien Term Loans. Borrowings under the First Lien Credit Facilities bear interest at a rate per annum equal to the applicable margin, plus, at our election, either (a) a base rate determined by reference to the highest of (i) the New York Federal Reserve Bank effective rate in effect on such date plus 0.50%, (ii) LIBOR plus 1.00%, (iii) the prime commercial lending rate of the administrative agent as in effect on the relevant day and (iv) with respect to the First Lien Term B Loans only, 1.75% or (b) LIBOR determined by reference to the applicable Reuters screen page two business days prior to the commencement of the interest period relevant to the subject borrowing, adjusted for certain additional costs, which may not, (i) with respect to the First Lien Term B Loans only, be less than 0.75% and (ii) with respect to the First Lien Term A Loans and Revolver only, be less than 0.00%.
We manage our interest rate risk through the use of derivative financial instruments. Specifically, we enter into interest rate cap agreements to manage our exposure to potential interest rate increases that may result from fluctuations in the three month LIBOR. Interest rate cap agreements designated as cash flow hedges involve the receipt of variable amounts from a counterparty if interest rates rise above the strike rate on the contract in exchange for a deferred premium.
As of December 31, 2016 and December 31, 2015, we had $540.0 million and $630.0 million, respectively, in notional debt outstanding related to interest rate cap agreements, which cover interest payments through September 2019. The interest rate cap agreements outstanding as of December 31, 2016 and 2015 effectively guarantee a ceiling to the interest rate we would otherwise pay on our floating rate debt. This interest rate ceiling on all outstanding hedges is 3.00%. As of December 31, 2016, our interest rate cap agreements were designated as cash flow hedges so that changes in the fair market value of the interest rate cap agreements were included within other comprehensive (loss) income.
Based on our outstanding debt as of December 31, 2016, and assuming that our mix of debt instruments, interest rate caps and other variables remain the same, the annualized effect of a one percentage point change in variable interest rates would have an annualized pretax impact on our earnings and cash flows of approximately $7.5 million.
In the future, in order to manage our interest rate risk, we may refinance our existing debt, enter into additional interest rate cap agreements, modify our existing interest rate cap agreement or make changes that may impact our ability to treat our interest rate caps as cash flow hedges. However, we do not intend or expect to enter into derivative or interest rate cap transactions for speculative purposes.
80
Inflation Risk
We do not believe that the effects of inflation have had a material effect on our business, financial condition or results of operations. If our costs become subject to significant inflationary pressures, we may not be able to offset such increased costs through price increases. Our inability or failure to offset any such cost increases in the future could have a material adverse effect on our business, financial condition and results of operations. We cannot assure you, however, that our results of operations and financial condition will not be materially impacted by inflation in the future.
81
Item 8. Financial Statements and Supplementary Data.
COTIVITI HOLDINGS, INC.
Index to Consolidated Financial Statements
82
Report of Independent Registered Public Accounting Firm
The Board of Directors and Stockholders
Cotiviti Holdings, Inc.:
We have audited the accompanying consolidated balance sheets of Cotiviti Holdings, Inc. and subsidiaries (the Company) as of December 31, 2016 and 2015, and the related consolidated statements of comprehensive income (loss), stockholders’ equity, and cash flows for each of the years in the three-year period ended December 31, 2016. In connection with our audits of the consolidated financial statements, we also have audited Schedule I and II. These consolidated financial statements and financial statement schedules are the responsibility of the Company’s management. Our responsibility is to express an opinion on these consolidated financial and financial statement schedules based on our audits.
We conducted our audit in accordance with the standards of the Public Company Accounting Oversight Board (United States). Those standards require that we plan and perform the audit to obtain reasonable assurance about whether the financial statements are free of material misstatement. An audit includes examining, on a test basis, evidence supporting the amounts and disclosures in the financial statements. An audit also includes assessing the accounting principles used and significant estimates made by management, as well as evaluating the overall financial statement presentation. We believe that our audit provides a reasonable basis for our opinion.
In our opinion, the consolidated financial statements referred to above present fairly, in all material respects, the financial position of Cotiviti Holdings, Inc. and subsidiaries as of December 31, 2016 and 2015, and the results of their operations and their cash flows for each of the years in the three-year period ended December 31, 2016, in conformity with U.S. generally accepted accounting principles. Also, in our opinion, the related financial statement schedules, when consideration in relation to basic consolidated financial statements taken as a whole, present fairly, in all material respects, the information set forth therein.
/s/ KPMG LLP
New York, New York
February 23, 2017
83
(In thousands, except share and per share amounts)
|
|
|
December 31, |
|
||||
|
|
|
2016 |
|
2015 |
|
||
|
ASSETS |
|
|
|
|
|
|
|
|
Current assets: |
|
|
|
|
|
|
|
|
Cash and cash equivalents |
|
$ |
110,635 |
|
$ |
149,365 |
|
|
Restricted cash |
|
|
9,103 |
|
|
10,741 |
|
|
Accounts receivable, net of allowance for doubtful accounts of $851 and $1,053 at December 31, 2016 and 2015, respectively; and net of estimated allowance for refunds and appeals of $41,020 and $33,406 at December 31, 2016 and 2015, respectively |
|
|
67,735 |
|
|
78,856 |
|
|
Prepaid expenses and other current assets |
|
|
14,957 |
|
|
24,044 |
|
|
Total current assets |
|
|
202,430 |
|
|
263,006 |
|
|
Property and equipment, net |
|
|
67,640 |
|
|
57,452 |
|
|
Goodwill |
|
|
1,196,024 |
|
|
1,197,044 |
|
|
Intangible assets, net |
|
|
533,305 |
|
|
594,410 |
|
|
Other long-term assets |
|
|
2,864 |
|
|
2,176 |
|
|
TOTAL ASSETS |
|
$ |
2,002,263 |
|
$ |
2,114,088 |
|
|
LIABILITIES AND STOCKHOLDERS' EQUITY |
|
|
|
|
|
|
|
|
Current liabilities: |
|
|
|
|
|
|
|
|
Current maturities of long-term debt |
|
$ |
18,000 |
|
$ |
21,099 |
|
|
Customer deposits |
|
|
9,103 |
|
|
10,741 |
|
|
Accounts payable and accrued other expenses |
|
|
23,162 |
|
|
29,521 |
|
|
Accrued compensation costs |
|
|
58,589 |
|
|
42,902 |
|
|
Estimated liability for refunds and appeals |
|
|
62,539 |
|
|
67,775 |
|
|
Total current liabilities |
|
|
171,393 |
|
|
172,038 |
|
|
Long-term liabilities: |
|
|
|
|
|
|
|
|
Long-term debt |
|
|
762,202 |
|
|
1,012,971 |
|
|
Other long-term liabilities |
|
|
8,799 |
|
|
12,199 |
|
|
Deferred tax liabilities |
|
|
120,533 |
|
|
129,284 |
|
|
Total long-term liabilities |
|
|
891,534 |
|
|
1,154,454 |
|
|
Total liabilities |
|
|
1,062,927 |
|
|
1,326,492 |
|
|
Commitments and contingencies (Note 8) |
|
|
|
|
|
|
|
|
Stockholders' equity: |
|
|
|
|
|
|
|
|
Common stock ($0.001 par value; 600,000,000 and 122,000,000 shares authorized, 90,748,740 and 77,237,711 issued, and 90,741,340 and 77,230,311 outstanding at December 31, 2016 and 2015, respectively) |
|
|
91 |
|
|
77 |
|
|
Additional paid-in capital |
|
|
911,582 |
|
|
807,419 |
|
|
Retained earnings (deficit) |
|
|
33,917 |
|
|
(14,935) |
|
|
Accumulated other comprehensive loss |
|
|
(6,156) |
|
|
(4,867) |
|
|
Treasury stock, at cost (7,400 shares at December 31, 2016 and 2015) |
|
|
(98) |
|
|
(98) |
|
|
Total stockholders' equity |
|
|
939,336 |
|
|
787,596 |
|
|
TOTAL LIABILITIES AND STOCKHOLDERS' EQUITY |
|
$ |
2,002,263 |
|
$ |
2,114,088 |
|
See accompanying notes to consolidated financial statements.
84
Cotiviti Holdings, Inc.
Consolidated Statements of Comprehensive Income (Loss)
(In thousands, except share and per share amounts)
|
|
|
Year Ended |
|
|||||||
|
|
|
December 31, |
|
|||||||
|
|
|
2016 |
|
2015 |
|
2014 |
|
|||
|
Net revenue |
|
$ |
625,162 |
|
$ |
541,343 |
|
$ |
441,372 |
|
|
Cost of revenue (exclusive of depreciation and amortization, stated separately below): |
|
|
|
|
|
|
|
|
|
|
|
Compensation |
|
|
229,601 |
|
|
183,817 |
|
|
164,552 |
|
|
Other costs of revenue |
|
|
22,167 |
|
|
20,800 |
|
|
14,536 |
|
|
Total cost of revenue |
|
|
251,768 |
|
|
204,617 |
|
|
179,088 |
|
|
Selling, general and administrative expenses (exclusive of depreciation and amortization, stated separately below): |
|
|
|
|
|
|
|
|
|
|
|
Compensation |
|
|
97,123 |
|
|
70,802 |
|
|
49,777 |
|
|
Other selling, general and administrative expenses |
|
|
59,561 |
|
|
65,943 |
|
|
42,760 |
|
|
Total selling, general and administrative expenses |
|
|
156,684 |
|
|
136,745 |
|
|
92,537 |
|
|
Depreciation and amortization of property and equipment |
|
|
20,151 |
|
|
12,695 |
|
|
7,416 |
|
|
Amortization of intangible assets |
|
|
60,818 |
|
|
61,467 |
|
|
52,355 |
|
|
Transaction-related expenses |
|
|
1,788 |
|
|
1,469 |
|
|
5,745 |
|
|
Impairment of intangible assets |
|
|
— |
|
|
27,826 |
|
|
74,034 |
|
|
Total operating expenses |
|
|
491,209 |
|
|
444,819 |
|
|
411,175 |
|
|
Operating income |
|
|
133,953 |
|
|
96,524 |
|
|
30,197 |
|
|
Other expense (income): |
|
|
|
|
|
|
|
|
|
|
|
Interest expense |
|
|
48,653 |
|
|
65,561 |
|
|
51,717 |
|
|
Loss on extinguishment of debt |
|
|
16,417 |
|
|
4,084 |
|
|
21,524 |
|
|
Other non-operating (income) expense |
|
|
(939) |
|
|
(826) |
|
|
(415) |
|
|
Total other expense (income) |
|
|
64,131 |
|
|
68,819 |
|
|
72,826 |
|
|
|
|
|
|
|
|
|
|
|
|
|
|
Income (loss) from continuing operations before income taxes |
|
|
69,822 |
|
|
27,705 |
|
|
(42,629) |
|
|
Income tax expense (benefit) |
|
|
20,970 |
|
|
14,401 |
|
|
(16,804) |
|
|
Income (loss) from continuing operations |
|
|
48,852 |
|
|
13,304 |
|
|
(25,825) |
|
|
Gain on discontinued operations, net of tax |
|
|
— |
|
|
559 |
|
|
— |
|
|
Net income (loss) |
|
$ |
48,852 |
|
$ |
13,863 |
|
$ |
(25,825) |
|
|
Other comprehensive (loss) income, net of tax: |
|
|
|
|
|
|
|
|
|
|
|
Foreign currency translation adjustments |
|
|
(923) |
|
|
(667) |
|
|
(1,293) |
|
|
Change in available-for-sale securities |
|
|
— |
|
|
3 |
|
|
— |
|
|
Change in fair value of derivative instruments |
|
|
(366) |
|
|
(2,345) |
|
|
(623) |
|
|
Total other comprehensive (loss) income |
|
|
(1,289) |
|
|
(3,009) |
|
|
(1,916) |
|
|
Comprehensive income (loss) |
|
$ |
47,563 |
|
$ |
10,854 |
|
$ |
(27,741) |
|
|
|
|
|
|
|
|
|
|
|
|
|
|
Earnings (loss) per share from continuing operations: |
|
|
|
|
|
|
|
|
|
|
|
Basic |
|
$ |
0.57 |
|
$ |
0.17 |
|
$ |
(0.40) |
|
|
Diluted |
|
$ |
0.55 |
|
$ |
0.17 |
|
$ |
(0.40) |
|
|
Earnings per share from discontinued operations: |
|
|
|
|
|
|
|
|
|
|
|
Basic |
|
$ |
— |
|
$ |
0.01 |
|
$ |
— |
|
|
Diluted |
|
$ |
— |
|
$ |
0.01 |
|
$ |
— |
|
|
Total earnings (loss) per share: |
|
|
|
|
|
|
|
|
|
|
|
Basic |
|
$ |
0.57 |
|
$ |
0.18 |
|
$ |
(0.40) |
|
|
Diluted |
|
$ |
0.55 |
|
$ |
0.18 |
|
$ |
(0.40) |
|
See accompanying notes to consolidated financial statements.
85
Cotiviti Holdings, Inc.
Consolidated Statements of Stockholders’ Equity
(In thousands, except shares)
|
|
|
|
|
|
|
|
|
|
|
|
|
|
Accumulated |
|
|
|
|
|
|
|
|
|
|
|
|
|
|
|
|
|
|
Additional |
|
|
|
|
Other |
|
|
|
|
|
|
Total |
|
|||
|
|
|
Common Stock |
|
Paid-in |
|
Retained Earnings |
|
Comprehensive |
|
Treasury Stock |
|
Stockholders' |
|
||||||||||
|
|
|
Shares |
|
Amount |
|
Capital |
|
(Deficit) |
|
Income / (Loss) |
|
Shares |
|
Amount |
|
Equity |
|
||||||
|
Balance, January 1, 2014 |
|
44,408,008 |
|
$ |
44 |
|
$ |
366,094 |
|
$ |
(2,973) |
|
$ |
58 |
|
— |
|
$ |
— |
|
$ |
363,223 |
|
|
Net loss |
|
— |
|
|
— |
|
|
— |
|
|
(25,825) |
|
|
— |
|
— |
|
|
— |
|
|
(25,825) |
|
|
Proceeds from issuance of common stock |
|
32,790,321 |
|
|
33 |
|
|
435,111 |
|
|
— |
|
|
— |
|
— |
|
|
— |
|
|
435,144 |
|
|
Stock-based compensation expense |
|
— |
|
|
— |
|
|
2,492 |
|
|
— |
|
|
— |
|
— |
|
|
— |
|
|
2,492 |
|
|
Exercise of stock options |
|
6,362 |
|
|
— |
|
|
113 |
|
|
— |
|
|
— |
|
7,400 |
|
|
(98) |
|
|
15 |
|
|
Other comprehensive loss, net |
|
— |
|
|
— |
|
|
— |
|
|
— |
|
|
(1,916) |
|
— |
|
|
— |
|
|
(1,916) |
|
|
Balance, December 31, 2014 |
|
77,204,691 |
|
$ |
77 |
|
$ |
803,810 |
|
$ |
(28,798) |
|
$ |
(1,858) |
|
7,400 |
|
$ |
(98) |
|
$ |
773,133 |
|
|
Net income |
|
— |
|
|
— |
|
|
— |
|
|
13,863 |
|
|
— |
|
— |
|
|
— |
|
|
13,863 |
|
|
Stock-based compensation expense |
|
— |
|
|
— |
|
|
3,399 |
|
|
— |
|
|
— |
|
— |
|
|
— |
|
|
3,399 |
|
|
Exercise of stock options |
|
25,620 |
|
|
— |
|
|
210 |
|
|
— |
|
|
— |
|
— |
|
|
— |
|
|
210 |
|
|
Other comprehensive loss, net |
|
— |
|
|
— |
|
|
— |
|
|
— |
|
|
(3,009) |
|
— |
|
|
— |
|
|
(3,009) |
|
|
Balance, December 31, 2015 |
|
77,230,311 |
|
$ |
77 |
|
$ |
807,419 |
|
$ |
(14,935) |
|
$ |
(4,867) |
|
7,400 |
|
$ |
(98) |
|
$ |
787,596 |
|
|
Net income |
|
— |
|
|
— |
|
|
— |
|
|
48,852 |
|
|
— |
|
— |
|
|
— |
|
|
48,852 |
|
|
Proceeds from issuance of common stock |
|
12,936,038 |
|
|
13 |
|
|
226,950 |
|
|
— |
|
|
— |
|
— |
|
|
— |
|
|
226,963 |
|
|
Dividends paid |
|
— |
|
|
— |
|
|
(150,000) |
|
|
— |
|
|
— |
|
— |
|
|
— |
|
|
(150,000) |
|
|
Stock-based compensation expense |
|
— |
|
|
— |
|
|
22,954 |
|
|
— |
|
|
— |
|
— |
|
|
— |
|
|
22,954 |
|
|
Exercise of stock options |
|
574,991 |
|
|
1 |
|
|
4,259 |
|
|
— |
|
|
— |
|
— |
|
|
— |
|
|
4,260 |
|
|
Other comprehensive loss, net |
|
— |
|
|
— |
|
|
— |
|
|
— |
|
|
(1,289) |
|
— |
|
|
— |
|
|
(1,289) |
|
|
Balance, December 31, 2016 |
|
90,741,340 |
|
$ |
91 |
|
$ |
911,582 |
|
$ |
33,917 |
|
$ |
(6,156) |
|
7,400 |
|
$ |
(98) |
|
$ |
939,336 |
|
86
Cotiviti Holdings, Inc.
Consolidated Statements of Cash Flows
(In thousands)
|
|
|
Year Ended |
|
|||||||
|
|
|
December 31, |
|
|||||||
|
|
|
2016 |
|
2015 |
|
2014 |
|
|||
|
Cash flows from operating activities: |
|
|
|
|
|
|
|
|
|
|
|
Net income (loss) |
|
$ |
48,852 |
|
$ |
13,863 |
|
$ |
(25,825) |
|
|
Adjustments to reconcile net income (loss) to net cash provided by operating activities: |
|
|
|
|
|
|
|
|
|
|
|
Deferred income taxes |
|
|
(7,735) |
|
|
(11,832) |
|
|
(46,873) |
|
|
Depreciation and amortization |
|
|
80,969 |
|
|
74,162 |
|
|
59,771 |
|
|
Stock-based compensation expense |
|
|
22,954 |
|
|
3,399 |
|
|
2,492 |
|
|
Amortization of debt issuance costs |
|
|
4,278 |
|
|
5,565 |
|
|
4,398 |
|
|
Accretion of asset retirement obligations |
|
|
186 |
|
|
166 |
|
|
131 |
|
|
Loss on impairment of intangible assets |
|
|
— |
|
|
27,826 |
|
|
74,034 |
|
|
Loss on extinguishment of debt |
|
|
16,417 |
|
|
4,084 |
|
|
21,524 |
|
|
Gain on discontinued operations |
|
|
— |
|
|
(900) |
|
|
— |
|
|
Changes in operating assets and liabilities: |
|
|
|
|
|
|
|
|
|
|
|
Restricted cash |
|
|
1,638 |
|
|
9,486 |
|
|
(6,020) |
|
|
Accounts receivable |
|
|
11,121 |
|
|
(18,641) |
|
|
6,709 |
|
|
Other current assets |
|
|
7,905 |
|
|
(12,265) |
|
|
(1,167) |
|
|
Other long-term assets |
|
|
(688) |
|
|
98 |
|
|
160 |
|
|
Customer deposits |
|
|
(1,638) |
|
|
(9,486) |
|
|
6,020 |
|
|
Accrued compensation |
|
|
15,687 |
|
|
263 |
|
|
(38,844) |
|
|
Accounts payable and accrued other expenses |
|
|
(4,821) |
|
|
(14,831) |
|
|
5,694 |
|
|
Estimated liability for refunds and appeals |
|
|
(5,236) |
|
|
(7,166) |
|
|
33,303 |
|
|
Other long-term liabilities |
|
|
109 |
|
|
(115) |
|
|
105 |
|
|
Other |
|
|
(827) |
|
|
(522) |
|
|
116 |
|
|
Net cash provided by operating activities |
|
|
189,171 |
|
|
63,154 |
|
|
95,728 |
|
|
Cash flows from investing activities: |
|
|
|
|
|
|
|
|
|
|
|
Expenditures for property and equipment |
|
|
(35,213) |
|
|
(22,982) |
|
|
(19,014) |
|
|
Business combinations, net of cash acquired |
|
|
— |
|
|
— |
|
|
(1,072,614) |
|
|
Other investing activities |
|
|
1,181 |
|
|
401 |
|
|
108 |
|
|
Net cash used in investing activities |
|
|
(34,032) |
|
|
(22,581) |
|
|
(1,091,520) |
|
|
Cash flows from financing activities: |
|
|
|
|
|
|
|
|
|
|
|
Net proceeds from issuance of common stock |
|
|
226,963 |
|
|
— |
|
|
365,187 |
|
|
Proceeds from exercise of stock options |
|
|
4,243 |
|
|
210 |
|
|
32 |
|
|
Proceeds from issuance of debt |
|
|
800,000 |
|
|
— |
|
|
1,395,000 |
|
|
Dividends paid |
|
|
(150,000) |
|
|
— |
|
|
— |
|
|
Purchase of treasury shares |
|
|
— |
|
|
— |
|
|
(18) |
|
|
Payment of contingent consideration |
|
|
— |
|
|
— |
|
|
(750) |
|
|
Payment of debt issuance costs |
|
|
(7,131) |
|
|
(1,086) |
|
|
(49,635) |
|
|
Repayment of debt |
|
|
(1,067,350) |
|
|
(8,100) |
|
|
(683,944) |
|
|
Net cash (used in) provided by financing activities |
|
|
(193,275) |
|
|
(8,976) |
|
|
1,025,872 |
|
|
Effect of foreign exchanges on cash and cash equivalents |
|
|
(594) |
|
|
(844) |
|
|
(530) |
|
|
Net (decrease) increase in cash and cash equivalents |
|
|
(38,730) |
|
|
30,753 |
|
|
29,550 |
|
|
Cash and cash equivalents at beginning of period |
|
|
149,365 |
|
|
118,612 |
|
|
89,062 |
|
|
Cash and cash equivalents at end of the period |
|
$ |
110,635 |
|
$ |
149,365 |
|
$ |
118,612 |
|
|
Supplemental disclosures of cash flow information: |
|
|
|
|
|
|
|
|
|
|
|
Cash paid for income taxes |
|
$ |
25,359 |
|
$ |
41,119 |
|
$ |
27,433 |
|
|
Cash paid for interest |
|
|
43,227 |
|
|
60,238 |
|
|
46,530 |
|
|
Noncash investing activities (accrued property and equipment purchases) |
|
|
8,163 |
|
|
12,949 |
|
|
947 |
|
|
Noncash financing activities (issuance of common stock) |
|
|
— |
|
|
— |
|
|
69,957 |
|
|
Noncash acquisition of treasury stock |
|
|
— |
|
|
— |
|
|
98 |
|
See accompanying notes to consolidated financial statements
87
Cotiviti Holdings, Inc.
Notes to the Financial Statements
(In thousands, except shares and per share amounts)
Note 1. Description of Business
Cotiviti Holdings, Inc. (collectively with its subsidiaries, “we,” “our,” “Cotiviti” or the “Company”) is a leading provider of analytics‑driven payment accuracy solutions, focused primarily on the healthcare sector. Our integrated solutions help clients enhance payment accuracy in an increasingly complex healthcare environment. We leverage our robust technology platform, configurable analytics, proprietary information assets and expertise in healthcare reimbursement to help our clients enhance their claims payment accuracy. We help our healthcare clients identify and correct payment inaccuracies. We work with over 40 healthcare organizations, including 20 of the 25 largest U.S. commercial, Medicaid and Medicare managed health plans, as well as CMS. We are also a leading provider of payment accuracy solutions to over 35 retail clients, including eight of the ten largest retailers in the United States.
We were founded as Connolly in 1979 as a provider of payment accuracy solutions to the retail industry and launched our retrospective claims accuracy solutions to the healthcare industry in 1998. Connolly was acquired by the funds managed by Advent in 2012. In May 2014, Connolly merged with iHealth Technologies which was founded in 2001. At the time of the merger, Connolly was a leading provider of retrospective claims accuracy solutions to U.S. healthcare providers and retailers and iHealth Technologies was a leading provider of prospective claims accuracy solutions to U.S. healthcare providers. As a result of the Connolly iHealth Merger, iHT and all of its wholly owned subsidiaries became our wholly owned subsidiaries. The results of operations for iHT are included in our consolidated financial statements as of and since May 14, 2014. Accordingly, comparability to other periods presented is impacted by the timing of the Connolly iHealth Merger. We have adopted a holding company structure and our primary domestic operations are performed through our wholly owned operating subsidiaries. We have international operations in Canada, the United Kingdom and India. We rebranded our company as “Cotiviti” in September 2015.
Note 2. Summary of Significant Accounting Policies
Basis of Presentation
The accompanying consolidated financial statements include our accounts and our wholly owned subsidiaries. All significant intercompany balances and transactions have been eliminated in consolidation. Certain prior year amounts have been reclassified to conform to the current year presentation.
Use of Estimates
The preparation of consolidated financial statements in conformity with GAAP requires management to make estimates and assumptions affecting the reported amounts in our consolidated financial statements and accompanying notes. These estimates are based on information available as of the date of the Consolidated Financial Statements; therefore, actual results could differ from those estimates.
Foreign Currency Translation
Assets and liabilities of our foreign subsidiaries with a functional currency other than the U.S. Dollar are translated into U.S. Dollars using applicable exchange rates at the balance sheet date. Revenue and expenses are translated at average exchange rates effective during the year. The resulting foreign currency translation gains and losses are included as a component of accumulated other comprehensive (loss) income within stockholders’ equity on our Consolidated Balance Sheets.
Assets and liabilities of our foreign subsidiaries for which the functional currency is the U.S. Dollar are re-measured into U.S. Dollars using applicable exchange rates at the balance sheet date, except nonmonetary assets and liabilities, which are re-measured at the historical exchange rates prevailing when acquired. Revenue and expenses are re-measured at average exchange rates effective during the year. Foreign currency translation gains and losses from re-measurement are included in other non-operating (income) expense in the accompanying Consolidated Statements of Comprehensive Income (Loss). The amounts of net gain (loss) on foreign currency re-measurement recognized were immaterial for all periods presented.
88
Cotiviti Holdings, Inc.
Notes to the Financial Statements (continued)
(In thousands, except shares and per share amounts)
Revenue Recognition, Unbilled Receivables and Estimated Liability for Refunds and Appeals
We provide services under contracts that contain various fee structures, including performance fee‑based contracts and fixed fee arrangements. Revenue is recognized when a contract exists, services have been provided to the client, the fee is fixed and determinable and collectability is reasonably assured.
We recognize revenue on performance fee-based contracts based upon the specific terms of the underlying contract. The contract terms generally specify: (a) time periods covered by the work to be performed; (b) nature and extent of services we are to provide; (c) the client’s duties in assisting and cooperating with us; and (d) fees payable to us. Our fees are most often expressed as a percentage of our findings. Generally, our services are rendered when our clients realize the economic benefits from our services. Our clients realize economic benefits when they take credits against their existing accounts payable based on when we identify cost savings, when they receive refund checks based on overpayments, or when they acknowledge payment reductions based on cost savings.
We derive a relatively small portion of revenue on contracts with fixed fee arrangements. We recognize revenue on these contracts ratably over the contract term and once all of the above criteria have been satisfied.
Historically, there has been a certain amount of revenue with respect to which, even though we had met the requirements of our revenue recognition policy, the claim is ultimately rejected. In such cases, our clients may request a refund or offset if their providers or vendors ultimately reject the payment inaccuracies we find or if our clients determine not to pursue reimbursement from their providers or vendors even though we may have collected fees. We record any such refund as a reduction of revenue. We record an estimate for refund liabilities at any given time based on actual historical refund data by client type. We satisfy such refund liabilities either by offsets to accounts receivable or by cash payments to clients.
In addition to the refund liabilities, we calculate client specific reserves when we determine an additional reserve may be necessary.
The estimated liability for refunds and appeals representing our estimate of claims that may be overturned related to revenue which had already been received was $62,539 and $67,775 at December 31, 2016 and December 31, 2015, respectively. The estimated allowance for refunds and appeals representing our estimate of claims that may be overturned related to amounts in accounts receivable was $41,020 and $33,406 at December 31, 2016 and December 31, 2015, respectively.
Under the Medicare Recovery Audit Program, in which we are one of the four Medicare RACs for CMS, healthcare providers have the right to appeal a claim and may pursue additional appeals if the initial appeal is found in favor of CMS. We accrue an estimated liability for appeals based on the amount of fees that are subject to appeals, closures or other adjustments and those which we estimate are probable of being returned to CMS following a successful appeal by the providers. Our estimates are based on our historical experience with the Medicare RAC appeal process.
This estimated liability for Medicare RAC appeals is an offset to revenue in our Consolidated Statements of Comprehensive Income (Loss). The liability is included in the estimated liability for refunds and appeals on our Consolidated Balance Sheets. See Note 8 for further information regarding the estimated liability for appeals related to the Medicare RAC program.
Unbilled receivables represent revenue recognized related to claims for which clients have received economic value that were not invoiced at the balance sheet date. Unbilled receivables were approximately $51,643 and $51,799 as of December 31, 2016 and December 31, 2015, respectively and are included in accounts receivable on our Consolidated Balance Sheets.
Certain unbilled receivables arise when a portion of our earned fee is deferred at the time of the initial invoice. At a later date (which can be up to a year after original invoice, and at other times during the year after completion of the
89
Cotiviti Holdings, Inc.
Notes to the Financial Statements (continued)
(In thousands, except shares and per share amounts)
audit period based on contractual terms or as agreed with our client), we invoice the unbilled receivable amount. Notwithstanding the deferred due date, our clients acknowledge we have earned this unbilled receivable at the time of the original invoice, but we have agreed to defer billing the client for the related services. Unbilled receivables of this nature were approximately $6,137 and $6,431 as of December 31, 2016 and December 31, 2015, respectively, and are included in accounts receivable on our Consolidated Balance Sheets.
We record periodic changes in unbilled receivables and refund liabilities as adjustments to revenue.
Cost of Revenue
Cost of revenue is a direct cost associated with generating revenue. Cost of revenue related to compensation includes the total cost of payroll, related benefits and stock compensation expense for employees in roles that serve to provide direct revenue generating services to clients. Other cost of revenue primarily includes expenses related to the use of certain subcontractors and professional service firms, costs associated with the retrieval of medical records and facilities related costs associated with locations that are used strictly for revenue generating activities. Cost of revenue does not include depreciation and amortization, which is stated separately in our Consolidated Statements of Comprehensive Income (Loss).
Selling, General and Administrative (“SG&A”)
Compensation within SG&A includes the total cost of payroll, related benefits and stock compensation expense for employees who do not have a direct role associated with revenue generation including those involved with developing new service offerings. Other SG&A expenses include all general operating costs. These costs include, but are not limited to, rent and occupancy costs for facilities associated with locations that are used for employees not serving in revenue generating roles, telecommunications costs, information technology infrastructure costs, software licensing costs, advertising and marketing expenses, costs associated with developing new service offerings and expenses related to the use of certain subcontractors and professional services firms. Selling, general and administrative expenses do not include depreciation and amortization, which is stated separately in our Consolidated Statements of Comprehensive Income (Loss).
Advertising Costs
Advertising costs are expensed as incurred and included in other selling, general and administrative expenses on our Consolidated Statements of Comprehensive Income (Loss). Advertising expense was $1,345, $1,241 and $1,294 for the years ended December 31, 2016, 2015 and 2014, respectively.
Cash and Cash Equivalents
Cash and cash equivalents include all cash balances and highly liquid investments with an original maturity of 90 days or less from the date of purchase.
Restricted Cash
In connection with providing services to certain clients, we maintain a series of lockbox accounts with certain financial institutions. These lockbox accounts exist to receive funds we collect on behalf of our clients resulting from services provided. When client funds are received and deposited into the lockbox accounts, we record a corresponding customer deposit liability. These funds are included as both restricted cash in current assets and customer deposits in current liabilities on our Consolidated Balance Sheets.
Accounts Receivable
Trade accounts receivable are recorded at the invoiced amount and do not bear interest. We accrue an allowance against accounts receivable related to fees yet to be collected, based on historical losses adjusted for current market
90
Cotiviti Holdings, Inc.
Notes to the Financial Statements (continued)
(In thousands, except shares and per share amounts)
conditions, our clients’ financial condition, the amount of any receivables in dispute, the current receivables aging and current payment patterns. We record changes in our estimate to the allowance for doubtful accounts through bad debt expense and relieve the allowance after all means of collection have been exhausted and the potential for recovery is considered remote. Write offs for all periods presented have not been significant. We do not have any off balance sheet credit exposure related to our clients.
Investments
Investments, which were historically purchased on behalf of our nonqualified profit sharing incentive compensation plan (See Note 19), consisted of money market securities and were classified as available-for-sale securities. Available-for-sale securities are reported at fair values (based primarily on quoted prices and market observable inputs) using the specific identification method, with the unrealized gains and losses included in accumulated other comprehensive (loss) income on our Consolidated Balance Sheets. Investments are included in prepaid expenses and other current assets on our Consolidated Balance Sheets (See Note 3). Realized gains and losses and interest and dividends on available-for-sale securities are included in other non-operating (income) expense on the Consolidated Statements of Comprehensive Income (Loss).
Property and Equipment
Property and equipment is stated at cost, net of accumulated depreciation. Depreciation on property and equipment is calculated using the straight-line method over the estimated useful lives of the assets and is included in depreciation and amortization of property and equipment in our Consolidated Statements of Comprehensive Income (Loss). The estimated useful lives of our property and equipment are as follows:
|
Computer equipment |
|
3 |
- |
5 |
years |
|
|
Software |
|
2 |
- |
5 |
years |
|
|
Furniture and fixtures |
|
|
|
7 |
years |
|
|
Leasehold improvements |
|
|
|
|
Lesser of remaining lease term or expected service life of improvement |
|
We have asset retirement obligations (“AROs”) arising from contractual requirements to perform specified activities at the time of disposition of certain leasehold improvements and equipment at some of our facilities. We record a liability for the estimated costs of these AROs. The liabilities are included in other long-term liabilities on our Consolidated Balance Sheets and are initially measured at fair value and subsequently are adjusted for accretion expense and any changes in the amount or timing of the estimated cash flows.
Internally Developed Software Costs
Capitalization of costs incurred in connection with software developed for internal use commences when both the preliminary project stage is completed and management has authorized further funding for the project, based on a determination that it is probable the project will be completed and used to perform the function intended. Capitalized costs are limited to (i) external direct costs of materials and services consumed in developing or obtaining internal use software and (ii) payroll and payroll related costs for employees who are directly associated with and devote time to the internal use software project. Capitalization of such costs ceases no later than the point at which the project is substantially complete and ready for its intended use. All other costs to develop software for internal use are expensed as incurred. We capitalized approximately $21,580 and $7,239 for the years ended December 31, 2016 and 2015, respectively. Amortization of software and software development costs is calculated on a straight-line basis over the expected economic life of the software, generally estimated to be five years and is included in depreciation and amortization of property and equipment on our Consolidated Statements of Comprehensive Income (Loss). Amortization expense for internal use software was $2,992, $2,287 and $722 for the years ended December 31, 2016, 2015 and 2014, respectively. Amortization expense for the year ended December 31, 2015 includes the write off of approximately $975 related to software that is no longer being used.
91
Cotiviti Holdings, Inc.
Notes to the Financial Statements (continued)
(In thousands, except shares and per share amounts)
Intangible Assets
Our intangible assets with definite lives include customer relationships and acquired software. Intangible assets with indefinite lives include a trademark, which is not being amortized and is tested for impairment on an annual basis or when events or changes in circumstances necessitate an evaluation for impairment. Intangible assets with definite lives are initially recorded at fair value and are amortized on a basis consistent with the timing and pattern of expected cash flows used to value the intangibles, generally on a straight-line basis over useful lives ranging from 6 to 14 years. Amortization expense is included in amortization of intangible assets in our Consolidated Statements of Comprehensive Income (Loss).
Impairment of Long-Lived Assets
Long-lived assets, including property and equipment and intangible assets with definite lives, are reviewed for impairment whenever events or changes in circumstances indicate the carrying amount of an asset may not be recoverable. If circumstances require the asset or asset group be tested for possible impairment, we first compare undiscounted cash flows expected to be generated by the asset or asset group to its carrying value. If the carrying value of the asset or asset group is not recoverable on an undiscounted cash flow basis, an impairment loss is recognized to the extent the carrying value exceeds its fair value. Fair value is determined through various valuation techniques including discounted cash flow models, quoted market values and third party independent appraisals, as necessary. Intangible assets with indefinite lives are tested for impairment on an annual basis as of October 1, of each year or more frequently whenever events or circumstances indicate that the carrying amount of such assets may not be recoverable. Recoverability of these assets is measured by a comparison of the carrying amounts to the future discounted cash flows the assets are expected to generate.
We recognized a $27,826 impairment charge on our trademark assets during the year ended December 31, 2015 due to a change in the estimated fair value of the trademark. We recognized a $74,034 impairment charge for the year ended December 31, 2014 due to the change in the estimated fair value of our CMS customer relationship intangible asset associated with the Medicare RAC. See Note 6 for further detail.
Goodwill
Goodwill is an asset representing the future economic benefits arising from other assets acquired in a business combination which are not individually identified and separately recognized. We do not amortize goodwill. Goodwill is reviewed for impairment on an annual basis as of October 1, of each year or more frequently if a triggering event occurs. These tests are performed at the reporting unit level. We have two reporting units, Healthcare and Global Retail and Other. We are permitted to make a qualitative assessment of whether it is more likely than not that a reporting unit’s fair value is less than its carrying amount before applying the two step impairment test as required in ASC 350, Intangibles—Goodwill and Other. If we can support the conclusion that it is more likely than not that the fair value of a reporting unit is greater than its carrying amount, then we would not need to perform the two step impairment test. If we cannot support such a conclusion, or we do not elect to perform the qualitative assessment, then the first step of the goodwill impairment test is used to identify potential impairment by comparing the fair value of a reporting unit with its carrying amount, including goodwill. The fair value of each reporting unit is determined using a discounted cash flow analysis.
Acquisitions
We account for acquisitions using the accounting for business combinations. The purchase price is allocated to the identifiable net assets acquired, including intangible assets and liabilities assumed, based on estimated fair values at the date of the acquisition. The excess of the purchase price over the amount allocated to the identifiable assets and liabilities, if any, is recorded as goodwill.
Determining the fair value of assets acquired and liabilities assumed requires significant judgment, including the selection of valuation methodologies, estimates of future revenue and cash flows and discount rates.
92
Cotiviti Holdings, Inc.
Notes to the Financial Statements (continued)
(In thousands, except shares and per share amounts)
Under the acquisition method of accounting for business combinations, any changes to acquired balances in tax accounts, including adjustments to deferred tax asset valuation allowances or liabilities related to uncertain tax positions, which are recorded during the measurement period, and are determined to be attributable to facts and circumstances that existed as of the acquisition date, are considered a measurement period adjustment and will result in an offsetting increase or decrease to goodwill. All other changes to deferred tax asset valuation allowances and liabilities related to uncertain tax positions will result in an increase or decrease to income tax expense.
Income Taxes
Income taxes are accounted for under the asset and liability method. Deferred tax assets and liabilities are recognized for the future tax consequences attributable to differences between the financial statement carrying amounts of existing assets and liabilities and their respective tax bases, as well as for tax attributes such as operating loss and tax credit carryforwards. Deferred tax assets and liabilities are measured using enacted tax rates expected to apply to taxable income in the years in which those temporary differences are expected to be recovered or settled. The effect on deferred tax assets and liabilities of a change in tax rates is recognized in income in the period that includes the enactment date.
We recognize net deferred tax assets to the extent that we believe these assets are more likely than not to be realized. In making such a determination, we consider all available positive and negative evidence, including future reversals of existing taxable temporary differences, projected future taxable income, tax planning strategies, and results of recent operations. In the event we determine that we would be able to realize our deferred tax assets in the future in excess of their net recorded amount, we reduce the deferred tax asset valuation allowance and record a benefit in our provision for income taxes in our Consolidated Statements of Comprehensive Income (Loss).
We record liabilities related to uncertain tax positions in accordance with ASC 740, Income Taxes (“ASC 740”), on the basis of a two step process whereby (1) we determine whether it is more likely than not that the tax positions will be sustained on the basis of the technical merits of the position and (2) for those tax positions that meet the more likely than not recognition threshold, we recognize the largest amount of tax benefit that is more than 50 percent likely to be realized upon ultimate settlement with the related tax authority. We recognize interest and penalties related to unrecognized tax benefits within the income tax provision in the accompanying Consolidated Statements of Comprehensive Income (Loss). Accrued interest and penalties are included within accounts payable and accrued other expenses in the Consolidated Balance Sheets.
Derivative Instruments
Our derivative instruments consist entirely of interest rate cap agreements, are stated at fair value and are included in accounts payable and accrued other expenses and other long-term liabilities on our Consolidated Balance Sheets. Changes in the fair value of derivatives that are designated as cash flow hedges are deferred in accumulated other comprehensive loss (income) on our Consolidated Balance Sheets until the underlying hedged transactions are recognized in earnings, at which time any deferred hedging gains or losses are also recorded in earnings. See Note 10 for more information.
Stock-Based Compensation
Our policy is to issue new shares for purchases under our equity incentive plans as described in Note 15. Stock-based compensation expense is estimated at the grant date based on an award’s fair value. The determination of the stock-based compensation expense related to stock options is calculated using a Black-Scholes-Merton option pricing model and is affected by our stock price, expected stock price volatility over the term of the awards, expected term, risk free interest rate and expected dividends. We record forfeitures as they occur.
We recognize stock-based compensation expense for service-based equity awards using the straight-line attribution method over the requisite service period.
93
Cotiviti Holdings, Inc.
Notes to the Financial Statements (continued)
(In thousands, except shares and per share amounts)
We have awarded performance-based equity awards to certain employees and directors. Performance-based awards vested in accordance with the specific performance criteria espoused in the executed award agreements. Consistent with the service-based equity awards, the vesting of performance-based equity awards was dependent upon the participant’s continued employment through the date the performance criteria were achieved. The criteria associated with our outstanding performance-based stock options as defined in the terms of the award agreements, was satisfied as of September 30, 2016 and therefore these stock options all became vested and exercisable. As such, we recorded stock-based compensation expense during the year ended December 31, 2016 based on the grant date fair value of the performance-based awards.
Commitments and Contingencies
Liabilities for loss contingencies arising from claims, assessments, litigation, fines and penalties and other sources are recorded when it is probable a liability has been incurred and the amount can be reasonably estimated. Legal costs incurred in connection with loss contingencies are expensed as incurred. See Note 8 for further detail on loss contingency related to the Medicare RAC.
Fair Value of Financial Instruments
The carrying values for cash and cash equivalents, restricted cash, accounts receivable, accounts payable, and other accrued liabilities reasonably approximate fair market value due to their nature and the short term maturity of these financial instruments. We measure assets and liabilities at fair value based on assumptions that market participants would use in pricing an asset or liability in the principal or most advantageous market. When considering market participant assumptions in fair value measurements, we use a consistent fair value hierarchy framework as defined in ASC 820, Fair Value Measurement. Refer to Note 11 for more information regarding management’s fair value estimates.
Recently Issued Accounting Standards
In January 2017, the FASB issued ASU 2017-04, Simplifying the Test for Goodwill Impairment (“ASU 2017-04”), which is intended to simplify how an entity is required to test goodwill for impairment by eliminating Step 2 from the goodwill impairment test. Step 2 measures a goodwill impairment loss by comparing the implied fair value of a reporting unit’s goodwill with the carrying amount of the goodwill. Instead, an entity should compare the fair value of a reporting unit with its carrying amount and recognize an impairment charge for the amount by which the carrying amount exceeds the reporting unit’s fair value and should not exceed the total amount of goodwill allocated to that reporting unit. The guidance is effective for public companies with annual reporting periods beginning after December 15, 2019, and interim periods within those annual periods. Early adoption is permitted. We are evaluating this new guidance and do not believe it will have a material impact on our consolidated financial statements and related disclosures as the fair values of our reporting units exceed their carrying values.
In November 2016, the FASB issued ASU 2016-18, Restricted Cash (“ASU 2016-18”), which requires that restricted cash be included with cash and cash equivalents when reconciling the beginning and end of period total amounts shown on the statement of cash flows. The guidance is effective for public companies with annual reporting periods beginning after December 15, 2017, and interim periods within those annual periods. Early adoption is permitted. We are evaluating this guidance and its impact on our consolidated financial statements and related disclosures and expect the adoption of this ASU could impact the disclosure of our cash flows from operations.
In August 2016, the FASB issued ASU 2016-15, Classification of Certain Cash Receipts and Cash Payments (“ASU 2016-15”), which addresses eight specific cash flow issues in order to reduce diversity in practice. The guidance is effective for public companies with annual reporting periods beginning after December 15, 2017, and interim periods within those annual periods. Early adoption is permitted. We are evaluating this guidance and its impact on our consolidated financial statements and related disclosures.
94
Cotiviti Holdings, Inc.
Notes to the Financial Statements (continued)
(In thousands, except shares and per share amounts)
In March 2016, the FASB issued ASU 2016-09, Improvements to Employee Share-Based Payment Accounting (“ASU 2016-09”), which simplifies several aspects of the accounting for share based compensation. ASU 2016-09 changes several aspects of the accounting for share based payment award transactions, including 1) accounting for income taxes, 2) classification of excess tax benefits on the statement of cash flows, 3) forfeitures, 4) minimum statutory tax withholding requirements and 5) classification of employee taxes paid on the statement of cash flows when an employer withholds shares for tax-withholding purposes. We early adopted ASU 2016-09 during the third quarter of 2016, which did not result in any significant changes to our current or prior period consolidated financial statements. As a result of this adoption, we recorded an excess tax benefit of approximately $4,000 during the fourth quarter of 2016 related to stock option exercises. In conjunction with adopting ASU 2016-09, we also made an accounting policy election to account for forfeitures as they occur.
In February 2016, the FASB issued ASU 2016-02, Leases (“ASU 2016-02”), which changes the accounting recognition, measurement and disclosure for leases in order to increase transparency. ASU 2016-02 requires lease assets and liabilities to be recognized on the balance sheet and key information about leasing arrangements to be disclosed. The guidance is effective for public companies with annual reporting periods beginning after December 15, 2018, including interim periods within that reporting period. Early adoption is permitted. We are evaluating this new guidance and its impact on our consolidated financial statements and related disclosures.
In January 2016, the FASB issued ASU 2016-01, Recognition and Measurement of Financial Assets and Financial Liabilities (“ASU 2016-01”), which changes the current financial instruments model primarily impacting the accounting for equity investments, financial liabilities under the fair value option, and the presentation and disclosure requirements for financial instruments. The guidance is effective for public companies with annual reporting periods beginning after December 15, 2017, including interim periods within that reporting period. We are evaluating this new guidance and do not believe it will have a material impact on our consolidated financial statements and related disclosures.
In November 2015, the FASB issued ASU 2015‑17, Balance Sheet Classification of Deferred Taxes, (“ASU 2015‑17”), which requires entities with a classified balance sheet to present all deferred tax assets and liabilities as noncurrent. The guidance is effective for public companies with annual and interim periods beginning after December 15, 2016. We early adopted the provisions of ASU 2015-17 as of December 31, 2016 and prior period amounts have been reclassified to conform to the current period presentation. As of December 31, 2015, $32,919 of current deferred tax assets have been reclassified to long-term deferred tax liabilities in the consolidated balance sheet. The adoption of ASU 2015-17 did not materially impact our consolidated financial position, results of operations or cash flows, but did reduce our calculation of working capital.
In April 2015, the FASB issued ASU 2015-05, Customer’s Accounting for Fees Paid in a Cloud Computing Arrangement (“ASU 2015-05”), which established guidance regarding the accounting for software licenses. ASU 2015-05 was effective for annual reporting periods, including interim periods, beginning after December 15, 2015. We prospectively adopted the provisions of ASU 2015-05 as of January 1, 2016 and have not yet had any material contracts that were impacted by this new guidance.
In April 2015, the FASB issued ASU 2015‑03, Simplifying the Presentation of Debt and Issuance Costs (“ASU 2015‑03”), which establishes guidance to simplify the presentation of debt issuance costs by requiring debt issuance costs related to a recognized debt liability be presented in the balance sheet as a direct deduction from the carrying amount of that liability, consistent with debt discounts. Prior to the issuance of ASU 2015-03, debt issuance costs were required to be presented as an asset in the balance sheet. The guidance is effective for annual reporting periods beginning after December 15, 2015, and interim periods within that reporting period. We adopted the provisions of ASU 2015-03 as of January 1, 2016 and prior period amounts have been reclassified to conform to the current period presentation. As of December 31, 2015, $20,975 of debt issuance costs were reclassified in the consolidated balance sheet from debt issuance costs, net to long-term debt. The adoption of ASU 2015-03 did not materially impact our consolidated financial position, results of operations or cash flows.
95
Cotiviti Holdings, Inc.
Notes to the Financial Statements (continued)
(In thousands, except shares and per share amounts)
In May 2014, the FASB issued ASU 2014‑09, Revenue from Contracts with Customers (Topic 606) (“ASU 2014‑09”), which supersedes existing revenue recognition guidance and provides clarification of principles for recognizing revenue from contracts with customers. ASU 2014-09 sets forth a five-step model for determining when and how revenue is recognized. The core principle of the new standard is that a company should recognize revenue to depict the transfer of promised goods or services to customers in an amount that reflects the consideration to which the company expects to be entitled in exchange for those goods or services. Additional disclosures will be required to describe the nature, amount, timing and uncertainty of revenue and cash flows arising from customer contracts. The two permitted transition methods under ASU 2014-09 are the full retrospective method, in which case the new guidance would be applied to each prior reporting period presented and the cumulative effect of applying the standard would be recognized at the earliest period shown, or the modified retrospective method, in which case the cumulative effect of applying the standard would be recognized at the date of the initial application. The guidance is effective for public companies with annual periods beginning after December 15, 2017 and interim periods within that reporting period. The FASB will permit companies to adopt the new standard early, but not before the original effective date of annual reporting periods beginning after December 15, 2016.
We have formed an internal team to evaluate and quantify the potential impact of this new revenue guidance. As of the date of this filing, we have made significant progress on our contract reviews and policy drafting. We will continue to evaluate this new guidance and plan to provide additional information about our method of adoption and the impact, if any, on our consolidated financial statements and related disclosures in future filings.
Note 3. Investments
Investments in marketable securities, all of which were classified as available-for-sale and included in prepaid expenses and other current assets, were as follows:
|
|
December 31, 2015 |
|
||||||||||
|
|
|
|
|
Gross |
|
Gross |
|
|
|
|
||
|
|
Amortized |
|
Unrealized |
|
Unrealized |
|
Fair |
|
||||
|
|
Cost |
|
Gains |
|
Losses |
|
Value |
|
||||
|
Money market securities |
$ |
1,178 |
|
$ |
3 |
|
$ |
— |
|
$ |
1,181 |
|
There were no investments in marketable securities as of December 31, 2016.
Note 4. Acquisition
On May 14, 2014, we acquired the stock of iHealth Technologies resulting in the Connolly iHealth Merger. The Connolly iHealth Merger brought two market leaders together to offer clients a broad suite of claims accuracy solutions. This merger and related transaction expenses were funded through a cash investment by us and our stockholders as well as by additional borrowings. In addition to the cash funding related to the Connolly iHealth Merger, certain members of management received $69,957 in equity by rolling over a portion of their former equity interests in iHealth Technologies or incentive compensation that was owed to them as of the date of the merger.
As part of the Connolly iHealth Merger, we allocated the purchase price to the identifiable net assets acquired, including intangible assets and liabilities assumed, based on the estimated fair values at the date of acquisition. The excess of the purchase price over the amount allocated to the identifiable assets and liabilities was recorded as goodwill. Goodwill represents the value of the acquired assembled workforce, specialized processes and procedures and operating synergies, none of which qualify as separate intangible assets. We believe these specialized processes and procedures and operating synergies will enhance our long history of innovation in improving our existing solutions, developing new solutions and expanding the scope of our services at both legacy companies. As a result of the Connolly iHealth Merger, we have cross sell opportunities across more than half of our healthcare client base and are actively engaging with existing clients to cross sell our solutions.
We determined the estimated fair values of intangible assets acquired using estimates of future discounted cash flows to be generated by the business over the estimated duration of those cash flows. We based the estimated cash flows
96
Cotiviti Holdings, Inc.
Notes to the Financial Statements (continued)
(In thousands, except shares and per share amounts)
on our projections of future revenue, operating expenses, capital expenditures, working capital needs and tax rates. We estimated the duration of the cash flows based on the projected useful lives of the assets acquired. The discount rate was determined based on specific business risk, cost of capital and other factors.
The estimated fair values of the assets acquired and liabilities assumed, after the effect of final adjustments related to the accounting for business combinations within the measurement period as described below, at the date of the Connolly iHealth Merger were as follows:
|
|
|
|
|
|
|
|
|
May 14, 2014 |
|
|
|
Cash |
|
$ |
62,218 |
|
|
Accounts receivable |
|
|
34,830 |
|
|
Prepaid expenses and other assets |
|
|
5,516 |
|
|
Other long-term assets |
|
|
1,237 |
|
|
Property and equipment |
|
|
7,594 |
|
|
Intangible assets |
|
|
543,200 |
|
|
Total identifiable assets acquired |
|
|
654,595 |
|
|
Accounts payable and accrued liabilities |
|
|
82,095 |
|
|
Deferred tax liabilities |
|
|
195,948 |
|
|
Other long-term liabilities |
|
|
904 |
|
|
Total liabilities assumed |
|
|
278,947 |
|
|
Net identifiable assets acquired |
|
|
375,648 |
|
|
Goodwill |
|
|
829,141 |
|
|
Net assets acquired |
|
$ |
1,204,789 |
|
The $543,200 of acquired intangible assets are subject to a weighted average useful life of approximately 13.3 years. These definite lived intangible assets include a registered trademark of $8,600 (11 year useful life), customer relationships of $486,700 (14 year useful life) and acquired software of $47,900 (7 year useful life).
For federal income tax purposes, the Connolly iHealth Merger was treated as a stock acquisition. The goodwill recognized is not deductible for income tax purposes.
In connection with the acquisition, a preliminary liability of $21,291 was recorded in accounts payable and accrued other expenses on the Consolidated Balance Sheets as of December 31, 2014 for payments due to the former stockholders of iHealth Technologies These amounts were finalized and no other adjustments were made to the estimated fair values of the assets acquired and liabilities assumed during the measurement period in 2015 as additional information was received by management resulting in a total liability due to the former stockholders of iHealth Technologies of $22,270 and a corresponding increase to goodwill of $979. The payment in full was made to the former stockholders during the year ended December 31, 2015.
We recorded $5,745 of transaction costs primarily related to professional services associated with the Connolly iHealth Merger as transaction-related expenses within our Consolidated Statements of Comprehensive Income (Loss) during the year ended December 31, 2014.
We consolidated the results of operations of the acquired business as of and from May 14, 2014. The following are unaudited pro forma results of operations for the year ended December 31, 2014 as if the acquisition had occurred on January 1, 2014, and does not give effect to any estimated and potential cost savings or other operating efficiencies that may result from the Connolly iHealth Merger.
97
Cotiviti Holdings, Inc.
Notes to the Financial Statements (continued)
(In thousands, except shares and per share amounts)
These unaudited pro forma results are for comparative purposes only and may not be indicative of the results that would have occurred had this acquisition been completed on January 1, 2014 or the results that would be attained in the future.
|
|
|
|
|
|
|
|
|
Year Ended |
|
|
|
|
|
December 31, |
|
|
|
|
|
2014 |
|
|
|
|
|
(unaudited) |
|
|
|
Net revenue |
|
$ |
505,961 |
|
|
Operating income |
|
|
57,533 |
|
|
Net loss |
|
|
(18,752) |
|
|
Basic loss per share |
|
$ |
(0.24) |
|
|
Diluted loss per share |
|
$ |
(0.24) |
|
Note 5. Property and Equipment
Property and equipment by major asset class for the periods presented consisted of the following:
|
|
|
December 31, |
|
||||
|
|
|
2016 |
|
2015 |
|
||
|
Computer equipment |
|
$ |
40,349 |
|
$ |
31,496 |
|
|
Software |
|
|
42,614 |
|
|
26,412 |
|
|
Furniture and fixtures |
|
|
8,652 |
|
|
7,916 |
|
|
Leasehold improvements |
|
|
4,392 |
|
|
3,488 |
|
|
Projects in progress |
|
|
12,001 |
|
|
10,434 |
|
|
Property and equipment, gross |
|
$ |
108,008 |
|
$ |
79,746 |
|
|
Less: Accumulated depreciation and amortization |
|
|
40,368 |
|
|
22,294 |
|
|
Property and equipment, net |
|
$ |
67,640 |
|
$ |
57,452 |
|
In December 2015, we purchased a perpetual software license, which is included in the software total above. We are paying for this software over a two year period ending in January 2018. As such, there is approximately $3,351 and $2,952 included in accounts payable and accrued other expenses and $3,225 and $6,340 included in other long-term liabilities on our Consolidated Balance Sheets as of December 31, 2016 and 2015, respectively. The amounts included in other long-term liabilities represents the present value of payments that will ultimately be made.
Total depreciation and amortization expense related to property and equipment, including capitalized software costs, was $20,151, $12,695 and $7,416 for the years ended December 31, 2016, 2015 and 2014, respectively.
98
Cotiviti Holdings, Inc.
Notes to the Financial Statements (continued)
(In thousands, except shares and per share amounts)
Note 6. Intangible Assets
Intangible asset balances by major asset class for the periods presented were as follows:
|
|
|
|
|
|
|
|
|
|
|
|
|
|
|
Weighted |
|
|
|
|
|
Gross |
|
|
|
|
|
|
|
Net |
|
Average |
|
|||
|
|
|
Carrying |
|
Accumulated |
|
|
|
|
Carrying |
|
Amortization |
|
||||
|
|
|
Amount |
|
Amortization |
|
Impairment |
|
Amount |
|
Period |
|
|||||
|
December 31, 2016: |
|
|
|
|
|
|
|
|
|
|
|
|
|
|
|
|
|
Customer relationships |
|
$ |
640,052 |
|
$ |
144,768 |
|
$ |
— |
|
$ |
495,284 |
|
13.7 |
years |
|
|
Acquired software |
|
|
82,400 |
|
|
48,579 |
|
|
— |
|
|
33,821 |
|
6.2 |
years |
|
|
Connolly trademark |
|
|
4,200 |
|
|
— |
|
|
— |
|
|
4,200 |
|
indefinite-lived |
|
|
|
Total |
|
$ |
726,652 |
|
$ |
193,347 |
|
$ |
— |
|
$ |
533,305 |
|
12.8 |
years |
|
|
December 31, 2015: |
|
|
|
|
|
|
|
|
|
|
|
|
|
|
|
|
|
Customer relationships |
|
$ |
640,503 |
|
$ |
97,857 |
|
$ |
— |
|
$ |
542,646 |
|
13.7 |
years |
|
|
Acquired software |
|
|
82,400 |
|
|
34,836 |
|
|
— |
|
|
47,564 |
|
6.2 |
years |
|
|
Connolly trademark |
|
|
24,500 |
|
|
— |
|
|
20,300 |
|
|
4,200 |
|
indefinite-lived |
|
|
|
iHealth trademark |
|
|
8,600 |
|
|
1,074 |
|
|
7,526 |
|
|
— |
|
11.0 |
years |
|
|
Total |
|
$ |
756,003 |
|
$ |
133,767 |
|
$ |
27,826 |
|
$ |
594,410 |
|
12.8 |
years |
|
Amortization expense was $60,818, $61,467 and $52,355 for the years ended December 31, 2016, 2015 and 2014, respectively.
As a result of our rebranding in September 2015, we recorded an impairment of intangible assets of $27,826 related to our legacy trademarks during the year ended December 31, 2015. The remaining trademark value as of December 31, 2016 of $4,200 is related to our retail business that we continue to operate as Connolly, a division of Cotiviti.
As of December 31, 2016 amortization expense for the next 5 years is expected to be:
|
2017 |
|
$ |
57,824 |
|
|
2018 |
|
|
53,894 |
|
|
2019 |
|
|
53,894 |
|
|
2020 |
|
|
53,894 |
|
|
2021 |
|
|
49,572 |
|
Note 7. Goodwill
Total goodwill in our Consolidated Balance Sheets was $1,196,024 and $1,197,044 as of December 31, 2016 and December 31, 2015, respectively.
Changes in the carrying amount of goodwill for the years ended December 31, 2016 and 2015 as allocated to each of our Healthcare and Global Retail and Other segments was as follows:
|
|
|
|
|
|
|
|
|
|
|
|
|
|
|
|
|
|
December 31, 2016 |
|
December 31, 2015 |
|
||||||||
|
|
|
|
|
|
Global Retail |
|
|
|
|
Global Retail |
|
||
|
|
|
Healthcare |
|
and Other |
|
Healthcare |
|
and Other |
|
||||
|
Beginning balance |
|
$ |
1,147,771 |
|
$ |
49,273 |
|
$ |
1,147,396 |
|
$ |
49,957 |
|
|
Purchase price adjustments |
|
|
— |
|
|
— |
|
|
979 |
|
|
— |
|
|
Foreign currency translation and other |
|
|
— |
|
|
(1,020) |
|
|
(604) |
|
|
(684) |
|
|
Ending balance |
|
$ |
1,147,771 |
|
$ |
48,253 |
|
$ |
1,147,771 |
|
$ |
49,273 |
|
There was no impairment related to goodwill for any period presented.
99
Cotiviti Holdings, Inc.
Notes to the Financial Statements (continued)
(In thousands, except shares and per share amounts)
Note 8. Commitments and Contingencies
Operating Leases
We are obligated under non cancellable lease agreements for certain facilities and equipment, which frequently include renewal options and escalation clauses. For leases that contain predetermined fixed escalations, we recognize the related rent expense on a straight-line basis and record the difference between the recognized rent expense and amounts payable under the lease as lease obligations. Lease obligations due within one year are included in accounts payable and accrued other expenses on our Consolidated Balance Sheets.
We lease certain facilities and equipment under non cancelable leases that expire at various points through 2029. Rent expense was $10,529, $8,826 and $7,202 for the years ended December 31, 2016, 2015 and 2014, respectively.
Future minimum payments under non cancelable operating lease agreements as of December 31, 2016 were as follows:
|
|
|
|
|
|
|
Year ending December 31: |
|
|
|
|
|
2017 |
|
$ |
9,262 |
|
|
2018 |
|
|
7,227 |
|
|
2019 |
|
|
4,038 |
|
|
2020 |
|
|
2,907 |
|
|
2021 |
|
|
2,034 |
|
|
2022 - 2029 |
|
|
8,257 |
|
|
Total minimum lease payments |
|
$ |
33,725 |
|
Legal and Other Matters
We may be involved in various legal proceedings and litigation arising in the ordinary course of business. While any legal proceeding or litigation has an element of uncertainty, management believes the ultimate disposition of these matters will not have a material adverse effect on our consolidated financial position, results of operations, or liquidity.
Medicare RAC Contract Contingency
In August 2014, CMS announced it would allow providers to remove all eligible claims currently pending in the appeals process by offering to pay hospitals 68% of the original claim amount. This settlement was offered to the providers and it was unknown what, if any, impact there would be for the Medicare RACs. On July 1, 2015, CMS issued a Technical Direction Letter to the Medicare RACs, including us, indicating that Medicare RACs will only be entitled to the contract contingency fee on the settled amounts of the claims, or 32% of the original inpatient claim amounts. Based on the initial lists of finalized settlements provided by CMS, we would be required to refund CMS approximately $22,308 due to the related adjustments in Medicare RAC contingency fees. CMS further advised that as the hospital settlement project continues, additional settlement lists will be matched to Medicare RAC claims which may result in updated refund amounts to those initially provided. While there are uncertainties in any dispute resolution and results are uncertain, we have disputed CMS’s findings based on our interpretation of the terms of the Medicare RAC contract and our belief that the backup data provided by CMS is inaccurate and/or incomplete. Our liability for estimated refunds and appeals includes amounts for these settled claims based on our best estimates of the amount we believe will be ultimately payable to CMS based on our interpretation of the terms of the Medicare RAC contract. We believe that it is possible that we could be required to pay an additional amount up to approximately $13,000 in excess of the amount we accrued as of December 31, 2016 based on the claims data we have received from CMS to date. As CMS completes its settlement process with the providers and updated files are provided to us, the potential amount owed by us may change. On September 28, 2016, CMS announced a second settlement process to allow eligible providers to settle their inpatient
100
Cotiviti Holdings, Inc.
Notes to the Financial Statements (continued)
(In thousands, except shares and per share amounts)
claims currently under appeal beginning December 1, 2016. This second settlement process could result in additional amounts owed to CMS. The amount of any such additional claims cannot presently be determined.
Asset Retirement Obligations
We have AROs arising from contractual requirements to perform specified activities at the time of disposition of certain leasehold improvements and equipment at some of our facilities. Changes in the carrying amount of AROs were as follows:
|
|
|
Year ended |
|
||||
|
|
|
December 31, |
|
||||
|
|
|
2016 |
|
2015 |
|
||
|
Balance beginning of period |
|
$ |
2,415 |
|
$ |
2,055 |
|
|
Additional ARO liability |
|
|
133 |
|
|
207 |
|
|
Accretion expense |
|
|
177 |
|
|
153 |
|
|
Balance at end of period |
|
$ |
2,725 |
|
$ |
2,415 |
|
Note 9. Long‑term Debt
In September 2016, we entered into and executed the Restated Credit Agreement, which replaced our then outstanding Initial Secured Credit Facilities, lowered total debt outstanding by $22,700 and provided for lower applicable interest rates. The Restated Credit Agreement consists of (a) the First Lien Term A Loan in the amount of $250,000, (b) the First Lien Term B Loan in the amount of $550,000 and (c) the Revolver in the amount of up to $100,000. As a result of this refinancing, we recognized a loss on extinguishment of debt of $9,349 during the year ended December 31, 2016, which is included in our Consolidated Statements of Comprehensive Income (Loss).
In June 2016, we repaid $223,000 in outstanding principal under our then outstanding Initial Second Lien Credit Facility using proceeds from our IPO. We also made a voluntary prepayment of $13,100 of outstanding principal under the Initial Second Lien Credit Facility. As a result of these repayments, we recognized a loss on extinguishment of debt of $7,068 during the year ended December 31, 2016, which is included in our Consolidated Statements of Comprehensive Income (Loss).
In May 2015, we entered into and executed the First and Second Amendments to the then outstanding Initial First Lien Credit Facilities, which, among other things, provided for lower applicable interest rates associated with the Initial First Lien Credit Facilities by 50 basis points. As a result, we recorded a loss on extinguishment of debt of $4,084 during the year ended December 31, 2015, which is included in our Consolidated Statements of Comprehensive Income (Loss).
101
Cotiviti Holdings, Inc.
Notes to the Financial Statements (continued)
(In thousands, except shares and per share amounts)
Long‑term debt for the periods presented was as follows:
|
|
|
December 31, |
|
||||
|
|
|
2016 |
|
2015 |
|
||
|
First Lien Term A Loan(a) |
|
$ |
246,694 |
|
$ |
— |
|
|
First Lien Term B Loan(b) |
|
|
544,345 |
|
|
— |
|
|
Revolver(c) |
|
|
— |
|
|
— |
|
|
Initial First Lien Term Loan(d) |
|
|
— |
|
|
792,167 |
|
|
Initial Second Lien Credit Facility(e) |
|
|
— |
|
|
262,878 |
|
|
Initial First Lien Revolver(f) |
|
|
— |
|
|
— |
|
|
Total debt |
|
|
791,039 |
|
|
1,055,045 |
|
|
Less: debt issuance costs |
|
|
10,837 |
|
|
20,975 |
|
|
Less: current portion |
|
|
18,000 |
|
|
21,099 |
|
|
Total long-term debt |
|
$ |
762,202 |
|
$ |
1,012,971 |
|
|
(a) |
The First Lien Term A Loan matures on September 28, 2021 and requires quarterly principal payments of $3,125 for the fourth quarter of 2016, $3,125 per quarter in 2017 and 2018, $4,688 per quarter in 2019, $6,250 per quarter in 2020 and $9,375 per quarter for the first two quarters of 2021. The remainder of the outstanding First Lien Term A Loan borrowings are due on September 28, 2021. Any mandatory or voluntary prepayment will be applied against the remaining scheduled installments of principal payments in direct order of maturity, unless other direction of application is provided by us. Based on our periodic election, borrowings under the First Lien Term A Loan bear interest at either (a) the ABR plus, based on our Secured Leverage Ratio (as defined in the Restated Credit Agreement), 1.25% - 2.00% for ABR loans or (b) LIBOR plus, based on our Secured Leverage Ratio, 2.25% to 3.00% for LIBOR loans. The ABR is equal to the highest of (i) the New York Federal Reserve Bank rate in effect on such date plus 0.50%, (ii) the LIBOR plus 1.00% and (iii) the prime commercial lending rate of the administrative agent as in effect on the relevant day. The interest period applicable to any LIBOR borrowing is one, two, three or six months, at the election of the borrower. Interest on LIBOR loans is payable the last day of the applicable interest period and, in the case of an interest period of more than three months’ duration, each day on which interest would have been payable had successive interest periods of three months’s duration been applicable to such borrowing. The interest rate in effect was 3.75% at December 31, 2016. |
|
(b) |
The First Lien Term B Loan matures on September 28, 2023 and requires quarterly principal payments of $1,375 with all remaining borrowings due on September 28, 2023. Based on our periodic election, borrowings under the First Lien Term B Loan bear interest at either (a) the ABR plus 1.75% for ABR loans or (b) LIBOR plus 2.75% for LIBOR loans. The ABR is equal to the highest of (i) the New York Federal Reserve Bank rate in effect on such date plus 0.50%, (ii) LIBOR plus 1.00%, (iii) the prime commercial lending rate of the administrative agent as in effect on the relevant day and (iv) 1.75%. LIBOR is equal to the higher of (a) the published LIBOR or (b) 0.75%. If our corporate credit rating from Moody’s Investor Service, Inc. is Ba3 or better and our corporate family rating from Standard & Poor’s Financial Services, LLC is BB- or better, the margin will be reduced by 0.25% per annum for as long as such ratings are maintained. The interest period applicable to any LIBOR borrowing is one, two, three or six months, at the election of the borrower. Interest on LIBOR loans is payable the last day of the applicable interest period and, in the case of an interest period of more than three months’ duration, each day on which interest would have been payable had successive interest periods of three months’s duration been applicable to such borrowing. The interest rate in effect was 3.75% at December 31, 2016. |
|
(c) |
The Revolver expires on September 28, 2021. Interest for any borrowings under the Revolver is payable over one, two, three or six months at our election. A commitment fee is payable quarterly based on the unused portion of the Revolver commitment which ranges from 0.30% to 0.50% per annum based on certain financial tests. Based on our periodic election, borrowings under the Revolver bear interest at either (a) ABR plus, based on our Secured Leverage Ratio, 1.25% - 2.00% for ABR loans or (b) LIBOR plus, based on our Secured Leverage Ratio, 2.25% to 3.00% for LIBOR loans. The ABR is equal to the highest of (i) the New York Federal Reserve Bank rate in effect on such date plus 0.50%, (ii) LIBOR plus 1.00% and (iii) the prime commercial lending rate of the administrative agent as in effect on the relevant day. There were no borrowings outstanding under the Revolver as of December 31, 2016. The interest rate in effect was 3.75% at December 31, 2016. |
|
(d) |
The Initial First Lien Term Loan, as amended, expired May 2021 and required quarterly principal payments of $2,025. The quarterly principal payment could be reduced by any amounts of mandatory prepayment. Any mandatory prepayment would be applied against the remaining scheduled installments of principal payments in direct order of maturity, unless other direction of application was provided by us. Interest on the Initial First Lien Term Loan was payable over periods of one, two, three or six months at the election of the borrower. Based on our periodic election, borrowings under the Initial First Lien Term Loan bore |
102
Cotiviti Holdings, Inc.
Notes to the Financial Statements (continued)
(In thousands, except shares and per share amounts)
interest at either (a) ABR plus 2.50% for ABR Loans, or (b) LIBOR plus 3.50% for LIBOR Loans. The ABR was equal to the higher of (a) the Federal Funds Effective Rate plus 0.50%; (b) the published one month LIBOR plus 1.00%; (c) the Prime Rate; or (d) 2.00%. The LIBOR was equal to the higher of (a) LIBOR or (b) 1.00%. The interest rate in effect was 4.50% at December 31, 2015. Following the IPO, borrowings under the Initial First Lien Term Loan bore interest at either (a) ABR plus 2.25%, or (b) LIBOR plus 3.25%. |
|
(e) |
The Initial Second Lien Credit Facility expired May 2022 with the total principal balance due at maturity. Interest on the Initial Second Lien Credit Facility was payable over periods of one, two, three, or six months at the election of the borrower. Based on our periodic election, borrowings under the Initial Second Lien Credit Facility bore interest at either (a) ABR plus 6.00% for ABR Loans or (b) LIBOR plus 7.00% for LIBOR Loans. The ABR was equal to the higher of (a) the Federal Funds Effective Rate plus 0.50% (b) the published one month LIBOR plus 1.00%; (c) the Prime Rate; or (d) 2.00%. The LIBOR was equal to the higher of (a) LIBOR or (b) 1.00%. The interest rate in effect was 8.00% at December 31, 2015. Following the IPO, borrowings under the Initial Second Lien Credit Facility bore interest at either (a) ABR plus 5.75% for ABR Loans, or (b) LIBOR plus 6.75% for LIBOR Loans. |
|
(f) |
The Initial First Lien Revolver expired May 2019 with interest payable over periods of one, two, three or six months at the election of the borrower. A commitment fee was payable quarterly based on the daily unused portion of the Initial First Lien Revolver balance which ranged from an annual rate of 0.375% to 0.50% based on certain financial tests. The commitment fee was 0.375% at December 31, 2015. Based on our periodic election, borrowings under the Initial First Lien Revolver bore interest at either (a) ABR plus 1.75% to 2.25% for ABR Loans based on certain financial tests or (b) LIBOR plus 2.75% to 3.25% for LIBOR Loans based on certain financial tests. The ABR was equal to the higher of (a) the Federal Funds Effective Rate plus 0.50%; (b) the published one month LIBOR plus 1.00%; or (c) the Prime Rate. The LIBOR was equal to the higher of (a) the LIBOR or (b) 1.00%. The interest rate in effect was 4.00% at December 31, 2015. At December 31, 2015 we had $3,526 letters of credit outstanding which reduce the amount available for borrowing. There were no borrowings outstanding under the Initial First Lien Revolver as of December 31, 2015. |
The Restated Credit Agreement includes certain binding affirmative and negative covenants, including delivery of financial statements and other reports, maintenance of existence and transactions with affiliates. The negative covenants restrict our ability, among other things, to incur indebtedness, grant liens, make investments, sell or otherwise dispose of assets or enter into a merger, pay dividends or repurchase stock. As a result of these restrictions, approximately 80% of the subsidiary net assets are deemed restricted as of December 31, 2016. Refer to Schedule I Condensed Financial Information of Parent. Beginning December 31, 2016, there is a required financial covenant applicable only to the Revolver and the First Lien Term A Loan, pursuant to which we agree not to permit our Secured Leverage Ratio (as defined in the Restated Credit Agreement) to exceed 5.50:1.00 through September 2018, 5.25:1.00 through September 2019 and 5.00:1.00 through June 2021. In addition, the Restated Credit Agreement includes certain events of default including payment defaults, failure to perform affirmative covenants, failure to refrain from actions or omissions prohibited by negative covenants, the inaccuracy of representations or warranties, bankruptcy and insolvency related defaults and a change of control default. We were in compliance with all such covenants as of December 31, 2016 and similar affirmative and negative covenants applicable to our then outstanding credit facilities as of December 31, 2015.
The Restated Credit Agreement requires mandatory prepayments based upon annual excess cash flows commencing with the year ended December 31, 2017. The mandatory prepayment is contingently payable based on an annual excess cash flow calculation as defined within the Restated Credit Agreement.
103
Cotiviti Holdings, Inc.
Notes to the Financial Statements (continued)
(In thousands, except shares and per share amounts)
As of December 31, 2016, the expected aggregate maturities of long‑term debt for each of the next five years are as follows:
|
|
|
December 31, |
|
|
|
|
|
2016 |
|
|
|
2017 |
|
$ |
18,000 |
|
|
2018 |
|
|
18,000 |
|
|
2019 |
|
|
24,250 |
|
|
2020 |
|
|
30,500 |
|
|
2021 |
|
|
183,625 |
|
|
Thereafter |
|
|
521,125 |
|
|
Total |
|
$ |
795,500 |
|
Note 10. Derivative Instruments
We are exposed to fluctuations in interest rates on our long‑term debt. We manage our exposure to fluctuations in the 3‑month LIBOR through the use of interest rate cap agreements designated as cash flow hedges. We are meeting our objective by hedging the risk of changes in cash flows related to changes in LIBOR by capping the interest on our floating rate debt linked to LIBOR to approximately 3%. We do not utilize derivatives for speculative or trading purposes.
As of December 31, 2016 and December 31, 2015, we had $540,000 and $630,000, respectively, in notional debt outstanding related to these interest rate caps, which cover quarterly interest payments through September 2019. The notional amount decreases over time. Refer to Note 9 for more information regarding the debt outstanding related to these agreements.
All of our outstanding interest rate cap contracts qualify for cash flow hedge accounting treatment in accordance with ASC 815, Derivatives and Hedging. Cash flow hedge accounting treatment allows for gains and losses on the effective portion of qualifying hedges to be deferred in accumulated other comprehensive (loss) income until the underlying transaction occurs, rather than recognizing the gains and losses on these instruments in earnings during each period they are outstanding. When the actual interest payments are made on our variable rate debt as described in Note 9 and the related derivative contract settles, any effective portion of realized interest rate hedging derivative gains and losses previously recorded in accumulated other comprehensive (loss) income is recognized in interest expense. We recognized interest expense of $283 and $105 during the years ended December 31, 2016 and 2015, respectively. We did not recognize any interest expense related to interest rate caps during the year ended December 31, 2014.
Ineffectiveness results, in certain circumstances, when the change in total fair value of the derivative instrument differs from the change in the fair value of our expected future cash outlays for the related interest payment and is recognized immediately in interest expense. There was no ineffectiveness recorded during the years ended December 31, 2016, 2015 and 2014, respectively. Likewise, if the hedge does not qualify for hedge accounting, the periodic changes in its fair value are recognized in the period of the change in interest expense. All cash flows related to our interest rate cap agreements are classified as operating cash flows.
Any outstanding derivative instruments expose us to credit loss in the event of nonperformance by the counterparties to the agreements, but we do not expect that the counterparty will fail to meet their obligations. The amount of such credit exposure is generally the positive fair value of our outstanding contracts. To manage credit risks, we select counterparties based on credit assessments, limit our overall exposure to any single counterparty and monitor the market position of any counterparty.
104
Cotiviti Holdings, Inc.
Notes to the Financial Statements (continued)
(In thousands, except shares and per share amounts)
The table below reflects quantitative information related to the fair value of our derivative instruments and where these amounts are recorded in our consolidated financial statements as of the period presented:
|
|
|
|
|
|
|
|
|
|
|
|
December 31, |
|
||||
|
|
|
2016 |
|
2015 |
|
||
|
Liability fair value recorded in other long-term liabilities |
|
$ |
1,729 |
|
$ |
2,310 |
|
|
Liability fair value recorded in accounts payable and accrued other expenses |
|
|
1,065 |
|
|
1,086 |
|
|
Estimated amount of existing losses expected to be reclassified into earnings in the next 12 months |
|
|
(1,783) |
|
|
(283) |
|
We record deferred hedge premiums which are being paid over the life of the hedge in accumulated other comprehensive (loss) income until the related hedge ultimately settles and interest payments are made on the underlying debt. As of December 31, 2016, we have made payments of $2,581 related to these deferred premiums. We expect to pay an additional $3,813 in deferred premiums through 2019 related to our outstanding interest rate cap agreements which is reflected in the fair value of these derivatives in the table above.
Comprehensive (loss) income includes changes in the fair value of our interest rate cap agreements which qualify for hedge accounting. Changes in other comprehensive (loss) income for the periods presented related to derivative instruments classified as cash flow hedges were as follows:
|
|
|
|
|
|
|
Balance, January 1, 2014 |
|
$ |
— |
|
|
Reclassifications in earnings |
|
|
— |
|
|
Change in fair value of derivative instrument, net of tax of $476 |
|
|
(623) |
|
|
Balance, December 31, 2014 |
|
|
(623) |
|
|
Reclassifications in earnings, net of tax benefit of $40 |
|
|
65 |
|
|
Change in fair value of derivative instrument, net of tax of $1,360 |
|
|
(2,410) |
|
|
Balance, December 31, 2015 |
|
|
(2,968) |
|
|
Reclassifications in earnings, net of tax benefit of $107 |
|
|
176 |
|
|
Change in fair value of derivative instrument, net of tax of $319 |
|
|
(542) |
|
|
Balance, December 31, 2016 |
|
$ |
(3,334) |
|
Note 11. Fair Value Measurements
We measure assets and liabilities at fair value based on assumptions market participants would use in pricing an asset or liability in the principal or most advantageous market. Authoritative guidance on fair value measurements establishes a consistent framework for measuring fair value whereby inputs are assigned a hierarchical level. The hierarchical levels are:
Level 1: Unadjusted quoted prices in active markets for identical assets or liabilities accessible to the reporting entity at the measurement date.
Level 2: Observable prices, other than quoted prices included in Level 1 inputs for the asset or liability, either directly or indirectly, for substantially the full term of the asset or liability.
Level 3: Unobservable inputs for the asset or liability used to measure fair value to the extent observable inputs are not available, thereby allowing for situations in which there is little, if any, market activity for the asset or liability at measurement date.
105
Cotiviti Holdings, Inc.
Notes to the Financial Statements (continued)
(In thousands, except shares and per share amounts)
The following table summarizes our financial instruments measured at fair value within the Consolidated Balance Sheets:
|
|
|
December 31, 2016 |
|
December 31, 2015 |
|
||||||||||||||
|
|
|
Level 1 |
|
Level 2 |
|
Level 3 |
|
Level 1 |
|
Level 2 |
|
Level 3 |
|
||||||
|
Assets: |
|
|
|
|
|
|
|
|
|
|
|
|
|
|
|
|
|
|
|
|
Available-for-sale securities |
|
$ |
— |
|
$ |
— |
|
$ |
— |
|
$ |
1,181 |
|
$ |
— |
|
$ |
— |
|
|
Liabilities |
|
|
|
|
|
|
|
|
|
|
|
|
|
|
|
|
|
|
|
|
Long-term debt |
|
|
— |
|
|
— |
|
|
791,038 |
|
|
— |
|
|
— |
|
|
1,055,045 |
|
|
Interest rate cap agreements |
|
|
— |
|
|
2,794 |
|
|
— |
|
|
— |
|
|
3,396 |
|
|
— |
|
|
Total |
|
$ |
— |
|
$ |
2,794 |
|
$ |
791,038 |
|
$ |
1,181 |
|
$ |
3,396 |
|
$ |
1,055,045 |
|
Investments are classified as available‑for‑sale and carried at fair value in the accompanying Consolidated Balance Sheets. As of December 31, 2015, our investments consisted of money market securities valued using quoted market prices for identical assets in active markets. As of December 31, 2016, we did not hold any investments in available-for-sale securities.
The fair value of our private debt is determined based on fluctuations in current interest rates, the trends in market yields of debt instruments with similar credit ratings, general economic conditions and other quantitative and qualitative factors. The carrying value of our debt approximates its fair value.
The fair value of the interest rate cap agreements is determined using the market standard methodology of discounting the future expected variable cash receipts that would occur if interest rates rose above the strike rate of the caps. The analysis reflects the contractual terms of the derivatives, including period to maturity and remaining deferred premium payments, and uses observable market‑based inputs, including interest rates and implied volatilities. The variable cash receipts are based on an expectation of future interest rates (forward curves) derived from observable market interest rates. As such, the estimated fair values of these liabilities are classified as Level 2 in the fair value hierarchy.
Note 12. Income Taxes
Total income tax expense (benefit) for the years ended December 31, 2016, 2015 and 2014 was as follows:
|
|
|
Year ended |
|
|||||||
|
|
|
December 31, |
|
|||||||
|
|
|
2016 |
|
2015 |
|
2014 |
|
|||
|
Income tax expense (benefit) from continuing operations |
|
$ |
20,970 |
|
$ |
14,401 |
|
$ |
(16,804) |
|
|
Income tax expense from discontinued operations |
|
|
— |
|
|
341 |
|
|
— |
|
|
Total income tax expense (benefit) |
|
$ |
20,970 |
|
$ |
14,742 |
|
$ |
(16,804) |
|
For the years ended December 31, 2016, 2015 and 2014, income (loss) from continuing operations before income taxes includes the following components:
|
|
|
Year ended |
|
|||||||
|
|
|
December 31, |
|
|||||||
|
|
|
2016 |
|
2015 |
|
2014 |
|
|||
|
U.S. operations |
|
$ |
66,838 |
|
$ |
27,605 |
|
$ |
(45,203) |
|
|
Foreign operations |
|
|
2,984 |
|
|
100 |
|
|
2,574 |
|
|
Income (loss) before income taxes |
|
$ |
69,822 |
|
$ |
27,705 |
|
$ |
(42,629) |
|
106
Cotiviti Holdings, Inc.
Notes to the Financial Statements (continued)
(In thousands, except shares and per share amounts)
The income tax expense (benefit) that is attributable to income (loss) from continuing operations before income taxes included in our Consolidated Statements of Comprehensive Income (Loss) for the years ended December 31, 2016, 2015 and 2014 consisted of the following:
|
|
|
Year ended |
|
|||||||
|
|
|
December 31, |
|
|||||||
|
|
|
2016 |
|
2015 |
|
2014 |
|
|||
|
Current: |
|
|
|
|
|
|
|
|
|
|
|
U.S. federal |
|
$ |
26,734 |
|
$ |
20,382 |
|
$ |
25,136 |
|
|
State and local |
|
|
613 |
|
|
4,822 |
|
|
4,091 |
|
|
Foreign |
|
|
1,358 |
|
|
1,029 |
|
|
842 |
|
|
Current income tax expense |
|
|
28,705 |
|
|
26,233 |
|
|
30,069 |
|
|
Deferred |
|
|
|
|
|
|
|
|
|
|
|
U.S. federal |
|
|
(5,858) |
|
|
(12,584) |
|
|
(42,047) |
|
|
State and local |
|
|
(1,825) |
|
|
798 |
|
|
(4,826) |
|
|
Foreign |
|
|
(52) |
|
|
(46) |
|
|
— |
|
|
Deferred income tax benefit |
|
|
(7,735) |
|
|
(11,832) |
|
|
(46,873) |
|
|
Total income tax expense (benefit) |
|
$ |
20,970 |
|
$ |
14,401 |
|
$ |
(16,804) |
|
The factors accounting for the variation in our overall effective tax rates from continuing operations compared to U.S. statutory income tax rates for the years ended December 31, 2016, 2015 and 2014 were as follows:
|
|
|
Year ended |
|
|||||||
|
|
|
December 31, |
|
|||||||
|
|
|
2016 |
|
2015 |
|
2014 |
|
|||
|
Federal income tax expense (benefit) at the statutory rate |
|
$ |
24,438 |
|
$ |
9,697 |
|
$ |
(14,920) |
|
|
State and local taxes, net of federal benefit |
|
|
556 |
|
|
3,922 |
|
|
(2,167) |
|
|
Non-deductible costs |
|
|
779 |
|
|
1,070 |
|
|
815 |
|
|
Stock-based compensation |
|
|
(4,000) |
|
|
— |
|
|
— |
|
|
Unrecognized tax positions |
|
|
(1,397) |
|
|
508 |
|
|
(240) |
|
|
Other |
|
|
594 |
|
|
(796) |
|
|
(292) |
|
|
Total income tax expense (benefit) |
|
$ |
20,970 |
|
$ |
14,401 |
|
$ |
(16,804) |
|
Our effective income tax rate from continuing operations was 30.0%, 52.0% and 39.4% for the years ended December 31, 2016, 2015 and 2014, respectively. The decrease in the effective tax rate for the year ended December 31, 2016 compared to December 31, 2015 is primarily due to a $1,300 tax benefit related to the settlement of an uncertain tax position recorded in a prior period, a $4,000 excess tax benefit related to stock option exercises resulting from the early adoption of ASU 2016-09 and a $1,122 tax benefit from the implementation of certain tax planning. The increase in the effective tax rate for the year ended December 31, 2015 compared to December 31, 2014 is primarily due to changes in uncertain tax positions, an increase in non-deductible costs, an increase in the valuation allowance and the impact of a state deferred tax remeasurement as a result of new statutory regulations.
In general, it is our practice and intention to reinvest the earnings of our non branch foreign subsidiaries in those operations on an indefinite basis. Such amounts may become subject to U.S. taxation upon the remittance of dividends and under certain other circumstances. Due to our intent to reinvest such amounts indefinitely, the taxation of these amounts in the U.S. is not expected to occur in the foreseeable future and therefore no deferred tax liability has been recorded. For the years ended December 31, 2016, 2015 and 2014 the amounts considered indefinitely reinvested were $8,065, $5,910 and $4,610, respectively. If the earnings were not considered indefinitely reinvested under current law, the tax on such earnings would be approximately $1,891, $1,386 and $1,081 for the years ended December 31, 2016, 2015 and 2014, respectively.
The net deferred taxes below are included on our Consolidated Balance Sheets as a long-term net deferred tax liability of $120,533 at December 31, 2016 and a long-term net deferred tax liability of $129,284 at December 31, 2015.
107
Cotiviti Holdings, Inc.
Notes to the Financial Statements (continued)
(In thousands, except shares and per share amounts)
The components of our deferred tax assets and liabilities as of December 31, 2016 and 2015 are as follows:
|
|
|
Year ended December 31, |
|
||||
|
|
|
2016 |
|
2015 |
|
||
|
Deferred tax assets: |
|
|
|
|
|
|
|
|
Allowance for doubtful accounts and estimated allowance for refunds and appeals |
|
$ |
34,794 |
|
$ |
35,174 |
|
|
Accrued compensation |
|
|
2,185 |
|
|
540 |
|
|
Deferred rent |
|
|
149 |
|
|
156 |
|
|
Stock-based compensation |
|
|
10,381 |
|
|
2,960 |
|
|
Tax credit and net operating loss carryforward |
|
|
652 |
|
|
1,652 |
|
|
Other deductible temporary differences |
|
|
5,077 |
|
|
6,353 |
|
|
Gross deferred tax assets |
|
|
53,238 |
|
|
46,835 |
|
|
Less: valuation allowance |
|
|
(199) |
|
|
(440) |
|
|
Total deferred tax assets |
|
|
53,039 |
|
|
46,395 |
|
|
Deferred tax liabilities: |
|
|
|
|
|
|
|
|
Unbilled receivables and other liabilities |
|
|
(2,307) |
|
|
(2,435) |
|
|
Intangibles and goodwill |
|
|
(154,528) |
|
|
(161,099) |
|
|
Property and equipment |
|
|
(10,795) |
|
|
(8,706) |
|
|
Software development costs |
|
|
(2,603) |
|
|
(1,998) |
|
|
Other taxable temporary differences |
|
|
(3,339) |
|
|
(1,441) |
|
|
Total gross deferred tax liabilities |
|
|
(173,572) |
|
|
(175,679) |
|
|
Net deferred tax liability |
|
$ |
(120,533) |
|
$ |
(129,284) |
|
We have federal net operating loss carryforwards of $1,297 which will expire in 2029. In addition, we have a foreign net operating loss of $1,183 with an unlimited carryforward. All state net operating losses were utilized in the prior year.
As of December 31, 2016 and 2015, a valuation allowance of $199 and $440, respectively, has been recorded to reflect the portion of the deferred tax asset that is not more likely than not to be realized. The decrease in the valuation allowance relates to changes from statutory tax filings for the year ended December 31, 2015. The amount of the deferred tax asset considered realizable, however, could be adjusted if estimates of future taxable income during the carryforward period are reduced or increased or if objective negative evidence in the form of cumulative losses is no longer present and additional weight may be given to subjective evidence such as our projections for growth.
Due to change of ownership provisions in the Internal Revenue Code, use of a portion of our domestic net operating loss and tax credit carryforwards will be limited in future periods. Further, a portion of the carryforwards may expire before being applied to reduce future income tax liabilities.
ASC 740 clarifies the accounting and reporting for uncertainties in income tax law. This interpretation prescribes a comprehensive model for financial statement recognition measurement, presentation and disclosure of uncertain tax positions taken or expected to be taken in income tax returns. ASC 740 requires that the tax effects of an uncertain tax position be recognized only if it is “more likely than not” to be sustained by the taxing authority as of the reporting date.
108
Cotiviti Holdings, Inc.
Notes to the Financial Statements (continued)
(In thousands, except shares and per share amounts)
A reconciliation of the beginning and ending amount of unrecognized tax benefits at December 31, 2016 and 2015 is as follows:
|
|
|
|
|
|
|
|
|
|
|
|
Year ended December 31, |
|
||||
|
|
|
2016 |
|
2015 |
|
||
|
Unrecognized tax benefits — January 1 |
|
$ |
4,937 |
|
$ |
4,324 |
|
|
Increase for tax positions taken in prior period |
|
|
67 |
|
|
619 |
|
|
Increase for tax positions taken in current period |
|
|
203 |
|
|
694 |
|
|
Decrease for tax positions taken in prior period |
|
|
(508) |
|
|
— |
|
|
Decrease for tax positions taken in current period |
|
|
(43) |
|
|
(146) |
|
|
Decrease related to lapse in statute of limitations |
|
|
(96) |
|
|
(554) |
|
|
Decrease related to settlement of positions taken in prior periods |
|
|
(1,989) |
|
|
— |
|
|
Unrecognized tax benefits — December 31 |
|
$ |
2,571 |
|
$ |
4,937 |
|
The majority of the balance of unrecognized tax benefits as of December 31, 2016 and 2015, would affect the effective tax rate if recognized.
The total uncertain tax positions expected to reverse in the next 12 months is approximately $2,301 and $194 as of December 31, 2016 and 2015, respectively, due to lapse of statute of limitations. The current year change in uncertain tax positions is primarily the result of the settlement of an uncertain tax position recorded during a prior period.
The total penalty and interest incurred, relating to uncertain tax positions, for years ended December 31, 2016, 2015 and 2014, was $424, $920 and $583, respectively. We include interest and penalties as tax expense in the Consolidated Statements of Comprehensive Income (Loss).
We file income taxes with the U.S. federal government and various state and foreign jurisdictions. We are currently under audit with the Internal Revenue Service for the tax year ended December 31, 2014. In addition we are currently under audit for iHealth Technologies for the tax years ended December 31, 2012, December 31, 2013 and May 13, 2014. We operate in a number of state and local jurisdictions and as such are subject to state and local income tax examinations based upon various statutes of limitations in each jurisdiction. We are currently under audit by the State of New York for the tax year ended December 31, 2014 and for iHealth Technologies for the tax years ended December 31, 2012, December 31, 2013 and May 13, 2014.
Note 13. Stockholders’ Equity
Issuance of Common Stock
On May 13, 2016 our certificate of incorporation was amended and the number of shares of common stock authorized to be issued by Cotiviti Holdings, Inc. was increased from 122,000,000 to 600,000,000.
On May 25, 2016 we consummated our IPO in which we issued and sold a total of 12,936,038 shares of common stock, including a portion of the underwriter overallotment, at a public offering price of $19.00 per share. We received net proceeds of approximately $226,963 after deducting underwriting discounts and commissions and other offering expenses of approximately $18,822.
In May 2014, a total of 32,790,321 shares of common stock were issued for a total fair value of $435,144 in connection with the Connolly iHealth Merger. Of this amount, $365,187 was received in cash and $69,957 was issued to certain members of the former iHealth Technologies management as they either rolled over a portion of their former equity interests in iHealth Technologies or received equity in lieu of incentive compensation that was owed to them as of the date of the merger.
109
Cotiviti Holdings, Inc.
Notes to the Financial Statements (continued)
(In thousands, except shares and per share amounts)
A summary of the current rights and preferences of holders of our common stock are as follows:
Voting
Common stockholders are entitled to one vote per share of common stock held on all matters on which such common stockholder is entitled to vote.
Dividends
Common stockholders are eligible to receive dividends on common stock held when funds are available and as approved by the Board. The Restated Credit Agreement contains certain negative covenants that may restrict our ability to pay dividends. In addition, Delaware law may restrict the Board’s ability to declare dividends.
Liquidation Rights
In the event of liquidation or dissolution, common stockholders are entitled to receive all assets available for distribution to stockholders.
Registration Rights
The Second Amended and Restated Stockholders Agreement entered into as of June 1, 2016 in connection with our IPO contains (i) demand registration rights for Advent, subject to a cap of two requests in any 12 month period; (ii) piggy-back registration rights for any stockholder holding at least $500 worth of shares (each, a “Holder”), subject to a pro rata reduction if the total amount of shares requested to be included exceeds the amount of securities which in the opinion of the underwriters can be sold; and (iii) shelf registration rights for Holders, subject to a required anticipated aggregate offering price, net of selling expenses, of $5,000 subject to a cap of two requests for shelf registrations, for all Holders in the aggregate, in any 12 month period. Holders that are capable of selling all of their registrable securities pursuant to Rule 144 under the Securities Act in a single transaction without timing or volume limitations do not have piggy-back registration rights. We will be responsible for fees and expenses in connection with the registration rights, other than underwriters’ discounts and brokers’ commissions, if any, relating to any such registration and offering.
Common Stock Split
On May 13, 2016 we effected a 6.1-for-1 stock split of all outstanding shares of our common stock. All share, option and per share information presented in the accompanying consolidated financial statements and notes thereto have been adjusted to reflect the stock split on a retroactive basis for all periods presented and all share information is rounded up to the nearest whole share after reflecting the stock split.
Common Stock Dividends
On May 25, 2016 we paid a Special Cash Dividend of $150,000, or $1.94 per share of common stock outstanding prior to the IPO, to holders of record of our common stock on the dividend record date. In connection with the Special Cash Dividend we lowered the exercise price of then outstanding stock options by $1.94 per share in order to preserve the intrinsic value of the options giving effect to the Special Cash Dividend.
Note 14. Earnings per Share
Basic earnings per share (“EPS”) is computed based on the weighted average number of shares of common stock outstanding during the period. Diluted EPS is computed based on the weighted average number of shares of common stock plus the effect of dilutive potential common shares outstanding during the period. For all periods presented, potentially dilutive outstanding shares consisted solely of our stock-based awards. Our potential common shares consist of the incremental common shares issuable upon the exercise of the options and vesting of restricted stock
110
Cotiviti Holdings, Inc.
Notes to the Financial Statements (continued)
(In thousands, except shares and per share amounts)
units. The dilutive effect of outstanding stock-based awards is reflected in diluted earnings per share by application of the treasury stock method. For all periods presented, all outstanding common stock consisted of a single‑class.
Basic and diluted earnings (loss) per share are computed as follows:
|
|
|
|
|
|
|
|
|
|
|
|
|
|
|
Year Ended |
|
|||||||
|
|
|
December 31, |
|
|||||||
|
|
|
2016 |
|
2015 |
|
2014 |
|
|||
|
Net income (loss) available to common stockholders |
|
$ |
48,852 |
|
$ |
13,863 |
|
$ |
(25,825) |
|
|
|
|
|
|
|
|
|
|
|
|
|
|
Weighted average outstanding shares of common stock |
|
|
85,053,890 |
|
|
77,216,133 |
|
|
65,253,954 |
|
|
Dilutive effect of stock-based awards |
|
|
3,524,302 |
|
|
425,255 |
|
|
— |
|
|
Adjusted weighted average outstanding and assumed conversions for diluted EPS |
|
|
88,578,192 |
|
|
77,641,388 |
|
|
65,253,954 |
|
|
|
|
|
|
|
|
|
|
|
|
|
|
Earnings (loss) per share from continuing operations: |
|
|
|
|
|
|
|
|
|
|
|
Basic |
|
$ |
0.57 |
|
$ |
0.17 |
|
$ |
(0.40) |
|
|
Diluted |
|
|
0.55 |
|
|
0.17 |
|
|
(0.40) |
|
|
|
|
|
|
|
|
|
|
|
|
|
|
Earnings per share from discontinued operations: |
|
|
|
|
|
|
|
|
|
|
|
Basic |
|
$ |
— |
|
$ |
0.01 |
|
$ |
— |
|
|
Diluted |
|
|
— |
|
|
0.01 |
|
|
— |
|
|
|
|
|
|
|
|
|
|
|
|
|
|
Total earnings (loss) per share: |
|
|
|
|
|
|
|
|
|
|
|
Basic |
|
$ |
0.57 |
|
$ |
0.18 |
|
$ |
(0.40) |
|
|
Diluted |
|
|
0.55 |
|
|
0.18 |
|
|
(0.40) |
|
Employee stock options and RSUs that were excluded from the calculation of diluted earnings per share because their effect is anti‑dilutive for the periods presented were as follows:
|
|
|
|
|
|
|
|
|
|
|
|
Years Ended |
|
||||
|
|
|
December 31, |
|
||||
|
|
|
2016 |
|
2015 |
|
2014 |
|
|
|
|
|
|
|
|
|
|
|
Employee stock-based awards |
341,054 | 2,035,332 | 2,536,960 | ||||
The criteria associated with all of our outstanding performance-based stock options as defined in the terms of the applicable award agreements, were satisfied as of September 30, 2016 and, as a result, outstanding performance-based stock options were included in the calculation of diluted earnings per share for the year ended December 31, 2016. Performance-based stock options of 2,794,910 and 2,487,275 as of December 31, 2015 and 2014, respectively, were not included in the calculation of diluted earnings per share as the vesting conditions had not yet been satisfied.
Note 15. Stock‑Based Compensation
Equity Incentive Plans
In 2012, we adopted the 2012 Plan pursuant to which our Board of Directors (or committee as designated by the Board of Directors) may grant options to purchase shares of our stock, restricted stock and certain other equity awards to directors, officers and key employees. We only granted stock options that can be settled in shares of our common stock under the 2012 Plan. The 2012 Plan had a total of 7,243,330 shares authorized for issuance. Upon completion of the IPO in May 2016, issuances under the 2012 Plan were suspended. At that time we adopted the 2016 Plan (collectively with the 2012 Plan, the “Equity Plans”), pursuant to which our Board of Directors (or a committee or sub-committee designated by the Board of Directors) may grant options to purchase shares of our stock, restricted stock and certain other equity awards to directors, officers and key employees. The 2016 Plan was established with the authorization for grants of up to 5,490,000 shares of authorized but unissued shares of common stock.
111
Cotiviti Holdings, Inc.
Notes to the Financial Statements (continued)
(In thousands, except shares and per share amounts)
No stock options were granted under the 2012 Plan after December 31, 2015. Awards granted under the 2012 Plan will remain outstanding until the earlier of exercise, forfeiture, cancellation or expiration. To the extent outstanding options under the 2012 Plan are forfeited, cancelled or terminated, the common stock subject to such options will be available for future issuance under the 2016 Plan. As of December 31, 2016, there are no shares available for future issuance under the 2012 Plan as it was discontinued upon adoption of the 2016 Plan. As of December 31, 2016 the total number of shares available for future issuance under the 2016 Plan is 5,277,451.
Stock Options
Under the terms of the 2016 Plan, we may issue options to purchase shares of our common stock at a price equal to 100% of the market price on the date of grant. Issuances under the 2012 Plan, prior to its suspension, were under terms similar to issuances under the 2016 Plan. Stock options granted are subject to either time of service (service-based awards) or performance (performance-based awards) criteria. Service-based awards typically vest ratably over a five year service period from the date of grant under the 2012 Plan and typically vest ratably over a four year service period from the date of grant under the 2016 Plan. In the event of a change in control, any outstanding, unvested service-based awards will vest immediately. Performance-based awards vest in accordance with the specific performance criteria espoused in the executed award agreements. The term of any stock option shall not exceed ten years from the date of grant. However, an incentive stock option granted to an employee who, at the time of grant, owns stock possessing more than 10% of the total combined voting power of all classes of our stock may not have a term exceeding five years from the date of grant.
The following is a summary of stock option activity under the Equity Plans:
|
|
|
Year Ended December 31, |
|
||||||||
|
|
|
2016 |
|
2015 |
|
||||||
|
|
|
|
|
Weighted |
|
|
|
Weighted |
|
||
|
|
|
|
|
average |
|
|
|
average |
|
||
|
|
|
|
|
exercise |
|
|
|
exercise |
|
||
|
|
|
Shares |
|
price |
|
Shares |
|
price |
|
||
|
Outstanding at beginning of period |
|
6,441,527 |
|
$ |
9.59 |
|
5,024,234 |
|
$ |
7.98 |
|
|
Granted |
|
273,759 |
|
|
19.59 |
|
1,997,964 |
|
|
13.76 |
|
|
Exercised |
|
(574,991) |
|
|
7.41 |
|
(25,620) |
|
|
6.26 |
|
|
Forfeited |
|
(127,233) |
|
|
12.92 |
|
(555,051) |
|
|
10.16 |
|
|
Expired |
|
(15,690) |
|
|
13.60 |
|
— |
|
|
— |
|
|
Outstanding at end of period |
|
5,997,372 |
|
$ |
10.18 |
|
6,441,527 |
|
$ |
9.59 |
|
|
|
|
|
|
|
|
|
|
|
|
|
|
|
|
|
|
|
|
|
|
|
|
|
|
|
|
|
|
Average |
|
|
|
|||
|
|
|
|
|
Weighted |
|
|
|
Weighted |
|
Remaining |
|
|
|
|
||
|
|
|
Service- |
|
average |
|
Performance- |
|
average |
|
Contractual |
|
Aggregate |
|
|||
|
|
|
based |
|
exercise |
|
based |
|
exercise |
|
Term |
|
Intrinsic |
|
|||
|
|
|
Shares |
|
price |
|
Shares |
|
price |
|
(in years) |
|
Value |
|
|||
|
Stock options outstanding as of December 31, 2016 |
|
3,609,485 |
|
$ |
10.77 |
|
2,387,887 |
|
$ |
9.28 |
|
7.30 |
|
$ |
145,270 |
|
|
Stock options vested and exercisable as of December 31, 2016 |
|
1,878,538 |
|
$ |
9.04 |
|
2,387,887 |
|
$ |
9.28 |
|
7.00 |
|
$ |
107,617 |
|
The criteria associated with 2,746,592 of our outstanding performance-based stock options as defined in the terms of the award agreements, was satisfied as of September 30, 2016 and therefore these stock options all became vested and exercisable.
Aggregate intrinsic value represents the difference between our estimated fair value of common stock and the exercise price of outstanding in the money options. The fair value per share of common stock was $34.40 as of December 31, 2016 based upon the closing price of our common stock on the NYSE. The total intrinsic value of options exercised was $15,521 for the year ended December 31, 2016 and was insignificant for the year ended
112
Cotiviti Holdings, Inc.
Notes to the Financial Statements (continued)
(In thousands, except shares and per share amounts)
December 31, 2015. The total fair value of stock options vested was $22,453, $2,450 and $2,000 during the years ended December 31, 2016, 2015 and 2014, respectively.
Restricted Stock Units
RSUs provide participants the right to receive a payment based on the value of a share of common stock. RSUs may be subject to vesting requirements, restrictions and conditions to payment. Such requirements may be based on the continued service for a specified time period or on the attainment of specified performance goals as specified in the award agreements. RSUs are payable in cash or in shares or a combination of both. Under the terms of the Equity Plans, RSUs have a grant date fair value equal to the closing price of our stock on the grant date. The units typically vest ratably over a four year service period. We began issuing RSUs upon adoption of the 2016 Plan; no RSUs were issued under the 2012 Plan.
The following is a summary of RSU activity under the 2016 Plan:
|
|
|
|
|
|
|
|
|
|
|
Year Ended December 31, |
|
|||
|
|
|
2016 |
|
|||
|
|
|
|
|
Weighted |
|
|
|
|
|
|
|
average |
|
|
|
|
|
|
|
grant date |
|
|
|
|
|
Shares |
|
fair value |
|
|
|
Nonvested at beginning of period |
|
— |
|
$ |
— |
|
|
Granted |
|
67,295 |
|
|
25.88 |
|
|
Vested |
|
— |
|
|
— |
|
|
Forfeited |
|
— |
|
|
— |
|
|
Nonvested at end of period |
|
67,295 |
|
$ |
25.88 |
|
Stock Compensation Expense
The fair value of each stock option award is estimated on the date of grant using a Black-Scholes-Merton option pricing model. The expected term of the option represents the period the stock-based awards are expected to be outstanding. We use the simplified method under the provisions of ASC 718, Compensation – Stock Compensation, for estimating the expected term of the options. Since our shares were not publicly traded until May 2016 and were rarely traded privately, at the time of each grant, there was insufficient volatility data available. Accordingly, we calculate expected volatility using comparable peer companies with publicly traded shares over a term similar to the expected term of the options issued. We do not intend to pay dividends on our common shares, therefore, the dividend yield percentage is zero. The risk-free interest rate is based on the U.S. Treasury constant maturity interest rate whose term is consistent with the expected life of our stock options.
We used the following weighted average assumptions to estimate the fair value of stock options granted for the periods presented as follows:
|
|
|
Year Ended December 31, |
|
|||||||
|
|
|
2016 |
|
2015 |
|
2014 |
|
|||
|
Expected term (years) |
|
|
6.25 |
|
|
6.25 |
|
|
6.25 |
|
|
Expected volatility |
|
|
50.00 |
% |
|
50.00 |
% |
|
50.00 |
% |
|
Expected dividend yield |
|
|
0.00 |
% |
|
0.00 |
% |
|
0.00 |
% |
|
Weighted average risk-free interest rate |
|
|
1.36 |
% |
|
1.70 |
% |
|
1.80 |
% |
|
Weighted average grant date fair value |
|
$ |
9.53 |
|
$ |
7.77 |
|
$ |
5.70 |
|
We recorded total stock-based compensation expense of $22,954, $3,399 and $2,492 for the years ended December 31, 2016, 2015 and 2014, respectively. Stock-based compensation expense during the year ended December 31, 2016 includes $15,898 related to the vesting of all outstanding performance-based stock options. Stock-based compensation expense during the year ended December 31, 2016 also includes $2,257 related to the accelerated vesting
113
Cotiviti Holdings, Inc.
Notes to the Financial Statements (continued)
(In thousands, except shares and per share amounts)
of certain stock options as the result of our IPO. We had not previously adjusted stock-based compensation expense for estimated forfeitures as there has been insignificant forfeiture activity to date. Based on the adoption of ASU 2016-09, we will account for forfeitures as they occur. As of December 31, 2016, we had total unrecognized compensation cost related to 1,784,212 unvested service-based stock options and RSUs under the Equity Plans of $13,319 which we expect to recognize over the next 3.1 years.
Note 16. Related Party Transactions
In connection with the Connolly iHealth Merger, a preliminary liability of $21,291 was recorded in accounts payable and accrued other expenses on the Consolidated Balance Sheets as of December 31, 2014 for payments due to the former stockholders of iHealth Technologies. See Note 4 for more information regarding the Connolly iHealth Merger. These amounts were finalized during 2015 and $22,270 was paid to the former stockholders of iHealth Technologies in September 2015.
Note 17. Segment and Geographic Information
Operating segments are components of an enterprise for which separate financial information is available that is evaluated regularly by our Chief Operating Decision Maker in deciding how to allocate resources and in assessing financial performance. We conduct our business through two reportable business segments: Healthcare and Global Retail and Other.
Through our Healthcare segment, we offer prospective and retrospective claims accuracy solutions to healthcare payers in the United States. We also provide analytics-based solutions unrelated to our healthcare payment accuracy solutions, on a limited basis in the United States. Through our Global Retail and Other segment, we provide retrospective claims accuracy solutions to retailers primarily in the United States, Canada and the United Kingdom, as well as solutions that improve efficiency and effectiveness of payment networks for a limited number of clients.
We evaluate the performance of each segment based on segment net revenue and segment operating income. Operating income is calculated as net revenue less operating expenses and is not affected by other expense (income) or by income taxes. Indirect costs are generally allocated to the segments based on the segments’ proportionate share of revenue and expenses directly related to the operation of the segment. We do not allocate interest expense, other non‑operating (income) expense or the provision for income taxes, since these items are not considered in evaluating the segment’s overall operating performance. Our Chief Operating Decision Maker does not receive or utilize asset information to evaluate performance of operating segments. Accordingly, asset‑related information has not been presented.
Our operating segment results for the periods presented were as follows:
|
|
|
Year Ended |
|
|||||||
|
|
|
December 31, |
|
|||||||
|
|
|
2016 |
|
2015 |
|
2014 |
|
|||
|
|
|
|
|
|
|
|
|
|
|
|
|
Net Revenue |
|
|
|
|
|
|
|
|
|
|
|
Healthcare |
|
$ |
552,041 |
|
$ |
467,044 |
|
$ |
359,842 |
|
|
Global Retail and Other |
|
|
73,121 |
|
|
74,299 |
|
|
81,530 |
|
|
Consolidated net revenue |
|
$ |
625,162 |
|
$ |
541,343 |
|
$ |
441,372 |
|
|
Operating Income |
|
|
|
|
|
|
|
|
|
|
|
Healthcare |
|
$ |
123,917 |
|
$ |
84,240 |
|
$ |
23,713 |
|
|
Global Retail and Other |
|
|
10,036 |
|
|
12,284 |
|
|
6,484 |
|
|
Consolidated operating income |
|
$ |
133,953 |
|
$ |
96,524 |
|
$ |
30,197 |
|
114
Cotiviti Holdings, Inc.
Notes to the Financial Statements (continued)
(In thousands, except shares and per share amounts)
Operating segment net revenue by product type for the periods presented was as follows:
|
|
|
Year Ended December 31, |
|
|||||||||||||
|
|
|
2016 |
|
% |
|
2015 |
|
% |
|
2014 |
|
% |
|
|||
|
|
|
|
|
|
|
|
|
|
|
|
|
|
|
|
|
|
|
Healthcare |
|
|
|
|
|
|
|
|
|
|
|
|
|
|
|
|
|
Retrospective claims accuracy |
|
$ |
310,496 |
|
49.7 |
|
$ |
251,288 |
|
46.4 |
|
$ |
240,544 |
|
54.5 |
|
|
Prospective claims accuracy |
|
|
229,491 |
|
36.7 |
|
|
201,899 |
|
37.3 |
|
|
108,828 |
|
24.7 |
|
|
Transaction services |
|
|
12,054 |
|
1.9 |
|
|
13,857 |
|
2.6 |
|
|
10,470 |
|
2.4 |
|
|
Total Healthcare |
|
|
552,041 |
|
88.3 |
|
|
467,044 |
|
86.3 |
|
|
359,842 |
|
81.6 |
|
|
Global Retail and Other |
|
|
|
|
|
|
|
|
|
|
|
|
|
|
|
|
|
Retrospective claims accuracy |
|
|
70,656 |
|
11.3 |
|
|
72,060 |
|
13.3 |
|
|
80,075 |
|
18.1 |
|
|
Other |
|
|
2,465 |
|
0.4 |
|
|
2,239 |
|
0.4 |
|
|
1,455 |
|
0.3 |
|
|
Total Global Retail and Other |
|
|
73,121 |
|
11.7 |
|
|
74,299 |
|
13.7 |
|
|
81,530 |
|
18.4 |
|
|
Consolidated net revenue |
|
$ |
625,162 |
|
100.0 |
|
$ |
541,343 |
|
100.0 |
|
$ |
441,372 |
|
100.0 |
|
Geographic Information
Geographic net revenue and long-lived assets are attributed to the geographic regions based on the geographic location of each of our subsidiaries/locations. Our operations are primarily within the continental United States. We also operate in Canada and the United Kingdom.
Net revenue generated in the United States accounted for approximately 98%, 98%, and 95% of total net revenue for the years ended December 31, 2016, 2015 and 2014, respectively. Remaining net revenue was generated in the rest of the world.
Long-lived assets are primarily based in the United States with over 99% of total consolidated long-lived assets. Less than 1% of total consolidated long-lived assets are foreign.
Note 18. Client Concentration
The list of our largest clients changes periodically and was further impacted by the Connolly iHealth Merger. Our significant clients accounted for the following percentages of total net revenue:
|
|
|
Year Ended |
|
||||
|
|
|
December 31, |
|
||||
|
|
|
2016 |
|
2015 |
|
2014 |
|
|
Customer A |
|
15 |
% |
14 |
% |
15 |
% |
|
Customer B |
|
11 |
% |
10 |
% |
10 |
% |
|
Customer C |
|
2 |
% |
3 |
% |
10 |
% |
In many instances, we provide our services pursuant to agreements which have auto renewal clauses and may be periodically subject to a competitive reprocurement process.
115
Cotiviti Holdings, Inc.
Notes to the Financial Statements (continued)
(In thousands, except shares and per share amounts)
Note 19. Employee Benefit Plans
Contributions expensed and included in compensation on our Consolidated Statements of Comprehensive Income (Loss) for employee benefit plans are detailed below:
|
|
|
Year Ended |
|
|||||||
|
|
|
December 31, |
|
|||||||
|
|
|
2016 |
|
2015 |
|
2014 |
|
|||
|
401(k) Plan (a) |
|
$ |
3,860 |
|
$ |
3,053 |
|
$ |
1,604 |
|
|
Profit Share Plan (b) |
|
|
220 |
|
|
539 |
|
|
416 |
|
|
Provident Plan (c) |
|
|
528 |
|
|
427 |
|
|
179 |
|
|
Total |
|
$ |
4,608 |
|
$ |
4,019 |
|
$ |
2,199 |
|
|
(a) |
We sponsor defined contribution retirement plans in accordance with Section 401(k) of the Internal Revenue Code, which cover substantially all U.S. employees, subject to certain minimum age and service requirements. The plans provide for a contribution based on a percentage of eligible employee contributions. |
|
(b) |
We had a nonqualified profit sharing incentive compensation plan for certain eligible employees. Contributions were made within 90 days following the last day of the plan to a brokerage account in an amount determined at our discretion for employees who had completed 1,000 hours of service and were employed at the time of the contribution. This plan was discontinued after the 2014 plan year, with the final payout occurring in June |
2016 and therefore we did not have a liability under the plan as of December 31, 2016. Our liability under the plan was $893 at December 31, 2015, which is included in accrued compensation costs in the accompanying Consolidated Balance Sheets.
|
(c) |
Eligible employees of our subsidiary located in India are covered by the Provident Fund, contributions which are based on a percentage of eligible employees’ salaries, and the Indian Payment of Gratuity Act, which provides for benefits to be paid to eligible employees upon termination of employment (collectively, the “India Plan”). Benefits under the India Plan are administered by the Indian Government. As of December 31, 2016 and 2015 we had an accrued benefit obligation relating to the India Plan of $763 and $535, respectively. |
Note 20. Discontinued Operations
In February 2015, we received payment on a $900 note receivable related to a business that was disposed of in 2012. Since the date of sale, we had elected to fully reserve the note receivable as the collectability was determined to be uncertain. This gain from the collection of the note receivable, net of tax, is reflected as a gain on discontinued operations on our Consolidated Statements of Comprehensive Income (Loss). The estimated impact to diluted EPS as a result of this gain on discontinued operations was $0.01 per diluted share for the year ended December 31, 2015.
Note 21. Selected Quarterly Financial Data (Unaudited)
Historically, there has been a seasonal pattern to our healthcare revenue with the revenues in the first quarter generally lower than the other quarters and revenues in the fourth quarter generally being higher than the other quarters. Accordingly, the comparison of revenue from quarter to quarter may fluctuate and is dependent on various factors, including, but not limited to, reset of member liability, timing of special projects and timing of inaccurate payments being prevented or recovered as well as the aforementioned seasonal considerations. Consequently, you should not rely on our revenue for any one quarter as an indication of our future performance.
116
Cotiviti Holdings, Inc.
Notes to the Financial Statements (continued)
(In thousands, except shares and per share amounts)
The following table summarizes our unaudited quarterly operating results for the last two years:
|
|
|
First |
|
Second |
|
Third |
|
Fourth |
|
||||
|
Year Ended December 31, 2016 |
|
Quarter |
|
Quarter |
|
Quarter |
|
Quarter |
|
||||
|
Revenue(1) |
|
$ |
142,718 |
|
$ |
158,291 |
|
$ |
156,241 |
|
$ |
167,912 |
|
|
Operating income(1)(2) |
|
|
29,238 |
|
|
38,938 |
|
|
24,155 |
|
|
41,622 |
|
|
Net income(1)(2)(3) |
|
|
8,084 |
|
|
10,893 |
|
|
4,583 |
|
|
25,292 |
|
|
Total earnings per share—Basic |
|
$ |
0.10 |
|
$ |
0.13 |
|
$ |
0.05 |
|
$ |
0.28 |
|
|
Total earnings per share—Diluted |
|
$ |
0.10 |
|
$ |
0.13 |
|
$ |
0.05 |
|
$ |
0.27 |
|
|
|
|
First |
|
Second |
|
Third |
|
Fourth |
|
||||
|
Year Ended December 31, 2015 |
|
Quarter |
|
Quarter |
|
Quarter |
|
Quarter |
|
||||
|
Revenue |
|
$ |
119,638 |
|
$ |
133,306 |
|
$ |
136,936 |
|
$ |
151,463 |
|
|
Operating income |
|
|
23,707 |
|
|
33,773 |
|
|
4,128 |
|
|
34,916 |
|
|
Income (loss) from continuing operations(3)(4) |
|
|
3,635 |
|
|
7,780 |
|
|
(7,294) |
|
|
9,183 |
|
|
Net income (loss)(3)(4)(5) |
|
|
4,194 |
|
|
7,780 |
|
|
(7,294) |
|
|
9,183 |
|
|
Earnings (loss) per share from continuing operations—Basic |
|
$ |
0.04 |
|
$ |
0.10 |
|
$ |
(0.09) |
|
$ |
0.12 |
|
|
Earnings (loss) per share from continuing operations—Diluted |
|
$ |
0.04 |
|
$ |
0.10 |
|
$ |
(0.09) |
|
$ |
0.12 |
|
|
Earnings per share from discontinued operations(5) |
|
$ |
0.01 |
|
|
— |
|
|
— |
|
|
— |
|
|
Total earnings (loss) per share—Basic |
|
$ |
0.05 |
|
$ |
0.10 |
|
$ |
(0.09) |
|
$ |
0.12 |
|
|
Total earnings (loss) per share—Diluted |
|
$ |
0.05 |
|
$ |
0.10 |
|
$ |
(0.09) |
|
$ |
0.12 |
|
|
(1) |
During the second quarter 2016, we generated approximately $5,000 in healthcare revenue from special projects that did not reoccur in the second half of the year. |
|
(2) |
During the second quarter 2016, stock-based compensation expense includes $2,257 related to the accelerated vesting of certain stock options as the result of our IPO. During the third quarter 2016, stock-based compensation expense includes $15,898 related to the vesting of all outstanding performance-based stock options (see Note 15). |
|
(3) |
During the second quarter 2016, we made a voluntary prepayment on our Initial Second Lien Credit Facility which resulted in a $7,068 loss on extinguishment of debt. During the third quarter 2016, as a result of refinancing our long-term debt, we recorded a loss on extinguishment of $9,349 (see Note 9). |
|
(4) |
During the second quarter 2015, as a result of repricing our Initial First Lien Credit Facilities, we recorded a loss on extinguishment of debt of $4,084 (see Note 9). |
|
(5) |
As a result of our rebranding in September 2015, as discussed in Note 1, we recorded an impairment of intangible assets of $27,826 related to our trademarks (see Note 6). |
|
(6) |
During the first quarter 2015, we received payment on a $900 note receivable related to a business that was disposed of in 2012. Since the date of sale, we had elected to fully reserve the note receivable as the collectability was determined to be uncertain. This collection of the note receivable resulted in a gain on discontinued operations, net of tax, of $559 (see Note 20). |
117
Item 9. Changes in and Disagreements with Accountants on Accounting and Financial Disclosure
None.
Item 9A. Controls and Procedures
Evaluation of Disclosure Controls and Procedures
Our management has evaluated, with the participation of our Chief Executive Officer and Chief Financial Officer, the effectiveness of our disclosure controls and procedures, as defined in Rule 13(a)-15(e) of the Exchange Act, as of the end of the period covered by this Annual Report on Form 10‑K pursuant to Rule 13a-15(b) of the Exchange Act. Based on that evaluation, our Chief Executive Officer and Chief Financial Officer have concluded that our disclosure controls and procedures as of the end of the period covered by this Annual Report on Form 10‑K are effective at a reasonable assurance level in ensuring that information required to be disclosed in our Exchange Act reports is (1) recorded, processed, summarized and reported in a timely manner and (2) accumulated and communicated to our management, including our Chief Executive Officer and Chief Financial Officer, as appropriate to allow timely decisions regarding required disclosure. While our disclosure controls and procedures are designed to provide reasonable assurance of their effectiveness, because of the inherent limitations in all control systems, no evaluation of controls can provide absolute assurance that all control issues and instances of fraud, if any, within the Company have been detected.
Management’s Annual Report on Internal Control Over Financial Reporting
This Annual Report on Form 10-K does not include a report of management’s assessment regarding internal control over financial reporting or an attestation report of the company’s registered public accounting firm due to a transition period established by rules of the Securities and Exchange Commission for newly public companies.
Changes in Internal Control over Financial Reporting
There were no changes in our internal control over financial reporting that occurred during the year ended December 31, 2016 that have materially affected, or are reasonably likely to materially affect, our internal control over financial reporting.
None.
118
Item 10. Directors, Executive Officers and Corporate Governance
Directors and Executive Officers
The following table sets forth the names and ages, as of December 31, 2016, of the individuals who serve as our executive officers and directors.
|
Name |
Age |
Position |
|
J. Douglas (Doug) Williams |
55 |
Chief Executive Officer and Director |
|
Steve Senneff |
47 |
Senior Vice President and Chief Financial Officer |
|
David Beaulieu |
60 |
Senior Vice President and Chief Operations Officer |
|
Jonathan Olefson |
41 |
Senior Vice President, General Counsel and Secretary |
|
Damien Creavin |
60 |
Senior Vice President and Chief Information Officer |
|
David Swift |
58 |
Director (Chairman) |
|
Elizabeth (Libby) Connolly Alexander |
54 |
Director |
|
Mala Anand |
49 |
Director |
|
J. Lawrence (Larry) Connolly |
60 |
Director |
|
Kenneth Goulet |
57 |
Director |
|
Ruben Jose King-Shaw, Jr. |
55 |
Director |
|
John Maldonado |
41 |
Director |
|
James (Jamie) Parisi |
51 |
Director |
|
Christopher Pike |
47 |
Director |
|
Douglas Present |
52 |
Director |
There are no family relationships between or among our directors and executive officers, except that Ms. Alexander and Mr. Connolly are siblings.
J. Douglas (Doug) Williams
Mr. Williams is our Chief Executive Officer, a position he has held since May 2014. He has served as a member of our Board since May 2014. Prior to the Connolly iHealth Merger, Mr. Williams served as President and Chief Executive Officer of iHealth Technologies since its inception in May 2001. Prior to his position with iHealth Technologies, Mr. Williams served as Chief Executive Officer of Magellan Specialty Health from April 2000 to May 2001. Mr. Williams has also served in various executive and managerial roles with Vivra Specialty Partners and CIGNA Healthcare. Mr. Williams holds a B.S. in Business Administration from Appalachian State University. We believe that Mr. Williams’ extensive leadership experience, institutional knowledge of our Company and broad familiarity with the payment accuracy market qualify him to serve as one of our directors.
Steve Senneff
Mr. Senneff is our Senior Vice President and Chief Financial Officer, a position he has held since April 2015. Mr. Senneff previously served as our Chief Operations Officer from May 2014 to April 2015. Prior to the Connolly iHealth Merger, Mr. Senneff served as Chief Financial Officer of Connolly from October 2012 to May 2014. Mr. Senneff previously held various leadership positions at the Nielsen Company, most recently as Senior Vice President, Global Financial Planning & Analysis from January 2011 to October 2012. Mr. Senneff holds a B.B.A. in Accounting from the University of Iowa and a Master’s degree in Finance from the Krannert School of Management at Purdue University.
David Beaulieu
Mr. Beaulieu is our Senior Vice President and Chief Operations Officer, a position he has held since April 2015. Mr. Beaulieu previously served as our Senior Vice President, Technology and Innovation, from May 2014 to April 2015. Prior to the Connolly iHealth Merger, Mr. Beaulieu served as Chief Operating Officer of iHealth Technologies since July 2010. Mr. Beaulieu previously served as Executive Vice President of Marketing, Sales & Business Solutions at DST Health Solutions from October 2008 to June 2010, and as Chief Operating Officer at Amisys Synertech from 2004 to 2008 prior to its acquisition by DST Health Solutions. Prior to this, Mr. Beaulieu was the Managing Partner for
119
Government Business Services at First Consulting Group and held various operational and executive positions at CIGNA Healthcare. Mr. Beaulieu holds a B.A. in Government from Bates College.
Jonathan Olefson
Mr. Olefson is our Senior Vice President, General Counsel and Secretary, a position he has held since October 2013. Prior to joining us, Mr. Olefson spent nine years in senior legal and compliance roles at Cognizant Technology Solutions, most recently as Vice President and General Counsel (Corporate, M&A and Intellectual Property) from 2012 to 2013. Prior to this, he was an Associate at Fulbright & Jaworski, L.L.P from 2000 to 2004. Mr. Olefson holds a J.D. from the George Washington University and a B.A. in Political Science from Emory University.
Damien Creavin
Mr. Creavin is our Senior Vice President and Chief Information Officer, a position he has held since July 2015. Prior to joining us, Mr. Creavin was Chief Information Officer/Chief Technology Officer at Emdeon Inc. from June 2004 to July 2014. Prior to this, Mr. Creavin was Senior Vice President and Chief Information Officer at Primedia Inc. from October 2000 to October 2003. Mr. Creavin holds B.S. degrees in Mathematics and Engineering Science from Trinity College, Dublin and an M.B.A. from the Stern School of Business at New York University.
David Swift
Mr. Swift has served as Chairman of our Board since joining the Board in November 2014. Mr. Swift has served as an Executive Business Partner at Advent since August 2014. Mr. Swift was President and Chief Executive Officer of Goodman Manufacturing from April 2008 to April 2014. Prior to this, Mr. Swift served in a variety of senior leadership roles at Whirlpool Corporation, most recently as President (North America) of Whirlpool Corporation from December 2005 to July 2007. Before joining Whirlpool in October 2001, Mr. Swift served as the President of Eastman Kodak Company’s Professional Group, prior to which he served as the Chairman and President of Kodak’s Greater Asian Region based in Shanghai, China for more than four years. Mr. Swift is a member of the board of directors of Dawn Holdings, Inc. and ATI Holdings, Inc., and is a member of the Board of Overseers of the Thayer School of Engineering at Dartmouth College. He previously served as a member of the Boards of Directors of Daikin Industries, Limited, Goodman Manufacturing and Whirlpool Corporation. He holds a B.A. in Physics and Mathematics from Amherst College, a Master’s degree in Engineering from Dartmouth College and an M.B.A. from Harvard Business School. We believe that Mr. Swift’s investment and management expertise and his experience serving on public and private boards qualify him to serve as one of our directors.
Elizabeth (Libby) Connolly Alexander
Ms. Alexander has served as a director since July 2012. Ms. Alexander has held a variety of senior leadership positions since joining us in 1984 and is responsible for establishing Connolly’s healthcare practice in 1998. Prior to the Connolly iHealth Merger, Ms. Alexander most recently served as Chief Executive Officer of Connolly from January 2013 until May 2014. Ms. Alexander serves on the board of directors of CT Fund for the Environment, Save the Sound and the Eaglebrook School. She holds a B.A. from Tulane University. We believe that Ms. Alexander’s three decades of institutional knowledge of our Company and extensive knowledge of the recovery audit process qualify her to serve as one of our directors.
Mala Anand
Ms. Anand has served as a director since December 2016. Ms. Anand has served as President of Analytics at SAP SE since October 2016. Prior to joining SAP SE, Ms. Anand led the Data & Analytics | Automation Software Platforms for Cisco Systems, Inc. from October 2007 to October 2016. Before this Ms. Anand served as Chief Operating Officer and Senior Vice President for Software Products and Services at Informative. Ms. Anand was also an entrepreneur in residence for Kleiner, Perkins, Caufield and Byers from 2001 to 2003, and has developed software products for CoroSoft Technologies, Inc., Rapt, Inc. (Microsoft Corporation), and Beyond, Inc. Ms. Anand also led enterprise software and go-to-market teams at Oracle Corporation from 1994 to 1998 and Digital Equipment Corporation from 1990 to 1994. Ms. Anand holds a B.S. in Computer Science from the University of Massachusetts and a M.S. in Computer Science from Brown University. We believe that Ms. Anand’s deep experience in software development, analytics and developing technology solutions, along with her leadership experience and entrepreneurial background qualify her to serve as one of our directors.
120
J. Lawrence (Larry) Connolly
Mr. Connolly has served as a director since July 2012. Mr. Connolly has held a variety of senior leadership positions with us since 1982, most recently as Chief Executive Officer of Connolly from 1991 until his retirement in January 2013. Mr. Connolly currently serves as President of the Connolly Family Foundation and is Chairman of the Georgia Prevention Project. He is also a trustee of Washington and Lee University, where he received a B.A. in History. Mr. Connolly also holds an M.B.A. from the A.B. Freeman School of Business at Tulane University. We believe that Mr. Connolly’s three decades of institutional knowledge of our Company and his broad management experience qualify him to serve as one of our directors.
Kenneth Goulet
Mr. Goulet has served as a director since December 2015. He most recently served as the Executive Vice President of Anthem Inc. and President of Anthem Inc.’s Commercial and Specialty Business Division from August 2012 to September 2015, prior to which he served as President of Anthem Inc.’s Commercial Business Unit from October 2007 to August 2012. Before joining Anthem Inc., Mr. Goulet spent 23 years at CIGNA Corporation where he held a number of management, sales and operations positions. Mr. Goulet currently serves on the board of directors of Surgical Care Affiliates, Inc., and has previously served on the board of directors of Bloom Health Corporation from October 2011 to September 2015. Mr. Goulet holds a B.S. in Economics from Trinity College. We believe Mr. Goulet’s broad management expertise and in-depth knowledge of the healthcare sector qualifies him to serve as one of our directors.
Ruben Jose King-Shaw, Jr.
Mr. King-Shaw has served as a director since August 2016. Mr. King-Shaw has served as Managing Partner and Chief Investment Officer at Mansa Capital since 2011 and as Chief Executive Officer of Mansa Equity Partners, Inc. since 2003. Prior to this, Mr. King-Shaw served as Senior Vice President and Chief Operating Officer of Neighborhood Health Partnership, Inc. from 1993 through 1998. Mr. King-Shaw currently serves on the board of directors of ODH, Inc., NetHealth, Inc. and Steward Healthcare System, Inc. He previously served on the boards of directors of Lucid, Inc., Athena Health, Inc., Wellcare Health Plans, Inc. and iHealth Technologies. He holds a B.S. in Industrial and Labor Relations with a specialty in Labor Economics from Cornell University, a Master’s degree in Health Services Administration from Florida International University, and a Master’s of International Business from the Chapman Graduate School of Business at Florida International University. We believe that Mr. King-Shaw’s expertise in healthcare policy, regulatory compliance and finance, and his extensive experience serving on public and private boards, qualify him to serve as one of our directors.
John Maldonado
Mr. Maldonado has served as a director since July 2012. Mr. Maldonado is a Managing Director of Advent focusing on investments in the healthcare, financial and business services sectors. Prior to joining Advent in 2006, his previous private equity experience included positions at both Bain Capital and Parthenon Capital. Mr. Maldonado currently serves on the board of directors of Genoa, a QoL Healthcare Company, inVentiv Group Holdings, Inc. and ATI Holdings, Inc. and has previously served on the boards of directors of Vantiv, Inc., SkillSoft Corp., American Radiology Services, and Managed Healthcare Associates. He holds a B.A. in Mathematics from Dartmouth College and an M.B.A. from Harvard Business School. We believe that Mr. Maldonado’s experience at Advent and as a director of public and private companies provides insight that is beneficial to the Board.
James (Jamie) Parisi
Mr. Parisi has served as a director since May 2015. He most recently served as the Chief Financial Officer of CME Group Inc. from November 2004 to August 2014, prior to which he held positions of increasing responsibility and leadership within CME Group Inc. from 1988, including as Managing Director & Treasurer and Director, Planning & Finance. Mr. Parisi holds a B.S. in Finance from the University of Illinois and an M.B.A. from the University of Chicago. Mr. Parisi also currently serves on the board of directors and regulatory oversight committee of CBOE Futures Exchange LLC and on the board of directors and as audit committee chairman for Pursuant Health Inc. We believe that Mr. Parisi’s financial management experience within the public company framework qualifies him to serve as one of our directors.
121
Christopher Pike
Mr. Pike has served as a director since July 2012. He is currently a Managing Partner at Advent, having joined the firm in February 1997. Prior to joining Advent, Mr. Pike was a Senior Associate at PricewaterhouseCoopers LLP from 1992 to 1996. Mr. Pike also serves on the board of directors of Genoa, a QoL Healthcare Company, and ATI Holdings, Inc. He has previously served on the boards of directors of GFI Group Inc., Long Term Care Group, Vantiv, Inc., Managed Healthcare Associates and several other public and private companies. Mr. Pike received a B.A. in Economics and Spanish from Amherst College. We believe that Mr. Pike’s experience at Advent and as a director of numerous private and public companies provides insight that is beneficial to the Board.
Douglas Present
Mr. Present has served as a director since October 2012. He most recently served as Chief Executive Officer of Managed Health Care Associates, Inc. from November 2001 to May 2013. Prior to this he was a Senior Vice President at Medsite, Inc., which was subsequently acquired by WebMD, Inc. Mr. Present is Chairman of the board of directors of Genoa, a QoL Health Care Company. He also serves as Chairman of the board of directors of Golden State Medical Supply. Mr. Present has a faculty appointment at the Wharton Business School, where he teaches a class on healthcare services. He also serves on the Advisory Board of the Whitman School of Business at Syracuse University. Mr. Present holds a B.S. in Marketing from Syracuse University and an M.B.A. in Finance from The Wharton School at the University of Pennsylvania. We believe that Mr. Present’s management expertise and broad experience in the healthcare industry qualify him to serve as one of our directors.
Board of Directors
Our business and affairs are managed under the direction of our Board. Our Board is currently composed of eleven directors.
Our amended and restated certificate of incorporation provides that our Board is divided into three classes, as nearly equal in number as possible, with one class being elected at each annual meeting of stockholders. Each director will serve a three-year term, with termination staggered according to class. The Class I directors, whose terms will expire at the 2017 annual meeting of our stockholders, are Ms. Anand and Messrs. Connolly, Present and King-Shaw. The Class II directors, whose terms will expire at the 2018 annual meeting of our stockholders, are Ms. Alexander and Messrs. Parisi, Pike and Swift. The Class III directors, whose terms will expire at the 2019 annual meeting of our stockholders, are Messrs. Goulet, Maldonado and Williams.
Director Independence and Controlled Company Exemption
Advent beneficially owns common stock representing more than 50% of the voting power of our common stock eligible to vote in the election of directors. As a result, we qualify as a “controlled company” and may avail ourselves of the “controlled company” exemption under the corporate governance rules of the NYSE. As a controlled company, we are not required to have a majority of “independent directors” on our Board as defined under the rules of the NYSE, or have a compensation committee and a nominating and corporate governance committee composed entirely of independent directors. Accordingly, we do not have a compensation committee and a nominating and corporate governance committee composed entirely of independent directors.
Even though we qualify as a controlled company, we have a majority of independent directors serving on our Board. Our Board has affirmatively determined that Ms. Anand and Messrs. Goulet, Parisi, Pike, Present, Swift and King-Shaw are independent directors under the applicable rules of the NYSE.
We are not required to maintain compliance with the NYSE’s director independence requirements and may choose to change our Board or committee composition or other arrangements in the future to manage our corporate governance in accordance with the controlled company exemption. If we cease to be a controlled company, we will be required to comply with the NYSE’s corporate governance requirements applicable to listed companies, subject to a permitted “phase-in” period.
The “controlled company” exemption does not modify the independence requirements for the audit committee. The NYSE and the SEC rules require that our audit committee be composed of at least three members, subject to certain permitted phase-in rules for newly public companies. We are currently in compliance with these “phase-in” provisions, with three of four members of our audit committee satisfying applicable independence requirements.
122
Board Committees
Our Board has established an audit committee, a compensation committee and a nominating and corporate governance committee. Each committee operates under a charter approved by our Board. Each committee has the composition and primary responsibilities described below. Members serve on these committees until their resignations or until otherwise determined by our Board. The charter of each committee is available on our website.
Audit Committee. The primary purposes of our audit committee are to assist the Board's oversight of:
|
· |
audits of our financial statements; |
|
· |
the integrity of our financial statements; |
|
· |
our process relating to risk management and the conduct and systems of internal control over financial reporting and disclosure controls and procedures; |
|
· |
the qualifications, engagement, compensation, independence and performance of our independent auditor; and |
|
· |
the performance of our internal audit function. |
Our audit committee is currently composed of Ms. Anand and Messrs. Parisi, Pike and King-Shaw. Mr. Parisi serves as chair of the audit committee. Messrs. Parisi, Pike and King-Shaw each qualifies as an “audit committee financial expert” as such term has been defined by the SEC in Item 407(d)(5) of Regulation S-K. Our Board has affirmatively determined that Ms. Anand and Messrs. Parisi and King-Shaw meet the definition of an “independent director” for the purposes of serving on the audit committee under applicable NYSE rules and Rule 10A-3 under the Exchange Act. In accordance with the NYSE and the SEC rules, we intend for all members of the audit committee to meet the required independence standards within one year of our IPO. The audit committee is governed by a charter that complies with the rules of the NYSE.
Compensation Committee. The primary purposes of our compensation committee are to assist the Board in overseeing our management compensation policies and practices, including:
|
· |
determining and approving the compensation of our executive officers; and |
|
· |
reviewing and approving incentive compensation and equity compensation policies and programs. |
Our compensation committee is currently composed of Messrs. Goulet, Maldonado, Swift and Present. Mr. Goulet serves as chair of the compensation committee. The compensation committee is governed by a charter that complies with the rules of the NYSE. Messrs. Goulet and Present, each of whom qualifies as a "non-employee director" under Rule 16b-3 of the Exchange Act, comprise a subcommittee of our compensation committee for the purpose of reviewing and approving equity awards to our directors and executive officers made pursuant to the 2012 Plan and the 2016 Plan.
Nominating and Corporate Governance Committee. The primary purposes of our nominating and corporate governance committee are to:
|
· |
make recommendations to the Board regarding nomination of individuals as members of the Board and its committees; |
|
· |
assist the Board with identifying individuals qualified to become Board members; and |
|
· |
determine corporate governance practices and related matters. |
Our nominating and corporate governance committee is currently comprised of Messrs. Goulet, Maldonado and Swift. Mr. Goulet serves as chair of the nominating and corporate governance committee. The nominating and corporate governance committee is governed by a charter that complies with the rules of the NYSE.
Compensation Committee Interlocks and Insider Participation
The members of our compensation committee during 2016 were Messrs. Connolly, Goulet, Maldonado, Swift and Present. Mr. Connolly, who is no longer a member of our compensation committee, served as our Chief Executive Officer through December 31, 2012, and Mr. Maldonado served as our Vice President and Assistant Secretary through December 12, 2013. No other member of the compensation committee was a former or current officer or employee of Cotiviti or any of its subsidiaries in 2016. In addition, during 2016, none of our executive officers served (i) as a member
123
of the compensation committee or board of directors of another entity, one of whose executive officers served on our compensation committee or (ii) as a member of the compensation committee of another entity, one of whose executive officers served on our Board.
Code of Business Conduct and Ethics
We have a Code of Business Conduct and Ethics that applies to our Board, officers, employees, agents, consultants and representatives. A copy of the code is available on our website, located at www.cotiviti.com. Any amendments to or waivers from our code for our principal executive officer, principal financial officer, principal accounting officer or controller, or persons performing similar functions, will be disclosed on our Internet website promptly following the date of such amendment or waiver. Our Internet website and the information contained therein or connected thereto shall not be deemed to be incorporated into this Annual Report on Form 10-K.
Corporate Governance Guidelines
Our Board has adopted Corporate Governance Guidelines in accordance with the corporate governance rules of the NYSE that serve as a flexible framework within which our Board and its committees operate. These guidelines cover a number of areas including: the duties and responsibilities of the Board; director independence; Board leadership structure; executive sessions; CEO evaluations; management development and succession planning; director nomination, qualification and election; director orientation and continuing education; Board agenda, materials, information and presentations; director access to company employees and independent advisers; Board communication with stockholders and others; director compensation; and annual board and committee performance evaluations. A copy of our Corporate Governance Guidelines is posted on our corporate website, which is located at www.cotiviti.com. Our Internet website and the information contained therein or connected thereto shall not be deemed to be incorporated into this Annual Report on Form 10-K.
Section 16(a) Beneficial Ownership Reporting Compliance
Section 16(a) of the Exchange Act requires our directors, executive officers and stockholders who beneficially own more than 10% of any class of our equity securities registered pursuant to Section 12 of the Exchange Act, including our common stock, to file with the SEC initial reports of beneficial ownership and reports of changes in beneficial ownership of our common stock and other equity securities, and to provide us with a copy of those reports.
Based solely upon our review of the copies of such reports furnished to us and written representations received by us that no other reports were required, we are not aware of any instances of noncompliance with the Section 16(a) filing requirements by any director, executive officer or beneficial owner of more than 10% of any class of our equity securities during the year ended December 31, 2016.
Item 11. Executive Compensation
The following discussion and analysis of compensation arrangements should be read with the compensation tables and related disclosures set forth below. This discussion contains forward-looking statements that are based on our current plans and expectations regarding future compensation programs. See “Cautionary note regarding forward-looking statements.” Actual compensation programs that we adopt may differ materially from the programs summarized in this discussion.
Overview
The discussion below includes a review of our compensation decisions with respect to 2016 and 2015 for our “named executive officers,” or NEOs, namely our principal executive officer and our two other most highly compensated executive officers. Our NEOs for 2016 were:
|
· |
J. Douglas (Doug) Williams, our Chief Executive Officer; |
|
· |
Steve Senneff, our Senior Vice President and Chief Financial Officer; and |
|
· |
David Beaulieu, our Senior Vice President and Chief Operations Officer. |
In 2016 and 2015, we compensated our NEOs through a combination of base salary and annual cash bonuses as
124
well as grants of stock options under the terms of our Equity Plans. Our executive officers are also eligible to receive certain benefits, which include a 401(k) plan with matching contributions, life insurance and group health insurance, including medical, dental and vision insurance.
Summary Compensation Table
The following table sets forth certain information for 2016 and 2015 concerning the compensation awarded to, earned by or paid to our NEOs.
|
|
|
|
|
|
|
|
|
|
|
|
|
|
|
|
|
|
|
|
|
|
|
|
|
Name and principal |
|
|
|
|
|
|
|
|
|
Option |
|
|
Restricted Stock |
|
Non-Qualified Deferred Compensation |
|
All other |
|
|
|
||
|
position |
|
Year |
|
Salary(1) |
|
Bonus(2) |
|
Awards(3) |
|
|
Units (4) |
|
Earnings |
|
Compensation(5) |
|
Total |
|||||
|
J. Douglas (Doug) Williams |
|
2016 |
|
$ |
640,000 |
|
$ |
987,878 |
|
$ |
716,335 |
|
$ |
243,390 |
|
— |
|
$ |
22,691 |
|
$ |
2,610,294 |
|
Chief Executive Officer |
|
2015 |
|
$ |
630,587 |
|
$ |
861,000 |
|
$ |
5,642,504 |
|
$ |
— |
|
— |
|
$ |
22,360 |
|
$ |
7,156,451 |
|
Steve Senneff |
|
2016 |
|
$ |
400,000 |
|
$ |
432,197 |
|
$ |
213,195 |
|
$ |
72,447 |
|
— |
|
$ |
7,950 |
|
$ |
1,125,789 |
|
Senior Vice President and Chief Financial Officer |
|
2015 |
|
$ |
400,000 |
|
$ |
397,000 |
|
$ |
— |
|
$ |
— |
|
— |
|
$ |
7,950 |
|
$ |
804,950 |
|
David Beaulieu |
|
2016 |
|
$ |
400,000 |
|
$ |
432,197 |
|
$ |
106,602 |
|
$ |
36,290 |
|
— |
|
$ |
17,940 |
|
$ |
993,029 |
|
Senior Vice President and Chief Operations Officer |
|
2015 |
|
$ |
393,621 |
|
$ |
397,000 |
|
$ |
— |
|
$ |
— |
|
— |
|
$ |
17,716 |
|
$ |
808,337 |
|
(1) |
Represents annual salary paid pursuant to the terms of each of NEO’s employment agreement. See “—Employment Agreements.” |
|
(2) |
Represents annual performance-based cash bonuses. NEOs are eligible to receive an annual performance-based cash bonus under their employment agreements. Mr. Williams has a target cash bonus of 100% of his annual base salary, and Messrs. Senneff and Beaulieau have a target cash bonus of 70% of their annual base salary. |
|
(3) |
Represents the aggregate grant date fair value of the option awards, computed in accordance with FASB ASC Topic 718, Compensation—Stock Compensation. These values have been determined based on the assumptions set forth in Note 15 to our consolidated financial statements included elsewhere in this Annual Report on Form 10-K. |
|
(4) |
Represents the aggregate grant date fair value of the restricted stock unit awards, which is equal to the closing price of our common stock on the date of grant. |
(5)Represents contributions to employee 401(k) plan and amounts paid pursuant to a profit-sharing employee incentive plan established by iHealth Technologies.
125
Outstanding Equity Awards as of December 31, 2016
The following table sets forth certain information about outstanding equity awards held by our NEOs as of December 31, 2016.
|
|
|
Option Awards |
|
Stock Awards |
||||||||
|
|
|
Number of securities underlying unexercised options exercisable |
|
Number of securities underlying unexercised options unexercisable(1) |
|
Option exercise price(2) |
|
Option expiration date(3) |
|
Number of Shares or Units of Stock that Have Not Vested(4) |
|
Market Value of Shares or Units of Stock that Have Not Vested(5) |
|
Name |
|
(#) |
|
(#) |
|
($) |
|
|
|
(#) |
|
($) |
|
J. Douglas (Doug) Williams |
|
723,094 |
|
— |
|
13.79 |
|
7/01/2025 |
|
— |
|
— |
|
Chief Executive Officer |
|
— |
|
76,860 |
|
19.00 |
|
5/25/2026 |
|
— |
|
— |
|
|
|
— |
|
— |
|
— |
|
— |
|
12,810 |
|
440,664 |
|
|
|
|
|
|
|
|
|
|
|
|
|
|
|
Steve Senneff |
|
263,520 |
|
29,280 |
|
6.26 |
|
10/15/2022 |
|
— |
|
— |
|
Senior Vice President and |
|
— |
|
22,875 |
|
19.00 |
|
5/25/2026 |
|
— |
|
— |
|
Chief Financial Officer |
|
— |
|
— |
|
— |
|
— |
|
3,813 |
|
131,167 |
|
|
|
|
|
|
|
|
|
|
|
|
|
|
|
David Beaulieu |
|
204,960 |
|
87,840 |
|
11.33 |
|
9/26/2024 |
|
— |
|
— |
|
Senior Vice President and |
|
— |
|
11,438 |
|
19.00 |
|
5/25/2026 |
|
— |
|
— |
|
Chief Operations Officer |
|
— |
|
— |
|
— |
|
— |
|
1,910 |
|
65,704 |
(1)The 76,800 share option held by Mr. Williams fully vests with continued service as to 25% of the shares over a 4-year period on each anniversary date of May 25, 2016, the date of the grant. The 29,280 share option held by Mr. Senneff fully vests with continued service on the fifth anniversary of October 15, 2012, the start date and the 22,875 share option held by Mr. Senneff fully vests with continued service as to 25% of the shares over a 4-year period on each anniversary date of May 25, 2016, the date of the grant. The 87,840 share option held by Mr. Beaulieu vests with continued service as to 29,280 of the shares on each of the third, fourth and fifth anniversaries of September 26, 2014, the date of the grant, and the 11,438 share option held by Mr. Beaulieu vests with continued service as to 25% of the shares over a 4-year period on each anniversary date of May 25, 2016, the date of the grant.
(2)Option exercise prices are the fair market value of our stock on the date of grant. Option exercise price reflected has been adjusted for stock split and Special Cash Dividend.
(3)All options have a ten-year term.
(4)Amounts in this column represent restricted stock units. Each restricted stock unit represents the right to receive, at settlement, one share of common stock. Each of Mr. Williams’, Mr. Senneff’s and Mr. Beaulieu’s restricted units vests with continued service as to 25% of the amount over a 4-year period on each anniversary date of May 25, 2016, the date of the grant.
(5)Value calculated based on the $34.40 closing price of our stock on December 30, 2016 (the last trading day during the year ended December 31, 2016).
Employment Agreements
We are currently party to employment agreements with each of our NEOs. The material provisions of each such agreement are described below.
In May 2015, we entered into employment agreements with each of J. Douglas (Doug) Williams, our Chief Executive Officer, Steve Senneff, our Senior Vice President and Chief Financial Officer and David Beaulieu, our Senior Vice President and Chief Operations Officer. The agreements provide for an indefinite term beginning on January 1, 2015. The agreements provide that each NEO will receive an annualized base salary subject to review by our Board (currently $640,000 for Mr. Williams and $400,000 for each of Messrs. Senneff and Beaulieu). The agreements also provide that each of them is eligible to receive an annual performance-based cash bonus with a target amount of 100% of annual base salary for Mr. Williams and 70% of annual base salary for each of Messrs. Senneff and Beaulieu.
Either we or the NEO may terminate the agreement at any time upon written notice. We may terminate the NEO’s employment for death, “disability,” “cause” or without “cause” by written notice to the applicable NEO. The NEO may
126
resign with 30 days prior written notice for “good reason” and without “good reason.”
If we terminate the NEO’s employment without “cause” or the NEO resigns for “good reason,” then, in addition to any accrued but unpaid base salary, accrued but unpaid expenses, accrued but unused vacation pay and any amount arising from the NEO’s participation in employee benefit plans and programs, we must provide the NEO with, subject to his execution of a release of claims, such release becoming effective and his continued compliance with the restrictive covenants contained in his agreement, (i) an amount equal to 24 months of his annual base salary for Mr. Williams and 12 months of his base salary for each of Messrs. Senneff and Beaulieu, payable in a lump sum, (ii) a pro-rata bonus for the year of termination (determined by multiplying the amount of such bonus that would have been payable to the NEO for the year of termination by a fraction, the numerator of which is the number of full weeks that elapsed during the year through the date of termination and the denominator of which is 52) and (iii) if the NEO elects to continue medical and dental coverage under the Consolidated Omnibus Budget Reconciliation Act of 1985, as amended, a lump sum payment equal to the employer portion of the premium cost of continuation coverage for the NEO and his eligible dependents for 12 months. In addition, if the NEO’s employment is terminated by us without “cause” or the NEO resigns for “good reason” within one year following a “change of control” (as defined in his employment agreement), then, in addition to the payments and benefits described above, he will be entitled to accelerated vesting of his unvested time-based equity awards outstanding immediately prior to the “change of control.”
For purposes of the agreements, “good reason” means the occurrence of one or more of the following conditions, without the NEO’s consent: (i) any material adverse change by us in his annual base salary, position, authority, title or reporting obligations, or the assignment of duties to him by us or any of our affiliates that are materially inconsistent with his position; (ii) relocation of his principal place of employment by more than 50 miles; or (iii) any other material breach by us of a material provision of his agreement or any other written agreement with him; provided that any such condition will only constitute good reason if the NEO provides us with 30 days prior written notice of his intent to resign for good reason (which notice must be provided within 60 days following the occurrence of the event(s) purported to constitute good reason) and we have not remedied the alleged violations within such 30 day period and the NEO’s resignation becomes effective within 30 days after we have either failed to cure such condition or indicated that we will not cure such condition.
For purposes of the agreements, “cause” means (i) the willful misconduct or an act of dishonesty of the NEO with regard to us or any affiliate, which in either case, results in material harm to us or any affiliate, (ii) the willful and continued failure of the NEO to perform his duties with us or any of our affiliates (other than any such failure resulting from “disability,” as defined in the agreements) which is not remedied within 30 days of receiving written notice thereof, (iii) indictment for any felony or indictment for any misdemeanor involving moral turpitude, or (iv) a material breach by the NEO of any material provision of the agreement or any other written agreement with us or material policy of ours, which breach is not remedied within ten days after receiving written notice.
The agreements include perpetual confidentiality provisions, a non-disparagement provision as well as provisions relating to assignment of inventions and non-competition and non-solicitation that apply during employment and two years thereafter.
Potential Payments upon Termination of Employment or Change of Control
Our NEOs are entitled to receive severance payments and acceleration of time-based vesting equity awards upon termination of employment or a change of control, as provided in “—Employment Agreements.” In addition, pursuant to our 2016 Plan, upon the occurrence of a “change of control” (as defined in the 2016 Plan), unless otherwise provided in the applicable award agreement, the Plan Administrator is authorized to make adjustments in the terms and conditions of outstanding awards, including without limitation the following (or any combination thereof): (i) continuation or assumption of such outstanding awards by us (if it is the surviving company or corporation) or by the surviving company or corporation or its parent; (ii) substitution by the surviving company or corporation or its parent of awards with substantially the same terms as such outstanding awards (with appropriate adjustments to the type of consideration payable upon settlement of the awards); (iii) acceleration of exercisability, vesting and/or payment; and (iv) if all or substantially all of our outstanding shares of common stock are transferred in exchange for cash consideration in connection with such change of control: (A) upon written notice, provide that any outstanding stock options and stock appreciation rights are exercisable during a reasonable period of time immediately prior to the scheduled consummation of the event or such other reasonable period as determined by the Plan Administrator (contingent upon the consummation of the event), and at the end of such period, such stock options and stock appreciation rights will terminate to the extent not so exercised within the relevant period; and (B) cancel all or any portion of outstanding
127
awards for fair value, as determined in the sole discretion of the Plan Administrator.
Director Compensation
Directors who are employed by us or who are full-time investment professionals of Advent are not eligible to receive compensation for their service on our Board. All other members of our Board receive a one-time stock option or restricted stock unit grant upon their election to the Board. All of our directors are also reimbursed for reasonable out-of-pocket travel expenses incurred in connection with attendance at Board and committee meetings and other Board-related activities.
Following our IPO, we pay our directors who are not our employees or full-time investment professionals of Advent an annual retention fee of $65,000 (prior to the IPO, the annual retainer was $75,000). Each member of our audit committee, compensation committee and nominating and corporate governance committee (to the extent such individual is not one of our employees or a full-time investment professional of Advent) receives an annual fee of $5,000, $5,000 and $5,000, respectively. The chair of each of our audit committee, compensation committee and nominating and corporate governance committee (to the extent such individual is not one of our employees or a full-time investment professional of Advent) receives an annual fee of $22,500, $15,000 and $15,000, respectively.
The compensation for our directors who are not employees or full-time investment professionals of Advent for fiscal 2016 was as follows:
|
|
Fees Earned or Paid in Cash |
Stock Awards |
Total |
|
Name |
($)(1) |
($)(2,3) |
($)(4) |
|
Mala Anand(5) |
— |
— |
— |
|
Elizabeth (Libby) Connolly Alexander |
71,250 | 160,015 | 231,265 |
|
J. Lawrence (Larry) Connolly |
70,000 | 160,015 | 230,015 |
|
Kenneth Goulet |
85,000 | 160,015 | 245,015 |
|
Ruben Jose King-Shaw, Jr.(6) |
26,250 | 120,003 | 146,253 |
|
James (Jamie) Parisi |
81,250 | 160,015 | 241,265 |
|
Douglas Present |
72,500 | 160,015 | 232,515 |
(1) As described under “Item 11, Executive Compensation—Director Compensation,” prior to our IPO, our directors received an annual fee of $75,000. Following our IPO, our directors receive an annual fee of $65,000 with additional fees for service as the chair or a member of the Audit, Compensation and Nominating and Corporate Governance Committees. Accordingly, each of Ms. Alexander and Messrs. Connolly, Goulet, Parisi and Present received a pro-rated payment in 2016 of $37,500 related to their service on the Board prior to our IPO and a pro-rated payment of $32,500 for their service following our IPO. In addition, Ms. Alexander received a pro-rated payment of $1,250 for her service on the Audit Committee during 2016; Mr. Goulet received pro-rated payments of $7,500 each for his service as chair of the Compensation Committee and chair of the Nominating and Corporate Governance Committee; Mr. Parisi received a pro-rated payment of $11,250 for his service as chair of the Audit Committee; and Mr. Present received a pro-rated payment of $2,500 for his service as a member of the Compensation Committee.
(2)On September 1, 2016, our directors then serving who were not employees or full-time investment professionals of Advent received a grant of 4,919 restricted stock units, except that Mr. King-Shaw, who joined the Board in October 2016, received a pro-rated grant. Each restricted stock unit represents the right to receive, at settlement, one share of common stock. The restricted stock units vest on the date of our first annual meeting following the date of grant, September 1, 2016, subject to the director’s continued service through the vesting date.
(3)Represents the aggregate grant date fair value for restricted stock units granted in 2016, determined in accordance with FASB ASC Topic 718, Compensation—Stock Compensation. The grant date fair value of each restricted stock unit was approximately $32.53. See Note 15 to our consolidated financial statements included elsewhere in this Annual Report on Form 10-K.
(4)Non-employee directors are reimbursed for expenses (including costs of travel, food and lodging) incurred in attending Board, Committee and stockholder meetings. No reimbursements for any non-employee director exceeded the $10,000 threshold in the year ended December 31, 2016.
(5)Ms. Anand joined the Board on December 12, 2016. She did not receive any 2016 compensation in connection with her Board service.
(6)Mr. King-Shaw joined the Board in October 2016. He received a pro-rated payment of $24,375 in connection with his service as a director and an additional pro-rated payment of $1,875 for his service as a member of the Audit Committee.
128
Equity Incentive Plans
We maintain two equity incentive plans for the benefit of our employees, directors and other service providers: the 2012 Plan and the 2016 Plan. The following is a summary of certain features of the 2012 Plan and the 2016 Plan. Provisions of the 2016 Plan applicable to participants who are residents of Canada, India and the United Kingdom may vary from the terms described in this summary.
2012 Plan
The 2012 Plan provided awards to our employees, directors and consultants prior to our IPO. We no longer grant awards under the 2012 Plan. As of December 31, 2016, approximately 5,723,613 shares of common stock are subject to awards that have been granted under the 2012 Plan. The 2012 Plan is administered by the compensation committee of our Board.
2016 Plan
The 2016 Plan was adopted in connection with our IPO and provides for awards of stock options, stock appreciation rights, restricted stock awards, restricted stock units, stock awards and cash performance awards. Awards under the 2016 Plan may be granted to any employee, non-employee director, consultant or other personal service provider to us or any of our subsidiaries. The 2016 Plan is administered by a plan administrator, which is the compensation committee, such other committee of the Board appointed by the Board or the Board, as determined by the Board.
Employee Stock Purchase Plan
We maintain an Employee Stock Purchase Plan, or “ESPP,” for U.S. (the “US ESPP”) and non-U.S. (the “Non-US ESPP”) employees. The purpose of the US ESPP and the Non-US ESPP is to provide employees with an opportunity to acquire a proprietary interest in the Company through the purchase of shares of our common stock. In general, all employees of the Company and its subsidiaries are eligible to participate in the ESPP applicable to their jurisdiction, subject to certain exceptions for employees who have been employed for less than 90 days, whose customary employment is for less than 20 hours per week or whose customary employment is for not more than five months in a calendar year.
Item 12. Security Ownership of Certain Beneficial Owners and Management and Related Stockholder Matters
Principal Stockholders
The following table shows information as of December 31, 2016, regarding the beneficial ownership of our common stock by:
|
· |
each person or group who is known by us to own beneficially more than 5% of our common stock; |
|
· |
each member of our Board and each of our named executive officers; and |
|
· |
all members of our Board and our executive officers as a group. |
Beneficial ownership of shares is determined under rules of the SEC and generally includes any shares over which a person exercises sole or shared voting or investment power. Except as noted by footnote, and subject to community property laws where applicable, we believe based on the information provided to us that the persons and entities named in the table below have sole voting and investment power with respect to all shares of our common stock shown as beneficially owned by them. Percentage of beneficial ownership is based on 90,741,340 shares of common stock outstanding as of December 31, 2016. Shares of common stock subject to options currently exercisable or exercisable within 60 days of December 31, 2016, are deemed to be outstanding and beneficially owned by the person holding the options for the purposes of computing the percentage of beneficial ownership of that person and any group of which that person is a member, but are not deemed outstanding for the purpose of computing the percentage of beneficial ownership for any other person. Except as otherwise indicated, the persons named in the table below have sole voting and
129
investment power with respect to all shares of capital stock held by them. Unless otherwise indicated, the address for each holder listed below is c/o Cotiviti Holdings, Inc., 115 Perimeter Center Place, Suite 700, Atlanta, GA 30346.
|
|
|
Shares of common stock beneficially owned |
||
|
Name and address of beneficial owner |
|
Number of shares |
|
Percentage of shares |
|
5% stockholders: |
|
|
|
|
|
Funds managed by Advent International Corporation(1) |
|
58,702,930 |
|
64.7% |
|
J. Lawrence Connolly(2) |
|
7,079,406 |
|
7.8% |
|
Elizabeth Connolly Alexander(3) |
|
4,676,989 |
|
5.2% |
|
Named executive officers and directors |
|
|
|
|
|
J. Douglas Williams(4) |
|
3,773,094 |
|
4.2% |
|
Steve Senneff(5) |
|
286,127 |
|
* |
|
David Beaulieu(6) |
|
242,780 |
|
* |
|
David Swift(7) |
|
— |
|
* |
|
Mala Anand(8) |
|
— |
|
* |
|
Kenneth Goulet(9) |
|
14,751 |
|
* |
|
Ruben Jose King-Shaw, Jr.(10) |
|
— |
|
* |
|
John Maldonado(11) |
|
— |
|
* |
|
James Parisi(12) |
|
19,751 |
|
* |
|
Christopher Pike(13) |
|
— |
|
* |
|
Douglas Present(14) |
|
146,932 |
|
* |
|
All Board members and executive officers as a group (15 persons) |
|
16,365,554 |
|
18.0% |
(1)Includes: (a) 25,188,602 shares indirectly owned by Advent International GPE VI Limited Partnership, (b) 17,650,967 shares indirectly owned by Advent International GPE VI-A Limited Partnership, (c) 1,277,731 shares indirectly owned by Advent International GPE VI-B Limited Partnership, (d) 1,300,911 shares directly owned by Advent International GPE VI-C Limited Partnership, (e) 1,240,917 shares directly owned by Advent International GPE VI-D Limited Partnership, (f) 3,138,847 shares directly owned by Advent International GPE VI-E Limited Partnership, (g) 4,743,916 shares indirectly owned by Advent International GPE VI-F Limited Partnership, (h) 2,988,464 shares indirectly owned by Advent International GPE VI-G Limited Partnership, (i) 922,973 shares directly owned by Advent Partners GPE VI 2008 Limited Partnership, (j) 27,999 shares directly owned by Advent Partners GPE VI 2009 Limited Partnership, (k) 66,033 shares directly owned by Advent Partners GPE VI 2010 Limited Partnership, (l) 73,335 shares directly owned by Advent Partners GPE VI-A 2010 Limited Partnership and (m) 82,235 shares directly owned by Advent Partners GPE VI-A Limited Partnership. Advent-Cotiviti Acquisition Limited Partnership directly owns 25,188,602 shares and Advent-Cotiviti Acquisition II Limited Partnership directly owns 26,661,078 shares. The general partner of Advent-Cotiviti Acquisition Limited Partnership and Advent-Cotiviti Acquisition II Limited Partnership is Advent-Cotiviti GP Corporation. Advent International GPE VI Limited Partnership, Advent International GPE VI-A Limited Partnership, Advent International GPE VI-B Limited Partnership, Advent International GPE VI-F Limited Partnership and Advent International GPE VI-G Limited Partnership (together, the “Cayman Advent Funds”) collectively own 100% of Advent-Cotiviti GP Corporation, in pro rata proportion to the number of shares disclosed as beneficially owned by the Cayman Advent Funds above. Advent International GPE VI Limited Partnership owns 100% of the limited partnership interests in Advent-Cotiviti Acquisition Limited Partnership, and the other Cayman Advent Funds collectively own 100% of the limited partnership interests in Advent-Cotiviti Acquisition II Limited Partnership in pro rata proportion to the number of shares disclosed as beneficially owned by such other funds above.
Advent is the manager of Advent International LLC, which is the general partner of: GPE VI GP Limited Partnership; GPE VI GP (Delaware) Limited Partnership; Advent Partners GPE VI 2008 Limited Partnership; Advent Partners GPE VI 2009 Limited Partnership; Advent Partners GPE VI 2010 Limited Partnership; Advent Partners GPE VI-A Limited Partnership and Advent Partners GPE VI-A 2010 Limited Partnership. GPE VI GP Limited Partnership is the general partner of the Cayman Advent Funds. GPE VI GP (Delaware) Limited Partnership is the general partner of: Advent International GPE VI-C Limited Partnership; Advent International GPE VI-D Limited Partnership and Advent International GPE VI-E Limited Partnership. Advent exercises voting and investment power over the shares held by the Cayman Advent Funds and may be deemed to have beneficial ownership of all of these shares. With respect to the shares held by the Advent Funds, a number of individuals currently composed of David M. McKenna, David M. Mussafer and Steven M. Tadler, none of whom have individual voting or investment power, exercise voting and investment power over the shares beneficially owned by Advent. The address of Advent International Corporation and each of the Cayman Advent Funds and other entities listed above is c/o Advent International Corporation, 75 State Street, Floor 29, Boston, MA 02109.
(2)Includes: (a) 3,468,906 shares held by JL Connolly LLC, (b) 1,805,250 shares held by The Catherine G. Connolly Gift Trust and (c) 1,805,250 shares held by The J. Lawrence Connolly, Jr. Gift Trust. Mr. Connolly exercises sole voting and investment power over the shares beneficially owned by JL Connolly LLC, The Catherine G. Connolly Gift Trust and The J. Lawrence Connolly, Jr. Gift Trust. Mr. Connolly is a member of our Board.
130
(3)Includes: (a) 1,962,116 shares and 195,200 vested options to purchase shares held by Ms. Alexander directly, (b) 1,471,577 shares held in three family irrevocable trusts, the trustees of which are in each case an institution and Ms. Alexander’s spouse; and (c) 1,048,096 shares owned by Milton Harbor View, LLC, of which Ms. Alexander and her spouse are the sole managers and of which Ms. Alexander and her children are members. Ms. Alexander is a member of our Board.
(4)Includes: (a) 3,050,000 shares held directly and (b) 723,094 shares underlying options which are currently exercisable or will become exercisable within 60 days of December 31, 2016.
(5)Includes: (a) 22,607 shares held directly and (b) 263,520 shares underlying options which are currently exercisable or will become exercisable within 60 days of December 31, 2016.
(6)Includes: (a) 37,820 shares held directly and (b) 204,960 shares underlying options which are currently exercisable or will become exercisable within 60 days of December 31, 2016.
(7)Mr. Swift holds no shares directly. Mr. Swift is an Executive Business Partner at Advent, which manages funds that collectively own 58,702,930 shares. See note 1 above.
(8)Ms. Anand holds no shares and no options or other derivative securities currently exercisable or that will become exercisable for shares within 60 days of December 31, 2016.
(9)Includes 14,751 shares underlying options which are currently exercisable or will become exercisable within 60 days of December 31, 2016.
(10)Mr. King-Shaw holds no shares and no options or other derivative securities currently exercisable or that will become exercisable for shares within 60 days of December 31, 2016.
(11)Mr. Maldonado holds no shares directly. Mr. Maldonado is a Managing Director at Advent, which manages funds that collectively own 58,702,930 shares. See note 1 above.
(12)Includes (a) 5,000 shares held directly and (b) 14,751 shares underlying options which are currently exercisable or will become exercisable within 60 days of December 31, 2016.
(13)Mr. Pike holds no shares directly. Mr. Pike is a Managing Partner at Advent, which manages funds that collectively own 58,702,930 shares. See note 1 above.
(14)Includes (a) 37,680 shares held directly and (b) 109,252 shares underlying options which are currently exercisable or will become exercisable within 60 days of December 31, 2016. Pursuant to a 10b5-1 trading plan adopted by Mr. Present on December 12, 2016, a portion of these options have been exercised and all shares received upon exercise sold as follows: (i) 50,000 shares on January 17, 2017, and (ii) 15,000 shares on February 15, 2017.
Securities Authorized for Issuance Under Equity Compensation Plans
See “Item 11. Executive Compensation—Equity Incentive Plans” for a discussion of our equity incentive plans.
Equity Compensation Plans Table
The following table shows information relating to the number of shares authorized for issuance under our equity compensation plans as of December 31, 2016.
|
|
|
Securities to be issued |
|
|
Weighted average |
|
Number of securities |
|
|
|
upon exercise of |
|
|
exercise price of |
|
remaining available |
|
|
|
outstanding options, |
|
|
outstanding options, |
|
for future issuance |
|
December 31, 2016 |
|
warrants and rights |
|
|
warrants and rights |
|
under equity compensation plans |
|
Equity compensation plans |
|
|
|
|
|
|
|
|
Approved by shareholders |
|
6,064,667 |
|
$ |
10 |
|
5,277,451 |
|
Not approved by shareholders(1) |
|
— |
|
$ |
— |
|
1,260,000 |
|
(1) |
Reflects 1,260,000 shares of common stock available for future issuance under the Company’s ESPP, which was approved by the Board. The Company intends to submit the ESPP for stockholder approval at its 2017 annual meeting. |
131
Item 13. Certain Relationships and Related Transactions, and Director Independence
Set forth below is a description of certain relationships and related party transactions between us or our subsidiaries, and our directors, executive officers and holders of more than 5% of our voting securities.
Common Stock Split
On May 13, 2016, we effected a 6.1-for-1 stock split of all outstanding shares of our common stock pursuant to an amendment to our certificate of incorporation. All common stock share, option and per share amounts for all periods presented have been adjusted retroactively to reflect the stock split.
Common Stock Dividends
On May 25, 2016, we paid a Special Cash Dividend of $150.0 million, or $1.94 per share of common stock outstanding prior to our IPO, to holders of record of our common stock on May 24, 2016. In connection with the Special Cash Dividend, we lowered the exercise price of then outstanding stock options by $1.94 per share in order to preserve the intrinsic value of the options giving effect to the Special Cash Dividend.
Amended and Restated Stockholders Agreement
On June 1, 2016, in connection with our IPO, we amended and restated our existing stockholders agreement, dated as of July 26, 2012, and entered into an amended and restated stockholders agreement with affiliates of Advent and our management stockholders.
The amended and restated stockholders agreement contains (i) demand registration rights for Advent, subject to a cap of two requests in any 12 month period; (ii) piggy-back registration rights for any stockholder holding at least $500,000 worth of shares (the “Holders”), subject to a pro rata reduction if the total amount of shares requested to be included exceeds the amount of securities which in the opinion of the underwriters can be sold; and (iii) shelf registration rights for Holders, subject to a required anticipated aggregate offering price, net of selling expenses, of $5.0 million, subject to a cap of two requests for shelf registrations, for all Holders in the aggregate, in any 12 month period. Holders that are capable of selling all of their registrable securities pursuant to Rule 144 under the Securities Act in a single transaction without timing or volume limitations will not have piggyback registration rights. We will be responsible for fees and expenses in connection with the registration rights, other than underwriters’ discounts and brokers' commissions, if any, relating to any such registration and offering.
Indemnification Agreements
We have entered into indemnification agreements with each of our directors. The indemnification agreements provide the directors with contractual rights to indemnification, expense advancement and reimbursement, to the fullest extent permitted under the DGCL, subject to certain exceptions contained in those agreements.
Policies for Approval of Related Person Transactions
Contemporaneously with our IPO, our Board adopted a written policy relating to the approval of related person transactions. A “related person transaction” is a transaction or arrangement or series of transactions or arrangements in which we participate (whether or not we are a party) and a related person has a direct or indirect material interest in such transaction. Our audit committee will review and approve or ratify all relationships and related person transactions between us and (i) our directors, director nominees or executive officers, (ii) any 5% record or beneficial owner of our common stock or (iii) any immediate family member of any person specified in (i), (ii) and (iii) above. The audit committee will review all related person transactions and, where the audit committee determines that such transactions are in our best interests, approve such transactions in advance of such transaction being given effect.
As set forth in the related person transaction policy, in the course of its review and approval or ratification of a related person transaction, the audit committee will, in its judgment, consider in light of the relevant facts and circumstances whether the related person transaction is, or is not inconsistent with, our best interests, including consideration of various factors enumerated in the policy.
Any member of the audit committee who is a related person with respect to a related person transaction under review or is otherwise not disinterested will not be permitted to participate in the discussions or approval or ratification
132
of the related person transaction. However, such member of the audit committee will provide all materially adverse information concerning the transaction to the audit committee. Our policy also includes certain exemptions for related person transactions that need not be reported and provides the audit committee with the discretion to pre-approve certain related person transactions.
See “Item 10, Director Independence and Controlled Company Exemption,” above for a discussion of the matters required by Item 407(a) of Regulation S-K.
Item 14. Principal Accountant Fees and Services
The information required by this Item will be set forth in the Proxy Statement for our 2017 Annual Meeting of Stockholders and is incorporated herein by reference.
133
Item 15. Exhibits and Financial Statement Schedules
Financial Statements and Financial Statement Schedules
See “—Index to Consolidated Financial Statements” in Item 8 of this Annual Report on Form 10-K.
Schedule I – Condensed Financial Information of Cotiviti Holdings, Inc.
Schedule II – Valuation and Qualifying Accounts of Cotiviti Holdings, Inc.
Exhibits
The exhibits listed in the accompanying index to exhibits are filed or incorporated by reference as part of this Annual Report on Form 10-K.
Not applicable.
134
Pursuant to the requirements of the Securities Exchange Act of 1934, the registrant has duly caused this report to be signed on its behalf by the undersigned thereunto duly authorized.
|
|
COTIVITI HOLDINGS, INC. |
|
||
|
|
|
|
||
|
Date: February 23, 2017 |
|
By: |
/s/ J. Douglas Williams |
|
|
|
|
Name: |
J. Douglas Williams |
|
|
|
|
Title: |
Chief Executive Officer |
|
|
|
|
|
(Principal Executive Officer) |
|
|
|
|
|
|
|
POWER OF ATTORNEY
KNOW ALL PERSONS BY THESE PRESENTS, that each person whose signature appears below constitutes and appoints J. Douglas Williams, Steve Senneff and Jonathan Olefson, each or any one of them, his true and lawful attorney-in-fact and agent, with full power of substitution and resubstitution, for him and in his name, place and stead, in any and all capacities, to sign any and all amendments to this Annual Report on Form 10-K, and to file the same, with all exhibits thereto, and other documents in connection therewith, with the United States Securities and Exchange Commission, granting unto said attorneys-in-fact and agents, and each of them, full power and authority to do and perform each and every act and thing requisite and necessary to be done in connection therewith, as fully to all intents and purposes as he might or could do in person, hereby ratifying and confirming all that said attorneys-in-fact and agents, or any of them, or their or his substitutes or substitute, may lawfully do or cause to be done by virtue hereof.
Pursuant to the requirements of the Securities Exchange Act of 1934, as amended, this Annual Report on Form 10-K has been signed below by the following persons on behalf of the Registrant in the capacities and on the dates indicated.
|
Signature |
|
Title |
|
Date |
|
|
|
|
|
|
|
/s/ J. DOUGLAS WILLIAMS |
|
Chief Executive Officer and Director |
|
February 23, 2017 |
|
J. Douglas Williams |
|
(Principal Executive Officer) |
|
|
|
|
|
|
|
|
|
/s/ STEVE SENNEFF |
|
Senior Vice President and Chief Financial Officer |
|
February 23, 2017 |
|
Steve Senneff |
|
(Principal Financial Officer and Principal Accounting Officer) |
|
|
|
|
|
|
|
|
|
/s/ DAVID SWIFT |
|
Chairman and Director |
|
February 23, 2017 |
|
David Swift |
|
|
|
|
|
|
|
|
|
|
|
/s/ ELIZABETH CONNOLLY ALEXANDER |
|
Director |
|
February 23, 2017 |
|
Elizabeth Connolly Alexander |
|
|
|
|
|
|
|
|
|
|
|
/s/ MALA ANAND |
|
Director |
|
February 23, 2017 |
|
Mala Anand |
|
|
|
|
|
|
|
|
|
|
|
/s/ J. LAWRENCE CONNOLLY |
|
Director |
|
February 23, 2017 |
|
J. Lawrence Connolly |
|
|
|
|
|
|
|
|
|
|
|
/s/ KENNETH GOULET |
|
Director |
|
February 23, 2017 |
|
Kenneth Goulet |
|
|
|
|
|
|
|
|
|
|
|
/s/ RUBEN J. KING-SHAW, JR. |
|
Director |
|
February 23, 2017 |
|
Ruben Jose King-Shaw, Jr. |
|
|
|
|
|
|
|
|
|
|
|
/s/ JOHN MALDONADO |
|
Director |
|
February 23, 2017 |
|
John Maldonado |
|
|
|
|
|
|
|
|
|
|
|
/s/ JAMES PARISI |
|
Director |
|
February 23, 2017 |
|
James Parisi |
|
|
|
|
|
|
|
|
|
|
|
/s/ CHRISTOPHER PIKE |
|
Director |
|
February 23, 2017 |
|
Christopher Pike |
|
|
|
|
|
|
|
|
|
|
|
/s/ DOUGLAS PRESENT |
|
Director |
|
February 23, 2017 |
|
Douglas Present |
|
|
|
|
135
Cotiviti Holdings, Inc.
Schedule I - Condensed Financial Information of Registrant
Parent Company Balance Sheets
(In thousands, except share amounts)
|
|
|
|
December 31, |
|||
|
|
|
|
2016 |
|
|
2015 |
|
ASSETS |
|
|
|
|
|
|
|
Non current assets: |
|
|
|
|
|
|
|
Investment in subsidiaries |
|
|
939,336 |
|
|
787,596 |
|
TOTAL ASSETS |
|
$ |
939,336 |
|
$ |
787,596 |
|
|
|
|
|
|
|
|
|
LIABILITIES AND STOCKHOLDERS' EQUITY |
|
|
|
|
|
|
|
Total liabilities |
|
$ |
— |
|
$ |
— |
|
|
|
|
|
|
|
|
|
Stockholders' equity: |
|
|
|
|
|
|
|
Common stock ($0.001 par value; 600,000,000 and 122,000,000 shares authorized, 90,748,740 and 77,237,711 issued, and 90,741,340 and 77,230,311 outstanding at December 31, 2016 and 2015, respectively) |
|
|
91 |
|
|
77 |
|
Additional paid-in capital |
|
|
911,582 |
|
|
807,419 |
|
Retained earnings (deficit) |
|
|
33,917 |
|
|
(14,935) |
|
Accumulated other comprehensive loss |
(6,156) | (4,867) | ||||
|
Treasury stock, at cost (7,400 shares at December 31, 2016 and 2015) |
|
|
(98) |
|
|
(98) |
|
Total stockholders' equity |
|
|
939,336 |
|
|
787,596 |
|
TOTAL LIABILITIES AND STOCKHOLDERS' EQUITY |
|
$ |
939,336 |
|
$ |
787,596 |
136
Cotiviti Holdings, Inc.
Schedule I - Condensed Financial Information
Parent Company Statements of Comprehensive Income (Loss)
(In thousands)
|
|
|
Years ended December 31, |
||||||
|
|
|
2016 |
|
|
2015 |
|
|
2014 |
|
Equity in income (loss) of subsidiaries |
$ |
48,852 |
|
$ |
13,863 |
|
$ |
(25,825) |
|
Net income (loss) |
|
48,852 |
|
|
13,863 |
|
|
(25,825) |
|
Equity in other comprehensive loss of subsidiaries |
|
(1,289) |
|
|
(3,009) |
|
|
(1,916) |
|
Total comprehensive income (loss) |
$ |
47,563 |
|
$ |
10,854 |
|
$ |
(27,741) |
137
Cotiviti Holdings, Inc.
Schedule I—Condensed Financial Information of Registrant
Parent Company Statements of Cash Flows
(In thousands)
|
|
|
|
|
|
|
|
|
|
|
|
|
|
Year Ended December 31, |
|||||||
|
|
|
2016 |
|
2015 |
|
2014 |
|||
|
Cash flows from operating activities: |
|
|
|
|
|
|
|
|
|
|
Net income (loss) |
|
$ |
48,852 |
|
$ |
13,863 |
|
$ |
(25,825) |
|
Adjustments to reconcile net income (loss) to net cash provided by operating activities: |
|
|
|
|
|
|
|
|
|
|
Equity in income (loss) of subsidiaries |
|
|
(48,852) |
|
|
(13,863) |
|
|
25,825 |
|
Net cash provided by operating activities |
|
|
— |
|
|
— |
|
|
— |
|
|
|
|
|
|
|
|
|
|
|
|
Cash flows from investing activities: |
|
|
|
|
|
|
|
|
|
|
Investment in subsidiaries |
|
|
(81,206) |
|
|
(210) |
|
|
(365,201) |
|
Net cash used in investing activities |
|
|
(81,206) |
|
|
(210) |
|
|
(365,201) |
|
|
|
|
|
|
|
|
|
|
|
|
Cash flows from financing activities: |
|
|
|
|
|
|
|
|
|
|
Proceeds from issuance of common stock |
|
|
226,963 |
|
|
— |
|
|
365,187 |
|
Proceeds from exercise of stock options |
|
|
4,243 |
|
|
210 |
|
|
32 |
|
Purchase of treasury shares |
|
|
— |
|
|
— |
|
|
(18) |
|
Dividends paid |
|
|
(150,000) |
|
|
|
|
|
|
|
Net cash provided by financing activities |
|
|
81,206 |
|
|
210 |
|
|
365,201 |
|
|
|
|
|
|
|
|
|
|
|
|
Net increase in cash and cash equivalents |
|
|
— |
|
|
— |
|
|
— |
|
Cash and cash equivalents at beginning of period |
|
|
— |
|
|
— |
|
|
— |
|
Cash and cash equivalents at end of the period |
|
$ |
— |
|
$ |
— |
|
$ |
— |
|
|
|
|
|
|
|
|
|
|
|
|
Supplemental disclosures of cash flow information: |
|
|
|
|
|
|
|
|
|
|
Noncash operating activities (stock-based compensation) |
|
$ |
22,954 |
|
$ |
3,399 |
|
$ |
2,492 |
|
Noncash financing activities (noncash capital contribution) |
|
|
— |
|
|
— |
|
|
69,957 |
|
Noncash financing activities (noncash acquisition of treasury stock ) |
|
|
|
|
|
|
|
|
(98) |
138
Cotiviti Holdings, Inc.
Schedule I—Condensed Financial Information of Registrant
Notes to Parent Company Financial Statements
(In thousands, except share amounts)
Note 1. Basis of Presentation
Cotiviti Holdings, Inc. (collectively with its subsidiaries, "we," "our," or "the Company") is incorporated in the state of Delaware and has adopted a holding company structure. With effect from September 2015, the name of our Company was changed from Connolly Superholdings, Inc. to Cotiviti Holdings, Inc. Our primary domestic operations are performed through Cotiviti, LLC; Cotiviti Services, LLC; and Cotiviti USA, LLC, all are our wholly-owned operating subsidiaries. We have international operations in Canada, the United Kingdom and India.
Pursuant to the terms of the Restated Credit Agreement discussed in Note 9 of the Notes to the Cotiviti Holdings, Inc. Consolidated Financial Statements, Cotiviti Corporation and certain of its subsidiaries have restrictions on their ability to, among other things, incur additional indebtedness, pay dividends or make certain intercompany loans and advances. As a result of these restrictions, these parent company financial statements have been prepared in accordance with Rule 12-04 of Regulation S-X, as restricted net assets of the Company's subsidiaries (as defined in Rule 4-08(e)(3) of Regulation S-X) exceed 25% of the Company's consolidated net assets as of December 31, 2016. The Company is a holding company without any operations of its own. These condensed financial statements have been prepared on a "parent-only" basis. Under a parent-only presentation, the Parent Company's investments in subsidiaries are presented under the equity method of accounting. Certain information and footnote disclosures normally included in financial statements prepared in accordance with U.S. GAAP have been condensed or omitted. Stock-based compensation expense associated with equity incentive awards issued by the Parent Company and the related tax effects are recorded at the subsidiary level where the employees provide the services. The accompanying condensed financial information should be read in conjunction with the Cotiviti Holdings, Inc. Consolidated Financial Statements and related Notes thereto.
Note 2. Stockholders' Equity
Issuance of Common Stock
On May 13, 2016 our certificate of incorporation was amended and the number of shares of common stock authorized to be issued by the Company was increased from 122,000,000 to 600,000,000.
On May 25, 2016 we consummated our IPO in which we issued and sold a total of 12,936,038 shares of common stock, including a portion of the underwriter overallotment, at a public offering price of $19.00 per share. We received net proceeds of approximately $226,963 after deducting underwriting discounts and commissions and other offering expenses of approximately $18,822.
In May 2014, a total of 32,790,321 shares of common stock were issued for a total fair value of $435,144 in connection with the Connolly iHealth Merger. Of this amount, $365,187 was received in cash and $69,957 was issued to certain members of the former iHealth Technologies management as they either rolled over a portion of their former equity interests in iHealth Technologies or received equity in lieu of incentive compensation that was owed to them as of the date of the merger.
Common Stock Split
On May 13, 2016 we effected a 6.1-for-1 stock split of all outstanding shares of our common stock. All share, option and per share information presented in the accompanying consolidated financial statements and notes thereto have been adjusted to reflect the stock split on a retroactive basis for all periods presented and all share information is rounded up to the nearest whole share after reflecting the stock split.
Common Stock Dividends
On May 25, 2016 we paid a Special Cash Dividend of $150,000, or $1.94 per share of common stock outstanding prior to the IPO, to holders of record of our common stock on the dividend record date. In connection with
139
the Special Cash Dividend we lowered the exercise price of then outstanding stock options by $1.94 per share in order to preserve the intrinsic value of the options giving effect to the Special Cash Dividend.
140
Cotiviti Holdings, Inc.
Schedule II—Valuation and Qualifying Accounts
(in thousands)
|
|
|
|
|
|
|
|
|
|
|
|
|
|
|
|
|
|
|
|
|
|
|
|
|
Additions |
|
|
|
|
|
|
||||||
|
Description |
Balance at Beginning of Period |
|
Charged to Operating Expenses |
|
Business Combination(1) |
|
Provision Charged Against Revenue |
|
Deductions(2) |
|
Balance at End of Period |
||||||
|
Year Ended December 31, 2016 |
|
|
|
|
|
|
|
|
|
|
|
|
|
|
|
|
|
|
Allowance and estimated liability for refunds and appeals (3) |
$ |
101,181 |
|
$ |
— |
|
$ |
— |
|
$ |
99,472 |
|
$ |
(97,094) |
|
$ |
103,559 |
|
Allowance for doubtful accounts |
|
1,053 |
|
|
(147) |
|
|
— |
|
|
— |
|
|
(55) |
|
|
851 |
|
|
|
|
|
|
|
|
|
|
|
|
|
|
|
|
|
|
|
|
Year Ended December 31, 2015 |
|
|
|
|
|
|
|
|
|
|
|
|
|
|
|
|
|
|
Allowance and estimated liability for refunds and appeals (3) |
$ |
98,157 |
|
$ |
— |
|
$ |
— |
|
$ |
67,702 |
|
$ |
(64,678) |
|
$ |
101,181 |
|
Allowance for doubtful accounts |
|
655 |
|
|
804 |
|
|
— |
|
|
— |
|
|
(406) |
|
|
1,053 |
|
|
|
|
|
|
|
|
|
|
|
|
|
|
|
|
|
|
|
|
Year Ended December 31, 2014 |
|
|
|
|
|
|
|
|
|
|
|
|
|
|
|
|
|
|
Allowance and estimated liability for refunds and appeals (3) |
$ |
53,075 |
|
$ |
— |
|
$ |
14,382 |
|
$ |
62,166 |
|
$ |
(31,466) |
|
$ |
98,157 |
|
Allowance for doubtful accounts |
|
34 |
|
|
660 |
|
|
— |
|
|
— |
|
|
(39) |
|
|
655 |
|
(1) |
On May 14, 2014, we acquired the stock of iHealth Technologies, Inc. resulting in the Connolly iHealth Merger. In connection with this business combination, we assumed the liabilities of iHealth Technologies, Inc. |
|
(2) |
Deductions related to the allowance and estimated liability for refunds and appeals represent credits or payments provided to our clients to settle the liability. Deductions related to the allowance for doubtful accounts represent write-offs of bad debt expense. |
|
(3) |
The balance at end of period consists of the estimated allowance for refunds and appeals netted against accounts receivable of $41,020, $33,406 and $23,216 and the estimated liability for refunds and appeals of $62,539, $67,775 and $74,941 as of December 31, 2016, 2015 and 2014, respectively. Refer to the Notes to our Consolidated Financial Statements. |
141
|
Exhibit No. |
|
Description of Exhibits |
|
3.1 |
|
Amended and Restated Certificate of Incorporation of Cotiviti Holdings, Inc. (incorporated by reference to Exhibit 3.1 to the Company’s Current Report on Form 8-K (File No. 001-37787) filed on June 3, 2016). |
|
|
|
|
|
3.2 |
|
Amended and Restated Bylaws of Cotiviti Holdings, Inc. (incorporated by reference to Exhibit 3.2 to the Company’s Current Report on Form 8-K (File No. 001-37787) filed on June 3, 2016). |
|
|
|
|
|
4.1 |
|
Specimen Certificate of Common Stock (incorporated by reference to Exhibit 4.1 to the Company’s Registration Statement on Form S-1 (File No. 333-211022) filed on April 29, 2016). |
|
|
|
|
|
4.2 |
|
Second Amended and Restated Stockholders Agreement, by and among Cotiviti Holdings, Inc. and certain stockholders named therein (incorporated by reference to Exhibit 4.1 to the Company’s Current Report on Form 8-K (File No. 001-37787) filed on June 3, 2016). |
|
|
|
|
|
10.1 |
|
Restatement Agreement No. 1, dated September 28, 2016, to the First Lien Credit Agreement, dated May 14, 2014, among Cotiviti Corporation, Cotiviti Domestic Holdings, Inc., Cotiviti Intermediate Holdings, Inc., the other Loan Parties party thereto, the Lenders party thereto and JPMorgan Chase Bank, N.A., as Successor Agent, and Goldman Sachs Bank USA, as Resigning Agent (incorporated by reference to Exhibit 10.1 to the Company's Quarterly Report on Form 10-Q (File No. 001-37787) filed on November 10, 2016). |
|
|
|
|
|
10.2 |
|
Director Indemnification Agreement (incorporated by reference to Exhibit 10.7 to the Company’s Quarterly Report on Form 10-Q (File No. 001-37787) filed on August 10, 2016). |
|
|
|
|
|
10.3† |
|
Executive Employment Agreement, dated May 15, 2015, by and between John D. Williams and Connolly iHealth Technologies, LLC (incorporated by reference to Exhibit 10.8 to the Company's Registration Statement on Form S-1 (File No. 333-211022) filed on April 29, 2016). |
|
|
|
|
|
10.4† |
|
Executive Employment Agreement, dated May 15, 2015, by and between Steve Senneff and Connolly iHealth Technologies, LLC (incorporated by reference to Exhibit 10.9 to the Company’s Registration Statement on Form S-1 (File No. 333-211022) filed on April 29, 2016). |
|
|
|
|
|
10.5† |
|
Executive Employment Agreement, dated May 15, 2015, by and between David Beaulieu and Connolly iHealth Technologies, LLC (incorporated by reference to Exhibit 10.10 to the Company’s Registration Statement on Form S-1 (File No. 333-211022) filed on April 29, 2016). |
|
|
|
|
|
10.6† |
|
Cotiviti Holdings, Inc. 2012 Equity Incentive Plan (incorporated by reference to Exhibit 4.2 to the Company’s Registration Statement on Form S-8 (File No. 333-211618) filed on May 25, 2016). |
|
|
|
|
|
10.7† |
|
Form of Stock Option Agreement under Cotiviti Holdings, Inc. 2012 Equity Incentive Plan (incorporated by reference to Exhibit 10.12 to the Company’s Registration Statement on Form S-1 (File No. 333‑211022) filed on April 29, 2016). |
|
|
|
|
|
10.8† |
|
Cotiviti Holdings, Inc. 2016 Equity Incentive Plan (incorporated by reference to Exhibit 4.1 to the Company’s Registration Statement on Form S-8 (File No. 333-211618) filed on May 25, 2016). |
|
|
|
|
|
10.9† |
|
Form of Stock Option Award Agreement under Cotiviti Holdings, Inc. 2016 Equity Incentive Plan (incorporated by reference to Exhibit 10.14 to the Company’s Registration Statement on Form S-1 (File No. 333-211022) filed on April 29, 2016). |
|
|
|
|
|
10.10† |
|
Form of Restricted Stock Unit Award Agreement under Cotiviti Holdings, Inc. 2016 Equity Incentive Plan (incorporated by reference to Exhibit 10.15 to the Company’s Registration Statement on Form S-1 (File No. 333-211022) filed on April 29, 2016). |
|
|
|
|
|
10.11† |
|
Cotiviti Holdings, Inc. Employee Stock Purchase Plan for U.S. Employees (incorporated by reference to Exhibit 4.1 to the Company’s Registration Statement on Form S-8 (File No. 333-214568) filed on November 10, 2016). |
142
|
Exhibit No. |
|
Description of Exhibits |
|
|
|
|
|
10.12† |
|
Cotiviti Holdings, Inc. Employee Stock Purchase Plan for Non-U.S. Employees (incorporated by reference to Exhibit 4.2 to the Company’s Registration Statement on Form S-8 (File No. 333-214568) filed on November 10, 2016). |
|
|
|
|
|
21.1* |
|
List of subsidiaries of the Company. |
|
|
|
|
|
23.1* |
|
Consent of KPMG LLP |
|
|
|
|
|
24.1* |
|
Power of Attorney (included on the signature pages herein). |
|
|
|
|
|
31.1* |
|
Certification of Chief Executive Officer pursuant to Rule 13a-14(a) or 15d-14(a) of the Securities Exchange Act of 1934, as amended, as adopted pursuant to Section 302 of the Sarbanes-Oxley Act of 2002. |
|
|
|
|
|
31.2* |
|
Certification of Chief Financial Officer pursuant to Rule 13a-14(a) or 15d-14(a) of the Securities Exchange Act of 1934, as amended, as adopted pursuant to Section 302 of the Sarbanes-Oxley Act of 2002. |
|
|
|
|
|
32.1* |
|
Certification of Chief Executive Officer pursuant to 18 U.S.C. Section 1350, as adopted pursuant to Section 906 of the Sarbanes-Oxley Act of 2002. |
|
|
|
|
|
32.2* |
|
Certification of Chief Financial Officer pursuant to 18 U.S.C. Section 1350, as adopted pursuant to Section 906 of the Sarbanes-Oxley Act of 2002. |
|
|
|
|
|
101.INS* |
|
XBRL Instance Document. |
|
|
|
|
|
101.SCH* |
|
XBRL Taxonomy Extension Schema Document. |
|
|
|
|
|
101.CAL* |
|
XBRL Taxonomy Extension Calculation Linkbase Document. |
|
|
|
|
|
101.DEF* |
|
XBRL Taxonomy Extension Definition Linkbase Document. |
|
|
|
|
|
101.LAB* |
|
XBRL Taxonomy Extension Label Linkbase Document. |
|
|
|
|
|
101.PRE* |
|
XBRL Taxonomy Extension Presentation Linkbase Document. |
* Filed herewith.
† Management contract or compensatory plan, contract or arrangement.
143