Attached files
| file | filename |
|---|---|
| EX-99.1 - HANCOCK WHITNEY CORP | hwc-20180717xex99_1.htm |
| 8-K - HANCOCK WHITNEY CORP | hwc-20180717x8k.htm |

Second Quarter 2018Earnings Conference Call 7/18/2018

This presentation contains forward-looking statements within the meaning of section 27A of the Securities Act of 1933, as amended, and section 21E of the Securities Exchange Act of 1934, as amended. Forward-looking statements that we may make include statements regarding balance sheet and revenue growth, the provision for loans losses, loan growth expectations, management’s predictions about charge-offs for loans, including energy-related credits, the impact of changes in oil and gas prices on our energy portfolio, and the downstream impact on businesses that support the energy sector, especially in the Gulf Coast region, the impact of the sale of HFC on our performance and financial condition, the impact of the transactions with First NBC and Capital One on our performance and financial condition, including our ability to successfully integrate the businesses, deposit trends, credit quality trends, net interest margin trends, future expense levels, success of revenue-generating initiatives, projected tax rates, future profitability, improvements in expense to revenue (efficiency) ratio, purchase accounting impacts such as accretion levels, and the financial impact of regulatory requirements and tax reform legislation. Also, any statement that does not describe historical or current facts is a forward-looking statement. These statements often include the words “believes,” “expects,” “anticipates,” “estimates,” “intends,” “plans,” “forecast,” “goals,” “targets,” “initiatives,” “focus,” “potentially,” “probably,” “projects,” “outlook", or similar expressions or future conditional verbs such as “may,” “will,” “should,” “would,” and “could.” Forward-looking statements are based upon the current beliefs and expectations of management and on information currently available to management. Our statements speak as of the date hereof, and we do not assume any obligation to update these statements or to update the reasons why actual results could differ from those contained in such statements in light of new information or future events. Forward-looking statements are subject to significant risks and uncertainties. Any forward-looking statement made in this release is subject to the safe harbor protections set forth in the Private Securities Litigation Reform Act of 1995. Investors are cautioned against placing undue reliance on such statements. Actual results may differ materially from those set forth in the forward looking statements. Additional factors that could cause actual results to differ materially from those described in the forward-looking statements can be found in Part I, “Item 1A. Risk Factors” in our Annual Report on Form 10-K for the year ended December 31, 2017 and in other periodic reports that we file with the SEC. Important cautionary statement about forward-looking statements 2
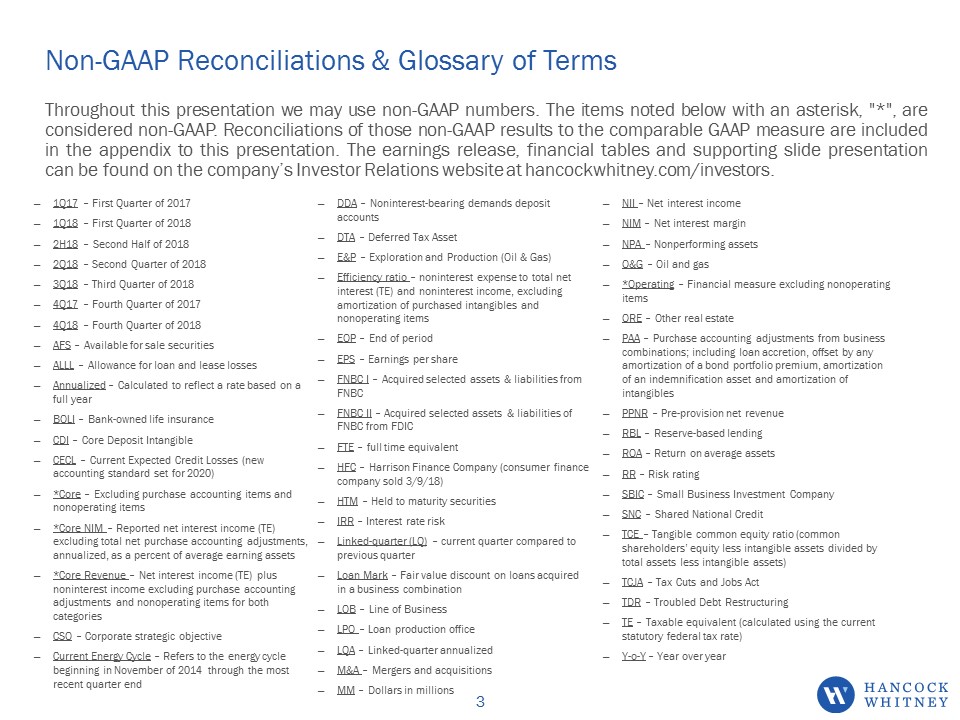
Non-GAAP Reconciliations & Glossary of Terms Throughout this presentation we may use non-GAAP numbers. The items noted below with an asterisk, "*", are considered non-GAAP. Reconciliations of those non-GAAP results to the comparable GAAP measure are included in the appendix to this presentation. The earnings release, financial tables and supporting slide presentation can be found on the company’s Investor Relations website at hancockwhitney.com/investors. 1Q17 – First Quarter of 20171Q18 – First Quarter of 20182H18 – Second Half of 20182Q18 – Second Quarter of 20183Q18 – Third Quarter of 20184Q17 – Fourth Quarter of 20174Q18 – Fourth Quarter of 2018AFS – Available for sale securitiesALLL – Allowance for loan and lease lossesAnnualized – Calculated to reflect a rate based on afull yearBOLI – Bank-owned life insuranceCDI – Core Deposit IntangibleCECL – Current Expected Credit Losses (new accounting standard set for 2020)*Core – Excluding purchase accounting items and nonoperating items*Core NIM – Reported net interest income (TE) excluding total net purchase accounting adjustments, annualized, as a percent of average earning assets*Core Revenue – Net interest income (TE) plus noninterest income excluding purchase accounting adjustments and nonoperating items for both categoriesCSO – Corporate strategic objectiveCurrent Energy Cycle – Refers to the energy cycle beginning in November of 2014 through the most recent quarter endDDA – Noninterest-bearing demands deposit accountsDTA – Deferred Tax AssetE&P – Exploration and Production (Oil & Gas)Efficiency ratio – noninterest expense to total net interest (TE) and noninterest income, excluding amortization of purchased intangibles and nonoperating itemsEOP – End of periodEPS – Earnings per shareFNBC I – Acquired selected assets & liabilities from FNBC FNBC II – Acquired selected assets & liabilities of FNBC from FDIC FTE – full time equivalentHFC – Harrison Finance Company (consumer finance company sold 3/9/18)HTM – Held to maturity securitiesIRR – Interest rate riskLinked-quarter (LQ) – current quarter compared to previous quarterLoan Mark – Fair value discount on loans acquired in a business combinationLOB – Line of BusinessLPO – Loan production officeLQA – Linked-quarter annualizedM&A – Mergers and acquisitionsMM – Dollars in millionsNII – Net interest income NIM – Net interest marginNPA – Nonperforming assetsO&G – Oil and gas*Operating – Financial measure excluding nonoperating itemsORE – Other real estatePAA – Purchase accounting adjustments from business combinations; including loan accretion, offset by any amortization of a bond portfolio premium, amortization of an indemnification asset and amortization of intangiblesPPNR – Pre-provision net revenueRBL – Reserve-based lendingROA – Return on average assetsRR – Risk ratingSBIC – Small Business Investment CompanySNC – Shared National CreditTCE – Tangible common equity ratio (common shareholders’ equity less intangible assets divided by total assets less intangible assets)TCJA – Tax Cuts and Jobs ActTDR – Troubled Debt Restructuring TE – Taxable equivalent (calculated using the current statutory federal tax rate)Y-o-Y – Year over year 3

Corporate Profile (as of June 30, 2018) $27.9 billion in Total Assets$19.4 billion in Total Loans$22.2 billion in Total DepositsTangible Common Equity (TCE) ratio 7.76%Nearly 200 banking locations and 269 ATMs across our footprintApproximately 3,800 (FTE) employees corporate-wideRated among the strongest, safest financial institutions in the country by BauerFinancial, Inc. for 115 consecutive quartersEarned top customer service marks with Greenwich Excellence AwardsMoody’s long-term issuer rating: Baa3S&P long-term issuer rating: BBB 4
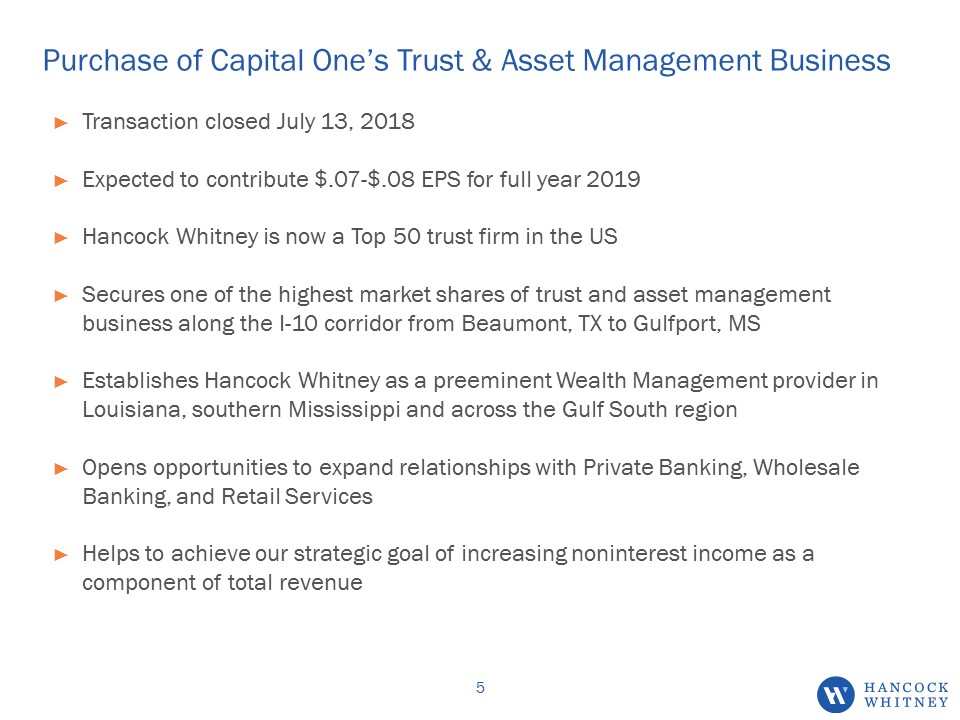
Purchase of Capital One’s Trust & Asset Management Business Transaction closed July 13, 2018Expected to contribute $.07-$.08 EPS for full year 2019Hancock Whitney is now a Top 50 trust firm in the USSecures one of the highest market shares of trust and asset management business along the I-10 corridor from Beaumont, TX to Gulfport, MSEstablishes Hancock Whitney as a preeminent Wealth Management provider in Louisiana, southern Mississippi and across the Gulf South regionOpens opportunities to expand relationships with Private Banking, Wholesale Banking, and Retail ServicesHelps to achieve our strategic goal of increasing noninterest income as a component of total revenue 5
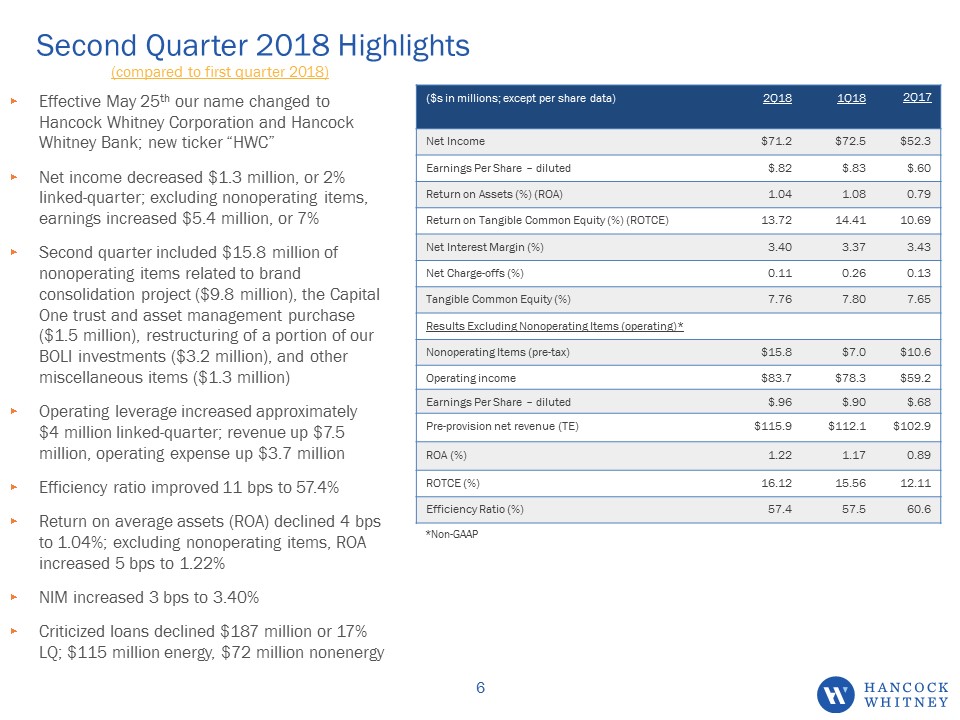
Second Quarter 2018 Highlights (compared to first quarter 2018) Effective May 25th our name changed to Hancock Whitney Corporation and Hancock Whitney Bank; new ticker “HWC”Net income decreased $1.3 million, or 2% linked-quarter; excluding nonoperating items, earnings increased $5.4 million, or 7%Second quarter included $15.8 million of nonoperating items related to brand consolidation project ($9.8 million), the Capital One trust and asset management purchase ($1.5 million), restructuring of a portion of our BOLI investments ($3.2 million), and other miscellaneous items ($1.3 million)Operating leverage increased approximately $4 million linked-quarter; revenue up $7.5 million, operating expense up $3.7 millionEfficiency ratio improved 11 bps to 57.4%Return on average assets (ROA) declined 4 bps to 1.04%; excluding nonoperating items, ROA increased 5 bps to 1.22%NIM increased 3 bps to 3.40%Criticized loans declined $187 million or 17% LQ; $115 million energy, $72 million nonenergy ($s in millions; except per share data) 2Q18 1Q18 2Q17 Net Income $71.2 $72.5 $52.3 Earnings Per Share – diluted $.82 $.83 $.60 Return on Assets (%) (ROA) 1.04 1.08 0.79 Return on Tangible Common Equity (%) (ROTCE) 13.72 14.41 10.69 Net Interest Margin (%) 3.40 3.37 3.43 Net Charge-offs (%) 0.11 0.26 0.13 Tangible Common Equity (%) 7.76 7.80 7.65 Results Excluding Nonoperating Items (operating)* Nonoperating Items (pre-tax) $15.8 $7.0 $10.6 Operating income $83.7 $78.3 $59.2 Earnings Per Share – diluted $.96 $.90 $.68 Pre-provision net revenue (TE) $115.9 $112.1 $102.9 ROA (%) 1.22 1.17 0.89 ROTCE (%) 16.12 15.56 12.11 Efficiency Ratio (%) 57.4 57.5 60.6 *Non-GAAP 6

Growth Diversified Across Footprint and Many Lines of Business Loans totaled $19.4 billion at quarter-end, an increase of $278 million, or 6% LQALoan portfolio 51% variable56% of variable loans are LIBOR-based 96% of the LIBOR loans are tied to 1mo L4% of the LIBOR loans are tied to 3mo LApproximately 33% tied to Wall Street Journal PrimeNet loan growth during the quarter continues to be diversified both regionally and in areas identified as part of the company’s revenue-generating initiativesExpect loan growth for 3Q18 in the range of $250-$300 million; expect year-over-year EOP loan growth between 5-6% 7

Well-Diversified Loan Portfolio 8

Asset Quality Improvement - Criticized Commercial Loans Declined 17% LQ Total criticized loans $1,113 $1,108 $1,256 $1,268 $1,189 $1,153 $1,092 $1,076 $1,084 $897 Criticized –nonenergy $352 $310 $363 $379 $452 $466 $485 $526 $561 $489 Criticized – energy $761 $798 $893 $889 $737 $687 $607 $550 $523 $408 Criticized commercial loans totaled $897 million at June 30, 2018, down $187 million, or 17%, from March 31, 2018Criticized energy loans totaled $408 million at June 30, 2018, down $115 million, or 22%, linked-quarter; declines in all major segmentsCriticized nonenergy loans totaled $489 million at June 30, 2018, down $72 million, or 13%, linked-quarterProvision for loan losses was $8.9 million, down $3.4 million linked-quarterNet charge-offs totaled $5.1 million, or 11 bps, down from $12.2 million, or 26 bps, in 1Q18 9

Asset Quality Improvement - Nonperforming Loans Declined 11% LQ Total nonperforming loans $283 $302 $311 $358 $310 $329 $366 $373 $442 $394 Nonperforming loans - nonenergy $124 $105 $112 $119 $116 $121 $145 $159 $163 $157 Nonperforming loans – energy $159 $197 $199 $239 $194 $208 $221 $214 $279 $237 Total HWC Nonperforming Loans(nonaccrual loans + TDRs) NPA ratio 2.15%, down 30 bps linked-quarter Nonperforming assets totaled $417 million, down $52 million from March 31, 2018Nonperforming energy loans totaled $237 million at June 30, 2018, down $42 million, or 15%, linked-quarterNonperforming nonenergy loans totaled $157 million at June 30, 2018, down $6 million, or 4%, from first quarter of 2018 10
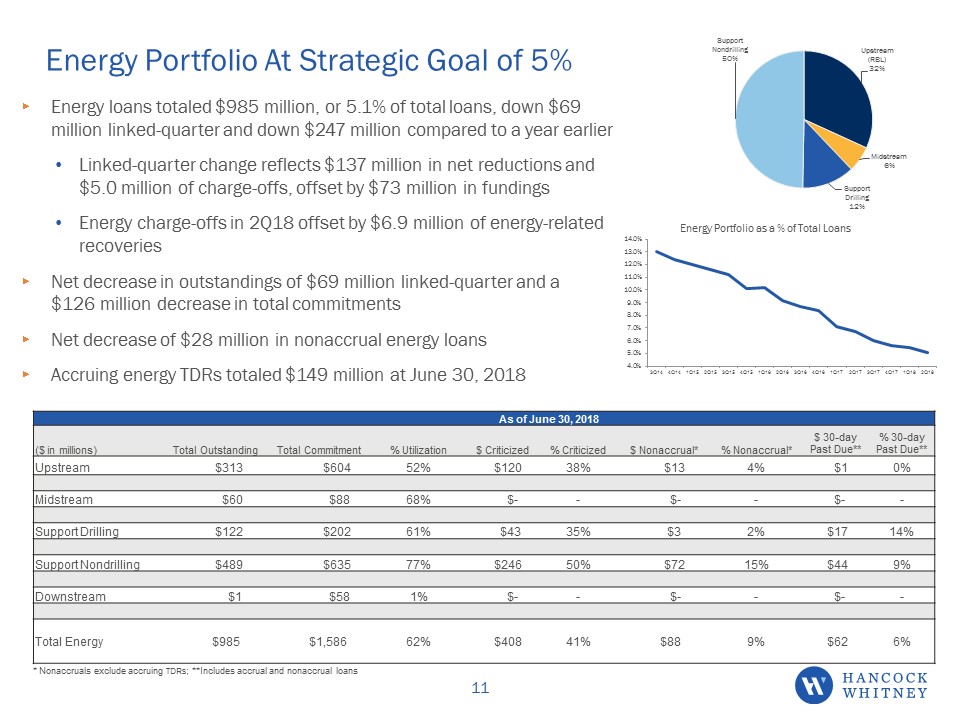
Energy Portfolio At Strategic Goal of 5% As of June 30, 2018 ($ in millions) Total Outstanding Total Commitment % Utilization $ Criticized % Criticized $ Nonaccrual* % Nonaccrual* $ 30-day Past Due** % 30-day Past Due** Upstream $313 $604 52% $120 38% $13 4% $1 0% Midstream $60 $88 68% $- - $- - $- - Support Drilling $122 $202 61% $43 35% $3 2% $17 14% Support Nondrilling $489 $635 77% $246 50% $72 15% $44 9% Downstream $1 $58 1% $- - $- - $- - Total Energy $985 $1,586 62% $408 41% $88 9% $62 6% Energy loans totaled $985 million, or 5.1% of total loans, down $69 million linked-quarter and down $247 million compared to a year earlierLinked-quarter change reflects $137 million in net reductions and $5.0 million of charge-offs, offset by $73 million in fundingsEnergy charge-offs in 2Q18 offset by $6.9 million of energy-related recoveriesNet decrease in outstandings of $69 million linked-quarter and a $126 million decrease in total commitmentsNet decrease of $28 million in nonaccrual energy loansAccruing energy TDRs totaled $149 million at June 30, 2018 * Nonaccruals exclude accruing TDRs; **Includes accrual and nonaccrual loans 11
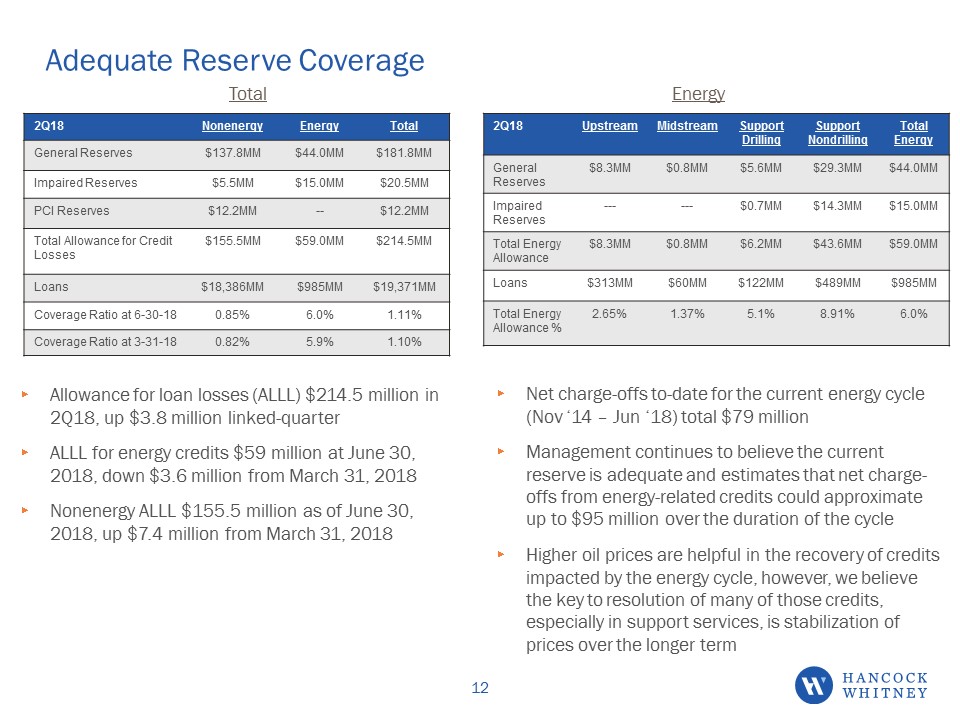
Adequate Reserve Coverage Allowance for loan losses (ALLL) $214.5 million in 2Q18, up $3.8 million linked-quarterALLL for energy credits $59 million at June 30, 2018, down $3.6 million from March 31, 2018 Nonenergy ALLL $155.5 million as of June 30, 2018, up $7.4 million from March 31, 2018 Net charge-offs to-date for the current energy cycle (Nov ‘14 – Jun ‘18) total $79 millionManagement continues to believe the current reserve is adequate and estimates that net charge-offs from energy-related credits could approximate up to $95 million over the duration of the cycleHigher oil prices are helpful in the recovery of credits impacted by the energy cycle, however, we believe the key to resolution of many of those credits, especially in support services, is stabilization of prices over the longer term Total Energy 2Q18 Upstream Midstream Support Drilling Support Nondrilling Total Energy General Reserves $8.3MM $0.8MM $5.6MM $29.3MM $44.0MM Impaired Reserves --- --- $0.7MM $14.3MM $15.0MM Total Energy Allowance $8.3MM $0.8MM $6.2MM $43.6MM $59.0MM Loans $313MM $60MM $122MM $489MM $985MM Total Energy Allowance % 2.65% 1.37% 5.1% 8.91% 6.0% 2Q18 Nonenergy Energy Total General Reserves $137.8MM $44.0MM $181.8MM Impaired Reserves $5.5MM $15.0MM $20.5MM PCI Reserves $12.2MM -- $12.2MM Total Allowance for Credit Losses $155.5MM $59.0MM $214.5MM Loans $18,386MM $985MM $19,371MM Coverage Ratio at 6-30-18 0.85% 6.0% 1.11% Coverage Ratio at 3-31-18 0.82% 5.9% 1.10% 12
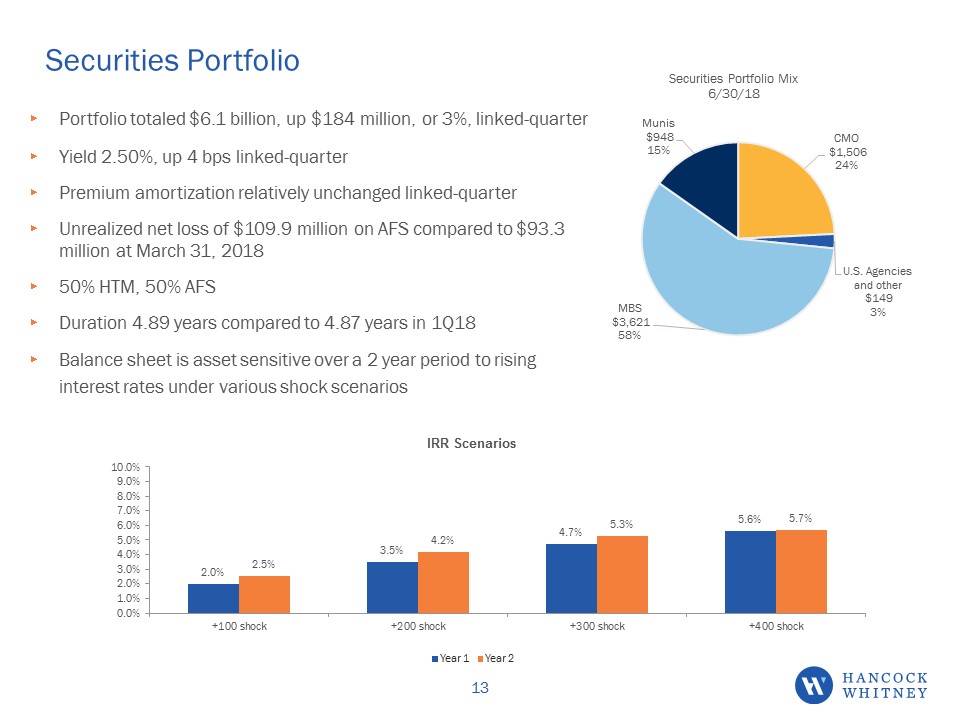
Securities Portfolio Portfolio totaled $6.1 billion, up $184 million, or 3%, linked-quarterYield 2.50%, up 4 bps linked-quarterPremium amortization relatively unchanged linked-quarterUnrealized net loss of $109.9 million on AFS compared to $93.3 million at March 31, 201850% HTM, 50% AFSDuration 4.89 years compared to 4.87 years in 1Q18Balance sheet is asset sensitive over a 2 year period to rising interest rates under various shock scenarios 13
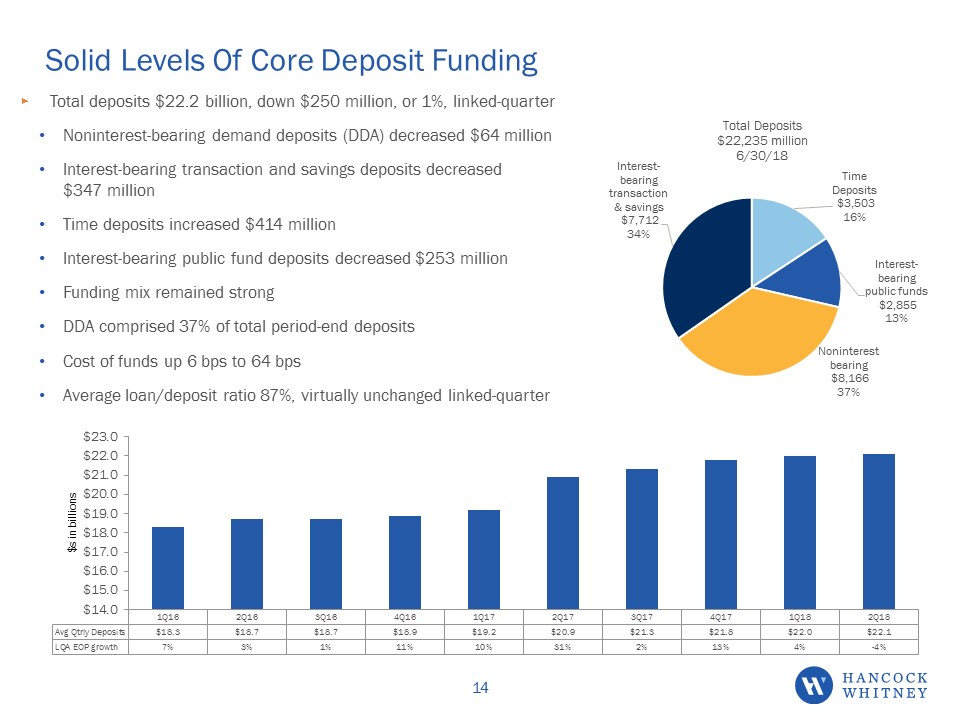
Solid Levels Of Core Deposit Funding Total deposits $22.2 billion, down $250 million, or 1%, linked-quarterNoninterest-bearing demand deposits (DDA) decreased $64 million Interest-bearing transaction and savings deposits decreased $347 millionTime deposits increased $414 million Interest-bearing public fund deposits decreased $253 millionFunding mix remained strongDDA comprised 37% of total period-end depositsCost of funds up 6 bps to 64 bpsAverage loan/deposit ratio 87%, virtually unchanged linked-quarter 14

Reported net interest margin (NIM) of 3.40%, up 3 bps linked-quarterLoan yield up 12 bpsYield on securities portfolio up 4 bpsCost of funds up 6 bpsCore NIM (TE) of 3.31% up 5 bps linked-quarter NIM (TE) Expansion of 3 bps LQ as Deposit Betas Decline Betas 2Q18 1Q18 4Q15-2Q18 Loans 44% 47% 48% Deposits 17% 29% 21% 15
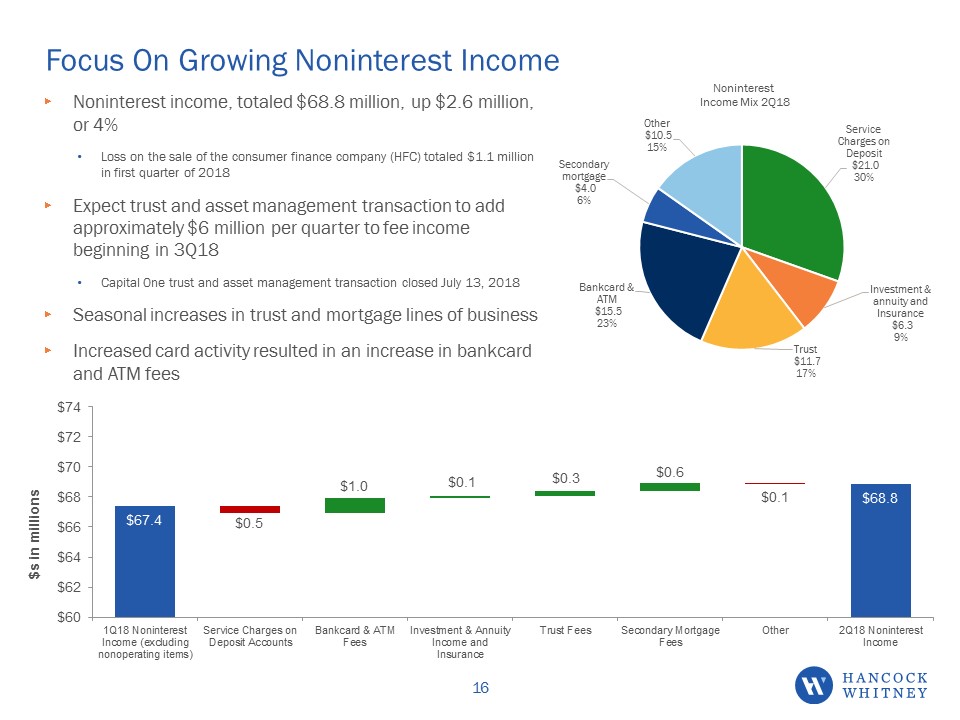
Focus On Growing Noninterest Income Noninterest income, totaled $68.8 million, up $2.6 million, or 4%Loss on the sale of the consumer finance company (HFC) totaled $1.1 million in first quarter of 2018Expect trust and asset management transaction to add approximately $6 million per quarter to fee income beginning in 3Q18Capital One trust and asset management transaction closed July 13, 2018Seasonal increases in trust and mortgage lines of businessIncreased card activity resulted in an increase in bankcard and ATM fees 16

Growth in Balance Sheet and Revenue Drive Higher Expenses Operating expense (noninterest expense excluding nonoperating items) totaled $168.6 million, up $3.7 million, or 2%Nonoperating expenses totaled $15.8 million in 2Q18 and $5.9 million in 1Q18Consumer finance company (HFC) expenses totaled $2.5 million in 1Q18; sold March 9, 2018Efficiency ratio improved 11 bps to 57.4%Expect trust and asset management transaction to add approximately $6 million per quarter to both 3Q18 and 4Q18 expensesLinked-quarter changes noted below adjusted for HFC 17 Annual merit increase and incentive pay Annual insurance renewals DP, professional services, regulatory and business development

Managing Our Capital In The Best Interests of All Stakeholders TCE ratio 7.76%, down 4 bps linked-quarterGrowth in tangible assets -18 bpsTangible net earnings +29 bpsOCI -9 bps; mostly related to higher unrealized loss on the AFS securities portfolioDividends -8 bpsStock-based comp activity & other +2 bpsWill continue to manage capital in the best interests of the Company and our shareholdersOrganic growthContinuing to review M&A opportunities; strategy unchangedDividend payout ratio targeted between 30-40% of net incomeStock buybacks Tangible Common Equity Ratio Leverage (Tier 1) Ratio Tier 1 Risked-Based Capital Ratio Total Risk-Based Capital Ratio June 30, 2018 7.76% 8.65%(e) 10.49%(e) 12.13%(e) March 31, 2018 7.80% 8.51% 10.35% 12.00% December 31, 2017 7.73% 8.43% 10.21% 11.90% September 30, 2017 7.80% 8.34% 10.10% 11.84% June 30, 2017 7.65% 8.21% 10.01% 11.76% (e) Estimated for most recent period-end 18

Near-Term Outlook 2Q18 Actual Items to note 2H18 Outlook Loans up $278 million or 6% LQA; up $897 million or 5% Y-o-Y Energy loans declined $69 million and total just under $1 billion or 5.1% of total loans Expect net loan growth of $250-$300 million for 3Q18 and 5%-6% EOP growth year-over-year Net Interest Margin (NIM) 3.40%3.31% (core) up 3 bps LQup 5 bps LQ Absent any additional rate hikes expect NIM to remain relatively stable in the second half of 2018; expect each additional 25 bps increase in rates to widen the NIM 2-4 bps Noninterest Income $68.8 million Expect operating noninterest income to increase 8%-9% for the year compared to 2017Capital One transaction to add approximately $6MM in trust fees per quarter in 2H18 Loan Loss Provision $8.9 million Expected range of $8-$10 million in third and fourth quarters of 2018 Operating expense $168.6 million Expect operating expense to increase 3%-4% for the year compared to 2017Capital One transaction to add approximately $6MM per quarter in 2H18 Effective Tax Rate 18% Expect the effective tax rate to approximate 18% and 15% in 3rd and 4th quarters of 2018 respectively Nonoperating items $15.8 million Brand consolidation project ($9.8 million), Capital One trust and asset management purchase ($1.5 million), restructuring of a portion of our BOLI investments ($3.2 million), and other miscellaneous items ($1.3 million) Nonoperating items anticipated in 2H18: Relocation expenses for Hancock Whitney Center in New Orleans; Expenses related to the Capital One Trust & Asset Management acquisition 19

Long-Term Outlook – Goal To Achieve Objectives By 4Q19 Quarterly Objective 2Q18 Actual Earnings (EPS)/quarter (excluding nonoperating items) $1.00 - $1.10+ $.96 ROA (operating) 1.15% - 1.25%+ 1.22% TCE 8.5%+ 7.76% ROTCE (operating) 15%+ 16.12% Efficiency Ratio ≤56% 57.4% 2018/2019 Corporate Strategic Objectives (CSOs) 20

Non-GAAP Reconciliations

Operating Earnings & Operating EPS Reconciliations Three Months Ended (in thousands, except per share amounts) 6/30/2018 3/31/2018 12/31/2017 9/30/2017 6/30/2017 Net Income $71,177 $72,475 $ 55,449 $58,902 $52,267 Net income allocated to participating securities (1,328) (1,366) (1,104) (1,244) (1,166) Net income available to common shareholders $69,849 $71,109 $54,345 $57,658 $51,101 Nonoperating items, net of applicable income tax 12,486 5,782 19,520 7,405 6,902 Nonoperating income allocated to participating securities (233) (109) (390) (156) (154) Operating net income available to common shareholders $82,102 $76,782 $73,475 $64,907 $57,849 Weighted average common shares - diluted 85,483 85,423 85,303 84,980 84,867 Earnings per share - diluted $0.82 $0.83 $0.64 $0.68 $0.60 Operating earnings per share - diluted $0.96 $0.90 $0.86 $0.76 $0.68 22
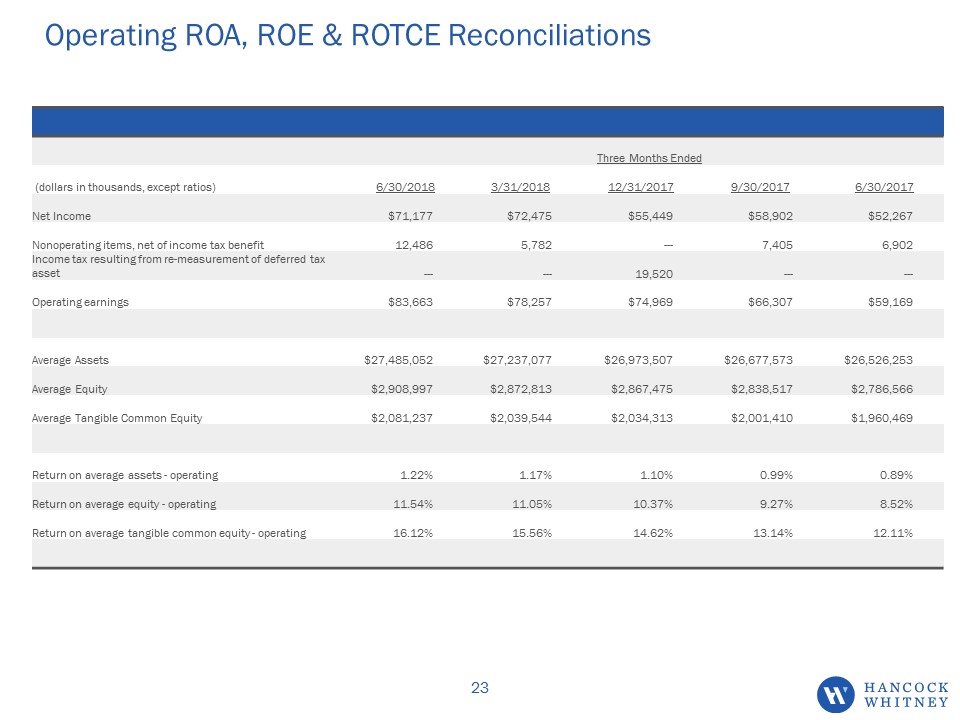
Operating ROA, ROE & ROTCE Reconciliations Three Months Ended (dollars in thousands, except ratios) 6/30/2018 3/31/2018 12/31/2017 9/30/2017 6/30/2017 Net Income $71,177 $72,475 $55,449 $58,902 $52,267 Nonoperating items, net of income tax benefit 12,486 5,782 --- 7,405 6,902 Income tax resulting from re-measurement of deferred tax asset --- --- 19,520 --- --- Operating earnings $83,663 $78,257 $74,969 $66,307 $59,169 Average Assets $27,485,052 $27,237,077 $26,973,507 $26,677,573 $26,526,253 Average Equity $2,908,997 $2,872,813 $2,867,475 $2,838,517 $2,786,566 Average Tangible Common Equity $2,081,237 $2,039,544 $2,034,313 $2,001,410 $1,960,469 Return on average assets - operating 1.22% 1.17% 1.10% 0.99% 0.89% Return on average equity - operating 11.54% 11.05% 10.37% 9.27% 8.52% Return on average tangible common equity - operating 16.12% 15.56% 14.62% 13.14% 12.11% 23

Operating Revenue (TE) & Operating PPNR (TE) Reconciliations Three Months Ended (dollars in thousands) 6/30/2018 3/31/2018 12/31/2017 9/30/2017 6/30/2017 Net interest income $211,547 $205,664 $208,047 $202,857 $199,717 Noninterest income 68,832 66,252 69,688 67,115 67,487 Total revenue $280,379 $271,916 $277,735 $269,972 $267,204 Taxable equivalent adjustment 4,081 3,963 8,949 8,579 8,564 Nonoperating revenue — 1,145 — — — Operating revenue (TE) $284,460 $277,024 $286,684 $278,551 $275,768 Noninterest expense (184,402) (170,791) (168,063) (177,616) (183,470) Nonoperating expense 15,805 5,853 — 11,393 10,617 Operating pre-provision net revenue (TE) $115,863 $112,086 $118,621 $112,328 $102,915 24

Core NII (TE) & Core NIM (TE) Reconciliation Three Months Ended (dollars in thousands, except ratios) 6/30/2018 3/31/2018 12/31/2017 9/30/2017 6/30/2017 Net interest income $211,547 $205,664 $208,047 $202,857 $199,717 Taxable equivalent adjustment (a) 4,081 3,963 8,949 8,579 8,564 Net interest income (TE) $215,628 $209,627 $216,996 $211,436 $208,281 Purchase accounting adjustments: Net loan discount accretion (b) 6,376 7,108 8,280 7,711 8,801 Net investment premium amortization (c) (259) (315) (320) (364) (398) Net purchase accounting accretion 6,117 6,793 7,960 7,347 8,403 Net interest income (TE) - core $209,511 $202,834 $209,036 $204,089 $199,878 Average earning assets $25,391,025 $25,106,283 $24,812,676 $24,487,426 $24,338,130 Net interest margin (TE) - reported 3.40 % 3.37 % 3.48 % 3.44 % 3.43 % Net purchase accounting adjustments 0.09 % 0.11 % 0.13 % 0.12 % 0.14 % Net interest margin (TE) - core 3.31 % 3.26 % 3.35 % 3.32 % 3.29 % (a) Taxable equivalent (TE) amounts are calculated using a federal income tax rate of 21% for the three months ended 3/31/2018 and 6/30/2018, and 35% for all other periods presented. (b) Includes net loan discount accretion arising from business combinations. (c) Includes net investment premium amortization arising from business combinations. 25

Appendix

Operating Earnings See slides 22-25 for non-GAAP reconciliations 27 2Q17 3Q17 4Q17 1Q18 2Q18 Operating Earnings ($000) 59,169 66,307 74,969 78,257 83,663 Operating EPS $0.68 $0.76 $0.86 $0.90 $0.96 Net Interest Income (TE) ($000) 208,281 211,436 216,996 209,627 215,628 Noninterest Inc excl non-op ($000) 67,487 67,115 69,688 67,397 68,832 Operating Expense excl non-op ($000) 172,853 166,223 168,063 164,938 168,597 Provision ($000) 14,951 13,040 14,986 12,253 8,891

Key Operating Ratios See slides 22-25 for non-GAAP reconciliations 28 2Q17 3Q17 4Q17 1Q18 2Q18 Operating Return on Assets 0.89% 0.99% 1.10% 1.17% 1.22% Operating Return on Equity 8.52% 9.27% 10.37% 11.05% 11.54% Operating Return on TCE 12.11% 13.14% 14.62% 15.56% 16.12% Tangible Common Equity Ratio 7.65% 7.80% 7.73% 7.80% 7.76% Net Interest Margin (TE) 3.43% 3.44% 3.48% 3.37% 3.40% Operating Efficiency Ratio 60.59% 57.50% 56.57% 57.51% 57.40%

Balance Sheet Summary 29 2Q17 3Q17 4Q17 1Q18 2Q18 Average Loans ($MM) 18,369 18,591 18,840 19,028 19,193 Average Total Securities ($MM) 5,242 5,680 5,801 5,897 6,032 Average Deposits ($MM) 20,933 21,350 21,763 22,043 22,101 Loan Yield (TE) 4.36% 4.39% 4.46% 4.43% 4.55% Securities Yield (TE) 2.52% 2.48% 2.50% 2.46% 2.50% Cost of Interest Bearing Dep 0.56% 0.64% 0.68% 0.78% 0.86%

Historical Energy Data $s in millions Energy Outstandings by Type 30

Energy Portfolio Support Services 31
Second Quarter 2018Earnings Conference Call 7/18/2018