Attached files
| file | filename |
|---|---|
| 8-K - 8-K - ONCOR ELECTRIC DELIVERY CO LLC | d801299d8k.htm |
Exhibit 99.1
Oncor Allen Nye, Chief Executive Officer, Oncor June 28, 2018
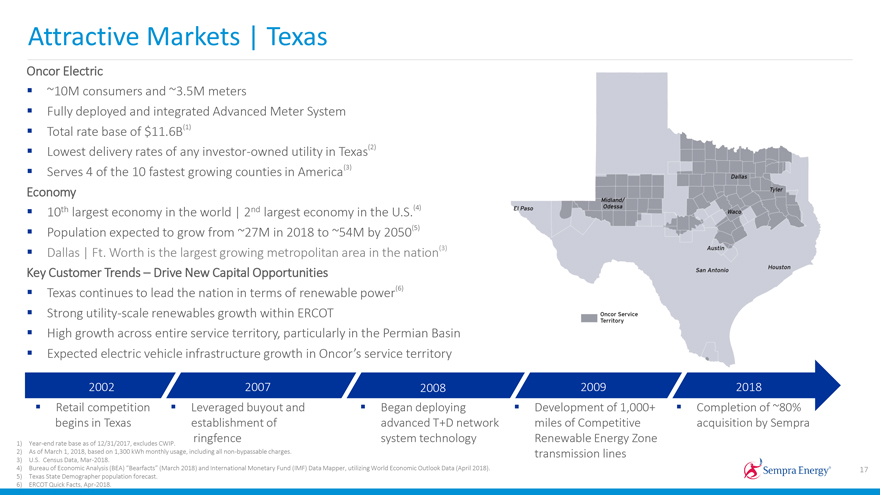
Attractive Markets | Texas Oncor Electric ~10M consumers and ~3.5M meters Fully deployed and integrated Advanced Meter System Total rate base of $11.6B(1) Lowest delivery rates of any investor-owned utility in Texas(2) Serves 4 of the 10 fastest growing counties in America(3) Economy 10th largest economy in the world | 2nd largest economy in the U.S.(4) Population expected to grow from ~27M in 2018 to ~54M by 2050(5) Dallas | Ft. Worth is the largest growing metropolitan area in the nation(3) Key Customer Trends – Drive New Capital Opportunities Texas continues to lead the nation in terms of renewable power(6) Strong utility-scale renewables growth within ERCOT High growth across entire service territory, particularly in the Permian Basin Expected electric vehicle infrastructure growth in Oncor’s service territory 2002 2007 2008 2009 2018 Retail competition Leveraged buyout and Began deploying Development of 1,000+ Completion of ~80% begins in Texas establishment of advanced T+D network miles of Competitive acquisition by Sempra ringfence system technology Renewable Energy Zone 1) Year-end rate base as of 12/31/2017, excludes CWIP. 2) As of March 1, 2018, based on 1,300 kWh monthly usage, including all non-bypassable charges. transmission lines 3) U.S. Census Data, Mar-2018. 4) Bureau of Economic Analysis (BEA) “Bearfacts” (March 2018) and International Monetary Fund (IMF) Data Mapper, utilizing World Economic Outlook Data (April 2018). 17 5) Texas State Demographer population forecast. 6) ERCOT Quick Facts, Apr-2018.
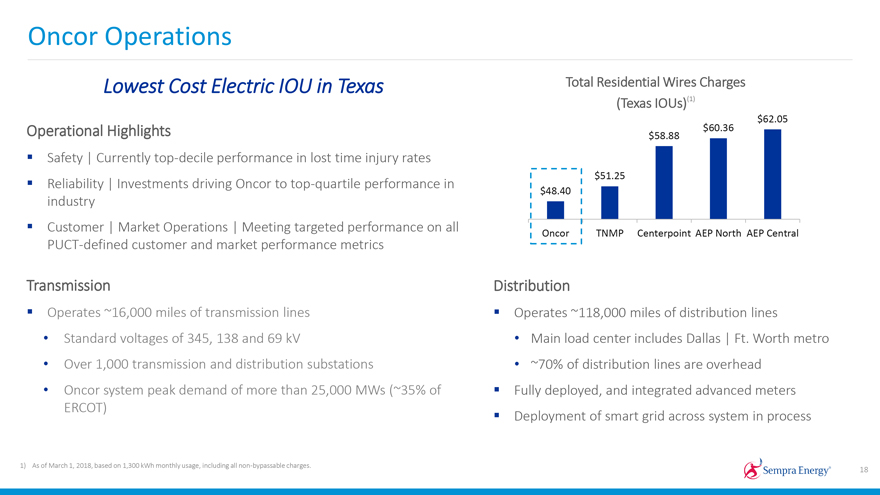
Oncor Operations Lowest Cost Electric IOU in Texas Total Residential Wires Charges (Texas IOUs)(1) $62.05 Operational Highlights $58.88 $60.36 Safety | Currently top-decile performance in lost time injury rates $51.25 Reliability | Investments driving Oncor to top-quartile performance in $48.40 industry Customer | Market Operations | Meeting targeted performance on all Oncor TNMP Centerpoint AEP North AEP Central PUCT-defined customer and market performance metrics Transmission Distribution Operates ~16,000 miles of transmission lines Operates ~118,000 miles of distribution lines • Standard voltages of 345, 138 and 69 kV • Main load center includes Dallas | Ft. Worth metro • Over 1,000 transmission and distribution substations • ~70% of distribution lines are overhead • Oncor system peak demand of more than 25,000 MWs (~35% of Fully deployed, and integrated advanced meters ERCOT) Deployment of smart grid across system in process 1) As of March 1, 2018, based on 1,300 kWh monthly usage, including all non-bypassable charges. 18
Constructive Regulatory EnvironmentPositive and constructive relationship with all stakeholders, including:â–ª Public Utility Commission of Texas (PUCT) Commissionersâ–ª PUCT Staffâ–ª Cities Served by Oncor (Cities)â–ª Texas Industrial Energy Consumers (TIEC)â–ª Office of Public Utility Counsel (OPUC)Settled rate case approved by the PUCT in Oct-2017â–ª Base rate increase of $118Mâ–ª 42.5% equity capital structure (previous 60% | 40%; current 57.5% | 42.5%)â–ª 9.8% approved ROEâ–ª ~$1B in regulatory assets approved for recoveryâ–ª New rates effective November 27, 2017Rate case included successful $400M asset swap with Sharyland Utilitiesâ–ª Sharyland received $400M of Oncor transmission assetsâ–ª Oncor received ~54k new distribution customers, located primarily in the Permian Basin
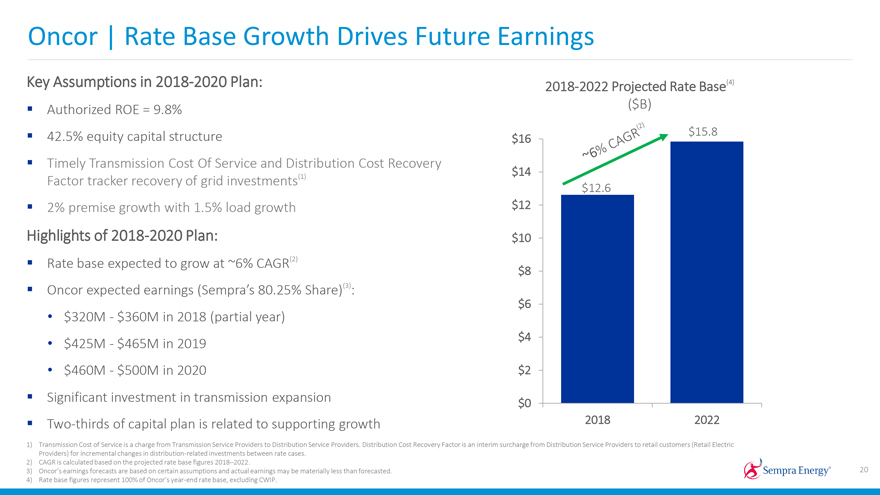
Oncor | Rate Base Growth Drives Future Earnings Key Assumptions in 2018-2020 Plan: 2018-2022 Projected Rate Base(4) ($B) Authorized ROE = 9.8% 42.5% equity capital structure $15.8 $16 Timely Transmission Cost Of Service and Distribution Cost Recovery $14 Factor tracker recovery of grid investments(1) $12.6 2% premise growth with 1.5% load growth $12 Highlights of 2018-2020 Plan: $10 Rate base expected to grow at ~6% CAGR(2) $8 Oncor expected earnings (Sempra’s 80.25% Share)(3): $6 $320M - $360M in 2018 (partial year) $4 $425M - $465M in 2019 $460M - $500M in 2020 $2 Significant investment in transmission expansion $0Two-thirds of capital plan is related to supporting growth 2018 2022 1) Transmission Cost of Service is a charge from Transmission Service Providers to Distribution Service Providers. Distribution Cost Recovery Factor is an interim surcharge from Distribution Service Providers to retail customers (Retail Electric Providers) for incremental changes in distribution-related investments between rate cases. 2) CAGR is calculated based on the projected rate base figures 2018–2022. 3) Oncor’s earnings forecasts are based on certain assumptions and actual earnings may be materially less than forecasted. 20 4) Rate base figures represent 100% of Oncor’s year-end rate base, excluding CWIP.
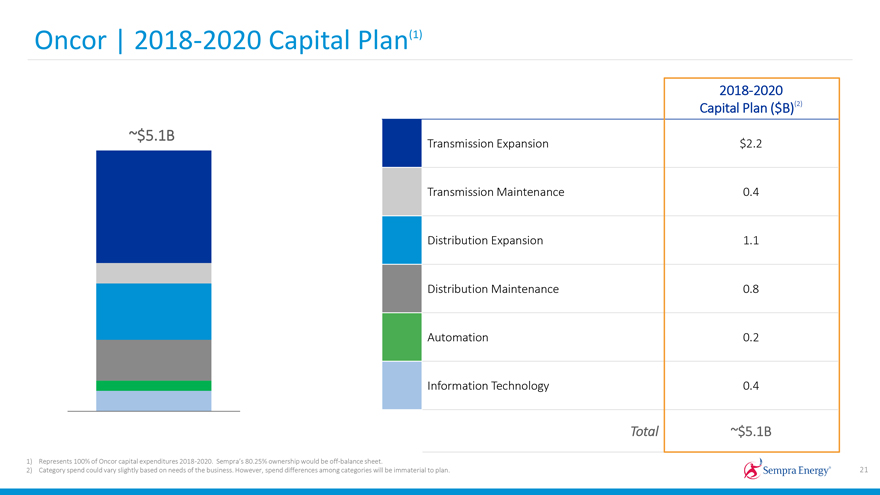
Oncor | 2018-2020 Capital Plan(1) 2018-2020 Capital Plan ($B)(2) ~$5.1B Transmission Expansion $2.2 Transmission Maintenance 0.4 Distribution Expansion 1.1 Distribution Maintenance 0.8 Automation 0.2 Information Technology 0.4 Total ~$5.1B 1) Represents 100% of Oncor capital expenditures 2018-2020. Sempra’s 80.25% ownership would be off-balance sheet. 2) Category spend could vary slightly based on needs of the business. However, spend differences among categories will be immaterial to plan. 21
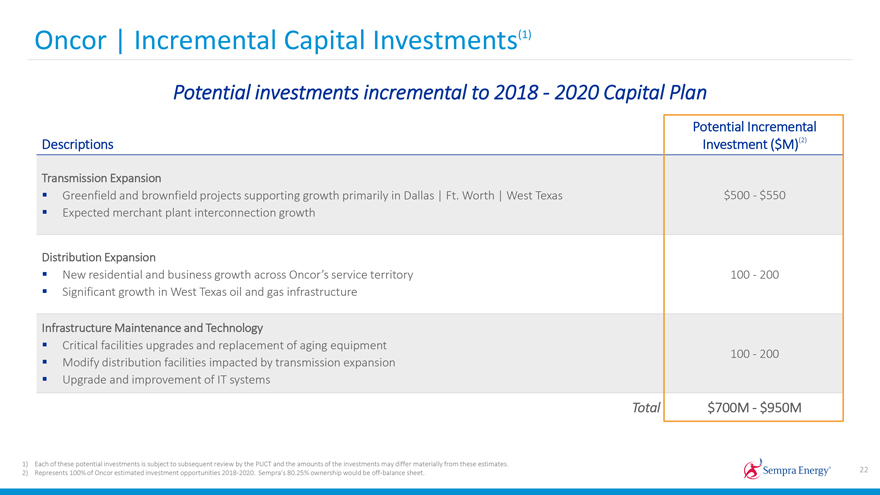
Oncor | Incremental Capital Investments(1) Potential investments incremental to 2018 - 2020 Capital Plan Potential Incremental Descriptions Investment ($M)(2) Transmission Expansion Greenfield and brownfield projects supporting growth primarily in Dallas | Ft. Worth | West Texas $500 - $550 Expected merchant plant interconnection growth Distribution Expansion New residential and business growth across Oncor’s service territory 100 - 200 Significant growth in West Texas oil and gas infrastructure Infrastructure Maintenance and Technology Critical facilities upgrades and replacement of aging equipment 100 - 200 Modify distribution facilities impacted by transmission expansion Upgrade and improvement of IT systems Total $700M - $950M 1) Each of these potential investments is subject to subsequent review by the PUCT and the amounts of the investments may differ materially from these estimates. 22 2) Represents 100% of Oncor estimated investment opportunities 2018-2020. Sempra’s 80.25% ownership would be off-balance sheet.
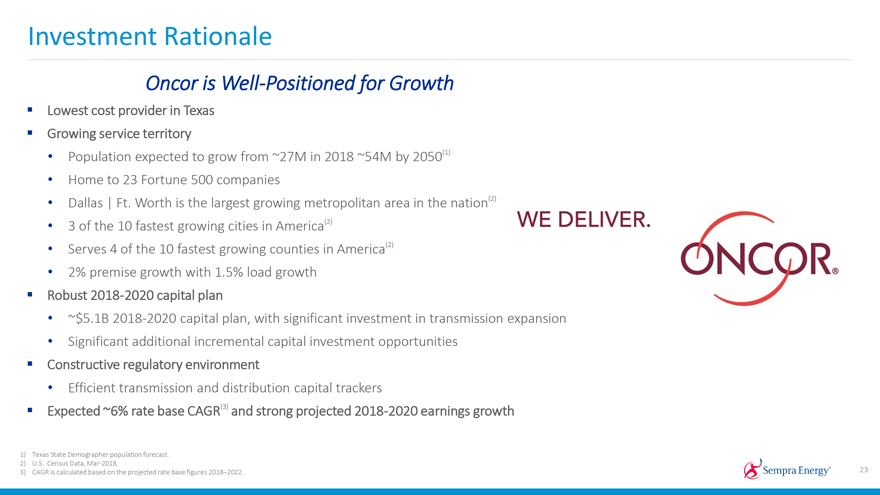
Investment Rationale Oncor is Well-Positioned for Growth Lowest cost provider in Texas Growing service territory Population expected to grow from ~27M in 2018 ~54M by 2050(1) Home to 23 Fortune 500 companies Dallas | Ft. Worth is the largest growing metropolitan area in the nation(2) 3 of the 10 fastest growing cities in America(2) Serves 4 of the 10 fastest growing counties in America(2) 2% premise growth with 1.5% load growth Robust 2018-2020 capital plan ~$5.1B 2018-2020 capital plan, with significant investment in transmission expansion Significant additional incremental capital investment opportunities Constructive regulatory environment Efficient transmission and distribution capital trackers Expected ~6% rate base CAGR(3) and strong projected 2018-2020 earnings growth 1) Texas State Demographer population forecast. 2) U.S. Census Data, Mar-2018. 23 3) CAGR is calculated based on the projected rate base figures 2018–2022.
