Attached files
| file | filename |
|---|---|
| 8-K - RAYONIER ADVANCED MATERIALS INC. | 8k.htm |
Exhibit 99.1
Investor PresentationJune 2018
Safe Harbor Certain statements in this document regarding anticipated financial, business, legal or other outcomes including business and market conditions, outlook and other similar statements relating to Rayonier Advanced Materials’ future events, developments, or financial or operational performance or results, are “forward-looking statements” made pursuant to the safe harbor provisions of the Private Securities Litigation Reform Act of 1995 and other federal securities laws. These forward-looking statements are identified by the use of words such as “may,” “will,” “should,” “expect,” “estimate,” “believe,” “intend,” “forecast,” “anticipate,” “guidance,” and other similar language. However, the absence of these or similar words or expressions does not mean a statement is not forward-looking. While we believe these forward-looking statements are reasonable when made, forward-looking statements are not guarantees of future performance or events and undue reliance should not be placed on these statements. Although we believe the expectations reflected in any forward-looking statements are based on reasonable assumptions, we can give no assurance these expectations will be attained and it is possible actual results may differ materially from those indicated by these forward-looking statements due to a variety of risks and uncertainties.Our operations are subject to a number of risks and uncertainties including, but not limited to, those listed below. When considering an investment in our securities, you should carefully read and consider these risks, together with all other information in our Annual Report on Form 10-K and our other filings and submissions to the SEC, which provide much more information and detail on the risks described below. If any of the events described in the following risk factors actually occur, our business, financial condition or operating results, as well as the market price of our securities, could be materially adversely affected. These risks and events include, without limitation: Our businesses we operate are highly competitive and many of them are cyclical, which may result in fluctuations in pricing and volume that can adversely impact our business, financial condition and results of operations; Our ten largest customers represent approximately 38% of our pro forma 2017 revenue, and the loss of all or a substantial portion of our revenue from these large customers could have a material adverse effect on us; A material disruption at one of our major manufacturing facilities could prevent us from meeting customer demand, reduce our sales and profitability, increase our cost of production and capital needs, or otherwise adversely affect our business, financial condition and results of operation; Changes in raw material and energy availability and prices could affect our results of operations and financial condition; The availability of, and prices for, wood fiber may significantly impact our business, results of operations and financial condition; We are subject to risks associated with manufacturing and selling products and otherwise doing business outside of the United States; Our operations require substantial capital for ongoing maintenance, repair and replacement of existing facilities and equipment; Currency fluctuations may have a negative impact on our business, financial condition and results of operations; Restrictions on trade through tariffs, countervailing and anti-dumping duties, quotas and other trade barriers, in the United States and internationally, could adversely affect our ability to access certain markets; We depend on third parties for transportation services and increases in costs and the availability of transportation could adversely affect our business; Our business is subject to extensive environmental laws, regulations and permits that may restrict or adversely affect our ability to conduct our business; The impacts of climate-related initiatives remain uncertain at this time; Our failure to maintain satisfactory labor relations could have a material adverse effect on our business; We are dependent upon attracting and retaining key personnel, the loss of whom could adversely affect our business; Failure to develop new products or discover new applications for our existing products, or our inability to protect the intellectual property underlying such new products or applications, could have a negative impact on our business; Risk of loss of the Company’s intellectual property and sensitive business information, or disruption of its manufacturing operations, in each case due to cyberattacks or cyber security breaches, could adversely impact the Company; We may need to make significant additional cash contributions to our retirement benefit plans if investment returns on pension assets are lower than expected or interest rates decline, and/or due to changes to regulatory, accounting and actuarial requirements; We have significant debt obligations that could adversely affect our business and our ability to meet our obligations; Challenges in the commercial and credit environments may materially adversely affect our future access to capital; We may need additional financing in the future to meet our capital needs or to make acquisitions, and such financing may not be available on favorable terms, if at all, and may be dilutive to existing stockholders; The inability to effectively integrate the Tembec acquisition, and any future acquisitions we may make, may affect our results; and, we may not achieve the benefits anticipated from our previously-announced transformation plan. Other important factors that could cause actual results or events to differ materially from those expressed in forward-looking statements that may have been made in this document are described or will be described in our filings with the U.S. Securities and Exchange Commission, including our Annual Report on Form 10-K and Quarterly Reports on Form 10-Q. Rayonier Advanced Materials assumes no obligation to update these statements except as is required by law. 2
Non-GAAP Financial Measures These presentation materials contain certain non-GAAP financial measures, including EBITDA, adjusted free cash flows, adjusted operating income, adjusted net income and adjusted net debt. These non-GAAP measures are reconciled to each of their respective most directly comparable GAAP financial measures in the appendix of these presentation materials.We believe these non-GAAP measures provide useful information to our board of directors, management and investors regarding certain trends relating to our financial condition and results of operations. Our management uses these non-GAAP measures to compare our performance to that of prior periods for trend analyses, purposes of determining management incentive compensation and budgeting, forecasting and planning purposes. We do not consider these non-GAAP measures an alternative to financial measures determined in accordance with GAAP. The principal limitations of these non-GAAP financial measures are that they may exclude significant expenses and income items that are required by GAAP to be recognized in our consolidated financial statements. In addition, they reflect the exercise of management’s judgment about which expenses and income items are excluded or included in determining these non-GAAP financial measures. In order to compensate for these limitations, management provides reconciliations of the non-GAAP financial measures we use to their most directly comparable GAAP measures. Non-GAAP financial measures should not be relied upon, in whole or part, in evaluating the financial condition, results of operations or future prospects of the Company. 3
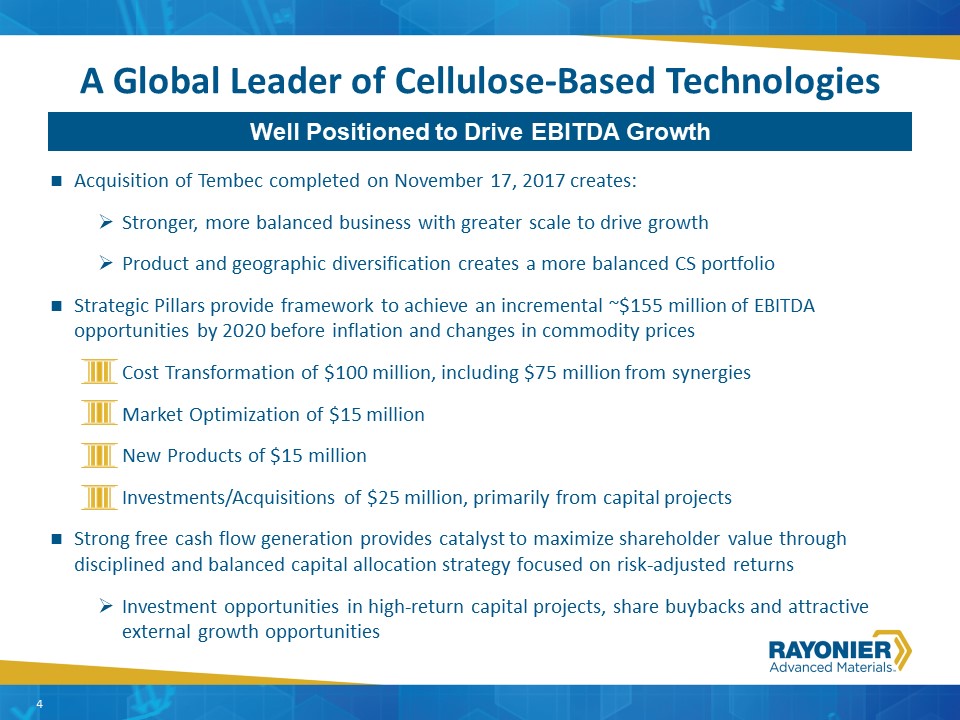
Granite Considerations---Granite Overview A Global Leader of Cellulose-Based Technologies Acquisition of Tembec completed on November 17, 2017 creates:Stronger, more balanced business with greater scale to drive growthProduct and geographic diversification creates a more balanced CS portfolioStrategic Pillars provide framework to achieve an incremental ~$155 million of EBITDA opportunities by 2020 before inflation and changes in commodity pricesCost Transformation of $100 million, including $75 million from synergiesMarket Optimization of $15 millionNew Products of $15 millionInvestments/Acquisitions of $25 million, primarily from capital projectsStrong free cash flow generation provides catalyst to maximize shareholder value through disciplined and balanced capital allocation strategy focused on risk-adjusted returnsInvestment opportunities in high-return capital projects, share buybacks and attractive external growth opportunities Well Positioned to Drive EBITDA Growth 4
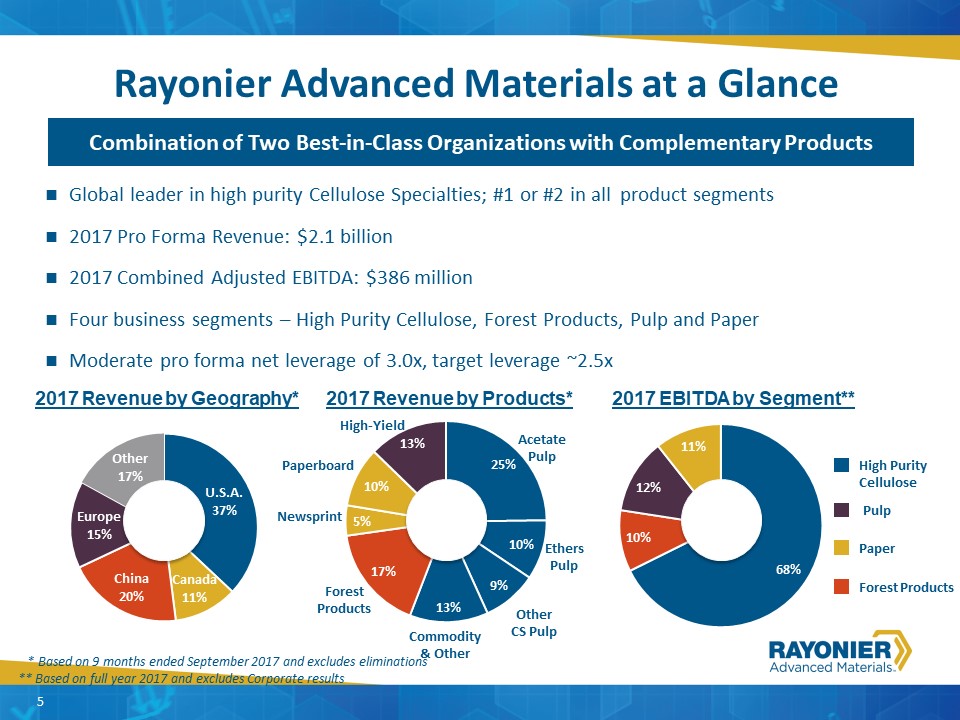
Granite Considerations---Granite Overview 5 Rayonier Advanced Materials at a Glance Global leader in high purity Cellulose Specialties; #1 or #2 in all product segments2017 Pro Forma Revenue: $2.1 billion 2017 Combined Adjusted EBITDA: $386 million Four business segments – High Purity Cellulose, Forest Products, Pulp and PaperModerate pro forma net leverage of 3.0x, target leverage ~2.5x Combination of Two Best-in-Class Organizations with Complementary Products 2017 EBITDA by Segment** 2017 Revenue by Products* 2017 Revenue by Geography* Commodity & Other Other CS Pulp Ethers Pulp High Purity Cellulose Forest Products Acetate Pulp High-Yield Newsprint Paperboard Forest Products Paper Pulp * Based on 9 months ended September 2017 and excludes eliminations** Based on full year 2017 and excludes Corporate results
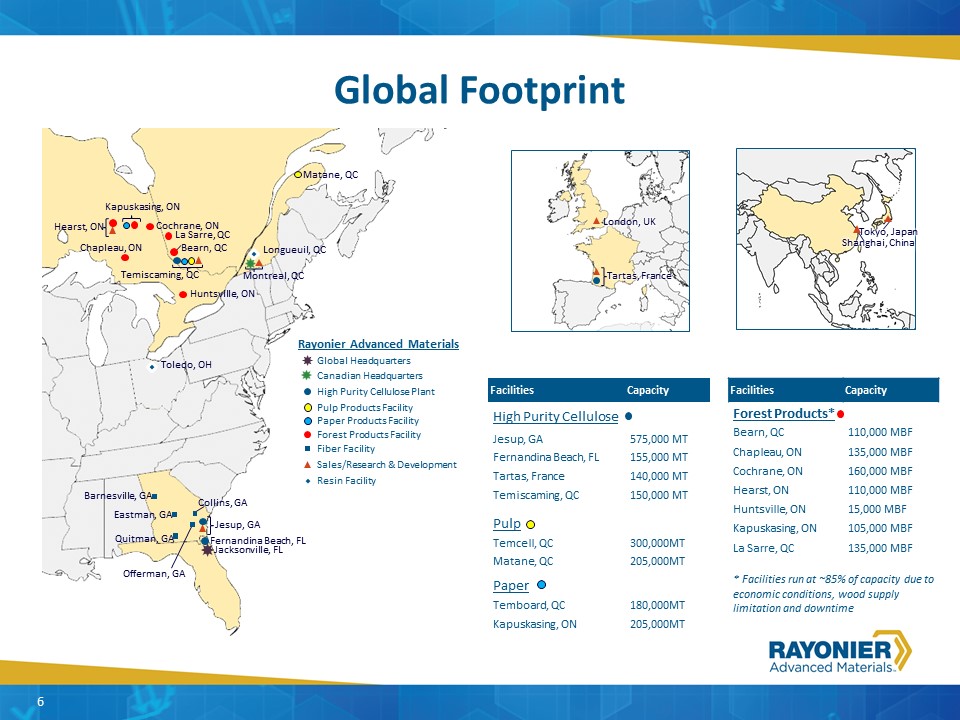
Global Footprint Rayonier Advanced Materials Global Headquarters Facilities Capacity Forest Products* Bearn, QC 110,000 MBF Chapleau, ON 135,000 MBF Cochrane, ON 160,000 MBF Hearst, ON 110,000 MBF Huntsville, ON 15,000 MBF Kapuskasing, ON 105,000 MBF La Sarre, QC 135,000 MBF Facilities Capacity High Purity Cellulose Jesup, GA 575,000 MT Fernandina Beach, FL 155,000 MT Tartas, France 140,000 MT Temiscaming, QC 150,000 MT Pulp Temcell, QC 300,000MT Matane, QC 205,000MT Paper Temboard, QC 180,000MT Kapuskasing, ON 205,000MT Barnesville, GA Eastman, GA Quitman, GA Offerman, GA Collins, GA Jacksonville, FL Jesup, GA Fernandina Beach, FL Temiscaming, QC Matane, QC Kapuskasing, ON Bearn, QC Chapleau, ON Cochrane, ON Hearst, ON Huntsville, ON La Sarre, QC Fiber Facility Sales/Research & Development Montreal, QC Forest Products Facility Pulp Products Facility High Purity Cellulose Plant Tartas, France London, UK Canadian Headquarters Shanghai, China Tokyo, Japan 6 * Facilities run at ~85% of capacity due to economic conditions, wood supply limitation and downtime Resin Facility Longueuil, QC Toledo, OH Paper Products Facility
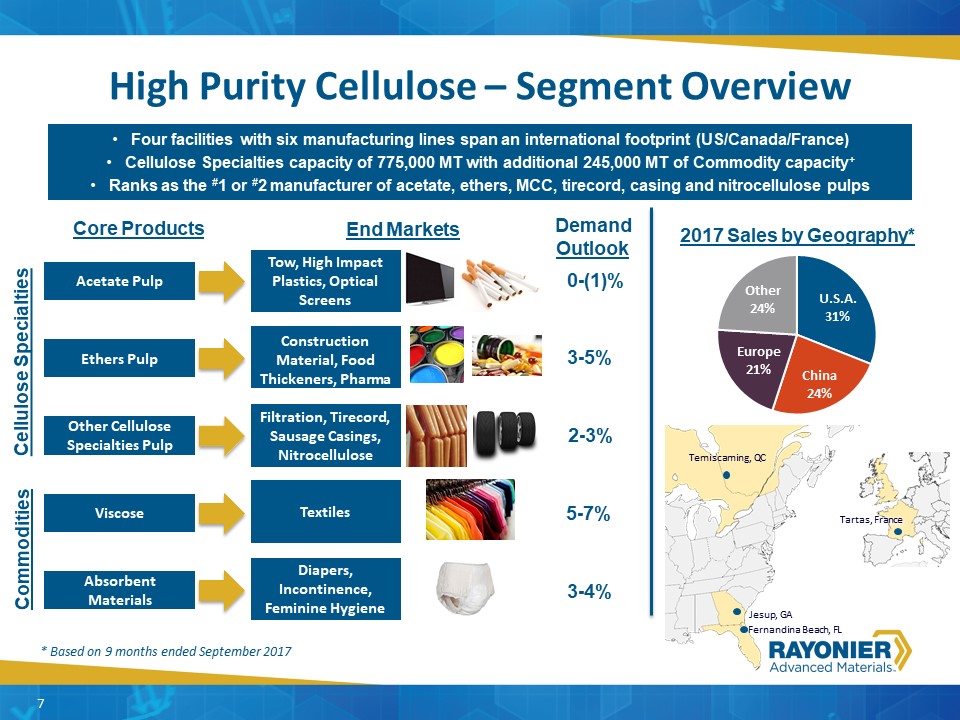
High Purity Cellulose – Segment Overview 7 Core Products End Markets Acetate Pulp Tow, High Impact Plastics, Optical Screens Ethers Pulp Construction Material, Food Thickeners, Pharma Other Cellulose Specialties Pulp Filtration, Tirecord, Sausage Casings, Nitrocellulose Viscose Textiles Absorbent Materials Diapers, Incontinence, Feminine Hygiene Four facilities with six manufacturing lines span an international footprint (US/Canada/France)Cellulose Specialties capacity of 775,000 MT with additional 245,000 MT of Commodity capacity+Ranks as the #1 or #2 manufacturer of acetate, ethers, MCC, tirecord, casing and nitrocellulose pulps 2017 Sales by Geography* * Based on 9 months ended September 2017 Jesup, GA Fernandina Beach, FL Temiscaming, QC Tartas, France Cellulose Specialties Commodities Demand Outlook 0-(1)% 3-5% 2-3% 5-7% 3-4%
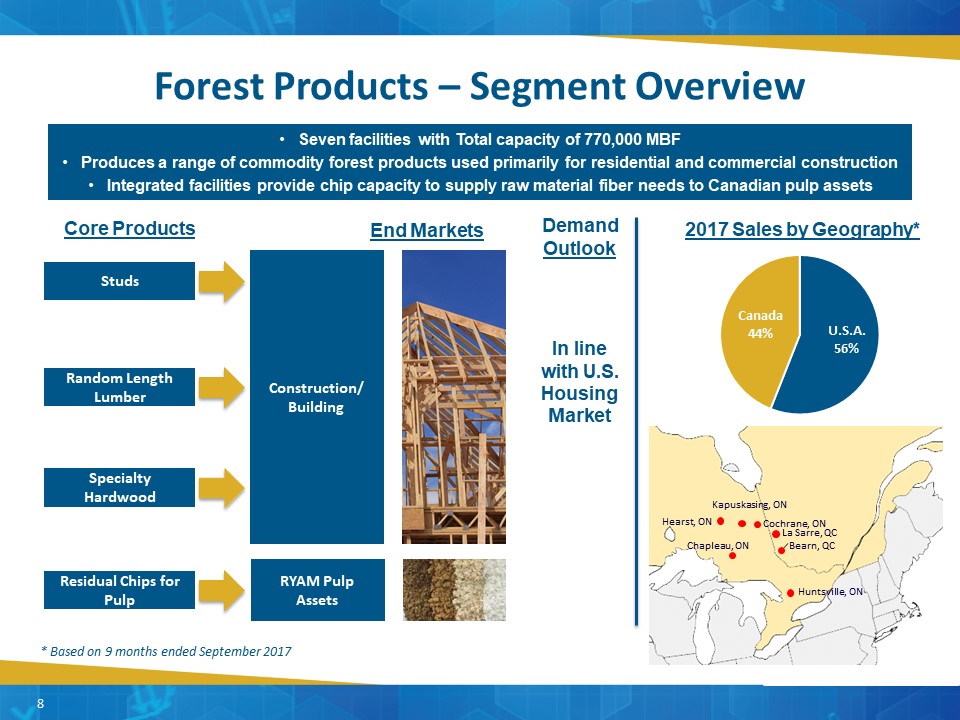
2017 Sales by Geography* Forest Products – Segment Overview 8 Core Products End Markets Studs Random Length Lumber Specialty Hardwood Residual Chips for Pulp Seven facilities with Total capacity of 770,000 MBFProduces a range of commodity forest products used primarily for residential and commercial constructionIntegrated facilities provide chip capacity to supply raw material fiber needs to Canadian pulp assets Construction/Building RYAM Pulp Assets Kapuskasing, ON Bearn, QC Chapleau, ON Cochrane, ON Huntsville, ON La Sarre, QC Hearst, ON Demand Outlook In line with U.S. Housing Market * Based on 9 months ended September 2017
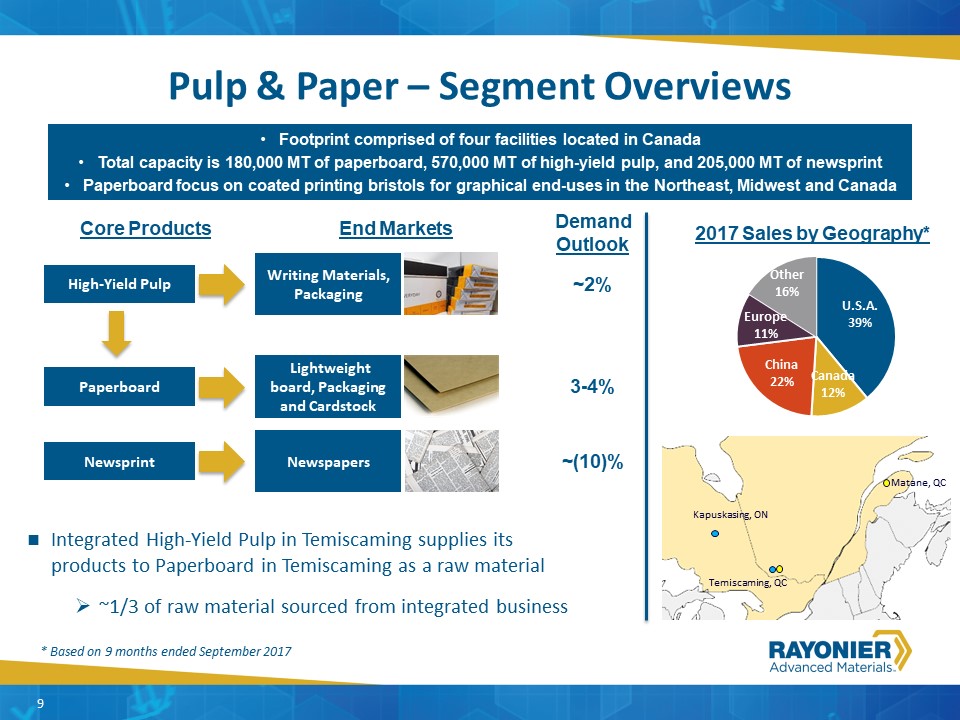
Pulp & Paper – Segment Overviews 9 Core Products End Markets Paperboard Lightweight board, Packaging and Cardstock High-Yield Pulp Writing Materials, Packaging Newsprint Newspapers Footprint comprised of four facilities located in CanadaTotal capacity is 180,000 MT of paperboard, 570,000 MT of high-yield pulp, and 205,000 MT of newsprintPaperboard focus on coated printing bristols for graphical end-uses in the Northeast, Midwest and Canada 2017 Sales by Geography* Integrated High-Yield Pulp in Temiscaming supplies its products to Paperboard in Temiscaming as a raw material~1/3 of raw material sourced from integrated business 9 Temiscaming, QC Matane, QC Kapuskasing, ON Demand Outlook 3-4% ~2% ~(10)% * Based on 9 months ended September 2017
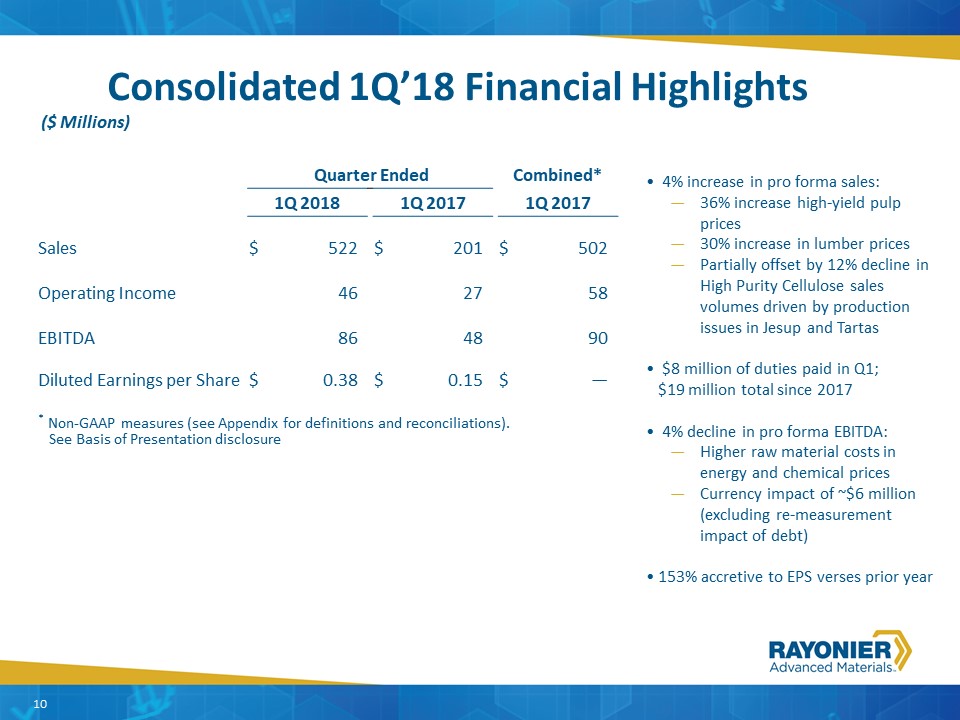
Quarter Ended Quarter Ended Combined* Pro Forma2 1Q 2018 1Q 2018 1Q 2017 1Q 2017 1Q 2017 1Q 2017 Sales $ 522 $ 201 $ 502 Operating Income 46 27 58 EBITDA 86 48 90 Diluted Earnings per Share $ 0.38 $ 0.15 $ — * Non-GAAP measures (see Appendix for definitions and reconciliations). See Basis of Presentation disclosure 10 Consolidated 1Q’18 Financial Highlights ($ Millions) 4% increase in pro forma sales:36% increase high-yield pulp prices30% increase in lumber pricesPartially offset by 12% decline in High Purity Cellulose sales volumes driven by production issues in Jesup and Tartas $8 million of duties paid in Q1;$19 million total since 2017 4% decline in pro forma EBITDA:Higher raw material costs in energy and chemical pricesCurrency impact of ~$6 million (excluding re-measurement impact of debt)153% accretive to EPS verses prior year
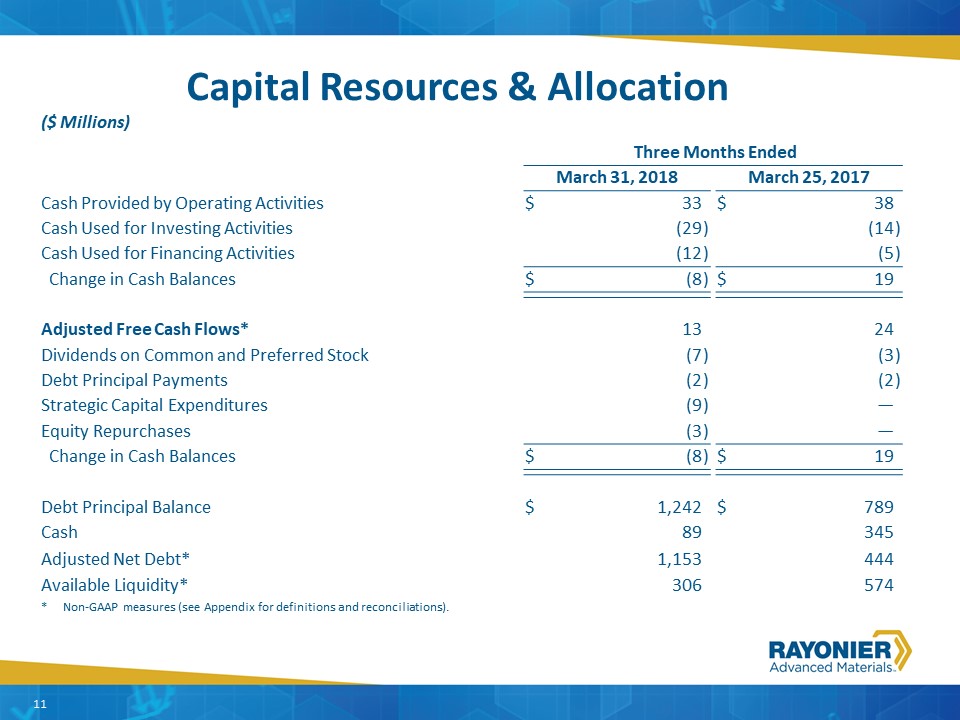
Capital Resources & Allocation 11 ($ Millions) Three Months Ended Three Months Ended March 31, 2018 March 31, 2018 March 25, 2017 March 25, 2017 Cash Provided by Operating Activities $ 33 $ 38 Cash Used for Investing Activities (29 ) (14 ) Cash Used for Financing Activities (12 ) (5 ) Change in Cash Balances $ (8 ) $ 19 Adjusted Free Cash Flows* 13 24 Dividends on Common and Preferred Stock (7 ) (3 ) Debt Principal Payments (2 ) (2 ) Strategic Capital Expenditures (9 ) — Equity Repurchases (3 ) — Change in Cash Balances $ (8 ) $ 19 Debt Principal Balance $ 1,242 $ 789 Cash 89 345 Adjusted Net Debt* 1,153 444 Available Liquidity* 306 574 * Non-GAAP measures (see Appendix for definitions and reconciliations).
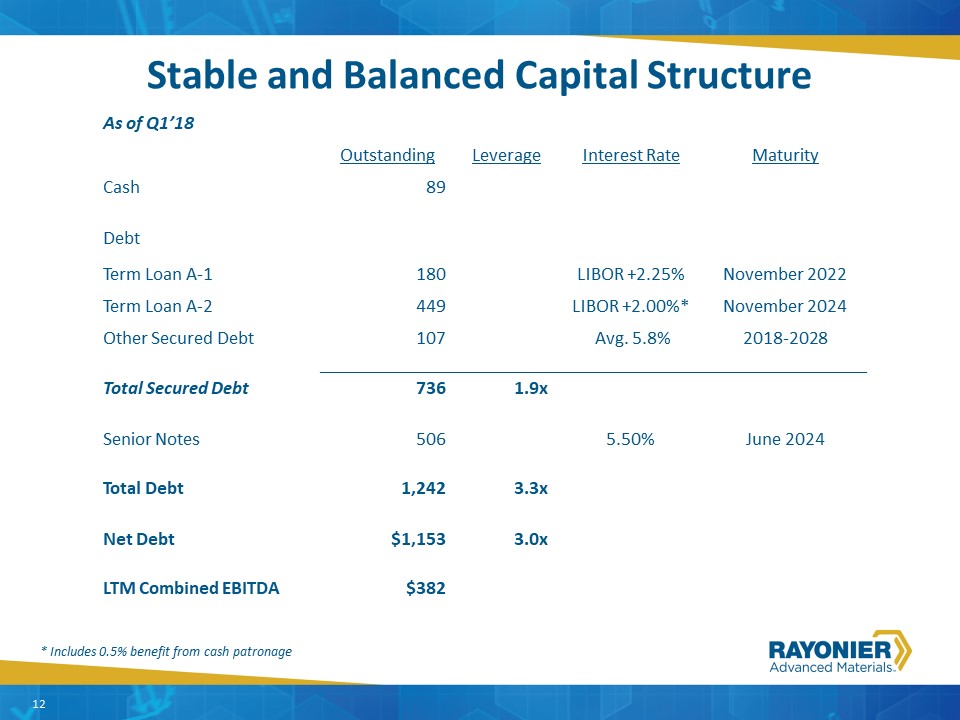
Stable and Balanced Capital Structure As of Q1’18 Outstanding Leverage Interest Rate Maturity Cash 89 Debt Term Loan A-1 180 LIBOR +2.25% November 2022 Term Loan A-2 449 LIBOR +2.00%* November 2024 Other Secured Debt 107 Avg. 5.8% 2018-2028 Total Secured Debt 736 1.9x Senior Notes 506 5.50% June 2024 Total Debt 1,242 3.3x Net Debt $1,153 3.0x LTM Combined EBITDA $382 12 * Includes 0.5% benefit from cash patronage
Granite Considerations---Granite Overview Efficient Tax Structure U.S. Tax reform expected to provide significant benefitsCanadian NOLs generated by Tembec from integrated business model maintained through acquisitionEfficient tax structure supports increased cash flow generationUltimate tax rate to be determined by profitability in various jurisdictions 13 Anticipated annual tax rate of 25-30% with cash taxes of ~10% for the next three years
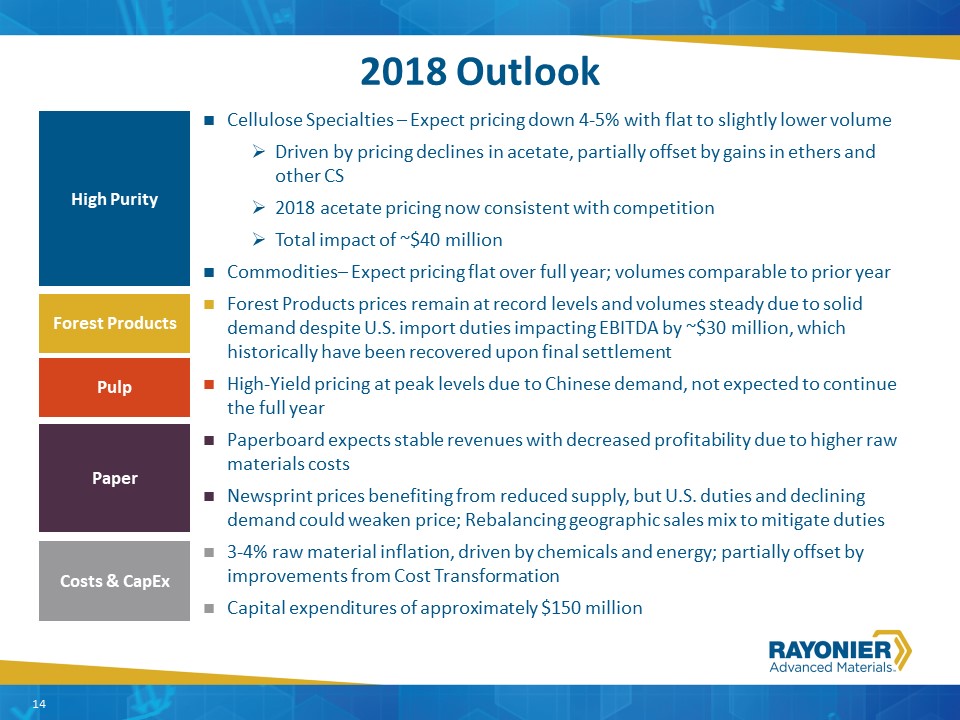
Cellulose Specialties – Expect pricing down 4-5% with flat to slightly lower volumeDriven by pricing declines in acetate, partially offset by gains in ethers and other CS2018 acetate pricing now consistent with competitionTotal impact of ~$40 millionCommodities– Expect pricing flat over full year; volumes comparable to prior year Forest Products prices remain at record levels and volumes steady due to solid demand despite U.S. import duties impacting EBITDA by ~$30 million, which historically have been recovered upon final settlementHigh-Yield pricing at peak levels due to Chinese demand, not expected to continue the full year Paperboard expects stable revenues with decreased profitability due to higher raw materials costsNewsprint prices benefiting from reduced supply, but U.S. duties and declining demand could weaken price; Rebalancing geographic sales mix to mitigate duties 3-4% raw material inflation, driven by chemicals and energy; partially offset by improvements from Cost Transformation Capital expenditures of approximately $150 million 2018 Outlook 14 High Purity Forest Products Paper Costs & CapEx Pulp
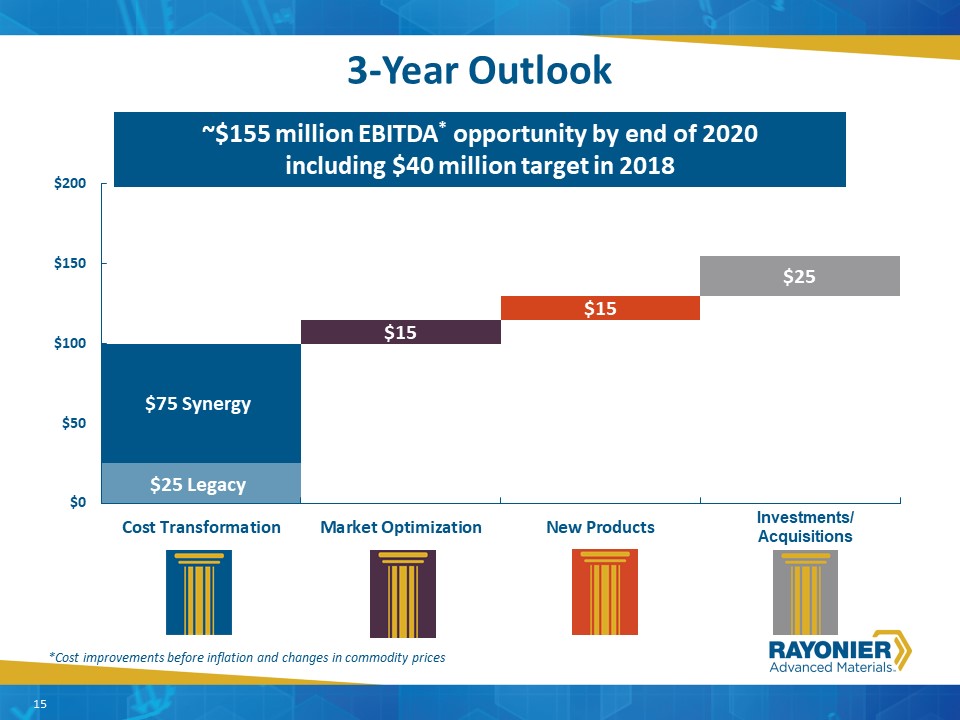
3-Year Outlook 15 *Cost improvements before inflation and changes in commodity prices ~$155 million EBITDA* opportunity by end of 2020including $40 million target in 2018 $25 Legacy $75 Synergy Investments/ Acquisitions
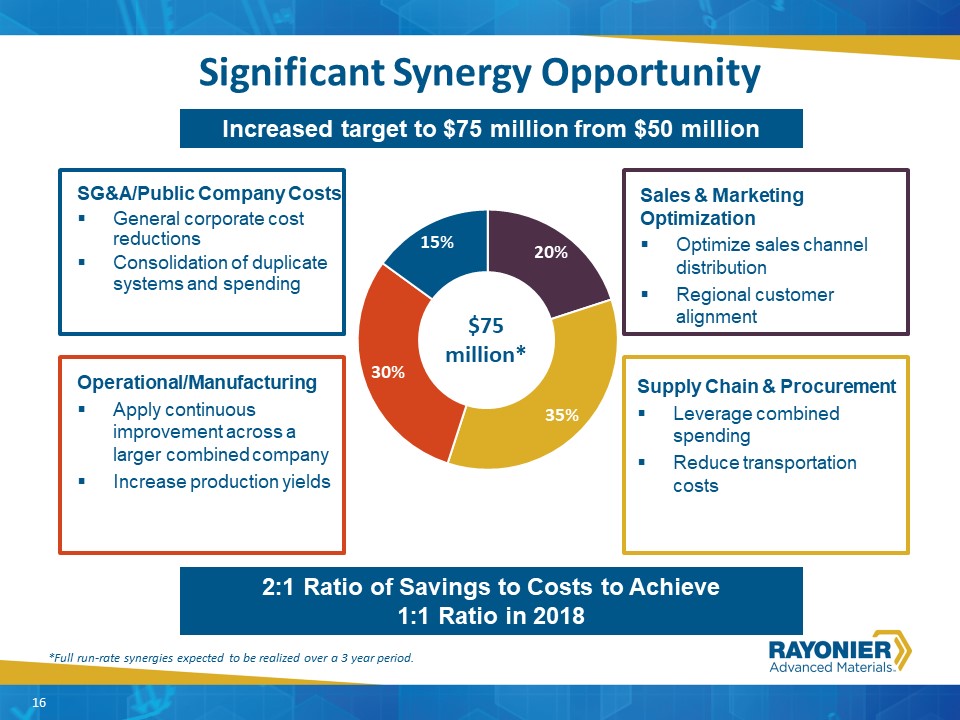
Granite Considerations---Granite Overview 16 Significant Synergy Opportunity SG&A/Public Company CostsGeneral corporate cost reductionsConsolidation of duplicate systems and spending Supply Chain & ProcurementLeverage combined spendingReduce transportation costs Operational/ManufacturingApply continuous improvement across a larger combined companyIncrease production yields 2:1 Ratio of Savings to Costs to Achieve1:1 Ratio in 2018 *Full run-rate synergies expected to be realized over a 3 year period. Sales & Marketing OptimizationOptimize sales channel distributionRegional customer alignment $75 million* Increased target to $75 million from $50 million
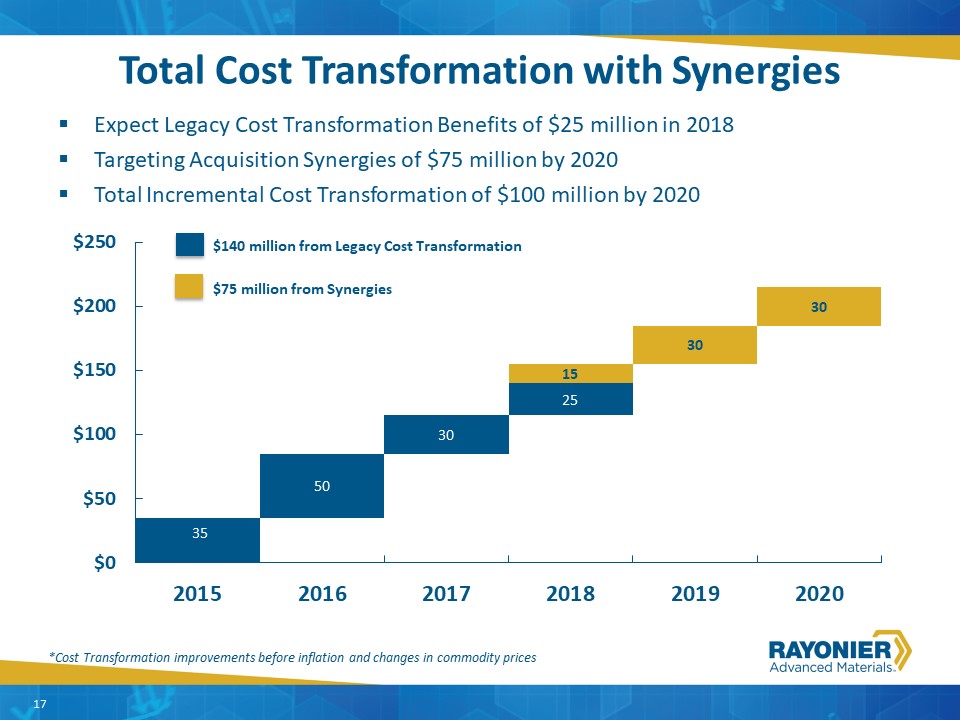
Total Cost Transformation with Synergies Expect Legacy Cost Transformation Benefits of $25 million in 2018Targeting Acquisition Synergies of $75 million by 2020Total Incremental Cost Transformation of $100 million by 2020 17 *Cost Transformation improvements before inflation and changes in commodity prices
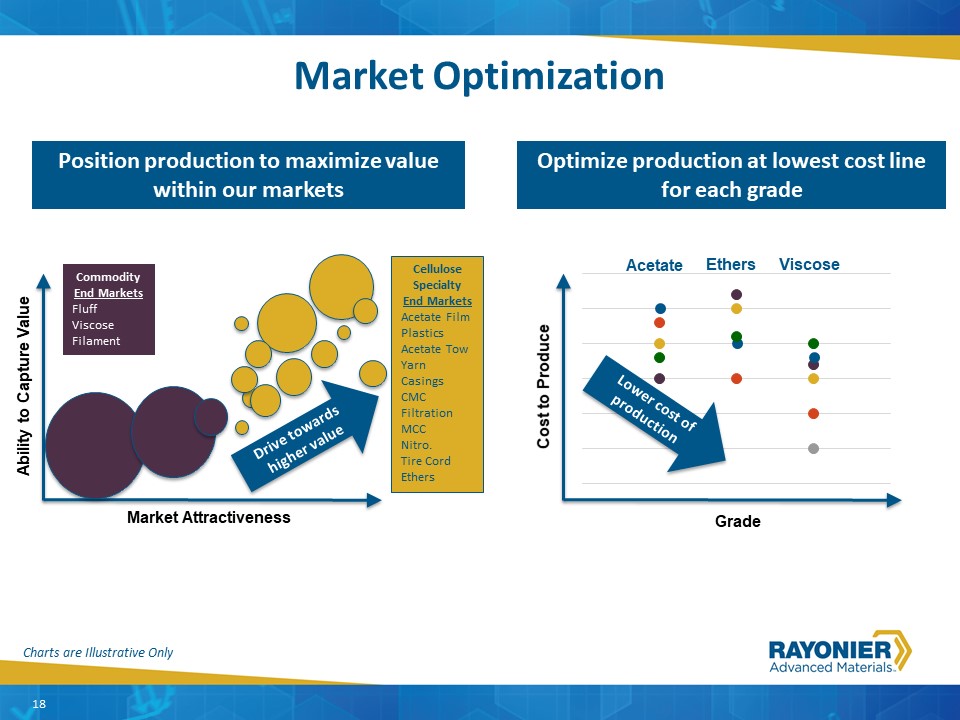
Market Optimization Position production to maximize value within our markets Ability to Capture Value Market Attractiveness Cellulose Specialty End MarketsAcetate FilmPlasticsAcetate TowYarnCasingsCMCFiltrationMCCNitro.Tire CordEthers CommodityEnd MarketsFluffViscoseFilament Drive towards higher value Optimize production at lowest cost line for each grade Cost to Produce Grade Acetate Charts are Illustrative Only Ethers Viscose Lower cost of production 18
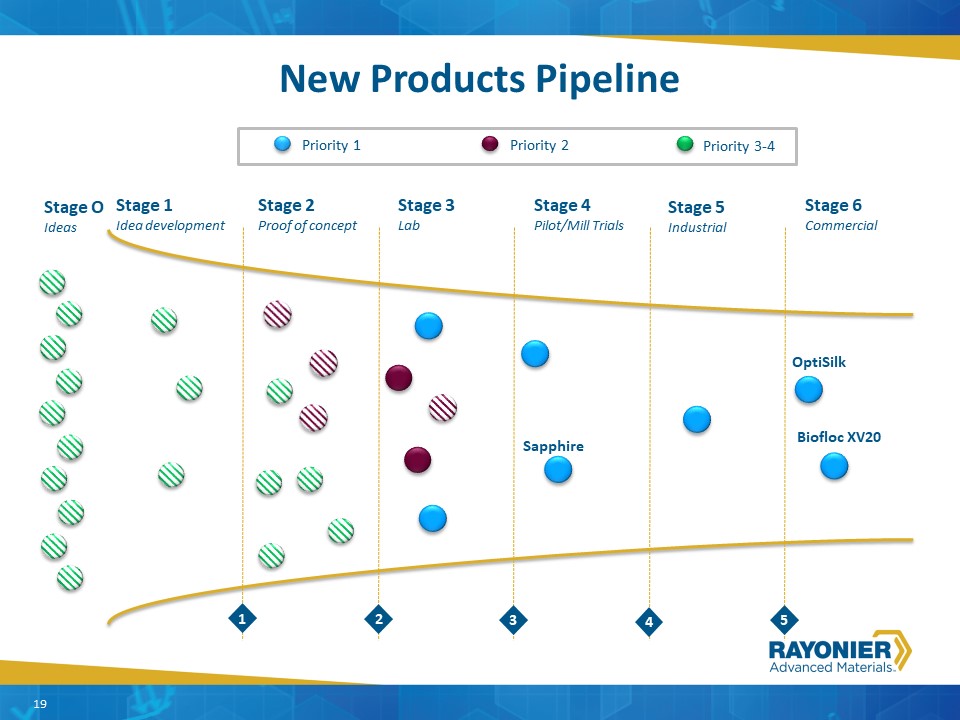
New Products Pipeline 19 Stage 1Idea development Stage 2Proof of concept Stage 3Lab Stage 4Pilot/Mill Trials Stage 5Industrial Stage 6Commercial 1 2 3 4 5 Priority 1 Priority 2 Priority 3-4 OptiSilk Sapphire Stage OIdeas Biofloc XV20 19
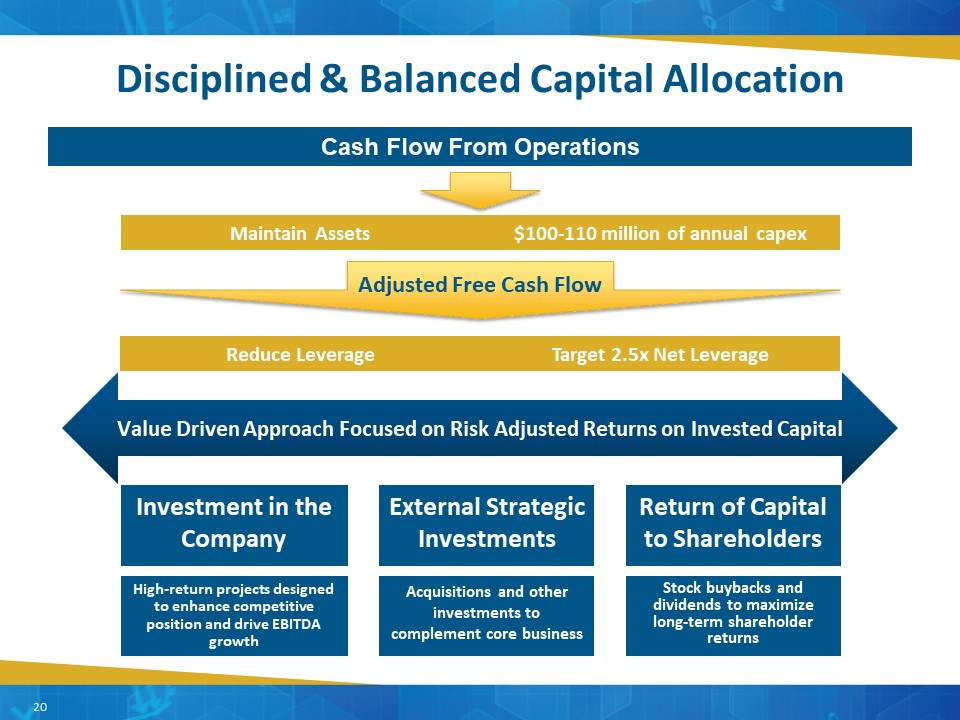
Disciplined & Balanced Capital Allocation Maintain Assets $100-110 million of annual capex Adjusted Free Cash Flow Return of Capital to Shareholders Stock buybacks and dividends to maximize long-term shareholder returns External Strategic Investments Acquisitions and other investments to complement core business Investment in the Company High-return projects designed to enhance competitive position and drive EBITDA growth 20 Reduce Leverage Target 2.5x Net Leverage Value Driven Approach Focused on Risk Adjusted Returns on Invested Capital Cash Flow From Operations
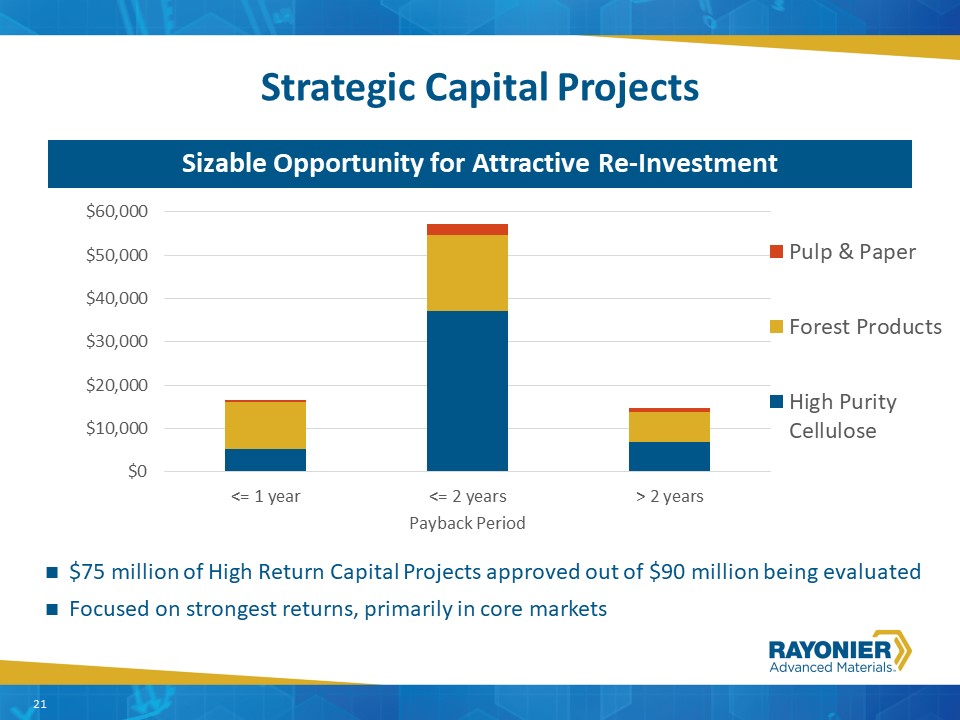
Strategic Capital Projects Sizable Opportunity for Attractive Re-Investment $75 million of High Return Capital Projects approved out of $90 million being evaluatedFocused on strongest returns, primarily in core markets 21
Granite Considerations---Granite Overview Return of Capital to Shareholders RYAM currently pays a $0.07 quarterly dividend per share of common stock On January 29, 2018, the Board of Directors authorized a $100 million share buybackCompany is committed to growing and maximizing long-term shareholder value including prudent return of capital to shareholders Dividend Policy and Share Buyback Authorization 22
Appendix
EBITDA is defined as earnings before interest, taxes, depreciation and amortization. EBITDA is a non-GAAP measure used by our Chief Operating Decision Maker, existing stockholders and potential stockholders to measure how the Company is performing relative to the assets under management. Adjusted EBITDA is defined as EBITDA before acquisition related costs, inventory fair value adjustment, gain on bargain purchase, loss (gain) on derivative instrument, and gain on debt extinguishment.Adjusted Free Cash Flows is defined as cash provided by operating activities adjusted for capital expenditures excluding strategic capital and acquisition related costs, net of tax. Adjusted free cash flows is a non-GAAP measure of cash generated during a period which is available for dividend distribution, debt reduction, strategic acquisitions and repurchase of our common stock. Adjusted free cash flows is not necessarily indicative of the adjusted free cash flows that may be generated in future periods. Adjusted Net Debt is defined as the amount of debt after the consideration of the original issue discount, premiums, and debt issuance costs, less cash. Adjusted net debt is a non-GAAP measure of debt and is not necessarily indicative of the adjusted net debt that may occur in future periods.Adjusted Operating Income is defined as operating income adjusted for acquisition related costs and fair market valuation of inventory.Adjusted Net Income is defined as net income adjusted net of tax for gain on debt extinguishment, gain on bargain purchase, acquisition related costs, fair market valuation of inventory, and loss (gain) on derivative.Available Liquidity is defined as the funds available under the revolving credit facility and term loans, adjusted for cash on hand and outstanding letters of credit. Definitions of Non-GAAP Measures 24
Combined net sales and operating income (loss) represents the combination of Tembec’s net sales and operating earnings for the respective periods presented, adjusted to reflect the estimated conversion from International Financial Reporting Standards to U.S. Generally Accepted Accounting Principles for certain material amounts and translated at the historical quarterly average exchange rates, with the Company’s comparable periods net sales and operating income. The adjustments represent the Company’s best estimates and are subject to change should additional information become available. Operating income for the fourth quarter contains the impact of additional depreciation associated with the write-up of property, plant and equipment and amortization of acquired intangible assets.Combined EBITDA represents the combination of Tembec’s reported adjusted EBITDA for the respective periods translated at the historical quarterly average exchange rate, with the Company’s comparable adjusted EBITDA. The combined net sales, operating results and EBITDA of the Company and Tembec are presented for illustrative purposes only and do not necessarily reflect the net sales, operating results or EBITDA that would have resulted had the acquisition occurred for the period, nor project the results of operations for any future date or period. Basis of Presentation of 2017 Combined Historical Financial Information 25
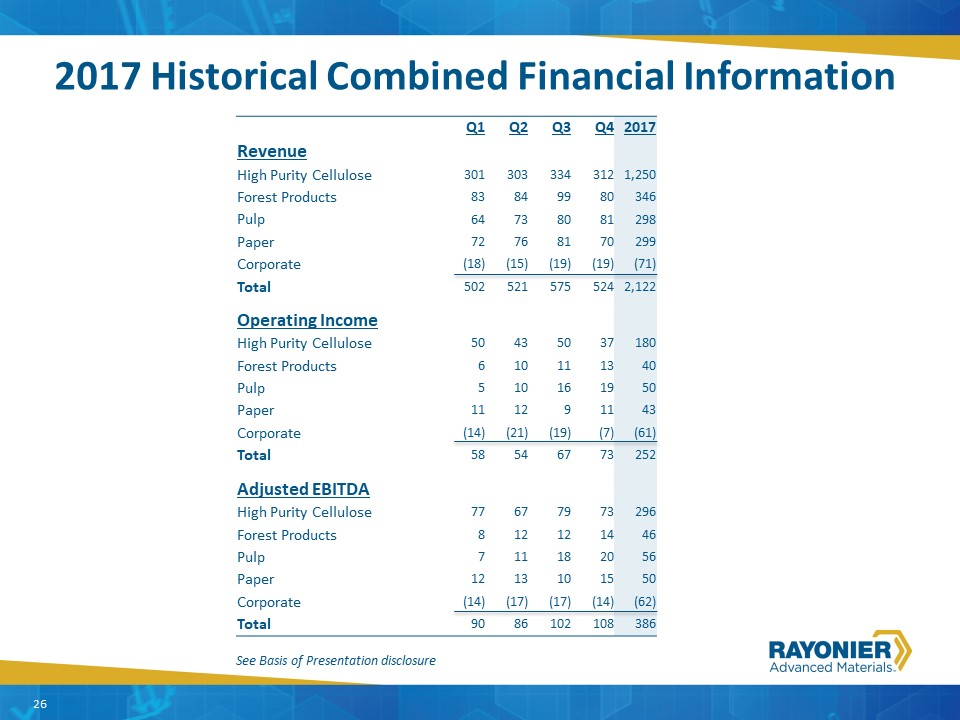
2017 Historical Combined Financial Information Q1 Q2 Q3 Q4 2017 Revenue High Purity Cellulose 301 303 334 312 1,250 Forest Products 83 84 99 80 346 Pulp 64 73 80 81 298 Paper 72 76 81 70 299 Corporate (18) (15) (19) (19) (71) Total 502 521 575 524 2,122 Operating Income High Purity Cellulose 50 43 50 37 180 Forest Products 6 10 11 13 40 Pulp 5 10 16 19 50 Paper 11 12 9 11 43 Corporate (14) (21) (19) (7) (61) Total 58 54 67 73 252 Adjusted EBITDA High Purity Cellulose 77 67 79 73 296 Forest Products 8 12 12 14 46 Pulp 7 11 18 20 56 Paper 12 13 10 15 50 Corporate (14) (17) (17) (14) (62) Total 90 86 102 108 386 See Basis of Presentation disclosure 26
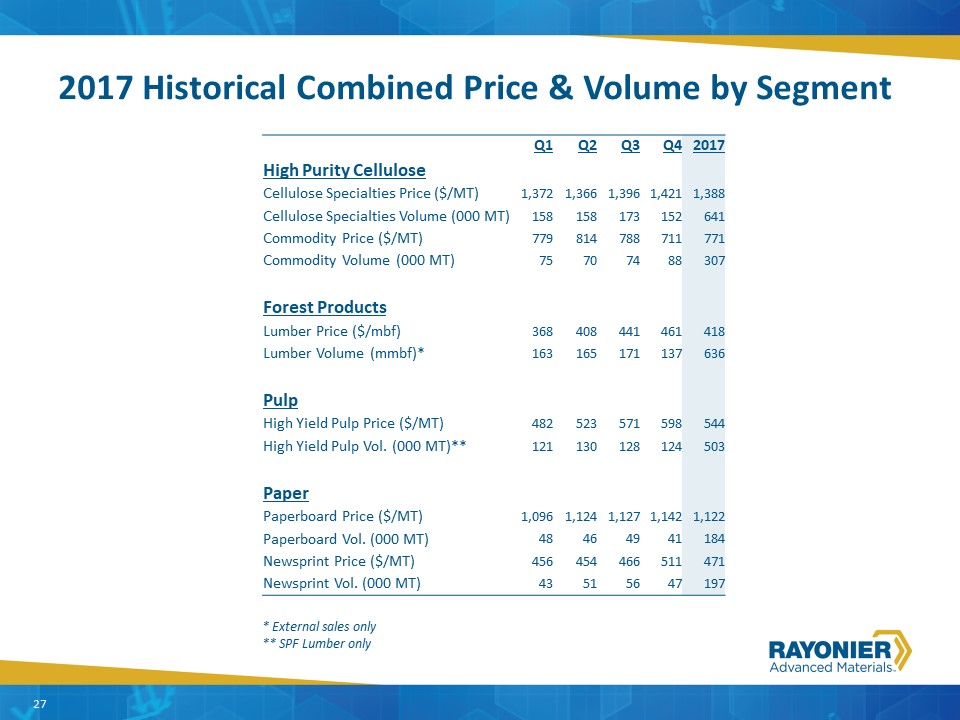
2017 Historical Combined Price & Volume by Segment Q1 Q2 Q3 Q4 2017 High Purity Cellulose Cellulose Specialties Price ($/MT) 1,372 1,366 1,396 1,421 1,388 Cellulose Specialties Volume (000 MT) 158 158 173 152 641 Commodity Price ($/MT) 779 814 788 711 771 Commodity Volume (000 MT) 75 70 74 88 307 Forest Products Lumber Price ($/mbf) 368 408 441 461 418 Lumber Volume (mmbf)* 163 165 171 137 636 Pulp High Yield Pulp Price ($/MT) 482 523 571 598 544 High Yield Pulp Vol. (000 MT)** 121 130 128 124 503 Paper Paperboard Price ($/MT) 1,096 1,124 1,127 1,142 1,122 Paperboard Vol. (000 MT) 48 46 49 41 184 Newsprint Price ($/MT) 456 454 466 511 471 Newsprint Vol. (000 MT) 43 51 56 47 197 27 * External sales only** SPF Lumber only
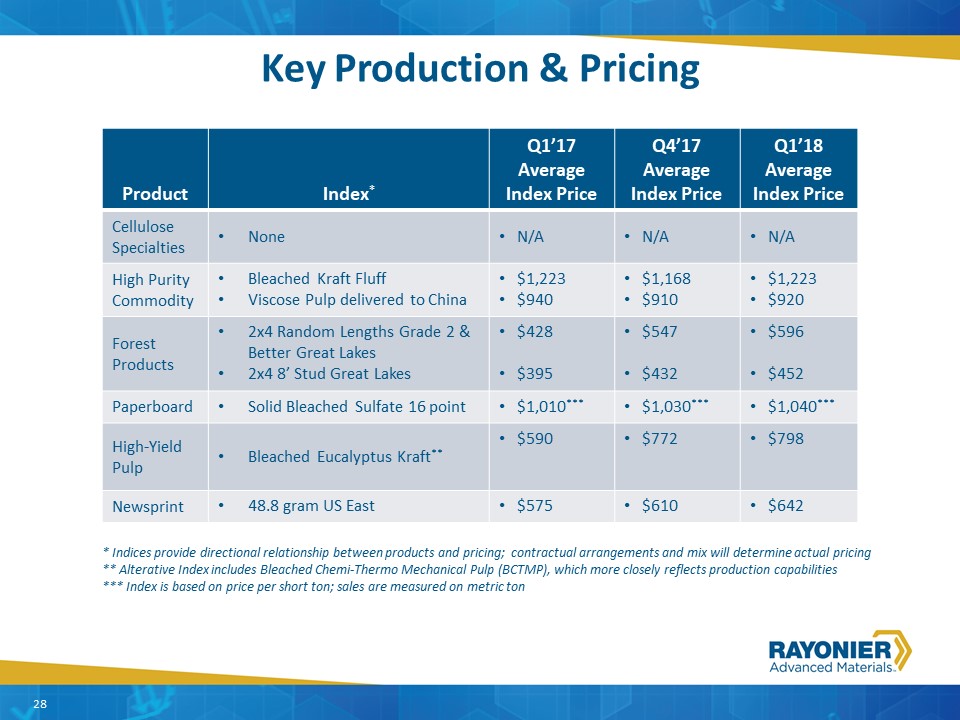
28 Key Production & Pricing * Indices provide directional relationship between products and pricing; contractual arrangements and mix will determine actual pricing** Alterative Index includes Bleached Chemi-Thermo Mechanical Pulp (BCTMP), which more closely reflects production capabilities*** Index is based on price per short ton; sales are measured on metric ton Product Index* Q1’17 Average Index Price Q4’17 Average Index Price Q1’18 Average Index Price Cellulose Specialties None N/A N/A N/A High Purity Commodity Bleached Kraft FluffViscose Pulp delivered to China $1,223$940 $1,168$910 $1,223$920 Forest Products 2x4 Random Lengths Grade 2 & Better Great Lakes2x4 8’ Stud Great Lakes $428$395 $547$432 $596$452 Paperboard Solid Bleached Sulfate 16 point $1,010*** $1,030*** $1,040*** High-Yield Pulp Bleached Eucalyptus Kraft** $590 $772 $798 Newsprint 48.8 gram US East $575 $610 $642
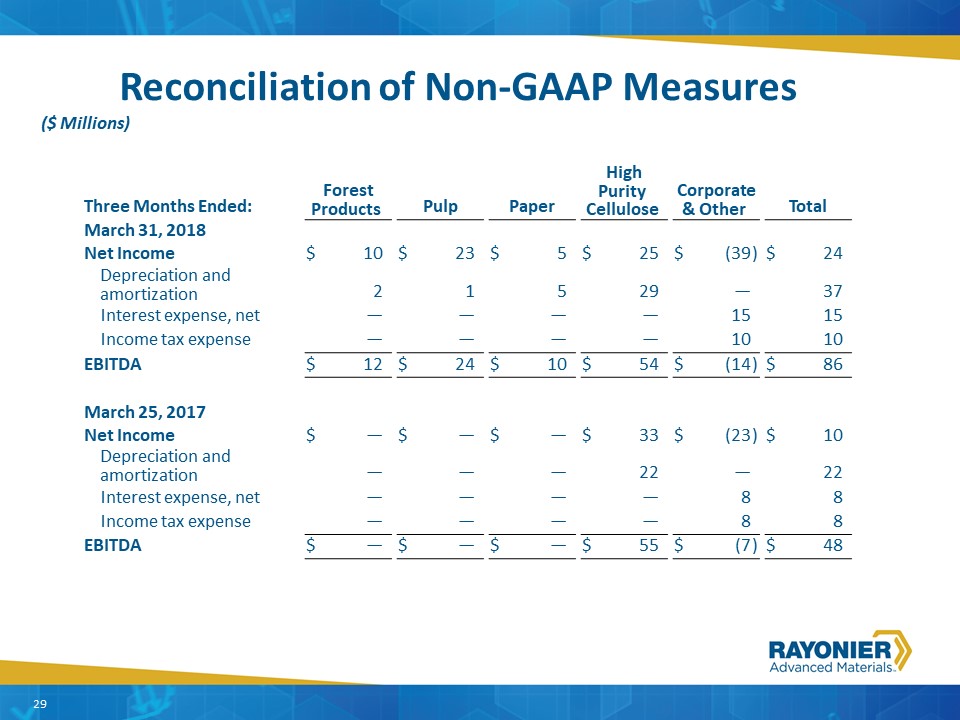
Reconciliation of Non-GAAP Measures 29 ($ Millions) Three Months Ended: Forest Products Forest Products Pulp Pulp Paper Paper High Purity Cellulose High Purity Cellulose Corporate & Other Corporate & Other Total Total March 31, 2018 Net Income $ 10 $ 23 $ 5 $ 25 $ (39 ) $ 24 Depreciation and amortization 2 1 5 29 — 37 Interest expense, net — — — — 15 15 Income tax expense — — — — 10 10 EBITDA $ 12 $ 24 $ 10 $ 54 $ (14 ) $ 86 March 25, 2017 Net Income $ — $ — $ — $ 33 $ (23 ) $ 10 Depreciation and amortization — — — 22 — 22 Interest expense, net — — — — 8 8 Income tax expense — — — — 8 8 EBITDA $ — $ — $ — $ 55 $ (7 ) $ 48
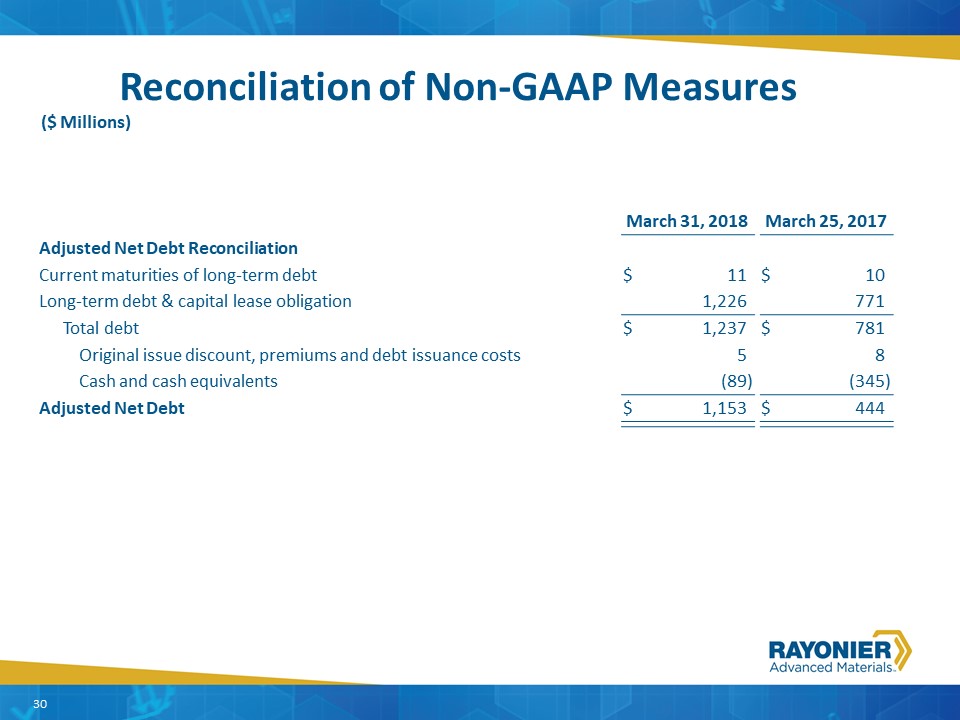
Reconciliation of Non-GAAP Measures 30 ($ Millions) March 31, 2018 March 31, 2018 March 25, 2017 March 25, 2017 Adjusted Net Debt Reconciliation Current maturities of long-term debt $ 11 $ 10 Long-term debt & capital lease obligation 1,226 771 Total debt $ 1,237 $ 781 Original issue discount, premiums and debt issuance costs 5 8 Cash and cash equivalents (89 ) (345 ) Adjusted Net Debt $ 1,153 $ 444
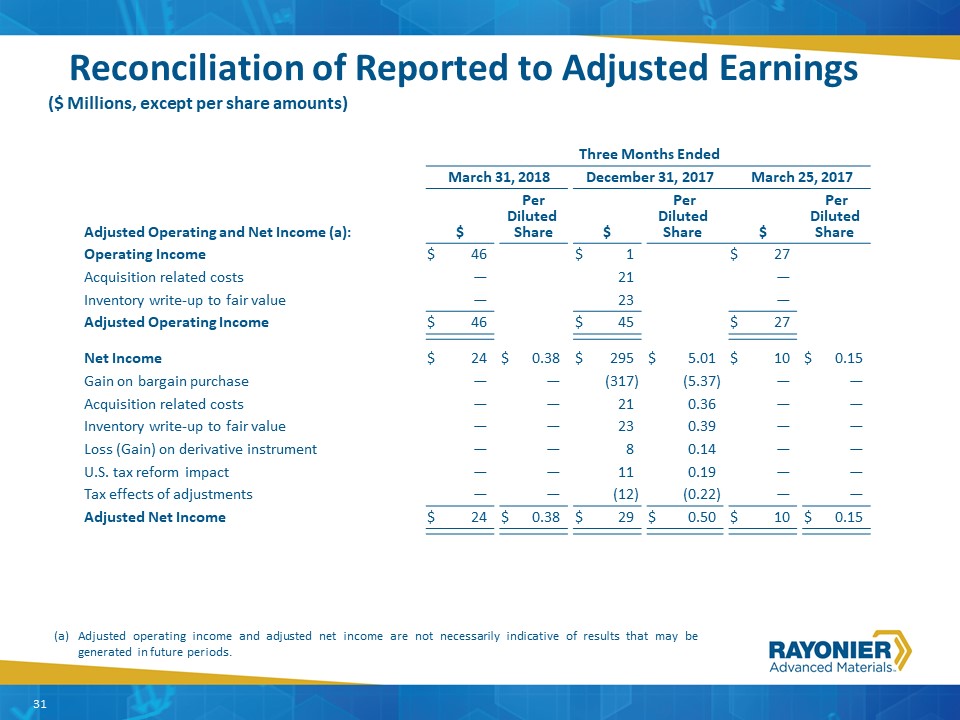
Reconciliation of Reported to Adjusted Earnings 31 (a) Adjusted operating income and adjusted net income are not necessarily indicative of results that may be generated in future periods. ($ Millions, except per share amounts) Three Months Ended Three Months Ended March 31, 2018 March 31, 2018 December 31, 2017 December 31, 2017 March 25, 2017 March 25, 2017 Adjusted Operating and Net Income (a): $ $ Per Diluted Share Per Diluted Share $ $ Per Diluted Share Per Diluted Share $ $ Per Diluted Share Per Diluted Share Operating Income $ 46 $ 1 $ 27 Acquisition related costs — 21 — Inventory write-up to fair value — 23 — Adjusted Operating Income $ 46 $ 45 $ 27 Net Income $ 24 $ 0.38 $ 295 $ 5.01 $ 10 $ 0.15 Gain on bargain purchase — — (317 ) (5.37 ) — — Acquisition related costs — — 21 0.36 — — Inventory write-up to fair value — — 23 0.39 — — Loss (Gain) on derivative instrument — — 8 0.14 — — U.S. tax reform impact — — 11 0.19 — — Tax effects of adjustments — — (12 ) (0.22 ) — — Adjusted Net Income $ 24 $ 0.38 $ 29 $ 0.50 $ 10 $ 0.15