Attached files
| file | filename |
|---|---|
| EX-10.12 - EXHIBIT 10.12 - RAYONIER ADVANCED MATERIALS INC. | ex1012.htm |
| EX-32 - EXHIBIT 32 - RAYONIER ADVANCED MATERIALS INC. | ex32q4-201710xq.htm |
| EX-31.2 - EXHIBIT 31.2 - RAYONIER ADVANCED MATERIALS INC. | ex312q4-201710xq.htm |
| EX-31.1 - EXHIBIT 31.1 - RAYONIER ADVANCED MATERIALS INC. | ex311q4-201710xq.htm |
| EX-24 - EXHIBIT 24 - RAYONIER ADVANCED MATERIALS INC. | ex24201710-k.htm |
| EX-23.2 - EXHIBIT 23.2 - RAYONIER ADVANCED MATERIALS INC. | ex2322017.htm |
| EX-23.1 - EXHIBIT 23.1 - RAYONIER ADVANCED MATERIALS INC. | ex2312017.htm |
| EX-21 - EXHIBIT 21 - RAYONIER ADVANCED MATERIALS INC. | exhibit212017.htm |
| EX-12 - EXHIBIT 12 - RAYONIER ADVANCED MATERIALS INC. | ex12.htm |
| EX-10.18 - EXHIBIT 10.18 - RAYONIER ADVANCED MATERIALS INC. | ex1018.htm |
| EX-10.15 - EXHIBIT 10.15 - RAYONIER ADVANCED MATERIALS INC. | ex1015.htm |
| EX-10.10 - EXHIBIT 10.10 - RAYONIER ADVANCED MATERIALS INC. | ex1010.htm |
UNITED STATES SECURITIES AND EXCHANGE COMMISSION
Washington, D.C. 20549
FORM 10-K
(Mark One)
x | ANNUAL REPORT PURSUANT TO SECTION 13 OR 15(d) OF THE SECURITIES EXCHANGE ACT OF 1934 |
For the fiscal year ended December 31, 2017
or
o | TRANSITION REPORT PURSUANT TO SECTION 13 OR 15(d) OF THE SECURITIES EXCHANGE ACT OF 1934 |
For the transition period from to | |
Commission File Number 001-36285

Incorporated in the State of Delaware
I.R.S. Employer Identification No. 46-4559529
1301 RIVERPLACE BOULEVARD, SUITE 2300
JACKSONVILLE, FL 32207
(Principal Executive Office)
Telephone Number: (904) 357-4600
Securities registered pursuant to Section 12(b) of the Act: | |
Title of each class | Name of exchange on which registered |
Common stock, par value $0.01 per share | New York Stock Exchange |
8.00% Series A Mandatory Convertible Preferred Stock, par value $0.01 per share | New York Stock Exchange |
Securities to be registered pursuant to Section 12(g) of the Act: None | |
Indicate by check mark if the registrant is a well-known seasoned issuer, as defined in Rule 405 of the Securities Act.
YES x NO o
Indicate by check mark if the registrant is not required to file reports pursuant to Section 13 or Section 15(d) of the Act.
YES o NO x
Indicate by check mark whether the registrant (1) has filed all reports required to be filed by Section 13 or 15(d) of the Securities Exchange Act of 1934 during the preceding 12 months (or for such shorter period that the registrant was required to file such reports), and (2) has been subject to such filing requirements for the past 90 days.
YES x NO o
Indicate by check mark whether the registrant has submitted electronically and posted on its corporate Web site, if any, every Interactive Data File required to be submitted and posted pursuant to Rule 405 of Regulation S-T (§ 232.405 of this chapter) during the preceding 12 months (or for such shorter period that the registrant was required to submit and post such files).
YES x NO o
Indicate by check mark if disclosure of delinquent filers pursuant to Item 405 of Regulation S-K (§ 229.405 of this chapter) is not contained herein, and will not be contained, to the best of registrant’s knowledge, in definitive proxy or information statements incorporated by reference in Part III of this Form 10-K or any amendment to this Form 10-K. x
Indicate by check mark whether the registrant is a large accelerated filer, an accelerated filer, a non-accelerated filer, or a smaller reporting company. See the definitions of “large accelerated filer,” “accelerated filer” and “smaller reporting company” in Rule 12b-2 of the Exchange Act.
Large accelerated filer x | Accelerated filer o | |
Non-accelerated filer o | Smaller reporting company o | |
Emerging growth company o | ||
If an emerging growth company, indicate by check mark if the registrant has elected not to use the extended transition period for complying with any new or revised financial accounting standards provided pursuant to Section 13(a) of the Exchange Act. o
Indicate by check mark whether the registrant is a shell company (as defined in Rule 12b-2 of the Exchange Act).
YES o NO x
The aggregate market value of the Common Stock of the registrant held by non-affiliates at the close of business on June 24, 2017 was $643,689,895 based on the closing sale price as reported on the New York Stock Exchange.
The registrant had 51,681,748 shares of Common Stock, $.01 par value per share, outstanding as of February 20, 2018.
Portions of the registrant’s definitive proxy statement to be filed with the Securities and Exchange Commission in connection with the 2018 annual meeting of the stockholders of the registrant scheduled to be held May 21, 2018, are incorporated by reference in Part III hereof.
Table of Contents
Item | Page | ||
Part I | |||
1. | |||
1A. | |||
1B. | |||
2. | |||
3. | |||
4. | |||
Part II | |||
5. | |||
6. | |||
7. | |||
7A. | |||
8. | |||
9. | |||
9A. | |||
9B. | |||
Part III | |||
10. | |||
11. | |||
12. | |||
13. | |||
14. | |||
Part IV | |||
15. | |||
16. | |||
i
Index to Financial Statements
Page | |
Index to Financial Statement Schedules | |
All other financial statement schedules have been omitted because they are not applicable, the required matter is not present, or the required information has been otherwise supplied in the financial statements or the notes thereto. | |
ii
Part I
When we refer to “we,” “us,” “our,” “the Company,” or “Rayonier Advanced Materials” we mean Rayonier Advanced Materials Inc. and its consolidated subsidiaries. References herein to “Notes to Financial Statements” refer to the Notes to the Consolidated Financial Statements of Rayonier Advanced Materials Inc. included in Item 8 of this Report.
Note About Forward-Looking Statements
Certain statements in this document regarding anticipated financial, business, legal or other outcomes including business and market conditions, outlook and other similar statements relating to Rayonier Advanced Materials’ future events, developments, or financial or operational performance or results, are “forward-looking statements” made pursuant to the safe harbor provisions of the Private Securities Litigation Reform Act of 1995 and other federal securities laws. These forward-looking statements are identified by the use of words such as “may,” “will,” “should,” “expect,” “estimate,” “believe,” “intend,” “forecast,” “anticipate” “guidance” and other similar language. However, the absence of these or similar words or expressions does not mean a statement is not forward-looking. While we believe these forward-looking statements are reasonable when made, forward-looking statements are not guarantees of future performance or events and undue reliance should not be placed on these statements. Although we believe the expectations reflected in any forward-looking statements are based on reasonable assumptions, we can give no assurance these expectations will be attained and it is possible actual results may differ materially from those indicated by these forward-looking statements due to a variety of risks and uncertainties. The risk factors contained in Item 1A — Risk Factors, among others, could cause actual results or events to differ materially from the Company’s historical experience and those expressed in forward-looking statements made in this document.
Risks Relating to the Business
• | The businesses we operate are highly competitive and many of them are cyclical, which may result in fluctuations in pricing and volume that can adversely impact our financial condition and results of operations. |
• | Our ten largest customers represent approximately 38 percent of our pro forma 2017 revenue, and the loss of all or a substantial portion of our revenue from these large customers could have a material adverse effect on our business. |
• | A material disruption at one of our major manufacturing facilities could prevent us from meeting customer demand, reduce our sales and profitability, increase our cost of production and capital needs, or otherwise adversely affect our business, financial condition and results of operation. |
• | Changes in raw material and energy availability and prices could affect our results of operations and financial condition. |
• | The availability of, and prices for, wood fiber may significantly impact our business, results of operations and financial condition. |
• | We are subject to risks associated with doing business outside of the United States. |
• | Our operations require substantial capital. |
• | Currency fluctuations may have a negative impact on our business, financial condition and results of operations. |
• | Restrictions on trade through tariffs, countervailing and anti-dumping duties, quotas and other trade barriers, in the United States and internationally, could adversely affect our ability to access certain markets. |
• | We depend on third parties for transportation services and increases in costs and the availability of transportation could adversely affect our business. |
• | Our business is subject to extensive environmental laws, regulations and permits that may restrict or adversely affect our ability to conduct our business. |
• | The impacts of climate-related initiatives remain uncertain at this time. |
• | Our failure to maintain satisfactory labor relations could have a material adverse effect on our business. |
• | We are dependent upon attracting and retaining key personnel, the loss of whom could adversely affect our business. |
• | Failure to develop new products or discover new applications for our existing products, or our inability to protect the intellectual property underlying such new products or applications, could have a negative impact on our business. |
• | Risk of loss of the Company’s intellectual property and sensitive business information, or disruption of its manufacturing operations, in each case due to cyberattacks or cyber security breaches, could adversely impact the Company. |
• | We may need to make significant additional cash contributions to our retirement benefit plans if investment returns on pension assets are lower than expected or interest rates decline, and/or due to changes to regulatory, accounting and actuarial requirements. |
• | We have debt obligations that could adversely affect our business and our ability to meet our obligations. |
• | Challenges in the commercial and credit environments may materially adversely affect our future access to capital. |
• | We may need additional financing in the future to meet our capital needs or to make acquisitions, and such financing may not be available on favorable terms, if at all, and may be dilutive to existing stockholders. |
• | The inability to effectively integrate the Tembec Inc. (“Tembec”) acquisition, and any future acquisitions we may make, may affect our results. |
• | We may not achieve the benefits anticipated from our announced transformation plan. |
1
Risks Related to the Company’s Common Stock and Certain Corporate Matters
• | Your percentage of ownership in the Company may be diluted in the future. |
• | Our common stock ranks junior to our Mandatory Convertible Preferred Stock, Series A (the “Preferred Stock”) with respect to dividends and amounts payable in the event of our liquidation. |
• | Certain provisions of the Preferred Stock could prevent or delay an acquisition of the Company, which could decrease the price of our common stock. |
• | Certain provisions in our amended and restated certificate of incorporation and bylaws, and of Delaware law, could prevent or delay an acquisition of the Company, which could decrease the price of our common stock. |
• | Our amended and restated certificate of incorporation designates the Court of Chancery of the State of Delaware as the sole and exclusive forum for certain types of actions and proceedings that may be initiated by our stockholders, which could discourage lawsuits against the Company and our directors and officers. |
• | There could be significant liability if the distribution of common stock of the Company that occurred as a result of its spin-off from Rayonier Inc. is determined to be a taxable transaction. |
Forward-looking statements are only as of the date they are made, and the Company undertakes no duty to update its forward-looking statements except as required by law. You are advised, however, to review any further disclosures we have made or may make in our filings and other submissions to the U.S. Securities and Exchange Commission (the “SEC”), including those on Forms 10-Q, 10-K, 8-K and other reports. Specifically, more details on each of the above risk factors are more specifically described in Item 1A - Risk Factors.
Note About Non-GAAP Financial Measures
This document contains certain non-GAAP financial measures, including Earnings Before Interest, Taxes, Depreciation and Amortization (“EBITDA”), adjusted EBITDA, and adjusted free cash flows. These non-GAAP measures are reconciled to each of their respective most directly comparable U.S. Generally Accepted Accounting Principles (“GAAP”) financial measures in Item 7 — Management’s Discussion and Analysis of Financial Condition and Results of Operations.
We believe these non-GAAP measures provide useful information to our board of directors, management and investors regarding certain trends relating to our financial condition and results of operations. Our management uses these non-GAAP measures to compare our performance to that of prior periods for trend analyses, purposes of determining management incentive compensation and budgeting, forecasting and planning purposes.
We do not consider non-GAAP measures an alternative to financial measures determined in accordance with GAAP. The principal limitation of these non-GAAP financial measures is they may exclude significant expense and income items that are required by GAAP to be recognized in our consolidated financial statements. In addition, they reflect the exercise of management’s judgment about which expense and income items are excluded or included in determining these non-GAAP financial measures. In order to compensate for these limitations, reconciliations of the non-GAAP financial measures we use to their most directly comparable GAAP measures are provided. Non-GAAP financial measures should not be relied upon, in whole or part, in evaluating the financial condition, results of operations or future prospects of the Company.
Item 1. | Business |
Prior to June 27, 2014, we consisted of Rayonier Inc.’s (“Rayonier’s”) wholly-owned performance fibers business, the global leader in the production of cellulose specialties. On that date, holders of Rayonier common shares received one share of our common stock for every three Rayonier common shares held on the record date. This resulted in our separation from Rayonier and the start of our business as an independent, publicly traded company.
We are transforming our business and growing EBITDA to drive long-term value for our stockholders. Our plan focuses on the following four strategic pillars:
•Cost Transformation - driving sustainable cost reductions by fostering a culture of continuous improvement
• | New Products - expanding our business by developing next generation cellulose fibers and other value-added product utilizing our cellulose processing technology, expertise and co-products. We have made significant progress in developing and applying proprietary technologies to new products in many of the end-market segments we serve. |
• | Market Optimization - maximizing the profitability of our existing products and assets by optimizing the intersection of our customers’ needs, our manufacturing capabilities and transportation costs to drive higher value for our customers and our Company. |
2
• | Disciplined Capital Allocation - delivering a capital allocation strategy that maximizes our risk adjusted returns. Our first priority is to delever our balance sheet through EBITDA growth and repayment of indebtedness in order to reach our target net leverage ratio of 2.5 times EBITDA. We will allocate capital across high return investments in our facilities, acquisitions and other external investments to grow profitability, as well as return capital to stockholders through buybacks and dividends. |
On November 17, 2017, we acquired Tembec which was engaged in the manufacture of cellulose specialties, commodity products, forest products and pulp & paper (the “Acquisition”). The Acquisition created a combined company with leading positions in acetate, ethers, high-strength viscose, filtration and other cellulose specialties, as well as adding complementary assets in the forest products and pulp & paper businesses. Consequently, we now operate in the following business segments:
•High Purity Cellulose
•Forest Products
•Pulp & Paper
The following describes each of these segments. Additionally, see Note 19 — Segment and Geographical Information of our consolidated financial statements for more information.
High Purity Cellulose
The High Purity Cellulose segment, and in particular the cellulose specialties product line, is the primary driver of our profitability. Cellulose specialties are natural polymers, used as raw materials to manufacture a broad range of consumer-oriented products such as cigarette filters, liquid crystal displays, impact-resistant plastics, thickeners for food products, pharmaceuticals, cosmetics, high-tenacity rayon yarn for tires and industrial hoses, food casings, paints and lacquers. We manufacture products tailored to the precise and demanding chemical and physical specifications of our customers, achieving industry-leading purity and product functionality. Our ability to consistently manufacture high-quality cellulose specialties products is the result of our proprietary production processes, intellectual property, technical expertise and knowledge of cellulosic chemistry.
Additionally, a significant portion of our production capacity is dedicated to manufacturing high-purity commodity products for viscose and absorbent materials applications. Commodity viscose is a raw material required for the manufacture of viscose staple fibers which are used in woven applications such as rayon textiles for clothing and other fabrics, and in non-woven applications such as baby wipes, cosmetic and personal wipes, industrial wipes and mattress ticking. Absorbent materials, typically referred to as fluff fibers, are used as an absorbent medium in products such as disposable baby diapers, feminine hygiene products, incontinence pads, convalescent bed pads, industrial towels and wipes and non-woven fabrics. Cellulose specialties typically contain over 95 percent cellulose, while commodity products typically contain less than 95 percent cellulose.
Products
Cellulose Specialties
Cellulose specialties are a natural polymer primarily derived from either wood or cotton and are used as a raw material to manufacture a broad range of products. Cellulose specialties generally command a price premium and earn higher margins relative to other commodity wood pulp products. Typically, product pricing is set annually in the fourth quarter for the following year based on discussions with customers and the terms of contractual arrangements.
Derived from wood, our cellulose specialties require high levels of purity, consistency and process knowledge. Our products play a significant role in our customers’ manufacturing processes, which require cellulose specialties of high purity and uniformity for efficient production. Therefore, our customers demand products of the highest quality. As a result, our products are custom-engineered and manufactured to each customers’ unique specifications and require a stringent qualification process; our quality and consistency allow our customers to operate more efficiently and cost-effectively.
One of our key competitive advantages is our unique ability to leverage our global manufacturing asset base to provide our customers a greater security of supply for cellulose specialties fibers. With our four facilities and five manufacturing lines capable of producing cellulose specialties, we are the only cellulose specialties producer with manufacturing facilities that provide flexibility to use both hardwood and softwood fibers, kraft and sulfite cooking processes, and a variety of proprietary chemical treatments to provide customized product functionality. Additionally, we possess significant process knowledge: the understanding of wood fiber properties and their modification under a sequence of chemical processes, accumulated and developed over 90 years of practical application to satisfy a variety of customer needs. This process knowledge, combined with our
3
manufacturing scale and flexibility and knowledge of customers’ applications and specifications, makes us the industry’s most adaptable and capable modifier of cellulose fibers.
Commodity Products
Our High Purity Cellulose manufacturing assets can easily be shifted between commodity viscose and absorbent materials production to take advantage of market conditions and generate the most attractive margins.
Commodity viscose is primarily sold to producers of viscose staple fibers which in turn are used primarily to manufacture rayon fibers which are widely used in the clothing and textile industries. Shifts in fashion styles and textile fiber blending have increased demand for viscose staple fibers. Additionally, variability in cotton linter supply and increasing environmental concerns about cotton production have resulted in viscose staple producers shifting volume away from cotton linter pulp to wood-based dissolving pulp.
Absorbent materials, or fluff fibers, are typically used in consumer products such as baby diapers. These fibers provide a medium for fluid acquisition, distribution and retention in the products in which they are incorporated. Pricing for commodity products is typically referenced to published indexes or based on publicly available spot market prices.
Competition
Cellulose Specialties
Significant intellectual property, capital investment and technical expertise are needed to design and manufacture customized cellulose specialties fibers to exacting customer specifications. The product must be formulated to achieve the desired characteristics including parameters for purity, viscosity, brightness, reactivity and other physical properties. Product qualification time can be lengthy, extending six to twenty-four months. Resulting customer relationships are typically long-term, based on an understanding of our customers’ production processes and technical expertise which we utilize to solve customers’ production issues and support new product development. Further, establishing a production line and obtaining the necessary production technologies requires substantial capital and ongoing maintenance expenditures.
Product performance, technical service and price are principal methods of competition in cellulose specialties. Product performance is primarily determined by the purity and uniformity of the cellulose specialties. Our processes, which are a key element of our intellectual property, are capable of generating cellulose specialties purity levels in excess of 98 percent.
We compete with both domestic and foreign producers in cellulose specialties. Competitors include GP Cellulose, Borregaard, Bracell, Sappi, Nippon, Cosmo Specialty Fibers and Aditya Birla Group. Some competitors use both wood and cotton linter fibers, as a source of cellulose fibers.
Commodity Products
The principal method of competition in commodity products is price, as purity and uniformity are less critical differentiators. We compete with both domestic and foreign producers of commodity products.
For commodity viscose, many competitors derive their commodity viscose from either wood or cotton. Although cellulose specialties can generally be sold to meet commodity viscose demand, the reverse is not typically true. For commodity viscose, major competitors include Sappi, Aditya Birla Group, Lenzing and Bracell.
For absorbent materials, major competitors include GP Cellulose, Domtar and International Paper.
Forest Products
We manufacture and market primarily high-quality construction-grade lumber in North America through our seven sawmills located in Canada.
Approximately 56 percent of our sales are exported from Canada to the U.S. On November 25, 2016, a petition for the imposition of countervailing and anti-dumping duties (“CVD” and “ADD”) on softwood lumber from Canada was filed with the U.S. International Trade Commission by the Committee Overseeing Action for Lumber International Trade Investigations or Negotiations. On December 28, 2017, the United States Department of Commerce (“USDOC”) issued an amended final determination for CVD and ADD of 14.2 percent and 6.0 percent, respectively, on imports of softwood lumber from Canada. On January 3, 2018, the USDOC issued its ADD and CVD orders to the United States Customs and Border Protection to collect the above duties on softwood lumber imports from Canada effective.
Products
4
We manufacture finished dimensional lumber (2 by 4’s, 2 by 8’s, etc.) primarily made of spruce, pine, or fir, used in the construction of residential and multi-family homes, light industrial and commercial facilities, and the home repair and remodel markets. Wood chips, a by-product of the lumber manufacturing process, are used as raw materials in our High Purity Cellulose and Pulp & Paper facilities in Canada.
Competition
The principal method of competition in the Forest Products segment is price, which is based on individual sawmill efficiency, the availability of competitively-priced raw materials, demand for wood products used in the construction of residential and multifamily homes and the repair and remodel of existing homes. Residential and multifamily home construction is influenced by demographic factors such as population growth, employment, consumer confidence, consumer income, availability of financing and interest rate levels, and the supply and pricing of existing homes on the market. Repair and remodel activity is affected by the size and age of existing housing inventory and access to home equity financing and other credit.
Significant competitors include West Fraser Timber Ltd., Resolute Forest Products, Weyerhauser, Canfor and Eacom.
Pulp & Paper
Through our four production facilities in Canada, we manufacture and distribute pulp and paper products consisting of paperboard, high-yield pulp and newsprint.
Products
Products in the Pulp & Paper business include the following:
• | Paperboard, produced in the Temiscaming plant, is used for packaging, printing documents, brochures, promotional materials, paperback book or catalog covers, file folders, tags and tickets. |
• | High-yield pulps are produced at the Matane and Temiscaming plants, primarily from hardwood aspen and maple furnish. These pulps are used by paper manufacturers to produce paperboard products, printing and writing papers and a variety of other paper grades. |
• | Newsprint, produced in the Kapuskasing plant, is a paper grade used to print newspapers, advertising materials and other publications. In January of 2018, the USDOC announced preliminary countervailing duties applicable against Canadian newsprint producers, with our preliminary countervailing duty rate of 6.5 percent. Preliminary anti-dumping duties, if any, could be assigned prior to the close of the first quarter of 2018. |
Competition
The principal method of competition in the Pulp & Paper segment is price. Price is impacted by the balance between supply and demand as affected by global economic conditions, changes in consumption and capacity, the level of customer and producer inventories, and fluctuations in currency exchange rates. To a lesser extent, quality and service are also considered competitive determinants, particularly for paperboard.
For paperboard, significant competitors include Westrock, Clearwater, SAPPI, Metso and Verso.
For high-yield pulp, significant competitors include Millar Western, West Fraser, Paper Excellence, Estonia Cell and Winstone.
For newsprint, significant competitors include Resolute Forest Products, Whitebirch Paper and Kruger.
Raw Materials and Input Costs
All our manufacturing operations, require significant amounts of wood fiber, in the form of logs or wood chips, as a raw material and energy to produce our products. Additionally, our High-Purity Cellulose and Pulp & Paper manufacturing processes require significant amounts of chemicals. These raw materials and input costs are subject to significant changes in prices as a result of weather conditions, supply and demand. To control cost, we continually pursue reductions in usage and costs of key supplies, services and raw materials. We do not foresee any material constraints in the near term from pricing or availability.
Wood
5
Our Canadian Forest Products operations rely on the consistent supply of substantial quantities of logs. Substantially all timberlands in Canada are government-owned and the right to harvest timber is acquired through provincially-granted licenses. Licenses grant the holder the right to harvest, for a fee, up to a specified quantity of timber annually. Government objectives in granting licenses include responsible management of timber, soils, wildlife, water and fish resources and the preservation of biodiversity and the protection of cultural values. The objectives also include achieving the fullest possible economic utilization of the forest resources and employment in local communities. In addition, license holders are required to replant the trees harvested to ensure re-establishment of the forest after harvesting. Reforestation projects are planned and supervised by our forest resource management staff and subject to approval by relevant government authorities. Our timber harvesting operations are performed directly or carried out by independent contractors under our forest resource management supervision.
In Canada, the High Purity Cellulose and Pulp & Paper plants are supplied with wood chips produced as a by-product from the lumber manufacturing process.
In the U.S. and France, we supply wood chips to our High Purity Cellulose plants through the purchase of chips from lumber producers or produce chips through our wood chipping facilities.
Chemicals
Chemicals, which include caustic soda (sodium hydroxide), sulfuric acid, ammonia, sodium chlorate and various specialty chemicals, are purchased under negotiated supply agreements with third parties. The prices for these products are impacted by various factors including supply and demand, environmental regulation, energy prices and overall economic conditions.
Energy
Our energy is primarily produced through the burning of lignin and other residual biomass in recovery and power boilers located at our plants. However, our manufacturing facilities still utilize significant amounts of fuel oil, natural gas and purchased electricity to supplement their energy requirements. In addition, energy prices impact our transportation costs for delivery of raw materials to our manufacturing facilities and delivery of our finished products to customers.
Intellectual Property
Substantially all of our intellectual property relates to our High Purity Cellulose segment. We own patents, trademarks and trade secrets, and have developed significant know-how, particularly in the production of high purity cellulose, which we deem important to our operations. We intend to protect our intellectual property, including, when appropriate, filing patent applications for inventions that are deemed important to our business and operations. Our U.S. patents generally have a duration of 20 years from the date of filing. We also require key employees to enter into non-compete agreements as appropriate.
Seasonality
Our results are not significantly affected by seasonal changes.
Customers
See Note 19 — Segment and Geographical Information of our consolidated financial statements for more information on on our major customers.
Research and Development
Research and development capabilities and activities are focused on the High Purity Cellulose segment. The quality and consistency of our cellulose specialties and research and development capabilities create a significant competitive advantage; they are important factors in achieving an optimal value for our cellulose specialties products. Our research and development efforts are primarily directed at further developing products and technologies, improving the quality of cellulose fiber grades, improving manufacturing efficiency and environmental controls and reducing fossil fuel consumption. We continue to grow our research and development activities to develop and market additional new products and applications.
We spent $4 million, $4 million and $3 million on research and development for the years ended December 31, 2017, 2016 and 2015, respectively.
6
Environmental Matters
Our manufacturing operations are subject to significant federal, state, provincial and local environmental regulations. For a more detailed discussion, see Item 1A — Risk Factors, Item 3 — Legal Proceedings, Item 7 — Management’s Discussion and Analysis of Financial Condition and Results of Operations — Environmental Regulation. Additionally, see Note 9 — Liabilities for Disposed Operations and Note 20 — Commitments and Contingencies of our consolidated financial statements for more information.
Employee Relations
We currently employ approximately 4,200 people in the United States, Canada and France. See Note 20 — Commitments and Contingencies of our consolidated financial statements for more information. We believe relations with our employees are satisfactory.
Availability of Reports and Other Information
Our annual reports on Form 10-K, quarterly reports on Form 10-Q, current reports on Form 8-K, proxy statements and amendments to those reports filed or furnished pursuant to Sections 13(a) or 14 of the Securities Exchange Act of 1934 are made available to the public free of charge in the Investor Relations section of our website www.rayonieram.com, shortly after we electronically file such material with, or furnish them to, the SEC. Our corporate governance guidelines and charters of all committees of our board of directors are also available on our website.
Item 1A. | Risk Factors |
Our operations are subject to a number of risks and events including, but not limited to, those listed below. When considering an investment in our securities, you should carefully read and consider these risks, together with all other information in this Report and our other filings and submissions to the SEC. If any of the events described in the following risk factors actually occur, our business, financial condition or operating results, as well as the market price of our securities, could be materially adversely affected.
Business and Operating Risks
The businesses we operate are highly competitive and many of them are cyclical, which may result in fluctuations in pricing and volume that can adversely affect our business, financial condition and results of operations.
Competition, demand fluctuations and cyclicality are the most significant drivers of sales volumes and pricing for our products. We face significant competition from domestic and foreign producers in virtually all of our businesses. For example, our cellulose specialties business has seen increased cellulose specialties production capacity from our competitors, some of whom have lower raw material, wood and production costs than us, combined with demand weakness, particularly in the acetate grades, which have collectively driven cellulose specialties sales prices down substantially over the past several years. Likewise, volumes have declined meaningfully over the past two years due to these factors. There can be no assurance these declines will not continue into the near future.
With respect to demand for cellulose specialties, and in particular our acetate grades, the majority of these grades are used to manufacture acetate tow, which is used to make the filter component of a cigarette. Significant increases in cigarette costs and potential actions taken by the United States and other countries to discourage smoking, such as tax increases on tobacco products, policy changes and future legislation, may have a material adverse effect on the demand for tobacco products. For example, actions by the Chinese government to curb corruption and limit smoking in public buildings have had some impact on cigarette consumption. Additionally, increased use of e-cigarettes, electronically heated tobacco products and smokeless tobacco products, by way of example, may affect demand for traditional cigarettes.
Our lumber, paper, high yield pulp and paper-related commodity businesses are cyclical and influenced by a variety of factors. These include periods of excess product supply due to industry capacity increases, periods of decreased demand due to reduced economic activity or market conditions, inventory de-stocking by customers and fluctuations in currency exchange rates. To address these factors, we have in the past, and may in the future, elect to schedule production curtailments and shutdowns to address, for example, unfavorable economic conditions, reduced demand for our products or the end products of our customers, lack of economically viable fiber in Canada, reduced market prices and other factors. In particular, our lumber and newsprint businesses have been the subject of curtailments and shutdowns in the past.
7
In sum, continued competitive pressures and demand weakness, as well as the cyclicality of our commodity businesses, may have a material impact on our future sales prices and volumes and, therefore, our business, financial condition and results of operations.
Our ten largest customers represent approximately 38 percent of our pro forma 2017 revenue, and the loss of all or a substantial portion of our revenue from these large customers could have a material adverse effect on our business.
While we are not dependent on any single customer or group of customers, our ten largest customers accounted for approximately 38 percent of pro forma revenue in 2017. Due to the highly competitive nature of our businesses, we regularly bid for new business and to retain/renew existing business and, as such, we are subject to the potential for meaningful revenue and volume gains and losses.
In addition, some of the industries in which our end-use customers participate, such as construction, home building, publishing, packaging, automotive and textiles, are cyclical in nature, thus posing risks to us which are beyond our control. These industries are highly competitive and may experience overcapacity and reductions in end use demand, each of which may affect demand for and pricing of our products. The consequences of this could include the reduction, delay or cancellation of customer orders.
We are also subject to credit risk associated with these customers. If one or more of our ten largest customers were to become bankrupt, insolvent or otherwise were unable to pay for its products, we may incur significant write-offs of accounts that may have a material adverse effect on our business, financial condition and results of operations.
Although we continue to strive to broaden and diversify our customer base, a significant portion of our revenue is derived from these ten customers, and the loss of all or a substantial portion of sales to any of these customers, or significant, unfavorable changes to pricing or terms contained in contracts with them, could materially affect our business, financial condition or results of operations. See Note 19 — Segment and Geographical Information of our consolidated financial statements for more information on our major customers.
A material disruption at one of our major manufacturing facilities could prevent us from meeting customer demand, reduce our sales and profitability, increase our cost of production and capital needs, or otherwise adversely affect our business, financial condition and results of operation.
Any of our major manufacturing facilities, or a significant portion of any of these facilities, could cease operations unexpectedly or suffer a material disruption to all or a portion of its operations due to a number of events, including:
• | Unscheduled outages or downtime due to the need for unexpected maintenance or equipment failure, such as for portions of our facilities that produce steam and electricity (such as boilers and turbines), pollution control equipment, and equipment directly used to manufacture our products; |
• | prolonged power interruptions or failures; |
• | explosion of a boiler or other pressure vessel; |
• | interruptions in the supply of raw materials, including chemicals and wood fiber; |
• | disruptions to or failures of the transportation infrastructure, such as roads, bridges, railroad tracks and tunnels, as well as lack of availability of rail, trucking and ocean shipping equipment and service from third party transportation providers; |
• | interruption or material reduction of water supply; |
• | a chemical spill or release or other event causing risks to the environment or human health and safety; |
• | information technology system failures and cybersecurity incidents; |
• | fires, floods, windstorms, earthquakes, hurricanes or other similar catastrophes, such as the hurricanes which impacted our Jesup, Georgia and Fernandina, Florida plants in 2017; |
• | labor interruptions, such as the strike at our Temiscaming, Quebec facility in 2014; |
• | terrorism or threats of terrorism; and |
• | other operational problems resulting from these and other risks. |
Some of these matters are discussed in more detail in other sections of these Risk Factors. Depending on the nature, extent and length of any operational interruption, the event could materially affect our business, financial condition and results of operations.
Changes in raw material and energy availability and prices could affect our results of operations and financial condition.
Raw material costs and energy, such as chemicals, oil and natural gas and electricity are a significant operating expense. The cost of these inputs can be volatile and are susceptible to rapid and substantial increases due to factors beyond our control, such as lack of availability, changing economic and weather conditions, political or other unrest or instability in energy-producing
8
nations, and supply and demand considerations. For example, caustic soda, a key manufacturing input, has historically had significant price volatility. Similarly, the price of oil and natural gas (including its pipeline transportation element) is subject to fluctuations based on market and other factors. In contracts for certain of our products, pricing is set annually or otherwise not subject to change for a contractually-agreed period of time, so in some cases we may have limited ability to pass along fluctuations in these input costs once the contract price for the relevant period has been established. In addition, industrial and other policies of the governments and governmental agencies having jurisdiction over our facilities may change, due to changes in political leadership or otherwise, which also could adversely impact the cost of energy and its transportation. While we often use various strategies to mitigate the potential impact of this pricing volatility, such as long term contracting and the purchase of derivative commodity contracts, the impact of raw material and energy pricing increases could materially adversely affect our business, financial condition and results of operations.
The availability of, and prices for, wood fiber may significantly impact our business, results of operations and financial condition.
Wood fiber is the single largest raw material in the manufacturing process for virtually all of our products. Many factors can impact its availability and pricing: One key factor is whether the land on which the timber is grown is owned by private parties or governmental entities. For example, fiber for our U.S. and French facilities is primarily harvested from privately-held lands, while fiber for our Canadian facilities is primarily harvested from lands owned or controlled by the governments of the provinces of Ontario and Quebec, respectively, which are often referred to as “Crown lands”. In fiscal 2017, approximately 90 percent of the Company’s fiber requirements in Canada were sourced from Crown lands. The Company’s current agreements with provincial authorities grant timber “tenures” for terms varying from five to 20 years and may be subject to renewals every five years. In Canada, the Company currently manages approximately 25 million acres (ten million hectares) of Crown lands for timber production. The price and availability of this Canadian fiber depends, in large part, on the Company’s ability to replace or renew these agreements on acceptable terms or enter into acceptable alternative fibre supply arrangements with provincial authorities. The terms of any replacement, renewal or alternative arrangement are based on legislative and regulatory provisions as well as governmental policy. Therefore, changes in legislation, regulatory regimes or policy in the provinces in which we operate may reduce the availability of fiber and increase costs through the imposition of additional and more stringent harvesting, rehabilitation and silvicultural standards or the alteration of fee structures. Although we expect these agreements to be extended in the ordinary course as they come up for renewal, there can be no assurance that they will be renewed, extended or replaced in the future on acceptable terms, or at all, or that the amount of timber that the Company is allowed to harvest will not decrease.
Also, Aboriginal communities in Canada, often referred to as “First Nations”, have claimed substantial portions of land in various provinces based on claims of aboriginal title or traditional/historical interest. Canadian courts have recognized that Aboriginal people may possess rights in respect of land used or occupied by their ancestors and have encouraged the federal and provincial governments and Aboriginal people to resolve rights claims through the negotiation of treaties. We operate in territories in which Aboriginal people assert these types of rights and interests. To accommodate the traditional activities of these communities during forestry planning and operations, the Company has concluded agreements with many First Nations communities and other agreements are in development. These agreements support an approach of active engagement with Aboriginal communities that serves to ensure the identification of issues and facilitates constructive problem-solving.
In addition, regulatory developments and environmental litigation have caused, and may cause in the future, significant reductions in the amount of timber available for commercial harvest from non-Crown lands in Canada and privately-owned lands in the U.S. and France, thereby increasing prices for these sources of wood fiber. In Canada, for example, future legislation and policy changes, litigation advanced by environmental groups and Aboriginal communities concerning rights and limitations on harvesting and use of timberlands, the protection of endangered species, the promotion of forest diversity and the response to and prevention of wildfires could also affect wood fiber supply and pricing.
Finally, natural conditions, such as weather, timber growth cycles and restrictions on access to timberlands for harvesting (for example, due to prolonged wet or cold conditions) may also limit the availability and increase the price of wood (and, in particular, hardwood species), as may other factors, including damage by fire, insect infestation, disease, prolonged drought and natural disasters such as wind storms and hurricanes.
In sum, any sustained decrease in harvestable lands or wood supply, or increase in fiber prices, whether sourced from Crown lands in Canada or from private parties in Canada, the U.S. or France, could materially increase our costs and thereby materially impact our business, financial condition and results of operations.
We are subject to risks associated with doing business outside of the United States.
We have significant manufacturing facilities outside of the United States, in Canada and France, and a significant portion of our sales are to customers and customer locations outside of the United States, including Canada, China, Japan, South Korea, the European Union and other international markets. Sales to customers outside of the United States made up approximately 65
9
percent of our revenue in 2017. The manufacture and sale of our products in non-U.S. markets results in risks that are inherent in conducting business under international laws, regulations and customs. We expect international sales will continue to contribute significantly to our financial condition and future growth. The risks associated with our business outside the United States include:
• | maintaining and governing international subsidiaries and managing international operations; |
• | the need to comply with, changes in and reinterpretations of, the laws, regulations and enforcement priorities of the countries in which we manufacture and sell our products; |
• | responsibility to comply with anti-bribery laws such as the U.S. Foreign Corrupt Practices Act and similar anti-bribery laws in other jurisdictions; |
• | trade protection laws, policies and measures and other regulatory requirements affecting trade and investment, including loss or modification of exemptions for taxes and tariffs, imposition of new tariffs and duties and import and export licensing requirements, as discussed below in more detail; |
• | repatriating cash from foreign countries to the United States; |
• | changes in tax laws and their interpretations in the countries in which we do business, including the potential impact on the value of recorded or future deferred tax assets and liabilities; |
• | product damage or losses incurred during shipping; |
• | political instability and actual or anticipated military or political conflicts; |
• | economic instability, inflation, recessions and interest rate and currency exchange rate fluctuations, as discussed below in more detail; |
• | uncertainties regarding non-U.S. judicial systems, rules and procedures; and |
• | minimal or limited protection of intellectual property in some countries. |
These and other risks of doing business outside of the United States could adversely affect our business, financial condition and results of operations.
Our operations require substantial capital.
We require substantial capital for ongoing maintenance, repair and replacement of existing facilities and equipment. Although we maintain our production equipment with regular scheduled maintenance, key pieces of equipment and systems, some of which are large in scale, may need to be repaired or replaced periodically. Moreover, some of the facilities we acquired as part of the Tembec acquisition in 2017 have seen some capital expenditures deferred due to Tembec’s cash flows limitations in recent years, which may require the Company to make additional investments. The costs of repairing or replacing such equipment and the associated downtime of the affected production line could adversely affect our financial condition and results of operations. In addition, new or existing environmental regulations at times require additional capital expenditures for compliance. We believe our capital resources are currently adequate to meet our current projected operating needs, capital expenditures and other cash requirements. However, if for any reason we are unable to provide for our operating needs, capital expenditures and other cash requirements on reasonable economic terms, we could experience an adverse effect on our business, financial condition and results of operations.
Currency fluctuations may have a negative impact on our business, financial condition and results of operations.
We have manufacturing operations in the United States, Canada and France. The Company also sells its products all over the world, in either U.S dollars, Canadian dollars or Euros. As a result, the Company is exposed to movements in foreign currency exchange rates, and its earnings are affected by increases or decreases in the value of the U.S. dollar and in the value of the Canadian dollar and Euro relative to the U.S. dollar. In addition to ordinary course currency fluctuations, specific events such as Brexit have had, and could in the future have, impact on currency valuation. The Company’s risk management policy allows management, with oversight from the Audit Committee of its Board of Directors, to hedge a significant portion of its exposure to fluctuations in foreign currency exchange rates. To accomplish this, the Company has used, and may in the future continue to use, derivative instruments, such as currency options and foreign exchange forward contracts, to mitigate its exposure to fluctuations in foreign currency exchange rates, but there can be no assurance that the Company will be protected against substantial foreign currency fluctuations or that such fluctuations will not have a material adverse impact on our business, financial condition and results of operations.
Restrictions on trade through tariffs, countervailing and anti-dumping duties, quotas and other trade barriers, in the United States and internationally, could adversely affect our ability to access certain markets.
We manufacture our products in the United States, Canada and France, and sell them into more than 35 countries. Our financial results are highly dependent on our ability to sell our products globally. Trade barriers such as tariffs, countervailing and dumping duties, quotas and similar restrictions on trade have in the past, and could in the future, result in materially reduced revenues and profitability. For example:
10
In April of 2014, China’s Ministry of Commerce (“MOFCOM”) issued a final determination assessing a 17.2 percent duty on imports of our lower purity commodity viscose into China from our Jesup, Georgia and Fernandina Beach, Florida plants in the United States, and a 13 percent duty for similar imports into China from our plant in Temiscaming (Quebec), Canada).This product is primarily utilized to produce viscose staple fiber for use in the manufacture of fabrics. We expect MOFCOM’s final determination to remain in place for five years, but it may be extended for an additional five years at the discretion of MOFCOM. MOFCOM’s duty could have an adverse effect on our sales of commodity viscose into China.
The United States and Canada have a history dating to the early 1980s of trade disputes relating to the export of softwood lumber from Canada into the United States. Each dispute has been resolved via agreement or litigation, which generally involved some combination of duties and/or quotas as well as a return of all or most of the duties previously paid by Canadian softwood lumber producers. The Company operates six softwood lumber mills in Ontario and Quebec, Canada and, in 2017, sold approximately $226 million of softwood lumber into the United States from Canada. In October of 2015, a ten-year Softwood Lumber Agreement (the “SLA”) between the United States and Canada, which resolved the 2001-2006 lumber dispute between the countries, expired. No agreement was reached to extend or renew it, and as a result, after a one-year cooling off period the United States commenced a dumping investigation of lumber exports from Canada into the U.S. In 2017, anti-dumping and countervailing duties were assessed by the United States Department of Commerce (“Commerce”) on lumber exported into the United States, with the Company being assigned an anti-dumping duty rate of 6 percent and a countervailing duty rate of 14.1 percent. These duties are being legally challenged by Canada under both the North American Free Trade Agreement (“NAFTA”) and World Trade Organization (“WTO”) dispute resolution processes. The Company paid approximately $11 million in lumber duties in 2017, but expects to eventually receive most of these duties back in the event of a favorable ruling under the NAFTA or WTO process or a settlement of the dispute. Because the imposition of duties, together with strong lumber demand, has resulted in favorable lumber pricing in the United States in 2017, these duties have not yet had a material adverse impact on the Company’s business. However, no assurances can be given that the duties will be overturned or repaid through the legal process or a negotiated settlement, or that lumber pricing in the United States will continue to be sufficient to substantially offset their impact.
Separately, Commerce has also commenced an anti-dumping and countervailing duty investigation of imports of Canadian uncoated groundwood paper (including newsprint) into the United States, spurred by the complaints of a single company, North Pacific Paper Company, which owns one mill in Longview, Washington. The Company operates a newsprint mill in Kapuskasing, Ontario and, in 2017, sold $51 million of newsprint into the United States. In January of 2018, Commerce announced preliminary countervailing duties applicable against Canadian newsprint producers, with Company being assigned a preliminary countervailing duty rate of 6.5 percent. Preliminary anti-dumping duties, if any, could be assigned prior to the close of the first quarter of 2018. It is expected that Canada will appeal these duties through either or both of the NAFTA and WTO processes. It is also expected that these duties will result in increased newsprint prices in the United States, which would be expected to partially offset the duties, but the expected financial impact of the duties on the Company’s future newsprint sales into the United States will not be known until the investigation is completed and final duties are assessed. The Company cannot provide assurances concerning the potential impact of any final duties assessed, if any, or the likelihood of success of any appeal.
In 2017, the United States, Mexico and Canada began a process for the renegotiation of the North American Free Trade Agreement (“NAFTA”), which is expected to conclude in 2018. The Company manufactures various products in the United States and Canada, sells various products to customers in all three countries, and purchases various products and services from suppliers and contractors in all three countries. Until the outcome is clear, the Company can provide no assurances concerning the potential impact, if any, of this renegotiation on the business, financial condition or results of operations of the Company.
We depend on third parties for transportation services and increases in costs and the availability of transportation could adversely affect our business.
Our business depends on transportation services provided by third parties, both domestically and internationally. We rely on these providers for transportation of the products we manufacture as well as delivery of raw materials to our manufacturing facilities. A significant portion of the products we manufacture and raw materials we use are transported by railroad or trucks, and internationally by ship.
If any of our transportation providers were to fail to deliver the goods we manufacture in a timely manner, or damaged them during transport, we may be unable to sell those products at full value, or at all. Similarly, if any of these providers were to fail to deliver raw materials to us in a timely manner, we may be unable to timely manufacture our products in response to customer demand. Finally, if any of the ports we commonly use for international shipping, or the port system generally, were to suffer work stoppages, slowdowns or strikes, we could be adversely impacted.
11
Our business is subject to extensive environmental laws, regulations and permits that may restrict or adversely affect our ability to conduct our business.
Our plants are subject to stringent environmental laws, regulations and permits that may limit operations and production. Many of our operations are subject to stringent environmental laws, regulations and permits that contain conditions governing how we operate our facilities including how much and, in some cases, what types of products we can produce. These laws, regulations and permits, now and in the future, may restrict our current production, limit our ability to increase production and impose significant costs on our operations with respect to environmental compliance. It is expected that, overall, costs will likely increase over time as environmental laws, regulations and permit conditions become more stringent, and as the expectations of the communities in which we operate become more demanding.
Environmental laws, regulations and permits are constantly changing and are generally becoming more restrictive. Laws, regulations, permits and related judicial decisions and administrative interpretations affecting our business are subject to change, and new laws and regulations are frequently enacted. These laws and regulations may limit, prohibit or affect, among other things, air emissions, wastewater discharges, receiving water quality, remedial standards for contaminated property and groundwater, and the type of chemicals we use in our manufacturing processes. Over time, the complexity and stringency of these laws and regulations have increased and the enforcement of these laws and regulations has intensified. EPA has pursued a number of initiatives that, if implemented, could impose additional operational and pollution control obligations on industrial facilities like ours, especially in the area of air emissions and wastewater and storm water control. See Item 7 - Management’s Discussion and Analysis of Financial Condition and Results of Operations - Environmental Regulation for further information. Environmental laws and regulations will likely continue to become more restrictive and over time could adversely affect our business, financial condition and results of operations.
Environmental groups, Aboriginal communities (in Canada) and interested individuals may seek to delay or prevent a variety of operations. We expect that environmental groups, Aboriginal communities and interested individuals will intervene with increasing frequency in the regulatory processes in areas where we operate plants and manage and operate timberlands. External engagement with these groups and communities are requirements of our licenses to manage and operate timberlands in Quebec and Ontario, and in the case of Aboriginal communities are often required by treaty. Delays, restrictions and increased cost caused by the intervention of these groups or interested individuals could adversely affect our operating results. In addition to intervention in regulatory proceedings, interested groups and individuals may file or threaten to file lawsuits that seek to prevent us from obtaining permits, implementing capital improvements or pursuing operating plans. For example, in March 2014, litigation was commenced in federal court by the Altamaha Riverkeeper (“ARK”) alleging violations of federal and state environmental laws relating to permitted wastewater discharges from our Jesup plant (although it was dismissed by the court on summary judgment in 2015), and in January of 2016 the same group brought an action in the Georgia Office of Administrative Hearings against the Georgia Environmental Protection Division of the Natural Resources (“EPD”) in opposition to the issuance by EPD of a renewed wastewater treatment permit for our Jesup plant (an adverse decision was reversed by the Georgia Superior Court in 2017 and our permit was issued, which decision has been appealed by ARK to the Georgia Court of Appeals). See Item 3 - Legal Proceedings for a description of the pending legal proceedings with the Altamaha Riverkeeper.
We currently own or may acquire properties that require environmental remediation or otherwise are subject to environmental and other liabilities. We currently own, may have liability at formerly operated manufacturing facilities that we do not currently own, and may acquire additional facilities in the future, which are subject to environmental liabilities, such as remediation of soil, sediment and groundwater contamination and other liabilities. The cost of assessment and remediation of contaminated properties could be substantial and adversely affect financial results. These costs could include, without limitation, costs of investigation and assessment, corrective measures, installation of pollution control equipment and other remediation and closure costs, as well as third-party claims for property damage and personal injury as a result of alleged violations of, or liabilities arising out of, environmental laws and regulations. Although we believe we currently have adequate liabilities recorded, legal requirements relating to assessment and remediation of contaminated properties continue to become more stringent and there can be no assurance actual expenditures will not exceed current liabilities and forecasts, or that other presently unknown liabilities will not be discovered in the future. See Item 7 - Management’s Discussion and Analysis of Financial Condition and Results of Operations - Environmental Regulation and Note 9 - Liabilities for Disposed Operations.
The impacts of climate-related initiatives remain uncertain at this time.
There are numerous international, federal and state-level initiatives and proposals to address domestic and global climate issues. Within the United States, Canada and France, most of these would or currently regulate and/or tax, in one fashion or another, the production of carbon dioxide and other “greenhouse gases” to facilitate the reduction of carbon compound emissions to the atmosphere, and provide tax and other incentives to produce and use more “clean energy.”
12
In 2015, EPA issued its final Clean Power Plan rule to regulate greenhouse gas (“GHG”) emissions from electric power plants. The regulation is not directed at industry generally, but has very broad requirements that could affect fuel and energy prices for industrial energy consumers. Further, the rule directs states to customize their regulations, which could lead to different results in different states and create additional uncertainty. The rule was legally challenged by a number of states, industry groups and environmental organizations. In February of 2016, the U.S. Supreme Court granted a stay of its implementation while the rule is reviewed by lower courts. In October of 2017, EPA took steps to begin the regulatory process to repeal the Clean Power Plan. If not otherwise repealed or invalidated by the courts, it is unclear what impact this rule would have on our operations.
In December of 2015, the United States signed the Paris Agreement on climate change (the “Paris Agreement”), which was entered into under the auspices of the 1992 U.N. Framework Convention on Climate Change (the “UN Framework”), a treaty signed by the U.S. and ratified by the U.S. Senate. The Paris Agreement includes national targets for greenhouse gas emissions reductions and other provisions designed to reduce greenhouse gas emissions worldwide and provide financial incentives to developing nations to discourage greenhouse gas emissions. As of December 31, 2017, 197 countries have signed the Paris Agreement and approximately 175 have ratified it, but on June 1, 2017 President Trump announced that the United States would withdraw from the agreement, a process that will take four years.
The federal government of Canada has indicated its intent to regulate priority air pollutants and GHGs under the Clean Air Act and the Canadian Environmental Protection Act. Under the proposed targets, The Company’s Canadian pulp and paper mills may be required to reduce air pollutants, such as particulate matter (“PM”), sulphur oxides (“SOx”) emissions, nitrogen oxides (“NOx”) and GHGs. While industry consultations are ongoing with the federal government, the cost of making any such reductions is currently unknown; however, the requirements associated with PM, SOx and NOx are not expected to be material to the Company given its current operations and pollution control systems. In lieu of the Canadian federal programs, both Ontario and Quebec (as well as France) have recently implemented “cap and trade” programs and, at this time, only the Company’s Temiscaming site in Québec was a net purchaser of credits under these programs in 2017. In addition, the impact of these GHG credits to suppliers to the Company may be reflected in the cost of wood, other raw materials and energy purchased by the Company. To date, the cost of GHG credits purchased by our business has not been material, though no assurances can be given that they will not substantially increase in the future, and especially in Canada after 2020, because the law and cost of GHG credits after such date is currently not known..
Additional regulatory initiatives may be implemented to address GHG emissions and other climate-change-related concerns. If such initiatives are implemented we may be required to incur additional capital expenditures, operating costs or mitigating expenses, such as carbon taxes or other charges, to comply with any such initiatives. No assurance can be given that the increased costs associated with compliance of future GHG-related requirements will not have a material adverse effect on our business, financial condition and results of operations.
Our failure to maintain satisfactory labor relations could have a material adverse effect on our business.
As of December 31, 2017, approximately 74 percent of our global work force is unionized. As a result, we are required to negotiate the wages, benefits and other terms of employment with these employees collectively. Our financial results could be adversely affected if labor negotiations resulted in substantially higher compensation costs or materially restricted how we run our operations. In addition, our inability to negotiate acceptable contracts with any of these unions as existing agreements expire could result in strikes or work stoppages by the affected workers. Ten of our collective bargaining agreements, representing approximately 43 percent of our employees, either have expired in 2017 or are scheduled to expire in 2018 in their ordinary course, and negotiations relating to new agreements have commenced or will commence shortly. While we do not expect any significant labor interruptions, if our unionized employees were to engage in a strike or other work stoppage at one or more of our major facilities, we could experience a significant disruption of our operations, which could materially affect our business, financial condition and results of operations.
We are dependent upon attracting and retaining key personnel, the loss of whom could adversely affect our business.
We believe our success depends, to a significant extent, upon our ability to attract and retain key senior management and operations management personnel. Changing demographics and labor work force trends may result in the loss of knowledge and skills as experienced workers retire. Furthermore, some of our facilities are in relatively remote locations, which can adversely impact our ability to recruit and retain employees. Our failure to retain these key personnel and recruit qualified replacements for retiring employees could adversely affect our business, financial condition or results of operations.
Failure to develop new products or discover new applications for our existing products, or our inability to protect the intellectual property underlying such new products or applications, could have a negative impact on our business.
We have an active research and development program to develop new products and new applications for our existing products. However, there can be no assurance this program will be successful, either from a product development or commercialization
13
perspective, or that any particular invention, product or development, or the program as a whole, will lead to significant revenue or profit generation. Moreover, some of our new products and new applications may not contain intellectual property that can be protected under applicable law. Failure to generate meaningful revenue and profit from our research and product development efforts could adversely affect our business, financial condition and results of operations in the future.
The risk of loss of the Company’s intellectual property and sensitive business information, or disruption of its manufacturing operations, in each case due to cyberattacks or cyber security breaches, could adversely impact the Company.
Like most companies, the Company has been, and expects in the future to continue to be, subject to attempted cyberattacks. Cyberattacks or cyber security breaches could compromise the Company’s intellectual property and confidential business information, cause a disruption to the Company’s operations, or harm the Company’s reputation. For example, our Jesup facility purchases some of its electricity from the grid and, therefore, any cyberattack on the electricity transmission system could adversely impact Jesup’s operations, or a cyberattack could target valuable intellectual property relating to our products or operations. While the Company has implemented and maintains what it believes to be appropriate cyber security policies, programs and systems, there can be no assurance a cyberattack would not be successful, or that such a cyber security breach will not occur. Such an event could have a material adverse impact on the Company’s results of operations and financial condition.
We may need to make significant additional cash contributions to our retirement benefit plans if investment returns on pension assets are lower than expected or interest rates decline, and/or due to changes to regulatory, accounting and actuarial requirements.
We have a qualified non-contributory defined benefit pension plan, which covers many of our salaried and hourly employees in the United States. The Federal Pension Protection Act of 2006 requires certain capitalization levels be maintained in each of these benefit plans. Our non-U.S. pension plans, while currently fully funded, will also require periodic contributions to ensure that applicable legal requirements are met. Because it is unknown what the investment return on pension assets will be in future years or what interest rates may be at any point in time, no assurances can be given that applicable law will not require us to make future material plan contributions. In addition, it is possible new or additional accounting rules and changes to actuarial requirements (for example, if life expectancy assumptions for participants are increased) may also result in the need for additional contributions to the plans. Any such contributions could adversely affect our financial condition. See Item 7 - Management’s Discussion and Analysis of Financial Condition and Results of Operations - Critical Accounting Policies and Use of Estimates for additional information about these plans, including funding status.
We have debt obligations that could adversely affect our business and our ability to meet our obligations.
As of December 31, 2017, our total combined indebtedness was $1,241 million. This significant amount of debt could have important consequences to us and our investors, including:
• | requiring a substantial portion of our cash flows from operations to make interest payments on this debt; |
• | making it more difficult to satisfy debt service and other obligations; |
• | increasing the risk of a future credit ratings downgrade of our debt, which could increase future debt costs and limit the future availability of debt financing; |
• | increasing our vulnerability to general adverse economic and industry conditions; |
• | reducing the cash flows available to fund capital expenditures and other corporate purposes and to grow our business; |
• | limiting our flexibility in planning for, or reacting to, market or other changes in our businesses and industry; |
• | placing us at a competitive disadvantage to our competitors that may not be as highly leveraged with debt; and |
• | limiting our ability to borrow additional funds as needed or take advantage of business opportunities as they arise, pay cash dividends or repurchase common stock. |
To the extent we incur additional indebtedness, the risks described above could increase. In addition, our actual cash requirements in the future may be greater than expected. Our cash flows from operations may not be sufficient to repay all of the outstanding debt as it becomes due, and we may not be able to borrow money, sell assets or otherwise raise funds on acceptable terms, or at all, to refinance our debt.
Challenges in the commercial and credit environments may materially adversely affect our future access to capital.
Our ability to issue debt or equity or enter into other financing arrangements on acceptable terms could be materially adversely affected if there is a material decline in the pricing or sales volume for our products, or if significantly unfavorable changes in economic conditions occur. Volatility in the world financial markets could increase borrowing or other costs of capital or affect our ability to gain access to the capital markets, which could have a material adverse effect on our competitive position, business, financial condition, results of operations and cash flows.
14
We may need additional financing in the future to meet our capital needs or to make acquisitions, and such financing may not be available on favorable terms, if at all, and may be dilutive to existing stockholders.
We may need to seek additional financing for general corporate purposes. For example, we may need to increase our investment in research and development activities, make strategic investments in our facilities or require funding to invest in joint ventures or make acquisitions. We may be unable to obtain desired additional financing on terms favorable to us, if at all. For example, during periods of volatile credit markets, there is a risk that lenders, even those with strong balance sheets and sound lending practices, could fail or refuse to honor their credit commitments and obligations, including but not limited to extending credit up to the maximum permitted by a credit facility and otherwise accessing capital and/or honoring loan commitments. If our lenders are unable to fund borrowings under their loan commitments or we are unable to borrow, it could be difficult to replace such loan commitments on similar terms or at all. If adequate funds are not available on acceptable terms, we may be unable to fund growth opportunities, successfully develop or enhance products or respond to competitive pressures, any of which could negatively affect our business. If we raise additional funds through the issuance of equity securities, our stockholders will experience dilution of their ownership interest. If we raise additional funds by issuing debt, it may be subject to limitations on our operations and ability to pay dividends due to restrictive covenants in addition to those that are expected to be in place pursuant to our existing indebtedness.
The inability to effectively integrate the Tembec acquisition, and any future acquisitions we may make, may affect our results.
As part of our growth strategy, we may pursue acquisitions of complementary businesses and product lines, such as the November 2017 acquisition of Tembec Inc., and invest in joint ventures. The ability to grow through acquisitions or other investments depends upon our ability to identify, negotiate, complete and integrate suitable acquisitions or joint venture arrangements. For example, we have disclosed our synergy and business objectives relating to our acquisition of Tembec Inc. and achievement of these synergies and objectives is subject to a number of uncertainties, including risks attendant to successfully and effectively consolidating each company’s technologies, organizations, processes, controls, policies and operations. If we fail to successfully integrate the acquisition of Tembec Inc., or any future acquisition we may make, our business, financial condition and results of operations could be materially adversely affected.
We may not achieve the benefits anticipated from our announced transformation plan.
We are three years into a previously announced four-year plan to significantly reduce costs and increase cash flows. See Item 7 - Management’s Discussion and Analysis of Financial Condition and Results of Operations - Overview for more information. While we are on track to achieve our plan, failure to achieve the remaining anticipated benefits could adversely affect our financial condition and results of operations.
Risks Related to the Company’s Common Stock and Certain Corporate Matters
Your percentage of ownership in the Company may be diluted in the future.
In the future, your percentage ownership in the Company may be diluted because of equity issuances for acquisitions, capital market transactions or other corporate purposes, including equity awards we will grant to our directors, officers and employees. Our employees have options to purchase shares of our common stock and we anticipate our compensation committee will grant additional stock options or other stock-based awards to our employees. Such awards will have a dilutive effect on our earnings per share, which could adversely affect the market price of our common stock. From time to time, we will issue additional options or other stock-based awards to our employees under our employee benefits plans.
In addition, our amended and restated certificate of incorporation authorizes us to issue, without the approval of our stockholders, one or more classes or series of preferred stock having such designation, powers, preferences and relative, participating, optional and other special rights, including preferences over our common stock respecting dividends and distributions, as our board of directors generally may determine. The terms of one or more classes or series of preferred stock could dilute the voting power or reduce the value of our common stock. For example, we could grant the holders of preferred stock the right to elect some number of our directors in all events or on the happening of specified events or the right to veto specified transactions. Similarly, the repurchase or redemption rights or liquidation preferences we could assign to holders of preferred stock could affect the residual value of the common stock. In particular, note that, on August 10, 2016, the Company issued 1,725,000 shares of Mandatory Convertible Preferred Stock, Series A (the “Preferred Stock”), as more fully described in that certain Registration Statement on Form S-3 (File No. 333-209747) and Prospectus filed with the SEC on February 26, 2016, as amended by that certain Prospectus Supplement dated August 4, 2016 (the “Prospectus Supplement”). As a result of this offering, unless earlier converted, the Preferred Stock will automatically convert to common stock of the Company on a mandatory conversion date expected to be August 15, 2019, at a conversion rate described in the Prospectus Supplement. See Note 12 - Stockholders' Equity (Deficit) of our consolidated financial statements for more information on the Preferred Stock.
15
Our common stock ranks junior to the Preferred Stock with respect to dividends and amounts payable in the event of our liquidation.
Our common stock ranks junior to our Preferred Stock with respect to the payment of dividends and amounts payable in the event of our liquidation, dissolution or winding-up. This means, unless full cumulative dividends have been paid or set aside for payment on all outstanding Preferred Stock for all past dividend periods and the then current dividend period, subject to certain exceptions, no dividends may be declared or paid on our common stock. Likewise, in the event of our voluntary or involuntary liquidation, dissolution or winding-up, no distribution of our assets may be made to holders of our common stock until we have paid to Preferred Stock holders a liquidation preference equal to $100.00 per share plus accrued and unpaid dividends.
Certain provisions of the Preferred Stock could prevent or delay an acquisition of the Company, which could decrease the price of our common stock.
Certain terms of our Preferred Stock could make it more difficult or more expensive for a third party to acquire the Company. For example, as more fully described in the Prospectus Supplement, if a fundamental change (including, certain consolidation or merger involving us) were to occur on or prior to August 15, 2019, holders of our Preferred Stock may have the right to convert their Preferred Stock, in whole or in part, at a fundamental change conversion rate and be entitled to receive a fundamental change dividend make-whole amount equal to the present value of all remaining dividend payments on their Preferred Stock, plus accumulated and unpaid dividends, if any. These features of the Preferred Stock could increase the cost of acquiring us or otherwise discourage a third party from acquiring the Company.
Certain provisions in our amended and restated certificate of incorporation and bylaws, and of Delaware law, could prevent or delay an acquisition of the Company, which could decrease the trading price of our common stock.
Our amended and restated certificate of incorporation and amended and restated bylaws contain, and Delaware law contain, provisions intended to deter coercive takeover practices and inadequate takeover bids by making such practices or bids unacceptably expensive to the bidder and to encourage prospective acquirers to negotiate with our board of directors rather than to attempt a hostile takeover. These provisions include, among others:
• | the inability of our stockholders to call a special meeting; |
• | rules regarding how stockholders may present proposals or nominate directors for election at stockholder meetings; |
• | the right of our board to issue preferred stock without stockholder approval; |
• | the division of our board of directors into three classes of directors, with each class serving a staggered three-year term, and this classified board provision could have the effect of making the replacement of incumbent directors more time consuming and difficult; |
• | a provision that stockholders may only remove directors with cause; |
• | the ability of our directors, and not stockholders, to fill vacancies on our board of directors; and |
• | the requirement that the affirmative vote of stockholders holding at least 80 percent of our voting stock is required to amend certain provisions in our amended and restated certificate of incorporation and our amended and restated bylaws relating to the number, term and election of our directors, the filling of board vacancies, the calling of special meetings of stockholders and director and officer indemnification provisions. |
In addition, because we have not chosen to be exempt from Section 203 of the Delaware General Corporation Law (“DGCL”), this provision could also delay or prevent a change of control you may favor. Section 203 provides, subject to limited exceptions, persons that acquire, or are affiliated with a person that acquires, more than 15 percent of the outstanding voting stock of a Delaware corporation shall not engage in any business combination with that corporation, including by merger, consolidation or acquisitions of additional shares, for a three-year period following the date on which that person or its affiliates becomes the holder of more than 15 percent of the corporation’s outstanding voting stock.
We believe these provisions protect our stockholders from coercive or otherwise unfair takeover tactics by requiring potential acquirers to negotiate with our board of directors and by providing our board of directors with more time to assess any acquisition proposal. These provisions are not intended to make the Company immune from takeovers. However, these provisions will apply even if the offer may be considered beneficial by some stockholders and could delay or prevent an acquisition that our board of directors determines is not in the best interests of the Company and our stockholders. These provisions may also prevent or discourage attempts to remove and replace incumbent directors.
Our amended and restated certificate of incorporation designates the Court of Chancery of the State of Delaware as the sole and exclusive forum for certain types of actions and proceedings that may be initiated by our stockholders, which could discourage lawsuits against the Company and our directors and officers.
16
Our amended and restated certificate of incorporation provides that unless the board of directors otherwise determines, the Court of Chancery of the State of Delaware will be the sole and exclusive forum for any derivative action or proceeding brought on behalf of the Company, any action asserting a claim of breach of a fiduciary duty owed by any director or officer of the Company to the Company or its stockholders, creditors or other constituents, any action asserting a claim against the Company or any director or officer of the Company arising pursuant to any provision of the DGCL, or our amended and restated certificate of incorporation or bylaws, or any action asserting a claim against the Company or any director or officer of the Company governed by the internal affairs doctrine. However, if the Court of Chancery of the State of Delaware dismisses any such action for lack of subject matter jurisdiction, the action may be brought in another court sitting in the State of Delaware. This exclusive forum provision may limit the ability of our stockholders to bring a claim in a judicial forum that such stockholders find favorable for disputes with the Company or its directors or officers, which may discourage such lawsuits against the Company and its directors and officers. Alternatively, if a court were to find this exclusive forum provision inapplicable to, or unenforceable in respect of, one or more of the specified types of actions or proceedings described above, we may incur additional costs associated with resolving such matters in other jurisdictions, which could adversely affect our business, financial condition or results of operations.
There could be significant liability if the distribution of common stock of the Company that occurred as a result of its spin-off from Rayonier Inc. is determined to be a taxable transaction.
The Company was spun off from its former parent, Rayonier Inc. (“Rayonier”), on June 27, 2014 (the “Separation”). In connection with the Separation, Rayonier received a private letter ruling from the Internal Revenue Service (“IRS”) to the effect that, among other things, the Separation and the distribution of the Company‘s common stock will qualify as a transaction that is tax-free for U.S. federal income tax purposes under Sections 355 and 368(a)(1)(D) of the Internal Revenue Code, and it was a condition to the distribution that this private letter ruling shall not be revoked or modified in any material respect. In addition, Rayonier received an opinion from outside tax counsel to the effect that, with respect to certain requirements for tax-free treatment under Section 355 of the Code on which the IRS will not rule, such requirements will be satisfied. The ruling and the opinion rely on certain facts, assumptions, representations and undertakings from Rayonier and the Company regarding the past and future conduct of the companies’ respective businesses and other matters. If any of these facts, assumptions, representations or undertakings are incorrect or not satisfied, Rayonier and its shareholders may not be able to rely on the ruling or the opinion of tax counsel and could be subject to significant tax liabilities.
Notwithstanding a private letter ruling from the IRS and opinion of tax counsel, the IRS could determine on audit the Separation is taxable if it determines any of these facts, assumptions, representations or undertakings are not correct or have been violated or if it disagrees with the conclusions in the opinion that are not covered by the private letter ruling, or for other reasons, including as a result of certain significant changes in the share ownership of Rayonier or the Company after the separation. If the Separation is determined to be taxable for U.S. federal income tax purposes, Rayonier and its shareholders that are subject to U.S. federal income tax could incur significant U.S. federal income tax liabilities and the Company could incur significant liabilities. In connection with the Separation, Rayonier and the Company entered into a tax matters agreement, which describes the sharing of any such liabilities between Rayonier and the Company.
Item 1B. | Unresolved Staff Comments |
None.
17
Item 2. | Properties |
The following table details the significant properties we owned or leased at December 31, 2017:
Segment/Location | Production Capacity | Owned/Leased | |||
High Purity Cellulose Facilities (a): | |||||
Jesup, Georgia, United States | 330,000 metric tons of cellulose specialties or commodity products 245,000 metric tons of commodity products | Owned | |||
Fernandina Beach, Florida, United States | 155,000 metric tons of cellulose specialties or commodity products | Owned | |||
Temiscaming, Quebec, Canada | 150,000 metric tons of cellulose specialties or commodity products | Owned | |||
Tartas, France | 140,000 metric tons of cellulose specialties or commodity products | Owned | |||
Forest Products Group Facilities (b): | |||||
La Sarre, Quebec, Canada | 135,000 thousand board feet of lumber | Owned | |||
Bearn, Quebec, Canada | 110,000 thousand board feet of lumber | Owned | |||
Chapleau, Ontario, Canada | 135,000 thousand board feet of lumber | Owned | |||
Cochrane, Ontario, Canada | 160,000 thousand board feet of lumber | Owned | |||
Hearst, Ontario, Canada | 110,000 thousand board feet of lumber | Owned | |||
Huntsville, Ontario, Canada | 15,000 thousand board feet of lumber | Owned | |||
Kapuskasing, Ontario, Canada | 105,000 thousand board feet of lumber | Owned | |||
Pulp & Paper Facilities (a): | |||||
Temiscaming, Quebec, Canada | 300,000 metric tons of high-yield pulp | Owned | |||
Temiscaming, Quebec, Canada | 180,000 metric tons of paperboard | Owned | |||
Matane, Quebec, Canada | 270,000 metric tons of high-yield pulp | Owned | |||
Kapuskasing, Ontario, Canada | 205,000 metric tons of newspaper | Owned | |||
Wood Chipping Facilities (a): | |||||
Offerman, Georgia | 880,000 short green tons of wood chips | Owned | |||
Collins, Georgia | 780,000 short green tons of wood chips | Owned | |||
Eastman, Georgia | 350,000 short green tons of wood chips | Owned | |||
Barnesville, Georgia | 350,000 short green tons of wood chips | Owned | |||
Quitman, Georgia | 200,000 short green tons of wood chips | Owned | |||
Corporate and Other: | |||||
Jacksonville, Florida | Corporate Headquarters | Leased | |||
(a) | During 2017, these facilities produced at or near capacity levels for most of the year. |
(b) | Capacity represents targeted production for these facilities. On average, these facilities produce at approximately 85 percent of capacity due to economic conditions, wood availability, and downtime. |
Our manufacturing facilities are maintained through ongoing capital investments, regular maintenance and equipment upgrades. As a result, production capacities may vary from the amounts listed above.
Item 3. | Legal Proceedings |
The Company is engaged in various legal and regulatory actions and proceedings, and has been named as a defendant in various lawsuits and claims arising in the ordinary course of its business. While the Company has procured reasonable and customary insurance covering risks normally occurring in connection with its businesses, the Company has in certain cases retained some risk through the operation of self-insurance, primarily in the areas of workers’ compensation, property insurance, business interruption and general liability. While there can be no assurance, the ultimate outcome of these actions, either individually or in
18
the aggregate, is not expected to have a material adverse effect on the Company’s financial position, results of operations or cash flows, except as may be noted below.
Jesup Plant Permit
On January 27, 2016, the Altamaha Riverkeeper (“ARK”) filed a Petition for Hearing in the Office of Administrative Hearings for the State of Georgia, captioned Altamaha Riverkeeper, Inc. v. Environmental Protection Division (“EPD”), Georgia Department of Natural Resources, in which ARK appealed the issuance by EPD to the Company of a new permit for the treatment and discharge of waste water from the Jesup mill, which was to go into effect March 1, 2016. In the petition, ARK claims, among other things, that the issuance of the permit by EPD would violate Georgia’s narrative water quality standard, a rule promulgated by the Georgia Natural Resources Board pursuant to certain provisions of the Clean Water Act and the Georgia Water Quality Control Act. The petition seeks to have the permit invalidated and modified as demanded by ARK. On February 16, 2016, the Company moved to legally intervene, as a party-in-interest, in this matter (because EPD, as the permit issuer, is the named defendant) and its petition was granted by the administrative law judge (“ALJ”). The trial was held in June of 2016, and on September 30, 2016 the ALJ issued her decision. While the ALJ rejected many of ARK’s claims, she held there existed a reasonable potential for the Company’s treated effluent discharged to the Altamaha River to cause a violation of Georgia’s narrative water quality standard, but only under low (rather than “normal”) river flow conditions. As such, the ALJ reversed the issuance of the new permit by EPD and remanded the matter back to EPD for consideration and issuance of a permit that comports with this ruling.
The Company strongly disagreed with the decision and appealed it, as did EPD. The appeal was heard in the Superior Court of Wayne County, Georgia and on March 17, 2017 the Superior Court Judge issued an order reversing ALJ’s decision and ordering the permit affirmed as issued by EPD. As such, the Jesup plant is currently operating under the new permit. On April 13, 2017, ARK filed an application with the Georgia Court of Appeals in which it requested that the Court hear its appeal of the Superior Court decision, as the decision to hear such an appeal is discretionary on the part of the Court. The Court has granted the application and ARK has appealed the Superior Court decision. The Company believes the decision of the Superior Court is legally sound, and anticipates a decision from the Georgia Court of Appeals sometime in 2018.
Stockholder Lawsuit
On August 17, 2017, the City of Warren General Employees’ Retirement System filed a putative class action complaint against the Company, Paul Boynton, and Frank Ruperto in the United States District Court, Middle District of Tennessee, Nashville Division. The plaintiffs allege the Company made false statements in filings with the U.S. Securities and Exchange Commission (“SEC”) and other public statements related to certain litigation with Eastman Chemical, a customer of the Company, in third quarter and fourth quarter 2015, in violation of §§10(b) and 20(a) of the Exchange Act, causing unspecified damages to stockholders of the Company who purchased stock in the Company between October 29, 2014 and August 19, 2015. The applicable Eastman litigation was resolved via settlement in 2015. The Company was served with the complaint on August 28, 2017. On November 13, 2017, the Court appointed the Michigan Carpenters’ Pension Fund and Local 295 IBT Employer Group Pension Trust Fund as lead plaintiff, and a law firm to act as lead counsel. On January 10, 2018, the Company and the individual defendants filed a motion to dismiss the case for improper venue or, in the alternative, asked the court to transfer it to the U. S. District Court for the Middle District of Florida. Per the court scheduling order, the lead plaintiff filed a consolidated amended complaint (the “CAC”) on January 12, 2018. The CAC added Benson Woo, former CFO of the Company, as an additional defendant. The Company strongly disagrees with the allegations set forth in the complaint, believes the lawsuit is without merit and will continue to vigorously defend itself in this matter.
Item 4. | Mine Safety Disclosures |
Not applicable.
19
Part II
Item 5. | Market for Registrant’s Common Equity, Related Stockholder Matters and Issuer Purchases of Equity Securities |
Market Prices of our Common Stock; Dividends
The table below reflects, for the quarters indicated, the dividends declared per share of common stock and the range of market prices of our common stock as reported in the consolidated transaction reporting system of the New York Stock Exchange, the only exchange on which our stock is listed, under the trading symbol RYAM.
High (a) | Low (a) | Dividends | |||||||||
2017 | |||||||||||
Fourth Quarter | $ | 20.71 | $ | 13.57 | $ | 0.07 | |||||
Third Quarter | 15.99 | 13.24 | 0.07 | ||||||||
Second Quarter | 17.39 | 12.18 | 0.07 | ||||||||
First Quarter | 17.13 | 12.31 | 0.07 | ||||||||
2016 | |||||||||||
Fourth Quarter | 16.07 | 11.93 | 0.07 | ||||||||
Third Quarter | 15.83 | 10.72 | 0.07 | ||||||||
Second Quarter | 14.40 | 9.34 | 0.07 | ||||||||
First Quarter | 9.84 | 6.00 | 0.07 | ||||||||
a) High and low market prices are based on daily close values.
On February 23, 2018, our board of directors declared a first quarter cash dividend of $0.07 per share of common stock. The common stock dividend is payable March 30, 2018, to stockholders of record on March 16, 2018. There were approximately 51,681,748 shares of stock outstanding and 4,813 record holders on February 20, 2018. On January 16, 2018 our board of directors declared a cash dividend of $2.00 per share of our Preferred Stock. The dividend was paid on February 15, 2018 to holders of record of our Preferred Stock as of February 1, 2018.
The declaration and payment of future dividends on our common stock will be at the discretion of our board of directors and will be dependent upon our financial condition, results of operations, capital requirements, and other factors our board of directors deems relevant. Certain of our debt facilities may also restrict the declaration and payment of dividends, depending upon our then current compliance with certain covenants. In addition, the terms of our Preferred Stock provide that, unless full cumulative dividends have been paid or set aside for payment on all outstanding Preferred Stock for all prior dividend periods, no dividends may be declared or paid on our common stock. Dividends on our Preferred Stock are payable on a cumulative basis if and when they are declared by our board of directors. If declared, dividends will be paid at an annual rate of 8 percent of the liquidation preference of $100 per share. Dividend payment dates are February 15, May 15, August 15 and November 15 of each year, through August 15, 2019. Dividends may be paid in cash or, subject to certain limitations, in shares of common stock or any combination of cash and shares of common stock. See Item 1A — Risk Factors and Note 12 — Stockholders' Equity (Deficit) of our consolidated financial statements for more information about our Preferred Stock.
20
Issuer Purchases of Equity Securities
The following table provides information regarding our purchases of Rayonier Advanced Materials common stock during the quarter ended December 31, 2017:
Period | Total Number of Shares Purchased (a) | Average Price Paid per Share | Total Number of Shares Purchased as Part of Publicly Announced Plans or Programs | Maximum Number of Shares that May Yet Be Purchased Under the Plans or Programs | ||||||||
September 24 to October 28 | 345 | $ | 13.94 | — | — | |||||||
October 29 to November 25 | — | — | — | — | ||||||||
November 26 to December 31 | — | — | — | — | ||||||||
Total | 345 | — | ||||||||||
(a) | Repurchased to satisfy the minimum tax withholding requirements related to the vesting of restricted stock under the Rayonier Advanced Materials Incentive Stock Plan. |
Securities Authorized for Issuance under Equity Compensation Plans
See Part III, Item 12 of this report for information relating to our equity compensation plans.
Stock Performance Graph
The following graph compares the performance of Rayonier Advanced Material’s common stock (assuming reinvestment of dividends) with a broad-based market index, Standard & Poor’s (“S&P”) Small Cap 600, and an industry-specific index, the S&P 500 Materials Index. The initial date on the graph, June 27, 2014, reflects the date we separated from our former parent Rayonier. The table and related information shall not be deemed to be “filed” with the SEC, nor shall such information be incorporated by reference into any future filing under the Securities Act of 1933 or Securities Exchange Act of 1934, each as amended, except to the extent that we specifically incorporate it by reference into such filing.
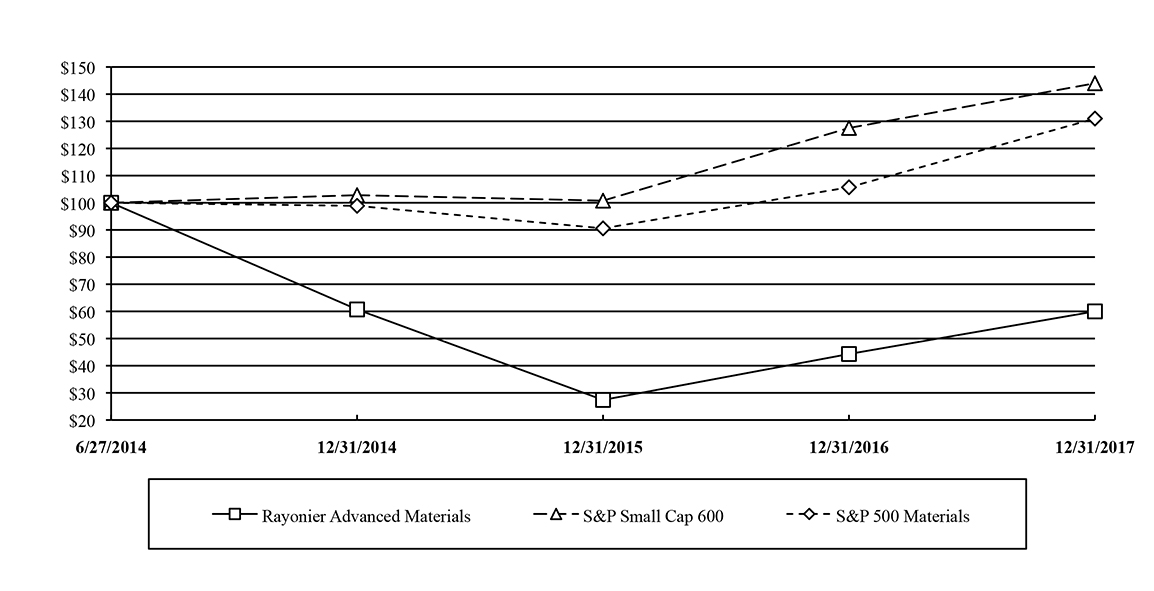
21
The data in the following table was used to create the previous graph:
6/27/2014 | 12/31/2014 | 12/31/2015 | 12/31/2016 | 12/31/2017 | ||||||
Rayonier Advanced Materials | $100 | $61 | $27 | $44 | $60 | |||||
S&P Small Cap 600 | $100 | $103 | $101 | $128 | $144 | |||||
S&P 500 Materials Index | $100 | $99 | $91 | $106 | $131 | |||||
Item 6. | Selected Financial Data |
The following financial data should be read in conjunction with our consolidated financial statements. Prior to 2014, the following selected financial data consists of Rayonier’s performance fibers business for the years presented. For 2014, the balance sheet represents our financial position as of December 31, 2014 and the statement of income and statement of cash flows are presented as if the performance fibers business had been combined with us for the year ended December 31, 2014.
(millions of dollars except per share amounts) | 2017 | 2016 | 2015 | 2014 | 2013 | ||||||||||||||
Statement of Income Data: | |||||||||||||||||||
Net Sales | $ | 961 | $ | 869 | $ | 941 | $ | 958 | $ | 1,047 | |||||||||
Gross margin | 139 | 182 | 202 | 224 | 333 | ||||||||||||||
Operating income | 57 | 138 | 120 | 63 | 289 | ||||||||||||||
Net income | 325 | 73 | 55 | 32 | 220 | ||||||||||||||
Diluted earnings per share of common stock (a) | 5.81 | 1.55 | 1.30 | 0.75 | 5.21 | ||||||||||||||
Dividends declared per share of common stock | 0.28 | 0.28 | 0.28 | 0.14 | — | ||||||||||||||
Balance Sheet Data: | |||||||||||||||||||
Total assets | $ | 2,643 | $ | 1,422 | $ | 1,279 | $ | 1,293 | $ | 1,120 | |||||||||
Property, plant and equipment, net | 1,408 | 801 | 804 | 843 | 846 | ||||||||||||||
Total debt | 1,241 | 783 | 858 | 934 | — | ||||||||||||||
Stockholders’ equity (deficit) | 694 | 212 | (17 | ) | (62 | ) | 968 | ||||||||||||
Statement of Cash Flows Data: | |||||||||||||||||||
Cash provided by operating activities | $ | 130 | $ | 232 | $ | 202 | $ | 188 | $ | 258 | |||||||||
Cash used for investing activities | (277 | ) | (87 | ) | (78 | ) | (90 | ) | (251 | ) | |||||||||
Cash provided by (used in) financing activities | (84 | ) | 80 | (89 | ) | (31 | ) | (7 | ) | ||||||||||
Capital expenditures | (75 | ) | (89 | ) | (78 | ) | (75 | ) | (96 | ) | |||||||||
Non GAAP Measures (b): | |||||||||||||||||||
EBITDA | $ | 480 | $ | 235 | $ | 209 | $ | 149 | $ | 363 | |||||||||
Adjusted EBITDA | $ | 212 | $ | 226 | $ | 238 | $ | 267 | $ | 369 | |||||||||
Adjusted Free Cash Flows | $ | 91 | $ | 147 | $ | 124 | $ | 113 | $ | 143 | |||||||||
(a) | In conjunction with the Separation, 42,176,565 shares of our common stock were distributed to Rayonier shareholders on June 27, 2014. For comparative purposes, this amount has been assumed to be outstanding as of the beginning of each period prior to the separation from Rayonier in the calculation of Basic Earnings Per Share. For the years ended December 31, 2016 and 2017, basic and diluted earnings per share include the impact of dividends on the Company’s Preferred Stock. See Note 12 — Stockholders' Equity (Deficit) of our consolidated financial statements for more information. |
(b) | EBITDA, adjusted EBITDA and adjusted free cash flows are non-GAAP measures. See “Note about Non-GAAP Financial Measures” on page two for limitations associated with non-GAAP measures. Also see Item 7 — Management’s Discussion and Analysis of Financial Condition and Results of Operations — Performance and Liquidity Indicators for definitions of these non-GAAP measures as well as a reconciliation of EBITDA, adjusted EBITDA and adjusted free cash flows to their most directly comparable GAAP financial measure. |
22
Item 7. | Management’s Discussion and Analysis of Financial Condition and Results of Operations |
Overview
We are transforming our business and growing EBITDA to drive long-term value for our stockholders. Our plan centers on the following four strategic pillars:
•Cost Transformation - driving sustainable cost reductions by fostering a culture of continuous improvement
• | New Products - expanding our business by developing next generation cellulose fibers and other value-added product utilizing our cellulose processing technology, expertise and co-products. We have made significant progress in developing and applying proprietary technologies to new products in many of the end-market segments we serve. |
• | Market Optimization - maximizing the profitability of our existing products and assets by optimizing the intersection of our customers’ needs, our manufacturing capabilities and transportation costs to drive higher value for our customers and our Company. |
• | Disciplined Capital Allocation - delivering a capital allocation strategy that maximizes our risk adjusted returns. Our first priority is to delever our balance sheet through EBITDA growth and repayment of indebtedness in order to reach our target net leverage ratio of 2.5 times EBITDA. We will allocate capital across high return investments in our facilities, acquisitions and other external investments to grow profitability, as well as return capital to stockholders through buybacks and dividends. |
On November 17, 2017, we acquired Tembec which was engaged in the manufacture of cellulose specialties, commodity products, forest products and pulp & paper. The Acquisition created a combined company with leading positions with acetate and ethers high purity cellulose end-use markets, as well as, a more diversified earnings stream given the addition of the forest products, pulp and paper businesses. Consequently, we now operate in the following business segments:
•High Purity Cellulose
•Forest Products
•Pulp & Paper
High Purity Cellulose
We are the leading global producer of cellulose specialties. Pricing for our cellulose specialties products is typically set annually in the fourth quarter for the following year based on discussions with customers and the terms of contractual arrangements. We also produce commodity products, primarily commodity viscose and absorbent materials. Pricing for commodity products is typically referenced to published indexes or based on publicly available spot market prices.
Our four production facilities have a combined annual production capacity of approximately 775,000 metric tons of cellulose specialties or commodity products. Additionally, we have dedicated approximately 245,000 metric tons of production to commodity products.
Wood fiber, chemicals, and energy represent approximately 35 percent, 15 percent and 5 percent, respectively, of the per metric ton cost of sales. Labor, manufacturing and maintenance supplies, depreciation, manufacturing overhead and transportation costs represent the remaining cost of sales.
Forest Products
Pricing for lumber is typically referenced to published indexes marketed through our internal sales team. Our seven production facilities have a targeted capacity of approximately 770 million board feet of lumber.
Wood and energy represents approximately 47 percent and 5 percent, respectively, of the per million board feet cost of sales. Labor, manufacturing and maintenance supplies, depreciation, manufacturing overhead and transportation costs represent the remaining cost of sales.
Pulp & Paper
23
Pricing for paperboard, high-yield pulp and newsprint is typically referenced to published indices marketed through our internal sales team. Our four production facilities have the capacity to produce 180,000 metric tons of paperboard, 570,000 metric tons of high-yield pulp and 205,000 metric tons of newsprint.
Wood fiber, chemicals, and energy represent approximately 36 percent, 15 percent and 12 percent, respectively, of the per metric ton cost of sales. Labor, manufacturing and maintenance supplies, depreciation, manufacturing overhead and transportation costs represent the remaining cost of sales.
Outlook
High Purity Cellulose
Cellulose specialties prices are anticipated to decline 4 to 5 percent in 2018 primarily due to lower acetate prices, offset by improved pricing in the ethers and other cellulose specialties products. We believe our 2018 acetate pricing is now consistent with our competition. Demand for ethers and other cellulose specialties continues to show strength and will provide opportunities for us to expand sales in these faster growing end-uses. Additionally, our expanded capabilities in ethers and its enhanced innovation footprint should allow us to further diversify its portfolio of products.
Forest Products
Increased demand from the steady growth of the U.S. housing market is expected to result in record lumber prices in 2018. Our business is currently operating under countervailing and anti-dumping duties on lumber sold into the U.S. These duties are anticipated to affect approximately 58 percent of its sales in this segment and reduce operating income and EBITDA by approximately $25 million during 2018, but should not impact sales volumes.
Pulp & Paper
High-yield pulp prices are currently at peak levels due to increased Chinese demand driven primarily from the reduction of imports of recycled fiber. This demand is not expected to continue at its current level throughout 2018. In paperboard, markets are expected to remain stable but peak pulp prices, which benefit our high-yield pulp, will impact the cost of raw materials. Finally, in newsprint, reduced industry production capacity has resulted in a temporary supply imbalance and higher pricing; however, continued decreases in demand and the potential for final countervailing and anti-dumping duties are expected to negatively impact results.
Capital Allocation and Investment
We are anticipating to spend approximately $100 to $110 million in maintenance capital expenditures across our businesses in 2018. In addition, we have identified approximately $90 million of potential strategic capital expenditures in its facilities with attractive payback periods of 1 to 3 years which may be acted upon over the next 3 years. These capital investment opportunities are predominantly in the High Purity Cellulose and Forest Products segments. We currently anticipate spending approximately $45 million on high-return projects in 2018, with an average pay-back of less than 2 years.
Reconciliation of Non-GAAP measures
For a reconciliation of EBITDA to net income, see Item 7 — Management’s Discussion and Analysis of Financial Condition and Results of Operations — Performance and Liquidity Indicators.
Critical Accounting Policies and Use of Estimates
The preparation of financial statements requires us to make estimates, assumptions and judgments that affect our assets, liabilities, revenues and expenses, and to disclose contingent assets and liabilities in our consolidated financial statements. We base these estimates and assumptions on historical data and trends, current fact patterns, expectations and other sources of information we believe are reasonable. Actual results may differ from these estimates.
Revenue Recognition
We generally recognizes sales when the following criteria are met: (i) persuasive evidence of an agreement exists, (ii) delivery has occurred, (iii) the price to the buyer is fixed and determinable and (iv) collectibility is reasonably assured. Generally, title passes upon delivery to the agreed upon location. Based on the time required to reach each location, customer orders are generally received in one period with the corresponding revenue recognized in a subsequent period. As such, there could be substantial
24
variation in orders received and revenue recognized from period to period. Payments from customers made in advance of the recognition of revenue are included in accrued customer incentives and prepayments.
Property, Plant & Equipment
Depreciation expense is computed using the units-of-production method for our High Purity Cellulose and Pulp & Paper plant and equipment and the straight-line method on all other property, plant and equipment over the useful economic lives of the assets involved. The total units of production used to calculate depreciation expense is determined by factoring annual production days, based on normal production conditions, by the economic useful life of the asset involved. The physical life of equipment, however, may be shortened by economic obsolescence caused by environmental regulation, competition or other causes. We depreciate our non-production assets, including office, lab and transportation equipment, using the straight-line depreciation method over 3 to 25 years. Buildings and land improvements are depreciated using the straight-line method over 15 to 35 years and 5 to 30 years, respectively. We believe these depreciation methods are the most appropriate, versus other generally accepted accounting methods, as they most closely match revenues with expenses.
Gains and losses on the retirement of assets are included in operating income. Long-lived assets are reviewed annually for impairment or whenever events or changes in circumstances indicate the carrying amount of an asset may not be recoverable. Recoverability of assets that are held and used is measured by net undiscounted cash flows expected to be generated by the asset. Property, plant and equipment are grouped for purposes of evaluating recoverability at the combined plant level, the lowest level for which independent cash flows are identifiable. If such assets are considered to be impaired, the impairment to be recognized is measured by the amount by which the carrying value exceeds the fair value of the assets. Assets to be disposed of are reported at the lower of the carrying amount or fair value less costs to sell.
Environmental liabilities associated with disposed operations
At December 31, 2017, we had $164 million of accrued liabilities for environmental costs relating to disposed operations. Numerous cost assumptions are used in estimating these obligations. Factors affecting these estimates include changes in the nature or extent of contamination, changes in the content or volume of the material discharged or treated in connection with one or more impacted sites, requirements to perform additional or different assessment or remediation, changes in technology that may lead to additional or different environmental remediation strategies, approaches and work-plans, discovery of additional or unanticipated contaminated soil, groundwater or sediment on or off-site, changes in remedy selection, changes in law or interpretation of existing law and the outcome of negotiations with governmental agencies or non-governmental parties. We periodically review our environmental liabilities and also engage third-party consultants to assess our ongoing remediation of contaminated sites. Quarterly, we review our environmental liabilities related to assessment activities and remediation costs and adjust them as necessary. Liabilities for financial assurance, monitoring and maintenance activities and other activities are assessed annually. A significant change in any of these estimates could have a material effect on the results of our operations. See Note 9 — Liabilities for Disposed Operations of our consolidated financial statements for more information.
Determining the adequacy of pension and other postretirement benefit assets and liabilities
Our defined benefit pension and postretirement plans for employees in the U.S., Canada and France require numerous estimates and assumptions to determine the proper amount of pension and postretirement liabilities and annual expense to record in our financial statements. The key assumptions include discount rate, return on assets, salary increases, health care cost trends, mortality rates, longevity and service lives of employees. Although authoritative guidance on how to select most of these assumptions exists, we exercise some degree of judgment when selecting these assumptions based on input from our actuary and other advisors. Different assumptions, as well as actual versus expected results, would change the periodic benefit cost and funded status of the benefit plans recognized in the financial statements.
Our long-term return plan assets assumption was established based on historical long-term rates of return on broad equity and bond indices, discussions with our actuary and investment advisors and consideration of the actual historical annualized rate of returns. In determining future pension obligations, we select a discount rate based on information supplied by our actuary. The actuarial rates are developed by models which incorporate high-quality (AA rated), long-term corporate bond rates into their calculations. The discount rate decreased from 3.88 percent at December 31, 2016 to 3.55 percent at December 31, 2017.
Our defined pension plans were underfunded by $139 million at December 31, 2017. Excluding the impact of the acquisition of Tembec, the funded status improved in 2017 due to actual investment performance and a $10 million voluntary contribution to the pension plan in the current year offset by a decrease in the discount rate. Excluding the Tembec pension plans, we did not have any mandatory contributions in 2017, 2016 or 2015. In September 2017 and July 2016, we made $10 million voluntary contributions to the pension plan. There were no voluntary contributions to our qualified pension plan in 2015. Future contribution requirements will vary depending on actual investment performance, changes in valuation assumptions, interest rates and legal requirements to maintain a certain funding status.
25
In 2018, we expect pension expense to increase due to the Acquisition and lower discount rates. Future pension expense will be impacted by many factors including actual investment performance, changes in discount rates, timing of contributions and other employee related matters. See Note 16 — Employee Benefit Plans of our consolidated financial statements for more information.
The sensitivity of pension expense and projected benefit obligation related to our pension plans to changes in economic assumptions is highlighted below:
Impact on (in millions): | |||
Change in Assumption | Annual Pension Expense | Projected Benefit Obligation | |
50 bp decrease in discount rate | 6 | 71 | |
50 bp increase in discount rate | (5) | (63) | |
50 bp decrease in long-term return on assets | 5 | ||
50 bp increase in long-term return on assets | (5) | ||
Realizability of both recorded and unrecorded tax assets and tax liabilities
We have recorded certain deferred tax assets we believe will be realized in future periods. The recognition of these tax assets is based on our historical profitability and unlimited carryforward periods on a majority of our deferred tax assets. These assets are reviewed periodically in order to assess their realizability. This review requires management to make assumptions and estimates about future profitability affecting the realization of these tax assets. If the review indicates the realizability may be less than likely, a valuation allowance is recorded.
Our income tax returns are subject to examination by U.S. federal and state taxing authorities as well as foreign jurisdictions, including Canada and France. In evaluating the tax benefits associated with various tax filing positions, we record a tax benefit for an uncertain tax position if it is more-likely-than-not to be realized upon ultimate settlement of the issue. We record a liability for an uncertain tax position that does not meet this criterion. The liabilities for unrecognized tax benefits are adjusted in the period in which it is determined the issue is settled with the taxing authorities, the statute of limitations expires for the relevant taxing authority to examine the tax position or when new facts or information become available. See Note 18 — Income Taxes of our consolidated financial statements for more information.
Business Combinations
We allocate the total purchase price of assets acquired and liabilities assumed based on their estimated fair value as of the business combination date. In developing estimates of fair values for long-lived assets, including identifiable intangible assets, we utilize a variety of inputs including forecasted cash flows, anticipated growth rates, discount rates, estimated replacement costs and depreciation and obsolescence factors. Determining the fair value for specifically identified intangible assets such as customer lists and trade-names involves judgment. We may refine our estimates and make adjustments to the assets acquired and liabilities assumed over a measurement period, not to exceed one year. Upon the conclusion of the measurement period or the final determination of the values of assets acquired and liabilities assumed, whichever comes first, any subsequent adjustments are charged to the consolidated statements of income. Subsequent actual results of the underlying business activity supporting the specifically identified intangible assets could change, requiring us to record impairment charges or adjust their economic lives in future periods.
New Accounting Standards
See Note 1 — Nature of Operations and Basis of Presentation of our consolidated financial statements for a discussion of recently issued accounting pronouncements that may affect our financial results and disclosures in future periods.
26
Summary of our results of operations for the three years ended December 31:
Financial Information (in millions) | 2017 | 2016 | 2015 | ||||||||
Net Sales | |||||||||||
High Purity Cellulose | $ | 867 | $ | 869 | $ | 941 | |||||
Forest Products | 34 | — | — | ||||||||
Pulp & Paper | 65 | — | — | ||||||||
Eliminations | (5 | ) | — | — | |||||||
Total Net Sales | 961 | 869 | 941 | ||||||||
Cost of Sales | (822 | ) | (687 | ) | (739 | ) | |||||
Gross Margin | 139 | 182 | 202 | ||||||||
Selling, general and administrative expenses | (80 | ) | (38 | ) | (48 | ) | |||||
Other operating expense, net | (2 | ) | (6 | ) | (34 | ) | |||||
Operating Income | 57 | 138 | 120 | ||||||||
Interest expense and other, net | (37 | ) | (35 | ) | (37 | ) | |||||
Gain on bargain purchase | 317 | — | — | ||||||||
Gain on derivative instrument | 8 | — | — | ||||||||
Gain on debt extinguishment | — | 9 | — | ||||||||
Income Before Income Taxes | 345 | 112 | 83 | ||||||||
Income Tax Expense | (20 | ) | (39 | ) | (28 | ) | |||||
Net Income | $ | 325 | $ | 73 | $ | 55 | |||||
Other Data | |||||||||||
Average Sales Prices: | |||||||||||
High Purity Cellulose ($ per metric ton): | |||||||||||
Cellulose specialties | $ | 1,460 | $ | 1,525 | $ | 1,641 | |||||
Commodity products | 733 | 668 | 671 | ||||||||
Forest Products ($ per thousand board feet): | 460 | — | — | ||||||||
Pulp & Paper ($ per metric ton): | |||||||||||
Paperboard | 1,132 | — | — | ||||||||
High-Yield pulp | 616 | — | — | ||||||||
Newsprint | 513 | — | — | ||||||||
Sales Volumes: | |||||||||||
High Purity Cellulose (thousands of metric tons): | |||||||||||
Cellulose specialties | 453 | 456 | 467 | ||||||||
Commodity products | 250 | 249 | 247 | ||||||||
Forest Products (millions of board feet): | 56 | — | — | ||||||||
Pulp & Paper (thousands of metric tons): | |||||||||||
Paperboard | 17 | — | — | ||||||||
High-Yield pulp | 58 | — | — | ||||||||
Newsprint | 21 | — | — | ||||||||
Gross Margin % | 14.5 | % | 20.9 | % | 21.5 | % | |||||
Operating Margin % | 5.9 | % | 15.9 | % | 12.8 | % | |||||
Effective Tax Rate % | 5.7 | % | 34.9 | % | 33.3 | % | |||||
27
Results of Operations, Year Ended December 31, 2017 versus December 31, 2016
2016 | Changes Attributable to: | 2017 | |||||||||||||||||
Net Sales (in millions) | Price | Volume/Mix | Acquisition | ||||||||||||||||
High Purity Cellulose: | |||||||||||||||||||
Cellulose specialties | $ | 695 | $ | (28 | ) | $ | (30 | ) | $ | 25 | $ | 662 | |||||||
Commodity products and other | 174 | 16 | (5 | ) | 20 | 205 | |||||||||||||
Forest Products | — | — | — | 34 | 34 | ||||||||||||||
Pulp & Paper | — | — | — | 65 | 65 | ||||||||||||||
Eliminations | — | — | — | (5 | ) | $ | (5 | ) | |||||||||||
Total Net Sales | $ | 869 | $ | (12 | ) | $ | (35 | ) | $ | 139 | $ | 961 | |||||||
For the year ended December 31, 2017, sales were $961 million compared to $869 million in the prior year, an increase of $92 million, or 11 percent. Excluding the impact of Tembec sales of $139 million since closing November 17, 2017, sales decreased $47 million or 5 percent compared to the prior year. The $47 million decrease in net sales was driven by a decline in cellulose specialties sales prices of 4 percent, as expected, and a 4 percent decline in cellulose specialties sales volumes primarily due to the impacts of Hurricane Irma and an operational disruption at a major customer. Additionally, commodity sales volumes decreased 3 percent due to discrete production issues and the impact of Hurricane Irma. These declines were partially offset by improved commodity sales prices due to stronger commodity markets resulting in higher sales prices for both commodity viscose and absorbent materials.
Operating Income (in millions) | Gross Margin Changes Attributable to (a): | |||||||||||||||||||||
2016 | Price | Volume/ Sales Mix | Cost | Acquisition | SG&A and other | 2017 | ||||||||||||||||
Operating Income | $ | 138 | (12 | ) | (21 | ) | (17 | ) | — | (31 | ) | $ | 57 | |||||||||
Operating Margin % | 15.9 | % | (1.2 | )% | (1.9 | )% | (2.1 | )% | (1.6 | )% | (3.2 | )% | 5.9 | % | ||||||||
(a) | Computed based on contribution margin. |
For the year ended December 31, 2017, operating income was $57 million compared to $138 million in the prior year, a decrease of $81 million. The decrease reflects lower cellulose specialties sales prices, lower cellulose specialties and commodity sales volumes, and higher commodity product sales prices, as previously discussed. Costs increased $17 million as savings from cost transformation were more than offset by costs incurred to achieve additional future savings, higher production expenses due to sales mix, chemical prices and production issues, as well as, investments in customer product development. The operating income from Tembec was break-even since closing November 17, 2017, due to the inventory write-up to fair value of $23 million and Acquisition related costs of $3 million. Selling, general and administrative expenses and other increased as a result of approximately $31 million of Acquisition related costs.
Interest expense and other, net was $37 million for 2017, compared to $35 million in the prior year. Interest expense increased in 2017 due to lower average debt balances, more than offset by higher LIBOR interest rates on floating rate debt and the increased amortization of deferred financing costs as a result of the refinancing of the Company’s term loans. See Note 8 — Debt and Capital Leases of our consolidated financial statements for more information.
In connection with the acquisition of Tembec, we recognized a gain on bargain purchase primarily as a result of the elimination of Tembec’s valuation allowance associated with certain deferred tax assets. As a result of the refinancing of Tembec’s debt, we expect future taxable income would be adequate to realize the benefit of the tax assets. See Note 3 — Recent Acquisition of our consolidated financial statements for more information.
In connection with the acquisition of Tembec, we entered into a foreign currency collar, a derivative, as an economic hedge of the anticipated cash flows denominated in Canadian dollars. The derivative was not deemed a hedge for accounting purposes and, as a result, we recorded a realized gain on derivative instrument of $8 million in 2017. See Note 3 — Recent Acquisition of our consolidated financial statements for more information.
Our effective tax rate for 2017 was 5.7 percent compared to 34.9 percent in 2016. The decrease is primarily due to the non-taxable gain on bargain purchase partially offset by the impact of the U.S. tax reform legislation and certain non-deductible acquisition related costs. See Note 18 — Income Taxes of our consolidated financial statements for more information.
28
Results of Operations, Year Ended December 31, 2016 versus December 31, 2015
2015 | Changes Attributable to: | 2016 | |||||||||||||
Sales (in millions) | Price | Volume/Mix | |||||||||||||
Cellulose specialties | $ | 767 | $ | (53 | ) | $ | (19 | ) | $ | 695 | |||||
Commodity products and other | 174 | (1 | ) | 1 | 174 | ||||||||||
Total sales | $ | 941 | $ | (54 | ) | $ | (18 | ) | $ | 869 | |||||
Total net sales were $72 million lower, or approximately 8 percent, in 2016, primarily due to a 7 percent decline in cellulose specialties prices which reflects the anticipated declines from the prior year. Additionally, cellulose specialties sales volumes decreased approximately 11 thousand tons, or 2 percent as a result of weak market conditions. This decrease was slightly less than expected due to the timing of revenue recognition in the fourth quarter of 2016.
Operating Income (in millions) | Gross Margin Changes Attributable to (a): | ||||||||||||||||||||||
2015 | Price | Volume/ Sales Mix | Cost | SG&A and other | 2016 | ||||||||||||||||||
Operating Income | $ | 120 | $ | (54 | ) | $ | (14 | ) | $ | 46 | $ | 40 | $ | 138 | |||||||||
Operating Margin % | 12.8 | % | (5.3 | )% | (1.5 | )% | 5.3 | % | 4.6 | % | 15.9 | % | |||||||||||
(a) | Computed based on contribution margin. |
In 2016, operating income and margin percentage increased $18 million and 3.1 percentage points versus prior year. Lower cellulose specialties prices and sales volumes were partially offset by lower costs driven by the Company’s cost improvements. Selling, general and administrative and other expenses decreased $40 million primarily as a result of the Jesup asset impairment recognized in the second quarter of 2015. Additionally, lower professional fees, stock compensation expense and pension expense in 2016 compared to 2015 contributed to the decrease in SG&A and other.
We incurred $35 million of interest expense in 2016 compared with $37 million of interest expense in 2015. The decrease in interest expense reflects the repurchase of Senior Notes in the first quarter of 2016, partially offset by higher LIBOR rates on floating rate debt. See Note 8 — Debt and Capital Leases of our consolidated financial statements for more information.
Our effective tax rate for 2016 was 34.9 percent, compared with 33.3 percent for 2015. The increase from the prior year period reflects the impact of the domestic manufacturing tax deduction being limited in the current year. The Company had no taxable income for 2016 as a result of higher tax depreciation and a tax accounting method change related to the deductibility of certain repair expenditures. As the manufacturing deduction is limited by taxable income, there is no benefit recognized in the current year. See Note 18 — Income Taxes of our consolidated financial statements for more information.
Liquidity and Capital Resources
Cash flows from operations have historically been our primary source of liquidity and capital resources. We believe our cash flows and availability under our revolving credit facility, as well as our ability to access the capital markets, if necessary or desirable, will be adequate to fund our operations and anticipated long-term funding requirements, including capital expenditures, dividend payments, defined benefit plan contributions and repayment of debt maturities.
During 2017, our Board of Directors has declared, and we have paid, cash dividends on our Preferred Stock of approximately $13.8 million. Additionally, our Board of Directors has declared, and we have paid, cash dividends of $0.07 per share on our common stock for the first, second, third and fourth quarters.
The declaration and payment of future preferred and common stock dividends will be at the discretion of the Board of Directors and will be dependent upon our financial condition, results of operations, capital requirements and other factors the Board of Directors deems relevant. In addition, certain of our debt facilities may restrict the declaration and payment of dividends, depending upon our then current compliance with certain covenants.
On January 29, 2018, the Board of Directors authorized a $100 million share buyback. While we do not expect to immediately use this authorization, we believe this provides another option to maximize long-term shareholder value as we execute on a disciplined and balanced capital allocation strategy.
29
In connection with the Acquisition, we entered into an amended and restated credit agreement that refinanced, restated and replaced the credit facilities under our previous credit agreements. The amended and restated credit facility consists of a $230 million senior secured five-year term loan, a $450 million senior secured seven-year term loan, a $100 million revolving credit facility and a multi-currency revolving credit facility in a U.S. Dollar equivalent amount of $150 million (collectively, the "Credit Facilities"). The lenders under the Credit Facilities have a first priority security interest in substantially all present and future material U.S. assets, excluding the Fernandina Beach plant’s real property and the assets of certain non-guarantors subsidiaries. The non-guarantors of the Credit Facilities had assets of $1,410 million, revenue of $138 million, covenant EBITDA of $227 and liabilities of $1,086 million as of and for the year ended December 31, 2017. The Credit Facilities agreements contain various customary covenants. At December 31, 2017, we were in compliance with all covenants. See Note 8 — Debt and Capital Leases of our consolidated financial statements for more information.
A summary of liquidity and capital resources is shown below (in millions of dollars):
As of December 31, | |||||||||||
2017 | 2016 | 2015 | |||||||||
Cash and cash equivalents (a) | $ | 96 | $ | 326 | $ | 101 | |||||
Availability under the Revolving Credit Facility (b) | 216 | 229 | 236 | ||||||||
Total long-term debt (c) | 1,241 | 783 | 858 | ||||||||
Stockholders’ equity (deficit) | 694 | 212 | (17 | ) | |||||||
Total capitalization (total debt plus equity) | 1,935 | 995 | 841 | ||||||||
Debt to capital ratio | 64 | % | 79 | % | 102 | % | |||||
(a) | Cash and cash equivalents consisted of cash, money market deposits and time deposits with original maturities of 90 days or less. |
(b) | Availability under the revolving credit facility is reduced by standby letters of credit of approximately $34 million, $21 million and $14 million at December 31, 2017, 2016 and 2015, respectively. See Note 20 — Commitments and Contingencies of our consolidated financial statements for more information. |
(c) | See Note 8 — Debt and Capital Leases of our consolidated financial statements for more information. |
Cash Flows (in millions of dollars)
The following table summarizes our cash flows from operating, investing and financing activities for each of the three years ended December 31:
Cash Provided by (Used for): | 2017 | 2016 | 2015 | ||||||||
Operating activities | $ | 130 | $ | 232 | $ | 202 | |||||
Investing activities | (277 | ) | (87 | ) | (77 | ) | |||||
Financing activities | (84 | ) | 80 | (89 | ) | ||||||
Cash Provided by Operating Activities
Cash provided by operating activities in 2017 decreased $102 million primarily due to decreased net income after the non-cash reduction to net income from the gain on bargain purchase, as well as an increase in working capital requirements. Cash provided by operating activities in 2016 increased $30 million as lower cellulose specialties sales prices and volumes were offset by the impact of our Cost Transformation and improvements in working capital driven primarily by lower receivables and inventory balances.
Cash Used for Investing Activities
Cash used for investing activities during 2017 increased $190 million as a result of the Acquisition, partly offset by a decrease in capital spending and a gain on derivative instrument. Cash used for investing activities in 2016 increased $10 million primarily due to the timing of capital asset purchases.
30
Cash Provided by (Used for) Financing Activities
Cash used for financing activities increased $164 million in 2017 primarily due to the payoff of our old credit facilities and the payment of Tembec’s senior notes, partially offset by cash provided by the issuance of new debt in conjunction with the Acquisition. Cash provided by financing activities in 2016 increased $169 million primarily due to the issuance of the Preferred Stock partially offset by Preferred Stock dividend payments and higher debt repayments in 2016 including the Company’s first quarter 2016 repurchase of senior notes. See Note 8 — Debt and Capital Leases of our consolidated financial statements for more information.
Performance and Liquidity Indicators
The discussion below is presented to enhance the reader’s understanding of our operating performance, liquidity, ability to generate cash and satisfy rating agency and creditor requirements. This information includes the following measures of financial results: EBITDA, adjusted EBITDA and adjusted free cash flows. These measures are not defined by U.S. Generally Accepted Accounting Principles (“GAAP”) and the discussion of EBITDA, adjusted EBITDA and adjusted free cash flows is not intended to conflict with or change any of the GAAP disclosures described above. Management considers these measures, in addition to operating income, to be important to estimate the enterprise and stockholder values of the Company, and for making strategic and operating decisions. In addition, analysts, investors and creditors use these measures when analyzing our operating performance, financial condition and cash generating ability. Management uses EBITDA and adjusted EBITDA as performance measures and adjusted free cash flows as a liquidity measure. See “Note about Non-GAAP Financial Measures” on page two for limitations associated with non-GAAP measures.
EBITDA is defined by SEC rule as earnings before interest, taxes, depreciation and amortization. Adjusted EBITDA is defined by the Company as EBITDA before acquisition related costs, inventory write-up to fair value, gain on bargain purchase, gain on derivative instrument, non-cash impairment, one-time separation and legal costs, insurance recovery, environmental liability adjustments and gain on debt extinguishment. EBITDA and adjusted EBITDA are not necessarily indicative of results that may be generated in future periods.
Below is a reconciliation of Net Income to EBITDA and adjusted EBITDA for the five years ended December 31 (in millions of dollars):
Net Income to EBITDA Reconciliation | 2017 | 2016 | 2015 | 2014 | 2013 | ||||||||||||||
Net Income | $ | 325 | $ | 73 | $ | 55 | $ | 32 | $ | 220 | |||||||||
Depreciation and amortization | 97 | 88 | 89 | 86 | 74 | ||||||||||||||
Interest expense, net | 38 | 35 | 37 | 22 | — | ||||||||||||||
Income tax expense | 20 | 39 | 28 | 9 | 69 | ||||||||||||||
EBITDA | 480 | 235 | 209 | 149 | 363 | ||||||||||||||
Acquisition related costs | 34 | — | — | — | — | ||||||||||||||
Inventory write-up to fair value | 23 | — | — | — | — | ||||||||||||||
Gain on bargain purchase | (317 | ) | — | — | — | — | |||||||||||||
Gain on derivative instrument | (8 | ) | — | — | — | — | |||||||||||||
Non-cash impairment charge | — | — | 28 | — | — | ||||||||||||||
One-time separation and legal costs | — | — | 2 | 26 | 6 | ||||||||||||||
Insurance recovery | — | — | (1 | ) | (3 | ) | — | ||||||||||||
Environmental reserve adjustments | — | — | — | 95 | — | ||||||||||||||
Gain on debt extinguishment | — | (9 | ) | — | — | — | |||||||||||||
Adjusted EBITDA | 212 | 226 | 238 | 267 | 369 | ||||||||||||||
EBITDA for 2017 increased compared to 2016 primarily due to the gains on bargain purchase and a derivative instrument partially offset by acquisition related costs, the inventory write-up to fair value and EBITDA from the Acquisition. Adjusted EBITDA for 2017 decreased from 2016 primarily due to lower net income driven by lower sales prices and volumes for our cellulose specialties and commodity products volumes and increased costs, partially offset by the impact of EBITDA from the Acquisition.
31
EBITDA for 2016 increased compared to 2015 primarily from the non-cash impairment charge which occurred in 2015. Adjusted EBITDA for 2016 decreased from 2015 due to lower cellulose specialties sales prices and volumes partially offset by cost improvements from the Company’s Cost Transformation.
Adjusted free cash flows is defined as cash provided by operating activities adjusted for capital expenditures excluding strategic capital expenditures, acquisition related costs, net of tax, and subsequent tax benefits to exchange the Alternative Fuel Mixture Credit (“AFMC”) for the Cellulosic Biofuel Producer Credit (“CBPC”). Adjusted free cash flows, as defined by the Company, is a non-GAAP measure of cash generated during a period which is available for dividend distribution, debt reduction, strategic capital expenditures and acquisitions and repurchase of the Company’s common stock. Adjusted free cash flows is not necessarily indicative of the adjusted free cash flows that may be generated in future periods.
Below is a reconciliation of cash flows from operations to adjusted free cash flows for the five years ended December 31 (in millions of dollars):
Cash Flows from Operations to Adjusted Free Cash Flows Reconciliation | 2017 | 2016 | 2015 | 2014 | 2013 | ||||||||||||||
Cash flows from operations | $ | 130 | $ | 232 | $ | 202 | $ | 188 | $ | 258 | |||||||||
Capital expenditures (a) | (65 | ) | (85 | ) | (78 | ) | (75 | ) | (96 | ) | |||||||||
Acquisition related costs, net of tax | 26 | — | — | — | — | ||||||||||||||
Tax benefit due to exchange of AFMC for CBPC | — | — | — | — | (19 | ) | |||||||||||||
Adjusted Free Cash Flows | $ | 91 | $ | 147 | $ | 124 | $ | 113 | $ | 143 | |||||||||
(a) | Capital expenditures exclude strategic capital expenditures which we deem discretionary. Strategic capital for the years ended December 31, 2017 and 2016 were $11 million and $4 million, respectively, for our LignoTech Florida joint venture. There was no strategic capital expenditures for the year ended December 31, 2015. Strategic capital totaled $13 million for the purchase of timber deeds and $2 million for the purchase of land for the year ended December 31, 2014. Strategic capital totaled $141 million for the Cellulose Specialties Expansion project for the year ended December 31, 2013. |
Adjusted free cash flows in 2017 decreased from 2016 primarily due to decreased cash flows from operations, as previously described, were partially offset by reduced capital expenditures.
Adjusted free cash flows in 2016 increased over 2015 as increased cash flows from operations, as previously described, were partially offset by increased capital expenditures.
Off Balance Sheet Arrangements
We utilize off-balance sheet arrangements to provide credit support for certain suppliers and vendors in case of their default on critical obligations, collateral for certain self-insurance programs we maintain and guarantees for the completion of our remediation of environmental liabilities. These arrangements consist of standby letters of credit and surety bonds. As part of our ongoing operations, we also periodically issue guarantees to third parties. Off-balance sheet arrangements are not considered a source of liquidity or capital resources and do not expose us to material risks or material unfavorable financial impacts. See Note 20 — Commitments and Contingencies of our consolidated financial statements for more information.
Contractual Financial Obligations
See Note 20 — Commitments and Contingencies of our consolidated financial statements for details on the letters of credit, surety bonds and other guarantees as of December 31, 2017.
32
The following table aggregates our contractual financial obligations as of December 31, 2017 and anticipated cash spending by period:
Contractual Financial Obligations (in millions) | Total | Payments Due by Period | |||||||||||||||||
2018 | 2019-2020 | 2021-2022 | Thereafter | ||||||||||||||||
Long-term debt, including current maturities | $ | 1,244 | $ | 9 | $ | 42 | $ | 224 | $ | 969 | |||||||||
Interest payments on long-term debt and capital lease obligations (a) | 377 | 62 | 122 | 116 | 77 | ||||||||||||||
Purchase obligations (b) | 445 | 103 | 101 | 74 | 167 | ||||||||||||||
Purchase orders (c) | 7 | 7 | — | — | — | ||||||||||||||
Postretirement obligations | 26 | 3 | 6 | 6 | 11 | ||||||||||||||
Capital lease obligations | 4 | 1 | 1 | 1 | 1 | ||||||||||||||
Operating leases (d) | 7 | 3 | 3 | 1 | — | ||||||||||||||
Total contractual cash obligations | $ | 2,110 | $ | 188 | $ | 275 | $ | 422 | $ | 1,225 | |||||||||
(a) | Projected interest payments for variable-rate debt were calculated based on outstanding principal amounts and interest rates as of December 31, 2017. See Note 8 — Debt and Capital Leases for additional information. |
(b) | Purchase obligations primarily consist of payments expected to be made on natural gas, steam energy and wood chip purchase contracts. |
(c) | Purchase orders represent non-cancellable purchase agreements entered into in the normal course of business with various suppliers that specify a fixed or minimum quantity that we must purchase. |
(d) | Operating leases primarily consist of the office lease for our corporate headquarters and machinery and equipment. |
Environmental Regulation
We are subject to stringent environmental laws and regulations concerning air emissions, wastewater discharges, waste handling and disposal, and assessment and remediation of environmental contamination, which impact both our current ongoing operations and 18 former operating facilities or third party-owned sites classified as disposed operations. These include the Clean Air Act, the Clean Water Act, the Resource Conservation and Recovery Act, the Comprehensive Environmental Response, Compensation and Liability Act of 1980 and similar state laws and regulations impacting U.S. facilities, as well as requirements relating to ancillary matters such as financial assurance of the Company’s legal obligations for facility closure and post-closure care. Similar laws and legal requirements also impact currently and former operating sites in Canada and France, respectively. Management closely monitors our environmental responsibilities and believes we are in material compliance with current requirements. In addition to ongoing compliance with laws and regulations, our facilities operate in accordance with various permits, which are issued by state and federal environmental agencies. Many of these permits impose operating conditions on us which require significant expenditures to ensure compliance. Upon renewal and renegotiation of these permits, the issuing agencies often seek to impose new or additional conditions in response to new environmental laws and regulations, or more stringent interpretations of existing laws and regulations. In addition, under many federal environmental laws, private citizens and organizations, such as environmental advocacy groups, have the right to legally challenge permitting and other decisions made by regulatory agencies.
Our operations are subject to constantly changing environmental requirements, and interpretations of existing requirements, which are often impacted by new policy initiatives, new and amended legislation and regulation, negotiations involving state and federal governmental agencies and various other stakeholders, as well as, at times, litigation. For additional information, see Item 1A — Risk Factors for a discussion of the potential impact of environmental risks on our business, and Item 3 — Legal Proceedings, for a discussion of any environmental-related litigation.
33
Ongoing Operations
During 2017, 2016 and 2015, we spent the following for capital projects related to environmental compliance for ongoing operations:
(in millions) | 2017 | 2016 | 2015 | ||||||||
Boiler MACT (a) | $ | — | $ | 10 | $ | 18 | |||||
(a) | Represents spending required as a result of a regulation originally promulgated in 2012 (and later re-promulgated after litigation), which imposes more stringent emissions limits on certain air pollutants from industrial boilers. This project was completed in 2016. |
The Company’s future spending requirements in the area of environmental compliance could change significantly based on the passage of new environmental laws and regulations.
Disposed Operations
For information and details relating to our disposed operations and estimated liabilities relating thereto, see Item 1A — Risk Factors and Note 9 — Liabilities for Disposed Operations of our consolidated financial statements for more information.
Item 7A. | Quantitative and Qualitative Disclosures about Market Risk |
Market and Other Economic Risks
We are exposed to various market risks, primarily changes in interest rates, currency and commodity prices. Our objective is to minimize the economic impact of these market risks. We use derivatives in accordance with policies and procedures approved by the Audit Committee of our Board of Directors. Derivatives are managed by a senior executive committee whose responsibilities include initiating, managing and monitoring resulting exposures. See Note 10 — Derivative Instruments for additional information.
We manage our foreign currency exposures by balancing certain assets and liabilities denominated in foreign currencies and through the use, from time to time, of foreign currency forward contracts. The principal objective of such contracts is to minimize the potential volatility and financial impact of changes in foreign currency exchange rates. The counterparties to these contractual agreements are major financial institutions with which we generally have other financial relationships. We are exposed to credit loss in the event of nonperformance by these counterparties. However, given their size and financial strength, we do not anticipate nonperformance by the counterparties. We do not utilize financial instruments for trading or other speculative purposes.
The prices, sales volumes and margins of the commodity products of our High Purity Cellulose segment and all the products of the Forest Product and Pulp & Paper segments have historically been cyclically affected by economic and market shifts, fluctuations in capacity, and changes in foreign currency exchange rates. In general, these products are commodities that are widely available from other producers; because these products have few distinguishing qualities from producer to producer, competition is based primarily on price, which is determined by supply relative to demand. The overall levels of demand for the products we manufacture, and consequently our sales and profitability, reflect fluctuations in end user demand. Our cellulose specialties product prices are impacted by market supply and demand, raw material and processing costs, changes in global currencies and other factors. They are not directly correlated to commodity paper pulp prices. In addition, a majority of our cellulose specialties products are under long-term volume contracts that expire between 2018 and 2020.
As of December 31, 2017, we had $636 million of variable rate debt which is subject to interest rate risk. At this borrowing level, a hypothetical one-percentage point increase/decrease in interest rates would result in a corresponding increase/decrease of approximately $6 million in interest payments and expense over a 12 month period. Our primary interest rate exposure on variable rate debt results from changes in LIBOR. We have entered into interest rate swap agreements to reduce the volatility of financing costs, achieve a desired proportion of fixed-rate versus floating-rate debt and to hedge the variability in cash flows attributable to interest rate risks caused by changes in the LIBOR benchmark.
The fair market value of our long-term fixed interest rate debt is also subject to interest rate risk. However, we intend to hold most of our debt until maturity. The estimated fair value of our fixed-rate debt at December 31, 2017 was $611 million compared to the $607 million principal amount. We use quoted market prices to estimate the fair value of our fixed-rate debt. Generally, the fair market value of fixed-rate debt will increase as interest rates fall and decrease as interest rates rise.
34
We may periodically enter into commodity forward contracts to fix some of our energy costs that are subject to price volatility caused by weather, supply conditions, political and economic variables and other unpredictable factors. Such forward contracts partially mitigate the risk of changes to our gross margins resulting from an increase or decrease in these costs. Forward contracts which are derivative instruments are reported in the consolidated balance sheets at their fair values, unless they qualify for the normal purchase normal sale ("NPNS") exception and such exception has been elected. If the NPNS exception is elected, the fair values of such contracts are not recognized on the balance sheet.
Item 8. | Financial Statements and Supplementary Data |
See Index to Financial Statements on page ii.
Item 9. | Changes in and Disagreements with Accountants on Accounting and Financial Disclosure |
None
Item 9A. | Controls and Procedures |
Disclosure Controls and Procedures
Rayonier Advanced Materials management is responsible for establishing and maintaining adequate disclosure controls and procedures. Disclosure controls and procedures (as defined in Rule 13a-15(e) under the Securities Exchange Act of 1934 (the “Exchange Act”)) are designed with the objective of ensuring that information required to be disclosed in reports filed under the Exchange Act, such as this annual report on Form 10-K, is (1) recorded, processed, summarized and reported within the time periods specified in the SEC’s rules and forms and (2) accumulated and communicated to our management, including our Chief Executive Officer and Chief Financial Officer, as appropriate to allow timely decisions regarding required disclosure.
Because of the inherent limitations in all control systems, no control evaluation can provide absolute assurance all control exceptions and instances of fraud have been prevented or detected on a timely basis. Even systems determined to be effective can provide only reasonable assurance their objectives are achieved.
Based on an evaluation of our disclosure controls and procedures as of the end of the period covered by this annual report on Form 10-K, our management, including the Chief Executive Officer and Chief Financial Officer, concluded the design and operation of the disclosure controls and procedures were effective as of December 31, 2017.
Internal Control over Financial Reporting
With regard to our internal control over financial reporting as defined in paragraph (f) of Rule 13a-15(f), see Management’s Report on Internal Control over Financial Reporting on page F-1, followed by the Reports of Independent Registered Public Accounting Firm on pages F-2 and F-4, included in Item 8 — Financial Statements and Supplementary Data of this annual report on Form 10-K.
As a result of our November 2017 acquisition of Tembec, the Company implemented internal controls over significant processes specific to the acquisition that management believes are appropriate in consideration of related integration of operations, systems, control activities, and accounting for the acquisition and acquisition-related transactions.
Except as described above, for the year ended December 31, 2017, based upon the evaluation required by paragraph (d) of Rule 13a-15, there were no changes in our internal control over financial reporting that would materially affect or are reasonably likely to materially affect our internal control over financial reporting.
Item 9B. | Other Information |
None.
35
Part III
Certain information required by Part III is incorporated by reference from the Company’s definitive Proxy Statement to be filed with the SEC in connection with the solicitation of proxies for the Company’s 2018 Annual Meeting of Stockholders (the “Proxy Statement”). We will make the Proxy Statement available on our website at www.rayonieram.com as soon as it is filed with the SEC.
Item 10. | Directors, Executive Officers and Corporate Governance |
The information required by this Item with respect to directors, executive officers and corporate governance is incorporated by reference from the sections entitled “Election of Directors,” “Corporate Governance,” “Executive Officers” and “Report of the Audit Committee” in the Proxy Statement. The information required by this Item with respect to disclosure of any known late filing or failure by an insider to file a report required by Section 16 of the Exchange Act is incorporated by reference to the section entitled “Section 16(a) Beneficial Ownership Reporting Compliance” in the Proxy Statement.
Our Standard of Ethics and Code of Corporate Conduct, which is applicable to our principal executive officer and financial and accounting officers, is available on our website, www.rayonieram.com. Any amendments to or waivers of the Standard of Ethics and Code of Corporate Conduct will also be disclosed on our website.
Item 11. | Executive Compensation |
The information called for by Item 11 is incorporated herein by reference from the section and subsections entitled “Compensation Discussion and Analysis,” “Summary Compensation Table,” “Grants of Plan-Based Awards,” “Outstanding Equity Awards at Fiscal Year-End,” “Option Exercises and Stock Vested,” “Pension Benefits,” “Nonqualified Deferred Compensation,” “Potential Payments Upon Termination or Change in Control,” “Agreements with our NEOs,” “Director Compensation,” “Corporate Governance — Compensation Committee Interlocks and Insider Participation; Processes and Procedures” and “Compensation Discussion and Analysis — Report of the Compensation and Management Development Committee” in the Proxy Statement.
Item 12. | Security Ownership of Certain Beneficial Owners and Management and Related Stockholder Matters |
The information called for by Item 12 is incorporated herein by reference from the sections entitled “Security Ownership of Certain Beneficial Owners,” “Stock Ownership of Directors and Executive Officers” and “Equity Compensation Plan Information” in the Proxy Statement.
Item 13. | Certain Relationships and Related Transactions, and Director Independence |
The information called for by Item 13 is incorporated herein by reference from the section and subsections entitled “Election of Directors,” “Corporate Governance — Director Independence” and “Corporate Governance — Related Person Transactions” in the Proxy Statement.
Item 14. | Principal Accounting Fees and Services |
The information called for by Item 14 is incorporated herein by reference from the subsection entitled “Report of the Audit Committee — Information Regarding Independent Registered Public Accounting Firm” in the Proxy Statement.
36
Part IV
Item 15. | Exhibits, Financial Statement Schedules |
(a) Documents filed as a part of this report:
(1) | See Index to Financial Statements on page ii for a list of the financial statements filed as part of this report. |
(2) | See Schedule II — Valuation and Qualifying Accounts. All other financial statement schedules have been omitted because they are not applicable, the required matter is not present or the required information has otherwise been supplied in the financial statements or the notes thereto. |
(3) | See Exhibit Index for a list of the exhibits filed or incorporated herein as part of this report. Exhibits that are incorporated by reference to documents filed previously by the Company under the Securities Exchange Act of 1934, as amended, are filed with the SEC under File No. 1-6780. |
(b) Exhibits:
See Item 15 (a)(3).
(c) Financial Statement Schedules:
See Item 15 (a)(2).
Item 16. | Form 10-K Summary |
None.
37
Management’s Report on Internal Control over Financial Reporting
To Our Stockholders:
The management of Rayonier Advanced Materials Inc. and its subsidiaries is responsible for establishing and maintaining adequate internal control over financial reporting (as defined in Rule 13a-15(f) under the Securities Exchange Act of 1934, as amended). Our system of internal controls over financial reporting is designed to provide reasonable assurance to the Company’s management and Board of Directors regarding the preparation and fair presentation of the financial statements for external purposes in accordance with accounting principles generally accepted in the United States of America.
Because of the inherent limitations of internal control over financial reporting, misstatements due to error or fraud may not be prevented or detected on a timely basis. Also, projections of any evaluation of effectiveness to future periods are subject to the risk that controls may become inadequate because of changes in conditions, or that the degree of compliance with the policies or procedures may deteriorate.
Rayonier Advanced Materials Inc.’s management, under the supervision of the Chief Executive Officer and Chief Financial Officer, assessed the effectiveness of our internal control over financial reporting as of December 31, 2017. In making this assessment, we used the framework included in Internal Control — Integrated Framework issued by the Committee of Sponsoring Organizations of the Treadway Commission (2013 Framework). Based on our evaluation under the criteria set forth in Internal Control — Integrated Framework, management concluded that our internal control over financial reporting was effective as of December 31, 2017.
On November 17, 2017, we acquired Tembec, Inc (“Tembec”). Due to the timing of the acquisition, management has excluded from its assessment of the effectiveness of Rayonier Advanced Materials Inc.’s internal control over financial reporting as of December 31, 2017, certain components of Tembec’s internal control over financial reporting. Those certain components of the acquired Tembec operations represent 59 percent of total assets, 14 percent of sales and 0 percent of net income, as reported in the Company's consolidated financial statements as of and for the year ended December 31, 2017.
Grant Thornton LLP, the independent registered public accounting firm that audited the Company’s consolidated financial statements, has issued an attestation report on the Company’s internal control over financial reporting as of December 31, 2017. The report on the Company’s internal control over financial reporting as of December 31, 2017, is on page F-3.
RAYONIER ADVANCED MATERIALS INC. | |
By: | /s/ PAUL G. BOYNTON |
Paul G. Boynton Chairman, President and Chief Executive Officer | |
March 1, 2018 | |
By: | /s/ FRANK A. RUPERTO |
Frank A. Ruperto Chief Financial Officer and Senior Vice President, Finance and Strategy (Duly Authorized Officer and Principal Financial Officer) | |
March 1, 2018 | |
F- 1
Report of Independent Registered Public Accounting Firm
Board of Directors and Stockholders of Rayonier Advanced Materials Inc.
Opinion on the financial statements
We have audited the accompanying consolidated balance sheets of Rayonier Advanced Materials Inc. (a Delaware corporation) and subsidiaries (the “Company”) as of December 31, 2017 and 2016, the related consolidated statements of income and comprehensive income, and cash flows for each of the two years in the period ended December 31, 2017 , and the related notes and schedule (collectively referred to as the “financial statements”). In our opinion, the financial statements present fairly, in all material respects, the financial position of the Company as of December 31, 2017 and 2016, and the results of its operations and its cash flows for each of the two years in the period ended December 31, 2017, in conformity with accounting principles generally accepted in the United States of America.
We also have audited, in accordance with the standards of the Public Company Accounting Oversight Board (United States) (“PCAOB”), the Company’s internal control over financial reporting as of December 31, 2017, based on criteria established in the 2013 Internal Control-Integrated Framework issued by the Committee of Sponsoring Organizations of the Treadway Commission (“COSO”), and our report dated March 1, 2018 expressed an unqualified opinion.
Other matter
We also have audited the adjustments to the 2015 financial statements to retrospectively apply the change in reporting segments resulting from the acquisition of Tembec, Inc. on November 17, 2017, as described in Note 19. In our opinion, such adjustments are appropriate and have been properly applied. We were not engaged to audit, review, or apply any procedures to the 2015 financial statements of the Company other than with respect to such adjustments and, accordingly, we do not express an opinion or any other form of assurance on the 2015 financial statements taken as a whole.
Basis for opinion
These financial statements are the responsibility of the Company’s management. Our responsibility is to express an opinion on the Company’s financial statements based on our audits. We are a public accounting firm registered with the PCAOB and are required to be independent with respect to the Company in accordance with the U.S. federal securities laws and the applicable rules and regulations of the Securities and Exchange Commission and the PCAOB.
We conducted our audits in accordance with the standards of the PCAOB. Those standards require that we plan and perform the audit to obtain reasonable assurance about whether the financial statements are free of material misstatement, whether due to error or fraud. Our audits included performing procedures to assess the risks of material misstatement of the financial statements, whether due to error or fraud, and performing procedures that respond to those risks. Such procedures included examining, on a test basis, evidence supporting the amounts and disclosures in the financial statements. Our audits also included evaluating the accounting principles used and significant estimates made by management, as well as evaluating the overall presentation of the financial statements. We believe that our audits provide a reasonable basis for our opinion.
/s/ GRANT THORNTON LLP
We have served as the Company’s auditor since 2016.
Jacksonville, Florida
March 1, 2018
F- 2
Report of Independent Registered Public Accounting Firm
Board of Directors and Stockholders of Rayonier Advanced Materials Inc.
Opinion on internal control over financial reporting
We have audited the internal control over financial reporting of Rayonier Advanced Materials Inc. (a Delaware corporation) and subsidiaries (the “Company”) as of December 31, 2017, based on criteria established in the 2013 Internal Control-Integrated Framework issued by the Committee of Sponsoring Organizations of the Treadway Commission (“COSO”). In our opinion, the Company maintained, in all material respects, effective internal control over financial reporting as of December 31, 2017, based on criteria established in the 2013 Internal Control-Integrated Framework issued by COSO.
We also have audited, in accordance with the standards of the Public Company Accounting Oversight Board (United States) (“PCAOB”), the consolidated financial statements of the Company as of and for the year ended December 31, 2017, and our report dated March 1, 2018 expressed an unqualified opinion on those financial statements.
Basis for opinion
The Company’s management is responsible for maintaining effective internal control over financial reporting and for its assessment of the effectiveness of internal control over financial reporting, included in the accompanying Management’s Report on Internal Control over Financial Reporting (“Management’s Report”). Our responsibility is to express an opinion on the Company’s internal control over financial reporting based on our audit. We are a public accounting firm registered with the PCAOB and are required to be independent with respect to the Company in accordance with the U.S. federal securities laws and the applicable rules and regulations of the Securities and Exchange Commission and the PCAOB.
We conducted our audit in accordance with the standards of the PCAOB. Those standards require that we plan and perform the audit to obtain reasonable assurance about whether effective internal control over financial reporting was maintained in all material respects. Our audit included obtaining an understanding of internal control over financial reporting, assessing the risk that a material weakness exists, testing and evaluating the design and operating effectiveness of internal control based on the assessed risk, and performing such other procedures as we considered necessary in the circumstances. We believe that our audit provides a reasonable basis for our opinion.
Our audit of, and opinion on, the Company’s internal control over financial reporting does not include the internal control over financial reporting of Tembec Inc. and subsidiaries (“Tembec”), a wholly-owned subsidiary, whose financial statements reflect total assets and revenues constituting 59% and 14% percent, respectively, of the related consolidated financial statement amounts as of and for the year ended December 31, 2017. As indicated in Management’s Report, Tembec was acquired during 2017. Management’s assertion on the effectiveness of the Company’s internal control over financial reporting excluded internal control over financial reporting of Tembec.
Definition and limitations of internal control over financial reporting
A company’s internal control over financial reporting is a process designed to provide reasonable assurance regarding the reliability of financial reporting and the preparation of financial statements for external purposes in accordance with generally accepted accounting principles. A company’s internal control over financial reporting includes those policies and procedures that (1) pertain to the maintenance of records that, in reasonable detail, accurately and fairly reflect the transactions and dispositions of the assets of the company; (2) provide reasonable assurance that transactions are recorded as necessary to permit preparation of financial statements in accordance with generally accepted accounting principles, and that receipts and expenditures of the company are being made only in accordance with authorizations of management and directors of the company; and (3) provide reasonable assurance regarding prevention or timely detection of unauthorized acquisition, use, or disposition of the company’s assets that could have a material effect on the financial statements.
Because of its inherent limitations, internal control over financial reporting may not prevent or detect misstatements. Also, projections of any evaluation of effectiveness to future periods are subject to the risk that controls may become inadequate because of changes in conditions, or that the degree of compliance with the policies or procedures may deteriorate.
/s/ GRANT THORNTON LLP
Jacksonville, Florida
March 1, 2018
F- 3
Report of Independent Registered Public Accounting Firm
The Board of Directors and Stockholders of Rayonier Advanced Materials Inc.
We have audited, before the effects of the adjustments to retrospectively apply the changes in segment reporting for corporate operations described in Note 19, the consolidated statements of income and comprehensive income, and cash flows of Rayonier Advanced Materials Inc. (“the Company”) for the year ended December 31, 2015 (the 2015 consolidated financial statements before the effects of the adjustments discussed in Note 19 are not presented herein). Our audit also included the financial statement schedule listed in the Index at Item 15(a). The 2015 financial statements and schedule are the responsibility of the Company's management. Our responsibility is to express an opinion on these consolidated financial statements and schedule based on our audit.
We conducted our audit in accordance with the standards of the Public Company Accounting Oversight Board (United States). Those standards require that we plan and perform the audit to obtain reasonable assurance about whether the financial statements are free of material misstatement. An audit includes examining, on a test basis, evidence supporting the amounts and disclosures in the financial statements. An audit also includes assessing the accounting principles used and significant estimates made by management, as well as evaluating the overall financial statement presentation. We believe that our audit provides a reasonable basis for our opinion.
In our opinion, the 2015 financial statements, before the effects of the adjustments to retrospectively apply the changes in segment reporting for corporate operations described in Note 19, present fairly, in all material respects, the consolidated results of its operations and its cash flows for the year ended December 31, 2015 in conformity with U.S. generally accepted accounting principles. Also, in our opinion, the related financial statement schedule, when considered in relation to the basic financial statements taken as a whole, presents fairly in all material respects the information set forth therein.
We were not engaged to audit, review, or apply any procedures to the adjustments to retrospectively apply the changes in segment reporting for corporate operations described in Note 19 and, accordingly, we do not express an opinion or any other form of assurance about whether such adjustments are appropriate and have been properly applied. Those adjustments were audited by Grant Thornton LLP.
/s/ Ernst & Young LLP
Certified Public Accountants
Jacksonville, Florida
February 26, 2016
F- 4
Rayonier Advanced Materials Inc.
Consolidated Statements of Income and Comprehensive Income
For the Years Ended December 31,
(Dollars in thousands, except per share amounts)
2017 | 2016 | 2015 | |||||||||
Net Sales | $ | 961,333 | $ | 868,731 | $ | 941,384 | |||||
Cost of Sales | (822,088 | ) | (687,458 | ) | (738,930 | ) | |||||
Gross Margin | 139,245 | 181,273 | 202,454 | ||||||||
Selling, general and administrative expenses | (80,016 | ) | (37,942 | ) | (47,662 | ) | |||||
Other operating expense, net (Note 17) | (2,213 | ) | (5,684 | ) | (35,269 | ) | |||||
Operating Income | 57,016 | 137,647 | 119,523 | ||||||||
Interest expense | (40,447 | ) | (34,627 | ) | (36,869 | ) | |||||
Interest income and other, net | 3,791 | 737 | 210 | ||||||||
Gain on bargain purchase (Note 3) | 316,555 | — | — | ||||||||
Gain on derivative instrument (Note 10) | 7,780 | — | — | ||||||||
Gain on debt extinguishment | — | 8,844 | — | ||||||||
Income Before Income Taxes | 344,695 | 112,601 | 82,864 | ||||||||
Income tax expense (Note 18) | (19,731 | ) | (39,315 | ) | (27,607 | ) | |||||
Net Income Attributable to Rayonier Advanced Materials Inc. | 324,964 | 73,286 | 55,257 | ||||||||
Mandatory convertible stock dividends | (13,800 | ) | (5,404 | ) | — | ||||||
Net Income Available to Rayonier Advanced Materials Inc. Common Stockholders | $ | 311,164 | $ | 67,882 | $ | 55,257 | |||||
Earnings Per Share of Common Stock (Note 14) | |||||||||||
Basic earnings per share | $ | 7.17 | $ | 1.61 | $ | 1.31 | |||||
Diluted earnings per share | $ | 5.81 | $ | 1.55 | $ | 1.30 | |||||
Dividends Declared Per Share | $ | 0.28 | $ | 0.28 | $ | 0.28 | |||||
Comprehensive Income: | |||||||||||
Net Income | $ | 324,964 | $ | 73,286 | $ | 55,257 | |||||
Other Comprehensive Income (Loss), net of tax (Note 13) | |||||||||||
Foreign currency translation adjustments | 4,868 | — | — | ||||||||
Unrealized gain on derivative instruments | 619 | — | — | ||||||||
Net gain (loss) from pension and postretirement plans | 28,442 | (460 | ) | (6,176 | ) | ||||||
Total other comprehensive income (loss) | 33,929 | (460 | ) | (6,176 | ) | ||||||
Comprehensive Income | $ | 358,893 | $ | 72,826 | $ | 49,081 | |||||
See Notes to Consolidated Financial Statements.
F- 5
Rayonier Advanced Materials Inc.
Consolidated Balance Sheets
As of December 31,
(Dollars in thousands)
2017 | 2016 | ||||||
Assets | |||||||
Current Assets | |||||||
Cash and cash equivalents | $ | 96,235 | $ | 326,655 | |||
Accounts receivable, net (Note 4) | 181,298 | 37,626 | |||||
Inventory (Note 5) | 302,086 | 118,368 | |||||
Prepaid and other current assets | 66,918 | 36,859 | |||||
Total current assets | 646,537 | 519,508 | |||||
Property, Plant and Equipment, Net (Note 6) | 1,407,762 | 801,039 | |||||
Deferred Tax Assets (Note 18) | 402,846 | 51,246 | |||||
Intangible Assets, Net | 59,869 | — | |||||
Other Assets | 125,597 | 50,146 | |||||
Total Assets | $ | 2,642,611 | $ | 1,421,939 | |||
Liabilities and Stockholders’ Equity | |||||||
Current Liabilities | |||||||
Accounts payable | $ | 157,925 | $ | 36,379 | |||
Accrued and other current liabilities (Note 7) | 127,040 | 67,226 | |||||
Current maturities of long-term debt (Note 8) | 9,425 | 9,593 | |||||
Current liabilities for disposed operations (Note 9) | 13,181 | 13,781 | |||||
Total current liabilities | 307,571 | 126,979 | |||||
Long-Term Debt (Note 8) | 1,232,179 | 773,689 | |||||
Non-Current Liabilities for Disposed Operations (Note 9) | 150,905 | 139,129 | |||||
Pension and Other Postretirement Benefits (Note 16) | 212,810 | 161,729 | |||||
Deferred Tax Liabilities (Note 18) | 32,607 | — | |||||
Other Non-Current Liabilities | 12,783 | 8,664 | |||||
Commitments and Contingencies (Note 20) | |||||||
Stockholders’ Equity (Note 12) | |||||||
Preferred stock, 10,000,000 shares authorized at $0.01 par value, 1,725,000 and 1,725,000 issued and outstanding as of December 31, 2017 and 2016, respectively, aggregate liquidation preference $172,500 | 17 | 17 | |||||
Common stock, 140,000,000 shares authorized at $0.01 par value, 51,717,142 and 43,261,905 issued and outstanding, as of December 31, 2017 and 2016, respectively | 517 | 433 | |||||
Additional paid-in capital | 392,353 | 242,402 | |||||
Retained earnings | 377,020 | 78,977 | |||||
Accumulated other comprehensive loss (Note 13) | (76,151 | ) | (110,080 | ) | |||
Total Stockholders’ Equity | 693,756 | 211,749 | |||||
Total Liabilities and Stockholders’ Equity | $ | 2,642,611 | $ | 1,421,939 | |||
See Notes to Consolidated Financial Statements.
F- 6
Rayonier Advanced Materials Inc.
Consolidated Statements of Cash Flows
For the Years Ended December 31,
(Dollars in thousands)
2017 | 2016 | 2015 | |||||||||
Operating Activities | |||||||||||
Net income | $ | 324,964 | $ | 73,286 | $ | 55,257 | |||||
Adjustments to reconcile net income to cash provided by operating activities: | |||||||||||
Depreciation and amortization | 96,963 | 88,274 | 89,189 | ||||||||
Stock-based incentive compensation expense | 8,986 | 7,217 | 9,992 | ||||||||
Amortization of capitalized debt costs and debt discount | 3,377 | 1,919 | 2,116 | ||||||||
Deferred income taxes | 30,280 | 45,199 | (9,757 | ) | |||||||
Gain on bargain purchase | (316,555 | ) | — | — | |||||||
Increase in liabilities for disposed operations | 256 | 5,298 | 6,930 | ||||||||
Impairment charges | — | — | 28,462 | ||||||||
Gain on debt extinguishment | — | (8,844 | ) | — | |||||||
Amortization of losses and prior service costs from pension and postretirement plans | 12,594 | 12,203 | 14,702 | ||||||||
Loss from sale/disposal of property, plant and equipment | 2,032 | 2,422 | 1,364 | ||||||||
Gain on foreign currency exchange | (2,335 | ) | — | — | |||||||
Other | (1,303 | ) | (3,429 | ) | 398 | ||||||
Changes in operating assets and liabilities: | |||||||||||
Receivables | (4,699 | ) | 31,266 | 696 | |||||||
Inventories | 3,033 | 7,041 | 14,800 | ||||||||
Accounts payable | 16,215 | (2,048 | ) | (19,789 | ) | ||||||
Accrued liabilities | (2,865 | ) | 167 | 15,466 | |||||||
All other operating activities | (21,654 | ) | (4,839 | ) | 1,223 | ||||||
Contributions to pension and other postretirement benefit plans | (13,722 | ) | (13,135 | ) | (3,116 | ) | |||||
Expenditures for disposed operations | (5,795 | ) | (9,772 | ) | (6,275 | ) | |||||
Cash Provided by Operating Activities | 129,772 | 232,225 | 201,658 | ||||||||
Investing Activities | |||||||||||
Acquisition of Tembec, net of cash acquired | (210,164 | ) | — | — | |||||||
Capital expenditures | (75,042 | ) | (88,703 | ) | (77,424 | ) | |||||
Realized gain on derivative instrument | 7,780 | — | — | ||||||||
Other | — | 2,143 | — | ||||||||
Cash Used for Investing Activities | (277,426 | ) | (86,560 | ) | (77,424 | ) | |||||
Financing Activities | |||||||||||
Issuance of mandatory convertible preferred stock | — | 166,609 | — | ||||||||
Issuance of debt | 680,000 | — | — | ||||||||
Repayment of debt | (729,958 | ) | (71,031 | ) | (77,100 | ) | |||||
Dividends paid on common stock | (12,693 | ) | (11,840 | ) | (11,816 | ) | |||||
Dividends paid on preferred stock | (13,800 | ) | (3,641 | ) | — | ||||||
Proceeds from the issuance of common stock | 14 | — | 8 | ||||||||
Debt issuance costs | (7,025 | ) | — | — | |||||||
Other | (157 | ) | (410 | ) | — | ||||||
Cash Provided by (Used for) Financing Activities | (83,619 | ) | 79,687 | (88,908 | ) | ||||||
Cash and Cash Equivalents | |||||||||||
Change in cash and cash equivalents | (231,273 | ) | 225,352 | 35,326 | |||||||
Net effect of foreign exchange on cash and cash equivalents | 853 | — | — | ||||||||
Balance, beginning of year | 326,655 | 101,303 | 65,977 | ||||||||
Balance, end of year | $ | 96,235 | $ | 326,655 | $ | 101,303 | |||||
See Notes to Consolidated Financial Statements.
F- 7
Rayonier Advanced Materials Inc.
Notes to Consolidated Financial Statements
(Dollar amounts in thousands unless otherwise stated)
1. Nature of Operations and Basis of Presentation
Nature of Operations
Rayonier Advanced Materials Inc., (the “Company”), is a leading manufacturer of high purity cellulose products, lumber, and pulp & paper products. The following describes the Company’s current operating segments:
High Purity Cellulose
The Company, through its four production facilities located in the United States (“U.S.”), Canada and France, manufactures and markets high purity cellulose, which is sold as either cellulose specialties or commodity products. Cellulose specialties are primarily used in dissolving chemical applications that require a highly purified form of cellulose. Commodity products are used for commodity viscose and absorbent materials applications. Commodity viscose is a raw material required for the manufacture of viscose staple fibers which are used in woven and non-woven applications. Absorbent materials, typically referred to as fluff fibers, are used as an absorbent medium in consumer products. Sales of resins, chemicals, and energy, a majority of which are by-products, are included in the high purity cellulose segment.
Forest Products
The Company, through its seven sawmills in Canada, manufactures and markets high-quality construction-grade lumber in North America. The lumber, primarily spruce, pine, or fir, is used in the construction of residential and multi-family homes, light industrial and commercial facilities, and the home repair and remodel markets. The chips, manufactured as a by-product of the lumber manufacturing process, are used in the Company’s Canadian High Purity Cellulose and Pulp & Paper plants.
Pulp & Paper
The Company, through its four production facilities in Canada, manufactures and markets pulp and paper products consisting of high-yield pulp, paperboard and newsprint. High-yield pulp is used by paper manufacturers to produce paperboard, packaging, printing and writing papers and a variety of other paper products. Paperboard is used for printing documents, brochures, promotional materials, paperback book or catalog covers, file folders, tags, and tickets. Newsprint is a paper grade used to print newspapers, advertising materials and other publications.
Basis of Presentation
Principles of Consolidation
The consolidated financial statements include the accounts and operations of the Company and its wholly owned, majority owned and controlled subsidiaries. The Company applies the equity method of accounting for investments in which it has an ownership interest from 20 percent to 50 percent or exercises significant influence over the related investee’s operations. All significant intercompany accounts and transactions are eliminated in consolidation.
Reclassifications
Certain December 31, 2016 and 2015 amounts have been reclassified to conform with the current year presentation.
Fiscal Year
The Company’s fiscal year end is the last day of the calendar year. For interim reporting periods, the Company uses the last Saturday of the fiscal quarter.
F- 8
Subsequent Events
Events and transactions subsequent to the balance sheet date have been evaluated for potential recognition and disclosure through March 1, 2018, the date these financial statements were available to be issued. The following subsequent events warranting disclosure were identified:
On January 16, 2018, our board of directors declared a first quarter 2018 cash dividend of $2.00 per share of our mandatory convertible preferred stock. The dividend was paid on February 15, 2018 to mandatory convertible preferred stockholders of record as of February 1, 2018.
On February 23, 2018, the Company declared a first quarter 2018 cash dividend of $0.07 per share of common stock. The dividend is payable on March 30, 2018 to stockholders of record on March 16, 2018.
2. Summary of Significant Accounting Policies and New Accounting Pronouncements
Summary of Significant Accounting Policies
Use of Estimates
The preparation of financial statements in conformity with U.S. generally accepted accounting principles (“U.S. GAAP”) requires management to make estimates and assumptions that affect the reported amounts of assets and liabilities and to disclose contingent assets and liabilities at the date of the financial statements and the reported amounts of revenues and expenses during the reporting period. There are risks inherent in estimating, and therefore, actual results could differ from those estimates.
Translation of Foreign Currency
Assets and liabilities of consolidated subsidiaries whose functional currency is other than the U.S. dollar are translated into U.S. dollars using currency exchange rates at the balance sheet date. Revenues and expenses are translated using the average currency exchange rates during the period. Foreign currency translation gains and losses are reported as a component of accumulated other comprehensive loss. Gains and losses resulting from foreign currency transactions are included in operating results as incurred.
Cash and Cash Equivalents
Cash and cash equivalents include time deposits and other investments that are highly liquid with original maturities of three months or less.
Accounts Receivable and Allowance for Doubtful Accounts
Trade accounts receivable are recorded at invoiced amounts and do not bear interest. The Company maintains an allowance for doubtful accounts for estimated losses resulting from the inability of its customers to make required payments. The Company's allowance is established based on historical patterns of accounts receivable collections and general economic conditions. Outstanding accounts receivable balances are reviewed quarterly or more frequently when circumstances indicate a review is warranted, for example if there is a significant change in the aging of the Company’s receivables or a customer’s financial condition. Write-off’s are recorded at the time a customer receivable is deemed uncollectible and collection efforts have been exhausted.
Inventory
Finished goods, work-in-process and raw materials inventories are valued at the lower of cost, as determined on the first-in, first-out basis, or market. Manufacturing and maintenance supplies are valued at average cost. Inventory costs include material, labor and manufacturing overhead. The need for a provision for estimated losses from obsolete, excess or slow-moving inventories is reviewed periodically.
F- 9
Property, Plant, Equipment and Depreciation
Property, plant and equipment additions are recorded at cost, including applicable freight, interest, construction and installation costs. The Forest Products segment production related plant and equipment are depreciated using the the straight-line method over 3 to 20 years. High Purity Cellulose and Pulp & Paper production related plant and equipment are depreciated using the units-of-production method. The total units of production used to calculate depreciation expense is determined by factoring annual production days, based on normal production conditions, by the economic useful life of the asset involved. Production related assets under capital leases are depreciated using the straight-line method over the related lease term. The Company depreciates its non-production assets, including office, lab and transportation equipment, using the straight-line depreciation method over 3 to 25 years. Buildings and land improvements are depreciated using the straight-line method over 15 to 35 years and 5 to 30 years, respectively. Depreciation expense reflected in cost of sales in the Consolidated Statements of Income was $94 million, $85 million and $88 million for the years ended December 31, 2017, 2016 and 2015, respectively.
Gains and losses on the retirement of assets are included in operating income. Long-lived assets are reviewed for impairment whenever events or changes in circumstances indicate the carrying amount of an asset may not be recoverable. Recoverability of assets that are held and used is measured by net undiscounted cash flows expected to be generated by the asset. If such assets are considered to be impaired, the impairment to be recognized is measured as the amount by which the carrying value exceeds the fair value of the assets, which is based on a discounted cash flows model. Assets to be disposed of are reported at the lower of the carrying amount or fair value less cost to sell.
Maintenance Costs
The Company performs scheduled inspections, repairs and maintenance of plant machinery and equipment at the Company’s manufacturing plants during a full plant shutdown. Costs associated with these planned outage periods are referred to as shutdown costs. Shutdown costs are costs incurred to ensure the long-term reliability and safety of operations. Shutdown costs are accounted for using the deferral method, under which expenditures related to shutdown are capitalized in other assets when incurred and amortized to production costs on a straight-line basis over the period benefited, or the period of time until the next scheduled shutdown which can generally range from one year to eighteen months. Shutdown costs are classified as working capital in operating activities in the consolidated statements of cash flows. As of December 31, 2017 and 2016 the Company had $8 million and $16 million, respectively, in shut down costs capitalized in other current assets.
Intangible Assets
The Company has definite-life intangible assets which it acquired through a business combination. The definite-life intangible assets consist of customer lists and trade-names and are amortized over their estimated useful lives generally for periods ranging from 8 to 15 years. The Company evaluates the recovery of its definite-life intangible assets by comparing the net carrying value of the asset group to the undiscounted net cash flows expected to be generated from the use and eventual disposition of that asset group when events or changes in circumstances indicate that its carrying amount may not be recoverable. If the carrying amount of the asset group is not recoverable, the fair value of the asset group is measured, and, if the carrying amount exceeds the fair value, an impairment loss is recognized. During 2017, the Company recognized amortization expense on the definite-life intangibles of approximately $1 million in selling, general and administrative expense.
Capitalized Interest
Interest from external borrowings are capitalized on major projects with an expected construction period of one year or longer. The interest costs are added to the cost of the underlying basis of the property, plant and equipment and amortized over the useful life of the assets. Interest capitalized to property, plant and equipment was $1 million for both years ended December 31, 2016 and 2015. During 2017, there was no interest capitalized to property, plant and equipment.
F- 10
Fair Value Measurements
Fair value is defined as the exchange price that would be received for an asset or paid to transfer a liability (an exit price) in the principal or most advantageous market for the asset or liability in an orderly transaction between market participants at the measurement date. A three-level hierarchy that prioritizes the inputs used to measure fair value was established as follows:
Level 1 — Quoted prices in active markets for identical assets or liabilities.
Level 2 — Observable inputs other than quoted prices included in Level 1, such as quoted prices for similar assets and liabilities in active markets, quoted prices for identical or similar assets and liabilities in markets that are not active, or other inputs that are observable or can be corroborated by observable market data.
Level 3 — Unobservable inputs that are supported by little or no market activity and that are significant to the fair value of the assets or liabilities. This includes certain pricing models, discounted cash flows methodologies and similar techniques that use significant unobservable inputs.
Derivative Instruments
Derivatives are recognized on the consolidated balance sheets at fair value and are classified according to their asset or liability position and the expected timing of settlement. Changes in the fair values of derivatives are recorded in net earnings or other comprehensive income based on whether the instrument is designated and effective as a hedge transaction and, if so, the type of hedge transaction. Gains or losses on derivative instruments reported in accumulated other comprehensive loss (“AOCL”) are reclassified to earnings in the period the hedged item affects earnings. If the underlying hedged transaction ceases to exist, any associated amounts reported in accumulated other comprehensive loss are reclassified to earnings at that time. Any ineffectiveness is recognized in earnings in the current period.
Revenue Recognition
The Company generally recognizes sales when persuasive evidence of an agreement exists, delivery of products has occurred, the sales price to the buyer is fixed and determinable and collectibility is reasonably assured. Generally, title passes upon delivery to the agreed upon location. Based on the time required to reach each location, customer orders are generally received in one period with the corresponding revenue recognized in a subsequent period. As such, there could be substantial variation in orders received and revenue recognized from period to period. Customer incentives are recorded as a reduction of gross sales within the same period that revenue from the sale is recognized. Payments from customers made in advance of the recognition of revenue are included in accrued customer incentives and prepayments.
Shipping and Handling Costs
Shipping and handling costs, such as freight to the customers’ destinations, are included in cost of goods sold in the consolidated statements of income.
Environmental Costs
The Company has established liabilities to assess, remediate, maintain and monitor sites related to disposed operations from which no current or future benefit is discernible. These obligations are established based on projected spending over the next 20 years and require significant estimates to determine the proper amount at any point in time. The projected period, from 2018 through 2038, reflects the time during which potential future costs are both estimable and probable. As new information becomes available, these cost estimates are updated and the recorded liabilities are adjusted appropriately. Environmental liabilities are accounted for on an undiscounted basis and are reflected in current and non-current liabilities for disposed operations in the consolidated balance sheets.
Employee Benefit Plans
The determination of expense and funding requirements for the Company’s defined benefit pension and postretirement health care and life insurance plans are largely based on a number of actuarial assumptions. The key assumptions include discount rate, return on assets, salary increases, health care cost trends, mortality rates, longevity and service lives of employees.
F- 11
Periodic pension and other postretirement expense is included in cost of sales and selling, general and administrative expenses in the consolidated statements of income, as appropriate. Changes in the funded status of the Company’s plans are recorded through comprehensive income in the year in which the changes occur. Actuarial gains and losses, which occur when actual experience differs from actuarial assumptions, are reflected in stockholders’ equity, net of taxes. If actuarial gains and losses exceed ten percent of the greater of plan assets or plan liabilities, the Company will amortize them over the average future service period of employees.
Income Taxes
The Company uses the asset and liability method of accounting for income taxes. Under this method, deferred tax assets and liabilities are recognized for the estimated future tax consequences attributable to differences between the financial statement carrying amounts of assets and liabilities and their respective tax bases, operating loss carryforwards and tax credit carryforwards. Deferred tax assets and liabilities are measured pursuant to tax laws using rates expected to apply to taxable income in the years in which the temporary differences are expected to be recovered or settled. The Company records a valuation allowance to reduce the carrying amounts of deferred tax assets if it is more likely than not such deferred tax assets will not be realized. Interest expense and penalties, if applicable, related to unrecognized tax benefits are recorded in income tax expense.
The Company’s income tax returns are subject to audit by U.S. federal and state taxing authorities as well as foreign jurisdictions, including Canada and France. In evaluating the tax benefits associated with various tax filing positions, the Company records a tax benefit for an uncertain tax position if it is more-likely-than-not to be realized upon ultimate settlement of the issue. The Company records a liability for an uncertain tax position that does not meet this criterion. The Company adjusts its liabilities for unrecognized tax benefits in the period in which it is determined the issue is settled with the taxing authorities, the statute of limitations expires for the relevant taxing authority to examine the tax position or when new facts or information becomes available.
New Accounting Pronouncements
Recently Adopted Accounting Pronouncements
In July 2015, the Financial Accounting Standards Board (“FASB”) issued Accounting Standards Update (“ASU”) No. 2015-11, Simplifying the Measurement of Inventory. The update requires inventory to be measured at the lower of cost and net realizable value. It became effective for fiscal years beginning after December 15, 2016. The Company adopted as of January 1, 2017 and retrospectively applied the guidance. There was not a material impact on the Company’s financial statements as the inventory valuation practices already approximated the lower of cost or net realizable value.
In March 2016, FASB issued ASU No. 2016-09, Compensation - Stock Compensation. The update simplifies several areas of accounting for share based payments. The guidance also includes the acceptable or required transition methods for each of the various amendments included in the new standard. It became effective for fiscal years beginning after December 15, 2016. The Company adopted as of January 1, 2017 and prospectively applied the guidance. The Company recorded $2 million in tax expense during the first quarter of 2017 as a result of the adoption of ASU 2016-09.
New Accounting Pronouncements
In May 2014, the FASB issued ASU No. 2014-09, Revenue from Contracts with Customers, as amended and/or clarified by ASU Nos. 2016-08, 2016-10, 2016-12, and 2016-20, a comprehensive new revenue recognition standard. The core principle is that a company should recognize revenue when it transfers control of goods or services to customers for an amount that reflects the consideration to which the company expects to be entitled to in exchange for those goods or services. The Company will adopt the standard on a modified retrospective basis in the first quarter of 2018 and will generally recognize revenue when it transfers control at a point in time, which is not materially different than its current revenue recognition practices.
In February 2016, the FASB issued ASU No. 2016-02, Leases. The update requires entities to recognize assets and liabilities arising from finance and operating leases and to classify those finance and operating lease payments in the financing or operating sections, respectively, of the statement of cash flows. It is effective for fiscal years beginning after December 15, 2018. Early adoption is permitted. The Company is evaluating the impact of this standard on its consolidated financial statements.
In August 2016, the FASB issued ASU No. 2016-15, Statement of Cash Flows (Topic 230) Classification of Certain Cash Receipts and Cash Payments. The update was issued to reduce diversity in practice regarding the presentation of eight specific types of cash receipts and cash payments in the statement of cash flows. The update is effective for fiscal years beginning after December 15, 2017. The update is not expected to have a material impact on the Company’s consolidated financial statements.
F- 12
In March 2017, the FASB issued ASU No. 2017-07, Compensation - Retirement Benefits. The update was issued to to improve the presentation of net periodic pension and post retirement benefit cost. As a result of this update, the Company will present the service costs component of net periodic benefit cost for its pension and post retirement plans in the same income statement line items as the related employee compensation costs arising from services rendered during the period. In addition, only the service cost component of the net periodic benefit cost for its pension and post retirement will be eligible for capitalization in assets. The Company will present the other components of periodic pension and post retirement cost separately outside of operating income. The update is effective for fiscal years beginning after December 15, 2017. The Company expects the update to result in an increase in its operating income or decrease its operating loss, which will be offset by a corresponding increase in other components of net periodic benefits costs to reflect the impact of presenting interest cost, expected return on plan assets, amortization of prior service costs and actuarial gains and losses components in non-operating income. The Company will adopt the provisions of this guidance in the first quarter of 2018 using the retrospective method. The update is not expected to have a material impact on the Company’s consolidated financial statements.
In May 2017, the FASB issued ASU No. 2017-09, Compensation - Stock Compensation. The update provides guidance on how to account for changes to the terms or conditions of stock compensation awards. It is effective for fiscal years beginning after December 15, 2017. The update is not expected to have a material impact on the Company’s consolidated financial statements.
In August 2017, the FASB issued ASU No. 2017-12, Derivatives and Hedging (Topic 815): Targeted Improvements to Accounting for Hedging Activities. The updated provides guidance to better align the financial reporting for hedging activities with the economic objectives of those activities and is effective for public business entities for fiscal years beginning after December 15, 2018, with early adoption, including adoption in an interim period, permitted. Additionally, the update requires a modified retrospective transition method which will result in the recognition of a cumulative effect of the change on the opening balance of each affected component of equity in the statement of financial position as of the date of adoption. The Company plans to adopt the update in the first quarter of 2018. While the Company continues to assess all potential impacts of the standard update, it does not expect the adoption to have an material impact on its consolidated financial statements.
In February 2018, the FASB issued ASU No. 2018-02, Reclassification of Tax Effects from AOCI. This guidance requires the reclassification of any pension or other post employment benefit dangling debits and credits (“dangles”) from accumulated other comprehensive income to retained earnings. The dangles were recorded when there are changes in tax rates for the Company. The reclassification is required in the 2019 financial reporting year with early adoption permitted for the 2018 reporting year. The Company has approximately $23 million in dangling debits recorded AOCI.
3. Recent Acquisition
On November 17, 2017, the Company acquired all of the outstanding common shares of Tembec Inc. (“Tembec”) for an aggregate purchase price of approximately $317 million Canadian dollars cash and 8.4 million shares of the Company’s common stock, par value $0.01 per share (the “Acquisition”).
The Acquisition was accounted for as a business combination. Under this accounting, the assets acquired and liabilities assumed have been presented based on preliminary estimates of fair value which is defined as the price that would be received to sell an asset or paid to transfer a liability in an orderly transaction between market participants at the measurement date. The actual fair values will be determined during the measurement period of the transaction and may vary from these estimates.
The purchase consideration was calculated as follows:
November 17, 2017 | |||
Total Tembec shares receiving stock consideration | 33,200,000 | ||
Exchange ratio | 0.2542 | ||
Total Company stock issued to Tembec shareholders | 8,439,452 | ||
Company’s closing share price on November 17, 2017 | $ | 16.73 | |
Total value of Company shares issued | $ | 141,192 | |
Total cash consideration paid to Tembec shareholders in U.S. dollars | 249,233 | ||
Total purchase consideration to Tembec shareholders | $ | 390,425 | |
F- 13
The estimated fair value of the total purchase consideration was allocated as follows:
November 17, 2017 | |||
Current assets | $ | 383,066 | |
Property, plant and equipment | 628,027 | ||
Deferred tax assets | 389,321 | ||
Definite-life intangibles (a) | 60,684 | ||
Other assets | 70,868 | ||
Current liabilities | (167,244 | ) | |
Assumed long-term debt (b) | (508,531 | ) | |
Pension and other postretirement benefits | (96,278 | ) | |
Other long-term liabilities | (52,933 | ) | |
Estimated fair value of net assets acquired | $ | 706,980 | |
Gain on bargain purchase | $ | 316,555 | |
(a) | The Company acquired definite-life intangibles of $52 million for customer lists and $9 million for trade-names which will be amortized over 8 years and 15 years, respectively. |
(b) Refer to Note 8 — Debt and Capital Leases for a description of the assumed debt.
The estimated fair values of assets acquired and liabilities assumed in the acquisition are based on the information that was available as of the acquisition date. The Company believes such information provides a reasonable basis for estimating the fair values of assets acquired and liabilities assumed; however, the Company is obtaining additional information necessary to finalize those estimated fair values. In particular, the Company will review additional valuation information to more closely ascertain the fair value of acquired property, plant and equipment, intangible assets, spare parts inventories, other assets, environmental liabilities and asset retirement obligations. The Company expects to finalize the valuation and complete the purchase consideration allocation no later than one year from the acquisition date. As of December 31, 2017, no measurement adjustments have been recognized.
The Company recognized a gain on bargain purchase primarily as a result of the elimination of Tembec’s valuation allowance associated with certain deferred tax assets. As a result of the refinancing of Tembec’s debt, the Company expects future taxable income will be adequate to realize the benefit of the tax assets.
Tembec’s operating results contributed net revenue of $139 million and no operating income for the period from the acquisition date of November 17, 2017 to December 31, 2017. The Company recognized $34 million of acquisition related expenses in operating expense during 2017.
The following presents the unaudited pro forma consolidated financial information of the Company as if the acquisition of Tembec was completed on January 1, 2016. The unaudited pro forma financial information includes adjustments for (i) depreciation on acquired property, plant and equipment of $15 million for the pro forma years ended 2017 and 2016; (ii) amortization of intangible assets recorded at the date of the transactions of $7 million for the pro forma years ended 2017 and 2016; (iii) the elimination of acquisition related costs of $49 million and the fair value write-up of inventory of $23 million for the pro forma year ended 2017; (iv) the elimination of interest expense related to Tembec debt that was paid off, net of interest expense associated with financing the acquisition of $38 million and $26 million for the pro forma years ended 2017 and 2016, respectively; (v) the elimination of the gain on bargain purchase for the pro forma year ended 2017, and (vi) total weighted average shares outstanding related to the acquisition. This information is presented for informational purposes only and does not purport to be indicative of the results of future operations or the results that would have occurred had the transaction taken place on January 1, 2016.
Years Ended December 31, | |||||||
2017 | 2016 | ||||||
Unaudited pro forma net revenue | $ | 2,122,000 | $ | 2,044,000 | |||
Unaudited pro forma net income attributable to the Company | 111,000 | 99,000 | |||||
Unaudited pro forma basic net income per share | 1.92 | 1.85 | |||||
Unaudited pro forma diluted net income per share | 1.76 | 1.78 | |||||
F- 14
4. Accounts Receivable
The Company’s accounts receivable included the following for the years ended December 31:
2017 | 2016 | ||||||
Accounts receivable, trade | $ | 134,523 | $ | 35,337 | |||
Accounts receivable, other (a) | 47,368 | 2,440 | |||||
Allowance for doubtful accounts | (593 | ) | (151 | ) | |||
Total accounts receivable, net | $ | 181,298 | $ | 37,626 | |||
(a) | Accounts receivable, other consists primarily of value added/consumption taxes, grants receivable and accrued billings due from government agencies. |
5. Inventory
The Company’s inventory included the following for the years ended December 31:
2017 | 2016 | ||||||
Finished goods | $ | 190,140 | $ | 94,858 | |||
Work-in-progress | 18,889 | 3,422 | |||||
Raw materials | 82,940 | 17,183 | |||||
Manufacturing and maintenance supplies | 10,117 | 2,905 | |||||
Total inventory | $ | 302,086 | $ | 118,368 | |||
6. Property, Plant and Equipment
The Company’s property, plant and equipment included the following for the years ended December 31:
2017 | 2016 | ||||||
Land and land improvements | $ | 18,336 | $ | 15,502 | |||
Buildings | 241,831 | 171,741 | |||||
Machinery and equipment | 2,377,210 | 1,843,057 | |||||
Other | 21,704 | 11,633 | |||||
Construction in progress | 57,873 | 14,439 | |||||
Total property, plant and equipment, gross | 2,716,954 | 2,056,372 | |||||
Accumulated depreciation | (1,309,192 | ) | (1,255,333 | ) | |||
Total property, plant and equipment, net | $ | 1,407,762 | $ | 801,039 | |||
7. Accrued and Other Liabilities
The Company’s accrued and other liabilities included the following for the years ended December 31:
2017 | 2016 | ||||||
Accrued customer incentives and prepayments | $ | 53,522 | $ | 34,541 | |||
Accrued payroll and benefits | 48,431 | 11,915 | |||||
Accrued interest | 3,188 | 2,499 | |||||
Other current liabilities | 21,899 | 18,271 | |||||
Total accrued and other liabilities | $ | 127,040 | $ | 67,226 | |||
F- 15
8. Debt and Capital Leases
The Company’s debt and capital leases include the following for the years ended December 31:
2017 | 2016 | ||||||
U.S. Revolver of $100 million maturing in November 2022, $92 million available after taking into account outstanding letters of credit, bearing interest at LIBOR plus 2.25% at December 31, 2017 | $ | — | $ | — | |||
Multi-currency Revolver of $150 million maturing in November 2022, $124 million available after taking into account outstanding letters of credit, bearing interest at LIBOR plus 2.25% at December 31, 2017 | — | — | |||||
Term A-1 Loan Facility borrowings maturing through November 2022 bearing interest at LIBOR plus 2.25%, interest rate of 3.80% at December 31, 2017 | 180,000 | — | |||||
Term A-2 Loan Facility borrowings maturing through November 2024 bearing interest at LIBOR plus 2.00 (after consideration of 0.50% patronage benefit), interest rate of 4.05% at December 31, 2017 | 450,000 | — | |||||
Previous term A-1 loan borrowings bearing interest at LIBOR plus 1.50%, interest rate of 2.26% at December 31, 2016 (a) | — | 30,450 | |||||
Previous term A-2 loan borrowings bearing interest at LIBOR plus 1.08% (after consideration of 0.67% patronage benefit), interest rate of 1.84% at December 31, 2016 (a) | — | 251,300 | |||||
Senior Notes due 2024 at a fixed interest rate of 5.50% | 506,412 | 506,412 | |||||
Canadian dollar, fixed interest rate term loans with rates ranging from 5.50% to 6.86% and maturity dates ranging from March 2020 through April 2028, secured by certain assets of the Temiscaming plant (b) | 100,881 | — | |||||
Other loans (b) | 5,946 | ||||||
Capital Lease obligation | 3,409 | 3,676 | |||||
Total principal payments due | 1,246,648 | 791,838 | |||||
Less: debt premium, original issue discount and issuance costs | (5,044 | ) | (8,556 | ) | |||
Total debt | 1,241,604 | 783,282 | |||||
Less: Current maturities of long-term debt | (9,425 | ) | (9,593 | ) | |||
Long-term debt | $ | 1,232,179 | $ | 773,689 | |||
(a) | The December 31, 2016 term loan balances were outstanding under the previous credit facility. The loans were extinguished in November 2017 and replaced with the new Term Loan Facilities as described in this footnote and presented above. |
(b) | Debt assumed in Acquisition. |
Debt and capital lease payments due during the next five years and thereafter are as follows:
Capital Lease | |||||||||||||||
Minimum Lease Payments | Less: Interest | Net Present Value | Debt Principal Payments | ||||||||||||
2018 | $ | 515 | $ | 230 | $ | 285 | $ | 8,501 | |||||||
2019 | 515 | 209 | 306 | 18,798 | |||||||||||
2020 | 515 | 187 | 328 | 23,192 | |||||||||||
2021 | 515 | 163 | 352 | 14,753 | |||||||||||
2022 | 515 | 138 | 377 | 209,377 | |||||||||||
Thereafter | 2,018 | 257 | 1,761 | 968,618 | |||||||||||
Total payments | $ | 4,593 | $ | 1,184 | $ | 3,409 | $ | 1,243,239 | |||||||
F- 16
5.50% Senior Notes due 2024
On May 22, 2014, the Company issued $550 million in aggregate principal amount of 5.50 percent senior notes due 2024. The Senior Notes were issued and sold in a private placement to qualified institutional buyers pursuant to Rule 144A under the U.S. Securities Act of 1933, as amended (the “Securities Act”) and non-U.S. persons pursuant to Regulation S under the Securities Act. During the first quarter of 2016, the Company repurchased in the open market $44 million of the Senior Notes and retired them for $34 million plus accrued and unpaid interest. In connection with the retirement of these Senior Notes, the Company recorded a gain in other income of approximately $9 million, which includes the write-off of $1 million of unamortized debt issuance costs in the first quarter of 2016.
Prior to June 1, 2019, the Company may redeem some or all of the Senior Notes at a redemption price of 100 percent of the principal amount, plus accrued and unpaid interest, plus a “make-whole” premium. On or after June 1, 2019, the Company may redeem the Senior Notes, in whole or in part, at the redemption prices specified in the indenture governing the Senior Notes plus accrued and unpaid interest.
The indenture governing the Senior Notes contains various customary covenants that limit the ability of the Company and its restricted subsidiaries, as defined by the Senior Notes, to take certain specified actions, subject to certain exceptions, including: creating liens; incurring indebtedness; making investments and acquisitions; engaging in mergers and other fundamental changes; making dispositions; making restricted payments, including dividends and distributions; and consummating transactions with affiliates. Additionally, the Senior Notes contain customary affirmative covenants and customary events of default (subject, in certain cases, to customary grace or cure periods), including, without limitation, payment defaults, breach of covenant defaults, bankruptcy defaults, judgment defaults, defaults under certain other indebtedness and changes in control. At December 31, 2017, the Company was in compliance with all covenants.
Senior Secured Credit Facilities
On November 17, 2017, the Company entered into an amended and restated credit agreement that refinanced, restated and replaced the credit facilities established by its previous credit agreement. The new credit facilities (collectively the “Credit Facility”) consists of a $230 million senior secured five year term loan (the “Term A-1 Loan Facility”), a $450 million senior secured seven year term loan (the “Term A-2 Loan Facility” and together with the Term A-1 Facility, the “Term Loan Facilities”), a $100 million revolving credit facility (the “U.S. Revolver”), and a multi-currency revolving credit facility in a U.S. Dollar equivalent amount of $150 million (the “Multicurrency Revolver” and together with the U.S. Revolver, the “Revolving Credit Facility”). The lenders under the Credit Facilities have a first priority security interest in substantially all present and future material assets, excluding the Fernandina Beach plant’s real property.
The loans under the Credit Facility bear interest at either (a) a base rate plus an applicable margin ranging between 1.00 percent and 1.75 percent or (b) an adjusted LIBOR rate plus an applicable margin ranging between 2.00 percent and 2.75 percent. The applicable margin for borrowings under the Credit Facility is based on a consolidated total net leverage-based pricing grid.
The Revolving Credit Facility has a five year term, maturing in November 2022. As of December 31, 2017, the Company had no outstanding balance on the Revolving Credit Facility. At December 31, 2017, the Company had $216 million of available borrowings under the Revolving Credit Facility, net of $34 million used to secure its outstanding letters of credit. There were no revolving credit borrowings outstanding at December 31, 2016.
During the fourth quarter of 2017, the Company made a principal debt repayment on the new Term A-1 Loan of $50 million.
The Credit Facility contains a number of covenants that limit the ability of the Company and its restricted subsidiaries, as defined by the Credit Facility, to take certain specified actions, subject to certain exceptions, including: creating liens; incurring indebtedness; making investments and acquisitions; engaging in mergers and other fundamental changes; making dispositions; making restricted payments, including dividends and distributions; and consummating transactions with affiliates. Under the Credit Facility, the Company will be required to maintain a consolidated first lien secured net leverage ratio of no greater than 3.00 to 1.00 and an interest coverage ratio of no less than 3.00 to 1.00. Additionally, the Credit Facility contains customary affirmative covenants for credit facilities of this kind and customary events of default (subject, in certain cases, to customary grace or cure periods), including, without limitation, payment defaults, breach of covenant defaults, bankruptcy defaults, judgment defaults, defaults under certain other indebtedness and changes in control. At December 31, 2017, the Company was in compliance with all covenants.
F- 17
The previous credit facility was executed in June 2014 and consisted of a $110 million senior secured term loan facility, a $290 million senior secured term loan facility, and a $250 million senior secured revolving credit facility. Interest rates on loans under the previous credit facilities were either (a) a base rate plus an applicable margin ranging between 0.25 percent and 1.00 percent or (b) an adjusted LIBOR rate plus an applicable margin ranging between 1.25 percent and 2.00 percent. The applicable margin for borrowings was based on a consolidated total net leverage-based pricing grid.
Debt Assumed in Tembec Acquisition
The Company assumed certain debt as part of the Tembec Acquisition and recorded the related liabilities at their fair values. Subsequent to the Acquisition, the Company repaid Tembec’s senior secured notes for $375 million plus accrued and unpaid interest.
9. Liabilities for Disposed Operations
The Company’s liabilities for disposed operations relate to sawmills, pulp & paper and wood treating plants which have ceased operations other than environmental investigation and remediation activities. The Company owns or has liability for eighteen sites that are subject to various federal, state or provincial statutes, including but not limited to, the Resource Conservation and Recovery Act (“RCRA”), the Comprehensive Environmental Response, Compensation and Liability Act of 1980 (“CERCLA”) and the Environmental Protection Act in the United States, and similar laws in Canada and France, related to the investigation and remediation of environmentally-impacted sites.
The Company estimates its environmental liabilities based on its current interpretation of environmental laws and regulations when it is probable a liability has been incurred and the amount of such liability is estimable. The Company calculates estimates based on a number of factors, including the application and interpretation of current environmental laws, regulations and other requirements; reports and advice of internal and third-party environmental specialists; and management’s knowledge and experience with these and similar types of environmental matters. These estimates include potential costs for investigation, assessment, remediation, ongoing operation and maintenance (where applicable), and post-remediation monitoring of the sites, as well as the cost of legally-required financial assurance relating to the Company’s obligations on an undiscounted basis, generally for a period of 20 years. These environmental liabilities do not include potential third-party recoveries to which the Company may be entitled unless they are probable and estimable.
The following table provides detail for specific sites where current estimates exceed 10 percent of the total liabilities for disposed operations at December 31, 2017, 2016, or 2015. An analysis of the activity of the liabilities for disposed operations for the years ended December 31, 2017 and 2016 is as follows:
December 31, 2015 Liability | Payments | Increase (Decrease) to Liabilities | December 31, 2016 Liability | Liabilities Assumed in Acquisition | Payments | Increase (Decrease) to Liabilities | December 31, 2017 Liability | ||||||||||||||||||||||||
Port Angeles, Washington | $ | 39,405 | $ | (809 | ) | $ | 714 | $ | 39,310 | $ | — | $ | (698 | ) | $ | 5,055 | $ | 43,667 | |||||||||||||
Augusta, Georgia | 22,881 | (1,206 | ) | 1,212 | 22,887 | — | (1,508 | ) | (204 | ) | 21,175 | ||||||||||||||||||||
Baldwin, Florida | 26,960 | (3,019 | ) | 2,831 | 26,772 | — | (902 | ) | (4,700 | ) | 21,170 | ||||||||||||||||||||
Spartanburg, South Carolina | 17,476 | (792 | ) | (4,904 | ) | 11,780 | — | (737 | ) | (1,045 | ) | 9,998 | |||||||||||||||||||
All other sites | 50,662 | (3,946 | ) | 5,445 | 52,161 | 16,715 | (1,950 | ) | 1,150 | 68,076 | |||||||||||||||||||||
Total | 157,384 | $ | (9,772 | ) | $ | 5,298 | 152,910 | $ | 16,715 | $ | (5,795 | ) | $ | 256 | 164,086 | ||||||||||||||||
Less: Current portion | (12,034 | ) | (13,781 | ) | (13,181 | ) | |||||||||||||||||||||||||
Non-Current portion | $ | 145,350 | $ | 139,129 | $ | 150,905 | |||||||||||||||||||||||||
F- 18
A brief description of the above identified sites is as follows:
Port Angeles, Washington — The Company operated a pulp mill at this site from 1930 until 1997. The site and the adjacent marine areas (a portion of Port Angeles harbor) have been in various stages of the assessment process under the Washington Model Toxics Control Act (“MTCA”) since 2000, and several voluntary interim soil clean-up actions have been performed during this time. In addition, the Company may be liable under CERCLA for “natural resource damages” caused by releases from the site. As a result of an agreed order with the Washington State Department of Ecology (“Ecology”), the remainder of the MTCA regulatory process will be completed on a set timetable, subject to approval of all reports and studies by Ecology. Upon completion of all work required under the agreed order and negotiation of an approved remedy, additional remedial measures for the site and off-site areas may be necessary and, as a result, current cost estimates and the corresponding liability could change. In September 2017, the Company received comments from Ecology on its feasibility study submitted in February 2015. The Company is currently evaluating the impact of the comments on its proposed remediation plan and cost estimates and expects to complete its evaluation and resubmit the feasibility study in the first quarter of 2018. During 2016, there was not a significant change in the estimated liability as payments were offset by an increase in the estimated liability to maintain its 20 year projection of costs. During 2017, the estimated liability increased by approximately $4 million primarily due to the re-evaluation of the remediation’s cost estimate. Total spending related to the site as of December 31, 2017 was $48 million.
Augusta, Georgia — The Company operated a wood treatment plant at this site from 1928 to 1988. This site operates under a 10 year hazardous waste permit renewed and issued pursuant to the RCRA in 2015. Remediation activities currently consist primarily of groundwater recovery and treatment. Current cost estimates and the corresponding liability could vary if recovery or discharge volumes change or if changes to current remediation activities are required in the future. During 2016, there was not a significant change in the estimated liability as payments were offset by an increase in the estimated liability to maintain its 20 year projection of costs. During 2017, the Company decreased the estimated liability by approximately $2 million due to payments and a decrease in the estimated costs related to the site’s operation and maintenance. Total spending related to the site as of December 31, 2017 was $74 million.
Baldwin, Florida — The Company operated a wood treatment plant at this site from 1954 to 1987. This site operates under a 10 year hazardous waste permit renewed and issued pursuant to the RCRA in 2016. The current remediation activities primarily consist of groundwater recovery and treatment. Additional remedial activities may be necessary in the future and, therefore, current cost estimates and the corresponding liability could change. During 2016, there was not a significant change in the estimated liability as payments were offset by an increase in the estimated liability to maintain its 20 year projection of costs. During 2017, the Company decreased the estimated liability by approximately $6 million due to payments and a decrease in the estimated costs related to the site’s remediation plan. Total spending as of December 31, 2017 was $28 million.
Spartanburg, South Carolina — The Company operated a wood treatment plant at this site from 1925 to 1989. Remediation activities consist primarily of groundwater recovery and treatment. The Company entered into a consent agreement with the South Carolina Department of Health and Environmental Control (“DHEC”) which governs the on and off-site assessment and remediation activities. Additional remedial actions may be required in the future and, therefore, current cost estimates and the corresponding liability could change. In 2016, the Company decreased its estimated liability by $6 million primarily due to expected lower estimated costs for addressing certain off-site areas based on the results of a study performed by the Company and approved by DHEC. During 2017, the Company decreased the estimated liability by approximately $2 million due to payments and a decrease in the estimated costs related to the site’s operation and maintenance. Total spending related to the site as of December 31, 2017 was $44 million.
In addition to the estimated liabilities, the Company is subject to the risk of reasonably possible additional liabilities in excess of the established liabilities due to potential changes in circumstances and future events, including, without limitation, changes to current laws and regulations; changes in governmental agency personnel, direction, philosophy or enforcement policies; developments in remediation technologies; increases in the cost of remediation, operation, maintenance and monitoring of its disposed operations sites and providing financial assurance relating thereto; changes in the volume, nature or extent of contamination to be remediated or monitoring to be undertaken; the outcome of negotiations with governmental agencies or non-governmental parties; and changes in accounting rules or interpretations. Based on information available as of December 31, 2017, the Company estimates this exposure could range up to approximately $66 million, although no assurances can be given that this amount will not be exceeded given the factors described above. These potential additional costs are attributable to several of the above sites and other applicable liabilities. This estimate excludes liabilities which would otherwise be considered reasonably possible but for the fact that they are not currently estimable primarily due to the factors discussed above.
F- 19
Subject to the previous paragraph, the Company believes established liabilities are sufficient for probable costs expected to be incurred over the next 20 years with respect to its disposed operations. However, no assurances are given they will be sufficient for the reasons described above, and additional liabilities could have a material adverse effect on the Company’s financial position, results of operations and cash flows.
10. Derivative Instruments
The Company’s earnings and cash flows are subject to fluctuations due to changes in interest rates and foreign currency exchange rates. The Company allows for the use of derivative financial instruments to manage interest rate and foreign currency exchange rate exposure, but does not allow derivatives to be used for speculative purposes.
All derivative instruments are recognized on the consolidated balance sheets at their fair value and are either (1) designated as a hedge of a forecasted transaction or (2) undesignated. Changes in the fair value of a derivative designated as a hedge are recorded in other comprehensive income until earnings are affected by the hedged transaction, and are then reported in current earnings. Changes in the fair value of undesignated derivative instruments and the ineffective portion of designated derivative instruments are reported in current earnings.
Interest Rate Risk
The Company’s primary debt obligations utilize variable-rate LIBOR, exposing the Company to variability in interest payments due to changes in interest rates. The Company entered into interest rate swap agreements to reduce the volatility of financing costs, achieve a desired proportion of fixed-rate versus floating-rate debt and to hedge the variability in cash flows attributable to interest rate risks caused by changes in the LIBOR benchmark.
The Company designated the swaps as cash flow hedges and is assessing their effectiveness using the hypothetical derivative method in conjunction with regression. Effective gains and losses, deferred to accumulated other comprehensive loss, are reclassified into earnings over the life of the associated hedge. Ineffective gains and losses are classified to earnings immediately. There was no hedge ineffectiveness during 2017.
Foreign Currency Exchange Rate Risk
Foreign currency fluctuations affect investments in foreign subsidiaries and foreign currency cash flows related to third party purchases, product shipments, and foreign-denominated debt. The Company is also exposed to the translation of foreign currency earnings to the U.S. dollar. Management may use foreign currency forward contracts to selectively hedge its foreign currency cash flows exposure and manage risk associated with changes in currency exchange rates. The Company’s principal foreign currency exposure is to the Canadian dollar, and to a lesser extent, the EURO.
The notional amounts and maturity dates of outstanding derivative instruments as of December 31, 2017 are presented below. The Company did not use any derivative instruments during the years ended December 31, 2016 and 2015.
Maturity Date | Notional Amount | |||||
Interest Rate Swap | December 29, 2020 | $ | 200,000 | |||
Foreign Currency Forward Contract | Monthly | $ | 240,591 | |||
F- 20
The fair values of derivative instruments included in the consolidated balance sheet as of December 31, 2017 are provided in the below table. See Note 11 — Fair Value Measurements for additional information related to the Company’s derivatives.
Balance Sheet Location | Asset Derivatives | Balance Sheet Location | Liability Derivatives | |||||||||
Derivatives designated as hedging instruments: | ||||||||||||
Interest rate swaps | Other assets | $ | 749 | Other non-current liabilities | $ | — | ||||||
Derivatives not designated as hedging instruments: | ||||||||||||
Foreign exchange forward contracts | Other current assets | $ | 427 | Other current liabilities | $ | — | ||||||
Total derivatives | $ | 1,176 | $ | — | ||||||||
The effects of derivative instruments designated as cash flow hedges, the related changes in AOCL and the gains and losses in income for the year ended December 31, 2017 were as follows:
Derivatives in Cash Flow Hedging Relationships | Gain (Loss) Recognized in OCI on Derivative (Effective Portion) | Gain (Loss) Reclassified from AOCL into Income (Effective Portion) | Gain (Loss) Recognized in Income on Derivative (Ineffective Portion and Amount Excluded from Effectiveness Testing) | |||||||||||||
Interest rate swaps | $ | 749 | Interest Expense | $ | — | Interest expense | $ | — | ||||||||
The effects of derivative instruments not designated as hedging instruments on the statement of income for the year ended December 31, 2017 were as follows:
Derivatives Not Designated as Hedging Instruments | Location of Gain (Loss) Recognized in Income on Derivative | Gains (Losses) | ||||
Foreign exchange forward contracts | Other operating expense, net | $ | 427 | |||
Foreign currency collar | Other non-operating income | 7,780 | ||||
The after-tax amounts of unrealized gains in AOCL related to hedge derivatives at December 31, 2017 are presented below:
After-tax Gain (Loss) | ||||
Unrealized gains from interest rate cash flow hedges | $ | 619 | ||
The amount of future reclassifications from AOCL will fluctuate with movements in the underlying markets.
F- 21
11. Fair Value Measurements
The following table presents the carrying amount, estimated fair values and categorization under the fair value hierarchy for financial instruments held by the Company at December 31, 2017 and 2016, using market information and what management believes to be appropriate valuation methodologies:
December 31, 2017 | December 31, 2016 | ||||||||||||||||||||||
Carrying Amount | Fair Value | Carrying Amount | Fair Value | ||||||||||||||||||||
Level 1 | Level 2 | Level 1 | Level 2 | ||||||||||||||||||||
Assets: | |||||||||||||||||||||||
Cash and cash equivalents | $ | 96,235 | $ | 96,235 | $ | — | $ | 326,655 | $ | 326,655 | $ | — | |||||||||||
Interest rate swaps (a) | 749 | — | 749 | — | — | — | |||||||||||||||||
Foreign currency forward contracts (a) | 427 | — | 427 | — | — | — | |||||||||||||||||
Liabilities (b): | |||||||||||||||||||||||
Fixed-rate long-term debt | 606,529 | — | 611,308 | 499,444 | — | 474,761 | |||||||||||||||||
Variable-rate long-term debt | 631,666 | — | 635,946 | 280,163 | — | 281,750 | |||||||||||||||||
(a) These items represent derivative instruments.
(b) Liabilities excludes capital lease obligation.
The Company uses the following methods and assumptions in estimating the fair value of its financial instruments:
Cash and cash equivalents — The carrying amount is equal to fair market value.
Derivative instruments — The fair value is calculated based on standard valuation models using quoted prices and market observable data of similar instruments. The interest rate derivatives are based on the LIBOR swap rate, which is observable at commonly quoted intervals for the full term of the swap and therefore is considered Level 2. The foreign currency derivatives are contracts to buy foreign currency at a fixed rate on a specified future date. The foreign exchange rate is observable for the full term of the swap and is therefore considered Level 2. See Note 10 — Derivative Instruments for additional information related to the derivative instruments.
Debt — The fair value of fixed rate debt is based upon quoted market prices for debt with similar terms and maturities. The variable rate debt adjusts with changes in the market rate, therefore the carrying value approximates fair value.
F- 22
12. Stockholders' Equity (Deficit)
An analysis of stockholders’ equity (deficit) for each of the three years ended December 31 is shown below (share amounts not in thousands):
Common Stock | Preferred Stock | Additional Paid in Capital | Retained Earnings (Accumulated Deficit) | Accumulated Other Comprehensive Loss | Total Stockholders’ Equity (Deficit) | ||||||||||||||||||||||||
Shares | Par Value | Shares | Par Value | ||||||||||||||||||||||||||
Balance, December 31, 2014 | 42,616,319 | $ | 426 | — | $ | — | $ | 62,082 | $ | (21,476 | ) | $ | (103,444 | ) | $ | (62,412 | ) | ||||||||||||
Net income | — | — | — | — | — | 55,257 | — | 55,257 | |||||||||||||||||||||
Other comprehensive loss, net of tax | — | — | — | — | — | — | (6,176 | ) | (6,176 | ) | |||||||||||||||||||
Reclassification to additional paid-in capital | — | — | — | — | 864 | — | 864 | ||||||||||||||||||||||
Issuance of common stock under incentive stock plans | 258,176 | 3 | — | — | 5 | — | — | 8 | |||||||||||||||||||||
Stock-based compensation | — | — | — | — | 9,832 | — | — | 9,832 | |||||||||||||||||||||
Excess tax deficit on stock-based compensation | — | — | — | — | (2,558 | ) | — | — | (2,558 | ) | |||||||||||||||||||
Repurchase of common stock | (2,060 | ) | — | — | — | (12 | ) | — | — | (12 | ) | ||||||||||||||||||
Common stock dividends ($0.28 per share) | — | — | — | — | — | (11,942 | ) | — | (11,942 | ) | |||||||||||||||||||
Balance, December 31, 2015 | 42,872,435 | $ | 429 | — | — | $ | 70,213 | $ | 21,839 | $ | (109,620 | ) | $ | (17,139 | ) | ||||||||||||||
Net income | — | — | — | — | — | 73,286 | — | 73,286 | |||||||||||||||||||||
Other comprehensive loss, net of tax | — | — | — | — | — | — | (460 | ) | (460 | ) | |||||||||||||||||||
Issuance of preferred stock | — | — | 1,725,000 | 17 | 166,592 | — | — | 166,609 | |||||||||||||||||||||
Issuance of common stock under incentive stock plans | 422,941 | 4 | — | — | (4 | ) | — | — | — | ||||||||||||||||||||
Stock-based compensation | — | — | — | — | 7,217 | — | — | 7,217 | |||||||||||||||||||||
Excess tax deficit on stock-based compensation | — | — | — | — | (1,228 | ) | — | — | (1,228 | ) | |||||||||||||||||||
Repurchase of common stock | (33,471 | ) | — | — | — | (388 | ) | — | — | (388 | ) | ||||||||||||||||||
Common stock dividends ($0.28 per share) | — | — | — | — | — | (12,507 | ) | — | (12,507 | ) | |||||||||||||||||||
Preferred stock dividends ($2.11 per share) | — | — | — | — | — | (3,641 | ) | — | (3,641 | ) | |||||||||||||||||||
Balance, December 31, 2016 | 43,261,905 | 433 | 1,725,000 | 17 | $ | 242,402 | $ | 78,977 | $ | (110,080 | ) | $ | 211,749 | ||||||||||||||||
Net income | — | — | — | — | — | 324,964 | — | 324,964 | |||||||||||||||||||||
Other comprehensive income, net of tax | — | — | — | — | — | — | 33,929 | 33,929 | |||||||||||||||||||||
Common stock issued at Acquisition | 8,439,452 | 84 | 141,108 | 141,192 | |||||||||||||||||||||||||
Issuance of common stock under incentive stock plans | 27,131 | — | — | — | 14 | — | — | 14 | |||||||||||||||||||||
Stock-based compensation | — | — | — | — | 8,986 | — | — | 8,986 | |||||||||||||||||||||
Repurchase of common stock | (11,346 | ) | — | — | — | (157 | ) | — | — | (157 | ) | ||||||||||||||||||
Common stock dividends ($0.28 per share) | — | — | — | — | — | (13,121 | ) | — | (13,121 | ) | |||||||||||||||||||
Preferred stock dividends ($8.00 per share) | — | — | — | — | — | (13,800 | ) | — | (13,800 | ) | |||||||||||||||||||
Balance, December 31, 2017 | 51,717,142 | 517 | 1,725,000 | 17 | 392,353 | 377,020 | (76,151 | ) | 693,756 | ||||||||||||||||||||
Series A Mandatory Convertible Preferred Stock
On August 4, 2016, the Company completed a registered public offering of 1,725,000 shares of the Company’s 8.00% Series A Mandatory Convertible Preferred Stock (the “Preferred Stock”), at a public offering price of $100.00 per share. Net proceeds were $167 million after deducting underwriting discounts, commissions and expenses.
F- 23
Each share of the Preferred Stock will automatically convert into shares of common stock, subject to anti-dilution and other adjustments, on the mandatory conversion date, which is expected to be August 15, 2019. The number of shares of common stock issuable on conversion will be determined based on the volume-weighted average price of the Company’s common stock over a 20 trading day period immediately prior to the mandatory conversion date (“Applicable Market Value”). If the Applicable Market Value for our common stock is greater than $15.17 or less than $12.91, the conversion rate per share of Preferred Stock will be 6.5923 or 7.7459, respectively. If the Applicable Market Value is between $15.17 and $12.91, the conversion rate per share of Preferred Stock will be between 6.5923 and 7.7459. Subject to certain restrictions, at any time prior to August 15, 2019, holders of the Preferred Stock may elect to convert all or a portion of their shares into common stock at the minimum conversion rate of 6.5923 shares of common stock per share of Preferred Stock, subject to adjustment.
Preferred Stock holders have no voting rights unless dividends on the Preferred Stock have not been declared and paid for six or more dividend periods. In those circumstances, holders will be entitled to vote for the election of a total of two additional members of the Company’s board of directors.
Dividends on the Preferred Stock are payable on a cumulative basis if and when they are declared by our board of directors. If declared, dividends will be paid at an annual rate of 8.00% of the liquidation preference of $100 per share. Dividend payment dates are February 15, May 15, August 15 and November 15 of each year, through August 15, 2019. Dividends may be paid in cash or, subject to certain limitations, in shares of common stock or any combination of cash and shares of common stock. The terms of the Preferred Stock provide that, unless full cumulative dividends have been paid or set aside for payment on all outstanding Preferred Stock for all prior dividend periods, no dividends may be declared or paid on common stock.
F- 24
13. Accumulated Other Comprehensive Loss
AOCL was comprised of the following for the three years ended December 31:
2017 | 2016 | 2015 | |||||||||
Unrecognized components of employee benefit plans, net of tax: | |||||||||||
Balance, beginning of year | $ | (110,080 | ) | $ | (109,620 | ) | $ | (103,444 | ) | ||
Other comprehensive gain (loss) before reclassifications | 26,050 | (12,917 | ) | (24,191 | ) | ||||||
Income tax on other comprehensive loss | (5,731 | ) | — | — | |||||||
Reclassifications to earnings: (a) | |||||||||||
Amortization of losses | 11,984 | 11,581 | 14,110 | ||||||||
Amortization of prior service costs | 763 | 775 | 767 | ||||||||
Amortization of negative plan amendment | (153 | ) | (153 | ) | (175 | ) | |||||
Income tax on reclassifications | (4,471 | ) | 254 | 3,313 | |||||||
Net comprehensive gain (loss) on employee benefit plans, net of tax | 28,442 | (460 | ) | (6,176 | ) | ||||||
Balance, end of year | (81,638 | ) | (110,080 | ) | (109,620 | ) | |||||
Unrealized gain on derivative instruments, net of tax: | |||||||||||
Balance, beginning of year | — | — | — | ||||||||
Other comprehensive income before reclassifications | 749 | — | — | ||||||||
Income tax on other comprehensive income | (130 | ) | — | — | |||||||
Net comprehensive gain on derivative instruments, net of tax | 619 | — | — | ||||||||
Balance, end of year (b) | 619 | — | — | ||||||||
Foreign currency translation adjustments: | |||||||||||
Balance, beginning of year | — | — | — | ||||||||
Foreign currency translation adjustment | 4,868 | — | — | ||||||||
Balance, end of year | 4,868 | — | — | ||||||||
Accumulated other comprehensive loss, end of year | $ | (76,151 | ) | $ | (110,080 | ) | $ | (109,620 | ) | ||
(a) | The AOCL components for defined benefit pension and post-retirement plans are included in the computation of net periodic pension cost. See Note 16 — Employee Benefit Plans for additional information. |
(b) | Reclassifications of interest rate contracts are recorded in interest expense, and reclassifications of foreign currency exchange contracts are recorded in other operating income. Additional details about the reclassifications related to derivative instruments is included in Note 10 —Derivative Instruments. There were no reclassifications to earnings for derivative instruments during the year ended December 31, 2017. |
14. Earnings per Share of Common Stock
Basic earnings per share (“EPS”) is calculated by dividing net income available for common stockholders by the weighted-average number of shares of common stock outstanding during the year. Diluted EPS is calculated by dividing net income by the weighted-average number of shares of common stock outstanding adjusted to include the potentially dilutive effect of outstanding stock options, performance shares, restricted shares and Preferred Stock.
In connection with the acquisition of Tembec in November 2017, the Company issued 8.4 million shares of common stock as part of the consideration to Tembec shareholders. These shares are included in the calculation of weighted-average shares outstanding at December 31, 2017. Refer to Note 3— Recent Acquisition for more information.
F- 25
The following table provides details of the calculations of basic and diluted EPS for the three years ended December 31:
2017 | 2016 | 2015 | |||||||||
Net income | $ | 324,964 | $ | 73,286 | $ | 55,257 | |||||
Less: Preferred Stock dividends | (13,800 | ) | (5,404 | ) | — | ||||||
Net income available for common stockholders | $ | 311,164 | $ | 67,882 | $ | 55,257 | |||||
Shares used for determining basic earnings per share of common stock | 43,416,868 | 42,279,811 | 42,194,891 | ||||||||
Dilutive effect of: | |||||||||||
Stock options | — | — | — | ||||||||
Performance and restricted shares | 1,113,866 | 422,962 | 27,968 | ||||||||
Preferred Stock | 11,371,718 | 4,443,048 | — | ||||||||
Shares used for determining diluted earnings per share of common stock | 55,902,452 | 47,145,821 | 42,222,859 | ||||||||
Basic earnings per share (not in thousands) | $ | 7.17 | $ | 1.61 | $ | 1.31 | |||||
Diluted earnings per share (not in thousands) | $ | 5.81 | $ | 1.55 | $ | 1.30 | |||||
Anti-dilutive instruments excluded from the computation of diluted earnings per share:
2017 | 2016 | 2015 | ||||||
Stock options | 373,058 | 399,012 | 447,524 | |||||
Performance and restricted shares | 798 | 90,399 | 223,727 | |||||
Preferred Stock | — | — | — | |||||
Total | 373,856 | 489,411 | 671,251 | |||||
15. Incentive Stock Plans
At December 31, 2017, the Company had two stock-based incentive plans. The Rayonier Advanced Materials Inc. Incentive Stock Plan (the “Prior Plan”) provided for the grant of incentive stock options, non-qualified stock options, stock appreciation rights, performance shares, restricted stock, and restricted stock units, subject to certain limitations. The Company no longer issues shares under the Prior Plan. The Rayonier Advanced Materials Inc. 2017 Incentive Stock Plan (the “2017 Plan”) provides for up to 4.8 million shares to be granted for stock options, non-qualified stock options, stock appreciation rights, performance shares, restricted stock, and restricted stock units. Under the 2017 Plan, shares available for issuance may be increased by any shares of common stock subject to awards under the Prior Plan that, in whole or in part, are forfeited, terminated or expire unexercised, settled in cash in lieu of stock, or released from a reserve for failure to meet the maximum payout under a program. At December 31, 2017, approximately 4.8 million shares were available for future grants under the Stock Plan.
The Company recognizes stock-based compensation expense on a straight-line basis over the service period of the award. The Company’s total stock based compensation cost, including allocated amounts, for the years ended December 31, 2017, 2016 and 2015 was $9 million, $7 million and $10 million, respectively. These amounts may not reflect the cost of current or future equity awards.
Total stock-based compensation expense was allocated for the years ended December 31 as follows:
2017 | 2016 | 2015 | |||||||||
Selling, general and administrative expenses | $ | 7,991 | $ | 6,330 | $ | 8,124 | |||||
Cost of sales | 995 | 887 | 1,868 | ||||||||
Total stock-based compensation expense | $ | 8,986 | $ | 7,217 | $ | 9,992 | |||||
F- 26
The Company’s employee stock option compensation program generally provides accelerated vesting (i.e., a waiver of the remaining period of service required to earn an award) for awards held by employees at the time of their retirement. Stock-based compensation expense for stock option awards is recognized over the shorter of: (1) the service period (i.e., the stated period of time required to earn the award); or (2) the period beginning at the start of the service period and ending when an employee first becomes eligible for retirement.
Fair Value Calculations by Award
All restricted stock and performance share awards are presented for Rayonier Advanced Materials stock only. Option awards include Rayonier Advanced Materials awards held by Rayonier employees.
Non-Qualified Employee Stock Option Awards
Stock options are granted with an exercise price equal to the market value of the underlying stock on the grant date. They generally vest ratably over three years and have a maximum term of 10 years and two days from the grant date.
The fair value of each option grant is estimated on the grant date using the Black-Scholes option-pricing model. The Company has elected to value each grant in total and recognize the expense for stock options on a straight-line basis over three years. During the years ended December 31, 2017, 2016 and 2015, no options were granted.
A summary of the Company’s stock option activity is presented below for the year ended December 31, 2017:
Stock Options | ||||||||||||
Options | Weighted Average Exercise Price | Weighted Average Remaining Contractual Term (in years) | Aggregate Intrinsic Value | |||||||||
Outstanding at January 1, 2017 | 399,012 | $ | 31.85 | |||||||||
Forfeited | — | — | ||||||||||
Exercised | (832 | ) | 17.34 | |||||||||
Expired | (25,122 | ) | 26.39 | |||||||||
Outstanding at December 31, 2017 | 373,058 | $ | 32.25 | 3.4 | $ | 139 | ||||||
Options vested and expected to vest | 373,058 | $ | 32.25 | 3.4 | $ | 139 | ||||||
Options exercisable at December 31, 2017 | 373,058 | $ | 32.25 | 3.4 | $ | 139 | ||||||
A summary of additional information pertaining to stock options granted to employees is presented below:
2017 | 2016 | 2015 | |||||||||
Intrinsic value of options exercised | $ | 1 | $ | — | $ | — | |||||
Fair value of options vested | $ | 210 | $ | 444 | $ | 717 | |||||
Restricted Stock and Stock Unit Awards
Restricted stock and stock units granted in connection with the Company’s performance share plan generally vests upon completion of periods ranging from one to four years. The fair value of each share granted is equal to the share price of the underlying stock on the date of grant. As of December 31, 2017, there was $4 million of unrecognized compensation cost related to the Company’s outstanding restricted stock. This cost is expected to be recognized over a weighted average period of 1.2 years.
F- 27
The following table summarizes the activity of restricted stock and stock units granted to employees for the three years ended December 31:
2017 | 2016 | 2015 | |||||||||
Restricted stock and stock units granted | 285,506 | 598,219 | 277,298 | ||||||||
Weighted average price of restricted shares granted | $ | 13.37 | $ | 8.03 | $ | 20.83 | |||||
Intrinsic value of restricted stock outstanding | $ | 17,349 | $ | 10,326 | $ | 3,763 | |||||
Fair value of restricted stock vested | $ | 1,199 | $ | 5,890 | $ | 690 | |||||
A summary of the Company’s restricted stock and stock units activity is presented below for the year ended December 31, 2017:
Restricted Stock and Stock Units | ||||||
Awards | Weighted Average Grant Date Fair Value | |||||
Outstanding at January 1, 2017 | 667,899 | $ | 11.97 | |||
Granted | 285,506 | 13.37 | ||||
Forfeited | (3,135 | ) | 10.74 | |||
Vested | (101,899 | ) | 11.77 | |||
Outstanding at December 31, 2017 | 848,371 | $ | 12.47 | |||
Performance-Based Stock Unit Awards
The Company’s performance-based stock unit awards generally vest upon completion of a three-year period. The number of shares, if any, that are ultimately awarded is contingent upon the Company’s performance against an internal performance metric or a combination of an internal metric and a market condition.
The performance-based stock unit awards which are measured against a market condition or incorporate market conditions are valued using a Monte Carlo simulation model. The model generates the fair value of the market-based award or market-based portion of the award at the grant date. The related expense is then amortized over the award’s vesting period.
As of December 31, 2017, there was $10 million of unrecognized compensation cost related to the Company’s performance-based stock unit awards. This cost is expected to be recognized over a weighted average period of 1.2 years.
The following table summarizes the activity of the Company’s performance-based stock units awarded to its employees for the three years ended December 31:
2017 | 2016 | 2015 | |||||||||
Common shares of stock reserved for performance-based stock units | 896,121 | 1,304,419 | 422,920 | ||||||||
Weighted average fair value of performance-based stock units granted | $ | 14.60 | $ | 7.79 | $ | 17.51 | |||||
Intrinsic value of outstanding performance-based stock units | $ | 7,408 | $ | 8,169 | $ | 2,070 | |||||
F- 28
A summary of the Company’s performance-based stock unit award activity is presented below for the year ended December 31, 2017:
Performance-Based Stock Units | Performance-Based Restricted Stock | ||||||||||||
Awards | Weighted Average Grant Date Fair Value | Awards | Weighted Average Grant Date Fair Value | ||||||||||
Outstanding at January 1, 2017 | 718,891 | $ | 10.05 | 128,038 | $ | 41.05 | |||||||
Granted | 363,422 | 14.60 | — | — | |||||||||
Forfeited | (2,246 | ) | 9.82 | — | — | ||||||||
Canceled | — | — | (128,038 | ) | 41.05 | ||||||||
Outstanding at December 31, 2017 | 1,080,067 | $ | 11.58 | — | $ | — | |||||||
The expected volatility is based on representative price returns using the stock price of several peer companies. The risk-free rate was based on the 3-year U.S. treasury rate on the date of the award. The following chart provides a tabular overview of the weighted average assumptions used in calculating the fair value of the awards granted for the three years ended December 31:
2017 | 2016 | 2015 | ||||||
Expected volatility | 70.2 | % | 74.3 | % | 17.3 | % | ||
Risk-free rate | 1.5 | % | 1.0 | % | 1.0 | % | ||
16. Employee Benefit Plans
Defined Benefit Plans
The Company has defined benefit pension and other postretirement plans covering certain union and non-union employees, primarily in the U.S., Canada and France. In connection with the Acquisition, we assumed the obligations of various defined benefit pension and other postretirement plans that were maintained by Tembec which cover certain employees, primarily in Canada and France. The defined benefit pension plans are closed to new participants.
Defined benefit pension and other postretirement plan liabilities are calculated using actuarial estimates and management assumptions. These estimates are based on historical information, along with certain assumptions about future events. Changes in assumptions, as well as changes in actual experience, could cause the estimates to change.
F- 29
The following tables set forth the changes in the projected benefit obligation and plan assets and reconciles the funded status and the amounts recognized in the Consolidated Balance Sheets for the defined benefit pension and postretirement plans for the two years ended December 31:
Pension | Postretirement | ||||||||||||||
Change in Projected Benefit Obligation | 2017 | 2016 | 2017 | 2016 | |||||||||||
Projected benefit obligation at beginning of year | $ | 414,479 | $ | 405,033 | $ | 26,838 | $ | 26,959 | |||||||
Plans assumed in Acquisition | 710,466 | — | 18,884 | — | |||||||||||
Service cost | 5,646 | 5,225 | 1,249 | 808 | |||||||||||
Interest cost | 15,926 | 15,915 | 827 | 871 | |||||||||||
Actuarial loss (gain) | 6,852 | 7,416 | (1,639 | ) | (940 | ) | |||||||||
Participant contributions | 96 | — | 396 | 335 | |||||||||||
Benefits paid | (23,192 | ) | (19,110 | ) | (1,386 | ) | (1,195 | ) | |||||||
Effects of foreign currency exchange rates | 8,904 | — | 280 | — | |||||||||||
Projected benefit obligation at end of year | $ | 1,139,177 | $ | 414,479 | $ | 45,449 | $ | 26,838 | |||||||
Change in Plan Assets | |||||||||||||||
Fair value of plan assets at beginning of year | $ | 275,955 | $ | 266,155 | $ | — | $ | — | |||||||
Plans assumed in Acquisition | 668,463 | — | — | — | |||||||||||
Actual return on plan assets | 57,618 | 16,634 | — | — | |||||||||||
Employer contributions | 12,732 | 12,276 | 990 | 860 | |||||||||||
Participant contributions | 96 | — | 396 | 335 | |||||||||||
Benefits paid | (23,192 | ) | (19,110 | ) | (1,386 | ) | (1,195 | ) | |||||||
Effects of foreign currency exchange rates | 8,528 | — | — | — | |||||||||||
Fair value of plan assets at end of year | $ | 1,000,200 | $ | 275,955 | $ | — | $ | — | |||||||
Funded Status at end of year: | $ | (138,977 | ) | $ | (138,524 | ) | $ | (45,449 | ) | $ | (26,838 | ) | |||
Pension | Postretirement | ||||||||||||||
Amounts recognized in the Consolidated Balance Sheets consist of: | 2017 | 2016 | 2017 | 2016 | |||||||||||
Non-current assets | $ | 36,605 | $ | — | $ | — | $ | — | |||||||
Current liabilities | (5,059 | ) | (2,293 | ) | (3,162 | ) | (1,340 | ) | |||||||
Non-current liabilities | (170,523 | ) | (136,231 | ) | (42,287 | ) | (25,498 | ) | |||||||
Net amount recognized | $ | (138,977 | ) | $ | (138,524 | ) | $ | (45,449 | ) | $ | (26,838 | ) | |||
Net gains (losses) recognized in other comprehensive income for the three years ended December 31 are as follows:
Pension | Postretirement | ||||||||||||||||||||||
2017 | 2016 | 2015 | 2017 | 2016 | 2015 | ||||||||||||||||||
Net gains (losses) | $ | 24,411 | $ | (14,101 | ) | $ | (24,950 | ) | $ | 1,639 | $ | 1,184 | $ | 759 | |||||||||
F- 30
Net gains or losses and prior service costs or credits reclassified from other comprehensive income and recognized as a component of pension and postretirement expense for the three years ended December 31 are as follows:
Pension | Postretirement | ||||||||||||||||||||||
2017 | 2016 | 2015 | 2017 | 2016 | 2015 | ||||||||||||||||||
Amortization of losses | $ | 11,651 | $ | 11,343 | $ | 13,434 | $ | 333 | $ | 238 | $ | 676 | |||||||||||
Amortization of prior service (credit) cost | 761 | 761 | 750 | (151 | ) | (139 | ) | (158 | ) | ||||||||||||||
Net losses, prior service costs or credits and plan amendments that have not yet been included in pension and postretirement expense for the two years ended December 31, which have been recognized as a component of AOCL are as follows:
Pension | Postretirement | ||||||||||||||
2017 | 2016 | 2017 | 2016 | ||||||||||||
Prior service cost | $ | (2,254 | ) | $ | (3,015 | ) | $ | — | $ | (2 | ) | ||||
Net losses | (128,215 | ) | (164,277 | ) | (5,149 | ) | (7,121 | ) | |||||||
Plan amendment | — | — | 1,491 | 1,644 | |||||||||||
Deferred income tax benefit | 50,907 | 60,684 | 1,582 | 2,007 | |||||||||||
AOCL | $ | (79,562 | ) | $ | (106,608 | ) | $ | (2,076 | ) | $ | (3,472 | ) | |||
For defined benefit pension plans with accumulated benefit obligations in excess of plan assets, the following table sets forth the projected and accumulated benefit obligations and the fair value of plan assets for the years ended December 31:
2017 | 2016 | ||||||
Projected benefit obligation | $ | 813,411 | $ | 414,480 | |||
Accumulated benefit obligation | 785,435 | 401,896 | |||||
Fair value of plan assets | 638,414 | 275,955 | |||||
The following tables set forth the components of net pension and postretirement benefit cost that have been recognized during the three years ended December 31:
Pension | Postretirement | ||||||||||||||||||||||
Components of Net Periodic Benefit Cost | 2017 | 2016 | 2015 | 2017 | 2016 | 2015 | |||||||||||||||||
Service cost | $ | 5,646 | $ | 5,225 | $ | 5,977 | $ | 1,249 | $ | 808 | $ | 1,006 | |||||||||||
Interest cost | 15,926 | 15,915 | 15,228 | 827 | 871 | 919 | |||||||||||||||||
Expected return on plan assets | (25,978 | ) | (23,320 | ) | (23,234 | ) | — | — | — | ||||||||||||||
Amortization of prior service (credit) cost | 761 | 761 | 750 | (151 | ) | (139 | ) | (158 | ) | ||||||||||||||
Amortization of losses | 11,651 | 11,343 | 13,434 | 333 | 238 | 676 | |||||||||||||||||
Net periodic benefit cost (a) | $ | 8,006 | $ | 9,924 | $ | 12,155 | $ | 2,258 | $ | 1,778 | $ | 2,443 | |||||||||||
(a) | A portion of the net periodic benefit cost is recorded in cost of goods sold in the Consolidated Statements of Income. |
The estimated pre-tax amounts that will be amortized from AOCL into net periodic benefit cost in 2018 are as follows:
Pension | Postretirement | ||||||
Amortization of loss | $ | 11,648 | $ | 229 | |||
Amortization of prior service cost | 572 | (153 | ) | ||||
Total amortization of AOCL | $ | 12,220 | $ | 76 | |||
F- 31
In 2017, the Company changed its method used to determine the service and interest cost components of net periodic benefit cost. Previously, the cost was determined using a single weighted-average discount rate derived from the yield curve. Under the new method, known as the spot rate approach, individual spot rates along the yield curve that correspond with the timing of each benefit payment will be used. The Company believes this change will provide a more precise measurement of service and interest costs by improving the correlation between projected cash outflows and corresponding spot rates on the yield curve. This change does not affect the measurement of plan obligations but generally results in lower pension expense in periods where the yield curve is upward sloping. The Company accounted for this change prospectively as a change in accounting estimate.
The following table sets forth the weighted average principal assumptions inherent in the determination of benefit obligations and net periodic benefit cost of the pension and postretirement benefit plans as of December 31:
Pension | Postretirement | ||||||||||||||||
2017 | 2016 | 2015 | 2017 | 2016 | 2015 | ||||||||||||
Assumptions used to determine benefit obligations at December 31: | |||||||||||||||||
Discount rate | 3.55 | % | 3.88 | % | 4.03 | % | 3.14 | % | 3.85 | % | 3.98 | % | |||||
Rate of compensation increase | 2.60 | % | 4.10 | % | 4.45 | % | 3.10 | % | 4.50 | % | 4.50 | % | |||||
Assumptions used to determine net periodic benefit cost for years ended December 31: | |||||||||||||||||
Discount rate | 3.77 | % | 4.03 | % | 3.71 | % | 3.64 | % | 3.98 | % | 3.65 | % | |||||
Expected long-term return on plan assets | 7.38 | % | 8.50 | % | 8.50 | % | N/A | N/A | N/A | ||||||||
Rate of compensation increase | 2.59 | % | 4.10 | % | 4.45 | % | 3.10 | % | 4.50 | % | 4.50 | % | |||||
The estimated return on plan assets is based on historical and expected long-term rates of return on broad equity and bond indices and consideration of the actual annualized rate of return. The Company, with the assistance of external consultants, utilizes this information in developing assumptions for returns, risks and correlation of asset classes, which are then used to establish the asset allocation ranges.
The following table sets forth the assumed health care cost trend rates as of December 31:
Postretirement | ||||||||
2017 | 2016 | |||||||
U.S. | Canada | U.S. | ||||||
Health care cost trend rate assumed for next year | 8.00 | % | 5.50 | % | 8.00 | % | ||
Rate to which the cost trend is assumed to decline (ultimate trend rate) | 5.00 | % | 4.50 | % | 5.00 | % | ||
Year that ultimate trend rate is reached | 2024 | 2019 | 2026 | |||||
Assumed health care cost trend rates have a significant effect on the amounts reported for the postretirement benefit plans. The following table shows the effect of a one percentage point change in assumed health care cost trends:
1 Percent | |||||||
Effect on: | Increase | Decrease | |||||
Total of service and interest cost components | $ | 237 | $ | (203 | ) | ||
Accumulated postretirement benefit obligation | 2,022 | (1,772 | ) | ||||
F- 32
Investment of Plan Assets
The Company’s Pension and Savings Plan Committee and the Audit Committee of the Board of Directors oversee the defined benefit pension plans’ investment program. The investment approach of each defined benefit pension plan is designed to maximize returns and provide sufficient liquidity to meet each plans obligations while maintaining acceptable risk levels. For certain defined benefit plans, investment target allocation percentages for equity securities can range from 45 percent to 65 percent and fixed income securities can range from 30 percent to 55 percent. For certain defined benefit plans, investments may be 100 percent allocated to fixed income securities. All plans were within their respective targeted ranges. The Company’s weighted average defined benefit pension plan asset allocation at December 31, 2017 and 2016, by asset category are as follows:
Percentage of Plan Assets | |||||
Asset Category | 2017 | 2016 | |||
U.S. equity securities | 23 | % | 41 | % | |
International equity securities | 27 | % | 24 | % | |
U.S. fixed income securities | 13 | % | 27 | % | |
International fixed income securities | 34 | % | 5 | % | |
Other | 3 | % | 3 | % | |
Total | 100 | % | 100 | % | |
Investments within the equity categories may include large capitalization, small capitalization and emerging market securities, while the international fixed income portfolio may include emerging markets debt. Pension assets did not include a direct investment in Rayonier Advanced Materials common stock at December 31, 2017 or 2016.
Fair Value Measurements
The following table sets forth by level, within the fair value hierarchy (see Note 1 — Nature of Operations and Basis of Presentation for definition), the assets of the plans as of December 31, 2017 and 2016.
Fair Value at December 31, 2017 | |||||||||||||||
Asset Category | Level 1 | Level 2 | Level 3 | Total | |||||||||||
Mutual funds | $ | 161,424 | $ | — | $ | — | $ | 161,424 | |||||||
Investments at net asset value: | |||||||||||||||
Common collective trust funds | 838,776 | ||||||||||||||
Total assets at fair value | $ | 1,000,200 | |||||||||||||
Fair Value at December 31, 2016 | |||||||||||||||
Asset Category | Level 1 | Level 2 | Level 3 | Total | |||||||||||
Mutual funds | $ | 76,757 | $ | — | $ | — | $ | 76,757 | |||||||
Investments at net asset value: | |||||||||||||||
Common collective trust funds | 199,198 | ||||||||||||||
Total assets at fair value | $ | 275,955 | |||||||||||||
F- 33
The valuation methodology used for measuring the fair value of these asset categories was as follows:
Mutual funds — Net asset value in an observable market.
Common collective trust funds — Common collective trusts are measured at NAV per share, as a practical expedient for fair value, as provided by the Plan trustee. The NAV is calculated by determining the fair value of the fund’s underlying assets, deducting its liabilities, and dividing by the units outstanding as of the valuation date. These funds are not publicly traded; however, in the majority of cases the unit price calculation is based on observable market inputs of the funds’ underlying assets.
There have been no changes in the methodology used during the years ended December 31, 2017 and 2016.
Cash Flows
Expected benefit payments for the next ten years are as follows:
Pension Benefits | Postretirement Benefits | ||||||
2018 | $ | 87,144 | $ | 3,163 | |||
2019 | 89,291 | 3,035 | |||||
2020 | 90,367 | 3,127 | |||||
2021 | 91,580 | 3,014 | |||||
2022 | 92,327 | 2,836 | |||||
2023 — 2027 | 473,753 | 11,296 | |||||
The Company has no mandatory pension contribution requirements in 2017, but may make discretionary contributions.
Defined Contribution Plans
The Company provides defined contribution plans to all of its hourly and salaried employees. The Company’s contributions charged to expense for these plans were $6 million, $5 million and $5 million for the years ended December 31, 2017, 2016 and 2015, respectively. Rayonier Advanced Materials Hourly and Salaried Defined Contribution Plans include Rayonier Advanced Materials common stock with a fair market value of $17 million at December 31, 2017.
F- 34
17. Other Operating Expense, Net
Other operating expense, net was comprised of the following for the three years ended December 31:
2017 | 2016 | 2015 | |||||||||
Environmental liability adjustments and other costs for disposed operations (a) | $ | (1,451 | ) | $ | (5,298 | ) | $ | (6,930 | ) | ||
One-time separation and legal costs | — | — | 802 | ||||||||
Non-cash impairment charge (b) | — | — | (28,462 | ) | |||||||
Loss on sale or disposal of property, plant and equipment | (2,032 | ) | (2,422 | ) | (998 | ) | |||||
Gain on foreign exchange | 2,335 | — | — | ||||||||
Duties | (939 | ) | — | — | |||||||
Insurance settlement | (13 | ) | 897 | 1,000 | |||||||
Miscellaneous income (expense) | (113 | ) | 1,139 | (681 | ) | ||||||
Total other operating expense, net | $ | (2,213 | ) | $ | (5,684 | ) | $ | (35,269 | ) | ||
(a) | Environmental liability adjustments and other costs for disposed operations reflects the adjustments to the Company’s estimates for environmental liability for the assessment, remediation and long-term monitoring and maintenance of the disposed operations sites over the next 20 years and other related costs. See Note 9 — Liabilities for Disposed Operations for additional information. |
(b) | In light of the persistent imbalance of supply and demand in the cellulose specialties markets, on July 30, 2015, the Company announced a strategic asset repositioning at its Jesup, Georgia plant, which is included in the High-Purity Cellulose segment to better align its production assets to current market conditions, improve efficiency and restore commodity production throughput to approach historical levels. This repositioning resulted in the abandonment of certain long-lived assets, primarily at the Jesup plant. As a result, the abandoned assets were written down to salvage value and a $29 million pre-tax, non-cash impairment charge was recorded during the second quarter of 2015. The abandonment led management to conduct an impairment analysis on all long-lived assets being held and used on a combined plant level. Based on the impairment analysis performed, management concluded the assets were recoverable. |
F- 35
18. Income Taxes
Income Tax Expense
Income tax expense for the three years ended December 31 are as follows:
2017 | 2016 | 2015 | |||||||||
Current | |||||||||||
Federal | $ | 10,871 | $ | 5,516 | $ | (37,561 | ) | ||||
Foreign | (121 | ) | — | — | |||||||
State and other | (201 | ) | 368 | 197 | |||||||
10,549 | 5,884 | (37,364 | ) | ||||||||
Deferred | |||||||||||
Federal | (34,635 | ) | (44,488 | ) | 11,073 | ||||||
Foreign | 4,065 | — | — | ||||||||
State and other | 290 | (711 | ) | (1,316 | ) | ||||||
(30,280 | ) | (45,199 | ) | 9,757 | |||||||
Changes in valuation allowance | — | — | — | ||||||||
Income tax expense | $ | (19,731 | ) | $ | (39,315 | ) | $ | (27,607 | ) | ||
A reconciliation of the U.S. federal statutory income tax rate to the actual income tax rate for the three years ended December 31 is as follows:
2017 | 2016 | 2015 | ||||||
U.S. federal statutory income tax rate | 35.0 | % | 35.0 | % | 35.0 | % | ||
Nontaxable bargain purchase gain (a) | (32.1 | ) | — | — | ||||
U.S. federal rate change (b) | 3.2 | — | — | |||||
Domestic manufacturing production deduction | (0.3 | ) | — | (4.2 | ) | |||
State credits | — | (0.8 | ) | (0.9 | ) | |||
Nondeductible executive compensation | 0.4 | 0.6 | 1.2 | |||||
Adjustment to previously filed tax returns | (1.1 | ) | — | — | ||||
Nondeductible transaction costs (c) | 1.0 | — | — | |||||
Change in state rate | (0.1 | ) | — | 1.4 | ||||
Other | (0.3 | ) | 0.1 | 0.8 | ||||
Income tax rate as reported | 5.7 | % | 34.9 | % | 33.3 | % | ||
(a) | The bargain purchase gain of $317 million from the acquisition of Tembec is not taxable resulting in a decrease in the income tax rate (see Note 3 —Recent Acquisition). |
(b) | The income tax rate for the year ended December 31, 2017 was impacted by the Tax Cuts and Jobs Act through a decrease in the federal tax rate from 35 percent to 21 percent. Income tax expense for the re-measurement of the deferred tax assets of $11 million was recorded during the year ended December 31, 2017. This expense is the result of previously recorded deferred tax deductions which will now result in a lower after-tax benefit due to the reduced rate. |
(c) | The Company incurred significant costs associated with the acquisition of Tembec. Certain costs incurred are considered facilitative to the transaction and not currently deductible, resulting in an unfavorable adjustment to the income tax rate. |
F- 36
Deferred Taxes
Deferred income taxes result from recording revenues and expenses in different periods for financial reporting versus tax reporting. The nature of the temporary differences and the resulting net deferred tax liability for the two years ended December 31 were as follows:
2017 | 2016 | ||||||
Gross deferred tax assets: | |||||||
Pension, postretirement and other employee benefits | $ | 49,669 | $ | 71,842 | |||
Tax credit carryforwards (a) | 77,897 | 17,967 | |||||
Property, plant and equipment basis differences | 97,242 | — | |||||
Canadian pool of scientific research and experimentation deductions ("SR&ED") (a) | 79,349 | — | |||||
Environmental liabilities | 36,791 | 54,351 | |||||
Capitalized costs | 6,347 | 10,894 | |||||
U.S. federal and Canadian net operating losses (a) | 212,904 | 8,951 | |||||
State net operating losses (a) | 2,946 | 3,102 | |||||
Interest carryforwards (a) | 11,635 | — | |||||
Other | 1,868 | — | |||||
Total gross deferred tax assets | 576,648 | 167,107 | |||||
Less: valuation allowance | (92,081 | ) | (20,821 | ) | |||
Total deferred tax assets after valuation allowance | 484,567 | 146,286 | |||||
Gross deferred tax liabilities: | |||||||
Property, plant and equipment basis differences | (95,754 | ) | (92,287 | ) | |||
Intangible assets | (15,948 | ) | — | ||||
Other | (2,626 | ) | (2,753 | ) | |||
Total gross deferred tax liabilities | (114,328 | ) | (95,040 | ) | |||
Net deferred tax asset | $ | 370,239 | $ | 51,246 | |||
Included in: | |||||||
Deferred tax assets | $ | 402,846 | $ | 51,246 | |||
Deferred tax liabilities | (32,607 | ) | — | ||||
$ | 370,239 | $ | 51,246 | ||||
(a) | The following relates to tax credit carryforwards and net operating losses as of December 31, 2017: |
Gross Amount | Tax Effected | Valuation Allowance | Expiration | ||||||||||
State tax credit carryforwards | $ | 17,646 | $ | 17,646 | $ | 17,249 | 2018 - 2025 | ||||||
Foreign R&D credit carryforwards | 60,251 | 60,251 | 60,251 | 2017 - 2036 | |||||||||
State net operating losses | 63,503 | 2,946 | 2,946 | 2017 - 2033 | |||||||||
Canada non-capital losses | 796,394 | 212,904 | — | 2025 - 2036 | |||||||||
Interest limitation carryforward | 52,885 | 11,635 | 11,635 | None | |||||||||
Canadian pool of SR&ED | 308,591 | 79,349 | — | None | |||||||||
F- 37
Unrecognized Tax Benefits
The Company recognizes the impact of a tax position if it is “more likely than not” to prevail. As of December 31, 2017, there were several positions resulting in unrecognized tax benefits that, if recognized, would affect income tax expense.During the years ended December 31, 2017, 2016 and 2015, the Company did not record interest expense or penalties in income tax expense. A reconciliation of the beginning and ending unrecognized tax benefits for the three years ended December 31 is as follows:
2017 | 2016 | 2015 | |||||||||
Balance at January 1, | $ | — | $ | — | $ | — | |||||
Decreases related to prior year tax positions | — | — | — | ||||||||
Increases related to prior year tax positions | 11,171 | — | — | ||||||||
Decreases related to current year tax positions | — | — | — | ||||||||
Increases related to current year tax positions | 12,633 | — | — | ||||||||
Balance at December 31, | $ | 23,804 | $ | — | $ | — | |||||
Each of our unrecognized tax benefits would decrease our effective tax rate if recognized.
It is reasonably possible that within the next twelve months a number of tax positions could increase or decrease, impacting our unrecognized tax position reserve by between a decrease of $5 million and increase of $5 million.
Tax Statutes
The following table provides detail of tax years that remain open to examination by significant taxing jurisdictions:
Taxing Jurisdiction | Open Tax Years |
U.S. | 2014 - 2017 |
France (a) | 2014 - 2017 |
Canada | 2013 - 2017 |
State of Florida | 2014 - 2017 |
(a) | France is currently examining certain returns from 2014 to 2017. There are no identified high risk areas in this examination, so no reserve has been recorded. |
Tax Cuts and Jobs Act
On December 22, 2017, the United States enacted tax reform legislation commonly known as the Tax Cuts and Jobs Act (the “Act”), resulting in significant modifications to existing law. The most significant impact to the Company is the reduction of the U.S. federal corporate tax rate, effective January 1, 2018, from 35 percent to 21 percent, partially offset by the loss of the domestic manufacturing production deduction. The Company is likely to also be impacted by 100 percent tax expensing for certain assets in the next five years, new U.S. interest expense limitations, changes to executive compensation deductibility, tax on Global Intangible Low-Taxed Income and a deduction for Foreign Derived Intangible Income.
The Company has completed the accounting for the effects of the Act during the fourth quarter of 2017, except for the one-time deemed repatriation transition tax on unrepatriated foreign earnings (“Repatriation Tax”). Based on information currently available, we estimate the Repatriation Tax will not be material. However, the Company continues to gather and analyze information in order to complete the accounting for the effects, if any. Additionally, we made a reasonable assessment concerning whether our executive compensation plans in effect November 2, 2017 qualified to continue to be treated under pre-Act law. That assessment may change as guidance is issued.
F- 38
19. Segment and Geographical Information
As a result of the Acquisition of Tembec, the Company is currently evaluating its reportable segments. The Company has currently divided its operations into four reportable segments: High Purity Cellulose, Forest Products, Pulp & Paper and Corporate. See Note 1 — Nature of Operations and Basis of Presentation for a description of the operating business. The Corporate operations consist primarily of senior management, accounting, information systems, human resources, treasury, tax and legal administrative functions that provide support services to the operating business units. The Company does not currently allocate the cost of maintaining these support functions to its operating units.
The Company evaluates the performance of its segments based on operating income. Intersegment sales consist primarily of wood chips sales from Forest Products to High Purity Cellulose and Pulp & Paper segments and are transferred at rates that approximate market for the respective operating area.
Net sales and operating income were comprised of the following for the years ended December 31:
2017 | 2016 | 2015 | |||||||||
Net sales: | |||||||||||
High Purity Cellulose | $ | 866,861 | $ | 868,731 | $ | 941,384 | |||||
Forest Products | 33,945 | — | — | ||||||||
Pulp & Paper | 65,385 | — | — | ||||||||
Corporate | 753 | — | — | ||||||||
Eliminations | (5,611 | ) | — | — | |||||||
Total net sales | $ | 961,333 | $ | 868,731 | $ | 941,384 | |||||
Operating income: | |||||||||||
High Purity Cellulose | $ | 116,565 | $ | 170,852 | $ | 163,143 | |||||
Forest Products | (4 | ) | — | — | |||||||
Pulp & Paper | 3,058 | — | — | ||||||||
Corporate | (62,603 | ) | (33,205 | ) | (43,620 | ) | |||||
Total operating income | $ | 57,016 | $ | 137,647 | $ | 119,523 | |||||
Identifiable assets by segment were as follows for the years ended December 31:
2017 | 2016 | ||||||
Identifiable assets: | |||||||
High Purity Cellulose | $ | 1,671,107 | $ | 1,253,944 | |||
Forest Products | 154,258 | — | |||||
Pulp & Paper | 328,827 | — | |||||
Corporate | 488,419 | 167,995 | |||||
Total identifiable assets | $ | 2,642,611 | $ | 1,421,939 | |||
Long-life assets by country were as follows for the years ended December 31:
2017 | 2016 | ||||||
Long-life assets: | |||||||
United States | $ | 840,315 | $ | 902,431 | |||
Canada | 926,774 | — | |||||
France | 228,985 | — | |||||
Total long-life assets | $ | 1,996,074 | $ | 902,431 | |||
F- 39
Depreciation and amortization and capital expenditures by segment were as follows for the years ended December 31:
2017 | 2016 | 2015 | |||||||||
Depreciation and amortization: | |||||||||||
High Purity Cellulose | $ | 93,177 | $ | 87,837 | $ | 88,397 | |||||
Forest Products | 728 | — | — | ||||||||
Pulp & Paper | 2,744 | — | — | ||||||||
Corporate | 314 | 437 | 792 | ||||||||
Total depreciation and amortization | $ | 96,963 | $ | 88,274 | $ | 89,189 | |||||
Capital expenditures (a): | |||||||||||
High Purity Cellulose | $ | 65,691 | $ | 85,835 | $ | 77,507 | |||||
Forest Products | 4,409 | — | — | ||||||||
Pulp & Paper | 1,451 | — | — | ||||||||
Corporate | 19 | — | — | ||||||||
Total capital expenditures | $ | 71,570 | $ | 85,835 | $ | 77,507 | |||||
(a) Amounts include capital assets purchased on account.
Geographical distribution of the Company’s sales was comprised of the following for the three years ended December 31:
Sales by Destination | |||||||||||||||||
2017 | % | 2016 | % | 2015 | % | ||||||||||||
United States | $ | 336,943 | 35 | $ | 348,570 | 40 | $ | 398,739 | 42 | ||||||||
China | 253,275 | 26 | 250,044 | 29 | 256,979 | 27 | |||||||||||
Japan | 123,850 | 13 | 136,817 | 16 | 132,480 | 14 | |||||||||||
Europe | 114,049 | 12 | 88,191 | 10 | 91,847 | 10 | |||||||||||
Latin America | 11,576 | 1 | 9,876 | 1 | 8,176 | 1 | |||||||||||
Other Asia | 78,538 | 8 | 27,280 | 3 | 25,373 | 3 | |||||||||||
Canada | 41,178 | 4 | — | — | — | — | |||||||||||
All other | 1,924 | 1 | 7,953 | 1 | 27,790 | 3 | |||||||||||
Total sales | $ | 961,333 | 100 | $ | 868,731 | 100 | $ | 941,384 | 100 | ||||||||
The Company had sales to three significant customers in its High Purity Cellulose segment which represented over 10 percent of total sales for the three years ended December 31:
Percentage of Sales | |||||
2017 | 2016 | 2015 | |||
Eastman Chemical Company | 20% | 25% | 28% | ||
Nantong Cellulose Fibers, Co., Ltd. | 15% | 17% | 18% | ||
Daicel Corporation | 10% | 14% | 13% | ||
F- 40
20. Commitments and Contingencies
Litigation and Contingencies
The Company is engaged in various legal and regulatory actions and proceedings, and has been named as a defendant in various lawsuits and claims arising in the ordinary course of its business. While the Company has procured reasonable and customary insurance covering risks normally occurring in connection with its businesses, the Company has in certain cases retained some risk through the operation of self-insurance, primarily in the areas of workers’ compensation, property insurance and general liability. These other lawsuits and claims, either individually or in aggregate, are not expected to have a material adverse effect on the Company’s financial position, results of operations or cash flows.
The Company currently employs approximately 4,200 people in the United States, Canada and France. As of December 31, 2017, approximately 74 percent of the work force is unionized. As a result, the Company is required to negotiate wages, benefits and other terms with unionized employees collectively.
As of December 31, 2017, collective bargaining agreements covering approximately 900 unionized employees had expired. In all cases, the parties have continued to work under the terms of the expired contracts while negotiations continue. While there can be no assurances, the Company expects to reach agreements with its unions. However, a work stoppage could have a material adverse effect on its business, results of operations and financial condition.
Commitments
The Company leases certain buildings, machinery and equipment under various operating leases. Total rental expense for operating leases amounted to $6 million, $5 million, and $4 million in 2017, 2016 and 2015, respectively.
At December 31, 2017, the future minimum payments under non-cancellable operating leases and purchase obligations were as follows:
Operating Leases (a) | Purchase Obligations (b) | ||||||
2018 | $ | 2,805 | $ | 102,784 | |||
2019 | 1,674 | 59,302 | |||||
2020 | 1,134 | 42,183 | |||||
2021 | 648 | 33,870 | |||||
2022 | 272 | 40,228 | |||||
Thereafter | 116 | 166,868 | |||||
Total | $ | 6,649 | $ | 445,235 | |||
(a) | Operating leases include leases on buildings, machinery and equipment under various operating leases. |
(b) | Purchase obligations primarily consist of payments expected to be made on natural gas, steam energy and wood chips purchase contracts. Obligations reported in the table are estimates and may vary based on changes in actual price and volumes terms. |
Guarantees and Other
The Company provides financial guarantees as required by creditors, insurance programs and various governmental agencies. As of December 31, 2017, the Company had $66 million of various standby letters of credit, primarily for financial assurance relating to environmental remediation, credit support for natural gas and electricity purchases, and guarantees related to foreign retirement plan obligations. These standby letters of credit represent a contingent liability. The Company would only be liable upon its default on the related payment obligations. The letters of credit have various expiration dates and will be renewed as required.
The Company had surety bonds of $86 million as of December 31, 2017, primarily to comply with financial assurance requirements relating to environmental remediation and post closure care, to provide collateral for the Company’s workers’ compensation program, and to guarantee taxes and duties for products shipped internationally. These surety bonds expire at various dates and are expected to be renewed annually as required.
F- 41
LignoTech Florida, a venture in which the Company owns 45 percent and its venture partner Borregaard ASA owns 55 percent, entered into a construction contract to build its lignin manufacturing facility, which is expected to begin operations in mid-2018. The Company is a guarantor under the contract and is jointly and severally liable for payment of costs incurred to construct the facility. In the event of default, the Company expects it would only be liable for its proportional share as a result of an agreement with its venture partner. The remaining guarantee related to LignoTech Florida at December 31, 2017 was $41 million.
The Company has not recorded any liabilities for these financial guarantees in its consolidated balance sheets, either because the Company has recorded the underlying liability associated with the guarantee or the guarantee is dependent on the Company’s own performance and, therefore, is not subject to the measurement requirements or because the Company has calculated the estimated fair value of the guarantee and determined it to be immaterial based upon the current facts and circumstances that would trigger a payment obligation.
It is not possible to determine the maximum potential amount of the liability under these potential obligations due to the unique set of facts and circumstances likely to be involved with each provision.
21. Supplemental Disclosures of Cash Flows Information
Supplemental disclosures of cash flows information was comprised of the following for the three years ended December 31:
2017 | 2016 | 2015 | |||||||||
Cash paid (received) during the period: | |||||||||||
Interest | $ | 35,879 | $ | 35,160 | $ | 38,189 | |||||
Income taxes | 5,992 | (4,727 | ) | 31,667 | |||||||
Non-cash investing and financing activities: | |||||||||||
Capital assets purchased on account | $ | 12,083 | $ | 10,155 | $ | 16,720 | |||||
Capital lease obligation | 3,409 | 3,697 | — | ||||||||
Value of stock issued for Acquisition | 141,192 | — | — | ||||||||
F- 42
22. Quarterly Results for 2017 and 2016 (Unaudited)
Quarter Ended | Total Year | ||||||||||||||||||
March 25 | June 24 | September 23 | December 31 | ||||||||||||||||
2017 | |||||||||||||||||||
Net Sales | $ | 201,415 | $ | 201,226 | $ | 209,717 | $ | 348,975 | $ | 961,333 | |||||||||
Gross Margin | 36,417 | 33,345 | 31,168 | 38,315 | 139,245 | ||||||||||||||
Operating Income | 25,965 | 13,354 | 17,657 | 40 | 57,016 | ||||||||||||||
Net Income | 9,642 | 4,573 | 15,672 | 295,077 | 324,964 | ||||||||||||||
Basic earnings per share | 0.15 | 0.03 | 0.29 | 6.31 | 7.17 | ||||||||||||||
Diluted earnings per share (a) | 0.15 | 0.03 | 0.28 | 5.01 | 5.81 | ||||||||||||||
Quarter Ended | |||||||||||||||||||
March 26 | June 25 | September 24 | December 31 | Total Year | |||||||||||||||
2016 | |||||||||||||||||||
Net Sales | $ | 217,729 | $ | 213,589 | $ | 206,540 | $ | 230,873 | $ | 868,731 | |||||||||
Gross Margin | 40,238 | 48,803 | 50,543 | 41,689 | 181,273 | ||||||||||||||
Operating Income | 31,920 | 38,569 | 41,437 | 25,721 | 137,647 | ||||||||||||||
Net Income (Loss) | 20,893 | 19,340 | 21,567 | 11,486 | 73,286 | ||||||||||||||
Basic earnings per share | 0.50 | 0.46 | 0.46 | 0.19 | 1.61 | ||||||||||||||
Diluted earnings per share (b) | 0.49 | 0.46 | 0.44 | 0.18 | 1.55 | ||||||||||||||
(a) | Basic and diluted earnings per share for the fourth quarter of 2017 and year ended December 31, 2017 included the impact of the Common shares issued in November 2017 as part of the Acquisition. Basic and diluted earnings per share also included the impact of dividends on the Company’s Preferred Stock for the quarter ended September 23, 2017 and the quarter and year ended December 31, 2017. As a result, quarterly EPS does not crossfoot to full-year EPS. See Note 12 — Stockholders' Equity (Deficit) for additional information. |
(b) | Basic and diluted earnings per share included the impact of dividends on the Company’s Preferred Stock for the quarter ended September 26, 2016 and the quarter and year ended December 31, 2016. As a result of the impact of the Preferred Stock in the third and fourth quarters of 2016, quarterly diluted EPS does not crossfoot to full-year diluted EPS. See Note 12 — Stockholders' Equity (Deficit) for additional information. |
F- 43
Rayonier Advanced Materials Inc.
Schedule II—Valuation and Qualifying Accounts
Years Ended December 31, 2017, 2016, and 2015
(In thousands)
Additions | |||||||||||||||||||||||
Description | Balance at Beginning of Year | Charged to Cost and Expenses | Charged to Other Accounts | Acquisition | Deductions | Balance at End of Year | |||||||||||||||||
Allowance for doubtful accounts: | |||||||||||||||||||||||
Year ended December 31, 2017 | $ | 151 | $ | 437 | $ | 5 | $ | — | $ | — | $ | 593 | |||||||||||
Year ended December 31, 2016 | 151 | — | — | — | — | 151 | |||||||||||||||||
Year ended December 31, 2015 | 151 | — | — | — | — | 151 | |||||||||||||||||
Allowance for sales returns (a): | |||||||||||||||||||||||
Year ended December 31, 2017 | $ | 523 | $ | 598 | $ | — | $ | — | $ | — | $ | 1,121 | |||||||||||
Year ended December 31, 2016 | — | 523 | — | — | — | 523 | |||||||||||||||||
Deferred tax asset valuation allowance: | |||||||||||||||||||||||
Year ended December 31, 2017 | $ | 20,821 | $ | — | $ | 873 | $ | 71,722 | $ | (1,335 | ) | $ | 92,081 | ||||||||||
Year ended December 31, 2016 | 19,702 | 1,119 | — | — | — | 20,821 | |||||||||||||||||
Year ended December 31, 2015 | 20,517 | — | — | — | (815 | ) | 19,702 | ||||||||||||||||
Self-insurance liabilities: | |||||||||||||||||||||||
Year ended December 31, 2017 | $ | 428 | $ | 1,660 | $ | — | $ | — | $ | (799 | ) | $ | 1,289 | ||||||||||
Year ended December 31, 2016 | 589 | 291 | — | — | (452 | ) | 428 | ||||||||||||||||
Year ended December 31, 2015 (b) | 1,947 | (734 | ) | — | — | (624 | ) | 589 | |||||||||||||||
(a) | An allowance for sales returns was not required for the year ended December 31, 2015. |
(b) | The decrease in the self-insurance liabilities relates to an adjustment based on an annual actuarial review. |
F- 44
Signatures
Pursuant to the requirements of Section 13 or 15(d) of the Securities Exchange Act of 1934, the registrant has duly caused this report to be signed on its behalf by the undersigned thereunto duly authorized.
Rayonier Advanced Materials Inc. | ||
(Registrant) | ||
By: | /s/ FRANK A. RUPERTO | |
Frank A. Ruperto Chief Financial Officer and Senior Vice President, Finance and Strategy (Duly Authorized Officer and Principal Financial Officer) | ||
Date: March 1, 2018
Pursuant to the requirements of the Securities Exchange Act of 1934, this report has been signed below by the following persons on behalf of the registrant and in the capacities and on the dates indicated.
F- 45
Signature | Title | Date | |||
/s/ PAUL G. BOYNTON | Chairman of the Board, President and Chief Executive Officer | March 1, 2018 | |||
Paul G. Boynton (Principal Executive Officer) | |||||
/s/ FRANK A. RUPERTO | Chief Financial Officer and Senior Vice President, Finance and Strategy | March 1, 2018 | |||
Frank A. Ruperto (Principal Financial Officer) | |||||
/s/ JOHN P. CARR | Chief Accounting Officer and Vice President, Controller | March 1, 2018 | |||
John P. Carr (Principal Accounting Officer) | |||||
* | Lead Director | ||||
C. David Brown, II | |||||
* | Director | ||||
Charles E. Adair | |||||
* | Director | ||||
DeLyle W. Bloomquist | |||||
* | Director | ||||
Mark E. Gaumond | |||||
* | Director | ||||
James F. Kirsch | |||||
* | Director | ||||
Lisa M. Palumbo | |||||
* | Director | ||||
Thomas I. Morgan | |||||
* | Director | ||||
Ronald Townsend | |||||
*By: | /s/ FRANK A. RUPERTO | ||||
Frank A. Ruperto (Attorney-In-Fact) | March 1, 2018 | ||||
F- 46
Exhibit Index
The following is a list of Exhibits filed as part of the Form 10-K. The documents incorporated by reference are located in the SEC’s Public Reference Room in Washington D.C. in SEC File no. 001-36285.
As permitted by the rules of the SEC, the Company has not filed certain instruments defining the rights of holders of long-term debt of the Company or consolidated subsidiaries under which the total amount of securities authorized does not exceed 10 percent of the total assets of the Company and its consolidated subsidiaries. The Company agrees to furnish to the SEC, upon request, a copy of any omitted instrument.
Exhibit No. | Description | Location |
Separation and Distribution Agreement between Rayonier Advanced Materials Inc. and Rayonier Inc., dated as of May 28, 2014 | Incorporated herein by reference to Exhibit 2.1 to the Registrant’s Amendment No. 4 to the Registration Statement on Form 10 filed on May 29, 2014 | |
Arrangement Agreement by and between Tembec Inc. and Rayonier Advanced Materials Inc. dated as of May 24, 2017* | Incorporated herein by reference to Exhibit 2.1 to the Registrant’s Form 8-K filed on May 25, 2017 | |
Amending Agreement, dated as of July 23, 2017, to the Arrangement Agreement by and between Tembec Inc. and Rayonier Advanced Materials Inc. dated as of May 24, 2017 | Incorporated herein by reference to Exhibit 2.1 to the Registrant’s Form 8-K filed on July 24, 2017 | |
Amended and Restated Certificate of Incorporation of Rayonier Advanced Materials Inc. | Incorporated herein by reference to Exhibit 3.1 to the Registrant’s Form 8-K filed on June 30, 2014 | |
Certificate of Designations of 8.00% Series A Mandatory Convertible Preferred Stock of Rayonier Advanced Materials Inc., filed with the Secretary of State of the State of Delaware and effective August 10, 2016 | Incorporated herein by reference to Exhibit 3.1 to the Registrant’s Form 8-K filed on August 10, 2016 | |
Amended and Restated Bylaws of Rayonier Advanced Materials Inc. | Incorporated herein by reference to Exhibit 3.2 to the Registrant’s Form 8-K filed on June 30, 2014 | |
Indenture among Rayonier A.M. Products Inc., the guarantors party thereto from time to time and Wells Fargo Bank, National Association, as Trustee, dated as of May 22, 2014 | Incorporated herein by reference to Exhibit 4.1 to the Registrant’s Amendment No. 4 to Registration Statement on Form 10 filed on May 29, 2014 | |
Form of certificate representing the Registrant’s 8.00% Series A Mandatory Convertible Preferred Stock | Incorporated herein by reference to Exhibit A to Exhibit 3.1 to the Registrant’s Form 8-K filed on August 10, 2016 | |
Transition Services Agreement, dated as of June 27, 2014, by and between Rayonier Inc. and Rayonier Advanced Materials Inc. | Incorporated herein by reference to Exhibit 10.1 to the Registrant’s Form 8-K filed on June 30, 2014 | |
Tax Matters Agreement, dated as of June 27, 2014, by and among Rayonier Inc., Rayonier Advanced Materials Inc., Rayonier TRS Holdings Inc. and Rayonier A.M. Products Inc. | Incorporated herein by reference to Exhibit 10.2 to the Registrant’s Form 8-K filed on June 30, 2014 | |
Employee Matters Agreement, dated as of June 27, 2014, by and between Rayonier Inc. and Rayonier Advanced Materials Inc. | Incorporated herein by reference to Exhibit 10.3 to the Registrant’s Form 8-K filed on June 30, 2014 | |
Intellectual Property Agreement, dated as of June 27, 2014, by and between Rayonier Inc. and Rayonier Advanced Materials Inc. | Incorporated herein by reference to Exhibit 10.4 to the Registrant’s Form 8-K filed on June 30, 2014 | |
Credit Agreement, dated as of June 24, 2014, among Rayonier A.M. Products Inc., Rayonier Advanced Materials Inc. (following its joinder thereto), the subsidiary loan parties from time to time party thereto (following their joinder thereto), the lenders from time to time party thereto and Bank of America, N.A., as administrative agent | Incorporated herein by reference to Exhibit 10.5 to the Registrant’s Form 8-K filed on June 30, 2014 | |
First Amendment, dated as of June 5, 2017, among Rayonier A.M. Products Inc., as Borrower, Rayonier Advanced Materials Inc., as Designated Borrower, Holdings and as a Guarantor, th10.6e Subsidiary Loan Parties party thereto, the Lenders party thereto, and Bank of America, N.A., as administrative agent and collateral agent | Incorporated herein by reference to Exhibit 10.1 to the Registrant’s Form 8-K filed on June 6, 2017 | |
First Restatement Agreement, dated as of August 17, 2017, among Rayonier Advanced Materials Inc., as Holdings, Rayonier A.M. Products Inc. and Rayonier Performance Fibers, LLC, as Borrowers, certain subsidiaries of Rayonier Advanced Materials Inc. party thereto, the lenders and L/C issuers party thereto and Bank of America, N.A., as Administrative Agent | Incorporated hereby by referenced to Exhibit 10.1 to the Registrant’s Form 8-K filed on August 18, 2017 | |
Rayonier Advanced Materials Inc. Incentive Stock Plan, as amended effective May 23, 2016** | Incorporated herein by reference to Appendix C to the Registrant’s Proxy Statement filed on April 8, 2016 | |
Rayonier Advanced Materials Inc. 2017 Incentive Stock Plan, effective May 22, 2017** | Incorporated herein by referenced to Appendix B to the Registrant’s Proxy Statement filed on April 7, 2017 | |
Rayonier Advanced Materials Inc. 2017 Incentive Stock Plan, effective December 15, 2017** | Filed herewith | |
Form of Rayonier Advanced Materials Inc. Incentive Stock Plan Restricted Stock Award Agreement, effective 2015** | Incorporated herein by reference to Exhibit 10.11 to the Registrant’s Form 10-K filed on February 27, 2015 | |
Form of Rayonier Advanced Materials Inc. Incentive Stock Plan Restricted Stock Unit Award Agreement, effective 2017** | Filed herewith | |
Form of Rayonier Advanced Materials Inc. Incentive Stock Plan Supplemental Terms Applicable to the 2016 Equity Award Grant** | Incorporated herein by reference to Exhibit 10.10 to the Registrant’s Form 10-K filed on February 24, 2017 | |
Form of Rayonier Advanced Materials Inc. Incentive Stock Plan Supplemental Terms Applicable to the 2017 Equity Award Grant** | Incorporated herein by reference to Exhibit 10.11 to the Registrant’s Form 10-K filed on February 24, 2017 | |
Form of Rayonier Advanced Materials Inc. Incentive Stock Plan Supplemental Terms Applicable to the 2018 Equity Award Grant** | Filed herewith | |
Description of Rayonier Advanced Materials Inc. 2016 Performance Share Award Program** | Incorporated herein by reference to Exhibit 10.14 to the Registrant’s Form 10-K filed on February 26, 2016 | |
Description of Rayonier Advanced Materials Inc. 2017 Performance Share Award Program** | Incorporated herein by reference to Exhibit 10.13 to the Registrant’s Form 10-K filed on February 24, 2017 | |
Description of Rayonier Advanced Materials Inc. 2018 Performance Share Award Program** | Filed herewith | |
Agreement between Rayonier Advanced Materials Inc. and Paul G. Boynton Regarding Special Stock Grant, dated May 28, 2014** | Incorporated herein by reference to Exhibit 10.6 to the Registrant’s Amendment No. 4 to the Registration Statement on Form 10 filed on May 29, 2014 | |
Amendment dated March 23, 2015 to Agreement between Rayonier Advanced Materials Inc. and Paul G. Boynton Regarding Retention Award** | Incorporated herein by reference to Exhibit 10.2 to the Registrant’s Form 10-Q filed on May 1, 2015 | |
Rayonier Advanced Materials Inc. Non-Equity Incentive Plan, as amended effective May 23, 2016** | Incorporated herein by reference to Appendix B to the Registrant’s Proxy Statement filed on April 8, 2016 | |
Rayonier Advanced Materials Inc. Executive Severance Pay Plan, as amended effective March 1, 2017** | Incorporated herein by reference to Exhibit 10.17 to the Registrant’s Form 10-K filed on February 24, 2017 | |
Rayonier Advanced Materials Inc. Non Change In Control Executive Severance Plan** | Incorporated herein by reference to Exhibit 10.20 to the Registrant’s Form 10-K filed on February 26, 2016 | |
Trust Agreement for Rayonier Advanced Materials Inc. Legal Resources Trust, dated June 28, 2014, by and between Rayonier Advanced Materials Inc. and Wells Fargo Bank, National Association** | Incorporated herein by reference to Exhibit 10.23 to the Registrant’s Form 10-Q/A filed on September 4, 2014 | |
Rayonier Advanced Materials Inc. Excess Benefit Plan, effective June 27, 2014** | Incorporated herein by reference to Exhibit 10.24 to the Registrant’s Form 10-Q/A filed on September 4, 2014 | |
Rayonier Advanced Materials Inc. Excess Savings and Deferred Compensation Plan, effective June 28, 2014** | Incorporated herein by reference to Exhibit 10.25 to the Registrant’s Form 10-Q/A filed on September 4, 2014 | |
Form of Rayonier Advanced Materials Inc. Excess Savings and Deferred Compensation Plan Agreements, effective June 28, 2014** | Incorporated herein by reference to Exhibit 10.18 to the Registrant’s Form 10-K filed on February 27, 2015 | |
Retirement Plan for Salaried Employees of Rayonier Advanced Materials Inc., effective June 27, 2014** | Incorporated herein by reference to Exhibit 10.26 to the Registrant’s Form 10-Q/A filed on September 4, 2014 | |
Rayonier Advanced Materials Inc. Investment and Savings Plan for Salaried Employees, effective January 1, 2015** | Incorporated herein by reference to Exhibit 10.24 to the Registrant’s Form 10-K filed on February 24, 2017 | |
Amendment to Rayonier Advanced Materials Inc. Investment and Savings Plan for Salaried Employees, effective January 1, 2015** | Incorporated herein by reference to Exhibit 10.25 to the Registrant’s Form 10-K filed on February 24, 2017 | |
Amendment to Rayonier Advanced Materials Inc. Investment and Savings Plan for Salaried Employees, effective January 1, 2016** | Incorporated herein by reference to Exhibit 10.26 to the Registrant’s Form 10-K filed on February 24, 2017 | |
Amendment to Rayonier Advanced Materials Inc. Investment and Savings Plan for Salaried Employees, effective January 1, 2016** | Incorporated herein by reference to Exhibit 10.27 to the Registrant’s Form 10-K filed on February 24, 2017 | |
Amendment to Rayonier Advanced Materials Inc. Investment and Savings Plan for Salaried Employees, effective October 1, 2016** | Incorporated herein by reference to Exhibit 10.28 to the Registrant’s Form 10-K filed on February 24, 2017 | |
Amendment to Rayonier Advanced Materials Inc. Investment and Savings Plan for Salaried Employees, effective February 13, 2017** | Incorporated herein by reference to Exhibit 10.29 to the Registrant’s Form 10-K filed on February 24, 2017 | |
Form of Indemnification Agreement between Rayonier Advanced Materials Inc. and individual directors or officers** | Incorporated herein by reference to Exhibit 10.5 to the Registrant’s Amendment No. 4 to the Registration Statement on Form 10 filed on May 29, 2014 | |
Form of Rayonier Advanced Materials Inc. Outside Directors Compensation Program/Cash Deferral Option Agreement** | Incorporated herein by reference to Exhibit 10.22 to the Registrant’s Form 10-K and filed on February 27, 2015 | |
Chemical Cellulose Purchase and Sale Agreement, effective as of January 1, 2016, between Rayonier A.M. Sales and Technology Inc. and Eastman Chemical Company*** | Incorporated herein by reference to Exhibit 10.1 to the Registrant’s Form 8-K filed on December 1, 2015 | |
Amendment No. 1 to Chemical Cellulose Purchase and Sale Agreement by and between Rayonier A.M. Sales and Technology Inc. and Eastman Chemical Company, effective as of November 18, 2017*** | Incorporated herein by reference to Exhibit 10.33 to the Registrant’s Form 10-K filed on February 24, 2017 | |
Cellulose Specialties Agreement, effective as of January 1, 2012, by and between Rayonier Performance Fibers, LLC and Nantong Cellulose Fibers Co., Ltd.*** | Incorporated herein by reference to Exhibit 10.9 to the Registrant’s Amendment No. 4 to the Registration Statement on Form 10 filed on May 29, 2014 | |
Amendment No. 1 to Cellulose Specialties Agreement, effective as of January 1, 2012, by and between Rayonier Performance Fibers, LLC and Nantong Cellulose Fibers Co., Ltd.*** | Incorporated herein by reference to Exhibit 10.10 to the Registrant’s Amendment No. 4 to the Registration Statement on Form 10 filed on May 29, 2014 | |
Amendment No. 2 to Cellulose Specialties Agreement, effective as of December 31, 2014, by and between Rayonier Performance Fibers, LLC and Nantong Cellulose Fibers Co., Ltd.*** | Incorporated herein by reference to Exhibit 10.1 to the Registrant’s Form 8-K filed on October 20, 2014 | |
Amendment No. 3 to Chemical Cellulose Agreement, dated effective as of January 1, 2016, between Nantong Cellulose Fibers Co., Ltd. and Rayonier A.M. Sales and Technology Inc.*** | Incorporated herein by reference to Exhibit 10.1 to the Registrant’s Form 8-K filed on September 23, 2015 | |
Amended and Restated Cellulose Specialties Agreement, effective as of January 1, 2012, by and between Rayonier Performance Fibers, LLC and Daicel Corporation*** | Incorporated herein by reference to Exhibit 10.11 to the Registrant’s Amendment No. 4 to the Registration Statement on Form 10 filed on May 29, 2014 | |
Amendment No. 1 to Amended and Restated Cellulose Specialties Agreement, effective as of February 15, 2013, by and between Rayonier Performance Fibers, LLC and Daicel Corporation*** | Incorporated herein by reference to Exhibit 10.12 to the Registrant’s Amendment No. 4 to the Registration Statement on Form 10 filed on May 29, 2014 | |
Amendment No. 2 to Daicel - Rayonier Amended Chemical Specialties Agreement, effective as of January 1, 2016, between Daicel Corporation and Rayonier A.M. Sales and Technology Inc.*** | Incorporated herein by reference to Exhibit 10.1 to the Registrant’s Form 8-K filed on March 17, 2016 | |
Amendment No. 3 to Daicel - Rayonier Amended Chemical Specialties Agreement, effective as of January 1, 2017 between Daicel Corporation and Rayonier A. M. Sales and technology Inc.*** | Incorporated hereby by referenced to Exhibit 10.1 to the Registrant’s Form 10-Q filed on August 3, 2017 | |
Support and Voting Agreement, dated as of July 23, 2017, by and between Rayonier Advanced Materials Inc., Oaktree Value Equity Fund, L.P. and Oaktree Value Equity Fund-SP, L.P. | Incorporated herein by reference to Exhibit 10.1 to the Registrant’s Form 8-K filed on July 24, 2017 | |
Support and Voting Agreement, dated as of July 23, 2017, by and between Rayonier Advanced Materials Inc., Bennett Restructuring Fund, L.P. and Bennett Offshore Restructuring Fund, Inc. | Incorporated herein by reference to Exhibit 10.2 to the Registrant’s Form 8-K filed on July 24, 2017 | |
Agreement by and among Rayonier Advanced Materials Inc., Marcato Capital Management L.P., Marcato International Master Fund, Ltd., Marcato Encore Master Fund, Ltd. and Matthew Hepler, dated February 18, 2018 | Incorporated herein by reference to Exhibit 10.1 to the Registrant’s Form 8-K filed on February 20, 2018 | |
Statements re computation of ratios | Filed herewith | |
Subsidiaries of the registrant | Filed herewith | |
Consent of Grant Thornton LLP | Filed herewith | |
Consent of Ernst & Young LLP | Filed herewith | |
Powers of attorney | Filed herewith | |
Chief Executive Officer’s Certification Pursuant to Rule 13a-14(a)/15d-14(a) and pursuant to Section 302 of the Sarbanes-Oxley Act of 2002 | Filed herewith | |
Chief Financial Officer’s Certification Pursuant to Rule 13a-14(a)/15d-14-(a) and pursuant to Section 302 of the Sarbanes-Oxley Act of 2002 | Filed herewith | |
Certification of Periodic Financial Reports Under Section 906 of the Sarbanes-Oxley Act of 2002 | Furnished herewith | |
101 | The following financial information from our Annual Report on Form 10-K for the fiscal year ended December 31, 2017, formatted in Extensible Business Reporting Language (“XBRL”), includes: (i) the Consolidated Statements of Income and Comprehensive Income for the Years Ended December 31, 2017, 2016 and 2015; (ii) the Consolidated Balance Sheets as of December 31, 2017 and 2016; (iii) the Consolidated Statements of Cash Flows for the Years Ended December 31, 2017, 2016 and 2015; and (iv) the Notes to the Consolidated Financial Statements | Filed herewith |
* The exhibits to the Arrangement Agreement have been omitted from this filing pursuant to Item 601(b)(2) of Regulation S-K. The Company will furnish copies of any such schedules and exhibits to the U.S. Securities and Exchange Commission upon request.
** Management contract or compensatory plan.
*** Portions of this exhibit have been omitted pursuant to a request for confidential treatment pursuant to Rule 24b-2 under the
Securities Exchange Act of 1934.