Attached files
| file | filename |
|---|---|
| EX-32.2 - EXHIBIT 32.2 - CSS INDUSTRIES INC | fy201810-kxex322.htm |
| EX-32.1 - EXHIBIT 32.1 - CSS INDUSTRIES INC | fy201810-kxex321.htm |
| EX-31.2 - EXHIBIT 31.2 - CSS INDUSTRIES INC | fy201810-kxex312.htm |
| EX-31.1 - EXHIBIT 31.1 - CSS INDUSTRIES INC | fy201810-kxex311.htm |
| EX-23 - EXHIBIT 23 - CSS INDUSTRIES INC | fy201810-kxex23.htm |
| EX-21 - EXHIBIT 21 - CSS INDUSTRIES INC | fy201810-kxex21.htm |
| EX-10.16 - EXHIBIT 10.16 - CSS INDUSTRIES INC | exhibit1016.htm |
UNITED STATES
SECURITIES AND EXCHANGE COMMISSION
Washington, D.C. 20549
FORM 10-K |
(Mark one)
ý | ANNUAL REPORT PURSUANT TO SECTION 13 OR 15(d) OF THE SECURITIES EXCHANGE ACT OF 1934 |
For the fiscal year ended March 31, 2018
OR
¨ | TRANSITION REPORT PURSUANT TO SECTION 13 OR 15(d) OF THE SECURITIES EXCHANGE ACT OF 1934 |
For the transition period from to
Commission file number 1-2661
 |
CSS INDUSTRIES, INC. (Exact name of registrant as specified in its charter) |
Delaware | 13-1920657 | |
(State or other jurisdiction of | (I.R.S. Employer | |
incorporation or organization) | Identification No.) | |
450 Plymouth Road, Suite 300, Plymouth Meeting, PA | 19462 | |
(Address of principal executive offices) | (Zip Code) | |
Registrant’s telephone number, including area code: (610) 729-3959
Securities registered pursuant to Section 12(b) of the Act:
Title of each class | Name of each exchange on which registered | |
Common Stock, $.10 par value | New York Stock Exchange | |
Securities registered pursuant to Section 12(g) of the Act: None
(Title of class)
Indicate by check mark if the registrant is a well-known seasoned issuer, as defined in Rule 405 of the Securities Act. Yes ¨ No ý
Indicate by check mark if the registrant is not required to file reports pursuant to Section 13 or Section 15(d) of the Act. Yes ¨ No ý
Indicate by check mark whether the registrant (1) has filed all reports required to be filed by Section 13 or 15(d) of the Securities Exchange Act of 1934 during the preceding 12 months (or for such shorter period that the registrant was required to file such reports), and (2) has been subject to such filing requirements for the past 90 days. Yes ý No ¨
Indicate by check mark whether the registrant has submitted electronically and posted on its corporate Web site, if any, every Interactive Data File required to be submitted and posted pursuant to Rule 405 of Regulation S-T (§232.405 of this chapter) during the preceding 12 months (or for such period that the registrant was required to submit and post such files). Yes ý No ¨
Indicate by check mark if disclosure of delinquent filers pursuant to Item 405 of Regulation S-K is not contained herein, and will not be contained, to the best of registrant’s knowledge, in definitive proxy or information statements incorporated by reference in Part III of this Form 10-K or any amendment to this Form 10-K. ý
Indicate by check mark whether the registrant is a large accelerated filer, an accelerated filer, a non-accelerated filer, smaller reporting company, or an emerging growth company. See the definitions of “large accelerated filer,” “accelerated filer,” “smaller reporting company,” and "emerging growth company" in Rule 12b-2 of the Exchange Act:
Large accelerated filer | ¨ | Accelerated filer | ý | |||
Non-accelerated filer | ¨ | Smaller reporting company | ¨ | |||
Emerging growth company | ¨ | |||||
If an emerging growth company, indicate by check mark if the registrant has elected not to use the extended transition period for complying with any new or revised financial accounting standards provided pursuant to Section 13(a) of the Exchange Act. ¨
Indicate by check mark whether the registrant is a shell company (as defined in Rule 12b-2 of the Exchange Act). Yes ¨ No ý
The aggregate market value of the voting stock held by non-affiliates of the registrant is $255,661,557. Such aggregate market value was computed by reference to the closing price of the common stock of the registrant on the New York Stock Exchange on September 29, 2017, being the last trading day of the registrant’s most recently completed second fiscal quarter. Such calculation excludes the shares of common stock beneficially owned at such date by certain directors and officers of the registrant, as described under the section entitled “Ownership of CSS Common Stock” in the proxy statement to be filed by the registrant for its 2018 Annual Meeting of Stockholders. In making such calculation, registrant does not determine the affiliate or non-affiliate status of any holders of the shares of common stock for any other purpose.
At June 1, 2018, there were outstanding 9,119,746 shares of common stock.
DOCUMENTS INCORPORATED BY REFERENCE
Portions of the registrant’s definitive proxy statement for its 2018 Annual Meeting of Stockholders are incorporated by reference into Part III of this Form 10-K.
CSS INDUSTRIES, INC.
FORM 10-K
FOR THE FISCAL YEAR ENDED MARCH 31, 2018
INDEX
Page | ||
Item 1. | ||
Item 1A. | ||
Item 1B. | ||
Item 2. | ||
Item 3. | ||
Item 4. | ||
Item 5. | ||
Item 6. | ||
Item 7. | ||
Item 7A. | ||
Item 8. | ||
Item 9. | ||
Item 9A. | ||
Item 9B. | ||
Item 10. | ||
Item 11. | ||
Item 12. | ||
Item 13. | ||
Item 14. | ||
Item 15. | ||
PART I
Item 1. Business.
General
CSS Industries, Inc. (“CSS” or the “Company”) is a creative consumer products company, focused on the seasonal, gift and craft categories. For these design-driven categories, the Company engages in the creative development, manufacture, procurement, distribution and sale of our products with an omni-channel approach focused primarily on mass market retailers.
Seasonal The seasonal category includes gift packaging items such as ribbon, bows, greeting cards, wrapping paper, bags, boxes, tags and gift card holders, in addition to specific holiday-themed decorations, accessories, and activities, such as Easter egg dyes and novelties and Valentine's Day classroom exchange cards. These products are sold to mass market retailers, and production forecasts for these products are generally known well in advance of shipment.
Gift The gift category (formerly described by the Company as its celebrations category) includes products designed to celebrate certain life events or special occasions, such as weddings, birthdays, anniversaries, graduations, or the birth of a child. Products include ribbons and bows, floral accessories, infant products, journals, gift card holders, all occasion boxed greeting cards, memory books, scrapbooks, stationery, stickers and other items that commemorate life's celebrations. Products in this category are primarily sold into mass and specialty retailers, floral and packaging wholesalers and distributors, and are generally ordered on a replenishment basis throughout the year.
Craft The craft category includes ribbons, trims, buttons, sewing patterns, knitting needles, needle arts and kids' crafts. These products are sold to mass market and specialty retailers, and are generally ordered on a replenishment basis throughout the year.
CSS’ product breadth provides its retail customers the opportunity to use a single vendor for much of their seasonal, gift and craft product requirements. A substantial portion of CSS’ products are manufactured and packaged in the United States and warehoused and distributed from facilities in the United States, the United Kingdom and Australia, with the remainder sourced from foreign suppliers, primarily in Asia. The Company also has a manufacturing facility in India that produces certain craft products, including trims, braids and tassels, and also has a distribution facility in India. The Company’s products are sold to its customers by national and regional account sales managers, sales representatives, product specialists and by a network of independent manufacturers’ representatives. CSS maintains purchasing offices in Hong Kong and China to administer Asian sourcing opportunities.
A key aspect of the Company’s strategy is to reposition its portfolio primarily through acquisitions within the categories that the Company currently operates. The highly fragmented nature of the categories in which the Company operates creates opportunities to grow through acquisition. As a result, the Company actively meets with craft, gift and seasonal companies to assess potential fit against our pre-defined parameters, seeking to deploy its cash to grow through acquisition.
The overall objective of the Company is to grow profitable sales and improve return on invested capital ("ROIC") through five strategic pillars. These strategic pillars include:
*Defend the base business - Design, product innovation, category leadership
* | Identify adjacent product categories with a focus on brands - Focus on fragmented markets, brands, omni-channel |
*Build an omni-channel business model - Dedicated resources, leverage technology
* | Improve ROIC by maximizing margins while minimizing capital investment - Fix underperforming product lines, focus on working capital |
*Build a collaborative, dynamic One CSS culture - Communication, accountability, talent infusion
Principal Products CSS designs, manufactures, procures, distributes and sells a broad range of craft and gift consumer products. Craft and gift consumer products include ribbons and bows, trims, buttons, sewing patterns, knitting needles, needle arts, kids' crafts, floral accessories, infant products, journals, gift card holders, all occasion boxed greeting cards, memory books, scrapbooks, stationery, stickers and other gift and craft items, sold to its mass market, craft, specialty and floral retail and wholesale distribution customers. CSS also designs, manufactures, procures, distributes and sells a broad range of seasonal consumer products primarily through the mass market distribution channel. Christmas products include packaging ribbons and bows, boxed greeting cards, gift wrap, gift bags, gift boxes, gift tags, gift card holders, tissue paper and decorations. CSS’ Valentine's Day product offerings include classroom exchange Valentine's Day cards and other related
1
Valentine's Day products, while its Easter product offerings include Dudley’s® brand of Easter egg dyes and related Easter seasonal products. Its back-to-school products include teachers’ aids and other learning oriented products to the education market sold through mass market retailers, school supply distributors and teachers’ stores.
Key brands include Paper Magic®, Berwick®, Offray®, C.R. Gibson®, McCall’s®, Butterick®, Kwik Sew®, Vogue Patterns®, Markings®, Stepping Stones®, Tapestry®, Seastone®, Dudley’s®, Eureka®, Stickerfitti®, Favorite Findings®, La Mode®, Simplicity®, Wrights®, Boye®, Dimensions® and Perler®.
CSS operates nineteen manufacturing and/or distribution facilities located in Pennsylvania, Maryland, New Hampshire, South Carolina, Alabama, Illinois, Kansas, the United Kingdom, Australia and India. A description of the Company’s product lines and related manufacturing and/or distribution facilities is as follows:
• | Ribbon and bows are primarily manufactured and warehoused in eight facilities located in Pennsylvania, Maryland, South Carolina and Alabama. The manufacturing process is vertically integrated. Non-woven ribbon and bow products are primarily made from polypropylene resin, a petroleum-based product, which is mixed with color pigment, melted and pressed through an extruder. Large rolls of extruded film go through various combinations of manufacturing processes before being made into bows or packaged on ribbon spools or reels as required by various markets and customers. Woven fabric ribbons are manufactured domestically or imported from Mexico and Asia. Imported woven products are either narrow woven or converted from bulk rolls of wide width textiles. Domestic woven products are narrow woven. |
• | Infant products, journals, educational products, memory books, scrapbooks, stationery, and other gift items are imported from Asian manufacturers and warehoused and distributed from two distribution facilities in Alabama. |
• | Floral accessories, including pot covers, foil, waxed tissue, shred, aisle runners, corsage bags and other paper and film products, are manufactured in a facility located in New Hampshire or imported from Mexico. Manufacturing includes gravure and flexo printing, waxing and converting. Products are warehoused and distributed from a distribution facility in Pennsylvania. |
• | Sewing patterns are purchased and distributed from a third party printer and are also manufactured and distributed from a facility located in Kansas. Sewing patterns are also warehoused and distributed from two distribution facilities in the United Kingdom and two distribution facilities in Australia. |
• | Certain craft items, including trims, braids and tassels, are manufactured and distributed from two facilities in India. |
Other products including, but not limited to, buttons, knitting needles, needle arts, kids crafts, boxed greeting cards, gift tags, gift card holders, gift bags, gift wrap, decorative tissue paper, classroom exchange Valentine's Day products, Easter products, and decorations are produced to the specifications of CSS and are imported primarily from Asian manufacturers.
During our 2018 fiscal year, CSS experienced no material difficulties in obtaining raw materials or finished goods from suppliers.
Intellectual Property Rights CSS has a number of copyrights, patents, tradenames, trademarks and intellectual property licenses which are used in connection with its products. Substantially all of its designs and artwork are protected by copyright. Intellectual property license rights which CSS has obtained are viewed as especially important to the success of its classroom exchange Valentine's Day cards and stickers. It is CSS’ view that its operations are not dependent upon any individual patent, tradename, trademark, copyright or intellectual property license. The collective value of CSS’ intellectual property is viewed as substantial, and CSS seeks to protect its rights in all patents, copyrights, tradenames, trademarks and intellectual property licenses.
Sales and Marketing Most of CSS’ products are sold in the United States and Canada by national and regional account sales managers, sales representatives, product specialists and by a network of independent manufacturers’ representatives. CSS maintains permanent showrooms in Pennsylvania, Georgia, Arkansas, Ohio, Tennessee, Texas, Hong Kong and Australia where buyers for major retail customers will typically visit for a presentation and review of the new lines. Products are also displayed and presented in showrooms maintained by various independent manufacturers’ representatives in major cities in the United States and Canada. Relationships are developed with key retail customers by CSS sales personnel and independent manufacturers’ representatives. Social stationery products are sold by a national organization of sales representatives that specialize in the gift and specialty channel, as well as by key account representatives. Craft ribbon and bow products are also sold through sales representatives or independent manufacturers’ representatives to wholesale distributors and independent small retailers who serve the floral, craft and retail packaging trades. The Company also sells custom products to private label customers, to other social expression companies, and to converters of the Company’s ribbon products. Custom products are sold by both independent manufacturers’ representatives and CSS sales managers.
2
Customers are generally mass market retailers, discount department stores, specialty chains, warehouse clubs, drug and food chains, dollar stores, office supply stores, independent card, gift and floral shops and retail teachers’ stores. Net sales to Walmart Stores, Inc. and its affiliates accounted for approximately 25% of total net sales during fiscal 2018. No other customer accounted for 10% or more of the Company’s net sales in fiscal 2018. Our ten largest customers, which include mass market retailers, warehouse clubs and national drug store chains, accounted for approximately 61% of our sales in our 2018 fiscal year. Approximately 66% of the Company’s sales are attributable to gift and craft products with the remainder attributable to seasonal (Christmas, Valentine’s Day, Easter and back to-school) products. Approximately 24% of CSS’ sales relate to the Christmas season. Seasonal products are generally designed and marketed beginning up to 18 to 20 months before the holiday event and manufactured during an eight to ten month production cycle. Due to these long lead time requirements, timely communication with third party factories, licensors, customers and independent manufacturers’ representatives is critical to the timely production of seasonal products. Sales terms for our seasonal products do not generally require payment until just before or just after the holiday, in accordance with industry practice. CSS products, with some customer specific exceptions, are not sold under guaranteed or return privilege terms. The Company has certain limited products, primarily sewing patterns, that are on consignment at mass market retailers and the Company recognizes the sale as products are sold to end consumers at point-of-sale terminals.
Competition among retailers in the sale of the Company’s products to end users is intense. CSS seeks to assist retailers in developing merchandising programs designed to enable the retailers to meet their revenue and profit objectives while appealing to their consumers’ tastes. These objectives are met through the development and manufacture of custom configured and designed products and merchandising programs. CSS’ years of experience in merchandising program development and product quality are key competitive advantages in helping retailers meet their objectives.
Competition CSS competes with various domestic and foreign companies in each of its seasonal, gift and craft categories. Some of our competitors are larger and have greater resources than the Company while many are smaller, private companies that we compete with across our product lines. CSS believes its products are competitively positioned in their primary markets. Since competition is based primarily on category knowledge, timely delivery, creative design, price and, with respect to seasonal products, the ability to serve major retail customers with single, combined product shipments for each holiday event, CSS believes that its focus on products, combined with consistent service levels, allows it to compete effectively in its core markets.
Backlog Production forecasts for products within our seasonal category are generally known well in advance of shipment. Orders for products within our gift and craft categories are generally ordered on a just-in-time replenishment basis by our customers and an order backlog does not typically exist, except when major program resets occur.
The Company’s fiscal year ends on March 31. References to a particular year refer to the fiscal year ending in March of that year. For example, fiscal 2018 refers to the fiscal year ended March 31, 2018.
Employees
At June 1, 2018, approximately 2,000 persons were employed by CSS (increasing to approximately 2,075 as seasonal employees are added). The Company believes that relationships with its employees are good.
With the exception of the bargaining unit at the ribbon manufacturing facility in Hagerstown, Maryland, which totaled 80 employees as of June 1, 2018, CSS employees are not represented by labor unions. Because of the seasonal nature of certain of its businesses, the number of production employees fluctuates during the year. The collective bargaining agreement with the labor union representing the Hagerstown-based production and maintenance employees remains in effect until December 31, 2020. Historically, we have been successful in renegotiating expiring agreements without any disruption of operating activities.
Acquisitions
The Company will continue to build on existing relationships with seasonal, gift and craft customers by expanding and diversifying its product lines and thereby growing its presence in the largest retailers in North America. This includes both capitalizing on opportunities for organic growth in existing businesses as well as acquiring companies which fit into appropriate acquisition parameters. We actively meet with seasonal, gift and craft companies to review and assess potential acquisition targets.
On November 3, 2017, the Company completed the acquisition of substantially all of the net assets and business of Simplicity Creative Group ("Simplicity") from Wilton Brands LLC ("Wilton") for a total consideration of $69,617,000 and transaction costs of approximately $3,411,000. Simplicity is a leading provider of home sewing patterns, decorative trims, knitting and crocheting tools, needle arts and kids' crafts products under the Simplicity®, Wrights®, Boye®, Dimensions®, and
3
Perler® brand names. Simplicity's products are sold to mass-market retailers, specialty fabric and craft chains, wholesale distributors and online customers. The Company primarily financed the acquisition with borrowings of $60,000,000 under its revolving credit facility and has recorded a working capital adjustment due to Wilton of $2,500,000, which is recorded in other current liabilities in the accompanying consolidated balance sheet and was paid on April 4, 2018. A portion of the purchase price is being held in escrow for certain post closing adjustments and indemnification obligations. The acquisition was accounted for using the acquisition method and the excess of cost over the fair market value of the net tangible and identifiable intangible assets acquired of $9,642,000 was recorded as goodwill. This goodwill was subsequently written off as a result of the Company’s annual impairment testing performed in the fourth quarter of fiscal 2018 as further described in Note 3 to the consolidated financial statements.
On December 13, 2016, the Company completed the acquisition of substantially all of the net assets and business of The McCall Pattern Company and certain affiliated subsidiaries ("McCall"), for approximately $13,914,000 in cash, plus transaction costs of approximately $1,484,000. McCall designs, manufactures, and sells home sewing patterns under the McCall’s®, Butterick®, Kwik Sew® and Vogue Patterns® brand names. McCall is a leading provider of home sewing patterns, selling to mass market retailers, specialty fabric and craft chains, and wholesale distributors. A portion of the purchase price is being held in escrow for certain post closing adjustments and indemnification obligations. The acquisition was accounted for using the acquisition method and resulted in a bargain purchase due to the fair value of the net assets acquired of approximately $33,528,000 exceeding the amount paid. In connection with this bargain purchase, the Company recorded a gain of approximately $19,614,000 in the consolidated statements of operations in the fiscal year ended March 31, 2017.
On July 8, 2016, a subsidiary of the Company completed the acquisition of substantially all of the assets of Lawrence Schiff Silk Mills, Inc. ("Schiff") for $1,125,000 in cash. Schiff was a leading U.S. manufacturer and distributor of narrow woven ribbon prior to its April 2016 Chapter 11 bankruptcy filing. The acquisition was accounted for using the acquisition method and resulted in a bargain purchase due to the fair value of the net assets acquired of approximately $1,501,000 exceeding the amount paid. In connection with this bargain purchase, the Company recorded a gain of approximately $376,000 in the consolidated statements of operations in the fiscal year ended March 31, 2017.
On February 2, 2016, a subsidiary of the Company completed the acquisition of substantially all of the net assets and business of Blumenthal Lansing Company, LLC ("Blumenthal") for approximately $19,626,000 in cash, including transaction costs of approximately $81,000. The Company also incurred costs of approximately $1,028,000 in fiscal 2016, primarily related to severance. Blumenthal was a leading provider of buttons to the sewing and craft markets in the United States, selling to mass market retailers and wholesale distributors that service independent retail stores. The acquisition was accounted for using the acquisition method, and $4,017,000, which is the excess of cost over fair value of the net tangible and identifiable intangible assets acquired, was recorded as goodwill. This goodwill was subsequently written off as a result of the Company’s annual impairment testing performed in fiscal 2018 as further described in Note 3 to the consolidated financial statements.
SEC Filings
The Company’s Internet address is www.cssindustries.com. Through its website, the following filings are made available free of charge as soon as reasonably practicable after they are electronically filed with or furnished to the Securities and Exchange Commission: its annual report on Form 10-K, its quarterly reports on Form 10-Q, its current reports on Form 8-K and any amendments to those reports filed or furnished pursuant to Section 13(a) or 15(d) of the Securities Exchange Act of 1934.
Item 1A. Risk Factors.
You should carefully consider each of the risk factors we describe below, as well as other factors described in this annual report on Form 10-K and elsewhere in our SEC filings.
Our results of operations fluctuate on a seasonal basis, and quarter to quarter comparisons may not be a good indicator of our performance. Seasonal demand fluctuations may adversely affect our cash flow and our ability to sell our products.
Approximately 66% of the Company’s sales are attributable to products within our gift and craft categories, with the remainder attributable to products in the seasonal category. Approximately 24% of our sales relate to the Christmas season. The seasonal nature of our business has historically resulted in lower sales levels and operating losses in our first and fourth quarters, and higher sales levels and operating profits in our second and third quarters. As a result, our quarterly results of operations fluctuate during our fiscal year, and a quarter to quarter comparison is not a good indication of our performance or how we will perform in the future. For example, our overall results of operations in the future may fluctuate substantially based on seasonal demand for our products. Such variations in demand could have a material adverse effect on the timing of cash flow and therefore our ability to meet our obligations with respect to our debt and other financial commitments. Seasonal
4
fluctuations also affect our inventory levels. We must carry significant amounts of inventory, especially before the Christmas retail selling period. If we are not successful in selling the inventory during the relevant period, we may have to sell the inventory at significantly reduced prices, or we may not be able to sell the inventory at all.
We rely on a few mass market retailers, warehouse clubs and national drug store chains for a significant portion of our sales. The loss of sales, or a significant reduction of sales, to one or more of our large customers may adversely affect our business, results of operations and financial condition. Past and future consolidation within the retail sector also may lead to reduced profit margins, which may adversely affect our business, results of operations and financial condition.
A few of our customers are material to our business and operations. Our sales to Walmart Stores, Inc. and its affiliates accounted for approximately 25% of our sales during our 2018 fiscal year. No other single customer accounted for 10% or more of our sales in fiscal 2018. Our ten largest customers, which include mass market retailers, warehouse clubs and national drug store chains, accounted for approximately 61% of our sales in our 2018 fiscal year. Our business depends, in part, on our ability to identify and define product and market trends, and to anticipate, understand and react to changing consumer demands in a timely manner. There can be no assurance that our large customers will continue to purchase our products in the same quantities that they have in the past. The loss of sales, or a significant reduction of sales, with one or more of our large customers, including without limitation a loss or significant reduction in sales resulting from our failure or inability to comply with one or more of any of our customers’ sourcing requirements, may adversely affect our business, results of operations and financial condition. Further, in recent years there has been consolidation among our retail customer base. As the retail sector consolidates, our customers become larger, and command increased leverage in negotiating prices and other terms of sale of our products, including credits, discounts, allowances and other incentive considerations to these customers. Past and future consolidation may lead to reduced profit margins, which may adversely affect our business, results of operations and financial condition.
A portion of our products, primarily sewing patterns, are sold on a consignment basis by third party consignment sellers, including certain mass market retailers. Because of the nature of the consignment arrangement, we may be adversely affected if third party consignment sellers, including mass market retailers, experience difficulties in recording sales of the products to end consumers, or in accounting for, or paying us for, the sales of such products. Additionally, while the consigned products are physically stored with third parties, including third party consignment sellers, we do not have custody or control of such products, and the consigned products are subject to damage or loss, including, but not limited to, theft. Any failure or inability by third parties, including third party consignment sellers, to appropriately manage the consignment arrangement may adversely affect our business, results of operations and financial condition.
A portion of our products, primarily sewing patterns, are sold on a consignment basis by third party consignment sellers, including certain mass market retailers. Under the consignment arrangement, the applicable products are physically stored at third party locations, including mass market retailer store locations, and we retain title to the consigned products until such products are purchased by an end consumer. We recognize the sale of such consigned products at the time that the products are sold to the end consumer, as recorded at the applicable seller’s point-of-sale terminals. Under this arrangement, we are subject to the ability of third party consignment sellers, including mass market retailers, to appropriately record the sales of our consigned products to end consumers, and to appropriately account for, and pay us for, such recorded sales. The failure or inability of third party consignment sellers, including mass market retailers, to record sales of our consigned products, and to appropriately account for, and pay us for, such recorded sales may adversely affect our business, results of operations and financial condition. Additionally, while our consigned products are physically stored with third parties, including third party consignment sellers, we do not have custody or control of such products, and the consigned products are subject to damage or loss, including, but not limited to, theft. There can be no assurance that third parties, including third party consignment sellers, will appropriately handle, monitor, secure or protect our consigned products, and any failure or inability to do so may adversely affect our business, results of operations and financial condition.
Increases in raw material and energy costs, resulting from general economic conditions, acts of nature, such as hurricanes, earthquakes or pandemics, acts of war, threats of war, terrorism, civil unrest, or other factors, may raise our cost of goods sold and adversely affect our business, results of operations and financial condition.
Paper and petroleum-based materials are essential in the manufacture of some of our products, such as our stationery and plastic decorative ribbons products, and the cost of such materials is significant to our cost of goods sold. Energy costs, especially fuel costs, also are significant expenses in the production and delivery of our products. Increased costs of raw materials or energy resulting from general economic conditions, acts of nature, such as hurricanes, earthquakes or pandemics, acts of war, threats of war, terrorism, civil unrest, or other factors, may result in declining margins and operating results if market conditions prevent us from passing these increased costs on to our customers through timely price increases on our products.
5
Risks associated with our use of foreign suppliers may adversely affect our business, results of operations and financial condition.
For a large portion of our product lines, with the exception of our decorative ribbon and bow product lines and sewing patterns, we use foreign suppliers to manufacture a significant portion of our products. Approximately 58% of our sales in fiscal 2018 were related to products sourced from foreign suppliers. Our use of foreign suppliers exposes us to risks inherent in doing business outside of the United States, including risks associated with foreign currency fluctuations, transportation costs and delays or disruptions, difficulties in maintaining and monitoring quality control (including without limitation risks associated with defective products), enforceability of agreed upon contract terms, compliance with existing and new United States and foreign laws and regulations, such as the United States Foreign Corrupt Practices Act and legislation and regulations relating to imported products, costs relating to the imposition or retrospective application of antidumping and countervailing duties or other trade-related sanctions on imported products, economic, civil or political instability, acts of war, threats of war, terrorism, civil unrest, labor-related issues, such as labor shortages or wage disputes or increases, international public health issues, and restrictions on the repatriation of profits and assets.
Increased overseas sourcing by our competitors and our customers may reduce our market share and profit margins, adversely affecting our business, results of operations and financial condition.
We have relatively high market share in many of our seasonal product categories. Most of our product markets have shown little or no growth, and some of our product markets have declined in recent years, and we continue to confront significant cost pressure as our competitors source certain products from overseas and certain customers increase direct sourcing from overseas factories. Increased overseas sourcing by our competitors and certain customers may result in a reduction of our market share and profit margins, adversely affecting our business, results of operations and financial condition.
Difficulties encountered by our key customers may cause them to reduce their purchases from us and/or increase our exposure to losses from bad debts, and adversely affect our business, results of operations and financial condition.
Many of our largest customers are national and regional retail chains. The retail channel in the United States has experienced significant shifts in market share among competitors in recent years, including as a result of the presence and continued growth of e-commerce retailers. Any current or future economic slowdown, slow economic recovery, or uncertain economic outlook could further adversely affect our key customers. Our business, results of operations and financial condition may be adversely affected if our customers file for bankruptcy protection and/or cease doing business, significantly reduce the number of stores they operate, significantly reduce their purchases from us, do not pay us for their purchases, or if their payments to us are delayed or reduced because of bankruptcy or other factors beyond our control.
Our inability to effectively develop, manufacture, procure, distribute and sell our products with an omni-channel approach may adversely affect our business, results of operations and financial condition.
The retail channel in the United States is rapidly evolving, and consumers are increasingly embracing online shopping, including through mobile commerce applications. Many of our retail customers are experiencing a shift of their total consumer expenditures from sales at physical retail locations to sales on digital platforms. Our retail customers expect us, as a product supplier, to assist them to deliver a seamless omni-channel shopping experience. Additionally, our strategy includes a greater focus on our own direct-to-consumer online shopping opportunities. We continue to invest in e-commerce technology, including the development of our digital platforms and mobile commerce applications. Our business, results of operations and financial condition may be adversely affected if we are unable to effectively develop, manufacture, procure, distribute and sell our products with an omni-channel approach.
Our business, results of operations and financial condition may be adversely affected by volatility in the demand for our products.
Our success depends on the sustained demand for our products. Many factors affect the level of consumer spending on our products, including, among other things, general business conditions, interest rates, the availability of consumer credit, taxation, the effects of war, terrorism or threats of war, civil unrest, fuel prices, consumer demand for our products based upon, among other things, consumer trends and the availability of alternative products, and consumer confidence in future economic conditions. A decline in economic activity in the United States or other regions of the world, a slow economic recovery, or an uncertain outlook, in addition to adversely affecting our customers, could adversely affect our business, results of operations and financial condition because of, among other things, reduced consumer spending on discretionary items, including our products. We also routinely utilize new artwork, designs or licensed intellectual property in connection with our products, and our inability to design, select, procure, maintain or sell consumer-desired artwork, designs or
6
licensed intellectual property could adversely affect the demand for our products, which could adversely affect our business, results of operations and financial condition.
Our business, results of operations and financial condition may be adversely affected if we are unable to compete successfully against our competitors.
Our success depends in part on our ability to compete against our competitors in our highly competitive markets. Our competitors, including domestic businesses, foreign manufacturers who market directly to our customer base, and importers of products, may be able to offer similar products with more favorable pricing, servicing and/or terms of sale or may be able to provide products that more readily meet customer requirements or consumer preferences. Our inability to successfully compete against our competitors could adversely affect our business, results of operations and financial condition.
Our business, results of operations and financial condition may be adversely affected if we are unable to hire and retain sufficient qualified personnel.
Our success depends, to a substantial extent, on the ability, experience and performance of our senior management. In order to hire and retain qualified personnel, including our senior management team, we seek to provide competitive compensation programs. Our inability to retain our senior management team, or our inability to attract and retain qualified replacement personnel, may adversely affect us. We also regularly hire a large number of seasonal employees. Any difficulty we may encounter in hiring seasonal employees may result in significant increases in labor costs, which may have an adverse effect on our business, results of operations and financial condition.
Employee benefit costs may adversely affect our business, results of operations and financial condition.
We seek to provide competitive employee benefit programs to our employees. Employee benefit costs, such as healthcare costs for our eligible and participating employees, may increase significantly at a rate that is difficult to forecast, in part because of the current and/or future impact of federal healthcare legislation on our employer-sponsored medical plans. Higher employee benefit costs could have an adverse effect on our business, results of operations and financial condition.
Our acquisition strategy involves risks, and difficulties in integrating potential acquisitions may adversely affect our business, results of operations and financial condition.
We regularly evaluate potential acquisition opportunities to support, strengthen and grow our business. In fiscal 2018, we completed the acquisition of substantially all of the business and net assets of Simplicity. In fiscal 2017, we completed the acquisitions of substantially all of the businesses and net assets of McCall and Schiff and in fiscal 2016, we completed the acquisition of substantially all of the business and net assets of Blumenthal. We cannot be sure that we will be able to locate suitable acquisition candidates, acquire possible acquisition candidates, acquire such candidates on commercially reasonable terms, or integrate acquired businesses successfully. Future acquisitions may require us to incur debt and contingent liabilities, which may adversely affect our business, results of operations and financial condition. The process of integrating acquired businesses into our existing operations may result in operating, contract and supply chain difficulties, such as the failure to retain customers or management personnel. Also, prior to our completion of any acquisition, we could fail to discover liabilities of the acquired business for which we may be responsible as a successor owner or operator in spite of any investigation we may make prior to the acquisition. Such difficulties may divert significant financial, operational and managerial resources from our existing operations, and make it more difficult to achieve our operating and strategic objectives. The diversion of management attention, particularly in a difficult operating environment, may adversely affect our business, results of operations and financial condition.
Our strategy to continuously review the efficiency, productivity and competitiveness of our business may result in our decision to divest or close selected operations. Any divesture or closure involves risks, and decisions to divest or close selected operations may adversely affect our business, results of operations and financial condition.
We regularly evaluate the efficiency, productivity and competitiveness of our business, including our competitiveness within our product categories. As part of such review, we also regularly evaluate the efficiency and productivity of our production and distribution facilities. If we decide to divest a portion of our business, we cannot be sure that we will be able to locate suitable buyers or that we will be able to complete such divestiture successfully, timely or on commercially reasonable terms. If we decide to close a portion of our business, we cannot be sure of the effect such closure would have on the productivity or effectiveness of the remaining portions of our business, including our ongoing relationships with suppliers and customers, or of the expected success, timing or costs relating to such closure. Activities associated with any divestiture or closure may divert significant financial, operational and managerial resources from our existing operations,
7
and make it more difficult to achieve our operating and strategic objectives. Accordingly, future decisions to divest or close any portion of our business may adversely affect our business, results of operations and financial condition.
Our inability to protect our intellectual property rights, or infringement claims asserted against us by others, may adversely affect our business, results of operations and financial condition.
We have a number of copyrights, patents, tradenames, trademarks and intellectual property licenses which are used in connection with our products. While our operations are not dependent upon any individual copyright, patent, tradename, trademark or intellectual property license, we believe that the collective value of our intellectual property is substantial. We rely upon copyright, patent, tradename and trademark laws in the United States and other jurisdictions and on confidentiality agreements with some of our employees and others to protect our proprietary rights. If our proprietary rights were infringed, our business could be adversely affected. In addition, our activities could infringe upon the proprietary rights of others, who could assert infringement claims against us. We could face costly litigation to defend these claims. If we are unsuccessful in defending such claims, our business, results of operations and financial condition could be adversely affected.
We seek to register certain of our copyrights, patents, tradenames and trademarks in the United States and elsewhere. These registrations could be challenged by others or invalidated through administrative process or litigation. In addition, our confidentiality agreements with some employees or others may not provide adequate protection in the event of unauthorized use or disclosure of our proprietary information, or if our proprietary information otherwise becomes known, or is independently developed by competitors.
We are subject to cyber security risks and may incur increasing costs in efforts to minimize those risks and to comply with regulatory standards.
We use information technologies to securely manage operations and various business functions. We rely on various technologies to process, store and report on our business and interact with customers, vendors and employees. The secure processing, maintenance and transmission of this information is critical to our operations and business strategy. Despite our efforts, and those of our third party vendors, to develop and maintain security systems to protect this information, the security of our computer networks could be compromised through circumstances beyond our control, including systems failures, viruses, security breaches or cyber incidents such as intentional cyber attacks aimed at theft of sensitive data, or inadvertent cyber-security compromises. Such events could impact operations and confidential information could be misappropriated, which could lead to negative publicity, loss of sales and profits or cause us to incur significant costs to reimburse third-parties for damages which could adversely impact profits. As a result, our business, results of operations and financial condition could be adversely affected.
Various laws and governmental regulations applicable to a manufacturer or distributor of consumer products may adversely affect our business, results of operations and financial condition.
Our business is subject to numerous federal, state, provincial, local and foreign laws and regulations, including laws and regulations with respect to labor and employment, product safety, including regulations enforced by the United States Consumer Products Safety Commission, import and export activities, the Internet and e-commerce, antitrust issues, taxes, chemical usage, air emissions, wastewater and storm water discharges and the generation, handling, storage, transportation, treatment and disposal of waste materials, including hazardous materials. Although we believe that we are in substantial compliance with all applicable laws and regulations, because legal requirements frequently change and are subject to interpretation, we are unable to predict the ultimate cost of compliance or the consequences of non-compliance with these requirements, or the affect on our operations, any of which may be significant. If we fail to comply with applicable laws and regulations, we may be subject to criminal sanctions or civil remedies, including fines, injunctions, or prohibitions on importing or exporting. A failure to comply with applicable laws and regulations, or concerns about product safety, also may lead to a recall or post-manufacture repair of selected products, resulting in the rejection of our products by our customers and consumers, lost sales, increased customer service and support costs, and costly litigation. There is risk that any claims or liabilities, including product liability claims, relating to such noncompliance may exceed, or fall outside the scope of, our insurance coverage. Further, a failure to comply with applicable laws and regulations with respect to the Internet and e-commerce activities (which cover issues relating to user privacy, data protection, copyrights and consumer protection), such as the European Union’s General Data Protection Regulation (GDPR), may subject us to significant liabilities. GDPR is a comprehensive European Union privacy and data protection reform effective in 2018. GDPR applies to companies that are organized in the European Union (or otherwise provide services to consumers who reside in the European Union), imposes strict standards regarding the sharing, storage, use, disclosure and protection of end user data and significant penalties (monetary and otherwise) for non-compliance. Any failure to comply with GDPR, or other regulatory standards, could subject us to legal and reputational risks. Misuse of or failure to secure personal information could also result in violation of data privacy laws and regulations, proceedings against the Company by governmental entities or others, damage to our reputation
8
and credibility, and as a result, our business, results of operations and financial condition could be adversely affected. We cannot be certain that existing laws or regulations, as currently interpreted or reinterpreted in the future, or future laws or regulations, will not have an adverse effect on our business, results of operations and financial condition.
Unanticipated changes to our income tax liabilities may adversely affect our business, results of operations and financial condition.
As a corporation operating in various international jurisdictions, our business is subject to a wide variety of laws, regulations and policies, including, but not limited to, those of the United States, Canada, the United Kingdom, Australia, Hong Kong, China and India. There can be no assurance that laws, regulations and policies will not be changed in ways that will impact our income tax provision or our income tax assets and liabilities. We are also subject to income tax audits in the United States and foreign jurisdictions in which we operate. The tax laws to which we are subject are inherently complex and ambiguous, and we must interpret the applicable laws and make subjective judgments about both the expected outcome upon challenge by the applicable taxing authorities and our global provision for income taxes and other tax liabilities. Although we believe that our tax estimates are reasonable, there is risk that the final determination of tax audits or tax disputes will be different from what is reflected in our historical income tax provisions and accruals. Tax authorities in the various jurisdictions in which we have a presence and conduct business may disagree with our tax positions and assess additional taxes.
Additionally, our effective tax rate in the future could be adversely affected by changes to our operating structure, changes in the mix of earnings in countries with differing statutory tax rates, changes in the valuation of deferred tax assets and liabilities, changes in tax laws, and the discovery of new information in the course of our tax return preparation process. The carrying value of deferred tax assets, which are predominantly in the United States, is dependent on our ability to generate future taxable income in the United States. Increases in our income tax liabilities or risks related to the realization of our deferred tax assets as a result of any of the foregoing could adversely affect our business, results of operations and financial condition.
Further, as a company based in the United States but doing business in international markets through subsidiaries, we are subject to intercompany pricing rules in the jurisdictions where we operate. Tax rates vary from country to country, and if regulators determine that our profits in one jurisdiction should be increased, we may not be able to fully offset the adjustment in the other jurisdictions, which would increase our effective tax rate. Additionally, the Organization for Economic Cooperation and Development (“OECD”) has adopted guidelines regarding base erosion and profit shifting. As a result of the adoption of these guidelines by the OECD, individual taxing jurisdictions have also adopted some form of these guidelines as well. As such, we may need to change our approach to intercompany transfer pricing in order to maintain compliance under the new rules. Our effective tax rate may increase or decrease depending on the current location of global operations at the time of the change. An increase in our effective tax rate may adversely affect our business, results of operations and financial condition.
Further, in December 2017, the Tax Cuts and Jobs Act (the “Tax Act”) was enacted. The Tax Act revises the U.S. corporate income tax by, among other things, lowering the corporate income tax rate from 35% to 21%, adopting a quasi-territorial income tax system and imposing a one-time transition tax on foreign unremitted earnings, and setting limitations on deductibility of certain costs (e.g., interest expense).
The lower U.S. corporate income tax rate became effective January 1, 2018; however, our U.S. deferred tax assets and liabilities were adjusted in the third quarter of fiscal 2018 when the new tax law was enacted. Additionally, as part of the transition to the new quasi-territorial tax system, the Tax Act imposes a one-time tax on deemed repatriation of foreign subsidiaries’ earnings, which the Company recorded in the third quarter of fiscal 2018.
Due to the complexities involved in the accounting for the Tax Act, on December 22, 2017, the Securities and Exchange Commission’s Staff Accounting Bulletin (“SAB”) 118 was issued to provide guidance to companies that have not yet completed their accounting for the Tax Act in the period of enactment. SAB 118 requires us to include in our financial statements a reasonable estimate of the impact of the Tax Act on earnings to the extent such estimate has been determined. Accordingly, our U.S. provision for income tax for fiscal 2018 is based on the reasonable estimate guidance provided by SAB 118. We are continuing to assess the impact from the Tax Act and will record adjustments in fiscal 2019. The final impact on the Company from the Tax Act’s transition tax legislation may differ from the reasonable estimate due to the complexity of calculating and supporting with primary evidence such U.S. tax attributes as accumulated foreign earnings and profits, foreign tax paid, and other tax components involved in foreign tax credit calculations for prior years back to 1986. Such differences could be material, due to, among other things, changes in interpretations of the Tax Act, future legislative action to address questions that arise because of the Tax Act, changes in accounting standards for income taxes or related interpretations in
9
response to the Tax Act, or any updates or changes to estimates we have utilized to calculate the transition tax’s reasonable estimate. Such differences could have a material adverse effect upon our results of operations.
Our business, results of operations and financial condition may be adversely affected by national or global changes in economic or political conditions.
Our business, results of operations and financial condition may be adversely affected by national or global changes in economic or political conditions, including foreign currency fluctuations and fluctuations in inflation and interest rates, a national or international economic downturn, any future terrorist attacks, acts of war, threats of war, civil unrest, and the national and global military, diplomatic and financial exposure to such attacks or other threats.
We are subject to a number of restrictive covenants under our borrowing arrangement, including customary operating restrictions and customary financial covenants. Our business, results of operations and financial condition may be adversely affected if we are unable to maintain compliance with such covenants.
Our borrowing arrangement contains a number of restrictive covenants, including customary operating restrictions that limit our ability to engage in activities such as incurring additional debt, making investments, granting liens on our assets, making capital expenditures, paying dividends and making other distributions on our capital stock, and engaging in mergers, acquisitions, asset sales and repurchases of our capital stock. Under such arrangements, we are also subject to customary financial covenants, including covenants requiring us to maintain our capital expenditures below a maximum permitted amount each year and to keep our tangible net worth and our interest coverage ratio at or above certain minimum levels. Compliance with the financial covenants contained in our borrowing arrangements is based on financial measures derived from our operating results.
If our business, results of operations or financial condition is adversely affected by one or more of the risk factors described above, or other factors described in this annual report on Form 10-K or elsewhere in our filings with the SEC, we may be unable to maintain compliance with these covenants. If we fail to comply with such covenants, our lenders under our borrowing arrangements could stop advancing funds to us under these arrangements and/or demand immediate payment of amounts outstanding under such arrangements. Under such circumstances, we may need to seek alternate financing sources to fund our ongoing operations and to repay amounts outstanding and satisfy our other obligations under our existing borrowing arrangements. Such financing may not be available on favorable terms, if at all. Consequently, we may be restricted in how we fund ongoing operations and strategic initiatives and deploy capital, and in our ability to make acquisitions and to pay dividends. As a result, our business, results of operations and financial condition may be further adversely affected if we are unable to maintain compliance with the covenants under our borrowing arrangements.
If our business, results of operations or financial condition is adversely affected as a result of any of the risk factors described above or elsewhere in this annual report on Form 10-K or our other SEC filings, we may be required to incur financial statement charges, such as asset or goodwill impairment charges, which may, in turn, have a further adverse effect on our results of operations and financial condition.
In the fourth quarter of fiscal 2018, we recorded a non-cash pre-tax impairment charge of $33,358,000 due to a full impairment of goodwill and partial impairment of a tradename. If our business, results of operations or financial condition are adversely affected by one or more circumstances, such as any one or more of the risk factors above or other factors described in this annual report on Form 10-K and elsewhere in our SEC filings, we then may be required under applicable accounting rules to incur additional charges associated with reducing the carrying value on our financial statements of certain assets, such as goodwill, intangible assets or tangible assets.
Goodwill is subject to an assessment for impairment which must be performed at least annually, or more frequently if events or circumstances indicate that goodwill might be impaired. We perform our required annual assessment as of our fiscal year end. Effective April 1, 2017, the Company early adopted Accounting Standards Update 2017-04, "Simplifying the Test for Goodwill Impairment" ("ASU 2017-04"), which replaced the two-step impairment test for goodwill with a one-step test that both identifies and measures goodwill impairment. Under ASU 2017-04, entities still have the option to assess qualitative factors to determine whether the existence of events or circumstances leads to a determination that it is more likely than not that the fair value of a reporting unit is less than its carrying amount. If, after assessing the totality of events or circumstances, an entity determines it is not more likely than not that the fair value of a reporting unit is less than its carrying amount, then the quantitative goodwill impairment test is not necessary. However, if an entity concludes otherwise, then it is required to perform the quantitative goodwill impairment test, which identifies both the existence of impairment and the amount of impairment loss by comparing the fair value of the reporting unit with its carrying value. If the carrying amount of the reporting unit exceeds the fair value, an impairment loss shall be recognized in an amount equal to that excess. Additionally, an entity shall consider the income tax effect from any tax deductible goodwill on the carrying value of the reporting unit when measuring the
10
impairment loss. Additionally, the Company uses quoted market prices in active markets as the basis for measurement of fair value with consideration given to a control premium. We believe the use of multiple valuation techniques results in a more accurate indicator of the fair value of the reporting unit. If the fair value of the goodwill is less than the carrying amount of the goodwill, an impairment loss will be reported.
Other indefinite lived intangible assets, such as our tradenames, also are required to be tested annually for impairment. Authoritative guidance gives an entity the option to first assess qualitative factors to determine whether it is more likely than not that an indefinite-lived intangible asset is impaired. To perform a qualitative assessment, an entity must identify and evaluate changes in economic, industry and entity-specific events and circumstances that could affect the significant inputs used to determine the fair value of an indefinite-lived intangible asset. If the result of the qualitative analysis indicates it is more likely than not that an indefinite-lived intangible asset is impaired, a more detailed fair value calculation will need to be performed which is used to identify potential impairments and to measure the amount of impairment losses to be recognized, if any. We calculate the fair value of our tradenames using a “relief from royalty payments” methodology. We also review long-lived assets, except for goodwill and indefinite lived intangible assets, for impairment when circumstances indicate the carrying value of an asset may not be recoverable. If such assets are considered to be impaired, we will recognize, for impairment purposes, an amount by which the carrying amount of the assets exceeds the fair value of the assets.
If we are required to incur any of the foregoing financial charges, our results of operations and financial condition may be further adversely affected.
Item 1B. Unresolved Staff Comments.
None.
11
Item 2. Properties.
The following table sets forth the location and approximate square footage of the Company’s manufacturing and distribution facilities:
Use | Approximate Square Feet | |||||||
Owned | Leased | |||||||
U.S. Properties: | ||||||||
Florence, Alabama | Distribution | — | 100,000 | |||||
Florence, Alabama | Distribution | — | 180,000 | |||||
Shorewood, Illinois | Distribution | — | 493,000 | |||||
Manhattan, Kansas | Manufacturing and distribution | 282,000 | — | |||||
Hagerstown, Maryland | Manufacturing and distribution | 284,000 | — | |||||
Milford, New Hampshire | Manufacturing | — | 58,000 | |||||
Danville, Pennsylvania | Distribution | 133,000 | — | |||||
Berwick, Pennsylvania | Manufacturing and distribution | 213,000 | — | |||||
Berwick, Pennsylvania | Manufacturing and distribution | 220,000 | — | |||||
Berwick, Pennsylvania | Distribution | 226,000 | — | |||||
Berwick, Pennsylvania | Distribution | — | 431,000 | |||||
Newville, Pennsylvania | Distribution | — | 137,000 | |||||
Batesburg, South Carolina | Manufacturing | 229,000 | — | |||||
Total U.S. Properties | 1,587,000 | 1,399,000 | ||||||
International Properties: | ||||||||
Bankstown, Australia | Distribution | — | 17,000 | |||||
Revesby, Australia | Distribution | — | 22,000 | |||||
Coimbatore, India | Manufacturing and distribution | 100,000 | — | |||||
Coimbatore, India | Manufacturing | — | 31,000 | |||||
Hampshire, United Kingdom | Distribution | 58,000 | — | |||||
Stockport, United Kingdom | Distribution | — | 20,000 | |||||
Total International Properties | 158,000 | 90,000 | ||||||
Total Properties | 1,745,000 | 1,489,000 | ||||||
In addition to the above facilities, the Company also utilizes owned and leased space aggregating approximately 255,000 square feet for various marketing and administrative purposes in the United States. Additionally, the Company utilizes approximately 9,000 square feet as an office and showroom in Hong Kong and approximately 5,000 square feet as an office in China. The headquarters and principal executive office of the Company are located in Plymouth Meeting, Pennsylvania.
Item 3. Legal Proceedings.
CSS and its subsidiaries are involved in ordinary, routine legal proceedings that are not considered by management to be material. In the opinion of Company counsel and management, the ultimate liabilities resulting from such legal proceedings will not materially affect the consolidated financial position of the Company or its results of operations or cash flows.
Item 4. Mine Safety Disclosures.
Not applicable.
12
PART II
Item 5. Market for Registrant’s Common Equity, Related Stockholder Matters and Issuer Purchases of Equity Securities.
The common stock of the Company is listed for trading on the New York Stock Exchange. The following table sets forth the high and low sales prices per share of that stock, and the dividends declared per share, for each of the quarters during fiscal 2018 and fiscal 2017.
Fiscal 2018 | Dividends Declared | ||||||||||
High | Low | ||||||||||
First Quarter | $ | 27.77 | $ | 24.60 | $ | 0.20 | |||||
Second Quarter | 28.97 | 26.02 | 0.20 | ||||||||
Third Quarter | 30.13 | 26.54 | 0.20 | ||||||||
Fourth Quarter | 28.20 | 17.50 | 0.20 | ||||||||
Fiscal 2017 | Dividends Declared | ||||||||||
High | Low | ||||||||||
First Quarter | $ | 28.45 | $ | 26.06 | $ | 0.20 | |||||
Second Quarter | 28.49 | 24.85 | 0.20 | ||||||||
Third Quarter | 28.97 | 24.35 | 0.20 | ||||||||
Fourth Quarter | 28.71 | 23.48 | 0.20 | ||||||||
At June 1, 2018, there were approximately 3,950 holders of the Company’s common stock and there were no shares of preferred stock outstanding.
The ability of the Company to pay any cash dividends on its common stock is dependent on the Company’s earnings and cash requirements and is further limited by maintaining compliance with financial covenants contained in the Company’s credit facilities. The Company anticipates that quarterly cash dividends will continue to be paid in the future.
13
Performance Graph
The graph below compares the cumulative total stockholders’ return on the Company’s common stock for the period from April 1, 2013 through March 31, 2018, with (i) the cumulative total return on the Standard and Poors 500 (“S&P 500”) Index and (ii) two peer groups, as described below (assuming the investment of $100 in our common stock, the S&P 500 Index, and the peer group on April 1, 2013 and reinvestment of all dividends).
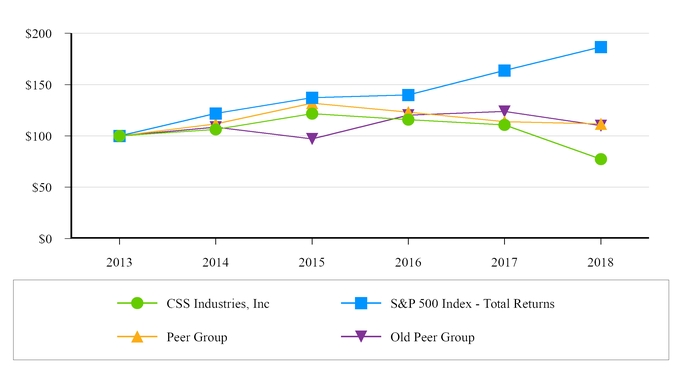
The peer group utilized consists of Bassett Furniture Industries, Incorporated, Flexsteel Industries, Inc., Hamilton Beach Brands Holding Company, JAKKS Pacific, Inc., Libbey Inc., Lifetime Brands, Inc., Nautilus, Inc., Perry Ellis International, Inc., Unifi, Inc., Vera Bradley, Inc. and ZAGG Inc (the "Peer Group"). The Peer Group selected by the Company was revised this year to include companies in the peer group that we use for executive compensation purposes. It includes consumer durables companies headquartered in North America with similar revenues and business operations. The Peer Group previously used by the Company, which consisted of Ennis, Inc., JAKKS Pacific, Inc. and Lifetime Brands, Inc. (the "Old Peer Group"), is shown in the chart above for comparative purposes.
14
Item 6. Selected Financial Data.
Years Ended March 31, | |||||||||||||||||||
2018 (a) | 2017 (b) | 2016 | 2015 | 2014 | |||||||||||||||
(in thousands, except per share amounts) | |||||||||||||||||||
Statement of Operations Data: | |||||||||||||||||||
Net sales | $ | 361,896 | $ | 322,431 | $ | 317,017 | $ | 313,044 | $ | 320,459 | |||||||||
Income (loss) from continuing operations before income taxes | (46,059 | ) | 29,687 | 26,641 | 26,641 | 27,700 | |||||||||||||
Income (loss) from continuing operations | (36,520 | ) | 28,504 | 17,236 | 16,954 | 18,564 | |||||||||||||
Income from discontinued operations, net of tax | — | — | — | — | 205 | ||||||||||||||
Net income (loss) | (36,520 | ) | 28,504 | 17,236 | 16,954 | 18,769 | |||||||||||||
Net income (loss) per common share: | |||||||||||||||||||
Basic: | |||||||||||||||||||
Continuing operations | $ | (4.01 | ) | $ | 3.14 | $ | 1.88 | $ | 1.82 | $ | 1.98 | ||||||||
Discontinued operations | $ | — | $ | — | $ | — | $ | — | $ | 0.02 | |||||||||
Total | $ | (4.01 | ) | $ | 3.14 | $ | 1.88 | $ | 1.82 | $ | 2.00 | ||||||||
Diluted: | |||||||||||||||||||
Continuing operations | $ | (4.01 | ) | $ | 3.13 | $ | 1.87 | $ | 1.80 | $ | 1.97 | ||||||||
Discontinued operations | $ | — | $ | — | $ | — | $ | — | $ | 0.02 | |||||||||
Total | $ | (4.01 | ) | $ | 3.13 | $ | 1.87 | $ | 1.80 | $ | 1.99 | ||||||||
Balance Sheet Data: | |||||||||||||||||||
Working capital | $ | 176,701 | $ | 196,106 | $ | 176,886 | $ | 190,047 | $ | 183,395 | |||||||||
Total assets | 365,188 | 339,194 | 309,926 | 309,473 | 293,535 | ||||||||||||||
Current portion of long-term debt | 228 | 220 | — | — | — | ||||||||||||||
Long-term debt, net of current portion | 40,228 | 456 | — | — | — | ||||||||||||||
Stockholders’ equity | 253,695 | 294,154 | 271,490 | 270,255 | 257,216 | ||||||||||||||
Cash dividends declared per common share | $ | 0.80 | $ | 0.80 | $ | 0.74 | $ | 0.63 | $ | 0.60 | |||||||||
(a) | In the fourth quarter of fiscal 2018, the Company recorded a non-cash pre-tax impairment charge of $33,358,000 due to a full impairment of goodwill and partial impairment of a tradename. The foregoing impairment charge was partially offset by a $6,233,000 tax benefit. |
(b) | In fiscal 2017, the Company recorded a non-taxable bargain purchase gain of $19,990,000 related to the acquisition of substantially all of the net assets and business of McCall on December 13, 2016 and the acquisition of all of the assets of Schiff on July 8, 2016. These acquisitions were accounted for using the acquisition method and resulted in a bargain purchase due to the fair value of the net assets acquired of approximately $35,029,000 exceeding the amount paid of $15,039,000. See Note 2 to the consolidated financial statements for additional information. |
15
Item 7. Management’s Discussion and Analysis of Financial Condition and Results of Operations.
Overview
The overall objective of the Company is to grow profitable sales and improve return on invested capital ("ROIC") through five strategic pillars. These strategic pillars include:
*Defend the base business - Design, product innovation, category leadership
* | Identify adjacent product categories with a focus on brands - Focus on fragmented markets, brands, omni-channel |
*Build an omni-channel business model - Dedicated resources, leverage technology
* | Improve ROIC by maximizing margins while minimizing capital investment - Fix underperforming product lines, focus on working capital |
*Build a collaborative, dynamic One CSS culture - Communication, accountability, talent infusion
Approximately 66% of the Company’s sales are attributable to products within both our gift category (previously described by the Company as its celebrations category) and craft category, with the remainder attributable to products in the seasonal category. The seasonal product category is defined as products designed, produced and sold to mass market retailers for holidays and seasonal events, including Christmas, Valentine’s Day, Easter and back-to-school. Production forecasts for these products are known well in advance of shipment. The gift product category is defined as products primarily designed to celebrate certain life events or special occasions such as weddings, birthdays, anniversaries, graduations, or the birth of a child. Gift products are primarily sold into mass and specialty retailers, floral and packaging wholesalers and distributors, and are generally ordered on a replenishment basis throughout the year. The craft product category reflects products used for craft activities and includes ribbons, trims, buttons, sewing patterns, knitting needles, needle arts and kids crafts. Craft products are sold to mass market and specialty retailers and are generally ordered on a replenishment basis throughout the year.
The Company has relatively high market share in many products across its categories. Most of these markets have shown little growth and in some cases have declined in recent years. The Company continues to confront significant price pressure as its competitors source certain products from overseas and its customers increase direct sourcing from overseas factories. Increasing customer concentration has augmented customers' bargaining power, which has also contributed to price pressure. In recent fiscal years, the Company has experienced lower sales in certain Christmas product lines, craft ribbon product lines and in our non-retail packaging and floral product lines due to factors such as continued price pressure, inventory destocking, as well as a decline in retail traffic.
The Company has taken several measures to respond to sales volume, cost and price pressures. The Company believes it continues to have strong core product offerings which have allowed it to compete effectively in this competitive market. In addition, the Company is pursuing new product initiatives related to seasonal, gift and craft products, including new licensed and non-licensed product offerings. CSS continually invests in product and packaging design and product knowledge to assure that it can continue to provide unique added value to its customers. In addition, CSS maintains purchasing offices in Hong Kong and China to be able to provide foreign-sourced products at competitive prices. CSS continually evaluates the efficiency and productivity of its production and distribution facilities and of its back office operations to maintain its competitiveness.
Our domestically-manufactured decorative plastic ribbon product lines have experienced price pressure and reduced sales volume due to competition from low-priced imports from China. In December 2017, our Berwick Offray company filed trade remedy petitions with the U.S. International Trade Commission (“ITC”) and the U.S. Department of Commerce (“Commerce Department”) asserting that the competing Chinese products are being imported at less-than-fair-value and that they benefit from unfair governmental subsidies. In the petitions, Berwick Offray requested the imposition of trade remedies in the form of antidumping and countervailing duties on decorative plastic ribbon from China. We expect that the proceedings before the ITC and Commerce Department will conclude by not later than January 2019. If the petition is successful, duties potentially may be imposed on import shipments arriving in the U.S. beginning anywhere from June 2018 to July 2018. The potential impact of these proceedings is not determinable at this time.
The seasonal nature of CSS’ business has historically resulted in lower sales levels and operating losses in the first and fourth quarters and comparatively higher sales levels and operating profits in the second and third quarters of the Company’s fiscal year, which ends March 31, thereby causing significant fluctuations in the quarterly results of operations of the Company.
16
The Company will continue to build on existing relationships with seasonal, gift and craft customers by expanding and diversifying its product lines and thereby growing its presence in the largest retailers in North America. This includes both capitalizing on opportunities for organic growth in existing businesses as well as acquiring companies which fit into appropriate acquisition parameters. We actively meet with seasonal, gift and craft companies to review and assess potential acquisition targets. Historically, significant revenue growth at CSS has come through acquisitions. Management anticipates that it will continue to consider acquisitions as a strategy to stimulate growth.
On November 3, 2017, the Company completed the acquisition of substantially all of the net assets and business of Simplicity Creative Group from Wilton for a total consideration of $69,617,000 and transaction costs of approximately $3,411,000. Simplicity is a leading provider of home sewing patterns, decorative trims, knitting and crocheting tools, needle arts and kids' crafts products under the Simplicity®, Wrights®, Boye®, Dimensions®, and Perler® brand names. Simplicity's products are sold to mass-market retailers, specialty fabric and craft chains, wholesale distributors and online customers. The Company primarily financed the acquisition with borrowings of $60,000,000 under its revolving credit facility and has recorded a working capital adjustment due to Wilton of $2,500,000, which is recorded in other current liabilities in the accompanying consolidated balance sheet and was paid on April 4, 2018. A portion of the purchase price is being held in escrow for certain post closing adjustments and indemnification obligations. The acquisition was accounted for using the acquisition method and the excess of cost over the fair market value of the net tangible and identifiable intangible assets acquired of $9,642,000 was recorded as goodwill. This goodwill was subsequently written off as a result of the Company’s annual impairment testing performed in the fourth quarter of fiscal 2018 as further described in Note 3 to the consolidated financial statements.
On December 13, 2016, the Company completed the acquisition of substantially all of the net assets and business of The McCall Pattern Company and certain subsidiaries for approximately $13,914,000 in cash plus transaction costs of approximately $1,484,000. McCall designs, manufactures, and sells home sewing patterns under the McCall’s®, Butterick®, Kwik Sew® and Vogue Patterns® brand names. McCall is a leading provider of home sewing patterns, selling to mass market retailers, specialty fabric and craft chains, and wholesale distributors. A portion of the purchase price is being held in escrow for certain post closing adjustments and indemnification obligations. The acquisition was accounted for using the acquisition method and resulted in a bargain purchase due to the fair value of the net assets acquired of approximately $33,528,000 exceeding the amount paid. In connection with this bargain purchase, the Company recorded a gain of approximately $19,614,000 in the consolidated statements of operations in the fiscal year ended March 31, 2017.
On July 8, 2016, a subsidiary of the Company completed the acquisition of substantially all of the assets of Schiff for $1,125,000 in cash. Schiff was a leading U.S. manufacturer and distributor of narrow woven ribbon prior to its April 2016 Chapter 11 bankruptcy filing. The acquisition was accounted for using the acquisition method and resulted in a bargain purchase due to the fair value of the net assets acquired of approximately $1,501,000 exceeding the amount paid. In connection with this bargain purchase, the Company recorded a gain of approximately $376,000 in the consolidated statements of operations in the fiscal year ended March 31, 2017.
On February 2, 2016, a subsidiary of the Company completed the acquisition of substantially all of the net assets and business of Blumenthal for approximately $19,626,000 in cash, including transaction costs of approximately $81,000. The Company also incurred costs of approximately $1,028,000 in fiscal 2016, primarily related to severance. Blumenthal was a leading provider of buttons to the sewing and craft markets in the United States, selling to mass market retailers and wholesale distributors that service independent retail stores. The acquisition was accounted for using the acquisition method, and $4,017,000, which is the excess of cost over fair value of the net tangible and identifiable intangible assets acquired, was recorded as goodwill. This goodwill was subsequently written off as a result of the Company’s annual impairment testing performed in fiscal 2018 as further described in Note 3 to the consolidated financial statements.
Litigation
CSS and its subsidiaries are involved in ordinary, routine legal proceedings that are not considered by management to be material. In the opinion of Company counsel and management, the ultimate liabilities resulting from such legal proceedings will not materially affect the consolidated financial position of the Company or its results of operations or cash flows.
Results of Operations
Fiscal 2018 Compared to Fiscal 2017
Consolidated net sales for fiscal 2018 increased to $361,896,000 from $322,431,000 in fiscal 2017. The increase in net sales was due to incremental sales of $35,581,000 related to the acquisition of Simplicity on November 3, 2017 and incremental sales of $20,174,000 related to the acquisition of McCall on December 13, 2016. There was a decline in seasonal sales of $11,558,000, consisting primarily of Christmas gift tags of $5,422,000, ribbons and bows of $2,186,000, school
17
products of $1,458,000, seasonal gift card holders of $1,052,000 and Valentines of $915,000. In our gift category, we had a sales decline of $2,969,000 in packaging and wholesale products, $2,810,000 in infant products and $1,342,000 in journals, which was partially offset by higher sales of gift card holders of $1,714,000, everyday ribbons, bags and bows of $1,335,000, and all occasion cards of $1,256,000. The remaining sales decline was primarily associated with lower craft sales of $1,925,000.
Cost of sales, as a percentage of net sales, increased to 74% in fiscal 2018 compared to 71% in fiscal 2017 due to the recognition of the incremental McCall and Simplicity inventory step-up through cost of sales of $13,337,000 and $4,544,000, respectively, in fiscal 2018 and $3,577,000 of incremental McCall inventory step-up through cost of sales in fiscal 2017, which relates to the portion of acquired inventory that was sold during the period. In connection with the acquisitions of McCall and Simplicity, the inventory acquired was marked up to estimated fair value and is being recognized through cost of sales as the inventory turns. Excluding the recognition of the McCall and Simplicity inventory step-up, cost of sales, as a percentage of net sales, was 69% in fiscal 2018 and 70% in fiscal 2017. The decrease in fiscal 2018 is attributable to higher margin mix of Simplicity and McCall products sold compared to the prior fiscal year.
Selling, general and administrative (“SG&A”) expenses, as a percentage of net sales, increased to 29% in fiscal 2018 compared to 26% in fiscal 2017 primarily due to incremental costs related to the acquired Simplicity business of $13,409,000 (which includes transaction costs of $3,411,000), incremental costs related to the acquired McCall business of $6,735,000 and higher payroll and employee expenses of $4,115,000, partially offset by lower commissions of $819,000, selling and marketing expenses of $773,000, professional fees of $718,000, and travel expenses of $305,000.
An impairment of goodwill and intangible assets of $33,358,000 was recorded in fiscal 2018 as a result of the full impairment of goodwill and partial impairment of a tradename. The impairment of goodwill was due to the decline in the Company's trading price of its common stock during the fourth quarter of fiscal 2018 and related decrease in the Company's market capitalization. See further discussion in Note 3 to the consolidated financial statements. There was no such impairment recorded in fiscal 2017.
Gain on bargain purchases of $19,990,000 in fiscal 2017 related to the acquisitions of McCall on December 13, 2016 and Schiff on July 8, 2016. These acquisitions were accounted for using the acquisition method and resulted in a bargain purchase due to the fair value of the net assets acquired of approximately $35,029,000 exceeding the amount paid of $15,039,000. There was no such gain recorded in fiscal 2018.
Interest expense, net for fiscal 2018 increased to $681,000 from $29,000 in fiscal 2017. The increase in interest expense was primarily due to the Company's borrowings under its revolving credit facility due to its acquisition of Simplicity on November 3, 2017, as well as lower average balances of funds invested in short-term investments compared to the prior year. The Company had no borrowings outstanding under its revolving credit facility during fiscal 2017.
Other income, net for fiscal 2018 increased to $352,000 from $12,000 in fiscal 2017 primarily due to incremental rental income associated with McCall properties acquired on December 13, 2016.
Income taxes, as a percentage of income (loss) before income taxes, were 21% in fiscal 2018 and 4% in 2017. The increase in income taxes, as a percentage of income (loss) before taxes, was primarily attributable to the non-taxable bargain purchase gain related to the McCall and Schiff acquisitions in the prior fiscal year, partially offset by the impact of the new U.S. tax legislation enacted on December 22, 2017, commonly referred to as the Tax Cuts and Jobs Act ("Tax Act").
The net loss for the fiscal year ended March 31, 2018 was $36,520,000, or $4.01 per diluted share compared to net income of $28,504,000, or $3.13 per diluted share in fiscal 2017.
Fiscal 2017 Compared to Fiscal 2016
Consolidated net sales for fiscal 2017 increased to $322,431,000 from $317,017,000 in fiscal 2016. The increase in net sales was substantially due to incremental sales of buttons of $11,609,000 related to the Blumenthal acquisition on February 2, 2016. Also contributing to the sales increase were sales of sewing patterns of $8,133,000 related to the McCall acquisition on December 13, 2016. There was a decline in sales of Christmas products, primarily cards of $5,895,000 and ribbons and bows of $2,173,000, which was offset by higher sales of $3,310,000 in Christmas gift wrap and gift bags. In our gift category, we had a decline of $3,643,000 in sales of packaging and floral supplies which was partially offset by higher sales of journals and stationery products of $1,497,000. The remaining sales decline was primarily associated with lower craft sales of $9,341,000, particularly craft ribbons and bows, which was partially attributable to shipping issues encountered in our warehouse consolidation project discussed further below.
Cost of sales, as a percentage of net sales, increased to 71% in fiscal 2017 compared to 68% in fiscal 2016 partially due to the recognition of the McCall inventory step-up through cost of sales in the amount of $3,577,000, which relates to the
18
portion of acquired inventory that was sold during the period. In connection with the acquisition of McCall, the inventory acquired was marked up to estimated fair value, which will be recognized through cost of sales as the inventory turns. Also contributing to the increase were higher distribution and freight costs of $3,015,000 related to costs and inefficiencies of two warehouse consolidation projects. The warehouse consolidation projects involved the closing of a distribution facility in El Paso, Texas in the fourth quarter of fiscal 2016 and the closing of a manufacturing and distribution facility in Lansing, Iowa, which was acquired as part of the Blumenthal acquisition, in the second quarter of fiscal 2017. The Company consolidated the distribution operations of the two closed facilities into the Company's existing distribution facilities in Florence, Alabama.
SG&A expenses, as a percentage of net sales, increased to 26% in fiscal 2017 compared to 24% in fiscal 2016 primarily due to incremental costs related to the McCall and Blumenthal acquisitions of $7,184,000 (of which $2,473,000 represents transaction and transition costs) and $1,225,000, respectively; higher recruiting and relocation costs of $517,000; higher legal fees of $506,000, partially relating to the Company's participation in "sunset" review proceedings conducted by the Commerce Department and the ITC in connection with the fifth anniversary of the initiation of trade remedies on certain imported narrow woven ribbon products, which proceedings concluded in the Company's favor in August 2016; higher professional fees of $384,000 primarily related to tax consulting services; and higher product development costs of $270,000. Partially offsetting these increases were lower payroll related expenses of $3,002,000.
Gain on bargain purchases of $19,990,000 in fiscal 2017 related to the acquisitions of McCall on December 13, 2016 and Schiff on July 8, 2016. These acquisitions were accounted for using the acquisition method and resulted in a bargain purchase due to the fair value of the net assets acquired of approximately $35,029,000 exceeding the amount paid of $15,039,000. There was no such gain recorded in fiscal 2016.
Interest expense, net was $29,000 in fiscal 2017 compared to interest income, net $112,000 in fiscal 2016. The change was primarily due to lower average balances of funds invested in short-term investments compared to the prior year.
Income taxes, as a percentage of income (loss) before income taxes, were 4% in fiscal 2017 and 35% in 2016. The decrease in income taxes, as a percentage of income (loss) before taxes, was primarily attributable to the non-taxable bargain purchase gain related to the McCall and Schiff acquisitions in the current fiscal year, representing an approximately 21% decrease in tax rate compared to the prior year. There was also a decrease of approximately 8% related to the permanent reinvestment of current year foreign earnings that will not be taxed in the United States.
Net income for the fiscal year ended March 31, 2017 was $28,504,000, or $3.13 per diluted share compared to $17,236,000, or $1.87 per diluted share in fiscal 2016.
Liquidity and Capital Resources
At March 31, 2018 and 2017, the Company had working capital of $176,701,000 and $196,106,000, respectively, and stockholders’ equity of $253,695,000 and $294,154,000, respectively. Operating activities provided net cash of $31,368,000 in fiscal 2018 compared to $14,871,000 in fiscal 2017 and $15,123,000 in fiscal 2016. Net cash provided by operating activities in fiscal 2018 reflects our working capital requirements which resulted in an increase in accounts receivable of $6,409,000, a decrease in inventory of $16,082,000 and an increase in accrued expenses and long-term obligations of $5,164,000. Included in the fiscal 2018 net loss were non-cash charges for impairment of $33,358,000 related to goodwill and an intangible asset, amortization of inventory step-up of $17,881,000, depreciation and amortization of $10,487,000, deferred tax benefit of $14,125,000, provision for accounts receivable allowances of $4,035,000 and share-based compensation of $1,938,000. Net cash provided by operating activities in fiscal 2017 reflects our working capital requirements which resulted in an increase in accounts receivable of $6,095,000, an increase in inventory of $3,607,000, a decrease in prepaid expenses and other assets of $2,506,000, a decrease in accounts payable of $1,153,000 and a decrease in accrued expenses and long-term obligations of $2,473,000. Included in fiscal 2017 net income was a non-cash gain on bargain purchases of $19,990,000 related to the acquisitions of McCall and Schiff on December 13, 2016 and July 8, 2016, respectively, and non-cash charges for depreciation and amortization of $8,477,000, provision for accounts receivable allowances of $5,188,000, amortization of inventory step-up of $3,577,000, share-based compensation of $1,653,000 and a deferred tax benefit of $1,608,000. Net cash provided by operating activities in fiscal 2016 reflects our working capital requirements which resulted in an increase in accounts receivable of $4,268,000, an increase in inventory of $4,674,000, an increase in other assets of $4,627,000 and a decrease in accrued expenses and long-term obligations of $3,176,000. Included in fiscal 2016 net income were non-cash charges for depreciation and amortization of $8,308,000, provision for accounts receivable allowances of $2,712,000, a deferred tax provision of $1,868,000 and share-based compensation of $1,654,000.
Net cash used for our investing activities was $53,233,000 in fiscal 2018, consisting primarily of the purchase of businesses of $65,228,000, capital expenditures of $7,291,000 and the purchase of a company-owned life insurance policy of $750,000, partially offset by maturities of investment securities of $20,000,000. Net cash provided by our investing activities was $20,287,000 in fiscal 2017, consisting primarily of maturities of investment securities of $60,000,000, partially offset by
19
the purchase of held-to-maturity investment securities of $19,928,000, purchase of businesses of $15,039,000 and capital expenditures of $4,957,000. In fiscal 2016, our investing activities consisted primarily of the purchase of held-to-maturity investment securities of $84,632,000, purchase of businesses of $19,545,000 and capital expenditures of $6,411,000, partially offset by maturities of investment securities of $95,000,000 and proceeds from sale of assets of $1,530,000.
Net cash provided by our financing activities was $32,688,000 in fiscal 2018, consisting primarily of net borrowings under our revolving credit facility of $40,000,000, partially offset by payments of cash dividends of $7,293,000. Net cash used for financing activities in in fiscal 2017 consisted primarily of payments of cash dividends of $7,273,000. In fiscal 2016, our financing activities consisted primarily of purchases of treasury stock of $11,274,000 and payments of cash dividends of $6,764,000.
On March 4, 2016, the Company agreed to purchase, under its stock repurchase program, 45,000 shares of its common stock from a charitable foundation of which the Company's former Chairman of the Board, who retired as a director and officer of the Company on July 28, 2015, is a founder, director and officer. The purchase price was lower than the closing market price on the preceding trading day. The transaction was approved by the Company's Board of Directors on March 4, 2016 and completed on March 8, 2016. The total amount of this transaction was $1,274,000.
Under a stock repurchase program authorized by the Company’s Board of Directors, the Company repurchased 397,789 shares (inclusive of the 45,000 shares described above) of the Company’s common stock for $11,274,000 (inclusive of the $1,274,000 described above) in fiscal 2016. There were no repurchases of the Company's common stock by the Company during fiscal 2018 and 2017. As of March 31, 2018, the Company had 303,166 shares remaining available for repurchase under the Board’s authorization.
The Company relies primarily on cash on hand, cash generated from its operations and, if needed, seasonal borrowings under its revolving credit facility to meet its liquidity requirements throughout the year. Historically, a significant portion of the Company’s revenues have been seasonal, primarily Christmas related, with approximately 64% of sales recognized in the second and third quarters. As payment for sales of Christmas related products is usually not received until just before or just after the holiday selling season in accordance with general industry practice, working capital has historically increased in the second and third quarters, peaking prior to Christmas and dropping thereafter. Seasonal financing requirements are available under a revolving credit facility with two banks. Reflecting the seasonality of the Company’s business, the maximum credit available at any one time under the credit facility (“Commitment Level”) adjusts to $50,000,000 from February to June (“Low Commitment Period”), $100,000,000 from July to October (“Medium Commitment Period”) and $150,000,000 from November to January (“High Commitment Period”) in each respective year over the term of the facility. The Company has the option to increase the Commitment Level during part of any Low Commitment Period from $50,000,000 to an amount not less than $62,500,000 and not in excess of $125,000,000; provided, however, that the Commitment Level must remain at $50,000,000 for at least three consecutive months during each Low Commitment Period. The Company has the option to increase the Commitment Level during all or part of any Medium Commitment Period from $100,000,000 to an amount not in excess $125,000,000. Fifteen days prior written notice is required for the Company to exercise an option to increase the Commitment Level with respect to a particular Low Commitment Period or Medium Commitment Period. The Company may exercise an option to increase the Commitment Level no more than three times each calendar year. This financing facility is available to fund the Company’s seasonal borrowing needs and to provide the Company with sources of capital for general corporate purposes, including acquisitions as permitted under the revolving credit facility. This facility is due to expire on March 16, 2020. For information concerning this credit facility, see Note 8 to the consolidated financial statements. At March 31, 2018, there was $40,000,000 outstanding under the Company’s revolving credit facility. The Company had approximately $262,000 of other debt outstanding and approximately $194,000 of capital leases outstanding at March 31, 2018.
Based on its current operating plan, the Company believes its sources of available capital are adequate to meet its ongoing cash needs for at least the next 12 months.
20
As of March 31, 2018, the Company’s contractual obligations and commitments are as follows (in thousands):
Contractual Obligations | Less than 1 Year | 1-3 Years | 4-5 Years | After 5 Years | Total | ||||||||||||||
Note payable to seller | $ | 2,500 | $ | — | $ | — | $ | — | $ | 2,500 | |||||||||
Long-term debt (1) | 1,195 | 42,170 | 1,888 | — | 45,253 | ||||||||||||||
Capital lease obligations | 82 | 124 | 1 | — | 207 | ||||||||||||||
Operating leases | 8,975 | 12,711 | 8,301 | 14,105 | 44,092 | ||||||||||||||
Other long-term obligations (2) | 251 | 1,222 | 470 | 3,543 | 5,486 | ||||||||||||||
Royalty obligations (3) | 1,561 | 1,925 | — | — | 3,486 | ||||||||||||||
$ | 14,564 | $ | 58,152 | $ | 10,660 | $ | 17,648 | $ | 101,024 | ||||||||||
(1) | Long-term debt includes interest payments on outstanding borrowings of $40,000,000 which the Company intends to maintain outstanding through the term of an interest rate swap agreement which expires February 1, 2023. Such interest is calculated at the swap interest rate of 2.575% through February 1, 2023. Also includes interest related to an equipment financing agreement at a rate of 5.72%. |
(2) | Other long-term obligations consist primarily of postretirement medical liabilities, deferred compensation arrangements and pension obligations. Future timing of payments for other long-term obligations is estimated by management. |
(3) | The Company is committed to pay guaranteed minimum royalties attributable to sales of certain intellectual property licensed products. |
The above table excludes any potential uncertain income tax liabilities that may become payable upon examination of the Company’s income tax returns by taxing authorities. Such amounts and periods of payment cannot be reliably estimated. See Note 7 to the consolidated financial statements for further explanation of the Company’s uncertain tax positions.
As of March 31, 2018, the Company’s other commitments are as follows (in thousands):
Less than 1 Year | 1-3 Years | 4-5 Years | After 5 Years | Total | |||||||||||||||
Letters of credit | $ | 1,853 | $ | — | $ | — | $ | — | $ | 1,853 | |||||||||
The Company has a reimbursement obligation with respect to stand-by letters of credit that guarantee the funding of workers’ compensation claims and a lease security deposit. The Company has no financial guarantees or other similar arrangements with any third parties or related parties other than its subsidiaries.
In the ordinary course of business, the Company enters into arrangements with vendors to purchase merchandise in advance of expected delivery. These purchase orders do not contain any significant termination payments or other penalties if canceled.
Critical Accounting Policies
In preparing our consolidated financial statements, management is required to make estimates and assumptions that, among other things, affect the reported amounts of assets, liabilities, revenue and expenses. These estimates and assumptions are most significant where they involve levels of subjectivity and judgment necessary to account for highly uncertain matters or matters susceptible to change, and where they can have a material impact on our financial condition and operating performance. Below are the most significant estimates and related assumptions used in the preparation of our consolidated financial statements. If actual results were to differ materially from the estimates made, the reported results could be materially affected.
Revenue
Revenue is recognized from most product sales when goods are shipped, title and risk of loss have been transferred to the customer and collection is reasonably assured. The Company has certain limited products, primarily sewing patterns, that are on consignment at mass market retailers and the Company recognizes the sale as products are sold to end consumers at point-of-sale terminals. The Company records estimated reductions to revenue for customer programs, which may include special pricing agreements for specific customers, volume incentives and other promotions. In limited cases, the Company may provide the right to return product as part of its customer programs with certain customers. The Company also records
21
estimated reductions to revenue, based primarily on historical experience, for customer returns and chargebacks that may arise as a result of shipping errors, product damaged in transit or for other reasons that become known subsequent to recognizing the revenue. These provisions are recorded in the period that the related sale is recognized and are reflected as a reduction from gross sales. The related reserves are shown as a reduction of accounts receivable, except for reserves for customer programs which are shown as a current or long term liability. If the amount of actual customer returns and chargebacks were to increase or decrease significantly from the estimated amount, revisions to the estimated allowance would be required.
Accounts Receivable
The Company offers seasonal dating programs related to certain seasonal product offerings pursuant to which customers that qualify for such programs are offered extended payment terms. While some customers are granted return rights as part of their sales program, customers generally do not have the right to return product except for reasons the Company believes are typical of our industry, including damaged goods, shipping errors or similar occurrences. The Company is generally not required to repurchase products from its customers, nor does the Company have any regular practice of doing so. In addition, the Company endeavors to mitigate its exposure to bad debts by evaluating the creditworthiness of its major customers utilizing established credit limits and purchasing credit insurance when warranted in management’s judgment and available on terms that management deems satisfactory. Bad debt and returns and allowances reserves are recorded as an offset to accounts receivable while reserves for customer programs are recorded as accrued liabilities. The Company evaluates accounts receivable related reserves and accruals monthly by specifically reviewing customers’ creditworthiness, historical recovery percentages and outstanding customer deductions and program arrangements. Customer account balances are charged off against the allowance reserve after reasonable means of collection have been exhausted and the potential for recovery is considered unlikely.
Inventory Valuation
Inventories are valued at the lower of cost or net realizable value. Cost is primarily determined by the first-in, first-out method although certain inventories are valued based on the last-in, first-out method. The Company writes down its inventory for estimated obsolescence in an amount equal to the difference between the cost of the inventory and the estimated net realizable value based upon assumptions about future demand, market conditions, customer planograms and sales forecasts. Additional inventory write downs could result from unanticipated additional carryover of finished goods and raw materials, or from lower proceeds offered by parties in our traditional closeout channels. In connection with the acquisition of McCall on December 13, 2016 and the acquisition of Simplicity on November 3, 2017, there was a step-up to fair value of the inventory acquired of $21,773,000 and $10,214,000, respectively, recorded at the applicable dates of acquisition. This was a result of the inventory acquired being marked up to estimated net selling price in purchase accounting, and is recognized through cost of sales as the inventory turns. The amount of step-up to fair value of the acquired inventory remaining as of March 31, 2018 and 2017 was $10,683,000 and $18,187,000. The Company expects the acquired McCall inventory to be sold through the second quarter of fiscal 2019 and the acquired Simplicity inventory to be sold through the first quarter of fiscal 2020. See Note 2 to the consolidated financial statements for further discussion of the McCall and Simplicity acquisitions.
Goodwill, Other Intangibles and Long-Lived Assets
When a company is acquired, the difference between the fair value of its net assets, including intangibles, and the purchase price is recorded as goodwill. Goodwill is subject to an assessment for impairment which must be performed at least annually or more frequently if events or circumstances indicate that goodwill might be impaired. Effective April 1, 2017, the Company early adopted Accounting Standards Update 2017-04, "Simplifying the Test for Goodwill Impairment," ("ASU 2017-04"), which replaced the two-step impairment test for goodwill with a one-step test that both identifies and measures goodwill impairment. Under ASU 2017-04, entities still have the option to assess qualitative factors to determine whether the existence of events or circumstances leads to a determination that it is more likely than not that the fair value of a reporting unit is less than its carrying amount. If, after assessing the totality of events or circumstances, an entity determines it is not more likely than not that the fair value of a reporting unit is less than its carrying amount, then the quantitative goodwill impairment test is not necessary. However, if an entity concludes otherwise, then it is required to perform the quantitative goodwill impairment test, which identifies both the existence of impairment and the amount of impairment loss by comparing the fair value of the reporting unit with its carrying value. If the carrying amount of the reporting unit exceeds the fair value, an impairment loss shall be recognized in an amount equal to that excess. Additionally, an entity shall consider the income tax effect from any tax deductible goodwill on the carrying value of the reporting unit when measuring the impairment loss. The Company uses a dual approach including both a market approach and an income approach. The market approach computes fair value using a multiple of earnings before interest, income taxes, depreciation and amortization which was developed considering both the multiples of recent transactions as well as trading multiples of consumer products companies. The income approach is based on the present value of discounted cash flows and a terminal value projected for the reporting unit. The
22
income approach requires significant judgments including the Company’s projected net cash flows, the weighted average cost of capital (“WACC”) used to discount the cash flows and terminal value assumptions. The projected net cash flows are derived using the next fiscal year budget and multi-year strategic plan of the Company for the reporting unit. The WACC rate is based on an average of the capital structure, cost of capital and inherent business risk profiles of the Company. Additionally, the Company uses quoted market prices in active markets as the basis for measurement of fair value with consideration given to a control premium. We believe the use of multiple valuation techniques results in a more accurate indicator of the fair value of each reporting unit.
The Company then corroborates the reasonableness of the total fair value of the reporting units by reconciling the aggregate fair values of the reporting units to the Company’s total market capitalization adjusted to include an estimated control premium. The estimated control premium is derived from reviewing observable transactions involving the purchase of controlling interests in comparable companies. The market capitalization is calculated using the relevant shares outstanding and an average closing stock price which considers volatility around the test date. The exercise of reconciling the market capitalization to the computed fair value further supports the Company’s conclusion on the fair value. If the carrying amount of the reporting unit exceeds its fair value, an impairment loss would be reported. The Company performs its required annual assessment as of the fiscal year end. Changes to our judgments regarding assumptions and estimates could result in a significantly different estimate of the fair market value of the reporting units.
Effective April 1, 2017, the Company combined its four former operating segments, which represented our one historical reportable segment, into one operating segment which reflects the manner in which our chief operating decision maker reviews operating performance and allocates resources. This was a result of the change in the Company's strategy to a One CSS structure and reflects how the businesses are now managed and operating results are assessed. Effective with the change from four operating segments and reporting units to one, the Company evaluated whether there was an impairment as of April 1, 2017 and concluded that there was no impairment based on the assessment that was performed as of March 31, 2017 which was reconciled to the Company’s market capitalization as of March 31, 2017.
Other indefinite lived intangible assets consist primarily of tradenames, which are also required to be tested annually for impairment. An entity has the option to first assess qualitative factors to determine whether it is more likely than not that an indefinite-lived intangible asset is impaired. To perform a qualitative assessment, an entity must identify and evaluate changes in economic, industry and entity-specific events and circumstances that could affect the significant inputs used to determine the fair value of an indefinite-lived intangible asset. If the result of the qualitative analysis indicates it is more likely than not that an indefinite-lived intangible asset is impaired, a more detailed fair value calculation will need to be performed which is used to identify potential impairments and to measure the amount of impairment losses to be recognized, if any. The fair value of the Company’s tradenames is calculated using a “relief from royalty payments” methodology. This approach involves first estimating reasonable royalty rates for each trademark then applying these royalty rates to a net sales stream and discounting the resulting cash flows to determine the fair value. The royalty rate is estimated using both a market and income approach. The market approach relies on the existence of identifiable transactions in the marketplace involving the licensing of tradenames similar to those owned by the Company. The income approach uses a projected pretax profitability rate relevant to the licensed income stream. We believe the use of multiple valuation techniques results in a more accurate indicator of the fair value of each tradename. This fair value is then compared with the carrying value of each tradename.
Long-lived assets (including property, plant and equipment), except for goodwill and indefinite lived intangible assets, are reviewed for impairment when circumstances indicate the carrying value of an asset group may not be recoverable. Recoverability of assets to be held and used is measured by a comparison of the carrying amount of the asset group to future net cash flows estimated by the Company to be generated by such assets. If such asset group is considered to be impaired, the impairment to be recognized is the amount by which the carrying amount of the asset group exceeds the fair value of the asset group. Assets to be disposed of are recorded at the lower of their carrying value or estimated net realizable value.
In the fourth quarter of fiscal 2018, the Company recorded a non-cash pre-tax impairment charge of $33,358,000 due to the full impairment of goodwill and partial impairment of a tradename. See Note 3 to the consolidated financial statements for further discussion.
Accounting for Income Taxes
As part of the process of preparing our consolidated financial statements, we are required to estimate our actual current tax expense or benefit (state, federal and foreign), including the impact of permanent and temporary differences resulting from differing bases and treatment of items for tax and accounting purposes, such as the carrying value of intangibles, deductibility of expenses, depreciation of property, plant and equipment, and valuation of inventories. Temporary differences and operating loss and credit carryforwards result in deferred tax assets and liabilities, which are included within the Company's consolidated balance sheets. We must then assess the likelihood that our deferred tax assets will be recovered from
23
future taxable income. Actual results could differ from this assessment if sufficient taxable income is not generated in future periods. To the extent we determine the need to establish a valuation allowance or increase (decrease) such allowance in a period, the Company would record additional tax expense (benefit) in the accompanying consolidated statements of operations. The management of the Company periodically estimates the probable tax obligations of the Company using historical experience in tax jurisdictions and informed judgments. There are inherent uncertainties related to the interpretation of tax regulations. The judgments and estimates made at a point in time may change based on the outcome of tax audits, as well as changes to or further interpretations of regulations. If such changes take place, there is a risk that the tax rate may increase or decrease in any period.
New tax legislation in the U.S., commonly referred to as the Tax Act, was enacted on December 22, 2017. Accounting Standards Codification 740, "Accounting for Income Taxes," requires companies to recognize the effect of tax law changes in the period of enactment even though the effective date for most provisions is for tax years beginning after December 31, 2017, or in the case of certain other provisions, January 1, 2018. Though certain key aspects of the new law are effective January 1, 2018 and have an immediate accounting effect, other significant provisions are not effective or may not result in accounting effects for the Company until April 1, 2018.
Given the significance of the legislation, the Securities and Exchange Commission staff issued Staff Accounting Bulletin 118, "Income Tax Accounting Implications of the Tax Cuts and Jobs Act" ("SAB 118"), which allows registrants to record provisional amounts during a one year “measurement period” similar to that used when accounting for business combinations. However, the measurement period is deemed to have ended earlier when the registrant has obtained, prepared and analyzed the information necessary to finalize its accounting. During the measurement period, impacts of the law are expected to be recorded at the time a reasonable estimate for all or a portion of the effects can be made, and provisional amounts can be recognized and adjusted as information becomes available, prepared or analyzed.
The Company has estimated the impact of the Tax Act incorporating assumptions made based upon our current interpretations of its provisions. We have recognized the tax impacts related to deemed repatriated earnings (provisional) and revaluation of our deferred tax assets and liabilities, and included those amounts in our consolidated financial statements for fiscal 2018. The actual impact of the Tax Act may differ from the Company's estimates due to, among other things, further refinement of our calculations, changes in interpretations and assumptions we have made, guidance that may be issued and actions we may take as a result of the Tax Act. The Company expects the accounting to be completed within the one year measurement period, as allowed under SAB 118. In addition, we also expect to adopt a policy to record any tax liability associated with the Global Intangible Low-Taxed Income (“GILTI”) provision of the Tax Act as either a period cost or a deferred tax item within the one year measurement period, as allowed under SAB 118.
Accounting Pronouncements
See Note 13 to the consolidated financial statements for information concerning recent accounting pronouncements and the impact of those standards.
Forward-Looking and Cautionary Statements
This report includes “forward-looking statements” within the meaning of the Private Securities Litigation Reform Act of 1995, including statements regarding: future organic growth; future growth through acquisitions; new product initiatives; the Company's future ability to provide unique added value to its customers; the period of time over which inventory acquired as part of the Simplicity and McCall acquisitions will be sold; the future continuation of quarterly cash dividend payments; the expected future impact of legal proceedings; the expected future impact of foreign currency exchange rate fluctuations; the timing and amount of future expense recognition for amortization expense and unrecognized compensation expense; the timing and amount of future lease payments, pension payments and other contractual obligations and commitments; the expected future effect of certain accounting pronouncements; and the Company’s belief that its sources of available capital are adequate to meet its future cash needs for at least the next 12 months.
Forward-looking statements are based on the beliefs of the Company’s management as well as assumptions made by and information currently available to the Company’s management as to future events and financial performance with respect to the Company’s operations. Forward-looking statements speak only as of the date made. The Company undertakes no obligation to update any forward-looking statements to reflect the events or circumstances arising after the date as of which they were made. Actual events or results may differ materially from those discussed in forward-looking statements as a result of various factors, including, without limitation: general market and economic conditions; increased competition (including competition from foreign products which may be imported at less than fair value and from foreign products which may benefit from foreign governmental subsidies); difficulties achieving organic growth; information technology risks, such as cyber attacks and data breaches; increased operating costs, including labor-related and energy costs and costs relating to the
24
imposition or retrospective application of duties on imported products; currency risks and other risks associated with international markets; risks associated with acquisitions, including difficulties identifying and evaluating suitable acquisition opportunities, realization of intangible assets and recoverability of long-lived assets, acquisition integration costs, and the risk that the Company may not be able to integrate and derive the expected benefits from acquisitions; risks associated with the combination of the facilities and/or operations of the Company's operating businesses; the risk that customers may become insolvent, may delay payments or may impose deductions or penalties on amounts owed to the Company; costs of compliance with governmental regulations and government investigations; liability associated with non-compliance with governmental regulations, including regulations pertaining to the environment, federal and state employment laws, and import and export controls, customs laws and consumer product safety regulations; and other factors described more fully elsewhere in this annual report on Form 10-K and in the Company’s previous filings with the Securities and Exchange Commission. As a result of these factors, readers are cautioned not to place undue reliance on any forward-looking statements included herein or that may be made elsewhere from time to time by, or on behalf of, the Company.
Item 7A. Quantitative and Qualitative Disclosures About Market Risk.
The Company’s activities expose it to a variety of market risks, including the effects of changes in interest rates and foreign currency exchange rates. These financial exposures are monitored and, where considered appropriate, managed by the Company as described below.
Interest Rate Risk
The Company’s primary market risk exposure with regard to financial instruments is to changes in interest rates. Pursuant to the Company’s variable rate line of credit in effect during fiscal 2018, a change in the London Interbank Offered Rate (LIBOR) would affect the rate at which the Company could borrow funds thereunder. Based on average borrowings of $21,526,000 for the year ended March 31, 2018, a 1% increase or decrease in current market interest rates would have increased or decreased interest expense by $215,260.
On February 1, 2018, the Company entered into an interest rate swap agreement with a term of five years to manage its exposure to interest rate movements by effectively converting a portion of its anticipated working capital debt from variable to fixed rates. The notional amount of the interest rate swap contract subject to fixed rates was $40,000,000 in fiscal 2018. Fixed interest rate payments were at a weighted average rate of 2.575% in fiscal 2018. Interest rate differentials paid under this agreement were recognized as adjustments to interest expense and were $60,000 for the year ended March 31, 2018. This interest rate swap effectively converts $40,000,000 of the Company's variable-rate debt into fixed-rate debt with an effective interest rate of 3.525% (2.575% fixed + .95% spread) through the expiration of the Company's credit facility in March 2020.
Foreign Currency Risk
Approximately 4% of the Company’s sales in fiscal 2018 were denominated in a foreign currency.
The Company considers its risk exposure with regard to foreign currency fluctuations insignificant for its subsidiaries in the United States as it enters into foreign currency forward contracts to hedge the majority of firmly committed transactions and related receivables that are denominated in a foreign currency. The Company has designated its foreign currency forward contracts as fair value hedges. The gains or losses on the fair value hedges are recognized in earnings and generally offset the transaction gains or losses on the foreign denominated assets of its domestic operations that they are intended to hedge.
The Company has wholly-owned subsidiaries in Hong Kong, the United Kingdom, Australia, New Zealand, India, China and Canada. The Company is subject to risk from changes in foreign exchange rates for its subsidiaries that use a foreign currency as their functional currency and are translated into U.S. dollars. These changes result in cumulative translation adjustments, which are included in accumulated other comprehensive income (loss). We currently do not transact a material amount of business in a foreign currency and therefore fluctuations in exchange rates will not have a material impact on our financial statements. However, if we pursue additional opportunities in international markets, our international presence could grow. If we enter into any material transactions in a foreign currency or establish or acquire additional subsidiaries that measure and record their financial condition and results of operation in a foreign currency, we will be exposed to currency transaction risk and/or currency translation risk. Changes in the various exchange rates against the U.S. dollar may positively or negatively affect our operating results. Accordingly, we may decide in the future to undertake hedging strategies to minimize the effect of currency fluctuations on our financial condition and results of operations.
25
Item 8. Financial Statements and Supplementary Data.
CSS INDUSTRIES, INC. AND SUBSIDIARIES
INDEX
Page | |
Financial Statement Schedule: | |
26
Report of Independent Registered Public Accounting Firm
To the Stockholders and Board of Directors
CSS Industries, Inc.:
Opinion on the Consolidated Financial Statements
We have audited the accompanying consolidated balance sheets of CSS Industries, Inc. and subsidiaries (the Company) as of March 31, 2018 and 2017, the related consolidated statements of operations and comprehensive income (loss), cash flows and stockholders’ equity for each of the years in the three‑year period ended March 31, 2018, and the related notes and financial statement schedule II - valuation and qualifying accounts (collectively, the consolidated financial statements). In our opinion, the consolidated financial statements present fairly, in all material respects, the financial position of the Company as of March 31, 2018 and 2017, and the results of its operations and its cash flows for each of the years in the three‑year period ended March 31, 2018, in conformity with U.S. generally accepted accounting principles.
We also have audited, in accordance with the standards of the Public Company Accounting Oversight Board (United States) (PCAOB), the Company’s internal control over financial reporting as of March 31, 2018, based on criteria established in Internal Control - Integrated Framework (2013) issued by the Committee of Sponsoring Organizations of the Treadway Commission, and our report dated June 4, 2018 expressed an unqualified opinion on the effectiveness of the Company’s internal control over financial reporting.
Basis for Opinion
These consolidated financial statements are the responsibility of the Company’s management. Our responsibility is to express an opinion on these consolidated financial statements based on our audits. We are a public accounting firm registered with the PCAOB and are required to be independent with respect to the Company in accordance with the U.S. federal securities laws and the applicable rules and regulations of the Securities and Exchange Commission and the PCAOB.
We conducted our audits in accordance with the standards of the PCAOB. Those standards require that we plan and perform the audit to obtain reasonable assurance about whether the consolidated financial statements are free of material misstatement, whether due to error or fraud. Our audits included performing procedures to assess the risks of material misstatement of the consolidated financial statements, whether due to error or fraud, and performing procedures that respond to those risks. Such procedures included examining, on a test basis, evidence regarding the amounts and disclosures in the consolidated financial statements. Our audits also included evaluating the accounting principles used and significant estimates made by management, as well as evaluating the overall presentation of the consolidated financial statements. We believe that our audits provide a reasonable basis for our opinion.
/s/ KPMG LLP
We have served as the Company’s auditor since 2002.
Philadelphia, PA
June 4, 2018
27
CSS INDUSTRIES, INC. AND SUBSIDIARIES
CONSOLIDATED BALANCE SHEETS
(in thousands, except share and per share amounts)
March 31, | |||||||
2018 | 2017 | ||||||
ASSETS | |||||||
Current assets: | |||||||
Cash and cash equivalents | $ | 58,560 | $ | 47,693 | |||
Short-term investments | — | 19,931 | |||||
Accounts receivable, net of allowances of $1,576 and $1,283 | 63,083 | 48,814 | |||||
Inventories | 102,436 | 105,258 | |||||
Prepaid expenses and other current assets | 11,962 | 10,793 | |||||
Total current assets | 236,041 | 232,489 | |||||
Net property, plant and equipment | 52,126 | 35,764 | |||||
Deferred income taxes | 10,439 | — | |||||
Goodwill | — | 19,916 | |||||
Intangible assets, net of accumulated amortization of $21,960 and $17,928 | 57,029 | 43,879 | |||||
Other assets | 9,553 | 7,146 | |||||
Total assets | $ | 365,188 | $ | 339,194 | |||
LIABILITIES AND STOCKHOLDERS’ EQUITY | |||||||
Current liabilities: | |||||||
Current portion of long-term debt | $ | 228 | $ | 220 | |||
Accounts payable | 20,581 | 14,223 | |||||
Accrued payroll and other compensation | 11,496 | 7,884 | |||||
Accrued customer programs | 12,284 | 5,030 | |||||
Accrued other expenses | 14,751 | 9,026 | |||||
Total current liabilities | 59,340 | 36,383 | |||||
Long-term debt, net of current portion | 40,228 | 456 | |||||
Deferred income taxes | 1,639 | 4,430 | |||||
Other long-term obligations | 10,286 | 3,771 | |||||
Total liabilities | 111,493 | 45,040 | |||||
Commitments and contingencies (Notes 9 and 11) | |||||||
Stockholders’ equity: | |||||||
Preferred stock, Class 2, $.01 par, 1,000,000 shares authorized, no shares issued | — | — | |||||
Common stock, $.10 par, 25,000,000 shares authorized, 14,703,084 shares issued at March 31, 2018 and 2017 | 1,470 | 1,470 | |||||
Additional paid-in capital | 58,877 | 57,997 | |||||
Retained earnings | 339,088 | 382,807 | |||||
Accumulated other comprehensive income (loss), net of tax | 1,163 | (63 | ) | ||||
Common stock in treasury, 5,583,338 and 5,616,319 shares, at cost | (146,903 | ) | (148,057 | ) | |||
Total stockholders’ equity | 253,695 | 294,154 | |||||
Total liabilities and stockholders’ equity | $ | 365,188 | $ | 339,194 | |||
See accompanying notes to consolidated financial statements.
28
CSS INDUSTRIES, INC. AND SUBSIDIARIES
CONSOLIDATED STATEMENTS OF OPERATIONS
AND COMPREHENSIVE INCOME (LOSS)
(in thousands, except per share amounts)
For the Years Ended March 31, | |||||||||||
2018 | 2017 | 2016 | |||||||||
Net sales | $ | 361,896 | $ | 322,431 | $ | 317,017 | |||||
Cost of sales | 269,067 | 229,342 | 214,746 | ||||||||
Gross profit | 92,829 | 93,089 | 102,271 | ||||||||
Selling, general and administrative expenses | 105,201 | 83,375 | 76,047 | ||||||||
Impairment of goodwill and intangible assets | 33,358 | — | — | ||||||||
Operating income (loss) | (45,730 | ) | 9,714 | 26,224 | |||||||
Gain on bargain purchases | — | (19,990 | ) | — | |||||||
Interest expense (income), net | 681 | 29 | (112 | ) | |||||||
Other expense (income), net | (352 | ) | (12 | ) | (305 | ) | |||||
Income (loss) before income taxes | (46,059 | ) | 29,687 | 26,641 | |||||||
Income tax expense (benefit) | (9,539 | ) | 1,183 | 9,405 | |||||||
Net income (loss) | $ | (36,520 | ) | $ | 28,504 | $ | 17,236 | ||||
Net income (loss) per common share: | |||||||||||
Basic | $ | (4.01 | ) | $ | 3.14 | $ | 1.88 | ||||
Diluted | $ | (4.01 | ) | $ | 3.13 | $ | 1.87 | ||||
Weighted average shares outstanding: | |||||||||||
Basic | 9,108 | 9,074 | 9,147 | ||||||||
Diluted | 9,108 | 9,115 | 9,239 | ||||||||
Net income (loss) | $ | (36,520 | ) | $ | 28,504 | $ | 17,236 | ||||
Other comprehensive income (loss), net of tax: | |||||||||||
Currency translation adjustments | 943 | 45 | — | ||||||||
Pension and postretirement benefits | 367 | (46 | ) | 29 | |||||||
Fair value of interest rate swap agreements | (84 | ) | — | — | |||||||
Other comprehensive income (loss) | 1,226 | (1 | ) | 29 | |||||||
Comprehensive income (loss) | $ | (35,294 | ) | $ | 28,503 | $ | 17,265 | ||||
See accompanying notes to consolidated financial statements.
29
CSS INDUSTRIES, INC. AND SUBSIDIARIES
CONSOLIDATED STATEMENTS OF CASH FLOWS
(in thousands)
For the Years Ended March 31, | |||||||||||
2018 | 2017 | 2016 | |||||||||
Cash flows from operating activities: | |||||||||||
Net income (loss) | $ | (36,520 | ) | $ | 28,504 | $ | 17,236 | ||||
Adjustments to reconcile net income (loss) to net cash provided by operating activities: | |||||||||||
Depreciation and amortization | 10,487 | 8,477 | 8,308 | ||||||||
Amortization of inventory step-up | 17,881 | 3,577 | — | ||||||||
Accretion of asset retirement obligation | 51 | — | — | ||||||||
Accretion of investment discount | (69 | ) | (196 | ) | (329 | ) | |||||
Impairment of goodwill and intangible assets | 33,358 | — | — | ||||||||
Provision for accounts receivable allowances | 4,035 | 5,188 | 2,712 | ||||||||
Deferred tax provision (benefit) | (14,125 | ) | (1,608 | ) | 1,868 | ||||||
Share-based compensation expense | 1,938 | 1,653 | 1,654 | ||||||||
Gain on bargain purchases | — | (19,990 | ) | — | |||||||
(Gain) loss on sale or disposal of assets | (12 | ) | 88 | (120 | ) | ||||||
Changes in assets and liabilities, net of effects of purchase of businesses: | |||||||||||
Accounts receivable | (6,409 | ) | (6,095 | ) | (4,268 | ) | |||||
Inventories | 16,082 | (3,607 | ) | (4,674 | ) | ||||||
Prepaid expenses and other assets | (273 | ) | 2,506 | (4,627 | ) | ||||||
Accounts payable | (220 | ) | (1,153 | ) | 539 | ||||||
Accrued expenses and long-term obligations | 5,164 | (2,473 | ) | (3,176 | ) | ||||||
Net cash provided by operating activities | 31,368 | 14,871 | 15,123 | ||||||||
Cash flows from investing activities: | |||||||||||
Maturities of investment securities | 20,000 | 60,000 | 95,000 | ||||||||
Purchase of held-to-maturity investment securities | — | (19,928 | ) | (84,632 | ) | ||||||
Purchase of businesses, net of cash received of $1,889 in 2018 | (65,228 | ) | (15,039 | ) | (19,545 | ) | |||||
Purchase of property, plant and equipment | (7,291 | ) | (4,957 | ) | (6,411 | ) | |||||
Purchase of company owned life insurance policy | (750 | ) | — | — | |||||||
Purchase of intangibles | — | (100 | ) | — | |||||||
Proceeds from sale of assets | 36 | 311 | 1,530 | ||||||||
Net cash (used for) provided by investing activities | (53,233 | ) | 20,287 | (14,058 | ) | ||||||
Cash flows from financing activities: | |||||||||||
Borrowings on revolving credit facility | 87,476 | — | — | ||||||||
Repayments on revolving credit facility | (47,476 | ) | — | — | |||||||
Payments on long-term debt | (220 | ) | (65 | ) | — | ||||||
Dividends paid | (7,293 | ) | (7,273 | ) | (6,764 | ) | |||||
Purchase of treasury stock | — | — | (11,274 | ) | |||||||
Proceeds from exercise of stock options | 201 | 123 | 770 | ||||||||
Payments for tax withholding on net restricted stock settlements | — | (527 | ) | (520 | ) | ||||||
Tax effect of stock awards | — | 286 | 221 | ||||||||
Net cash provided by (used for) financing activities | 32,688 | (7,456 | ) | (17,567 | ) | ||||||
Effect of exchange rate changes on cash | 44 | 64 | — | ||||||||
Net increase (decrease) in cash and cash equivalents | 10,867 | 27,766 | (16,502 | ) | |||||||
Cash and cash equivalents at beginning of period | 47,693 | 19,927 | 36,429 | ||||||||
Cash and cash equivalents at end of period | $ | 58,560 | $ | 47,693 | $ | 19,927 | |||||
See accompanying notes to consolidated financial statements.
30
CSS INDUSTRIES, INC. AND SUBSIDIARIES
CONSOLIDATED STATEMENTS OF STOCKHOLDERS’ EQUITY
(in thousands, except share and per share amounts)
Accumulated | |||||||||||||||||||||||||||||||||||
Additional | Other | Common Stock | |||||||||||||||||||||||||||||||||
Preferred Stock | Common Stock | Paid-in | Retained | Comprehensive | in Treasury | ||||||||||||||||||||||||||||||
Shares | Amount | Shares | Amount | Capital | Earnings | Income (Loss) | Shares | Amount | Total | ||||||||||||||||||||||||||
Balance, March 31, 2015 | — | — | 14,703,084 | $ | 1,470 | $ | 54,399 | $ | 356,467 | $ | (91 | ) | (5,359,334 | ) | $ | (141,990 | ) | $ | 270,255 | ||||||||||||||||
Share-based compensation expense | — | — | — | — | 1,654 | — | — | — | — | 1,654 | |||||||||||||||||||||||||
Issuance of common stock upon exercise of stock options | — | — | — | — | — | (895 | ) | — | 47,560 | 1,665 | 770 | ||||||||||||||||||||||||
Issuance of common stock under equity plan | — | — | — | — | — | (2,014 | ) | — | 38,744 | 1,494 | (520 | ) | |||||||||||||||||||||||
Purchase of treasury shares | — | — | — | — | — | — | — | (397,789 | ) | (11,274 | ) | (11,274 | ) | ||||||||||||||||||||||
Tax effect of stock awards | — | — | — | — | 221 | — | — | — | — | 221 | |||||||||||||||||||||||||
Reduction of deferred tax assets due to expired stock options | — | — | — | — | (117 | ) | — | — | — | — | (117 | ) | |||||||||||||||||||||||
Cash dividends ($.74 per common share) | — | — | — | — | — | (6,764 | ) | — | — | — | (6,764 | ) | |||||||||||||||||||||||
Other comprehensive income | — | — | — | — | — | — | 29 | — | — | 29 | |||||||||||||||||||||||||
Net income | — | — | — | — | — | 17,236 | — | — | — | 17,236 | |||||||||||||||||||||||||
Balance, March 31, 2016 | — | — | 14,703,084 | 1,470 | 56,157 | 364,030 | (62 | ) | (5,670,819 | ) | (150,105 | ) | 271,490 | ||||||||||||||||||||||
Share-based compensation expense | — | — | — | — | 1,653 | — | — | — | — | 1,653 | |||||||||||||||||||||||||
Issuance of common stock upon exercise of stock options | — | — | — | — | — | (373 | ) | — | 14,177 | 496 | 123 | ||||||||||||||||||||||||
Issuance of common stock under equity plan | — | — | — | — | — | (2,079 | ) | — | 40,323 | 1,552 | (527 | ) | |||||||||||||||||||||||
Tax effect of stock awards | — | — | — | — | 286 | — | — | — | — | 286 | |||||||||||||||||||||||||
Reduction of deferred tax assets due to expired stock options | — | — | — | — | (99 | ) | — | — | — | — | (99 | ) | |||||||||||||||||||||||
Cash dividends ($.80 per common share) | — | — | — | — | — | (7,275 | ) | — | — | — | (7,275 | ) | |||||||||||||||||||||||
Other comprehensive loss | — | — | — | — | — | — | (1 | ) | — | — | (1 | ) | |||||||||||||||||||||||
Net income | — | — | — | — | — | 28,504 | — | — | — | 28,504 | |||||||||||||||||||||||||
Balance, March 31, 2017 | — | — | 14,703,084 | 1,470 | 57,997 | 382,807 | (63 | ) | (5,616,319 | ) | (148,057 | ) | 294,154 | ||||||||||||||||||||||
Cumulative effect of change in accounting principle | — | — | — | — | (1,059 | ) | 1,059 | — | — | — | — | ||||||||||||||||||||||||
Share-based compensation expense | — | — | — | — | 1,939 | — | — | — | — | 1,939 | |||||||||||||||||||||||||
Issuance of common stock upon exercise of stock options | — | — | — | — | — | (346 | ) | — | 15,629 | 547 | 201 | ||||||||||||||||||||||||
Issuance of common stock under equity plan | — | — | — | — | — | (607 | ) | — | 17,352 | 607 | — | ||||||||||||||||||||||||
Cash dividends ($.80 per common share) | — | — | — | — | — | (7,305 | ) | — | — | — | (7,305 | ) | |||||||||||||||||||||||
Other comprehensive income | — | — | — | — | — | — | 1,226 | — | — | 1,226 | |||||||||||||||||||||||||
Net loss | — | — | — | — | — | (36,520 | ) | — | — | — | (36,520 | ) | |||||||||||||||||||||||
Balance, March 31, 2018 | — | — | 14,703,084 | $ | 1,470 | $ | 58,877 | $ | 339,088 | $ | 1,163 | (5,583,338 | ) | $ | (146,903 | ) | $ | 253,695 | |||||||||||||||||
See accompanying notes to consolidated financial statements.
31
CSS INDUSTRIES, INC. AND SUBSIDIARIES
NOTES TO CONSOLIDATED FINANCIAL STATEMENTS
MARCH 31, 2018
(1) SUMMARY OF SIGNIFICANT ACCOUNTING POLICIES
Basis of Presentation
CSS Industries, Inc. (collectively with its subsidiaries, “CSS” or the “Company”) has prepared the consolidated financial statements included herein pursuant to the rules and regulations of the Securities and Exchange Commission.
The Company’s fiscal year ends on March 31. References to a particular year refer to the fiscal year ending in March of that year. For example fiscal 2018 refers to the fiscal year ended March 31, 2018.
Principles of Consolidation
The consolidated financial statements include the accounts of CSS Industries, Inc. and all of its subsidiaries. All intercompany transactions and accounts have been eliminated in consolidation.
Nature of Business
CSS is a creative consumer products company, focused on the seasonal, gift and craft categories. For these design-driven categories, the Company engages in the creative development, manufacture, procurement, distribution and sale of our products with an omni-channel approach focused primarily on mass market retailers.
Seasonal The seasonal category includes gift packaging items such as ribbon, bows, greeting cards, wrapping paper, bags, boxes, tags and gift card holders, in addition to specific holiday-themed decorations, accessories, and activities, such as Easter egg dyes and novelties and Valentine's Day classroom exchange cards. These products are sold to mass market retailers, and production forecasts for these products are generally known well in advance of shipment.
Gift The gift category (formerly described by the Company as its celebrations category) includes products designed to celebrate certain life events or special occasions, such as weddings, birthdays, anniversaries, graduations, or the birth of a child. Products include ribbons and bows, floral accessories, infant products, journals, gift card holders, all occasion boxed greeting cards, memory books, scrapbooks, stationery, stickers and other items that commemorate life's celebrations. Products in this category are primarily sold into mass and specialty retailers, floral and packaging wholesalers and distributors, and are generally ordered on a replenishment basis throughout the year.
Craft The craft category includes ribbons, trims, buttons, sewing patterns, knitting needles, needle arts and kids crafts. These products are sold to mass market and specialty retailers, and are generally ordered on a replenishment basis throughout the year.
CSS’ product breadth provides its retail customers the opportunity to use a single vendor for much of their seasonal, gift and craft product requirements. A substantial portion of CSS’ products are manufactured, packaged and/or warehoused in facilities located in the United States, the United Kingdom and Australia, with the remainder purchased primarily from manufacturers in Asia and Mexico. The Company also has a manufacturing facility in India that produces certain craft products, including trims, braids and tassels, and also has a distribution facility in India. The Company’s products are sold to its customers by national and regional account sales managers, sales representatives, product specialists and by a network of independent manufacturers’ representatives. CSS maintains purchasing offices in Hong Kong and China to administer Asian sourcing opportunities.
As further discussed in Note 2 to the consolidated financial statements, the Company acquired substantially all of the net assets and business of Simplicity Creative Group ("Simplicity") on November 3, 2017.
Of its 2,000 employees (increasing to approximately 2,075 as seasonal employees are added), there are 80 employees that are represented by a labor union. The collective bargaining agreement with the labor union representing the production and maintenance employees in Hagerstown, Maryland remains in effect until December 31, 2020. Historically, we have been successful in renegotiating expiring agreements without any disruption of operating activities.
Foreign Currency Translation and Transactions
The Company's foreign subsidiaries use the local currency as the functional currency. The Company translates all assets and liabilities at year-end exchange rates and all income and expense accounts at average rates during the year. Translation adjustments are recorded in accumulated other comprehensive income (loss) in stockholders’ equity. Gains and
32
losses on foreign currency transactions (denominated in currencies other than the local currency) are not material and are included in other expense (income), net in the consolidated statements of operations.
Use of Estimates
The preparation of financial statements in conformity with accounting principles generally accepted in the United States requires management to make estimates and assumptions that affect the reported amounts of assets and liabilities and disclosure of contingent assets and liabilities at the date of the financial statements and the reported amounts of revenues and expenses during the reporting period. Judgments and assessments of uncertainties are required in applying the Company’s accounting policies in many areas. Such estimates pertain to revenue recognition, the valuation of inventory and accounts receivable, the assessment of the recoverability of goodwill and other intangible and long-lived assets, income tax accounting and resolution of litigation and other proceedings. Actual results could differ from these estimates.
Short-Term Investments
The Company categorized and accounted for its short-term investment holdings as held-to-maturity securities. Held-to-maturity securities were recorded at amortized cost which approximated fair market value at March 31, 2017. This categorization was based upon the Company's positive intent and ability to hold these securities until maturity. Short-term investments at March 31, 2017 consisted of commercial paper with an amortized cost of $19,931,000 and matured in fiscal 2018. There were no short-term investments at March 31, 2018.
Accounts Receivable
The Company offers seasonal dating programs related to certain seasonal product offerings pursuant to which customers that qualify for such programs are offered extended payment terms. With some exceptions, customers do not have the right to return product except for reasons the Company believes are typical of our industry, including damaged goods, shipping errors or similar occurrences. The Company generally is not required to repurchase products from its customers, nor does the Company have any regular practice of doing so. In addition, the Company mitigates its exposure to bad debts by evaluating the creditworthiness of its major customers, utilizing established credit limits, and purchasing credit insurance when appropriate and available on terms satisfactory to the Company. Bad debt and returns and allowances reserves are recorded as an offset to accounts receivable while reserves for customer programs are recorded as accrued liabilities. The Company evaluates accounts receivable related reserves and accruals monthly by specifically reviewing customers’ creditworthiness, historical recovery percentages and outstanding customer deductions and program arrangements. Customer account balances are charged off against the allowance reserve after reasonable means of collection have been exhausted and the potential for recovery is considered unlikely.
Inventories
The Company records inventory when title is transferred, which occurs upon receipt or prior to receipt dependent on supplier shipping terms. The Company adjusts unsaleable and slow-moving inventory to its estimated net realizable value. Substantially all of the Company’s inventories are stated at the lower of first-in, first-out (FIFO) cost or net realizable value. The remaining portion of the inventory is valued at the lower of last-in, first-out (LIFO) cost or net realizable value, which was $98,000 and $134,000 at March 31, 2018 and 2017, respectively. Had all inventories been valued at the lower of FIFO cost or market, inventories would have been greater by $524,000 and $578,000 at March 31, 2018 and 2017, respectively. Inventories consisted of the following (in thousands):
March 31, | |||||||
2018 | 2017 | ||||||
Raw material | $ | 11,602 | $ | 11,210 | |||
Work-in-process | 17,809 | 18,316 | |||||
Finished goods | 73,025 | 75,732 | |||||
$ | 102,436 | $ | 105,258 | ||||
Finished goods inventory includes $18,720,000 and $18,417,000 of inventory on consignment at March 31, 2018 and 2017, respectively. In connection with the acquisition of McCall on December 13, 2016 and the acquisition of Simplicity on November 3, 2017, there was a step-up to fair value of the inventory acquired of $21,773,000 and $10,214,000, respectively, recorded at the dates of acquisition. This was a result of the inventory acquired being marked up to estimated fair value in purchase accounting and is recognized through cost of sales as the inventory turns. The amount of step-up to fair value of the acquired inventory remaining as of March 31, 2018 and 2017 was $10,683,000 and $18,187,000, respectively. The Company
33
expects the acquired McCall inventory to be sold through the second quarter of fiscal 2019 and the acquired Simplicity inventory to be sold through the first quarter of fiscal 2020. See Note 2 to the consolidated financial statements for further discussion of the McCall and Simplicity acquisitions.
Property, Plant and Equipment
Property, plant and equipment are stated at cost and include the following (in thousands):
March 31, | |||||||
2018 | 2017 | ||||||
Land | $ | 7,100 | $ | 5,838 | |||
Buildings, leasehold interests and improvements | 45,164 | 40,661 | |||||
Machinery, equipment and other | 104,497 | 89,917 | |||||
156,761 | 136,416 | ||||||
Less – Accumulated depreciation and amortization | (104,635 | ) | (100,652 | ) | |||
Net property, plant and equipment | $ | 52,126 | $ | 35,764 | |||
Depreciation is provided generally on the straight-line method and is based on estimated useful lives or terms of leases as follows:
Buildings, leasehold interests and improvements | Lease term to 45 years | |||
Machinery, equipment and other | 3 to 15 years | |||
When property is retired or otherwise disposed of, the related cost and accumulated depreciation and amortization are eliminated from the consolidated balance sheet. Any gain or loss from the disposition of property, plant and equipment is included in other expense (income), net. Maintenance and repairs are expensed as incurred while improvements are capitalized and depreciated over their estimated useful lives.
With the acquisition of McCall, there were assets acquired under capital lease obligations. Depreciation expense was $6,455,000, $5,173,000 and $5,643,000 for the years ended March 31, 2018, 2017 and 2016, respectively.
The Company maintains various operating leases and records rent expense on a straight-line basis over the lease term. See Note 9 for further discussion.
Impairment of Long-Lived Assets including Goodwill, Other Intangible Assets and Property, Plant and Equipment
When a company is acquired, the difference between the fair value of its net assets, including intangibles, and the purchase price is recorded as goodwill. Goodwill is subject to an assessment for impairment which must be performed at least annually or more frequently if events or circumstances indicate that goodwill might be impaired. Effective April 1, 2017, the Company early adopted Accounting Standards Update 2017-04, "Simplifying the Test for Goodwill Impairment," ("ASU 2017-04"), which replaced the two-step impairment test for goodwill with a one-step test that both identifies and measures goodwill impairment. Under ASU 2017-04, entities still have the option to assess qualitative factors to determine whether the existence of events or circumstances leads to a determination that it is more likely than not that the fair value of a reporting unit is less than its carrying amount. If, after assessing the totality of events or circumstances, an entity determines it is not more likely than not that the fair value of a reporting unit is less than its carrying amount, then the quantitative goodwill impairment test is not necessary. However, if an entity concludes otherwise, then it is required to perform the quantitative goodwill impairment test, which identifies both the existence of impairment and the amount of impairment loss by comparing the fair value of the reporting unit with its carrying value. If the carrying amount of the reporting unit exceeds the fair value, an impairment loss shall be recognized in an amount equal to that excess. Additionally, an entity shall consider the income tax effect from any tax deductible goodwill on the carrying value of the reporting unit when measuring the impairment loss. The Company uses a dual approach including both a market approach and an income approach. The market approach computes fair value using a multiple of earnings before interest, income taxes, depreciation and amortization which was developed considering both the multiples of recent transactions as well as trading multiples of consumer products companies. The income approach is based on the present value of discounted cash flows and a terminal value projected for the reporting unit. The income approach requires significant judgments including the Company’s projected net cash flows, the weighted average cost of capital (“WACC”) used to discount the cash flows and terminal value assumptions. The projected net cash flows are derived using the next fiscal year budget and multi-year strategic plan of the Company for the reporting unit. The WACC rate is based on an average of the capital structure, cost of capital and inherent business risk profiles of the Company. Additionally, the
34
Company uses quoted market prices in active markets as the basis for measurement of fair value with consideration given to a control premium. We believe the use of multiple valuation techniques results in a more accurate indicator of the fair value of each reporting unit.
The Company then corroborates the reasonableness of the total fair value of the reporting units by reconciling the aggregate fair values of the reporting units to the Company’s total market capitalization adjusted to include an estimated control premium. The estimated control premium is derived from reviewing observable transactions involving the purchase of controlling interests in comparable companies. The market capitalization is calculated using the relevant shares outstanding and an average closing stock price which considers volatility around the test date. The exercise of reconciling the market capitalization to the computed fair value further supports the Company’s conclusion on the fair value. If the carrying amount of the reporting unit exceeds its fair value, an impairment loss would be reported. The Company performs its required annual assessment as of the fiscal year end. Changes to our judgments regarding assumptions and estimates could result in a significantly different estimate of the fair market value of the reporting units.
Effective April 1, 2017, the Company combined its four former operating segments, which represented our one historical reportable segment, into one operating segment which reflects the manner in which our chief operating decision maker reviews operating performance and allocates resources. This was a result of the change in the Company's strategy to a One CSS structure and reflects how the businesses are now managed and operating results are assessed. Effective with the change from four operating segments and reporting units to one, the Company evaluated whether there was an impairment as of April 1, 2017 and concluded that there was no impairment based on the assessment that was performed as of March 31, 2017 which was reconciled to the Company’s market capitalization as of March 31, 2017.
Other indefinite lived intangible assets consist primarily of tradenames which are also required to be tested annually for impairment. An entity has the option to first assess qualitative factors to determine whether it is more likely than not that an indefinite-lived intangible asset is impaired. To perform a qualitative assessment, an entity must identify and evaluate changes in economic, industry and entity-specific events and circumstances that could affect the significant inputs used to determine the fair value of an indefinite-lived intangible asset. If the result of the qualitative analysis indicates it is more likely than not that an indefinite-lived intangible asset is impaired, a more detailed fair value calculation will need to be performed which is used to identify potential impairments and to measure the amount of impairment losses to be recognized, if any. The fair value of the Company’s tradenames is calculated using a “relief from royalty payments” methodology. This approach involves first estimating reasonable royalty rates for each trademark then applying these royalty rates to a net sales stream and discounting the resulting cash flows to determine the fair value. The royalty rate is estimated using both a market and income approach. The market approach relies on the existence of identifiable transactions in the marketplace involving the licensing of tradenames similar to those owned by the Company. The income approach uses a projected pretax profitability rate relevant to the licensed income stream. We believe the use of multiple valuation techniques results in a more accurate indicator of the fair value of each tradename. This fair value is then compared with the carrying value of each tradename.
Long-lived assets (including property, plant and equipment), except for goodwill and indefinite lived intangible assets, are reviewed for impairment when events or circumstances indicate the carrying value of an asset group may not be recoverable. Recoverability of assets to be held and used is measured by a comparison of the carrying amount of the asset group to future net cash flows estimated by the Company to be generated by such assets. If such asset group is considered to be impaired, the impairment to be recognized is the amount by which the carrying amount of the asset group exceeds the fair value of the asset group. Assets to be disposed of are recorded at the lower of their carrying value or estimated net realizable value.
In the fourth quarter of fiscal 2018, the Company performed the required annual impairment test of the carrying amount of goodwill and indefinite lived intangible assets. The decline in the Company's trading price of its common stock at and around the end of fiscal 2018, and related decrease in the Company's market capitalization, was determined to be a triggering event for potential goodwill impairment. Accordingly, the Company also performed an assessment of its other long-lived assets for impairment. Refer to Note 3 for the results of the annual impairment testing performed in fiscal 2018. The Company determined that no impairment of intangible assets existed in fiscal 2017 or in fiscal 2016.
Derivative Financial Instruments
The Company uses certain derivative financial instruments as part of its risk management strategy to reduce interest rate and foreign currency risk. Derivatives are not used for trading or speculative activities.
The Company recognizes all derivatives on the consolidated balance sheet at fair value. On the date the derivative instrument is entered into, the Company generally designates the derivative as either (1) a hedge of the fair value of a recognized asset or liability or of an unrecognized firm commitment (“fair value hedge”), or (2) a hedge of a forecasted transaction or of the variability of cash flows to be received or paid related to a recognized asset or liability (“cash flow
35
hedge”). Changes in the fair value of a derivative that is designated as, and meets all the required criteria for, a fair value hedge, along with the gain or loss on the hedged asset or liability that is attributable to the hedged risk, are recorded in current period earnings. Changes in the fair value of a derivative that is designated as, and meets all the required criteria for, a cash flow hedge are recorded in accumulated other comprehensive income and reclassified into earnings as the underlying hedged item affects earnings. The portion of the change in fair value of a derivative associated with hedge ineffectiveness or the component of a derivative instrument excluded from the assessment of hedge effectiveness is recorded currently in earnings. Also, changes in the entire fair value of a derivative that is not designated as a hedge are recorded immediately in earnings. The Company formally documents all relationships between hedging instruments and hedged items, as well as its risk-management objective and strategy for undertaking various hedge transactions. This process includes relating all derivatives that are designated as fair value or cash flow hedges to specific assets and liabilities on the consolidated balance sheet or to specific firm commitments or forecasted transactions.
The Company also formally assesses, both at the inception of the hedge and on an ongoing basis, whether each derivative is highly effective in offsetting changes in fair values or cash flows of the hedged item. If it is determined that a derivative is not highly effective as a hedge or if a derivative ceases to be a highly effective hedge, the Company will discontinue hedge accounting prospectively.
The Company enters into foreign currency forward contracts in order to reduce the impact of certain foreign currency fluctuations. Firmly committed transactions and the related receivables and payables may be hedged with forward exchange contracts. Gains and losses arising from foreign currency forward contracts are recorded in other expense (income), net as offsets of gains and losses resulting from the underlying hedged transactions. A realized loss of $108,000 was recorded in the fiscal year ended March 31, 2018 and realized gains of $56,000 and $151,000 were recorded in the fiscal year ended March 31, 2017 and 2016, respectively. There were no open foreign currency forward exchange contracts as of March 31, 2018 and 2017.
On February 1, 2018, the Company entered into an interest rate swap agreement with a term of five years to manage its exposure to interest rate movements by effectively converting a portion of its anticipated working capital debt from variable to fixed rates. The notional amount of the interest rate swap contract subject to fixed rates was $40,000,000 in fiscal 2018. Fixed interest rate payments were at a weighted average rate of 2.575% in fiscal 2018. Interest rate differentials paid under this agreement were recognized as adjustments to interest expense and were $60,000 for the year ended March 31, 2018. This interest rate swap effectively converts $40,000,000 of the Company's variable-rate debt into fixed-rate debt with an effective interest rate of 3.525% (2.575% fixed + .95% spread) through the expiration of the Company's credit facility in March 2020. There were no interest rate swap agreements in fiscal 2017.
Interest Expense (Income)
Interest expense was $904,000, $298,000 and $288,000 in the years ended March 31, 2018, 2017 and 2016, respectively. Interest income was $223,000, $269,000 and $400,000 in the years ended March 31, 2018, 2017 and 2016, respectively.
Income Taxes
Income taxes are accounted for under the asset and liability method. Deferred tax assets and liabilities are recognized for the future tax consequences attributable to differences between the financial statement carrying amounts of existing assets and liabilities and their respective tax bases and operating loss and credit carryforwards. Deferred tax assets and liabilities are measured using enacted tax rates expected to apply to taxable income in the years in which those temporary differences and carryforwards are expected to be recovered or settled. The effect on deferred tax assets and liabilities of a change in tax rates is recognized in income in the period that includes the enactment date.
The Company recognizes the impact of an uncertain tax position, if it is more likely than not that such position will be sustained on audit, based solely on the technical merits of the position. See Note 7 for further discussion.
Revenue Recognition
Revenue is recognized from most product sales when goods are shipped, title and risk of loss have been transferred to the customer and collection is reasonably assured. The Company has certain limited products, primarily sewing patterns, that are on consignment at mass market retailers and the Company recognizes the sale as products are sold to end consumers as recorded at point-of-sale terminals. The Company records estimated reductions to revenue for customer programs, which may include special pricing agreements for specific customers, volume incentives and other promotions. In limited cases, the Company may provide the right to return product as part of its customer programs with certain customers. The Company also records estimated reductions to revenue, based primarily on historical experience, for customer returns and chargebacks that
36
may arise as a result of shipping errors, product damaged in transit or for other reasons that become known subsequent to recognizing the revenue. These provisions are recorded in the period that the related sale is recognized and are reflected as a reduction from gross sales. The related reserves are shown as a reduction of accounts receivable, except for reserves for customer programs which are shown as a current or long term liability. If the amount of actual customer returns and chargebacks were to increase or decrease significantly from the estimated amount, revisions to the estimated allowance would be required.
Product Development Costs
Product development costs consist of purchases of outside artwork, printing plates, cylinders, catalogs and samples. For seasonal products, the Company typically begins to incur product development costs 18 to 20 months before the applicable holiday event. These costs are amortized monthly over the selling season, which is generally within two to four months of the holiday event. Development costs related to gift and craft products are incurred within a period beginning six to nine months prior to the applicable sales period. These costs generally are amortized over a six to twelve month selling period. The expense of certain product development costs that are related to the manufacturing process are recorded in cost of sales while the portion that relates to creative and selling efforts are recorded in selling, general and administrative expenses.
Product development costs capitalized as of March 31, 2018 were $3,835,000, of which $3,350,000 was recorded in other current assets and $485,000 was recorded in other long-term assets in the consolidated financial statements. Product development costs capitalized as of March 31, 2017 were $4,116,000, of which $3,636,000 was recorded in prepaid expenses and other current assets and $480,000 was recorded in other long-term assets in the consolidated financial statements. Product development expense of $8,296,000, $8,268,000 and $6,902,000 was recognized in the years ended March 31, 2018, 2017 and 2016, respectively.
Shipping and Handling Costs
Shipping and handling costs are reported in cost of sales in the consolidated statements of operations.
Share-Based Compensation
Share-based compensation cost is estimated at the grant date based on a fair-value model. Calculating the fair value of share-based awards at the grant date requires judgment, including estimating stock price volatility and expected option life.
The Company uses the Black-Scholes option valuation model to value service-based stock options and uses Monte Carlo simulation to value performance-based stock options and restricted stock units. The fair value of each service-based restricted stock unit is estimated on the day of grant based on the closing price of the Company's common stock reduced by the present value of the expected dividend stream during the vesting period using the risk-free interest rate. The Company estimates stock price volatility based on historical volatility of its common stock. Estimated option life assumptions are also derived from historical data. Had the Company used alternative valuation methodologies and assumptions, compensation cost for share-based payments could be significantly different. The Company recognizes compensation cost over the stated vesting period consistent with the terms of the arrangement (i.e. either on a straight-line or graded-vesting basis).
Net Income (Loss) Per Common Share
The following table sets forth the computation of basic net income (loss) per common share and diluted net income (loss) per common share for the years ended March 31, 2018, 2017 and 2016.
37
For the Years Ended March 31, | |||||||||||
2018 | 2017 | 2016 | |||||||||
(in thousands, except per share amounts) | |||||||||||
Numerator: | |||||||||||
Net income (loss) | $ | (36,520 | ) | $ | 28,504 | $ | 17,236 | ||||
Denominator: | |||||||||||
Weighted average shares outstanding for basic income (loss) per common share | 9,108 | 9,074 | 9,147 | ||||||||
Effect of dilutive stock options | — | 41 | 92 | ||||||||
Adjusted weighted average shares outstanding for diluted income (loss) per common share | 9,108 | 9,115 | 9,239 | ||||||||
Basic net income (loss) per common share | $ | (4.01 | ) | $ | 3.14 | $ | 1.88 | ||||
Diluted net income (loss) per common share | $ | (4.01 | ) | $ | 3.13 | $ | 1.87 | ||||
The Company has excluded 495,000 shares, 505,175 shares, and 253,000 shares, consisting of outstanding stock options and unearned restricted stock units, in computing diluted net income (loss) per common share for the years ended March 31, 2018, 2017 and 2016, respectively, because their effects were antidilutive.
Statements of Cash Flows
For purposes of the consolidated statements of cash flows, the Company considers all holdings of highly liquid investments with a maturity at time of purchase of three months or less to be cash equivalents.
Supplemental Schedule of Cash Flow Information
For the Years Ended March 31, | |||||||||||
2018 | 2017 | 2016 | |||||||||
(in thousands) | |||||||||||
Cash paid during the year for: | |||||||||||
Interest | $ | 511 | $ | 264 | $ | 210 | |||||
Income taxes | $ | 1,484 | $ | 2,270 | $ | 9,736 | |||||
Details of acquisitions: | |||||||||||
Fair value of assets acquired | $ | 92,666 | $ | 50,445 | $ | 20,796 | |||||
Liabilities assumed | 23,049 | 15,416 | 1,251 | ||||||||
Net assets acquired | 69,617 | 35,029 | 19,545 | ||||||||
Amount due seller | 2,500 | — | — | ||||||||
Cash paid | 67,117 | 35,029 | 19,545 | ||||||||
Less cash acquired | 1,889 | — | — | ||||||||
Less gain on bargain purchases | — | 19,990 | — | ||||||||
Net cash paid for acquisitions | $ | 65,228 | $ | 15,039 | $ | 19,545 | |||||
(2) BUSINESS ACQUISITIONS
On November 3, 2017, the Company completed the acquisition of substantially all of the net assets and business of Simplicity Creative Group from Wilton Brands LLC ("Wilton") for a total consideration of $69,617,000 and transaction costs of approximately $3,411,000. Simplicity is a leading provider of home sewing patterns, decorative trims, knitting and crocheting tools, needle arts and kids' crafts products under the Simplicity®, Wrights®, Boye®, Dimensions®, and Perler® brand names. Simplicity's products are sold to mass-market retailers, specialty fabric and craft chains, wholesale distributors and online customers. The Company primarily financed the acquisition with borrowings of $60,000,000 under its revolving credit facility and has recorded a working capital adjustment due to Wilton of $2,500,000, which is recorded in other current liabilities in the accompanying consolidated balance sheet and was paid on April 4, 2018. A portion of the purchase price is being held in escrow for certain post closing adjustments and indemnification obligations. The acquisition was accounted for
38
using the acquisition method and the excess of cost over the fair market value of the net tangible and identifiable intangible assets acquired of $9,642,000 was recorded as goodwill. This goodwill was subsequently written off as a result of the Company’s annual impairment testing performed in the fourth quarter of fiscal 2018 as further described in Note 3.
The following table summarizes the preliminary fair values of the assets acquired and liabilities assumed at the date of acquisition in fiscal 2018 (in thousands):
Cash | $ | 1,889 | |
Accounts receivable | 11,787 | ||
Inventory | 30,804 | ||
Other assets | 1,460 | ||
Total current assets | 45,940 | ||
Property, plant and equipment | 15,188 | ||
Intangible assets | 20,982 | ||
Goodwill | 9,642 | ||
Other | 914 | ||
Total assets acquired | 92,666 | ||
Current liabilities | 16,912 | ||
Deferred tax liability | 840 | ||
Other long-term obligations | 5,297 | ||
Total liabilities assumed | 23,049 | ||
Net assets acquired | $ | 69,617 | |
In connection with the acquisition of Simplicity, the Company recorded an asset, within property, plant and equipment, and a liability of $1,163,000 related to an asset retirement obligation at a leased location. During fiscal 2018, the impact of the asset retirement obligation included $62,000 of depreciation expense and $51,000 of accretion expense. The asset retirement obligation of $1,214,000 is included in other long-term obligations as of March 31, 2018.
The financial results of Simplicity, from the acquisition date of November 3, 2017, are included in the Company's results of operations for the year ended March 31, 2018. For the period from acquisition through March 31, 2018, Simplicity contributed approximately $35,581,000 of revenue and resulted in a net loss of approximately $11,329,000 (due to the pre-tax impairment of goodwill of $9,642,000, pre-tax recognition of inventory step-up of $4,544,000 recorded in cost of sales, and pre-tax acquisition costs of approximately $3,411,000, which are included in selling, general and administrative expenses, in the year ended March 31, 2018).
On December 13, 2016, the Company completed the acquisition of substantially all of the net assets and business of The McCall Pattern Company and certain subsidiaries ("McCall"), for approximately $13,914,000 in cash plus transaction costs of approximately $1,484,000. McCall designs, manufactures, and sells home sewing patterns under the McCall’s®, Butterick®, Kwik Sew® and Vogue Patterns® brand names. McCall is a leading provider of home sewing patterns, selling to mass market retailers, specialty fabric and craft chains, and wholesale distributors. A portion of the purchase price is being held in escrow for certain post closing adjustments and indemnification obligations. The acquisition was accounted for using the acquisition method and, due to McCall's distressed financial condition and a motivated previous foreign owner who was seeking to exit operations in the United States, the transaction resulted in a bargain purchase due to the fair value of the net assets acquired of approximately $33,528,000 exceeding the amount paid.
On July 8, 2016, a subsidiary of the Company completed the acquisition of substantially all of the assets and business of Lawrence Schiff Silk Mills, Inc. ("Schiff") for $1,125,000 in cash. Schiff was a leading U.S. manufacturer and distributor of narrow woven ribbon prior to its April 2016 Chapter 11 bankruptcy filing. The acquisition was accounted for using the acquisition method and resulted in a bargain purchase due to the fair value of the net assets acquired of approximately $1,501,000 exceeding the amount paid.
39
The following table summarizes the fair values of the assets acquired and liabilities assumed at the date of acquisitions in fiscal 2017 (in thousands):
Accounts receivable | $ | 2,762 | |
Inventory | 32,206 | ||
Other assets | 553 | ||
Total current assets | 35,521 | ||
Property, plant and equipment | 9,473 | ||
Intangible assets | 4,900 | ||
Other | 551 | ||
Total assets acquired | 50,445 | ||
Current liabilities | 5,328 | ||
Deferred tax liability | 9,419 | ||
Long-term debt | 516 | ||
Other long-term obligations | 153 | ||
Total liabilities assumed | 15,416 | ||
Net assets acquired | $ | 35,029 | |
As the fair value of identifiable net assets acquired exceeded the fair value of the consideration transferred, the Company reassessed the recognition and measurement of identifiable assets acquired and liabilities assumed and concluded that all acquired assets and liabilities assumed were recognized and that the valuation procedures and resulting measures were appropriate. As a result, the Company recorded a gain on bargain purchases of approximately $19,990,000 in the fiscal year ended March 31, 2017.
The following table summarizes the revenue and earnings of the Company had the date of these acquisitions been April 1, 2016 (unaudited and in thousands):
For the Years Ended March 31, | |||||||
2018 | 2017 | ||||||
Supplemental pro forma revenue | $ | 413,577 | $ | 440,676 | |||
Supplemental pro forma earnings(1) | $ | (18,131 | ) | $ | 15,465 | ||
Supplemental pro forma earnings per basic share(1) | $ | (1.99 | ) | $ | 1.70 | ||
Supplemental pro forma earnings per diluted share(1) | $ | (1.99 | ) | $ | 1.70 | ||
(1) Earnings and earnings per share in the above pro forma table exclude bargain purchase gains and recognition of inventory step-up through cost of sales as the inventory turns.
40
(3) GOODWILL, OTHER INTANGIBLE ASSETS AND LONG-LIVED ASSETS
The following table shows changes in goodwill for the fiscal year ended March 31, 2017 and 2018 (in thousands):
Balance as of March 31, 2016 | $ | 19,974 | |
Decrease in goodwill - Blumenthal | (58 | ) | |
Balance as of March 31, 2017 | 19,916 | ||
Acquisition of Simplicity | 9,642 | ||
Impairment charge | (29,558 | ) | |
Balance as of March 31, 2018 | $ | — | |
The change in the gross carrying amount of other intangible assets for the year ended March 31, 2017 and 2018 is as follows (in thousands):
Tradenames and Trademarks | Customer Relationships | Favorable Lease Contracts | |||||||||
Balance as of March 31, 2016 | $ | 15,553 | $ | 39,157 | $ | — | |||||
Acquisition of McCall | 4,400 | — | — | ||||||||
Acquisition of Schiff | — | 500 | — | ||||||||
Purchase of customer lists | — | 100 | — | ||||||||
Balance as of March 31, 2017 | 19,953 | 39,757 | — | ||||||||
Acquisition of Simplicity | 8,200 | 8,900 | 3,882 | ||||||||
Impairment charge | (3,800 | ) | — | — | |||||||
Balance as of March 31, 2018 | $ | 24,353 | $ | 48,657 | $ | 3,882 | |||||
With the acquisition of Simplicity, the Company recorded intangible assets relating to tradenames that are not subject to amortization of $8,200,000. Additionally, the Company recorded $8,900,000 relating to customer lists with an estimated life of ten years and $3,882,000 related to favorable lease contracts with a weighted-average amortization period of four years. With the acquisition of the McCall business, the Company recorded intangible assets relating to tradenames that are not subject to amortization of $4,400,000. Additionally, the Company recorded customer lists of $500,000 with the acquisition of the Schiff business that are being amortized over five years and customer lists of $100,000 purchased from a third party which are being amortized over two years.
The gross carrying amount and accumulated amortization of other intangible assets as of March 31, 2018 and 2017 is as follows (in thousands):
March 31, 2018 | March 31, 2017 | ||||||||||||||
Gross Carrying Amount | Accumulated Amortization | Gross Carrying Amount | Accumulated Amortization | ||||||||||||
Tradenames and trademarks | $ | 24,353 | $ | — | $ | 19,953 | $ | — | |||||||
Customer relationships | 48,657 | 19,976 | 39,757 | 16,495 | |||||||||||
Favorable lease contracts | 3,882 | 299 | — | — | |||||||||||
Patents | 1,164 | 941 | 1,164 | 825 | |||||||||||
Trademarks | 403 | 393 | 403 | 363 | |||||||||||
Covenants not to compete | 530 | 351 | 530 | 245 | |||||||||||
$ | 78,989 | $ | 21,960 | $ | 61,807 | $ | 17,928 | ||||||||
The weighted-average amortization period of customer relationships, patents, trademarks and covenants not to compete are 13 years, 10 years, 10 years, and 5 years, respectively.
41
Amortization expense was $4,032,000 for fiscal 2018, $3,304,000 for fiscal 2017, and $2,665,000 for fiscal 2016. The estimated amortization expense for the next five fiscal years is as follows (in thousands):
2019 | $ | 4,912 | |
2020 | 4,751 | ||
2021 | 4,264 | ||
2022 | 4,167 | ||
2023 | 3,451 | ||
At March 31, 2018 and 2017, the Company had zero and $19,916,000 of goodwill, respectively. In connection with the Company's review of the recoverability of its goodwill for the fiscal year ended March 31, 2018, the Company determined that a triggering event occurred due to the decline in the Company's trading price of its common stock at and around the end of fiscal 2018 and related decrease in the Company's market capitalization. Given this circumstance, the Company bypassed the option to assess qualitative factors to determine the existence of impairment and proceeded directly to the quantitative goodwill impairment test. Based on the results of its impairment test, the Company recorded an impairment charge of $29,558,000, which was the carrying amount of its goodwill immediately before the charge. The Company determined that no impairment of goodwill existed in fiscal 2017 or 2016.
During the fourth quarter annual impairment test of indefinite-lived intangibles performed in fiscal 2018, the Company determined that the carrying value of the C.R. Gibson tradename exceeded its fair value. The Company recorded a non-cash tradename impairment charge of $3,800,000 related to the C.R. Gibson tradename. The Company determined that no impairment of indefinite-lived intangible assets existed in fiscal 2017 or 2016.
The Company assesses the impairment of long-lived assets, including identifiable intangible assets subject to amortization and property and plant and equipment, whenever events or changes in circumstances indicate the carrying value may not be recoverable. Factors the Company considers important that could trigger an impairment review include significant changes in the use of any assets, changes in historical trends in operating performance, changes in projected operating performance, stock price, loss of a major customer and significant negative economic trends. The decline in the Company's trading price of its common stock at and around the end of fiscal 2018, and related decrease in the Company's market capitalization, was determined to be a triggering event in connection with the Company's review of the recoverability of its long-lived assets for the fiscal year ended March 31, 2018. The Company performed a recoverability test during the fourth quarter of fiscal 2018 using an undiscounted cash flow approach and determined that the carrying value of long-lived assets are recoverable and not impaired. In connection with the Company’s review of the recoverability of its long-lived assets subject to amortization for the fiscal years ended March 31, 2017 and 2016, no circumstances were identified that indicated the carrying value of the assets may not be recoverable and there was no impairment of assets recorded in fiscal 2017 or 2016.
(4) TREASURY STOCK TRANSACTIONS
On March 4, 2016, the Company agreed to purchase, under its stock repurchase program, 45,000 shares of its common stock from a charitable foundation of which the Company's former Chairman of the Board, who retired as a director and officer of the Company on July 28, 2015, is a founder, director and officer. The purchase price was lower than the closing market price on the preceding trading day. The transaction was approved by the Company's Board of Directors on March 4, 2016 and completed on March 8, 2016. The total amount of this transaction was $1,274,000.
Under a stock repurchase program authorized by the Company’s Board of Directors, the Company repurchased 397,789 shares (inclusive of the 45,000 shares described above) of the Company’s common stock for $11,274,000 (inclusive of the $1,274,000 described above) in fiscal 2016. There were no repurchases of the Company's common stock by the Company during fiscal 2018 and 2017. As of March 31, 2018, the Company had 303,166 shares remaining available for repurchase under the Board’s authorization.
(5) SHARE-BASED PLANS
On July 30, 2013, the Company's stockholders approved the CSS Industries, Inc. 2013 Equity Compensation Plan ("2013 Plan"). Under the terms of the Company's 2013 Plan, the Company may grant incentive stock options, non-qualified stock options, stock units, restricted stock grants, stock appreciation rights, stock bonus awards and dividend equivalents to officers and other employees and non-employee directors. The Human Resources Committee of the Company's Board of Directors ("Board"), or other committee appointed by the Board (collectively with the Human Resources Committee, the "2013 Equity Plan Committee") approves grants to officers and other employees, and the Board approves grants to non-employee
42
directors. Grants under the 2013 Plan may be made through July 29, 2023. The term of each grant is at the discretion of the 2013 Equity Plan Committee, but in no event greater than ten years from the date of grant, and at the date of grant the 2013 Equity Plan Committee has discretion to determine the date or dates on which granted options become exercisable. Service-based options outstanding as of March 31, 2018 become exercisable at the rate of 25% per year commencing one year after the date of grant. Market-based stock options outstanding as of March 31, 2018, will become exercisable only if certain market conditions and service requirements are satisfied, and the date(s) on which they become exercisable will depend on the period in which such market conditions and service requirements are met, if at all, except that vesting and exercisability are accelerated upon a change of control. Outstanding service-based restricted stock units ("RSUs") granted to employees vest at the rate of 50% of the shares underlying the grant at each of the third and fourth anniversaries of the date on which the award was granted. Service-based RSUs granted to directors and outstanding at March 31, 2018 vest on July 30, 2018. Market-based RSUs outstanding at March 31, 2018 will vest only if certain market conditions and service requirements have been met, and the date(s) on which they vest will depend on the period in which such market conditions and service requirements are met, if at all, except that vesting and redemption are accelerated upon a change of control. At March 31, 2018, there were 591,068 shares available for grant.
Compensation cost is recognized over the stated vesting period consistent with the terms of the arrangement (i.e. either on a straight-line or graded-vesting basis).
Stock Options
Activity and related information pertaining to stock options for the year ended March 31, 2018 was as follows:
Number of Options | Weighted Average Exercise Price | Weighted Average Remaining Contractual Life | Aggregate Intrinsic Value | |||||||||
Outstanding at April 1, 2017 | 554,575 | $ | 26.05 | |||||||||
Granted | 124,000 | 27.52 | ||||||||||
Exercised | (29,775 | ) | 19.26 | |||||||||
Forfeited/canceled | (111,000 | ) | 28.08 | |||||||||
Outstanding at March 31, 2018 | 537,800 | $ | 26.35 | 4.8 years | $ | — | ||||||
Exercisable at March 31, 2018 | 174,887 | $ | 25.22 | 2.8 years | $ | — | ||||||
Expected to vest at March 31, 2018 | 299,445 | $ | 27.39 | 6.4 years | $ | — | ||||||
The Company issues treasury shares for stock option exercises. The cash flows resulting from the tax benefits from tax deductions in excess of the compensation cost recognized for those share awards (referred to as excess tax benefits) are presented as operating cash flows in the consolidated statement of cash flows.
The fair value of each stock option granted was estimated on the date of grant using the Black-Scholes option valuation model with the following average assumptions:
For the Years Ended March 31, | ||||||||
2018 | 2017 | 2016 | ||||||
Expected dividend yield at time of grant | 2.91 | % | 2.91 | % | 2.58 | % | ||
Expected stock price volatility | 34 | % | 35 | % | 37 | % | ||
Risk-free interest rate | 2.21 | % | 1.66 | % | 1.92 | % | ||
Expected life of option (in years) | 6.3 | 4.8 | 4.6 | |||||
Expected volatilities are based on historical volatility of the Company’s common stock. The risk-free interest rate is based on U.S. Treasury yields in effect at the time of grant. The expected option life reflects the average of the contractual term of the options and the weighted-average vesting period for all option tranches.
The weighted average fair value of stock options granted during fiscal 2018, 2017 and 2016 was $7.40, $6.25 and $7.24, per share, respectively. The total intrinsic value of options exercised during the years ended March 31, 2018, 2017 and 2016 was $217,000, $253,000 and $428,000, respectively. The total fair value of stock options vested during fiscal 2018, 2017 and 2016 was $850,000, $1,048,000 and $909,000.
43
As of March 31, 2018, there was $1,439,000 of total unrecognized compensation cost related to non-vested stock option awards granted under the Company’s equity incentive plans which is expected to be recognized over a weighted average period of 2.5 years.
Compensation cost related to stock options recognized in operating results (included in selling, general and administrative expenses) was $628,000, $666,000, and $872,000 in the years ended March 31, 2018, 2017 and 2016, respectively, and the associated future income tax benefit recognized was $159,000, $256,000, and $331,000 in the years ended March 31, 2018, 2017 and 2016, respectively.
Restricted Stock Units
Activity and related information pertaining to RSUs for the year ended March 31, 2018 was as follows:
Number of RSUs | Weighted Average Fair Value | Weighted Average Remaining Contractual Life | ||||||
Outstanding at April 1, 2017 | 185,377 | $ | 20.14 | |||||
Granted | 92,680 | 25.10 | ||||||
Vested | (17,352 | ) | 26.54 | |||||
Forfeited/canceled | (49,450 | ) | 20.69 | |||||
Outstanding at March 31, 2018 | 211,255 | $ | 21.66 | 1.9 years | ||||
There were no market-based RSUs granted during fiscal 2018. The fair value of each market-based RSU granted during fiscal 2017 and 2016 was estimated on the date of grant using a Monte Carlo simulation model with the following assumptions:
For the Years Ended March 31, | |||||
2017 | 2016 | ||||
Expected dividend yield at time of grant | 2.99 | % | 2.60 | % | |
Expected stock price volatility | 33 | % | 37 | % | |
Risk-free interest rate | 1.20 | % | 1.29 | % | |
The fair value of each service-based RSU granted to employees was estimated on the day of grant based on the closing price of the Company's common stock reduced by the present value of the expected dividend stream during the vesting period using the risk-free interest rate. The fair value of each service-based RSU granted to directors, for which dividend equivalents are paid upon vesting of the underlying awards, was estimated on the day of grant based on the closing price of the Company's common stock.
The total fair value of restricted stock units vested during fiscal 2018, 2017 and 2016 was $1,108,000, $806,000 and $1,053,000, respectively.
As of March 31, 2018, there was $2,162,000 of total unrecognized compensation cost related to non-vested RSUs granted under the Company’s equity incentive plans which is expected to be recognized over a weighted average period of 2.3 years.
On August 11, 2015, the Company granted 10,000 RSUs to the Chair of the Company's Board of Directors. The RSUs vested on August 15, 2017 and were converted into a lump sum cash payment of approximately $266,000 which represented the fair market value of corresponding shares of common stock of the Company. Prior to vesting, the RSUs were classified as liability awards because they were to be paid in cash upon vesting. The RSU award liability was measured at its fair market value at the end of each reporting period. The total amount accrued related to this grant as of March 31, 2017 was $210,000 and is included in accrued payroll and other compensation in the consolidated balance sheet. During fiscal 2018, 2017 and 2016, dividend equivalents of $2,000, $8,000 and $6,000, respectively, were paid in cash related to these liability classified awards and were charged to selling, general and administrative expenses.
Compensation cost related to RSUs (inclusive of the liability classified awards described above) recognized in operating results (included in selling, general and administrative expenses) was $1,368,000, $1,118,000 and $875,000 in the years ended March 31, 2018, 2017 and 2016, respectively, and the associated future income tax benefit recognized was $345,000, $431,000 and $332,000 in the years ended March 31, 2018, 2017 and 2016, respectively.
44
(6) RETIREMENT BENEFIT PLANS
Profit Sharing Plans
The Company maintains defined contribution profit sharing and 401(k) plans covering substantially all of the employees of the Company and its subsidiaries as of March 31, 2018. Annual contributions under the plan are determined by the Board of Directors of the Company. Consolidated expense related to the plans for the years ended March 31, 2018, 2017 and 2016 was $1,233,000, $864,000 and $758,000, respectively.
Postretirement Medical Plan
The Company administers a postretirement medical plan covering certain persons who are employees or former employees of a former subsidiary. The plan is unfunded and frozen to new participants. The following table provides a reconciliation of the benefit obligation for the postretirement medical plan (in thousands):
For the Years Ended March 31, | |||||||
2018 | 2017 | ||||||
Benefit obligation at beginning of year | $ | 787 | $ | 816 | |||
Interest cost | 30 | 33 | |||||
Actuarial (gain) loss | (22 | ) | 3 | ||||
Benefits paid | (65 | ) | (65 | ) | |||
Benefit obligation at end of year | $ | 730 | $ | 787 | |||
As of March 31, 2018, $62,000 of the benefit obligation was recorded in accrued other expenses and $668,000 was recorded in other long-term obligations in the consolidated balance sheet. As of March 31, 2017, $65,000 of the benefit obligation was recorded in accrued other expenses and $722,000 was recorded in other long-term obligations in the consolidated balance sheet.
The net loss recognized in accumulated other comprehensive loss at March 31, 2018 was $53,000, net of tax, and the actuarial loss expected to be amortized from accumulated other comprehensive loss into net periodic benefit cost during fiscal 2019 is approximately $1,000.
The assumptions used to develop the net periodic benefit cost for the years ended March 31, 2018, 2017 and 2016 were a discount rate of 4.00%, 4.25%, and 3.75%, respectively, and assumed health care cost trend rate of 9% (9% for 2017 and 9% for 2016) trending down to an ultimate rate of 5% in 2026. The assumption used to develop the benefit obligation as of the years ended March 31, 2018 and 2017 was a discount rate of 3.75% (4% in 2017). The discount rate is determined based on the average of the Citigroup Pension Liability Index, Moody's Long Term Corporate Bond Yield, and Corporate Bond Rate calculated by the Internal Revenue Service.
Net periodic benefit costs for the postretirement medical plan were $30,000, $33,000 and $32,000 for the years ended March 31, 2018, 2017 and 2016, respectively.
Pension Plan
The Company administers a defined benefit pension plan that was acquired through the acquisition of McCall and covers certain employees of its United Kingdom subsidiary. The plan covers employees who meet the eligibility requirements as defined. The Company's funding policy is to make the minimum annual contribution that is required by applicable regulations, plus such amounts as the Company may determine to be appropriate from time to time. The plan is frozen to future accrual of benefits.
45
Reconciliations of changes in the defined benefit obligation, fair value of plan assets and statement of funded status from the date of acquisition through March 31, 2018 are as follows (in thousands):
For the Years Ended March 31, | ||||||
2018 | 2017 | |||||
Change in benefit obligation: | ||||||
Benefit obligation at April 1, 2017 and December 13, 2016 | $ | 4,027 | $ | 4,482 | ||
Interest cost | 107 | 32 | ||||
Actuarial (gain) loss | (233 | ) | 178 | |||
Benefits paid | (455 | ) | (639 | ) | ||
Foreign currency impact | 437 | (26 | ) | |||
Benefit obligation at March 31, 2018 and 2017 | $ | 3,883 | $ | 4,027 | ||
Change in plan assets: | ||||||
Fair value of assets at April 1, 2017 and December 13, 2016 | $ | 3,929 | $ | 4,511 | ||
Actual return on plan assets | 451 | 66 | ||||
Employer contributions | 66 | 19 | ||||
Benefits paid | (455 | ) | (639 | ) | ||
Foreign currency impact | 462 | (28 | ) | |||
Fair value of plan assets at March 31, 2018 and 2017 | $ | 4,453 | $ | 3,929 | ||
Funded status at March 31, 2018 and 2017 | $ | 570 | $ | (98 | ) | |
As of March 31, 2018, the net pension asset of $570,000 was recorded in other assets, and as of March 31, 2017, the net benefit obligation of $98,000 was recorded in other long-term obligations, in the consolidated balance sheet.
The net gain recognized in accumulated other comprehensive income (loss) at March 31, 2018 was $304,000, net of tax, and the net loss recognized in accumulated other comprehensive income (loss) at March 31, 2017 was $124,000, net of tax. There is no estimated net gain, prior service cost or transition asset for the defined benefit pension plan that will be amortized from accumulated other comprehensive income into net periodic benefit cost during fiscal 2019.
The components of net periodic pension benefit for the period ended March 31, 2018 and 2017 is as follows (in thousands):
For the Years Ended March 31, | ||||||
2018 | 2017 | |||||
Interest cost | $ | 107 | $ | 32 | ||
Expected return on plan assets | (148 | ) | (42 | ) | ||
Net periodic pension benefit | $ | (41 | ) | $ | (10 | ) |
The assumption used to develop the net periodic pension benefit was 2.70% for the period ended March 31, 2018 and 2017. The assumption used to develop the benefit obligation as of March 31, 2018 and 2017 was a discount rate of 2.60% and 2.70%, respectively. The Company has estimated the long-term rate of return on plan assets based primarily on contractual agreements with an insurance company. This rate of return approximated 4% during fiscal 2018 and 2017.
The Company's overall investment strategy is to outsource investment risk to an insurance company in return for a contractual rate of return. Funds are deposited with the insurance company in return for an agreed upon interest rate return on the principal balance.
The accounting guidance on fair value measurements specifies a fair value hierarchy based upon the observability of inputs used in valuation techniques (Level 1, 2 and 3). See Note 10 for a discussion of the fair value hierarchy. The fair values of the pension plan assets represents a guaranteed investment contract with an insurance company at March 31, 2018 and 2017. The guaranteed investment contract is a Level 3 asset.
46
The Company expects to make contributions of $70,000 to the pension plan in fiscal 2019. The following table reflects the total benefits expected to be paid from the pension plan (in thousands):
2019 | $ | 503 | |
2020 | 150 | ||
2021 | 21 | ||
2022 | 64 | ||
2023 | 67 | ||
2024-2028 | 824 | ||
(7) INCOME TAXES
Income (loss) before income tax expense (benefit) was as follows (in thousands):
For the Years Ended March 31, | |||||||||||
2018 | 2017 | 2016 | |||||||||
United States | $ | (51,270 | ) | $ | 14,502 | $ | 18,319 | ||||
Foreign | 5,211 | 15,185 | 8,322 | ||||||||
$ | (46,059 | ) | $ | 29,687 | $ | 26,641 | |||||
The following table summarizes the provision (benefit) for U.S. federal, state and foreign taxes on income (loss) (in thousands):
For the Years Ended March 31, | |||||||||||
2018 | 2017 | 2016 | |||||||||
Current: | |||||||||||
Federal | $ | 2,828 | $ | 728 | $ | 5,600 | |||||
State | 236 | 352 | 564 | ||||||||
Foreign | 1,522 | 1,711 | 1,373 | ||||||||
4,586 | 2,791 | 7,537 | |||||||||
Deferred: | |||||||||||
Federal | (11,199 | ) | (1,260 | ) | 1,547 | ||||||
State | (2,200 | ) | (161 | ) | 321 | ||||||
Foreign | (726 | ) | (187 | ) | — | ||||||
(14,125 | ) | (1,608 | ) | 1,868 | |||||||
$ | (9,539 | ) | $ | 1,183 | $ | 9,405 | |||||
The differences between the statutory and effective federal income tax rates on income before income taxes were as follows:
47
For the Years Ended March 31, | |||||||||||
2018 | 2017 | 2016 | |||||||||
U.S. federal statutory rate | $ | (14,509 | ) | $ | 10,390 | $ | 9,324 | ||||
State income taxes, less federal benefit | (1,681 | ) | 159 | 514 | |||||||
Non-deductible goodwill impairment | 2,632 | — | — | ||||||||
Foreign tax rate differential | (953 | ) | (2,258 | ) | — | ||||||
Bargain purchase gain | — | (6,214 | ) | — | |||||||
U.S. tax legislation - revaluation of net deferred tax assets and liabilities | 1,939 | — | — | ||||||||
U.S. tax legislation - tax on unremitted foreign earnings | 2,866 | — | — | ||||||||
Change in tax reserves and valuation allowance | 152 | (562 | ) | 190 | |||||||
Permanent book/tax differences | (133 | ) | (58 | ) | (638 | ) | |||||
Other, net | 148 | (274 | ) | 15 | |||||||
$ | (9,539 | ) | $ | 1,183 | $ | 9,405 | |||||
New tax legislation in the U.S., commonly referred to as the Tax Cuts and Jobs Act (the "Tax Act"), was enacted on December 22, 2017. Accounting Standards Codification 740, "Accounting for Income Taxes," requires companies to recognize the effect of tax law changes in the period of enactment even though the effective date for most provisions is for tax years beginning after December 31, 2017, or in the case of certain other provisions, January 1, 2018. Although certain key aspects of the new law are effective January 1, 2018 and have an immediate accounting effect, other significant provisions are not effective or may not result in accounting effects for the Company until April 1, 2018.
Given the significance of the legislation, the Securities and Exchange Commission staff issued Staff Accounting Bulletin 118, "Income Tax Accounting Implications of the Tax Cuts and Jobs Act" ("SAB 118"), which allows registrants to record provisional amounts during a one year “measurement period” similar to that used when accounting for business combinations. However, the measurement period is deemed to have ended earlier when the registrant has obtained, prepared and analyzed the information necessary to finalize its accounting. During the measurement period, impacts of the law are expected to be recorded at the time a reasonable estimate for all or a portion of the effects can be made, and provisional amounts can be recognized and adjusted as information becomes available, prepared or analyzed.
SAB 118 summarizes a three-step process to be applied at each reporting period to account for and qualitatively disclose: (1) the effects of the change in tax law for which accounting is complete; (2) provisional amounts (or adjustments to provisional amounts) for the effects of the tax law where accounting is not complete, but that a reasonable estimate has been determined; and (3) that a reasonable estimate cannot yet be made and therefore taxes are reflected in accordance with law prior to the enactment of the Tax Act.
Amounts recorded where accounting is complete principally relate to the reduction in the U.S. corporate income tax rate to 21%, which resulted in the Company reporting an income tax expense of $1,939,000 to remeasure deferred taxes.
Provisional amounts recorded where accounting is based upon reasonable estimates related to the Tax Act include a one-time mandatory repatriation transition tax of $2,866,000 on the net accumulated earnings and profits of our foreign subsidiaries. The Company has determined that the transition tax is provisional because various components of the computation are unknown as of March 31, 2018, including the following significant items: the exchange rates for fiscal year 2019, the actual earnings and profits of the foreign entities as of March 31, 2018, the interpretation and identification of cash positions as of March 31, 2018, and incomplete computations of accumulated earnings and profits balances as of November 2, 2017.
Income tax benefits related to the exercise of stock options and vesting of restricted stock units reduced current taxes payable by $243,000, $687,000 and $645,000 in fiscal 2018, 2017 and 2016, respectively.
Deferred taxes are recorded based upon differences between the financial statement and tax bases of assets and liabilities and available net operating loss and credit carryforwards. The following temporary differences gave rise to net deferred income tax assets (liabilities) as of March 31, 2018 and 2017 (in thousands):
48
March 31, | |||||||
2018 | 2017 | ||||||
Deferred income tax assets: | |||||||
Inventories | $ | 1,820 | $ | 658 | |||
Accrued expenses | 1,523 | 3,223 | |||||
Federal net operating loss and credit carryforwards | 5,204 | — | |||||
State net operating loss and credit carryforwards | 19,397 | 8,579 | |||||
Foreign net operating loss carryforwards | 4,598 | — | |||||
Intangibles | 4,361 | — | |||||
Share-based compensation | 1,986 | 2,455 | |||||
38,889 | 14,915 | ||||||
Valuation allowance | (23,312 | ) | (8,608 | ) | |||
15,577 | 6,307 | ||||||
Deferred income tax liabilities: | |||||||
Intangibles | — | 3,108 | |||||
Property, plant and equipment | 6,529 | 4,391 | |||||
Unremitted earnings of foreign subsidiaries | — | 2,539 | |||||
Other | 248 | 699 | |||||
6,777 | 10,737 | ||||||
Net deferred income tax asset (liability) | $ | 8,800 | $ | (4,430 | ) | ||
At March 31, 2018 and 2017, the Company had potential federal income tax benefits of $5,204,000 and $0, respectively, from federal net operating losses that do not expire. At March 31, 2018 and 2017, the Company had potential state income tax benefits of $19,397,000 (net of federal tax of $5,156,000) and $8,579,000 (net of federal tax of $4,619,000), respectively, from state deferred tax assets and state net operating loss carryforwards that expire in various years through 2038. At March 31, 2018 and 2017, the Company had potential foreign income tax benefits of $4,598,000 and $0, respectively, from foreign net operating and capital losses, the majority of which do not expire. At March 31, 2018 and 2017, the Company provided valuation allowances of $23,312,000 and $8,608,000, respectively. The valuation allowance reflects management’s assessment of the portion of the deferred tax asset that more likely than not will not be realized through future taxable earnings or implementation of tax planning strategies.
The Company recognizes in its consolidated financial statements the impact of a tax position, if it is more likely than not that such position will be sustained on audit, based solely on the technical merits of the position. A reconciliation of the beginning and ending amount of gross unrecognized tax benefits is as follows (in thousands):
March 31, | |||||||
2018 | 2017 | ||||||
Gross unrecognized tax benefits at April 1 | $ | 1,199 | $ | 1,764 | |||
Additions based on tax positions related to the current year | 24 | 63 | |||||
Additions based on tax positions related to the Simplicity acquisition | 774 | — | |||||
Reductions for tax positions of prior years | (145 | ) | (628 | ) | |||
Gross unrecognized tax benefits at March 31 | $ | 1,852 | $ | 1,199 | |||
During fiscal 2017, the Company completed a state nexus study. As a result of this study, management concluded that reductions of $628,000 to the gross unrecognized tax benefits were appropriate. The adjustment covered unrecognized tax benefits that were recorded in fiscal 2006 through fiscal 2015 and were immaterial to any individual year.
The total amount of gross unrecognized tax benefits at March 31, 2018 of $1,852,000 was classified in long-term obligations in the accompanying consolidated balance sheet and the amount that would favorably affect the effective tax rate in future periods, if recognized, is $852,000. The Company does not anticipate any significant changes to the amount of gross unrecognized tax benefits in the next 12 months.
49
The Company recognizes potential accrued interest and/or penalties related to unrecognized tax benefits in income tax expense in the consolidated statements of operations. Approximately $516,000 of interest and penalties are accrued at March 31, 2018, $12,000 of which was recorded during the current year.
The Company is subject to U.S. federal income tax as well as income tax in multiple state and foreign jurisdictions. The Company has settled all income tax matters for the United States federal jurisdiction for years through fiscal 2014. State income tax returns remain open back to fiscal 2012 and foreign income tax returns remain open back to fiscal 2006 in major jurisdictions in which the Company operates.
(8) LONG-TERM DEBT AND CREDIT ARRANGEMENTS
On March 24, 2015, the Company entered into an amendment to extend the expiration date of its revolving credit facility with two banks from March 17, 2016 to March 16, 2020. The facility provides for a revolving line of credit under which the maximum credit available to the Company at any one time automatically adjusts upwards and downwards on a periodic basis among “low”, “medium” and “high” levels (each a “Commitment Level”), as follows:
Commitment Period Description | Commitment Period Time Frame | Commitment Level | ||
Low | February 1 to June 30 (5 months) | $50,000,000 | ||
Medium | July 1 to October 31 (4 months) | $100,000,000 | ||
High | November 1 to January 31 (3 months) | $150,000,000 | ||
The Company has the option to increase the Commitment Level during part of any Low Commitment Period from $50,000,000 to an amount not less than $62,500,000 and not in excess of $125,000,000; provided, however, that the Commitment Level must remain at $50,000,000 for at least three consecutive months during each Low Commitment Period. The Company has the option to increase the Commitment Level during all or part of any Medium Commitment Period from $100,000,000 to an amount not in excess $125,000,000. Fifteen days prior written notice is required for the Company to exercise an option to increase the Commitment Level with respect to a particular Low Commitment Period or Medium Commitment Period. The Company may exercise an option to increase the Commitment Level no more than three times each calendar year. The Company may issue up to $20,000,000 of letters of credit under the facility.
Interest on the facility accrues at per annum rates equal to, at the Company’s option, either one-, two-, or three-month London Interbank Offered Rate (“LIBOR”) plus 0.95%, or the LIBOR Market Index Rate plus 0.95%. In addition to interest, the Company is required to pay “unused” fees equal to 0.275% per annum on the average daily unused amount of the Commitment Level that is then applicable. As of March 31, 2018, there was $40,000,000 outstanding under the facility and there were no amounts outstanding as of March 31, 2017. The weighted average interest rate under the revolving credit facility was 2.49% for the year ended March 31, 2018. The average and peak borrowings were $21,526,000 and $67,766,000, respectively, for the year ended March 31, 2018. There were no borrowings under the facility in fiscal 2017. Outstanding letters of credit under the facility were $1,853,000 and $1,097,000 at March 31, 2018 and 2017, respectively. These letters of credit guarantee funding of workers compensation claims in fiscal 2018 and 2017 and also guarantee the funding of a lease security deposit in fiscal 2018.
The agreement governing the facility contains financial covenants requiring the Company to maintain as of the last day of each fiscal quarter: (i) a tangible net worth of not less than $170,000,000, and (ii) an interest coverage ratio of not less than 3.50 to 1.00. The facility also contains covenants that address, among other things, the ability of the Company and its subsidiaries to incur additional indebtedness; grant liens on their assets; engage in mergers, acquisitions, divestitures and/or sale–leaseback transactions; pay dividends and make other distributions in respect of their capital stock; make investments and capital expenditures; and enter into “negative pledge” agreements with respect to their assets. The restriction on the payment of dividends applies only upon the occurrence and continuance of a Company default under the facility, or when a dividend payment would give rise to such a default. The Company is in compliance with all debt covenants as of March 31, 2018.
The Company also finances certain equipment which is classified in the accompanying consolidated balance sheets as of March 31, 2018 and 2017 as follows (in thousands):
March 31, | |||||||
2018 | 2017 | ||||||
Current portion of long-term debt | $ | 154 | $ | 145 | |||
Long-term debt, net of current portion | 108 | 262 | |||||
50
The Company leases certain equipment under capital leases. The future minimum annual lease payments, including interest, associated with the capital lease obligations are as follows (in thousands):
2019 | $ | 82 | |
2020 | 79 | ||
2021 | 45 | ||
2022 | 1 | ||
2023 | — | ||
Total minimum lease obligations | 207 | ||
Less amount representing interest at 4.89% | (13 | ) | |
Present value of future minimum lease obligations | $ | 194 | |
Long-term debt, including capital lease obligations, mature as follows as of March 31, 2018 (in thousands):
2019 | $ | 228 | |
2020 | 40,182 | ||
2021 | 45 | ||
2022 | 1 | ||
2023 | — | ||
Total | $ | 40,456 | |
(9) OPERATING LEASES
The Company maintains various lease arrangements for property and equipment. The future minimum rental payments associated with all non-cancelable lease obligations are as follows (in thousands):
2019 | $ | 8,975 | |
2020 | 7,718 | ||
2021 | 4,993 | ||
2022 | 4,828 | ||
2023 | 3,473 | ||
Thereafter | 14,105 | ||
Total | $ | 44,092 | |
The Company records rent expense on a straight-line basis over the lease term. Rent expense was $9,423,000, $6,468,000 and $5,910,000 for the years ended March 31, 2018, 2017 and 2016, respectively. Sublease income was $341,000, $194,000 and $152,000 for the years ended March 31, 2018, 2017 and 2016, respectively.
(10) FAIR VALUE OF FINANCIAL INSTRUMENTS
Recurring Fair Value Measurements
The Company uses certain derivative financial instruments as part of its risk management strategy to reduce interest rate and foreign currency risk. The Company recognizes all derivatives on the consolidated balance sheet at fair value based on quotes obtained from financial institutions. The fair value of interest rate swap agreements at March 31, 2018 was $110,000. There were no interest rate swap agreements as of March 31, 2017. There were no foreign currency contracts outstanding as of March 31, 2018 and 2017.
The Company maintains a Nonqualified Supplemental Executive Retirement Plan ("SERP") for qualified employees. There have been no contributions provided under the SERP since fiscal 2007 and there are four employees who maintain account balances as of March 31, 2018. The Company also maintains a nonqualified Deferred Compensation Plan (the "Deferred Comp Plan") for qualified employees. The Plan provides eligible key employees with the opportunity to elect to defer up to 50% of their eligible compensation under the Plan. The Company may make matching or discretionary contributions, at the discretion of the Board. All compensation deferred under the SERP and Deferred Comp Plan is held by
51
the Company. The Company maintains separate accounts for each participant to reflect deferred contribution amounts and the related gains or losses on such deferred amounts. A participant’s account is notionally invested in one or more investment funds and the value of the account is determined with respect to such investment allocations. The related liability is recorded as deferred compensation and included in other long-term obligations in the consolidated balance sheet as of March 31, 2018.
The Company maintains two life insurance policies in connection with deferred compensation arrangements with two former executives. The cash surrender value of the policies is recorded in other long-term assets in the consolidated balance sheets and is based on quotes obtained from the insurance company as of March 31, 2018 and 2017.
To increase consistency and comparability in fair value measurements, the FASB established a fair value hierarchy that prioritizes the inputs to valuation techniques into a three-level fair value hierarchy. The fair value hierarchy gives the highest priority to quoted prices in active markets for identical assets or liabilities (Level 1) and the lowest priority to unobservable inputs (Level 3). If the inputs used to measure the financial assets and liabilities fall within different levels of the hierarchy, the categorization is based on the lowest level input that is significant to the fair value measurement of the instrument.
The Company’s recurring assets and liabilities recorded on the consolidated balance sheet are categorized based on the inputs to the valuation techniques as follows:
Level 1 – Financial assets and liabilities whose values are based on unadjusted quoted prices for identical assets or liabilities in an active market that the Company has the ability to access.
Level 2 – Financial assets and liabilities whose values are based on quoted prices in markets that are not active or model inputs that are observable either directly or indirectly for substantially the full term of the asset or liability. Examples of Level 2 inputs included quoted prices for identical or similar assets or liabilities in non-active markets and pricing models whose inputs are observable for substantially the full term of the asset or liability.
Level 3 – Financial assets and liabilities whose values are based on prices or valuation techniques that require inputs that are both unobservable and significant to the overall fair value measurement.
The following table presents the Company’s fair value hierarchy for those financial assets and liabilities measured at fair value on a recurring basis in its consolidated balance sheet as of March 31, 2018 and 2017.
March 31, 2018 | Quoted Prices In Active Markets for Identical Assets (Level 1) | Significant Other Observable Inputs (Level 2) | Significant Unobservable Inputs (Level 3) | ||||||||||||
(in thousands) | |||||||||||||||
Assets: | |||||||||||||||
Marketable securities | $ | 359 | $ | 359 | $ | — | $ | — | |||||||
Cash surrender value of life insurance policies | 2,007 | — | 2,007 | — | |||||||||||
Total assets | $ | 2,366 | $ | 359 | $ | 2,007 | $ | — | |||||||
Liabilities: | |||||||||||||||
Interest rate swap agreement | $ | 110 | $ | — | $ | 110 | $ | — | |||||||
Deferred compensation plans | 776 | 776 | — | — | |||||||||||
Total liabilities | $ | 886 | $ | 776 | $ | 110 | $ | — | |||||||
52
March 31, 2017 | Quoted Prices In Active Markets for Identical Assets (Level 1) | Significant Other Observable Inputs (Level 2) | Significant Unobservable Inputs (Level 3) | ||||||||||||
(in thousands) | |||||||||||||||
Assets: | |||||||||||||||
Marketable securities | $ | 319 | $ | 319 | $ | — | $ | — | |||||||
Cash surrender value of life insurance policies | 1,187 | — | 1,187 | — | |||||||||||
Total assets | $ | 1,506 | $ | 319 | $ | 1,187 | $ | — | |||||||
Liabilities: | |||||||||||||||
Deferred compensation plans | $ | 364 | $ | 364 | $ | — | $ | — | |||||||
Total liabilities | $ | 364 | $ | 364 | $ | — | $ | — | |||||||
Cash and cash equivalents, accounts receivable, accounts payable and accrued expenses are reflected at carrying value in the consolidated balance sheets as such amounts are a reasonable estimate of their fair values due to the short-term nature of these instruments. Short-term investments as of March 31, 2017 included held-to-maturity securities that were recorded at amortized cost, which approximates fair value (Level 2), because their short-term maturity results in the interest rates on these securities approximating current market interest rates. The outstanding balance of the Company's long-term debt approximated its fair value based on the current rates available to the Company for debt of the same maturity and represents Level 2 financial instruments.
Nonrecurring Fair Value Measurements
The Company’s nonfinancial assets which are measured at fair value on a nonrecurring basis include property, plant and equipment, goodwill, intangible assets and certain other assets. These assets are not measured at fair value on a recurring basis; however, they are subject to fair value adjustments in certain circumstances, such as when there is evidence that an impairment may exist. In making the assessment of impairment, recoverability of assets to be held and used is measured by a comparison of the carrying amount of the asset group to future net cash flows estimated by the Company to be generated by such assets. If such asset group is considered to be impaired, the impairment to be recognized is the amount by which the carrying amount of the asset group exceeds the fair value of the asset group. Assets to be disposed of are recorded at the lower of their carrying value or estimated net realizable value.
As discussed in Note 2, during fiscal 2018, the Company acquired substantially all of the net assets and business of Simplicity on November 3, 2017 and determined that the aggregate fair value of the acquired intangible assets, consisting of tradenames, customer lists and favorable lease contracts, was $20,982,000. The Company estimated the fair value of the acquired intangible assets using discounted cash flow techniques which included an estimate of future cash flows discounted to present value with an appropriate risk-adjusted discount rate (Level 3). The Company determined that the aggregate preliminary fair value of the acquired inventory in the Simplicity acquisition was $30,804,000 which was estimated as the selling price less costs of disposal (Level 2). Also, as discussed in Note 2, during fiscal 2017, the Company acquired substantially all of the net assets and business of McCall on December 13, 2016 and determined that the fair value of acquired intangible assets, consisting of tradenames, was $4,400,000. Additionally, as discussed in Note 2, the Company acquired substantially all of the assets of Schiff on July 8, 2016 and determined that the aggregate fair value of the acquired intangible assets, consisting of customer relationships, was $500,000. The Company estimated the fair value of the aforementioned acquired intangible assets using discounted cash flow techniques which included an estimate of future cash flows discounted to present value with an appropriate risk-adjusted discount rate (Level 3). As discussed in Note 3, the Company acquired certain customer lists in the amount of $100,000 during fiscal 2017. The Company estimated the fair value of the acquired customer lists as the amount paid to acquire such customer lists (Level 1). The Company determined that the aggregate fair value of the acquired inventory in the McCall and Schiff acquisitions was $32,206,000 which was estimated as the selling price less costs of disposal (Level 2).
Goodwill and indefinite-lived intangibles are subject to impairment testing on an annual basis, or sooner if events or circumstances indicate a condition of impairment may exist. Impairment testing is conducted through valuation methods that are based on assumptions for matters such as interest and discount rates, growth projections and other assumptions of future business conditions (Level 3). These valuation methods require a significant degree of management judgment concerning the use of internal and external data. The Company also uses quoted market prices in active markets as the basis for measurement of fair value with consideration given to a control premium (Level 1). In the event these methods indicate that fair value is less than the carrying value, the asset is recorded at fair value as determined by the valuation models. In the fourth
53
quarter of fiscal 2018, the Company recorded a non-cash pre-tax impairment charge of $33,358,000 due to the full impairment of goodwill and partial impairment of a tradename. See Note 3 for further discussion. As of March 31, 2017, the Company believes that no impairments existed.
(11) COMMITMENTS AND CONTINGENCIES
CSS and its subsidiaries are involved in ordinary, routine legal proceedings that are not considered by management to be material. In the opinion of Company counsel and management, the ultimate liabilities resulting from such legal proceedings will not materially affect the consolidated financial position of the Company or its results of operations or cash flows.
(12) SEGMENT DISCLOSURE
The Company operates in a single reporting segment, the creative development, manufacture, procurement, distribution and sale of seasonal, gift and craft products, primarily to mass market retailers in the United States. The majority of the Company’s assets are maintained in the United States.
The Company’s detail of net sales from its various products is as follows (in thousands):
For the Years Ended March 31, | |||||||||||
2018 | 2017 | 2016 | |||||||||
Seasonal | $ | 122,191 | $ | 133,749 | $ | 136,684 | |||||
Gift | 125,399 | 128,206 | 130,258 | ||||||||
Craft | 114,306 | 60,476 | 50,075 | ||||||||
Total | $ | 361,896 | $ | 322,431 | $ | 317,017 | |||||
One customer accounted for 25%, 30% and 30% of net sales in fiscal 2018, 2017 and 2016, respectively. One other customer accounted for 10% of net sales in each of fiscal 2017 and 2016.
(13) RECENT ACCOUNTING PRONOUNCEMENTS
In February 2018, the Financial Accounting Standards Board ("FASB") issued Accounting Standards Update ("ASU") 2018-02, "Income Statement - Reporting Comprehensive Income (Topic 220): Reclassification of Certain Tax Effects from Accumulated Other Comprehensive Income" ("ASU 2018-02"). ASU 2018-02 allows a reclassification from accumulated other comprehensive income (loss) to retained earnings for stranded tax effects resulting from the Tax Act. The amount of the reclassification is calculated based on the effect of the change in the U.S. federal corporate income tax rate on the gross deferred tax amounts at the date of the enactment of the Tax Act related to items that remained in accumulated other comprehensive income (loss) at that time. ASU 2018-02 requires entities to make new disclosures, regardless of whether they elect to reclassify tax effects. This ASU is effective for fiscal years beginning after December 15, 2018, including interim periods within those fiscal years. Early adoption is permitted. The Company is currently evaluating the impact of the adoption of this standard, but it does not expect that it will have a material impact on the Company's consolidated financial statements.
In August 2017, the FASB issued ASU 2017-12, "Derivatives and Hedging (Topic 815): Targeted Improvements to Accounting for Hedging Activities," that amends and simplifies existing hedge accounting guidance and allows for more hedging strategies to be eligible for hedge accounting. In addition, the ASU amends disclosure requirements and how hedge effectiveness is assessed. This new standard is effective for fiscal years beginning after December 15, 2018. Early adoption is permitted. Effective January 1, 2018, the Company elected to early adopt ASU 2017-12. The adoption of this standard did not have an impact on the Company's consolidated financial statements.
In May 2017, the FASB issued ASU 2017-09, “Compensation–Stock Compensation (Topic 718): Scope of Modification Accounting,” clarifying when a change to the terms or conditions of a share-based payment award must be accounted for as a modification. The new guidance requires modification accounting if the fair value, vesting condition or the classification of the award is not the same immediately before and after a change to the terms and conditions of the award. The new guidance is effective for the Company on a prospective basis beginning on April 1, 2018, with early adoption permitted. This new guidance is not expected to have an impact on the Company’s consolidated financial statements as it is not the Company’s practice to change either the terms or conditions of share-based payment awards once they are granted.
In January 2017, the FASB issued ASU 2017-04, "Intangibles - Goodwill and Other (Topic 350): Simplifying the Test for Goodwill Impairment" ("ASU 2017-04"). Under the amendments in ASU 2017-04, Step 2 of the goodwill impairment
54
test is eliminated. An entity should perform its annual, or interim, goodwill impairment test by comparing the fair value of a reporting unit with its carrying amount. An entity should recognize an impairment charge for the amount by which the carrying amount exceeds the reporting unit's fair value; however, the loss recognized should not exceed the total amount of goodwill allocated to that reporting unit. Additionally, an entity should consider income tax effects from any tax deductible goodwill on the carrying amount of the reporting unit when measuring the goodwill impairment loss, if applicable. Also eliminated is the requirement for any reporting unit with a zero or negative carrying amount to perform a qualitative assessment and, if it fails that qualitative test, to perform Step 2 of the goodwill impairment test. Therefore, the same impairment assessment applies to all reporting units. An entity is required to disclose the amount of goodwill allocated to each reporting unit with a zero or negative carrying amount of net assets. This standard is effective for the Company for its annual or any interim goodwill impairment tests in fiscal years beginning after December 15, 2019. Early adoption is permitted for interim or annual goodwill impairment tests performed on testing dates after January 1, 2017. Effective April 1, 2017, the Company elected to early adopt ASU 2017-04 and the amendments described therein were applied to the fiscal 2018 goodwill impairment test. In connection with the Company's goodwill impairment test performed in the fourth quarter of fiscal 2018, the Company recorded a pre-tax impairment charge of $29,558,000, which was the carrying amount of its goodwill immediately before the charge. See Note 3 for further discussion.
In January 2017, the FASB issued ASU 2017-01, "Clarifying the Definition of a Business" ("ASU 2017-01"). This new guidance clarifies the definition of a business in order to assist with evaluating whether transactions should be accounted for as acquisitions (or disposals) of assets or businesses. ASU 2017-01 is effective for fiscal years beginning after December 15, 2017, and interim periods within those years. Early adoption is permitted for transactions not reported in financial statements that have been issued or made available for issuance. The new guidance must be applied prospectively on or after the effective date, and no disclosures for a change in accounting principle are required at transition. The Company elected to early adopt ASU 2017-01 effective April 1, 2017 and the new guidance did not have an impact on the Company's consolidated financial statements.
In October 2016, the FASB issued ASU 2016-16, "Income Taxes (Topic 740): Intra-Entity Transfers of Assets Other than Inventory" ("ASU 2016-16") which amends the accounting for income taxes. ASU 2016-16 requires the recognition of the income tax consequences of an intra-entity asset transfer, other than transfers of inventory, when the transaction occurs. For intra-entity transfers of inventory, the income tax effects will continue to be deferred until the inventory has been sold to a third party. The standard is effective in annual periods beginning after December 15, 2017, including interim periods within those fiscal years. Early adoption is permitted. The new guidance is required to be applied on a modified retrospective basis through a cumulative-effect adjustment to retained earnings as of the beginning of the period of adoption. The Company intends to adopt the guidance when it becomes effective in the first quarter of fiscal 2019 and does not anticipate that this guidance will have a material impact on its consolidated financial statements.
In March 2016, the FASB issued ASU 2016-09, "Compensation - Stock Compensation (Topic 718): Improvements to Employee Share-Based Payment Accounting" ("ASU 2016-09"). ASU 2016-09 simplifies several aspects of accounting for share-based payment award transactions, including income tax consequences, classification of awards as either liability or equity, and classification on the statement of cash flows. The standard is effective for annual periods beginning after December 15, 2016, including interim periods within those fiscal years. The Company adopted the guidance effective April 1, 2017 and recorded a $1,059,000 cumulative-effect adjustment to retained earnings to recognize deferred taxes attributable to excess tax benefits. The Company also elected to adopt the cash flow presentation of the excess tax benefits prospectively commencing in the first quarter of fiscal 2018.
In February 2016, the FASB issued ASU 2016-02, "Leases (Topic 842)" ("ASU 2016-02"). ASU 2016-02 requires lessees to record a right-of-use asset and lease liability on the balance sheet for all leases with terms longer than 12 months. Leases will be classified as either finance or operating, with classification affecting the pattern of expense recognition in the income statement. ASU 2016-02 is effective for fiscal years beginning after December 15, 2018, including interim periods within those fiscal years. Early adoption is permitted. The standard also requires certain quantitative and qualitative disclosures. While we are continuing to assess all potential aspects of ASU 2016-02, including taking an inventory of outstanding leases, the Company currently believes the most significant impact relates to our accounting for manufacturing, distribution, warehouse and office space operating leases. The Company expects this standard to have a material impact on its consolidated balance sheet, but does not believe that it will have a material impact on its consolidated net income.
In July 2015, the FASB issued ASU 2015-11, "Simplifying the Measurement of Inventory" ("ASU 2015-11"). ASU 2015-11 amends the guidelines for the measurement of inventory from lower of cost or market to the lower of cost and net realizable value ("NRV"). NRV is defined as the estimated selling prices in the ordinary course of business less reasonably predictable costs of completion, disposal, and transportation. Under existing standards, inventory is measured at lower of cost or market, which requires the consideration of replacement cost, NRV and NRV less an amount that approximates a normal profit margin. This ASU eliminates the requirement to determine and consider replacement cost or NRV less a normal profit margin for inventory measurement. The new standard is effective prospectively for fiscal years beginning after December 15,
55
2016, with early adoption permitted. The Company adopted ASU 2015-11 effective April 1, 2017 and it had no impact on its consolidated financial statements.
In May 2014, the FASB issued ASU 2014-09, "Revenue from Contracts with Customers" ("ASU 2014-09"). ASU 2014-09 provides a single model for entities to use in accounting for revenue arising from contracts with customers and will supersede most current revenue recognition guidance. The new standard also requires expanded disclosures regarding the qualitative and quantitative information about the nature, amount, timing, and uncertainty of revenue and cash flows arising from contracts with customers. The new guidance is effective for annual reporting periods beginning after December 15, 2017, including interim periods within that reporting period. The standard permits the use of either a full retrospective or a modified retrospective approach.
The Company will adopt the new guidance effective April 1, 2018, with a cumulative-effect adjustment, if any, to opening retained earnings under the modified retrospective approach. The Company’s implementation of this ASU includes the evaluation of its customer agreements to identify terms or conditions that could be considered a performance obligation such that, if material to the terms of the contract, consideration would be allocated to the performance obligation and could accelerate or defer the timing of recognizing revenue. The Company has made significant progress in the review of its customer contracts and its current accounting policies and practices to identify potential differences that could result from applying the requirements of the new standard to its revenue contracts. The Company has evaluated a majority of its revenue streams and based on the Company's analysis to date, it does not expect the new revenue standard will have a significant impact on the timing of recognizing revenue. The Company currently does not expect any significant changes to its accounting systems, but it will enhance its internal controls related to the new standard. While the Company has made significant progress, it is still evaluating other aspects of its revenue streams. The Company will continue to update its assessment of the effect that the new revenue guidance will have on its consolidated financial statements, disclosures and related internal controls, and we will be finalizing our assessment in advance of our first quarter fiscal 2019 Form 10-Q. We are also in the process of developing our new footnote disclosures required under the new standard.
56
(14) QUARTERLY FINANCIAL DATA (UNAUDITED)
2018 | Quarters | ||||||||||||||
First | Second | Third | Fourth | ||||||||||||
(in thousands, except per share amounts) | |||||||||||||||
Net sales | $ | 48,324 | $ | 101,397 | $ | 130,642 | $ | 81,533 | |||||||
Gross profit | $ | 11,812 | $ | 26,675 | $ | 37,459 | $ | 16,883 | |||||||
Net income (loss) | $ | (7,064 | ) | $ | 3,013 | $ | 5,952 | $ | (38,421 | ) | |||||
Net income (loss) per common share: | |||||||||||||||
Basic | $ | (0.78 | ) | $ | 0.33 | $ | 0.65 | $ | (4.21 | ) | |||||
Diluted | $ | (0.78 | ) | $ | 0.33 | $ | 0.65 | $ | (4.21 | ) | |||||
2017 | Quarters | ||||||||||||||
First | Second | Third | Fourth | ||||||||||||
(in thousands, except per share amounts) | |||||||||||||||
Net sales | $ | 45,318 | $ | 101,291 | $ | 117,153 | $ | 58,669 | |||||||
Gross profit | $ | 12,297 | $ | 31,600 | $ | 36,978 | $ | 12,214 | |||||||
Net income (loss) | $ | (3,286 | ) | $ | 6,992 | $ | 29,969 | $ | (5,171 | ) | |||||
Net income (loss) per common share: | |||||||||||||||
Basic | $ | (0.36 | ) | $ | 0.77 | $ | 3.30 | $ | (0.57 | ) | |||||
Diluted | $ | (0.36 | ) | $ | 0.77 | $ | 3.29 | $ | (0.57 | ) | |||||
Gross profit in the first, second, third and fourth quarters of fiscal 2018 included $3,185,000, $3,843,000, $5,209,000 and $5,644,000, respectively, related to the recognition of the McCall and Simplicity inventory step-up through cost of sales for the portion of acquired inventory that was sold during the period. The third and fourth quarters of fiscal 2018 net income (loss) included $3,243,000 and $168,000, respectively, of pre-tax transaction costs related to the acquisition of Simplicity. The fourth quarter of fiscal 2018 net loss included a charge of $27,125,000 (net of tax) related to the impairment of goodwill and an intangible asset as further described in Note 3 to the consolidated financial statements. Also included in the fourth quarter of fiscal 2018 net loss was $2,857,000 of pre-tax severance costs primarily related to the combination of the McCall and Simplicity sales and marketing departments. See Note 1 and Note 2 to the consolidated financial statements for further discussion of the McCall and Simplicity transactions. Additionally, the third quarter of fiscal 2018 included favorable income tax rate adjustments attributable to the Tax Act as further described in Note 7 to the consolidated financial statements.
The second and third quarters of fiscal 2017 net income included a non-taxable bargain purchase gain of $376,000 and $19,711,000, respectively, related to the purchase of the assets of Schiff in the second quarter and the purchase of the net assets and business of McCall in the third quarter. There was a reduction in the McCall bargain purchase gain of $97,000 recorded in the fourth quarter of fiscal 2017. Gross profit in the third and fourth quarters of fiscal 2017 included $452,000 and $3,125,000, respectively, related to the recognition of the McCall inventory step-up through cost of sales for the portion of acquired inventory that was sold during the period. See Note 1 and Note 2 to the consolidated financial statements for further discussion of the McCall and Schiff transactions. Additionally, the third and fourth quarter of fiscal 2017 included favorable income tax rate adjustments primarily attributable to the permanent reinvestment of current year foreign earnings and benefits of a state income tax nexus study as further described in Note 7 to the consolidated financial statements. The fourth quarter of fiscal 2017 net income included $2,473,000 of pre-tax transaction and transition costs related to the acquisition of McCall.
The seasonal nature of CSS’ business has historically resulted in comparatively lower sales and operating losses in the first and fourth quarters and comparatively higher sales levels and operating profits in the second and third quarters of the Company’s fiscal year, thereby causing significant fluctuations in the quarterly results of operations of the Company.
57
(15) SUBSEQUENT EVENT
On June 1, 2018, a subsidiary of the Company completed the acquisition of substantially all of the business and assets of Fitlosophy, Inc. ("Fitlosophy") for $2,500,000 in cash. The purchase price is subject to adjustment based on future net sales of certain products sold through fiscal 2023. Fitlosophy is devoted to creating, marketing, and distributing innovative products that inspire people to develop healthy habits by focusing on effective goal-setting through journaling. Products include a complete line of fitness and wellness planning products all sold under the fitlosophyTM, live life fitTM and fitbookTM brands.
58
Item 9. Changes in and Disagreements with Accountants on Accounting and Financial Disclosure.
None.
Item 9A. Controls and Procedures.
(a) Evaluation of Disclosure Controls and Procedures.
The Company’s management, with the participation of the Company’s President and Chief Executive Officer and Executive Vice President – Finance and Chief Financial Officer, evaluated the effectiveness of the Company’s disclosure controls and procedures (as defined in Securities Exchange Act of 1934 (“Exchange Act”) Rules 13a-15(e) or 15d-15(e)) as of the end of the period covered by this report as required by paragraph (b) of Exchange Act Rules 13a-15 or 15d-15. Based upon that evaluation, the President and Chief Executive Officer and Executive Vice President – Finance and Chief Financial Officer concluded that the Company’s disclosure controls and procedures are effective in providing reasonable assurance that information required to be disclosed by the Company in reports that it files or submits under the Exchange Act is recorded, processed, summarized and reported within the time periods specified in the Securities and Exchange Commission’s rules and procedures.
(b) Management’s Report on Internal Control over Financial Reporting.
Management is responsible for establishing and maintaining adequate internal control over financial reporting of the Company. Internal control over financial reporting is a process designed to provide reasonable assurance regarding the reliability of financial reporting and the preparation of financial statements for external purposes in accordance with accounting principles generally accepted in the United States of America.
The Company’s internal control over financial reporting includes those policies and procedures that (i) pertain to the maintenance of records that, in reasonable detail, accurately and fairly reflect the transactions and dispositions of the assets of the Company; (ii) provide reasonable assurance that transactions are recorded as necessary to permit preparation of financial statements in accordance with accounting principles generally accepted in the United States of America, and that receipts and expenditures of the Company are being made only in accordance with authorizations of management and directors of the Company; and (iii) provide reasonable assurance regarding prevention or timely detection of unauthorized acquisition, use or disposition of the Company’s assets that could have a material effect on the financial statements.
Because of its inherent limitations, internal control over financial reporting may not prevent or detect misstatements. Also, projections of any evaluation of effectiveness to future periods are subject to the risk that controls may become inadequate because of changes in conditions, or that the degree of compliance with the policies or procedures may deteriorate.
Management conducted an evaluation of the effectiveness of internal control over financial reporting based on the Internal Control – Integrated Framework (2013) issued by the Committee of Sponsoring Organizations of the Treadway Commission. Based on this evaluation, management concluded that the Company’s internal control over financial reporting was effective as of March 31, 2018. The Company’s internal control over financial reporting as of March 31, 2018 has been audited by KPMG LLP, an independent registered public accounting firm, as stated in their report which is included herein.
The Company acquired the net assets and business of Simplicity Creative Group on November 3, 2017, and management excluded from its assessment of the effectiveness of internal control over financial reporting as of March 31, 2018, Simplicity’s internal control over financial reporting associated with total assets of $74,108,000 and net sales of $35,581,000 included in the consolidated financial statements as of and for the year ended March 31, 2018.
(c) Changes in Internal Control over Financial Reporting.
There was no change in the Company’s internal control over financial reporting that occurred during the fourth quarter of fiscal year 2018 that has materially affected, or is reasonably likely to materially affect, the Company’s internal control over financial reporting.
59
(d) Report of Independent Registered Public Accounting Firm.
To the Stockholders and Board of Directors
CSS Industries, Inc.:
Opinion on Internal Control Over Financial Reporting
We have audited CSS Industries, Inc. and subsidiaries’ (the Company) internal control over financial reporting as of March 31, 2018, based on criteria established in Internal Control - Integrated Framework (2013) issued by the Committee of Sponsoring Organizations of the Treadway Commission. In our opinion, the Company maintained, in all material respects, effective internal control over financial reporting as of March 31, 2018, based on criteria established in Internal Control - Integrated Framework (2013) issued by the Committee of Sponsoring Organizations of the Treadway Commission.
We also have audited, in accordance with the standards of the Public Company Accounting Oversight Board (United States) (PCAOB), the consolidated balance sheets of the Company as of March 31, 2018 and 2017, the related consolidated statements of operations and comprehensive income (loss), cash flows and stockholders’ equity for each of the years in the three-year period ended March 31, 2018, and related notes and financial statement schedule II - valuation and qualifying accounts (collectively, the consolidated financial statements), and our report dated June 4, 2018 expressed an unqualified opinion on those consolidated financial statements.
The Company acquired the net assets and business of Simplicity Creative Group (Simplicity) on November 3, 2017, and management excluded from its assessment of the effectiveness of the Company’s internal control over financial reporting as of March 31, 2018, Simplicity’s internal control over financial reporting which is associated with total assets of $74,108,000 and total revenues of $35,581,000 included in the consolidated financial statements of the Company as of and for the year ended March 31, 2018. Our audit of internal control over financial reporting of the Company also excluded an evaluation of the internal control over financial reporting of Simplicity.
Basis for Opinion
The Company’s management is responsible for maintaining effective internal control over financial reporting and for its assessment of the effectiveness of internal control over financial reporting, included in the accompanying Management’s Report on Internal Control over Financial Reporting. Our responsibility is to express an opinion on the Company’s internal control over financial reporting based on our audit. We are a public accounting firm registered with the PCAOB and are required to be independent with respect to the Company in accordance with the U.S. federal securities laws and the applicable rules and regulations of the Securities and Exchange Commission and the PCAOB.
We conducted our audit in accordance with the standards of the PCAOB. Those standards require that we plan and perform the audit to obtain reasonable assurance about whether effective internal control over financial reporting was maintained in all material respects. Our audit of internal control over financial reporting included obtaining an understanding of internal control over financial reporting, assessing the risk that a material weakness exists, and testing and evaluating the design and operating effectiveness of internal control based on the assessed risk. Our audit also included performing such other procedures as we considered necessary in the circumstances. We believe that our audit provides a reasonable basis for our opinion.
Definition and Limitations of Internal Control Over Financial Reporting
A company’s internal control over financial reporting is a process designed to provide reasonable assurance regarding the reliability of financial reporting and the preparation of financial statements for external purposes in accordance with generally accepted accounting principles. A company’s internal control over financial reporting includes those policies and procedures that (1) pertain to the maintenance of records that, in reasonable detail, accurately and fairly reflect the transactions and dispositions of the assets of the company; (2) provide reasonable assurance that transactions are recorded as necessary to permit preparation of financial statements in accordance with generally accepted accounting principles, and that receipts and expenditures of the company are being made only in accordance with authorizations of management and directors of the company; and (3) provide reasonable assurance regarding prevention or timely detection of unauthorized acquisition, use, or disposition of the company’s assets that could have a material effect on the financial statements.
Because of its inherent limitations, internal control over financial reporting may not prevent or detect misstatements. Also, projections of any evaluation of effectiveness to future periods are subject to the risk that controls may become inadequate because of changes in conditions, or that the degree of compliance with the policies or procedures may deteriorate.
/s/ KPMG LLP
Philadelphia, PA
June 4, 2018
60
Item 9B. Other Information.
None.
61
PART III
Item 10. Directors, Executive Officers and Corporate Governance.
See “Our Board of Directors,” “Our Executive Officers,” “Section 16(a) Beneficial Ownership Reporting Compliance,” “Code of Ethics and Internal Disclosure Procedures (Employees) and Code of Business Conduct and Ethics (Board of Directors),” “Board Committees; Committee Membership; Committee Meetings” and “Audit Committee” in the Proxy Statement for the 2018 Annual Meeting of Stockholders of the Company, which is incorporated herein by reference.
Item 11. Executive Compensation.
See “Compensation Discussion and Analysis,” “Executive Compensation,” “Pay Ratio Disclosure,” “Human Resources Committee Interlocks and Insider Participation,” “Director Compensation” and “Human Resources Committee Report” in the Proxy Statement for the 2018 Annual Meeting of Stockholders of the Company, which is incorporated herein by reference.
Item 12. Security Ownership of Certain Beneficial Owners and Management and Related Stockholder Matters.
See “Ownership of CSS Common Stock” and “Securities Authorized for Issuance Under CSS’ Equity Compensation Plans” in the Proxy Statement for the 2018 Annual Meeting of Stockholders of the Company, which is incorporated herein by reference.
Item 13. Certain Relationships and Related Transactions, and Director Independence.
See “Board Independence” and “Related Party Transactions” in the Proxy Statement for the 2018 Annual Meeting of Stockholders of the Company, which is incorporated herein by reference.
Item 14. Principal Accounting Fees and Services.
See “Audit Committee” and “Our Independent Registered Public Accounting Firm, Their Fees and Their Attendance at the Annual Meeting” in the Proxy Statement for the 2018 Annual Meeting of Stockholders of the Company, which is incorporated herein by reference.
62
PART IV
Item 15. Exhibits and Financial Statement Schedules.
(a) | Following is a list of documents filed as part of this report: |
1. | Financial Statements |
2. | Financial Statement Schedules |
3. | Exhibits required by Item 601 of Regulation S-K, Including Those Incorporated by Reference (all of which are filed under Commission file number 1-2661) |
Articles of Incorporation and By-Laws
63
Management Contracts, Compensatory Plans or Arrangements
64
65
Other
*101.INS XBRL Instance Document.
*101.SCH XBRL Schema Document.
*101.CAL XBRL Taxonomy Extension Calculation Linkbase Document.
*101.LAB XBRL Taxonomy Extension Label Linkbase Document.
*101.PRE XBRL Taxonomy Extension Presentation Linkbase Document.
*101.DEF XBRL Taxonomy Extension Definition Linkbase Document.
* | Filed or furnished with this Annual Report on Form 10-K. |
66
CSS INDUSTRIES, INC. AND SUBSIDIARIES
SCHEDULE II
VALUATION AND QUALIFYING ACCOUNTS
Balance | Charged | ||||||||||||||||||||
at | to Costs | Charged | Balance | ||||||||||||||||||
Beginning | and | to Other | At End of | ||||||||||||||||||
of Period | Expenses | Accounts | Deductions | Period | |||||||||||||||||
Year ended March 31, 2018 | |||||||||||||||||||||
Accounts receivable allowances | $ | 1,283 | $ | 4,035 | $ | — | $ | 3,742 | $ | 1,576 | |||||||||||
Accrued customer programs | 5,030 | 15,940 | 11,147 | (a) | 19,324 | 12,793 | (b) | ||||||||||||||
Year ended March 31, 2017 | |||||||||||||||||||||
Accounts receivable allowances | $ | 1,363 | $ | 5,188 | $ | — | $ | 5,268 | $ | 1,283 | |||||||||||
Accrued customer programs | 3,275 | 9,716 | 2,296 | (c) | 10,257 | 5,030 | |||||||||||||||
Year ended March 31, 2016 | |||||||||||||||||||||
Accounts receivable allowances | $ | 1,059 | $ | 2,712 | $ | — | $ | 2,408 | $ | 1,363 | |||||||||||
Accrued customer programs | 4,042 | 6,423 | — | 7,190 | 3,275 | ||||||||||||||||
Accrued restructuring expenses | 32 | — | — | 32 | — | ||||||||||||||||
Notes: | |
(a) | Balance at acquisition of Simplicity Creative Group and certain subsidiaries. |
(b) | Classified in accrued customer programs and other long-term obligations in the accompanying consolidated balance sheet as of March 31, 2018. |
(c) | Balance at acquisition of The McCall Pattern Company and certain subsidiaries. |
67
SIGNATURES
Pursuant to the requirements of Section 13 or 15(d) of the Securities Exchange Act of 1934, the registrant has duly caused this Annual Report to be signed on behalf of the undersigned thereunto duly authorized.
CSS INDUSTRIES, INC. | |||||
Registrant | |||||
Dated: June 4, 2018 | By | /s/ Christopher J. Munyan | |||
Christopher J. Munyan, President and Chief Executive Officer | |||||
(principal executive officer) | |||||
Pursuant to the requirements of the Securities Exchange Act of 1934, this Annual Report has been signed below by the following persons on behalf of the registrant and in the capacities and on the dates indicated. | |||||
Dated: June 4, 2018 | /s/ Christopher J. Munyan | ||||
Christopher J. Munyan, President and Chief Executive Officer | |||||
(principal executive officer and a director) | |||||
Dated: June 4, 2018 | /s/ John M. Roselli | ||||
John M. Roselli, Executive Vice President—Finance and Chief Financial Officer | |||||
(principal financial and accounting officer) | |||||
Dated: June 4, 2018 | /s/ Scott A. Beaumont | ||||
Scott A. Beaumont, Director | |||||
Dated: June 4, 2018 | /s/ Robert E. Chappell | ||||
Robert E. Chappell, Director | |||||
Dated: June 4, 2018 | /s/ Stephen P. Crane | ||||
Stephen P. Crane, Director | |||||
Dated: June 4, 2018 | /s/ Elam M. Hitchner, III | ||||
Elam M. Hitchner, III, Director | |||||
Dated: June 4, 2018 | /s/ Rebecca C. Matthias | ||||
Rebecca C. Matthias, Director | |||||
Dated: June 4, 2018 | /s/ Harry J. Mullany, III | ||||
Harry J. Mullany, III, Director | |||||
Dated: June 4, 2018 | /s/ William Rulon-Miller | ||||
William Rulon-Miller, Director | |||||
68