Attached files
| file | filename |
|---|---|
| 8-K - FORM 8-K - KINDRED HEALTHCARE, INC | d579293d8k.htm |
Exhibit 99.1
Appendix
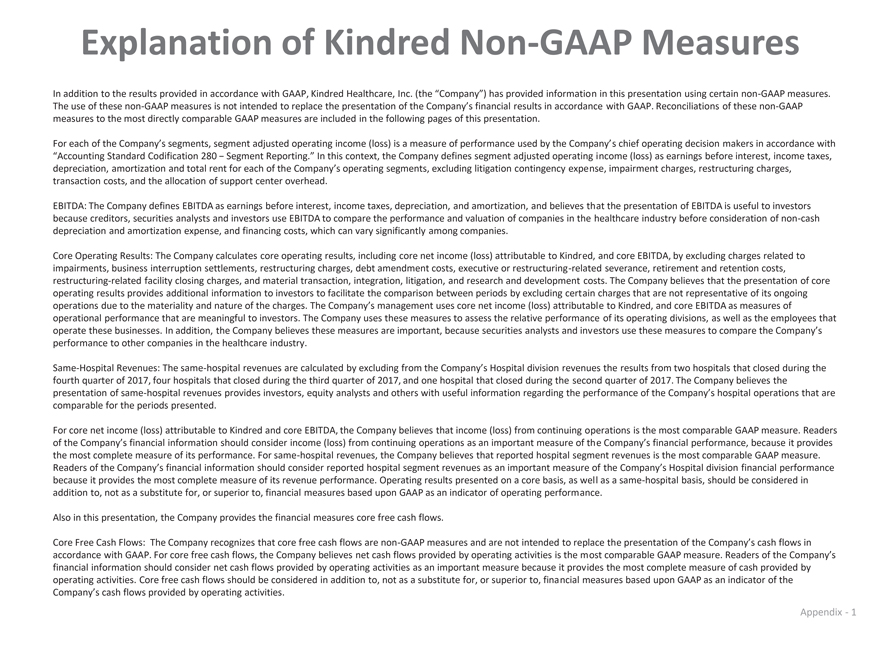
Explanation of Kindred Non-GAAP Measures In addition to the results provided in accordance with GAAP, Kindred Healthcare, Inc. (the “Company”) has provided information in this presentation using certain non-GAAP measures. The use of these non-GAAP measures is not intended to replace the presentation of the Company’s financial results in accordance with GAAP. Reconciliations of these non-GAAP measures to the most directly comparable GAAP measures are included in the following pages of this presentation. For each of the Company’s segments, segment adjusted operating income (loss) is a measure of performance used by the Company’s chief operating decision makers in accordance with “Accounting Standard Codification 280—Segment Reporting.” In this context, the Company defines segment adjusted operating income (loss) as earnings before interest, income taxes, depreciation, amortization and total rent for each of the Company’s operating segments, excluding litigation contingency expense, impairment charges, restructuring charges, transaction costs, and the allocation of support center overhead. EBITDA: The Company defines EBITDA as earnings before interest, income taxes, depreciation, and amortization, and believes that the presentation of EBITDA is useful to investors because creditors, securities analysts and investors use EBITDA to compare the performance and valuation of companies in the healthcare industry before consideration of non-cash depreciation and amortization expense, and financing costs, which can vary significantly among companies. Core Operating Results: The Company calculates core operating results, including core net income (loss) attributable to Kindred, and core EBITDA, by excluding charges related to impairments, business interruption settlements, restructuring charges, debt amendment costs, executive or restructuring-related severance, retirement and retention costs, restructuring-related facility closing charges, and material transaction, integration, litigation, and research and development costs. The Company believes that the presentation of core operating results provides additional information to investors to facilitate the comparison between periods by excluding certain charges that are not representative of its ongoing operations due to the materiality and nature of the charges. The Company’s management uses core net income (loss) attributable to Kindred, and core EBITDA as measures of operational performance that are meaningful to investors. The Company uses these measures to assess the relative performance of its operating divisions, as well as the employees that operate these businesses. In addition, the Company believes these measures are important, because securities analysts and investors use these measures to compare the Company’s performance to other companies in the healthcare industry. Same-Hospital Revenues: The same-hospital revenues are calculated by excluding from the Company’s Hospital division revenues the results from two hospitals that closed during the fourth quarter of 2017, four hospitals that closed during the third quarter of 2017, and one hospital that closed during the second quarter of 2017. The Company believes the presentation of same-hospital revenues provides investors, equity analysts and others with useful information regarding the performance of the Company’s hospital operations that are comparable for the periods presented. For core net income (loss) attributable to Kindred and core EBITDA, the Company believes that income (loss) from continuing operations is the most comparable GAAP measure. Readers of the Company’s financial information should consider income (loss) from continuing operations as an important measure of the Company’s financial performance, because it provides the most complete measure of its performance. For same-hospital revenues, the Company believes that reported hospital segment revenues is the most comparable GAAP measure. Readers of the Company’s financial information should consider reported hospital segment revenues as an important measure of the Company’s Hospital division financial performance because it provides the most complete measure of its revenue performance. Operating results presented on a core basis, as well as a same-hospital basis, should be considered in addition to, not as a substitute for, or superior to, financial measures based upon GAAP as an indicator of operating performance. Also in this presentation, the Company provides the financial measures core free cash flows. Core Free Cash Flows: The Company recognizes that core free cash flows are non-GAAP measures and are not intended to replace the presentation of the Company’s cash flows in accordance with GAAP. For core free cash flows, the Company believes net cash flows provided by operating activities is the most comparable GAAP measure. Readers of the Company’s financial information should consider net cash flows provided by operating activities as an important measure because it provides the most complete measure of cash provided by operating activities. Core free cash flows should be considered in addition to, not as a substitute for, or superior to, financial measures based upon GAAP as an indicator of the Company’s cash flows provided by operating activities.
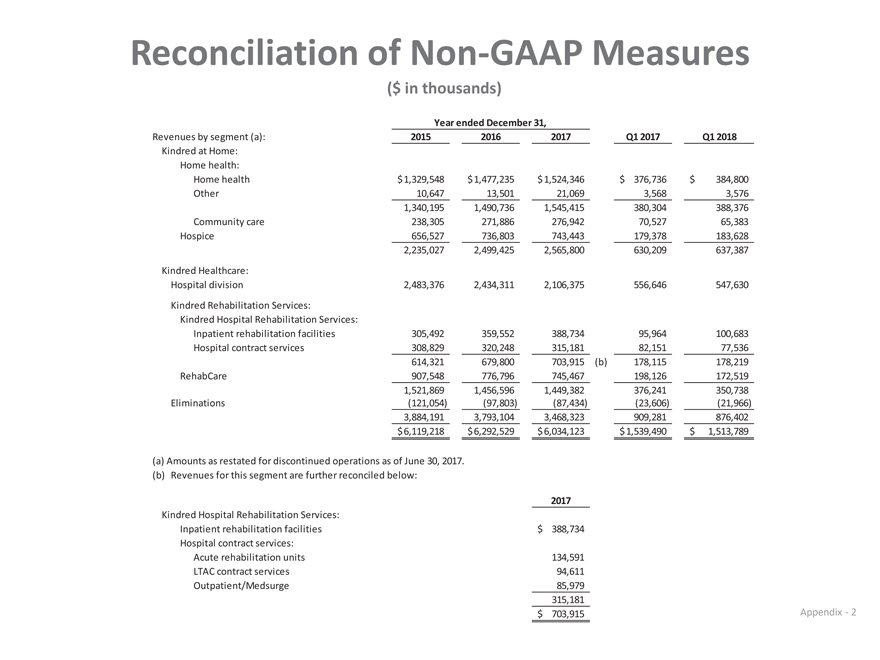
Reconciliation of Non-GAAP Measures ($ in thousands) Year ended December 31 Revenues by segment (a): 2015 2016 2017 Q1 2017 Q1 2018 Kindred at Home: Home health: Home health $ 1,329,548 $ 1,477,235 $ 1,524,346 $ 376,736 $ 3 84,800 Other 10,647 1 3,501 2 1,069 3,568 3 ,576 1,340,195 1 ,490,736 1 ,545,415 380,304 388,376 Community care 238,305 271,886 276,942 7 0,527 65,383 Hospice 656,527 736,803 743,443 179,378 183,628 2,235,027 2 ,499,425 2 ,565,800 630,209 637,387 Kindred Healthcare: Hospital division 2 ,483,376 2 ,434,311 2 ,106,375 556,646 547,630 Kindred Rehabilitation Services: Kindred Hospital Rehabilitation Services: Inpatient rehabilitation facilities 305,492 359,552 388,734 9 5,964 100,683 Hospital contract services 308,829 320,248 315,181 8 2,151 77,536 614,321 679,800 703,915 (b) 178,115 178,219 RehabCare 907,548 776,796 745,467 198,126 172,519 1,521,869 1 ,456,596 1 ,449,382 376,241 350,738 Eliminations (121,054) (97,803) (87,434) (23,606) ( 21,966) 3,884,191 3 ,793,104 3 ,468,323 909,281 876,402 $ 6,119,218 $ 6,292,529 $ 6,034,123 $ 1,539,490 $ 1,513,789 (a) Amounts as restated for discontinued operations as of June 30, 2017. (b) Revenues for this segment are further reconciled below: 2017 Kindred Hospital Rehabilitation Services: Inpatient rehabilitation facilities $ 388,734 Hospital contract services: Acute rehabilitation units 134,591 LTAC contract services 94,611 Outpatient/Medsurge 85,979 315,181 $ 703,915 Appendix—2
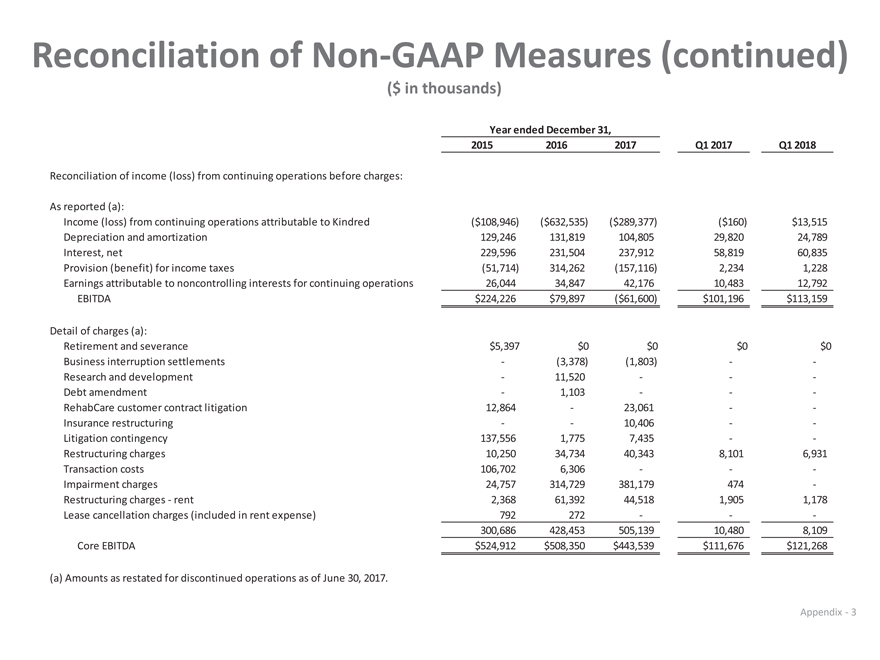
Reconciliation of Non-GAAP Measures (continued) 2015 2016 2017 Q1 2017 Q1 2018 Reconciliation of income (loss) from continuing operations before charges: As reported (a): Income (loss) from continuing operations attributable to Kindred ($108,946) ($632,535) ($289,377) ($160) $13,515 Depreciation and amortization 129,246 131,819 104,805 2 9,820 2 4,789 Interest, net 229,596 231,504 237,912 5 8,819 6 0,835 Provision (benefit) for income taxes (51,714) 314,262 ( 157,116) 2,234 1,228 Earnings attributable to noncontrolling interests for continuing operations 26,044 3 4,847 4 2,176 1 0,483 1 2,792 EBITDA $224,226 $79,897 ($61,600) $101,196 $113,159 Detail of charges (a): Retirement and severance $5,397 $0 $0 $0 $0 Business interruption settlements—(3,378) (1,803) — Research and development—1 1,520 ——Debt amendment—1,103 ——RehabCare customer contract litigation 12,864—2 3,061 — Insurance restructuring — 1 0,406 — Litigation contingency 137,556 1,775 7,435 — Restructuring charges 10,250 3 4,734 4 0,343 8,101 6,931 Transaction costs 106,702 6,306 ——Impairment charges 24,757 314,729 381,179 4 74—Restructuring charges—rent 2,368 6 1,392 4 4,518 1,905 1,178 Lease cancellation charges (included in rent expense) 792 2 72 ——300,686 428,453 505,139 1 0,480 8,109 Core EBITDA $524,912 $508,350 $443,539 $111,676 $121,268 (a) Amounts as restated for discontinued operations as of June 30, 2017. Year ended December 31, ($ in thousands) Appendix – 3
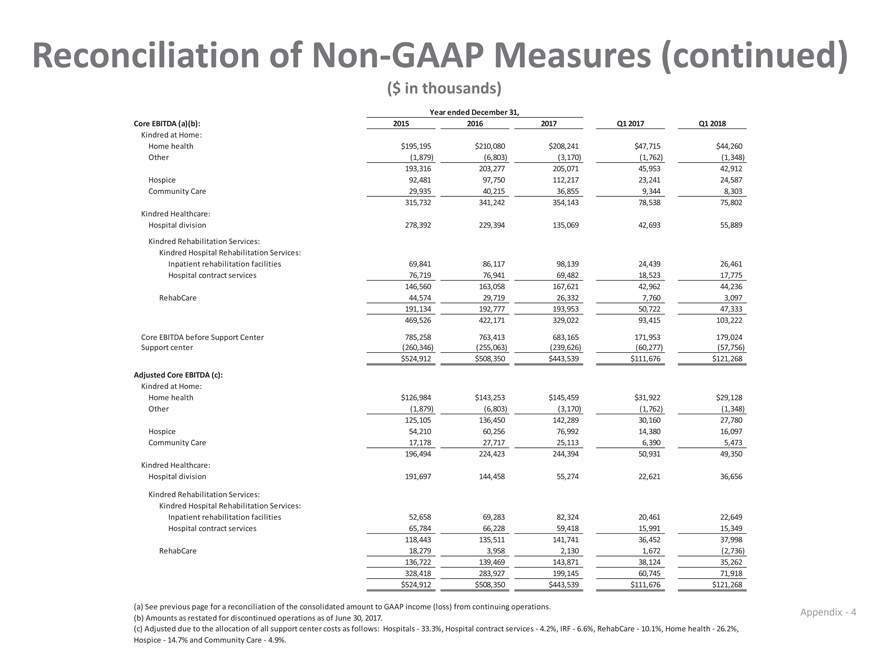
Core EBITDA (a)(b): 2015 2016 2017 Q1 2017 Q1 2018 Kindred at Home: Home health $195,195 $210,080 $208,241 $47,715 $44,260 Other ( 1,879) ( 6,803) ( 3,170) (1,762) ( 1,348) 1 93,316 2 03,277 2 05,071 45,953 42,912 Hospice 92,481 97,750 1 12,217 23,241 24,587 Community Care 29,935 40,215 36,855 9,344 8,303 3 15,732 3 41,242 3 54,143 78,538 75,802 Kindred Healthcare: Hospital division 2 78,392 2 29,394 1 35,069 42,693 55,889 Kindred Rehabilitation Services: Kindred Hospital Rehabilitation Services: Inpatient rehabilitation facilities 69,841 86,117 98,139 24,439 26,461 Hospital contract services 76,719 76,941 69,482 18,523 17,775 1 46,560 1 63,058 1 67,621 42,962 44,236 RehabCare 44,574 29,719 26,332 7,760 3,097 1 91,134 1 92,777 1 93,953 50,722 47,333 4 69,526 4 22,171 3 29,022 93,415 1 03,222 Core EBITDA before Support Center 7 85,258 7 63,413 6 83,165 171,953 1 79,024 Support center (260,346) (255,063) (239,626) (60,277) (57,756) $524,912 $508,350 $443,539 $111,676 $121,268 Adjusted Core EBITDA (c): Kindred at Home: Home health $126,984 $143,253 $145,459 $31,922 $29,128 Other ( 1,879) ( 6,803) ( 3,170) (1,762) ( 1,348) 1 25,105 1 36,450 1 42,289 30,160 27,780 Hospice 54,210 60,256 76,992 14,380 16,097 Community Care 17,178 27,717 25,113 6,390 5,473 1 96,494 2 24,423 2 44,394 50,931 49,350 Kindred Healthcare: Hospital division 1 91,697 1 44,458 55,274 22,621 36,656 Kindred Rehabilitation Services: Kindred Hospital Rehabilitation Services: Inpatient rehabilitation facilities 52,658 69,283 82,324 20,461 22,649 Hospital contract services 65,784 66,228 59,418 15,991 15,349 1 18,443 1 35,511 1 41,741 36,452 37,998 RehabCare 18,279 3,958 2,130 1,672 ( 2,736) 1 36,722 1 39,469 1 43,871 38,124 35,262 3 28,418 2 83,927 1 99,145 60,745 71,918 $524,912 $508,350 $443,539 $111,676 $121,268 (a) See previous page for a reconciliation of the consolidated amount to GAAP income (loss) from continuing operations. (b) Amounts as restated for discontinued operations as of June 30, 2017. Year ended December 31, (c) Adjusted due to the allocation of all support center costs as follows: Hospitals—33.3%, Hospital contract services—4.2%, IRF—6.6%, RehabCare—10.1%, Home health—26.2%, Hospice—14.7% and Community Care—4.9%. ($ in thousands) Reconciliation of Non-GAAP Measures (continued) Appendix – 4
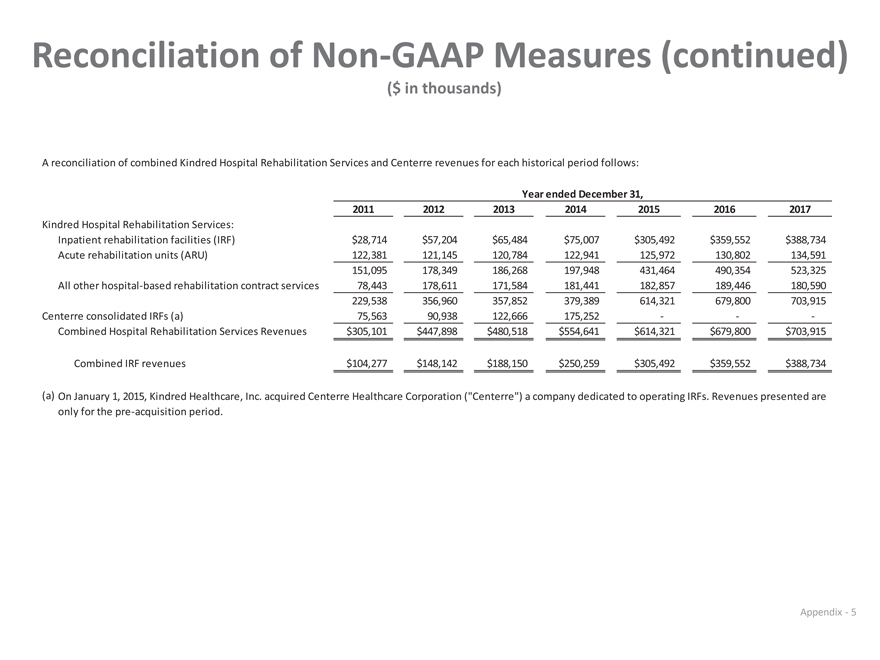
A reconciliation of combined Kindred Hospital Rehabilitation Services and Centerre revenues for each historical period follows: 2011 2012 2013 2014 2015 2016 2017 Kindred Hospital Rehabilitation Services: Inpatient rehabilitation facilities (IRF) $28,714 $57,204 $65,484 $75,007 $305,492 $359,552 $388,734 Acute rehabilitation units (ARU) 122,381 121,145 120,784 122,941 125,972 130,802 134,591 151,095 178,349 186,268 197,948 431,464 490,354 523,325 All other hospital-based rehabilitation contract services 78,443 178,611 171,584 181,441 182,857 189,446 180,590 229,538 356,960 357,852 379,389 614,321 679,800 703,915 Centerre consolidated IRFs (a) 75,563 90,938 122,666 175,252 ——Combined Hospital Rehabilitation Services Revenues $305,101 $447,898 $480,518 $554,641 $614,321 $679,800 $703,915 Combined IRF revenues $104,277 $148,142 $188,150 $250,259 $305,492 $359,552 $388,734 (a) For Centerre, only periods prior to acquisition are presented, or prior to January 1, 2015. Year ended December 31, On January 1, 2015, Kindred Healthcare, Inc. acquired Centerre Healthcare Corporation (“Centerre”) a company dedicated to operating IRFs. Revenues presented are only for the pre-acquisition period, one of which will convert to an inpatient rehabilitation facility. ($ in thousands) Reconciliation of Non-GAAP Measures (continued) Appendix – 5
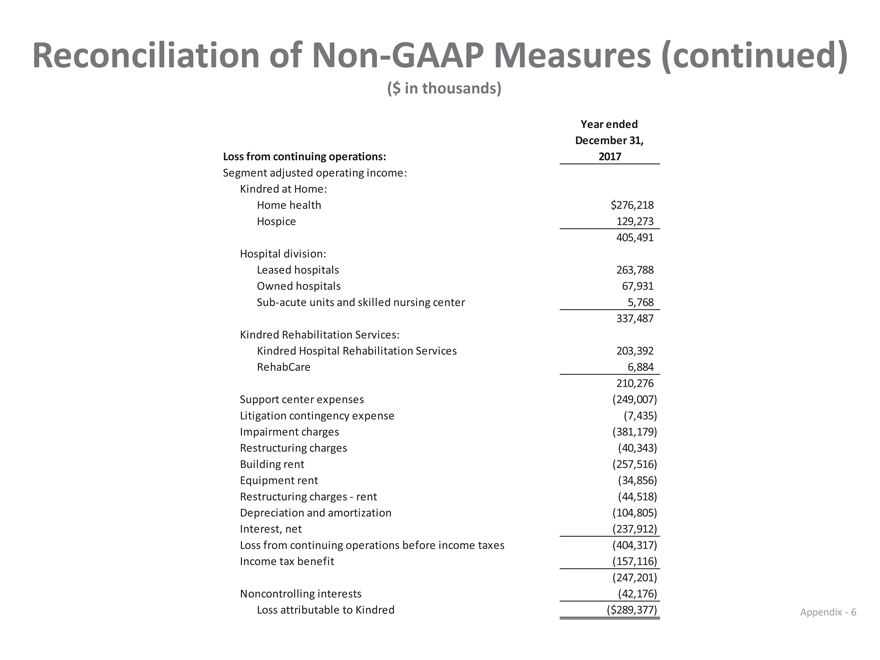
Year ended December 31, Loss from continuing operations: 2017 Segment adjusted operating income: Kindred at Home: Home health $276,218 Hospice 129,273 405,491 Hospital division: Leased hospitals 263,788 Owned hospitals 67,931 Sub-acute units and skilled nursing center 5,768 337,487 Kindred Rehabilitation Services: Kindred Hospital Rehabilitation Services 203,392 RehabCare 6,884 210,276 Support center expenses (249,007) Litigation contingency expense (7,435) Impairment charges (381,179) Restructuring charges (40,343) Building rent (257,516) Equipment rent (34,856) Restructuring charges—rent (44,518) Depreciation and amortization (104,805) Interest, net (237,912) Loss from continuing operations before income taxes (404,317) Income tax benefit (157,116) (247,201) Noncontrolling interests (42,176) Loss attributable to Kindred ($289,377) ($ in thousands) Reconciliation of Non-GAAP Measures (continued) Appendix – 6
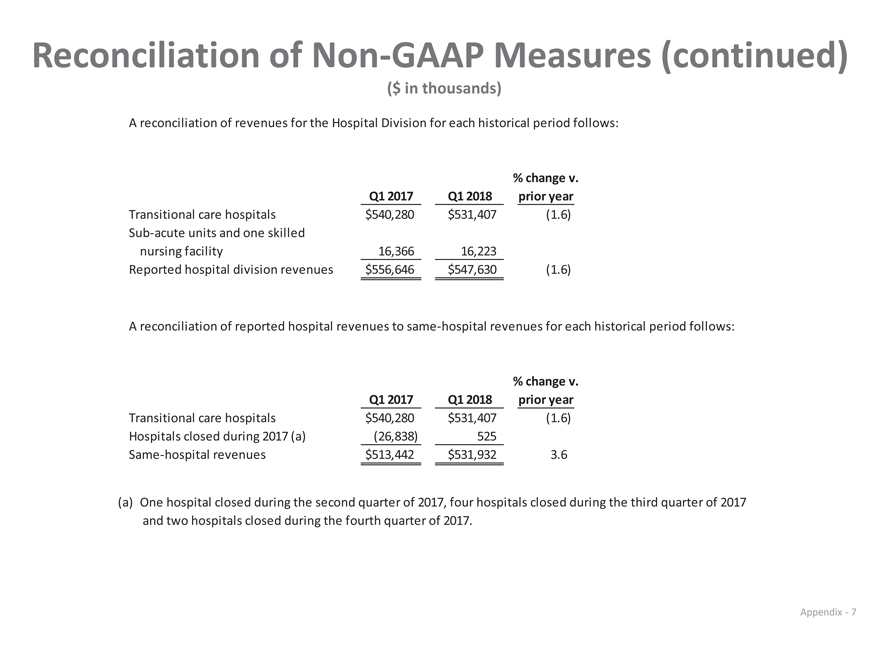
A reconciliation of revenues for the Hospital Division for each historical period follows: % change v. Q1 2017 Q1 2018 prior year Transitional care hospitals $540,280 $531,407 (1.6) Sub-acute units and one skilled nursing facility 16,366 16,223 Reported hospital division revenues $556,646 $547,630 (1.6) A reconciliation of reported hospital revenues to same-hospital revenues for each historical period follows: % change v. Q1 2017 Q1 2018 prior year Transitional care hospitals $540,280 $531,407 (1.6) Hospitals closed during 2017 (a) ( 26,838) 525 Same-hospital revenues $513,442 $531,932 3.6 (a) One hospital closed during the second quarter of 2017, four hospitals closed during the third quarter of 2017 and two hospitals closed during the fourth quarter of 2017. ($ in thousands) Reconciliation of Non-GAAP Measures (continued) Appendix – 7
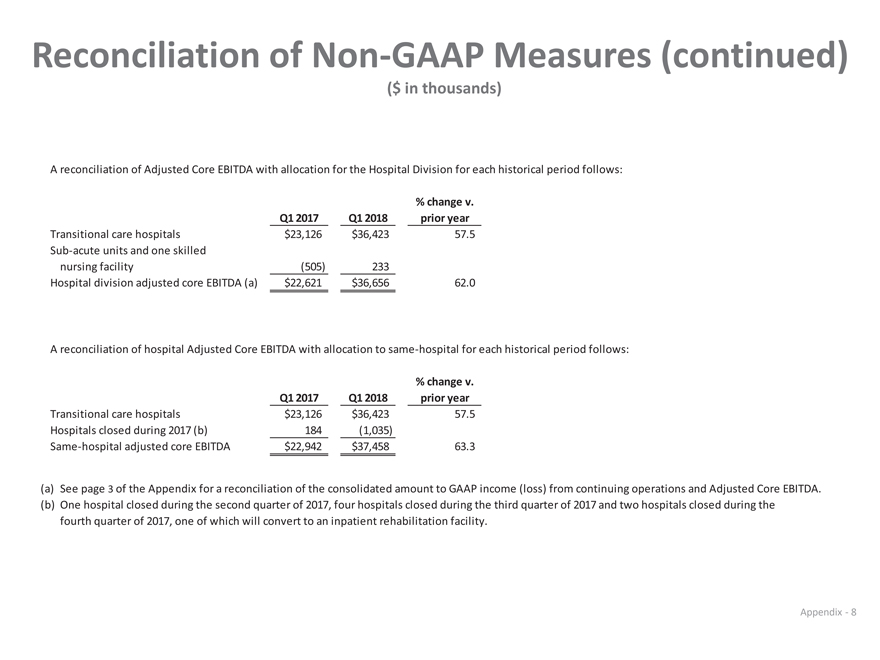
A reconciliation of Adjusted Core EBITDA with allocation for the Hospital Division for each historical period follows: % change v. Q1 2017 Q1 2018 prior year Transitional care hospitals $23,126 $36,423 57.5 Sub-acute units and one skilled nursing facility (505) 233 Hospital division adjusted core EBITDA (a) $22,621 $36,656 62.0 A reconciliation of hospital Adjusted Core EBITDA with allocation to same-hospital for each historical period follows: % change v. Q1 2017 Q1 2018 prior year Transitional care hospitals $23,126 $36,423 57.5 Hospitals closed during 2017 (b) 184 ( 1,035) Same-hospital adjusted core EBITDA $22,942 $37,458 63.3 (a) See page 6 of the Appendix for a reconciliation of the consolidated amount to GAAP income (loss) from continuing operations and Adjusted Core EBITDA. (b) One hospital closed during the second quarter of 2017, four hospitals closed during the third quarter of 2017 and two hospitals closed during the fourth quarter of 2017, one of which will convert to an inpatient rehabilitation facility. ($ in thousands) Reconciliation of Non-GAAP Measures (continued) Appendix—8