Attached files
| file | filename |
|---|---|
| EX-23.1 - CONSENT OF KPMG LLP, INDEPENDENT REGISTERED PUBLIC ACCOUNTING FIRM - ELECTRONIC ARTS INC. | ex-231kpmgconsent33118.htm |
| EX-32.2 - CERTIFICATION OF CHIEF FINANCIAL OFFICER PURSUANT TO SECTION 906 - ELECTRONIC ARTS INC. | ex-322sec906cfocert33118.htm |
| EX-32.1 - CERTIFICATION OF CHIEF EXECUTIVE OFFICER PURSUANT TO SECTION 906 - ELECTRONIC ARTS INC. | ex-321sec906ceocert33118.htm |
| EX-31.2 - CERTIFICATION OF CHIEF FINANCIAL OFFICER PURSUANT TO RULE 13A-14(A) - ELECTRONIC ARTS INC. | ex-312sec302cfocert33118.htm |
| EX-31.1 - CERTIFICATION OF CHIEF EXECUTIVE OFFICER PURSUANT TO RULE 13A-14(A) - ELECTRONIC ARTS INC. | ex-311sec302ceocert33118.htm |
| EX-21.1 - SUBSIDIARIES OF THE REGISTRANT - ELECTRONIC ARTS INC. | ex-211subsidiariesofthereg.htm |
| EX-12.1 - RATIO OF EARNINGS TO FIXED CHARGES - ELECTRONIC ARTS INC. | ex-121ratioofearningstofix.htm |
UNITED STATES SECURITIES AND EXCHANGE COMMISSION
Washington, D.C. 20549
Form 10-K
þ | ANNUAL REPORT PURSUANT TO SECTION 13 OR 15(d) OF THE SECURITIES EXCHANGE ACT OF 1934 | |
For the fiscal year ended March 31, 2018
OR
¨ | TRANSITION REPORT PURSUANT TO SECTION 13 OR 15(d) OF THE SECURITIES EXCHANGE ACT OF 1934 | |
For the transition period from to
Commission File No. 000-17948
ELECTRONIC ARTS INC.
(Exact name of registrant as specified in its charter)
Delaware | 94-2838567 | |
(State or other jurisdiction of incorporation or organization) | (I.R.S. Employer Identification No.) | |
209 Redwood Shores Parkway | 94065 | |
Redwood City, California | (Zip Code) | |
(Address of principal executive offices) | ||
Registrant’s telephone number, including area code:
(650) 628-1500
Securities registered pursuant to Section 12(b) of the Act:
Title of Each Class | Name of Each Exchange on Which Registered | |
Common Stock, $0.01 par value | NASDAQ Global Select Market | |
Securities registered pursuant to Section 12(g) of the Act:
None
Indicate by check mark if the registrant is a well-known seasoned issuer, as defined in Rule 405 of the Securities Act. Yes þ No ¨
Indicate by check mark if the registrant is not required to file reports pursuant to Section 13 or Section 15(d) of the Act. Yes ¨ No þ
Indicate by check mark whether the registrant (1) has filed all reports required to be filed by Section 13 or 15(d) of the Securities Exchange Act of 1934 during the preceding 12 months (or for such shorter period that the registrant was required to file such reports), and (2) has been subject to such filing requirements for the past 90 days. Yes þ No ¨
Indicate by check mark whether the registrant has submitted electronically and posted on its corporate Web site, if any, every Interactive Data File required to be submitted and posted pursuant to Rule 405 of Regulation S-T (§ 232.405 of this chapter) during the preceding 12 months (or for such shorter period that the registrant was required to submit and post such files). Yes þ No ¨
Indicate by check mark if disclosure of delinquent filers pursuant to Item 405 of Regulation S-K (§ 229.405 of this chapter) is not contained herein, and will not be contained, to the best of registrant’s knowledge, in definitive proxy or information statements incorporated by reference in Part III of this Form 10-K or any amendment to this Form 10-K. þ
Indicate by check mark whether the registrant is a large accelerated filer, an accelerated filer, a non-accelerated filer, a smaller reporting company, or an emerging growth company. See the definitions of “large accelerated filer,” “accelerated filer,” “smaller reporting company,” and “emerging growth company” in Rule 12b-2 of the Exchange Act.
Large accelerated filer þ | Accelerated filer ¨ | Non-accelerated filer ¨ | Smaller reporting company ¨ | |||
Emerging growth company ¨ | (Do not check if a smaller reporting company) | |||||
If an emerging growth company, indicate by check mark if the registrant has elected not to use the extended transition period for complying with any new or revised financial accounting standards provided pursuant to Section 13(a) of the Exchange Act. ¨
Indicate by check mark whether the registrant is a shell company (as defined in Rule 12b-2 of the Exchange Act). Yes ¨ No þ
The aggregate market value of the registrant’s common stock, $0.01 par value, held by non-affiliates of the registrant as of September 30, 2017, the last business day of our second fiscal quarter, was $35,692 million.
As of May 21, 2018, there were 306,832,936 shares of the registrant’s common stock, $0.01 par value, outstanding.
Documents Incorporated by Reference
Portions of the registrant’s definitive proxy statement for its 2018 Annual Meeting of Stockholders (the “2018 Proxy”) are incorporated by reference into Part III hereof. The 2018 Proxy is expected to be filed not later than 120 days after the registrant’s fiscal year end. Except with respect to information specifically incorporated by reference into this Form 10-K, the 2018 Proxy is not deemed to be filed as part hereof.
ELECTRONIC ARTS INC.
2018 FORM 10-K ANNUAL REPORT
Table of Contents
Page | ||
PART I | ||
Item 1 | ||
Item 1A | ||
Item 1B | ||
Item 2 | ||
Item 3 | ||
Item 4 | ||
PART II | ||
Item 5 | ||
Item 6 | ||
Item 7 | ||
Item 7A | ||
Item 8 | ||
Item 9 | ||
Item 9A | ||
Item 9B | ||
PART III | ||
Item 10 | ||
Item 11 | ||
Item 12 | ||
Item 13 | ||
Item 14 | ||
PART IV | ||
Item 15 | ||
2
CAUTIONARY NOTE ABOUT FORWARD-LOOKING STATEMENTS
This Report contains forward-looking statements within the meaning of the Private Securities Litigation Reform Act of 1995. All statements, other than statements of historical fact, made in this Report are forward looking. Examples of forward-looking statements include statements related to industry prospects, our future economic performance including anticipated revenues and expenditures, results of operations or financial position, and other financial items, trends in our business, our business plans and objectives, including our intended product releases, and may include certain assumptions that underlie the forward-looking statements. We use words such as “anticipate,” “believe,” “expect,” “intend,” “estimate” (and the negative of any of these terms), “future” and similar expressions to help identify forward-looking statements. These forward-looking statements are subject to business and economic risk and reflect management’s current expectations, and involve subjects that are inherently uncertain and difficult to predict. Our actual results could differ materially from those in the forward-looking statements. We will not necessarily update information if any forward-looking statement later turns out to be inaccurate. Risks and uncertainties that may affect our future results include, but are not limited to, those discussed under the heading “Risk Factors,” beginning on page 9.
PART I
Item 1: Business
Overview
We are a global leader in digital interactive entertainment, with a mission to inspire the world to play. We develop, market, publish and distribute games, content and services that can be played on a variety of platforms, including game consoles, PCs, mobile phones and tablets.
Our Strategic Pillars
There are three core pillars to our strategy:
•Players First
•Commitment to Digital
•One EA
These strategic pillars are built on our focus of delivering a broad and deep portfolio of games and services that engages players across a wide range of geographies, platforms and business models.
Players First
Players are the foundation of our success, and we are committed to thinking about players first in everything we do. Our goal is to build deep, on-going and meaningful relationships with our players. We aim to build these relationships by creating amazing games and services that deliver long-lasting fun and enduring value, by connecting with our players across platforms and social channels, and by delivering flexibility and innovation in our business models.
Our games and services are based on a portfolio of intellectual property that includes established brands such as FIFA, Madden NFL, Star Wars, Battlefield, the Sims and Need for Speed. We develop and publish a broad and deep portfolio of games and services that engage players across geographies, platforms and business models.
Commitment to Digital
Players increasingly purchase our games as digital downloads, as opposed to purchasing physical discs, and engage with the live services that we provide on an ongoing basis. Our live services provide additional depth and engagement opportunities for our players and include microtransactions, extra content, subscriptions, and esports. For example, the Ultimate Team mode associated with our sports franchises and live services provided for our Star Wars, Battlefield and Sims franchises, have extended the life of those games by engaging players over longer periods of time. The digital transformation also is creating opportunities in platforms, content models and the way in which players engage with our games and services. For example, we have leveraged brands and assets from franchises historically associated with consoles and traditional PC gaming, such as FIFA, Madden NFL, The Sims, SimCity, and Star Wars, to create successful mobile games that are monetized through live services provided with the game. We also offer subscription services, such as EA Access and Origin Access, as we look to build deeper relationships with our players.
3
We have significantly increased our digital net revenue from $2.409 billion in fiscal year 2016 to $2.874 billion in fiscal year 2017 and $3.450 billion during fiscal year 2018. It now comprises 67% of our total net revenue. We believe that our digital revenue, which generally has a higher gross margin relative to packaged goods revenue, will continue to increase during fiscal year 2019, both relative to packaged goods revenue and in absolute terms as we continue to focus on developing and monetizing products and services that can be delivered digitally.
One EA
As a global leader in digital interactive entertainment, we have an opportunity to leverage our scale to deliver engaging games and services to more players across more platforms. Our “One EA” model provides strategic advantages. For example, we have moved substantially all of our PC and console development to one game engine and are working to do the same for the development of our mobile games and services. This transition has created operational flexibility as our development teams now code on a consistent engine and can work across titles. In addition, it has accelerated the pace of our development as content and technological advances are leveraged across franchises. We also can transition our products and services to new platforms quickly and cost-effectively.
We also are strengthening our player network, connecting our players to each other and to the games they love. We are adopting consistent, cross-company methodologies to better understand our players’ needs and continue to invest in technology that enables us to build personalized player relationships that can last for years instead of days or weeks by connecting our players to us and to each other. This connection allows us to market and deliver content and services for popular franchises like FIFA, Battlefield and Star Wars to our players more efficiently. That same foundation also enables new player-centric ways to discover and try new games and experiences, such as our subscription-based EA Access and Origin Access services.
Our Games and Services
We develop, market, publish and deliver games and services that can be played on a variety of platforms, including consoles, PCs, mobile phones and tablets. We market and sell our games and services through digital distribution channels and through retail channels. We believe that flexibility across platforms, distribution channels and business models is critical to maintaining and growing our player base, as well as increasing engagement with our games and services. New platforms, engagement models and business models are expected to continue to emerge in the future, and we intend to evaluate these opportunities on a case-by-case basis.
Digitally, our console games and services can be purchased through third-party storefronts, such as the digital stores of our console platform partners Sony, Microsoft and Nintendo. Our direct sales to Sony and Microsoft represented approximately 27 percent and 16 percent of total net revenue, respectively, in fiscal 2018; approximately 19 percent and 17 percent of total net revenue, respectively, in fiscal 2017; and approximately 16 percent and 14 percent of total net revenue, respectively, in fiscal 2016. Our mobile and tablet games and services are available through third-party application storefronts such as the Apple App Store and Google Play. Our PC games and services can be downloaded directly through our Origin platform, as well as through third-party online download stores. We also partner with third parties to publish our mobile and PC games and services on their platforms in certain Asian territories, such as our partnerships with Tencent Holdings Limited and Nexon Co. Ltd. for FIFA Online in China and Korea, respectively. Players also can access a selection of our console and PC games and services through our EA Access and Origin Access subscription services. Our packaged goods games are sold directly to mass market retailers, electronics specialty stores and game software specialty stores or through distribution arrangements.
In our games and services, we use brands that we either wholly own (such as Battlefield, Mass Effect, Need for Speed, The Sims and Plants v. Zombies) or license from others (such as FIFA, Madden NFL and Star Wars). We develop and publish games and services across diverse genres such as sports, first-person shooter, action, role-playing and simulation. We believe that the breadth and depth of our portfolio gives us the opportunity to engage an increasing number of players across more platforms and geographies and through more business models.
Our largest and most popular game is FIFA, the annualized version of which is consistently one of the best-selling games in the marketplace. Net revenue from FIFA 18, FIFA 17, and FIFA 16 represented approximately 11 percent of our total net revenue in fiscal years 2018, 2017, and 2016, respectively.
Within our games, we offer live services, including microtransactions, downloadable content, subscriptions, and esports, that provide additional depth and engagement opportunities for our players. Our live services net revenue comprised 40% of our total net revenue during fiscal year 2018 and we expect that live services net revenue will continue to be material to our business. Our most popular live service is the Ultimate Team mode associated with our sports franchises. Ultimate Team allows
4
players to collect and trade current and former professional players in order to build, and compete as, a personalized team. Net revenue from Ultimate Team represented approximately 21 percent, 16 percent and 15 percent of our total net revenue during fiscal year 2018, 2017 and 2016, respectively, a substantial portion of which was derived from FIFA Ultimate Team.
We also are investing in a number of long-term initiatives that we believe will allow us to better serve and deepen our engagement with our players, such as our focus on esports through our Competitive Gaming Division. We believe that the interest and enthusiasm that surrounds esports will drive sales of our games and engagement with our live services in addition to providing revenue through partnerships with sponsors and broadcasters.
Significant Relationships
Sony & Microsoft. Under the terms of agreements we have entered into with Sony Computer Entertainment Inc. and its affiliates and with Microsoft Corporation and its affiliates, we are authorized to develop and distribute disc-based and digitally-delivered software products and services compatible with PlayStation and Xbox consoles, respectively. Under these agreements with Sony and Microsoft, we are provided with the non-exclusive right to use, for a fixed term and in a designated territory, technology that is owned or licensed by them to publish our games on their respective platform. With respect to our digitally-delivered products and services, the console manufacturers pay us either a wholesale price or a “royalty” percentage on the revenue they derive from their sales of our products and services. Our transactions for packaged goods products are made pursuant to individual purchase orders, which are accepted on a case-by case basis by Sony or Microsoft (or their designated replicators), as the case may be. For packaged goods products, we pay the console manufacturers a per-unit royalty for each unit manufactured. Many key commercial terms of our relationships with Sony and Microsoft — such as manufacturing terms, delivery times, platform policies and approval conditions — are determined unilaterally, and are subject to change by the console manufacturers.
The platform license agreements also require us to indemnify the console manufacturers for any loss, liability and expense resulting from any claim against the console manufacturer regarding our games and services, including any claims for patent, copyright or trademark infringement brought against the console manufacturer. Each platform license may be terminated by the console manufacturer if a breach or default by us is not cured after we receive written notice from the console manufacturer, or if we become insolvent. The console manufacturers are not obligated to enter into platform license agreements with us for any future consoles, products or services.
Apple, Google and Other App Stores. We have agreements to distribute our mobile applications and additional content through distributors such as Apple and Google. Our applications are downloaded for mobile devices from third party application storefronts. The distributor charges consumers for content purchased within the application or charges consumers a one-time fee to download the application. Our distribution agreements establish the amounts that are retained by the distributor and the amounts passed through to us. These arrangements are typically terminable on short notice. The agreements generally do not obligate the distributors to market or distribute any of our applications.
Publishing Partners in Asia. We have entered into agreements whereby we partner with certain companies, including Tencent Holdings Limited and Nexon Co., Ltd. or their respective affiliates, pursuant to which these companies publish our mobile and PC free-to-download games in certain Asian territories, including China and Korea. Our players access games from the publishers’ platforms and are charged for additional content purchased within our game environment. The agreements generally establish the amounts that are retained by the publisher, and the amounts passed through to us.
Competition
The market for interactive entertainment is intensely competitive and changes rapidly as new products and platforms are introduced. We also face competition for the right to use certain intellectual property included in our products. We face significant competition from companies such as Activision Blizzard, Take-Two Interactive, Ubisoft, Bethesda, Epic Games Tencent, Sony and Microsoft, primarily with respect to developing games and services that operate on consoles, PCs and/or mobile devices.
More broadly, we compete against providers of different sources of entertainment, such as motion pictures, television, social networking, online casual entertainment and music that our players could enjoy in their free time. Important competitive factors in our industry include game quality and ease of use, innovation, compatibility of products with certain platforms, brand recognition, publisher reputation, reliability, security, price, marketing, and quality of customer service.
5
Intellectual Property
To establish and protect our intellectual property, we rely on a combination of copyrights, trademarks, patents, patent applications, trade secrets, know-how, license agreements, confidentiality provisions and procedures and other contractual provisions. We actively engage in enforcement and other activities to protect our intellectual property. In addition, we engage in activities designed to limit the impact of abuse of our digital products and services, including monitoring our games for evidence of exploitation and re-balancing our game environments in the event that such abuse is discovered.
Governmental Regulation
We are subject to a number of foreign and domestic laws and regulations that affect companies conducting business on the Internet. In addition, laws and regulations that may have an impact on our business relating to user privacy, data collection, retention, electronic commerce, virtual items and currency, consumer protection, content, advertising, localization and information security have been adopted or are being considered for adoption by many countries throughout the world.
Seasonality
We have historically experienced the highest percentage of our sales in our third fiscal quarter due to seasonal holiday demand and the launch timing of our games. While we expect this trend to continue in fiscal year 2019, there is no assurance that it will. In addition, we have historically deferred the recognition of a significant amount of net revenue over an extended period of time. As a result, the quarter in which we generated the highest net bookings has been different from the quarter in which we recognized the highest amount of net revenue. ASU 2014-09, Revenue from Contracts with Customers (Topic 606), which is effective for us at the beginning of fiscal year 2019, will decrease the amount of net revenue that we defer as compared to our historical practices. As a result, we expect our net revenue and net bookings to align more closely during fiscal year 2019 and beyond.
Employees
As of March 31, 2018, we had approximately 9,300 regular, full-time employees, over 5,800 of whom were outside the United States. We believe that our ability to attract and retain qualified employees is a critical factor in the successful development of our products and services and that our future success will depend, in large measure, on our ability to continue to attract and retain qualified employees. Approximately 9 percent of our employees, all of whom work for our DICE development studio in Sweden, are represented by a union.
Investor Information
Our annual reports on Form 10-K, quarterly reports on Form 10-Q and current reports on Form 8-K, and any amendments to those reports filed pursuant to Section 13(a) or 15(d) of the Securities Exchange Act, as amended, are available free of charge on the Investor Relations section of our website at http://ir.ea.com as soon as reasonably practicable after they are electronically filed with or furnished to the Securities and Exchange Commission (“SEC”). Except as expressly set forth in this Form 10-K annual report, the contents of our website are not incorporated into, or otherwise to be regarded as part of this report.
Company Information
We were incorporated originally in California in 1982. In September 1991, we were reincorporated under the laws of Delaware. Our principal executive offices are located at 209 Redwood Shores Parkway, Redwood City, California 94065 and our telephone number is (650) 628-1500.
Information about Geographic Areas and Research & Development Expense
Information regarding financial data by geographic area is set forth in Part II, Item 8 of this Form 10-K in the Notes to Consolidated Financial Statements in Note 17, “Segment Information”. Information regarding financial data is set forth in Part II, Item 6 of this Form 10-K under the heading “Selected Financial Data” and information regarding certain risks attendant to our foreign operations is set forth in Part I, Item 1A of this Form 10-K under the heading “Risk Factors”. For the fiscal years ended March 31, 2018, 2017 and 2016, research and development expenses were $1,320 million, $1,205 million and $1,109 million, respectively.
6
Executive Officers
The following table sets forth information regarding our executive officers as of May 23, 2018:
Name | Age | Position | ||
Andrew Wilson | 43 | Chief Executive Officer | ||
Blake Jorgensen | 58 | Chief Operating Officer and Chief Financial Officer | ||
Patrick Söderlund | 44 | Chief Design Officer | ||
Laura Miele | 48 | Chief Studios Officer | ||
Kenneth Moss | 52 | Chief Technology Officer | ||
Christopher Bruzzo | 48 | Chief Marketing Officer | ||
Joel Linzner | 66 | Executive Vice President, Worldwide Business Affairs | ||
Mala Singh | 46 | Chief People Officer | ||
Matthew Bilbey | 42 | Executive Vice President of Strategic Growth | ||
Kenneth A. Barker | 51 | Senior Vice President, Chief Accounting Officer | ||
Jacob J. Schatz | 49 | Executive Vice President, General Counsel and Corporate Secretary | ||
Mr. Wilson has served as EA’s Chief Executive Officer and as a director of EA since September 2013. Prior to his appointment as our Chief Executive Officer, Mr. Wilson held several positions within the Company since joining EA in May 2000, including Executive Vice President, EA SPORTS from August 2011 to September 2013. Mr. Wilson serves as a director of Intel Corporation and is chairman of the board of the privately-held World Surf League.
Mr. Jorgensen has served as EA’s Chief Financial Officer since September 2012 and, in addition, became EA’s Chief Operating Officer in April 2018. Prior to joining EA, he served as Executive Vice President, Chief Financial Officer of Levi Strauss & Co. from July 2009 to August 2012. From June 2007 to June 2009, Mr. Jorgensen served as Executive Vice President, Chief Financial Officer of Yahoo! Inc. Mr. Jorgensen earned his M.B.A. from Harvard Business School and his undergraduate degree from Stanford University.
Mr. Söderlund has served as EA’s Chief Design Officer since April 2018. From September 2013 to April 2018, he was Executive Vice President, EA Worldwide Studios. Prior to that time, he served as Executive Vice President, EA Games Label from August 2011 to September 2013. Mr. Söderlund joined EA in October 2006 when EA purchased DICE studios where he was the Chief Executive Officer.
Ms. Miele has served as EA’s Chief Studios Officer since April 2018. Ms. Miele joined the Company in March 1996 and has held several positions at the Company, including Executive Vice President, Global Publishing from April 2016 to April 2018, Senior Vice President of Americas Publishing from June 2014 to April 2016, General Manager of the Company’s Star Wars business from June 2013 to June 2014, and several senior roles in the Company's marketing organization. Ms. Miele serves on the board of Silicon Valley Community Foundation.
Mr. Moss has served as EA’s Chief Technology Officer since July 2014. He served as Vice President of Market Places Technology, Science and Data at eBay Inc. from November 2011 to July 2014. Prior to joining eBay, he co-founded CrowdEye, Inc. and served as its Chief Executive Officer from October 2008 to November 2011. Mr. Moss graduated from Princeton University.
Mr. Bruzzo has served as EA’s Chief Marketing Officer since September 2014. Prior to joining EA, he served as Senior Vice President at Starbucks Corporation from June 2011 to August 2014. Mr. Bruzzo graduated from Whitworth University.
Mr. Linzner has served as EA’s Executive Vice President, Worldwide Business Affairs since April 2016. From March 2005 until April 2016, Mr. Linzner was EA's Executive Vice President, Business and Legal Affairs. Prior to joining EA in July 1999, Mr. Linzner served as outside litigation counsel to EA and several other companies in the video game industry. Mr. Linzner earned his J.D. from Boalt Hall at the University of California, Berkeley, after graduating from Brandeis University.
Ms. Singh has served as EA’s Chief People Officer since October 2016. Ms. Singh was previously employed by EA from 2009 to 2013, serving as Vice President, Human Resources, EA Labels from 2011 to 2013. Prior to rejoining EA, Ms. Singh served as the Chief People Officer of Minted, LLC from January 2014 to October 2016. Ms. Singh earned both her undergraduate and graduate degrees from Rutgers University - New Brunswick.
7
Mr. Bilbey has served as EA’s Executive Vice President of Strategic Growth since April 2018. Mr. Bilbey joined EA in 1995 and has held several positions within the Company, including Chief Operating Officer, Worldwide Studios from August 2016 to April 2018, Senior Vice President, Group General Manager from November 2013 to January 2017, and Vice President, General Manager Development and Marketing, Soccer from January 2009 to November 2013.
Mr. Barker has served as Senior Vice President, Chief Accounting Officer since April 2006. From February 2012 to September 2012, he also served as Interim Chief Financial Officer. From June 2003 to April 2006, Mr. Barker held the position of Vice President, Chief Accounting Officer. Prior to joining EA, Mr. Barker was at Sun Microsystems, Inc., as their Vice President and Corporate Controller from October 2002 to June 2003 and Assistant Corporate Controller from April 2000 to September 2002. Prior to that, he was an audit partner at Deloitte & Touche. Mr. Barker serves on the Board of Directors of Gatepath, a non-profit organization, and on the Accounting Advisory Board for the University of Notre Dame. Mr. Barker graduated from the University of Notre Dame.
Mr. Schatz has served as EA’s General Counsel and Corporate Secretary since June 2014. Mr. Schatz joined EA in 1999, and prior to his current role, he served as Deputy General Counsel and as Vice President from 2006 to 2014. Mr. Schatz earned his J.D. from Georgetown University Law Center, and received his undergraduate degree from Pomona College. Mr. Schatz is a member of the Bar of the State of California and is admitted to practice in the United States Supreme Court, the Ninth Circuit Court of Appeals and several United States District Courts.
8
Item 1A. | Risk Factors |
Our business is subject to many risks and uncertainties, which may affect our future financial performance. If any of the events or circumstances described below occurs, our business or financial performance could be harmed, our actual results could differ materially from our expectations and the market value of our stock could decline. The risks and uncertainties discussed below are not the only ones we face. There may be additional risks and uncertainties not currently known to us or that we currently do not believe could be material that may harm our business or financial performance.
Our business is intensely competitive and “hit” driven. We may not deliver “hit” products and services, or consumers may prefer our competitors’ products or services over our own.
Competition in our industry is intense. Many new products and services are regularly introduced in each major industry segment (console, mobile and PC), but only a relatively small number of “hit” titles account for a significant portion of total revenue in each segment. Our competitors range from established interactive entertainment companies and diversified media companies to emerging start-ups, and we expect new competitors to continue to emerge throughout the world. If our competitors develop and market more successful and engaging products or services, offer competitive products or services at lower price points, or if we do not continue to develop consistently high-quality, well-received and engaging products and services, our revenue, margins, and profitability will decline.
We maintain a relatively limited product portfolio in an effort to focus on developing high-quality and engaging products with the potential to become hits. High-quality titles, even if highly-reviewed, may not turn into hit products. Many hit products within our industry are iterations of prior hit products with large established consumer bases and significant brand recognition, which makes competing in certain product categories challenging. In addition, hit products or services of our competitors may take a larger portion of consumer spending or time than we anticipate, which could cause our products and services to underperform relative to our expectations. Publishing a relatively small number of major titles each year also concentrates risk in those titles and means each major title has greater associated risk. A significant portion of our revenue historically has been derived from games and services based on a few popular franchises, and the underperformance of a single major title could have a material adverse impact on our financial results. For example, we have historically derived a significant portion of our net revenue from sales related to our largest and most popular game, FIFA, the annualized version of which is consistently one of the best-selling games in the marketplace. Any events or circumstances that negatively impact our FIFA franchise, such as game or service quality, the delay or cancellation of a product or service launch, or real or perceived security risks could negatively impact our financial results to a disproportionate extent.
The increased importance of live services revenue to our business heightens the risks associated with our limited product portfolio. Live services that are either poorly-received or provided in connection with underperforming games may generate lower than expected sales. Any lapse, delay or failure in our ability to provide high-quality live services content to consumers over an extended period of time could materially and adversely affect our financial results, consumer engagement with our live services, and cause harm to our reputation and brand. Our most popular live service is the Ultimate Team mode associated with our sports franchises. Any events or circumstances that negatively impact our ability to reliably provide content or sustain engagement for Ultimate Team, particularly FIFA Ultimate Team, would negatively impact our financial results to a disproportionate extent.
Technology changes rapidly in our business and we may fail to anticipate or successfully implement new technologies or adopt new business strategies, technologies or methods.
Rapid technology changes in our industry require us to anticipate, sometimes years in advance, which technologies we must develop, implement and take advantage of in order to make our products and services competitive in the market. We have invested, and in the future may invest, in new business strategies, technologies, products, and services. For example, we are investing in the infrastructure for our EA Player Network which we expect will allow us to market and deliver content and services for our franchises more efficiently as well as enable new player-centric ways to discover and try new experiences. Such endeavors may involve significant risks and uncertainties, and no assurance can be given that the technology we choose to adopt and the products and services that we pursue will be successful. If we do not successfully implement these new technologies, our reputation and brand may be materially adversely affected and our financial condition and operating results may be impacted. We also may miss opportunities to adopt technology or develop products, services or new ways to engage with our games that become popular with consumers, which could adversely affect our financial results. It may take significant time and resources to shift our focus to such technologies, putting us at a competitive disadvantage.
Our development process usually starts with particular platforms and distribution methods in mind, and a range of technical development and feature goals that we hope to be able to achieve. We may not be able to achieve these goals, or our competition
9
may be able to achieve them more quickly and effectively than we can. In either case, our products and services may be technologically inferior to those of our competitors, less appealing to consumers, or both. If we cannot achieve our technology goals within the original development schedule for our products and services, then we may delay their release until these goals can be achieved, which may delay or reduce revenue and increase our development expenses. Alternatively, we may increase the resources employed in research and development in an attempt to accelerate our development of new technologies, either to preserve our product or service launch schedule or to keep up with our competition, which would increase our development expenses.
We may experience security breaches and cyber threats.
Our industry is prone to, and our systems and networks are subject to, cyber-attacks, computer viruses, worms, phishing attacks, malicious software programs and other information security incidents that seek to exploit, disable, damage, disrupt or gain access to our networks, our products and services, supporting technological infrastructure, intellectual property and other assets. We expect these threats to our systems and networks to continue. In addition, we rely on technological infrastructure provided by third-party business partners to support the online functionality of our products and services. These business partners, as well as our channel partners, also are subject to cyber risks and threats. Both our partners and we have expended, and expect to continue to expend, financial and operational resources to implement certain systems, processes and technologies to guard against cyber risks and to help protect our data and systems. However, the techniques used to exploit, disable, damage, disrupt or gain access to our networks, our products and services, supporting technological infrastructure, intellectual property and other assets change frequently, continue to evolve in sophistication and volume, and often are not detected for long periods of time. Our systems, processes and technologies, and the systems, processes and technologies of our business partners, may not be adequate against all eventualities. In addition, the costs to respond to, mitigate, and/or notify affected parties of cyber-attacks and other security vulnerabilities are significant. Any failure to prevent or mitigate security breaches or cyber risks, or detect or respond adequately to a security breach or cyber risk, could result in a loss of anticipated revenue, interruptions to our products and services, cause us to incur significant remediation and notification costs, degrade the user experience, cause consumers to lose confidence in our products and services and significant legal and financial costs. This could harm our business, reputation and brand, disrupt our relationships with partners and customers and diminish our competitive position.
The virtual economies that we have established in many of our games are subject to abuse, exploitation and other forms of fraudulent activity that can negatively impact our business. Virtual economies involve the use of virtual currency and/or virtual assets that can be used or redeemed by a player within a particular game or service. The abuse or exploitation of our virtual economies include the illegitimate generation and sale of virtual items, including in black markets. Our online services have been impacted by in-game exploits and the use of automated or other fraudulent processes to generate virtual item or currency illegitimately, and such activity may continue. These abuses and exploits, and the steps that we take to address these abuses and exploits may result in a loss of anticipated revenue, increased costs to protect against or remediate these issues, interfere with players’ enjoyment of a balanced game environment and cause harm to our reputation and brand.
Our business could be adversely affected if our consumer protection, data privacy and security practices are not adequate, or perceived as being inadequate, to prevent data breaches, or by the application of consumer protection and data privacy and security laws generally.
In the course of our business, we collect, process, store and use consumer, employee and other information, including personal information, passwords, credit card information gameplay details and banking information. Although we expend, and expect to continue to expend, financial and operational resources to create and enforce security measures, policies and controls that are designed to protect this information from improper or unauthorized access, acquisition and misuse and/or the uninformed disclosure, our security measures, policies and controls may not be able successful against all eventualities. The improper or unauthorized access, acquisition or misuse and/or uninformed disclosure of consumer and other information, or a perception that we do not adequately secure this information or provide consumers with adequate notice about the information that they authorize us to disclose, could result in legal liability, costly remedial measures, governmental and regulatory investigations, harm our profitability, reputation and brand, and cause our financial results to be materially affected. In addition, third party vendors and business partners receive access to information that we collect. These vendors and business partners may not prevent data security breaches with respect to the information we provide them or fully enforce our policies, contractual obligations and disclosures regarding the collection, use, storage, transfer and retention of personal data. A data security breach of one of our vendors or business partners could cause reputational and financial harm to them and us, negatively impact our ability to offer our products and services, and could result in legal liability, costly remedial measures, governmental and regulatory investigations, harm our profitability, reputation and brand, and cause our financial results to be materially affected.
10
We are subject to payment card association rules and obligations pursuant to contracts with payment card processors. Under these rules and obligations, if information is compromised, we could be liable to payment card issuers for the cost of associated expenses and penalties. In addition, if we fail to follow payment card industry security standards, even if no consumer information is compromised, we could incur significant fines or experience a significant increase in payment card transaction costs.
Data privacy, data protection, localization, security and consumer-protection laws are evolving, and the interpretation and application of these laws in the United States, Europe and elsewhere often are uncertain, contradictory and changing. For example, recent developments in Europe have created compliance uncertainty and increased the complexity of certain transfers of information from Europe to the United States. In addition, the European General Data Protection Regulation (GDPR), effective as of May 2018 applies to us because we receive and process the personal data of European Union residents. The GDPR contains significant penalties for non-compliance. It is possible that these laws may be interpreted or applied in a manner that is adverse to us, unforeseen, or otherwise inconsistent with our practices or that we may not adequately adapt our internal policies and/or procedures to evolving regulations, any of which could result in litigation, regulatory investigations and potential legal liability, require us to change our practices in a manner adverse to our business or limit access to our products and services in certain countries. As a result, our reputation and brand may be harmed, we could incur substantial costs, and we could lose both consumers and revenue.
We may experience outages, disruptions or degradations in our services, products and/or technological infrastructure.
The reliable performance of our products and services increasingly depends on the continuing operation and availability of our information technology systems and those of our external service providers, including third-party “cloud” computing services. Our games and services are complex software products, and maintaining the sophisticated technological infrastructure required to reliably deliver these games and services is expensive and complex. The reliable delivery and stability of our products and services could be adversely impacted by outages, disruptions, failures or degradations in our network and related infrastructure, as well as in the online platforms or services of key business partners who offer or support our products and services. Possible causes of these outages, disruptions, failures or degradations include natural disasters, power loss, terrorism, cyber-attacks, computer viruses, bugs or other malware or ransomware that may harm our systems. In addition, we occasionally migrate data among data centers and to third-party hosted environments and perform upgrades and maintenance on our systems.
If we were to experience an event that caused a significant system outage, disruption or degradation or if a transition among data centers or service providers or an upgrade or maintenance session encountered unexpected interruptions, unforeseen complexity or unplanned disruptions, our products and services may not be available to consumers or may not be delivered reliably and stably. As a result, our reputation and brand may be harmed, consumer engagement with our products and services may be reduced, and our revenue and profitability could be negatively impacted. We do not have redundancy for all our systems, many of our critical applications reside in only one of our data centers, and our disaster recovery planning may not account for all eventualities.
As our digital business grows, we will require an increasing amount of technical infrastructure, including network capacity and computing power to continue to satisfy the needs of consumers. We are investing, and expect to continue to invest, in technology, hardware and software to support our business, but it is possible that we may fail to scale effectively and grow our technical infrastructure to accommodate these increased demands, which may adversely affect the reliable and stable performance of our games and services, therefore negatively impacting engagement, reputation, brand and revenue growth.
Negative perceptions about and responses to our brands, products, services and/or business practices may damage our business, and we may incur costs to address concerns.
Expectations regarding the quality, performance and integrity of our products and services are high. Players may be critical of our brands, products, services, business models and/or business practices for a wide variety of reasons, including perceptions about gameplay fun, fairness, game content, features or services, or objections to certain of our business practices. These negative responses may not be foreseeable. We also may not effectively manage these responses because of reasons within or outside of our control. For example, we have included in certain games the ability for players to purchase digital items, including in some instances virtual “packs”, “boxes” or “crates” that contain variable digital items. The inclusion of variable digital items in certain of our games has attracted the attention of our community and if the future implementation of these features creates a negative perception of gameplay fairness or other negative perceptions, our reputation and brand could be harmed and our revenue could be negatively impacted. In addition, we have taken actions, including delaying the release of our games and delaying or discontinuing features and services for our games, after taking into consideration, among other things, feedback from our community even if those decisions negatively impacted our operating results in the short term. We expect to continue to take actions to address concerns as appropriate, including actions that may result in additional expenditures and the loss of revenue. Negative sentiment about gameplay fairness, our business practices, business models or game content also can lead to investigations or increased scrutiny from governmental bodies and consumer groups, as well as litigation, which, regardless of their outcome, may be costly, damaging to our reputation and harm our business.
11
Our business depends on the success and availability of platforms developed by third parties and our ability to develop commercially successful products and services for those platforms.
The success of our business is driven in part by the commercial success and adequate supply of third party platforms for which we develop our products and services or through which our products and services are distributed. Our success also depends on our ability to accurately predict which platforms will be successful in the marketplace, our ability to develop commercially successful products and services for these platforms, our ability to simultaneously manage products and services on multiple platforms and our ability to effectively transition our products and services to new platforms. We must make product development decisions and commit significant resources well in advance of the commercial availability of new platforms, and we may incur significant expense to adjust our product portfolio and development efforts in response to changing consumer platform preferences. Additionally, we may enter into certain exclusive licensing arrangements that affect our ability to deliver or market products or services on certain platforms. A platform for which we are developing products and services may not succeed as expected or new platforms may take market share and interactive entertainment consumers away from platforms for which we have devoted significant resources. If consumer demand for the platforms for which we are developing products and services is lower than our expectations, we may be unable to fully recover the investments we have made in developing our products and services, and our financial performance will be harmed. Alternatively, a platform for which we have not devoted significant resources could be more successful than we initially anticipated, causing us to not be able to take advantage of meaningful revenue opportunities.
Government regulations applicable to us may negatively impact our business.
We are subject to a number of foreign and domestic laws and regulations that affect companies conducting business on the Internet. In addition, laws and regulations relating to user privacy, data collection, retention, consumer protection, content, advertising, localization, and information security have been adopted or are being considered for adoption by many jurisdictions and countries throughout the world. These laws could harm our business by limiting the products and services we can offer consumers or the manner in which we offer them. The costs of compliance with these laws may increase in the future as a result of changes in interpretation. Any failure on our part to comply with these laws or the application of these laws in an unanticipated manner may harm our business and result in penalties or significant legal liability.
Certain of our business models could be subject to new laws or regulations or evolving interpretations of existing laws and regulations. For example, the growth and development of electronic commerce, virtual items and virtual currency has prompted calls for laws and regulations that could limit or restrict the sale of our products and services or otherwise impact our products and services. In addition, we include modes in our games that allow players to compete against each other and manage player competitions that are based on our products and services. Although we structure and operate our skill-based competitions with applicable laws in mind, our skill-based competitions in the future could become subject to evolving laws and regulations. New laws related to these business models, or changes in the interpretation of current laws that impact these business models, could subject us to additional regulation and oversight, lessen the engagement with, and growth of, profitable business models, and expose us to increased compliance costs, significant liability, penalties and harm to our reputation and brand.
We are subject to laws in certain foreign countries, and adhere to industry standards in the United States, that mandate rating requirements or set other restrictions on the advertisement or distribution of interactive entertainment software based on content. In addition, certain foreign countries allow government censorship of interactive entertainment software products. Adoption of ratings systems, censorship or restrictions on distribution of interactive entertainment software based on content could harm our business by limiting the products we are able to offer to our customers. In addition, compliance with new and possibly inconsistent regulations for different territories could be costly, delay or prevent the release of our products in those territories.
We may not meet our product development schedules or key events, sports seasons and/or movies that are tied to our product release schedule to may be delayed, cancelled or poorly received.
Our ability to meet product development schedules is affected by a number of factors both within and outside our control, including feedback from our players, the creative processes involved, the coordination of large and sometimes geographically dispersed development teams, the complexity of our products and the platforms for which they are developed, the need to fine-tune our products prior to their release and, in certain cases, approvals from third parties. We have experienced development delays for our products in the past, which caused us to delay or cancel release dates. We also seek to release certain products in conjunction with key events, such as the beginning of a sports season, major sporting event, or the release of a related movie. If such a key event were delayed, cancelled or poorly received, our sales likely would suffer materially. Any failure to meet anticipated production or release schedules likely would result in a delay of revenue and/or possibly a significant shortfall in our revenue, increase our development and/or marketing expenses, harm our profitability, and cause our operating results to be materially different than anticipated.
12
Historically our business has been highly seasonal with the highest percentage of our sales occurring in the quarter ending in December. While we expect this trend to continue in fiscal year 2019, there is no assurance that it will be so. If we miss key selling periods for products or services for any reason, including product delays or product cancellations our sales likely will suffer significantly. Additionally, macroeconomic conditions or the occurrence of unforeseen events that negatively impact consumer or retailer buying patterns, particularly during the quarter ending in December, likely will harm our financial performance disproportionately.
Our marketing and advertising efforts may fail to resonate with consumers.
Our products and services are marketed worldwide through a diverse spectrum of advertising and promotional programs, such as online and mobile advertising, television advertising, retail merchandising, marketing through websites, event sponsorship and direct communications with consumers including via email. Furthermore, an increasing portion of our marketing activity is taking place on social media platforms that are outside of our direct control. Our ability to sell our products and services is dependent in part upon the success of these programs, and changes to consumer preferences, marketing regulations, technology changes or service disruptions may negatively impact our ability to reach our customers. Moreover, if the marketing for our products and services fails to resonate with our customers, particularly during the critical holiday season or during other key selling periods, or if advertising rates or other media placement costs increase, our business and operating results could be harmed.
We may not attract and retain key personnel.
The market for technical, creative, marketing and other personnel essential to the development, marketing and support of our products and services and management of our businesses is extremely competitive. Our leading position within the interactive entertainment industry makes us a prime target for recruiting our executives, as well as key creative and technical talent. We may experience significant compensation costs to hire and retain senior executives and other personnel that we deem critical to our success. If we cannot successfully recruit and retain qualified employees, or replace key employees following their departure, our ability to develop and manage our business will be impaired.
We may experience declines or fluctuations in the recurring portion of our business.
Our business model includes revenue that we deem recurring in nature, such as revenue from our annualized titles (e.g., FIFA and Madden NFL) and associated services, subscriptions and our ongoing mobile businesses. While we have been able to forecast the revenue from these areas of our business with greater relative confidence than for new games, services and business models, we cannot provide assurances that consumer demand will remain consistent. Furthermore, we may cease to offer games and services that we previously had deemed to be recurring in nature. Consumer demand may decline or fluctuate as a result of a number of factors, including their level of satisfaction with our games and services, our ability to improve and innovate our annualized titles, our ability to adapt our games and services to new platforms and business models, outages and disruptions of online services, the games and services offered by our competitors, our marketing and advertising efforts or declines in consumer activity generally as a result of economic downturns, among others. The reception to our licensed sports games may be adversely impacted by circumstances outside our control impacting the sports leagues and organizations. Any decline or fluctuation in the recurring portion of our business may have a negative impact on our financial and operating results.
13
We could fail to successfully adopt new business models.
From time to time we seek to establish and implement new business models. Forecasting the success of any new business model is inherently uncertain and depends on a number of factors both within and outside of our control. Our actual revenue and profit for these businesses may be significantly greater or less than our forecasts. In addition, these new business models could fail, resulting in the loss of our investment in the development and infrastructure needed to support these new business models, as well as the opportunity cost of diverting management and financial resources away from more successful and established businesses. For example, we have devoted financial and operational resources to our subscription offerings without any assurance that these businesses will be financially successful. While we anticipate growth in this area of our business, consumer demand is difficult to predict as a result of a number of factors, including satisfaction with our products and services, our ability to provide engaging products and services, products and services offered by our competitors, reliability of our infrastructure, pricing, the actual or perceived security of our information technology systems and reductions in consumer spending levels. In addition, if our subscription offerings are successful, sales could be diverted from established business models. If we do not select a target price that is optimal for our subscription services, maintain our target pricing structure or correctly project renewal rates, our financial results may be harmed.
Acquisitions, investments, divestitures and other strategic transactions could result in operating difficulties and other negative consequences.
We have made and may continue to make acquisitions or enter into other strategic transactions including (1) acquisitions of companies, businesses, intellectual properties, and other assets, (2) minority investments in strategic partners, and (3) investments in new interactive entertainment businesses as part of our long-term business strategy. These transactions involve significant challenges and risks including that the transaction does not advance our business strategy, that we do not realize a satisfactory return on our investment, that we acquire liabilities, that our due diligence process does not identify significant issues, liabilities or other challenges, diversion of management’s attention from our other businesses, the incurrence of debt, contingent liabilities or amortization expenses, write-offs of goodwill, intangibles, or acquired in-process technology, or other increased cash and non-cash expenses. In addition, we may not integrate these businesses successfully, for example with difficulties with the integration of business systems and technologies, the integration and retention of new employees, the implementation or remediation of the internal control environment of the acquired entity, or the maintenance of key business and customer relationships. These events could harm our operating results or financial condition. We also may divest or sell assets or a business and we may have difficulty selling such assets or business on acceptable terms in a timely manner. This could result in a delay in the achievement of our strategic objectives, cause us to incur additional expense, or the sale of such assets or business at a price or on terms that are less favorable than we anticipated.
We may be unable to maintain or acquire licenses to include intellectual property owned by others in our games, or to maintain or acquire the rights to publish or distribute games developed by others.
Many of our products and services are based on or incorporate intellectual property owned by others. For example, our EA Sports products include rights licensed from major sports leagues and players’ associations and our Star Wars products include rights licensed from Disney. Competition for these licenses and rights is intense. If we are unable to maintain these licenses and rights or obtain additional licenses or rights with significant commercial value, our ability to develop and successful and engaging games and services may be adversely affected and our revenue, profitability and cash flows may decline significantly. Competition for these licenses also may increase the amounts that we must pay to licensors and developers, through higher minimum guarantees or royalty rates, which could significantly increase our costs and reduce our profitability.
We rely on the platforms of our channel partners who have significant influence over the products and services that we offer on their platforms.
A significant percentage of our digital net revenue is attributable to sales of products and services through our significant channel partners, including Sony, Microsoft, Nintendo, Apple and Google. The concentration of a material portion of our digital sales in these channel partners exposes us to risks associated with these businesses. Any deterioration in the businesses of our channel partners could disrupt and harm our business, including by limiting the channels through which our digital products and services are offered and exposing us to collection risks.
In addition, our license agreements with our channel partners typically give them significant control over the approval, manufacturing and distribution of the products and services that we develop for their platform. In particular, our arrangements with Sony and Microsoft could, in certain circumstances, leave us unable to get our products and services approved, manufactured or distributed to customers. For our digital products and services delivered via digital channels maintained by, among others, Sony,
14
Microsoft, Nintendo, Apple and Google, each respective channel partner has policies and guidelines that control the promotion and distribution of these titles and the features and functionalities that we are permitted to offer through the channel. In addition, we are dependent on our channel partners to invest in, and upgrade, digital commerce capabilities in a manner than corresponds to the way in which consumers purchase our products and services. Failure by our channels partners to keep pace with consumer preferences could have an adverse impact on our ability to merchandise and commercialize our products and services which could harm our business and/or financial results.
Moreover, certain of our channel partners can determine and change unilaterally certain key terms and conditions, including the ability to change their user and developer policies and guidelines. In many cases our channel partners also set the rates that we must pay to provide our games and services through their online channels, and retain flexibility to change their fee structures or adopt different fee structures for their online channels, which could adversely impact our costs, profitability and margins. In addition, our channel partners control the information technology systems through which online sales of our products and service channels are captured. If our channel partners establish terms that restrict our offerings through their channels, significantly impact the financial terms on which these products or services are offered to our customers, or their information technology systems fail or cause an unanticipated delay in reporting, our business and/or financial results could be materially affected.
Our business is subject to risks generally associated with the entertainment industry.
Our business is subject to risks that are generally associated with the entertainment industry, many of which are beyond our control. These risks could negatively impact our operating results and include: the popularity, price and timing of our games, economic conditions that adversely affect discretionary consumer spending, changes in consumer demographics, the availability and popularity of other forms of entertainment, and critical reviews and public tastes and preferences, which may change rapidly and cannot necessarily be predicted.
Our business partners may be unable to honor their obligations to us or their actions may put us at risk.
We rely on various business partners, including third-party service providers, vendors, licensing partners, development partners, and licensees in many areas of our business. Their actions may put our business and our reputation and brand at risk. For example, we may have disputes with our business partners that may impact our business and/or financial results. In many cases, our business partners may be given access to sensitive and proprietary information in order to provide services and support to our teams, and they may misappropriate our information and engage in unauthorized use of it. In addition, the failure of these third parties to provide adequate services and technologies, or the failure of the third parties to adequately maintain or update their services and technologies, could result in a disruption to our business operations. Further, disruptions in the financial markets, economic downturns, poor business decisions, or reputational harm may adversely affect our business partners and they may not be able to continue honoring their obligations to us or we may cease our arrangements with them. Alternative arrangements and services may not be available to us on commercially reasonable terms or we may experience business interruptions upon a transition to an alternative partner or vendor. If we lose one or more significant business partners, our business could be harmed and our financial results could be materially affected.
The products or services we release may contain defects, bugs or errors.
Our products and services are extremely complex software programs, and are difficult to develop and distribute. We have quality controls in place to detect defects, bugs or other errors in our products and services before they are released. Nonetheless, these quality controls are subject to human error, overriding, and reasonable resource or technical constraints. Therefore, these quality controls and preventative measures may not be effective in detecting all defects, bugs or errors in our products and services before they have been released into the marketplace. In such an event, the technological reliability and stability of our products and services could be below our standards and the standards of consumers and our reputation, brand and sales could be adversely affected. In addition, we could be required to, or may find it necessary to, offer a refund for the product or service, suspend the availability or sale of the product or service or expend significant resources to cure the defect, bug or error each of which could significantly harm our business and operating results.
We may be subject to claims of infringement of third-party intellectual property rights.
From time to time, third parties may claim that we have infringed their intellectual property rights. For example, patent holding companies may assert patent claims against us in which they seek to monetize patents they have purchased or otherwise obtained. Although we take steps to avoid knowingly violating the intellectual property rights of others, it is possible that third parties still may claim infringement.
15
Existing or future infringement claims against us, whether valid or not, may be expensive to defend and divert the attention of our employees from business operations. Such claims or litigation could require us to pay damages and other costs. We also could be required to stop selling, distributing or supporting products, features or services which incorporate the affected intellectual property rights, redesign products, features or services to avoid infringement, or obtain a license, all of which could be costly and harm our business.
In addition, many patents have been issued that may apply to potential new modes of delivering, playing or monetizing interactive entertainment software products and services, such as those that we produce or would like to offer in the future. We may discover that future opportunities to provide new and innovative modes of game play and game delivery to consumers may be precluded by existing patents that we are unable to license on reasonable terms.
From time to time we may become involved in other legal proceedings.
We are currently, and from time to time in the future may become, subject to legal proceedings, claims, litigation and government investigations or inquiries, which could be expensive, lengthy, disruptive to normal business operations and occupy a significant amount of our employees’ time and attention. In addition, the outcome of any legal proceedings, claims, litigation, investigations or inquiries may be difficult to predict and could have a material adverse effect on our business, operating results, or financial condition.
Our products and brands are subject to the threat of piracy, unauthorized copying and other forms of intellectual property infringement.
We regard our products and brands as proprietary and take measures to protect our products, brands and other confidential information from infringement. We are aware that some unauthorized copying of our products and brands occurs, and if a significantly greater amount were to occur, it could negatively impact our business.
Piracy and other forms of unauthorized copying and use of our content and brands are persistent problems for us, and policing is difficult. Further, the laws of some countries in which our products are or may be distributed either do not protect our products and intellectual property rights to the same extent as the laws of the United States, or are poorly enforced. Legal protection of our rights may be ineffective in such countries. In addition, although we take steps to enforce and police our rights, factors such as the proliferation of technology designed to circumvent the protection measures used by our business partners or by us, the availability of broadband access to the Internet, the refusal of Internet service providers or platform holders to remove infringing content in certain instances, and the proliferation of online channels through which infringing product is distributed all have contributed to an expansion in unauthorized copying of our products and brands.
We may experience outages, disruptions and/or degradations of our infrastructure.
We may experience outrages, disruptions and/or degradations of our infrastructure, including information technology system failures and network disruptions. These may be caused by natural disasters, cyber-incidents, weather events, power disruptions, telecommunications failures, failed upgrades of existing systems or migrations to new systems, acts of terrorism or other events, including cyber-attacks or malicious software programs that exploit vulnerabilities. System redundancy may be ineffective or inadequate, and our disaster recovery planning may not be sufficient for all eventualities. Such failures or disruptions could prevent access to our products, services or online stores selling our products and services or interruption in our ability to conduct critical business functions. Our corporate headquarters in Redwood City, CA and our studios in Los Angeles, California, Seattle, Washington and in Burnaby, British Columbia are located in seismically active regions, and certain of our game development activities and other essential business operations are conducted at these locations. An event that results in the disruption or degradation of any of our critical business or information technology systems could harm our ability to conduct normal business operations and materially impact our reputation and brand, financial condition and operating results.
A significant portion of our packaged goods sales are made to a relatively small number of retail and distribution partners, and these sales may be disrupted.
We derive a significant percentage of our net revenue attributable to sales of our packaged goods products to our top retail and distribution partners. The concentration of a significant percentage of these sales through a few large partners could lead to a short-term disruption to our business if certain of these partners significantly reduced their purchases or ceased to offer our products. We also could be more vulnerable to collection risk if one or more of these partners experienced a deterioration of their business or declared bankruptcy. Additionally, receivables from these partners generally increase in our December fiscal quarter as sales of our products generally increase in anticipation of the holiday season. Having a significant portion of our packaged goods sales
16
concentrated in a few partners could reduce our negotiating leverage with them. If one or more of these partners experience deterioration in their business, or become unable to obtain sufficient financing to maintain their operations, our business could be harmed.
External game developers may not meet product development schedules or otherwise honor their obligations.
We may contract with external game developers to develop our games or to publish or distribute their games. While we maintain contractual protections, we have less control over the product development schedules of games developed by external developers, and we depend on their ability to meet product development schedules. In addition, we may have disputes with external developers over game content, launch timing, achievement of certain milestones, the game development timeline, marketing campaigns or other matters. If we have disputes with external developers or they cannot meet product development schedules, acquire certain approvals or are otherwise unable or unwilling to honor their obligations to us, we may delay or cancel previously announced games, alter our launch schedule or experience increased costs and expenses, which could result in a delay or significant shortfall in anticipated revenue, harm our profitability and reputation, and cause our financial results to be materially affected.
Our financial results are subject to currency fluctuations.
International sales are a fundamental part of our business. For our fiscal year ended March 31, 2018, international net revenue comprised 59 percent of our total net revenue, and we expect our international business to continue to account for a significant portion of our total net revenue. As a result of our international sales, and also the denomination of our foreign investments and our cash and cash equivalents in foreign currencies, we are exposed to the effects of fluctuations in foreign currency exchange rates. Strengthening of the U.S. dollar, particularly relative to the Euro, British pound sterling, Australian dollar, Chinese yuan and South Korean won, has a negative impact on our reported international net revenue but a positive impact on our reported international operating expenses (particularly when the U.S. dollar strengthens against the Swedish krona and the Canadian dollar) because these amounts are translated at lower rates. We use foreign currency hedging contracts to mitigate some foreign currency risk. However, these activities are limited in the protection they provide us from foreign currency fluctuations and can themselves result in losses.
We utilize debt financing and such indebtedness could adversely impact our business and financial condition.
We have $1 billion in senior unsecured notes outstanding as well as an unsecured committed $500 million revolving credit facility. While the facility is currently undrawn, we may use the proceeds of any future borrowings for general corporate purposes. We may also enter into other financial instruments in the future.
Our indebtedness could affect our financial condition and future financial results by, among other things:
• | Requiring the dedication of a substantial portion of any cash flow from operations to the payment of principal of, and interest on, our indebtedness, thereby reducing the availability of such cash flow to fund our growth strategy, working capital, capital expenditures and other general corporate purposes; |
• | Limiting our flexibility in planning for, or reacting to, changes in our business and our industry; and |
• | Increasing our vulnerability to adverse changes in general economic and industry conditions. |
The agreements governing our indebtedness impose restrictions on us and require us to maintain compliance with specified covenants. In particular, the revolving credit facility includes a maximum capitalization ratio and minimum liquidity requirements. Our ability to comply with these covenants may be affected by events beyond our control. If we breach any of these covenants and do not obtain a waiver from the lenders or noteholders, then, subject to applicable cure periods, our outstanding indebtedness may be declared immediately due and payable. In addition, changes by any rating agency to our credit rating may negatively impact the value and liquidity of both our debt and equity securities, as well as the potential costs associated with any potential refinancing our indebtedness. Downgrades in our credit rating could also restrict our ability to obtain additional financing in the future and could affect the terms of any such financing.
Changes in our tax rates or exposure to additional tax liabilities could adversely affect our earnings and financial condition.
We are subject to taxes in the United States and in various foreign jurisdictions. Significant judgment is required in determining our worldwide income tax provision, tax assets, and accruals for other taxes, and there are many transactions and calculations where the ultimate tax determination is uncertain. Our effective income tax rate is based in part on our corporate operating structure and the manner in which we operate our business and develop, value and use our intellectual property. Taxing authorities in
17
jurisdictions in which we operate may challenge our methodologies for calculating our income tax provision or its underlying assumptions, which could increase our effective income tax rate and have an adverse impact on our results of operations and cash flows. In addition, our provision for income taxes could be adversely affected by our profit levels, changes in our business, changes in the mix of earnings in countries with differing statutory tax rates, changes in the elections we make, changes in applicable tax laws or interpretations of existing tax laws, or changes in the valuation allowance for deferred tax assets, as well as other factors.
The Tax Cuts and Jobs Act (the “U.S. Tax Act”), enacted on December 22, 2017, represents a significant overhaul to the U.S. federal tax code. This tax legislation lowers the U.S. statutory tax rate, but also includes a number of provisions that could significantly and adversely impact our U.S. federal income tax position in a reporting period, including the limitation or elimination of certain deductions or credits, and U.S. taxes on foreign earnings. The final calculation of tax expense resulting from the U.S. Tax Act may differ from our estimates, potentially materially. In addition, any further changes to tax laws applicable to corporate multinationals in the countries in which we do business could adversely affect our effective tax rates, cause us to change the way in which we structure our business or result in other costs.
We are also required to pay taxes other than income taxes, such as payroll, sales, use, value-added, net worth, property and goods and services taxes, in both the United States and foreign jurisdictions. Furthermore, we are regularly subject to audit by tax authorities with respect to both income and such other non-income taxes. Unfavorable audit results or tax rulings, or other changes resulting in significant additional tax liabilities, could have material adverse effects upon our earnings, cash flows, and financial condition.
Our reported financial results could be adversely affected by changes in financial accounting standards.
Our reported financial results are impacted by the accounting standards promulgated by the SEC and national accounting standards bodies and the methods, estimates, and judgments that we use in applying our accounting policies. These methods, estimates, and judgments are subject to risks, uncertainties, assumptions and changes that could adversely affect our reported financial position and financial results. In addition, changes to applicable financial accounting standards could adversely affect our reported financial position and financial results. For example, ASU 2014-09, Revenue from Contracts with Customers (Topic 606), which is effective for us at the beginning of fiscal 2019, will materially change the way in which we recognize revenue and will require us to change how we report mobile platform fees. For more information on ASU 2014-09 and other accounting standards, see Part II, Item 8 of this Form 10-K in the Notes to Consolidated Financial Statements in Note 1 - Description of Business and Basis of Presentation under the subheading “Impact of Recently Issued Accounting Standards”.
As we enhance, expand and diversify our business and product offerings, the application of existing or future financial accounting standards, particularly those relating to the way we account for revenue, costs and taxes, could have an adverse effect on our reported results although not necessarily on our cash flows.
Our stock price has been volatile and may continue to fluctuate significantly.
The market price of our common stock historically has been, and we expect will continue to be, subject to significant fluctuations. These fluctuations may be due to factors specific to us (including those discussed in the risk factors above, as well as others not currently known to us or that we currently do not believe are material), to changes in securities analysts’ earnings estimates or ratings, to our results or future financial guidance falling below our expectations and analysts’ and investors’ expectations, to factors affecting the entertainment, computer, software, Internet, media or electronics industries, to our ability to successfully integrate any acquisitions we may make, or to national or international economic conditions. In particular, economic downturns may contribute to the public stock markets experiencing extreme price and trading volume volatility. These broad market fluctuations could adversely affect the market price of our common stock.
18
Item 1B: Unresolved Staff Comments
None.
Item 2: Properties
We own our 660,000-square-foot Redwood Shores headquarters facilities located in Redwood City, California, which includes development studios, administrative, sales and marketing functions. We also own a 418,000-square-foot development studio facility in Burnaby, Canada and a 76,000-square-foot development studio facility in Chatsworth, California. In addition to the properties we own, we lease approximately 740,000 square feet in North America and 866,000 square feet in Europe and Asia at various locations at which we conduct research and development, sales and administration functions, including leases for our development studios in Orlando, Florida, Stockholm, Sweden and Austin, Texas.
While we continually evaluate our facility requirements, we believe that suitable additional or substitute space will be available as needed to accommodate our future needs. For information regarding our lease commitments, see Part II, Item 8 of this Form 10-K in the Notes to Consolidated Financial Statements in Note 12, “Commitments and Contingencies”.
Item 3: Legal Proceedings
On July 29, 2010, Michael Davis, a former NFL running back, filed a putative class action in the United States District Court for the Northern District of California against the Company, alleging that certain past versions of Madden NFL included the images of certain retired NFL players without their permission. In March 2012, the trial court denied the Company’s request to dismiss the complaint on First Amendment grounds. In January 2015, that trial court decision was affirmed by the Ninth Circuit Court of Appeals and the case was remanded back to the United States District Court for the Northern District of California, where the case is pending.
We are also subject to claims and litigation arising in the ordinary course of business. We do not believe that any liability from any reasonably foreseeable disposition of such claims and litigation, individually or in the aggregate, would have a material adverse effect on our Consolidated Financial Statements.
Item 4: Mine Safety Disclosures
Not applicable.
19
PART II
Item 5: | Market for Registrant’s Common Equity, Related Stockholder Matters and Issuer Purchases of Equity Securities |
Market Information
Our common stock is traded on the NASDAQ Global Select Market under the symbol “EA”. The following table sets forth the quarterly high and low closing sales price per share of our common stock from April 1, 2016 through March 31, 2018.
Prices | |||||||
High | Low | ||||||
Fiscal Year Ended March 31, 2017: | |||||||
First Quarter | $ | 77.25 | $ | 61.85 | |||
Second Quarter | 85.40 | 75.38 | |||||
Third Quarter | 85.56 | 75.58 | |||||
Fourth Quarter | 91.51 | 78.64 | |||||
Fiscal Year Ended March 31, 2018: | |||||||
First Quarter | 115.37 | 88.40 | |||||
Second Quarter | 121.97 | 105.42 | |||||
Third Quarter | 120.09 | 100.83 | |||||
Fourth Quarter | 129.12 | 107.19 | |||||
Holders
There were approximately 1,159 holders of record of our common stock as of May 21, 2018, and the closing price of our common stock was $132.91 per share as reported by the NASDAQ Global Select Market. In addition, a significant number of beneficial owners of our common stock hold their shares in street name.
Dividends
We have not paid any cash dividends and do not anticipate paying cash dividends in the foreseeable future.
Issuer Purchases of Equity Securities
In May 2015, our Board of Directors authorized a program to repurchase up to $1 billion of our common stock. We repurchased approximately 0.3 million, 6.5 million and 6.9 million shares for approximately $31 million, $508 million and $461 million under this program, respectively, during the fiscal years ended March 31, 2018, 2017 and 2016. We completed repurchases under the May 2015 program in April 2017.
In May 2017, a Special Committee of our Board of Directors, on behalf of the full Board of Directors, authorized a program to repurchase up to $1.2 billion of our common stock. During the fiscal year ended March 31, 2018, we repurchased approximately 5.0 million shares for approximately $570 million under this program. This program was superseded and replaced by the stock repurchase program approved in May 2018.
The following table summarizes the number of shares repurchased in the fourth quarter of the fiscal year ended March 31, 2018:
Fiscal Month | Total Number of Shares Purchased | Average Price Paid per Share | Total Number of Shares Purchased as part of Publicly Announced Programs | Maximum Dollar Value that May Still Be Purchased Under the Programs (in millions) | ||||||||||
December 31, 2017 - January 27, 2018 | 383,359 | $ | 111.99 | 383,359 | $ | 735 | ||||||||
January 28 - February 24, 2018 | 378,509 | $ | 122.48 | 378,509 | $ | 688 | ||||||||
February 25 - March 31, 2018 | 468,110 | $ | 126.11 | 468,110 | $ | 629 | ||||||||
1,229,978 | $ | 120.59 | 1,229,978 | |||||||||||
20
Stock Performance Graph
The following information shall not be deemed to be “filed” with the SEC nor shall this information be incorporated by reference into any future filing under the Securities Act of 1933, as amended, or the Exchange Act, as amended, except to the extent that we specifically incorporate it by reference into a filing.
The following graph shows a five-year comparison of cumulative total returns during the period from March 31, 2013 through March 31, 2018, for our common stock, the S&P 500 Index (to which EA was added in July 2002), the NASDAQ Composite Index, and the RDG Technology Composite Index, each of which assumes an initial value of $100. Each measurement point is as of the end of each fiscal year. The performance of our stock depicted in the following graph is not necessarily indicative of the future performance of our stock.
COMPARISON OF 5 YEAR CUMULATIVE TOTAL RETURN*
Among Electronic Arts Inc., the S&P 500 Index, the NASDAQ Composite Index,
and the RDG Technology Composite Index
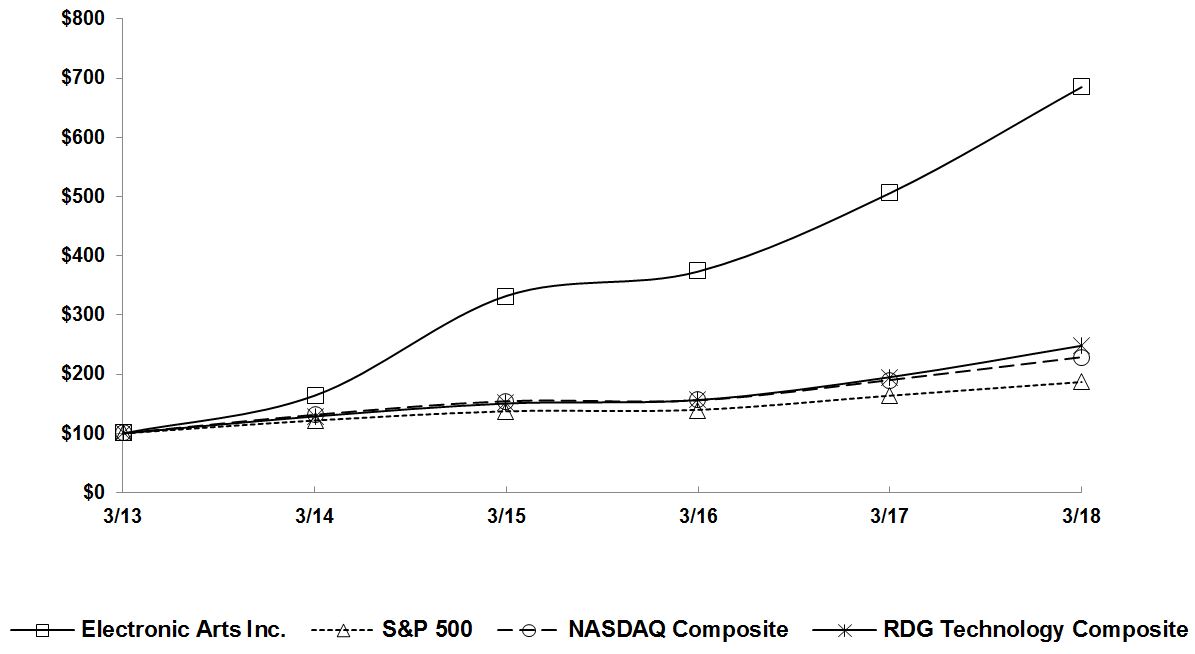
* | Based on $100 invested on March 31, 2013 in stock or index, including reinvestment of dividends. |
March 31, | |||||||||||||||||||||||
2013 | 2014 | 2015 | 2016 | 2017 | 2018 | ||||||||||||||||||
Electronic Arts Inc. | $ | 100 | $ | 164 | $ | 332 | $ | 374 | $ | 506 | $ | 685 | |||||||||||
S&P 500 Index | 100 | 122 | 137 | 140 | 164 | 187 | |||||||||||||||||
NASDAQ Composite Index | 100 | 131 | 154 | 156 | 190 | 229 | |||||||||||||||||
RDG Technology Composite Index | 100 | 129 | 151 | 156 | 195 | 248 | |||||||||||||||||
21
Item 6: Selected Financial Data
ELECTRONIC ARTS INC. AND SUBSIDIARIES
SELECTED FIVE-YEAR CONSOLIDATED FINANCIAL DATA
(In millions, except per share data)
Year Ended March 31, | |||||||||||||||||||
STATEMENTS OF OPERATIONS DATA | 2018 | 2017 | 2016 | 2015 | 2014 | ||||||||||||||
Net revenue | $ | 5,150 | $ | 4,845 | $ | 4,396 | $ | 4,515 | $ | 3,575 | |||||||||
Cost of revenue | 1,277 | 1,298 | 1,354 | 1,429 | 1,347 | ||||||||||||||
Gross profit | 3,873 | 3,547 | 3,042 | 3,086 | 2,228 | ||||||||||||||
Total operating expenses | 2,439 | 2,323 | 2,144 | 2,138 | 2,195 | ||||||||||||||
Operating income | 1,434 | 1,224 | 898 | 948 | 33 | ||||||||||||||
Interest and other income (expense), net | 15 | (14 | ) | (21 | ) | (23 | ) | (26 | ) | ||||||||||
Income before provision for (benefit from) income taxes | 1,449 | 1,210 | 877 | 925 | 7 | ||||||||||||||
Provision for (benefit from) income taxes | 406 | 243 | (279 | ) | 50 | (1 | ) | ||||||||||||
Net income | $ | 1,043 | $ | 967 | $ | 1,156 | $ | 875 | $ | 8 | |||||||||
Earnings per share: | |||||||||||||||||||
Basic | $ | 3.39 | $ | 3.19 | $ | 3.73 | $ | 2.81 | $ | 0.03 | |||||||||
Diluted | $ | 3.34 | $ | 3.08 | $ | 3.50 | $ | 2.69 | $ | 0.03 | |||||||||
Number of shares used in computation: | |||||||||||||||||||
Basic | 308 | 303 | 310 | 311 | 308 | ||||||||||||||
Diluted | 312 | 314 | 330 | 325 | 316 | ||||||||||||||
As of March 31, | |||||||||||||||||||
BALANCE SHEETS DATA | 2018 | 2017 | 2016 | 2015 | 2014 | ||||||||||||||
Cash and cash equivalents | $ | 4,258 | $ | 2,565 | $ | 2,493 | $ | 2,068 | $ | 1,782 | |||||||||
Short-term investments | 1,073 | 1,967 | 1,341 | 953 | 583 | ||||||||||||||
Working capital | 3,513 | 2,784 | 1,936 | 973 | 748 | ||||||||||||||
Total assets | 8,584 | 7,718 | 7,050 | 6,147 | 5,716 | ||||||||||||||
0.75% convertible senior notes due 2016, net | — | — | 163 | 633 | 580 | ||||||||||||||
Senior notes, net | 992 | 990 | 989 | — | — | ||||||||||||||
Other long-term liabilities | 506 | 253 | 245 | 333 | 324 | ||||||||||||||
Total liabilities | 3,989 | 3,658 | 3,652 | 3,080 | 3,294 | ||||||||||||||
Total stockholders’ equity | 4,595 | 4,060 | 3,396 | 3,036 | 2,422 | ||||||||||||||
22
Item 7: Management’s Discussion and Analysis of Financial Condition and Results of Operations
OVERVIEW
The following overview is a high-level discussion of our operating results, as well as some of the trends and drivers that affect our business. Management believes that an understanding of these trends and drivers provides important context for our results for the fiscal year ended March 31, 2018, as well as our future prospects. This summary is not intended to be exhaustive, nor is it intended to be a substitute for the detailed discussion and analysis provided elsewhere in this Form 10-K, including in the “Business” section and the “Risk Factors” above, the remainder of this “Management’s Discussion and Analysis of Financial Condition and Results of Operations (“MD&A”)”, and the Consolidated Financial Statements and related Notes.
About Electronic Arts
We are a global leader in digital interactive entertainment, with a mission to inspire the world to play. We develop, market, publish and deliver games and services that can be played on a variety of platforms, including game consoles, PCs, mobile phones and tablets. In our games and services, we use brands that we either wholly own (such as Battlefield, Mass Effect, The Sims and Plants v. Zombies), or license from others (such as FIFA, Madden NFL and Star Wars). We develop and publish games and services across diverse genres such as sports, first-person shooter, action, role-playing and simulation. We believe that the breadth and depth of our portfolio gives us the opportunity to engage an increasing number of players across more platforms and geographies and through more business models.
Financial Results
Our key financial results for our fiscal year ended March 31, 2018 were as follows:
• | Total net revenue was $5,150 million, up 6 percent year-over-year. On a constant currency basis, net of hedges, we estimate that total net revenue would have been $5,187 million, up 7 percent year over year. |
• | Digital revenue was $3,450 million, up 20 percent year-over-year. |
• | International net revenue was $3,060 million, up 12 percent year-over-year. On a constant currency basis, net of hedges, we estimate that international net revenue would have been $3,096 million, up 14 percent year over year. |
• | Gross margin was 75.2 percent, up 2 percentage points year-over-year. |
• | Operating expenses were $2,439 million, up 5 percent year-over-year. On a constant currency basis, net of hedges, we estimate that total operating expenses would have been $2,421 million, up 4 percent year over year. |
• | Operating income was $1,434 million, up 17 percent year-over-year. |
• | Net income was $1,043 million, up 8 percent year-over-year. |
• | Diluted earnings per share was $3.34, up 8 percent year-over-year. |
• | Operating cash flow was $1,692 million, up 7 percent year-over-year. |
• | Total cash, cash equivalents and short-term investments were $5,331 million. |
From time to time, we make comparisons of current periods to prior periods with reference to constant currency. Constant currency comparisons are based on translating local currency amounts in the current period at actual foreign exchange rates from the prior comparable period. We evaluate our financial performance on a constant currency basis in order to facilitate period-to-period comparisons without regard to the impact of changing foreign currency exchange rates.
23
Trends in Our Business
Digital Business. Players increasingly purchase our games as digital downloads, as opposed to purchasing physical discs, and engage with the live services we provide on an ongoing basis. Our live services provide additional depth and engagement opportunities for our players and include microtransactions, extra content, subscriptions, and esports. Our net revenue attributable to live services comprised 40 percent of our total net revenue during fiscal year 2018 and we expect that live services net revenue will continue to be material to our business. Our most popular live service is the Ultimate Team mode associated with our sports franchises. Ultimate Team allows players to collect and trade current and former professional players in order to build and compete as a personalized team. Net revenue from Ultimate Team represented approximately 21 percent of our total net revenue during fiscal year 2018, a substantial portion of which was derived from FIFA Ultimate Team. Our digital transformation is also creating opportunities in platforms, business models and the way in which players engage with our games and services. For example, we have leveraged brands and assets from franchises typically associated with consoles and traditional PC gaming, such as FIFA, Madden NFL, The Sims, SimCity and Star Wars, to create mobile and PC games that are monetized through live services associated with the game. We also provide our EA Access and Origin Access subscription services, which offer players access to a selection of EA games and other benefits for a monthly or annual fee.
We significantly increased our digital net revenue from $2,409 million in fiscal year 2016 to $2,874 million in fiscal year 2017 and $3,450 million during fiscal year 2018. We expect this portion of our business to continue to grow through fiscal year 2019 and beyond as we continue to focus on developing and monetizing products and services that can be delivered digitally.
Technological Infrastructure. As our digital business has grown, our games and services increasingly depend on the reliability, availability and security of our technological infrastructure. We are investing and expect to continue to invest in technology, hardware and software to support our games and services, including with respect to security protections. Our industry is prone to, and our systems and networks are subject to, cyber-attacks, computer viruses, worms, phishing attacks, malicious software programs, and other information security incidents that seek to exploit, disable, damage, disrupt or gain access to our networks, our products and services, supporting technological infrastructure, intellectual property and other assets. We expect these threats to our systems and networks to continue.
Player Network. We have made, and expect to continue to make, investments that strengthen our player network, which connects our players to each other and to the games they love. We are adopting consistent, cross-company methodologies to better understand our players’ needs and will continue to invest in technology that enables us to build personalized player relationships that can last for years instead of days or weeks by connecting our players to us and to each other. This connection allows us to market and deliver content and services for popular franchises like FIFA, Battlefield and Star Wars to our players more efficiently. That same foundation also enables new player-centric ways to discover and try new games and experiences, such as our subscription-based EA Access and Origin Access services.
Concentration of Sales Among the Most Popular Games. In all major segments of our industry, we see a large portion of games sales concentrated on the most popular titles. Similarly, a significant portion of our revenue historically has been derived from games based on a few popular franchises, several of which we have released on an annual or bi-annual basis. In particular, we have historically derived a significant portion of our net revenue from our largest and most popular game, FIFA, the annualized version of which is consistently one of the best-selling games in the marketplace.
Mobile and PC Free-to-Download Games. The global adoption of mobile devices and a business model for those devices that allows consumers to try new games with no up-front cost, and that are monetized through the live service associated with the game, has led to significant growth in the mobile gaming industry. We expect this growth to continue during our 2019 fiscal year. Likewise, the wide consumer acceptance of free-to-download, live service-based PC games played over the Internet has broadened our consumer base. We expect revenue generated from mobile and PC free-to-download games to remain an important part of our business.
Recurring Revenue Sources. Our business model includes revenue that we deem recurring in nature, such as revenue from our annualized titles (such as FIFA and Madden NFL) and associated live services, subscriptions and our ongoing mobile business. We have been able to forecast revenue from these areas of our business with greater relative confidence than for new games, services and business models. As we continue to leverage the digital transformation in our industry and incorporate new content models and modalities of play into our games, our goal is to continue to look for opportunities to expand the recurring portion of our business.
Net Bookings. In order to improve transparency into our business, we disclose an operating performance metric, net bookings. Net bookings is defined as the net amount of products and services sold digitally or sold-in physically in the period. Net
24
bookings is calculated by adding total net revenue to the change in deferred net revenue for online-enabled games, and, for periods after the fourth quarter of fiscal 2018, excluding mobile platform fees.
The following is a calculation of our total net bookings for the periods presented:
Year Ended March 31, | |||||||
(In millions) | 2018 | 2017 | |||||
Total net revenue | $ | 5,150 | $ | 4,845 | |||
Change in deferred net revenue (online-enabled games) | 30 | 97 | |||||
Net bookings | $ | 5,180 | $ | 4,942 | |||
Net bookings were $5,180 million for the fiscal year ended March 31, 2018, driven by FIFA 18, FIFA Ultimate Team, Star Wars Battlefront II, and Madden NFL 18. Net bookings increased $238 million or 5 percent as compared to the fiscal year ended March 31, 2017 due primarily to growth in bookings associated with the Ultimate Team game mode. Digital net bookings were $3,538 million for the fiscal year ended March 31, 2018, an increase of $504 million or 17 percent as compared to the fiscal year ended March 31, 2017. The increase in digital net bookings was driven by growth in live services which grew $514 million or 31 percent year-over-year, primarily due to growth in bookings associated with the Ultimate Team game mode and sales of The Sims 4; and our mobile business which grew $31 million or 5 percent year-over-year, primarily due to FIFA Mobile. These increases were offset by a decrease of $41 million or 6 percent in our full game downloads. Full game downloads of FIFA 18 showed strength in fiscal 2018, but were offset by the success of Battlefield 1 in fiscal 2017.
Recent Developments
Stock Repurchase Program. In May 2018, a Special Committee of our Board of Directors, on behalf of the full Board of Directors, authorized a program to repurchase up to $2.4 billion of our common stock. This stock repurchase program supersedes and replaces the stock repurchase program approved in May 2017, and expires on May 31, 2020. Under this program, we may purchase stock in the open market or through privately-negotiated transactions in accordance with applicable securities laws, including pursuant to pre-arranged stock trading plans. The timing and actual amount of the stock repurchases will depend on several factors including price, capital availability, regulatory requirements, alternative investment opportunities and other market conditions. We are not obligated to repurchase a specific number of shares under this program and it may be modified, suspended or discontinued at any time. We are actively repurchasing shares under this program.
Acquisition of Respawn LLC. On December 1, 2017, we completed the acquisition of Respawn. Respawn is a leading game development studio and creators of games including the critically-acclaimed Titanfall franchise. In connection with the acquisition, we paid $151 million in cash. In addition, we granted long-term equity awards in the form of restricted stock units to employees with a grant date fair value of $167 million. Furthermore, we may be required to pay variable cash consideration that is contingent upon the achievement of certain performance milestones relating to the development of future titles, through the end of calendar 2022. The additional consideration is limited to a maximum of $140 million.
U.S. Tax Act. On December 22, 2017, the Tax Cuts and Jobs Act (the “U.S. Tax Act”) was enacted which significantly revised the U.S. corporate income tax system by, among other things, lowering the U.S. corporate income tax rates to 21 percent, generally implementing a territorial tax system, and imposing a one-time transition tax on the deemed repatriation of undistributed earnings of foreign subsidiaries (the “Transition Tax”). We recorded a provisional $235 million tax charge during the year ended March 31, 2018 as a result of the application of the U.S. Tax Act; $192 million of which relates to the Transition Tax.
CRITICAL ACCOUNTING POLICIES AND ESTIMATES
Our Consolidated Financial Statements have been prepared in accordance with accounting principles generally accepted in the United States (“U.S. GAAP”). The preparation of these Consolidated Financial Statements requires management to make estimates and assumptions that affect the reported amounts of assets and liabilities, contingent assets and liabilities, and revenue and expenses during the reporting periods. The policies discussed below are considered by management to be critical because they are not only important to the portrayal of our financial condition and results of operations, but also because application and interpretation of these policies requires both management judgment and estimates of matters that are inherently uncertain and unknown. As a result, actual results may differ materially from our estimates.
25
Revenue Recognition, and Sales Returns and Allowances
We derive revenue principally from sales of interactive software games, and related content and services on game consoles, PCs, mobile phones and tablets. We evaluate revenue recognition based on the criteria set forth in FASB Accounting Standards Codification (“ASC”) 605, Revenue Recognition and ASC 985-605, Software: Revenue Recognition. We classify our revenue as either product revenue or service and other revenue.
Product revenue. Our product revenue includes revenue associated with the sale of software games or related product content or updates, whether delivered digitally (e.g., full-game downloads, extra-content) or via a physical disc (e.g., packaged goods), and licensing of game software to third-parties. Product revenue also includes revenue from mobile full game downloads that do not require our hosting support (e.g., premium mobile games) in order to utilize the game or related content (i.e. can be played with or without an Internet connection), and sales of tangible products such as hardware, peripherals, or collectors’ items.
Service and other revenue. Our service revenue includes revenue recognized from time-based subscriptions, games, content or updates that requires our hosting support in order to utilize the game or related content (i.e., can only be played with an Internet connection). This includes (1) entitlements to content that are accessed through hosting services (e.g., microtransactions for Internet-based, social network and free-to-download mobile games), (2) massively multi-player online (“MMO”) games (both software game and subscription sales), (3) subscriptions for our Battlefield Premium, EA and Origin Access, and Pogo-branded online game services, and (4) allocated service revenue from sales of software games with a service of online activities (e.g., online playability). Our other revenue includes advertising and non-software licensing revenue.
With respect to the allocated service revenue from sales of software games with a service of online activities (“online services”) mentioned above, our allocation of proceeds between product and service revenue for presentation purposes is based on management’s best estimate of the selling price of the online services with the residual value allocated to product revenue. Our estimate of the selling price of the online services are comprised of several factors including, but not limited to, prior selling prices for the online services, prices charged separately by other third-party vendors for similar service offerings, and a cost-plus-margin approach. We review the estimated selling price of the online services on a regular basis and use this methodology consistently to allocate revenue between product and service for software game sales with online services.
We evaluate and recognize revenue when all four of the following criteria are met:
• | Evidence of an arrangement. Evidence of an agreement with the customer that reflects the terms and conditions to deliver the related products or services must be present. |
• | Fixed or determinable fee. If a portion of the arrangement fee is not fixed or determinable, we recognize revenue as the amount becomes fixed or determinable. |
• | Collection is deemed probable. Collection is deemed probable if we expect the customer to be able to pay amounts under the arrangement as those amounts become due. If we determine that collection is not probable as the amounts become due, we generally conclude that collection becomes probable upon cash collection. |
• | Delivery. For packaged goods, delivery is considered to occur when a product is shipped and the risk of loss and rewards of ownership have transferred to the customer. For digital downloads, delivery is considered to occur when the software is made available to the customer for download. For services and other, delivery is generally considered to occur as the service is delivered, which is determined based on the underlying service obligation. If there is significant uncertainty of acceptance, revenue is recognized once acceptance is reasonably assured. |
Online-Enabled Games
The majority of our software games and related content have online connectivity whereby a consumer may be able to download unspecified content or updates on a when-and-if-available basis (“unspecified updates”) for use with the original game software. In addition, we may also offer a service of online activities (e.g., online playability) without a separate fee. U.S. GAAP requires us to account for the consumer’s right to receive unspecified updates or the service of online activities for no additional fee as a “bundled” sale, or multiple-element arrangement.
We have an established historical pattern of providing unspecified updates (e.g., player roster updates to Madden NFL 18) to online-enabled games and related content at no additional charge to the consumer. Because we do not have vendor-specific objective evidence of fair value (“VSOE”) for these unspecified updates, we are required by current U.S. GAAP to recognize as
26
revenue the entire sales price of these online-enabled games and related content over the period we expect to offer the unspecified updates to the consumer (“estimated offering period”).
Estimated Offering Period
Because the offering period is not an explicitly defined period, we must make an estimate of the offering period. Determining the estimated offering period is inherently subjective and is subject to regular revision based on historical online usage. For example, in determining the estimated offering period for unspecified updates associated with our online-enabled games, we consider the period of time consumers are online as online connectivity is required. On an annual basis, we review consumers’ online gameplay of all online-enabled games that have been released 12 to 24 months prior to the evaluation date. For example, if our evaluation date is April 1, 2017, we evaluate all online-enabled games released between April 1, 2015 and March 31, 2016. Based on this population of games, for all players that register the game online within the first six months of release of the game to the general public, we compute the weighted-average number of days for each online-enabled game, based on when a player initially registers the game online to when that player last plays the game online. We then compute the weighted-average number of days for all online-enabled games by multiplying the weighted-average number of days for each online-enabled game by its relative percentage of total units sold from these online-enabled games (i.e., a game with more units sold will have a higher weighting to the overall computation than a game with fewer units sold). Under a similar computation, we also consider the estimated period of time between the date a game unit is sold to a reseller and the date the reseller sells the game unit to an end consumer (i.e., time in channel). Based on these two calculations we then consider the method of distribution. For example, physical software games sold at retail would have a composite offering period equal to the online gameplay plus time in channel as opposed to digitally distributed software games which are delivered immediately via digital download and thus have no concept of channel. Additionally, we consider results from prior analyses, known and expected online gameplay trends, as well as disclosed service periods for competitors’ games in determining the estimated offering period for future sales.
While we consistently apply this methodology, inherent assumptions used in this methodology include which online-enabled games to sample, whether to use only units that have registered online, whether to weight the number of days for each game, whether to weight the days based on the units sold of each game, determining the period of time between the date of sale to reseller and the date of sale to the consumer and assessing online gameplay trends.
We recognize revenue from the sale of online-enabled games for which we do not have VSOE for the unspecified updates on a straight-line basis, generally over an estimated nine-month period beginning in the month after shipment for physical games sold through retail and an estimated six-month period for digitally-distributed games.
Deferred Net Revenue (online-enabled games)
Because the majority of our sales are subject to a deferral period of generally six to nine months, our deferred net revenue (online-enabled games) balance is material. This balance increases from period to period by the revenue being deferred for current sales and is reduced by the recognition of revenue from prior sales that were deferred (i.e., the “net change” in the deferred balance). However, given the seasonal sales nature of our business, the net change in the deferred balance may be material from period to period. For example, because our sales have historically been highest in the fiscal third quarter, the deferred net revenue (online-enabled games) balance generally increases significantly in the third fiscal quarter. Similarly, because sales have historically been lowest in the first fiscal quarter, the deferred net revenue (online-enabled games) balance generally decreases significantly in the first fiscal quarter of a fiscal year.
Other Multiple-Element Arrangements
In some of our multiple-element arrangements, we sell non-software products with software and/or software-related offerings. These non-software products are generally music soundtracks, peripherals or ancillary collectors’ items, such as figurines and comic books. Revenue for these arrangements is allocated to each separate unit of accounting for each deliverable using the relative selling prices of each deliverable in the arrangement based on the selling price hierarchy described below. If the arrangement contains more than one software deliverable, the arrangement consideration is allocated to the software deliverables as a group and then allocated to each software deliverable.
We determine the selling price for a non-software product deliverable based on the following selling price hierarchy: VSOE (i.e., the price we charge when the non-software product is sold separately) if available, third-party evidence (“TPE”) of fair value (i.e., the price charged by others for similar non-software products) if VSOE is not available, or our best estimate of selling price (“BESP”) if neither VSOE nor TPE is available. Determining the BESP is a subjective process that is based on multiple factors including, but not limited to, recent selling prices and related discounts, market conditions, customer classes,
27
sales channels and other factors. Provided the other three revenue recognition criteria other than delivery have been met, we recognize revenue upon delivery to the customer as we have no further obligations.
We must make assumptions and judgments in order to (1) determine whether and when each element is delivered, (2) determine whether VSOE exists for each undelivered element, and (3) allocate the total price among the various elements, as applicable. Changes to any of these assumptions and judgments, or changes to the elements in the arrangement, could cause a material increase or decrease in the amount of revenue that we report in a particular period.
Principal Agent Considerations
We evaluate sales of our interactive software games, extra-content, and services from our subscription offerings via third party storefronts, including digital channel storefronts from Microsoft, Sony, Apple, and Google, in order to determine whether or not we are acting as the primary obligor in the sale to the end consumer, which we consider in determining if revenue should be reported gross or net of fees retained by the storefront. Key indicators that we evaluate in determining gross versus net treatment include but are not limited to the following:
• | The party responsible for delivery/fulfillment of the product or service to the end consumer |
• | The party responsible for the billing, collection of fees and refunds to the end consumer |
• | The storefront and Terms of Sale that govern the end consumer’s purchase of the product or service |
• | The party that sets the pricing with the end consumer and has credit risk |
Based on evaluation of the above indicators, we have determined that generally the third party is considered the primary obligor to end consumers for the sale of our interactive software games. We therefore report revenue related to these arrangements net of the fees retained by the storefront.
Sales Returns and Allowances
We reduce revenue for estimated future returns and price protection which may occur with our distributors and retailers (“channel partners”). Price protection represents our practice to provide our channel partners with a credit allowance to lower their wholesale price on a particular product that they have not resold to end consumers. The amount of the price protection is generally the difference between the old wholesale price and the new reduced wholesale price. In certain countries for our PC and console packaged goods software products, we also have a practice of allowing channel partners to return older software products in the channel in exchange for a credit allowance. As a general practice, we do not give cash refunds.
When evaluating the adequacy of sales returns and price protection allowances, we analyze the following: historical credit allowances, current sell-through of our channel partners’ inventory of our software products, current trends in retail and the video game industry, changes in customer demand, acceptance of our software products, and other related factors. In addition, we monitor the volume of sales to our channel partners and their inventories, as substantial overstocking in the distribution channel could result in high returns or higher price protection in subsequent periods.
In the future, actual returns and price protections may materially exceed our estimates as unsold software products in the distribution channels are exposed to rapid changes in consumer preferences, market conditions or technological obsolescence due to new platforms, product updates or competing software products. While we believe we can make reliable estimates regarding these matters, these estimates are inherently subjective. Accordingly, if our estimates change, our returns and price protection allowances would change and would impact the total net revenue and related Balance Sheet accounts that we report.
Fair Value Estimates
Business Combinations. We must estimate the fair value of assets acquired, liabilities and contingencies assumed, acquired in-process technology, and contingent consideration issued in a business combination. Our assessment of the estimated fair value of each of these can have a material effect on our reported results as intangible assets are amortized over various estimated useful lives. Furthermore, the estimated fair value assigned to an acquired asset or liability has a direct impact on the amount we recognize as goodwill, which is an asset that is not amortized. Determining the fair value of assets acquired requires an assessment of the highest and best use or the expected price to sell the asset and the related expected future cash flows. Determining the fair value of acquired in-process technology also requires an assessment of our expectations related to the use of that technology. Determining the fair value of an assumed liability requires an assessment of the expected cost to transfer the liability. Determining the fair value of contingent consideration requires an assessment of the probability-weighted expected future cash flows over the period in which the obligation is expected to be settled, and applying a discount rate that appropriately captures the risk associated with the obligation. The significant unobservable inputs used in the fair value measurement of the contingent consideration payable are forecasted earnings. Significant changes in forecasted earnings would
28
result in significantly higher or lower fair value measurement. This fair value assessment is also required in periods subsequent to a business combination. Such estimates are inherently difficult and subjective and can have a material impact on our Consolidated Financial Statements.
Royalties and Licenses
Our royalty expenses consist of payments to (1) content licensors, (2) independent software developers, and (3) co-publishing and distribution affiliates. License royalties consist of payments made to celebrities, professional sports organizations, movie studios and other organizations for our use of their trademarks, copyrights, personal publicity rights, content and/or other intellectual property. Royalty payments to independent software developers are payments for the development of intellectual property related to our games. Co-publishing and distribution royalties are payments made to third parties for the delivery of products.
Royalty-based obligations with content licensors and distribution affiliates are either paid in advance and capitalized as prepaid royalties or are accrued as incurred and subsequently paid. These royalty-based obligations are generally expensed to cost of revenue generally at the greater of the contractual rate or an effective royalty rate based on the total projected net revenue for contracts with guaranteed minimums. Significant judgment is required to estimate the effective royalty rate for a particular contract. Because the computation of effective royalty rates requires us to project future revenue, it is inherently subjective as our future revenue projections must anticipate a number of factors, including (1) the total number of titles subject to the contract, (2) the timing of the release of these titles, (3) the number of software units and amount of extra content that we expect to sell, which can be impacted by a number of variables, including product quality, number of platforms we release on, the timing of the title’s release and competition, and (4) future pricing. Determining the effective royalty rate for our titles is particularly challenging due to the inherent difficulty in predicting the popularity of entertainment products. Furthermore, if we conclude that we are unable to make a reasonably reliable forecast of projected net revenue, we recognize royalty expense at the greater of contract rate or on a straight-line basis over the term of the contract. Accordingly, if our future revenue projections change, our effective royalty rates would change, which could impact the amount and timing of royalty expense we recognize.
Prepayments made to thinly capitalized independent software developers and co-publishing affiliates are generally made in connection with the development of a particular product, and therefore, we are generally subject to development risk prior to the release of the product. Accordingly, payments that are due prior to completion of a product are generally expensed to research and development over the development period as the services are incurred. Payments due after completion of the product (primarily royalty-based in nature) are generally expensed as cost of revenue.
Our contracts with some licensors include minimum guaranteed royalty payments, which are initially recorded as an asset and as a liability at the contractual amount when no performance remains with the licensor. When performance remains with the licensor, we record guarantee payments as an asset when actually paid and as a liability when incurred, rather than recording the asset and liability upon execution of the contract.
Each quarter, we also evaluate the expected future realization of our royalty-based assets, as well as any unrecognized minimum commitments not yet paid to determine amounts we deem unlikely to be realized through product and service sales. Any impairments or losses determined before the launch of a product are generally charged to research and development expense. Impairments or losses determined post-launch are charged to cost of revenue. We evaluate long-lived royalty-based assets for impairment using undiscounted cash flows when impairment indicators exist. If impairment exists, then the assets are written down to fair value. Unrecognized minimum royalty-based commitments are accounted for as executory contracts, and therefore, any losses on these commitments are recognized when the underlying intellectual property is abandoned (i.e., cease use) or the contractual rights to use the intellectual property are terminated.
Income Taxes
We recognize deferred tax assets and liabilities for both (1) the expected impact of differences between the financial statement amount and the tax basis of assets and liabilities and (2) the expected future tax benefit to be derived from tax losses and tax credit carryforwards. We record a valuation allowance against deferred tax assets when it is considered more likely than not that all or a portion of our deferred tax assets will not be realized. In making this determination, we are required to give significant weight to evidence that can be objectively verified.
In addition to considering forecasts of future taxable income, we are also required to evaluate and quantify other possible sources of taxable income in order to assess the realization of our deferred tax assets, namely the reversal of existing deferred tax liabilities, the carryback of losses and credits as allowed under current tax law, and the implementation of tax planning
29
strategies. Evaluating and quantifying these amounts involves significant judgments. Each source of income must be evaluated based on all positive and negative evidence; this evaluation involves assumptions about future activity.
In the fourth quarter of fiscal year 2016, we realized significant U.S. pre-tax income for both the fourth quarter and the fiscal year ended March 31, 2016. As a result, we released the valuation allowance against all of the U.S. federal deferred tax assets and a portion of the U.S. state deferred tax assets during the fourth quarter of fiscal year 2016. We continue to maintain a valuation allowance related to specific U.S. state deferred tax assets and foreign capital loss carryovers, due to uncertainty about the future realization of these assets.
Our effective tax rate and resulting provision for income taxes for the year ended March 31, 2018 were significantly impacted by the U.S. Tax Act enacted on December 22, 2017. The U.S. Tax Act significantly revised the U.S. corporate income tax system by, among other things, lowering the U.S. corporate income tax rate to 21 percent, generally implementing a territorial tax system and imposing the Transition Tax.
Reasonable estimates of the impacts of the U.S. Tax Act are provided in accordance with SEC guidance that allows for a measurement period of up to one year after the enactment date of the U.S. Tax Act to finalize the recording of the related tax impacts. We expect to complete the accounting under the U.S. Tax Act as soon as practicable, but in no event later than one year from the enactment date of the U.S. Tax Act.
The final calculations of tax expenses and tax benefits resulting from the U.S. Tax Act may differ from our estimates, potentially materially, due to, among other things, changes in interpretations of the U.S. Tax Act, our further analysis of the U.S. Tax Act, or any updates or changes to estimates that we have utilized to calculate the transition impacts.
Prior to the U.S. Tax Act, a substantial majority of undistributed earnings of our foreign subsidiaries were considered to be indefinitely reinvested. The U.S. Tax Act included a mandatory one-time tax on accumulated earnings of foreign subsidiaries, and as a result, substantially all previously unremitted earnings for which no U.S. deferred tax liability had been accrued have now been subject to U.S. tax.
As part of the process of preparing our Consolidated Financial Statements, we are required to estimate our income taxes in each jurisdiction in which we operate prior to the completion and filing of tax returns for such periods. This process requires estimating both our geographic mix of income and our uncertain tax positions in each jurisdiction where we operate. These estimates involve complex issues and require us to make judgments about the likely application of the tax law to our situation, as well as with respect to other matters, such as anticipating the positions that we will take on tax returns prior to our preparing the returns and the outcomes of disputes with tax authorities. The ultimate resolution of these issues may take extended periods of time due to examinations by tax authorities and statutes of limitations. In addition, changes in our business, including acquisitions, changes in our international corporate structure, changes in the geographic location of business functions or assets, changes in the geographic mix and amount of income, as well as changes in our agreements with tax authorities, valuation allowances, applicable accounting rules, applicable tax laws and regulations, rulings and interpretations thereof, developments in tax audit and other matters, and variations in the estimated and actual level of annual pre-tax income can affect the overall effective tax rate.
IMPACT OF RECENTLY ISSUED ACCOUNTING STANDARDS
The information under the subheading “Impact of Recently Issued Accounting Standards” in Note 1 - Description of Business and Basis of Presentation to the Consolidated Financial Statements in this Form 10-K is incorporated by reference into this Item 7.
30
RESULTS OF OPERATIONS
Our fiscal year is reported on a 52- or 53-week period that ends on the Saturday nearest March 31. Our results of operations for the fiscal year ended March 31, 2018 and 2017 contained 52 weeks each and ended on March 31, 2018 and April 1, 2017, respectively. Our results of operations for the fiscal year ended March 31, 2016 contained 53 weeks and ended on April 2, 2016. For simplicity of disclosure, all fiscal periods are referred to as ending on a calendar month end.
Net Revenue
Net revenue consists of sales generated from (1) video games sold as digital downloads or as packaged goods and designed for play on game consoles and PCs, (2) video games for mobile phones and tablets, (3) separate software products and extra-content and online game services associated with these products, (4) licensing our game software to third parties, (5) allowing other companies to manufacture and sell our products in conjunction with other products, and (6) advertisements on our online web pages and in our games. We recognize revenue from the sale of online-enabled games for which we do not have VSOE for the unspecified updates on a straight-line basis, generally over an estimated six-month period for digitally-delivered games and content and an estimated nine-month period beginning in the month after shipment for physical games sold through retail.
We provide two different measures of our Net Revenue. (1) Net Revenue by Product revenue and Service and other revenue, and (2) Net Revenue by Type, which is primarily based on method of distribution. Management places a greater emphasis and focus on assessing our business through a review of the Net Revenue by Type (Digital, and Packaged goods and other) than by Net Revenue by Product revenue and Service and other revenue.
Comparison of Fiscal Year 2018 to Fiscal Year 2017
Net Revenue
For fiscal year 2018, net revenue was $5,150 million, an increase of $305 million, or 6 percent, as compared to fiscal year 2017. This increase was driven by a $681 million increase in revenue primarily from the FIFA and Mass Effect franchises. This increase was partially offset by a $376 million decrease in revenue primarily from the Star Wars, Plants vs. Zombies, and UFC franchises.
Net Revenue by Product Revenue and Service and Other Revenue
Our Net Revenue by Product revenue and Service and other revenue for fiscal years 2018 and 2017 was as follows (in millions):
Year Ended March 31, | ||||||||||||||
2018 | 2017 | $ Change | % Change | |||||||||||
Net revenue: | ||||||||||||||
Product | $ | 2,586 | $ | 2,640 | $ | (54 | ) | (2 | )% | |||||
Service and other | 2,564 | 2,205 | 359 | 16 | % | |||||||||
Total net revenue | $ | 5,150 | $ | 4,845 | $ | 305 | 6 | % | ||||||
Product Revenue
For fiscal year 2018, Product net revenue was $2,586 million, primarily driven by FIFA 18, Battlefield 1, and FIFA 17. Product net revenue decreased $54 million, or 2 percent, as compared to fiscal year 2017. This decrease was driven by a $450 million decrease primarily from the Star Wars, Battlefield, and UFC franchises. This decrease was partially offset by a $396 million increase primarily from the Mass Effect, The Sims, and Need for Speed franchises.
Service and Other Revenue
For fiscal year 2018, Service and other net revenue was $2,564 million, primarily driven by FIFA Ultimate Team, Star Wars: Galaxy of Heroes, and Battlefield 1 Premium. Service and other net revenue for fiscal year 2018 increased $359 million, or 16 percent, as compared to fiscal year 2017. This increase was driven by a $538 million increase primarily from FIFA Ultimate Team and Battlefield 1 Premium, partially offset by a $179 million decrease primarily from Need for Speed 2015 and the Plants vs. Zombies franchise.
31
Supplemental Net Revenue by Type
As we continue to evolve our business and more of our products are delivered to consumers digitally, we place a greater emphasis and focus on assessing our business performance through a review of net revenue by type.
Our net revenue by type for fiscal years 2018 and 2017 was as follows (in millions):
Year Ended March 31, | ||||||||||||||
2018 | 2017 | $ Change | % Change | |||||||||||
Full game downloads | $ | 707 | $ | 659 | 48 | 7 | % | |||||||
Live services (a) | 2,083 | 1,589 | 494 | 31 | % | |||||||||
Mobile | 660 | 626 | 34 | 5 | % | |||||||||
Total Digital | $ | 3,450 | $ | 2,874 | $ | 576 | 20 | % | ||||||
Packaged goods and other | $ | 1,700 | $ | 1,971 | (271 | ) | (14 | )% | ||||||
Net revenue | $ | 5,150 | $ | 4,845 | $ | 305 | 6 | % | ||||||
(a) | Live services net revenue is comprised of net revenue previously presented as “Extra content” and “Subscription, advertising, and other” through the fourth quarter of fiscal 2017. |
Digital Net Revenue
Digital net revenue includes full game downloads, live services, and mobile revenue. Digital net revenue includes game software distributed through our direct-to-consumer PC platform Origin, distributed wirelessly through mobile carriers, or licensed to our third-party publishing partners who distribute our games digitally.
For fiscal year 2018, digital net revenue was $3,450 million primarily driven by our digital business, particularly continued success with live services, including Ultimate Team and live services associated with Battlefield 1. Digital net revenue for fiscal year 2018 increased $576 million, or 20 percent, as compared to fiscal year 2017. This increase was due to (1) a $48 million or 7 percent increase in full-game download net revenue primarily driven by FIFA 18 and Mass Effect: Andromeda, partially offset by Battlefield 1 and Star Wars Battlefront, (2) a $494 million or 31 percent increase in live services net revenue primarily driven by our Ultimate Team game mode and Battlefield 1 Premium, (3) a $34 million or 5 percent increase in mobile net revenue primarily driven by Star Wars: Galaxy of Heroes and FIFA Mobile.
Packaged Goods and Other Net Revenue
Packaged goods and other net revenue includes revenue from software that is distributed physically. This includes (1) net revenue from game software distributed physically through traditional channels such as brick and mortar retailers, and (2) our software licensing revenue from third parties (for example, makers of console platforms, personal computers or computer accessories) who include certain of our products for sale with their products (“OEM bundles”).
For fiscal year 2018, packaged goods and other net revenue was $1,700 million, primarily driven by FIFA 18, FIFA 17, and Battlefield 1. Packaged goods and other net revenue for fiscal year 2018 decreased $271 million, or 14 percent, as compared to fiscal year 2017, primarily driven by consumers increasingly purchasing our games digitally, as opposed to purchasing physical discs. This decrease was driven by a $400 million decrease in net revenue primarily from the Star Wars, Plants vs. Zombies, and UFC franchises. This decrease was partially offset by a $129 million increase primarily from the Mass Effect and Battlefield franchises.
32
Cost of Revenue
Cost of revenue for fiscal years 2018 and 2017 was as follows (in millions):
March 31, 2018 | % of Related Net Revenue | March 31, 2017 | % of Related Net Revenue | % Change | Change as a % of Related Net Revenue | ||||||||||||||
Cost of revenue: | |||||||||||||||||||
Product | $ | 822 | 31.8 | % | $ | 893 | 33.8 | % | (8 | )% | (2.0 | )% | |||||||
Service and other | 455 | 17.7 | % | 405 | 18.4 | % | 12 | % | (0.7 | )% | |||||||||
Total cost of revenue | $ | 1,277 | 24.8 | % | $ | 1,298 | 26.8 | % | (2 | )% | (2.0 | )% | |||||||
Cost of Product Revenue
Cost of product revenue consists of (1) manufacturing royalties, net of volume discounts and other vendor reimbursements, (2) certain royalty expenses for celebrities, professional sports leagues, movie studios and other organizations, and independent software developers, (3) inventory costs, (4) expenses for defective products, (5) write-offs of post launch prepaid royalty costs and losses on previously unrecognized licensed intellectual property commitments, (6) amortization of certain intangible assets, (7) personnel-related costs, and (8) warehousing and distribution costs. We generally recognize volume discounts when they are earned from the manufacturer (typically in connection with the achievement of unit-based milestones); whereas other vendor reimbursements are generally recognized as the related revenue is recognized.
Cost of product revenue decreased by $71 million, or 8 percent in fiscal year 2018, as compared to fiscal year 2017. This decrease was primarily due to a decrease in inventory costs associated with Battlefield 1 and Titanfall 2 which were launched during the fiscal year 2017, a decrease in inventory and warehouse operations costs as a result of the closure of our Switzerland distribution business in fiscal year 2017, and a $25 million decrease in intangible amortization primarily due to the recognition of a $15 million impairment charge on an acquisition-related intangible asset during the fiscal year 2017. These decreases were partially offset by an increase in the royalty costs associated with our product launches during the fiscal year 2018, as compared to fiscal year 2017.
Cost of Service and Other Revenue
Cost of service and other revenue consists primarily of (1) royalty costs, (2) data center, bandwidth and server costs associated with hosting our online games and websites, (3) inventory costs, (4) platform processing fees from operating our website-based games on third party platforms, and (5) credit card fees associated with our service revenue.
Cost of service and other revenue increased by $50 million, or 12 percent in fiscal year 2018, as compared to fiscal year 2017. This increase was primarily due to an increase in royalty costs associated with higher sales associated with FIFA Ultimate Team and Madden Ultimate Team, offset by a $16 million decrease in intangible amortization.
Total Cost of Revenue as a Percentage of Total Net Revenue
During fiscal year 2018, total cost of revenue as a percentage of total net revenue decreased by $21 million, or 2.0 percent as compared to the fiscal year ended March 31, 2017. This decrease was primarily due to a decrease in inventory and warehouse operations costs as a result of the closure of our Switzerland distribution business in fiscal year 2017, and an increase in the proportion of our digital net revenues to packaged goods and other net revenues, which generally have higher costs than our digital products and services.
Research and Development
Research and development expenses consist of expenses incurred by our production studios for personnel-related costs, related overhead costs, contracted services, depreciation and any impairment of prepaid royalties for pre-launch products. Research and development expenses for our online products include expenses incurred by our studios consisting of direct development and related overhead costs in connection with the development and production of our online games. Research and development expenses also include expenses associated with our digital platform, software licenses and maintenance, and management overhead.
Research and development expenses for fiscal years 2018 and 2017 were as follows (in millions):
March 31, 2018 | % of Net Revenue | March 31, 2017 | % of Net Revenue | $ Change | % Change | ||||||||||||||
$ | 1,320 | 26 | % | $ | 1,205 | 25 | % | $ | 115 | 10 | % | ||||||||
33
Research and development expenses increased by $115 million, or 10 percent, in fiscal year 2018, as compared to fiscal year 2017. This $115 million increase was primarily due to a (1) a $78 million increase in personnel-related costs primarily resulting from an increase in headcount and an increase in salary costs, (2) a $37 million increase in stock-based compensation primarily resulting from an increase in equity award issuances to employees, and (3) a $21 million increase in facilities-related costs. These increases were partially offset by a $32 million decrease primarily due to a loss on a royalty-based commitment and impairment on a royalty based asset during fiscal year 2017.
Marketing and Sales
Marketing and sales expenses consist of personnel-related costs, related overhead costs, advertising, marketing and promotional expenses, net of qualified advertising cost reimbursements from third parties.
Marketing and sales expenses for fiscal years 2018 and 2017 were as follows (in millions):
March 31, 2018 | % of Net Revenue | March 31, 2017 | % of Net Revenue | $ Change | % Change | ||||||||||||||
$ | 641 | 12 | % | $ | 673 | 14 | % | $ | (32 | ) | (5 | )% | |||||||
Marketing and sales expenses decreased by $32 million, or 5 percent, in fiscal year 2018, as compared to fiscal year 2017. This $32 million decrease was primarily due to a decrease in advertising and promotional spending associated with our 2018 game launches as compared to our fiscal 2017 game launches, particularly Battlefield 1 and Titanfall 2, which were launched during fiscal 2017.
General and Administrative
General and administrative expenses consist of personnel and related expenses of executive and administrative staff, corporate functions such as finance, legal, human resources, and information technology, related overhead costs, fees for professional services such as legal and accounting, and allowances for doubtful accounts.
General and administrative expenses for fiscal years 2018 and 2017 were as follows (in millions):
March 31, 2018 | % of Net Revenue | March 31, 2017 | % of Net Revenue | $ Change | % Change | ||||||||||||||
$ | 469 | 9 | % | $ | 439 | 9 | % | $ | 30 | 7 | % | ||||||||
General and administrative expenses increased by $30 million, or 7 percent, in fiscal year 2018, as compared to fiscal year 2017. This $30 million increase was primarily due to (1) a $20 million increase in contracted services primarily due to higher legal expenses, (2) a $13 million increase in personnel-related costs primarily resulting from an increase in headcount, and (3) an $8 million increase in stock-based compensation. These increases were partially offset by an $8 million decrease in facility-related costs.
Income Taxes
Provision for income taxes for fiscal years 2018 and 2017 was as follows (in millions):
March 31, 2018 | Effective Tax Rate | March 31, 2017 | Effective Tax Rate | |||||||||
$ | 406 | 28.0 | % | $ | 243 | 20.1 | % | |||||
Our effective tax rate for the year ended March 31, 2018 was 28.0 percent as compared 20.1 percent for the same period in fiscal year 2017. Our effective tax rate and resulting provision for income taxes for the fiscal year ended March 31, 2018 was significantly impacted by the U.S. Tax Act. The U.S. Tax Act significantly revised the U.S. corporate income tax system by, among other things, lowering the U.S. corporate income tax rate to 21 percent, generally implementing a territorial tax system and imposing the Transition Tax. These impacts were offset by earnings realized in countries that have lower statutory tax rates and the recognition of excess tax benefits from stock-based compensation.
Our effective tax rates for fiscal year 2019 and future periods will continue to depend on a variety of factors, including changes in our business such as acquisitions and intercompany transactions, changes in our international structure, changes in the geographic location of business functions or assets, changes in the geographic mix of income, changes in or termination of our agreements with tax authorities, applicable accounting rules, applicable tax laws and regulations, rulings and interpretations thereof, developments in tax audit and other matters, and variations in our annual pre-tax income or loss. We anticipate that the impact of excess tax benefits and tax deficiencies may result in significant fluctuations to our effective tax rate in the future.
Reasonable estimates of the impacts of the U.S. Tax Act are provided in accordance with SEC guidance that allows for a measurement period of up to one year after the enactment date of the U.S. Tax Act to finalize the recording of the related tax
34
impacts. We expect to complete the accounting under the U.S. Tax Act as soon as practicable, but in no event later than one year from the enactment date of the U.S. Tax Act.
We recorded a provisional tax expense of $235 million related to the U.S. Tax Act for the year ended March 31, 2018, $192 million of which relates to the Transition Tax. During the three months ended March 31, 2018, we adjusted the provisional amount initially recorded for the Transition Tax by recognizing an additional $41 million charge. We also recorded immaterial adjustments to certain other tax items. These adjustments were based on our further analysis of the U.S. Tax Act and certain changes to current year earnings estimates and assertions. These amounts remain provisional. The final calculation of taxes attributable to the U.S. Tax Act may differ from our estimates, potentially materially, due to, among other things, changes in interpretations of the U.S. Tax Act, our further analysis of the U.S. Tax Act, or any updates or changes to estimates that we have utilized to calculate the transition impacts.
The U.S. Tax Act creates new U.S. taxes on foreign earnings. Our provision for income taxes for the year ended March 31, 2018 provisionally does not reflect any deferred tax impacts of the U.S. taxes on foreign earnings. Because of the complexity of the rules regarding the new tax on foreign earnings, we are continuing to evaluate this accounting policy election.
Comparison of Fiscal Year 2017 to Fiscal Year 2016
Net Revenue
For fiscal year 2017, net revenue was $4,845 million and increased $449 million, or 10 percent, as compared to fiscal year 2016. This increase was driven by an $809 million increase in revenue primarily from the Star Wars, Battlefield, and FIFA franchises. This increase was partially offset by a $360 million decrease in revenue primarily from the Dragon Age, The Sims, and NHL franchises, and The Simpsons Tapped Out.
Net Revenue by Product Revenue and Service and Other Revenue
Our Net Revenue by Product revenue and Service and other revenue for fiscal years 2017 and 2016 was as follows (in millions):
Year Ended March 31, | ||||||||||||||
2017 | 2016 | $ Change | % Change | |||||||||||
Net revenue: | ||||||||||||||
Product | $ | 2,640 | $ | 2,497 | $ | 143 | 6 | % | ||||||
Service and other | 2,205 | 1,899 | 306 | 16 | % | |||||||||
Total net revenue | $ | 4,845 | $ | 4,396 | $ | 449 | 10 | % | ||||||
Product Revenue
For fiscal year 2017, Product net revenue was $2,640 million, primarily driven by FIFA 17, Battlefield 1, and Star Wars Battlefront. Product net revenue increased $143 million, or 6 percent, as compared to fiscal year 2016. This increase was driven by a $526 million increase primarily from the Battlefield and Star Wars franchises, and Titanfall 2. This increase was partially offset by a $383 million decrease primarily from the Dragon Age, FIFA, The Sims, and Need for Speed franchises.
Service and Other Revenue
For fiscal year 2017, Service and other net revenue was $2,205 million, primarily driven by FIFA Ultimate Team, Star Wars: Galaxy of Heroes, and Need for Speed 2015. Service and other net revenue for fiscal year 2017 increased $306 million, or 16 percent, as compared to fiscal year 2016. This increase was driven by a $404 million increase primarily from FIFA Ultimate Team and the Star Wars and Need for Speed franchises. This increase was partially offset by a $98 million decrease primarily from The Simpsons Tapped Out, Titanfall, The Sims FreePlay, and Battlefield 4 Premium.
35
Supplemental Net Revenue by Composition
Our net revenue by composition for fiscal years 2017 and 2016 was as follows (in millions):
Year Ended March 31, | ||||||||||||||
2017 | 2016 | $ Change | % Change | |||||||||||
Full game downloads | $ | 659 | $ | 465 | $ | 194 | 42 | % | ||||||
Live services | 1,589 | 1,400 | 189 | 14 | % | |||||||||
Mobile | 626 | 544 | 82 | 15 | % | |||||||||
Total Digital | $ | 2,874 | $ | 2,409 | $ | 465 | 19 | % | ||||||
Packaged goods and other | $ | 1,971 | $ | 1,987 | $ | (16 | ) | (1 | )% | |||||
Net revenue | $ | 4,845 | $ | 4,396 | $ | 449 | 10 | % | ||||||
Digital Net Revenue
For fiscal year 2017, digital net revenue was $2,874 million primarily driven by FIFA Ultimate Team, FIFA Online 3 in Asia, Battlefield 1, and Star Wars: Galaxy of Heroes. Digital net revenue for fiscal year 2017 increased $465 million, or 19 percent, as compared to fiscal year 2016. This increase is due to (1) a $194 million or 42 percent increase in full-game download net revenue primarily driven by Battlefield 1 and FIFA 17, partially offset by Battlefield Hardline, (2) a $189 million or 14 percent increase in live services net revenue primarily driven by our Ultimate Team game mode and Star Wars Battlefront, and (3) an $82 million or 15 percent increase in mobile net revenue primarily driven by Star Wars: Galaxy of Heroes.
Packaged Goods and Other Net Revenue
For fiscal year 2017, packaged goods and other net revenue was $1,971 million, primarily driven by FIFA 17, FIFA 16, Star Wars Battlefront, and Battlefield 1. Packaged goods and other net revenue for fiscal year 2017 decreased $16 million, or 1 percent, as compared to fiscal year 2016.
Cost of Revenue
Cost of revenue for fiscal years 2017 and 2016 was as follows (in millions):
March 31, 2017 | % of Related Net Revenue | March 31, 2016 | % of Related Net Revenue | % Change | Change as a % of Related Net Revenue | ||||||||||||||
Cost of revenue: | |||||||||||||||||||
Product | $ | 893 | 33.8 | % | $ | 938 | 37.6 | % | (4.8 | )% | (3.8 | )% | |||||||
Service and other | 405 | 18.4 | % | 416 | 21.9 | % | (2.6 | )% | (3.5 | )% | |||||||||
Total cost of revenue | $ | 1,298 | 26.8 | % | $ | 1,354 | 30.8 | % | (4.1 | )% | (4.0 | )% | |||||||
Cost of Product Revenue
Cost of product revenue decreased by $45 million, or 4.8 percent in fiscal year 2017, as compared to fiscal year 2016. This decrease was driven primarily by a reduction in licensing costs as a result of a change in mix of our titles (i.e. Star Wars Battlefront was a fiscal 2016 title that had royalties associated with it while Battlefield 1 was a fiscal 2017 title that does not bear royalties). This was partially offset by the recognition of a $15 million impairment charge on an acquisition-related intangible asset, as well an increase in royalty costs associated with FIFA 17 and Titanfall 2.
Cost of Service and Other Revenue
Cost of service and other revenue decreased by $11 million, or 2.6 percent in fiscal year 2017, as compared to fiscal year 2016. The decrease was primarily due to a decrease in inventory costs due to the launch of Need for Speed 2015 during fiscal year
2016 without a comparable service game launch during fiscal year 2017, partially offset by the recognition of a $10 million impairment charge on a royalty-based asset, and an increase in royalty costs associated with FIFA Ultimate Team and Star Wars: Galaxy of Heroes during fiscal year 2017.
36
Total Cost of Revenue as a Percentage of Total Net Revenue
During fiscal year 2017, total cost of revenue as a percentage of total net revenue decreased by 4.0 percent as compared to the fiscal year ended March 31, 2016. This decrease was primarily due to an increase in the proportion of our digital net revenues to packaged goods and other net revenues, as well as lower royalties expense associated with our current year title mix as compared to fiscal year 2016.
Research and Development
Research and development expenses for fiscal years 2017 and 2016 were as follows (in millions):
March 31, 2017 | % of Net Revenue | March 31, 2016 | % of Net Revenue | $ Change | % Change | ||||||||||||||
$ | 1,205 | 25 | % | $ | 1,109 | 25 | % | $ | 96 | 9 | % | ||||||||
Research and development expenses increased by $96 million, or 9 percent, in fiscal year 2017, as compared to fiscal year 2016. This $96 million increase was primarily due to a (1) $41 million increase in contracted services primarily driven by an increase in development advances to third-party developers associated with the Star Wars franchise, (2) an aggregate $32 million pre-launch loss on previously unrecognized minimum royalty-based commitments and impairment on royalty-based assets, and (3) a $23 million increase in personnel-related costs primarily resulting from an increase in headcount. These increases were partially offset by the quarter ended June 30, 2016 containing 13 weeks of personnel costs as compared to 14 weeks in the prior fiscal year, as well as a reduction in losses of $10 million from our cash flow hedging program in fiscal 2017 as compared to fiscal 2016. We use hedges to protect against currency exchange rate movements in our research and development expenses.
Marketing and Sales
Marketing and sales expenses for fiscal years 2017 and 2016 were as follows (in millions):
March 31, 2017 | % of Net Revenue | March 31, 2016 | % of Net Revenue | $ Change | % Change | ||||||||||||||
$ | 673 | 14 | % | $ | 622 | 14 | % | $ | 51 | 8 | % | ||||||||
Marketing and sales expenses increased by $51 million, or 8 percent, in fiscal year 2017, as compared to fiscal year 2016. This $51 million increase was driven by higher advertising expenses associated with our fiscal year 2017 game launches, primarily Battlefield 1 and Titanfall 2, as compared to advertising expenses associated with our fiscal year 2016 game launches.
General and Administrative
General and administrative expenses for fiscal years 2017 and 2016 were as follows (in millions):
March 31, 2017 | % of Net Revenue | March 31, 2016 | % of Net Revenue | $ Change | % Change | ||||||||||||||
$ | 439 | 9 | % | $ | 406 | 9 | % | $ | 33 | 8 | % | ||||||||
General and administrative expenses increased by $33 million, or 8 percent, in fiscal year 2017, as compared to fiscal year 2016. This $33 million increase was primarily due to (1) a $12 million increase in facility-related expense primarily due to office expansions, (2) a $7 million increase in contracted services primarily due to higher legal expenses, and (3) a $6 million increase in personnel-related costs resulting from an increase in headcount.
Income Taxes
Provision for (benefit from) income taxes for fiscal years 2017 and 2016 was as follows (in millions):
March 31, 2017 | Effective Tax Rate | March 31, 2016 | Effective Tax Rate | |||||||||
$ | 243 | 20.1 | % | $ | (279 | ) | (31.8 | )% | ||||
Our effective tax rate for fiscal year 2017 was 20.1 percent. Our effective tax rate for the fiscal year 2017 differs from the statutory rate of 35.0 percent primarily due to non-U.S. profits subject to a reduced or zero tax rates. The effective tax rate for fiscal year 2017 differs from fiscal year 2016 primarily due to the reversal of a significant portion of our deferred tax valuation allowance recorded in fiscal year 2016. Excluding the impact of the reversal of the valuation allowance, our effective tax rate for fiscal year 2016 would have been 19.8 percent, which differs from the statutory rate of 35.0 percent primarily due to non-U.S. profits subject to a reduced or zero tax rates.
37
In the fourth quarter of fiscal year 2016, we realized significant U.S. pre-tax income for both the fourth quarter and the fiscal year ended March 31, 2016. As a result, we released the valuation allowance against all of the U.S. federal deferred tax assets and a portion of the U.S. state deferred tax assets during the fourth quarter of fiscal year 2016. Accordingly, we recorded a $453 million income tax benefit in fiscal year 2016 for the reversal of a significant portion of our deferred tax valuation allowance.
LIQUIDITY AND CAPITAL RESOURCES
As of March 31, | |||||||||||
(In millions) | 2018 | 2017 | 2016 | ||||||||
Cash and cash equivalents | $ | 4,258 | $ | 2,565 | $ | 2,493 | |||||
Short-term investments | 1,073 | 1,967 | 1,341 | ||||||||
Total | $ | 5,331 | $ | 4,532 | $ | 3,834 | |||||
Percentage of total assets | 62 | % | 59 | % | 54 | % | |||||
Year Ended March 31, | |||||||||||
(In millions) | 2018 | 2017 | 2016 | ||||||||
Cash provided by operating activities | $ | 1,692 | $ | 1,578 | $ | 1,465 | |||||
Cash provided by (used in) investing activities | 622 | (759 | ) | (484 | ) | ||||||
Cash used in financing activities | (643 | ) | (729 | ) | (548 | ) | |||||
Effect of foreign exchange on cash and cash equivalents | 22 | (18 | ) | (8 | ) | ||||||
Net increase in cash and cash equivalents | $ | 1,693 | $ | 72 | $ | 425 | |||||
Changes in Cash Flow
Comparison of Fiscal Year 2018 to Fiscal Year 2017
Operating Activities. In fiscal 2018, we delivered net revenue of $5.2 billion, cost of revenue of $1.3 billion, and operating income of $1.4 billion, which enabled us to record operating cash flow of $1.692 billion. Cash provided by operating activities increased $114 million during fiscal year 2018 as compared to fiscal year 2017. The increase is primarily driven by a $111 million increase in accounts receivable collections due to growth in sales associated with the Ultimate Team game mode and the collections from Mass Effect: Andromeda that was launched at the end of fiscal year 2017, partially offset by the live services sales at the end of fiscal year 2018 that will be collected in the beginning of fiscal year 2019.
Investing Activities. Cash provided by investing activities increased $1,381 million during fiscal year 2018 as compared to fiscal year 2017 primarily driven by a $1,885 million increase in proceeds from the sales and maturities of short-term investments as a result of repositioning such investments in order to make offshore funds available for repatriation. This was partially offset by a $370 million decrease in the purchase of short-term investments and a payment of $150 million in connection with the acquisition of Respawn.
Financing Activities. Cash used in financing activities decreased $86 million during fiscal year 2018 as compared to fiscal year 2017 primarily due to the repayment of $163 million of our formerly outstanding convertible notes in fiscal year 2017 without a corresponding transaction in fiscal year 2018, offset by a $93 million increase in the repurchase and retirement of our common stock in the current year.
Comparison of Fiscal Year 2017 to Fiscal Year 2016
Operating Activities. Cash provided by operating activities increased $113 million during fiscal year 2017 as compared to fiscal year 2016. The increase is primarily driven by a $385 million increase in sales related to FIFA 17, Battlefield 1, and Titanfall 2. This was partially offset by a $263 million decrease associated with a net increase in accounts receivable balances as of March 31, 2017 as compared to March 31, 2016 primarily due to the timing of game launches and higher digital sales during the three months ended March 31, 2017.
Investing Activities. Cash used in investing activities increased $275 million during fiscal year 2017 as compared to fiscal year 2016 primarily driven by a $585 million increase in the purchase of short-term investments and a $30 million increase in capital expenditures. This was partially offset by a $340 million increase in proceeds from the sales and maturities of short-term investments.
38
Financing Activities. Cash used in financing activities increased $181 million during fiscal year 2017 as compared to fiscal year 2016 primarily due to the issuance of Senior Notes for $989 million offset by the repurchases of our common stock for $510 million, both of which occurred during fiscal 2016. Also, we had a $35 million decrease in proceeds from the exercise of stock options and a $26 million decrease in taxes paid for shares withheld from employees, which were offset by a $307 million decrease in repayments related to our Convertible Notes during fiscal year 2017 as compared to fiscal year 2016.
Short-term Investments
Due to our mix of fixed and variable rate securities, our short-term investment portfolio is susceptible to changes in short-term interest rates. As of March 31, 2018, our short-term investments had gross unrealized losses of $9 million, or less than 1 percent of the total in short-term investments, and gross unrealized gains of less than $1 million, or less than 1 percent of the total in short-term investments. From time to time, we may liquidate some or all of our short-term investments to fund operational needs or other activities, such as capital expenditures, business acquisitions or stock repurchase programs.
Senior Notes
In February 2016, we issued $600 million aggregate principal amount of the 2021 Notes and $400 million aggregate principal amount of the 2026 Notes. We used the net proceeds of $989 million for general corporate purposes, including the payment of our formerly outstanding convertible notes and repurchases of our common stock. The effective interest rate is 3.94% for the 2021 Notes and 4.97% for the 2026 Notes. Interest is payable semiannually in arrears, on March 1 and September 1 of each year. See Note 11 - Financing Arrangements to the Consolidated Financial Statements in this Form 10-K as it relates to our Senior Notes, which is incorporated by reference into this Item 7.
Credit Facility
In March 2015, we entered into a $500 million senior unsecured revolving credit facility with a syndicate of banks. As of March 31, 2018, no amounts were outstanding under the credit facility. See Note 11 - Financing Arrangements to the Consolidated Financial Statements in this Form 10-K as it relates to our credit facility, which is incorporated by reference into this Item 7.
Financial Condition
We believe that our cash, cash equivalents, short-term investments, cash generated from operations and available financing facilities will be sufficient to meet our operating requirements for at least the next 12 months, including working capital requirements, capital expenditures, debt repayment obligations, stock repurchases, and potentially, future acquisitions, or strategic investments. We may choose at any time to raise additional capital to repay debt, strengthen our financial position, facilitate expansion, repurchase our stock, pursue strategic acquisitions and investments, and/or to take advantage of business opportunities as they arise. There can be no assurance, however, that such additional capital will be available to us on favorable terms, if at all, or that it will not result in substantial dilution to our existing stockholders.
As of March 31, 2018, approximately $3.7 billion of our cash, cash equivalents, and short-term investments were domiciled in foreign tax jurisdictions. As a result of the U.S. Tax Act, which generally implemented a territorial tax system, a substantial portion of this amount is available for repatriation.
In May 2018, a Special Committee of our Board of Directors, on behalf of the full Board of Directors, authorized a program to repurchase up to $2.4 billion of our common stock. This stock repurchase program supersedes and replaces the May 2017 program described below, and expires on May 31, 2020. Under this program, we may purchase stock in the open market or through privately-negotiated transactions in accordance with applicable securities laws, including pursuant to pre-arranged stock trading plans. The timing and actual amount of the stock repurchases will depend on several factors including price, capital availability, regulatory requirements, alternative investment opportunities and other market conditions. We are not obligated to repurchase a specific number of shares under this program and it may be modified, suspended or discontinued at any time. We are actively repurchasing shares under this program.
In May 2017, a Special Committee of our Board of Directors, on behalf of the full Board of Directors, authorized a program to repurchase up to $1.2 billion of our common stock. During the fiscal year ended March 31, 2018, we repurchased approximately 5.0 million shares for approximately $570 million under this program. This program was superseded and replaced by the May 2018 program.
In May 2015, our Board of Directors authorized a program to repurchase up to $1 billion of our common stock. We repurchased approximately 0.3 million shares for approximately $31 million under this program, respectively, during the fiscal year ended March 31, 2018. We completed repurchases under the May 2015 program in April 2017.
39
We have a “shelf” registration statement on Form S-3 on file with the SEC. This shelf registration statement, which includes a base prospectus, allows us at any time to offer any combination of securities described in the prospectus in one or more offerings. Unless otherwise specified in a prospectus supplement accompanying the base prospectus, we would use the net proceeds from the sale of any securities offered pursuant to the shelf registration statement for general corporate purposes, which may include funding for working capital, financing capital expenditures, research and development, marketing and distribution efforts, and if opportunities arise, for acquisitions or strategic alliances. Pending such uses, we may invest the net proceeds in interest-bearing securities. In addition, we may conduct concurrent or other financings at any time.
Our ability to maintain sufficient liquidity could be affected by various risks and uncertainties including, but not limited to, those related to customer demand and acceptance of our products, our ability to collect our accounts receivable as they become due, successfully achieving our product release schedules and attaining our forecasted sales objectives, the impact of acquisitions and other strategic transactions in which we may engage, the impact of competition, economic conditions in the United States and abroad, the seasonal and cyclical nature of our business and operating results, risks of product returns and the other risks described in the “Risk Factors” section, included in Part I, Item 1A of this report.
Contractual Obligations and Commercial Commitments
Note 12 - Commitments and Contingencies to the Consolidated Financial Statements in this Form 10-K as it relates to our contractual obligations and commercial commitments is incorporated by reference into this Item 7.
OFF-BALANCE SHEET ARRANGEMENTS
As of March 31, 2018, we did not have any off-balance sheet arrangements, as defined in Item 303(a)(4)(ii) of Regulation S-K promulgated by the SEC, that have or are reasonably likely to have a current or future effect on our financial condition, changes in financial condition, revenues and expenses, results of operations, liquidity, capital expenditures, or capital resources that are material to investors.
INFLATION
We believe the impact of inflation on our results of operations has not been significant in any of the past three fiscal years.
Item 7A: Quantitative and Qualitative Disclosures About Market Risk
MARKET RISK
We are exposed to various market risks, including changes in foreign currency exchange rates, interest rates and market prices, which have experienced significant volatility. Market risk is the potential loss arising from changes in market rates and market prices. We employ established policies and practices to manage these risks. Foreign currency forward contracts are used to hedge anticipated exposures or mitigate some existing exposures subject to foreign exchange risk as discussed below. While we do not hedge our short-term investment portfolio, we protect our short-term investment portfolio against different market risks, including interest rate risk as discussed below. Our cash and cash equivalents portfolio consists of highly liquid investments with insignificant interest rate risk and original or remaining maturities of three months or less at the time of purchase. We do not enter into derivatives or other financial instruments for speculative trading purposes and do not hedge our market price risk relating to marketable equity securities, if any.
Foreign Currency Exchange Risk
Foreign Currency Exchange Rates. International sales are a fundamental part of our business, and the strengthening of the U.S. dollar (particularly relative to the Euro, British pound sterling, Australian dollar, Chinese yuan and South Korean won) has a negative impact on our reported international net revenue, but a positive impact on our reported international operating expenses (particularly the Swedish krona and Canadian dollar) because these amounts are translated at lower rates as compared to periods in which the U.S. dollar is weaker. While we use foreign currency hedging contracts to mitigate some foreign currency exchange risk, these activities are limited in the protection that they provide us and can themselves result in losses.
Cash Flow Hedging Activities. We hedge a portion of our foreign currency risk related to forecasted foreign-currency-denominated sales and expense transactions by purchasing foreign currency forward contracts that generally have maturities of 18 months or less. These transactions are designated and qualify as cash flow hedges. Our hedging programs are designed to reduce, but do not entirely eliminate, the impact of currency exchange rate movements in net revenue and research and development expenses.
40
Balance Sheet Hedging Activities. We use foreign currency forward contracts to mitigate foreign currency exchange risk associated with foreign-currency-denominated monetary assets and liabilities, primarily intercompany receivables and payables. The foreign currency forward contracts generally have a contractual term of three months or less and are transacted near month-end.
We believe the counterparties to our foreign currency forward contracts are creditworthy multinational commercial banks. While we believe the risk of counterparty nonperformance is not material, a sustained decline in the financial stability of financial institutions as a result of disruption in the financial markets could affect our ability to secure creditworthy counterparties for our foreign currency hedging programs.
Notwithstanding our efforts to mitigate some foreign currency exchange risks, there can be no assurance that our hedging activities will adequately protect us against the risks associated with foreign currency fluctuations. As of March 31, 2018, a hypothetical adverse foreign currency exchange rate movement of 10 percent or 20 percent would have resulted in potential declines in the fair value on our foreign currency forward contracts used in cash flow hedging of $193 million or $386 million, respectively. As of March 31, 2018, a hypothetical adverse foreign currency exchange rate movement of 10 percent or 20 percent would have resulted in potential losses on our foreign currency forward contracts used in balance sheet hedging of $47 million or $93 million, respectively. This sensitivity analysis assumes an adverse shift of all foreign currency exchange rates; however, all foreign currency exchange rates do not always move in such manner and actual results may differ materially. See Note 4 - Derivative Financial Instruments to the Consolidated Financial Statements in this Form 10-K as it relates to our derivative financial instruments, which is incorporated by reference into this Item 7A.
Interest Rate Risk
Our exposure to market risk for changes in interest rates relates primarily to our short-term investment portfolio. We manage our interest rate risk by maintaining an investment portfolio generally consisting of debt instruments of high credit quality and relatively short maturities. However, because short-term investments mature relatively quickly and, if reinvested, are invested at the then-current market rates, interest income on a portfolio consisting of short-term investments is subject to market fluctuations to a greater extent than a portfolio of longer term investments. Additionally, the contractual terms of the investments do not permit the issuer to call, prepay or otherwise settle the investments at prices less than the stated par value. Our investments are held for purposes other than trading. We do not use derivative financial instruments in our short-term investment portfolio.
As of March 31, 2018, our short-term investments were classified as available-for-sale securities and, consequently, were recorded at fair value with unrealized gains or losses resulting from changes in fair value reported as a separate component of accumulated other comprehensive income (loss), net of tax, in stockholders’ equity.
Notwithstanding our efforts to manage interest rate risks, there can be no assurance that we will be adequately protected against risks associated with interest rate fluctuations. Fluctuations in interest rates could have a significant impact on the fair value of our investment portfolio. The following table presents the hypothetical changes in the fair value of our short-term investment portfolio as of March 31, 2018, arising from potential changes in interest rates. The modeling technique estimates the change in fair value from immediate hypothetical parallel shifts in the yield curve of plus or minus 50 basis points (“BPS”), 100 BPS, and 150 BPS.
(In millions) | Valuation of Securities Given an Interest Rate Decrease of X Basis Points | Fair Value as of March 31, 2018 | Valuation of Securities Given an Interest Rate Increase of X Basis Points | ||||||||||||||||||||||||
(150 BPS) | (100 BPS) | (50 BPS) | 50 BPS | 100 BPS | 150 BPS | ||||||||||||||||||||||
Corporate bonds | $ | 634 | $ | 631 | $ | 627 | $ | 624 | $ | 621 | $ | 617 | $ | 614 | |||||||||||||
U.S. Treasury securities | 213 | 212 | 211 | 210 | 209 | 208 | 206 | ||||||||||||||||||||
U.S. agency securities | 80 | 79 | 79 | 78 | 78 | 77 | 77 | ||||||||||||||||||||
Commercial paper | 109 | 109 | 109 | 109 | 109 | 108 | 108 | ||||||||||||||||||||
Foreign government securities | 53 | 53 | 53 | 52 | 52 | 51 | 51 | ||||||||||||||||||||
Total short-term investments | $ | 1,089 | $ | 1,084 | $ | 1,079 | $ | 1,073 | $ | 1,069 | $ | 1,061 | $ | 1,056 | |||||||||||||
41
Item 8: Financial Statements and Supplementary Data
Index to Consolidated Financial Statements
Page | |
Consolidated Financial Statements of Electronic Arts Inc. and Subsidiaries: | |
Financial Statement Schedule: | |
The following financial statement schedule of Electronic Arts Inc. and Subsidiaries for the years ended March 31, 2018, 2017 and 2016 is filed as part of this report and should be read in conjunction with the Consolidated Financial Statements of Electronic Arts Inc. and Subsidiaries: | |
Other financial statement schedules have been omitted because the information called for in them is not required or has already been included in either the Consolidated Financial Statements or the Notes thereto.
42
ELECTRONIC ARTS INC. AND SUBSIDIARIES
CONSOLIDATED BALANCE SHEETS
(In millions, except par value data) | March 31, 2018 | March 31, 2017 | |||||
ASSETS | |||||||
Current assets: | |||||||
Cash and cash equivalents | $ | 4,258 | $ | 2,565 | |||
Short-term investments | 1,073 | 1,967 | |||||
Receivables, net of allowances of $165 and $145, respectively | 385 | 359 | |||||
Other current assets | 288 | 308 | |||||
Total current assets | 6,004 | 5,199 | |||||
Property and equipment, net | 453 | 434 | |||||
Goodwill | 1,883 | 1,707 | |||||
Acquisition-related intangibles, net | 71 | 8 | |||||
Deferred income taxes, net | 84 | 286 | |||||
Other assets | 89 | 84 | |||||
TOTAL ASSETS | $ | 8,584 | $ | 7,718 | |||
LIABILITIES AND STOCKHOLDERS’ EQUITY | |||||||
Current liabilities: | |||||||
Accounts payable | $ | 48 | $ | 87 | |||
Accrued and other current liabilities | 821 | 789 | |||||
Deferred net revenue (online-enabled games) | 1,622 | 1,539 | |||||
Total current liabilities | 2,491 | 2,415 | |||||
Senior notes, net | 992 | 990 | |||||
Income tax obligations | 250 | 104 | |||||
Deferred income taxes, net | 1 | 1 | |||||
Other liabilities | 255 | 148 | |||||
Total liabilities | 3,989 | 3,658 | |||||
Commitments and contingencies (See Note 12) | |||||||
Stockholders’ equity: | |||||||
Preferred stock, $0.01 par value. 10 shares authorized | — | — | |||||
Common stock, $0.01 par value. 1,000 shares authorized; 306 and 308 shares issued and outstanding, respectively | 3 | 3 | |||||
Additional paid-in capital | 657 | 1,049 | |||||
Retained earnings | 4,062 | 3,027 | |||||
Accumulated other comprehensive loss | (127 | ) | (19 | ) | |||
Total stockholders’ equity | 4,595 | 4,060 | |||||
TOTAL LIABILITIES AND STOCKHOLDERS’ EQUITY | $ | 8,584 | $ | 7,718 | |||
See accompanying Notes to Consolidated Financial Statements.
43
ELECTRONIC ARTS INC. AND SUBSIDIARIES
CONSOLIDATED STATEMENTS OF OPERATIONS
Year Ended March 31, | |||||||||||
(In millions, except per share data) | 2018 | 2017 | 2016 | ||||||||
Net revenue: | |||||||||||
Product | $ | 2,586 | $ | 2,640 | $ | 2,497 | |||||
Service and other | 2,564 | 2,205 | 1,899 | ||||||||
Total net revenue | 5,150 | 4,845 | 4,396 | ||||||||
Cost of revenue: | |||||||||||
Product | 822 | 893 | 938 | ||||||||
Service and other | 455 | 405 | 416 | ||||||||
Total cost of revenue | 1,277 | 1,298 | 1,354 | ||||||||
Gross profit | 3,873 | 3,547 | 3,042 | ||||||||
Operating expenses: | |||||||||||
Research and development | 1,320 | 1,205 | 1,109 | ||||||||
Marketing and sales | 641 | 673 | 622 | ||||||||
General and administrative | 469 | 439 | 406 | ||||||||
Amortization of intangibles | 9 | 6 | 7 | ||||||||
Total operating expenses | 2,439 | 2,323 | 2,144 | ||||||||
Operating income | 1,434 | 1,224 | 898 | ||||||||
Interest and other income (expense), net | 15 | (14 | ) | (21 | ) | ||||||
Income before provision for (benefit from) income taxes | 1,449 | 1,210 | 877 | ||||||||
Provision for (benefit from) income taxes | 406 | 243 | (279 | ) | |||||||
Net income | $ | 1,043 | $ | 967 | $ | 1,156 | |||||
Earnings per share: | |||||||||||
Basic | $ | 3.39 | $ | 3.19 | $ | 3.73 | |||||
Diluted | $ | 3.34 | $ | 3.08 | $ | 3.50 | |||||
Number of shares used in computation: | |||||||||||
Basic | 308 | 303 | 310 | ||||||||
Diluted | 312 | 314 | 330 | ||||||||
See accompanying Notes to Consolidated Financial Statements.
44
ELECTRONIC ARTS INC. AND SUBSIDIARIES
CONSOLIDATED STATEMENTS OF COMPREHENSIVE INCOME
Year Ended March 31, | |||||||||||
(In millions) | 2018 | 2017 | 2016 | ||||||||
Net income | $ | 1,043 | $ | 967 | $ | 1,156 | |||||
Other comprehensive loss, net of tax: | |||||||||||
Net gains (losses) on available-for-sale securities | (5 | ) | (4 | ) | 4 | ||||||
Net gains (losses) on derivative instruments | (121 | ) | 18 | (7 | ) | ||||||
Foreign currency translation adjustments | 18 | (17 | ) | (15 | ) | ||||||
Total other comprehensive loss, net of tax | (108 | ) | (3 | ) | (18 | ) | |||||
Total comprehensive income | $ | 935 | $ | 964 | $ | 1,138 | |||||
See accompanying Notes to Consolidated Financial Statements.
45
ELECTRONIC ARTS INC. AND SUBSIDIARIES
CONSOLIDATED STATEMENTS OF STOCKHOLDERS’ EQUITY
(In millions, share data in thousands)
Common Stock | Additional Paid-in Capital | Retained Earnings | Accumulated Other Comprehensive Income (Loss) | Total Stockholders’ Equity | ||||||||||||||||||
Shares | Amount | |||||||||||||||||||||
Balances as of March 31, 2015 | 309,681 | $ | 3 | $ | 2,127 | $ | 904 | $ | 2 | $ | 3,036 | |||||||||||
Total comprehensive income (loss) | — | — | — | 1,156 | (18 | ) | 1,138 | |||||||||||||||
Issuance of common stock | 6,645 | — | (49 | ) | — | — | (49 | ) | ||||||||||||||
Reclassification of equity component of convertible notes | — | — | 29 | — | — | 29 | ||||||||||||||||
Settlement of convertible notes | 7,823 | — | (1 | ) | — | — | (1 | ) | ||||||||||||||
Exercise of convertible note hedge | (7,823 | ) | — | — | — | — | — | |||||||||||||||
Repurchase and retirement of common stock | (15,724 | ) | — | (1,018 | ) | — | — | (1,018 | ) | |||||||||||||
Stock-based compensation | — | — | 178 | — | — | 178 | ||||||||||||||||
Tax benefit from stock-based compensation | — | — | 83 | — | — | 83 | ||||||||||||||||
Balances as of March 31, 2016 | 300,602 | 3 | 1,349 | 2,060 | (16 | ) | 3,396 | |||||||||||||||
Total comprehensive income (loss) | — | — | — | 967 | (3 | ) | 964 | |||||||||||||||
Issuance of common stock | 4,626 | — | (55 | ) | — | — | (55 | ) | ||||||||||||||
Reclassification of equity component of convertible notes | — | — | 2 | — | — | 2 | ||||||||||||||||
Settlement of convertible notes | 2,917 | — | — | — | — | — | ||||||||||||||||
Exercise of convertible note hedge | (2,917 | ) | — | — | — | — | — | |||||||||||||||
Repurchase and retirement of common stock | (6,506 | ) | — | (508 | ) | — | — | (508 | ) | |||||||||||||
Settlement of warrants | 9,645 | — | — | — | — | — | ||||||||||||||||
Stock-based compensation | — | — | 196 | — | — | 196 | ||||||||||||||||
Tax benefit from stock-based compensation | — | — | 65 | — | — | 65 | ||||||||||||||||
Balances as of March 31, 2017 | 308,367 | 3 | 1,049 | 3,027 | (19 | ) | 4,060 | |||||||||||||||
Cumulative-effect adjustment from the adoption of ASU 2016-09 | — | — | 9 | (8 | ) | — | 1 | |||||||||||||||
Total comprehensive income (loss) | — | — | — | 1,043 | (108 | ) | 935 | |||||||||||||||
Issuance of common stock | 3,332 | — | (42 | ) | — | — | (42 | ) | ||||||||||||||
Repurchase and retirement of common stock | (5,329 | ) | — | (601 | ) | — | — | (601 | ) | |||||||||||||
Stock-based compensation | — | — | 242 | — | — | 242 | ||||||||||||||||
Balances as of March 31, 2018 | 306,370 | $ | 3 | $ | 657 | $ | 4,062 | $ | (127 | ) | $ | 4,595 | ||||||||||
See accompanying Notes to Consolidated Financial Statements.
46
ELECTRONIC ARTS INC. AND SUBSIDIARIES
CONSOLIDATED STATEMENTS OF CASH FLOWS
Year Ended March 31, | |||||||||||
(In millions) | 2018 | 2017 | 2016 | ||||||||
OPERATING ACTIVITIES | |||||||||||
Net income | $ | 1,043 | $ | 967 | $ | 1,156 | |||||
Adjustments to reconcile net income to net cash provided by operating activities: | |||||||||||
Depreciation, amortization and accretion | 136 | 172 | 197 | ||||||||
Stock-based compensation | 242 | 196 | 178 | ||||||||
Loss on conversion of convertible notes | — | — | 10 | ||||||||
Change in assets and liabilities: | |||||||||||
Receivables, net | (25 | ) | (136 | ) | 127 | ||||||
Other assets | 10 | 3 | 22 | ||||||||
Accounts payable | (44 | ) | 5 | 13 | |||||||
Accrued and other liabilities | 43 | 190 | (10 | ) | |||||||
Deferred income taxes, net | 204 | 100 | (403 | ) | |||||||
Deferred net revenue (online-enabled games) | 83 | 81 | 175 | ||||||||
Net cash provided by operating activities | 1,692 | 1,578 | 1,465 | ||||||||
INVESTING ACTIVITIES | |||||||||||
Capital expenditures | (107 | ) | (123 | ) | (93 | ) | |||||
Proceeds from maturities and sales of short-term investments | 3,166 | 1,281 | 941 | ||||||||
Purchase of short-term investments | (2,287 | ) | (1,917 | ) | (1,332 | ) | |||||
Acquisition, net of cash acquired | (150 | ) | — | — | |||||||
Net cash provided by (used in) investing activities | 622 | (759 | ) | (484 | ) | ||||||
FINANCING ACTIVITIES | |||||||||||
Proceeds from issuance of senior notes, net of issuance costs | — | — | 989 | ||||||||
Payment of convertible notes | — | (163 | ) | (470 | ) | ||||||
Proceeds from issuance of common stock | 78 | 72 | 107 | ||||||||
Cash paid to taxing authorities for shares withheld from employees | (120 | ) | (130 | ) | (156 | ) | |||||
Repurchase and retirement of common stock | (601 | ) | (508 | ) | (1,018 | ) | |||||
Net cash used in financing activities | (643 | ) | (729 | ) | (548 | ) | |||||
Effect of foreign exchange on cash and cash equivalents | 22 | (18 | ) | (8 | ) | ||||||
Increase in cash and cash equivalents | 1,693 | 72 | 425 | ||||||||
Beginning cash and cash equivalents | 2,565 | 2,493 | 2,068 | ||||||||
Ending cash and cash equivalents | $ | 4,258 | $ | 2,565 | $ | 2,493 | |||||
Supplemental cash flow information: | |||||||||||
Cash paid during the year for income taxes, net | $ | 57 | $ | 51 | $ | 35 | |||||
Cash paid during the year for interest | $ | 42 | $ | 43 | $ | 4 | |||||
See accompanying Notes to Consolidated Financial Statements.
47
ELECTRONIC ARTS INC. AND SUBSIDIARIES
NOTES TO CONSOLIDATED FINANCIAL STATEMENTS
(1) DESCRIPTION OF BUSINESS AND SUMMARY OF SIGNIFICANT ACCOUNTING POLICIES
We are a global leader in digital interactive entertainment, with a mission to inspire the world to play. We develop, market, publish and distribute games, content and services that can be played on a variety of platforms including game consoles, PCs, mobile phones and tablets. In our games and services, we use brands that we either wholly own (such as Battlefield, Mass Effect, Need for Speed, The Sims, Plants v. Zombies and Titanfall) or license from others (such as FIFA, Madden NFL and Star Wars). We develop and publish games and services across diverse genres such as sports, first-person shooter, action, role-playing and simulation.
A summary of our significant accounting policies applied in the preparation of our Consolidated Financial Statements follows:
Consolidation
The accompanying Consolidated Financial Statements include the accounts of Electronic Arts Inc. and its wholly-owned subsidiaries. Intercompany balances and transactions have been eliminated in consolidation.
Fiscal Year
Our fiscal year is reported on a 52- or 53-week period that ends on the Saturday nearest March 31. Our results of operations for the fiscal year ended March 31, 2018 and 2017 contained 52 weeks each and ended on March 31, 2018 and April 1, 2017, respectively. Our results of operations for the fiscal year ended March 31, 2016 contained 53 weeks and ended on April 2, 2016. For simplicity of disclosure, all fiscal periods are referred to as ending on a calendar month end.
Reclassifications
Certain prior year amounts were reclassified to conform to current year presentation.
Use of Estimates
The preparation of consolidated financial statements in conformity with accounting principles generally accepted in the United States (“U.S. GAAP”) requires us to make estimates and assumptions that affect the amounts reported in our consolidated financial statements and the accompanying notes. Such estimates include sales returns and allowances, provisions for doubtful accounts, accrued liabilities, offering periods for deferred net revenue, multiple-element arrangements, income taxes, losses on royalty commitments, estimates regarding the recoverability of prepaid royalties, inventories, long-lived assets, assets acquired and liabilities assumed in business combinations, certain estimates related to the measurement and recognition of costs resulting from our stock-based payment awards, unrecognized tax benefits, deferred income tax assets and associated valuation allowances, as well as estimates used in our goodwill, intangibles and short-term investment impairment tests. These estimates generally involve complex issues and require us to make judgments, involve analysis of historical and future trends, can require extended periods of time to resolve, and are subject to change from period to period. In all cases, actual results could differ materially from our estimates.
Cash, Cash Equivalents, and Short-Term Investments
Cash equivalents consist of highly liquid investments with insignificant interest rate risk and original or remaining maturities of three months or less at the time of purchase.
Short-term investments consist of securities with original or remaining maturities of greater than three months at the time of purchase, and are accounted for as available-for-sale securities and are recorded at fair value. Cash, cash equivalents and short-term investments are available for use in current operations or other activities such as capital expenditures, business combinations and share repurchases.
Unrealized gains and losses on our short-term investments are recorded as a component of accumulated other comprehensive income (loss) in stockholders’ equity, net of tax, until either (1) the security is sold, (2) the security has matured, or (3) we determine that the fair value of the security has declined below its adjusted cost basis and the decline is other-than-temporary. Realized gains and losses on our short-term investments are calculated based on the specific identification method and are reclassified from accumulated other comprehensive income (loss) to interest and other income (expense), net. Determining whether a decline in fair value is other-than-temporary requires management judgment based on the specific facts and circumstances of each security. The ultimate value realized on these securities is subject to market price volatility until they are sold.
48
Our short-term investments are evaluated for impairment quarterly. We consider various factors in determining whether we should recognize an impairment charge, including the credit quality of the issuer, the duration that the fair value has been less than the adjusted cost basis, severity of the impairment, reason for the decline in value and potential recovery period, the financial condition and near-term prospects of the investees, our intent to sell and ability to hold the investment for a period of time sufficient to allow for any anticipated recovery in market value, and any contractual terms impacting the prepayment or settlement process. If we conclude that an investment is other-than-temporarily impaired, we recognize an impairment charge at that time in our Consolidated Statements of Operations. Based on our evaluation, we did not consider any of our investments to be other-than-temporarily impaired as of March 31, 2018 and 2017.
Inventories
Inventories consist of materials (including manufacturing royalties paid to console manufacturers), labor and freight-in and are stated at the lower of cost (using the weighted average costing method) or net realizable value. We regularly review inventory quantities on-hand. We write down inventory based on excess or obsolete inventories determined primarily by future anticipated demand for our products. Inventory write-downs are measured as the difference between the cost of the inventory and market value, based upon assumptions about future demand that are inherently difficult to assess. At the point of a loss recognition, a new, lower cost basis for that inventory is established, and subsequent changes in facts and circumstances do not result in the restoration or increase in that newly established basis. Inventories are included in other current assets in the Consolidated Balance Sheets.
Property and Equipment, Net
Property and equipment, net, are stated at cost. Depreciation is calculated using the straight-line method over the following useful lives:
Buildings | 20 to 25 years | |
Computer equipment and software | 3 to 6 years | |
Equipment, furniture and fixtures, and other | 3 to 5 years | |
Leasehold improvements | Lesser of the lease term or the estimated useful lives of the improvements, generally 1 to 10 years | |
We capitalize costs associated with internal-use software development once a project has reached the application development stage. Such capitalized costs include external direct costs utilized in developing or obtaining the software, and payroll and payroll-related expenses for employees who are directly associated with the development of the software. Capitalization of such costs begins when the preliminary project stage is complete and ceases at the point in which the project is substantially complete and is ready for its intended purpose. Once the internal-use software is ready for its intended use, the assets are depreciated on a straight-line basis over each asset’s estimated useful life, which is generally three years. The net book value of capitalized costs associated with internal-use software was $35 million and $41 million as of March 31, 2018 and 2017, respectively.
Acquisition-Related Intangibles and Other Long-Lived Assets
We record acquisition-related intangible assets, such as developed and core technology, in connection with business combinations. We amortize the cost of acquisition-related intangible assets that have finite useful lives on a straight-line basis over the lesser of their estimated useful lives or the agreement terms, currently from one to nine years. We evaluate acquisition-related intangibles and other long-lived assets for impairment whenever events or changes in circumstances indicate that the carrying amount of an asset may not be recoverable. Recoverability of assets is measured by a comparison of the carrying amount of an asset to future undiscounted net cash flows expected to be generated by the asset group. This includes assumptions about future prospects for the business that the asset relates to and typically involves computations of the estimated future cash flows to be generated by these businesses. Based on these judgments and assumptions, we determine whether we need to take an impairment charge to reduce the value of the asset stated on our Consolidated Balance Sheets to reflect its estimated fair value. When we consider such assets to be impaired, the amount of impairment we recognize is measured by the amount by which the carrying amount of the asset exceeds its fair value.
49
Goodwill Impairment
In assessing impairment on our goodwill, we first analyze qualitative factors to determine whether it is more likely than not that the fair value of a reporting unit is less than its carrying amount as a basis for determining whether it is necessary to perform a goodwill impairment test. The qualitative factors we assess include long-term prospects of our performance, share price trends and market capitalization, and Company specific events. If we conclude it is more likely than not that the fair value of a reporting unit exceeds its carrying amount, we do not need to perform an impairment test. If based on that assessment, we believe it is more likely than not that the fair value of the reporting unit is less than its carrying value we will measure goodwill for impairment by applying fair value-based tests at the reporting unit level. Reporting units are determined by the components of operating segments that constitute a business for which (1) discrete financial information is available, (2) segment management regularly reviews the operating results of that component, and (3) whether the component has dissimilar economic characteristics to other components. As of March 31, 2018, we have only one reportable segment, which represents our only operating segment.
Revenue Recognition, Sales Returns and Allowances, and Bad Debt Reserves
We derive revenue principally from sales of interactive software games, and related content and services on game consoles, PCs, mobile phones and tablets. We evaluate revenue recognition based on the criteria set forth in FASB Accounting Standards Codification (“ASC”) 605, Revenue Recognition and ASC 985-605, Software: Revenue Recognition. We classify our revenue as either product revenue or service and other revenue.
Product revenue. Our product revenue includes revenue associated with the sale of software games or related product content or updates, whether delivered digitally (e.g., full-game downloads, extra-content) or via a physical disc (e.g., packaged goods), and licensing of game software to third-parties. Product revenue also includes revenue from mobile full game downloads that do not require our hosting support (e.g., premium mobile games) in order to utilize the game or related content (i.e. can be played with or without an Internet connection), and sales of tangible products such as hardware, peripherals, or collectors’ items.
Service and other revenue. Our service revenue includes revenue recognized from time-based subscriptions, games, content or updates that requires our hosting support in order to utilize the game or related content (i.e., can only be played with an Internet connection). This includes (1) entitlements to content that are accessed through hosting services (e.g., microtransactions for Internet-based, social network and free-to-download mobile games), (2) massively multi-player online (“MMO”) games (both software game and subscription sales), (3) subscriptions for our Battlefield Premium, EA and Origin Access, and Pogo-branded online game services, and (4) allocated service revenue from sales of software games with a service of online activities (e.g., online playability). Our other revenue includes advertising and non-software licensing revenue.
With respect to the allocated service revenue from sales of software games with a service of online activities (“online services”) mentioned above, our allocation of proceeds between product and service revenue for presentation purposes is based on management’s best estimate of the selling price of the online services with the residual value allocated to product revenue. Our estimate of the selling price of the online services are comprised of several factors including, but not limited to, prior selling prices for the online services, prices charged separately by other third-party vendors for similar service offerings, and a cost-plus-margin approach. We review the estimated selling price of the online services on a regular basis and use this methodology consistently to allocate revenue between product and service for software game sales with online services.
We evaluate and recognize revenue when all four of the following criteria are met:
• | Evidence of an arrangement. Evidence of an agreement with the customer that reflects the terms and conditions to deliver the related products or services must be present. |
• | Fixed or determinable fee. If a portion of the arrangement fee is not fixed or determinable, we recognize revenue as the amount becomes fixed or determinable. |
• | Collection is deemed probable. Collection is deemed probable if we expect the customer to be able to pay amounts under the arrangement as those amounts become due. If we determine that collection is not probable as the amounts become due, we generally conclude that collection becomes probable upon cash collection. |
• | Delivery. For packaged goods, delivery is considered to occur when a product is shipped and the risk of loss and rewards of ownership have transferred to the customer. For digital downloads, delivery is considered to occur when the software is made available to the customer for download. For services and other, delivery is generally considered |
50
to occur as the service is delivered, which is determined based on the underlying service obligation. If there is significant uncertainty of acceptance, revenue is recognized once acceptance is reasonably assured.
Online-Enabled Games
The majority of our software games and related content have online connectivity whereby a consumer may be able to download unspecified content or updates on a when-and-if-available basis (“unspecified updates”) for use with the original game software. In addition, we may also offer a service of online activities (e.g., online playability) without a separate fee. U.S. GAAP requires us to account for the consumer’s right to receive unspecified updates or the service of online activities for no additional fee as a “bundled” sale, or multiple-element arrangement.
We have an established historical pattern of providing unspecified updates (e.g., player roster updates to Madden NFL 18) to online-enabled games and related content at no additional charge to the consumer. Because we do not have vendor-specific objective evidence of fair value (“VSOE”) for these unspecified updates, we are required by current U.S. GAAP to recognize as revenue the entire sales price of these online-enabled games and related content over the period we expect to offer the unspecified updates to the consumer (“estimated offering period”).
Other Multiple-Element Arrangements
In some of our multiple-element arrangements, we sell non-software products with software and/or software-related offerings. These non-software products are generally music soundtracks, peripherals or ancillary collectors’ items, such as figurines and comic books. Revenue for these arrangements is allocated to each separate unit of accounting for each deliverable using the relative selling prices of each deliverable in the arrangement based on the selling price hierarchy described below. If the arrangement contains more than one software deliverable, the arrangement consideration is allocated to the software deliverables as a group and then allocated to each software deliverable.
We determine the selling price for a non-software product deliverable based on the following selling price hierarchy: VSOE (i.e., the price we charge when the non-software product is sold separately) if available, third-party evidence (“TPE”) of fair value (i.e., the price charged by others for similar non-software products) if VSOE is not available, or our best estimate of selling price (“BESP”) if neither VSOE nor TPE is available. Determining the BESP is a subjective process that is based on multiple factors including, but not limited to, recent selling prices and related discounts, market conditions, customer classes, sales channels and other factors. Provided the other three revenue recognition criteria other than delivery have been met, we recognize revenue upon delivery to the customer as we have no further obligations.
Principal Agent Considerations
We evaluate sales of our interactive software games, extra-content, and services from our subscription offerings via third party storefronts, including digital channel storefronts from Microsoft, Sony, Apple, and Google, in order to determine whether or not we are acting as the primary obligor in the sale to the end consumer, which we consider in determining if revenue should be reported gross or net of fees retained by the storefront. Key indicators that we evaluate in determining gross versus net treatment include but are not limited to the following:
• | The party responsible for delivery/fulfillment of the product or service to the end consumer |
• | The party responsible for the billing, collection of fees and refunds to the end consumer |
• | The storefront and Terms of Sale that govern the end consumer’s purchase of the product or service |
• | The party that sets the pricing with the end consumer and has credit risk |
Based on evaluation of the above indicators, we have determined that generally the third party is considered the primary obligor to end consumers for the sale of our interactive software games. We therefore report revenue related to these arrangements net of the fees retained by the storefront.
Sales Returns and Allowances and Bad Debt Reserves
We reduce revenue for estimated future returns and price protection which may occur with our distributors and retailers (“channel partners”). Price protection represents our practice to provide our channel partners with a credit allowance to lower their wholesale price on a particular product that they have not resold to end consumers. The amount of the price protection is generally the difference between the old wholesale price and the new reduced wholesale price. In certain countries for our PC and console packaged goods software products, we also have a practice of allowing channel partners to return older software products in the channel in exchange for a credit allowance. As a general practice, we do not give cash refunds.
51
We determine our allowance for doubtful accounts by evaluating the following: customer creditworthiness, current economic trends, historical experience, age of current accounts receivable balances, and changes in financial condition or payment terms of our customers. Significant management judgment is required to estimate our allowance for doubtful accounts in any accounting period. The amount and timing of our bad debt expense and cash collection could change significantly as a result of a change in any of the evaluation factors mentioned above.
Taxes Collected from Customers and Remitted to Governmental Authorities
Taxes assessed by a government authority that are both imposed on and concurrent with specific revenue transactions between us and our customers are presented on a net basis in our Consolidated Statements of Operations.
Concentration of Credit Risk, Significant Customers, and Platform Partners
We extend credit to various digital resellers and channel partners. Collection of trade receivables may be affected by changes in economic or other industry conditions and may, accordingly, impact our overall credit risk. Although we generally do not require collateral, we perform ongoing credit evaluations of our customers and maintain reserves for potential credit losses. Invoices are aged based on contractual terms with our customers. The provision for doubtful accounts is recorded as a charge to general and administrative expense when a potential loss is identified. Losses are written off against the allowance when the receivable is determined to be uncollectible. At March 31, 2018, we had three customers who accounted for approximately 39 percent, 21 percent, and 10 percent of our consolidated gross receivables, respectively. At March 31, 2017, we had three customers who accounted for 27 percent, 22 percent, and 11 percent of our consolidated gross receivables, respectively.
A majority of our sales are made via digital resellers and channel partners. During the fiscal years 2018, 2017, and 2016, approximately 67 percent, 64 percent, and 62 percent, respectively, of our net revenue was derived from our top ten customers. Though our products and services are available to consumers through a variety of retailers, digital resellers and directly through us, the concentration of our sales in one, or a few, large customers could lead to a short-term disruption in our sales if one or more digital resellers and channel partners significantly reduced their purchases or ceased to carry our products and services, and could make us more vulnerable to collection risk if one or more of these large customers became unable to pay for our products or declared bankruptcy.
Currently, a majority of our revenue is derived through sales of products and services playable on hardware consoles from Sony and Microsoft. For the fiscal years ended March 31, 2018, 2017 and 2016, our net revenue for products and services on Sony’s PlayStation 3 and 4, and Microsoft’s Xbox 360 and One consoles (combined across all four platforms) was 70 percent, 70 percent, and 67 percent, respectively. These platform partners have significant influence over the products and services that we offer on their platforms. Our agreements with Sony and Microsoft typically give significant control to them over the approval, manufacturing and distribution of our products and services that are distributed through their platform, which could, in certain circumstances, leave us unable to get our products and services approved, manufactured or distributed to customers.
Short-term investments are placed with high quality financial institutions or in short-duration, investment-grade securities. We limit the amount of credit exposure in any one financial institution or type of investment instrument.
Royalties and Licenses
Royalty-based obligations with content licensors and distribution affiliates are either paid in advance and capitalized as prepaid royalties or are accrued as incurred and subsequently paid. These royalty-based obligations are generally expensed to cost of revenue generally at the greater of the contractual rate or an effective royalty rate based on the total projected net revenue for contracts with guaranteed minimums. Prepayments made to thinly capitalized independent software developers and co-publishing affiliates are generally made in connection with the development of a particular product, and therefore, we are generally subject to development risk prior to the release of the product. Accordingly, payments that are due prior to completion of a product are generally expensed to research and development over the development period as the services are incurred. Payments due after completion of the product (primarily royalty-based in nature) are generally expensed as cost of revenue.
Our contracts with some licensors include minimum guaranteed royalty payments, which are initially recorded as an asset and as a liability at the contractual amount when no performance remains with the licensor. When performance remains with the licensor, we record guarantee payments as an asset when actually paid and as a liability when incurred, rather than recording the asset and liability upon execution of the contract.
Each quarter, we also evaluate the expected future realization of our royalty-based assets, as well as any unrecognized minimum commitments not yet paid to determine amounts we deem unlikely to be realized through product and service sales. Any impairments or losses determined before the launch of a product are generally charged to research and development
52
expense. Impairments or losses determined post-launch are charged to cost of revenue. We evaluate long-lived royalty-based assets for impairment using undiscounted cash flows when impairment indicators exist. If impairment exists, then the assets are written down to fair value. Unrecognized minimum royalty-based commitments are accounted for as executory contracts, and therefore, any losses on these commitments are recognized when the underlying intellectual property is abandoned (i.e., cease use) or the contractual rights to use the intellectual property are terminated.
Advertising Costs
We generally expense advertising costs as incurred, except for production costs associated with media campaigns, which are recognized as prepaid assets (to the extent paid in advance) and expensed at the first run of the advertisement. Cooperative advertising costs are recognized when incurred and are classified as marketing and sales expense if there is a separate identifiable benefit for which we can reasonably estimate the fair value of the benefit identified. Otherwise, they are classified as a reduction of revenue and are generally accrued when revenue is recognized. We then reimburse the channel partner when qualifying claims are submitted.
We are also reimbursed by our vendors for certain advertising costs incurred by us that benefit our vendors. Such amounts are recognized as a reduction of marketing and sales expense if the advertising (1) is specific to the vendor, (2) represents an identifiable benefit to us, and (3) represents an incremental cost to us. Otherwise, vendor reimbursements are recognized as a reduction of the cost incurred with the same vendor. Vendor reimbursements of advertising costs of $45 million, $53 million, and $51 million reduced marketing and sales expense for the fiscal years ended March 31, 2018, 2017 and 2016, respectively. For the fiscal years ended March 31, 2018, 2017 and 2016, advertising expense, net of vendor reimbursements, totaled approximately $261 million, $281 million, and $240 million, respectively.
Software Development Costs
Research and development costs, which consist primarily of software development costs, are expensed as incurred. We are required to capitalize software development costs incurred for computer software to be sold, leased or otherwise marketed after technological feasibility of the software is established or for development costs that have alternative future uses. Under our current practice of developing new games, the technological feasibility of the underlying software is not established until substantially all product development and testing is complete, which generally includes the development of a working model. Software development costs that have been capitalized to date have been insignificant.
Foreign Currency Translation
Generally, the functional currency for our foreign operating subsidiaries is its local currency. Assets and liabilities of foreign operations are translated into U.S. dollars using month-end exchange rates, and revenue and expenses are translated into U.S. dollars using average exchange rates. The effects of foreign currency translation adjustments are included as a component of accumulated other comprehensive income (loss) in stockholders’ equity.
Foreign currency transaction gains and losses are a result of the effect of exchange rate changes on transactions denominated in currencies other than the functional currency. Net foreign currency transaction gains (losses) of $18 million, $(40) million, and $(14) million for the fiscal years ended March 31, 2018, 2017 and 2016, respectively, are included in interest and other income (expense), net, in our Consolidated Statements of Operations. These net foreign currency transaction gains (losses) are partially offset by net gains (losses) on our foreign currency forward contracts of $(16) million, $46 million, and $15 million for the fiscal years ended March 31, 2018, 2017 and 2016, respectively. See Note 4 for additional information on our foreign currency forward contracts.
Income Taxes
We recognize deferred tax assets and liabilities for both the expected impact of differences between the financial statement amount and the tax basis of assets and liabilities and for the expected future tax benefit to be derived from tax losses and tax credit carryforwards. We record a valuation allowance against deferred tax assets when it is considered more likely than not that all or a portion of our deferred tax assets will not be realized. In making this determination, we are required to give significant weight to evidence that can be objectively verified. It is generally difficult to conclude that a valuation allowance is not needed when there is significant negative evidence, such as cumulative losses in recent years. Forecasts of future taxable income are considered to be less objective than past results. Therefore, cumulative losses weigh heavily in the overall assessment.
In addition to considering forecasts of future taxable income, we are also required to evaluate and quantify other possible sources of taxable income in order to assess the realization of our deferred tax assets, namely the reversal of existing deferred tax liabilities, the carry back of losses and credits as allowed under current tax law, and the implementation of tax planning
53
strategies. Evaluating and quantifying these amounts involves significant judgments. Each source of income must be evaluated based on all positive and negative evidence; this evaluation involves assumptions about future activity. Certain taxable temporary differences that are not expected to reverse during the carry forward periods permitted by tax law cannot be considered as a source of future taxable income that may be available to realize the benefit of deferred tax assets.
Recently Adopted Accounting Standards
In March 2016, the FASB issued ASU 2016-09, Compensation - Stock Compensation (Topic 718): Improvements to Employee Share-Based Payment Accounting, related to simplifications of employee share-based payment accounting. This pronouncement eliminated the APIC pool concept and requires that excess tax benefits and tax deficiencies be recorded in the income statement when awards are settled. As a result, reflected excess tax benefits of $43 million for the fiscal year ended March 31, 2018 in the Consolidated Statement of Income as a component of the provision for income taxes, whereas for the fiscal year ended March 31, 2017, they were recognized in additional paid-in-capital in the Consolidated Balance Sheets. The pronouncement also addressed simplifications related to statement of cash flows classification, accounting for forfeitures, and minimum statutory tax withholding requirements. We adopted ASU 2016-09 at the beginning of fiscal year 2018. Upon adoption of ASU 2016-09, excess tax benefits and tax deficiencies from employee share-based award activity are reflected in the Consolidated Statements of Income as a component of the provision for income taxes, whereas they previously were recognized in additional paid-in-capital. We now account for forfeitures as they occur, rather than estimate expected forfeitures. The adoption resulted in a cumulative-effect adjustment of $8 million, net of tax, decrease to retained earnings as a result of the change in recognition for forfeitures. The adoption of ASU 2016-09 also resulted in two changes to our cash flow presentation, which we applied retrospectively for comparability. Excess tax benefits are now presented as operating activities rather than financing activities, and cash payments to tax authorities in connection with shares withheld to meet statutory tax withholding requirements are now presented as a financing activity. The net increase to our reported net cash provided by operating activities and corresponding increase to cash used in financing activities resulting from the adoption of ASU 2016-09 for the fiscal years ended March 31, 2017 and 2016, and for comparability, the fiscal year ended March 31, 2018, are as follows:
Year Ended March 31, | |||||||||||
(In millions): | 2018 | 2017 | 2016 | ||||||||
Excess tax benefits from stock-based compensation | $ | 43 | $ | 65 | $ | 86 | |||||
Cash paid to taxing authorities for shares withheld from employees | 120 | 130 | 156 | ||||||||
Increase to net cash provided by operating activities and net cash used in financing activities | $ | 163 | $ | 195 | $ | 242 | |||||
In May 2017, the FASB issued ASU 2017-09, Compensation - Stock Compensation (Topic 718): Scope of Modification Accounting, which clarified when to account for a change to the terms or conditions of a share-based payment award as a modification. Modification accounting is required only if the fair value, the vesting conditions, or the classification of the award (as equity or liability) changes as a result of the change in terms or condition. We early adopted ASU 2017-09 in the first quarter of fiscal year 2018. The adoption did not have an impact on our Consolidated Financial Statements.
In January 2017, the FASB issued ASU 2017-04, Intangibles—Goodwill and Other (Topic 350). The standard simplifies the goodwill impairment test. This update removes Step 2 of the goodwill impairment test, which requires a hypothetical purchase price allocation. A goodwill impairment will now be the amount by which a reporting unit’s carrying value exceeds its fair value, however, the loss recognized should not exceed the total amount of goodwill allocated to that reporting unit. We early adopted ASU 2017-04 during the fourth quarter of fiscal year 2018. The adoption did not have an impact on our Consolidated Financial Statements.
Impact of Recently Issued Accounting Standards
In May 2014, the FASB issued ASU 2014-09, Revenue from Contracts with Customers (Topic 606), (the “New Revenue Standard”), which will replace existing guidance under U.S. GAAP, including industry-specific requirements, and will provide companies with a single principles-based revenue recognition model for recognizing revenue from contracts with customers. The core principle of the New Revenue Standard is that a company should recognize the amount of revenue to which it expects to be entitled for the transfer of promised goods or services to customers. In addition, the FASB has issued several amendments to the New Revenue Standard, including principal versus agent considerations, clarifications on identification of performance obligations, and accounting for licenses of intellectual property.
The New Revenue Standard is effective for us beginning in the first quarter of fiscal year 2019. We are adopting the New Revenue Standard using the modified retrospective method, which recognizes the cumulative effect of initially applying the New Revenue Standard as an adjustment to retained earnings at the adoption date. We have concluded on several key accounting assessments related to the New Revenue Standard.
54
The New Revenue Standard will have a significant impact on our Consolidated Financial Statements and related disclosures as it relates to the accounting for substantially all of our transactions with multiple elements or “bundled” arrangements. For example, for sales of online-enabled games, as currently reported we do not have vendor-specific objective evidence of fair value (“VSOE”) for unspecified future updates, and thus, revenue from the entire sales price is recognized ratably over the estimated offering period. However, under the New Revenue Standard, the VSOE requirement for undelivered elements is eliminated, allowing us to essentially “break-apart” our online-enabled games and account for the various promised goods or services identified as separate performance obligations.
For example, for the sale of an online-enabled game, we usually have multiple distinct performance obligations such as software, future update rights, and an online service. The software performance obligation represents the initial game delivered digitally or via physical disc. The future update rights performance obligation may include software patches or updates, maintenance, and/or additional free content to be delivered in the future. And lastly, the online service performance obligation consists of providing the customer with a service of online activities (e.g., online playability). Under current software revenue recognition rules, we recognize as revenue the entire sales price over the estimated offering period. However, under the New Revenue Standard, we currently estimate that a significant portion of the sales price will be allocated to the software performance obligation and recognized upon delivery, and the remaining portion will be allocated to the future update rights and the online service performance obligations and recognized ratably over the estimated offering period. As a result, we expect a significant portion of our annual revenue, and thereby annual profit, will shift from the first and fourth fiscal quarters to the second and third fiscal quarters which is historically when a significant portion of our annual bookings and software deliveries have been made.
The adoption of the New Revenue Standard will also change how we present mobile revenue. Currently, mobile platform fees retained by third-party application storefronts such as the Apple App Store and Google Play, are reported on a net basis within net revenue. Upon adoption, we will report mobile platform fees within cost of revenue. As a result, both mobile revenue and cost of revenue will increase by the amount of the mobile platform fees. This change will also decrease our gross margin percentage but will not have a material impact on our annual total gross profit or profitability.
In addition, both portions of sales price allocated to future update rights and online services will be classified as service revenue under the New Revenue Standard (currently, future update rights are generally presented as product revenue). Therefore, upon adoption, an increased portion of our sales from online-enabled games will be presented as service revenue than is currently reported today. Also, upon adoption of the New Revenue Standard, a substantial majority of our sales returns and price protection reserves will be classified as liabilities (currently, these allowances are classified as contra-assets within receivables on our Consolidated Balance Sheets). Additionally, the adoption of the New Revenue Standard requires us to modify our systems, processes, and internal controls, including the internal controls over financial reporting, to reflect the changes to the way in which we recognize revenue.
We expect the net cumulative effect adjustment upon adoption to result in an increase to retained earnings in the range of $550 million to $650 million, net of tax. The finalized impact to our consolidated financial statements will be included in our Form 10-Q for the first quarter of fiscal year 2019. We will continue to monitor additional changes, modifications, clarifications or interpretations of the New Revenue Standard, which may impact current expectations. It is possible that during the first quarter of fiscal year 2019, we could identify items that result in additional material changes to our Consolidated Financial Statements.
In January 2016, the FASB issued ASU 2016-01, Financial Instruments (Topic 825-10), which requires that most equity investments be measured at fair value, with subsequent changes in fair value recognized in net income. The ASU also impacts financial liabilities under the fair value option and the presentation and disclosure requirements for financial instruments. The requirements will be effective for us beginning in the first quarter of fiscal year 2019. We do not expect the adoption to have a material impact on our Consolidated Financial Statements.
In March 2016, the FASB issued ASU 2016-04, Liabilities – Extinguishments of Liabilities (Subtopic 405-20): Recognition of Breakage for Certain Prepaid Stored-Value Products. The amendments in the ASU are designed to provide guidance and eliminate diversity in the accounting for derecognition of prepaid stored-value product liabilities. Typically, a prepaid stored-value product liability is to be derecognized when it is probable that a significant reversal of the recognized breakage amount will not subsequently occur. This is when the likelihood of the product holder exercising its remaining rights becomes remote. This estimate shall be updated at the end of each period. The amendments in this ASU are effective for us beginning in the first quarter of fiscal year 2019. Early adoption is permitted. We do not expect the adoption to have a material impact on our Consolidated Financial Statements.
In August 2016, the FASB issued ASU 2016-15, Statement of Cash Flows (Topic 230): Classification of Certain Cash Receipts and Cash Payments. This update is intended to reduce the existing diversity in practice in how certain transactions are classified in the statement of cash flows. This update is effective for us beginning in the first quarter of fiscal year 2019. Early
55
adoption is permitted, provided that all of the amendments are adopted in the same period. We do not expect the adoption to have a material impact on our Consolidated Financial Statements.
In November 2016, the FASB issued ASU 2016-18, Statement of Cash Flows (Topic 230): Restricted Cash (a consensus of the FASB Emerging Issues Task Force), which requires amounts generally described as restricted cash and restricted cash equivalents be included with cash and cash equivalents when reconciling the beginning-of-period and end-of-period total amounts shown in the statement of cash flows. This update is effective for us beginning in the first quarter of fiscal year 2019. Early adoption is permitted. We do not expect the adoption to have a material impact on our Consolidated Financial Statements.
In February 2016, the FASB issued ASU 2016-02, Leases (Topic 842). The FASB issued this standard to increase transparency and comparability among organizations by recognizing lease assets and lease liabilities on the balance sheet and disclosing key information about leasing arrangements. We anticipate adopting this standard beginning in the first quarter of fiscal year 2020, when the updated guidance is effective for us. We are currently evaluating the impact of this new standard on our Consolidated Financial Statements and related disclosures.
In August 2017, the FASB issued ASU 2017-12, Derivatives and Hedging (Topic 815): Targeted Improvements to Accounting for Hedging Activities. This update is intended to make more financial and nonfinancial hedging strategies eligible for hedge accounting. It also amends the presentation and disclosure requirements and changes how companies assess effectiveness. This update is effective for us beginning in the first quarter of fiscal year 2020. Early adoption is permitted. We are currently evaluating the timing of adoption and impact of this new standard on our Consolidated Financial Statements and related disclosures.
In February 2018, the FASB issued ASU 2018-02, Income Statement-Reporting Comprehensive Income (Topic 220): Reclassification of Certain Tax Effects from Accumulated Other Comprehensive Income. This update gives the option to reclassify to retained earnings tax effects related to items in accumulated other comprehensive income that the FASB refers to as having been stranded in accumulated other comprehensive income as a result of the U.S. Tax Act. This update is effective for fiscal years beginning after December 15, 2018, and interim periods within those fiscal years. Early adoption is permitted. We are currently evaluating the impact of this new standard on our Consolidated Financial Statements.
In June 2016, the FASB issued ASU 2016-13, Financial Instruments—Credit Losses (Topic 326). The standard changes the methodology for measuring credit losses on financial instruments and the timing of when such losses are recorded. ASU 2016-13 is effective for us beginning in the first quarter of fiscal year 2021. Early adoption is permitted beginning in the first quarter of fiscal year 2020. We are currently evaluating the timing of adoption and impact of this new standard on our Consolidated Financial Statements and related disclosures.
(2) FAIR VALUE MEASUREMENTS
There are various valuation techniques used to estimate fair value, the primary one being the price that would be received from selling an asset or paid to transfer a liability in an orderly transaction between market participants at the measurement date. When determining fair value, we consider the principal or most advantageous market in which we would transact and consider assumptions that market participants would use when pricing the asset or liability. We measure certain financial and nonfinancial assets and liabilities at fair value on a recurring and nonrecurring basis.
Fair Value Hierarchy
The three levels of inputs that may be used to measure fair value are as follows:
• | Level 1. Quoted prices in active markets for identical assets or liabilities. |
• | Level 2. Observable inputs other than quoted prices included within Level 1, such as quoted prices for similar assets or liabilities, quoted prices in markets with insufficient volume or infrequent transactions (less active markets), or model-derived valuations in which all significant inputs are observable or can be derived principally from or corroborated with observable market data for substantially the full term of the assets or liabilities. |
• | Level 3. Unobservable inputs to the valuation methodology that are significant to the measurement of the fair value of assets or liabilities. |
56
Assets and Liabilities Measured at Fair Value on a Recurring Basis
As of March 31, 2018 and 2017, our assets and liabilities that were measured and recorded at fair value on a recurring basis were as follows (in millions):
Fair Value Measurements at Reporting Date Using | |||||||||||||||||
As of March 31, 2018 | Quoted Prices in Active Markets for Identical Financial Instruments | Significant Other Observable Inputs | Significant Unobservable Inputs | ||||||||||||||
(Level 1) | (Level 2) | (Level 3) | Balance Sheet Classification | ||||||||||||||
Assets | |||||||||||||||||
Bank and time deposits | $ | 286 | $ | 286 | $ | — | $ | — | Cash equivalents | ||||||||
Money market funds | 1,876 | 1,876 | — | — | Cash equivalents | ||||||||||||
Available-for-sale securities: | |||||||||||||||||
Corporate bonds | 624 | — | 624 | — | Short-term investments | ||||||||||||
U.S. Treasury securities | 210 | 210 | — | — | Short-term investments | ||||||||||||
U.S. agency securities | 78 | — | 78 | — | Short-term investments | ||||||||||||
Commercial paper | 150 | — | 150 | — | Short-term investments and cash equivalents | ||||||||||||
Foreign government securities | 52 | — | 52 | — | Short-term investments | ||||||||||||
Certificates of Deposit | 2 | — | 2 | — | Cash equivalents | ||||||||||||
Foreign currency derivatives | 4 | — | 4 | — | Other current assets and other assets | ||||||||||||
Deferred compensation plan assets (a) | 10 | 10 | — | — | Other assets | ||||||||||||
Total assets at fair value | $ | 3,292 | $ | 2,382 | $ | 910 | $ | — | |||||||||
Liabilities | |||||||||||||||||
Contingent consideration (b) | $ | 122 | $ | — | $ | — | $ | 122 | Other Liabilities | ||||||||
Foreign currency derivatives | 56 | — | 56 | — | Accrued and other current liabilities and other liabilities | ||||||||||||
Deferred compensation plan liabilities (a) | 11 | 11 | — | — | Other liabilities | ||||||||||||
Total liabilities at fair value | $ | 189 | $ | 11 | $ | 56 | $ | 122 | |||||||||
Fair Value Measurements Using Significant Unobservable Inputs (Level 3) | |||||||||||
Contingent Consideration | |||||||||||
Balance as of March 31, 2017 | $ | — | |||||||||
Additions | 122 | ||||||||||
Change in fair value | — | ||||||||||
Balance as of March 31, 2018 | $ | 122 | |||||||||
57
Fair Value Measurements at Reporting Date Using | |||||||||||||||||
As of March 31, 2017 | Quoted Prices in Active Markets for Identical Financial Instruments | Significant Other Observable Inputs | Significant Unobservable Inputs | ||||||||||||||
(Level 1) | (Level 2) | (Level 3) | Balance Sheet Classification | ||||||||||||||
Assets | |||||||||||||||||
Bank and time deposits | $ | 233 | $ | 233 | $ | — | $ | — | Cash equivalents | ||||||||
Money market funds | 405 | 405 | — | — | Cash equivalents | ||||||||||||
Available-for-sale securities: | |||||||||||||||||
Corporate bonds | 963 | — | 963 | — | Short-term investments and cash equivalents | ||||||||||||
U.S. Treasury securities | 460 | 460 | — | — | Short-term investments and cash equivalents | ||||||||||||
U.S. agency securities | 172 | — | 172 | — | Short-term investments and cash equivalents | ||||||||||||
Commercial paper | 270 | — | 270 | — | Short-term investments and cash equivalents | ||||||||||||
Foreign government securities | 113 | — | 113 | — | Short-term investments | ||||||||||||
Asset-backed securities | 135 | — | 135 | — | Short-term investments | ||||||||||||
Foreign currency derivatives | 19 | — | 19 | — | Other current assets and other assets | ||||||||||||
Deferred compensation plan assets (a) | 8 | 8 | — | — | Other assets | ||||||||||||
Total assets at fair value | $ | 2,778 | $ | 1,106 | $ | 1,672 | $ | — | |||||||||
Liabilities | |||||||||||||||||
Foreign currency derivatives | 8 | — | 8 | — | Accrued and other current liabilities and other liabilities | ||||||||||||
Deferred compensation plan liabilities (a) | 9 | 9 | — | — | Other liabilities | ||||||||||||
Total liabilities at fair value | $ | 17 | $ | 9 | $ | 8 | $ | — | |||||||||
(a) | The Deferred Compensation Plan assets consist of various mutual funds. See Note 14 for additional information regarding our Deferred Compensation Plan. |
(b) | The contingent consideration represents the estimated fair value of the additional variable cash consideration payable in connection with our acquisition of Respawn Entertainment, LLC (“Respawn”) that is contingent upon the achievement of certain performance milestones. We estimated fair value using a probability-weighted income approach combined with a real options methodology and applied a discount rate that appropriately captures the risk associated with the obligation. The discount rates used ranged from 3.25 percent to 3.56 percent. See Note 6 for additional information regarding the Respawn acquisition. |
(3) FINANCIAL INSTRUMENTS
Cash and Cash Equivalents
As of March 31, 2018 and 2017, our cash and cash equivalents were $4,258 million and $2,565 million, respectively. Cash equivalents were valued using quoted market prices or other readily available market information.
58
Short-Term Investments
Short-term investments consisted of the following as of March 31, 2018 and 2017 (in millions):
As of March 31, 2018 | As of March 31, 2017 | ||||||||||||||||||||||||||||||
Cost or Amortized Cost | Gross Unrealized | Fair Value | Cost or Amortized Cost | Gross Unrealized | Fair Value | ||||||||||||||||||||||||||
Gains | Losses | Gains | Losses | ||||||||||||||||||||||||||||
Corporate bonds | $ | 629 | $ | — | $ | (5 | ) | $ | 624 | $ | 944 | $ | — | $ | (1 | ) | $ | 943 | |||||||||||||
U.S. Treasury securities | 212 | — | (2 | ) | 210 | 414 | — | (1 | ) | 413 | |||||||||||||||||||||
U.S. agency securities | 79 | — | (1 | ) | 78 | 152 | — | (1 | ) | 151 | |||||||||||||||||||||
Commercial paper | 109 | — | — | 109 | 212 | — | — | 212 | |||||||||||||||||||||||
Foreign government securities | 53 | — | (1 | ) | 52 | 113 | — | — | 113 | ||||||||||||||||||||||
Asset-backed securities | — | — | — | — | 135 | — | — | 135 | |||||||||||||||||||||||
Short-term investments | $ | 1,082 | $ | — | $ | (9 | ) | $ | 1,073 | $ | 1,970 | $ | — | $ | (3 | ) | $ | 1,967 | |||||||||||||
The following table summarizes the amortized cost and fair value of our short-term investments, classified by stated maturity as of March 31, 2018 and 2017 (in millions):
As of March 31, 2018 | As of March 31, 2017 | ||||||||||||||
Amortized Cost | Fair Value | Amortized Cost | Fair Value | ||||||||||||
Short-term investments | |||||||||||||||
Due within 1 year | $ | 521 | $ | 520 | $ | 1,237 | $ | 1,236 | |||||||
Due 1 year through 5 years | 561 | 553 | 721 | 719 | |||||||||||
Due after 5 years | — | — | 12 | 12 | |||||||||||
Short-term investments | $ | 1,082 | $ | 1,073 | $ | 1,970 | $ | 1,967 | |||||||
(4) DERIVATIVE FINANCIAL INSTRUMENTS
The assets or liabilities associated with our derivative instruments and hedging activities are recorded at fair value in other current assets/other assets, or accrued and other current liabilities/other liabilities, respectively, on our Consolidated Balance Sheets. As discussed below, the accounting for gains and losses resulting from changes in fair value depends on the use of the derivative instrument and whether it is designated and qualifies for hedge accounting.
We transact business in various foreign currencies and have significant international sales and expenses denominated in foreign currencies, subjecting us to foreign currency risk. We purchase foreign currency forward contracts, generally with maturities of 18 months or less, to reduce the volatility of cash flows primarily related to forecasted revenue and expenses denominated in certain foreign currencies. Our cash flow risks are primarily related to fluctuations in the Euro, British pound sterling, Canadian dollar, Swedish krona, Australian dollar, Chinese yuan and South Korean won. In addition, we utilize foreign currency forward contracts to mitigate foreign currency exchange risk associated with foreign-currency-denominated monetary assets and liabilities, primarily intercompany receivables and payables. The foreign currency forward contracts not designated as hedging instruments generally have a contractual term of approximately three months or less and are transacted near month-end. We do not use foreign currency forward contracts for speculative trading purposes.
59
Cash Flow Hedging Activities
Certain of our forward contracts are designated and qualify as cash flow hedges. The effectiveness of the cash flow hedge contracts, including time value, is assessed monthly using regression analysis, as well as other timing and probability criteria. To qualify for hedge accounting treatment, all hedging relationships are formally documented at the inception of the hedges and must be highly effective in offsetting changes to future cash flows on hedged transactions. The derivative assets or liabilities associated with our hedging activities are recorded at fair value in other current assets/other assets, or accrued and other current liabilities/other liabilities, respectively, on our Consolidated Balance Sheets. The effective portion of gains or losses resulting from changes in the fair value of these hedges is initially reported, net of tax, as a component of accumulated other comprehensive income (loss) in stockholders’ equity. The gross amount of the effective portion of gains or losses resulting from changes in the fair value of these hedges is subsequently reclassified into net revenue or research and development expenses, as appropriate, in the period when the forecasted transaction is recognized in our Consolidated Statements of Operations. In the event that the gains or losses in accumulated other comprehensive income (loss) are deemed to be ineffective, the ineffective portion of gains or losses resulting from changes in fair value, if any, is reclassified to interest and other income (expense), net, in our Consolidated Statements of Operations. In the event that the underlying forecasted transactions do not occur, or it becomes remote that they will occur, within the defined hedge period, the gains or losses on the related cash flow hedges are reclassified from accumulated other comprehensive income (loss) to interest and other income (expense), net, in our Consolidated Statements of Operations.
Total gross notional amounts and fair values for currency derivatives with cash flow hedge accounting designation are as follows (in millions):
As of March 31, 2018 | As of March 31, 2017 | ||||||||||||||||||||||
Notional Amount | Fair Value | Notional Amount | Fair Value | ||||||||||||||||||||
Asset | Liability | Asset | Liability | ||||||||||||||||||||
Forward contracts to purchase | $ | 329 | $ | 2 | $ | 4 | $ | 185 | $ | — | $ | 5 | |||||||||||
Forward contracts to sell | $ | 1,575 | $ | 1 | $ | 48 | $ | 840 | $ | 19 | $ | 3 | |||||||||||
The net impact of the effective portion of gains and losses from our cash flow hedging activities in our Consolidated Statements of Operations was a loss of $5 million for the fiscal year ended March 31, 2018 and a gain of $36 million and $12 million for the fiscal years ended March 31, 2017 and 2016, respectively.
During fiscal years ended March 31, 2018, 2017 and 2016, we reclassified an immaterial amount of the ineffective portion of gains or losses resulting from changes in fair value into interest and other income (expense), net.
The amount excluded from the assessment of hedge effectiveness was a gain of $10 million during fiscal year ended March 31, 2018. The amount excluded from the assessment of hedge effectiveness during fiscal years ended fiscal years ended March 31, 2017 and 2016 and recognized in interest and other income (expense), net, was immaterial.
Balance Sheet Hedging Activities
Our foreign currency forward contracts that are not designated as hedging instruments are accounted for as derivatives whereby the fair value of the contracts are reported as other current assets or accrued and other current liabilities on our Consolidated Balance Sheets, and gains and losses resulting from changes in the fair value are reported in interest and other income (expense), net, in our Consolidated Statements of Operations. The gains and losses on these foreign currency forward contracts generally offset the gains and losses in the underlying foreign-currency-denominated monetary assets and liabilities, which are also reported in interest and other income (expense), net, in our Consolidated Statements of Operations.
Total gross notional amounts and fair values for currency derivatives that are not designated as hedging instruments are accounted for as follows (in millions):
As of March 31, 2018 | As of March 31, 2017 | ||||||||||||||||||||||
Notional Amount | Fair Value | Notional Amount | Fair Value | ||||||||||||||||||||
Asset | Liability | Asset | Liability | ||||||||||||||||||||
Forward contracts to purchase | $ | 210 | $ | 1 | $ | 1 | $ | 87 | $ | — | $ | — | |||||||||||
Forward contracts to sell | $ | 257 | $ | — | $ | 3 | $ | 166 | $ | — | $ | — | |||||||||||
60
The effect of foreign currency forward contracts not designated as hedging instruments in our Consolidated Statements of Operations for the fiscal years ended March 31, 2018, 2017 and 2016, was as follows (in millions):
Statement of Operations Classification | Amount of Gain (Loss) Recognized in the Statement of Operations | ||||||||||||
Year Ended March 31, | |||||||||||||
2018 | 2017 | 2016 | |||||||||||
Foreign currency forward contracts not designated as hedging instruments | Interest and other income (expense), net | $ | (26 | ) | $ | 43 | $ | 16 | |||||
(5) ACCUMULATED OTHER COMPREHENSIVE INCOME (LOSS)
The changes in accumulated other comprehensive income (loss) by component, net of tax, for the fiscal years ended March 31, 2018, 2017 and 2016 are as follows (in millions):
Unrealized Net Gains (Losses) on Available-for-Sale Securities | Unrealized Net Gains (Losses) on Derivative Instruments | Foreign Currency Translation Adjustments | Total | ||||||||||||
Balances as of March 31, 2015 | $ | (3 | ) | $ | 21 | $ | (16 | ) | $ | 2 | |||||
Other comprehensive income (loss) before reclassifications | 4 | 5 | (15 | ) | (6 | ) | |||||||||
Amounts reclassified from accumulated other comprehensive income (loss) | — | (12 | ) | — | (12 | ) | |||||||||
Total other comprehensive income (loss), net of tax | 4 | (7 | ) | (15 | ) | (18 | ) | ||||||||
Balances as of March 31, 2016 | $ | 1 | $ | 14 | $ | (31 | ) | $ | (16 | ) | |||||
Other comprehensive income (loss) before reclassifications | (3 | ) | 54 | (17 | ) | 34 | |||||||||
Amounts reclassified from accumulated other comprehensive income (loss) | (1 | ) | (36 | ) | — | (37 | ) | ||||||||
Total other comprehensive income (loss), net of tax | (4 | ) | 18 | (17 | ) | (3 | ) | ||||||||
Balances as of March 31, 2017 | $ | (3 | ) | $ | 32 | $ | (48 | ) | $ | (19 | ) | ||||
Other comprehensive income (loss) before reclassifications | (9 | ) | (126 | ) | 28 | (107 | ) | ||||||||
Amounts reclassified from accumulated other comprehensive income (loss) | 4 | 5 | (10 | ) | (1 | ) | |||||||||
Total other comprehensive income (loss), net of tax | (5 | ) | (121 | ) | 18 | (108 | ) | ||||||||
Balances as of March 31, 2018 | $ | (8 | ) | $ | (89 | ) | $ | (30 | ) | $ | (127 | ) | |||
61
The effects on net income of amounts reclassified from accumulated other comprehensive income (loss) for the fiscal years ended March 31, 2018, 2017 and 2016 were as follows (in millions):
Statement of Operations Classification | Amount Reclassified From Accumulated Other Comprehensive Income (Loss) | |||||||||||
Year Ended March 31, | ||||||||||||
2018 | 2017 | 2016 | ||||||||||
(Gains) losses on available-for-sale securities | ||||||||||||
Interest and other income (expense), net | $ | 4 | $ | (1 | ) | $ | — | |||||
Total, net of tax | 4 | (1 | ) | — | ||||||||
(Gains) losses on cash flow hedges from forward contracts | ||||||||||||
Net revenue | 10 | (37 | ) | (23 | ) | |||||||
Research and development | (5 | ) | 1 | 11 | ||||||||
Total, net of tax | 5 | (36 | ) | (12 | ) | |||||||
(Gains) losses on foreign currency translation | ||||||||||||
Interest and other income (expense), net | (10 | ) | — | — | ||||||||
Total, net of tax | (10 | ) | — | — | ||||||||
Total net (gain) loss reclassified, net of tax | $ | (1 | ) | $ | (37 | ) | $ | (12 | ) | |||
(6) BUSINESS COMBINATIONS
Respawn Entertainment, LLC
On December 1, 2017, we completed our acquisition of Respawn Entertainment, LLC (“Respawn”), a leading game development studio and creators of games including the critically-acclaimed Titanfall franchise. The total purchase price was $273 million, which consisted of $151 million in cash and the acquisition date fair value of contingent consideration of $122 million. The purchase price was allocated to Respawn’s net tangible and intangible assets based upon their estimated fair values as of December 1, 2017, resulting in $171 million being allocated to goodwill that consists largely of workforce and synergies with our existing business, all of which is expected to be deductible for tax purposes; $74 million being allocated to intangible assets acquired; and $28 million being allocated to net tangible assets acquired. During the fourth quarter of fiscal 2018, we finalized the fair values assigned to the Respawn assets acquired and liabilities assumed. The difference between the preliminary estimates recognized during the third quarter of fiscal 2018 and the final amounts were not material.
The payment of the contingent consideration is based on the achievement of certain performance milestones through the end of calendar year 2022 at the latest. The maximum amount of contingent consideration we may be required to pay is $140 million. The fair value of the contingent consideration is included in other liabilities on our Consolidated Balance Sheet. As of March 31, 2018, there were no significant changes in the range of expected outcomes for the contingent consideration from the acquisition date.
Subsequent to the acquisition, we also granted an aggregate of $167 million of restricted stock unit awards of our common stock to Respawn employees that will be recognized over a four year period as stock-based compensation expense in research and development in our Consolidated Statements of Operations. The fair value of these equity awards was based on the quoted market price of our common stock on the date of grant.
The results of operations of Respawn and the fair value of the assets acquired and liabilities assumed have been included in our Consolidated Financial Statements since the date of acquisition. Pro forma results of operations have not been presented because the effect of the acquisition was not material to our Consolidated Statements of Operations.
During the fiscal years ended March 31, 2017 and 2016, there were no acquisitions.
Subsequent to the fiscal year ended March 31, 2018, we acquired cloud gaming technology assets and personnel from a wholly-owned subsidiary of Gamefly, Inc. based in Israel for total cash consideration of approximately $50 million and up to $4 million in long-term equity in the form of restricted stock units to certain employees.
62
(7) GOODWILL AND ACQUISITION-RELATED INTANGIBLES, NET
The changes in the carrying amount of goodwill for the fiscal year ended March 31, 2018 are as follows (in millions):
As of March 31, 2017 | Activity | Effects of Foreign Currency Translation | As of March 31, 2018 | ||||||||||||
Goodwill | $ | 2,075 | $ | 171 | $ | 5 | $ | 2,251 | |||||||
Accumulated impairment | (368 | ) | — | — | (368 | ) | |||||||||
Total | $ | 1,707 | $ | 171 | $ | 5 | $ | 1,883 | |||||||
The changes in the carrying amount of goodwill for the fiscal year ended March 31, 2017 are as follows (in millions):
As of March 31, 2016 | Activity | Effects of Foreign Currency Translation | As of March 31, 2017 | ||||||||||||
Goodwill | $ | 2,078 | $ | — | $ | (3 | ) | $ | 2,075 | ||||||
Accumulated impairment | (368 | ) | — | — | (368 | ) | |||||||||
Total | $ | 1,710 | $ | — | $ | (3 | ) | $ | 1,707 | ||||||
Goodwill represents the excess of the purchase price over the fair value of the underlying acquired net tangible and intangible assets.
Acquisition-related intangibles, consisted of the following (in millions):
As of March 31, 2018 | As of March 31, 2017 | ||||||||||||||||||||||
Gross Carrying Amount | Accumulated Amortization | Acquisition- Related Intangibles, Net | Gross Carrying Amount | Accumulated Amortization | Acquisition- Related Intangibles, Net | ||||||||||||||||||
Developed and core technology | $ | 417 | $ | (414 | ) | $ | 3 | $ | 412 | $ | (412 | ) | $ | — | |||||||||
Trade names and trademarks | 161 | (107 | ) | 54 | 106 | (98 | ) | 8 | |||||||||||||||
Registered user base and other intangibles | 5 | (5 | ) | — | 5 | (5 | ) | — | |||||||||||||||
Carrier contracts and related | 85 | (85 | ) | — | 85 | (85 | ) | — | |||||||||||||||
In-process research and development | 14 | — | 14 | — | — | — | |||||||||||||||||
Total | $ | 682 | $ | (611 | ) | $ | 71 | $ | 608 | $ | (600 | ) | $ | 8 | |||||||||
The fair value of acquisition-related intangible assets acquired in the Respawn acquisition was $74 million, of which $55 million was allocated to trade names and trademarks, $14 million was allocated to in-process research and development, and $5 million was allocated to developed and core technology. In-process research and development assets are considered indefinite-lived until complete. Excluding the in-process research and development assets, the weighted-average useful life of the Respawn acquired intangible assets was approximately 4.7 years.
Amortization of intangibles for the fiscal years ended March 31, 2018, 2017 and 2016 are classified in the Consolidated Statement of Operations as follows (in millions):
Year Ended March 31, | |||||||||||
2018 | 2017 | 2016 | |||||||||
Cost of service and other | $ | — | $ | 16 | $ | 33 | |||||
Cost of product | 2 | 27 | 14 | ||||||||
Operating expenses | 9 | 6 | 7 | ||||||||
Total | $ | 11 | $ | 49 | $ | 54 | |||||
There were no impairment charges for acquisition-related intangible assets during fiscal years 2018 and 2016. During fiscal year 2017, we determined that the carrying value of one of our acquisition-related intangible assets was not recoverable. The acquisition-related intangible asset was measured using Level 3 inputs and was written down to a fair value of zero. We recognized an impairment charge of $15 million in cost of product revenue in our Consolidated Statements of Operations.
63
Finite-lived acquisition-related intangible assets are amortized using the straight-line method over the lesser of their estimated useful lives or the agreement terms, currently from 1 to 9 years. As of March 31, 2018 and 2017, the weighted-average remaining useful life for acquisition-related intangible assets was approximately 4.3 years and 1.4 years, respectively.
As of March 31, 2018, future amortization of finite-lived acquisition-related intangibles that will be recorded in the Consolidated Statement of Operations is estimated as follows (in millions):
Fiscal Year Ending March 31, | |||
2019 | $ | 16 | |
2020 | 11 | ||
2021 | 11 | ||
2022 | 11 | ||
2023 | 8 | ||
Thereafter | — | ||
Total | $ | 57 | |
(8) ROYALTIES AND LICENSES
Our royalty expenses consist of payments to (1) content licensors, (2) independent software developers, and (3) co-publishing and distribution affiliates. License royalties consist of payments made to celebrities, professional sports organizations, movie studios and other organizations for our use of their trademarks, copyrights, personal publicity rights, content and/or other intellectual property. Royalty payments to independent software developers are payments for the development of intellectual property related to our games. Co-publishing and distribution royalties are payments made to third parties for the delivery of products.
During fiscal years 2018 and 2016, we did not recognize any material losses or impairment charges on royalty-based assets or royalty-based commitments. During fiscal year 2017, we determined that the carrying value of certain of our royalty-based assets and certain previously unrecognized minimum royalty-based commitments were not recoverable. We recognized impairment charges of $23 million on the assets and a loss of $19 million on the commitments. Of the total $42 million loss, $10 million was included in cost of service revenue and $32 million was included in research and development expenses in our Consolidated Statements of Operations.
The current and long-term portions of prepaid royalties and minimum guaranteed royalty-related assets, included in other current assets and other assets, consisted of (in millions):
As of March 31, | |||||||
2018 | 2017 | ||||||
Other current assets | $ | 68 | $ | 79 | |||
Other assets | 34 | 39 | |||||
Royalty-related assets | $ | 102 | $ | 118 | |||
At any given time, depending on the timing of our payments to our co-publishing and/or distribution affiliates, content licensors, and/or independent software developers, we classify any recognized unpaid royalty amounts due to these parties as accrued liabilities. The current and long-term portions of accrued royalties, included in accrued and other current liabilities and other liabilities, consisted of (in millions):
As of March 31, | |||||||
2018 | 2017 | ||||||
Accrued royalties | $ | 171 | $ | 165 | |||
Other liabilities | 74 | 97 | |||||
Royalty-related liabilities | $ | 245 | $ | 262 | |||
As of March 31, 2018, we were committed to pay approximately $899 million to content licensors, independent software developers, and co-publishing and/or distribution affiliates, but performance remained with the counterparty (i.e., delivery of the product or content or other factors) and such commitments were therefore not recorded in our Consolidated Financial Statements. See Note 12 for further information on our developer and licensor commitments.
64
(9) BALANCE SHEET DETAILS
Property and Equipment, Net
Property and equipment, net, as of March 31, 2018 and 2017 consisted of (in millions):
As of March 31, | |||||||
2018 | 2017 | ||||||
Computer, equipment and software | $ | 744 | $ | 723 | |||
Buildings | 336 | 316 | |||||
Leasehold improvements | 139 | 126 | |||||
Equipment, furniture and fixtures, and other | 84 | 82 | |||||
Land | 66 | 61 | |||||
Construction in progress | 7 | 7 | |||||
1,376 | 1,315 | ||||||
Less: accumulated depreciation | (923 | ) | (881 | ) | |||
Property and equipment, net | $ | 453 | $ | 434 | |||
Depreciation expense associated with property and equipment was $120 million, $115 million and $119 million for the fiscal years ended March 31, 2018, 2017 and 2016, respectively.
Accrued and Other Current Liabilities
Accrued and other current liabilities as of March 31, 2018 and 2017 consisted of (in millions):
As of March 31, | |||||||
2018 | 2017 | ||||||
Accrued compensation and benefits | $ | 282 | $ | 267 | |||
Other accrued expenses | 260 | 210 | |||||
Accrued royalties | 171 | 165 | |||||
Deferred net revenue (other) | 108 | 147 | |||||
Accrued and other current liabilities | $ | 821 | $ | 789 | |||
Deferred net revenue (other) includes the deferral of subscription revenue, advertising revenue, licensing arrangements, and other revenue for which revenue recognition criteria has not been met.
Deferred Net Revenue (Online-Enabled Games)
Deferred net revenue (online-enabled games) was $1,622 million and $1,539 million as of March 31, 2018 and 2017, respectively. Deferred net revenue (online-enabled games) generally includes the unrecognized revenue from bundled sales of online-enabled games for which we do not have VSOE for the obligation to provide unspecified updates. We recognize revenue from the sale of online-enabled games for which we do not have vendor-specific objective evidence of fair value (“VSOE”) for the unspecified updates on a straight-line basis, generally over an estimated nine-month period beginning in the month after shipment for physical games sold through retail and an estimated six-month period for digitally-distributed games. However, we expense the cost of revenue related to these transactions generally during the period in which the product is delivered (rather than on a deferred basis).
65
(10) INCOME TAXES
The components of our income before provision for (benefit from) income taxes for the fiscal years ended March 31, 2018, 2017 and 2016 are as follows (in millions):
Year Ended March 31, | |||||||||||
2018 | 2017 | 2016 | |||||||||
Domestic | $ | 440 | $ | 382 | $ | 133 | |||||
Foreign | 1,009 | 828 | 744 | ||||||||
Income before provision for (benefit from) income taxes | $ | 1,449 | $ | 1,210 | $ | 877 | |||||
Provision for (benefit from) income taxes for the fiscal years ended March 31, 2018, 2017 and 2016 consisted of (in millions):
Current | Deferred | Total | |||||||||
Year Ended March 31, 2018 | |||||||||||
Federal | $ | 138 | $ | 197 | $ | 335 | |||||
State | 4 | 9 | 13 | ||||||||
Foreign | 61 | (3 | ) | 58 | |||||||
$ | 203 | $ | 203 | $ | 406 | ||||||
Year Ended March 31, 2017 | |||||||||||
Federal | $ | 86 | $ | 96 | $ | 182 | |||||
State | 3 | 9 | 12 | ||||||||
Foreign | 51 | (2 | ) | 49 | |||||||
$ | 140 | $ | 103 | $ | 243 | ||||||
Year Ended March 31, 2016 | |||||||||||
Federal | $ | 69 | $ | (376 | ) | $ | (307 | ) | |||
State | 5 | (14 | ) | (9 | ) | ||||||
Foreign | 36 | 1 | 37 | ||||||||
$ | 110 | $ | (389 | ) | $ | (279 | ) | ||||
Our effective tax rate and resulting provision for income taxes for the year ended March 31, 2018 was significantly impacted by the U.S. Tax Cuts and Jobs Act (the “U.S. Tax Act”), enacted on December 22, 2017. The U.S. Tax Act significantly revised the U.S. corporate income tax system by, among other things, lowering U.S. corporate income tax rate to 21 percent, generally implementing a territorial tax system and imposing a one-time transition tax on the deemed repatriation of undistributed earnings of foreign subsidiaries (the “Transition Tax”).
Reasonable estimates of the impacts of the U.S. Tax Act are provided in accordance with SEC guidance that allows for a measurement period of up to one year after the enactment date of the U.S. Tax Act to finalize the recording of the related tax impacts. We expect to complete the accounting under the U.S. Tax Act as soon as practicable, but in no event later than one year from the enactment date of the U.S. Tax Act.
We recorded a provisional tax expense of $235 million related to the U.S. Tax Act for the year ended March 31, 2018, $192 million of which relates to the Transition Tax. During the three months ended March 31, 2018, we adjusted the provisional amount initially recorded for the Transition Tax by recognizing an additional $41 million charge. We also recorded immaterial adjustments to certain other tax items. These adjustments were based on our further analysis of the U.S. Tax Act and certain changes to current year earnings estimates and assertions. These amounts remain provisional. The final calculation of taxes attributable to the U.S. Tax Act may differ from our estimates, potentially materially, due to, among other things, changes in interpretations of the U.S. Tax Act, our further analysis of the U.S. Tax Act, or any updates or changes to estimates that we have utilized to calculate the transition impacts.
The U.S. Tax Act creates new U.S. taxes on foreign earnings. Our provision for income taxes for the year ended March 31, 2018 provisionally does not reflect any deferred tax impacts of the U.S. taxes on foreign earnings. Because of the complexity of the rules regarding the new tax on foreign earnings, we are continuing to evaluate this accounting policy election.
66
Upon adoption of ASU 2016-09 at the beginning of fiscal year 2018, we reflected excess tax benefits of $43 million for the year ended March 31, 2018 in the Consolidated Statement of Income as a component of the provision for income taxes. For fiscal years 2017 and 2016, excess tax benefits of $65 million and $83 million, respectively, were recognized in additional paid-in-capital in the Condensed Consolidated Balance Sheets.
The differences between the statutory tax expense rate and our effective tax expense (benefit) rate, expressed as a percentage of income before provision for (benefit from) income taxes, for the fiscal years ended March 31, 2018, 2017 and 2016 were as follows:
Year Ended March 31, | ||||||||
2018 | 2017 | 2016 | ||||||
Statutory federal tax expense rate | 31.5 | % | 35.0 | % | 35.0 | % | ||
State taxes, net of federal benefit | 0.8 | % | 1.0 | % | 0.5 | % | ||
Differences between statutory rate and foreign effective tax rate | (19.1 | )% | (19.3 | )% | (22.1 | )% | ||
Valuation allowance | — | % | — | % | (51.7 | )% | ||
Tax reform | 16.2 | % | — | % | — | % | ||
Excess tax benefit | (3.0 | )% | — | % | — | % | ||
Research and development credits | (1.4 | )% | (0.7 | )% | (0.6 | )% | ||
Unremitted earnings of foreign subsidiaries | — | % | 2.2 | % | 4.9 | % | ||
Non-deductible stock-based compensation | 2.7 | % | 2.3 | % | 3.1 | % | ||
Other | 0.3 | % | (0.4 | )% | (0.9 | )% | ||
Effective tax expense (benefit) rate | 28.0 | % | 20.1 | % | (31.8 | )% | ||
We generated income in lower tax jurisdictions primarily related to our European and Asia Pacific businesses that are headquartered in Switzerland.
In the fourth quarter of fiscal year 2016, we realized significant U.S. pre-tax income for both the fourth quarter and the fiscal year ended March 31, 2016. As a result, we released the valuation allowance against all of the U.S. federal deferred tax assets and a portion of the U.S. state deferred tax assets during the fourth quarter of fiscal year 2016.
Prior to the U.S. Tax Act, a substantial majority of undistributed earnings of our foreign subsidiaries were considered to be indefinitely reinvested. The U.S. Tax Act included a mandatory one-time tax on accumulated earnings of foreign subsidiaries, and as a result, substantially all previously unremitted earnings for which no U.S. deferred tax liability had been accrued have now been subject to U.S. tax.
The components of net deferred tax assets, as of March 31, 2018 and 2017 consisted of (in millions):
As of March 31, | |||||||
2018 | 2017 | ||||||
Deferred tax assets: | |||||||
Accruals, reserves and other expenses | $ | 81 | $ | 151 | |||
Tax credit carryforwards | 121 | 276 | |||||
Stock-based compensation | 24 | 37 | |||||
Net operating loss & capital loss carryforwards | 23 | 25 | |||||
Total | 249 | 489 | |||||
Valuation allowance | (138 | ) | (114 | ) | |||
Deferred tax assets, net of valuation allowance | 111 | 375 | |||||
Deferred tax liabilities: | |||||||
Amortization and depreciation | (27 | ) | (19 | ) | |||
Unremitted earnings of foreign subsidiaries | — | (70 | ) | ||||
Prepaids and other liabilities | (2 | ) | (1 | ) | |||
Total | (29 | ) | (90 | ) | |||
Deferred tax assets, net of valuation allowance and deferred tax liabilities | $ | 82 | $ | 285 | |||
67
As of March 31, 2018, we maintained a valuation allowance of $138 million, primarily related to certain U.S. state deferred tax assets and foreign capital loss carryovers, due to uncertainty about the future realization of these assets. In determining the amount of deferred tax assets that are more likely than not to be realized, we evaluated the potential to realize the assets through the utilization of tax loss and credit carrybacks, the reversal of existing taxable temporary differences, future taxable income exclusive of the reversal of existing taxable temporary differences, and certain tax planning strategies.
As of March 31, 2018, we have state net operating loss carry forwards of approximately $639 million of which approximately $10 million is attributable to various acquired companies. These carryforwards, if not fully realized, will begin to expire in 2019. We also have U.S. federal, California and Canada tax credit carryforwards of $8 million, $107 million and $6 million, respectively. The U.S. federal tax credit carryforwards will begin to expire in 2027. The California and Canada tax credit carryforwards can be carried forward indefinitely.
The total unrecognized tax benefits as of March 31, 2018, 2017 and 2016 were $457 million, $389 million and $331 million, respectively. A reconciliation of the beginning and ending balance of unrecognized tax benefits is summarized as follows (in millions):
Balance as of March 31, 2015 | $ | 254 | |
Increases in unrecognized tax benefits related to prior year tax positions | 33 | ||
Decreases in unrecognized tax benefits related to prior year tax positions | (4 | ) | |
Increases in unrecognized tax benefits related to current year tax positions | 63 | ||
Decreases in unrecognized tax benefits related to settlements with taxing authorities | (10 | ) | |
Reductions in unrecognized tax benefits due to lapse of applicable statute of limitations | (4 | ) | |
Changes in unrecognized tax benefits due to foreign currency translation | (1 | ) | |
Balance as of March 31, 2016 | 331 | ||
Increases in unrecognized tax benefits related to prior year tax positions | 3 | ||
Decreases in unrecognized tax benefits related to prior year tax positions | (3 | ) | |
Increases in unrecognized tax benefits related to current year tax positions | 64 | ||
Decreases in unrecognized tax benefits related to settlements with taxing authorities | — | ||
Reductions in unrecognized tax benefits due to lapse of applicable statute of limitations | (3 | ) | |
Changes in unrecognized tax benefits due to foreign currency translation | (3 | ) | |
Balance as of March 31, 2017 | 389 | ||
Increases in unrecognized tax benefits related to prior year tax positions | 10 | ||
Decreases in unrecognized tax benefits related to prior year tax positions | (12 | ) | |
Increases in unrecognized tax benefits related to current year tax positions | 75 | ||
Decreases in unrecognized tax benefits related to settlements with taxing authorities | (7 | ) | |
Reductions in unrecognized tax benefits due to lapse of applicable statute of limitations | (2 | ) | |
Changes in unrecognized tax benefits due to foreign currency translation | 4 | ||
Balance as of March 31, 2018 | $ | 457 | |
As of March 31, 2018, approximately $248 million of the unrecognized tax benefits would affect our effective tax rate.
Interest and penalties related to estimated obligations for tax positions taken in our tax returns are recognized in income tax expense in our Consolidated Statements of Operations. The combined amount of accrued interest and penalties related to tax positions taken on our tax returns and included in non-current other liabilities was approximately $18 million as of March 31, 2018 and $14 million as of March 31, 2017.
We file income tax returns in the United States, including various state and local jurisdictions. Our subsidiaries file tax returns in various foreign jurisdictions, including Canada, France, Germany, Switzerland and the United Kingdom. The IRS is currently examining our returns for fiscal years 2009 through 2011, and we remain subject to income tax examination by the IRS for fiscal years after 2014.
We are also currently under income tax examination in the United Kingdom for fiscal years 2010 through 2015, Spain for fiscal years 2014 through 2015, and India for fiscal years 2009 through 2013. We remain subject to income tax examination for several other jurisdictions including in Germany for fiscal years after 2012, France for fiscal years after 2016, the United Kingdom for fiscal years after 2015, Canada for fiscal year after 2010, and Switzerland for fiscal years after 2008.
68
The timing of the resolution of income tax examinations is highly uncertain, and the amounts ultimately paid, if any, upon resolution of the issues raised by the taxing authorities may differ materially from the amounts accrued for each year. Although potential resolution of uncertain tax positions involves multiple tax periods and jurisdictions, it is reasonably possible that a reduction of up to $60 million of unrecognized tax benefits may occur within the next 12 months, some of which, depending on the nature of the settlement or expiration of statutes of limitations, may affect the Company’s income tax provision and therefore benefit the resulting effective tax rate. The actual amount could vary significantly depending on the ultimate timing and nature of any settlements.
(11) FINANCING ARRANGEMENTS
Senior Notes
In February 2016, we issued $600 million aggregate principal amount of 3.70% Senior Notes due March 1, 2021 (the “2021 Notes”) and $400 million aggregate principal amount of 4.80% Senior Notes due March 1, 2026 (the “2026 Notes,” and together with the 2021 Notes, the “Senior Notes”). Our proceeds were $989 million, net of discount of $2 million and issuance costs of $9 million. Both the discount and issuance costs are being amortized to interest expense over the respective terms of the 2021 Notes and the 2026 Notes using the effective interest rate method. The effective interest rate is 3.94% for the 2021 Notes and 4.97% for the 2026 Notes. Interest is payable semiannually in arrears, on March 1 and September 1 of each year.
The carrying and fair values of the Senior Notes are as follows (in millions):
As of March 31, 2018 | As of March 31, 2017 | |||||
Senior Notes: | ||||||
3.70% Senior Notes due 2021 | $ | 600 | $ | 600 | ||
4.80% Senior Notes due 2026 | 400 | 400 | ||||
Total principal amount | $ | 1,000 | $ | 1,000 | ||
Unaccreted discount | (2 | ) | (2 | ) | ||
Unamortized debt issuance costs | (6 | ) | (8 | ) | ||
Net carrying value of Senior Notes | $ | 992 | $ | 990 | ||
Fair value of Senior Notes (Level 2) | $ | 1,038 | $ | 1,054 | ||
As of March 31, 2018, the remaining life of the 2021 Notes and 2026 Notes is approximately 2.9 years and 7.9 years, respectively.
The Senior Notes are senior unsecured obligations and rank equally with all our other existing and future unsubordinated obligations and any indebtedness that we may incur from time to time under our Credit Facility.
The 2021 Notes and the 2026 Notes are redeemable at our option at any time prior to February 1, 2021 or December 1, 2025, respectively, subject to a make-whole premium. Within one and three months of maturity, we may redeem the 2021 Notes or the 2026 Notes, respectively, at a redemption price equal to 100% of the aggregate principal amount plus accrued and unpaid interest. In addition, upon the occurrence of a change of control repurchase event, the holders of the Senior Notes may require us to repurchase all or a portion of the Senior Notes, at a price equal to 101% of their principal amount, plus accrued and unpaid interest to the date of repurchase. The Senior Notes also include covenants that limit our ability to incur liens on assets and to enter into sale and leaseback transactions, subject to certain allowances.
Credit Facility
In March 2015, we entered into a $500 million senior unsecured revolving credit facility (“Credit Facility”) with a syndicate of banks. The Credit Facility terminates on March 19, 2020. The Credit Facility contains an option to arrange with existing lenders and/or new lenders to provide up to an aggregate of $250 million in additional commitments for revolving loans. Proceeds of loans made under the Credit Facility may be used for general corporate purposes.
The loans bear interest, at our option, at the base rate plus an applicable spread or an adjusted LIBOR rate plus an applicable spread, in each case with such spread being determined based on our consolidated leverage ratio for the preceding fiscal quarter. We are also obligated to pay other customary fees for a credit facility of this size and type. Interest is due and payable in arrears quarterly for loans bearing interest at the base rate and at the end of an interest period (or at each three month interval
69
in the case of loans with interest periods greater than three months) in the case of loans bearing interest at the adjusted LIBOR rate. Principal, together with all accrued and unpaid interest, is due and payable on March 19, 2020.
The credit agreement contains customary affirmative and negative covenants, including covenants that limit or restrict our ability to, among other things, incur subsidiary indebtedness, grant liens, dispose of all or substantially all assets and pay dividends or make distributions, in each case subject to customary exceptions for a credit facility of this size and type. We are also required to maintain compliance with a capitalization ratio and maintain a minimum level of total liquidity.
The credit agreement contains customary events of default, including among others, non-payment defaults, covenant defaults, cross-defaults to material indebtedness, bankruptcy and insolvency defaults, material judgment defaults and a change of control default, in each case, subject to customary exceptions for a credit facility of this size and type. The occurrence of an event of default could result in the acceleration of the obligations under the credit facility, an obligation by any guarantors to repay the obligations in full and an increase in the applicable interest rate.
As of March 31, 2018 and 2017, no amounts were outstanding under the Credit Facility. $2 million of debt issuance costs that were paid in connection with obtaining this credit facility are being amortized to interest expense over the 5-year term of the Credit Facility.
Interest Expense
The following table summarizes our interest expense recognized for fiscal years 2018, 2017, and 2016 that is included in interest and other income (expense), net on our Consolidated Statements of Operations (in millions):
Year Ended March 31, | |||||||||||
2018 | 2017 | 2016 | |||||||||
Amortization of debt discount | — | (2 | ) | (17 | ) | ||||||
Amortization of debt issuance costs | (2 | ) | (2 | ) | (3 | ) | |||||
Coupon interest expense | (42 | ) | (42 | ) | (7 | ) | |||||
Other interest expense | — | (1 | ) | (1 | ) | ||||||
Total interest expense | $ | (44 | ) | $ | (47 | ) | $ | (28 | ) | ||
(12) COMMITMENTS AND CONTINGENCIES
Lease Commitments
As of March 31, 2018, we leased certain facilities, furniture and equipment under non-cancelable operating lease agreements. We were required to pay property taxes, insurance and normal maintenance costs for certain of these facilities and any increases over the base year of these expenses on the remainder of our facilities.
Development, Celebrity, League and Content Licenses: Payments and Commitments
The products we produce in our studios are designed and created by our employee designers, artists, software programmers and by non-employee software developers (“independent artists” or “third-party developers”). We typically advance development funds to the independent artists and third-party developers during development of our games, usually in installment payments made upon the completion of specified development milestones. Contractually, these payments are generally considered advances against subsequent royalties on the sales of the products. These terms are set forth in written agreements entered into with the independent artists and third-party developers.
In addition, we have certain celebrity, league and content license contracts that contain minimum guarantee payments and marketing commitments that may not be dependent on any deliverables. Celebrities and organizations with whom we have contracts include, but are not limited to: FIFA (Fédération Internationale de Football Association), FIFPRO Foundation, FAPL (Football Association Premier League Limited), and DFL Deutsche Fußball Liga E.V. (German Soccer League) (professional soccer); National Basketball Association (professional basketball); National Hockey League and NHL Players’ Association (professional hockey); National Football League Properties and PLAYERS Inc. (professional football); William Morris Endeavor Entertainment LLC (professional mixed martial arts); ESPN (content in EA SPORTS games); Disney Interactive (Star Wars); and Fox Digital Entertainment, Inc. (The Simpsons). These developer and content license commitments represent the sum of (1) the cash payments due under non-royalty-bearing licenses and services agreements and (2) the minimum guaranteed payments and advances against royalties due under royalty-bearing licenses and services agreements, the majority
70
of which are conditional upon performance by the counterparty. These minimum guarantee payments and any related marketing commitments are included in the table below.
The following table summarizes our minimum contractual obligations as of March 31, 2018 (in millions):
Fiscal Year Ending March 31, | |||||||||||||||||||||||||||
Total | 2019 | 2020 | 2021 | 2022 | 2023 | Thereafter | |||||||||||||||||||||
Unrecognized commitments | |||||||||||||||||||||||||||
Developer/licensor commitments | $ | 899 | $ | 174 | $ | 227 | $ | 206 | $ | 211 | $ | 80 | $ | 1 | |||||||||||||
Marketing commitments | 358 | 89 | 87 | 79 | 75 | 28 | — | ||||||||||||||||||||
Operating leases | 240 | 40 | 40 | 40 | 33 | 26 | 61 | ||||||||||||||||||||
Senior Notes interest | 217 | 38 | 41 | 41 | 20 | 19 | 58 | ||||||||||||||||||||
Other purchase obligations | 110 | 32 | 35 | 14 | 9 | 6 | 14 | ||||||||||||||||||||
Total unrecognized commitments | 1,824 | 373 | 430 | 380 | 348 | 159 | 134 | ||||||||||||||||||||
Recognized commitments | |||||||||||||||||||||||||||
Senior Notes principal and interest | 1,003 | 3 | — | 600 | — | — | 400 | ||||||||||||||||||||
Transition Tax | 50 | 5 | 4 | 4 | 4 | 4 | 29 | ||||||||||||||||||||
Licensing and lease obligations | 102 | 24 | 25 | 26 | 27 | — | — | ||||||||||||||||||||
Total recognized commitments | 1,155 | 32 | 29 | 630 | 31 | 4 | 429 | ||||||||||||||||||||
Total Commitments | $ | 2,979 | $ | 405 | $ | 459 | $ | 1,010 | $ | 379 | $ | 163 | $ | 563 | |||||||||||||
The unrecognized amounts represented in the table above reflect our minimum cash obligations for the respective fiscal years, but do not necessarily represent the periods in which they will be recognized and expensed in our Consolidated Financial Statements.
In addition, the amounts in the table above are presented based on the dates the amounts are contractually due as of March 31, 2018; however, certain payment obligations may be accelerated depending on the performance of our operating results. Furthermore, up to $32 million of the unrecognized amounts in the table above may be payable, at the licensor’s election, in shares of our common stock, subject to a $10 million maximum during any fiscal year. The number of shares to be issued will be based on their fair market value at the time of issuance.
In addition to what is included in the table above, as of March 31, 2018, we had a liability for unrecognized tax benefits and an accrual for the payment of related interest totaling $205 million, of which we are unable to make a reasonably reliable estimate of when cash settlement with a taxing authority will occur.
In addition to what is included in the table above, as of March 31, 2018, we may be required to pay up to $140 million of cash consideration in connection with the Respawn acquisition based on the achievement of certain performance milestones through the end of calendar year 2022. As of March 31, 2018, we have recorded $122 million of contingent consideration on our Consolidated Balance Sheet representing the estimated fair value.
Total rent expense for our operating leases was $92 million, $91 million and $89 million for the fiscal years ended March 31, 2018, 2017 and 2016, respectively.
Legal Proceedings
On July 29, 2010, Michael Davis, a former NFL running back, filed a putative class action in the United States District Court for the Northern District of California against the Company, alleging that certain past versions of Madden NFL included the images of certain retired NFL players without their permission. In March 2012, the trial court denied the Company’s request to dismiss the complaint on First Amendment grounds. In January 2015, that trial court decision was affirmed by the Ninth Circuit Court of Appeals and the case was remanded back to the United States District Court for the Northern District of California, where the case is pending.
We are also subject to claims and litigation arising in the ordinary course of business. We do not believe that any liability from any reasonably foreseeable disposition of such claims and litigation, individually or in the aggregate, would have a material adverse effect on our Consolidated Financial Statements.
71
(13) PREFERRED STOCK
As of March 31, 2018 and 2017, we had 10,000,000 shares of preferred stock authorized but unissued. The rights, preferences, and restrictions of the preferred stock may be designated by our Board of Directors without further action by our stockholders.
(14) STOCK-BASED COMPENSATION AND EMPLOYEE BENEFIT PLANS
Valuation Assumptions
We estimate the fair value of stock-based awards on the date of grant. We recognize compensation costs for stock-based awards to employees based on the grant-date fair value using a straight-line approach over the service period for which such awards are expected to vest.
The determination of the fair value of market-based restricted stock units, stock options and ESPP purchase rights is affected by assumptions regarding subjective and complex variables. Generally, our assumptions are based on historical information and judgment is required to determine if historical trends may be indicators of future outcomes. We determine the fair value of our stock-based awards as follows:
• | Restricted Stock Units and Performance-Based Restricted Stock Units. The fair value of restricted stock units and performance-based restricted stock units (other than market-based restricted stock units) is determined based on the quoted market price of our common stock on the date of grant. |
• | Market-Based Restricted Stock Units. Market-based restricted stock units consist of grants of performance-based restricted stock units to certain members of executive management that vest contingent upon the achievement of pre-determined market and service conditions (referred to herein as “market-based restricted stock units”). The fair value of our market-based restricted stock units is determined using a Monte-Carlo simulation model. Key assumptions for the Monte-Carlo simulation model are the risk-free interest rate, expected volatility, expected dividends and correlation coefficient. |
• | Stock Options and Employee Stock Purchase Plan. The fair value of stock options and stock purchase rights granted pursuant to our equity incentive plans and our 2000 Employee Stock Purchase Plan, as amended (“ESPP”), respectively, is determined using the Black-Scholes valuation model based on the multiple-award valuation method. Key assumptions of the Black-Scholes valuation model are the risk-free interest rate, expected volatility, expected term and expected dividends. The risk-free interest rate is based on U.S. Treasury yields in effect at the time of grant for the expected term of the option. Expected volatility is based on a combination of historical stock price volatility and implied volatility of publicly-traded options on our common stock. Expected term is determined based on historical exercise behavior, post-vesting termination patterns, options outstanding and future expected exercise behavior. |
There were an insignificant number of stock options granted during fiscal years 2018 and 2017.
The estimated assumptions used in the Black-Scholes valuation model to value our ESPP purchase rights were as follows:
ESPP Purchase Rights | |||||||||
Year Ended March 31, | |||||||||
2018 | 2017 | 2016 | |||||||
Risk-free interest rate | 1.1 - 2.0% | 0.5 - 0.8% | 0.3 - 0.6% | ||||||
Expected volatility | 28 - 30% | 25 - 32% | 32 - 36% | ||||||
Weighted-average volatility | 29 | % | 27 | % | 33 | % | |||
Expected term | 6 - 12 months | 6 - 12 months | 6 - 12 months | ||||||
Expected dividends | None | None | None | ||||||
72
The assumptions used in the Monte-Carlo simulation model to value our market-based restricted stock units were as follows:
Year Ended March 31, | ||||||||
2018 | 2017 | 2016 | ||||||
Risk-free interest rate | 1.5 - 1.6% | 0.8 | % | 1.0 | % | |||
Expected volatility | 17 - 46% | 16 - 57% | 14 - 53% | |||||
Weighted-average volatility | 28 | % | 29 | % | 26 | % | ||
Expected dividends | None | None | None | |||||
Stock-Based Compensation Expense
Employee stock-based compensation expense recognized during the fiscal years ended March 31, 2017 and 2016 was calculated based on awards ultimately expected to vest and was reduced for estimated forfeitures. We adopted ASU 2016-09 at the beginning of fiscal year 2018 and elected to account for forfeitures as they occur. The adoption resulted in a cumulative-effect adjustment of $8 million, net of tax, decrease to retained earnings.
The following table summarizes stock-based compensation expense resulting from stock options, restricted stock units, market-based restricted stock units, performance-based restricted stock units, and the ESPP purchase rights included in our Consolidated Statements of Operations (in millions):
Year Ended March 31, | ||||||||||||
2018 | 2017 | 2016 | ||||||||||
Cost of revenue | $ | 3 | $ | 3 | $ | 2 | ||||||
Research and development | 146 | 109 | 103 | |||||||||
Marketing and sales | 32 | 31 | 24 | |||||||||
General and administrative | 61 | 53 | 49 | |||||||||
Stock-based compensation expense | $ | 242 | $ | 196 | $ | 178 | ||||||
During the fiscal years ended March 31, 2018, 2017 and 2016, we recognized $29 million, $43 million and $38 million, respectively, of deferred income tax benefit related to our stock-based compensation expense.
As of March 31, 2018, our total unrecognized compensation cost related to restricted stock units, market-based restricted stock units, and performance-based restricted stock units was $504 million and is expected to be recognized over a weighted-average service period of 2.2 years. Of the $504 million of unrecognized compensation cost, $418 million relates to restricted stock units, $49 million relates to market-based restricted stock units, and $37 million relates to performance-based restricted stock units at a 104 percent average vesting target. As of March 31, 2018, there were no unrecognized compensation cost related to stock options as they were fully vested.
Summary of Plans and Plan Activity
Equity Incentive Plans
Our 2000 Equity Incentive Plan, as amended, (the “Equity Plan”) allows us to grant options to purchase our common stock and to grant restricted stock, restricted stock units and stock appreciation rights to our employees, officers, and directors. Pursuant to the Equity Plan, incentive stock options may be granted to employees and officers and non-qualified options may be granted to employees, officers, and directors, at not less than 100 percent of the fair market value on the date of grant.
Approximately 17.7 million options or 12.3 million restricted stock units were available for grant under our Equity Plan as of March 31, 2018.
Stock Options
Options granted under the Equity Plan generally expire ten years from the date of grant and generally vest according to one of the following schedules:
• | 35 month vesting with 1/3 vesting after 11, 23 and 35 months; |
• | Three-year vesting with 1/3 vesting at the end of each year; |
73
• | 50 month vesting with 24% of the shares vesting after 12 months and 2% vesting monthly over the following 38 months. |
The following table summarizes our stock option activity for the fiscal year ended March 31, 2018:
Options (in thousands) | Weighted- Average Exercise Prices | Weighted- Average Remaining Contractual Term (in years) | Aggregate Intrinsic Value (in millions) | ||||||||||
Outstanding as of March 31, 2017 | 2,377 | $ | 33.35 | ||||||||||
Granted | 5 | 113.39 | |||||||||||
Exercised | (764 | ) | 40.30 | ||||||||||
Forfeited, cancelled or expired | (3 | ) | 41.71 | ||||||||||
Outstanding as of March 31, 2018 | 1,615 | $ | 30.28 | 5.44 | $ | 147 | |||||||
Vested and expected to vest | 1,615 | $ | 30.28 | 5.44 | $ | 147 | |||||||
Exercisable as of March 31, 2018 | 1,615 | $ | 30.28 | 5.44 | $ | 147 | |||||||
The aggregate intrinsic value represents the total pre-tax intrinsic value based on our closing stock price as of March 31, 2018, which would have been received by the option holders had all the option holders exercised their options as of that date. The total intrinsic values of stock options exercised during fiscal years 2018, 2017, and 2016 were $43 million, $39 million and $38 million, respectively. We issue new common stock from our authorized shares upon the exercise of stock options.
The following table summarizes outstanding and exercisable stock options as of March 31, 2018:
Options Outstanding | Options Exercisable | |||||||||||||||||||||
Range of Exercise Prices | Number of Shares (in thousands) | Weighted- Average Remaining Contractual Term (in years) | Weighted- Average Exercise Prices | Potential Dilution | Number of Shares (in thousands) | Weighted- Average Exercise Prices | Potential Dilution | |||||||||||||||
$11.53 - $22.42 | 119 | 1.41 | $ | 19.80 | — | % | 119 | $ | 19.80 | 0.1 | % | |||||||||||
26.25 - 26.25 | 750 | 5.59 | 26.25 | 0.3 | % | 750 | 26.25 | 0.2 | % | |||||||||||||
33.60 - 47.06 | 746 | 5.94 | 36.01 | 0.2 | % | 746 | 36.01 | 0.2 | % | |||||||||||||
$11.53 - $47.06 | 1,615 | 5.44 | $ | 30.28 | 0.5 | % | 1,615 | $ | 30.28 | 0.5 | % | |||||||||||
Potential dilution is computed by dividing the options in the related range of exercise prices by 306 million shares of common stock, which were issued and outstanding as of March 31, 2018.
Restricted Stock Units
We grant restricted stock units under our Equity Plan to employees worldwide. Restricted stock units are unfunded, unsecured rights to receive common stock upon the satisfaction of certain vesting criteria. Upon vesting, a number of shares of common stock equivalent the number of restricted stock units is typically issued net of required tax withholding requirements, if any. Restricted stock units are subject to forfeiture and transfer restrictions. Vesting for restricted stock units is based on the holders’ continued employment with us through each applicable vest date. If the vesting conditions are not met, unvested restricted stock units will be forfeited.
Generally, our restricted stock units vest according to one of the following vesting schedules:
• | One-year vesting with 100% cliff vesting at the end of one year; |
• | 35 month vesting with 1/3 vesting after 11, 23 and 35 months; |
• | Three-year vesting with 1/3 vesting at the end of each year; |
• | Four-year vesting with 1/2 and 1/2 vesting after 24 and 48 months or; |
• | Four-year vesting with 1/4 vesting at the end of each year. |
74
Each restricted stock unit granted reduces the number of shares available for grant by 1.43 shares under our Equity Plan. The following table summarizes our restricted stock units activity, excluding market-based restricted stock unit activity which is discussed below, for the fiscal year ended March 31, 2018:
Restricted Stock Units (in thousands) | Weighted- Average Grant Date Fair Values | ||||||
Outstanding as of March 31, 2017 | 5,153 | $ | 65.03 | ||||
Granted | 3,841 | 110.05 | |||||
Vested | (2,581 | ) | 59.49 | ||||
Forfeited or cancelled | (465 | ) | 80.97 | ||||
Outstanding as of March 31, 2018 | 5,948 | $ | 94.57 | ||||
The grant date fair value of restricted stock units is based on the quoted market price of our common stock on the date of grant. The weighted-average grant date fair values of restricted stock units granted during fiscal years 2018, 2017, and 2016 were $110.05, $76.60 and $64.40 respectively. The fair values of restricted stock units that vested during fiscal years 2018, 2017, and 2016 were $289 million, $320 million and $372 million, respectively.
Performance-Based Restricted Stock Units
Our performance-based restricted stock units cliff vest after a four-year performance period contingent upon the achievement of pre-determined performance-based milestones based on our non-GAAP net revenue and free cash flow as well as service conditions. If these performance-based milestones are not met but service conditions are met, the performance-based restricted stock units will not vest, in which case any compensation expense we have recognized to date will be reversed. Each quarter, we update our assessment of the probability that the non-GAAP net revenue and free cash flow performance milestones will be achieved. We amortize the fair values of performance-based restricted stock units over the requisite service period. The performance-based restricted stock units contain threshold, target and maximum milestones for each of non-GAAP net revenue and free cash flow. The number of shares of common stock to be issued at vesting will range from zero percent to 200 percent of the target number of performance-based restricted stock units attributable to each performance-based milestone based on the company’s performance as compared to these threshold, target and maximum performance-based milestones. Each performance-based milestone is weighted evenly where 50 percent of the total performance-based restricted stock units that vest will be determined based on non-GAAP net revenue and the other 50 percent will be determined based on free cash flow. The number of shares that vest based on each performance-based milestone is independent from the other.
The following table summarizes our performance-based restricted stock unit activity, presented with the maximum number of shares that could potentially vest, for the fiscal year ended March 31, 2018:
Performance- Based Restricted Stock Units (in thousands) | Weighted- Average Grant Date Fair Value | |||||
Outstanding as of March 31, 2017 | — | $ | — | |||
Granted | 796 | 110.51 | ||||
Forfeited or cancelled | — | — | ||||
Outstanding as of March 31, 2018 | 796 | $ | 110.51 | |||
Market-Based Restricted Stock Units
Our market-based restricted stock units vest contingent upon the achievement of pre-determined market and service conditions. If these market conditions are not met but service conditions are met, the market-based restricted stock units will not vest; however, any compensation expense we have recognized to date will not be reversed. The number of shares of common stock to be issued at vesting will range from zero percent to 200 percent of the target number of market-based restricted stock units based on our total stockholder return (“TSR”) relative to the performance of companies in the NASDAQ-100 Index for each measurement period, over either a one-year, two-year cumulative and three-year cumulative period, or over a two year and four-year cumulative period.
75
The following table summarizes our market-based restricted stock unit activity, presented with the maximum number of shares that could potentially vest, for the year ended March 31, 2018:
Market-Based Restricted Stock Units (in thousands) | Weighted- Average Grant Date Fair Value | ||||||
Outstanding as of March 31, 2017 | 1,282 | $ | 87.37 | ||||
Granted | 706 | 140.93 | |||||
Vested | (430 | ) | 76.27 | ||||
Forfeited or cancelled | (216 | ) | 91.88 | ||||
Outstanding as of March 31, 2018 | 1,342 | $ | 118.35 | ||||
The weighted-average grant date fair values of market-based restricted stock units granted during fiscal years 2018, 2017, and 2016 were $140.93, $98.04, and $79.81, respectively. The fair values of market-based restricted stock units that vested during fiscal years 2018, 2017, and 2016 were $48 million, $42 million, and $47 million, respectively.
ESPP
Pursuant to our ESPP, eligible employees may authorize payroll deductions of between 2 percent and 10 percent of their compensation to purchase shares of common stock at 85 percent of the lower of the market price of our common stock on the date of commencement of the applicable offering period or on the last day of each six-month purchase period.
The following table summarizes our ESPP activity for fiscal years ended March 31, 2018, 2017 and 2016:
Shares Issued (in millions) | Exercise Prices for Purchase Rights | Weighted-Average Fair Values of Purchase Rights | |||||||
Fiscal Year 2016 | 0.9 | $32.16 - $54.78 | $ | 12.97 | |||||
Fiscal Year 2017 | 0.7 | $54.60 - $67.56 | $ | 17.93 | |||||
Fiscal Year 2018 | 0.6 | $67.56 - $99.82 | $ | 21.57 | |||||
The fair values were estimated on the date of grant using the Black-Scholes valuation model. We issue new common stock out of the ESPP’s pool of authorized shares. As of March 31, 2018, 6.8 million shares were available for grant under our ESPP.
Deferred Compensation Plan
We have a Deferred Compensation Plan (“DCP”) for the benefit of a select group of management or highly compensated employees and directors, which is unfunded and intended to be a plan that is not qualified within the meaning of section 401(a) of the Internal Revenue Code. The DCP permits the deferral of the annual base salary and/or director cash compensation up to a maximum amount. The deferrals are held in a separate trust, which has been established by us to administer the DCP. The trust is a grantor trust and the specific terms of the trust agreement provide that the assets of the trust are available to satisfy the claims of general creditors in the event of our insolvency. The assets held by the trust are classified as trading securities and are held at fair value on our Consolidated Balance Sheets. The assets and liabilities of the DCP are presented in other assets and other liabilities on our Consolidated Balance Sheets, respectively, with changes in the fair value of the assets and in the deferred compensation liability recognized as compensation expense. The estimated fair value of the assets was $10 million and $8 million as of March 31, 2018 and 2017, respectively. As of March 31, 2018 and 2017, $11 million and $9 million were recorded, respectively, to recognize undistributed deferred compensation due to employees.
401(k) Plan, Registered Retirement Savings Plan and ITP Plan
We have a 401(k) plan covering substantially all of our U.S. employees, a Registered Retirement Savings Plan covering substantially all of our Canadian employees, and an ITP pension plan covering substantially all our Swedish employees. These plans permit us to make discretionary contributions to employees’ accounts based on our financial performance. We contributed an aggregate of $31 million, $28 million and $27 million to these plans in fiscal years 2018, 2017, and 2016, respectively.
Stock Repurchase Program
76
In May 2014, a Special Committee of our Board of Directors, on behalf of the full Board of Directors, authorized a two-year program to repurchase up to $750 million of our common stock. We have repurchased approximately 9.2 million shares for approximately $394 million under this program. This program was superseded and replaced by the stock repurchase program approved in May 2015.
In May 2015, our Board of Directors authorized a two-year program to repurchase up to $1 billion of our common stock. We repurchased approximately 0.3 million, 6.5 million and 6.9 million shares for approximately $31 million, $508 million and $461 million under this program, respectively, during the fiscal years ended March 31, 2018, 2017 and 2016. We completed repurchases under the May 2015 program in April 2017.
In February 2016, our Board of Directors authorized a $500 million stock repurchase program. This program was incremental to the two-year $1 billion stock repurchase program announced in May 2015. During the quarter ended March 31, 2016, we completed repurchases of approximately 7.8 million shares for approximately $500 million under the February 2016 program.
In May 2017, a Special Committee of our Board of Directors, on behalf of the full Board of Directors, authorized a program to repurchase up to $1.2 billion of our common stock. During the fiscal year ended March 31, 2018, we repurchased approximately 5.0 million shares for approximately $570 million under this program. This program was superseded and replaced by a new stock repurchase program approved in May 2018.
In May 2018, a Special Committee of our Board of Directors, on behalf of the full Board of Directors, authorized a program to repurchase up to $2.4 billion of our common stock. This stock repurchase program supersedes and replaces the May 2017 program, and expires on May 31, 2020. Under this program, we may purchase stock in the open market or through privately-negotiated transactions in accordance with applicable securities laws, including pursuant to pre-arranged stock trading plans. The timing and actual amount of the stock repurchases will depend on several factors including price, capital availability, regulatory requirements, alternative investment opportunities and other market conditions. We are not obligated to repurchase a specific number of shares under this program and it may be modified, suspended or discontinued at any time. We are actively repurchasing shares under this program.
The following table summarizes total shares repurchased during fiscal years 2018, 2017, and 2016:
May 2014 Program | May 2015 Program | February 2016 Program | May 2017 Program | Total | ||||||||||||||||||||||||||||||
(In millions) | Shares | Amount | Shares | Amount | Shares | Amount | Shares | Amount | Shares | Amount | ||||||||||||||||||||||||
Fiscal Year 2016 | 1.0 | $ | 57 | 6.9 | $ | 461 | 7.8 | $ | 500 | — | $ | — | 15.7 | $ | 1,018 | |||||||||||||||||||
Fiscal Year 2017 | — | $ | — | 6.5 | $ | 508 | — | $ | — | — | $ | — | 6.5 | $ | 508 | |||||||||||||||||||
Fiscal Year 2018 | — | $ | — | 0.3 | $ | 31 | — | $ | — | 5.0 | $ | 570 | 5.3 | $ | 601 | |||||||||||||||||||
(15) INTEREST AND OTHER INCOME (EXPENSE), NET
Interest and other income (expense), net, for the fiscal years ended March 31, 2018, 2017 and 2016 consisted of (in millions):
Year Ended March 31, | |||||||||||
2018 | 2017 | 2016 | |||||||||
Loss on conversion of Convertible Notes | $ | — | $ | — | $ | (10 | ) | ||||
Interest expense | (44 | ) | (47 | ) | (28 | ) | |||||
Interest income | 50 | 25 | 15 | ||||||||
Net gain (loss) on foreign currency transactions | 18 | (40 | ) | (14 | ) | ||||||
Net gain (loss) on foreign currency forward contracts | (16 | ) | 46 | 15 | |||||||
Other income, net | 7 | 2 | 1 | ||||||||
Interest and other income (expense), net | $ | 15 | $ | (14 | ) | $ | (21 | ) | |||
77
(16) EARNINGS PER SHARE
The following table summarizes the computations of basic earnings per share (“Basic EPS”) and diluted earnings per share (“Diluted EPS”). Basic EPS is computed as net income divided by the weighted-average number of common shares outstanding for the period. Diluted EPS reflects the potential dilution that could occur from common shares issuable through stock-based compensation plans including stock options, restricted stock, restricted stock units, ESPP purchase rights, warrants, and other convertible securities using the treasury stock method.
Year Ended March 31, | |||||||||||
(In millions, except per share amounts) | 2018 | 2017 | 2016 | ||||||||
Net income | $ | 1,043 | $ | 967 | $ | 1,156 | |||||
Shares used to compute earnings per share: | |||||||||||
Weighted-average common stock outstanding — basic | 308 | 303 | 310 | ||||||||
Dilutive potential common shares related to stock award plans and from assumed exercise of stock options | 4 | 4 | 6 | ||||||||
Dilutive potential common shares related to the Convertible Notes (a) | — | 1 | 6 | ||||||||
Dilutive potential common shares related to the Warrants (a) | — | 6 | 8 | ||||||||
Weighted-average common stock outstanding — diluted | 312 | 314 | 330 | ||||||||
Earnings per share: | |||||||||||
Basic | $ | 3.39 | $ | 3.19 | $ | 3.73 | |||||
Diluted | $ | 3.34 | $ | 3.08 | $ | 3.50 | |||||
(a) | See Note 10 - Financing Arrangements in our Annual Report on Form 10-K for the fiscal year ended March 31, 2017, for additional information regarding the potential dilutive shares related to our Convertible Notes and Warrants. |
The Convertible Notes matured on July 15, 2016 and the Warrants expired on January 12, 2017.
For the fiscal years ended March 31, 2018, 2017 and 2016, an immaterial amount of restricted stock units and market-based restricted stock units were excluded from the treasury stock method computation of diluted shares as their inclusion would have had an antidilutive effect. Our performance-based restricted stock units, which are considered contingently issuable shares, are also excluded from the treasury stock method computation because the related performance-based milestones were not achieved as of the end of the reporting period.
(17) SEGMENT INFORMATION
Our reporting segment is based upon: our internal organizational structure; the manner in which our operations are managed; the criteria used by our Chief Executive Officer, our Chief Operating Decision Maker (“CODM”), to evaluate segment performance; the availability of separate financial information; and overall materiality considerations. Our CODM currently reviews total company operating results to assess overall performance and allocate resources. As of March 31, 2018, we have only one reportable segment, which represents our only operating segment.
Information about our total net revenue by type and by platform for the fiscal years ended March 31, 2018, 2017 and 2016 is presented below (in millions):
Year Ended March 31, | |||||||||||
2018 | 2017 | 2016 | |||||||||
Digital | $ | 3,450 | $ | 2,874 | $ | 2,409 | |||||
Packaged goods and other | 1,700 | 1,971 | 1,987 | ||||||||
Net revenue | $ | 5,150 | $ | 4,845 | $ | 4,396 | |||||
Digital net revenue includes full-game downloads, live services, and mobile revenue. Digital net revenue includes game software distributed through our direct-to-consumer PC platform Origin, distributed wirelessly through mobile carriers, or licensed to our third-party publishing partners who distribute our games digitally.
Packaged goods and other net revenue includes revenue from software that is sold physically. This includes (1) net revenue from game software sold physically through traditional channels such as brick and mortar retailers, and (2) our software licensing revenue from third parties (for example, makers of console platforms, personal computers or computer accessories)
78
who include certain of our products for sale with their products (“OEM bundles”). Other revenue includes our non-software licensing revenue.
Year Ended March 31, | |||||||||||
2018 | 2017 | 2016 | |||||||||
Platform net revenue | |||||||||||
Xbox One, PlayStation 4, Switch | $ | 3,495 | $ | 3,056 | $ | 2,183 | |||||
Other consoles | 140 | 334 | 759 | ||||||||
Total consoles | 3,635 | 3,390 | 2,942 | ||||||||
PC / Browser | 827 | 773 | 814 | ||||||||
Mobile | 672 | 627 | 548 | ||||||||
Other | 16 | 55 | 92 | ||||||||
Net revenue | $ | 5,150 | $ | 4,845 | $ | 4,396 | |||||
Information about our operations in North America and internationally as of and for the fiscal years ended March 31, 2018, 2017 and 2016 is presented below (in millions):
Year Ended March 31, | |||||||||||
2018 | 2017 | 2016 | |||||||||
Net revenue from unaffiliated customers | |||||||||||
North America | $ | 2,090 | $ | 2,119 | $ | 1,907 | |||||
International | 3,060 | 2,726 | 2,489 | ||||||||
Total | $ | 5,150 | $ | 4,845 | $ | 4,396 | |||||
As of March 31, | |||||||
2018 | 2017 | ||||||
Long-lived assets | |||||||
North America | $ | 376 | $ | 369 | |||
International | 77 | 65 | |||||
Total | $ | 453 | $ | 434 | |||
We attribute net revenue from external customers to individual countries based on the location of the legal entity that sells the products and/or services. Note that revenue attributed to the legal entity that makes the sale is often not the country where the consumer resides. For example, revenue generated by our Swiss legal entities includes digital revenue from consumers who reside outside of Switzerland, including consumers who reside outside of Europe. Revenue generated by our Swiss legal entities during fiscal years 2018, 2017, and 2016 represents $2,272 million, $1,886 million and $1,643 million or 44 percent, 39 percent and 37 percent of our total net revenue, respectively. Revenue generated in the United States represents over 99 percent of our total North America net revenue. There were no other countries with net revenue greater than 10 percent.
In fiscal year 2018, our direct sales to Sony and Microsoft represented approximately 27 percent and 16 percent of total net revenue, respectively. In fiscal year 2017, our direct sales to Sony and Microsoft represented approximately 19 percent and 17 percent of total net revenue, respectively. In fiscal 2016, our direct sales to Sony and Microsoft represented approximately 16 percent and 14 percent of total net revenue, respectively.
79
(18) QUARTERLY FINANCIAL AND MARKET INFORMATION (UNAUDITED)
Quarter Ended | Year Ended | ||||||||||||||||||
(In millions, except per share data) | June 30 | September 30 | December 31 | March 31 | |||||||||||||||
Fiscal 2018 Consolidated | |||||||||||||||||||
Net revenue | $ | 1,449 | $ | 959 | $ | 1,160 | $ | 1,582 | $ | 5,150 | |||||||||
Gross profit | 1,295 | 570 | 659 | 1,349 | 3,873 | ||||||||||||||
Operating income (loss) | 743 | (41 | ) | (21 | ) | 753 | 1,434 | ||||||||||||
Net income (loss) | 644 | (22 | ) | (186 | ) | (a) | 607 | (a) | 1,043 | ||||||||||
Common Stock | |||||||||||||||||||
Earnings (loss) per share — Basic | $ | 2.08 | $ | (0.07 | ) | $ | (0.60 | ) | $ | 1.98 | $ | 3.39 | |||||||
Earnings (loss) per share — Diluted | $ | 2.06 | $ | (0.07 | ) | $ | (0.60 | ) | $ | 1.95 | $ | 3.34 | |||||||
Common stock price per share | |||||||||||||||||||
High | $ | 115.37 | $ | 121.97 | $ | 120.09 | $ | 129.12 | $ | 129.12 | |||||||||
Low | $ | 88.40 | $ | 105.42 | $ | 100.83 | $ | 107.19 | $ | 88.40 | |||||||||
Fiscal 2017 Consolidated | |||||||||||||||||||
Net revenue | $ | 1,271 | $ | 898 | $ | 1,149 | $ | 1,527 | $ | 4,845 | |||||||||
Gross profit | 1,092 | 497 | 633 | 1,325 | 3,547 | ||||||||||||||
Operating income (loss) | 560 | (49 | ) | (4 | ) | 717 | 1,224 | ||||||||||||
Net income (loss) | 440 | (38 | ) | (1 | ) | 566 | 967 | ||||||||||||
Common Stock | |||||||||||||||||||
Earnings (loss) per share — Basic | $ | 1.46 | $ | (0.13 | ) | $ ( | 0.00 | ) | $ | 1.84 | $ | 3.19 | |||||||
Earnings (loss) per share — Diluted | $ | 1.40 | $ | (0.13 | ) | $ ( | 0.00 | ) | $ | 1.81 | $ | 3.08 | |||||||
Common stock price per share | |||||||||||||||||||
High | $ | 77.25 | $ | 85.40 | $ | 85.56 | $ | 91.51 | $ | 91.51 | |||||||||
Low | $ | 61.85 | $ | 75.38 | $ | 75.58 | $ | 78.64 | $ | 61.85 | |||||||||
(a) | During the quarters ended December 31, 2017 and March 31, 2018, EA recognized a provisional tax expense due to the application of the U.S. Tax Act, enacted on December 22, 2017. |
Our common stock is traded on the NASDAQ Global Select Market under the symbol “EA”. The prices for the common stock in the table above represent the high and low closing sales prices as reported on the NASDAQ Global Select Market.
80
Report of Independent Registered Public Accounting Firm
To the Stockholders and Board of Directors
Electronic Arts Inc.:
Opinions on the Consolidated Financial Statements and Internal Control Over Financial Reporting
We have audited the accompanying consolidated balance sheets of Electronic Arts Inc. and subsidiaries (the Company) as of March 31, 2018 and April 1, 2017, the related consolidated statements of operations, comprehensive income, stockholders’ equity, and cash flows for each of the years in the three-year period ended March 31, 2018, and the related notes and financial statement schedule (collectively, the consolidated financial statements). We also have audited the Company’s internal control over financial reporting as of March 31, 2018, based on criteria established in Internal Control - Integrated Framework (2013) issued by the Committee of Sponsoring Organizations of the Treadway Commission.
In our opinion, the consolidated financial statements referred to above present fairly, in all material respects, the financial position of the Company as of March 31, 2018 and April 1, 2017, and the results of its operations and its cash flows for each of the years in the three-year period ended March 31, 2018, in conformity with U.S. generally accepted accounting principles. Also in our opinion, the Company maintained, in all material respects, effective internal control over financial reporting as of March 31, 2018, based on criteria established in Internal Control - Integrated Framework (2013) issued by the Committee of Sponsoring Organizations of the Treadway Commission.
Basis for Opinions
The Company’s management is responsible for these consolidated financial statements, for maintaining effective internal control over financial reporting, and for its assessment of the effectiveness of internal control over financial reporting, included in the accompanying Management’s Report on Internal Control over Financial Reporting appearing under Item 9A. Our responsibility is to express an opinion on the Company’s consolidated financial statements and an opinion on the Company’s internal control over financial reporting based on our audits. We are a public accounting firm registered with the Public Company Accounting Oversight Board (United States) (PCAOB) and are required to be independent with respect to the Company in accordance with the U.S. federal securities laws and the applicable rules and regulations of the Securities and Exchange Commission and the PCAOB.
We conducted our audits in accordance with the standards of the PCAOB. Those standards require that we plan and perform the audits to obtain reasonable assurance about whether the consolidated financial statements are free of material misstatement, whether due to error or fraud, and whether effective internal control over financial reporting was maintained in all material respects.
Our audits of the consolidated financial statements included performing procedures to assess the risks of material misstatement of the consolidated financial statements, whether due to error or fraud, and performing procedures that respond to those risks. Such procedures included examining, on a test basis, evidence regarding the amounts and disclosures in the consolidated financial statements. Our audits also included evaluating the accounting principles used and significant estimates made by management, as well as evaluating the overall presentation of the consolidated financial statements. Our audit of internal control over financial reporting included obtaining an understanding of internal control over financial reporting, assessing the risk that a material weakness exists, and testing and evaluating the design and operating effectiveness of internal control based on the assessed risk. Our audits also included performing such other procedures as we considered necessary in the circumstances. We believe that our audits provide a reasonable basis for our opinions.
Definition and Limitations of Internal Control Over Financial Reporting
A company’s internal control over financial reporting is a process designed to provide reasonable assurance regarding the reliability of financial reporting and the preparation of financial statements for external purposes in accordance with generally accepted accounting principles. A company’s internal control over financial reporting includes those policies and procedures that (1) pertain to the maintenance of records that, in reasonable detail, accurately and fairly reflect the transactions and dispositions of the assets of the company; (2) provide reasonable assurance that transactions are recorded as necessary to permit preparation of financial statements in accordance with generally accepted accounting principles, and that receipts and expenditures of the company are being made only in accordance with authorizations of management and directors of the company; and (3) provide reasonable assurance regarding prevention or timely detection of unauthorized acquisition, use, or disposition of the company’s assets that could have a material effect on the financial statements.
81
Because of its inherent limitations, internal control over financial reporting may not prevent or detect misstatements. Also, projections of any evaluation of effectiveness to future periods are subject to the risk that controls may become inadequate because of changes in conditions, or that the degree of compliance with the policies or procedures may deteriorate.
/s/ KPMG LLP
We have served as the Company’s auditor since 1987.
Santa Clara, California
May 23, 2018
82
Item 9: Changes in and Disagreements with Accountants on Accounting and Financial Disclosure
Not applicable.
Item 9A: Controls and Procedures
Definition and Limitations of Disclosure Controls
Our disclosure controls and procedures (as defined in Rules 13a-15(e) and 15d-15(e) under the Exchange Act) are controls and other procedures that are designed to ensure that information required to be disclosed in our reports filed under the Exchange Act, such as this report, is recorded, processed, summarized and reported within the time periods specified in the SEC’s rules and forms. Disclosure controls and procedures are also designed to ensure that such information is accumulated and communicated to our management, including the Chief Executive Officer and Chief Financial Officer, as appropriate to allow timely decisions regarding required disclosure. Our management evaluates these controls and procedures on an ongoing basis.
There are inherent limitations to the effectiveness of any system of disclosure controls and procedures. These limitations include the possibility of human error, the circumvention or overriding of the controls and procedures and reasonable resource constraints. In addition, because we have designed our system of controls based on certain assumptions, which we believe are reasonable, about the likelihood of future events, our system of controls may not achieve its desired purpose under all possible future conditions. Accordingly, our disclosure controls and procedures provide reasonable assurance, but not absolute assurance, of achieving their objectives.
Evaluation of Disclosure Controls and Procedures
Our Chief Executive Officer and our Chief Financial Officer, after evaluating the effectiveness of our disclosure controls and procedures, believe that as of the end of the period covered by this report, our disclosure controls and procedures were effective in providing the requisite reasonable assurance that material information required to be disclosed in the reports that we file or submit under the Exchange Act is recorded, processed, summarized and reported within the time periods specified in the SEC’s rules and forms, and is accumulated and communicated to our management, including our Chief Executive Officer and Chief Financial Officer, as appropriate to allow timely decisions regarding the required disclosure.
Management’s Report on Internal Control over Financial Reporting
Our management is responsible for establishing and maintaining adequate internal control over financial reporting, as defined in Rules 13a-15(f) and 15d-15(f) under the Exchange Act.
Our internal control over financial reporting is designed to provide reasonable, but not absolute, assurance regarding the reliability of financial reporting and the preparation of financial statements in accordance with generally accepted accounting principles. There are inherent limitations to the effectiveness of any system of internal control over financial reporting. These limitations include the possibility of human error, the circumvention or overriding of the system and reasonable resource constraints. Because of its inherent limitations, our internal control over financial reporting may not prevent or detect misstatements. Projections of any evaluation of effectiveness to future periods are subject to the risks that controls may become inadequate because of changes in conditions, or that the degree of compliance with our policies or procedures may deteriorate.
Our management assessed the effectiveness of our internal control over financial reporting as of the end of our most recently completed fiscal year. In making its assessment, management used the criteria set forth in Internal Control-Integrated Framework (2013), issued by the Committee of Sponsoring Organizations of the Treadway Commission (COSO). Based on this assessment, our management believes that, as of the end of our most recently completed fiscal year, our internal control over financial reporting was effective.
KPMG LLP, our independent registered public accounting firm, has issued an auditors’ report on the effectiveness of our internal control over financial reporting. That report appears on page 81.
Changes in Internal Control over Financial Reporting
There has been no change in our internal controls over financial reporting identified in connection with our evaluation that occurred during the fiscal quarter ended March 31, 2018 that has materially affected, or is reasonably likely to materially affect, our internal control over financial reporting.
Item 9B: Other Information
None.
83
PART III
Item 10: Directors, Executive Officers and Corporate Governance
The information required by Item 10, other than the information regarding executive officers, which is included in Part I, Item 1 of this report, is incorporated herein by reference to the information to be included in our 2018 Proxy under the heading “Board of Directors & Corporate Governance.” The information regarding compliance with Section 16(a) of the Exchange Act is incorporated herein by reference to the information to be included in the 2018 Proxy under the sub-heading “Section 16(a) Beneficial Ownership Reporting Compliance.”
Item 11: Executive Compensation
The information required by Item 11 is incorporated herein by reference to the information to be included in the 2018 Proxy under the headings “Director Compensation and Stock Ownership Guidelines” and “Compensation Discussion and Analysis” and “Executive Compensation” and the subheadings “Committee Report on Executive Compensation” and “Compensation Committee Interlocks and Insider Participation.”
Item 12: Security Ownership of Certain Beneficial Owners and Management and Related Stockholder Matters
The information required by Item 12 is incorporated herein by reference to the information to be included in the 2018 Proxy under the heading “Security Ownership of Certain Beneficial Owners and Management” and the subheading “Equity Compensation Plan Information.”
Item 13: Certain Relationships and Related Transactions, and Director Independence
The information required by Item 13 is incorporated herein by reference to the information to be included in the 2018 Proxy under the subheadings “Director Independence,” “Related Person Transaction Policy” and “Certain Relationships and Related Person Transactions.”
Item 14: Principal Accounting Fees and Services
The information required by Item 14 is incorporated herein by reference to the information to be included in Proposal 3 of the 2018 Proxy under the sub-headings “Fees of Independent Auditors” and “Pre-approval Procedures.”
PART IV
Item 15: Exhibits, Financial Statement Schedules
(a) | Documents filed as part of this report |
1. Financial Statements: See Index to Consolidated Financial Statements under Item 8 on Page 42 of this report.
2. Financial Statement Schedule: See Schedule II on Page 85 of this report.
3. Exhibits: The exhibits listed in the accompanying index to exhibits on Page 86 are filed or incorporated by reference as part of this report.
84
ELECTRONIC ARTS INC. AND SUBSIDIARIES
SCHEDULE II
VALUATION AND QUALIFYING ACCOUNTS
Years Ended March 31, 2018, 2017 and 2016
(In millions)
Allowance for Doubtful Accounts, Price Protection and Returns | Balance at Beginning of Period | Charged to Revenue, Costs and Expenses | Charged (Credited) to Other Accounts(a) | Deductions(b) | Balance at End of Period | |||||||||||
Year Ended March 31, 2018 | $ | 145 | 288 | 35 | (303 | ) | $ | 165 | ||||||||
Year Ended March 31, 2017 | $ | 159 | 298 | (8 | ) | (304 | ) | $ | 145 | |||||||
Year Ended March 31, 2016 | $ | 140 | 269 | 11 | (261 | ) | $ | 159 | ||||||||
(a) | Primarily other reclassification adjustments and the translation effect of using the average exchange rate for expense items and the year-end exchange rate for the balance sheet item (allowance account). |
(b) | Primarily the utilization of returns allowance and price protection reserves. |
85
ELECTRONIC ARTS INC.
2018 FORM 10-K ANNUAL REPORT
EXHIBIT INDEX
Incorporated by Reference | Filed Herewith | |||||||||
Number | Exhibit Title | Form | File No. | Filing Date | ||||||
10-Q | 000-17948 | 11/3/2004 | ||||||||
8-K/A | 000-17948 | 5/27/2016 | ||||||||
10-Q | 000-17948 | 2/6/2018 | ||||||||
8-K | 000-17948 | 2/24/2016 | ||||||||
8-K | 000-17948 | 2/24/2016 | ||||||||
10-K | 000-17948 | 6/4/2004 | ||||||||
8-K | 000-17948 | 5/18/2018 | ||||||||
10-Q | 000-17948 | 8/6/2007 | ||||||||
8-K | 000-17948 | 5/18/2018 | ||||||||
10-K | 000-17948 | 5/22/2009 | ||||||||
8-K | 000-17948 | 5/18/2018 | ||||||||
8-K | 000-17948 | 5/23/2016 | ||||||||
8-K | 000-17948 | 5/22/2017 | ||||||||
8-K | 000-17948 | 5/18/2018 | ||||||||
8-K | 000-17948 | 6/7/2017 | ||||||||
8-K | 000-17948 | 6/7/2017 | ||||||||
10-Q | 000-17948 | 11/7/2017 | ||||||||
8-K | 000-17948 | 8/1/2016 | ||||||||
8-K | 000-17948 | 8/1/2016 | ||||||||
8-K | 000-17948 | 9/17/2013 | ||||||||
8-K | 000-17948 | 7/31/2012 | ||||||||
10-Q | 000-17948 | 8/5/2014 | ||||||||
86
Incorporated by Reference | Filed Herewith | |||||||||
Number | Exhibit Title | Form | File No. | Filing Date | ||||||
10-Q | 000-17948 | 11/4/2014 | ||||||||
10-Q | 000-17948 | 11/8/2016 | ||||||||
10-Q | 000-17948 | 11/5/2013 | ||||||||
10-Q | 000-17948 | 8/3/2004 | ||||||||
10-Q | 000-17948 | 2/8/2006 | ||||||||
10-Q | 000-17948 | 8/10/2009 | ||||||||
10-Q | 000-17948 | 2/9/2010 | ||||||||
10-K | 000-17948 | 5/21/2014 | ||||||||
10-Q | 000-17948 | 11/10/2009 | ||||||||
10-Q | 000-17948 | 11/10/2009 | ||||||||
10-Q/A | 000-17948 | 4/30/2010 | ||||||||
10-Q/A | 000-17948 | 4/30/2010 | ||||||||
10-K | 000-17948 | 5/21/2014 | ||||||||
87
Incorporated by Reference | Filed Herewith | |||||||||
Number | Exhibit Title | Form | File No. | Filing Date | ||||||
8-K | 000-17948 | 3/20/2015 | ||||||||
X | ||||||||||
X | ||||||||||
X | ||||||||||
X | ||||||||||
X | ||||||||||
Additional exhibits furnished with this report: | ||||||||||
X | ||||||||||
X | ||||||||||
101.INS† | XBRL Instance Document | X | ||||||||
101.SCH† | XBRL Taxonomy Extension Schema Document | X | ||||||||
101.CAL† | XBRL Taxonomy Extension Calculation Linkbase Document | X | ||||||||
101.DEF† | XBRL Taxonomy Extension Definition Linkbase Document | X | ||||||||
101.LAB† | XBRL Taxonomy Extension Label Linkbase Document | X | ||||||||
101.PRE† | XBRL Taxonomy Extension Presentation Linkbase Document | X | ||||||||
* | Management contract or compensatory plan or arrangement. |
** | Confidential portions of these documents have been omitted and filed separately with the Securities and Exchange Commission pursuant to a request for confidential treatment that was granted in accordance with Exchange Act Rule 24b-2. |
† | Attached as Exhibit 101 to this Annual Report on Form 10-K for the year ended March 31, 2017 are the following formatted in eXtensible Business Reporting Language (“XBRL”): (1) Consolidated Balance Sheets, (2) Consolidated Statements of Operations, (3) Consolidated Statements of Comprehensive Income (Loss), (4) Consolidated Statements of Stockholders’ Equity, (5) Consolidated Statements of Cash Flows, and (6) Notes to Consolidated Financial Statements. |
88
SIGNATURES
Pursuant to the requirements of Section 13 or 15(d) of the Securities Exchange Act of 1934, the Registrant has duly caused this report to be signed on its behalf by the undersigned, thereunto duly authorized. | ||
ELECTRONIC ARTS INC. | ||
By: | /s/ Andrew Wilson | |
Andrew Wilson | ||
Chief Executive Officer | ||
Date: May 23, 2018 | ||
Pursuant to the requirements of the Securities Exchange Act of 1934, this report has been signed below by the following persons on behalf of the Registrant and in the capacities indicated and on the 23rd of May 2018. | ||
Name | Title | |
/s/ Andrew Wilson | Chief Executive Officer | |
Andrew Wilson | ||
/s/ Blake Jorgensen | Chief Operating Officer and | |
Blake Jorgensen | Chief Financial Officer | |
/s/ Kenneth A. Barker | Chief Accounting Officer | |
Kenneth A. Barker | (Principal Accounting Officer) | |
Directors: | ||
/s/ Lawrence F. Probst III | Chairman of the Board | |
Lawrence F. Probst III | ||
/s/ Leonard S. Coleman | Director | |
Leonard S. Coleman | ||
/s/ Jay C. Hoag | Director | |
Jay C. Hoag | ||
/s/ Jeffrey T. Huber | Director | |
Jeffrey T. Huber | ||
/s/ Vivek Paul | Director | |
Vivek Paul | ||
/s/ Talbott Roche | Director | |
Talbott Roche | ||
/s/ Richard A. Simonson | Director | |
Richard A. Simonson | ||
/s/ Luis A. Ubiñas | Director | |
Luis A. Ubiñas | ||
/s/ Heidi Ueberroth | Director | |
Heidi Ueberroth | ||
/s/ Denise F. Warren | Director | |
Denise F. Warren | ||
/s/ Andrew Wilson | Director | |
Andrew Wilson | ||
89