Attached files
| file | filename |
|---|---|
| EX-10.37 - EXHIBIT 10.37 - Qorvo, Inc. | exhibit1037qorvo_2018amend.htm |
| EX-32.2 - EXHIBIT 32.2 - Qorvo, Inc. | exhibit32220180331.htm |
| EX-32.1 - EXHIBIT 32.1 - Qorvo, Inc. | exhibit32120180331.htm |
| EX-31.2 - EXHIBIT 31.2 - Qorvo, Inc. | exhibit31220180331.htm |
| EX-31.1 - EXHIBIT 31.1 - Qorvo, Inc. | exhibit31120180331.htm |
| EX-23.1 - EXHIBIT 23.1 - Qorvo, Inc. | exhibit231consentletter201.htm |
| EX-21.2 - EXHIBIT 21.2 - Qorvo, Inc. | exhibit2120180331.htm |
UNITED STATES | ||
SECURITIES AND EXCHANGE COMMISSION | ||
Washington, D.C. 20549 | ||
FORM 10-K | ||
x ANNUAL REPORT PURSUANT TO SECTION 13 OR 15(d) OF THE SECURITIES EXCHANGE ACT OF 1934 | ||
For the fiscal year ended March 31, 2018 | ||
or | ||
¨ TRANSITION REPORT PURSUANT TO SECTION 13 OR 15(d) OF THE SECURITIES EXCHANGE ACT OF 1934 | ||
For the transition period from_______ to_______ | ||
Commission file number 001-36801 | ||
 | ||
Qorvo, Inc. (Exact name of registrant as specified in its charter) | ||
Delaware | 46-5288992 | |
(State or other jurisdiction of incorporation or organization) | (I.R.S. Employer Identification No.) | |
7628 Thorndike Road, Greensboro, North Carolina 27409-9421 | ||
(Address of principal executive offices) | ||
(Zip Code) | ||
(336) 664-1233 | ||
(Registrant's telephone number, including area code) | ||
Securities registered pursuant to Section 12(b) of the Act: | ||
Title of each class Common Stock, $0.0001 par value | Name of each exchange on which registered The Nasdaq Stock Market LLC (Nasdaq Global Select Market) | |
Securities registered pursuant to Section 12(g) of the Act: None | ||
Indicate by check mark if the registrant is a well-known seasoned issuer, as defined in Rule 405 of the Securities Act. Yes x No ¨
Indicate by check mark if the registrant is not required to file reports pursuant to Section 13 or Section 15(d) of the Act.
Yes ¨ No x
Indicate by check mark whether the registrant (1) has filed all reports required to be filed by Section 13 or 15(d) of the Securities Exchange Act of 1934 during the preceding 12 months (or for such shorter period that the registrant was required to file such reports), and (2) has been subject to such filing requirements for the past 90 days. Yes x No ¨
Indicate by check mark whether the registrant has submitted electronically and posted on its corporate Web site, if any, every Interactive Data File required to be submitted and posted pursuant to Rule 405 of Regulation S-T (§ 232.405 of this chapter) during the preceding 12 months (or for such shorter period that the registrant was required to submit and post such files).
Yes x No ¨
Indicate by check mark if disclosure of delinquent filers pursuant to Item 405 of Regulation S‑K (§ 229.405 of this chapter) is not contained herein, and will not be contained, to the best of registrant's knowledge, in definitive proxy or information statements incorporated by reference in Part III of this Form 10‑K or any amendment to this Form 10‑K. x
Indicate by check mark whether the registrant is a large accelerated filer, an accelerated filer, a non-accelerated filer, a smaller reporting company, or an emerging growth company. See the definitions of “large accelerated filer,” “accelerated filer,” “smaller reporting company,” and “emerging growth company” in Rule 12b-2 of the Exchange Act.
Large accelerated filer x | Accelerated filer ¨ |
Non-accelerated filer ¨ (Do not check if a smaller reporting company) | Smaller reporting company ¨ |
Emerging growth company ¨ | |
If an emerging growth company, indicate by check mark if the registrant has elected not to use the extended transition period for complying with any new or revised financial accounting standards provided pursuant to Section 13(a) of the Exchange Act. ¨ | |
Indicate by check mark whether the registrant is a shell company (as defined in Rule 12b-2 of the Act). Yes ¨ No x
The aggregate market value of the registrant's common stock held by non-affiliates of the registrant was approximately $8,954,525,040 as of September 30, 2017. For purposes of such calculation, shares of common stock held by persons who held more than 10% of the outstanding shares of common stock and shares held by directors and officers of the registrant and their immediate family members have been excluded because such persons may be deemed to be affiliates. This determination is not necessarily conclusive.
There were 126,490,563 shares of the registrant's common stock outstanding as of May 11, 2018.
DOCUMENTS INCORPORATED BY REFERENCE
The registrant has incorporated by reference into Part III of this report certain portions of its proxy statement for its 2018 annual meeting of stockholders, which is expected to be filed pursuant to Regulation 14A within 120 days after the end of the registrant’s fiscal year ended March 31, 2018.
QORVO, INC. FORM 10-K FOR THE FISCAL YEAR ENDED MARCH 31, 2018 INDEX | ||
Page | ||
Item 1. | ||
Item 1A. | ||
Item 1B. | ||
Item 2. | ||
Item 3. | ||
Item 4. | ||
Item 5. | ||
Item 6. | ||
Item 7. | ||
Item 7A. | ||
Item 8. | ||
Item 9. | ||
Item 9A. | ||
Item 9B. | ||
Item 10. | ||
Item 11. | ||
Item 12. | ||
Item 13. | ||
Item 14. | ||
Item 15. | ||
Item 16. | Form 10-K Summary. | |
3
Forward-Looking Information
This report includes "forward-looking statements" within the meaning of the safe harbor provisions of the Private Securities Litigation Reform Act of 1995, including but not limited to certain disclosures contained in Item 7, "Management’s Discussion and Analysis of Financial Condition and Results of Operations." These forward-looking statements include, but are not limited to, statements about our plans, objectives, representations and contentions, and are not historical facts and typically are identified by the use of terms such as "may," "will," "should," "could," "expect," "plan," "anticipate," "believe," "estimate," "forecast," "predict," "potential," "continue" and similar words, although some forward-looking statements are expressed differently. You should be aware that the forward-looking statements included herein represent management's current judgment and expectations, but our actual results, events and performance could differ materially from those expressed or implied by forward-looking statements. We do not intend to update any of these forward-looking statements or publicly announce the results of any revisions to these forward-looking statements, other than as is required under the federal securities laws.
The following discussion should be read in conjunction with, and is qualified in its entirety by reference to, our audited consolidated financial statements included in this report, including the notes thereto.
PART I
We use a 52- or 53-week fiscal year ending on the Saturday closest to March 31 of each year. Fiscal years 2018 and 2017 were 52-week years, and fiscal year 2016 was a 53-week year. Our other fiscal quarters end on the Saturday closest to June 30, September 30 and December 31 of each year.
On February 22, 2014, RF Micro Devices, Inc. (“RFMD”) and TriQuint Semiconductor, Inc. ("TriQuint") entered into an Agreement and Plan of Merger and Reorganization as subsequently amended on July 15, 2014 (the "Merger Agreement"), providing for the combination of RFMD and TriQuint in a merger of equals (the "Business Combination") under a new holding company named Qorvo, Inc. (the “Company” or “Qorvo”). The transactions contemplated by the Merger Agreement were consummated on January 1, 2015.
For more information concerning the Business Combination, see Note 6 of the Notes to the Consolidated Financial Statements set forth in Part II, Item 8 of this report.
ITEM 1. BUSINESS.
Company Overview
Qorvo® is a product and technology leader at the forefront of the growing global demand for always-on broadband connectivity. We combine a broad portfolio of radio frequency ("RF") solutions, highly differentiated semiconductor technologies, deep systems-level expertise and scale manufacturing to supply a diverse group of customers in expanding markets, including smartphones and other mobile devices, defense and aerospace, Wi-Fi customer premises equipment ("CPE"), cellular base stations, optical networks, automotive connectivity and smart home applications. Within these markets, our products enable a broad range of leading-edge applications – from very-high-power wired and wireless infrastructure solutions to ultra-low-power smart home solutions. Our products and technologies help transform how people around the world access their data, transact commerce and interact with their communities.
Qorvo employs more than 8,300 people. We have world-class manufacturing facilities, and our fabrication facility in Richardson, Texas, is a United States Department of Defense ("DoD")-accredited ‘Trusted Source’ (Category 1A) for gallium arsenide ("GaAs"), gallium nitride ("GaN") and bulk acoustic wave ("BAW") technologies. Our design and manufacturing expertise covers many semiconductor process technologies, which we source both internally and through external suppliers. Our primary wafer fabrication facilities are in Florida, North Carolina, Oregon and Texas, and our primary assembly and test facilities are in China, Costa Rica, Germany and Texas. We also operate design, sales and other manufacturing facilities throughout Asia, Europe and North America.
Qorvo was incorporated in Delaware in 2013. Our principal executive office is located at 7628 Thorndike Road, Greensboro, North Carolina 27409 and our telephone number is (336) 664-1233.
4
Operating Segments
We design, develop, manufacture and market our products to leading U.S. and international original equipment manufacturers ("OEMs") and original design manufacturers ("ODMs") in the following operating segments:
• | Mobile Products (MP) - MP is a leading global supplier of cellular RF and Wi-Fi solutions into a variety of mobile devices, including smartphones, notebook computers, wearables, tablets, and cellular-based applications for the Internet of Things ("IoT"). Mobile device manufacturers and mobile network operators are adopting new technologies to address the growing demand for data-intensive, increasingly cloud-based distributed applications and for mobile devices with smaller form factors, improved signal quality, less heat and longer talk and standby times. New wireless communications standards are being deployed to utilize available spectrum more efficiently. Carrier aggregation ("CA") is being implemented to support wider bandwidths, increase data rates and improve network performance. These trends increase the complexity of smartphones, require more RF content and place a premium on performance, integration, systems-level expertise, and product and technology portfolio breadth, all of which are MP strengths. MP offers a comprehensive product portfolio of BAW and surface acoustic wave ("SAW") filters, power amplifiers ("PAs"), low noise amplifiers ("LNAs"), switches, multimode multi-band PAs and transmit modules, RF power management integrated circuits ("ICs"), diversity receive modules, antenna switch modules, antenna tuning and control solutions, modules incorporating PAs and duplexers ("PADs") and modules incorporating switches, PAs and duplexers ("S-PADs"). |
• | Infrastructure and Defense Products (IDP) - IDP is a leading global supplier of RF solutions with a diverse portfolio of solutions that "connect and protect," spanning communications and defense applications. These applications include high performance defense systems such as radar, electronic warfare and communication systems, Wi-Fi CPE for home and work, high speed connectivity in Long-Term Evolution ("LTE") and 5G base stations, cloud connectivity via data center communications and telecom transport, automotive connectivity and other IoT, including smart home solutions. IDP products include GaAs and GaN PAs, LNAs, switches, complementary metal oxide semiconductor ("CMOS") system-on-a-chip ("SoC") solutions, premium BAW and SAW filter solutions and various multi-chip and hybrid assemblies. |
For financial information about the results of our operating segments for each of the last three fiscal years, see Note 16 of the Notes to the Consolidated Financial Statements set forth in Part II, Item 8 of this report.
Market Overview
Our business is diversified primarily across seven strategic end markets: mobile devices, defense and aerospace, CPE Wi-Fi, cellular base stations, optical, automotive connectivity and smart home. These markets compose the primary building blocks of the IoT.
Mobile Devices
In our largest market, mobile devices, the most significant trend today is the increasing demand for ubiquitous broadband mobile data. This is driven primarily by video, with data traffic for video exceeding data traffic for web browsing and voice. Compounding this, consumers want higher resolution screens and access to streaming media, real-time traffic/navigation, GPS, Bluetooth® connectivity and Wi-Fi. In response, leading smartphone providers are adding 4G LTE and 5G bands of coverage to their flagship devices to reduce development costs and enable larger, more concentrated marketing budgets in support of fewer models. They are also adding CA technology to enable simultaneous communication over multiple frequency bands. This helps network operators optimize spectral efficiency and provides an enhanced user experience for consumers. Both trends expand RF content and drive higher levels of integration, which can increase performance requirements for RF components and narrow the competitive field. We see these trends continuing, as consumers increasingly expect always-on, ultra-low latency, broadband connectivity and as smartphone manufacturers and network operators seek to enhance performance and the user experience generation-over-generation.
5
Defense and Aerospace
The global defense and aerospace industries are sharply focused on balancing cost, RF performance and power consumption. The trends toward phased arrays and higher frequencies of operation are expanding the market opportunities for monolithic microwave integrated circuits ("MMICs") and discrete PAs, LNAs, passive devices, die level solutions and multichip modules leveraging multiple semiconductor technologies and advanced packaging techniques. Additionally, as with all RF communications systems, spectrum is becoming increasingly crowded and requires interference-free connections which are addressed by premium filtering solutions. These factors continue to drive demand for increased reliability and performance to address current and next generation communications for defense and national security capabilities, both domestic and with international partners.
CPE Wi-Fi
In Wi-Fi markets, consumer and enterprise demand for faster data rates, the growth in connected users and the higher performance requirements of 802.11ac and 802.11ax mandate best-in-class RF solutions. Wi-Fi is continuing to proliferate within CPE, including routers, access points, set-top boxes and smart televisions, as well as in automobiles. As spectrum becomes more crowded, the demand for interference-free transmission and reception is expected to drive the demand for high performance filters in RF solutions for Wi-Fi equipment.
Cellular Base Stations
The widespread use of data-intensive applications has driven cellular operators to require more power-efficient designs and solutions that enable increased capacity from cellular networks. To meet network demand, network equipment manufacturers are using techniques such as CA, moving to new RF frequency bands that have wider channel bandwidths and incorporating cloud radio access networks, which use a virtual radio access technology and remote radio heads. As demand for data-intensive applications continues to grow, the next generation network, called 5G, is forecasted to begin commercial rollout in 2020. 5G networks will continue the progression of operating at much higher frequencies, likely at 28GHz and 39GHz. In the meantime, operators will continue to evolve the performance of their LTE networks and run field trials to prove out 5G technologies and solutions. The future trends in the base station market include implementation of Multiple Input Multiple Output ("MIMO") and small cells.
Optical
The optical market is comprised of traditional long haul, telecom network applications and hyperscale data center applications. Telecom applications typically involve high-speed networks of fiber optic cable to enable voice and data communications in a transcontinental, regional or city-wide area. Data center applications support the processing and routing of massive amounts of internet data traffic to, from and within hyperscale facilities used by Web 2.0 participants like Facebook, Google and Amazon in support of their proprietary, cloud-based applications. High-speed throughput, efficient power consumption and cost efficiency are key attributes of the hyperscale data center market.
Automotive Connectivity
The automobile is becoming a more connected device with the addition of multiple RF based connectivity solutions such as satellite radio, in-car infotainment and LTE connectivity solutions. Looking forward, new standards are expected to be deployed that will connect the car to other vehicles or to highway infrastructure. All of these applications create opportunities that will drive the need for RF solutions that will enhance passenger comfort, convenience and safety. Most of these applications require AEC-Q100 qualified solutions, which is the standard in the automobile industry. Additionally, in this market most of the communications devices will need to share frequency spectrum with either licensed or unlicensed users.
Smart Home
The smart home is characterized as a dwelling that contains devices such as sensors that detect light, motion or temperature, or whether doors are open, closed, locked or unlocked, and actuators to implement a command such as lowering the temperature or opening your garage door. Typically, these devices can be controlled via the internet, by a computer or phone or through a direct peer-to-peer connection such as a television remote control. The solutions often utilize industry open standard technologies like Bluetooth Low Energy ("BLE"), ZigBee, and Thread as well as proprietary solutions to link to a central gateway that connects to the internet.
Other Markets
We also participate in several smaller markets including broadband cable, point-to-point radio, Very Small Aperture Terminal ("VSAT") and cellular machine-to-machine ("M2M") applications.
6
Products and Applications
Our semiconductor solutions serve RF, microwave and millimeter-wave applications. We believe our products deliver key advantages, as measured by size, weight, linearity, distortion, output power, power-added efficiency, selectivity, frequency control, and other critical performance metrics.
We utilize specialized substrate materials such as GaAs, gallium nitride on silicon carbide (GaN on SiC), silicon germanium (SiGe) and silicon for power amplifiers. We use silicon on insulator (SOI) for tuners and switches and silicon for controllers. Our filters use substrates made of lithium tantalate for SAW filters, lithium niobate for temperature compensated SAW filters (TC-SAW) and silicon for BAW filters. We use heterojunction bipolar transistor ("HBT") and pseudomorphic high electron mobility transistors ("pHEMT") technologies for our GaAS and GaN power amplifiers. We use solid mounted resonator ("SMR") technology to manufacture our BAW filters.
Mobile Devices
Qorvo’s MP product portfolio includes our RF Fusion™ and RF Flex™ product families. RF Fusion leverages Qorvo’s product and technology leadership, systems-level expertise and advanced integration capabilities to combine all major transmit and receive RF functionality in highly integrated, high-performance, split-band placements. Qorvo’s RF Flex modules leverage our deep systems-level expertise to integrate core cellular transmit and receive functionality in high-performance multiband PA modules and transmit modules. RF Fusion solutions support the industry’s most advanced smartphone architectures, and RF Flex solutions support cost-optimized performance-tier smartphone architectures.
Qorvo is a pioneer in envelope tracking ("ET") technology, which we incorporate into power management components and our most advanced PAs. We also offer ET-capable PAs for third-party power management components. Our ET technology enables us to track the envelope of high-speed modulation signals and adjust the PA in real time to maximize efficiency and maintain the requisite levels of linearity. This is increasingly necessary to maximize data rates and satisfy user expectations for battery life and case temperatures.
Our mobile product portfolio includes filters, duplexers, switches, multimode/multi-band PAs and transmit modules, RF power management ICs, diversity receive modules, antenna switch modules, antenna tuning and control solutions, and modules incorporating PAs, PADs, and S-PADs.
Historically, we have experienced seasonal fluctuations in the sale of mobile products, with revenue strongest in our second and third fiscal quarters and weakest in our fourth fiscal quarter.
Defense and Aerospace
Contractors serving the United States and other governments use our high performance and high reliability products for mission critical solutions across the military and aerospace industry. Our die-level integrated circuits and discrete components, MMICs and multi-chip modules are key components for radar, electronic warfare and communications systems. Program applications include major shipboard, airborne and battlefield radar systems as well as communications and electronic warfare. We supply a wide range of products for large-scale programs with long lead-times. Once a component has been designed into an end-use military application, it is generally used during the entire production life of the end-use system.
Our products for defense radar applications bring new capabilities to detect and neutralize threats against aircrews and shipboard and infantry forces around the globe. Our microwave PAs provide the power at the heart of phased array radar. These radars consist of large element arrays composed of many individual integrated circuits, with the capability to track multiple targets simultaneously. We are strategically teamed with top tier contractors to offer this type of capability to new domestic and multi-national production programs, along with retrofits of other essential tactical military assets with critical enhancements and service life extension capabilities.
In the defense communications field, we supply filters, amplifiers and other components for handheld and satellite communications systems. In addition, we use our packaging and integrated assembly expertise to speed designs, facilitate multi-chip package evolution and deliver cost-effective solutions.
We are the leading supplier of GaN-based products to global defense and aerospace markets and are directly engaged with the United States government, primarily through contracts with the Defense Advanced Research
7
Project Agency, the Air Force Research Laboratory and the Office of Naval Research, to develop next generation GaN devices for future high-power phased array radar, electronic warfare and communications systems. The DoD has certified our GaN fabrication and production capabilities at Manufacturing Readiness Level 9, the highest in the industry.
CPE Wi-Fi
We address the high performance requirements demanded in customer premises Wi-Fi equipment through our portfolio of differentiated products, including discrete high power amplifiers, and integrated front-end modules ("iFEMs") for mid and low power, and our discrete and integrated BAW filter capabilities. Our products primarily target high-end Wi-Fi market segments, including retail (routers, extenders and repeaters), distributed mesh solutions, enterprise, service provider and carrier grade Wi-Fi. Our solutions enable better home and business coverage with the faster and more reliable connections required for video streaming, augmented/virtual reality and high density user environments. We use our GaN and GaAs technologies to supply leading Wi-Fi chipset providers with highly integrated, power-efficient solutions and we use our premium filter technologies to provide coexistence and band-edge solutions to address interference issues due to spectrum crowding. This approach aligns with our key customers’ need for more highly integrated, cost-effective solutions to provide a high-quality user experience at affordable prices.
Cellular Base Stations
We offer a broad set of custom RF amplifier solutions, receive module technologies and premium filter solutions to the leading base station OEMs to address the current and future needs of this market. To address the increasing market demands for more power-efficient designs and increased network capacity, we offer transceiver products supporting LTE massive MIMO deployments, primarily in China and Japan. Our integrated solutions for these massive MIMO systems include switch-LNA modules, variable gain amplifiers and integrated PA modules. Our GaAs base station solutions offer differentiated low noise performance, while our GaN amplifiers combine high linearity and efficiency with high output power and low power consumption. We are a strategic supplier of transceiver solutions to base station OEM market leaders, and we expect to continue to grow these relationships with new product categories.
We are leveraging our legacy defense product capabilities across low frequencies up through millimeter wave to respond to the product demands of the next generation 5G networks for sub-6GHz and millimeter wave solutions. Our current products are embedded in ongoing 5G field trials, and we have multiple product development engagements with top OEMs to intersect network operators’ timelines for deployment of 5G networks.
Optical
We supply linear and nonlinear driver solutions and trans-impedance amplifiers (“TIAs”) to the optical market and have leveraged this market position by extending our product offerings to include TIAs for long haul telecom, metro and datacenter interconnect applications. These differentiated, value-added products balance performance with the cost per gigabit for our customers. Achieving this balance requires a mix of internal and external semiconductor technologies and innovative packaging. Technologies used for our optical products include GaAs pHEMT, Indium Phosphide ("InP"), SiGe and silicon. In addition, we were the first to offer optical drivers with surface mount packaging and we continue to innovate to create smaller products that consume less power and enhance throughput to address the 40G, 100G, 200G and beyond markets.
Automotive Connectivity
To address the growing demand for connected car solutions, including solutions for cellular LTE, Wi-Fi, and satellite digital audio radio service, we offer a product portfolio that includes differentiated BAW filters, LNAs, switches, PAs and LTE front end solutions, all of which meet or exceed the industry’s automotive level quality and reliability standards. Our BAW and SAW solutions address interference issues due to licensed and unlicensed frequency bands being contiguous or overlapping. We leverage our mobile and CPE Wi-Fi and cellular LTE product portfolios and other technology combinations to address the industry needs. We have products on multiple reference designs with key chipset makers to address future vehicle-to-vehicle communication requirements.
8
Smart Home
Our product portfolio for the smart home market consists of silicon CMOS SoC devices and the associated firmware and software to drive the radio functions and enable application software to interface with the SoC. To augment the SoC, we offer various configurations of filtering and amplification utilizing our extensive portfolio of filters, amplifiers and LNAs. Our solutions are vertically focused on applications that perform the functions of remote controls, and we provide support to our customers to enable development of application software to run on our platforms. Our solutions typically support open standard technologies such as BLE, ZigBee, and Thread. Our smart home product development efforts are focused on driving more functionality and system power savings features into our hardware and software architectures to address the needs of battery powered devices, primarily remote controls. We are also engaged with overall ecosystem providers to develop products beyond remote controls to address next generation smart home applications.
Manufacturing
The majority of our products are multi-chip modules utilizing multiple semiconductor and acoustic material processing technologies. These products have varying degrees of complexity and contain semiconductors and other components that are manufactured in-house or outsourced. We are a leading supplier of RF solutions and a leading manufacturer of GaAs HBT, GaAs pHEMT, GaN, SAW, TC-SAW and BAW products.
We operate wafer fabrication facilities for the production of GaAs, GaN, SAW, TC-SAW and BAW wafers in Apopka, Florida; Greensboro, North Carolina; Hillsboro, Oregon; and Richardson, Texas. We also use multiple silicon-based process technologies, including SOI, SiGe and CMOS. We outsource all silicon manufacturing to leading silicon foundries located throughout the world. We have a global supply chain and ship millions of units per day.
We have our own flip chip and wafer-level packaging ("WLP") technologies and we also use external suppliers for these and other packaging technologies. In flip chip packages, the electrical connections are created directly on the surface of the die, which eliminates wirebonds so the die may be attached directly to a substrate or leadframe. This type of technology provides a higher density interconnection than wirebonded die and enables smaller form factors with improved thermal and electrical performance. We use WLP technologies for our SAW, TC-SAW and BAW filter products.
Once semiconductor wafers are manufactured, they are singulated, or separated, into individual units called die. Prior to singulation of wafers into die, we regularly conduct wafer level tests which could include electrical validation, RF testing through the designed frequency bands, as well as visual inspection. For module products, the next step is assembly. During assembly, the die and other components are placed on high-density interconnect substrates to provide connectivity between the die and the components. This populated substrate is formed into a microelectronic package. Next, the products are tested for RF performance and prepared for shipment through a tape and reel process. We primarily use internal assembly facilities in China, Costa Rica, Germany, and the U.S., and we also utilize external suppliers. We also manufacture large volumes of WLP die and discrete filters that our customers directly assemble into their products.
Manufacturing yields can vary significantly between products, based on a number of factors, including product complexity and the maturity of our manufacturing processes. To maximize wafer yields and quality, we test products multiple times, maintain continuous reliability monitoring and conduct numerous quality control inspections throughout the production flow.
Our internal manufacturing facilities require a high level of fixed costs, consisting primarily of occupancy costs, maintenance, repair, equipment depreciation, and fixed labor costs related to manufacturing and process engineering.
ICs and filter products are highly complex and sensitive to contaminants, and semiconductor fabrication requires highly controlled, clean environments. Wafers can be rejected or die on a wafer can be found to be nonfunctional as a result of minute impurities, variances in the fabrication process or defects in the masks used to transfer circuits onto the wafers.
Our manufacturing facilities worldwide are certified to the ISO 9001 quality standard, and select locations are certified to additional automotive (IATF 16949), aerospace (AS 9100) and environmental (ISO 14001) standards.
9
These stringent standards are audited and certified by third-party auditors in addition to our continuous internal self-audits. The ISO 9001 standard is based on a number of quality management principles including a strong customer focus, the motivation of top management, the process approach and continual improvement. IATF 16949 is the highest international quality standard for the global automotive industry and incorporates specific additional requirements for the automotive industry. AS 9100 is the standardized quality management system for the aerospace industry. ISO 14001 is an internationally agreed upon standard for an environmental management system. We require that all of our key vendors and suppliers be compliant with select standards, as applicable.
Raw Materials
We purchase numerous raw materials, passive components and substrates for our products and manufacturing processes. For our GaAs and GaN manufacturing operations, we use several raw materials, including GaAs wafers and GaN on SiC wafers. For our acoustic filter manufacturing operations, we use several raw materials, including wafer starting materials made from quartz, silicon, lithium niobate or lithium tantalite, as well as ceramic or metal packages. Relatively few companies produce these materials. Our most significant suppliers of ceramic surface mount packages are based in Japan.
For our silicon-based products, we use third-party foundries. High demand for silicon wafers and wafer starting materials has led to supply constraints from time-to-time, and we have attempted to address this by qualifying multiple silicon foundries and by obtaining supply commitments, in some cases in exchange for purchase or capital commitments by us.
Our manufacturing strategy includes a balance of internal and external sites (primarily for assembly and test operations), which helps reduce costs, provides flexibility of supply, and minimizes the risk of supply disruption. We routinely qualify multiple sources of supply and manufacturing sites to reduce the risk of supply interruptions or price increases and closely monitor suppliers’ key performance indicators. Our suppliers' and our manufacturing sites are geographically diversified (with our largest volume sources distributed throughout Southern and Eastern Asia). We believe we have adequate sources for the supply of raw materials, passive components and substrates for our products and manufacturing needs.
Customers
We design, develop, manufacture and market products for leading U.S. and international OEMs and ODMs. We also collaborate with leading baseband reference design partners located primarily in the U.S. and China.
We provided our products to our largest end customer, Apple Inc. ("Apple"), through sales to multiple contract manufacturers, which in the aggregate accounted for 36%, 34%, and 37% of total revenue in fiscal years 2018, 2017 and 2016, respectively. Huawei Technologies Co., Ltd. ("Huawei") accounted for 8%, 11% and 12% of our total revenue in fiscal years 2018, 2017 and 2016, respectively. These customers primarily purchase cellular RF and Wi-Fi solutions offered by our MP segment for a variety of mobile devices, including smartphones, notebook computers, wearables, tablets and cellular-based applications for the IoT.
Some of our sales to overseas customers are made under export licenses that must be obtained from the United States Department of Commerce.
Information about revenue (including segment revenue), operating profit or loss and total assets is presented in Part II, Item 8, “Financial Statements and Supplementary Data” of this report.
Sales and Marketing
We sell our products worldwide directly to customers as well as through a network of domestic and foreign sales representative firms and distributors. We select our domestic and foreign sales representatives based on technical skills and sales experience, the presence of complementary product lines and the customer base served. We provide ongoing training to our internal and external sales representatives and distributors to keep them educated about our products. We maintain an internal sales and marketing organization that is responsible for key account management, application engineering support for customers, sales and advertising literature, and technical presentations for industry conferences. Our sales and customer support centers are located near our customers throughout the world.
10
Our website contains extensive product information, and we publish a comprehensive product selection guide annually. Our global team of application engineers interacts with customers during all stages of design and production, maintains regular contact with customer engineers, provides product application notes and engineering data, and assists in the resolution of technical problems. We maintain close relationships with our customers and platform providers and provide them strong technical support to help anticipate future product needs and enhance their customer experience.
Research and Development
We maintain a high level of investment in research and development ("R&D") to develop the advanced technologies and products necessary to lead in the markets we serve. Our R&D activities focus primarily on large, competitive design win opportunities for major programs at key customers, which typically requires us to improve the year-over-year functional density, performance, size and cost of our products. We also devote significant R&D resources for targeted development of new products for general release to various markets. Our R&D efforts require us to focus on both continuous improvement in our processes for design and manufacture as well as innovation in fundamental areas like materials, software and firmware, semiconductor process technologies, simulation and modeling, systems architecture, circuit design, device packaging, module integration and test.
We have developed several generations of GaAs, GaN, BAW and SAW process technologies that we manufacture internally. We invest in these technologies to improve device performance, reduce die size and reduce manufacturing costs. We also help develop and qualify technologies made by key suppliers, including SOI for switches and RF signal conditioning solutions, SiGe and InP for amplifiers, and CMOS for power management devices and SoC solutions. We combine these external technologies with our proprietary design methods, intellectual property and other expertise to improve performance, increase integration and reduce the size and cost of our products.
We invest in GaN process technologies and continue to develop and release new GaN-based products to exploit GaN’s performance advantages. The inherent wide band gap, high electron mobility, and high breakdown voltage characteristics of GaN semiconductor devices offer significant performance advantages versus competing technologies.
We develop and qualify advanced packaging technologies to allow us to eliminate wire bonds, reduce component size, improve performance and reduce package costs. We are also investing in large scale module assembly and test capabilities to bring these technologies to market in very high volumes.
In fiscal years 2018, 2017 and 2016, we incurred approximately $445.1 million, $470.8 million and $448.8 million, respectively, in R&D expenses. We expect to continue to spend substantial funds on R&D in support of our growth and product diversification.
Competition
We operate in a competitive industry characterized by rapid advances in technology and new product introductions. Our customers’ product life cycles are often short, and our competitiveness depends on our ability to improve our products and processes faster than our competitors, anticipate changing customer requirements and successfully develop and launch new products while reducing our costs. Our competitiveness is also affected by the quality of our customer service and technical support and our ability to design customized products that address each customer’s particular requirements within their cost limitations. The selection process for our products to be included in our customers’ products is highly competitive, and our customers provide no guarantees that our products will be included in the next generation of products introduced.
We compete primarily with the following companies: Analog Devices, Inc.; Broadcom Limited; M/A-COM Technology Solutions, Inc.; Murata Manufacturing Co., Ltd.; Northrop Grumman Corporation; Qualcomm Technologies, Inc.; Skyworks Solutions, Inc.; and Sumitomo Electric Device Innovations.
Many of our current and potential competitors have entrenched market positions and customer relationships, established patents and other intellectual property and substantial technological capabilities. In some cases, our competitors are also our customers or suppliers. Additionally, many of our competitors may have significantly
11
greater financial, technical, manufacturing and marketing resources than we do, which may allow them to implement new technologies and develop new products more quickly than we can.
Intellectual Property
We believe our intellectual property, including patents, copyrights, trademarks and trade secrets, is important to our business, and we actively seek opportunities to leverage our intellectual property portfolio to promote our business interests. We also actively seek to monitor and protect our global intellectual property rights and to deter unauthorized use of our intellectual property and other assets. Such efforts can be difficult because of the absence of consistent international standards and laws. Moreover, we respect the intellectual property rights of others and have implemented policies and procedures to mitigate the risk of infringing or misappropriating third party intellectual property.
Patent applications are filed within the U.S. and in other countries where we have a market presence. On occasion, some applications do not mature into patents for various reasons, including rejections based on prior art. In addition, the laws of some foreign countries do not protect intellectual property rights to the same extent as U.S. laws. We have approximately 1,300 patents that expire from 2018 to 2038. We also continue to acquire patents through acquisitions or direct prosecution efforts and engage in licensing transactions to secure the right to practice third parties’ patents. In view of our rapid innovation and product development and the comparative pace of governments’ patenting processes, there is no guarantee that our products will not be obsolete before the related patents expire or are granted. However, we believe the duration and scope of our most relevant patents are sufficient to support our business, which as a whole is not significantly dependent on any particular patent or other intellectual property right. As we expand our products and offerings, we also seek to expand our patent prosecution efforts to cover such products.
We periodically register federal trademarks, service marks and trade names that distinguish our product brand names in the market. We also monitor these marks for their proper and intended use. Additionally, we rely on non-disclosure and confidentiality agreements to protect our interest in confidential and proprietary information that gives us a competitive advantage, including business strategies, unpatented inventions, designs and process technology. Such information is closely monitored and made available only to those employees whose responsibilities require access to the information.
Backlog
Our sales are the result of standard purchase orders or specific agreements with customers. We maintain Qorvo-owned finished goods inventory at certain customers’ "hub" locations and do not recognize revenue until our customers draw down the inventory at these hubs. Our customers’ projections of consumption of hub inventory and quantities on purchase orders, as well as the shipment schedules, are frequently revised within agreed-upon lead times to reflect changes in the customers’ needs. Because industry practice allows customers to cancel orders with limited advance notice prior to shipment, and with little or no penalty, we believe that backlog as of any particular date may not be a reliable indicator of our future revenue levels.
Employees
On March 31, 2018, we had more than 8,300 employees. We believe that our future prospects will depend, in part, on our ability to continue to attract and retain skilled employees. Competition for skilled personnel is intense, and the number of persons with relevant experience, particularly in RF engineering, product design and technical marketing, is limited. None of our U.S. employees are represented by a labor union. A number of our employees in Germany (less than 5% of our global workforce as of March 31, 2018) are represented by internal works councils. We have never experienced any work stoppage, and we believe that our current employee relations are good.
12
Geographic Financial Summary
A summary of our operations by geographic area is as follows (in thousands):
Fiscal Year | |||||||||||
2018 | 2017 | 2016 | |||||||||
Revenue: | |||||||||||
United States | $ | 524,472 | $ | 467,031 | $ | 306,328 | |||||
International | 2,449,064 | 2,565,543 | 2,304,398 | ||||||||
March 31, 2018 | April 1, 2017 | April 2, 2016 | |||||||||
Long-lived tangible assets: | |||||||||||
United States | $ | 1,089,157 | $ | 1,082,754 | $ | 816,882 | |||||
China | 217,205 | 244,728 | 183,836 | ||||||||
Other countries | 67,750 | 64,450 | 46,170 | ||||||||
Sales, for geographic disclosure purposes, are based on the “sold to” address of the customer. The "sold to" address is not always an accurate representation of the location of final consumption of our products. Of our total revenue for fiscal 2018, approximately 52% ($1,539.7 million) was attributable to customers in China and 19% ($564.8 million) was attributable to customers in Taiwan. Of our total revenue for fiscal years 2017 and 2016, approximately 62% ($1,866.0 million) and 61% ($1,601.0 million), respectively, was attributable to customers in China and 13% ($398.4 million) and 14% ($365.1 million), respectively, was attributable to customers in Taiwan.
For financial information regarding our operations by geographic area, see Note 16 of the Notes to the Consolidated Financial Statements set forth in Part II, Item 8 of this report.
For a summary of certain risks associated with our foreign operations, see Item 1A, "Risk Factors."
Environmental Matters
By virtue of operating our wafer fabrication facilities, we are subject to a variety of extensive and changing domestic and international federal, state and local governmental laws, regulations and ordinances related to the use, storage, discharge and disposal of toxic, volatile or otherwise hazardous chemicals used in the manufacturing process. We provide our own manufacturing waste water pretreatment and disposal for most of our manufacturing facilities, and we have contracted for the disposal of our hazardous waste. State agencies require us to report storage and emissions of environmentally hazardous materials, and we have retained appropriate personnel to help ensure compliance with all applicable environmental regulations. We believe that costs arising from existing environmental laws will not have a material adverse effect on our financial position or results of operations.
We are an ISO 14001:2015 certified manufacturer with a comprehensive Environmental Management System ("EMS") in place to help ensure control of the environmental aspects of the manufacturing process. Our EMS mandates compliance and establishes appropriate checks and balances to minimize the potential for non-compliance with environmental laws and regulations.
We actively monitor the hazardous materials that are used in the manufacture, assembly and testing of our products, particularly materials that are retained in the final product. We have developed specific restrictions on the content of certain hazardous materials in our products, as well as those of our suppliers and outsourced manufacturers and subcontractors. This helps to ensure that our products are compliant with the requirements of the markets into which the products will be sold and with our customers’ requirements. For example, our products are compliant with the European Union RoHS Directive (2011/65/EU on the Restriction of Use of Hazardous Substances), which prohibits the sale in the European Union market of new electrical and electronic equipment containing certain families of substances above a specified threshold.
We do not currently anticipate any material capital expenditures for environmental control facilities in fiscal 2019.
13
Access to Public Information
We make available, free of charge through our website (http://www.qorvo.com), our annual and quarterly reports on Forms 10-K and 10-Q (including related filings in XBRL format) and current reports on Form 8-K and amendments to these reports filed or furnished pursuant to Section 13(a) or 15(d) of the Securities Exchange Act of 1934, as amended (the "Exchange Act") as soon as reasonably practicable after we electronically file these reports with, or furnish them to, the United States Securities and Exchange Commission ("SEC"). The public may also request a copy of our forms filed with the SEC, without charge upon written request, directed to:
Investor Relations Department
Qorvo, Inc., 7628 Thorndike Road Greensboro, NC 27409-9421
The information contained on, or that can be accessed through, our website is not incorporated by reference into this Annual Report on Form 10-K. We have included our website address as a factual reference and do not intend it as an active link to our website.
In addition, the SEC maintains an Internet site that contains reports, proxy and information statements, and other information regarding issuers that file electronically with the SEC at http://www.sec.gov. You may also read and copy any documents that we file with the SEC at the SEC’s Public Reference Room located at 100 F Street, N.E., Room 1580, Washington, D.C. 20549. Please call the SEC at 1-800-SEC-0330 for information on the operation of the Public Reference Room.
ITEM 1A. RISK FACTORS.
Our operating results fluctuate.
Our revenue, earnings, margins and other operating results have fluctuated significantly in the past and may fluctuate significantly in the future. If demand for our products fluctuates as a result of economic conditions or for other reasons, our revenue and profitability could be impacted. Our future operating results will depend on many factors, including the following:
• | business, political and macroeconomic changes, including trade disputes and downturns in the semiconductor industry and the overall global economy; |
• | changes in consumer confidence caused by many factors, including changes in interest rates, credit markets, expectations for inflation, unemployment levels, and energy or other commodity prices; |
• | fluctuations in demand for our customers’ products; |
• | our ability to forecast our customers' demand for our products accurately; |
• | the ability of third-party foundries and other third-party suppliers to manufacture, assemble and test our products in a timely and cost-effective manner; |
• | our customers’ and distributors’ ability to manage the inventory that they hold and to forecast accurately their demand for our products; |
• | our ability to achieve cost savings and improve yields and margins on our new and existing products; and |
• | our ability to utilize our capacity efficiently or acquire additional capacity in response to customer demand. |
It is likely that our future operating results could be adversely affected by one or more of the factors set forth above or other similar factors. If our future operating results are below the expectations of stock market analysts or our investors, our stock price may decline.
14
Our operating results are substantially dependent on development of new products and achieving design wins as our industry’s product life cycles are short and our customers' requirements change rapidly.
Our largest markets are characterized by short product life cycles and the frequent introduction of new products in response to evolving product requirements, driven by end user demand for more functionality, improved performance, lower costs and smaller form factors. Our largest MP customers typically refresh some or all of their product portfolios by releasing new models each year. In some cases, product designs we pursue represent either opportunities to substantially increase our revenue by winning a new design or a risk of a substantial revenue loss by losing an incumbent product in a customer's device.
Our future success is dependent on our ability to develop and introduce new products in a timely and cost-effective manner and secure production orders from our customers. The development of new products is a highly complex process, and we have experienced delays in completing the development and introduction of new products at times in the past. Our successful product development depends on a number of factors, including the following:
• | our ability to predict market requirements and define and design new products that address those requirements; |
• | our ability to design products that meet our customers’ cost, size and performance requirements; |
• | our ability to introduce new products that are competitive and can be manufactured at lower costs or that command higher prices based on superior performance; |
• | acceptance of our new product designs; |
• | the availability of qualified product design engineers; |
• | our timely completion of product designs and ramp up of new products according to our customers’ needs with acceptable manufacturing yields; and |
• | market acceptance of our customers’ products and the duration of the life cycle of such products. |
We may not be able to design and introduce new products in a timely or cost-efficient manner, and our new products may fail to meet market or customer requirements. Most major product design opportunities that we pursue involve multiple competitors, and we could lose a new product design opportunity to a competitor that offers a lower cost or equal or superior performing product. If we are unsuccessful in achieving design wins against our competitors, our revenue and operating results will be adversely affected. Even when a design win is achieved, our success is not assured. Design wins may require significant expenditures by us and typically precede volume revenue by six to nine months or more. Many customers seek a second source for all major components in their devices, which can significantly reduce the revenue obtained from a design win. In many cases, the average selling prices of our products decline over the products’ lives, and we must achieve yield improvements, cost reductions and other productivity enhancements in order to maintain profitability. The actual value of a design win to us will ultimately depend on the commercial success of our customers’ products.
We depend on a few large customers for a substantial portion of our revenue.
A substantial portion of our MP revenue comes from large purchases by a small number of customers. Our future operating results depend on both the success of our largest customers and on our success in diversifying our products and customer base. Collectively, our two largest end customers accounted for an aggregate of approximately 44%, 45% and 49% of our revenue for fiscal years 2018, 2017 and 2016, respectively.
We typically manufacture custom products on an exclusive basis for individual customers for a negotiated period of time. Increasingly, the top-tier cellular handset OEMs are releasing fewer new phone models on an annual basis, which heightens the importance of achieving design wins for these larger opportunities. While the financial rewards and market affirmation from a design win for these premier customers are greater, competition for these projects is intense. The concentration of our revenue with a relatively small number of customers makes us particularly dependent on factors, both positive and negative, affecting those customers. If demand for their products increases, our results are favorably impacted, while if demand for their products decreases, they may reduce their purchases of,
15
or stop purchasing, our products and our operating results would suffer. Even if we achieve a design win, our customers can delay or cancel the release of a new handset for any reason. Most of our customers can cease incorporating our products into their devices with little notice to us and with little or no penalty. The loss of a large customer and failure to add new customers to replace lost revenue would have a material adverse effect on our business, financial condition and results of operations.
We face risks of a loss of revenue if contracts with the United States government or defense and aerospace contractors are canceled or delayed or if defense spending is reduced.
We receive a portion of our revenue from the United States government and from prime contractors on United States government-sponsored programs, principally for defense and aerospace applications. These programs are subject to delays or cancellation. Further, spending on defense and aerospace programs can vary significantly depending on funding from the United States government. We believe our government and defense and aerospace business has been negatively affected in the past by external factors such as sequestration and political pressure to reduce federal defense spending. Reductions in defense and aerospace funding or the loss of a significant defense and aerospace program or contract would have a material adverse effect on our operating results.
We depend heavily on third parties.
We purchase numerous component parts, substrates and silicon-based products from external suppliers. We also utilize third-party suppliers for numerous services, including die processing, wafer bumping, test and tape and reel. The use of external suppliers involves a number of risks, including the possibility of material disruptions in the supply of key components and the lack of control over delivery schedules, capacity constraints, manufacturing yields, product quality and fabrication costs.
Although our key suppliers commit to us to be compliant with applicable ISO 9001 and/or TS-16949 quality standards, we have experienced quality and reliability issues in the past with certain suppliers. Quality or reliability issues in our supply chain could negatively affect our products, our reputation and our results of operations.
We face risks related to sales through distributors.
We sell a significant portion of our products through third party distributors. We depend on these distributors to help us create end customer demand, provide technical support and other value-added services to customers, fill customer orders, and stock our products. We may rely on one or more key distributors for a product, and a material change in our relationship with one or more of these distributors or their failure to perform as expected could reduce our revenue. Our ability to add or replace distributors for some of our products may be limited because our end customers may be hesitant to accept the addition or replacement of a distributor due to advantages in the incumbent distributors’ technical support and favorable business terms related to payments, discounts and stocking of acceptable inventory levels. Using third parties for distribution exposes us to many risks, including competitive pressure, concentration, credit risk, and compliance risks. Other third parties may use one of our distributors to sell products that compete with our products, and we may need to provide financial and other incentives to the distributors to focus them on the sale of our products. Our distributors may face financial difficulties, including bankruptcy, which could harm our collection of accounts receivable and financial results. Violations of the Foreign Corrupt Practices Act or similar laws by our distributors or other third-party intermediaries could have a material impact on our business. Failure to manage risks related to our use of distributors may reduce sales, increase expenses, and weaken our competitive position.
We face risks associated with the operation of our manufacturing facilities.
We operate wafer fabrication facilities in Florida, North Carolina, Oregon and Texas. We currently use several international and domestic assembly suppliers, as well as internal assembly facilities in China, Costa Rica, Germany and the U.S. to assemble and test our products. We currently have our own test and tape and reel facilities located in China, Costa Rica and the U.S., and we also utilize contract suppliers and partners in Asia to test our products.
A number of factors related to our facilities will affect our business and financial results, including the following:
• | our ability to adjust production capacity in a timely fashion in response to changes in demand for our products; |
16
• | the significant fixed costs of operating the facilities; |
• | factory utilization rates; |
• | our ability to qualify our facilities for new products and new technologies in a timely manner; |
• | the availability of raw materials, the impact of the volatility of commodity pricing and tariffs imposed on raw materials, including substrates, gold, platinum and high purity source materials such as gallium, aluminum, arsenic, indium, silicon, phosphorous and palladium; |
• | our manufacturing cycle times; |
• | our manufacturing yields; |
• | the political, regulatory and economic risks associated with our international manufacturing operations; |
• | potential violations by our international employees or third-party agents of international or U.S. laws relevant to foreign operations; |
• | our ability to hire, train and manage qualified production personnel; |
• | our compliance with applicable environmental and other laws and regulations; and |
• | our ability to avoid prolonged periods of down-time in our facilities for any reason. |
Business disruptions could harm our business, lead to a decline in revenues and increase our costs.
Our worldwide operations and business could be disrupted by natural disasters, industrial accidents, cybersecurity incidents, telecommunications failures, power or water shortages, extreme weather conditions, public health issues, military actions, acts of terrorism, political or regulatory issues and other man-made disasters or catastrophic events. We carry commercial property damage and business interruption insurance against various risks, with limits we deem adequate for reimbursement for damage to our fixed assets and resulting disruption of our operations. However, the occurrence of any of these business disruptions could harm our business and result in significant losses, a decline in revenue and an increase in our costs and expenses. Any disruptions from these events could require substantial expenditures and recovery time in order to fully resume operations and could also have a material adverse effect on our operations and financial results to the extent that losses are uninsured or exceed insurance recoveries and to the extent that such disruptions adversely impact our relationships with our customers.
If we experience poor manufacturing yields, our operating results may suffer.
Our products have unique designs and are fabricated using multiple semiconductor process technologies that are highly complex. In many cases, our products are assembled in customized packages. Many of our products consist of multiple components in a single module and feature enhanced levels of integration and complexity. Our customers insist that our products be designed to meet their exact specifications for quality, performance and reliability. Our manufacturing yield is a combination of yields across the entire supply chain, including wafer fabrication, assembly and test yields. Defects in a single component in an assembled module product can impact the yield for the entire module, which means the adverse economic impacts of an individual defect can be multiplied many times over if we fail to discover the defect before the module is assembled. Due to the complexity of our products, we periodically experience difficulties in achieving acceptable yields and other quality issues, particularly with respect to new products.
Our customers test our products once they have been assembled into their products. The number of usable products that result from our production process can fluctuate as a result of many factors, including:
• | design errors; |
17
• | defects in photomasks (which are used to print circuits on a wafer); |
• | minute impurities in materials used; |
• | contamination of the manufacturing environment; |
• | equipment failure or variations in the manufacturing processes; |
• | losses from broken wafers or other human error; and |
• | defects in packaging. |
We constantly seek to improve our manufacturing yields. Typically, for a given level of sales, when our yields improve, our gross margins improve, and when our yields decrease, our unit costs are higher, our margins are lower, and our operating results are adversely affected.
Costs of product defects and deviations from required specifications could include the following:
• | writing off the value of inventory; |
• | disposing of products that cannot be fixed; |
• | recalling products that have been shipped; |
• | providing product replacements or modifications; |
• | direct and indirect costs incurred by our customers in recalling their products due to defects in our products; and |
• | defending against litigation. |
These costs could be significant and could reduce our gross margins. Our reputation with customers also could be damaged as a result of product defects and quality issues, and product demand could be reduced, which could harm our business and financial results.
We are subject to increased inventory risks and costs because we build our products based on forecasts provided by customers before receiving purchase orders for the products.
In order to ensure availability of our products for some of our largest end customers, we start manufacturing certain products in advance of receiving purchase orders based on forecasts provided by these customers. However, these forecasts do not represent binding purchase commitments and we do not recognize sales for these products until they are shipped to or consumed by the customer. As a result, we incur significant inventory and manufacturing costs in advance of anticipated sales. Because demand for our products may not materialize, or may be lower than expected, manufacturing based on forecasts subjects us to heightened risks of higher inventory carrying costs, increased obsolescence and higher operating costs. These inventory risks are exacerbated when our customers purchase indirectly through contract manufacturers or hold component inventory levels greater than their consumption rate because this reduces our visibility regarding the customers’ accumulated levels of inventory. If product demand decreases or we fail to forecast demand accurately, we could be required to write-off inventory, which would have a negative impact on our gross margin and other operating results.
18
We sell certain of our products based on reference designs of platform providers, and our inability to effectively manage or maintain our evolving relationships with these companies may have an adverse effect on our business.
Platform providers are typically large companies that provide system reference designs for OEMs and ODMs that include the platform provider’s baseband and other complementary products. A platform provider may own or control IP that gives it a strong market position for its baseband products for certain air interface standards, which provides it with significant influence and control over sales of RF products for these standards. Platform providers historically looked to us and our competitors to provide RF products to their customers as part of the overall system design, and we competed with other RF companies to have our products included in the platform provider’s system reference design. This market dynamic has evolved in recent years as platform providers have worked to develop more fully integrated solutions that include their own RF technologies and components.
Platform providers may be in a different business from ours or we may be their customer or direct competitor. Accordingly, we must balance our interest in obtaining new business with competitive and other factors. Because platform providers control the overall system reference design, if they offer competitive RF technologies or their own RF solutions as a part of their reference design and exclude our products from the design, we are at a distinct competitive disadvantage with OEMs and ODMs that are seeking a turn-key design solution, even if our products offer superior performance. This requires us to work more closely with OEMs and ODMs to secure the design of our products in their handsets and other devices.
Our relationships with platform providers are complex and evolving, and the inability to effectively manage or maintain these relationships could have an adverse effect on our business, financial condition and results of operations.
We are subject to risks from international sales and operations.
We operate globally with sales offices and R&D activities as well as manufacturing, assembly and testing facilities in multiple countries, and some of our business activities may be concentrated in one or more geographic areas. As a result, we are subject to regulatory, geopolitical and other risks associated with doing business outside the U.S., including:
• | global and local economic and political conditions; |
• | currency controls and fluctuations; |
• | tariff, trade (including import/export regulations) and other related restrictions and regulations; |
• | labor market conditions and workers’ rights affecting our transportation or manufacturing arrangements or those of our customers or suppliers; |
• | disruptions of capital and trading markets; |
• | occurrences of geopolitical crises such as terrorist activity, armed conflict, civil or military unrest or political instability, which may disrupt manufacturing, assembly, logistics, security and communications and result in reduced demand for our products; |
• | compliance with laws and regulations that differ among jurisdictions, including those covering taxes, intellectual property ownership and infringement, imports and exports, anti-corruption and anti-bribery, antitrust and competition, data privacy, and environment, health, and safety; and |
• | pandemics and similar major health concerns, which could adversely affect our business and our customer order patterns. |
Sales to customers located outside the U.S. accounted for approximately 82% of our revenue in fiscal 2018, of which approximately 52% and 19% were attributable to sales to customers located in China and Taiwan, respectively. We expect that revenue from international sales to China and other markets will continue to be a significant part of our total revenue. Any weakness in the Chinese economy could result in a decrease in demand for consumer products that contain our products, which could materially and adversely affect our business. The
19
imposition by the U.S. of tariffs on goods imported from China and other government actions that restrict our ability to sell our products to Chinese customers, and countermeasures imposed by China in response, could directly or indirectly adversely impact our manufacturing costs and the sales of our products in China and other markets.
As a global company, our results are affected by movements in currency exchange rates. Our exposure may increase or decrease over time as our foreign business levels fluctuate in the countries where we have operations, and these changes could have a material impact on our financial results. The functional currency for most of our international operations is the U.S. dollar. We have foreign operations in Asia, Europe and Costa Rica and Europe, and a substantial portion of our revenue is derived from sales to customers outside the U.S. Our international revenue is primarily denominated in U.S. dollars. Operating expenses and certain working capital items related to our foreign-based operations are, in some instances, denominated in the local foreign currencies and therefore are affected by changes in the U.S. dollar exchange rate in relation to foreign currencies, such as the Costa Rican Colon, Euro, Pound Sterling, Renminbi and Singapore Dollar. If the U.S. dollar weakens compared to these and other currencies, our operating expenses for foreign operations will be higher when remeasured back into U.S. dollars.
Economic regulation in China could adversely impact our business and results of operations.
We have a significant portion of our assembly and testing capacity in China. In recent years, the Chinese economy has experienced periods of rapid expansion and wide fluctuations in the rate of inflation. In response to these factors, the Chinese government has, from time to time, adopted measures to regulate growth and contain inflation, including measures designed to restrict credit or to control prices. Such actions in the future, as well as other changes in Chinese laws and regulations, could increase the cost of doing business in China or decrease the demand for our products in China, which could have a material adverse effect on our business and results of operations.
We operate in a very competitive industry and must continue to implement innovative technologies.
We compete with several companies primarily engaged in the business of designing, manufacturing and selling RF solutions, as well as suppliers of discrete integrated circuits and modules. In addition to our direct competitors, some of our largest end customers and leading platform partners also compete with us to some extent by designing and manufacturing their own products. Increased competition from any source could adversely affect our operating results through lower prices for our products, reduced demand for our products, losses of existing design slots with key customers and a corresponding reduction in our ability to recover development, engineering and manufacturing costs.
Many of our existing and potential competitors have entrenched market positions, historical affiliations with OEMs, considerable internal manufacturing capacity, established IP rights and substantial technological capabilities. The semiconductor industry has experienced increased industry consolidation over the last several years, a trend we expect to continue. Many of our existing and potential competitors may have greater financial, technical, manufacturing or marketing resources than we do. We cannot be sure that we will be able to compete successfully with our competitors.
20
Industry overcapacity could cause us to underutilize our manufacturing facilities and have a material adverse effect on our financial performance.
It is difficult to predict future demand for our products, which makes it difficult to estimate future requirements for production capacity. Capacity expansion projects have long lead times and require capital commitments based on forecasted product trends and demand well in advance of production orders from customers. In recent years, we have made significant capital investments to expand our BAW, SAW and TC-SAW filter capacity to address forecasted future demand patterns.
In the past, capacity additions by us and our competitors sometimes exceeded demand requirements, leading to overcapacity situations. Fluctuations in the growth rate of industry capacity relative to the growth rate in demand for our products also lead to overcapacity and contribute to cyclicality in the semiconductor market.
As many of our manufacturing costs are fixed, these costs cannot be reduced in proportion to the reduced revenues experienced during periods in which we underutilize our manufacturing facilities as a result of overcapacity. If the demand for our products is not consistent with our expectations, underutilization of our manufacturing facilities may have a material adverse effect on average selling prices, our gross margin and other operating results. If demand for our products experiences a prolonged decrease, we may be required to write down our long-lived assets or shorten the useful lives of underutilized assets and accelerate depreciation, which would increase our expenses.
We may not be able to borrow funds under our credit facility or secure future financing.
On December 5, 2017, we entered into a five-year unsecured senior credit facility pursuant to a credit agreement with Bank of America, N.A., as administrative agent, swing line lender and L/C issuer, and a syndicate of lenders (the "Credit Agreement"). The Credit Agreement includes a $300.0 million revolving credit facility which includes a $25.0 million sublimit for the issuance of standby letters of credit and a $10.0 million sublimit for swing line loans. We may request, at any time and from time to time, that the revolving credit facility or the Term Loan (as defined below) be increased by an amount not to exceed $300.0 million. The revolving credit facility is available to finance working capital, capital expenditures and for other corporate purposes. This facility contains various conditions, covenants and representations with which we must be in compliance in order to borrow funds. We cannot assure that we will be in compliance with these conditions, covenants and representations in the future when we may need to borrow funds under this facility.
We may not be able to generate sufficient cash to service all of our debt, including our Term Loan and Senior Notes, or to fund capital expenditures and may be forced to take other actions to satisfy our debt obligations and financing requirements, which may not be successful or on terms favorable to us.
The Credit Agreement also includes a $400.0 million senior delayed draw term loan (the "Term Loan"), of which $100.0 million was funded at closing and then subsequently repaid during March 2018. At our discretion, we may draw down the remaining balance in up to two advances prior to June 5, 2018.
In November 2015, we issued $450.0 million aggregate principal amount of 6.75% Senior Notes due 2023 (the "2023 Notes") and $550.0 million aggregate principal amount of 7.00% Senior Notes due 2025 (the "2025 Notes" and together with the 2023 Notes, the "Notes"). The Notes were issued pursuant to an indenture dated as of November 19, 2015 (the "Indenture"). In September 2016, we completed an exchange offer, in which all of the 2023 Notes and substantially all of the 2025 Notes were exchanged for new notes that have been registered under the Securities Act of 1933, as amended (the "Securities Act"). Our ability to make scheduled payments on or to refinance our debt obligations, including the Term Loan and the Notes, and to fund working capital, planned capital expenditures and expansion efforts and any strategic alliances or acquisitions we may make in the future depends on our ability to generate cash in the future and on our financial condition and operating performance, which are subject to prevailing economic and competitive conditions and to certain financial, business and other factors beyond our control. We cannot be sure that we will maintain a level of cash flows from operating activities sufficient to permit us to pay the principal, premium, if any, and interest on our debt, including the Term Loan and the Notes. If our cash flows and capital resources are insufficient to fund our debt service obligations, we may face liquidity issues and be forced to reduce or delay investments and capital expenditures, or to sell assets, seek additional capital or restructure or refinance our debt, including the Term Loan and the Notes. These alternative measures may not be successful and may not permit us to meet our scheduled debt service and other obligations. Additionally, the agreements governing our Credit Agreement and the Indenture governing the Notes limit the use of the proceeds
21
from any disposition; as a result, we may not be allowed under these documents to use proceeds from such dispositions to satisfy our debt service obligations. Further, we may need to refinance all or a portion of our debt on or before maturity, and we cannot be sure that we will be able to refinance any of our debt on commercially reasonable terms or at all.
The agreements and instruments governing our debt impose restrictions that may limit our operating and financial flexibility.
The Credit Agreement governing our revolving credit facility and the Term Loan and the Indenture governing the Notes contain a number of significant restrictions and covenants that limit our ability to:
• | incur additional debt; |
• | pay dividends, make other distributions or repurchase or redeem our capital stock; |
• | prepay, redeem or repurchase certain debt; |
• | make loans and investments; |
• | sell, transfer or otherwise dispose of assets; |
• | incur or permit to exist certain liens; |
• | enter into certain types of transactions with affiliates; |
• | enter into agreements restricting our subsidiaries’ ability to pay dividends; and |
• | consolidate, amalgamate, merge or sell all or substantially all of our assets. |
These covenants could have the effect of limiting our flexibility in planning for or reacting to changes in our business and the markets in which we compete. In addition, the Credit Agreement requires us to comply with certain financial maintenance covenants. Operating results below current levels or other adverse factors, including a significant increase in interest rates, could result in our being unable to comply with the financial covenants contained in our revolving credit facility. If we violate covenants under the Credit Agreement and are unable to obtain a waiver from our lenders, our debt under our revolving credit facility would be in default and could be accelerated by our lenders. Because of cross-default provisions in the agreements and instruments governing our debt, a default under one agreement or instrument could result in a default under, and the acceleration of, our other debt. If our debt is accelerated, we may not be able to repay our debt or borrow sufficient funds to refinance it. Even if we are able to obtain new financing, it may not be on commercially reasonable terms, on terms that are acceptable to us, or at all. If our debt is in default for any reason, our business, financial condition and results of operations could be materially and adversely affected. In addition, complying with these covenants may also cause us to take actions that are not favorable to holders of the notes and may make it more difficult for us to successfully execute our business strategy and compete against companies that are not subject to such restrictions.
The price of our common stock may be volatile.
The price of our common stock, which is traded on the Nasdaq Global Select Market, has been and may continue to be volatile and subject to wide fluctuations. In addition, the trading volume of our common stock may fluctuate and cause significant price variations to occur. Some of the factors that could cause fluctuations in the stock price or trading volume of our common stock include:
• | general market and economic and political conditions, including market conditions in the semiconductor industry; |
• | actual or expected variations in quarterly operating results; |
• | differences between actual operating results and those expected by investors and analysts; |
22
• | changes in recommendations by securities analysts; |
• | operations and stock performance of competitors and major customers; |
• | accounting charges, including charges relating to the impairment of goodwill and restructuring; |
• | significant acquisitions, strategic alliances, capital commitments, or new products announced by us or by our competitors; |
• | sales of our common stock, including sales by our directors and officers or significant investors; |
• | repurchases of our common stock; |
• | recruitment or departure of key personnel; and |
• | loss of key customers. |
We cannot assure you that the price of our common stock will not fluctuate or decline significantly in the future. In addition, the stock market in general can experience considerable price and volume fluctuations that are unrelated to our performance.
Our stock repurchases may fluctuate.
The amount and timing of our stock repurchases may fluctuate based on a number of factors, including our priorities for the use of our cash for other purposes, such as capital spending and acquisitions, restrictions under securities laws and because of changes in our cash flows, tax laws and the market price of our common stock.
We may engage in future acquisitions that dilute our stockholders’ ownership, cause us to incur debt and assume contingent liabilities or adversely affect our results of operations.
As part of our business strategy, we expect to continue to review potential acquisitions and strategic investments that could complement our current product offerings, augment our market coverage or enhance our technical capabilities, or that may otherwise offer growth or margin improvement opportunities. In the event of future acquisitions of businesses, products or technologies, we could issue equity securities that would dilute our current stockholders’ ownership, incur substantial debt or other financial obligations or assume contingent liabilities. Such actions could harm our results of operations or the price of our common stock. Acquisitions and strategic investments also entail numerous other risks that could adversely affect our business, results of operations and financial condition, including:
• | unanticipated costs, capital expenditures or working capital requirements; |
• | acquisition-related charges and amortization of acquired technology and other intangibles; |
• | the potential loss of key employees from a company we acquire or in which we invest; |
• | diversion of management’s attention from our business; |
• | dissynergies or other harm to existing business relationships with suppliers and customers; |
• | losses or impairment of investments from unsuccessful research and development by companies in which we invest; |
• | failure to successfully integrate acquired businesses, operations, products, technologies and personnel; and |
• | unrealized expected synergies. |
23
In order to compete, we must attract, retain, and motivate key employees, and our failure to do so could harm our business and our results of operations.
In order to compete effectively, we must:
• | hire and retain qualified employees; |
• | continue to develop leaders for key business units and functions; |
• | expand our presence in international locations and adapt to cultural norms of foreign locations; and |
• | train and motivate our employee base. |
Our future operating results and success depend on keeping key technical personnel and management and expanding our sales and marketing, R&D and administrative support. We do not have employment agreements with the vast majority of our employees. We must also continue to attract qualified personnel. The competition for qualified personnel is intense, and the number of people with experience, particularly in RF engineering, integrated circuit and filter design, and technical marketing and support, is limited. In addition, existing or new immigration laws, policies or regulations in the U.S. may limit the pool of available talent. Travels bans, difficulties obtaining visas and other restrictions on international travel could make it more difficult to effectively manage our international operations, collaborate as a global company or service our international customer base. We cannot be sure that we will be able to attract and retain skilled personnel in the future, which could harm our business and our results of operations.
We rely on our intellectual property portfolio and may not be able to successfully protect against the use of our intellectual property by third parties.
We rely on a combination of patents, trademarks, trade secret laws, confidentiality procedures and licensing arrangements to protect our intellectual property rights. We cannot be certain that patents will be issued from any of our pending applications or that patents will be issued in all countries where our products can be sold. Further, we cannot be certain that any claims allowed from pending applications will be of sufficient scope or strength to provide meaningful protection against our competitors. Our competitors may also be able to design around our patents.
The laws of some countries in which our products are developed, manufactured or sold may not protect our products or intellectual property rights to the same extent as U.S. laws. This increases the possibility of piracy of our technology and products. Although we intend to vigorously defend our intellectual property rights, we may not be able to prevent misappropriation of our technology. Additionally, our competitors may be able to independently develop non-infringing technologies that are substantially equivalent or superior to ours.
We may need to engage in legal actions to enforce or defend our intellectual property rights. Generally, intellectual property litigation is both expensive and unpredictable. Our involvement in intellectual property litigation could divert the attention of our management and technical personnel and have a material, adverse effect on our business.
We may be subject to claims of infringement of third-party intellectual property rights.
Our operating results may be adversely affected if third parties were to assert claims that our products infringed their patent, copyright or other intellectual property rights. Such assertions could lead to expensive and unpredictable litigation, diverting the attention of management and technical personnel. An unsuccessful result in any such litigation could have adverse effects on our business, which may include injunctions, exclusion orders and royalty payments to third parties. In addition, if one of our customers or another supplier to one of our customers were found to be infringing on third-party intellectual property rights, such finding could adversely affect the demand for our products.
24
Security breaches and other disruptions could compromise our proprietary information and expose us to liability, which would cause our business and reputation to suffer.
We rely on trade secrets, technical know-how and other unpatented proprietary information relating to our product development and manufacturing activities to provide us with competitive advantages. We protect this information by entering into confidentiality agreements with our employees, consultants, strategic partners and other third parties. We also design our computer networks and implement various procedures to restrict unauthorized access to our proprietary information.
We face internal and external data security threats. Current, departing or former employees or third parties could attempt to improperly use or access our computer systems and networks to copy, obtain, or misappropriate our proprietary information or otherwise interrupt our business. Like others, we are also subject to significant system or network disruptions from numerous causes, including computer viruses and other cyber-attacks, facility access issues, new system implementations and energy blackouts.
Security breaches, computer malware, phishing, spoofing, and other cyber-attacks have become more prevalent and sophisticated in recent years. While we defend against these threats on a daily basis, we do not believe that such attacks to date have caused us any material damage. Because the techniques used by computer hackers and others to access or sabotage networks constantly evolve and generally are not recognized until launched against a target, we may be unable to anticipate, counter or ameliorate all of these techniques. As a result, our and our customers' proprietary information may be misappropriated and the impact of any future incident cannot be predicted. Any loss of such information could harm our competitive position, result in a loss of customer confidence in the adequacy of our threat mitigation and detection processes and procedures, or cause us to incur significant costs to remedy the damages caused by the incident. We routinely implement improvements to our network security safeguards and we are devoting increasing resources to the security of our information technology systems. We cannot, however, assure that such system improvements will be sufficient to prevent or limit the damage from any future cyber-attack or network disruptions.
The costs related to cyber-attacks or other security threats or computer systems disruptions typically would not be fully insured or indemnified by others. Occurrence of any of the events described above could result in loss of competitive advantages derived from our R&D efforts or our IP. Moreover, these events may result in the early obsolescence of our products, product development delays, or diversion of the attention of management and key information technology and other resources, or otherwise adversely affect our internal operations and reputation or degrade our financial results and stock price.
We may be subject to theft, loss, or misuse of personal data by or about our employees, customers or other third parties, which could increase our expenses, damage our reputation, or result in legal or regulatory proceedings.
In the ordinary course of our business, we have access to sensitive, confidential or personal data or information regarding our employees and others that is subject to privacy and security laws and regulations. The theft, loss, or misuse of personal data collected, used, stored, or transferred by us to run our business, or by our third party service providers, including business process software applications providers and other vendors that have access to sensitive data, could result in damage to our reputation, disruption of our business activities, significantly increased business and security costs or costs related to defending legal claims.
Global privacy legislation, enforcement, and policy activity in this area are rapidly expanding and creating a complex regulatory compliance environment. For example, the European Union adopted the General Data Protection Regulation ("GDPR"), which requires companies to meet new requirements beginning in May 2018 regarding the handling of personal data, including its use, protection and the ability of persons whose data is stored to correct or delete such data about themselves. Failure to meet GDPR requirements could result in penalties of up to 4% of worldwide revenue. In addition, the interpretation and application of consumer and data protection laws in the U.S., Europe and elsewhere are often uncertain and fluid, and may be interpreted and applied in a manner that is inconsistent with our data practices. Complying with these changing laws has caused, and could continue to cause, us to incur substantial costs, which could have an adverse effect on our business and results of operations. Further, failure to comply with existing or new rules may result in significant penalties or orders to stop the alleged non-compliant activity. Finally, even our inadvertent failure to comply with federal, state, or international privacy-
25
related or data protection laws and regulations could result in proceedings against us by governmental entities or others.
We are subject to warranty claims, product recalls and product liability.
From time to time, we may be subject to warranty or product liability claims that could lead to significant expense. We may also be exposed to such claims as a result of any acquisition we may undertake in the future. Although we maintain reserves for reasonably estimable liabilities and purchase product liability insurance, we may elect to self-insure with respect to certain matters and our reserves may be inadequate to cover the uninsured portion of such claims.
Product liability insurance is subject to significant deductibles and such insurance may be unavailable or inadequate to protect against all claims. If one of our customers recalls a product containing one of our devices, we may incur significant costs and expenses, including replacement costs, direct and indirect product recall-related costs, diversion of technical and other resources and reputational harm. Our customer contracts typically contain warranty and indemnification provisions, and in certain cases may also contain liquidated damages provisions, relating to product quality issues. The potential liabilities associated with such provisions are significant, and in some cases, including in agreements with some of our largest end customers, are potentially unlimited. Any such liabilities may greatly exceed any revenue we receive from sale of the relevant products. Costs, payments or damages incurred or paid by us in connection with warranty and product liability claims and product recalls could materially and adversely affect our financial condition and results of operations.
We are subject to risks associated with environmental, health and safety regulations and climate change.
We are subject to a broad array of U.S. and foreign environmental, health and safety laws and regulations. These laws and regulations include those related to the use, transportation, storage, handling, emission, discharge and recycling or disposal of hazardous materials used in our manufacturing, assembly and testing processes. Our failure to comply with any of these existing or future laws or regulations could result in:
• | regulatory penalties and fines; |
• | legal liabilities, including financial responsibility for remedial measures if our properties are contaminated; |
• | expenses to secure required permits and governmental approvals; |
• | reputational damage; |
• | suspension or curtailment of our manufacturing, assembly and test processes; and |
• | increased costs to acquire pollution abatement or remediation equipment or to modify our equipment, facilities or manufacturing processes to bring them into compliance with applicable laws and regulations. |
Existing and future environmental laws and regulations could also impact our product designs and limit or restrict the materials or components that are included in our products. In addition, many of our largest end customers require us to comply with corporate social responsibility policies, which often include employment, health, safety, environmental and other requirements that exceed applicable legal requirements. Compliance with these policies increases our operating expenses and non-compliance can adversely affect customer relationships and harm our business.
New climate change laws and regulations could require us to change our manufacturing processes or procure substitute raw materials that may cost more or be more difficult to procure. In addition, new restrictions on emissions of carbon dioxide or other greenhouse gases could result in increased costs for us and our suppliers. Various jurisdictions are developing other climate change-based regulations that also may increase our expenses and adversely affect our operating results. We expect increased worldwide regulatory activity relating to climate change in the future. Future compliance with these laws and regulations may adversely affect our business and results of operations.
26
Compliance with regulations regarding the use of “conflict minerals” could limit the supply and increase the cost of certain metals used in manufacturing our products.
Regulations in the U.S. currently require that we determine whether certain materials used in our products, referred to as conflict minerals, originated in the Democratic Republic of the Congo or adjoining countries, or were from recycled or scrap sources. The verification and reporting requirements could affect the sourcing and availability of minerals that are used in the manufacture of our products. We have incurred costs and expect to incur additional costs associated with complying with these requirements. Additionally, we may face reputational challenges with our customers and other stakeholders if we are unable to sufficiently verify the origins of all minerals used in our products through the due diligence procedures that we implement. We may also face challenges with government regulators and our customers and suppliers if we are unable to sufficiently make any required determination that the metals used in our products are conflict free.
Our certificate of incorporation and bylaws and the General Corporation Law of the State of Delaware may discourage takeovers and business combinations that our stockholders might consider to be in their best interests.
Certain provisions in our amended and restated certificate of incorporation and amended and restated bylaws may have the effect of delaying, deterring, preventing or rendering more difficult a change in control of Qorvo that our stockholders might consider to be in their best interests. These provisions include:
• | granting to the board of directors sole power to set the number of directors and fill any vacancy on the board of directors, whether such vacancy occurs as a result of an increase in the number of directors or otherwise; |
• | the ability of the board of directors to designate and issue one or more series of preferred stock without stockholder approval, the terms of which may be determined at the sole discretion of the board of directors; |
• | the inability of stockholders to call special meetings of stockholders; |
• | establishment of advance notice requirements for stockholder proposals and nominations for election to the board of directors at stockholder meetings; and |
• | the inability of stockholders to act by written consent. |
In addition, the General Corporation Law of the State of Delaware contains provisions that regulate “business combinations” between corporations and interested stockholders who own 15% or more of the corporation’s voting stock, except under certain circumstances. These provisions could also discourage potential acquisition proposals and delay or prevent a change in control.
These provisions may prevent our stockholders from receiving the benefit of any premium to the market price of our common stock offered by a bidder in a takeover context, and may also make it more difficult for a third party to replace directors on our board of directors. Further, the existence of these provisions may adversely affect the prevailing market price of our common stock if they are viewed as discouraging takeover attempts in the future.
Our operating results could vary as a result of the methods, estimates and judgments we use in applying our accounting policies.
The methods, estimates and judgments we use in applying our accounting policies have a significant impact on our results of operations (see "Critical Accounting Policies and Estimates" in Part II, Item 7 of this report). Such methods, estimates and judgments are, by their nature, subject to substantial risks, uncertainties and assumptions, and factors may arise over time that lead us to change our methods, estimates and judgments that could significantly affect our results of operations.
Decisions we make about the scope of our future operations could affect our future financial results.
From time to time, changes in the business environment have led us to change the scope of our operations or business, which has resulted in restructuring and asset impairment charges, and this could occur in the future. The
27
amount and timing of such charges can be difficult to predict. Factors that contribute to the amount and timing of such charges include:
• | the timing and execution of plans and programs that are subject to local labor law requirements, including consultation with appropriate work councils; |
• | changes in assumptions related to severance and post-retirement costs; |
• | the timing of future divestitures and the amount and type of proceeds realized from such divestitures; and |
• | changes in the fair value of certain long-lived assets and goodwill. |
Changes in our effective tax rate may impact our results of operations.
We are subject to taxation in China, Germany, Singapore, the U.S. and numerous other foreign taxing jurisdictions. Our effective tax rate is subject to fluctuations as it is impacted by a number of factors, including the following:
• | changes in our overall profitability and the amount of profit determined to be earned and taxed in jurisdictions with differing statutory tax rates; |
• | the resolution of issues arising from tax audits with various tax authorities, including those described in Note 12 of the Notes to the Consolidated Financial Statements set forth in Part II, Item 8 of this report; |
• | changes in the valuation of either our gross deferred tax assets or gross deferred tax liabilities; |
• | adjustments to income taxes upon finalization of various tax returns; |
• | changes in expenses not deductible for tax purposes; |
• | changes in available tax credits; |
• | changes in tax laws or the interpretation of such tax laws, and changes in generally accepted accounting principles; and |
• | a future decision to repatriate non-U.S. earnings for which we have not previously provided country withholding taxes incurred upon repatriation. |
Any significant increase in our future effective tax rates could reduce net income for future periods.
Changes in the favorable tax status of our subsidiaries in Costa Rica and Singapore would have an adverse impact on our operating results.
Our subsidiaries in Costa Rica and Singapore have been granted tax holidays that effectively minimize our tax expense and that are expected to be effective through March 2024 and December 2021, respectively. In their efforts to deal with budget deficits, governments around the world are focusing on increasing tax revenues through increased audits and, potentially, increased tax rates for corporations. As part of this effort, governments continue to review their policies on granting tax holidays. In February 2017, Singapore enacted legislation that will exclude from our existing Development and Expansion Incentive grant the benefit of the reduced tax rate for Intellectual Property income earned after June 30, 2021. Future changes in the status of either tax holiday could have a negative effect on our net income in future years.
The impact of new U.S. tax legislation is uncertain and could have a material adverse impact on our cash flows and results of operations.
On December 22, 2017, the U.S. enacted comprehensive tax legislation, commonly referred to as the Tax Cuts and Jobs Act (the "Tax Act"), which includes a number of changes to U.S. tax laws that impact us, including a reduction in the U.S. federal corporate tax rate from 35% to 21%, a one-time mandatory deemed repatriation tax on earnings of certain foreign subsidiaries that were previously tax deferred, and a new minimum tax on certain foreign earnings.
28
Based on our current analysis of the changes enacted by the Tax Act, it will continue to have a significant impact on our results of operations.
The Tax Act requires complex computations to be performed that were not previously required under U.S. tax law, significant judgments to be made in interpretation of the provisions of the Tax Act, significant estimates in calculations, and the preparation and analysis of information not previously relevant or regularly produced. The United States Treasury Department, the Internal Revenue Service, and other standard-setting bodies could interpret or issue guidance on how provisions of the Tax Act will be applied or otherwise administered that is different from our initial interpretation. As we complete our analysis of the Tax Act, review all information, collect and prepare necessary data, and interpret any additional guidance, we may adjust the initial provisional amounts that we have recorded, which could have a material adverse effect on our results of operations or financial condition.
The Organisation for Economic Co-operation and Development Base Erosion and Profit Shifting initiative on tax policy and enacted laws in the countries in which we operate could increase our tax obligations.
Many countries are beginning to implement legislation and other guidance to align their international tax rules with the Organisation for Economic Co-operation’s Base Erosion and Profit Shifting recommendations and action plan, which aim to standardize and modernize global corporate tax policy, including changes to cross-border tax, transfer pricing documentation rules, and nexus-based tax incentive practices. If these changes are adopted by countries in which we do business, our tax obligations in these countries could increase. Furthermore, as a result of the heightened scrutiny of corporate taxation policies, prior decisions by tax authorities regarding treatments and positions of corporate income taxes could be subject to enforcement activities, and legislative investigation and inquiry, which could also result in changes in tax policies or prior tax rulings. Any such changes in policies or rulings may also increase our effective tax rate or result in the taxes we previously paid being subject to change, which may harm our financial position and results of operations.
ITEM 1B. UNRESOLVED STAFF COMMENTS.
None.
ITEM 2. PROPERTIES.
Our corporate headquarters (leased) and our MP headquarters (owned) are in Greensboro, North Carolina, where we also have a six-inch wafer production facility (owned), a design and prototyping facility (leased) and other leased office space to perform certain test and design operations. Our IDP headquarters is in Richardson, Texas (leased) and includes office space and design operations. We also have wafer fabrication facilities in Richardson, Texas (owned) and Farmers Branch, Texas (owned). In Hillsboro, Oregon, we have a single facility (owned) that includes office space and a wafer fabrication facility. We also have wafer fabrication facilities in Apopka, Florida (owned) and Bend, Oregon (leased).
We have module assembly and test facilities in Beijing, China (the building is owned and we hold a land-use right for the land) and Dezhou, China (the building is leased and we hold a land-use right for the land). In the fourth quarter of fiscal 2018, we signed a definitive lease for an additional manufacturing facility in Beijing, China, where we expect to start production beginning in fiscal 2020. We have a filter assembly and test facility in Heredia, Costa Rica (owned). We also have an assembly and test site in Richardson, Texas (owned) for custom products for our aerospace and defense business and a packaging and test facility in Nuremberg, Germany (leased).
We maintain numerous design centers and sales and customer support centers in leased offices located throughout Asia, Europe and North America.
We believe our properties have been well-maintained, are in sound operating condition and contain all equipment and facilities necessary to operate at present levels. While we believe all our facilities are suitable and adequate for our present purposes, we continually evaluate our business and facilities and may decide to expand, add or dispose of facilities in the future. We do not identify or allocate assets by operating segment. For information on long-lived tangible assets by country, see Note 16 of the Notes to the Consolidated Financial Statements in Part II, Item 8 of this report.
29
ITEM 3. LEGAL PROCEEDINGS.
See the information under the heading "Legal Matters" in Note 10 of the Notes to the Consolidated Financial Statements set forth in Part II, Item 8 of this report.
ITEM 4. MINE SAFETY DISCLOSURES.
Not Applicable.
PART II
ITEM 5. MARKET FOR REGISTRANT'S COMMON EQUITY, RELATED STOCKHOLDER MATTERS AND ISSUER PURCHASES OF EQUITY SECURITIES.
Our common stock is traded on the Nasdaq Global Select Market under the symbol "QRVO." The table below shows the high and low sales prices of our common stock for each of the quarters in the fiscal years ended March 31, 2018 and April 1, 2017, as reported by The Nasdaq Stock Market LLC. As of May 11, 2018, there were 775 holders of record of our common stock. This number does not include the beneficial owners of unexchanged stock certificates related to the Business Combination or the additional beneficial owners of our common stock who held their shares in street name as of that date.
High | Low | ||||||
Fiscal Year Ended March 31, 2018 | |||||||
First Quarter | $ | 79.34 | $ | 63.03 | |||
Second Quarter | 76.47 | 62.68 | |||||
Third Quarter | 81.20 | 64.53 | |||||
Fourth Quarter | 86.84 | 65.56 | |||||
High | Low | ||||||
Fiscal Year Ended April 1, 2017 | |||||||
First Quarter | $ | 58.30 | $ | 43.79 | |||
Second Quarter | 64.80 | 50.45 | |||||
Third Quarter | 59.12 | 48.28 | |||||
Fourth Quarter | 69.71 | 52.12 | |||||
We have never declared or paid cash dividends on our common stock. Although we currently intend to retain our earnings for use in our business and to repurchase our common stock, our future dividend policy with respect to our common stock may change and will depend on our earnings, capital requirements, debt covenants and other factors deemed relevant by our Board of Directors.
30
PERFORMANCE GRAPH
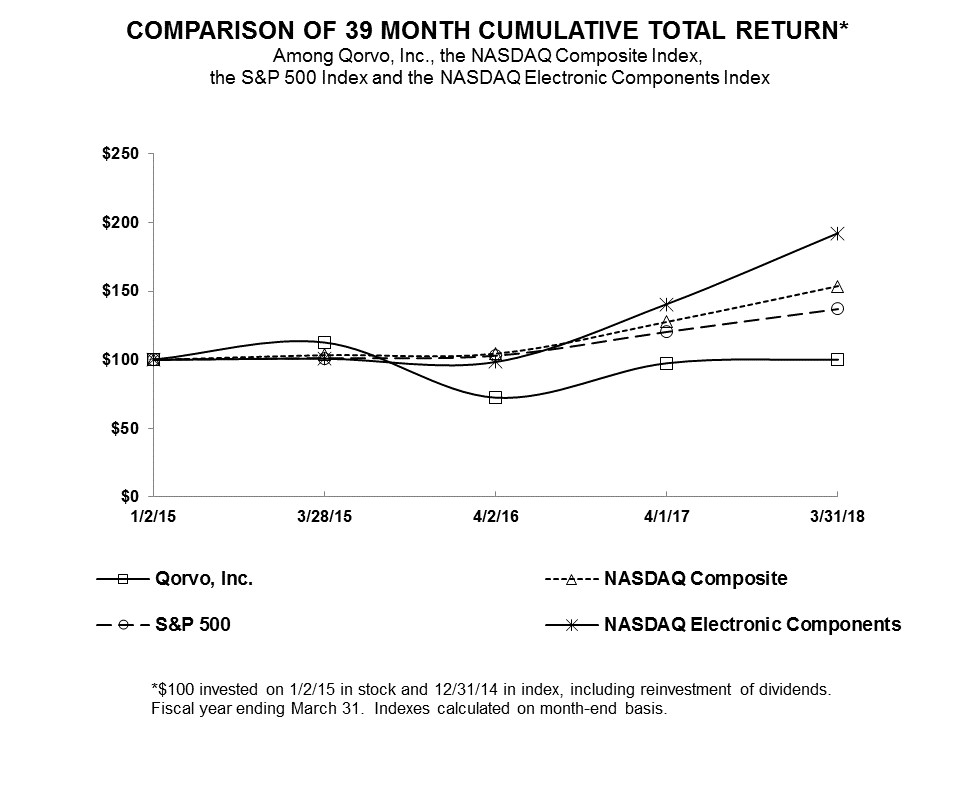
January 2, 2015 | March 28, 2015 | April 2, 2016 | April 1, 2017 | March 31, 2018 | |
Total Return Index for: | |||||
Qorvo, Inc. | 100.00 | 112.61 | 72.19 | 97.39 | 100.07 |
Nasdaq Composite | 100.00 | 103.60 | 104.64 | 127.64 | 153.56 |
S&P 500 | 100.00 | 100.95 | 102.75 | 120.39 | 137.24 |
Nasdaq Electronic Components | 100.00 | 100.94 | 98.56 | 140.56 | 191.99 |
Notes:
A. The index level for all series assumes that $100.00 was invested in our common stock and each index on January 2, 2015, the registration date of our common stock under Rule 12g-3(c) of the Exchange Act.
B. | The lines represent monthly index levels derived from compounded daily returns, assuming reinvestment of all dividends. |
C. | The indexes are reweighted daily using the market capitalization on the previous trading day. |
D. | If the month end is not a trading day, the preceding trading day is used. |
E. | Qorvo, Inc. was added to the S&P 500 Index on June 12, 2015. |
31
Purchases of Equity Securities
Period | Total number of shares purchased (in thousands) | Average price paid per share | Total number of shares purchased as part of publicly announced plans or programs (in thousands) | Approximate dollar value of shares that may yet be purchased under the plans or programs | ||||||||
December 31, 2017 to January 27, 2018 | — | $ | — | — | $213.1 million | |||||||
January 28, 2018 to February 24, 2018 | — | $ | — | — | $213.1 million | |||||||
February 25, 2018 to March 31, 2018 | 615 | $ | 82.87 | 615 | $162.1 million | |||||||
Total | 615 | $ | 82.87 | 615 | $162.1 million | |||||||
On November 3, 2016, our Board of Directors authorized a share repurchase program to repurchase up to $500.0 million of our outstanding stock. Under this program, share repurchases are made in accordance with applicable securities laws on the open market or in privately negotiated transactions. The extent to which we repurchase our shares, the number of shares and the timing of any repurchases will depend on general market conditions, regulatory requirements, alternative investment opportunities and other considerations. The program does not require us to repurchase a minimum number of shares, does not have a fixed term, and may be modified, suspended or terminated at any time without prior notice. See Note 15 of the Notes to the Consolidated Financial Statements set forth in Part II, Item 8 of this report for a further discussion of our share repurchase program.
32
ITEM 6. SELECTED FINANCIAL DATA.
The selected financial data set forth below for the fiscal years indicated were derived from our audited consolidated financial statements. The information should be read in conjunction with our consolidated financial statements and with "Management’s Discussion and Analysis of Financial Condition and Results of Operations" appearing in Item 7 of this report.
Fiscal Year | ||||||||||||||||||||
2018 | 2017 | 2016 | 2015 | (2) | 2014 | |||||||||||||||
(In thousands, except per share data) | ||||||||||||||||||||
Revenue | $ | 2,973,536 | $ | 3,032,574 | $ | 2,610,726 | $ | 1,710,966 | $ | 1,148,231 | ||||||||||
Operating costs and expenses: | ||||||||||||||||||||
Cost of goods sold | 1,826,570 | 1,897,062 | 1,561,173 | 1,021,658 | 743,304 | |||||||||||||||
Research and development | 445,103 | 470,836 | 448,763 | 257,494 | 197,269 | |||||||||||||||
Selling, general and administrative | 527,751 | 545,588 | 534,099 | 249,886 | 151,404 | |||||||||||||||
Other operating expense | 103,830 | (13) | 31,029 | (10) | 54,723 | (6) | 59,462 | (3) | 28,913 | (1) | ||||||||||
Total operating costs and expenses | 2,903,254 | 2,944,515 | 2,598,758 | 1,588,500 | 1,120,890 | |||||||||||||||
Income from operations | 70,282 | 88,059 | 11,968 | 122,466 | 27,341 | |||||||||||||||
Interest expense | (59,548 | ) | (14) | (58,879 | ) | (11) | (23,316 | ) | (7) | (1,421 | ) | (5,983 | ) | |||||||
Interest income | 7,017 | 1,212 | 2,068 | 450 | 179 | |||||||||||||||
Other (expense) income | (606 | ) | (3,087 | ) | 6,418 | (254 | ) | 2,336 | ||||||||||||
Income (loss) before income taxes | 17,145 | 27,305 | (2,862 | ) | 121,241 | 23,873 | ||||||||||||||
Income tax (expense) benefit | (57,433 | ) | (15) | (43,863 | ) | (12) | (25,983 | ) | (8) | 75,062 | (4) | (11,231 | ) | |||||||
Net (loss) income | $ | (40,288 | ) | $ | (16,558 | ) | $ | (28,845 | ) | $ | 196,303 | $ | 12,642 | |||||||
Net (loss) income per share: | ||||||||||||||||||||
Basic | $ | (0.32 | ) | $ | (0.13 | ) | $ | (0.20 | ) | $ | 2.17 | $ | 0.18 | |||||||
Diluted | $ | (0.32 | ) | $ | (0.13 | ) | $ | (0.20 | ) | $ | 2.11 | $ | 0.18 | |||||||
Weighted average shares of common stock outstanding | ||||||||||||||||||||
Basic | 126,946 | 127,121 | 141,937 | 90,477 | 70,499 | |||||||||||||||
Diluted | 126,946 | 127,121 | 141,937 | 93,211 | 72,019 | |||||||||||||||
As of Fiscal Year End | ||||||||||||||||||||
2018 | 2017 | 2016 | 2015 | (2) | 2014 | |||||||||||||||
Cash and cash equivalents | $ | 926,037 | $ | 545,463 | $ | 425,881 | $ | 299,814 | $ | 171,898 | ||||||||||
Short-term investments | — | — | 186,808 | 244,830 | 72,067 | |||||||||||||||
Working capital | 1,402,526 | 1,042,777 | 1,135,409 | (9) | 1,174,795 | 317,445 | ||||||||||||||
Total assets | 6,381,519 | 6,522,323 | 6,596,819 | 6,892,379 | (5) | 920,312 | ||||||||||||||
Long-term debt and capital lease obligations, less current portion | 983,290 | 989,154 | 988,130 | (7) | — | 18 | ||||||||||||||
Stockholders' equity | 4,775,564 | 4,896,722 | 4,999,672 | 6,173,160 | 676,351 | |||||||||||||||
1 Other operating expense for fiscal 2014 includes the impairment of intangible assets of $11.3 million and restructuring expenses of $11.1 million, as well as acquisition-related expenses of $5.1 million.
2 As a result of the Business Combination, which was completed on January 1, 2015, fiscal 2015 results include the results of TriQuint as of March 28, 2015 and for the period of January 1, 2015 through March 28, 2015.
3 Other operating expense for fiscal 2015 includes acquisition and integration-related expenses of $43.5 million and restructuring expenses of $12.4 million.
33
4 Income tax benefit for fiscal 2015 includes the effects of the income tax benefit generated by the reduction in the valuation allowance against domestic deferred tax assets.
5 Total assets for fiscal 2015 include goodwill and intangible assets totaling approximately $4,430.7 million associated with the Business Combination.
6 Other operating expense for fiscal 2016 includes integration-related expenses of $26.5 million and restructuring expenses of $10.2 million (see Note 6 and Note 11 of the Notes to the Consolidated Financial Statements set forth in Part II, Item 8 of this report).
7 During fiscal 2016, we issued the Notes and recorded $25.8 million of related interest expense, which was offset by $5.2 million of capitalized interest (see Note 8 of the Notes to the Consolidated Financial Statements set forth in Part II, Item 8 of this report).
8 Income tax expense for fiscal 2016 includes the effects of the income tax expense generated by the increase in the valuation allowance against domestic state deferred tax assets (see Note 12 of the Notes to the Consolidated Financial Statements set forth in Part II, Item 8 of this report).
9 ASU 2015-17 "Balance Sheet Classification of Deferred Taxes" was adopted in fiscal 2016, prospectively, which required deferred tax assets and deferred tax liabilities to be presented as non-current in a classified balance sheet. Prior periods presented were not retrospectively adjusted (see Note 12 of the Notes to the Consolidated Financial Statements set forth in Part II, Item 8 of this report).
10 Other operating expense for fiscal 2017 includes integration-related expenses of $16.9 million and restructuring expenses of $2.1 million (see Note 6 and Note 11 of the Notes to the Consolidated Financial Statements set forth in Part II, Item 8 of this report).
11 During fiscal 2017, we recorded $69.9 million of interest expense related to the Notes, which was offset by $13.6 million of capitalized interest (see Note 8 of the Notes to the Consolidated Financial Statements set forth in Part II, Item 8 of this report).
12 Income tax expense for fiscal 2017 includes the effects of the increase in our unrecognized tax benefits and the unfavorable impact of losses arising in countries with low tax rates (see Note 12 of the Notes to the Consolidated Financial Statements set forth in Part II, Item 8 of this report).
13 Other operating expense for fiscal 2018 includes integration-related expenses of $6.2 million and restructuring expenses of $67.7 million (see Note 6 and Note 11 of the Notes to the Consolidated Financial Statements set forth in Part II, Item 8 of this report).
14 During fiscal 2018, we recorded $70.5 million of interest expense primarily related to the Notes, which was offset by $13.6 million of capitalized interest (see Note 8 of the Notes to the Consolidated Financial Statements set forth in Part II, Item 8 of this report).
15 Income tax expense for fiscal 2018 includes the effects from the enactment of the Tax Act, including the one-time transition tax on certain unrepatriated earnings of foreign subsidiaries (the "Transitional Repatriation Tax") expense, which was partially offset by the benefit from remeasuring deferred taxes for the decrease in the U.S. corporate tax rate from 35% to 21% (see Note 12 of the Notes to the Consolidated Financial Statements set forth in Part II, Item 8 of this report).
34
ITEM 7. MANAGEMENT’S DISCUSSION AND ANALYSIS OF FINANCIAL CONDITION AND RESULTS OF OPERATIONS.
This Annual Report on Form 10-K includes "forward-looking statements" within the meaning of the safe harbor provisions of the Private Securities Litigation Reform Act of 1995. These forward-looking statements include, but are not limited to, statements about our plans, objectives, representations and contentions, and are not historical facts and typically are identified by use of terms such as "may," "will," "should," "could," "expect," "plan," "anticipate," "believe," "estimate," "predict," "potential," "continue" and similar words, although some forward-looking statements are expressed differently. You should be aware that the forward-looking statements included herein represent management's current judgment and expectations, but our actual results, events and performance could differ materially from those expressed or implied by forward-looking statements. We do not intend to update any of these forward-looking statements or publicly announce the results of any revisions to these forward-looking statements, other than as is required under U.S. federal securities laws. Our business is subject to numerous risks and uncertainties, including those relating to fluctuations in our operating results, our dependence on a few large customers for a substantial portion of our revenue, a loss of revenue if contracts with the United States government or defense and aerospace contractors are canceled or delayed, our ability to implement innovative technologies, our ability to bring new products to market and achieve design wins, the efficient and successful operation of our wafer fabrication and other facilities, our ability to adjust production capacity in a timely fashion in response to changes in demand for our products, variability in manufacturing yields, industry overcapacity, inaccurate product forecasts and corresponding inventory and manufacturing costs, dependence on third parties, our dependence on international sales and operations, our ability to attract and retain skilled personnel and develop leaders, the possibility that future acquisitions may dilute our stockholders’ ownership and cause us to incur debt and assume contingent liabilities, fluctuations in the price of our common stock, our ability to protect our intellectual property, claims of intellectual property infringement and other lawsuits, security breaches and other similar disruptions compromising our information, and the impact of government and stringent environmental regulations. These and other risks and uncertainties, which are described in more detail under Item 1A, "Risk Factors" in this Annual Report on Form 10-K and in other reports and statements that we file with the SEC, could cause actual results and developments to be materially different from those expressed or implied by any of these forward-looking statements.
The following discussion should be read in conjunction with, and is qualified in its entirety by reference to, our audited consolidated financial statements, including the notes thereto.
OVERVIEW
Company
On February 22, 2014, RFMD and TriQuint entered into the Merger Agreement, which provided for the combination of RFMD and TriQuint in a merger of equals and resulted in the Business Combination under a new holding company named Qorvo, Inc. The transactions contemplated by the Merger Agreement were consummated on January 1, 2015.
Qorvo® is a product and technology leader at the forefront of the growing global demand for always-on broadband connectivity. We combine a broad portfolio of RF solutions, highly differentiated semiconductor technologies, deep systems-level expertise and scale manufacturing to supply a diverse group of customers in expanding markets, including smartphones and other mobile devices, defense and aerospace, Wi-Fi customer premises equipment, cellular base stations, optical networks, automotive connectivity, and smart home applications. Within these markets, our products enable a broad range of leading-edge applications – from very-high-power wired and wireless infrastructure solutions to ultra-low-power smart home solutions. Our products and technologies help transform how people around the world access their data, transact commerce, and interact with their communities.
Qorvo employs more than 8,300 people. We have world-class manufacturing facilities, and our fabrication facility in Richardson, Texas, is a U.S. DoD-accredited ‘Trusted Source’ (Category 1A) for GaAs, GaN and BAW technologies. Our design and manufacturing expertise covers many semiconductor process technologies, which we source both internally and through external suppliers. Our primary wafer fabrication facilities are in Florida, North Carolina, Oregon and Texas, and our primary assembly and test facilities are in China, Costa Rica, Germany and Texas. We also operate design, sales and manufacturing facilities throughout Asia, Europe and North America.
35
Business Segments
We design, develop, manufacture and market our products to leading U.S. and international OEMs and ODMs in the following operating segments:
• | Mobile Products (MP) - MP is a leading global supplier of cellular RF and Wi-Fi solutions into a variety of mobile devices, including smartphones, notebook computers, wearables, tablets, and cellular-based applications for the IoT. Mobile device manufacturers and mobile network operators are adopting new technologies to address the growing demand for data-intensive, increasingly cloud-based distributed applications and for mobile devices with smaller form factors, improved signal quality, less heat and longer talk and standby times. New wireless communications standards are being deployed to utilize available spectrum more efficiently. Carrier aggregation is being implemented to support wider bandwidths, increase data rates and improve network performance. These trends increase the complexity of smartphones, require more RF content and place a premium on performance, integration, systems-level expertise, and product and technology portfolio breadth, all of which are MP strengths. We offer a comprehensive product portfolio of BAW and SAW filters, PAs, LNAs, switches, multimode multi-band PAs and transmit modules, RF power management ICs, diversity receive modules, antenna switch modules, antenna tuning and control solutions, modules incorporating PADs and modules incorporating S-PADs. |
• | Infrastructure and Defense Products (IDP) - IDP is a leading global supplier of RF solutions with a diverse portfolio of solutions that "connect and protect," spanning communications and defense applications. These applications include high performance defense systems such as radar, electronic warfare and communication systems, Wi-Fi customer premises equipment for home and work, high speed connectivity in LTE and 5G base stations, cloud connectivity via data center communications and telecom transport, automotive connectivity and other IoT, including smart home solutions. Our IDP products include GaAs and GaN PAs, LNAs, switches, CMOS system-on-a-chip solutions, premium BAW and SAW filter solutions and various multi-chip and hybrid assemblies. |
As of March 31, 2018, our reportable segments are MP and IDP. These business segments are based on the organizational structure and information reviewed by our Chief Executive Officer, who is our chief operating decision maker ("CODM"), and are managed separately based on the end markets and applications they support. The CODM allocates resources and evaluates the performance of each operating segment primarily based on operating income and operating income as a percentage of revenue. For financial information about the results of our operating segments for each of the last three fiscal years, see Note 16 of the Notes to the Consolidated Financial Statements set forth in Part II, Item 8 of this report.
Fiscal 2018 Management Summary
• | Our revenue decreased 1.9% in fiscal 2018 to $2,973.5 million compared to $3,032.6 million in fiscal 2017, primarily due to lower demand for our cellular RF solutions in support of customers based in China, partially offset by higher demand for our defense and aerospace and Wi-Fi products as well as higher demand for our cellular RF solutions in support of our largest end customer. |
• | Our gross margin for fiscal 2018 was 38.6% compared to 37.4% for fiscal 2017. Gross margin was positively impacted by improved manufacturing and test yields on certain high-volume products, lower depreciation, favorable changes in product mix within our cellular RF solutions and growth in demand for our IDP products. This increase in gross margin was partially offset by lower factory utilization, average selling price erosion and higher intangible amortization. |
• | Our operating income was $70.3 million in fiscal 2018 compared to $88.1 million in fiscal 2017. This decrease was primarily due to one-time restructuring charges, partially offset by lower personnel-related costs as well as cost savings resulting from restructuring initiatives described below and ongoing efforts to optimize our product portfolio. |
• | During fiscal 2018, we initiated restructuring actions to improve operating efficiencies. As a result of these actions, we recorded approximately $18.3 million of employee termination benefits and adjusted the carrying value of certain held for sale assets located in China and the U.S. to fair market value (resulting in impairment charges totaling approximately $46.3 million). |
36
• | Our net loss per diluted share was $0.32 for fiscal 2018 as compared to net loss per diluted share of $0.13 for fiscal 2017. |
• | We generated positive cash flow from operations of $852.5 million for fiscal 2018 as compared to $776.8 million for fiscal 2017. This year-over-year increase was primarily due to changes in working capital. The Tax Act did not have an impact on our fiscal 2018 cash flows from operating activities. |
• | Capital expenditures totaled $269.8 million in fiscal 2018, as compared to $552.7 million in fiscal 2017. The comparable prior year period expenditures were related to projects that increased premium filter capacity and manufacturing cost saving initiatives. |
• | The Tax Act, enacted during the third quarter of fiscal 2018, lowers the U.S. federal corporate income tax rate from 35% to 21% as of January 1, 2018, and implements a territorial tax system that will allow the repatriation of future foreign earnings without incurring additional U.S. federal income tax. This tax law change resulted in a provisional tax benefit of $39.1 million to reduce the U.S. deferred tax assets and liabilities and a provisional tax expense of $116.4 million for a one-time transitional deemed repatriation of our historical unremitted foreign earnings. |
• | During fiscal 2018, we repurchased approximately 2.9 million shares of our common stock for approximately $219.9 million. |
RESULTS OF OPERATIONS
Consolidated
The following table presents a summary of our results of operations for fiscal years 2018, 2017 and 2016:
2018 | 2017 | 2016 | |||||||||||||||||||
(In thousands, except percentages) | Dollars | % of Revenue | Dollars | % of Revenue | Dollars | % of Revenue | |||||||||||||||
Revenue | $ | 2,973,536 | 100.0 | % | $ | 3,032,574 | 100.0 | % | $ | 2,610,726 | 100.0 | % | |||||||||
Cost of goods sold | 1,826,570 | 61.4 | 1,897,062 | 62.6 | 1,561,173 | 59.8 | |||||||||||||||
Gross profit | 1,146,966 | 38.6 | 1,135,512 | 37.4 | 1,049,553 | 40.2 | |||||||||||||||
Research and development | 445,103 | 15.0 | 470,836 | 15.5 | 448,763 | 17.2 | |||||||||||||||
Selling, general, and administrative | 527,751 | 17.7 | 545,588 | 18.0 | 534,099 | 20.4 | |||||||||||||||
Other operating expense | 103,830 | 3.5 | 31,029 | 1.0 | 54,723 | 2.1 | |||||||||||||||
Operating income | $ | 70,282 | 2.4 | % | $ | 88,059 | 2.9 | % | 11,968 | 0.5 | % | ||||||||||
Revenue
Our overall revenue decreased $59.0 million, or 1.9%, in fiscal 2018 as compared to fiscal 2017, primarily due to lower demand for our cellular RF solutions in support of customers based in China, partially offset by higher demand for our defense and aerospace and Wi-Fi products as well as higher demand for our cellular RF solutions in support of our largest end customer.
Our overall revenue increased $421.8 million, or 16.2%, in fiscal 2017 as compared to fiscal 2016, primarily due to higher demand for our cellular RF solutions in support of marquee smartphones and customers based in China and higher sales of our wireless infrastructure, defense and aerospace and Wi-Fi products.
We provided our products to our largest end customer, Apple, through sales to multiple contract manufacturers, which in the aggregate accounted for 36%, 34% and 37% of total revenue in fiscal years 2018, 2017 and 2016, respectively. Huawei accounted for approximately 8%, 11% and 12% of our total revenue in fiscal years 2018, 2017
37
and 2016, respectively. These customers primarily purchase cellular RF and Wi-Fi solutions offered by our MP segment for a variety of mobile devices, including smartphones, notebook computers, wearables, tablets and cellular-based applications for the IoT.
International shipments amounted to $2,449.1 million in fiscal 2018 (approximately 82% of revenue) compared to $2,565.5 million in fiscal 2017 (approximately 85% of revenue) and $2,304.4 million in fiscal 2016 (approximately 88% of revenue). Shipments to Asia totaled $2,329.3 million in fiscal 2018 (approximately 78% of revenue) compared to $2,441.1 million in fiscal 2017 (approximately 81% of revenue) and $2,162.1 million in fiscal 2016 (approximately 83% of revenue). We expect our international and Asia shipments will remain relatively stable at these historical levels.
Gross Margin
Our overall gross margin for fiscal 2018 was 38.6% as compared to 37.4% in fiscal 2017. The increase was primarily due to improved manufacturing and test yields on certain high-volume parts, lower depreciation, favorable changes in product mix within our cellular RF solutions and growth in demand for our IDP products. This increase in gross margin was partially offset by lower factory utilization, average selling price erosion and higher intangible amortization.
Our overall gross margin for fiscal 2017 was 37.4% as compared to 40.2% in fiscal 2016. Gross margin was adversely impacted in fiscal 2017 by an unfavorable change in product mix towards lower margin low-band PAD modules, product cost reductions lagging normal average selling price erosion, lower factory utilization and unfavorable inventory adjustments primarily due to lower than expected manufacturing and assembly yields on the low-band PAD modules in the second quarter of fiscal 2017. The lower yield was associated with the device packaging, not device functionality; however, the impact was significant because the issue was identified late in the production process. These adverse factors were partially offset by lower intangible amortization, stock-based compensation and other costs related to the Business Combination in fiscal 2017 as compared to fiscal 2016.
Operating Expenses
Research and Development
In fiscal 2018, R&D spending decreased $25.7 million, or 5.5%, as compared to fiscal 2017, primarily due to lower personnel-related costs as well as cost savings resulting from the ongoing efforts to optimize our product portfolio and the restructuring actions initiated in fiscal 2018.
In fiscal 2017, R&D spending increased $22.1 million, or 4.9%, as compared to fiscal 2016, primarily driven by costs associated with the design and development of high-performance filter-based products and GaN-based technologies and products. The increased R&D expense was partially offset by lower stock-based compensation expense.
Selling, General and Administrative
In fiscal 2018, selling, general and administrative expense decreased $17.8 million, or 3.3%, as compared to fiscal 2017, primarily due to lower personnel-related costs as well as cost savings resulting from the restructuring actions initiated in fiscal 2018.
In fiscal 2017, selling, general, and administrative expense increased $11.5 million, or 2.2%, as compared to fiscal 2016, primarily due to higher personnel-related costs, partially offset by lower stock-based compensation expense.
Other Operating Expense
In fiscal 2018, other operating expense was $103.8 million. In fiscal 2018, we initiated restructuring actions to improve operating efficiencies, and, as a result of these actions, we recorded approximately $18.3 million of employee termination benefits and adjusted the carrying value of certain held for sale assets located in China and the U.S. to fair market value (resulting in impairment charges totaling approximately $46.3 million, pursuant to Accounting Standards Codification ("ASC") 360, "Property, Plant, and Equipment"). In fiscal 2018, we also recorded integration costs and restructuring costs of $6.2 million and $2.6 million, respectively, associated with the
38
Business Combination, as well as $24.3 million of start-up costs related to new processes and operations in both existing and new facilities.
In fiscal 2017, other operating expense was $31.0 million, including integration costs of $16.9 million and restructuring costs of $2.0 million associated with the Business Combination, as well as $9.7 million of start-up costs related to new processes and operations in both existing and new facilities.
In fiscal 2016, other operating expense was $54.7 million, including integration costs of $26.5 million and restructuring costs of $10.1 million (including stock-based compensation) associated with the Business Combination, as well as $14.1 million of start-up costs related to new processes and operations in both existing and new facilities.
Operating Income
Our overall operating income was $70.3 million for fiscal 2018 as compared to $88.1 million for fiscal 2017. This decrease was primarily due to one-time restructuring charges, partially offset by lower personnel-related costs as well as cost savings resulting from the restructuring initiative and ongoing efforts to optimize our product portfolio.
Our overall operating income was $88.1 million for fiscal 2017 as compared to $12.0 million for fiscal 2016. This increase was primarily due to higher gross profit from higher revenue and lower intangible amortization, stock-based compensation and other costs related to the Business Combination, partially offset by lower gross margin.
Segment Product Revenue, Operating Income and Operating Income as a Percentage of Revenue
Mobile Products
Fiscal Year | ||||||||||||
(In thousands, except percentages) | 2018 | 2017 | 2016 | |||||||||
Revenue | $ | 2,181,161 | $ | 2,384,041 | $ | 2,083,334 | ||||||
Operating income | $ | 549,574 | $ | 554,001 | $ | 591,751 | ||||||
Operating income as a % of revenue | 25.2 | % | 23.2 | % | 28.4 | % | ||||||
MP revenue decreased $202.9 million, or 8.5%, in fiscal 2018 as compared to fiscal 2017 primarily due to lower demand for our cellular RF solutions in support of customers based in China, partially offset by higher demand for our cellular RF solutions in support of our largest end customer.
The increase in MP operating income as a percentage of revenue in fiscal 2018 as compared to fiscal 2017 was primarily due to higher gross margin and lower operating expense. Gross margin increased primarily due to favorable changes in product mix within our cellular RF solutions, lower depreciation and improved manufacturing and test yields on certain high-volume parts. This increase in gross margin was partially offset by average selling price erosion and lower factory utilization. Operating expense decreased primarily due to lower personnel-related costs as well as cost savings resulting from restructuring actions that were initiated during fiscal 2018 to improve operating efficiencies and ongoing efforts to optimize our product portfolio.
MP revenue increased $300.7 million, or 14.4%, in fiscal 2017 as compared to fiscal 2016, primarily due to higher demand for our cellular RF solutions in support of marquee smartphones and customers based in China.
The decrease in MP operating income as a percentage of revenue in fiscal 2017 as compared to fiscal 2016 was primarily due to lower gross margin. Gross margin was adversely impacted in fiscal 2017 by an unfavorable change in product mix towards lower margin low-band PAD modules, product cost reductions lagging normal average selling price erosion, lower factory utilization, and unfavorable inventory adjustments, primarily due to lower than expected manufacturing assembly yields on the low-band PAD modules in the second quarter of fiscal 2017. The lower yield was associated with the device packaging, not device functionality, however, the impact was significant because the issue was identified late in the production process.
39
Infrastructure and Defense Products
Fiscal Year | ||||||||||||
(In thousands, except percentages) | 2018 | 2017 | 2016 | |||||||||
Revenue | $ | 788,495 | $ | 644,653 | $ | 523,512 | ||||||
Operating income | $ | 235,719 | $ | 152,539 | $ | 108,370 | ||||||
Operating income as a % of revenue | 29.9 | % | 23.7 | % | 20.7 | % | ||||||
IDP revenue increased $143.8 million, or 22.3%, in fiscal 2018 as compared to fiscal 2017, primarily due to higher demand for our defense and aerospace and Wi-Fi products.
IDP operating income increased $83.2 million, or 54.5%, in fiscal 2018 as compared to fiscal 2017, primarily due to higher demand for our defense and aerospace and Wi-Fi products.
IDP revenue increased $121.1 million, or 23.1%, in fiscal 2017 as compared to fiscal 2016, primarily due to higher sales of our wireless infrastructure, defense and aerospace and Wi-Fi products.
The increase in IDP operating income as a percentage of revenue in fiscal 2017 as compared to fiscal 2016 was driven by higher gross profit from increased revenue, favorable factory utilization and lower unfavorable inventory adjustments. This increase in gross profit was partially offset by higher personnel-related expenses.
See Note 16 of the Notes to the Consolidated Financial Statements set forth in Part II, Item 8 of this report for a reconciliation of segment operating income to the consolidated operating income for fiscal years 2018, 2017 and 2016.
Change in Estimate
During the first quarter of fiscal 2018, we changed our accounting estimate for the expected useful lives of certain machinery and equipment. We evaluated our current asset base and reassessed the estimated useful lives of certain machinery and equipment in connection with the implementation of several capital projects, including the migration of certain SAW processes from 4-inch to 6-inch toolsets and certain BAW processes from 6-inch to 8-inch toolsets. Based on our ability to re-use equipment across generations of process technologies and historical usage trends, we determined that the expected useful lives for certain machinery and equipment should be increased by up to three years to reflect more closely the estimated economic lives of those assets. This change in estimate was applied prospectively effective for the first quarter of fiscal 2018 and resulted in a decrease in depreciation expense of $59.7 million for fiscal 2018. This decrease in depreciation expense for fiscal 2018 resulted in the following: (1) an increase in income from operations of $47.4 million; (2) an increase in net income of $44.1 million; (3) an improvement in earnings per share of $0.34; and (4) a reduction in inventory of $12.3 million.
OTHER (EXPENSE) INCOME AND INCOME TAXES
Fiscal Year | ||||||||||||
(In thousands) | 2018 | 2017 | 2016 | |||||||||
Interest expense | $ | (59,548 | ) | $ | (58,879 | ) | $ | (23,316 | ) | |||
Interest income | 7,017 | 1,212 | 2,068 | |||||||||
Other (expense) income | (606 | ) | (3,087 | ) | 6,418 | |||||||
Income tax expense | (57,433 | ) | (43,863 | ) | (25,983 | ) | ||||||
Interest expense
We recognized $70.5 million, $69.9 million and $25.8 million of interest expense in fiscal years 2018, 2017 and 2016, respectively, primarily related to the $1.0 billion of senior notes that were issued in the third quarter of fiscal 2016. Interest expense in the preceding table for fiscal years 2018, 2017 and 2016 is net of capitalized interest of $13.6 million, $13.6 million and $5.2 million, respectively.
40
Other (expense) income
Other expense in fiscal 2018 of approximately $0.6 million was related primarily to a net loss from foreign currency offset by a gain on investments. The foreign currency loss was driven primarily by the depreciation of the U.S. dollar against the Euro and Singapore Dollar as well as by the changes in the local currency denominated balance sheet accounts. Other expense in fiscal 2017 of approximately $3.1 million was related primarily to a net loss from foreign currency. The foreign currency loss was driven primarily by the appreciation of the U.S. dollar against the Renminbi as well as by the changes in the local currency denominated balance sheet accounts. In fiscal 2016, we recognized other income primarily due to a gain from the sale of equity securities.
Income tax expense
Income tax expense for fiscal 2018 was $57.4 million, which was primarily comprised of tax expense related to the net $77.3 million provisional impact of the Tax Act, international operations generating pre-tax book income and an increase in gross unrecognized tax benefits, offset by tax benefits related to tax credits and domestic and international operations generating pre-tax book losses. For fiscal 2018, this resulted in an annual effective tax rate of 335.0%.
The impact of the Tax Act resulted in a provisional net tax expense of $77.3 million in fiscal 2018. This was comprised of a provisional transitional repatriation tax expense of $116.4 million, offset by a provisional deferred tax benefit of $39.1 million from the remeasurement of U.S. deferred tax assets and liabilities. Both the tax charge and the tax benefit represent provisional amounts based on current best estimates.
Income tax expense for fiscal 2017 was $43.9 million, which was primarily comprised of tax expense related to domestic and international operations generating pre-tax book income and an increase in gross unrecognized tax benefits, offset by tax benefits related to tax credits and international operations generating pre-tax book losses. For fiscal 2017, this resulted in an annual effective tax rate of 160.6%.
Income tax expense for fiscal 2016 was $26.0 million, which was primarily comprised of tax expense related to international operations, an increase in gross unrecognized tax benefits and a $25.1 million increase in the valuation allowance against domestic state tax net operating loss and credit deferred tax assets and foreign net operating loss deferred tax assets, offset by tax benefits arising from domestic operations and tax credits. For fiscal 2016, this resulted in an annual effective tax rate of (908.0)%.
A valuation allowance has been established against deferred tax assets in the taxing jurisdictions where, based upon the positive and negative evidence available, it is more likely than not that the related deferred tax assets will not be realized. Realization is dependent upon generating future income in the taxing jurisdictions in which the operating loss carryovers, credit carryovers, depreciable tax basis, and other deferred tax assets exist. Management reevaluates the ability to realize the benefit of these deferred tax assets on a quarterly basis. As of the end of fiscal years 2018, 2017 and 2016, the valuation allowance against domestic and foreign deferred tax assets was $42.8 million, $33.1 million, and $34.7 million, respectively.
See Note 12 of the Consolidated Financial Statements in Part II, Item 8 of this report for additional information regarding income taxes.
STOCK-BASED COMPENSATION
Under Financial Accounting Standards Board ("FASB") ASC 718, “Compensation – Stock Compensation,” stock-based compensation cost is measured at the grant date, based on the estimated fair value of the award using an option pricing model for stock options (Black-Scholes) and market price for restricted stock units, and is recognized as expense over the employee's requisite service period.
As of March 31, 2018, total remaining unearned compensation cost related to unvested restricted stock units and options was $72.8 million, which will be amortized over the weighted-average remaining service period of approximately 1.2 years.
41
LIQUIDITY AND CAPITAL RESOURCES
Cash generated by operations is our primary source of liquidity. As of March 31, 2018, we had working capital of approximately $1,402.5 million, including $926.0 million in cash and cash equivalents, compared to working capital of $1,042.8 million, including $545.5 million in cash and cash equivalents, as of April 1, 2017.
Our $926.0 million of total cash and cash equivalents as of March 31, 2018, includes approximately $292.9 million held by our foreign subsidiaries, of which $190.8 million is held by Qorvo International Pte. Ltd. in Singapore. If the undistributed earnings of our foreign subsidiaries are needed in the U.S., we may be required to accrue and pay state income and/or foreign local withholding taxes to repatriate these earnings. Our current plans are to permanently reinvest the undistributed earnings of our foreign subsidiaries, except for the earnings of Qorvo International Pte. Ltd.
Credit Agreement
On December 5, 2017, we and certain of our material domestic subsidiaries (the “Guarantors”) entered into a five-year unsecured senior credit facility with Bank of America, N.A., as administrative agent, swing line lender, and L/C issuer, and a syndicate of lenders (the “Credit Agreement”). On the same date, in connection with the execution of the Credit Agreement, we terminated our prior credit agreement, dated April 7, 2015.
The Credit Agreement includes a senior delayed draw term loan of up to $400.0 million (the "Term Loan") and a $300.0 million revolving line of credit (the "Revolving Facility", together with the Term Loan, the "Credit Facility"). In December 2017, $100.0 million of the Term Loan was funded and this amount was subsequently repaid in March 2018. The remainder of the Term Loan is available, at our discretion, in up to two draws prior to June 5, 2018. The Revolving Facility includes a $25.0 million sublimit for the issuance of standby letters of credit and a $10.0 million sublimit for swing line loans. We may request at any time that the Credit Facility be increased by an amount not to exceed $300.0 million. The Credit Facility is available to finance working capital, capital expenditures and other corporate purposes. Our obligations under the Credit Agreement are jointly and severally guaranteed by the Guarantors. Outstanding amounts are due in full on the maturity date of December 5, 2022 (with amounts borrowed under the swing line option due in full no later than ten business days after such loan is made). We had no outstanding amounts under the Credit Facility as of March 31, 2018.
See Note 8 of the Notes to the Consolidated Financial Statements set forth in Part II, Item 8 of this report for further information about the Credit Agreement, including applicable interest rates and financial covenants. As of March 31, 2018, we were in compliance with all the financial covenants under the Credit Agreement.
Stock Repurchases
On November 5, 2015, our Board of Directors authorized a share repurchase program to repurchase up to $1.0 billion of our outstanding common stock through November 4, 2016. On February 16, 2016, as part of the $1.0 billion share repurchase program, we entered into variable maturity accelerated share repurchase ("ASR") agreements (a $250.0 million collared agreement and a $250.0 million uncollared agreement) with Bank of America, N.A. For the upfront payment of $500.0 million, in fiscal 2016, we received an aggregate of 10.0 million shares of our common stock under the ASR agreements. Final settlements of the ASR agreements were completed during the first quarter of fiscal 2017 with 0.4 million shares received resulting in a total of 10.4 million shares of our common stock repurchased under the ASR agreements.
On November 3, 2016, our Board of Directors authorized a share repurchase program to repurchase up to $500.0 million of our outstanding stock. Under this program, share repurchases are made in accordance with applicable securities laws on the open market or in privately negotiated transactions. The extent to which we repurchase our shares, the number of shares and the timing of any repurchases will depend on general market conditions, regulatory requirements, alternative investment opportunities and other considerations. The program does not require us to repurchase a minimum number of shares, does not have a fixed term, and may be modified, suspended or terminated at any time without prior notice. This program included approximately $150.0 million authorized on the $1.0 billion repurchase program that expired November 4, 2016.
We repurchased 2.9 million shares, 4.1 million shares (inclusive of the 0.4 million shares received in final settlement of the ASR agreement) and 24.3 million shares (inclusive of the 10.0 million shares initially received under the ASR
42
agreement) of our common stock during fiscal years 2018, 2017 and 2016, respectively, at an aggregate cost of $219.9 million, $209.4 million and $1,300.0 million, respectively, in accordance with the share repurchase programs described above. As of March 31, 2018, $162.1 million remains available for future repurchases under our current share repurchase program.
Cash Flows from Operating Activities
Operating activities in fiscal 2018 provided cash of $852.5 million, compared to $776.8 million in fiscal 2017. This year-over-year increase was primarily due to changes in working capital. The Tax Act did not have an impact on our fiscal 2018 cash flows from operating activities.
Operating activities in fiscal 2017 provided cash of $776.8 million, compared to $687.9 million in fiscal 2016. This year-over-year increase was due primarily to improvement in working capital, partially offset by lower adjustments for non-cash items. The adjustments for non-cash items were lower due primarily to stock-based compensation expense and deferred taxes, partially offset by higher depreciation.
Cash Flows from Investing Activities
Net cash used in investing activities in fiscal 2018 was $277.4 million, compared to $490.3 million in fiscal 2017. This year-over-year decrease in cash used in investing activities was primarily due to capital expenditures incurred in fiscal 2017 that increased premium filter capacity and manufacturing cost saving initiatives.
Net cash used in investing activities in fiscal 2017 was $490.3 million, compared to $278.7 million in fiscal 2016. This increase was primarily due to higher capital expenditures related to projects for increasing premium filter capacity and manufacturing cost savings initiatives and the acquisition of GreenPeak Technologies, B.V. ("GreenPeak"), partially offset by higher net proceeds from available-for-sale securities.
Cash Flows from Financing Activities
Net cash used in financing activities in fiscal 2018 was $196.8 million, compared to $165.7 million in fiscal 2017. This year-over-year increase was primarily due to higher share repurchase activity, higher tax withholding paid on behalf of employees for restricted stock units and debt payments.
Net cash used in financing activities in 2017 was $165.7 million, compared to $283.0 million in fiscal 2016. This decrease was primarily due to lower share repurchase activity, partially offset by lower net proceeds from borrowings.
Our future capital requirements may differ materially from those currently anticipated and will depend on many factors, including market acceptance of and demand for our products, acquisition opportunities, technological advances and our relationships with suppliers and customers. Based on current and projected levels of cash flow from operations, coupled with our existing cash and cash equivalents and our Credit Facility, we believe that we have sufficient liquidity to meet both our short-term and long-term cash requirements. However, if there is a significant decrease in demand for our products, or if our revenue grows faster than we anticipate, operating cash flows may be insufficient to meet our needs. If existing resources and cash from operations are not sufficient to meet our future requirements or if we perceive conditions to be favorable, we may seek additional debt or equity financing. Additional equity or debt financing could be dilutive to holders of our common stock. Further, we cannot be sure that additional equity or debt financing, if required, will be available on favorable terms, if at all.
IMPACT OF INFLATION
We do not believe that the effects of inflation had a significant impact on our revenue or operating income during fiscal years 2018, 2017 and 2016.
OFF-BALANCE SHEET ARRANGEMENTS
As of March 31, 2018, we had no off-balance sheet arrangements as defined in Item 303(a)(4)(ii) of SEC Regulation S-K.
43
CONTRACTUAL OBLIGATIONS
The following table summarizes our significant contractual obligations and commitments (in thousands) as of March 31, 2018, and the effect such obligations are expected to have on our liquidity and cash flows in future periods.
Payments Due By Period | |||||||||||||||||||
Total Payments | Fiscal 2019 | Fiscal 2020-2021 | Fiscal 2022-2023 | Fiscal 2024 and thereafter | |||||||||||||||
Capital commitments (1) | $ | 39,793 | $ | 39,200 | $ | — | $ | 593 | $ | — | |||||||||
Long-term debt obligations (2) | 1,480,132 | 68,396 | 136,793 | 136,793 | 1,138,150 | ||||||||||||||
Capital lease (3) | 52,431 | — | 2,094 | 2,094 | 48,243 | ||||||||||||||
Operating leases | 68,582 | 12,490 | 21,898 | 15,740 | 18,454 | ||||||||||||||
Other purchase obligations and commitments (4) | 290,626 | 283,452 | 7,174 | — | — | ||||||||||||||
Cross-licensing liability (5) | 10,340 | 2,540 | 4,800 | 3,000 | — | ||||||||||||||
Deferred compensation (6) | 14,284 | 966 | 1,397 | 887 | 11,034 | ||||||||||||||
Total | $ | 1,956,188 | $ | 407,044 | $ | 174,156 | $ | 159,107 | $ | 1,215,881 | |||||||||
(1) Capital commitments represent obligations for the construction or purchase of property and equipment. They were not recorded as liabilities on our Consolidated Balance Sheet because we had not received the related goods or services as of March 31, 2018.
(2) Long-term debt obligations represent future cash payments of principal and interest over the life of the Notes, including anticipated interest payments not recorded as liabilities on our Consolidated Balance Sheet as of March 31, 2018. Debt obligations are classified based on their stated maturity date, and any future redemptions would impact our cash payments. See Note 8 of the Notes to the Consolidated Financial Statements set forth in Part II, Item 8 of this report for further information.
(3) The capital lease obligation relates to a lease that was signed in the fourth quarter of fiscal 2018. This lease will allow us to consolidate several leased facilities as well as provide additional manufacturing space in Beijing, China. The lease is not recorded on our Consolidated Balance Sheet as of March 31, 2018, because the lease term is not expected to commence until fiscal 2020.
(4) Other purchase obligations and commitments include payments due under various contracts as well as agreements to purchase materials and manufacturing services. They are not recorded as liabilities on our Consolidated Balance Sheet because we had not received the related goods or services as of March 31, 2018.
(5) The cross-licensing liability represents payables under a cross-licensing agreement and are included in "Accrued liabilities" and "Other long-term liabilities" in the Consolidated Balance Sheet as of March 31, 2018.
(6) Commitments for deferred compensation represent the liability under our Non-Qualified Deferred Compensation Plan. See Note 9 of the Notes to the Consolidated Financial Statements set forth in Part II, Item 8 of this report for further information.
Other Contractual Obligations
As of March 31, 2018, in addition to the amounts shown in the contractual obligations table above, we had $127.4 million of unrecognized income tax benefits and accrued interest, of which $18.3 million had been recorded as a liability. We are uncertain as to if, or when, such amounts may be settled.
As discussed in Note 9 of the Notes to the Consolidated Financial Statements set forth in Part II, Item 8 of this report, we have two pension plans in Germany with a combined benefit obligation of approximately $12.7 million as of March 31, 2018. Pension benefit payments are not included in the schedule above because they are not available for all periods presented. Pension benefit payments were approximately $0.2 million in fiscal 2018 and are expected to be approximately $0.3 million in fiscal 2019.
44
CRITICAL ACCOUNTING POLICIES AND ESTIMATES
The preparation of consolidated financial statements requires management to use judgment and estimates. The level of uncertainty in estimates and assumptions increases with the length of time until the underlying transactions are completed. Actual results could differ from those estimates. The accounting policies that are most critical in the preparation of our consolidated financial statements are those that are both important to the presentation of our financial condition and results of operations and require significant judgment and estimates on the part of management. Our critical accounting policies are reviewed periodically with the Audit Committee of the Board of Directors. We also have other policies that we consider key accounting policies, however, these policies typically do not require us to make estimates or judgments that are difficult or subjective (see Note 1 of the Notes to the Consolidated Financial Statements set forth in Part II, Item 8 of this report).
Inventory Reserves. The valuation of inventory requires us to estimate obsolete or excess inventory. The determination of obsolete or excess inventory requires us to estimate the future demand for our products within specific time horizons, generally 12 to 24 months. The estimates of future demand that we use in the valuation of inventory reserves are the same as those used in our revenue forecasts and are also consistent with the estimates used in our manufacturing plans to enable consistency between inventory valuations and build decisions. Product-specific facts and circumstances reviewed in the inventory valuation process include a review of the customer base, market conditions, and customer acceptance of our products and technologies, as well as an assessment of the selling price in relation to the product cost.
Historically, inventory reserves have fluctuated as new technologies have been introduced and customers’ demand has shifted. Inventory reserves had an impact on margins of less than 2% in fiscal years 2018, 2017 and 2016.
Property and Equipment. Periodically, we evaluate the period over which we expect to recover the economic value of our property and equipment, considering factors such as changes in machinery and equipment technology, our ability to re-use equipment across generations of process technology and historical usage trends. When we determine that the useful lives of assets are shorter or longer than we had originally estimated, we adjust the rate of depreciation to reflect the revised useful lives of the assets.
We assess property and equipment for impairment when events or changes in circumstances indicate that the carrying value of the assets or the asset grouping may not be recoverable. Factors that we consider in deciding when to perform an impairment review include an adverse change in our use of the assets or an expectation that the assets will be sold or otherwise disposed. We assess the recoverability of the assets held for use by comparing the projected undiscounted net cash flows associated with the related asset or group of assets over their remaining estimated useful lives against their respective carrying amounts. Assets identified as “held for sale” are recorded at the lesser of their carrying value or their fair market value less costs to sell. Impairment, if any, is based on the excess of the carrying amount over the fair value of those assets. The process of evaluating property and equipment for impairment is highly subjective and requires significant judgment as we are required to make assumptions about items such as future demand for our products and industry trends.
Goodwill and Intangible Assets. Goodwill is recorded when the purchase price paid for a business exceeds the estimated fair value of the net identified tangible and intangible assets acquired. Intangibles are recorded when such assets are acquired by purchase or license. The value of our intangibles, including goodwill, could be impacted by future adverse changes such as: (i) any future declines in our operating results; (ii) a decline in the value of technology company stocks, including the value of our common stock; (iii) a prolonged or more significant slowdown in the worldwide economy or the semiconductor industry; or (iv) failure to meet the performance projections included in our forecasts of future operating results.
We account for goodwill and indefinite-lived intangible assets in accordance with the FASB's guidance, which requires annual testing for impairment or whenever events or circumstances make it more likely than not that an impairment may have occurred. We perform our annual impairment tests on the first day of the fourth quarter in each fiscal year. Our indefinite-lived intangible assets consist of in-process research and development ("IPRD").
45
We have the option to perform a qualitative assessment (commonly referred to as "step zero") to determine whether further quantitative analysis for impairment of goodwill or indefinite-lived intangible assets is necessary. In performing step zero for our impairment test, we are required to make assumptions and judgments, including the evaluation of macroeconomic conditions as related to our business, industry and market trends, and the overall future financial performance of our reporting units and future opportunities in the markets in which they operate. We also consider recent fair value calculations of our indefinite-lived intangible assets and reporting units as well as cost factors such as changes in raw materials, labor or other costs. If the step zero analysis indicates that it is more likely than not that the fair value of a reporting unit or indefinite-lived asset is less than its respective carrying value including goodwill, then we would perform an additional quantitative analysis. For goodwill, this involves a two-step process. The first step compares the fair value of the reporting unit, including its goodwill, to its carrying value. If the carrying value of the reporting unit exceeds its fair value, then the second step of the process is performed to determine the amount of impairment. The second step compares the implied fair value of the reporting unit's goodwill to the carrying value of the goodwill. An impairment charge is recognized for the amount the carrying value of the reporting unit's goodwill exceeds its implied fair value.
For indefinite-lived intangible assets, the quantitative analysis compares the carrying value of the asset to its fair value and an impairment charge is recognized for the amount its carrying value exceeds its fair value.
Determining the fair value of reporting units, indefinite-lived intangible assets and implied fair value of a reporting unit's goodwill is reliant upon estimated future revenues, profitability and cash flows and consideration of market factors. Assumptions, judgments and estimates are complex, subjective and can be affected by a variety of factors, including external factors such as industry and economic trends, and internal factors such as changes in our business strategy or our internal forecasts. Although we believe the assumptions, judgments and estimates we have made have been reasonable and appropriate, different assumptions, judgments and estimates could materially affect our results of operations.
Goodwill
Goodwill is allocated to our reporting units based on the expected benefit from the synergies of the business combinations generating the underlying goodwill. For fiscal 2018, we performed a qualitative assessment of the fair value of our reporting units and, as a result of our analysis, we determined that there were no indicators of impairment and no further quantitative impairment test was deemed necessary.
For fiscal 2017, we performed a qualitative assessment of the fair value of our reporting units and, as a result of our analysis, we determined that there were no indicators of impairment and no further quantitative impairment test was deemed necessary.
For fiscal 2016, although there were no indicators of impairment, we opted to bypass the qualitative assessment and proceeded to perform fair value assessments of our reporting units (the first step of the quantitative impairment analysis) as the fair value of the reporting units had changed (due to the Business Combination) since the last time we performed a quantitative analysis. The quantitative assessments performed reaffirmed that there were no indicators of impairment for fiscal 2016.
In performing these quantitative assessments, consistent with our historical approach, we used both the income and market approaches to estimate the fair value of our reporting units. The income approach involves discounting future estimated cash flows. The sum of the reporting unit cash flow projections was compared to our market capitalization in a discounted cash flow framework to calculate an overall implied internal rate of return (or discount rate) for the Company. Our market capitalization was adjusted to a control basis assuming a reasonable control premium, which resulted in an implied discount rate. This implied discount rate serves as a baseline for estimating the specific discount rate for each reporting unit.
The discount rate used is the value-weighted average of our estimated cost of equity and debt (“cost of capital”) derived using both known and estimated customary market metrics. Our weighted average cost of capital is adjusted for each reporting unit to reflect a risk factor, if necessary, for each reporting unit. We perform sensitivity tests with respect to growth rates and discount rates used in the income approach. We
46
believe the income approach is appropriate because it provides a fair value estimate based upon the respective reporting unit’s expected long-term operations and cash flow performance.
We considered historical rates and current market conditions when determining the discount and growth rates used in our analysis. For fiscal 2016, the material assumptions used for the income approach were eight years of projected net cash flows and a long-term growth rate of 3% for both the MP and IDP reporting units. A discount rate of 15% and 16% was used for the MP and IDP reporting units, respectively.
In applying the market approach, valuation multiples are derived from historical and projected operating data of selected guideline companies, which are evaluated and adjusted, if necessary, based on the strengths and weaknesses of the reporting unit relative to the selected guideline companies. The valuation multiples are then applied to the appropriate historical and/or projected operating data of the reporting unit to arrive at an indication of fair value. We believe the market approach is appropriate because it provides a fair value using multiples from companies with operations and economic characteristics similar to its reporting units. We weighted the results of the income approach and the results of the market approach at 50% each and for the MP and IDP reporting units, concluded that the fair value of the reporting units was determined to be substantially in excess of the carrying value, and as such, no further analysis was warranted.
Under the income approach, the following indicates the sensitivity of key assumptions utilized in the assessment. A one percentage point decrease in the discount rate would have increased the fair value of the MP and IDP reporting units by approximately $660.0 million and $140.0 million, respectively, while a one percentage point increase in the discount rate would have decreased the fair value of the MP and IDP reporting units by approximately $560.0 million and $110.0 million, respectively. A one percentage point decrease in the long-term growth rate would have decreased the fair value of the MP and IDP reporting units by approximately $290.0 million and $50.0 million, respectively, while a one percentage point increase in the long-term growth rate would have increased the fair value of the MP and IDP reporting units by approximately $340.0 million and $70.0 million, respectively.
Intangible Assets with Indefinite Lives
In fiscal 2015, as a result of the Business Combination, we recorded IPRD of $470.0 million. IPRD was recorded at fair value as of the date of acquisition as an indefinite-lived intangible asset until the completion or abandonment of the associated R&D efforts or impairment. The fair value of the acquired IPRD was determined based on an income approach using the "excess earnings method," which estimated the value of the intangible assets by discounting the future projected earnings of the asset to present value as of the valuation date. Upon completion of development, acquired IPRD assets are transferred to finite-lived intangible assets and amortized over their useful lives. During fiscal years 2018, 2017 and 2016, we completed and transferred into developed technology approximately $37.0 million, $220.0 million and $203.0 million, respectively, of IPRD. We performed a qualitative assessment of the remaining IPRD of $10.0 million during fiscal 2018 and concluded that IPRD was not impaired.
Intangible Assets with Definite Lives
Intangible assets are recorded when such assets are acquired by purchase or license. Finite-lived intangible assets consist primarily of technology licenses, customer relationships, developed technology and trade names resulting from business combinations and are subject to amortization.
Technology licenses are recorded at cost and are amortized on a straight-line basis over the lesser of the estimated useful life of the technology or the term of the license agreement, ranging from approximately five to eight years.
The fair value of customer relationships acquired during fiscal years 2013, 2015 and 2017 was determined based on an income approach using the “with and without method," in which the value of the asset is determined by the difference in discounted cash flows of the profitability of the Company "with" the asset and the profitability of the Company "without" the asset. Customer relationships are amortized on a straight-line basis over the estimated useful life, ranging from three to ten years.
47
The fair value of developed technology acquired during fiscal years 2013, 2015 and 2017 was determined based on an income approach using the "excess earnings method," which estimated the value of the intangible assets by discounting the future projected earnings of the asset to present value as of the valuation date. Developed technology is amortized on a straight-line basis over the estimated useful life, ranging from three to six years.
The fair value of trade names acquired in fiscal years 2015 and 2017 was determined based on an income approach using the "relief from royalty method," in which the value of the asset is determined by discounting the future projected cash flows generated from the trade name's estimated royalties. Trade names are amortized on a straight-line basis over the estimated useful life of two to three years.
The fair value of the non-compete agreements acquired in fiscal 2017 was determined based on an income approach using the "incremental income method" over the useful life of two years.
We regularly review identified intangible assets to determine if facts and circumstances indicate that the useful life has changed from the original estimate or that the carrying amount of the assets may not be recoverable. If such facts and circumstances exist, we assess the recoverability of identified intangible assets by comparing the projected undiscounted net cash flows associated with the related asset or group of assets over their remaining lives against their respective carrying amounts. Impairments, if any, are based on the excess of the carrying amount over the fair value of those assets and occur in the period in which the impairment determination was made.
Revenue Recognition. Net revenue is generated principally from sales of semiconductor products. We recognize revenue from product sales when the fundamental criteria are met, such as the time at which the title and risk and rewards of product ownership are transferred to the customer, price and terms are fixed or determinable, no significant vendor obligation exists and collection of the resulting receivable is reasonably assured.
Sales of products are generally made through either our sales force, manufacturers' representatives or through a distribution network. Revenue from the majority of our products is recognized upon shipment of the product to the customer from a Company-owned or third-party location. Some revenue is recognized upon receipt of the shipment by the customer. We have limited rebate programs offering price protection to certain distributors. These rebates represented approximately 5% of net revenue in fiscal 2018 and can be reasonably estimated based on specific criteria included in the rebate agreements and other known factors at the time. We reduce revenue and record reserves for product returns and allowances for price protection, stock rotation, and scrap allowance based on historical experience or specific identification depending on the contractual terms of the arrangement.
We also recognize a portion of our net revenue through other agreements such as non-recurring engineering fees, contracts for R&D work, royalty income, intellectual property ("IP") revenue, and service revenue. These agreements are collectively less than 1% of our consolidated annual revenue. Revenue from these agreements is recognized when the service is completed or upon certain milestones, as provided for in the agreements.
Revenue from certain contracts is recognized on the percentage of completion method based on the costs incurred to date and the total contract amount, plus the contractual fee. If these contracts experience cost overruns, the percentage of completion method is used to determine revenue recognition. Revenue from fixed price contracts is recognized when the required deliverable is satisfied.
Royalty income is recognized based on a percentage of sales of the relevant product reported by licensees during the period.
In addition, we license or sell our rights to use portions of our IP portfolio, which includes certain patent rights useful in the manufacture and sales of certain products. IP revenue recognition is dependent on the terms of each agreement. We will recognize IP revenue upon delivery of the IP if we have no substantive future obligation to perform under the arrangement. We will defer recognition of IP revenue where future performance obligations are required to earn the revenue or the revenue is not guaranteed. Revenue from services is recognized during the period that the service is performed.
48
Accounts receivable are recorded for all revenue items listed above and do not bear interest. We evaluate the collectability of accounts receivable based on a combination of factors. In cases where we are aware of circumstances that may impair a specific customer’s ability to meet its financial obligations after the original sale, we will record an allowance against amounts due, and thereby reduce the receivable to the amount we reasonably believe will be collected. For all other customers, we recognize allowances for doubtful accounts based on the length of time the receivables are past due, industry and geographic concentrations, the current business environment and our historical experience.
Our terms and conditions do not give our customers a right of return associated with the original sale of our products. However, we will authorize sales returns under certain circumstances, which include perceived quality problems, courtesy returns and like-kind exchanges. We evaluate our estimate of returns by analyzing all types of returns and the timing of such returns in relation to the original sale. Reserves are adjusted to reflect changes in the estimated returns versus the original sale of product.
Income Taxes. In determining income for financial statement purposes, we must make certain estimates and judgments in the calculation of tax expense, the resultant tax liabilities, and in the recoverability of deferred tax assets that arise from temporary differences between the tax and financial statement recognition of revenue and expense.
As part of our financial process, we assess on a tax jurisdictional basis the likelihood that our deferred tax assets can be recovered. If recovery is not more likely than not (a likelihood of less than 50 percent), the provision for taxes must be increased by recording a reserve in the form of a valuation allowance for the deferred tax assets that are estimated not to ultimately be recoverable. In this process, certain relevant criteria are evaluated including: the amount of income or loss in prior years, the existence of deferred tax liabilities that can be used to absorb deferred tax assets, the taxable income in prior carryback years that can be used to absorb net operating losses and credit carrybacks, future expected taxable income, and prudent and feasible tax planning strategies. Changes in taxable income, market conditions, U.S. or international tax laws, and other factors may change our judgment regarding whether we will be able to realize the deferred tax assets. These changes, if any, may require material adjustments to the net deferred tax assets and an accompanying reduction or increase in income tax expense which will result in a corresponding increase or decrease in net income in the period when such determinations are made. See Note 12 of the Notes to the Consolidated Financial Statements set forth in Part II, Item 8 of this report for additional information regarding changes in the valuation allowance and net deferred tax assets.
As part of our financial process, we also assess the likelihood that our tax reporting positions will ultimately be sustained. To the extent it is determined it is more likely than not (a likelihood of more than 50 percent) that some portion or all of a tax reporting position will ultimately not be recognized and sustained, a provision for unrecognized tax benefit is provided by either reducing the applicable deferred tax asset or accruing an income tax liability. Our judgment regarding the sustainability of our tax reporting positions may change in the future due to changes in U.S. or international tax laws and other factors. These changes, if any, may require material adjustments to the related deferred tax assets or accrued income tax liabilities and an accompanying reduction or increase in income tax expense which will result in a corresponding increase or decrease in net income in the period when such determinations are made. See Note 12 of the Notes to the Consolidated Financial Statements set forth in Part II, Item 8 of this report for additional information regarding our uncertain tax positions and the amount of unrecognized tax benefits.
RECENT ACCOUNTING PRONOUNCEMENTS
Accounting Pronouncements Not Yet Effective
In January 2017, the FASB issued Accounting Standards Update ("ASU") 2017-04, "Intangibles-Goodwill and Other (Topic 350): Simplifying the Test for Goodwill Impairment." The new guidance simplifies the subsequent measurement of goodwill by eliminating the second step from the quantitative goodwill impairment test. We will continue to have the option to perform a qualitative assessment to determine if a quantitative goodwill impairment test is necessary. The new standard will become effective for us beginning in fiscal 2021 with early adoption permitted. We do not believe it will have a significant impact on our consolidated financial statements.
49
In January 2017, the FASB issued ASU 2017-01, "Business Combinations (Topic 805): Clarifying the Definition of a Business." The new guidance clarifies the definition of a business and provides further guidance for evaluating whether a transaction will be accounted for as an acquisition of an asset or a business. The new standard will become effective for us beginning in the first quarter of fiscal 2019 with early adoption permitted. The update should be applied prospectively. We do not believe it will have a significant impact on our consolidated financial statements.
In August 2016, the FASB issued ASU 2016-15, "Statement of Cash Flows (Topic 230): Classification of Certain Cash Receipts and Cash Payments (a consensus of the FASB’s Emerging Issues Task Force)." The new guidance addresses eight specific cash flow issues with the objective of reducing the existing diversity in practice. The new standard will become effective for us beginning in the first quarter of fiscal 2019. We do not believe it will have a significant impact on our consolidated financial statements.
In June 2016, the FASB issued ASU 2016-13, "Financial Instruments - Credit Losses (Topic 326): Measurement of Credit Losses on Financial Instruments." The new guidance requires entities to use a current lifetime expected credit loss methodology to measure impairments of certain financial instruments. It also modifies the impairment model for available-for-sale debt securities and provides for a simplified accounting model for purchased financial assets with credit deterioration since their origination. The new standard will become effective for us beginning in the first quarter of fiscal 2021 with early adoption permitted. We do not believe it will have a significant impact on our consolidated financial statements.
In February 2016, the FASB issued ASU 2016-02, "Leases (Topic 842)." The new guidance requires lessees to recognize a right-of-use asset and a lease liability for all leases with a term longer than 12 months, including those previously described as operating leases. Consistent with current U.S. generally accepted accounting principles ("GAAP"), the recognition, measurement, and presentation of expenses and cash flows arising from a lease by a lessee will primarily depend on its classification as a finance or operating lease. The new guidance will become effective for us in the first quarter of fiscal 2020. We expect the valuation of the right-of-use assets and lease liabilities, for leases previously described as operating leases, to be the present value of our forecasted future lease commitments. We are continuing to assess the overall impacts of the new standard, including the discount rate to be applied in these valuations.
In January 2016, the FASB issued ASU 2016-01, "Financial Instruments - Overall (Subtopic 825-10): Recognition and Measurement of Financial Assets and Financial Liabilities." The new guidance will affect the accounting for equity investments, financial liabilities measured under the fair value option and presentation and disclosure requirements for financial instruments. In addition, the FASB clarified guidance related to the assessment of valuation allowances when recognizing deferred tax assets related to unrealized losses on available-for-sale debt securities. The new standard is effective for us beginning in the first quarter of fiscal 2019. We do not believe it will have a significant impact on our consolidated financial statements.
In May 2014, the FASB issued ASU 2014-09, "Revenue from Contracts with Customers (Topic 606)," with several amendments subsequently issued. The new guidance provides an updated framework for revenue recognition, resulting in a single revenue model to be applied by reporting companies under U.S. GAAP. Under the new model, recognition of revenue occurs when a customer obtains control of promised goods or services in an amount that reflects the consideration to which the entity expects to be entitled in exchange for those goods or services. Additional disclosures will be required regarding the nature, amount, timing and uncertainty of cash flows. We will adopt the standard in the first quarter of fiscal 2019 using the modified retrospective approach, under which the cumulative effect of adoption is recognized at the date of initial application. We have evaluated the impact of the standard and do not anticipate that the adoption of this standard will have a material impact on our consolidated financial statements. We are implementing changes to our accounting policies, internal controls and disclosures to support the new standard, however, we do not expect these changes to be material.
Accounting Pronouncements Recently Adopted
In March 2018, the FASB issued ASU 2018-05, "Income Taxes (Topic 740): Amendments to SEC Paragraphs Pursuant to SEC Staff Accounting Bulletin No. 118." The amendments incorporate into the ASC the recent SEC guidance related to the income tax accounting implications of the Tax Act. See Note 12 of the Notes to the Consolidated Financial Statements in Part II, Item 8 of this report for additional information.
50
In May 2017, the FASB issued ASU 2017-09, "Compensation—Stock Compensation (Topic 718): Scope of Modification Accounting." The new guidance clarifies when modification accounting in Topic 718 should be applied to changes to the terms or conditions of a share-based payment award. We elected to early-adopt the standard in the first quarter of fiscal 2018 with no impact on our consolidated financial statements.
In November 2016, the FASB issued ASU 2016-18, "Statement of Cash Flows (Topic 230): Restricted Cash (a consensus of the FASB Emerging Issues Task Force)." The new guidance requires that restricted cash and restricted cash equivalents be included in cash and cash equivalents when reconciling the beginning-of-period and end-of-period total amounts shown in the statement of cash flows. We adopted the provisions of ASU 2016-18 in the second quarter of fiscal 2018 using the retrospective transition method. The adjustment to reclassify restricted cash for each period presented was less than $1.0 million.
In October 2016, the FASB issued ASU 2016-16, "Income Taxes (Topic 740), Intra-Entity Transfers of Assets Other Than Inventory." The new guidance requires an entity to recognize the income tax consequences of an intra-entity transfer of an asset, other than inventory, when the transfer occurs. We elected to early-adopt the standard in the first quarter of fiscal 2018 using the modified retrospective method (which resulted in a cumulative adjustment to retained earnings of $1.2 million as of the beginning of the period of adoption). During fiscal 2018, we recognized a tax expense of $6.9 million related to transfers of intra-entity assets.
In March 2016, the FASB issued ASU 2016-09, "Compensation - Stock Compensation (Topic 718): Improvements to Employee Share-Based Payment Accounting." The new guidance simplifies certain aspects of accounting for share-based payment transactions, including income tax consequences, forfeitures, classification of awards on the balance sheet and presentation on the statement of cash flows, and became effective for us in the first quarter of fiscal 2018. We recognized a cumulative-effect adjustment to reduce our accumulated deficit by $36.7 million with a corresponding increase to deferred tax assets for the federal and state net operating losses attributable to excess tax benefits that had not been previously recognized. All excess tax benefits and deficiencies in the current and future periods will be recognized as income tax expense in our Consolidated Statement of Operations in the reporting period in which they occur. This will result in increased volatility in our effective tax rate. During fiscal 2018, we recognized a discrete tax benefit of $12.2 million related to the excess tax benefits from stock-based compensation. We also elected to prospectively adopt the provision that requires excess tax benefits to be presented within operating activities in the statement of cash flows and no prior periods have been restated as a result of the adoption. We continued our existing practice of estimating expected forfeitures in determining compensation cost.
In March 2016, the FASB issued ASU 2016-07, "Investments-Equity Method and Joint Ventures (Topic 323): Simplifying the Transition to the Equity Method of Accounting." The new guidance eliminates the requirement to retrospectively apply the equity method of accounting when an investment previously accounted for under the cost basis qualifies for the equity method of accounting. We adopted ASU 2016-07 in the first quarter of fiscal 2018 with no impact on our consolidated financial results.
In July 2015, the FASB issued ASU 2015-11, "Inventory (Topic 330): Simplifying the Measurement of Inventory." The new guidance changes the measurement principle for inventory from the lower of cost or market to the lower of cost and net realizable value. ASU 2015-11 defines net realizable value as the estimated selling price in the ordinary course of business less reasonably predictable costs to completion, transportation, or disposal. We adopted ASU 2015-11 in the first quarter of fiscal 2018 with no significant impact on our consolidated financial statements.
ITEM 7A. QUANTITATIVE AND QUALITATIVE DISCLOSURES ABOUT MARKET RISK.
Financial Risk Management
We are exposed to financial market risks, including changes in interest rates, currency exchange rates and certain commodity prices. The overall objective of our financial risk management program is to seek a reduction in the potential negative earnings effects from changes in interest rates, foreign exchange rates and commodity prices arising from our business activities. We manage these financial exposures through operational means and by using various financial instruments. These practices may change as economic conditions change.
Interest Rates
51
The interest rates under our Credit Agreement are variable, however, since we have no outstanding balances under the Credit Agreement, there is no interest rate risk related to this facility as of March 31, 2018.
Currency Exchange Rates
As a global company, our results are affected by movements in currency exchange rates. Our exposure may increase or decrease over time as our foreign business levels fluctuate in the countries where we have operations, and these changes could have a material impact on our financial results. The functional currency for most of our international operations is the U.S. dollar. We have foreign operations in Asia, Costa Rica and Europe, and a substantial portion of our revenue is derived from sales to customers outside the U.S. Our international revenue is primarily denominated in U.S. dollars. Operating expenses and certain working capital items related to our foreign-based operations are, in some instances, denominated in the local foreign currencies and therefore are affected by changes in the U.S. dollar exchange rate in relation to foreign currencies, such as the Costa Rican Colon, Euro, Pound Sterling, Renminbi and Singapore Dollar. If the U.S. dollar weakens compared to these and other currencies, our operating expenses for foreign operations will be higher when remeasured back into U.S. dollars. We seek to manage our foreign exchange risk in part through operational means.
For fiscal 2018, we incurred a foreign currency loss of $2.8 million as compared to a loss of $3.2 million in fiscal 2017, which is recorded in “Other (expense) income.”
Our financial instrument holdings, including foreign receivables, cash and payables at March 31, 2018, were analyzed to determine their sensitivity to foreign exchange rate changes. In this sensitivity analysis, we assumed that the change in one currency's rate relative to the U.S. dollar would not have an effect on other currencies' rates relative to the U.S. dollar. All other factors were held constant. If the U.S. dollar declined in value 10% in relation to the re-measured foreign currency instruments, our net income would have decreased by approximately $2.7 million. If the U.S. dollar increased in value 10% in relation to the re-measured foreign currency instruments, our net income would have increased by approximately $2.2 million.
Commodity Prices
We routinely use precious metals in the manufacture of our products. Supplies for such commodities may from time to time become restricted, or general market factors and conditions may affect the pricing of such commodities. We also have an active reclamation process to capture any unused gold. While we continue to attempt to mitigate the risk of similar increases in commodities-related costs, there can be no assurance that we will be able to successfully safeguard against potential short-term and long-term commodity price fluctuations.
ITEM 8. FINANCIAL STATEMENTS AND SUPPLEMENTARY DATA. | |
INDEX TO CONSOLIDATED FINANCIAL STATEMENTS | |
Page | |
Consolidated Statements of Stockholders' Equity | |
52
March 31, 2018 | April 1, 2017 | ||||||
ASSETS | |||||||
Current assets: | |||||||
Cash and cash equivalents (Notes 1 & 3) | $ | 926,037 | $ | 545,463 | |||
Accounts receivable, less allowance of $134 and $58 as of March 31, 2018 and April 1, 2017, respectively | 345,957 | 357,948 | |||||
Inventories (Notes 1 & 4) | 472,292 | 430,454 | |||||
Prepaid expenses | 23,909 | 36,229 | |||||
Other receivables (Note 1) | 44,795 | 65,247 | |||||
Other current assets (Notes 1 & 9) | 30,815 | 26,264 | |||||
Total current assets | 1,843,805 | 1,461,605 | |||||
Property and equipment, net (Notes 1 & 5) | 1,374,112 | 1,391,932 | |||||
Goodwill (Notes 1, 6 & 7) | 2,173,889 | 2,173,914 | |||||
Intangible assets, net (Notes 1, 6 & 7) | 860,336 | 1,400,563 | |||||
Long-term investments (Notes 1 & 3) | 63,765 | 35,494 | |||||
Other non-current assets (Notes 9 & 12) | 65,612 | 58,815 | |||||
Total assets | $ | 6,381,519 | $ | 6,522,323 | |||
LIABILITIES AND STOCKHOLDERS' EQUITY | |||||||
Current liabilities: | |||||||
Accounts payable | $ | 213,193 | $ | 216,246 | |||
Accrued liabilities (Notes 1, 9, 10, & 11) | 167,182 | 170,584 | |||||
Other current liabilities (Note 12) | 60,904 | 31,998 | |||||
Total current liabilities | 441,279 | 418,828 | |||||
Long-term debt (Note 8) | 983,290 | 989,154 | |||||
Deferred tax liabilities (Note 12) | 63,084 | 131,511 | |||||
Other long-term liabilities (Notes 9, 10, 11 & 12) | 118,302 | 86,108 | |||||
Total liabilities | 1,605,955 | 1,625,601 | |||||
Commitments and contingent liabilities (Note 10) | |||||||
Stockholders’ equity: | |||||||
Preferred stock, $.0001 par value; 5,000 shares authorized; no shares issued and outstanding | — | — | |||||
Common stock and additional paid-in capital, $.0001 par value; 405,000 shares authorized; 126,322 and 126,464 shares issued and outstanding at March 31, 2018 and April 1, 2017, respectively | 5,237,085 | 5,357,394 | |||||
Accumulated other comprehensive loss, net of tax | (2,752 | ) | (4,306 | ) | |||
Accumulated deficit | (458,769 | ) | (456,366 | ) | |||
Total stockholders’ equity | 4,775,564 | 4,896,722 | |||||
Total liabilities and stockholders’ equity | $ | 6,381,519 | $ | 6,522,323 | |||
See accompanying notes.
53
Qorvo, Inc. and Subsidiaries
Consolidated Statements of Operations
(In thousands, except per share data)
Consolidated Statements of Operations
(In thousands, except per share data)
Fiscal Year | |||||||||||
2018 | 2017 | 2016 | |||||||||
Revenue | $ | 2,973,536 | $ | 3,032,574 | $ | 2,610,726 | |||||
Cost of goods sold | 1,826,570 | 1,897,062 | 1,561,173 | ||||||||
Gross profit | 1,146,966 | 1,135,512 | 1,049,553 | ||||||||
Operating expenses: | |||||||||||
Research and development | 445,103 | 470,836 | 448,763 | ||||||||
Selling, general and administrative | 527,751 | 545,588 | 534,099 | ||||||||
Other operating expense (Notes 6 & 11) | 103,830 | 31,029 | 54,723 | ||||||||
Total operating expenses | 1,076,684 | 1,047,453 | 1,037,585 | ||||||||
Income from operations | 70,282 | 88,059 | 11,968 | ||||||||
Interest expense (Note 8) | (59,548 | ) | (58,879 | ) | (23,316 | ) | |||||
Interest income | 7,017 | 1,212 | 2,068 | ||||||||
Other (expense) income | (606 | ) | (3,087 | ) | 6,418 | ||||||
Income (loss) before income taxes | $ | 17,145 | $ | 27,305 | $ | (2,862 | ) | ||||
Income tax expense (Note 12) | (57,433 | ) | (43,863 | ) | (25,983 | ) | |||||
Net loss | $ | (40,288 | ) | $ | (16,558 | ) | $ | (28,845 | ) | ||
Net loss per share (Note 13): | |||||||||||
Basic | $ | (0.32 | ) | $ | (0.13 | ) | $ | (0.20 | ) | ||
Diluted | $ | (0.32 | ) | $ | (0.13 | ) | $ | (0.20 | ) | ||
Weighted average shares of common stock outstanding (Note 13): | |||||||||||
Basic | 126,946 | 127,121 | 141,937 | ||||||||
Diluted | 126,946 | 127,121 | 141,937 | ||||||||
See accompanying notes.
54
Qorvo, Inc. and Subsidiaries
Consolidated Statements of Comprehensive Loss
Consolidated Statements of Comprehensive Loss
(In thousands)
Fiscal Year | |||||||||||
2018 | 2017 | 2016 | |||||||||
Net loss | $ | (40,288 | ) | $ | (16,558 | ) | $ | (28,845 | ) | ||
Total comprehensive loss: | |||||||||||
Unrealized gain on marketable securities, net of tax | 204 | 53 | 742 | ||||||||
Change in pension liability, net of tax | 476 | (339 | ) | 1,153 | |||||||
Foreign currency translation adjustment, including intra-entity foreign currency transactions that are of a long-term-investment nature | 1,276 | (1,014 | ) | (89 | ) | ||||||
Reclassification adjustments, net of tax: | |||||||||||
Recognized gain on marketable securities | — | — | (4,994 | ) | |||||||
Foreign currency gain recognized and included in net loss | (581 | ) | — | — | |||||||
Amortization of pension actuarial loss | 179 | 127 | 179 | ||||||||
Other comprehensive income (loss) | 1,554 | (1,173 | ) | (3,009 | ) | ||||||
Total comprehensive loss | $ | (38,734 | ) | $ | (17,731 | ) | $ | (31,854 | ) | ||
See accompanying notes.
55
Qorvo, Inc. and Subsidiaries
Consolidated Statements of Stockholders’ Equity
(In thousands)
Accumulated | ||||||||||||||||||
Other | ||||||||||||||||||
Common Stock | Comprehensive | Accumulated | ||||||||||||||||
Shares | Amount | Loss | Deficit | Total | ||||||||||||||
March 28, 2015 | 149,059 | $ | 6,584,247 | $ | (124 | ) | $ | (410,963 | ) | $ | 6,173,160 | |||||||
Net loss | — | — | — | (28,845 | ) | (28,845 | ) | |||||||||||
Other comprehensive loss | — | — | (3,009 | ) | — | (3,009 | ) | |||||||||||
Exercise of stock options and vesting of restricted stock units, net of shares withheld for employee taxes | 2,156 | 4,406 | — | — | 4,406 | |||||||||||||
Issuance of common stock in connection with employee stock purchase plan | 429 | 17,967 | — | — | 17,967 | |||||||||||||
Tax benefit from exercised stock options | — | 636 | — | — | 636 | |||||||||||||
Repurchase of common stock, including transaction costs | (24,258 | ) | (1,300,009 | ) | — | — | (1,300,009 | ) | ||||||||||
Stock-based compensation expense | — | 135,366 | — | — | 135,366 | |||||||||||||
Balance, April 2, 2016 | 127,386 | $ | 5,442,613 | $ | (3,133 | ) | $ | (439,808 | ) | $ | 4,999,672 | |||||||
Net loss | — | — | — | (16,558 | ) | (16,558 | ) | |||||||||||
Other comprehensive loss | — | — | (1,173 | ) | — | (1,173 | ) | |||||||||||
Exercise of stock options and vesting of restricted stock units, net of shares withheld for employee taxes | 2,484 | 16,832 | — | — | 16,832 | |||||||||||||
Issuance of common stock in connection with employee stock purchase plan | 678 | 25,640 | — | — | 25,640 | |||||||||||||
Tax deficiency from exercised stock options | — | (56 | ) | — | — | (56 | ) | |||||||||||
Repurchase of common stock, including transaction costs | (4,084 | ) | (209,357 | ) | — | — | (209,357 | ) | ||||||||||
Stock-based compensation expense | — | 81,722 | — | — | 81,722 | |||||||||||||
Balance, April 1, 2017 | 126,464 | $ | 5,357,394 | $ | (4,306 | ) | $ | (456,366 | ) | $ | 4,896,722 | |||||||
Net loss | — | — | — | (40,288 | ) | (40,288 | ) | |||||||||||
Other comprehensive income | — | — | 1,554 | — | 1,554 | |||||||||||||
Exercise of stock options and vesting of restricted stock units, net of shares withheld for employee taxes | 2,246 | 4,735 | — | — | 4,735 | |||||||||||||
Issuance of common stock in connection with employee stock purchase plan | 541 | 28,064 | — | — | 28,064 | |||||||||||||
Cumulative-effect adoption of ASU 2016-09 | — | — | — | 36,684 | 36,684 | |||||||||||||
Cumulative-effect adoption of ASU 2016-16 | — | — | — | 1,201 | 1,201 | |||||||||||||
Repurchase of common stock, including transaction costs | (2,929 | ) | (219,907 | ) | — | — | (219,907 | ) | ||||||||||
Stock-based compensation expense | — | 66,799 | — | — | 66,799 | |||||||||||||
Balance, March 31, 2018 | 126,322 | $ | 5,237,085 | $ | (2,752 | ) | $ | (458,769 | ) | $ | 4,775,564 | |||||||
See accompanying notes.
56
Fiscal Year | |||||||||||
2018 | 2017 | 2016 | |||||||||
Cash flows from operating activities: | |||||||||||
Net loss | $ | (40,288 | ) | $ | (16,558 | ) | $ | (28,845 | ) | ||
Adjustments to reconcile net loss to net cash provided by operating activities: | |||||||||||
Depreciation | 174,425 | 209,825 | 180,362 | ||||||||
Intangible assets amortization (Note 7) | 539,790 | 494,752 | 494,589 | ||||||||
Amortization of debt issuance cost and other non-cash items | 1,858 | 1,709 | 112 | ||||||||
Excess tax benefit from exercises of stock options | — | (65 | ) | (935 | ) | ||||||
Deferred income taxes | (32,248 | ) | (28,027 | ) | (12,189 | ) | |||||
Foreign currency adjustments | 953 | (36 | ) | 1,705 | |||||||
Loss (income) on investments and other assets, net (Note 11) | 49,177 | 5,478 | (4,705 | ) | |||||||
Stock-based compensation expense | 68,158 | 88,845 | 139,516 | ||||||||
Changes in operating assets and liabilities: | |||||||||||
Accounts receivable, net | 12,906 | (36,873 | ) | 36,682 | |||||||
Inventories | (41,887 | ) | (6,442 | ) | (84,116 | ) | |||||
Prepaid expenses and other current and non-current assets | 28,310 | 20,285 | (28,871 | ) | |||||||
Accounts payable | 38,952 | (1,035 | ) | (461 | ) | ||||||
Accrued liabilities | (2,623 | ) | 26,866 | 3,862 | |||||||
Income tax payable/(recoverable) | 50,801 | 13,414 | 4,300 | ||||||||
Other assets and liabilities | 4,236 | 4,682 | (13,079 | ) | |||||||
Net cash provided by operating activities | 852,520 | 776,820 | 687,927 | ||||||||
Investing activities: | |||||||||||
Purchase of property and equipment | (269,835 | ) | (552,702 | ) | (315,624 | ) | |||||
Purchase of available-for-sale securities | — | (469 | ) | (340,527 | ) | ||||||
Proceeds from maturities of available-for-sale securities | — | 186,793 | 390,009 | ||||||||
Purchase of business, net of cash acquired (Note 6) | — | (117,994 | ) | — | |||||||
Other investing | (7,574 | ) | (5,976 | ) | (12,572 | ) | |||||
Net cash used in investing activities | (277,409 | ) | (490,348 | ) | (278,714 | ) | |||||
Financing activities: | |||||||||||
Repurchase of common stock, including transaction costs | (219,907 | ) | (209,357 | ) | (1,300,009 | ) | |||||
Proceeds from debt issuances | 100,000 | — | 1,175,000 | ||||||||
Payment of debt | (107,729 | ) | — | (175,000 | ) | ||||||
Debt issuance costs | (1,916 | ) | — | (13,588 | ) | ||||||
Proceeds from the issuance of common stock | 57,412 | 59,148 | 51,875 | ||||||||
Tax withholding paid on behalf of employees for restricted stock units | (24,708 | ) | (15,516 | ) | (22,168 | ) | |||||
Excess tax benefit from exercises of stock options | — | 65 | 935 | ||||||||
Other financing | — | 10 | (29 | ) | |||||||
Net cash used in financing activities | (196,848 | ) | (165,650 | ) | (282,984 | ) | |||||
Effect of exchange rate changes on cash | 2,360 | (1,105 | ) | (294 | ) | ||||||
Net increase in cash, cash equivalents and restricted cash | 380,623 | 119,717 | 125,935 | ||||||||
Cash, cash equivalents and restricted cash at the beginning of the period | 545,779 | 426,062 | 300,127 | ||||||||
Cash, cash equivalents and restricted cash at the end of the period | $ | 926,402 | $ | 545,779 | $ | 426,062 | |||||
Supplemental disclosure of cash flow information: | |||||||||||
Cash paid during the year for interest | $ | 70,208 | $ | 71,171 | $ | 2,164 | |||||
Cash paid during the year for income taxes | $ | 41,478 | $ | 52,656 | $ | 34,942 | |||||
Non-cash investing and financing information: | |||||||||||
Capital expenditure adjustments included in liabilities | $ | 31,769 | $ | 75,340 | $ | 33,548 | |||||
See accompanying notes.
57
Qorvo, Inc. and Subsidiaries
Notes to Consolidated Financial Statements
March 31, 2018
1. | THE COMPANY AND ITS SIGNIFICANT ACCOUNTING POLICIES |
On February 22, 2014, RF Micro Devices, Inc. ("RFMD") and TriQuint Semiconductor, Inc. ("TriQuint") entered into an Agreement and Plan of Merger and Reorganization (as subsequently amended on July 15, 2014, the "Merger Agreement") providing for the business combination of RFMD and TriQuint (the "Business Combination") under a new holding company named Qorvo, Inc. The stockholders of both RFMD and TriQuint approved the Merger Agreement at each company's special meeting of stockholders on September 5, 2014. During the third quarter of fiscal 2015, all necessary regulatory approvals were received to complete the Business Combination. The Business Combination closed on January 1, 2015 (fourth quarter of fiscal 2015). For financial reporting and accounting purposes, RFMD was the acquirer of TriQuint.
The Company is a product and technology leader at the forefront of the growing global demand for always-on broadband connectivity. The Company combines a broad portfolio of radio frequency (“RF”) solutions, highly differentiated semiconductor technologies, deep systems-level expertise and scale manufacturing to supply a diverse group of customers in expanding markets, including smartphones and other mobile devices, defense and aerospace, Wi-Fi customer premises equipment, cellular base stations, optical networks, automotive connectivity, and smart home applications. Within these markets, the Company's products enable a broad range of leading-edge applications - from very-high-power wired and wireless infrastructure solutions to ultra-low-power smart home solutions. The Company's products and technologies help transform how people around the world access their data, transact commerce, and interact with their communities.
The Company’s design and manufacturing expertise covers many semiconductor process technologies, which it sources both internally and through external suppliers. The Company’s primary wafer fabrication facilities are located in Florida, North Carolina, Oregon and Texas and its primary assembly and test facilities are located in China, Costa Rica, Germany and Texas. The Company operates design, sales and manufacturing facilities throughout Asia, Europe and North America.
Principles of Consolidation and Basis of Presentation
The consolidated financial statements include the accounts of the Company and its wholly owned subsidiaries. All significant intercompany accounts and transactions have been eliminated in consolidation. Certain items in the fiscal years 2017 and 2016 financial statements have been reclassified to conform to the fiscal 2018 presentation, such as restricted cash in accordance with Accounting Standards Update ("ASU") 2016-18.
Accounting Periods
The Company uses a 52- or 53-week fiscal year ending on the Saturday closest to March 31 of each year. The most recent three fiscal years ended on March 31, 2018, April 1, 2017, and April 2, 2016. Fiscal years 2018 and 2017 were 52-week years, and fiscal year 2016 was a 53-week year.
Use of Estimates
The preparation of the consolidated financial statements in conformity with accounting principles generally accepted in the U.S. requires management to make estimates and assumptions that affect the amounts reported in the consolidated financial statements and accompanying notes. The actual results that the Company experiences may differ materially from its estimates. The Company makes estimates for the returns reserve, rebates, allowance for doubtful accounts, inventory valuation including reserves, warranty reserves, income tax valuation, current and deferred income taxes, uncertain tax positions, non-marketable equity investments, other-than-temporary impairments of investments, goodwill, long-lived assets and other financial statement amounts on a regular basis and makes adjustments based on historical experiences and expected future conditions. Accounting estimates require difficult and subjective judgments and actual results may differ from the Company’s estimates.
During the first quarter of fiscal 2018, the Company changed its accounting estimate for the expected useful lives of certain machinery and equipment. The Company evaluated its asset base and reassessed the estimated useful lives of certain machinery and equipment in connection with its implementation of several capital projects, including the migration of certain surface acoustic wave ("SAW") processes from 4-inch to 6-inch toolsets and certain bulk
58
Qorvo, Inc. and Subsidiaries
Notes to Consolidated Financial Statement (continued)
Notes to Consolidated Financial Statement (continued)
acoustic wave ("BAW") processes from 6-inch to 8-inch toolsets. Based on its ability to re-use equipment across generations of process technologies and historical usage trends, the Company determined that the expected useful lives for certain machinery and equipment should be increased by up to three years to reflect more closely the estimated economic lives of those assets. This change in estimate was applied prospectively effective for the first quarter of fiscal 2018 and resulted in a decrease in depreciation expense of $59.7 million for fiscal 2018. This decrease in depreciation expense for fiscal 2018 resulted in the following: (1) an increase in income from operations of $47.4 million; (2) an increase in net income of $44.1 million; (3) an improvement in earnings per share of $0.34; and (4) a reduction in inventory of $12.3 million.
Cash and Cash Equivalents
Cash and cash equivalents consist of demand deposit accounts, money market funds, and other temporary, highly-liquid investments with original maturities of three months or less when purchased.
Investments
Investments available-for-sale at March 31, 2018 and April 1, 2017 consisted of auction rate securities ("ARS"). Available-for-sale investments with an original maturity date greater than approximately three months and less than one year are classified as current investments. Available-for-sale investments with an original maturity date exceeding one year are classified as long-term.
Available-for-sale securities are carried at fair value with the unrealized gains and losses, net of tax, reported in “Other comprehensive income (loss).” The cost of securities sold is based on the specific identification method and any realized gain or loss is included in “Other (expense) income.” The cost of available-for-sale securities is adjusted for premiums and discounts, with the amortization or accretion of such amounts included as a portion of interest.
The Company assesses individual investments for impairment quarterly. Investments are impaired when the fair value is less than the amortized cost. If an investment is impaired, the Company evaluates whether the impairment is other-than-temporary. A debt investment impairment is considered other-than-temporary if (i) the Company intends to sell the security, (ii) it is more likely than not that the Company will be required to sell the security before recovery of the entire amortized cost basis, or (iii) the Company does not expect to recover the entire amortized cost basis of the security (a credit loss). Other-than-temporary declines in the Company's debt securities are recognized as a loss in the statement of operations if due to credit loss; all other losses on debt securities are recorded in “Other comprehensive income (loss).” The previous amortized cost basis less the other-than-temporary impairment becomes the new cost basis and is not adjusted for subsequent recoveries in fair value.
Inventories
Inventories are stated at the lower of cost or net realizable value (cost is based on standard cost, which approximates actual average cost). The Company’s business is subject to the risk of technological and design changes. The Company evaluates inventory levels quarterly against sales forecasts on a product family basis to evaluate its overall inventory risk. Reserves are adjusted to reflect inventory values in excess of forecasted sales and management's analysis and assessment of overall inventory risk. In the event the Company sells inventory that had been covered by a specific inventory reserve, the sale is recorded at the actual selling price and the related cost of goods sold is recorded at the full inventory cost, net of the reserve. Abnormal production levels are charged to the income statement in the period incurred rather than as a portion of inventory cost.
Product Warranty
The Company generally sells products with a limited warranty on product quality. The Company accrues for known warranty issues if a loss is probable and can be reasonably estimated, and accrues for estimated incurred but unidentified issues based on historical activity. The accrual and the related expense for known product warranty issues were not significant during the periods presented. Due to product testing and the short time typically between product shipment and the detection and correction of product failures and the historical rate of losses, the accrual and related expense for estimated incurred but unidentified issues was not significant during the periods presented.
59
Qorvo, Inc. and Subsidiaries
Notes to Consolidated Financial Statement (continued)
Notes to Consolidated Financial Statement (continued)
Other Receivables
The Company records miscellaneous non-product receivables that are collectible within 12 months in “Other receivables,” such as value-added tax receivables ($38.1 million as of March 31, 2018 and $55.4 million as of April 1, 2017, which are reported on a net basis), precious metal reclaims submitted for payment and other miscellaneous items.
Property and Equipment
Property and equipment are stated at cost, less accumulated depreciation. Depreciation of property and equipment is computed using the straight-line method over the estimated useful lives of the assets, ranging from one year to thirty-nine years. The Company capitalizes interest on borrowings related to eligible capital expenditures. Capitalized interest is added to the cost of qualified assets and depreciated together with that asset cost. The Company’s assets acquired under capital leases and leasehold improvements are amortized over the lesser of the asset life or lease term (which is reasonably assured) and included in depreciation. The Company records capital-related government grants earned as a reduction to property and equipment and depreciates such grants over the estimated useful lives of the associated assets.
The Company periodically evaluates the period over which it expects to recover the economic value of the Company’s property and equipment, considering factors such as changes in machinery and equipment technology, the ability to re-use equipment across generations of process technology and historical usage trends. If the Company determines that the useful lives of its assets are shorter or longer than originally estimated, the rate of depreciation is adjusted to reflect the revised useful lives of the assets.
The Company assesses property and equipment for impairment when events or changes in circumstances indicate that the carrying amount of its assets may not be recoverable. Factors that are considered in deciding when to perform an impairment review include an adverse change in the use of the Company’s assets or an expectation that the assets will be sold or otherwise disposed. The Company assesses the recoverability of the assets held for use by comparing the projected undiscounted net cash flows associated with the related asset or group of assets over their remaining estimated useful lives against their respective carrying amounts. Assets identified as “held for sale” are recorded at the lesser of their carrying value or their fair market value less costs to sell. Impairment, if any, is based on the excess of the carrying amount over the fair value of those assets.
Goodwill and Intangible Assets
Goodwill is recorded when the purchase price paid for a business exceeds the estimated fair value of the net identified tangible and intangible assets acquired. Intangibles are recorded when such assets are acquired by purchase or license. The value of the Company's intangibles, including goodwill, could be impacted by future adverse changes such as: (i) any future declines in the Company's operating results; (ii) a decline in the value of technology company stocks, including the value of the Company's common stock; (iii) a prolonged or more significant slowdown in the worldwide economy or the semiconductor industry; or (iv) failure to meet the performance projections included in the Company's forecasts of future operating results.
The Company accounts for goodwill and indefinite-lived intangible assets in accordance with the Financial Accounting Standards Board ("FASB") guidance, which requires annual testing for impairment or whenever events or circumstances make it more likely than not that an impairment may have occurred. The Company performs its annual impairment tests on the first day of the fourth quarter in each fiscal year. Indefinite-lived intangible assets consist of in-process research and development ("IPRD").
The Company has the option to perform a qualitative assessment (commonly referred to as "step zero") to determine whether further quantitative analysis for impairment of goodwill or indefinite-lived intangible assets is necessary. In performing step zero for its impairment test, the Company is required to make assumptions and judgments, including the evaluation of macroeconomic conditions as related to the Company's business, industry and market trends, and the overall future financial performance of the Company's reporting units and future opportunities in the markets in which they operate. The Company also considers recent fair value calculations of its indefinite-lived
60
Qorvo, Inc. and Subsidiaries
Notes to Consolidated Financial Statement (continued)
Notes to Consolidated Financial Statement (continued)
intangible assets and reporting units as well as cost factors such as changes in raw materials, labor or other costs. If the step zero analysis indicates that it is more likely than not that the fair value of a reporting unit or indefinite-lived asset is less than its respective carrying value including goodwill, then the Company would perform an additional quantitative analysis. For goodwill, this involves a two-step process. The first step compares the fair value of the reporting unit, including its goodwill, to its carrying value. If the carrying value of the reporting unit exceeds its fair value, then the second step of the process is performed to determine the amount of impairment. The second step compares the implied fair value of the reporting unit's goodwill to the carrying value of the goodwill. An impairment charge is recognized for the amount the carrying value of the reporting unit's goodwill exceeds its implied fair value.
For indefinite-lived intangible assets, the quantitative analysis compares the carrying value of the asset to its fair value and an impairment charge is recognized for the amount its carrying value exceeds its fair value. Determining the fair value of reporting units, indefinite-lived intangible assets and implied fair value of a reporting unit's goodwill is reliant upon estimated future revenues, profitability and cash flows and consideration of market factors. Assumptions, judgments and estimates are complex, subjective and can be affected by a variety of factors, including external factors such as industry and economic trends, and internal factors such as changes in the Company's business strategy or its internal forecasts. Although the Company believes the assumptions, judgments and estimates it has made have been reasonable and appropriate, different assumptions, judgments and estimates could materially affect its results of operations.
Goodwill
Goodwill is allocated to the Company's reporting units based on the expected benefit from the synergies of the business combinations generating the underlying goodwill. As of March 31, 2018, the Company's goodwill balance of $2,173.9 million is allocated between its Mobile Products ("MP") and Infrastructure and Defense Products ("IDP") reporting units. In fiscal years 2018 and 2017, the Company completed qualitative assessments of the fair value of its reporting units and concluded that goodwill was not impaired.
For fiscal 2016, although there were no indicators of impairment, the Company opted to bypass the qualitative assessment and proceeded to perform fair value assessments of its reporting units (the first step of the quantitative impairment analysis) as the fair value of the reporting units had changed (due to the Business Combination) since the last time the Company performed a quantitative analysis. The quantitative assessments performed reaffirmed that there were no indicators of impairment for fiscal 2016.
In performing these quantitative assessments, consistent with its historical approach, the Company used both the income and market approaches to estimate the fair value of its reporting units. The income approach involves discounting future estimated cash flows. The sum of the reporting unit cash flow projections was compared to the Company's market capitalization in a discounted cash flow framework to calculate an overall implied internal rate of return (or discount rate) for the Company. The Company's market capitalization was adjusted to a control basis assuming a reasonable control premium, which resulted in an implied discount rate. This implied discount rate serves as a baseline for estimating the specific discount rate for each reporting unit.
The discount rate used is the value-weighted average of the Company's estimated cost of equity and debt (“cost of capital”) derived using both known and estimated customary market metrics. The Company's weighted average cost of capital is adjusted for each reporting unit to reflect a risk factor, if necessary, for each reporting unit. The Company performs sensitivity tests with respect to growth rates and discount rates used in the income approach. The Company believes the income approach is appropriate because it provides a fair value estimate based upon the respective reporting unit’s expected long-term operations and cash flow performance.
The Company considered historical rates and current market conditions when determining the discount and growth rates used in its analysis. For fiscal 2016, the material assumptions used for the income approach were eight years of projected net cash flows and a long-term growth rate of 3% for both the MP and IDP reporting units. A discount rate of 15% and 16% was used for the MP and IDP reporting units, respectively.
In applying the market approach, valuation multiples are derived from historical and projected operating data of selected guideline companies, which are evaluated and adjusted, if necessary, based on the strengths and weaknesses
61
Qorvo, Inc. and Subsidiaries
Notes to Consolidated Financial Statement (continued)
Notes to Consolidated Financial Statement (continued)
of the reporting unit relative to the selected guideline companies. The valuation multiples are then applied to the appropriate historical and/or projected operating data of the reporting unit to arrive at an indication of fair value. The Company believes the market approach is appropriate because it provides a fair value using multiples from companies with operations and economic characteristics similar to its reporting units. The Company weighted the results of the income approach and the results of the market approach at 50% each and for the MP and IDP reporting units, concluded that the fair value of the reporting units was determined to be substantially in excess of the carrying value, and as such, no further analysis was warranted.
Under the income approach described above, the following indicates the sensitivity of key assumptions utilized in the assessment. A one percentage point decrease in the discount rate would have increased the fair value of the MP and IDP reporting units by approximately $660.0 million and $140.0 million, respectively, while a one percentage point increase in the discount rate would have decreased the fair value of the MP and IDP reporting units by approximately $560.0 million and $110.0 million, respectively. A one percentage point decrease in the long-term growth rate would have decreased the fair value of the MP and IDP reporting units by approximately $290.0 million and $50.0 million, respectively, while a one percentage point increase in the long-term growth rate would have increased the fair value of the MP and IDP reporting units by approximately $340.0 million and $70.0 million, respectively.
Intangible Assets with Indefinite Lives
In fiscal 2015, as a result of the Business Combination, the Company recorded IPRD of $470.0 million. IPRD was recorded at fair value as of the date of acquisition as an indefinite-lived intangible asset until the completion or abandonment of the associated research and development ("R&D") efforts or impairment. The fair value of the acquired IPRD was determined based on an income approach using the "excess earnings method," which estimated the value of the intangible assets by discounting the future projected earnings of the asset to present value as of the valuation date. Upon completion of development, acquired IPRD assets are transferred to finite-lived intangible assets and amortized over their useful lives. During fiscal years 2018, 2017 and 2016, the Company completed and transferred into developed technology approximately $37.0 million, $220.0 million and $203.0 million, respectively, of IPRD. The Company performed a qualitative assessment of the remaining IPRD of $10.0 million during fiscal 2018 and concluded that IPRD was not impaired.
Intangible Assets with Definite Lives
Intangible assets are recorded when such assets are acquired by purchase or license. Finite-lived intangible assets consist primarily of technology licenses, customer relationships, developed technology and trade names resulting from business combinations and are subject to amortization.
Technology licenses are recorded at cost and are amortized on a straight-line basis over the lesser of the estimated useful life of the technology or the term of the license agreement, ranging from approximately five to eight years.
The fair value of customer relationships acquired during fiscal years 2013, 2015 and 2017 was determined based on an income approach using the “with and without method," in which the value of the asset is determined by the difference in discounted cash flows of the profitability of the Company "with" the asset and the profitability of the Company "without" the asset. Customer relationships are amortized on a straight-line basis over the estimated useful life, ranging from three to ten years.
The fair value of developed technology acquired during fiscal years 2013, 2015 and 2017 was determined based on an income approach using the "excess earnings method," which estimated the value of the intangible assets by discounting the future projected earnings of the asset to present value as of the valuation date. Developed technology is amortized on a straight-line basis over the estimated useful life, ranging from three to six years.
The fair value of trade names acquired in fiscal years 2015 and 2017 was determined based on an income approach using the "relief from royalty method," in which the value of the asset is determined by discounting the future projected cash flows generated from the trade name's estimated royalties. Trade names are amortized on a straight-line basis over the estimated useful life of two to three years.
62
Qorvo, Inc. and Subsidiaries
Notes to Consolidated Financial Statement (continued)
Notes to Consolidated Financial Statement (continued)
The Company regularly reviews identified intangible assets to determine if facts and circumstances indicate that the useful lives have changed from the original estimate or that the carrying amount of the assets may not be recoverable. If such facts and circumstances exist, the Company assesses the recoverability of identified intangible assets by comparing the projected undiscounted net cash flows associated with the related asset or group of assets over their remaining lives against their respective carrying amounts. Impairments, if any, are based on the excess of the carrying amount over the fair value of those assets and occur in the period in which the impairment determination was made.
Accrued Liabilities
The "Accrued liabilities" balance as of March 31, 2018 and April 1, 2017 includes accrued compensation and benefits of $96.7 million and $98.7 million, respectively, and interest payable of $23.1 million and $23.2 million, respectively.
Revenue Recognition
The Company's net revenue is generated principally from sales of semiconductor products. The Company recognizes revenue from product sales when the fundamental criteria are met, such as the time at which the title and risk and rewards of product ownership are transferred to the customer, price and terms are fixed or determinable, no significant vendor obligation exists and collection of the resulting receivable is reasonably assured.
Sales of products are generally made through either the Company's sales force, manufacturers' representatives or through a distribution network. Revenue from the majority of the Company's products is recognized upon shipment of the product to the customer from a Company-owned or third-party location. Some revenue is recognized upon receipt of the shipment by the customer. The Company has limited rebate programs offering price protection to certain distributors. These rebates represent less than 5% of net revenue and can be reasonably estimated based on specific criteria included in the rebate agreements and other known factors at the time. The Company reduces revenue and records reserves for product returns and allowances for price protection, stock rotation, and scrap allowance based on historical experience or specific identification depending on the contractual terms of the arrangement.
The Company also recognizes a portion of its net revenue through other agreements such as non-recurring engineering fees, contracts for R&D work, royalty income, intellectual property ("IP") revenue, and service revenue. These agreements are collectively less than 1% of consolidated annual revenue. Revenue from these agreements is recognized when the service is completed or upon certain milestones, as provided for in the agreements.
Revenue from certain contracts is recognized on the percentage of completion method based on the costs incurred to date and the total contract amount, plus the contractual fee. If these contracts experience cost overruns, the percentage of completion method is used to determine revenue recognition. Revenue from fixed price contracts is recognized when the required deliverable is satisfied.
Royalty income is recognized based on a percentage of sales of the relevant product reported by licensees during the period.
The Company additionally licenses or sells its rights to use portions of its IP portfolio, which includes certain patent rights useful in the manufacture and sales of certain products. IP revenue recognition is dependent on the terms of each agreement. The Company will recognize IP revenue upon delivery of the IP if the Company has no substantive future obligation to perform under the arrangement. The Company will defer recognition of IP revenue where future performance obligations are required to earn the revenue or the revenue is not guaranteed. Revenue from services is recognized during the period that the service is performed.
Accounts receivable are recorded for all revenue items listed above and do not bear interest. The Company evaluates the collectability of accounts receivable based on a combination of factors. In cases where the Company is aware of circumstances that may impair a specific customer’s ability to meet its financial obligations subsequent to the original sale, the Company will record an allowance against amounts due, and thereby reduce the receivable to the amount the Company reasonably believes will be collected. For all other customers, the Company recognizes
63
Qorvo, Inc. and Subsidiaries
Notes to Consolidated Financial Statement (continued)
Notes to Consolidated Financial Statement (continued)
allowances for doubtful accounts based on the length of time the receivables are past due, industry and geographic concentrations, the current business environment and the Company’s historical experience.
The Company's terms and conditions do not give its customers a right of return associated with the original sale of its products. However, the Company will authorize sales returns under certain circumstances, which include perceived quality problems, courtesy returns and like-kind exchanges. The Company evaluates its estimate of returns by analyzing all types of returns and the timing of such returns in relation to the original sale. Reserves are adjusted to reflect changes in the estimated returns versus the original sale of product.
Shipping and Handling Cost
The Company recognizes amounts billed to a customer in a sale transaction related to shipping and handling as revenue. The costs incurred by the Company for shipping and handling are classified as cost of goods sold in the Consolidated Statements of Operations.
Research and Development
The Company charges all R&D costs to expense as incurred.
Precious Metals Reclaim
The Company uses historical experience to estimate the amount of reclaim on precious metals used in manufacturing at the end of each period and states the reclaim value at the lower of average cost or market. The estimated value to be received from precious metal reclaim is included in "Other current assets" and reclaims submitted for payment are included in "Other receivables" in the Consolidated Balance Sheets.
Income Taxes
The Company accounts for income taxes under the liability method, which requires recognition of deferred tax assets and liabilities for the temporary differences between the financial reporting and tax basis of assets and liabilities and for tax carryforwards. Deferred tax assets and liabilities for each tax jurisdiction are measured using the enacted statutory tax rates in effect for the years in which the differences are expected to reverse. A valuation allowance is provided against deferred tax assets to the extent the Company determines it is more likely than not that some portion or all of its deferred tax assets will not be realized.
A more likely than not recognition threshold is required to be met before the Company recognizes the benefit of an income tax position in its financial statements. The Company’s policy is to recognize accrued interest and penalties, if incurred, on any unrecognized tax benefits as a component of income tax expense.
It is the Company’s current intent and policy to invest the earnings of foreign subsidiaries indefinitely outside the U.S., except for Qorvo International Pte. Ltd. in Singapore. Accordingly, the Company does not record a deferred tax liability for U.S. income taxes on unremitted foreign earnings of other foreign subsidiaries.
Stock-Based Compensation
Under FASB Accounting Standards Codification ("ASC") 718, “Compensation – Stock Compensation," stock-based compensation cost is measured at the grant date, based on the estimated fair value of the award using an option pricing model for stock options (Black-Scholes) and market price for restricted stock units, and is recognized as expense over the employee's requisite service period.
As of March 31, 2018, total remaining unearned compensation cost related to unvested restricted stock units and options was $72.8 million, which will be amortized over the weighted-average remaining service period of approximately 1.2 years.
64
Qorvo, Inc. and Subsidiaries
Notes to Consolidated Financial Statement (continued)
Notes to Consolidated Financial Statement (continued)
Foreign Currency Translation
The financial statements of foreign subsidiaries have been translated into U.S. dollars in accordance with FASB ASC 830, “Foreign Currency Matters.” The functional currency for most of the Company’s international operations is the U.S. dollar. The functional currency for the remainder of the Company’s foreign subsidiaries is the local currency. Assets and liabilities denominated in foreign currencies are translated using the exchange rates on the balance sheet dates. Revenues and expenses are translated using the average exchange rates throughout the year. Translation adjustments are shown separately as a component of “Accumulated other comprehensive loss” within “Stockholders’ equity” in the Consolidated Balance Sheets. Foreign currency transaction gains or losses (transactions denominated in a currency other than the functional currency) are reported in “Other income (expense)” in the Consolidated Statements of Operations.
Recent Accounting Pronouncements
Accounting Pronouncements Not Yet Effective
In January 2017, the FASB issued ASU 2017-04, "Intangibles-Goodwill and Other (Topic 350): Simplifying the Test for Goodwill Impairment." The new guidance simplifies the subsequent measurement of goodwill by eliminating the second step from the quantitative goodwill impairment test. The Company will continue to have the option to perform a qualitative assessment to determine if a quantitative goodwill impairment test is necessary. The new standard will become effective for the Company beginning in fiscal 2021 with early adoption permitted. The Company does not believe it will have a significant impact on its consolidated financial statements.
In January 2017, the FASB issued ASU 2017-01, "Business Combinations (Topic 805): Clarifying the Definition of a Business." The new guidance clarifies the definition of a business and provides further guidance for evaluating whether a transaction will be accounted for as an acquisition of an asset or a business. The new standard will become effective for the Company beginning in the first quarter of fiscal 2019 with early adoption permitted. The update should be applied prospectively. The Company does not believe it will have a significant impact on its consolidated financial statements.
In August 2016, the FASB issued ASU 2016-15, "Statement of Cash Flows (Topic 230): Classification of Certain Cash Receipts and Cash Payments (a consensus of the FASB’s Emerging Issues Task Force)." The new guidance addresses eight specific cash flow issues with the objective of reducing the existing diversity in practice. The new standard will become effective for the Company beginning in the first quarter of fiscal 2019. The Company does not believe it will have a significant impact on its consolidated financial statements.
In June 2016, the FASB issued ASU 2016-13, "Financial Instruments - Credit Losses (Topic 326): Measurement of Credit Losses on Financial Instruments." The new guidance requires entities to use a current lifetime expected credit loss methodology to measure impairments of certain financial instruments. It also modifies the impairment model for available-for-sale debt securities and provides for a simplified accounting model for purchased financial assets with credit deterioration since their origination. The new standard will become effective for the Company beginning in the first quarter of fiscal 2021 with early adoption permitted. The Company does not believe it will have a significant impact on its consolidated financial statements.
In February 2016, the FASB issued ASU 2016-02, "Leases (Topic 842)." The new guidance requires lessees to recognize a right-of-use asset and a lease liability for all leases with a term longer than 12 months, including those previously described as operating leases. Consistent with current U.S. generally accepted accounting principles ("GAAP"), the recognition, measurement, and presentation of expenses and cash flows arising from a lease by a lessee will primarily depend on its classification as a finance or operating lease. The new guidance will become effective for the Company in the first quarter of fiscal 2020. The Company expects the valuation of the right-of-use assets and lease liabilities, for leases previously described as operating leases, to be the present value of its forecasted future lease commitments. The Company is continuing to assess the overall impacts of the new standard, including the discount rate to be applied in these valuations.
In January 2016, the FASB issued ASU 2016-01, "Financial Instruments - Overall (Subtopic 825-10): Recognition and Measurement of Financial Assets and Financial Liabilities." The new guidance will affect the accounting for
65
Qorvo, Inc. and Subsidiaries
Notes to Consolidated Financial Statement (continued)
Notes to Consolidated Financial Statement (continued)
equity investments, financial liabilities measured under the fair value option and presentation and disclosure requirements for financial instruments. In addition, the FASB clarified guidance related to the assessment of valuation allowances when recognizing deferred tax assets related to unrealized losses on available-for-sale debt securities. The new standard is effective for the Company beginning in the first quarter of fiscal 2019. The Company does not believe it will have a significant impact on its consolidated financial statements.
In May 2014, the FASB issued ASU 2014-09, "Revenue from Contracts with Customers (Topic 606)," with several amendments subsequently issued. The new guidance provides an updated framework for revenue recognition, resulting in a single revenue model to be applied by reporting companies under U.S. GAAP. Under the new model, recognition of revenue occurs when a customer obtains control of promised goods or services in an amount that reflects the consideration to which the entity expects to be entitled in exchange for those goods or services. Additional disclosures will be required regarding the nature, amount, timing and uncertainty of cash flows. The Company will adopt the standard in the first quarter of fiscal 2019 using the modified retrospective approach, under which the cumulative effect of adoption is recognized at the date of initial application. The Company has evaluated the impact of the standard and does not anticipate that the adoption of this standard will have a material impact on its consolidated financial statements. The Company is implementing changes to its accounting policies, internal controls and disclosures to support the new standard; however, these changes are not expected to be material.
Accounting Pronouncements Recently Adopted
In March 2018, the FASB issued ASU 2018-05, "Income Taxes (Topic 740): Amendments to SEC Paragraphs Pursuant to SEC Staff Accounting Bulletin No. 118." The amendments incorporate into the ASC the recent SEC guidance related to the income tax accounting implications of the Tax Cuts and Jobs Act (the "Tax Act"). See Note 12 for further disclosures.
In May 2017, the FASB issued ASU 2017-09, "Compensation—Stock Compensation (Topic 718): Scope of Modification Accounting." The new guidance clarifies when modification accounting in Topic 718 should be applied to changes to the terms or conditions of a share-based payment award. The Company elected to early-adopt the standard in the first quarter of fiscal 2018 with no impact on its consolidated financial statements.
In November 2016, the FASB issued ASU 2016-18, "Statement of Cash Flows (Topic 230): Restricted Cash (a consensus of the FASB Emerging Issues Task Force)." The new guidance requires that restricted cash and restricted cash equivalents be included in cash and cash equivalents when reconciling the beginning-of-period and end-of-period total amounts shown in the statement of cash flows. The Company adopted the provisions of ASU 2016-18 in the second quarter of fiscal 2018 using the retrospective transition method. The adjustment to reclassify restricted cash for each period presented was less than $1.0 million.
In October 2016, the FASB issued ASU 2016-16, "Income Taxes (Topic 740), Intra-Entity Transfers of Assets Other Than Inventory." The new guidance requires an entity to recognize the income tax consequences of an intra-entity transfer of an asset, other than inventory, when the transfer occurs. The Company elected to early-adopt the standard in the first quarter of fiscal 2018 using the modified retrospective method (which resulted in a cumulative adjustment to retained earnings of $1.2 million as of the beginning of the period of adoption). During fiscal 2018, the Company recognized a tax expense of $6.9 million related to transfers of intra-entity assets.
In March 2016, the FASB issued ASU 2016-09, "Compensation - Stock Compensation (Topic 718): Improvements to Employee Share-Based Payment Accounting." The new guidance simplifies certain aspects of accounting for share-based payment transactions, including income tax consequences, forfeitures, classification of awards on the balance sheet and presentation on the statement of cash flows, and became effective for the Company in the first quarter of fiscal 2018. The Company recognized a cumulative-effect adjustment to reduce the Company's accumulated deficit by $36.7 million with a corresponding increase to deferred tax assets for the federal and state net operating losses attributable to excess tax benefits that had not been previously recognized. All excess tax benefits and deficiencies in the current and future periods will be recognized as income tax expense in the Company’s Consolidated Statement of Operations in the reporting period in which they occur. This will result in increased volatility in the Company’s effective tax rate. During fiscal 2018, the Company recognized a discrete tax benefit of $12.2 million related to the excess tax benefits from stock-based compensation. The Company also elected to prospectively adopt the provision that requires excess tax benefits to be presented within operating activities in the statement of cash flows and no
66
Qorvo, Inc. and Subsidiaries
Notes to Consolidated Financial Statement (continued)
Notes to Consolidated Financial Statement (continued)
prior periods have been restated as a result of the adoption. The Company has continued its existing practice of estimating expected forfeitures in determining compensation cost.
In March 2016, the FASB issued ASU 2016-07, "Investments-Equity Method and Joint Ventures (Topic 323): Simplifying the Transition to the Equity Method of Accounting." The new guidance eliminates the requirement to retrospectively apply the equity method of accounting when an investment previously accounted for under the cost basis qualifies for the equity method of accounting. The Company adopted ASU 2016-07 in the first quarter of fiscal 2018 with no impact on its consolidated financial results.
In July 2015, the FASB issued ASU 2015-11, "Inventory (Topic 330): Simplifying the Measurement of Inventory." The new guidance changes the measurement principle for inventory from the lower of cost or market to the lower of cost and net realizable value. ASU 2015-11 defines net realizable value as the estimated selling price in the ordinary course of business less reasonably predictable costs to completion, transportation, or disposal. The Company adopted ASU 2015-11 in the first quarter of fiscal 2018 with no significant impact on its consolidated financial statements.
2. CONCENTRATIONS OF CREDIT RISK
The Company’s principal financial instrument subject to potential concentration of credit risk is accounts receivable, which is unsecured. The Company provides an allowance for doubtful accounts equal to estimated losses expected to be incurred in the collection of accounts receivable. The Company has adopted credit policies and standards intended to accommodate industry growth and inherent risk and it believes that credit risks are moderated by the financial stability of its major customers, conservative payment terms and the Company’s strict credit policies.
Revenue from significant customers, those representing 10% or more of revenue for the respective periods, are summarized as follows:
Fiscal Year | |||||
2018 | 2017 | 2016 | |||
Apple Inc. ("Apple") | 36% | 34% | 37% | ||
Huawei Technologies Co., Ltd. | 8% | 11% | 12% | ||
The Company provided its products to Apple through sales to multiple contract manufacturers.
These customers primarily purchase cellular RF and Wi-Fi solutions offered by the Company's MP segment for a variety of mobile devices, including smartphones, notebook computers, wearables, tablets and cellular-based applications for the Internet of Things ("IoT").
Accounts receivable related to these customers (which includes multiple contract manufacturers) accounted for 26%, 40%, and 40% of the Company's total net accounts receivable balance as of March 31, 2018, April 1, 2017 and April 2, 2016, respectively.
67
Qorvo, Inc. and Subsidiaries
Notes to Consolidated Financial Statement (continued)
Notes to Consolidated Financial Statement (continued)
3. INVESTMENTS AND FAIR VALUE OF FINANCIAL INSTRUMENTS
Investments
The following is a summary of cash equivalents and available-for-sale securities as of March 31, 2018 and April 1, 2017 (in thousands):
Cost | Gross Unrealized Gains | Gross Unrealized Losses | Estimated Fair Value | ||||||||||||
March 31, 2018 | |||||||||||||||
Auction rate securities | $ | 1,950 | $ | — | $ | (107 | ) | $ | 1,843 | ||||||
Money market funds | 9 | — | — | 9 | |||||||||||
$ | 1,959 | $ | — | $ | (107 | ) | $ | 1,852 | |||||||
April 1, 2017 | |||||||||||||||
Auction rate securities | $ | 2,150 | $ | — | $ | (429 | ) | $ | 1,721 | ||||||
Money market funds | 14 | — | — | 14 | |||||||||||
$ | 2,164 | $ | — | $ | (429 | ) | $ | 1,735 | |||||||
The estimated fair value of available-for-sale securities was based on the prevailing market values on March 31, 2018 and April 1, 2017. The Company determines the cost of an investment sold based on the specific identification method.
The expected maturity distribution of cash equivalents and available-for-sale debt securities is as follows (in thousands):
March 31, 2018 | April 1, 2017 | ||||||||||||||
Cost | Estimated Fair Value | Cost | Estimated Fair Value | ||||||||||||
Due in less than one year | $ | 9 | $ | 9 | $ | 14 | $ | 14 | |||||||
Due after ten years | 1,950 | 1,843 | 2,150 | 1,721 | |||||||||||
Total investments in debt securities | $ | 1,959 | $ | 1,852 | $ | 2,164 | $ | 1,735 | |||||||
Other Investments
As of March 31, 2018, the Company had invested $45.0 million to acquire shares of Series F Preferred Stock of Cavendish Kinetics Limited, a private limited company incorporated in England and Wales. This investment is accounted for as a cost method investment and classified in "Long-term investments" in the Consolidated Balance Sheets.
Fair Value of Financial Instruments
Marketable securities are measured at fair value and recorded in "Cash and cash equivalents" and "Long-term investments" in the Consolidated Balance Sheets, and the related unrealized gains and losses are included in "Accumulated other comprehensive loss," a component of stockholders’ equity, net of tax.
68
Qorvo, Inc. and Subsidiaries
Notes to Consolidated Financial Statement (continued)
Notes to Consolidated Financial Statement (continued)
Recurring Fair Value Measurements
The fair value of the financial assets and liabilities measured at fair value on a recurring basis was determined using the following levels of inputs as of March 31, 2018 and April 1, 2017 (in thousands):
Total | Quoted Prices In Active Markets For Identical Assets (Level 1) | Significant Other Observable Inputs (Level 2) | |||||||||||||
March 31, 2018 | |||||||||||||||
Assets | |||||||||||||||
Money market funds | $ | 9 | $ | 9 | $ | — | |||||||||
Auction rate securities (1) | 1,843 | — | 1,843 | ||||||||||||
Invested funds in deferred compensation plan (2) | 14,284 | 14,284 | — | ||||||||||||
Total assets measured at fair value | $ | 16,136 | $ | 14,293 | $ | 1,843 | |||||||||
Liabilities | |||||||||||||||
Deferred compensation plan obligation (2) | $ | 14,284 | $ | 14,284 | $ | — | |||||||||
Total liabilities measured at fair value | $ | 14,284 | $ | 14,284 | $ | — | |||||||||
April 1, 2017 | |||||||||||||||
Assets | |||||||||||||||
Money market funds | $ | 14 | $ | 14 | $ | — | |||||||||
Auction rate securities (1) | 1,721 | — | 1,721 | ||||||||||||
Invested funds in deferred compensation plan (2) | 10,237 | 10,237 | — | ||||||||||||
Total assets measured at fair value | $ | 11,972 | $ | 10,251 | $ | 1,721 | |||||||||
Liabilities | |||||||||||||||
Deferred compensation plan obligation (2) | $ | 10,237 | $ | 10,237 | $ | — | |||||||||
Total liabilities measured at fair value | $ | 10,237 | $ | 10,237 | $ | — | |||||||||
(1) Auction rate securities are debt instruments with interest rates that reset through periodic short-term auctions. The Company's Level 2 ARS are valued based on quoted prices for identical or similar instruments in markets that are not active.
(2) The non-qualified deferred compensation plan provides eligible employees and members of the Board of Directors with the opportunity to defer a specified percentage of their cash compensation. The Company includes the asset deferred by the participants in the “Other current assets” and “Other non-current assets” line items of its Consolidated Balance Sheets and the Company's obligation to deliver the deferred compensation in the "Other current liabilities" and “Other long-term liabilities” line items of its Consolidated Balance Sheets.
As of March 31, 2018 and April 1, 2017, the Company did not have any Level 3 assets or liabilities.
Nonrecurring Fair Value Measurements
The Company's non-financial assets, such as intangible assets and property and equipment, are measured at fair value when there is an indicator of impairment, and recorded at fair value only when an impairment charge is recognized. See Note 11 for further information on impairment of property and equipment.
Other Fair Value Disclosures
The carrying values of cash and cash equivalents, accounts receivable, accounts payable and other accrued liabilities approximate fair values because of the relatively short-term maturities of these instruments. See Note 8 for the fair value of the Company's long-term debt.
69
Qorvo, Inc. and Subsidiaries
Notes to Consolidated Financial Statements (continued)
Notes to Consolidated Financial Statements (continued)
4. INVENTORIES
The components of inventories, net of reserves, are as follows (in thousands):
March 31, 2018 | April 1, 2017 | ||||||
Raw materials | $ | 110,389 | $ | 92,282 | |||
Work in process | 221,137 | 198,339 | |||||
Finished goods | 140,766 | 139,833 | |||||
Total inventories | $ | 472,292 | $ | 430,454 | |||
5. PROPERTY AND EQUIPMENT
The components of property and equipment are as follows (in thousands):
March 31, 2018 | April 1, 2017 | ||||||
Land | $ | 23,778 | $ | 25,025 | |||
Building and leasehold improvements | 389,234 | 384,784 | |||||
Machinery and equipment | 1,660,138 | 1,659,404 | |||||
2,073,150 | 2,069,213 | ||||||
Less accumulated depreciation | (911,910 | ) | (981,328 | ) | |||
1,161,240 | 1,087,885 | ||||||
Construction in progress | 212,872 | 304,047 | |||||
Total property and equipment, net | $ | 1,374,112 | $ | 1,391,932 | |||
70
Qorvo, Inc. and Subsidiaries
Notes to Consolidated Financial Statement (continued)
Notes to Consolidated Financial Statement (continued)
6. BUSINESS ACQUISITIONS
Acquisition of GreenPeak Technologies, B.V.
During fiscal 2017, the Company completed the acquisition of GreenPeak Technologies, B.V. ("GreenPeak"), a leader in ultra-low power, short RF communication technology. The acquisition expanded the Company's offerings to include integrated RF solutions and systems-on-a-chip ("SoCs") for the connected home. The Company acquired 100% of the outstanding equity securities of GreenPeak for a purchase price of $118.1 million, net of cash acquired of $0.7 million. The total purchase price was allocated to GreenPeak's assets and liabilities based upon fair values as determined by the Company and resulted in goodwill of $38.2 million. The measurement period (up to one year from the acquisition date pursuant to ASC Topic 805 "Business Combinations") related to the acquisition of GreenPeak was concluded during the first quarter of fiscal 2018.
The GreenPeak acquisition resulted in an increase in intangible assets of $82.1 million. The more significant intangible assets acquired were developed technology of $74.2 million (which is being amortized over 7 years) and customer relationships of $5.6 million (which is being amortized over 3 years).
Business Combination between RFMD and TriQuint
Effective January 1, 2015, pursuant to the Merger Agreement, RFMD and TriQuint completed a strategic combination of their respective businesses through the “merger of equals” Business Combination. Based on an evaluation of the provisions of FASB ASC Topic 805, “Business Combinations,” RFMD was determined to be the acquirer for accounting purposes.
The initial allocation to goodwill of $2,036.7 million represented the excess of the purchase price over the fair value of assets acquired and liabilities assumed, which amount was allocated to the Company's MP operating segment ($1,745.5 million) and IDP operating segment ($291.2 million). During the measurement period (which was concluded during the third quarter of fiscal 2016), adjustments of $3.8 million and $1.1 million were made to reduce goodwill and increase property and equipment and deferred taxes, respectively. Goodwill recognized from the Business Combination is not deductible for income tax purposes.
The Business Combination resulted in an increase in intangible assets of $2,394.0 million. The more significant intangible assets acquired were developed technology of $610.0 million and customer relationships of $1,220.0 million (which are both being amortized over periods between 4 and 6 years) and IPRD of $470.0 million, of which $460.0 million has been completed as of March 31, 2018 and transferred to finite-lived intangible assets (which are being amortized over periods between 4 and 6 years).
During fiscal years 2018, 2017 and 2016, the Company incurred integration costs of approximately $6.2 million, $16.9 million, and $26.5 million, respectively, associated with the Business Combination. During fiscal years 2018, 2017 and 2016, the Company incurred restructuring costs of approximately $2.6 million, $2.0 million, and $10.1 million, respectively, associated with the Business Combination.
The acquisition, integration and restructuring costs are being expensed as incurred and are presented in the Consolidated Statements of Operations as "Other operating expense." See Note 11 for further information on the restructuring.
71
Qorvo, Inc. and Subsidiaries
Notes to Consolidated Financial Statement (continued)
Notes to Consolidated Financial Statement (continued)
7. GOODWILL AND INTANGIBLE ASSETS
The changes in the carrying amount of goodwill for fiscal years 2017 and 2018, are as follows (in thousands):
Mobile Products | Infrastructure and Defense Products | Total | |||||||||
Balance as of April 2, 2016 (1) | $ | 1,751,503 | 384,194 | $ | 2,135,697 | ||||||
GreenPeak acquisition | — | 38,217 | 38,217 | ||||||||
Balance as of April 1, 2017 (1) | 1,751,503 | 422,411 | 2,173,914 | ||||||||
GreenPeak acquisition measurement adjustment | — | (25 | ) | (25 | ) | ||||||
Balance as of March 31, 2018 (1) | $ | 1,751,503 | $ | 422,386 | $ | 2,173,889 | |||||
(1) The Company’s goodwill balance is presented net of accumulated impairment losses and write-offs of $621.6 million.
Goodwill is allocated to the reporting units that are expected to benefit from the synergies of the business combinations generating the underlying goodwill.
The following summarizes information regarding the gross carrying amounts and accumulated amortization of intangible assets (in thousands):
March 31, 2018 | April 1, 2017 | ||||||||||||||
Gross Carrying Amount | Accumulated Amortization | Gross Carrying Amount | Accumulated Amortization | ||||||||||||
Intangible Assets: | |||||||||||||||
Customer relationships | $ | 1,272,725 | $ | 936,175 | $ | 1,272,725 | $ | 656,688 | |||||||
Developed technology | 1,246,335 | 733,081 | 1,209,335 | 481,441 | |||||||||||
Trade names | 29,391 | 29,377 | 29,353 | 21,912 | |||||||||||
Technology licenses | 12,379 | 11,904 | 13,346 | 11,711 | |||||||||||
Non-compete agreement | 1,026 | 983 | 1,026 | 470 | |||||||||||
IPRD | 10,000 | N/A | 47,000 | N/A | |||||||||||
Total | $ | 2,571,856 | $ | 1,711,520 | $ | 2,572,785 | $ | 1,172,222 | |||||||
During fiscal 2018, $37.0 million of IPRD assets were completed, transferred to finite-lived intangible assets, and are being amortized over their useful lives of 4 years. As of March 31, 2018, the IPRD remaining totaled approximately $10.0 million and is expected to be completed during fiscal 2019 with estimated remaining costs to complete of approximately $1.0 million to $2.0 million.
Total intangible assets amortization expense was $539.8 million, $494.8 million and $494.6 million in fiscal years 2018, 2017 and 2016, respectively.
The following table provides the Company's estimated amortization expense for intangible assets based on current amortization periods for the periods indicated (in thousands):
Fiscal Year | Estimated Amortization Expense | ||
2019 | $ | 455,000 | |
2020 | 207,000 | ||
2021 | 155,000 | ||
2022 | 28,000 | ||
2023 | 12,000 | ||
72
Qorvo, Inc. and Subsidiaries
Notes to Consolidated Financial Statement (continued)
Notes to Consolidated Financial Statement (continued)
8. DEBT
Debt as of March 31, 2018 and April 1, 2017 is as follows (in thousands):
March 31, 2018 | April 1, 2017 | ||||||
6.75% Senior Notes due 2023 | $ | 444,464 | $ | 450,000 | |||
7.00% Senior Notes due 2025 | 548,500 | 550,000 | |||||
Less unamortized issuance costs | (9,674 | ) | (10,846 | ) | |||
Total long-term debt | $ | 983,290 | $ | 989,154 | |||
Credit Agreement
On December 5, 2017 (the "Closing Date"), the Company and certain of its material domestic subsidiaries (the "Guarantors") entered into a five-year unsecured senior credit facility pursuant to a credit agreement with Bank of America, N.A., as administrative agent (in such capacity, the "Administrative Agent"), swing line lender and L/C issuer, and a syndicate of lenders (the "Credit Agreement"). The Credit Agreement includes a senior delayed draw term loan of up to $400.0 million (the "Term Loan") and a $300.0 million senior revolving line of credit (the "Revolving Facility", together with the Term Loan, the "Credit Facility"). On the Closing Date, $100.0 million of the Term Loan was funded (and was subsequently repaid in March 2018), with the remainder available, at the discretion of the Company, in up to two draws prior to June 5, 2018. The Revolving Facility includes a $25.0 million sublimit for the issuance of standby letters of credit and a $10.0 million sublimit for swing line loans. The Company may request, at its option and at any time, that the Credit Facility be increased by an amount not to exceed $300.0 million, subject to securing additional funding commitments from the existing or new lenders. The Credit Facility is available to finance working capital, capital expenditures and other corporate purposes. The Company’s obligations under the Credit Agreement are jointly and severally guaranteed by the Guarantors. Upon execution of the Credit Agreement, the Company terminated its prior credit agreement, dated as of April 7, 2015, as amended, with Bank of America, N.A., thus terminating and releasing the Company’s obligations and guarantees of certain of its subsidiaries under that agreement. During fiscal 2018, there were no borrowings under the Revolving Facility. The Company had no outstanding amounts under the Credit Facility as of March 31, 2018.
At the Company’s option, loans under the Credit Agreement bear interest at (i) the Applicable Rate (as defined in the Credit Agreement) plus the Eurodollar Rate (as defined in the Credit Agreement) or (ii) the Applicable Rate plus a rate equal to the highest of (a) the federal funds rate plus 0.50%, (b) the prime rate of the Administrative Agent, or (c) the Eurodollar Base Rate plus 1.0% (the “Base Rate”). All swingline loans will bear interest at a rate equal to the Applicable Rate plus the Base Rate. The Eurodollar Rate is the rate per annum equal to the reserve adjusted London Interbank Offered Rate (or a comparable or successor rate), for dollar deposits for interest periods of one, two, three, six or twelve months, as selected by the Company. The Applicable Rate for Eurodollar Rate loans ranges from 1.125% per annum to 1.375% per annum. The Applicable Rate for Base Rate loans ranges from 0.125% per annum to 0.375% per annum. Interest for Eurodollar Rate loans will be payable at the end of each applicable interest period or at three-month intervals, if such interest period exceeds three months. Interest for Base Rate loans will be payable quarterly in arrears. The Company will pay a letter of credit fee equal to the Applicable Rate multiplied by the daily amount available to be drawn under any letter of credit, a fronting fee, and any customary documentary and processing charges for any letter of credit issued under the Credit Agreement. Interest paid on the Term Loan during fiscal 2018 was $0.7 million.
The Credit Agreement contains various conditions, covenants and representations with which the Company must comply in order to borrow funds and to avoid an event of default, including the following financial covenants that the Company must maintain: (i) a consolidated leverage ratio not to exceed 3.0 to 1.0 as of the end of any fiscal quarter of the Company, provided that in connection with a permitted acquisition in excess of $300.0 million, the Company's maximum consolidated leverage ratio may increase on two occasions during the term of the Credit Facility to 3.5 to 1.0 for four consecutive fiscal quarters, beginning with the fiscal quarter in which such acquisition occurs and (ii) an interest coverage ratio not to be less than 3.0 to 1.0 as of the end of any fiscal quarter of the Company. As of March 31, 2018, the Company was in compliance with these covenants.
The Credit Agreement also contains customary events of default. The occurrence of an event of default can result in the exercise of remedies including an increase in the applicable rate of interest by 2.00%, termination of undrawn commitments under the Credit Facility, declaration that all outstanding loans are due and payable and requiring cash
73
Qorvo, Inc. and Subsidiaries
Notes to Consolidated Financial Statement (continued)
Notes to Consolidated Financial Statement (continued)
collateral deposits in respect of outstanding letters of credit. Outstanding amounts are due in full on the maturity date of December 5, 2022 (with amounts borrowed under the swingline option due in full no later than ten business days after such loan is made), subject to scheduled amortization of the Term Loan principal as set forth in the Credit Agreement prior to the maturity date.
Senior Notes
On November 19, 2015, the Company completed an offering of $450.0 million aggregate principal amount of its 6.75% senior notes due December 1, 2023 (the “2023 Notes”) and $550.0 million aggregate principal amount of its 7.00% senior notes due December 1, 2025 (the “2025 Notes” and, together with the 2023 Notes, the “Notes”). The Notes were sold in the U.S. to qualified institutional buyers pursuant to Rule 144A under the Securities Act of 1933, as amended (the “Securities Act”), and outside the U.S. pursuant to Regulation S under the Securities Act. The Notes were issued pursuant to an indenture dated as of November 19, 2015 (the "Indenture") containing customary events of default, including payment default, failure to provide certain notices and certain provisions related to bankruptcy events. The Indenture also contains customary negative covenants.
On September 19, 2016, the Company completed an exchange offer, in which all of the 2023 Notes and substantially all of the 2025 Notes were exchanged for new notes that have been registered under the Securities Act.
At any time prior to December 1, 2018, the Company may redeem all or part of the 2023 Notes, at a redemption price equal to their principal amount, plus a “make whole” premium as of the redemption date, and accrued and unpaid interest. In addition, at any time prior to December 1, 2018, the Company may redeem up to 35% of the original aggregate principal amount of the 2023 Notes with the proceeds of one or more equity offerings, at a redemption price equal to 106.75%, plus accrued and unpaid interest. Furthermore, at any time on or after December 1, 2018, the Company may redeem the 2023 Notes, in whole or in part, at once or over time, at the specified redemption prices set forth in the Indenture plus accrued and unpaid interest thereon to the redemption date (subject to the rights of holders of record on the relevant record date to receive interest due on the relevant interest payment date). In March 2018, the Company repurchased $5.5 million of the 2023 Notes at a redemption price of 107.50% plus accrued and unpaid interest.
At any time prior to December 1, 2020, the Company may redeem all or part of the 2025 Notes, at a redemption price equal to their principal amount, plus a “make whole” premium as of the redemption date, and accrued and unpaid interest. In addition, at any time prior to December 1, 2018, the Company may redeem up to 35% of the original aggregate principal amount of the 2025 Notes with the proceeds of one or more equity offerings, at a redemption price equal to 107.00%, plus accrued and unpaid interest. Furthermore, at any time on or after December 1, 2020, the Company may redeem the 2025 Notes, in whole or in part, at once or over time, at the specified redemption prices set forth in the Indenture plus accrued and unpaid interest thereon to the redemption date (subject to the rights of holders of record on the relevant record date to receive interest due on the relevant interest payment date). In March 2018, the Company repurchased $1.5 million of the 2025 Notes at a redemption price of 109.50% plus accrued and unpaid interest.
Interest is payable on June 1 and December 1 of each year on the 2023 Notes at a rate of 6.75% per annum and on the 2025 Notes at a rate of 7.00% per annum. Interest paid on the Notes during fiscal 2018 and fiscal 2017 was $68.9 million and $71.2 million, respectively.
The 2023 Notes and the 2025 Notes are traded over the counter, and their fair values as of March 31, 2018 of $474.5 million and $596.5 million, respectively (compared to carrying values of $444.5 million and $548.5 million, respectively) were estimated based upon the values of their last trade at the end of the period. The fair values of the 2023 Notes and the 2025 Notes were $489.4 million and $607.8 million, respectively (compared to carrying values of $450.0 million and $550.0 million, respectively), as of April 1, 2017.
Interest Expense
During fiscal 2018, the Company recognized $70.5 million of interest expense related to the Notes and the Term Loan, which was offset by $13.6 million of interest capitalized to property and equipment. During fiscal 2017 and fiscal 2016, the Company recognized $69.9 million and $25.8 million, respectively, of interest expense related to the
74
Qorvo, Inc. and Subsidiaries
Notes to Consolidated Financial Statement (continued)
Notes to Consolidated Financial Statement (continued)
Notes, which was partially offset by $13.6 million and $5.2 million, respectively, of interest capitalized to property and equipment.
9. RETIREMENT BENEFIT PLANS
Defined Contribution Plans
The Company offers tax-beneficial retirement contribution plans to eligible employees in the U.S. and certain other countries. Eligible employees in certain countries outside of the U.S. are eligible to participate in stakeholder or national pension plans with differing eligibility and contributory requirements based on local and national regulations. U.S. employees are eligible to participate in the Company's fully qualified 401(k) plan 30 days after their date of hire. An employee may invest pretax earnings in the 401(k) plan up to the maximum legal limits (as defined by Federal regulations). Employer contributions to the 401(k) plan are made at the discretion of the Company’s Board of Directors. Employees are immediately vested in their own contributions as well as employer matching contributions.
In total, the Company contributed $14.0 million, $11.5 million and $11.7 million to its domestic and foreign defined contribution plans during fiscal years 2018, 2017 and 2016, respectively.
Defined Benefit Pension Plans
The Company maintains two qualified defined benefit pension plans for its subsidiaries located in Germany. One of the plans is funded through a self-paid reinsurance program with $4.0 million and $3.3 million of assets valued as of March 31, 2018 and April 1, 2017, respectively. Assets of the funded plan are included in "Other non-current assets" in the Consolidated Balance Sheets. The net periodic benefit obligations of both plans were $12.7 million and $11.4 million as of March 31, 2018 and April 1, 2017, respectively, which is included in “Accrued liabilities” and “Other long-term liabilities” in the Consolidated Balance Sheets. The assumptions used in calculating the benefit obligations for the plans are dependent on the local economic conditions and were measured as of March 31, 2018 and April 1, 2017. The net periodic benefit costs were approximately $0.7 million, $0.6 million and $0.8 million for fiscal years 2018, 2017 and 2016, respectively.
Non-Qualified Deferred Compensation Plan
Certain employees and members of the Board of Directors are eligible to participate in the Company's Non-Qualified Deferred Compensation Plan ("NQDC Plan"). The NQDC Plan provides eligible participants the opportunity to defer and invest a specified percentage of their cash compensation. The NQDC Plan is a non-qualified plan that is maintained in a rabbi trust. The amount of compensation to be deferred by each participant is based on their own elections and is adjusted for any investment changes that the participant directs. The deferred compensation obligation and the fair value of the investments held in the rabbi trust were $14.3 million and $10.2 million as of March 31, 2018 and April 1, 2017, respectively. The current portion of the deferred compensation obligation and fair value of the assets held in the rabbi trust were $1.0 million and $0.7 million as of March 31, 2018 and April 1, 2017, respectively, and are included in "Other current assets" and "Accrued liabilities" in the Consolidated Balance Sheets. The non-current portion of the deferred compensation obligation and fair value of the assets held in the rabbi trust were $13.3 million and $9.5 million as of March 31, 2018 and April 1, 2017, respectively, and are included in "Other non-current assets" and "Other long-term liabilities" in the Consolidated Balance Sheets.
10. COMMITMENTS AND CONTINGENT LIABILITIES
The Company leases certain of its corporate, wafer fabrication and other facilities from multiple third-party real estate developers. The operating leases expire at various dates through 2034, and some of these leases have renewal options, with the longest ranging up to two, ten-year periods. Several of these leases also include market rate rent escalations, rent holidays, and leasehold improvement incentives, all of which are recognized to expense on a straight-line basis. The amortization period of leasehold improvements made either at the inception of the lease or during the lease term is amortized over the lesser of the remaining life of the lease term (including renewals that are reasonably assured) or the useful life of the asset. The Company also leases various machinery and equipment and office equipment under non-cancelable operating leases. The remaining terms of these operating leases range from
75
Qorvo, Inc. and Subsidiaries
Notes to Consolidated Financial Statement (continued)
Notes to Consolidated Financial Statement (continued)
less than one year to approximately four years. As of March 31, 2018, the total future minimum lease payments related to facility and equipment operating leases was approximately $68.6 million.
In the fourth quarter of fiscal 2018, the Company entered into a capital lease for a facility in Beijing, China that will allow the Company to consolidate several leased facilities as well as provide additional manufacturing space. The lease term is expected to commence in fiscal 2020 and therefore is not recorded on the Consolidated Balance Sheet as of March 31, 2018. The initial term of the lease is five years. The lease includes multiple renewal options, and the maximum lease term cannot exceed 30 years.
Minimum future lease payments under non-cancelable operating and capital leases as of March 31, 2018, are as follows (in thousands):
Fiscal Year | Operating Leases | Capital Lease | Total | |||||||||
2019 | $ | 12,490 | $ | 0 | $ | 12,490 | ||||||
2020 | 11,429 | 1,047 | 12,476 | |||||||||
2021 | 10,469 | 1,047 | 11,516 | |||||||||
2022 | 8,577 | 1,047 | 9,624 | |||||||||
2023 | 7,163 | 1,047 | 8,210 | |||||||||
Thereafter | 18,454 | 48,243 | 66,697 | |||||||||
Total minimum lease payments | $ | 68,582 | $ | 52,431 | $ | 121,013 | ||||||
Rent expense under operating leases, covering facilities and equipment, was approximately $16.3 million, $14.8 million, and $14.2 million for fiscal years 2018, 2017 and 2016, respectively.
Legal Matters
The Company accrues a liability for legal contingencies when it believes that it is both probable that a liability has been incurred and that it can reasonably estimate the amount of the loss. The Company reviews these accruals and adjusts them to reflect ongoing negotiations, settlements, rulings, advice of legal counsel and other relevant information. To the extent new information is obtained and the Company's views on the probable outcomes of claims, suits, assessments, investigations or legal proceedings change, changes in the Company's accrued liabilities would be recorded in the period in which such determination is made.
The Company is involved in various legal proceedings and claims that have arisen in the ordinary course of its business that have not been fully adjudicated. These actions, when finally concluded and determined, will not, in the opinion of management, have a material adverse effect upon the Company’s consolidated financial position or results of operations.
11. RESTRUCTURING
During fiscal 2018, the Company recorded approximately $67.7 million of restructuring expenses in "Other operating expense" in the Consolidated Statements of Operations, related to actions initiated in fiscal 2018 to improve operating efficiencies and actions initiated in fiscal 2015 as a result of the Business Combination.
During fiscal 2018, the Company initiated restructuring actions to improve operating efficiencies, and, as a result of these actions, recorded approximately $18.3 million of employee termination benefits. As a result of this restructuring plan, in the fourth quarter of fiscal 2018, the Company also adjusted the carrying value of certain of its held for sale assets located in China and the U.S. to fair market value (resulting in impairment charges totaling approximately $46.3 million, pursuant to ASC 360). The fair value of the assets is based on quotes from third parties. The Company expects to record approximately $0.9 million of additional restructuring charges in fiscal 2019 primarily associated with employee termination benefits.
76
Qorvo, Inc. and Subsidiaries
Notes to Consolidated Financial Statement (continued)
Notes to Consolidated Financial Statement (continued)
During fiscal years 2018, 2017 and 2016, the Company recorded restructuring expenses (including employee termination benefits, stock-based compensation and ongoing expenses related to exited leased facilities) of approximately $2.7 million, $2.1 million and $10.2 million, respectively, primarily as a result of the Business Combination. See Note 6 for further information on the Business Combination.
As of March 31, 2018 and April 1, 2017, restructuring obligations relating to employee termination benefits totaled $6.1 million and $1.6 million, respectively, and are included in “Accrued liabilities” in the Consolidated Balance Sheets. As of March 31, 2018 and April 1, 2017, restructuring obligations relating to lease obligations totaled $2.6 million and $2.1 million, respectively, and are included in "Accrued liabilities" and "Other long-term liabilities" in the Consolidated Balance Sheets.
12. INCOME TAXES
On December 22, 2017, the Tax Act was signed into law in the U.S. The Tax Act significantly revises the future ongoing U.S. corporate income tax by, among other things, lowering U.S. corporate income tax rates, providing full expensing for investments in new and used qualified property made after September 27, 2017, and implementing a territorial tax system. Due to the timing of the Company's fiscal year, the lower corporate income tax rate will be phased in, resulting in a U.S. statutory federal rate of approximately 31.5% for our fiscal year ended March 31, 2018, and 21% for subsequent fiscal years. The Tax Act implements a territorial tax system that eliminates U.S. federal income taxes on dividends from 10% owned foreign subsidiaries, but limits the ability to credit certain foreign taxes that existed prior to enactment of the Tax Act. In connection with the transition to the new territorial tax system, a one-time transition tax on certain unrepatriated earnings of foreign subsidiaries is being imposed (the “Transitional Repatriation Tax”), which is payable over eight years. In addition, the Tax Act includes two new U.S. tax base erosion provisions, the Global Intangible Low-Taxed Income ("GILTI") provisions and the Base-Erosion and Anti-Abuse Tax (“BEAT”) provisions, which become effective for the Company in fiscal 2019.
The SEC issued Staff Accounting Bulletin No. 118 (“SAB 118”) to address the appropriate accounting treatment when a registrant does not have the necessary information available, prepared, or analyzed (including computations) in reasonable detail to complete the accounting for certain income tax effects of the Tax Act. SAB 118 allows for a measurement period of up to one year after the enactment date of the Tax Act to finalize the recording of the related tax impacts. In the interim periods, provisional amounts are to be recorded where the income tax effect can be reasonably estimated. The Company’s accounting for the Tax Act is incomplete, but the Company has recorded the provisional estimates discussed below and will finalize and record any resulting adjustments within the one-year measurement period. The final transitional impacts of the Tax Act may differ from the below provisional estimates, possibly materially, due to, among other things: legislation by states with respect to the Tax Act; evolving technical interpretations of the Tax Act; legislative action to address questions that arise because of the Tax Act; clarification of the application of accounting standards for income taxes or related interpretations in response to the Tax Act; or updates or changes to provisional amounts the Company has utilized to calculate the transitional impacts, including impacts from changes to current year earnings and tax liabilities, deferred tax assets and liabilities, earnings and profits at foreign subsidiaries, tax pools at foreign subsidiaries, foreign tax credits and foreign exchange rates.
The impact of the Tax Act resulted in a provisional tax expense of $77.3 million in fiscal 2018. This was comprised of a provisional Transitional Repatriation Tax expense of $116.4 million, offset by a provisional deferred tax benefit of $39.1 million from the remeasurement of U.S. deferred tax assets and liabilities. Both the tax charge and the tax benefit represent provisional amounts and the Company’s current best estimates.
The Transitional Repatriation Tax is a one-time tax on accumulated and current earnings and profits (“E&P”) of foreign companies with U.S. owners that have not previously been subjected to tax in the U.S. A portion of the E&P is subject to a tax rate of 15.5% and the remainder to 8%. To determine the amount of the Transitional Repatriation Tax, the Company must determine for each foreign company in which it has a direct or indirect ownership interest, among other factors, the amount of post-1986 E&P of its foreign subsidiaries, as well as the amount of non-U.S. income taxes paid on such earnings. The Company was able to make a reasonable estimate of the Transitional Repatriation Tax on its wholly owned foreign subsidiaries and has recorded a provisional Transitional Repatriation Tax expense of $116.4 million as a component of its current income tax provision. No reasonable estimate has been made with respect to direct and indirect investments in other foreign companies. The Company is continuing to
77
Qorvo, Inc. and Subsidiaries
Notes to Consolidated Financial Statement (continued)
Notes to Consolidated Financial Statement (continued)
gather and analyze additional information and guidance to complete the accounting with respect to its calculation of E&P, non-U.S. income taxes paid, and the portion taxable at the 15.5% tax rate.
The Tax Act allows the tax liability arising from the Transitional Repatriation Tax to be paid on an installment basis over eight years, resulting in a provisional increase in the long-term tax liability account included in "Other long-term liabilities" in the Company's Consolidated Balance Sheets.
The deferred tax assets and liabilities of the Company are impacted by the Tax Act. The reduction in the U.S. federal corporate tax rate from 35% to 21% for tax years beginning after December 31, 2017, requires the Company to remeasure its deferred tax assets and liabilities. The Company has evaluated this change and recorded a decrease to net deferred tax liabilities with a corresponding increase to deferred tax benefit of $39.1 million. In addition, the full expensing of investments in qualified property after September 27, 2017, impacts the calculation of deferred tax balances. The provisional amount for full expensing requires further analysis to determine which fixed assets placed in service after September 27, 2017, meet the qualification requirements. The Company is still in the process of evaluating the state tax impact on deferred tax balances, including valuation allowances, from the full expensing provision and other provisions of the Tax Act.
GILTI creates a new requirement that certain income earned by foreign subsidiaries must be currently included in the gross income of the U.S. stockholder. Due to the complexity of the new GILTI tax rules, the Company continues to evaluate this provision of the Tax Act and the application of ASC 740, "Income Taxes." Under U.S. GAAP, the Company is allowed to make an accounting policy choice of either: (1) treating taxes due on future U.S. inclusions in taxable income related to GILTI as a current-period expense when incurred (the “period cost method”) or (2) factoring such amounts into the Company's measurement of its deferred taxes (the “deferred method”). The Company has not yet completed its analysis of the GILTI tax rules and is not yet able to reasonably estimate the effect of this provision or make the accounting policy election. As a result, the Company has not made any provisional adjustments related to potential GILTI tax in its financial statements and has not made a policy decision regarding whether to record deferred taxes for GILTI.
Beginning in calendar year 2018, the Tax Act provides a 100% deduction for dividends received from 10-percent owned foreign corporations by U.S. corporate stockholders, subject to a one-year holding period. Although dividend income is now exempt from U.S. federal tax in the hands of the U.S. corporate stockholders, companies must still apply the guidance of ASC 740-30-25-18 to account for the tax consequences of outside basis differences and other tax impacts of their investments in non-U.S. subsidiaries. While the Company has accrued the Transitional Repatriation Tax on the deemed repatriated earnings that were previously indefinitely reinvested, it currently intends to only repatriate amounts where no additional withholding taxes will be imposed on a distribution. The Company has determined that Singapore does not impose a withholding tax on dividends and no longer takes the position that earnings are permanently reinvested for our operating subsidiary in Singapore. With respect to its other foreign subsidiaries, the Company continues to account for them as permanently reinvested while it continues to evaluate the impacts of the Tax Act on its operations in accordance with guidance issued under SAB 118.
Income (loss) before income taxes consists of the following components (in thousands):
Fiscal Year | |||||||||||
2018 | 2017 | 2016 | |||||||||
United States | $ | (151,083 | ) | $ | 2,439 | $ | (35,923 | ) | |||
Foreign | 168,228 | 24,866 | 33,061 | ||||||||
Total | $ | 17,145 | $ | 27,305 | $ | (2,862 | ) | ||||
78
Qorvo, Inc. and Subsidiaries
Notes to Consolidated Financial Statement (continued)
Notes to Consolidated Financial Statement (continued)
The components of the income tax provision are as follows (in thousands):
Fiscal Year | |||||||||||
2018 | 2017 | 2016 | |||||||||
Current (expense) benefit: | |||||||||||
Federal | $ | (28,168 | ) | $ | (23,835 | ) | $ | (4,285 | ) | ||
State | (229 | ) | (476 | ) | (541 | ) | |||||
Foreign | (61,284 | ) | (47,579 | ) | (33,346 | ) | |||||
(89,681 | ) | (71,890 | ) | (38,172 | ) | ||||||
Deferred benefit (expense): | |||||||||||
Federal | $ | 11,817 | $ | 2,762 | $ | 27,794 | |||||
State (1) | 253 | 3,659 | (31,229 | ) | |||||||
Foreign | 20,178 | 21,606 | 15,624 | ||||||||
32,248 | 28,027 | 12,189 | |||||||||
Total | $ | (57,433 | ) | $ | (43,863 | ) | $ | (25,983 | ) | ||
(1) In fiscal 2016, the state deferred tax expense included a $31.0 million income tax expense related to an increase in the valuation allowance for the deferred tax asset related to state net operating losses and tax credits.
A reconciliation of the provision for income taxes to income tax expense computed by applying the statutory federal income tax rate to pre-tax income (loss) for fiscal years 2018, 2017 and 2016 is as follows (dollars in thousands):
Fiscal Year | |||||||||||||||||
2018 | 2017 | 2016 | |||||||||||||||
Amount | Percentage | Amount | Percentage | Amount | Percentage | ||||||||||||
Income tax (expense) benefit at statutory federal rate | $ | (5,407 | ) | 31.54 | % | $ | (9,557 | ) | 35.00 | % | $ | 1,002 | 35.00 | % | |||
(Increase) decrease resulting from: | |||||||||||||||||
State benefit (provision), net of federal (provision) benefit | 474 | (2.77 | ) | (662 | ) | 2.42 | (1,320 | ) | (46.14 | ) | |||||||
Tax credits | 38,054 | (221.95 | ) | 15,352 | (56.22 | ) | 15,459 | 540.21 | |||||||||
Effect of changes in income tax rate applied to net deferred tax assets | 39,168 | (228.45 | ) | 1,163 | (4.26 | ) | (2,716 | ) | (94.92 | ) | |||||||
Foreign tax rate difference | 21,829 | (127.32 | ) | (11,298 | ) | 41.38 | 4,114 | 143.77 | |||||||||
Foreign permanent differences | (2,598 | ) | 15.15 | (8,432 | ) | 30.88 | (1,700 | ) | (59.40 | ) | |||||||
Change in valuation allowance | (1,632 | ) | 9.52 | 1,363 | (4.99 | ) | (25,120 | ) | (877.84 | ) | |||||||
Stock-based compensation | 9,924 | (57.88 | ) | (3,228 | ) | 11.82 | (5,362 | ) | (187.37 | ) | |||||||
Tax reserve adjustments | (29,188 | ) | 170.24 | (21,789 | ) | 79.80 | (8,699 | ) | (303.99 | ) | |||||||
Deemed dividend | (5,098 | ) | 29.73 | (6,989 | ) | 25.60 | (3,984 | ) | (139.21 | ) | |||||||
U.S. Tax Toll Charge | (116,419 | ) | 679.03 | — | — | — | — | ||||||||||
Intra-entity transfer | (6,873 | ) | 40.09 | — | — | — | — | ||||||||||
Other income tax (expense) benefit | 333 | (1.94 | ) | 214 | (0.79 | ) | 2,343 | 81.89 | |||||||||
$ | (57,433 | ) | 334.99 | % | $ | (43,863 | ) | 160.64 | % | $ | (25,983 | ) | (908.00 | )% | |||
Deferred income taxes reflect the net tax effects of temporary differences between the carrying amounts of assets and liabilities for financial reporting purposes and the basis used for income tax purposes. The deferred income tax assets and liabilities are measured in each taxing jurisdiction using the enacted tax rates and laws that will be in effect when the differences are expected to reverse.
79
Qorvo, Inc. and Subsidiaries
Notes to Consolidated Financial Statement (continued)
Notes to Consolidated Financial Statement (continued)
Significant components of the Company’s net deferred income taxes are as follows (in thousands):
Fiscal Year | |||||||
2018 | 2017 | ||||||
Deferred income tax assets: | |||||||
Inventory reserve | $ | 9,894 | $ | 15,599 | |||
Equity compensation | 37,724 | 83,333 | |||||
Net operating loss carry-forwards | 50,128 | 40,575 | |||||
Research and other credits | 39,513 | 92,793 | |||||
Employee benefits | 12,842 | 13,247 | |||||
Other deferred assets | 16,620 | 23,355 | |||||
Total deferred income tax assets | 166,721 | 268,902 | |||||
Valuation allowance | (42,787 | ) | (33,104 | ) | |||
Total deferred income tax assets, net of valuation allowance | $ | 123,934 | $ | 235,798 | |||
Deferred income tax liabilities: | |||||||
Amortization and purchase accounting basis difference | $ | (101,261 | ) | $ | (258,422 | ) | |
Accumulated depreciation/basis difference | (63,363 | ) | (91,337 | ) | |||
Total deferred income tax liabilities | (164,624 | ) | (349,759 | ) | |||
Net deferred income tax liabilities | $ | (40,690 | ) | $ | (113,961 | ) | |
Amounts included in the Consolidated Balance Sheets: | |||||||
Non-current assets | 22,394 | 17,550 | |||||
Non-current liabilities | (63,084 | ) | (131,511 | ) | |||
Net deferred income tax liabilities | $ | (40,690 | ) | $ | (113,961 | ) | |
The Company has recorded a $42.8 million and a $33.1 million valuation allowance against the U.S. deferred tax assets and deferred tax assets at foreign subsidiaries as of March 31, 2018, and April 1, 2017, respectively. These valuation allowances were established based upon management's opinion that it is more likely than not (a likelihood of more than 50 percent) that the benefit of these deferred tax assets may not be realized. Realization is dependent upon generating future income in the taxing jurisdictions in which the operating loss carryovers, credit carryovers, depreciable tax basis and other tax deferred assets exist. Management reevaluates the ability to realize the benefit of the deferred tax assets of the Company on a quarterly basis.
The valuation allowance against deferred tax assets increased by $9.7 million in fiscal 2018. The increase was comprised of a $6.8 million increase resulting from tax rate changes, primarily the federal rate changes enacted in the Tax Act, a $1.9 million increase in the state deferred tax for net operating losses and tax credits, a $1.0 million increase for deferred tax assets for net operating losses at other foreign subsidiaries and a $0.5 million increase in the valuation allowance for state tax credits due to the adoption of ASU 2016-09. It was partially offset by a $0.5 million decrease in valuation allowance for federal deferred tax assets for foreign tax credits. At the end of fiscal 2018, a $2.0 million valuation allowance remained against deferred tax assets at other foreign subsidiaries and a $40.8 million valuation allowance remained against domestic deferred tax assets as management has determined it is more likely than not that the related deferred tax assets will not be realized.
The valuation allowance against deferred tax assets decreased by $1.6 million in fiscal 2017. The decrease was comprised of a $5.2 million decrease in the valuation allowance for foreign deferred tax assets primarily resulting from the removal of the valuation allowance at a China manufacturing subsidiary as management has determined it is more likely than not that the related deferred tax assets will be realized. The decrease was offset by a $2.8 million increase in the valuation allowance for federal deferred tax assets for foreign tax credits and state deferred tax assets for net operating losses and tax credits, as well as a $0.8 million increase for deferred tax assets for net operating losses at other foreign subsidiaries. At the end of fiscal 2017, a $0.8 million valuation allowance remained against deferred tax assets at other foreign subsidiaries and a $32.3 million valuation allowance remained against domestic deferred tax assets as management determined it was more likely than not that the related deferred tax assets would not be realized.
80
Qorvo, Inc. and Subsidiaries
Notes to Consolidated Financial Statement (continued)
Notes to Consolidated Financial Statement (continued)
During fiscal 2017, the Company's China manufacturing subsidiary, which operates as a cost plus manufacturer for another Qorvo subsidiary, exited its start-up operational phase and generated sufficient income to substantially offset the losses earned in prior years. The balance of the cumulative pre-tax book loss was expected to be offset by income in the first half of fiscal 2018 as production at the assembly and test facility continued to increase as the Company reduced its dependence on outside assembly and test subcontractors. After evaluating the positive and negative evidence, management determined that it was more likely than not that the deferred tax assets of this China manufacturing subsidiary would be realized and a valuation allowance would not be provided as of the end of fiscal 2017.
The valuation allowance against deferred tax assets increased by $20.9 million in fiscal 2016. The increase was comprised of a $20.2 million increase in the valuation allowance for state deferred tax assets for net operating losses and tax credits, a $5.0 million increase in the valuation allowance for foreign net operating loss deferred tax assets, and a $4.3 million decrease in the valuation allowance related to a deferred tax asset recorded in the initial purchase price accounting for the Business Combination. The Business Combination adjustment related to a deferred tax asset which was recorded during fiscal 2015 in the initial purchase price accounting with a full valuation allowance, but which deferred tax asset was determined in fiscal 2016 to not exist as of the acquisition date. Accordingly, in fiscal 2016, that deferred tax asset was removed along with the offsetting deferred tax asset valuation allowance. At the end of fiscal 2016, a $5.2 million valuation allowance remained against foreign deferred tax assets and a $29.5 million valuation allowance remained against domestic deferred tax assets as management determined it was more likely than not that the related deferred tax assets would not be realized, effectively increasing the domestic net deferred tax liabilities.
During fiscal 2016, North Carolina enacted legislation to reduce the corporate income tax rate from 5% to 4% and phase-in over a three-year period a move to a single sales factor apportionment methodology. In addition, the Company underwent operational changes to leverage existing resources and capabilities of its Singapore subsidiary and consolidate operations and responsibilities associated with its foreign back-end manufacturing operations and foreign customers in that Singapore subsidiary. Together these changes resulted in a significant decrease in the amount of future taxable income expected to be allocated to North Carolina and other states in which the net operating loss and tax credit carryovers existed. As a result, it was no longer more likely than not that the deferred tax assets related to those state net operating loss and tax credit carryovers for which a valuation allowance was being provided will be used before they expire. The deferred tax asset for foreign net operating losses primarily related to the China subsidiary which owns the internal assembly and test facility that became operational during fiscal 2016 and had incurred losses since inception.
As of March 31, 2018, the Company had federal loss carryovers of approximately $305.0 million that expire in fiscal years 2020 to 2038 if unused and state losses of approximately $147.3 million that expire in fiscal years 2019 to 2038 if unused. Federal research credits of $54.9 million, and state credits of $58.7 million may expire in fiscal years 2019 to 2038 and 2019 to 2033, respectively. Foreign losses in the Netherlands of approximately $7.8 million expire in fiscal years 2019 to 2027. Included in the amounts above are certain net operating losses and other tax attribute assets acquired in conjunction with acquisitions in the current and prior years. The utilization of acquired domestic assets is subject to certain annual limitations as required under Section 382 of the Internal Revenue Code of 1986, as amended (the "Code") and similar state income tax provisions.
The Company has continued to expand its operations and increase its investments in numerous international jurisdictions. These activities expose the Company to taxation in multiple foreign jurisdictions. It is management's opinion that current and future undistributed foreign earnings will be permanently reinvested, except for the earnings of Qorvo International Pte. Ltd., our operating subsidiary in Singapore. No provision for U.S. federal, state income taxes and foreign local withholding taxes has been made with respect to any of the other foreign subsidiaries. It is not practical to estimate the additional tax that would be incurred, if any, if the permanently reinvested earnings were repatriated.
The Company has foreign subsidiaries with tax holiday agreements in Costa Rica and Singapore. These tax holiday agreements have varying rates and expire in March 2024 and December 2021, respectively. In February 2017, Singapore enacted legislation that will exclude from the Company's existing Development and Expansion Incentive grant the benefit of the reduced tax rate for intellectual property income earned after June 30, 2021. Incentives from these countries are subject to the Company meeting certain employment and investment requirements. Income tax
81
Qorvo, Inc. and Subsidiaries
Notes to Consolidated Financial Statement (continued)
Notes to Consolidated Financial Statement (continued)
expense decreased by $7.9 million (approximately $0.06 per basic and diluted share impact) in fiscal 2018 and $2.7 million (approximately $0.02 per basic and diluted share impact) in fiscal 2017 as a result of these agreements.
The Company’s gross unrecognized tax benefits totaled $122.8 million as of March 31, 2018, $90.6 million as of April 1, 2017, and $69.1 million as of April 2, 2016. Of these amounts, $118.7 million (net of federal benefit of state taxes), $84.4 million (net of federal benefit of state taxes) and $64.2 million (net of federal benefit of state taxes) as of March 31, 2018, April 1, 2017, and April 2, 2016, respectively, represent the amounts of unrecognized tax benefits that, if recognized, would impact the effective tax rate in each of the fiscal years.
A reconciliation of fiscal 2016 through fiscal 2018 beginning and ending amount of gross unrecognized tax benefits is as follows (in thousands):
Fiscal Year | |||||||||||
2018 | 2017 | 2016 | |||||||||
Beginning balance | $ | 90,615 | $ | 69,052 | $ | 59,397 | |||||
Additions based on positions related to current year | 26,431 | 20,036 | 9,374 | ||||||||
Additions for tax positions in prior years | 5,844 | 1,878 | 2,723 | ||||||||
Reductions for tax positions in prior years | (67 | ) | (29 | ) | (1,973 | ) | |||||
Expiration of statute of limitations | — | (322 | ) | (469 | ) | ||||||
Ending balance | $ | 122,823 | $ | 90,615 | $ | 69,052 | |||||
It is the Company’s policy to recognize interest and penalties related to uncertain tax positions as a component of income tax expense. During fiscal years 2018, 2017 and 2016, the Company recognized $(2.5) million, $2.1 million and $1.6 million, respectively, of interest and penalties related to uncertain tax positions. Accrued interest and penalties related to unrecognized tax benefits totaled $4.6 million, $7.1 million and $5.0 million as of March 31, 2018, April 1, 2017, and April 2, 2016, respectively.
The unrecognized tax benefits of $122.8 million and accrued interest and penalties of $4.6 million at the end of fiscal 2018 are recorded on the Consolidated Balance Sheet as an $18.3 million long-term liability, with the balance reducing the carrying value of the gross deferred tax assets.
Within the next 12 months, the Company believes it is reasonably possible that only a minimal amount of gross unrecognized tax benefits will be reduced as a result of reductions for tax positions taken in prior years where the only uncertainty was related to the timing of the tax deduction.
Income taxes payable of $60.0 million and $31.7 million as of March 31, 2018, and April 1, 2017, respectively, are included in "Other current liabilities" in the Consolidated Balance Sheets. Long term income taxes payable of $24.2 million as of March 31, 2018, are included in "Other long-term liabilities" in the Consolidated Balance Sheets.
RFMD's fiscal 2015 and TriQuint's calendar 2014 federal, North Carolina, and California tax returns and subsequent tax years remain open for examination. The federal tax return for the short period ended January 1, 2015 for RFMD is currently under examination by the Internal Revenue Service, and the Singapore tax return for calendar year 2012 is currently under examination by the Singapore tax authorities. An examination by taxing authorities of the Company's China subsidiary in Beijing of its calendar year 2013 through 2015 tax returns was completed in fiscal 2018 with minimal adjustments and returns for subsequent tax years remain open for examination. An examination by the German taxing authorities of the returns for calendar years 2013 through 2015 was completed during fiscal 2017 with minimal adjustments and returns for subsequent tax years remain open for examination. Tax attributes (including net operating loss and credit carryovers) arising in earlier fiscal years remain open to adjustment.
82
Qorvo, Inc. and Subsidiaries
Notes to Consolidated Financial Statement (continued)
Notes to Consolidated Financial Statement (continued)
13. NET LOSS PER SHARE
The following table sets forth the computation of basic and diluted net loss per share (in thousands, except per share data):
For Fiscal Year | |||||||||||
2018 | 2017 | 2016 | |||||||||
Numerator: | |||||||||||
Numerator for basic and diluted net loss per share — net loss available to common stockholders | $ | (40,288 | ) | $ | (16,558 | ) | $ | (28,845 | ) | ||
Denominator: | |||||||||||
Denominator for basic net loss per share — weighted average shares | 126,946 | 127,121 | 141,937 | ||||||||
Effect of dilutive securities: | |||||||||||
Stock-based awards | — | — | — | ||||||||
Denominator for diluted net loss per share — adjusted weighted average shares and assumed conversions | 126,946 | 127,121 | 141,937 | ||||||||
Basic net loss per share | $ | (0.32 | ) | $ | (0.13 | ) | $ | (0.20 | ) | ||
Diluted net loss per share | $ | (0.32 | ) | $ | (0.13 | ) | $ | (0.20 | ) | ||
In the computation of diluted net loss per share for fiscal years 2018, 2017 and 2016, approximately 3.7 million shares, 4.8 million shares and 5.0 million shares, respectively, were excluded because the effect of their inclusion would have been anti-dilutive.
14. STOCK-BASED COMPENSATION
Summary of Stock Option Plans
2003 Stock Incentive Plan - RF Micro Devices, Inc.
The 2003 Stock Incentive Plan (the "2003 Plan") was approved by the Company's stockholders on July 22, 2003, and the Company was permitted to grant stock options and other types of equity incentive awards, such as stock appreciation rights, restricted stock awards, performance shares and performance units, under the 2003 Plan. No further awards can be granted under this plan.
2006 Directors’ Stock Option Plan - RF Micro Devices, Inc.
At the Company’s 2006 annual meeting of stockholders, stockholders of the Company adopted the 2006 Directors’ Stock Option Plan, which replaced the Non-Employee Directors’ Stock Option Plan and reserved an additional 0.3 million shares of common stock for issuance to non-employee directors. Under the terms of this plan, non-employee directors were entitled to receive options to acquire shares of common stock. No further awards can be granted under this plan.
1996 Stock Incentive Program - TriQuint Semiconductor, Inc.
Effective upon the closing of the Business Combination, the Company assumed the TriQuint, Inc. 1996 Stock Incentive Program (the “TriQuint 1996 Stock Incentive Program”), originally adopted by TriQuint. The TriQuint 1996 Stock Incentive Program provided for the grant of incentive and non-qualified stock options to officers, outside directors and other employees of TriQuint or any parent or subsidiary. The TriQuint 1996 Stock Incentive Program was amended in 2002 to provide that options granted thereunder must have an exercise price per share no less than 100% of the fair market value of the share price on the grant date. In 2005, the TriQuint 1996 Stock Incentive Program was further amended to extend the term of the program to 2015 and permit the award of restricted stock, restricted stock units, stock appreciation rights, performance shares and performance units in addition to the grant of stock options. In addition, the amendment provided specific performance criteria that the plan administrator may use to establish performance objectives. The terms of each grant under the TriQuint 1996 Stock Incentive Program could not exceed ten years. No further awards can be granted under this program.
83
Qorvo, Inc. and Subsidiaries
Notes to Consolidated Financial Statement (continued)
Notes to Consolidated Financial Statement (continued)
2008 Inducement Award Plan- TriQuint Semiconductor, Inc.
Effective upon the closing of the Business Combination, the Company assumed the sponsorship of the TriQuint, Inc. 2008 Inducement Award Plan (the “TriQuint 2008 Inducement Award Plan”), originally adopted by TriQuint. The TriQuint 2008 Inducement Award Plan provided for the grant of nonstatutory stock options, restricted stock, restricted stock units, stock appreciation rights and other stock or cash awards to employees of TriQuint or any parent or subsidiary. The options granted thereunder were required to have an exercise price per share no less than 100% of the fair market value per share on the date of grant. The terms of each grant under the plan could not exceed ten years. No further awards can be granted under this plan.
2009 and 2012 Incentive Plans - TriQuint Semiconductor, Inc.
Effective upon the closing of the Business Combination, the Company assumed the TriQuint, Inc. 2009 Incentive Plan and TriQuint, Inc. 2012 Incentive Plan (the “TriQuint Incentive Plans”), originally adopted by TriQuint. The TriQuint Incentive Plans provided for the grant of stock options, restricted stock units, stock appreciation rights and other stock or cash awards to employees, officers, directors, consultants, agents, advisors and independent contractors of TriQuint and its subsidiaries and affiliates. The options granted thereunder were required to have an exercise price per share no less than 100% of the fair market value per share on the date of grant. The terms of each grant under the TriQuint Incentive Plans could not exceed ten years. No further awards can be granted under these plans.
2012 Stock Incentive Plan - Qorvo, Inc.
The Company currently grants stock options and restricted stock units to employees and directors under the 2012 Stock Incentive Plan (the "2012 Plan"), which was approved by the Company's stockholders on August 16, 2012, assumed by the Company in connection with the Business Combination and reapproved by the Company's stockholders on August 8, 2017 for purposes of Section 162(m) of the Code. Under the 2012 Plan, the Company is permitted to grant stock options and other types of equity incentive awards, such as stock appreciation rights, restricted stock awards, performance shares and performance units. The maximum number of shares issuable under the 2012 Plan may not exceed the sum of (a) 4.3 million shares, plus (b) any shares of common stock (i) remaining available for issuance as of the effective date of the 2012 Plan under the Company's prior plans and (ii) subject to an award granted under a prior plan, which awards are forfeited, canceled, terminated, expire or lapse for any reason. As of March 31, 2018, 3.6 million shares were available for issuance under the 2012 Plan. The aggregate number of shares subject to performance-based restricted stock units awarded for fiscal 2018 under the 2012 Plan was 0.2 million shares.
2013 Incentive Plan - Qorvo, Inc.
Effective upon the closing of the Business Combination, the Company assumed the TriQuint, Inc. 2013 Incentive Plan (the “2013 Incentive Plan”), originally adopted by TriQuint, allowing Qorvo to issue awards under this plan. The 2013 Incentive Plan replaces the TriQuint 2012 Incentive Plan and provides for the grant of stock options, restricted stock units, stock appreciation rights and other stock or cash awards to employees, officers, directors, consultants, agents, advisors and independent contractors of TriQuint and its subsidiaries and affiliates who were such prior to the Business Combination or who become employed by the Company or its affiliates after the closing of the Business Combination. Former employees, officers and directors of RFMD are not eligible for awards under the 2013 Incentive Plan. The options granted thereunder must have an exercise price per share no less than 100% of the fair market value per share on the date of grant. The terms of each grant under the 2013 Incentive Plan may not exceed ten years. As of March 31, 2018, 2.4 million shares were available for issuance under the 2013 Incentive Plan.
2015 Inducement Stock Plan - Qorvo, Inc.
The 2015 Inducement Stock Plan (the "2015 Inducement Plan") provides for the grant of equity awards to persons as a material inducement to become employees of the Company or its affiliates. The plan provides for the grant of stock options, restricted stock units, stock appreciation rights and other stock-based awards. The maximum number of shares issuable under the 2015 Inducement Plan may not exceed the sum of (a) 0.3 million shares, plus (b) any shares of common stock (i) remaining available for issuance as of the effective date of the 2015 Inducement Stock Plan under the TriQuint 2008 Inducement Award Plan and (ii) subject to an award granted under the TriQuint 2008 Inducement Award Plan, which awards are forfeited, canceled, terminated, expire or lapse for any reason. No awards were made under the 2015 Inducement Plan in fiscal years 2018, 2017 or 2016. As of March 31, 2018, 0.3 million shares were available for issuance under the 2015 Inducement Plan.
84
Qorvo, Inc. and Subsidiaries
Notes to Consolidated Financial Statement (continued)
Notes to Consolidated Financial Statement (continued)
Employee Stock Purchase Plan - Qorvo, Inc.
Effective upon closing of the Business Combination, the Company assumed the TriQuint Employee Stock Purchase Plan ("ESPP"), which is intended to qualify as an “employee stock purchase plan” under Section 423 of the Code. All regular full-time employees of the Company (including officers) and all other employees who meet the eligibility requirements of the plan may participate in the ESPP. The ESPP provides eligible employees an opportunity to acquire the Company’s common stock at 85.0% of the lower of the closing price per share of the Company’s common stock on the first or last day of each six-month purchase period. At March 31, 2018, 4.6 million shares were available for future issuance under this plan. The Company makes no cash contributions to the ESPP, but bears the expenses of its administration. The Company issued 0.5 million, 0.7 million and 0.4 million shares under the ESPP in fiscal years 2018, 2017 and 2016, respectively.
For fiscal years 2018, 2017 and 2016, the primary stock-based awards and their general terms and conditions are as follows:
Stock options are granted to employees with an exercise price equal to the market price of the Company’s stock at the date of grant, generally vest over a four-year period from the grant date, and generally expire 10 years from the grant date. Restricted stock units granted by the Company in fiscal years 2018, 2017 and 2016 are either service-based, performance and service-based, or based on total stockholder return. Service-based restricted stock units generally vest over a four-year period from the grant date. Performance and service-based restricted stock units are earned based on Company performance of stated metrics during the fiscal year and, if earned, generally vest one-half when earned and the balance over two years. Restricted stock units based on total stockholder return are earned based upon total stockholder return of the Company in comparison to the total stockholder return of a benchmark index and can be earned over one-, two- and three-year performance periods. In fiscal 2018, each non-employee director was eligible to receive an annual grant of restricted stock units.
The options and restricted stock units granted to certain officers of the Company generally will, in the event of the officer's termination other than for cause and subject to the officer executing certain agreements in favor of the Company, continue to vest pursuant to the same vesting schedule as if the officer had remained an employee of the Company and, as a result, these awards are expensed at grant date. In fiscal 2018, stock-based compensation of $20.5 million was recognized upon the grant of 0.3 million restricted share units to certain officers of the Company.
Stock-Based Compensation
Under ASC 718, stock-based compensation cost is measured at the grant date, based on the estimated fair value of the award using an option pricing model for stock options (Black-Scholes) and market price for restricted stock units, and is recognized as expense over the employee's requisite service period. ASC 718 covers a wide range of stock-based compensation arrangements including stock options, restricted share plans, performance-based awards, share appreciation rights and employee stock purchase plans.
Total pre-tax stock-based compensation expense recognized in the Consolidated Statements of Operations was $68.2 million for fiscal 2018, net of expense capitalized into inventory. For fiscal years 2017 and 2016, the total pre-tax stock-based compensation expense recognized was $88.8 million and $139.5 million, respectively, net of expense capitalized into inventory.
85
Qorvo, Inc. and Subsidiaries
Notes to Consolidated Financial Statement (continued)
Notes to Consolidated Financial Statement (continued)
A summary of activity of the Company’s director and employee stock option plans follows:
Shares (in thousands) | Weighted- Average Exercise Price | Weighted-Average Remaining Contractual Term (in years) | Aggregate Intrinsic Value (in thousands) | |||||||||
Outstanding as of April 1, 2017 | 4,177 | $ | 19.72 | |||||||||
Granted | — | — | ||||||||||
Exercised | (1,544) | $ | 19.07 | |||||||||
Canceled | (5) | $ | 41.86 | |||||||||
Forfeited | (5) | $ | 19.99 | |||||||||
Outstanding as of March 31, 2018 | 2,623 | $ | 20.06 | 3.64 | $ | 132,217 | ||||||
Vested and expected to vest as of March 31, 2018 | 2,623 | $ | 20.06 | 3.64 | $ | 132,216 | ||||||
Options exercisable as of March 31, 2018 | 2,597 | $ | 19.79 | 3.64 | $ | 131,585 | ||||||
The aggregate intrinsic value in the table above represents the total pre-tax intrinsic value, based upon the Company’s closing stock price of $70.45 as of March 29, 2018 (the last business day prior to the fiscal year end on March 31, 2018), that would have been received by the option holders had all option holders with in-the-money options exercised their options as of that date. As of March 31, 2018, total remaining unearned compensation cost related to unvested option awards was $0.3 million, which will be amortized over the weighted-average remaining service period of approximately 0.5 years.
The fair value of each option award is estimated on the date of grant using a Black-Scholes option-pricing model based on the assumptions noted in the following tables:
Fiscal Year | |||||||
2018 | 2017 | 2016 | |||||
Expected volatility | N/A | N/A | 42.8 | % | |||
Expected dividend yield | N/A | N/A | 0.0 | % | |||
Expected term (in years) | N/A | N/A | 5.7 | ||||
Risk-free interest rate | N/A | N/A | 1.6 | % | |||
Weighted-average grant-date fair value of options granted during the period | N/A | N/A | $ | 32.62 | |||
The total intrinsic value of options exercised during fiscal 2018, was $87.8 million. For fiscal years 2017 and 2016, the total intrinsic value of options exercised was $81.0 million and $74.9 million, respectively.
Cash received from the exercise of stock options and from participation in the employee stock purchase plan (excluding accrued unremitted employee funds) was approximately $57.5 million for fiscal 2018 and is reflected in cash flows from financing activities in the Consolidated Statements of Cash Flows. The Company settles employee stock options with newly issued shares of the Company's common stock.
The Company used the implied volatility of market-traded options on the Company’s common stock for the expected volatility assumption input to the Black-Scholes option-pricing model, consistent with the guidance in ASC 718. The selection of implied volatility data to estimate expected volatility was based upon the availability of actively-traded options on the Company’s common stock and the Company’s assessment that implied volatility is more representative of future common stock price trends than historical volatility.
The dividend yield assumption is based on the Company’s history and expectation of future dividend payouts and may be subject to change in the future. The Company has never paid a dividend.
The expected life of employee stock options represents the weighted-average period that the stock options are expected to remain outstanding. The Company’s method of calculating the expected term of an option assumes that
86
Qorvo, Inc. and Subsidiaries
Notes to Consolidated Financial Statement (continued)
Notes to Consolidated Financial Statement (continued)
all outstanding options will be exercised at the midpoint of the current date and full contractual term, combined with the average life of all options that have been exercised or canceled. The Company believes that this method provides a better estimate of the future expected life based on analysis of historical exercise behavioral data.
The risk-free interest rate assumption is based upon observed interest rates appropriate for the terms of the Company’s employee stock options.
ASC 718 requires forfeitures to be estimated at the time of grant and revised, if necessary, in subsequent periods if actual forfeitures differ from those estimates. Based upon historical pre-vesting forfeiture experience, the Company assumed an annualized forfeiture rate of 1.6% for both stock options and restricted stock units.
The following activity has occurred with respect to restricted stock unit awards:
Shares (in thousands) | Weighted-Average Grant-Date Fair Value | |||||
Balance at April 1, 2017 | 2,375 | $ | 53.00 | |||
Granted | 998 | 68.67 | ||||
Vested | (1,059) | 50.30 | ||||
Forfeited | (127) | 57.73 | ||||
Balance at March 31, 2018 | 2,187 | $ | 59.46 | |||
As of March 31, 2018, total remaining unearned compensation cost related to unvested restricted stock units was $72.5 million, which will be amortized over the weighted-average remaining service period of approximately 1.2 years.
The total fair value of restricted stock units that vested during fiscal 2018 was $73.2 million, based upon the fair market value of the Company’s common stock on the vesting date. For fiscal years 2017 and 2016, the total fair value of restricted stock units that vested was $46.1 million and $60.2 million, respectively.
15. STOCKHOLDERS’ EQUITY
Stock Repurchase
On November 5, 2015, the Company announced that its Board of Directors authorized a share repurchase program to repurchase up to $1.0 billion of the Company's outstanding common stock through November 4, 2016. On February 16, 2016, as part of the $1.0 billion share repurchase program, the Company entered into variable maturity accelerated share repurchase ("ASR") agreements (a $250.0 million collared agreement and a $250.0 million uncollared agreement) with Bank of America, N.A. For the upfront payment of $500.0 million, the Company received 3.1 million shares of its common stock under the collared agreement (representing 50% of the shares the Company would have repurchased assuming an average share price of $40.78) and 4.9 million shares of the Company's common stock under the uncollared agreement (representing 80% of the shares the Company would have repurchased assuming an average share price of $40.78). On March 10, 2016, the Company received an additional 2.0 million shares of its common stock under the collared agreement. Final settlements of the ASR agreements were completed during the first quarter of fiscal 2017 with 0.4 million shares received resulting in a total of 10.4 million shares of the Company's common stock repurchased under the ASR agreements. The shares were retired in the periods they were delivered, and the upfront payment was accounted for as a reduction to stockholders' equity in the Consolidated Balance Sheet in the period the payment was made. The Company reflected each ASR as a repurchase of common stock in the period delivered for purposes of calculating earnings per share.
On November 3, 2016, the Company announced that its Board of Directors authorized a share repurchase program to repurchase up to $500.0 million of the Company's outstanding stock. Under this program, share repurchases are made in accordance with applicable securities laws on the open market or in privately negotiated transactions. The extent to which the Company repurchases its shares, the number of shares and the timing of any repurchases will depend on general market conditions, regulatory requirements, alternative investment opportunities and other considerations. The program does not require the Company to repurchase a minimum number of shares, does not
87
Qorvo, Inc. and Subsidiaries
Notes to Consolidated Financial Statement (continued)
Notes to Consolidated Financial Statement (continued)
have a fixed term, and may be modified, suspended or terminated at any time without prior notice. The program included approximately $150.0 million authorized on the $1.0 billion repurchase program that expired November 4, 2016.
The Company repurchased 2.9 million shares, 4.1 million shares (inclusive of 0.4 million shares received under the ASR agreement) and 24.3 million shares (inclusive of 10.0 million shares received under the ASR agreement) of its common stock during fiscal years 2018, 2017 and 2016, respectively, at an aggregate cost of $219.9 million, $209.4 million and $1,300.0 million, respectively, in accordance with the share repurchase programs described above. As of March 31, 2018, $162.1 million remains available for future repurchases under our current share repurchase program.
Common Stock Reserved For Future Issuance
At March 31, 2018, the Company had reserved a total of approximately 15.7 million of its authorized 405.0 million shares of common stock for future issuance as follows (in thousands):
Outstanding stock options under formal directors’ and employees’ stock option plans | 2,623 |
Possible future issuance under Company stock incentive plans | 6,254 |
Employee stock purchase plan | 4,594 |
Restricted stock-based units granted | 2,187 |
Total shares reserved | 15,658 |
16. OPERATING SEGMENT AND GEOGRAPHIC INFORMATION
The Company's operating segments as of March 31, 2018 are MP and IDP based on the organizational structure and information reviewed by the Company's Chief Executive Officer, who is the Company's chief operating decision maker ("CODM"), and these segments are managed separately based on the end markets and applications they support. The CODM allocates resources and assesses the performance of each operating segment primarily based on non-GAAP operating income (loss) and non-GAAP operating income (loss) as a percentage of revenue.
MP is a leading global supplier of cellular RF and Wi-Fi solutions for a variety of mobile devices, including smartphones, notebook computers, wearables, tablets, and cellular-based applications for the IoT. Mobile device manufacturers and mobile network operators are adopting new technologies to address the growing demand for data-intensive, increasingly cloud-based distributed applications and for mobile devices with smaller form factors, improved signal quality, less heat and longer talk and standby times. New wireless communications standards are being deployed to utilize available spectrum more efficiently. Carrier aggregation is being implemented to support wider bandwidths, increase data rates and improve network performance. These trends increase the complexity of smartphones, require more RF content and place a premium on performance, integration, systems-level expertise, and product and technology portfolio breadth, all of which are MP strengths. MP offers a comprehensive product portfolio of BAW and SAW filters, power amplifiers ("PAs"), low noise amplifiers ("LNAs"), switches, multimode multi-band PAs and transmit modules, RF power management integrated circuits, diversity receive modules, antenna switch modules, antenna tuning and control solutions, modules incorporating PAs and duplexers and modules incorporating switches, PAs and duplexers.
IDP is a leading global supplier of RF solutions with a diverse portfolio of solutions that "connect and protect," spanning communications and defense applications. These applications include high performance defense systems such as radar, electronic warfare and communication systems, Wi-Fi customer premises equipment for home and work, high speed connectivity in Long-Term Evolution and 5G base stations, cloud connectivity via data center communications and telecom transport, automotive connectivity and other IoT, including smart home solutions. IDP products include high power GaAs and GaN PAs, LNAs, switches, CMOS SoC solutions, premium BAW and SAW filter solutions and various multi-chip and hybrid assemblies.
The “All other” category includes operating expenses such as stock-based compensation, amortization of intangible assets, acquisition and integration related costs, restructuring and disposal costs, start-up costs, (loss) gain on assets and other miscellaneous corporate overhead expenses that the Company does not allocate to its reportable segments because these expenses are not included in the segment operating performance measures evaluated by the Company’s CODM. The CODM does not evaluate operating segments using discrete asset information. The Company’s operating segments
88
Qorvo, Inc. and Subsidiaries
Notes to Consolidated Financial Statement (continued)
Notes to Consolidated Financial Statement (continued)
do not record intercompany revenue. The Company does not allocate gains and losses from equity investments, interest and other income, or taxes to operating segments. Except as discussed above regarding the “All other” category, the Company’s accounting policies for segment reporting are the same as for the Company as a whole.
The following tables present details of the Company’s reportable segments and a reconciliation of the “All other” category (in thousands):
Fiscal Year | |||||||||||
2018 | 2017 | 2016 | |||||||||
Revenue: | |||||||||||
MP | $ | 2,181,161 | $ | 2,384,041 | $ | 2,083,334 | |||||
IDP | 788,495 | 644,653 | 523,512 | ||||||||
All other (1) | 3,880 | 3,880 | 3,880 | ||||||||
Total revenue | $ | 2,973,536 | $ | 3,032,574 | $ | 2,610,726 | |||||
Income from operations: | |||||||||||
MP | $ | 549,574 | $ | 554,001 | $ | 591,751 | |||||
IDP | 235,719 | 152,539 | 108,370 | ||||||||
All other | (715,011 | ) | (618,481 | ) | (688,153 | ) | |||||
Income from operations | $ | 70,282 | $ | 88,059 | $ | 11,968 | |||||
Interest expense | $ | (59,548 | ) | $ | (58,879 | ) | $ | (23,316 | ) | ||
Interest income | 7,017 | 1,212 | 2,068 | ||||||||
Other (expense) income | (606 | ) | (3,087 | ) | 6,418 | ||||||
Income (loss) before income taxes | $ | 17,145 | $ | 27,305 | $ | (2,862 | ) | ||||
(1) "All other" revenue relates to royalty income that is not allocated to MP or IDP.
Fiscal Year | |||||||||||
2018 | 2017 | 2016 | |||||||||
Reconciliation of “All other” category: | |||||||||||
Stock-based compensation expense | $ | (68,158 | ) | $ | (88,845 | ) | $ | (139,516 | ) | ||
Amortization of intangible assets | (539,362 | ) | (494,387 | ) | (494,589 | ) | |||||
Acquisition and integration related costs | (10,561 | ) | (25,391 | ) | (26,503 | ) | |||||
Restructuring charges | (21,406 | ) | (1,696 | ) | (4,235 | ) | |||||
Start-up costs | (24,271 | ) | (9,694 | ) | (14,110 | ) | |||||
Other (including loss (gain) on assets and other miscellaneous corporate overhead) | (51,253 | ) | 1,532 | (9,200 | ) | ||||||
Loss from operations for “All other” | $ | (715,011 | ) | $ | (618,481 | ) | $ | (688,153 | ) | ||
As a result of restructuring actions initiated in fiscal 2018, the Company adjusted the carrying value of certain of its held for sale assets located in China and the U.S., and recorded impairment charges totaling approximately $46.3 million. The fair value of the assets is based on quotes from third parties. See Note 11 for further information on the restructuring.
The consolidated financial statements include revenue to customers by geographic region that are summarized as follows (in thousands):
Fiscal Year | |||||||||||
2018 | 2017 | 2016 | |||||||||
Revenue: | |||||||||||
United States | $ | 524,472 | $ | 467,031 | $ | 306,328 | |||||
International | 2,449,064 | 2,565,543 | 2,304,398 | ||||||||
89
Qorvo, Inc. and Subsidiaries
Notes to Consolidated Financial Statement (continued)
Notes to Consolidated Financial Statement (continued)
Fiscal Year | |||||
2018 | 2017 | 2016 | |||
Revenue: | |||||
United States | 18% | 15% | 12% | ||
Asia | 78 | 81 | 83 | ||
Europe | 3 | 3 | 4 | ||
Other | 1 | 1 | 1 | ||
Sales, for geographic disclosure purposes, are based on the “sold to” address of the customer. The “sold to” address is not always an accurate representation of the location of final consumption of the Company’s components. Of the Company’s revenue for fiscal 2018, approximately 52% ($1,539.7 million) was from customers in China and 19% ($564.8 million) from customers in Taiwan. Of the Company’s revenue for fiscal years 2017 and 2016, approximately 62% ($1,866.0 million) and 61% ($1,601.0 million), respectively, was from customers in China and 13% ($398.4 million) and 14% ($365.1 million), respectively, was from customers in Taiwan.
The consolidated financial statements include the following long-lived tangible asset amounts related to operations of the Company by geographic region (in thousands):
March 31, 2018 | April 1, 2017 | April 2, 2016 | |||||||||
Long-lived tangible assets: | |||||||||||
United States | $ | 1,089,157 | $ | 1,082,754 | $ | 816,882 | |||||
China | 217,205 | 244,728 | 183,836 | ||||||||
Other countries | 67,750 | 64,450 | 46,170 | ||||||||
17. CONDENSED CONSOLIDATING FINANCIAL INFORMATION
In accordance with the indenture governing the Notes, the Company's obligations under the Notes are fully and unconditionally guaranteed on a joint and several basis by each Guarantor, each of which is 100% owned, directly or indirectly, by Qorvo, Inc. A Guarantor can be released in certain customary circumstances.
The following presents the condensed consolidating financial information separately for:
(i) | Parent Company, the issuer of the guaranteed obligations; |
(ii) | Guarantor subsidiaries, on a combined basis, as specified in the indenture; |
(iii) | Non-guarantor subsidiaries, on a combined basis; |
(iv) | Consolidating entries and eliminations representing adjustments to (a) eliminate intercompany transactions between or among Parent Company, the guarantor subsidiaries and the non-guarantor subsidiaries, (b) eliminate intercompany profit in inventory, (c) eliminate the investments in the Company’s subsidiaries and (d) record consolidating entries; and |
(v) | The Company, on a consolidated basis. |
Each entity in the condensed consolidating financial information follows the same accounting policies as described in the consolidated financial statements, except for the use by the Parent Company and guarantor subsidiaries of the equity method of accounting to reflect ownership interests in subsidiaries that are eliminated upon consolidation. The financial information may not necessarily be indicative of the financial position, results of operations, comprehensive (loss) income, and cash flows, had the Parent Company, guarantor or non-guarantor subsidiaries operated as independent entities.
90
Qorvo, Inc. and Subsidiaries
Notes to Consolidated Financial Statement (continued)
Notes to Consolidated Financial Statement (continued)
Condensed Consolidating Balance Sheet | |||||||||||||||||||
March 31, 2018 | |||||||||||||||||||
(in thousands) | Parent Company | Guarantor Subsidiaries | Non-Guarantor Subsidiaries | Eliminations and Reclassifications | Consolidated | ||||||||||||||
ASSETS | |||||||||||||||||||
Current assets: | |||||||||||||||||||
Cash and cash equivalents | $ | — | $ | 629,314 | $ | 296,723 | $ | — | $ | 926,037 | |||||||||
Accounts receivable, less allowance | — | 76,863 | 269,094 | — | 345,957 | ||||||||||||||
Intercompany accounts and note receivable | — | 272,409 | 53,363 | (325,772 | ) | — | |||||||||||||
Inventories | — | 154,651 | 339,434 | (21,793 | ) | 472,292 | |||||||||||||
Prepaid expenses | — | 17,530 | 6,379 | — | 23,909 | ||||||||||||||
Other receivables | — | 5,959 | 38,836 | — | 44,795 | ||||||||||||||
Other current assets | — | 29,627 | 1,188 | — | 30,815 | ||||||||||||||
Total current assets | — | 1,186,353 | 1,005,017 | (347,565 | ) | 1,843,805 | |||||||||||||
Property and equipment, net | — | 1,085,255 | 289,146 | (289 | ) | 1,374,112 | |||||||||||||
Goodwill | — | 1,121,941 | 1,051,948 | — | 2,173,889 | ||||||||||||||
Intangible assets, net | — | 395,317 | 465,019 | — | 860,336 | ||||||||||||||
Long-term investments | — | 1,847 | 61,918 | — | 63,765 | ||||||||||||||
Long-term intercompany accounts and notes receivable | — | 543,127 | 116,494 | (659,621 | ) | — | |||||||||||||
Investment in subsidiaries | 6,198,885 | 2,388,222 | — | (8,587,107 | ) | — | |||||||||||||
Other non-current assets | 72,122 | 31,011 | 32,516 | (70,037 | ) | 65,612 | |||||||||||||
Total assets | $ | 6,271,007 | $ | 6,753,073 | $ | 3,022,058 | $ | (9,664,619 | ) | $ | 6,381,519 | ||||||||
LIABILITIES AND STOCKHOLDERS’ EQUITY | |||||||||||||||||||
Current liabilities: | |||||||||||||||||||
Accounts payable | $ | — | $ | 78,278 | $ | 134,915 | $ | — | $ | 213,193 | |||||||||
Intercompany accounts and notes payable | — | 53,363 | 272,409 | (325,772 | ) | — | |||||||||||||
Accrued liabilities | 23,102 | 101,286 | 43,163 | (369 | ) | 167,182 | |||||||||||||
Other current liabilities | — | 3,882 | 57,022 | — | 60,904 | ||||||||||||||
Total current liabilities | 23,102 | 236,809 | 507,509 | (326,141 | ) | 441,279 | |||||||||||||
Long-term debt | 983,290 | — | — | — | 983,290 | ||||||||||||||
Deferred tax liabilities | — | 83,449 | 16,366 | (36,731 | ) | 63,084 | |||||||||||||
Long-term intercompany accounts and notes payable | 489,051 | 116,494 | 54,076 | (659,621 | ) | — | |||||||||||||
Other long-term liabilities | — | 62,417 | 55,885 | — | 118,302 | ||||||||||||||
Total liabilities | 1,495,443 | 499,169 | 633,836 | (1,022,493 | ) | 1,605,955 | |||||||||||||
Total stockholders’ equity | 4,775,564 | 6,253,904 | 2,388,222 | (8,642,126 | ) | 4,775,564 | |||||||||||||
Total liabilities and stockholders’ equity | $ | 6,271,007 | $ | 6,753,073 | $ | 3,022,058 | $ | (9,664,619 | ) | $ | 6,381,519 | ||||||||
91
Qorvo, Inc. and Subsidiaries
Notes to Consolidated Financial Statement (continued)
Notes to Consolidated Financial Statement (continued)
Condensed Consolidating Balance Sheet | |||||||||||||||||||
April 1, 2017 | |||||||||||||||||||
(in thousands) | Parent Company | Guarantor Subsidiaries | Non-Guarantor Subsidiaries | Eliminations and Reclassifications | Consolidated | ||||||||||||||
ASSETS | |||||||||||||||||||
Current assets: | |||||||||||||||||||
Cash and cash equivalents | $ | — | $ | 226,186 | $ | 319,277 | $ | — | $ | 545,463 | |||||||||
Accounts receivable, less allowance | — | 57,874 | 300,074 | — | 357,948 | ||||||||||||||
Intercompany accounts and notes receivable | — | 392,075 | 36,603 | (428,678 | ) | — | |||||||||||||
Inventories | — | 131,225 | 322,559 | (23,330 | ) | 430,454 | |||||||||||||
Prepaid expenses | — | 29,032 | 7,197 | — | 36,229 | ||||||||||||||
Other receivables | — | 7,239 | 58,008 | — | 65,247 | ||||||||||||||
Other current assets | — | 25,534 | 730 | — | 26,264 | ||||||||||||||
Total current assets | — | 869,165 | 1,044,448 | (452,008 | ) | 1,461,605 | |||||||||||||
Property and equipment, net | — | 1,078,761 | 314,910 | (1,739 | ) | 1,391,932 | |||||||||||||
Goodwill | — | 1,121,941 | 1,051,973 | — | 2,173,914 | ||||||||||||||
Intangible assets, net | — | 599,618 | 800,945 | — | 1,400,563 | ||||||||||||||
Long-term investments | — | 25,971 | 9,523 | — | 35,494 | ||||||||||||||
Long-term intercompany accounts and notes receivable | — | 447,613 | 138,398 | (586,011 | ) | — | |||||||||||||
Investment in subsidiaries | 6,142,568 | 2,596,172 | — | (8,738,740 | ) | — | |||||||||||||
Other non-current assets | 84,153 | 33,249 | 24,746 | (83,333 | ) | 58,815 | |||||||||||||
Total assets | $ | 6,226,721 | $ | 6,772,490 | $ | 3,384,943 | $ | (9,861,831 | ) | $ | 6,522,323 | ||||||||
LIABILITIES AND STOCKHOLDERS’ EQUITY | |||||||||||||||||||
Current liabilities: | |||||||||||||||||||
Accounts payable | $ | — | $ | 111,799 | $ | 104,447 | $ | — | $ | 216,246 | |||||||||
Intercompany accounts and notes payable | — | 36,603 | 392,075 | (428,678 | ) | — | |||||||||||||
Accrued liabilities | 23,150 | 111,700 | 35,734 | — | 170,584 | ||||||||||||||
Other current liabilities | — | 55 | 31,943 | — | 31,998 | ||||||||||||||
Total current liabilities | 23,150 | 260,157 | 564,199 | (428,678 | ) | 418,828 | |||||||||||||
Long-term debt | 989,154 | — | — | — | 989,154 | ||||||||||||||
Deferred tax liabilities | — | 171,284 | 43,560 | (83,333 | ) | 131,511 | |||||||||||||
Long-term intercompany accounts and notes payable | 317,695 | 138,398 | 129,918 | (586,011 | ) | — | |||||||||||||
Other long-term liabilities | — | 35,014 | 51,094 | — | 86,108 | ||||||||||||||
Total liabilities | 1,329,999 | 604,853 | 788,771 | (1,098,022 | ) | 1,625,601 | |||||||||||||
Total stockholders’ equity | 4,896,722 | 6,167,637 | 2,596,172 | (8,763,809 | ) | 4,896,722 | |||||||||||||
Total liabilities and stockholders’ equity | $ | 6,226,721 | $ | 6,772,490 | $ | 3,384,943 | $ | (9,861,831 | ) | $ | 6,522,323 | ||||||||
92
Qorvo, Inc. and Subsidiaries
Notes to Consolidated Financial Statement (continued)
Notes to Consolidated Financial Statement (continued)
Condensed Consolidating Statement of Operations and Comprehensive (Loss) Income | |||||||||||||||||||
Fiscal Year 2018 | |||||||||||||||||||
(in thousands) | Parent Company | Guarantor Subsidiaries | Non-Guarantor Subsidiaries | Eliminations and Reclassifications | Consolidated | ||||||||||||||
Revenue | $ | — | $ | 1,137,783 | $ | 2,689,676 | $ | (853,923 | ) | 2,973,536 | |||||||||
Cost of goods sold | — | 828,496 | 1,723,829 | (725,755 | ) | 1,826,570 | |||||||||||||
Gross profit | — | 309,287 | 965,847 | (128,168 | ) | 1,146,966 | |||||||||||||
Operating expenses: | |||||||||||||||||||
Research and development | 27,688 | 54,663 | 382,109 | (19,357 | ) | 445,103 | |||||||||||||
Selling, general and administrative | 39,882 | 248,601 | 349,739 | (110,471 | ) | 527,751 | |||||||||||||
Other operating expense | 588 | 89,454 | 13,463 | 325 | 103,830 | ||||||||||||||
Total operating expenses | 68,158 | 392,718 | 745,311 | (129,503 | ) | 1,076,684 | |||||||||||||
Income (loss) from operations | (68,158 | ) | (83,431 | ) | 220,536 | 1,335 | 70,282 | ||||||||||||
Interest expense | (58,133 | ) | (2,340 | ) | (1,505 | ) | 2,430 | (59,548 | ) | ||||||||||
Interest income | — | 2,696 | 6,751 | (2,430 | ) | 7,017 | |||||||||||||
Other (expense) income | (929 | ) | 973 | (642 | ) | (8 | ) | (606 | ) | ||||||||||
Income (loss) before income taxes | (127,220 | ) | (82,102 | ) | 225,140 | 1,327 | 17,145 | ||||||||||||
Income tax expense | (26 | ) | (15,586 | ) | (41,821 | ) | — | (57,433 | ) | ||||||||||
Income in subsidiaries | 86,958 | 183,319 | — | (270,277 | ) | — | |||||||||||||
Net (loss) income | $ | (40,288 | ) | $ | 85,631 | $ | 183,319 | $ | (268,950 | ) | $ | (40,288 | ) | ||||||
Comprehensive (loss) income | $ | (38,734 | ) | $ | 87,654 | $ | 186,172 | $ | (273,826 | ) | $ | (38,734 | ) | ||||||
Condensed Consolidating Statement of Operations and Comprehensive (Loss) Income | |||||||||||||||||||
Fiscal Year 2017 | |||||||||||||||||||
(in thousands) | Parent Company | Guarantor Subsidiaries | Non-Guarantor Subsidiaries | Eliminations and Reclassifications | Consolidated | ||||||||||||||
Revenue | $ | — | $ | 1,316,576 | $ | 2,918,865 | $ | (1,202,867 | ) | 3,032,574 | |||||||||
Cost of goods sold | — | 979,190 | 2,023,715 | (1,105,843 | ) | 1,897,062 | |||||||||||||
Gross profit | — | 337,386 | 895,150 | (97,024 | ) | 1,135,512 | |||||||||||||
Operating expenses: | |||||||||||||||||||
Research and development | 35,379 | 40,918 | 416,869 | (22,330 | ) | 470,836 | |||||||||||||
Selling, general and administrative | 53,465 | 253,531 | 370,812 | (132,220 | ) | 545,588 | |||||||||||||
Other operating expense | — | 16,065 | 8,409 | 6,555 | 31,029 | ||||||||||||||
Total operating expenses | 88,844 | 310,514 | 796,090 | (147,995 | ) | 1,047,453 | |||||||||||||
Income (loss) from operations | (88,844 | ) | 26,872 | 99,060 | 50,971 | 88,059 | |||||||||||||
Interest expense | (57,344 | ) | (2,619 | ) | (3,129 | ) | 4,213 | (58,879 | ) | ||||||||||
Interest income | — | 4,457 | 759 | (4,004 | ) | 1,212 | |||||||||||||
Other (expense) income | — | 426 | (1,999 | ) | (1,514 | ) | (3,087 | ) | |||||||||||
Income (loss) before income taxes | (146,188 | ) | 29,136 | 94,691 | 49,666 | 27,305 | |||||||||||||
Income tax (expense) benefit | 46,003 | (63,893 | ) | (25,973 | ) | — | (43,863 | ) | |||||||||||
Income in subsidiaries | 83,627 | 68,718 | — | (152,345 | ) | — | |||||||||||||
Net (loss) income | $ | (16,558 | ) | $ | 33,961 | $ | 68,718 | $ | (102,679 | ) | $ | (16,558 | ) | ||||||
Comprehensive (loss) income | $ | (17,731 | ) | $ | 34,014 | $ | 67,492 | $ | (101,506 | ) | $ | (17,731 | ) | ||||||
93
Qorvo, Inc. and Subsidiaries
Notes to Consolidated Financial Statement (continued)
Notes to Consolidated Financial Statement (continued)
Condensed Consolidating Statement of Operations and Comprehensive (Loss) Income | |||||||||||||||||||
Fiscal Year 2016 | |||||||||||||||||||
(in thousands) | Parent Company | Guarantor Subsidiaries | Non-Guarantor Subsidiaries | Eliminations and Reclassifications | Consolidated | ||||||||||||||
Revenue | $ | — | $ | 2,212,062 | $ | 2,762,150 | $ | (2,363,486 | ) | 2,610,726 | |||||||||
Cost of goods sold | — | 1,778,336 | 2,060,702 | (2,277,865 | ) | 1,561,173 | |||||||||||||
Gross profit | — | 433,726 | 701,448 | (85,621 | ) | 1,049,553 | |||||||||||||
Operating expenses: | |||||||||||||||||||
Research and development | 67,158 | 106,560 | 304,219 | (29,174 | ) | 448,763 | |||||||||||||
Selling, general and administrative | 72,358 | 151,814 | 360,593 | (50,666 | ) | 534,099 | |||||||||||||
Other operating expense | — | 50,928 | 2,447 | 1,348 | 54,723 | ||||||||||||||
Total operating expenses | 139,516 | 309,302 | 667,259 | (78,492 | ) | 1,037,585 | |||||||||||||
Income (loss) from operations | (139,516 | ) | 124,424 | 34,189 | (7,129 | ) | 11,968 | ||||||||||||
Interest expense | (21,895 | ) | (2,419 | ) | (3,029 | ) | 4,027 | (23,316 | ) | ||||||||||
Interest income | — | 2,650 | 3,003 | (3,585 | ) | 2,068 | |||||||||||||
Other income (expense) | — | 5,467 | (298 | ) | 1,249 | 6,418 | |||||||||||||
(Loss) income before income taxes | (161,411 | ) | 130,122 | 33,865 | (5,438 | ) | (2,862 | ) | |||||||||||
Income tax (expense) benefit | 44,014 | (49,751 | ) | (20,246 | ) | — | (25,983 | ) | |||||||||||
Income in subsidiaries | 88,552 | 13,619 | — | (102,171 | ) | — | |||||||||||||
Net (loss) income | $ | (28,845 | ) | $ | 93,990 | $ | 13,619 | $ | (107,609 | ) | $ | (28,845 | ) | ||||||
Comprehensive (loss) income | $ | (31,854 | ) | $ | 89,738 | $ | 14,862 | $ | (104,600 | ) | $ | (31,854 | ) | ||||||
94
Qorvo, Inc. and Subsidiaries
Notes to Consolidated Financial Statement (continued)
Notes to Consolidated Financial Statement (continued)
Condensed Consolidating Statement of Cash Flows | |||||||||||||||||||
Fiscal Year 2018 | |||||||||||||||||||
(in thousands) | Parent Company | Guarantor Subsidiaries | Non-Guarantor Subsidiaries | Eliminations and Reclassifications | Consolidated | ||||||||||||||
Net cash provided by operating activities | $ | 196,848 | $ | 165,883 | $ | 489,789 | $ | — | $ | 852,520 | |||||||||
Investing activities: | |||||||||||||||||||
Purchase of property and equipment | — | (226,860 | ) | (42,975 | ) | — | (269,835 | ) | |||||||||||
Other investing | — | 22,800 | (30,374 | ) | — | (7,574 | ) | ||||||||||||
Net transactions with related parties | — | 439,925 | (24,100 | ) | (415,825 | ) | — | ||||||||||||
Net cash (used in) provided by investing activities | — | 235,865 | (97,449 | ) | (415,825 | ) | (277,409 | ) | |||||||||||
Financing activities: | |||||||||||||||||||
Proceeds from debt issuances | 100,000 | — | — | — | 100,000 | ||||||||||||||
Payment of debt | (107,729 | ) | — | — | — | (107,729 | ) | ||||||||||||
Debt issuance costs | (1,916 | ) | — | — | — | (1,916 | ) | ||||||||||||
Proceeds from the issuance of common stock | 57,412 | — | — | — | 57,412 | ||||||||||||||
Repurchase of common stock, including transaction costs | (219,907 | ) | — | — | — | (219,907 | ) | ||||||||||||
Tax withholding paid on behalf of employees for restricted stock units | (24,708 | ) | — | — | — | (24,708 | ) | ||||||||||||
Net transactions with related parties | — | 1,380 | (417,205 | ) | 415,825 | — | |||||||||||||
Net cash (used in) provided by financing activities | (196,848 | ) | 1,380 | (417,205 | ) | 415,825 | (196,848 | ) | |||||||||||
Effect of exchange rate changes on cash | — | — | 2,360 | — | 2,360 | ||||||||||||||
Net increase (decrease) in cash, cash equivalents and restricted cash | — | 403,128 | (22,505 | ) | — | 380,623 | |||||||||||||
Cash, cash equivalents and restricted cash at the beginning of the period | — | 226,186 | 319,593 | — | 545,779 | ||||||||||||||
Cash, cash equivalents and restricted cash at the end of the period | $ | — | $ | 629,314 | $ | 297,088 | $ | — | $ | 926,402 | |||||||||
95
Qorvo, Inc. and Subsidiaries
Notes to Consolidated Financial Statement (continued)
Notes to Consolidated Financial Statement (continued)
Condensed Consolidating Statement of Cash Flows | |||||||||||||||||||
Fiscal Year 2017 | |||||||||||||||||||
(in thousands) | Parent Company | Guarantor Subsidiaries | Non-Guarantor Subsidiaries | Eliminations and Reclassifications | Consolidated | ||||||||||||||
Net cash provided by operating activities | $ | 165,660 | $ | 175,988 | $ | 435,172 | $ | 776,820 | |||||||||||
Investing activities: | |||||||||||||||||||
Purchase of available-for-sale securities | — | (469 | ) | — | — | (469 | ) | ||||||||||||
Proceeds from maturities and sales of available-for-sale securities | — | 186,793 | — | — | 186,793 | ||||||||||||||
Purchase of a business, net of cash acquired | — | — | (117,994 | ) | — | (117,994 | ) | ||||||||||||
Purchase of property and equipment | — | (424,175 | ) | (128,527 | ) | — | (552,702 | ) | |||||||||||
Other investing | — | 3,924 | (9,900 | ) | — | (5,976 | ) | ||||||||||||
Net transactions with related parties | — | 61,891 | — | (61,891 | ) | — | |||||||||||||
Net cash used in investing activities | — | (172,036 | ) | (256,421 | ) | (61,891 | ) | (490,348 | ) | ||||||||||
Financing activities: | |||||||||||||||||||
Excess tax benefit from exercises of stock options | 65 | — | — | — | 65 | ||||||||||||||
Proceeds from the issuance of common stock | 59,148 | — | — | — | 59,148 | ||||||||||||||
Repurchase of common stock, including transaction costs | (209,357 | ) | — | — | — | (209,357 | ) | ||||||||||||
Tax withholding paid on behalf of employees for restricted stock units | (15,516 | ) | — | — | — | (15,516 | ) | ||||||||||||
Other financing | — | 14 | (4 | ) | — | 10 | |||||||||||||
Net transactions with related parties | — | 1,587 | (63,478 | ) | 61,891 | — | |||||||||||||
Net cash (used in) provided by financing activities | (165,660 | ) | 1,601 | (63,482 | ) | 61,891 | (165,650 | ) | |||||||||||
Effect of exchange rate changes on cash | — | — | (1,105 | ) | — | (1,105 | ) | ||||||||||||
Net increase in cash, cash equivalents and restricted cash | — | 5,553 | 114,164 | — | 119,717 | ||||||||||||||
Cash, cash equivalents and restricted cash at the beginning of the period | — | 220,633 | 205,429 | — | 426,062 | ||||||||||||||
Cash, cash equivalents and restricted cash at the end of the period | $ | — | $ | 226,186 | $ | 319,593 | $ | — | $ | 545,779 | |||||||||
96
Qorvo, Inc. and Subsidiaries
Notes to Consolidated Financial Statement (continued)
Notes to Consolidated Financial Statement (continued)
Condensed Consolidating Statement of Cash Flows | |||||||||||||||||||
Fiscal Year 2016 | |||||||||||||||||||
(in thousands) | Parent Company | Guarantor Subsidiaries | Non-guarantor Subsidiaries | Eliminations and Reclassifications | Consolidated | ||||||||||||||
Net cash provided by operating activities | $ | 282,955 | $ | 273,171 | $ | 131,801 | $ | — | $ | 687,927 | |||||||||
Investing activities: | |||||||||||||||||||
Purchase of available-for-sale securities | — | (340,527 | ) | — | (340,527 | ) | |||||||||||||
Proceeds from maturities of available-for-sale securities | — | 390,009 | — | 390,009 | |||||||||||||||
Purchase of property and equipment | — | (244,817 | ) | (70,807 | ) | — | (315,624 | ) | |||||||||||
Other investing | — | (12,830 | ) | 258 | — | (12,572 | ) | ||||||||||||
Net cash used in investing activities | — | (208,165 | ) | (70,549 | ) | — | (278,714 | ) | |||||||||||
Financing activities: | |||||||||||||||||||
Proceeds from debt issuances | 1,175,000 | — | — | — | 1,175,000 | ||||||||||||||
Payment of debt | (175,000 | ) | — | — | (175,000 | ) | |||||||||||||
Excess tax benefit from exercises of stock options | 935 | — | — | — | 935 | ||||||||||||||
Debt issuance costs | (13,588 | ) | — | — | — | (13,588 | ) | ||||||||||||
Proceeds from the issuance of common stock | 51,875 | — | — | — | 51,875 | ||||||||||||||
Repurchase of common stock, including transaction costs | (1,300,009 | ) | — | — | — | (1,300,009 | ) | ||||||||||||
Tax withholding paid on behalf of employees for restricted stock units | (22,168 | ) | — | — | — | (22,168 | ) | ||||||||||||
Other financing | — | 57 | (86 | ) | — | (29 | ) | ||||||||||||
Net transactions with related parties | — | 1,192 | (1,192 | ) | — | — | |||||||||||||
Net cash (used in) provided by financing activities | (282,955 | ) | 1,249 | (1,278 | ) | — | (282,984 | ) | |||||||||||
Effect of exchange rate changes on cash | — | — | (294 | ) | — | (294 | ) | ||||||||||||
Net increase in cash, cash equivalents and restricted cash | — | 66,255 | 59,680 | — | 125,935 | ||||||||||||||
Cash, cash equivalents and restricted cash at the beginning of the period | — | 154,378 | 145,749 | — | 300,127 | ||||||||||||||
Cash, cash equivalents and restricted cash at the end of the period | $ | — | $ | 220,633 | $ | 205,429 | $ | — | $ | 426,062 | |||||||||
97
Qorvo, Inc. and Subsidiaries
Notes to Consolidated Financial Statement (continued)
Notes to Consolidated Financial Statement (continued)
18. QUARTERLY FINANCIAL SUMMARY (UNAUDITED):
Fiscal 2018 Quarter | ||||||||||||||||
(in thousands, except | ||||||||||||||||
per share data) | First | Second | Third | Fourth | ||||||||||||
Revenue | $ | 640,831 | $ | 821,583 | $ | 845,739 | $ | 665,383 | ||||||||
Gross profit | 236,377 | 321,022 | 336,927 | 252,640 | ||||||||||||
Net (loss) income | (30,624 | ) | (1),(2),(3) | 35,919 | (1),(2),(3) | (33,082 | ) | (1),(2),(3),(4) | (12,501 | ) | (1),(2),(3),(5) | |||||
Net (loss) income per share: | ||||||||||||||||
Basic | $ | (0.24 | ) | $ | 0.28 | $ | (0.26 | ) | $ | (0.10 | ) | |||||
Diluted | $ | (0.24 | ) | $ | 0.27 | $ | (0.26 | ) | $ | (0.10 | ) | |||||
Fiscal 2017 Quarter | ||||||||||||||||
(in thousands, except | ||||||||||||||||
per share data) | First | Second | Third | Fourth | ||||||||||||
Revenue | $ | 698,537 | $ | 864,698 | $ | 826,347 | $ | 642,992 | ||||||||
Gross profit | 276,475 | 316,799 | 310,642 | 231,596 | ||||||||||||
Net (loss) income | (5,675 | ) | (1),(2),(3) | 11,847 | (1),(2),(3) | (78,638 | ) | (1),(2),(3),(6) | 55,908 | (1),(2),(3),(7) | ||||||
Net (loss) income per share: | ||||||||||||||||
Basic | $ | (0.04 | ) | $ | 0.09 | $ | (0.62 | ) | $ | 0.44 | ||||||
Diluted | $ | (0.04 | ) | $ | 0.09 | $ | (0.62 | ) | $ | 0.43 | ||||||
1. The Company recorded integration related expenses of $1.5 million, $1.8 million, $1.7 million and $1.2 million in the first, second, third and fourth quarters of fiscal 2018, respectively, associated with the Business Combination. The Company recorded integration related expenses of $5.3 million, $5.0 million, $3.9 million and $2.7 million in the first, second, third and fourth quarters of fiscal 2017, respectively, associated with the Business Combination (Note 6).
2. The Company recorded restructuring expenses of $0.5 million, $10.5 million, $15.2 million and $41.5 million in the first, second, third and fourth quarters of fiscal 2018, respectively. The Company recorded restructuring expenses of $0.8 million, $0.5 million, $0.4 million and $0.4 million in the first, second, third and fourth quarters of fiscal 2017, respectively (Note 11).
3. The Company recorded start-up expenses of $6.6 million, $7.2 million, $5.4 million and $5.1 million in the first, second, third and fourth quarters of fiscal 2018, respectively. The Company recorded start-up expenses of $2.1 million, $2.0 million, $2.2 million and $3.4 million in the first, second, third and fourth quarters of fiscal 2017, respectively.
4. Income tax expense of $98.5 million for the third quarter of fiscal 2018 relates primarily to a discrete provisional tax expense related to the enactment of the Tax Act (Note 12).
5. Income tax benefit of $31.2 million for the fourth quarter of fiscal 2018 relates primarily to a discrete provisional benefit for adjustments to a third quarter fiscal 2018 provisional estimate of the impact of the Tax Act (Note 12).
6. Income tax expense of $123.2 million for the third quarter of fiscal 2017 relates primarily to the timing of income and loss recognition in the various tax jurisdictions for the quarter (Note 12).
7. Income tax benefit of $93.2 million for the fourth quarter of fiscal 2017 relates primarily to the timing of income and loss recognition in the various tax jurisdictions for the quarter (Note 12).
The Company uses a 52- or 53-week fiscal year ending on the Saturday closest to March 31 of each year. The first fiscal quarter of each year ends on the Saturday closest to June 30, the second fiscal quarter of each year ends on the Saturday closest to September 30 and the third fiscal quarter of each year ends on the Saturday closest to December 31. Each quarter of fiscal 2018 and fiscal 2017 contained a comparable number of weeks (13 weeks).
98
Report of Independent Registered Public Accounting Firm
To the Stockholders and Board of Directors
Qorvo, Inc.:
Opinion on the Consolidated Financial Statements
We have audited the accompanying consolidated balance sheets of Qorvo, Inc. and subsidiaries (the “Company”) as of March 31, 2018 and April 1, 2017, the related consolidated statements of operations, comprehensive loss, stockholders’ equity, and cash flows for each of the years in the three‑year period ended March 31, 2018, and the related notes (collectively, the consolidated financial statements). In our opinion, the consolidated financial statements present fairly, in all material respects, the financial position of the Company as of March 31, 2018 and April 1, 2017, and the results of its operations and its cash flows for each of the years in the three‑year period ended March 31, 2018, in conformity with U.S. generally accepted accounting principles.
We also have audited, in accordance with the standards of the Public Company Accounting Oversight Board (United States) (“PCAOB”), the Company’s internal control over financial reporting as of March 31, 2018, based on criteria established in Internal Control - Integrated Framework (2013) issued by the Committee of Sponsoring Organizations of the Treadway Commission, and our report dated May 21, 2018 expressed an unqualified opinion on the effectiveness of the Company’s internal control over financial reporting.
Basis for Opinion
These consolidated financial statements are the responsibility of the Company’s management. Our responsibility is to express an opinion on these consolidated financial statements based on our audits. We are a public accounting firm registered with the PCAOB and are required to be independent with respect to the Company in accordance with the U.S. federal securities laws and the applicable rules and regulations of the Securities and Exchange Commission and the PCAOB.
We conducted our audits in accordance with the standards of the PCAOB. Those standards require that we plan and perform the audit to obtain reasonable assurance about whether the consolidated financial statements are free of material misstatement, whether due to error or fraud. Our audits included performing procedures to assess the risks of material misstatement of the consolidated financial statements, whether due to error or fraud, and performing procedures that respond to those risks. Such procedures included examining, on a test basis, evidence regarding the amounts and disclosures in the consolidated financial statements. Our audits also included evaluating the accounting principles used and significant estimates made by management, as well as evaluating the overall presentation of the consolidated financial statements. We believe that our audits provide a reasonable basis for our opinion.
/s/ KPMG LLP
We have served as the Company’s auditor since 2014.
Greensboro, North Carolina
May 21, 2018
99
Report of Independent Registered Public Accounting Firm
To the Stockholders and Board of Directors
Qorvo, Inc.:
Opinion on Internal Control Over Financial Reporting
We have audited Qorvo, Inc.’s (the “Company”) internal control over financial reporting as of March 31, 2018, based on criteria established in Internal Control - Integrated Framework (2013) issued by the Committee of Sponsoring Organizations of the Treadway Commission. In our opinion, the Company maintained, in all material respects, effective internal control over financial reporting as of March 31, 2018, based on criteria established in Internal Control - Integrated Framework (2013) issued by the Committee of Sponsoring Organizations of the Treadway Commission.
We also have audited, in accordance with the standards of the Public Company Accounting Oversight Board (United States) (“PCAOB”), the consolidated balance sheets of the Company as of March 31, 2018 and April 1, 2017, the related consolidated statements of operations, comprehensive loss, stockholders’ equity, and cash flows for each of the years in the three-year period ended March 31, 2018, and the related notes (collectively, the consolidated financial statements), and our report dated May 21, 2018 expressed an unqualified opinion on those consolidated financial statements.
Basis for Opinion
The Company’s management is responsible for maintaining effective internal control over financial reporting and for its assessment of the effectiveness of internal control over financial reporting, included in the accompanying Management’s Assessment of Internal Control over Financial Reporting. Our responsibility is to express an opinion on the Company’s internal control over financial reporting based on our audit. We are a public accounting firm registered with the PCAOB and are required to be independent with respect to the Company in accordance with the U.S. federal securities laws and the applicable rules and regulations of the Securities and Exchange Commission and the PCAOB.
We conducted our audit in accordance with the standards of the PCAOB. Those standards require that we plan and perform the audit to obtain reasonable assurance about whether effective internal control over financial reporting was maintained in all material respects. Our audit of internal control over financial reporting included obtaining an understanding of internal control over financial reporting, assessing the risk that a material weakness exists, and testing and evaluating the design and operating effectiveness of internal control based on the assessed risk. Our audit also included performing such other procedures as we considered necessary in the circumstances. We believe that our audit provides a reasonable basis for our opinion.
Definition and Limitations of Internal Control Over Financial Reporting
A company’s internal control over financial reporting is a process designed to provide reasonable assurance regarding the reliability of financial reporting and the preparation of financial statements for external purposes in accordance with generally accepted accounting principles. A company’s internal control over financial reporting includes those policies and procedures that (1) pertain to the maintenance of records that, in reasonable detail, accurately and fairly reflect the transactions and dispositions of the assets of the company; (2) provide reasonable assurance that transactions are recorded as necessary to permit preparation of financial statements in accordance with generally accepted accounting principles, and that receipts and expenditures of the company are being made only in accordance with authorizations of management and directors of the company; and (3) provide reasonable assurance regarding prevention or timely detection of unauthorized acquisition, use, or disposition of the company’s assets that could have a material effect on the financial statements.
Because of its inherent limitations, internal control over financial reporting may not prevent or detect misstatements. Also, projections of any evaluation of effectiveness to future periods are subject to the risk that controls may become inadequate because of changes in conditions, or that the degree of compliance with the policies or procedures may deteriorate.
/s/ KPMG LLP
Greensboro, North Carolina
May 21, 2018
100
ITEM 9. CHANGES IN AND DISAGREEMENTS WITH ACCOUNTANTS ON ACCOUNTING AND FINANCIAL DISCLOSURE.
Not applicable.
ITEM 9A. CONTROLS AND PROCEDURES.
(a) Evaluation of disclosure controls and procedures
Disclosure controls and procedures refer to controls and other procedures designed to ensure that information required to be disclosed in the reports we file or submit under the Exchange Act is recorded, processed, summarized and reported within the time periods specified in the rules and forms of the SEC. Disclosure controls and procedures include, without limitation, controls and procedures designed to ensure that information required to be disclosed by us in our reports that we file or submit under the Exchange Act is accumulated and communicated to our management, including our Chief Executive Officer and Chief Financial Officer, as appropriate, to allow timely decisions regarding our required disclosure. In designing and evaluating our disclosure controls and procedures, our management recognizes that any controls and procedures, no matter how well designed and operated, can provide only reasonable assurance of achieving the desired control objectives.
As of the end of the period covered by this report, the Company’s management, including our Chief Executive Officer and Chief Financial Officer, evaluated the effectiveness of the Company’s disclosure controls and procedures in accordance with Rule 13a-15 under the Exchange Act. Based on this evaluation, our Chief Executive Officer and Chief Financial Officer concluded that the Company’s disclosure controls and procedures were effective, as of such date, to enable the Company to record, process, summarize and report in a timely manner the information that the Company is required to disclose in its Exchange Act reports. Our Chief Executive Officer and Chief Financial Officer also concluded that the Company’s disclosure controls and procedures were effective, as of the end of the period covered by this report, in ensuring that information required to be disclosed by the Company in the reports that it files or submits under the Exchange Act is accumulated and communicated to the Company’s management, including our Chief Executive Officer and Chief Financial Officer, as appropriate, to allow timely decisions regarding required disclosure.
(b) Management's assessment of internal control over financial reporting
The Company’s management is responsible for establishing and maintaining adequate internal control over financial reporting and for the assessment of the effectiveness of internal control over financial reporting as defined in Rules 13a-15(f) and 15d-15(f) under the Exchange Act. Our internal control over financial reporting is a process designed by and under the supervision of our Chief Executive Officer and Chief Financial Officer and effected by our board of directors, management and other personnel, to provide reasonable assurance regarding the reliability of financial reporting and the preparation of consolidated financial statements for external purposes in accordance with U.S. generally accepted accounting principles. Our internal control over financial reporting includes those policies and procedures that (1) pertain to the maintenance of records that, in reasonable detail, accurately and fairly reflect the transactions and dispositions of assets of the Company, (2) provide reasonable assurance that transactions are recorded as necessary to permit preparation of consolidated financial statements for external purposes in accordance with U.S. generally accepted accounting principles and that receipts and expenditures of the Company are being made only in accordance with authorizations of management and directors of the Company, and (3) provide reasonable assurance regarding prevention or timely detection of unauthorized acquisition, use or disposition of assets that could have a material effect on the consolidated financial statements.
Management assessed the effectiveness of our internal control over financial reporting as of March 31, 2018. Management based this assessment on criteria for effective internal control over financial reporting described in Internal Control-Integrated Framework (2013) issued by the Committee of Sponsoring Organizations of the Treadway Commission ("COSO").
Based on this assessment, management concluded that the Company's internal control over financial reporting was effective as of March 31, 2018, based on the criteria in the Internal Control-Integrated Framework (2013) issued by the COSO.
101
KPMG LLP, an independent registered public accounting firm, has issued an unqualified opinion on the effectiveness of the Company’s internal control over financial reporting, which is included in this Annual Report on Form 10-K under Item 8.
(c) Changes in internal control over financial reporting
There were no changes in our Company's internal control over financial reporting (as defined in Rules 13a-15(f) and 15d-15(f) under the Exchange Act) during the quarter ended March 31, 2018 that have materially affected, or are reasonably likely to materially affect, our internal control over financial reporting.
ITEM 9B. OTHER INFORMATION.
Not applicable.
PART III
ITEM 10. DIRECTORS, EXECUTIVE OFFICERS AND CORPORATE GOVERNANCE.
Information required by this Item may be found in our definitive proxy statement for our 2018 Annual Meeting of Stockholders under the captions "Corporate Governance," "Executive Officers," "Proposal 1 - Election of Directors" and "Section 16(a) Beneficial Ownership Reporting Compliance," and the information therein is incorporated herein by reference.
The Company has adopted its “Code of Business Conduct and Ethics,” and a copy is posted on the Company’s website at www.qorvo.com, on the "Corporate Governance" tab under the "Investor Relations" page. In the event that we amend any of the provisions of the Code of Business Conduct and Ethics that requires disclosure under applicable law, SEC rules or Nasdaq listing standards, we intend to disclose such amendment on our website. Any waiver of the Code of Business Conduct and Ethics for any executive officer or director must be approved by the Board and will be promptly disclosed, along with the reasons for the waiver, as required by applicable law or Nasdaq rules.
ITEM 11. EXECUTIVE COMPENSATION.
Information required by this Item may be found in our definitive proxy statement for our 2018 Annual Meeting of Stockholders under the captions "Executive Compensation" and "Compensation Committee Interlocks and Insider Participation," and the information therein is incorporated herein by reference.
ITEM 12. SECURITY OWNERSHIP OF CERTAIN BENEFICIAL OWNERS AND MANAGEMENT AND RELATED STOCKHOLDER MATTERS.
Information required by this Item may be found in our definitive proxy statement for our 2018 Annual Meeting of Stockholders under the captions "Security Ownership of Certain Beneficial Owners and Management" and "Equity Compensation Plan Information," and the information therein is incorporated herein by reference.
ITEM 13. CERTAIN RELATIONSHIPS AND RELATED TRANSACTIONS, AND DIRECTOR INDEPENDENCE.
Information required by this Item may be found in our definitive proxy statement for our 2018 Annual Meeting of Stockholders under the captions "Related Person Transactions" and "Corporate Governance," and the information therein is incorporated herein by reference.
ITEM 14. PRINCIPAL ACCOUNTING FEES AND SERVICES.
Information required by this Item may be found in our definitive proxy statement for our 2018 Annual Meeting of Stockholders under the captions “Proposal 3 - Ratification of Appointment of Independent Registered Public Accounting Firm” and “Corporate Governance,” and the information therein is incorporated herein by reference.
102
Qorvo, Inc. and Subsidiaries
Notes to Consolidated Financial Statements (continued)
Notes to Consolidated Financial Statements (continued)
PART IV
ITEM 15. EXHIBITS, FINANCIAL STATEMENT SCHEDULES.
(a) The following documents are filed as part of this report:
(1) Financial Statements
i. Consolidated Balance Sheets as of March 31, 2018 and April 1, 2017.
ii. | Consolidated Statements of Operations for fiscal years 2018, 2017 and 2016. |
iii. Consolidated Statements of Comprehensive Loss for fiscal years 2018, 2017 and 2016.
iv. | Consolidated Statements of Stockholders' Equity for fiscal years 2018, 2017 and 2016. |
v. | Consolidated Statements of Cash Flows for fiscal years 2018, 2017 and 2016. |
vi. | Notes to Consolidated Financial Statements. |
Reports of Independent Registered Public Accounting Firm.
(2) The financial statement schedules are not included in this item as they are either included within the consolidated financial statements or the notes thereto in this Annual Report on Form 10-K or are inapplicable and, therefore, have been omitted.
(3) The exhibits listed in the accompanying Exhibit Index are filed as a part of this Annual Report on Form 10-K.
(b) Exhibits.
See the Exhibit Index.
(c) Separate Financial Statements and Schedules.
None.
103
ITEM 16. FORM 10-K SUMMARY.
None.
104
EXHIBIT INDEX | |
Exhibit No. | Description |
2.1 | |
2.2 | |
2.3 | |
2.4 | |
3.1 | |
3.2 | |
4.1 | |
4.2 | |
10.1 | |
10.2 | |
10.3 | |
10.4 | |
10.5 | |
10.6 | |
10.7 | |
10.8 | |
10.9 | |
105
10.10 | |
10.11 | |
10.12 | |
10.13 | |
10.14 | |
10.15 | |
10.16 | |
10.17 | |
10.18 | |
10.19 | |
10.20 | |
10.21 | |
10.22 | |
10.23 | |
10.24 | |
10.25 | |
10.26 | |
10.27 | |
106
10.28 | |
10.29 | |
10.30 | |
10.31 | |
10.32 | |
10.33 | |
10.34 | |
10.35 | |
10.36 | |
10.37 | |
21 | |
23.1 | |
31.1 | |
31.2 | |
32.1 | |
32.2 | |
101 | The following materials from our Annual Report on Form 10-K for the fiscal year ended March 31, 2018, formatted in XBRL (eXtensible Business Reporting Language): (i) the Consolidated Balance Sheets as of March 31, 2018 and April 1, 2017, (ii) the Consolidated Statements of Operations for the fiscal years ended March 31, 2018, April 1, 2017, and April 2, 2016, (iii) the Consolidated Statements of Stockholders' Equity for the fiscal years ended March 31, 2018, April 1, 2017, and April 2, 2016, (iv) the Consolidated Statements of Cash Flows for the fiscal years ended March 31, 2018, April 1, 2017, and April 2, 2016, and (v) the Notes to the Consolidated Financial Statements. |
_________
107
+ | Confidential treatment has been granted with respect to certain portions of this Exhibit, which portions have been omitted and filed separately with the SEC as part of an application for confidential treatment. |
* | Executive compensation plan or agreement |
Our SEC file number for documents filed with the SEC pursuant to the Securities Exchange Act of 1934, as amended, is 001-36801. The SEC file number for RFMD is 000-22511.
108
SIGNATURES
Pursuant to the requirements of Section 13 or 15(d) of the Securities Exchange Act of 1934, the registrant has duly caused this report to be signed on its behalf by the undersigned, thereunto duly authorized.
Qorvo, Inc. | |||
Date: | May 21, 2018 | /s/ Robert A. Bruggeworth | |
By: Robert A. Bruggeworth | |||
President and Chief Executive Officer | |||
POWER OF ATTORNEY
KNOW ALL PERSONS BY THESE PRESENTS, that each person whose signature appears below constitutes and appoints Robert A. Bruggeworth and Mark J. Murphy and each of them, as true and lawful attorneys-in-fact and agents, with full power of substitution and resubstitution for him and in his name, place and stead, in any and all capacities, to sign any and all amendments to this report, and to file the same, with all exhibits thereto, and other documents in connection therewith, with the Securities and Exchange Commission, granting unto said attorneys-in-fact and agents, and each of them, full power and authority to do and perform each and every act and thing requisite and necessary to be done in and about the premises, as fully to all intents and purposes as he might or could do in person, hereby ratifying and confirming all which said attorneys-in-fact and agents or any of them, or their or his substitute or substitutes, may lawfully do or cause to be done by virtue hereof.
109
Pursuant to the requirements of the Securities Exchange Act of 1934, this report has been signed below by the following persons on behalf of the registrant and in the capacities indicated on May 21, 2018.
/s/ Robert A. Bruggeworth | Name: | Robert A. Bruggeworth | |
Title: | President, Chief Executive Officer and Director | ||
(Principal Executive Officer) | |||
/s/ Mark J. Murphy | Name: | Mark J. Murphy | |
Title: | Chief Financial Officer | ||
(Principal Financial Officer) | |||
/s/ Gina B. Harrison | Name: | Gina B. Harrison | |
Title: | Vice President and Corporate Controller | ||
(Principal Accounting Officer) | |||
/s/ Ralph G. Quinsey | Name: | Ralph G. Quinsey | |
Title: | Chairman of the Board of Directors | ||
/s/ Daniel A. DiLeo | Name: | Daniel A. DiLeo | |
Title: | Director | ||
/s/ Jeffery R. Gardner | Name: | Jeffery R. Gardner | |
Title: | Director | ||
/s/ Charles Scott Gibson | Name: | Charles Scott Gibson | |
Title: | Director | ||
/s/ John R. Harding | Name: | John R. Harding | |
Title: | Director | ||
/s/ David H. Y. Ho | Name: | David H. Y. Ho | |
Title: | Director | ||
/s/ Roderick D. Nelson | Name: | Roderick D. Nelson | |
Title: | Director | ||
/s/ Dr. Walden C. Rhines | Name: | Dr. Walden C. Rhines | |
Title: | Director | ||
/s/ Susan L. Spradley | Name: | Susan L. Spradley | |
Title: | Director | ||
/s/ Walter H. Wilkinson, Jr. | Name: | Walter H. Wilkinson, Jr. | |
Title: | Director | ||
110